UNITED STATES
SECURITIES AND EXCHANGE COMMISSION
Washington, D.C. 20549
FORMN-CSR
CERTIFIED SHAREHOLDER REPORT OF REGISTERED
MANAGEMENT INVESTMENT COMPANIES
Investment Company Act file number:811-4984
AMERICAN BEACON FUNDS
(Exact name of registrant as specified in charter)
220 East Las Colinas Boulevard, Suite 1200
Irving, Texas 75039
(Address of principal executive offices)-(Zip code)
GENE L. NEEDLES, JR., PRESIDENT
220 East Las Colinas Boulevard, Suite 1200
Irving, Texas 75039
(Name and address of agent for service)
Registrant’s telephone number, including area code: (817)391-6100
Date of fiscal year end: October 31, 2019
Date of reporting period: October 31, 2019
FormN-CSR is to be used by management investment companies to file reports with the Commission not later than 10 days after the transmission to stockholders of any report that is required to be transmitted to stockholders under Rule30e-1 under the Investment Company Act of 1940 (17 CFR270.30e-1). The Commission may use the information provided on FormN-CSR in its regulatory, disclosure review, inspection, and policymaking roles.
A registrant is required to disclose the information specified by FormN-CSR, and the Commission will make this information public. A registrant is not required to respond to the collection of information contained in FormN-CSR unless the Form displays a currently valid Office of Management and Budget (“OMB”) control number. Please direct comments concerning the accuracy of the information collection burden estimate and any suggestions for reducing the burden to Secretary, Securities and Exchange Commission, 450 Fifth Street, NW, Washington, DC 20549-0609. The OMB has reviewed this collection of information under the clearance requirements of 44 U.S.C. § 3507.
| ITEM 1. | REPORTS TO STOCKHOLDERS. |

About American Beacon Advisors
Since 1986, American Beacon Advisors has offered a variety of products and investment advisory services to numerous institutional and retail clients, including a variety of mutual funds, corporate cash management, and separate account management.
Our clients include defined benefit plans, defined contribution plans, foundations, endowments, corporations, financial planners, and other institutional investors. With American Beacon Advisors, you can put the experience of a multi-billion dollar asset management firm to work for your company.
BALANCED FUND RISKS
The use offixed-income securitiesentails interest rate and credit risks. Investing inforeign securitiesmay involve heightened risk due to currency fluctuations and economic and political risks. Investing invalue stocksmay limit downside risk over time; however, the Fund may produce more modest gains than riskier stock funds as atrade-off for this potentially lower risk. The use offutures contractsfor cash management may subject the Fund to losing more money than invested. The Fund participates in asecurities lendingprogram. Please see the prospectus for a complete discussion of the Fund’s risks. There can be no assurances that the investment objectives of this Fund will be met.
MID-CAP VALUE FUND RISKS
Investing inmedium-capitalization stocksmay involve greater volatility and lower liquidity than larger company stocks. Investing invalue stocksmay limit downside risk over time; however, the Fund may produce more modest gains than riskier stock funds as atrade-off for this potentially lower risk. Investing inforeign securitiesmay involve heightened risk due to currency fluctuations and economic and political risks. The use offutures contractsfor cash management may subject the Fund to losing more money than invested. The Fund participates in asecurities lendingprogram. Please see the prospectus for a complete discussion of the Fund’s risks. There can be no assurances that the investment objectives of this Fund will be met.
Any opinions herein, including forecasts, reflect our judgment as of the end of the reporting period and are subject to change. Each advisor’s strategies and each Fund’s portfolio composition will change depending on economic and market conditions. This report is not a complete analysis of market conditions, and, therefore, should not be relied upon as investment advice. Although economic and market information has been compiled from reliable sources, American Beacon Advisors, Inc. makes no representation as to the completeness or accuracy of the statements contained herein.
American Beacon Funds | October 31, 2019 |
| 1 | ||||
| 2 | ||||
| 9 | ||||
| 11 | ||||
| 12 | ||||
| 27 | ||||
| 33 | ||||
| 37 | ||||
| 65 | ||||
| 71 | ||||
| 78 | ||||
Disclosure Regarding Approval of the Management and Investment Advisory Agreements | 79 | |||
| 85 | ||||
| 92 | ||||
| Back Cover | ||||
 | Dear Shareholders,
In recent months, you’ve likely seen and heard news reports about disruptive headwinds in the global economy –including the U.S. trade war with China and its toll on the global economy, slowing global growth, the Federal Reserve’s series of rate cuts, Brexit, disruptions in the Middle East and protests in Hong Kong – and watched a flood of reaction in the world’s markets.
As Peter L. Bernstein said in his treatise on risk,Against the Gods: The Remarkable Story of Risk, published by John Wiley & Sons, Inc. in September 1998, “Volatility is a proxy for uncertainty and must be accommodated in measuring investment risk.”
During times of economic uncertainty and market volatility, fear of loss can be a powerful emotion – one that drives many investors to making short-term decisions subject to a variety of potential error-leading biases. Unfortunately, some short-term investment decisions may create more volatility rather than mitigate it. |
Instead of dwelling on the markets’ short-term reaction to waves of negative global news, we encourage investors to focus on the horizon instead. Long-term investing isn’t about identifying and anticipating the next big market move, it is about identifying the right investment products for riding out those moves. As a long-term investor, you should keep in mind the three Ds:direction,disciplineanddiversification.
| u | Direction:Achieving your long-term financial goals requires an individualized plan of action. You may want your plan to provide some measure of protection against periods of geopolitical turmoil, economic uncertainty, market volatility and job insecurity. Your plan should be reviewed annually and be adjusted in the event your long-range needs change. |
| u | Discipline:Long-term, systematic participation in an investment portfolio requires your resolution to stay the course. Spending time in the market – rather than trying to time the market – may place you in a better position to reach your long-term financial goals. |
| u | Diversification:By investing in different investment styles and asset classes, you may be able to help mitigate financial risks across your investment portfolio. By allocating your investment portfolio according to your risk-tolerance level, you may be better positioned to weather storms and achieve your long-term financial goals. |
Since 1986, American Beacon has endeavored to provide investors with a disciplined approach to realizing long-term financial goals.As a manager of managers, we strive to provide investment products that may enable investors to participate during market upswings while potentially insulating against market downswings.
Many of thesub-advisors to our mutual funds pursue upside capture and/or downside protection using proprietary strategies. The investment teams behind our mutual funds seek to produce consistent, long-term results rather than focus only on short-term movements in the markets. In managing our investment products, we emphasize identifying opportunities that offer the potential for long-term rewards.
Our management approach is more than a concept; it’s the cornerstone of our culture. And we strive to apply it at every turn as we seek to provide a well-diversified line of investment solutions to help our shareholders seek long-term rewards while mitigating volatility and risk.
Thank you for your continued interest in American Beacon. For additional information about our investment products or to access your account information, please visit our website atwww.americanbeaconfunds.com.
Best Regards,

Gene L. Needles, Jr.
President
American Beacon Funds
1
Domestic Bond and Domestic Equity Market Overviews
October 31, 2019 (Unaudited)
Domestic Bond Market Overview
During the 12 months ended October 31, 2019, the Federal Reserve (the “Fed”) hiked the federal funds rate in December 2018, paused for the first half of 2019, and then cut the rate three times in as many meetings. The most recent meeting, held at the end of October, saw the Fed vote to cut its target rate to a range of 1.50% to 1.75%. However, the Fed also indicated its “midcycle adjustment” was complete. The official statement changed with regard to future actions by removing the phrase “will act as appropriate to sustain the expansion,” which was added in advance of the recent rate cuts, addressing economic “uncertainties” and “muted inflation pressures.” Fed Chairman Jerome Powell was more explicit about the completion of the midcycle adjustment at his October press conference when he said further easing would only be needed if developments forced a “material reassessment” of the outlook. He was likely encouraged by recent developments on global trade since U.S. officials indicated they were “close to finalizing” sections of the Phase One agreement with China and the European Union granted the U.K. a Brexit extension. Additionally, the first release of third quarter GDP was reported at 1.9%, which surprised to the upside on solid consumer spending.
Multiple rate cuts from the Fed and uncertainties around global trade caused interest rates to decline and the yield curve to steepen during the period. The10-year Treasury yield fell 145 basis points (or 1.45%) to 1.69%. Thetwo-year Treasury yield declined 132 basis points (or 1.32%) to 1.52%, and the30-year Treasury yield declined 121 basis points (or 1.21%) to 2.17%. These moves caused thetwo- to30-year Treasury yield spread to increase by 11 basis points (or 0.11%) to 65 basis points (or 0.65%).
With the decline in rates during the year, the bond market posted a positive return of 11.51%, according to the Bloomberg Barclays U.S. Aggregate Bond Index. Spread product was mostly in favor over the period as three of the four spread sectors posted positive excess returns. The leader was the corporate sector with an excess return of 232 basis points (or 2.32%). The agency and asset-backed sectors followed with excess returns of 107 basis points (or 1.07%) and 59 basis points (or 0.59%), respectively. The laggard was the mortgage-backed sector with a negative excess return of-11 basis points (or-0.11%). Overall, the Bloomberg Barclays U.S. Aggregate Bond Index had an excess return of 63 basis points (or 0.63%) for the period.
Domestic Equity Market Overview
For the12-month period ended October 31, 2019, the U.S. equity markets rallied strongly after a depressed start to the period that saw market volatility spike to its highest level in seven years during the fourth quarter of 2018. The S&P 500 Index and the Dow Jones Industrial Average returned 14.33% and 10.32%, respectively, for the period. Growth broadly outperformed Value across all market caps; the Russell 1000 Growth Index and the Russell 1000 Value Index returned 17.10% and 11.21%, respectively, and the Russell Midcap Growth Index and the Russell Midcap Value Index returned 18.93% and 10.08%, respectively. Large andmid-cap stocks also did significantly better thansmall-cap stocks; the Russell 1000 Index returned 14.15% and the Russell Midcap Index returned 13.72%, compared to the Russell 2000 Index return of 4.90%.
All of this occurred in an environment that saw rising fears of economic recession as the current expansion entered its 11th year, intensified by the effects of an escalating trade war, as well as concerns over the ability of the Fed policy to forestall the effects of an economic downturn. Feeding these uncertainties, growth slowed during the period as the third quarter’s gross domestic product decelerated to 1.9% from its peak rate of 3.5% in the second quarter of 2018. Corporate earnings growth also slowed with profit growth.
The Fed did alter its policy course at year end 2018 and began lowering the federal funds rate in the third quarter of 2019. At the same time, the economic strength underlying the U.S. economy remained resilient with the September unemployment rate at 3.5%, a40-year low. In addition, the consumer continued to show good strength with both income and expenditures growing at healthy rates. Also, ongoing tariff negotiations between the U.S. and China are providing hope to prospects of settlement. Collectively, all of these factors kept the markets positive going into the fiscal year end.
2
American Beacon Balanced FundSM
Performance Overview
October 31, 2019 (Unaudited)
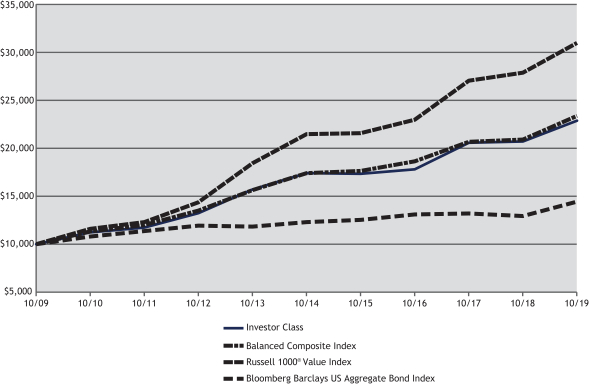
The Investor Class of the American Beacon Balanced Fund (the “Fund”) returned 10.50% for the twelve months ended October 31, 2019, underperforming the 60% Russell 1000® Value Index/40% Bloomberg Barclays U.S. Aggregate Bond Index (“Balanced Composite Index”) return of 11.82% for the same period.
Comparison of Change in Value of a $10,000 Investment for the period from 10/31/2009 through 10/31/2019
Total Returns for the Period ended October 31, 2019 |
| |||||||||||||||||||||||||||||||
Ticker | 1 Year | 3 Years | 5 Years | 10 Years | Value of $10,000 10/31/2009- 10/31/2019 | |||||||||||||||||||||||||||
Institutional Class (1,7) | AADBX | 10.89 | % | 9.00 | % | 5.98 | % | 8.98 | % | $ | 23,623 | |||||||||||||||||||||
Y Class (1,2,7) | ACBYX | 10.75 | % | 9.04 | % | 5.95 | % | 8.90 | % | $ | 23,456 | |||||||||||||||||||||
Investor Class (1,7) | AABPX | 10.50 | % | 8.70 | % | 5.65 | % | 8.62 | % | $ | 22,867 | |||||||||||||||||||||
Advisor Class (1,7) | ABLSX | 10.34 | % | 8.54 | % | 5.48 | % | 8.45 | % | $ | 22,509 | |||||||||||||||||||||
A Class without sales charge (1,3,7) | ABFAX | 10.54 | % | 8.70 | % | 5.62 | % | 8.55 | % | $ | 22,712 | |||||||||||||||||||||
A Class with sales charge (1,3,7) | ABFAX | 4.16 | % | 6.57 | % | 4.38 | % | 7.91 | % | $ | 21,404 | |||||||||||||||||||||
C Class without sales charge (1,4,7) | ABCCX | 9.63 | % | 7.89 | % | 4.84 | % | 7.79 | % | $ | 21,176 | |||||||||||||||||||||
C Class with sales charge (1,4,7) | ABCCX | 8.63 | % | 7.89 | % | 4.84 | % | 7.79 | % | $ | 21,176 | |||||||||||||||||||||
Balanced Composite Index (5) | 11.82 | % | 7.81 | % | 6.05 | % | 8.85 | % | $ | 23,342 | ||||||||||||||||||||||
Russell 1000® Value Index (6) | 11.21 | % | 10.51 | % | 7.61 | % | 11.96 | % | $ | 30,959 | ||||||||||||||||||||||
Bloomberg Barclays US Aggregate Bond Index (6) | 11.51 | % | 3.29 | % | 3.24 | % | 3.73 | % | $ | 14,421 | ||||||||||||||||||||||
| 1. | Performance shown is historical and is not indicative of future returns. Investment returns and principal value will vary, and shares may be worth more or less at redemption than at original purchase. Performance shown is calculated based on the published end of day net asset values as of date indicated, and current performance may be lower or higher than the performance data quoted. To obtain performance as of the most recent month end, please visitwww.americanbeaconfunds.com or call1-800-967-9009. Fund performance in the table above does not reflect the deduction of taxes a shareholder would pay on distributions or the redemption of shares. Generally accepted accounting principles require adjustments to be made to the net assets of the Fund at period end for financial reporting purposes only; and as such, the total return based on the unadjusted net asset value per share may differ from the total return reported in the financial highlights. |
3
American Beacon Balanced FundSM
Performance Overview
October 31, 2019 (Unaudited)
| 2. | Fund performance for theten-year period represents the total returns achieved by the Institutional Class from 10/31/09 up to 3/1/10, the inception date of the Y Class, and the returns of the Y Class since its inception. Expenses of the Y Class are higher than those of the Institutional Class. Therefore, total returns shown may be higher than they would have been had the Y Class been in existence since 10/31/09. A portion of the fees charged to the Y Class of the Fund was waived in 2011, partially recovered in 2013 and fully recovered in 2014. Performance prior to waiving fees was lower than the actual returns shown for 2011. |
| 3. | Fund performance for theten-year period represents the total returns achieved by the Investor Class from 10/31/09 up to 5/17/10, the inception date of the A Class, and the returns of the A Class since its inception. Expenses of the A Class are higher than those of the Investor Class. Therefore, total returns shown may be higher than they would have been had the A Class been in existence since 10/31/09. A portion of the fees charged to the A Class of the Fund was waived in 2011 and 2012, partially recovered in 2013, fully recovered in 2014 and waived in 2018. Performance prior to waiving fees was lower than the actual returns shown for 2011, 2012 and 2018. A Class has a maximum sales charge of 5.75%. |
| 4. | Fund performance for theten-year period represents the total returns achieved by the Investor Class from 10/31/09 up to 9/1/10, the inception date of the C Class, and the returns of the C Class since its inception. Expenses of the C Class are higher than those of the Investor Class. Therefore, total returns shown may be higher than they would have been had the C Class been in existence since 10/31/09. A portion of the fees charged to the C Class of the Fund was waived from 2010 through 2012, partially recovered in 2013, fully recovered in 2014 and waived in 2018. Performance prior to waiving fees was lower than the actual returns shown for 2010 through 2012 and for 2018. The maximum contingent deferred sales charge for C Class is 1% for shares redeemed within one year of the date of purchase. |
| 5. | To reflect the Fund’s allocation of its assets between investment-grade fixed-income securities and equity securities, the returns of the Russell 1000 Value Index and the Bloomberg Barclays U.S. Aggregate Bond Index have been combined in a 60% / 40% proportion. |
| 6. | The Russell 1000 Value Index is an unmanaged index of those stocks in the Russell 1000 Index with lowerprice-to-book ratios and lower forecasted values. Russell 1000 Value Index and Russell 1000 Index are registered trademarks of Frank Russell Company. Frank Russell Company (“Russell”) is the source and owner of the trademarks, service marks and copyrights related to the Russell Indexes. Russell® is a trademark of Frank Russell Company. Neither Russell nor its licensors accept any liability for any errors or omissions in the Russell Indexes and/or Russell ratings or underlying data, and no party may rely on any Russell Indexes and/or Russell ratings and/or underlying data contained in this communication. No further distribution of Russell Data is permitted without Russell’s express written consent. Russell does not promote, sponsor or endorse the content of this communication. The Bloomberg Barclays U.S. Aggregate Bond Index is a market value weighted index of government, corporate, mortgage-backed and asset-backed fixed-rate debt securities of all maturities. One cannot directly invest in an index. |
| 7. | The Total Annual Fund Operating Expense ratios set forth in the most recent Fund prospectus for the Institutional, Y, Investor, Advisor, A, and C Class shares were 0.62%, 0.70%, 0.95%, 1.12%, 0.91% and 1.66%, respectively. The expense ratios above may vary from the expense ratios presented in other sections of this report that are based on expenses incurred during the period covered by this report. |
During the twelve-month period, the Fund’s assets on average were invested 63% in equities (including equitized cash) and 37% in fixed-income securities, ending the period with 61% in equities (including equitized cash) and 39% in fixed-income securities.
The equity portion of the Fund (excluding equitized cash) returned 10.0% for the period, underperforming the Russell 1000 Value Index (the “Index”) return of 11.2%. The Fund underperformed the Index as sector allocation outweighed the benefits gained from stock selection relative to the Index.
Stock selection in the Consumer Discretionary and Financials sectors contributed the majority of the positive relative performance during the twelve-month period. In the Consumer Discretionary sector, the Fund’s position in Dollar General Corp. (up 44.6%) and PulteGroup, Inc. (up 63.9%) were the biggest additives. In the Financials sector, American International Group, Inc. (up 33.8%) and The Blackstone Group LP (up 49.5%) performed well. Conversely, positions in Altria Group Inc. (down 26.2%) and Imperial Brands PLC, Sponsored ADR (down 29.0%) both detracted from performance with the Consumer Staples sector.
The Fund’s overweight to Energy (down 12.3%) and underweight to Real Estate (up 25.2%) hurt performance the most through sector allocation. On the other side, being overweight in Information Technology (up 20.0%) helped buoy some of the Fund’s relative underperformance.
The fixed-income portion of the Fund returned 13.0% for the twelve-month period, outperforming the Bloomberg Barclays U.S. Aggregate Bond Index (the “Barclays Index”) return of 11.5%. The Fund’s fixed-income excess performance relative to the Barclays Index was due to both sector allocation and security selection. The Fund’s selections in U.S. Treasuries (up 13.9%) and Consumer Corporates (up 25.7%) added relative value. Also, an
4
American Beacon Balanced FundSM
Performance Overview
October 31, 2019 (Unaudited)
underweight to Mortgage-Backed Securities (“MBS”) (up 9.1%) and an overweight to Manufacturing (up 14.7%), within Corporates, also benefited the Fund. From a duration perspective, the portfolio was helped most by an overweight allocation in the 10 to 30 year maturity and an underweight allocation in the 1 to 3 year maturity range.
Thesub-advisors continue to focus on the disciplined selection of attractive securities that should allow the Fund to benefit long-term.
| Top Ten Holdings (% Net Assets) |
| |||||||
| U.S. Treasury Notes/Bonds, 1.766%, Due 4/30/2021,(3-mo. Treasury money market yield + 0.139%) | 5.1 | |||||||
| U.S. Treasury Notes/Bonds, 1.857%, Due 7/31/2021,(3-mo. Treasury money market yield + 0.220%) | 3.9 | |||||||
| Citigroup, Inc. | 1.7 | |||||||
| Microsoft Corp. | 1.6 | |||||||
| American International Group, Inc. | 1.5 | |||||||
| Bank of America Corp. | 1.5 | |||||||
| Wells Fargo & Co. | 1.5 | |||||||
| General Motors Co. | 1.4 | |||||||
| Medtronic PLC | 1.4 | |||||||
| Oracle Corp. | 1.3 | |||||||
| Total Fund Holdings | 491 | |||||||
| Sector Allocation (% Equities) |
| |||||||
| Financials | 21.6 | |||||||
| Energy | 14.3 | |||||||
| Health Care | 12.1 | |||||||
| Consumer Discretionary | 11.3 | |||||||
| Information Technology | 10.8 | |||||||
| Industrials | 9.3 | |||||||
| Communication Services | 7.2 | |||||||
| Materials | 6.0 | |||||||
| Consumer Staples | 4.1 | |||||||
| Utilities | 3.1 | |||||||
| Real Estate | 0.2 | |||||||
| Sector Allocation (% Fixed Income) |
| |||||||
| U.S. Treasury Obligations | 44.0 | |||||||
| U.S. Agency Mortgage-Backed Obligations | 14.3 | |||||||
| Financial | 10.3 | |||||||
| Technology | 7.0 | |||||||
| Consumer,Non-Cyclical | 4.5 | |||||||
| Communications | 4.4 | |||||||
| Energy | 3.4 | |||||||
| Industrial | 2.8 | |||||||
| Utilities | 2.7 | |||||||
| Consumer, Cyclical | 2.3 | |||||||
| Commercial Mortgage-Backed Obligations | 1.7 | |||||||
| Asset-Backed Obligations | 1.4 | |||||||
| Basic Materials | 0.7 | |||||||
| Foreign Sovereign Obligations | 0.4 | |||||||
| Collateralized Mortgage Obligations | 0.1 | |||||||
5
American Beacon Mid-Cap Value FundSM
Performance Overview
October 31, 2019 (Unaudited)
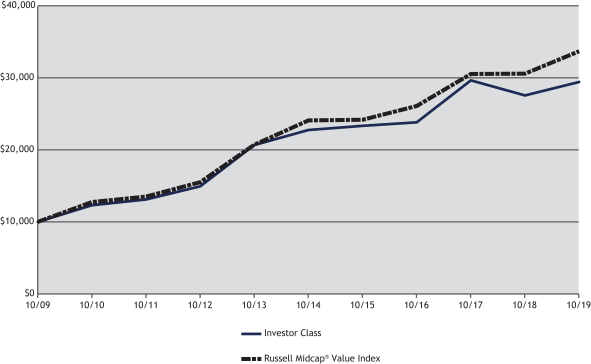
The Investor Class of the American BeaconMid-Cap Value Fund (the “Fund”) returned 6.79% for the twelve months ended October 31, 2019, underperforming the Russell Midcap® Value Index (the “Index”) return of 10.08% for the same period.
Comparison of Change in Value of a $10,000 Investment for the period from 10/31/2009 through 10/31/2019
| Total Returns for the Period ended October 31, 2019 |
| |||||||||||||||||||||||||||||||
Ticker | 1 Year | 3 Years | 5 Years | 10 Years | Value of $10,000 10/31/2009- 10/31/2019 | |||||||||||||||||||||||||||
Institutional Class (1,3,10) | AACIX | 7.08 | % | 7.53 | % | 5.51 | % | 11.57 | % | $ | 29,899 | |||||||||||||||||||||
Y Class (1,4,10) | ACMYX | 7.04 | % | 7.46 | % | 5.46 | % | 11.51 | % | $ | 29,716 | |||||||||||||||||||||
Investor Class (1,2,10) | AMPAX | 6.79 | % | 7.29 | % | 5.27 | % | 11.38 | % | $ | 29,390 | |||||||||||||||||||||
Advisor Class (1,5,10) | AMCSX | 6.50 | % | 6.98 | % | 4.97 | % | 10.98 | % | $ | 28,354 | |||||||||||||||||||||
A Class without sales charge (1,6,10) | ABMAX | 6.64 | % | 7.09 | % | 5.11 | % | 11.09 | % | $ | 28,617 | |||||||||||||||||||||
A Class with sales charge (1,6,10) | ABMAX | 0.54 | % | 4.99 | % | 3.87 | % | 10.43 | % | $ | 26,970 | |||||||||||||||||||||
C Class without sales charge (1,7,10) | AMCCX | 5.94 | % | 6.37 | % | 4.36 | % | 10.35 | % | $ | 26,784 | |||||||||||||||||||||
C Class with sales charge (1,7,10) | AMCCX | 4.94 | % | 6.37 | % | 4.36 | % | 10.35 | % | $ | 26,784 | |||||||||||||||||||||
R6 Class (1,8,10) | AMDRX | 7.15 | % | 7.55 | % | 5.53 | % | 11.58 | % | $ | 29,919 | |||||||||||||||||||||
Russell Midcap® Value Index (9) | AMDRX | 10.08 | % | 8.90 | % | 6.95 | % | 12.90 | % | $ | 33,652 | |||||||||||||||||||||
| 1. | Performance shown is historical and is not indicative of future returns. Investment returns and principal value will vary, and shares may be worth more or less at redemption than at original purchase. Performance shown is calculated based on the published end of day net asset values as of date indicated, and current performance may be lower or higher than the performance data quoted. To obtain performance as of the most recent month end, please visitwww.americanbeaconfunds.com or call1-800-967-9009. Fund performance in the table above does not reflect the deduction of taxes a shareholder would pay on distributions or the redemption of shares. Generally accepted accounting principles require adjustments to be made to the net assets of the Fund at period end for financial reporting purposes only; and as such, the total return based on the unadjusted net asset value per share may differ from the total return reported in the financial highlights. |
| 2. | A portion of the fees charged to the Investor Class of the Fund was waived from 2006 through 2013 and fully recovered in 2014. Performance prior to waiving fees was lower than actual returns shown for 2006 to 2013. |
6
American Beacon Mid-Cap Value FundSM
Performance Overview
October 31, 2019 (Unaudited)
| 3. | A portion of the fees charged to the Institutional Class of the Fund was waived from 2005 through 2013 and fully recovered in 2014. Performance prior to waiving fees was lower than actual returns shown for 2005 to 2013. |
| 4. | Fund performance for theten-year period represents the total returns achieved by the Institutional Class from 10/31/09 up to 3/1/10, the inception date of the Y Class and the returns of the Y Class since its inception. Expenses of the Institutional Class are lower than those of the Y Class. As a result, total returns shown may be higher than they would have been had the Y Class been in existence since 10/31/09. A portion of the fees charged to the Y Class of the Fund was waived from 2010 through 2013. Performance prior to waiving fees was lower than the actual returns shown for 2010 through 2013. |
| 5. | A portion of the fees charged to the Advisor Class of the Fund was waived from 2007 through 2013 and fully recovered in 2014. Performance prior to waiving fees was lower than the actual returns shown for 2007 to 2013. |
| 6. | Fund performance for theten-year period represents the total returns achieved by the Investor Class from 10/31/09 to 5/17/10, the inception date of the A Class, and the returns of the A Class since its inception. Expenses of the Investor Class are lower than those of the A Class. As a result, total returns shown may be higher than they would have been had the A Class been in existence since 10/31/09. A portion of the fees charged to the A Class of the Fund was waived for 2010 through 2012 and fully recovered in 2013. Performance prior to waiving fees was lower than the actual returns shown from 2010 through 2012. A Class shares have a maximum sales charge of 5.75%. |
| 7. | Fund performance for theten-year period represents the total returns achieved by the Investor Class from 10/31/09 to 9/1/10, the inception date of the C Class, and the returns of the C Class since its inception. Expenses of the Investor Class are lower than those of the C Class. As a result, total returns shown may be higher than they would have been had the C Class been in existence since 10/31/09. A portion of the fees charged to the C Class of the Fund was waived from 2010 through 2013 and fully recovered in 2014. Performance prior to waiving fees was lower than the actual returns shown for 2010 through 2013. The maximum contingent deferred sales charge for C Class is 1.00% for shares redeemed within one year of the date of purchase. |
| 8. | Fund performance for the three-year, five-year andten-year periods represents the returns achieved by the Institutional Class from 10/31/09 through 2/28/18, the inception date of the R6 Class, and the returns of the R6 Class since its inception. Expenses of the R6 Class are lower than those of the Institutional Class. As a result, total returns shown may be lower than they would have been had the R6 Class been in existence since 10/31/09. A portion of fees charged to the R6 Class of the Fund has been waived since Class inception. Performance prior to waiving fees was lower than actual returns shown since inception. |
| 9. | The Russell Midcap Value Index is an unmanaged index of those stocks in the Russell Midcap Index with lowerprice-to-book ratios and lower forecasted growth values. The Russell Midcap Index measures the performance of the 800 smallest companies in the Russell 1000 Index. Russell Midcap Value Index, Russell Midcap Index and Russell 1000 Index are registered trademarks of Frank Russell Company. Frank Russell Company (“Russell”) is the source and owner of the trademarks, service marks and copyrights related to the Russell Indexes. Russell® is a trademark of Frank Russell Company. Neither Russell nor its licensors accept any liability for any errors or omissions in the Russell Indexes and/or Russell ratings or underlying data, and no party may rely on any Russell Indexes and/or Russell ratings and/or underlying data contained in this communication. No further distribution of Russell Data is permitted without Russell’s express written consent. Russell does not promote, sponsor or endorse the content of this communication. One cannot directly invest in an index. |
| 10. | The Total Annual Fund Operating Expense ratios set forth in the most recent Fund prospectus for the Institutional, Y, Investor, Advisor, A, C, and R6 Class shares were 0.86%, 0.94%, 1.13%, 1.40%, 1.26%, 1.88% and 3.10%, respectively. The expense ratios above may vary from the expense ratios presented in other sections of this report that are based on expenses incurred during the period covered by this report. |
The Fund trailed the Index due to sector allocation, while stock selection added value for the period.
In sector allocation, the Fund’s overweight position in Energy, the worst performing sector in the Index, was the primary driver of underperformance. Underweights to Real Estate and Utilities, two of the best performers for the Index, further detracted from relative returns. Offsetting some of this underperformance were underweight positions in the Health Care and Consumer Staples sectors, both of which were low performing sectors for the Index.
From a stock selection perspective, the Fund’s relative outperformance was driven by holdings in the Financials, Industrials, and Consumer Discretionary sectors. Within Financials, Fidelity National Financial, Inc. was up 40.8%, Apollo Global Management, Inc. was up 51.0%, and Willis Towers Watson PLC was up 32.0%. Companies in the Industrials sector adding to relative performance included Transdigm Group, Inc. (up 72.3%) and Carlisle Cos., Inc. (up 50.1%). In Consumer Discretionary, the Fund avoided Index-position Tapestry, Inc. (down 36.1%), while holdings in Aaron’s, Inc. and Dollar General Corp. were up 58.9% and 45.7%, respectively. Offsetting this performance were positions in the Utilities and Real Estate sectors. Within Utilities, PG&E Corp. was down 67.4% for the period. In the Real Estate sector, Realogy Holdings Corp. was down 55.7%, and the Fund did not hold Index-position Camden Property Trust, which was up 30.7% for the year.
Thesub-advisors’ philosophy of investing in undervalued companies that exhibit improving profitability and earnings growth potential should allow the Fund to benefit longer term.
7
American Beacon Mid-Cap Value FundSM
Performance Overview
October 31, 2019 (Unaudited)
| Top Ten Holdings (% Net Assets) |
| |||||||
| Axis Capital Holdings Ltd. | 2.3 | |||||||
| Fidelity National Financial, Inc. | 1.9 | |||||||
| Stanley Black & Decker, Inc. | 1.8 | |||||||
| Fifth Third Bancorp | 1.7 | |||||||
| Marvell Technology Group Ltd. | 1.6 | |||||||
| MGM Growth Properties LLC, Class A | 1.6 | |||||||
| TransDigm Group, Inc. | 1.5 | |||||||
| Universal Health Services, Inc., Class B | 1.4 | |||||||
| Halliburton Co. | 1.3 | |||||||
| Wabtec Corp. | 1.3 | |||||||
| Total Fund Holdings | 114 | |||||||
| Sector Allocation (% Equities) |
| |||||||
| Financials | 22.8 | |||||||
| Industrials | 18.7 | |||||||
| Consumer Discretionary | 17.3 | |||||||
| Energy | 8.2 | |||||||
| Information Technology | 7.8 | |||||||
| Real Estate | 7.5 | |||||||
| Utilities | 6.0 | |||||||
| Health Care | 4.9 | |||||||
| Materials | 4.5 | |||||||
| Communication Services | 1.8 | |||||||
| Consumer Staples | 0.5 | |||||||
8
American Beacon FundsSM
October 31, 2019 (Unaudited)
Fund Expense Example
As a shareholder of a Fund, you incur two types of costs: (1) transaction costs, including sales charges (loads) on purchase payments and redemption fees if applicable, and (2) ongoing costs, including management fees, distribution(12b-1) fees,sub-transfer agent fees, and other Fund expenses. The Examples are intended to help you understand the ongoing cost (in dollars) of investing in the Funds and to compare these costs with the ongoing costs of investing in other mutual funds. The Examples are based on an investment of $1,000 invested at the beginning of the period in each Class and held for the entire period from May 1, 2019 through October 31, 2019.
Actual Expenses
The “Actual” lines on the tables provide information about actual account values and actual expenses. You may use the information on this page, together with the amount you invested, to estimate the expenses that you paid over the period. Simply divide your account value by $1,000 (for example, an $8,600 account value divided by $1,000 = $8.60), then multiply the result by the “Expenses Paid During Period” for the applicable Fund to estimate the expenses you paid on your account during this period. Shareholders of the Investor and Institutional Classes that invest in the Fund through an IRA or Roth IRA may be subject to a custodial IRA fee of $15 that is typically deducted each December. If your account was subject to a custodial IRA fee during the period, your costs would have been $15 higher.
Hypothetical Example for Comparison Purposes
The “Hypothetical” line of the tables provide information about hypothetical account values and hypothetical expenses based on the Fund’s actual expense ratio and an assumed 5% per year rate of return before expenses (not the Fund’s actual return). You may compare the ongoing costs of investing in the Funds with other funds by contrasting this 5% hypothetical example and the 5% hypothetical examples that appear in the shareholder reports of the other funds. The hypothetical account values and expenses may not be used to estimate the actual ending account balance or expenses you paid for the period. Shareholders of the Investor and Institutional Classes that invest in the Funds through an IRA or Roth IRA may be subject to a custodial IRA fee of $15 that is typically deducted each December. If your account was subject to a custodial IRA fee during the period, your costs would have been $15 higher.
You should also be aware that the expenses shown in the table highlight only your ongoing costs and do not reflect any transaction costs charged by the Funds, such as sales charges (loads) or redemption fees, as applicable. Similarly, the expense examples for other funds do not reflect any transaction costs charged by those funds, such as sales charges (loads), redemption fees or exchange fees. Therefore, the “Hypothetical” lines of the tables are useful in comparing ongoing costs only and will not help you determine the relative total costs of owning different funds. If you were subject to any transaction costs during the period, your costs would have been higher.
9
American Beacon FundsSM
Expense Examples
October 31, 2019 (Unaudited)
| American Beacon Balanced Fund | |||||||||||||||
| Beginning Account Value 5/1/2019 | Ending Account Value 10/31/2019 | Expenses Paid During Period 5/1/2019-10/31/2019* | |||||||||||||
| Institutional Class | |||||||||||||||
| Actual | $1,000.00 | $1,039.30 | $3.44 | ||||||||||||
| Hypothetical** | $1,000.00 | $1,021.83 | $3.41 | ||||||||||||
| Y Class | |||||||||||||||
| Actual | $1,000.00 | $1,038.00 | $3.85 | ||||||||||||
| Hypothetical** | $1,000.00 | $1,021.43 | $3.82 | ||||||||||||
| Investor Class | |||||||||||||||
| Actual | $1,000.00 | $1,037.30 | $5.14 | ||||||||||||
| Hypothetical** | $1,000.00 | $1,020.16 | $5.09 | ||||||||||||
| Advisor Class | |||||||||||||||
| Actual | $1,000.00 | $1,036.60 | $5.95 | ||||||||||||
| Hypothetical** | $1,000.00 | $1,019.36 | $5.90 | ||||||||||||
| A Class | |||||||||||||||
| Actual | $1,000.00 | $1,037.40 | $5.19 | ||||||||||||
| Hypothetical** | $1,000.00 | $1,020.11 | $5.14 | ||||||||||||
| C Class | |||||||||||||||
| Actual | $1,000.00 | $1,033.00 | $9.02 | ||||||||||||
| Hypothetical** | $1,000.00 | $1,016.33 | $8.94 | ||||||||||||
| * | Expenses are equal to the Fund’s annualized expense ratios for thesix-month period of 0.67%, 0.75%, 1.00%, 1.16%, 1.01%, and 1.76% for the Institutional, Y, Investor, Advisor, A, and C Classes, respectively, multiplied by the average account value over the period, multiplied by the number derived by dividing the number of days in the most recent fiscal half-year (184) by days in the year (365) to reflect the half-year period. |
| ** | 5% return before expenses. |
| American BeaconMid-Cap Value Fund | |||||||||||||||
| Beginning Account Value 5/1/2019 | Ending Account Value 10/31/2019 | Expenses Paid During Period 5/1/2019-10/31/2019* | |||||||||||||
| Institutional Class | |||||||||||||||
| Actual | $1,000.00 | $995.50 | $4.98 | ||||||||||||
| Hypothetical** | $1,000.00 | $1,020.22 | $5.04 | ||||||||||||
| Y Class | |||||||||||||||
| Actual | $1,000.00 | $996.10 | $5.18 | ||||||||||||
| Hypothetical** | $1,000.00 | $1,020.01 | $5.24 | ||||||||||||
| Investor Class | |||||||||||||||
| Actual | $1,000.00 | $994.90 | $6.24 | ||||||||||||
| Hypothetical** | $1,000.00 | $1,018.96 | $6.31 | ||||||||||||
| Advisor Class | |||||||||||||||
| Actual | $1,000.00 | $993.40 | $7.59 | ||||||||||||
| Hypothetical** | $1,000.00 | $1,017.59 | $7.68 | ||||||||||||
| A Class | |||||||||||||||
| Actual | $1,000.00 | $993.40 | $7.54 | ||||||||||||
| Hypothetical** | $1,000.00 | $1,017.64 | $7.63 | ||||||||||||
| C Class | |||||||||||||||
| Actual | $1,000.00 | $990.40 | $10.33 | ||||||||||||
| Hypothetical** | $1,000.00 | $1,014.82 | $10.46 | ||||||||||||
| R6 Class | |||||||||||||||
| Actual | $1,000.00 | $996.10 | $4.18 | ||||||||||||
| Hypothetical** | $1,000.00 | $1,021.02 | $4.23 | ||||||||||||
| * | Expenses are equal to the Fund’s annualized expense ratios for thesix-month period of 0.99%, 1.03%, 1.24%, 1.51%, 1.50%, 2.06%, and 0.83% for the Institutional, Y, Investor, Advisor, A, C, and R6 Classes, respectively, multiplied by the average account value over the period, multiplied by the number derived by dividing the number of days in the most recent fiscal half-year (184) by days in the year (365) to reflect the half-year period. |
| ** | 5% return before expenses. |
10
American Beacon FundsSM
Report of Independent Registered Public Accounting Firm
To the Shareholders and the Board of Trustees of
American Beacon Balanced Fund and American BeaconMid-Cap Value Fund
Opinion on the Financial Statements
We have audited the accompanying statements of assets and liabilities of American Beacon Balanced Fund and American BeaconMid-Cap Value Fund (collectively referred to as the “Funds”), (two of the funds constituting American Beacon Funds (the “Trust”)), including the schedules of investments, as of October 31, 2019, and the related statements of operations for the year then ended, the statements of changes in net assets for each of the two years in the period then ended, the financial highlights for each of the five years in the period then ended and the related notes (collectively referred to as the “financial statements”). In our opinion, the financial statements present fairly, in all material respects, the financial position of each of the Funds at October 31, 2019, the results of their operations for the year then ended, the changes in their net assets for each of the two years in the period then ended and their financial highlights for each of the five years in the period then ended, in conformity with U.S. generally accepted accounting principles.
Basis for Opinion
These financial statements are the responsibility of the Trust’s management. Our responsibility is to express an opinion on each of the Funds’ financial statements based on our audits. We are a public accounting firm registered with the Public Company Accounting Oversight Board (United States) (“PCAOB”) and are required to be independent with respect to the Trust in accordance with the U.S. federal securities laws and the applicable rules and regulations of the Securities and Exchange Commission and the PCAOB.
We conducted our audits in accordance with the standards of the PCAOB. Those standards require that we plan and perform the audit to obtain reasonable assurance about whether the financial statements are free of material misstatement, whether due to error or fraud. The Trust is not required to have, nor were we engaged to perform, an audit of the Trust’s internal control over financial reporting. As part of our audits, we are required to obtain an understanding of internal control over financial reporting, but not for the purpose of expressing an opinion on the effectiveness of the Trust’s internal control over financial reporting. Accordingly, we express no such opinion.
Our audits included performing procedures to assess the risks of material misstatement of the financial statements, whether due to error or fraud, and performing procedures that respond to those risks. Such procedures included examining, on a test basis, evidence regarding the amounts and disclosures in the financial statements. Our procedures included confirmation of securities owned as of October 31, 2019, by correspondence with the custodian and brokers or by other appropriate auditing procedures where replies from brokers were not received. Our audits also included evaluating the accounting principles used and significant estimates made by management, as well as evaluating the overall presentation of the financial statements. We believe that our audits provide a reasonable basis for our opinion.

We have served as the auditor of one or more American Beacon investment companies since 1987.
Dallas, Texas
December 30, 2019
11
American Beacon Balanced FundSM
Schedule of Investments
October 31, 2019
| Shares | Fair Value | ||||||||||||||
| COMMON STOCKS - 58.93% | |||||||||||||||
| Communication Services - 4.26% | |||||||||||||||
| Diversified Telecommunication Services - 0.82% | |||||||||||||||
| AT&T, Inc. | 55,073 | $ | 2,119,760 | ||||||||||||
|
| ||||||||||||||
| Interactive Media & Services - 0.74% | |||||||||||||||
| Alphabet, Inc., Class AA | 690 | 868,572 | |||||||||||||
| Facebook, Inc., Class AA | 5,500 | 1,054,075 | |||||||||||||
|
| ||||||||||||||
| 1,922,647 | |||||||||||||||
|
| ||||||||||||||
| Media - 2.27% | |||||||||||||||
| CBS Corp., Class B, NVDR | 11,852 | 427,146 | |||||||||||||
| Comcast Corp., Class A | 67,029 | 3,004,240 | |||||||||||||
| Discovery, Inc., Class CA | 44,799 | 1,130,727 | |||||||||||||
| Interpublic Group of Cos., Inc. | 13,000 | 282,750 | |||||||||||||
| News Corp., Class A | 55,500 | 760,905 | |||||||||||||
| Omnicom Group, Inc. | 3,586 | 276,803 | |||||||||||||
|
| ||||||||||||||
| 5,882,571 | |||||||||||||||
|
| ||||||||||||||
| Wireless Telecommunication Services - 0.43% | |||||||||||||||
| Vodafone Group PLC, Sponsored ADRB | 54,132 | 1,105,375 | |||||||||||||
|
| ||||||||||||||
Total Communication Services | 11,030,353 | ||||||||||||||
|
| ||||||||||||||
| Consumer Discretionary - 6.66% | |||||||||||||||
| Auto Components - 0.97% | |||||||||||||||
| Adient PLC | 15,732 | 333,361 | |||||||||||||
| Goodyear Tire & Rubber Co. | 30,759 | 488,145 | |||||||||||||
| Magna International, Inc. | 31,427 | 1,689,830 | |||||||||||||
|
| ||||||||||||||
| 2,511,336 | |||||||||||||||
|
| ||||||||||||||
| Automobiles - 1.58% | |||||||||||||||
| General Motors Co. | 99,391 | 3,693,370 | |||||||||||||
| Harley-Davidson, Inc. | 10,541 | 410,150 | |||||||||||||
|
| ||||||||||||||
| 4,103,520 | |||||||||||||||
|
| ||||||||||||||
| Hotels, Restaurants & Leisure - 0.63% | |||||||||||||||
| Aramark | 25,988 | 1,137,235 | |||||||||||||
| Norwegian Cruise Line Holdings Ltd.A | 9,565 | 485,519 | |||||||||||||
|
| ||||||||||||||
| 1,622,754 | |||||||||||||||
|
| ||||||||||||||
| Household Durables - 0.99% | |||||||||||||||
| DR Horton, Inc. | 13,011 | 681,386 | |||||||||||||
| Mohawk Industries, Inc.A | 6,800 | 974,984 | |||||||||||||
| PulteGroup, Inc. | 23,100 | 906,444 | |||||||||||||
|
| ||||||||||||||
| 2,562,814 | |||||||||||||||
|
| ||||||||||||||
| Internet & Direct Marketing Retail - 0.17% | |||||||||||||||
| eBay, Inc. | 12,200 | 430,050 | |||||||||||||
|
| ||||||||||||||
| Multiline Retail - 1.11% | |||||||||||||||
| Dollar General Corp. | 17,867 | 2,864,795 | |||||||||||||
|
| ||||||||||||||
| Specialty Retail - 1.21% | |||||||||||||||
| Advance Auto Parts, Inc. | 6,195 | 1,006,564 | |||||||||||||
| Lowe’s Cos., Inc. | 19,078 | 2,129,295 | |||||||||||||
|
| ||||||||||||||
| 3,135,859 | |||||||||||||||
|
| ||||||||||||||
Total Consumer Discretionary | 17,231,128 | ||||||||||||||
|
| ||||||||||||||
See accompanying notes
12
American Beacon Balanced FundSM
Schedule of Investments
October 31, 2019
| Shares | Fair Value | ||||||||||||||
| COMMON STOCKS - 58.93% (continued) | |||||||||||||||
| Consumer Staples - 2.42% | |||||||||||||||
| Beverages - 0.43% | |||||||||||||||
| Molson Coors Brewing Co., Class B | 21,000 | $ | 1,107,120 | ||||||||||||
|
| ||||||||||||||
| Food Products - 0.82% | |||||||||||||||
| Ingredion, Inc. | 9,200 | 726,800 | |||||||||||||
| Mondelez International, Inc., Class A | 7,800 | 409,110 | |||||||||||||
| Tyson Foods, Inc., Class A | 12,100 | 1,001,759 | |||||||||||||
|
| ||||||||||||||
| 2,137,669 | |||||||||||||||
|
| ||||||||||||||
| Personal Products - 0.30% | |||||||||||||||
| Unilever PLC, Sponsored ADR | 12,900 | 775,419 | |||||||||||||
|
| ||||||||||||||
| Tobacco - 0.87% | |||||||||||||||
| Altria Group, Inc. | 17,589 | 787,812 | |||||||||||||
| Imperial Brands PLC, Sponsored ADR | 22,104 | 486,288 | |||||||||||||
| Philip Morris International, Inc. | 12,039 | 980,456 | |||||||||||||
|
| ||||||||||||||
| 2,254,556 | |||||||||||||||
|
| ||||||||||||||
Total Consumer Staples | 6,274,764 | ||||||||||||||
|
| ||||||||||||||
| Energy - 8.40% | |||||||||||||||
| Energy Equipment & Services - 1.40% | |||||||||||||||
| Halliburton Co. | 69,700 | 1,341,725 | |||||||||||||
| National Oilwell Varco, Inc. | 46,100 | 1,042,782 | |||||||||||||
| Schlumberger Ltd. | 38,000 | 1,242,220 | |||||||||||||
|
| ||||||||||||||
| 3,626,727 | |||||||||||||||
|
| ||||||||||||||
| Oil, Gas & Consumable Fuels - 7.00% | |||||||||||||||
| Apache Corp. | 38,814 | 840,711 | |||||||||||||
| BP PLC, Sponsored ADR | 88,835 | 3,367,735 | |||||||||||||
| Canadian Natural Resources Ltd. | 69,565 | 1,754,429 | |||||||||||||
| Chevron Corp. | 20,060 | 2,329,768 | |||||||||||||
| ConocoPhillips | 52,202 | 2,881,550 | |||||||||||||
| Hess Corp. | 15,332 | 1,008,079 | |||||||||||||
| Kosmos Energy Ltd. | 34,869 | 216,188 | |||||||||||||
| Marathon Oil Corp. | 76,931 | 887,015 | |||||||||||||
| Marathon Petroleum Corp. | 7,531 | 481,608 | |||||||||||||
| Murphy Oil Corp.B | 29,575 | 610,132 | |||||||||||||
| Phillips 66 | 18,747 | 2,190,025 | |||||||||||||
| Royal Dutch Shell PLC, Class A, Sponsored ADR | 13,835 | 802,015 | |||||||||||||
| Royal Dutch Shell PLC, Class B, Sponsored ADR | 12,500 | 728,625 | |||||||||||||
|
| ||||||||||||||
| 18,097,880 | |||||||||||||||
|
| ||||||||||||||
Total Energy | 21,724,607 | ||||||||||||||
|
| ||||||||||||||
| Financials - 12.73% | |||||||||||||||
| Banks - 6.75% | |||||||||||||||
| Banco Santander S.A., Sponsored ADRB | 156,400 | 619,344 | |||||||||||||
| Bank of America Corp. | 123,578 | 3,864,284 | |||||||||||||
| CIT Group, Inc. | 5,850 | 250,906 | |||||||||||||
| Citigroup, Inc. | 59,266 | 4,258,855 | |||||||||||||
| Citizens Financial Group, Inc. | 23,068 | 811,071 | |||||||||||||
| Fifth Third Bancorp | 9,800 | 284,984 | |||||||||||||
| JPMorgan Chase & Co. | 27,262 | 3,405,569 | |||||||||||||
| Wells Fargo & Co. | 77,032 | 3,977,162 | |||||||||||||
|
| ||||||||||||||
| 17,472,175 | |||||||||||||||
|
| ||||||||||||||
See accompanying notes
13
American Beacon Balanced FundSM
Schedule of Investments
October 31, 2019
| Shares | Fair Value | ||||||||||||||
| COMMON STOCKS - 58.93% (continued) | |||||||||||||||
| Financials - 12.73% (continued) | |||||||||||||||
| Capital Markets - 1.48% | |||||||||||||||
| Bank of New York Mellon Corp. | 5,915 | $ | 276,526 | ||||||||||||
| E*TRADE Financial Corp. | 12,500 | 522,375 | |||||||||||||
| Goldman Sachs Group, Inc. | 7,697 | 1,642,386 | |||||||||||||
| Morgan Stanley | 12,037 | 554,304 | |||||||||||||
| State Street Corp. | 12,706 | 839,485 | |||||||||||||
|
| ||||||||||||||
| 3,835,076 | |||||||||||||||
|
| ||||||||||||||
| Consumer Finance - 1.11% | |||||||||||||||
| Capital One Financial Corp. | 11,929 | 1,112,379 | |||||||||||||
| Discover Financial Services | 6,200 | 497,612 | |||||||||||||
| Navient Corp. | 32,214 | 443,587 | |||||||||||||
| SLM Corp. | 96,249 | 812,342 | |||||||||||||
|
| ||||||||||||||
| 2,865,920 | |||||||||||||||
|
| ||||||||||||||
| Diversified Financial Services - 1.04% | |||||||||||||||
| AXA Equitable Holdings, Inc. | 37,100 | 801,360 | |||||||||||||
| Berkshire Hathaway, Inc., Class BA | 8,849 | 1,881,121 | |||||||||||||
|
| ||||||||||||||
| 2,682,481 | |||||||||||||||
|
| ||||||||||||||
| Insurance - 1.84% | |||||||||||||||
| American International Group, Inc. | 74,608 | 3,951,240 | |||||||||||||
| Travelers Cos., Inc. | 6,257 | 820,042 | |||||||||||||
|
| ||||||||||||||
| 4,771,282 | |||||||||||||||
|
| ||||||||||||||
| Mortgage Real Estate Investment Trusts (REITs) - 0.51% | |||||||||||||||
| Annaly Capital Management, Inc. | 91,900 | 825,262 | |||||||||||||
| Two Harbors Investment Corp. | 35,200 | 488,224 | |||||||||||||
|
| ||||||||||||||
| 1,313,486 | |||||||||||||||
|
| ||||||||||||||
Total Financials | 32,940,420 | ||||||||||||||
|
| ||||||||||||||
| Health Care - 7.14% | |||||||||||||||
| Biotechnology - 0.52% | |||||||||||||||
| AbbVie, Inc. | 7,100 | 564,805 | |||||||||||||
| Biogen, Inc.A | 1,072 | 320,217 | |||||||||||||
| Gilead Sciences, Inc. | 7,420 | 472,728 | |||||||||||||
|
| ||||||||||||||
| 1,357,750 | |||||||||||||||
|
| ||||||||||||||
| Health Care Equipment & Supplies - 1.73% | |||||||||||||||
| Medtronic PLC | 32,468 | 3,535,765 | |||||||||||||
| Zimmer Biomet Holdings, Inc. | 6,732 | 930,565 | |||||||||||||
|
| ||||||||||||||
| 4,466,330 | |||||||||||||||
|
| ||||||||||||||
| Health Care Providers & Services - 1.86% | |||||||||||||||
| Anthem, Inc. | 6,673 | 1,795,571 | |||||||||||||
| Centene Corp.A | 5,800 | 307,864 | |||||||||||||
| CVS Health Corp. | 27,922 | 1,853,741 | |||||||||||||
| HCA Healthcare, Inc. | 2,200 | 293,788 | |||||||||||||
| UnitedHealth Group, Inc. | 2,200 | 555,940 | |||||||||||||
|
| ||||||||||||||
| 4,806,904 | |||||||||||||||
|
| ||||||||||||||
| Pharmaceuticals - 3.03% | |||||||||||||||
| AstraZeneca PLC, Sponsored ADR | 11,700 | 573,651 | |||||||||||||
| Bristol-Myers Squibb Co. | 23,993 | 1,376,478 | |||||||||||||
| GlaxoSmithKline PLC, Sponsored ADR | 18,743 | 858,429 | |||||||||||||
| Horizon Therapeutics PLCA | 11,812 | 341,485 | |||||||||||||
See accompanying notes
14
American Beacon Balanced FundSM
Schedule of Investments
October 31, 2019
| Shares | Fair Value | ||||||||||||||
| COMMON STOCKS - 58.93% (continued) | |||||||||||||||
| Health Care - 7.14% (continued) | |||||||||||||||
| Pharmaceuticals - 3.03% (continued) | |||||||||||||||
| Jazz Pharmaceuticals PLCA | 3,793 | $ | 476,515 | ||||||||||||
| Johnson & Johnson | 5,500 | 726,220 | |||||||||||||
| Merck & Co., Inc. | 12,385 | 1,073,284 | |||||||||||||
| Mylan N.V.A | 15,744 | 301,498 | |||||||||||||
| Pfizer, Inc. | 23,600 | 905,532 | |||||||||||||
| Sanofi, ADR | 26,011 | 1,198,587 | |||||||||||||
|
| ||||||||||||||
| 7,831,679 | |||||||||||||||
|
| ||||||||||||||
Total Health Care | 18,462,663 | ||||||||||||||
|
| ||||||||||||||
| Industrials - 5.48% | |||||||||||||||
| Aerospace & Defense - 0.88% | |||||||||||||||
| Embraer S.A., Sponsored ADR | 9,024 | 156,747 | |||||||||||||
| General Dynamics Corp. | 2,533 | 447,834 | |||||||||||||
| Raytheon Co. | 4,957 | 1,051,925 | |||||||||||||
| United Technologies Corp. | 4,338 | 622,850 | |||||||||||||
|
| ||||||||||||||
| 2,279,356 | |||||||||||||||
|
| ||||||||||||||
| Air Freight & Logistics - 0.21% | |||||||||||||||
| FedEx Corp. | 3,600 | 549,576 | |||||||||||||
|
| ||||||||||||||
| Airlines - 0.45% | |||||||||||||||
| American Airlines Group, Inc. | 38,561 | 1,159,144 | |||||||||||||
|
| ||||||||||||||
| Building Products - 0.67% | |||||||||||||||
| Johnson Controls International PLC | 40,114 | 1,738,140 | |||||||||||||
|
| ||||||||||||||
| Construction & Engineering - 0.09% | |||||||||||||||
| Fluor Corp. | 13,600 | 219,096 | |||||||||||||
|
| ||||||||||||||
| Electrical Equipment - 0.17% | |||||||||||||||
| Eaton Corp. PLC | 4,883 | 425,358 | |||||||||||||
|
| ||||||||||||||
| Industrial Conglomerates - 1.74% | |||||||||||||||
| General Electric Co. | 331,840 | 3,311,763 | |||||||||||||
| Honeywell International, Inc. | 6,949 | 1,200,301 | |||||||||||||
|
| ||||||||||||||
| 4,512,064 | |||||||||||||||
|
| ||||||||||||||
| Machinery - 0.95% | |||||||||||||||
| CNH Industrial N.V.B | 101,180 | 1,103,874 | |||||||||||||
| Cummins, Inc. | 6,272 | 1,081,795 | |||||||||||||
| PACCAR, Inc. | 3,639 | 276,782 | |||||||||||||
|
| ||||||||||||||
| 2,462,451 | |||||||||||||||
|
| ||||||||||||||
| Trading Companies & Distributors - 0.32% | |||||||||||||||
| AerCap Holdings N.V.A | 14,391 | 832,951 | |||||||||||||
|
| ||||||||||||||
Total Industrials | 14,178,136 | ||||||||||||||
|
| ||||||||||||||
| Information Technology - 6.37% | |||||||||||||||
| Communications Equipment - 0.26% | |||||||||||||||
| Telefonaktiebolaget LM Ericsson, Sponsored ADR | 77,020 | 671,615 | |||||||||||||
|
| ||||||||||||||
| Electronic Equipment, Instruments & Components - 0.86% | |||||||||||||||
| Corning, Inc. | 39,495 | 1,170,237 | |||||||||||||
| IPG Photonics Corp.A | 5,000 | 671,400 | |||||||||||||
See accompanying notes
15
American Beacon Balanced FundSM
Schedule of Investments
October 31, 2019
| Shares | Fair Value | ||||||||||||||
| COMMON STOCKS - 58.93% (continued) | |||||||||||||||
| Information Technology - 6.37% (continued) | |||||||||||||||
| Electronic Equipment, Instruments & Components - 0.86% (continued) | |||||||||||||||
| TE Connectivity Ltd. | 4,358 | $ | 390,041 | ||||||||||||
|
| ||||||||||||||
| 2,231,678 | |||||||||||||||
|
| ||||||||||||||
| Semiconductors & Semiconductor Equipment - 1.61% | |||||||||||||||
| Marvell Technology Group Ltd. | 42,600 | 1,039,014 | |||||||||||||
| NVIDIA Corp. | 3,900 | 783,978 | |||||||||||||
| QUALCOMM, Inc. | 24,214 | 1,947,774 | |||||||||||||
| Texas Instruments, Inc. | 3,300 | 389,367 | |||||||||||||
|
| ||||||||||||||
| 4,160,133 | |||||||||||||||
|
| ||||||||||||||
| Software - 3.01% | |||||||||||||||
| Microsoft Corp. | 28,824 | 4,132,497 | |||||||||||||
| Oracle Corp. | 63,899 | 3,481,856 | |||||||||||||
| Teradata Corp.A | 5,718 | 171,140 | |||||||||||||
|
| ||||||||||||||
| 7,785,493 | |||||||||||||||
|
| ||||||||||||||
| Technology Hardware, Storage & Peripherals - 0.63% | |||||||||||||||
| Hewlett Packard Enterprise Co. | 98,808 | 1,621,439 | |||||||||||||
|
| ||||||||||||||
Total Information Technology | 16,470,358 | ||||||||||||||
|
| ||||||||||||||
| Materials - 3.56% | |||||||||||||||
| Chemicals - 2.24% | |||||||||||||||
| Air Products & Chemicals, Inc. | 10,485 | 2,236,031 | |||||||||||||
| Corteva, Inc.A | 27,072 | 714,159 | |||||||||||||
| Dow, Inc.A | 12,001 | 605,931 | |||||||||||||
| DuPont de Nemours, Inc. | 16,972 | 1,118,625 | |||||||||||||
| Eastman Chemical Co. | 8,785 | 668,011 | |||||||||||||
| Huntsman Corp. | 19,900 | 440,387 | |||||||||||||
|
| ||||||||||||||
| 5,783,144 | |||||||||||||||
|
| ||||||||||||||
| Containers & Packaging - 0.73% | |||||||||||||||
| Crown Holdings, Inc.A | 16,235 | 1,182,557 | |||||||||||||
| International Paper Co. | 16,225 | 708,708 | |||||||||||||
|
| ||||||||||||||
| 1,891,265 | |||||||||||||||
|
| ||||||||||||||
| Metals & Mining - 0.59% | |||||||||||||||
| Freeport-McMoRan, Inc. | 37,000 | 363,340 | |||||||||||||
| Newmont Goldcorp Corp. | 29,500 | 1,172,035 | |||||||||||||
|
| ||||||||||||||
| 1,535,375 | |||||||||||||||
|
| ||||||||||||||
Total Materials | 9,209,784 | ||||||||||||||
|
| ||||||||||||||
| Real Estate - 0.10% | |||||||||||||||
| Equity Real Estate Investment Trusts (REITs) - 0.10% | |||||||||||||||
| Gaming and Leisure Properties, Inc. | 6,200 | 250,232 | |||||||||||||
|
| ||||||||||||||
| Utilities - 1.81% | |||||||||||||||
| Electric Utilities - 1.40% | |||||||||||||||
| Entergy Corp. | 15,454 | 1,877,352 | |||||||||||||
| PPL Corp. | 35,447 | 1,187,120 | |||||||||||||
| Southern Co. | 8,843 | 554,102 | |||||||||||||
|
| ||||||||||||||
| 3,618,574 | |||||||||||||||
|
| ||||||||||||||
See accompanying notes
16
American Beacon Balanced FundSM
Schedule of Investments
October 31, 2019
| Shares | Fair Value | ||||||||||||||
| COMMON STOCKS - 58.93% (continued) | |||||||||||||||
| Utilities - 1.81% (continued) | |||||||||||||||
| Multi-Utilities - 0.41% | |||||||||||||||
| Dominion Energy, Inc. | 13,060 | $ | 1,078,103 | ||||||||||||
|
| ||||||||||||||
Total Utilities | 4,696,677 | ||||||||||||||
|
| ||||||||||||||
Total Common Stocks (Cost $122,984,159) | 152,469,122 | ||||||||||||||
|
| ||||||||||||||
| Principal Amount | |||||||||||||||
| CORPORATE OBLIGATIONS - 11.45% | |||||||||||||||
| Basic Materials - 0.22% | |||||||||||||||
| Dow Chemical Co., | |||||||||||||||
4.125%, Due 11/15/2021 | $ | 145,000 | 150,266 | ||||||||||||
3.500%, Due 10/1/2024 | 264,000 | 277,089 | |||||||||||||
| Nucor Corp., | |||||||||||||||
4.125%, Due 9/15/2022 | 52,000 | 54,808 | |||||||||||||
4.000%, Due 8/1/2023 | 80,000 | 84,956 | |||||||||||||
|
| ||||||||||||||
| 567,119 | |||||||||||||||
|
| ||||||||||||||
| Communications - 0.95% | |||||||||||||||
| Amazon.com, Inc., 3.875%, Due 8/22/2037 | 40,000 | 45,482 | |||||||||||||
| AT&T, Inc., | |||||||||||||||
3.400%, Due 5/15/2025 | 169,000 | 177,079 | |||||||||||||
6.000%, Due 8/15/2040 | 40,000 | 50,092 | |||||||||||||
5.350%, Due 9/1/2040 | 30,000 | 35,536 | |||||||||||||
| CBS Corp., 3.375%, Due 3/1/2022 | 337,000 | 345,330 | |||||||||||||
| Charter Communications Operating LLC / Charter Communications Operating Capital, 3.750%, Due 2/15/2028 | 90,000 | 92,725 | |||||||||||||
| Comcast Corp., | |||||||||||||||
3.150%, Due 3/1/2026 | 54,000 | 56,983 | |||||||||||||
4.600%, Due 10/15/2038 | 60,000 | 71,293 | |||||||||||||
6.550%, Due 7/1/2039 | 217,000 | 318,208 | |||||||||||||
| Fox Corp., 5.476%, Due 1/25/2039C | 55,000 | 67,636 | |||||||||||||
| NBCUniversal Enterprise, Inc., 2.499%, Due 4/1/2021,(3-mo. USD LIBOR + 0.400%)C D | 835,000 | 837,806 | |||||||||||||
| Verizon Communications, Inc., | |||||||||||||||
2.625%, Due 8/15/2026 | 115,000 | 117,339 | |||||||||||||
4.329%, Due 9/21/2028 | 180,000 | 204,974 | |||||||||||||
| Walt Disney Co., 6.400%, Due 12/15/2035C | 35,000 | 50,370 | |||||||||||||
|
| ||||||||||||||
| 2,470,853 | |||||||||||||||
|
| ||||||||||||||
| Consumer, Cyclical - 0.77% | |||||||||||||||
| American Airlines Pass Through Trust, 3.150%, Due 8/15/2033, Series AA | 50,000 | 52,293 | |||||||||||||
| American Honda Finance Corp., | |||||||||||||||
3.875%, Due 9/21/2020C | 250,000 | 254,383 | |||||||||||||
3.375%, Due 12/10/2021 | 95,000 | 98,009 | |||||||||||||
| Aptiv Corp., 4.150%, Due 3/15/2024 | 85,000 | 90,206 | |||||||||||||
| Costco Wholesale Corp., | |||||||||||||||
2.150%, Due 5/18/2021 | 30,000 | 30,176 | |||||||||||||
2.750%, Due 5/18/2024 | 65,000 | 67,476 | |||||||||||||
| Dollar General Corp., 4.125%, Due 5/1/2028 | 50,000 | 55,444 | |||||||||||||
| Dollar Tree, Inc., 3.700%, Due 5/15/2023 | 60,000 | 62,792 | |||||||||||||
| General Motors Financial Co., Inc., 3.150%, Due 6/30/2022 | 90,000 | 91,403 | |||||||||||||
| Home Depot, Inc., 2.700%, Due 4/1/2023 | 52,000 | 53,493 | |||||||||||||
| Lowe’s Cos., Inc., 2.500%, Due 4/15/2026 | 110,000 | 110,421 | |||||||||||||
| McDonald’s Corp., 3.700%, Due 1/30/2026 | 98,000 | 105,813 | |||||||||||||
| O’Reilly Automotive, Inc., 4.350%, Due 6/1/2028 | 70,000 | 78,443 | |||||||||||||
| Starbucks Corp., 4.000%, Due 11/15/2028 | 60,000 | 67,309 | |||||||||||||
| Toyota Motor Credit Corp., 3.450%, Due 9/20/2023 | 100,000 | 105,979 | |||||||||||||
| United Airlines Pass Through Trust, 2.700%, Due 11/1/2033, Series AA | 35,000 | �� | 35,213 | ||||||||||||
| Walgreens Boots Alliance, Inc., 3.800%, Due 11/18/2024 | 145,000 | 153,661 | |||||||||||||
| Walmart, Inc., | |||||||||||||||
3.400%, Due 6/26/2023 | 65,000 | 68,678 | |||||||||||||
2.375%, Due 9/24/2029 | 150,000 | 151,168 | |||||||||||||
7.550%, Due 2/15/2030 | 169,000 | 247,308 | |||||||||||||
|
| ||||||||||||||
| 1,979,668 | |||||||||||||||
|
| ||||||||||||||
See accompanying notes
17
American Beacon Balanced FundSM
Schedule of Investments
October 31, 2019
| Principal Amount | Fair Value | ||||||||||||||
| CORPORATE OBLIGATIONS - 11.45% (continued) | |||||||||||||||
| Consumer,Non-Cyclical - 0.88% | |||||||||||||||
| AbbVie, Inc., | |||||||||||||||
3.200%, Due 5/14/2026 | $ | 60,000 | $ | 61,446 | |||||||||||
4.450%, Due 5/14/2046 | 55,000 | 56,845 | |||||||||||||
| Altria Group, Inc., 4.750%, Due 5/5/2021 | 145,000 | 150,635 | |||||||||||||
| Amgen, Inc., 4.400%, Due 5/1/2045 | 60,000 | 67,500 | |||||||||||||
| Anthem, Inc., 2.500%, Due 11/21/2020 | 65,000 | 65,387 | |||||||||||||
| Bristol-Myers Squibb Co., 3.400%, Due 7/26/2029C | 650,000 | 699,131 | |||||||||||||
| Cigna Corp., 4.125%, Due 11/15/2025 | 75,000 | 81,230 | |||||||||||||
| CVS Health Corp., | |||||||||||||||
3.700%, Due 3/9/2023 | 60,000 | 62,556 | |||||||||||||
5.050%, Due 3/25/2048 | 35,000 | 40,342 | |||||||||||||
| Genzyme Corp., 5.000%, Due 6/15/2020 | 19,000 | 19,374 | |||||||||||||
| HCA, Inc., 4.125%, Due 6/15/2029 | 60,000 | 63,564 | |||||||||||||
| Humana, Inc., 3.150%, Due 12/1/2022 | 80,000 | 82,099 | |||||||||||||
| Kaiser Foundation Hospitals, 4.150%, Due 5/1/2047 | 25,000 | 29,380 | |||||||||||||
| Kraft Heinz Foods Co., 4.625%, Due 10/1/2039C | 25,000 | 25,545 | |||||||||||||
| Medtronic, Inc., 3.500%, Due 3/15/2025 | 313,000 | 336,443 | |||||||||||||
| Molson Coors Brewing Co., 3.000%, Due 7/15/2026 | 90,000 | 90,845 | |||||||||||||
| Moody’s Corp., 4.875%, Due 12/17/2048 | 50,000 | 62,885 | |||||||||||||
| S&P Global, Inc., 4.400%, Due 2/15/2026 | 50,000 | 56,018 | |||||||||||||
| Shire Acquisitions Investments Ireland DAC, 2.875%, Due 9/23/2023 | 60,000 | 61,236 | |||||||||||||
| Zimmer Biomet Holdings, Inc., 3.550%, Due 4/1/2025 | 85,000 | 89,903 | |||||||||||||
| Zoetis, Inc., 3.000%, Due 9/12/2027 | 75,000 | 77,340 | |||||||||||||
|
| ||||||||||||||
| 2,279,704 | |||||||||||||||
|
| ||||||||||||||
| Energy - 0.34% | |||||||||||||||
| BP Capital Markets America, Inc., 3.796%, Due 9/21/2025 | 50,000 | 54,060 | |||||||||||||
| Columbia Pipeline Group, Inc., 4.500%, Due 6/1/2025 | 61,000 | 66,529 | |||||||||||||
| Concho Resources, Inc., 4.300%, Due 8/15/2028 | 60,000 | 64,746 | |||||||||||||
| Enterprise Products Operating LLC, 6.125%, Due 10/15/2039 | 45,000 | 58,350 | |||||||||||||
| Marathon Petroleum Corp., 5.125%, Due 12/15/2026 | 45,000 | 51,427 | |||||||||||||
| MPLX LP, | |||||||||||||||
4.125%, Due 3/1/2027 | 55,000 | 57,722 | |||||||||||||
5.200%, Due 3/1/2047 | 26,000 | 27,896 | |||||||||||||
| Occidental Petroleum Corp., 2.900%, Due 8/15/2024 | 70,000 | 70,637 | |||||||||||||
| ONEOK, Inc., 4.550%, Due 7/15/2028 | 65,000 | 70,749 | |||||||||||||
| Phillips 66, 4.300%, Due 4/1/2022 | 87,000 | 91,920 | |||||||||||||
| Phillips 66 Partners LP, | |||||||||||||||
3.550%, Due 10/1/2026 | 28,000 | 29,251 | |||||||||||||
3.750%, Due 3/1/2028 | 50,000 | 52,507 | |||||||||||||
| Spectra Energy Partners LP, 3.375%, Due 10/15/2026 | 63,000 | 65,311 | |||||||||||||
| Sunoco Logistics Partners Operations LP, 4.250%, Due 4/1/2024 | 48,000 | 50,676 | |||||||||||||
| Valero Energy Corp., 4.350%, Due 6/1/2028 | 60,000 | 65,323 | |||||||||||||
|
| ||||||||||||||
| 877,104 | |||||||||||||||
|
| ||||||||||||||
| Financial - 3.59% | |||||||||||||||
| American Campus Communities Operating Partnership LP, 3.625%, Due 11/15/2027 | 55,000 | 57,912 | |||||||||||||
| American Express Co., | |||||||||||||||
2.887%, Due 11/5/2021,(3-mo. USD LIBOR + 0.600%)D | 420,000 | 422,222 | |||||||||||||
3.400%, Due 2/27/2023 | 70,000 | 72,968 | |||||||||||||
4.200%, Due 11/6/2025 | 115,000 | 127,122 | |||||||||||||
4.050%, Due 12/3/2042 | 45,000 | 52,405 | |||||||||||||
| American International Group, Inc., 4.875%, Due 6/1/2022 | 289,000 | 309,877 | |||||||||||||
| Bank of America Corp., | |||||||||||||||
4.125%, Due 1/22/2024 | 193,000 | 207,499 | |||||||||||||
2.456%, Due 10/22/2025,(3-mo. USD LIBOR + 0.870%)D | 160,000 | 160,862 | |||||||||||||
6.110%, Due 1/29/2037 | 176,000 | 233,689 | |||||||||||||
5.000%, Due 1/21/2044 | 160,000 | 203,959 | |||||||||||||
| Bank of New York Mellon Corp., 3.250%, Due 5/16/2027 | 110,000 | 117,152 | |||||||||||||
| BB&T Corp., 2.750%, Due 4/1/2022 | 130,000 | 132,203 | |||||||||||||
| Boston Properties LP, | |||||||||||||||
3.200%, Due 1/15/2025 | 50,000 | 51,991 | |||||||||||||
2.900%, Due 3/15/2030 | 50,000 | 50,220 | |||||||||||||
| Camden Property Trust, 3.150%, Due 7/1/2029 | 70,000 | 73,653 | |||||||||||||
| Capital One Financial Corp., 3.200%, Due 1/30/2023 | 95,000 | 97,628 | |||||||||||||
See accompanying notes
18
American Beacon Balanced FundSM
Schedule of Investments
October 31, 2019
| Principal Amount | Fair Value | ||||||||||||||
| CORPORATE OBLIGATIONS - 11.45% (continued) | |||||||||||||||
| Financial - 3.59% (continued) | |||||||||||||||
| CBOE Global Markets, Inc., 3.650%, Due 1/12/2027 | $ | 65,000 | $ | 69,864 | |||||||||||
| Chubb INA Holdings, Inc., 3.350%, Due 5/3/2026 | 70,000 | 75,262 | |||||||||||||
| Citigroup, Inc., | |||||||||||||||
3.887%, Due 1/10/2028,(3-mo. USD LIBOR + 1.563%)D | 220,000 | 236,606 | |||||||||||||
5.875%, Due 1/30/2042 | 145,000 | 200,002 | |||||||||||||
| CNA Financial Corp., 3.900%, Due 5/1/2029 | 60,000 | 65,130 | |||||||||||||
| Crown Castle International Corp., 3.400%, Due 2/15/2021 | 59,000 | 59,977 | |||||||||||||
| Digital Realty Trust LP, 3.700%, Due 8/15/2027 | 95,000 | 100,284 | |||||||||||||
| ERP Operating LP, 3.000%, Due 4/15/2023 | 52,000 | 53,775 | |||||||||||||
| Goldman Sachs Group, Inc., | |||||||||||||||
5.750%, Due 1/24/2022 | 385,000 | 414,879 | |||||||||||||
2.908%, Due 6/5/2023,(3-mo. USD LIBOR + 1.053%)D | 140,000 | 142,321 | |||||||||||||
3.500%, Due 1/23/2025 | 65,000 | 67,954 | |||||||||||||
3.272%, Due 9/29/2025,(3-mo. USD LIBOR + 1.201%)D | 65,000 | 67,206 | |||||||||||||
| HCP, Inc., 3.250%, Due 7/15/2026 | 60,000 | 62,665 | |||||||||||||
| Intercontinental Exchange, Inc., 2.750%, Due 12/1/2020 | 35,000 | 35,289 | |||||||||||||
| JPMorgan Chase & Co., | |||||||||||||||
3.625%, Due 5/13/2024 | 434,000 | 461,541 | |||||||||||||
2.301%, Due 10/15/2025, (SOFRRATE + 1.160%)D | 180,000 | 179,634 | |||||||||||||
3.782%, Due 2/1/2028,(3-mo. USD LIBOR + 1.337%)D | 100,000 | 107,561 | |||||||||||||
3.882%, Due 7/24/2038,(3-mo. USD LIBOR + 1.360%)D | 95,000 | 104,057 | |||||||||||||
5.500%, Due 10/15/2040 | 313,000 | 413,551 | |||||||||||||
| KeyCorp, 5.100%, Due 3/24/2021 | 45,000 | 46,848 | |||||||||||||
| Liberty Mutual Group, Inc., | |||||||||||||||
4.250%, Due 6/15/2023C | 25,000 | 26,534 | |||||||||||||
4.569%, Due 2/1/2029C | 88,000 | 99,444 | |||||||||||||
| MetLife, Inc., | |||||||||||||||
6.375%, Due 6/15/2034 | 169,000 | 241,597 | |||||||||||||
4.721%, Due 12/15/2044 | 193,000 | 236,609 | |||||||||||||
| Morgan Stanley, | |||||||||||||||
3.700%, Due 10/23/2024 | 145,000 | 154,268 | |||||||||||||
3.591%, Due 7/22/2028,(3-mo. USD LIBOR + 1.340%)D | 105,000 | 110,808 | |||||||||||||
| PNC Financial Services Group, Inc., 3.500%, Due 1/23/2024 | 105,000 | 111,070 | |||||||||||||
| Prudential Financial, Inc., | |||||||||||||||
4.600%, Due 5/15/2044 | 313,000 | 369,893 | |||||||||||||
4.350%, Due 2/25/2050 | 70,000 | 80,909 | |||||||||||||
| Public Storage, 2.370%, Due 9/15/2022 | 80,000 | 81,060 | |||||||||||||
| Raymond James Financial, Inc., 3.625%, Due 9/15/2026 | 105,000 | 109,962 | |||||||||||||
| Simon Property Group LP, 3.375%, Due 10/1/2024 | 313,000 | 330,566 | |||||||||||||
| State Street Corp., 3.300%, Due 12/16/2024 | 95,000 | 100,431 | |||||||||||||
| SunTrust Bank, 2.450%, Due 8/1/2022 | 85,000 | 85,963 | |||||||||||||
| TD Ameritrade Holding Corp., 2.750%, Due 10/1/2029 | 65,000 | 65,276 | |||||||||||||
| Trinity Acquisition PLC, 4.400%, Due 3/15/2026 | 67,000 | 72,583 | |||||||||||||
| US Bancorp, | |||||||||||||||
3.375%, Due 2/5/2024 | 70,000 | 73,898 | |||||||||||||
2.400%, Due 7/30/2024 | 130,000 | 132,279 | |||||||||||||
| Ventas Realty LP, 5.700%, Due 9/30/2043 | 40,000 | 51,913 | |||||||||||||
| Visa, Inc., 3.150%, Due 12/14/2025 | 80,000 | 85,522 | |||||||||||||
| Wells Fargo & Co., | |||||||||||||||
2.961%, Due 7/26/2021,(3-mo. USD LIBOR + 1.025%)D | 1,087,000 | 1,100,261 | |||||||||||||
3.584%, Due 5/22/2028,(3-mo. USD LIBOR + 1.310%)D | 160,000 | 169,593 | |||||||||||||
4.750%, Due 12/7/2046 | 60,000 | 71,666 | |||||||||||||
|
| ||||||||||||||
| 9,297,873 | |||||||||||||||
|
| ||||||||||||||
| Industrial - 1.05% | |||||||||||||||
| Allegion PLC, 3.500%, Due 10/1/2029 | 60,000 | 61,864 | |||||||||||||
| BAE Systems Holdings, Inc., 3.800%, Due 10/7/2024C | 313,000 | 331,572 | |||||||||||||
| Burlington Northern Santa Fe LLC, | |||||||||||||||
3.650%, Due 9/1/2025 | 65,000 | 70,816 | |||||||||||||
5.750%, Due 5/1/2040 | 202,000 | 273,322 | |||||||||||||
| Caterpillar Financial Services Corp., 2.650%, Due 5/17/2021, Series I | 125,000 | 126,520 | |||||||||||||
| CSX Corp., 5.500%, Due 4/15/2041 | 157,000 | 196,594 | |||||||||||||
| Eaton Corp., 2.750%, Due 11/2/2022 | 55,000 | 56,202 | |||||||||||||
See accompanying notes
19
American Beacon Balanced FundSM
Schedule of Investments
October 31, 2019
| Principal Amount | Fair Value | ||||||||||||||
| CORPORATE OBLIGATIONS - 11.45% (continued) | |||||||||||||||
| Industrial - 1.05% (continued) | |||||||||||||||
| General Electric Co., | |||||||||||||||
5.500%, Due 1/8/2020 | $ | 120,000 | $ | 120,727 | |||||||||||
3.450%, Due 5/15/2024 | 70,000 | 72,192 | |||||||||||||
| Ingersoll-Rand Luxembourg Finance S.A., 2.625%, Due 5/1/2020 | 145,000 | 145,375 | |||||||||||||
| John Deere Capital Corp., | |||||||||||||||
1.950%, Due 6/22/2020 | 90,000 | 89,991 | |||||||||||||
2.150%, Due 9/8/2022 | 65,000 | 65,508 | |||||||||||||
| Johnson Controls International PLC, 5.000%, Due 3/30/2020 | 145,000 | 146,665 | |||||||||||||
| Lockheed Martin Corp., 3.550%, Due 1/15/2026 | 65,000 | 70,207 | |||||||||||||
| Martin Marietta Materials, Inc., 4.250%, Due 12/15/2047 | 65,000 | 66,405 | |||||||||||||
| Northrop Grumman Corp., 3.850%, Due 4/15/2045 | 130,000 | 142,013 | |||||||||||||
| Precision Castparts Corp., 3.250%, Due 6/15/2025 | 65,000 | 68,804 | |||||||||||||
| Republic Services, Inc., 2.500%, Due 8/15/2024 | 65,000 | 66,084 | |||||||||||||
| Union Pacific Corp., 4.100%, Due 9/15/2067 | 90,000 | 93,398 | |||||||||||||
| United Technologies Corp., | |||||||||||||||
1.900%, Due 5/4/2020 | 70,000 | 70,025 | |||||||||||||
4.125%, Due 11/16/2028 | 75,000 | 85,105 | |||||||||||||
6.125%, Due 7/15/2038 | 217,000 | 300,717 | |||||||||||||
|
| ||||||||||||||
| 2,720,106 | |||||||||||||||
|
| ||||||||||||||
| Technology - 2.64% | |||||||||||||||
| Analog Devices, Inc., 3.900%, Due 12/15/2025 | 75,000 | 80,925 | |||||||||||||
| Apple, Inc., | |||||||||||||||
2.850%, Due 5/11/2024 | 170,000 | 176,644 | |||||||||||||
2.200%, Due 9/11/2029 | 300,000 | 295,062 | |||||||||||||
| Broadcom Corp. / Broadcom Cayman Finance Ltd., 3.125%, Due 1/15/2025 | 60,000 | 59,948 | |||||||||||||
| Broadridge Financial Solutions, Inc., 3.400%, Due 6/27/2026 | 65,000 | 68,202 | |||||||||||||
| Dell International LLC / EMC Corp., | |||||||||||||||
4.420%, Due 6/15/2021C | 135,000 | 139,420 | |||||||||||||
5.300%, Due 10/1/2029C | 1,110,000 | 1,226,310 | |||||||||||||
| Fiserv, Inc., 3.200%, Due 7/1/2026 | 70,000 | 73,137 | |||||||||||||
| Hewlett Packard Enterprise Co., 6.350%, Due 10/15/2045 | 1,560,000 | 1,853,735 | |||||||||||||
| HP, Inc., 4.050%, Due 9/15/2022 | 145,000 | 153,147 | |||||||||||||
| Intel Corp., 3.300%, Due 10/1/2021 | 86,000 | 88,465 | |||||||||||||
| International Business Machines Corp., 4.250%, Due 5/15/2049 | 870,000 | 991,290 | |||||||||||||
| Micron Technology, Inc., 5.327%, Due 2/6/2029 | 1,135,000 | 1,256,531 | |||||||||||||
| Microsoft Corp., 4.450%, Due 11/3/2045 | 50,000 | 63,502 | |||||||||||||
| Oracle Corp., | |||||||||||||||
2.500%, Due 5/15/2022 | 115,000 | 116,785 | |||||||||||||
4.300%, Due 7/8/2034 | 112,000 | 131,252 | |||||||||||||
| QUALCOMM, Inc., 2.900%, Due 5/20/2024 | 55,000 | 56,815 | |||||||||||||
|
| ||||||||||||||
| 6,831,170 | |||||||||||||||
|
| ||||||||||||||
| Utilities - 1.01% | |||||||||||||||
| American Electric Power Co., Inc., 3.650%, Due 12/1/2021, Series I | 80,000 | 82,635 | |||||||||||||
| Appalachian Power Co., 4.500%, Due 3/1/2049, Series Y | 30,000 | 36,278 | |||||||||||||
| Berkshire Hathaway Energy Co., 6.125%, Due 4/1/2036 | 267,000 | 371,151 | |||||||||||||
| Consolidated Edison Co. of New York, Inc., | |||||||||||||||
5.500%, Due 12/1/2039, Series09-C | 169,000 | 221,507 | |||||||||||||
4.625%, Due 12/1/2054 | 55,000 | 66,032 | |||||||||||||
| Delmarva Power & Light Co., 3.500%, Due 11/15/2023 | 61,000 | 64,376 | |||||||||||||
| Dominion Energy, Inc., 2.579%, Due 7/1/2020 | 60,000 | 60,179 | |||||||||||||
| DPL, Inc., 7.250%, Due 10/15/2021 | 144,000 | 154,080 | |||||||||||||
| Duke Energy Corp., | |||||||||||||||
3.550%, Due 9/15/2021 | 130,000 | 133,333 | |||||||||||||
3.750%, Due 4/15/2024 | 65,000 | 69,067 | |||||||||||||
| Duke Energy Progress LLC, 4.150%, Due 12/1/2044 | 70,000 | 80,171 | |||||||||||||
| Entergy Louisiana LLC, 4.000%, Due 3/15/2033 | 47,000 | 53,940 | |||||||||||||
| Florida Power & Light Co., 3.950%, Due 3/1/2048 | 50,000 | 58,193 | |||||||||||||
| MidAmerican Energy Co., 3.100%, Due 5/1/2027 | 75,000 | 79,465 | |||||||||||||
| National Fuel Gas Co., 3.950%, Due 9/15/2027 | 80,000 | 81,762 | |||||||||||||
| National Rural Utilities Cooperative Finance Corp., | |||||||||||||||
2.950%, Due 2/7/2024 | 65,000 | 67,271 | |||||||||||||
4.300%, Due 3/15/2049 | 50,000 | 60,050 | |||||||||||||
| Nevada Power Co., 2.750%, Due 4/15/2020, Series BB | 50,000 | 50,200 | |||||||||||||
See accompanying notes
20
American Beacon Balanced FundSM
Schedule of Investments
October 31, 2019
| Principal Amount | Fair Value | ||||||||||||||
| CORPORATE OBLIGATIONS - 11.45% (continued) | |||||||||||||||
| Utilities - 1.01% (continued) | |||||||||||||||
| NextEra Energy Capital Holdings, Inc., 2.403%, Due 9/1/2021 | $ | 35,000 | $ | 35,267 | |||||||||||
| NiSource, Inc., | |||||||||||||||
3.490%, Due 5/15/2027 | 45,000 | 47,326 | |||||||||||||
3.950%, Due 3/30/2048 | 65,000 | 69,587 | |||||||||||||
| Southern Co., 2.750%, Due 6/15/2020 | 241,000 | 241,948 | |||||||||||||
| Southern Power Co., 4.150%, Due 12/1/2025 | 64,000 | 70,006 | |||||||||||||
| Southwestern Electric Power Co., 3.550%, Due 2/15/2022 | 289,000 | 296,789 | |||||||||||||
| WEC Energy Group, Inc., 3.550%, Due 6/15/2025 | 59,000 | 63,029 | |||||||||||||
|
| ||||||||||||||
| 2,613,642 | |||||||||||||||
|
| ||||||||||||||
Total Corporate Obligations (Cost $27,005,915) | 29,637,239 | ||||||||||||||
|
| ||||||||||||||
| FOREIGN CORPORATE OBLIGATIONS - 3.01% | |||||||||||||||
| Basic Materials - 0.06% | |||||||||||||||
| ArcelorMittal, 3.600%, Due 7/16/2024 | 70,000 | 71,618 | |||||||||||||
| Nutrien Ltd., 4.000%, Due 12/15/2026 | 49,000 | 52,526 | |||||||||||||
| Teck Resources Ltd., 6.000%, Due 8/15/2040 | 30,000 | 32,441 | |||||||||||||
|
| ||||||||||||||
| 156,585 | |||||||||||||||
|
| ||||||||||||||
| Communications - 0.72% | |||||||||||||||
| Alibaba Group Holding Ltd., 3.600%, Due 11/28/2024 | 313,000 | 328,771 | |||||||||||||
| America Movil S.A.B. de C.V., 6.375%, Due 3/1/2035 | 169,000 | 227,914 | |||||||||||||
| Bell Canada, Inc., 4.464%, Due 4/1/2048 | 45,000 | 52,125 | |||||||||||||
| Deutsche Telekom International Finance B.V., 4.875%, Due 3/6/2042C | 150,000 | 174,914 | |||||||||||||
| Rogers Communications, Inc., 3.625%, Due 12/15/2025 | 85,000 | 90,597 | |||||||||||||
| TELUS Corp., 2.800%, Due 2/16/2027 | 49,000 | 49,468 | |||||||||||||
| Thomson Reuters Corp., | |||||||||||||||
4.300%, Due 11/23/2023 | 145,000 | 155,994 | |||||||||||||
3.850%, Due 9/29/2024 | 193,000 | 204,662 | |||||||||||||
| Vodafone Group PLC, | |||||||||||||||
3.750%, Due 1/16/2024 | 65,000 | 68,521 | |||||||||||||
6.150%, Due 2/27/2037 | 393,000 | 501,655 | |||||||||||||
|
| ||||||||||||||
| 1,854,621 | |||||||||||||||
|
| ||||||||||||||
| Consumer, Cyclical - 0.12% | |||||||||||||||
| Daimler Finance North America LLC, 2.450%, Due 5/18/2020C | 313,000 | 313,869 | |||||||||||||
|
| ||||||||||||||
| Consumer,Non-Cyclical - 0.82% | |||||||||||||||
| Anheuser-Busch InBev Worldwide, Inc., | |||||||||||||||
4.375%, Due 4/15/2038 | 20,000 | 22,341 | |||||||||||||
5.450%, Due 1/23/2039 | 1,465,000 | 1,844,663 | |||||||||||||
5.550%, Due 1/23/2049 | 50,000 | 66,030 | |||||||||||||
| Coca-Cola Femsa S.A.B. de C.V., 3.875%, Due 11/26/2023 | 45,000 | 47,680 | |||||||||||||
| RELX Capital, Inc., 3.500%, Due 3/16/2023 | 55,000 | 57,060 | |||||||||||||
| Sanofi, 4.000%, Due 3/29/2021 | 75,000 | 77,360 | |||||||||||||
|
| ||||||||||||||
| 2,115,134 | |||||||||||||||
|
| ||||||||||||||
| Energy - 0.95% | |||||||||||||||
| Canadian Natural Resources Ltd., | |||||||||||||||
3.900%, Due 2/1/2025 | 60,000 | 63,889 | |||||||||||||
6.250%, Due 3/15/2038 | 176,000 | 222,538 | |||||||||||||
| Petroleos Mexicanos, | |||||||||||||||
6.750%, Due 9/21/2047 | 110,000 | 109,450 | |||||||||||||
7.690%, Due 1/23/2050C | 605,000 | 657,417 | |||||||||||||
| Saudi Arabian Oil Co., 4.375%, Due 4/16/2049C | 1,050,000 | 1,139,996 | |||||||||||||
| TransCanada PipeLines Ltd., | |||||||||||||||
3.750%, Due 10/16/2023 | 145,000 | 153,169 | |||||||||||||
6.100%, Due 6/1/2040 | 82,000 | 105,907 | |||||||||||||
|
| ||||||||||||||
| 2,452,366 | |||||||||||||||
|
| ||||||||||||||
See accompanying notes
21
American Beacon Balanced FundSM
Schedule of Investments
October 31, 2019
| Principal Amount | Fair Value | ||||||||||||||
| FOREIGN CORPORATE OBLIGATIONS - 3.01% (continued) | |||||||||||||||
| Financial - 0.33% | |||||||||||||||
| Bank of Montreal, 3.300%, Due 2/5/2024, Series E | $ | 140,000 | $ | 146,099 | |||||||||||
| HSBC Holdings PLC, 3.262%, Due 3/13/2023,(3-mo. USD LIBOR + 1.055%)D | 123,000 | 125,711 | |||||||||||||
| Mitsubishi UFJ Financial Group, Inc., 2.623%, Due 7/18/2022 | 80,000 | 80,981 | |||||||||||||
| Nordea Bank Abp, 4.875%, Due 1/27/2020C | 120,000 | 120,806 | |||||||||||||
| Royal Bank of Canada, 2.250%, Due 11/1/2024 | 125,000 | 125,285 | |||||||||||||
| Toronto-Dominion Bank, 3.250%, Due 3/11/2024 | 190,000 | 199,298 | |||||||||||||
| Westpac Banking Corp., 2.650%, Due 1/25/2021 | 65,000 | 65,617 | |||||||||||||
|
| ||||||||||||||
| 863,797 | |||||||||||||||
|
| ||||||||||||||
| Industrial - 0.01% | |||||||||||||||
| CNH Industrial N.V., 3.850%, Due 11/15/2027 | 35,000 | 36,461 | |||||||||||||
|
| ||||||||||||||
Total Foreign Corporate Obligations (Cost $6,906,709) | 7,792,833 | ||||||||||||||
|
| ||||||||||||||
| FOREIGN SOVEREIGN OBLIGATIONS - 0.16% | |||||||||||||||
| European Investment Bank, 2.375%, Due 6/15/2022 | 90,000 | 91,773 | |||||||||||||
| Kreditanstalt fuer Wiederaufbau, 2.125%, Due 6/15/2022 | 100,000 | 101,392 | |||||||||||||
| Province of Ontario Canada, 2.500%, Due 4/27/2026 | 120,000 | 124,726 | |||||||||||||
| Province of Quebec Canada, 2.375%, Due 1/31/2022 | 100,000 | 101,461 | |||||||||||||
|
| ||||||||||||||
Total Foreign Sovereign Obligations (Cost $409,465) | 419,352 | ||||||||||||||
|
| ||||||||||||||
| ASSET-BACKED OBLIGATIONS - 0.54% | |||||||||||||||
| Ally Auto Receivables Trust, 1.750%, Due 12/15/2021, 2017 4 A3 | 158,962 | 158,803 | |||||||||||||
| AmeriCredit Automobile Receivables Trust, 1.900%, Due 3/18/2022, 2017 3 A3 | 114,441 | 114,319 | |||||||||||||
| BMW Vehicle Lease Trust, 2.840%, Due 11/22/2021, 2019 1 A3 | 105,000 | 106,191 | |||||||||||||
| Ford Credit Auto Lease Trust, | |||||||||||||||
2.030%, Due 12/15/2020, 2017 B A3 | 60,884 | 60,882 | |||||||||||||
2.220%, Due 10/15/2022, 2019 B A3 | 165,000 | 165,754 | |||||||||||||
| GM Financial Automobile Leasing Trust, 2.980%, Due 12/20/2021, 2019 1 A3 | 75,000 | 75,805 | |||||||||||||
| GM Financial Consumer Automobile Receivables Trust, 2.320%, Due 7/18/2022, 2018 1 A3 | 95,000 | 95,288 | |||||||||||||
| John Deere Owner Trust, 3.080%, Due 11/15/2022, 2018 B A3 | 190,000 | 192,376 | |||||||||||||
| Mercedes-Benz Auto Lease Trust, 3.100%, Due 11/15/2021, 2019 A A3 | 105,000 | 106,045 | |||||||||||||
| Nissan Auto Receivables Owner Trust, 2.120%, Due 4/18/2022, 2017 C A3 | 99,047 | 99,148 | |||||||||||||
| PSNH Funding LLC, 3.094%, Due 2/1/2026, 2018 1 A1 | 101,161 | 103,676 | |||||||||||||
| World Omni Auto Receivables Trust, 1.950%, Due 2/15/2023, 2017 B A3 | 123,207 | 123,218 | |||||||||||||
|
| ||||||||||||||
Total Asset-Backed Obligations (Cost $1,392,585) | 1,401,505 | ||||||||||||||
|
| ||||||||||||||
| COLLATERALIZED MORTGAGE OBLIGATIONS - 0.05% (Cost $139,511) | |||||||||||||||
| Freddie Mac REMIC Trust, 3.000%, Due 1/15/2047 | 139,476 | 141,263 | |||||||||||||
|
| ||||||||||||||
| COMMERCIAL MORTGAGE-BACKED OBLIGATIONS - 0.63% | |||||||||||||||
| Bank, 3.183%, Due 8/15/2061, 2019-BN19 A3 | 185,000 | 196,000 | |||||||||||||
| Ginnie Mae REMIC Trust, | |||||||||||||||
1.368%, Due 11/16/2041,2013-125 AB | 498,319 | 492,106 | |||||||||||||
1.147%, Due 12/16/2038,2013-139 A | 196,716 | 195,480 | |||||||||||||
1.624%, Due 7/16/2039,2013-78 AB | 333,569 | 330,334 | |||||||||||||
| GS Mortgage Securities Trust, 3.679%, Due 8/10/2043,2010-C1 A1C | 3,005 | 3,006 | |||||||||||||
| JPMBB Commercial Mortgage Securities Trust, 3.157%, Due 7/15/2045,2013-C12 ASB | 212,348 | 215,103 | |||||||||||||
| WFRBS Commercial Mortgage Trust, 3.660%, Due 3/15/2047,2014-C19 A3 | 186,336 | 189,163 | |||||||||||||
|
| ||||||||||||||
Total Commercial Mortgage-Backed Obligations (Cost $1,624,477) | 1,621,192 | ||||||||||||||
|
| ||||||||||||||
| U.S. AGENCY MORTGAGE-BACKED OBLIGATIONS - 5.43% | |||||||||||||||
| Federal Home Loan Mortgage Corp., | |||||||||||||||
5.000%, Due 10/1/2020 | 1,256 | 1,295 | |||||||||||||
3.500%, Due 9/1/2028 | 42,547 | 44,560 | |||||||||||||
3.000%, Due 11/1/2032 | 118,472 | 122,082 | |||||||||||||
5.000%, Due 8/1/2033 | 38,456 | 42,499 | |||||||||||||
5.500%, Due 2/1/2034 | 38,290 | 43,119 | |||||||||||||
3.000%, Due 8/1/2034 | 24,020 | 24,602 | |||||||||||||
4.000%, Due 1/1/2041 | 142,741 | 152,821 | |||||||||||||
See accompanying notes
22
American Beacon Balanced FundSM
Schedule of Investments
October 31, 2019
| Principal Amount | Fair Value | ||||||||||||||
| U.S. AGENCY MORTGAGE-BACKED OBLIGATIONS - 5.43% (continued) | |||||||||||||||
| Federal Home Loan Mortgage Corp. (continued) | |||||||||||||||
4.500%, Due 2/1/2041 | $ | 97,414 | $ | 105,658 | |||||||||||
3.500%, Due 6/1/2042 | 473,494 | 497,199 | |||||||||||||
3.500%, Due 7/1/2042 | 132,734 | 139,371 | |||||||||||||
3.500%, Due 5/1/2046 | 218,276 | 230,009 | |||||||||||||
3.000%, Due 11/1/2046 | 283,076 | 290,713 | |||||||||||||
3.000%, Due 4/1/2047 | 285,161 | 293,356 | |||||||||||||
3.500%, Due 1/1/2048 | 387,144 | 402,869 | |||||||||||||
4.000%, Due 4/1/2048 | 255,631 | 267,496 | |||||||||||||
3.000%, Due 8/1/2048 | 280,862 | 288,391 | |||||||||||||
|
| ||||||||||||||
| 2,946,040 | |||||||||||||||
|
| ||||||||||||||
| Federal National Mortgage Association, | |||||||||||||||
4.000%, Due 8/1/2020 | 3,270 | 3,407 | |||||||||||||
3.500%, Due 1/1/2028E | 41,731 | 43,306 | |||||||||||||
3.000%, Due 7/1/2032 | 180,859 | 185,446 | |||||||||||||
4.000%, Due 10/1/2033 | 199,090 | 207,933 | |||||||||||||
5.000%, Due 3/1/2034E | 41,358 | 45,659 | |||||||||||||
4.500%, Due 4/1/2034 | 73,199 | 78,582 | |||||||||||||
3.000%, Due 10/1/2034 | 14,934 | 15,345 | |||||||||||||
3.500%, Due 6/1/2037 | 270,378 | 281,397 | |||||||||||||
5.500%, Due 6/1/2038 | 8,255 | 9,262 | |||||||||||||
4.500%, Due 1/1/2040 | 107,245 | 116,232 | |||||||||||||
5.000%, Due 5/1/2040 | 159,100 | 173,972 | |||||||||||||
5.000%, Due 6/1/2040 | 132,371 | 146,154 | |||||||||||||
4.000%, Due 9/1/2040 | 95,006 | 101,639 | |||||||||||||
4.000%, Due 1/1/2041 | 186,749 | 199,808 | |||||||||||||
3.000%, Due 6/1/2043 | 756,786 | 780,631 | |||||||||||||
3.500%, Due 7/1/2043 | 135,677 | 142,388 | |||||||||||||
3.000%, Due 8/1/2043 | 663,937 | 684,709 | |||||||||||||
4.000%, Due 11/1/2044E | 107,782 | 115,402 | |||||||||||||
4.000%, Due 7/1/2045 | 436,663 | 462,000 | |||||||||||||
3.500%, Due 8/1/2045 | 117,928 | 122,941 | |||||||||||||
3.500%, Due 11/1/2045 | 1,289,074 | 1,343,727 | |||||||||||||
3.000%, Due 4/1/2046 | 153,605 | 157,965 | |||||||||||||
3.500%, Due 5/1/2046 | 173,298 | 180,607 | |||||||||||||
4.000%, Due 7/1/2046 | 192,115 | 202,998 | |||||||||||||
3.000%, Due 10/1/2046 | 46,337 | 47,503 | |||||||||||||
3.000%, Due 11/1/2046 | 308,270 | 316,466 | |||||||||||||
3.000%, Due 12/1/2046E | 188,704 | 193,759 | |||||||||||||
3.000%, Due 2/1/2047 | 208,163 | 213,547 | |||||||||||||
3.500%, Due 3/1/2047 | 96,490 | 100,710 | |||||||||||||
4.500%, Due 7/1/2047 | 110,211 | 116,703 | |||||||||||||
4.500%, Due 8/1/2047 | 116,091 | 123,209 | |||||||||||||
3.500%, Due 9/1/2047 | 116,233 | 121,910 | |||||||||||||
3.500%, Due 2/1/2048 | 249,334 | 257,573 | |||||||||||||
4.000%, Due 3/1/2048 | 221,596 | 231,703 | |||||||||||||
4.500%, Due 4/1/2048 | 98,728 | 104,532 | |||||||||||||
4.500%, Due 7/1/2048E | 144,196 | 152,414 | |||||||||||||
4.500%, Due 7/1/2048 | 309,431 | 326,593 | |||||||||||||
3.000%, Due 10/1/2048E | 164,401 | 167,308 | |||||||||||||
4.500%, Due 9/1/2049 | 209,050 | 220,804 | |||||||||||||
|
| ||||||||||||||
| 8,496,244 | |||||||||||||||
|
| ||||||||||||||
See accompanying notes
23
American Beacon Balanced FundSM
Schedule of Investments
October 31, 2019
| Principal Amount | Fair Value | ||||||||||||||
| U.S. AGENCY MORTGAGE-BACKED OBLIGATIONS - 5.43% (continued) | |||||||||||||||
| Government National Mortgage Association, | |||||||||||||||
6.500%, Due 8/15/2027 | $ | 32,449 | $ | 35,936 | |||||||||||
6.500%, Due 11/15/2027 | 37,731 | 41,785 | |||||||||||||
7.500%, Due 12/15/2028 | 34,366 | 39,071 | |||||||||||||
5.500%, Due 7/15/2033 | 40,335 | 45,277 | |||||||||||||
6.000%, Due 12/15/2033 | 52,424 | 60,090 | |||||||||||||
5.500%, Due 2/20/2034 | 55,775 | 62,819 | |||||||||||||
5.000%, Due 10/15/2039 | 89,984 | 100,946 | |||||||||||||
3.500%, Due 9/15/2041 | 235,140 | 248,122 | |||||||||||||
3.000%, Due 1/20/2046 | 68,519 | 70,987 | |||||||||||||
3.000%, Due 4/20/2046 | 173,427 | 179,457 | |||||||||||||
3.000%, Due 6/20/2046 | 230,159 | 237,909 | |||||||||||||
3.000%, Due 12/20/2046 | 156,044 | 161,425 | |||||||||||||
3.500%, Due 8/20/2047 | 73,618 | 76,682 | |||||||||||||
3.500%, Due 10/20/2047 | 71,545 | 74,511 | |||||||||||||
4.000%, Due 1/20/2048 | 395,087 | 411,742 | |||||||||||||
5.000%, Due 6/20/2049 | 200,930 | 213,299 | |||||||||||||
4.500%, Due 7/20/2049 | 207,815 | 218,721 | |||||||||||||
4.500%, Due 8/20/2049 | 203,501 | 214,342 | |||||||||||||
5.000%, Due 8/20/2049 | 104,408 | 110,476 | |||||||||||||
|
| ||||||||||||||
| 2,603,597 | |||||||||||||||
|
| ||||||||||||||
Total U.S. Agency Mortgage-Backed Obligations (Cost $13,681,750) | 14,045,881 | ||||||||||||||
|
| ||||||||||||||
| U.S. TREASURY OBLIGATIONS - 16.65% | |||||||||||||||
| U.S. Treasury Notes/Bonds, | |||||||||||||||
1.750%, Due 10/31/2020 | 319,000 | 319,436 | |||||||||||||
1.766%, Due 4/30/2021,(3-mo. Treasury money market yield + 0.139%)D | 13,175,000 | 13,158,079 | |||||||||||||
2.000%, Due 5/31/2021 | 1,446,000 | 1,455,094 | |||||||||||||
1.857%, Due 7/31/2021,(3-mo. Treasury money market yield + 0.220%)D | 10,080,000 | 10,078,463 | |||||||||||||
1.937%, Due 10/31/2021,(3-mo. Treasury money market yield + 0.300%)D | 565,000 | 565,420 | |||||||||||||
2.000%, Due 2/15/2022 | 2,326,000 | 2,350,714 | |||||||||||||
1.750%, Due 9/30/2022 | 500,000 | 503,340 | |||||||||||||
1.625%, Due 11/15/2022 | 964,000 | 967,163 | |||||||||||||
1.750%, Due 1/31/2023 | 590,000 | 594,148 | |||||||||||||
2.000%, Due 2/15/2023 | 500,000 | 507,578 | |||||||||||||
2.750%, Due 7/31/2023 | 500,000 | 522,168 | |||||||||||||
2.500%, Due 8/15/2023 | 964,000 | 998,342 | |||||||||||||
2.375%, Due 8/15/2024 | 1,885,000 | 1,957,160 | |||||||||||||
2.875%, Due 7/31/2025 | 500,000 | 535,527 | |||||||||||||
6.875%, Due 8/15/2025 | 279,000 | 360,771 | |||||||||||||
2.000%, Due 11/15/2026 | 500,000 | 513,184 | |||||||||||||
2.875%, Due 5/15/2028 | 200,000 | 219,383 | |||||||||||||
2.875%, Due 8/15/2028 | 100,000 | 109,852 | |||||||||||||
5.250%, Due 11/15/2028 | 217,000 | 282,125 | |||||||||||||
2.625%, Due 2/15/2029 | 1,155,000 | 1,248,754 | |||||||||||||
2.375%, Due 5/15/2029 | 450,000 | 477,158 | |||||||||||||
1.625%, Due 8/15/2029 | 250,000 | 248,506 | |||||||||||||
4.750%, Due 2/15/2037 | 304,000 | 432,511 | |||||||||||||
4.500%, Due 8/15/2039 | 241,000 | 339,481 | |||||||||||||
2.750%, Due 8/15/2042 | 250,000 | 277,324 | |||||||||||||
3.000%, Due 2/15/2049 | 2,154,000 | 2,539,364 | |||||||||||||
2.875%, Due 5/15/2049 | 1,315,000 | 1,515,229 | |||||||||||||
|
| ||||||||||||||
| 43,076,274 | |||||||||||||||
|
| ||||||||||||||
Total U.S. Treasury Obligations (Cost $42,122,895) | 43,076,274 | ||||||||||||||
|
| ||||||||||||||
See accompanying notes
24
American Beacon Balanced FundSM
Schedule of Investments
October 31, 2019
| Shares | Fair Value | ||||||||||||||
| SHORT-TERM INVESTMENTS - 2.09% | |||||||||||||||
| Investment Companies - 1.90% | |||||||||||||||
| American Beacon U.S. Government Money Market Select Fund, Select Class, 1.75%F G | 4,904,248 | $ | 4,904,248 | ||||||||||||
|
| ||||||||||||||
| Principal Amount | |||||||||||||||
| U.S. Treasury Obligations - 0.07% | |||||||||||||||
| U.S. Treasury Bill, 1.870%, Due 2/13/2020H | $ | 175,000 | 174,233 | ||||||||||||
|
| ||||||||||||||
| Foreign Corporate Obligations - 0.12% | |||||||||||||||
| Nordea Bank Abp, 2.092%, Due 1/27/2020 | 300,000 | 298,636 | |||||||||||||
|
| ||||||||||||||
Total Short-Term Investments (Cost $5,376,837) | 5,377,117 | ||||||||||||||
|
| ||||||||||||||
TOTAL INVESTMENTS - 98.94% (Cost $221,644,303) | 255,981,778 | ||||||||||||||
OTHER ASSETS, NET OF LIABILITIES - 1.06% | 2,749,415 | ||||||||||||||
|
| ||||||||||||||
TOTAL NET ASSETS - 100.00% | $ | 258,731,193 | |||||||||||||
|
| ||||||||||||||
| Percentages are stated as a percent of net assets. | |||||||||||||||
ANon-income producing security.
B All or a portion of this security is on loan, collateralized by either cash and/or U.S. Treasuries, at October 31, 2019 (Note 9).
C Security exempt from registration under the Securities Act of 1933. These securities may be resold to qualified institutional buyers pursuant to Rule 144A. At the period end, the value of these securities amounted to $6,168,159 or 2.38% of net assets. The Fund has no right to demand registration of these securities.
D Variable, floating, or adjustable rate securities with an interest rate that changes periodically. Rates are periodically reset with rates that are based on a predetermined benchmark such as a widely followed interest rate such asT-bills, LIBOR or PRIME plus a fixed spread. The interest rate disclosed reflects the rate in effect on October 31, 2019.
E Coupon rate may change based on changes of the underlying collateral or prepayments of principal. The coupon rate shown represents the rate at period end.
F The Fund is affiliated by having the same investment advisor.
G7-day yield.
H This security or a piece thereof is held as segregated collateral.
ADR - American Depositary Receipt.
LIBOR - London Interbank Offered Rate.
LLC - Limited Liability Company.
LP - Limited Partnership.
NVDR - Non Voting Depositary Receipt.
PLC - Public Limited Company.
PRIME - A rate, charged by banks, based on the U.S. Federal Funds rate.
REMIC - Real Estate Mortgage Investment Conduit.
SOFRRATE – Secured Overnight Financing Rate.
| Long Futures Contracts Open on October 31, 2019: |
| |||||||||||||||
| Equity Futures Contracts | ||||||||||||||||
| Description | Number of Contracts | Expiration Date | Notional Amount | Contract Value | Unrealized Appreciation (Depreciation) | |||||||||||
| S&P 500E-Mini Index Futures | 27 | December 2019 | $ | 4,074,447 | $ | 4,098,330 | $ | 23,883 | ||||||||
|
|
|
|
|
| |||||||||||
| $ | 4,074,447 | $ | 4,098,330 | $ | 23,883 | |||||||||||
|
|
|
|
|
| |||||||||||
| Index Abbreviations: | ||
| S&P 500 | Standard & Poor’s U.S. EquityLarge-Cap Index. | |
See accompanying notes
25
American Beacon Balanced FundSM
Schedule of Investments
October 31, 2019
The Fund’s investments are summarized by level based on the inputs used to determine their values. As of October 31, 2019, the investments were classified as described below:
Balanced Fund | Level 1 | Level 2 | Level 3 | Total | ||||||||||||||||||||||||
Assets | ||||||||||||||||||||||||||||
Common Stocks | $ | 152,469,122 | $ | - | $ | - | $ | 152,469,122 | ||||||||||||||||||||
Corporate Obligations | - | 29,637,239 | - | 29,637,239 | ||||||||||||||||||||||||
Foreign Corporate Obligations | - | 7,792,833 | - | 7,792,833 | ||||||||||||||||||||||||
Foreign Sovereign Obligations | - | 419,352 | - | 419,352 | ||||||||||||||||||||||||
Asset-Backed Obligations | - | 1,401,505 | - | 1,401,505 | ||||||||||||||||||||||||
Collateralized Mortgage Obligations | - | 141,263 | - | 141,263 | ||||||||||||||||||||||||
Commercial Mortgage-Backed Obligations | - | 1,621,192 | - | 1,621,192 | ||||||||||||||||||||||||
U.S. Agency Mortgage-Backed Obligations | - | 14,045,881 | - | 14,045,881 | ||||||||||||||||||||||||
U.S. Treasury Obligations | - | 43,076,274 | - | 43,076,274 | ||||||||||||||||||||||||
Short-Term Investments | 4,904,248 | 472,869 | - | 5,377,117 | ||||||||||||||||||||||||
|
|
|
|
|
|
|
| |||||||||||||||||||||
Total Investments in Securities - Assets | $ | 157,373,370 | $ | 98,608,408 | $ | - | $ | 255,981,778 | ||||||||||||||||||||
|
|
|
|
|
|
|
| |||||||||||||||||||||
Financial Derivative Instruments - Assets | ||||||||||||||||||||||||||||
Futures Contracts | $ | 23,883 | $ | - | $ | - | $ | 23,883 | ||||||||||||||||||||
|
|
|
|
|
|
|
| |||||||||||||||||||||
Total Financial Derivative Instruments - Assets | $ | 23,883 | $ | - | $ | - | $ | 23,883 | ||||||||||||||||||||
|
|
|
|
|
|
|
| |||||||||||||||||||||
U.S. GAAP requires transfers between all levels to/from level 3 be disclosed. During the year ended October 31, 2019, there were no transfers into or out of Level 3.
See accompanying notes
26
American BeaconMid-Cap Value FundSM
Schedule of Investments
October 31, 2019
| Shares | Fair Value | ||||||||||||||
| COMMON STOCKS - 96.07% | |||||||||||||||
| Communication Services - 1.75% | |||||||||||||||
| Media - 1.75% | |||||||||||||||
| Altice USA, Inc., Class AA | 128,539 | $ | 3,978,282 | ||||||||||||
| Interpublic Group of Cos., Inc. | 215,801 | 4,693,672 | |||||||||||||
|
| ||||||||||||||
| 8,671,954 | |||||||||||||||
|
| ||||||||||||||
Total Communication Services | 8,671,954 | ||||||||||||||
|
| ||||||||||||||
| Consumer Discretionary - 16.63% | |||||||||||||||
| Auto Components - 1.91% | |||||||||||||||
| Dana, Inc. | 215,101 | 3,491,089 | |||||||||||||
| Lear Corp. | 50,870 | 5,990,960 | |||||||||||||
|
| ||||||||||||||
| 9,482,049 | |||||||||||||||
|
| ||||||||||||||
| Diversified Consumer Services - 0.68% | |||||||||||||||
| Adtalem Global Education, Inc.A | 114,125 | 3,398,643 | |||||||||||||
|
| ||||||||||||||
| Hotels, Restaurants & Leisure - 6.26% | |||||||||||||||
| Aramark | 109,094 | 4,773,953 | |||||||||||||
| Marriott Vacations Worldwide Corp. | 26,573 | 2,921,170 | |||||||||||||
| MGM Resorts International | 129,399 | 3,687,872 | |||||||||||||
| Norwegian Cruise Line Holdings Ltd.A | 73,520 | 3,731,875 | |||||||||||||
| Royal Caribbean Cruises Ltd. | 37,508 | 4,081,996 | |||||||||||||
| SeaWorld Entertainment, Inc.A B | 150,513 | 3,976,553 | |||||||||||||
| Wyndham Destinations, Inc. | 79,634 | 3,695,814 | |||||||||||||
| Wyndham Hotels & Resorts, Inc. | 77,268 | 4,170,154 | |||||||||||||
|
| ||||||||||||||
| 31,039,387 | |||||||||||||||
|
| ||||||||||||||
| Household Durables - 2.53% | |||||||||||||||
| Lennar Corp., Class A | 72,444 | 4,317,662 | |||||||||||||
| Mohawk Industries, Inc.A | 23,276 | 3,337,313 | |||||||||||||
| Newell Brands, Inc. | 257,148 | 4,878,098 | |||||||||||||
|
| ||||||||||||||
| 12,533,073 | |||||||||||||||
|
| ||||||||||||||
| Internet & Direct Marketing Retail - 0.66% | |||||||||||||||
| Qurate Retail, Inc.A | 343,486 | 3,276,856 | |||||||||||||
|
| ||||||||||||||
| Multiline Retail - 1.18% | |||||||||||||||
| Dollar General Corp. | 36,566 | 5,862,992 | |||||||||||||
|
| ||||||||||||||
| Specialty Retail - 2.08% | |||||||||||||||
| Aaron’s, Inc. | 74,879 | 5,610,684 | |||||||||||||
| Advance Auto Parts, Inc. | 29,015 | 4,714,357 | |||||||||||||
|
| ||||||||||||||
| 10,325,041 | |||||||||||||||
|
| ||||||||||||||
| Textiles, Apparel & Luxury Goods - 1.33% | |||||||||||||||
| Gildan Activewear, Inc. | 74,056 | 1,890,650 | |||||||||||||
| PVH Corp. | 53,966 | 4,703,676 | |||||||||||||
|
| ||||||||||||||
| 6,594,326 | |||||||||||||||
|
| ||||||||||||||
Total Consumer Discretionary | 82,512,367 | ||||||||||||||
|
| ||||||||||||||
| Consumer Staples - 0.47% | |||||||||||||||
| Beverages - 0.47% | |||||||||||||||
| Coca-Cola European Partners PLC | 43,401 | 2,322,388 | |||||||||||||
|
| ||||||||||||||
| Energy - 7.88% | |||||||||||||||
| Energy Equipment & Services - 3.61% | |||||||||||||||
| Baker Hughes Co. | 121,347 | 2,596,826 | |||||||||||||
| Halliburton Co. | 327,356 | 6,301,603 | |||||||||||||
See accompanying notes
27
American BeaconMid-Cap Value FundSM
Schedule of Investments
October 31, 2019
| Shares | Fair Value | ||||||||||||||
| COMMON STOCKS - 96.07% (continued) | |||||||||||||||
| Energy - 7.88% (continued) | |||||||||||||||
| Energy Equipment & Services - 3.61% (continued) | |||||||||||||||
| National Oilwell Varco, Inc. | 273,706 | $ | 6,191,230 | ||||||||||||
| TechnipFMC PLC | 141,894 | 2,799,568 | |||||||||||||
|
| ||||||||||||||
| 17,889,227 | |||||||||||||||
|
| ||||||||||||||
| Oil, Gas & Consumable Fuels - 4.27% | |||||||||||||||
| Cenovus Energy, Inc.B | 275,126 | 2,335,820 | |||||||||||||
| EQT Corp. | 271,600 | 2,916,984 | |||||||||||||
| Equitrans Midstream Corp.B | 205,907 | 2,866,225 | |||||||||||||
| Hess Corp. | 65,434 | 4,302,286 | |||||||||||||
| Kosmos Energy Ltd. | 443,683 | 2,750,835 | |||||||||||||
| Murphy Oil Corp.B | 216,981 | 4,476,318 | |||||||||||||
| Parsley Energy, Inc., Class A | 98,587 | 1,558,660 | |||||||||||||
|
| ||||||||||||||
| 21,207,128 | |||||||||||||||
|
| ||||||||||||||
Total Energy | 39,096,355 | ||||||||||||||
|
| ||||||||||||||
| Financials - 21.86% | |||||||||||||||
| Banks - 5.78% | |||||||||||||||
| Fifth Third Bancorp | 283,928 | 8,256,626 | |||||||||||||
| FNB Corp. | 262,121 | 3,161,179 | |||||||||||||
| KeyCorp | 279,115 | 5,015,697 | |||||||||||||
| Pinnacle Financial Partners, Inc. | 28,784 | 1,693,075 | |||||||||||||
| Regions Financial Corp. | 322,417 | 5,190,914 | |||||||||||||
| Signature Bank | 30,170 | 3,569,714 | |||||||||||||
| Valley National Bancorp | 155,166 | 1,796,822 | |||||||||||||
|
| ||||||||||||||
| 28,684,027 | |||||||||||||||
|
| ||||||||||||||
| Capital Markets - 3.10% | |||||||||||||||
| Apollo Global Management, Inc. | 83,986 | 3,456,864 | |||||||||||||
| Invesco Ltd. | 176,845 | 2,974,533 | |||||||||||||
| KKR & Co., Inc., Class A | 197,179 | 5,684,670 | |||||||||||||
| Northern Trust Corp. | 32,543 | 3,243,886 | |||||||||||||
|
| ||||||||||||||
| 15,359,953 | |||||||||||||||
|
| ||||||||||||||
| Consumer Finance - 2.34% | |||||||||||||||
| Ally Financial, Inc. | 188,929 | 5,786,895 | |||||||||||||
| Navient Corp. | 143,167 | 1,971,410 | |||||||||||||
| SLM Corp. | 457,106 | 3,857,975 | |||||||||||||
|
| ||||||||||||||
| 11,616,280 | |||||||||||||||
|
| ||||||||||||||
| Diversified Financial Services - 2.59% | |||||||||||||||
| AXA Equitable Holdings, Inc. | 257,014 | 5,551,502 | |||||||||||||
| Jefferies Financial Group, Inc. | 125,166 | 2,336,849 | |||||||||||||
| Voya Financial, Inc. | 92,036 | 4,966,263 | |||||||||||||
|
| ||||||||||||||
| 12,854,614 | |||||||||||||||
|
| ||||||||||||||
| Insurance - 6.82% | |||||||||||||||
| American Financial Group, Inc. | 15,655 | 1,628,746 | |||||||||||||
| Assurant, Inc. | 24,515 | 3,090,606 | |||||||||||||
| Axis Capital Holdings Ltd. | 189,772 | 11,278,150 | |||||||||||||
| CNO Financial Group, Inc. | 256,658 | 4,016,698 | |||||||||||||
| Fidelity National Financial, Inc. | 205,125 | 9,402,930 | |||||||||||||
| Willis Towers Watson PLC | 23,585 | 4,408,036 | |||||||||||||
|
| ||||||||||||||
| 33,825,166 | |||||||||||||||
|
| ||||||||||||||
See accompanying notes
28
American BeaconMid-Cap Value FundSM
Schedule of Investments
October 31, 2019
| Shares | Fair Value | ||||||||||||||
| COMMON STOCKS - 96.07% (continued) | |||||||||||||||
| Financials - 21.86% (continued) | |||||||||||||||
| Mortgage Real Estate Investment Trusts (REITs) - 0.50% | |||||||||||||||
| MFA Financial, Inc. | 325,806 | $ | 2,472,868 | ||||||||||||
|
| ||||||||||||||
| Thrifts & Mortgage Finance - 0.73% | |||||||||||||||
| New York Community Bancorp, Inc. | 312,660 | 3,642,489 | |||||||||||||
|
| ||||||||||||||
Total Financials | 108,455,397 | ||||||||||||||
|
| ||||||||||||||
| Health Care - 4.66% | |||||||||||||||
| Health Care Equipment & Supplies - 1.20% | |||||||||||||||
| Zimmer Biomet Holdings, Inc. | 43,080 | 5,954,948 | |||||||||||||
|
| ||||||||||||||
| Health Care Providers & Services - 2.93% | |||||||||||||||
| Cardinal Health, Inc. | 74,948 | 3,706,179 | |||||||||||||
| McKesson Corp. | 30,258 | 4,024,314 | |||||||||||||
| Universal Health Services, Inc., Class B | 49,550 | 6,811,143 | |||||||||||||
|
| ||||||||||||||
| 14,541,636 | |||||||||||||||
|
| ||||||||||||||
| Pharmaceuticals - 0.53% | |||||||||||||||
| Mylan N.V.A | 137,321 | 2,629,697 | |||||||||||||
|
| ||||||||||||||
Total Health Care | 23,126,281 | ||||||||||||||
|
| ||||||||||||||
| Industrials - 17.98% | |||||||||||||||
| Aerospace & Defense - 3.04% | |||||||||||||||
| BWX Technologies, Inc. | 49,184 | 2,857,591 | |||||||||||||
| Spirit AeroSystems Holdings, Inc., Class A | 58,605 | 4,795,061 | |||||||||||||
| TransDigm Group, Inc. | 14,151 | 7,447,388 | |||||||||||||
|
| ||||||||||||||
| 15,100,040 | |||||||||||||||
|
| ||||||||||||||
| Airlines - 0.64% | |||||||||||||||
| Alaska Air Group, Inc. | 45,628 | 3,167,952 | |||||||||||||
|
| ||||||||||||||
| Building Products - 2.14% | |||||||||||||||
| JELD-WEN Holding, Inc.A | 308,042 | 5,264,438 | |||||||||||||
| Johnson Controls International PLC | 60,667 | 2,628,701 | |||||||||||||
| Owens Corning | 44,118 | 2,703,551 | |||||||||||||
|
| ||||||||||||||
| 10,596,690 | |||||||||||||||
|
| ||||||||||||||
| Commercial Services & Supplies - 1.03% | |||||||||||||||
| Republic Services, Inc. | 58,180 | 5,091,332 | |||||||||||||
|
| ||||||||||||||
| Construction & Engineering - 1.88% | |||||||||||||||
| AECOMA | 139,275 | 5,572,393 | |||||||||||||
| Jacobs Engineering Group, Inc. | 40,151 | 3,757,330 | |||||||||||||
|
| ||||||||||||||
| 9,329,723 | |||||||||||||||
|
| ||||||||||||||
| Industrial Conglomerates - 0.17% | |||||||||||||||
| Carlisle Cos., Inc. | 5,581 | 849,819 | |||||||||||||
|
| ||||||||||||||
| Machinery - 5.29% | |||||||||||||||
| Dover Corp. | 41,353 | 4,296,163 | |||||||||||||
| Snap-on, Inc. | 21,397 | 3,480,650 | |||||||||||||
| Stanley Black & Decker, Inc. | 59,689 | 9,032,736 | |||||||||||||
| Terex Corp. | 109,820 | 3,025,541 | |||||||||||||
| Wabtec Corp.B | 92,629 | 6,425,674 | |||||||||||||
|
| ||||||||||||||
| 26,260,764 | |||||||||||||||
|
| ||||||||||||||
| Professional Services - 0.40% | |||||||||||||||
| Nielsen Holdings PLC | 97,955 | 1,974,773 | |||||||||||||
|
| ||||||||||||||
See accompanying notes
29
American BeaconMid-Cap Value FundSM
Schedule of Investments
October 31, 2019
| Shares | Fair Value | ||||||||||||||
| COMMON STOCKS - 96.07% (continued) | |||||||||||||||
| Industrials - 17.98% (continued) | |||||||||||||||
| Road & Rail - 2.50% | |||||||||||||||
| Avis Budget Group, Inc.A | 106,861 | $ | 3,174,840 | ||||||||||||
| JB Hunt Transport Services, Inc. | 38,614 | 4,539,462 | |||||||||||||
| Ryder System, Inc. | 96,297 | 4,682,923 | |||||||||||||
|
| ||||||||||||||
| 12,397,225 | |||||||||||||||
|
| ||||||||||||||
| Trading Companies & Distributors - 0.89% | |||||||||||||||
| AerCap Holdings N.V.A | 76,290 | 4,415,665 | |||||||||||||
|
| ||||||||||||||
Total Industrials | 89,183,983 | ||||||||||||||
|
| ||||||||||||||
| Information Technology - 7.48% | |||||||||||||||
| Electronic Equipment, Instruments & Components - 2.09% | |||||||||||||||
| Anixter International, Inc.A | 68,038 | 5,630,145 | |||||||||||||
| Avnet, Inc. | 119,577 | 4,730,466 | |||||||||||||
|
| ||||||||||||||
| 10,360,611 | |||||||||||||||
|
| ||||||||||||||
| IT Services - 2.06% | |||||||||||||||
| Alliance Data Systems Corp. | 18,804 | 1,880,400 | |||||||||||||
| Conduent, Inc.A | 271,999 | 1,680,954 | |||||||||||||
| Genpact Ltd. | 76,811 | 3,008,687 | |||||||||||||
| KBR, Inc. | 130,627 | 3,678,456 | |||||||||||||
|
| ||||||||||||||
| 10,248,497 | |||||||||||||||
|
| ||||||||||||||
| Semiconductors & Semiconductor Equipment - 2.37% | |||||||||||||||
| Marvell Technology Group Ltd. | 322,572 | 7,867,531 | |||||||||||||
| Microchip Technology, Inc.B | 41,424 | 3,905,869 | |||||||||||||
|
| ||||||||||||||
| 11,773,400 | |||||||||||||||
|
| ||||||||||||||
| Technology Hardware, Storage & Peripherals - 0.96% | |||||||||||||||
| Hewlett Packard Enterprise Co. | 289,022 | 4,742,851 | |||||||||||||
|
| ||||||||||||||
Total Information Technology | 37,125,359 | ||||||||||||||
|
| ||||||||||||||
| Materials - 4.32% | |||||||||||||||
| Chemicals - 3.46% | |||||||||||||||
| Ashland Global Holdings, Inc. | 76,830 | 5,944,337 | |||||||||||||
| Axalta Coating Systems Ltd.A | 131,820 | 3,887,372 | |||||||||||||
| Eastman Chemical Co. | 29,681 | 2,256,943 | |||||||||||||
| Element Solutions, Inc.A | 470,411 | 5,108,663 | |||||||||||||
|
| ||||||||||||||
| 17,197,315 | |||||||||||||||
|
| ||||||||||||||
| Containers & Packaging - 0.86% | |||||||||||||||
| Packaging Corp. of America | 38,869 | 4,254,601 | |||||||||||||
|
| ||||||||||||||
Total Materials | 21,451,916 | ||||||||||||||
|
| ||||||||||||||
| Real Estate - 7.25% | |||||||||||||||
| Equity Real Estate Investment Trusts (REITs) - 6.99% | |||||||||||||||
| AvalonBay Communities, Inc. | 20,471 | 4,455,718 | |||||||||||||
| EPR Properties | 64,957 | 5,053,005 | |||||||||||||
| GEO Group, Inc. | 99,041 | 1,507,404 | |||||||||||||
| Healthpeak Properties, Inc. | 153,471 | 5,773,579 | |||||||||||||
| Lamar Advertising Co., Class A | 65,919 | 5,274,179 | |||||||||||||
| Liberty Property Trust | 83,898 | 4,955,855 | |||||||||||||
| MGM Growth Properties LLC, Class A | 246,266 | 7,685,962 | |||||||||||||
|
| ||||||||||||||
| 34,705,702 | |||||||||||||||
|
| ||||||||||||||
See accompanying notes
30
American BeaconMid-Cap Value FundSM
Schedule of Investments
October 31, 2019
| Shares | Fair Value | ||||||||||||||
| COMMON STOCKS - 96.07% (continued) | |||||||||||||||
| Real Estate - 7.25% (continued) | |||||||||||||||
| Real Estate Management & Development - 0.26% | |||||||||||||||
| Realogy Holdings Corp.B | 161,574 | $ | 1,273,203 | ||||||||||||
|
| ||||||||||||||
Total Real Estate | 35,978,905 | ||||||||||||||
|
| ||||||||||||||
| Utilities - 5.79% | |||||||||||||||
| Electric Utilities - 5.23% | |||||||||||||||
| Edison International | 79,572 | 5,005,079 | |||||||||||||
| Entergy Corp. | 36,718 | 4,460,503 | |||||||||||||
| Evergy, Inc. | 41,008 | 2,620,821 | |||||||||||||
| FirstEnergy Corp. | 112,307 | 5,426,674 | |||||||||||||
| Pinnacle West Capital Corp. | 36,338 | 3,420,132 | |||||||||||||
| Xcel Energy, Inc. | 78,864 | 5,008,653 | |||||||||||||
|
| ||||||||||||||
| 25,941,862 | |||||||||||||||
|
| ||||||||||||||
| Gas Utilities - 0.56% | |||||||||||||||
| UGI Corp. | 58,093 | 2,769,294 | |||||||||||||
|
| ||||||||||||||
Total Utilities | 28,711,156 | ||||||||||||||
|
| ||||||||||||||
Total Common Stocks (Cost $424,770,122) | 476,636,061 | ||||||||||||||
|
| ||||||||||||||
| SHORT-TERM INVESTMENTS - 3.80% | |||||||||||||||
| Investment Companies - 3.64% | |||||||||||||||
| American Beacon U.S. Government Money Market Select Fund, Select Class, 1.75%C D | 18,059,056 | 18,059,056 | |||||||||||||
|
| ||||||||||||||
| Principal Amount | |||||||||||||||
| U.S. Treasury Obligations - 0.16% | |||||||||||||||
| U.S. Treasury Bill, 1.870%, Due 2/13/2020E | $ | 800,000 | 796,492 | ||||||||||||
|
| ||||||||||||||
Total Short-Term Investments (Cost $18,854,827) | 18,855,548 | ||||||||||||||
|
| ||||||||||||||
| Shares | |||||||||||||||
| SECURITIES LENDING COLLATERAL - 0.25% (Cost $1,233,330) | |||||||||||||||
| Investment Companies - 0.25% | |||||||||||||||
| American Beacon U.S. Government Money Market Select Fund, Select Class, 1.75%C D | 1,233,330 | 1,233,330 | |||||||||||||
|
| ||||||||||||||
TOTAL INVESTMENTS - 100.12% (Cost $444,858,279) | 496,724,939 | ||||||||||||||
LIABILITIES, NET OF OTHER ASSETS - (0.12%) | (604,009 | ) | |||||||||||||
|
| ||||||||||||||
TOTAL NET ASSETS - 100.00% | $ | 496,120,930 | |||||||||||||
|
| ||||||||||||||
| Percentages are stated as a percent of net assets. | |||||||||||||||
ANon-income producing security.
B All or a portion of this security is on loan, collateralized by either cash and/or U.S. Treasuries, at October 31, 2019 (Note 9).
C The Fund is affiliated by having the same investment advisor.
D7-day yield.
E This security or a piece thereof is held as segregated collateral.
LLC - Limited Liability Company.
PLC - Public Limited Company.
See accompanying notes
31
American BeaconMid-Cap Value FundSM
Schedule of Investments
October 31, 2019
| Long Futures Contracts Open on October 31, 2019: | ||||||||||||||
| Equity Futures Contracts | ||||||||||||||
| Description | Number of Contracts | Expiration Date | Notional Amount | Contract Value | Unrealized Appreciation (Depreciation) | |||||||||
| S&P MidCap 400E-Mini Index Futures | 87 | December 2019 | $16,924,711 | $ | 17,008,500 | $ | 83,789 | |||||||
|
|
|
|
| ||||||||||
| $16,924,711 | $ | 17,008,500 | $ | 83,789 | ||||||||||
|
|
|
|
| ||||||||||
| Index Abbreviations: | ||
| S&P 400 | Standard & Poor’s Midcap Index. | |
The Fund’s investments are summarized by level based on the inputs used to determine their values. As of October 31, 2019, the investments were classified as described below:
Mid-Cap Value Fund | Level 1 | Level 2 | Level 3 | Total | ||||||||||||||||||||||||
Assets | ||||||||||||||||||||||||||||
Common Stocks | $ | 476,636,061 | $ | - | $ | - | $ | 476,636,061 | ||||||||||||||||||||
Short-Term Investments | 18,059,056 | 796,492 | - | 18,855,548 | ||||||||||||||||||||||||
Securities Lending Collateral | 1,233,330 | - | - | 1,233,330 | ||||||||||||||||||||||||
|
|
|
|
|
|
|
| |||||||||||||||||||||
Total Investments in Securities - Assets | $ | 495,928,447 | $ | 796,492 | $ | - | $ | 496,724,939 | ||||||||||||||||||||
|
|
|
|
|
|
|
| |||||||||||||||||||||
Financial Derivative Instruments - Assets | ||||||||||||||||||||||||||||
Futures Contracts | $ | 83,789 | $ | - | $ | - | $ | 83,789 | ||||||||||||||||||||
|
|
|
|
|
|
|
| |||||||||||||||||||||
Total Financial Derivative Instruments - Assets | $ | 83,789 | $ | - | $ | - | $ | 83,789 | ||||||||||||||||||||
|
|
|
|
|
|
|
| |||||||||||||||||||||
U.S. GAAP requires transfers between all levels to/from level 3 be disclosed. During the year ended October 31, 2019, there were no transfers into or out of Level 3.
See accompanying notes
32
American Beacon FundsSM
Statements of Assets and Liabilities
October 31, 2019
| Balanced Fund | Mid-Cap Value Fund | |||||||||||
Assets: | ||||||||||||
Investments in unaffiliated securities, at fair value†§ | $ | 251,077,530 | $ | 477,432,553 | ||||||||
Investments in affiliated securities, at fair value‡ | 4,904,248 | 19,292,386 | ||||||||||
Cash | 122,492 | - | ||||||||||
Dividends and interest receivable | 674,624 | 172,103 | ||||||||||
Deposits with broker for futures contracts | 7,948 | - | ||||||||||
Receivable for investments sold | 2,015,827 | 3,193,418 | ||||||||||
Receivable for fund shares sold | 154,326 | 99,530 | ||||||||||
Receivable for tax reclaims | 8,472 | - | ||||||||||
Receivable for expense reimbursement (Note 2) | - | 236 | ||||||||||
Receivable for variation margin on open futures contracts (Note 5) | 23,971 | 83,947 | ||||||||||
Prepaid expenses | 219,970 | 26,296 | ||||||||||
|
|
|
| |||||||||
Total assets | 259,209,408 | 500,300,469 | ||||||||||
|
|
|
| |||||||||
Liabilities: | ||||||||||||
Payable for investments purchased | 146,490 | 1,565,571 | ||||||||||
Payable for fund shares redeemed | 117,637 | 648,092 | ||||||||||
Payable for expense reimbursement (Note 2) | - | 162 | ||||||||||
Cash due to broker for futures contracts | - | 211,870 | ||||||||||
Management andsub-advisory fees payable (Note 2) | 76,861 | 343,705 | ||||||||||
Service fees payable (Note 2) | 47,151 | 66,140 | ||||||||||
Transfer agent fees payable (Note 2) | 11,522 | 17,839 | ||||||||||
Payable upon return of securities loaned (Note 9)§ | - | 1,233,330 | ||||||||||
Custody and fund accounting fees payable | 18,921 | 11,460 | ||||||||||
Professional fees payable | 47,495 | 43,780 | ||||||||||
Trustee fees payable (Note 2) | 1,820 | 3,617 | ||||||||||
Payable for prospectus and shareholder reports | 6,326 | 24,866 | ||||||||||
Other liabilities | 3,992 | 9,107 | ||||||||||
|
|
|
| |||||||||
Total liabilities | 478,215 | 4,179,539 | ||||||||||
|
|
|
| |||||||||
Net assets | $ | 258,731,193 | $ | 496,120,930 | ||||||||
|
|
|
| |||||||||
Analysis of net assets: | ||||||||||||
Paid-in-capital | $ | 204,483,704 | $ | 466,604,351 | ||||||||
Total distributable earnings (deficits)A | 54,247,489 | 29,516,579 | ||||||||||
|
|
|
| |||||||||
Net assets | $ | 258,731,193 | $ | 496,120,930 | ||||||||
|
|
|
| |||||||||
See accompanying notes
33
American Beacon FundsSM
Statements of Assets and Liabilities
October 31, 2019
| Balanced Fund | Mid-Cap Value Fund | |||||||||||
Shares outstanding at no par value (unlimited shares authorized): | ||||||||||||
Institutional Class | 2,848,665 | 10,916,705 | ||||||||||
|
|
|
| |||||||||
Y Class | 3,821,922 | 5,549,578 | ||||||||||
|
|
|
| |||||||||
Investor Class | 6,689,539 | 14,761,990 | ||||||||||
|
|
|
| |||||||||
Advisor Class | 393,805 | 210,108 | ||||||||||
|
|
|
| |||||||||
A Class | 1,132,815 | 249,336 | ||||||||||
|
|
|
| |||||||||
C Class | 2,130,106 | 300,234 | ||||||||||
|
|
|
| |||||||||
R6 Class | N/A | 146,139 | ||||||||||
|
|
|
| |||||||||
Net assets: | ||||||||||||
Institutional Class | $ | 46,593,155 | $ | 168,201,120 | ||||||||
|
|
|
| |||||||||
Y Class | $ | 62,956,422 | $ | 84,763,978 | ||||||||
|
|
|
| |||||||||
Investor Class | $ | 96,065,263 | $ | 229,639,964 | ||||||||
|
|
|
| |||||||||
Advisor Class | $ | 6,039,168 | $ | 3,163,999 | ||||||||
|
|
|
| |||||||||
A Class | $ | 16,228,685 | $ | 3,748,595 | ||||||||
|
|
|
| |||||||||
C Class | $ | 30,848,500 | $ | 4,349,946 | ||||||||
|
|
|
| |||||||||
R6 Class | N/A | $ | 2,253,328 | |||||||||
|
|
|
| |||||||||
Net asset value, offering and redemption price per share: | ||||||||||||
Institutional Class | $ | 16.36 | $ | 15.41 | ||||||||
|
|
|
| |||||||||
Y Class | $ | 16.47 | $ | 15.27 | ||||||||
|
|
|
| |||||||||
Investor Class | $ | 14.36 | $ | 15.56 | ||||||||
|
|
|
| |||||||||
Advisor Class | $ | 15.34 | $ | 15.06 | ||||||||
|
|
|
| |||||||||
A Class | $ | 14.33 | $ | 15.03 | ||||||||
|
|
|
| |||||||||
A Class (offering price) | $ | 15.20 | $ | 15.95 | ||||||||
|
|
|
| |||||||||
C Class | $ | 14.48 | $ | 14.49 | ||||||||
|
|
|
| |||||||||
R6 Class | N/A | $ | 15.42 | |||||||||
|
|
|
| |||||||||
† Cost of investments in unaffiliated securities | $ | 216,740,055 | $ | 425,565,893 | ||||||||
‡ Cost of investments in affiliated securities | $ | 4,904,248 | $ | 19,292,386 | ||||||||
§ Fair value of securities on loan | $ | 2,452,229 | $ | 20,651,471 | ||||||||
A The Fund’s investments in affiliated securities did not have unrealized appreciation (depreciation) at year end. |
| |||||||||||
See accompanying notes
34
American Beacon FundsSM
Statements of Operations
For the year ended October 31, 2019
| Balanced Fund | Mid-Cap Value Fund | |||||||||||
Investment income: | ||||||||||||
Dividend income from unaffiliated securities (net of foreign taxes)† | $ | 4,653,221 | $ | 13,122,881 | ||||||||
Dividend income from affiliated securities (Note 8) | 119,895 | 448,948 | ||||||||||
Interest income (net of foreign taxes)† | 3,157,544 | 11,159 | ||||||||||
Income derived from securities lending (Note 9) | 7,171 | 16,218 | ||||||||||
|
|
|
| |||||||||
Total investment income | 7,937,831 | 13,599,206 | ||||||||||
|
|
|
| |||||||||
Expenses: | ||||||||||||
Management andsub-advisory fees (Note 2) | 1,444,808 | 4,642,017 | ||||||||||
Transfer agent fees: | ||||||||||||
Institutional Class (Note 2) | 7,482 | 89,620 | ||||||||||
Y Class (Note 2) | 57,527 | 95,225 | ||||||||||
Investor Class | 9,279 | 11,980 | ||||||||||
Advisor Class | 471 | 2,530 | ||||||||||
A Class | 1,177 | 1,117 | ||||||||||
C Class | 3,378 | 1,508 | ||||||||||
R6 Class | - | 285 | ||||||||||
Custody and fund accounting fees | 79,597 | 89,651 | ||||||||||
Professional fees | 61,000 | 72,238 | ||||||||||
Registration fees and expenses | 85,945 | 123,187 | ||||||||||
Service fees (Note 2): | ||||||||||||
Investor Class | 323,952 | 839,240 | ||||||||||
Advisor Class | 14,548 | 7,805 | ||||||||||
A Class | 18,015 | 15,643 | ||||||||||
C Class | 33,747 | 5,442 | ||||||||||
Distribution fees (Note 2): | ||||||||||||
Advisor Class | 15,622 | 7,873 | ||||||||||
A Class | 41,419 | 18,854 | ||||||||||
C Class | 326,377 | 48,369 | ||||||||||
Prospectus and shareholder report expenses | 27,838 | 88,291 | ||||||||||
Trustee fees (Note 2) | 20,635 | 44,991 | ||||||||||
Other expenses | 51,210 | 68,776 | ||||||||||
|
|
|
| |||||||||
Total expenses | 2,624,027 | 6,274,642 | ||||||||||
|
|
|
| |||||||||
Net fees waived and expenses (reimbursed) / recouped (Note 2) | - | (621 | ) | |||||||||
|
|
|
| |||||||||
Net expenses | 2,624,027 | 6,274,021 | ||||||||||
|
|
|
| |||||||||
Net investment income | 5,313,804 | 7,325,185 | ||||||||||
|
|
|
| |||||||||
Realized and unrealized gain (loss) from investments: | ||||||||||||
Net realized gain (loss) from: | ||||||||||||
Investments in unaffiliated securitiesA | 18,444,561 | (24,328,094 | ) | |||||||||
Commission recapture (Note 1) | 4,136 | 52,175 | ||||||||||
Foreign currency transactions | (188 | ) | 14 | |||||||||
Futures contracts | (282,052 | ) | 903,027 | |||||||||
Change in net unrealized appreciation of: | ||||||||||||
Investments in unaffiliated securitiesB | 2,410,846 | 52,835,570 | ||||||||||
Foreign currency transactions | - | 81 | ||||||||||
Futures contracts | 264,711 | 1,531,334 | ||||||||||
|
|
|
| |||||||||
Net gain from investments | 20,842,014 | 30,994,107 | ||||||||||
|
|
|
| |||||||||
Net increase in net assets resulting from operations | $ | 26,155,818 | $ | 38,319,292 | ||||||||
|
|
|
| |||||||||
† Foreign taxes | $ | 36,203 | $ | 59,238 | ||||||||
A The Fund did not recognize net realized gains (losses) from the sale of investments in affiliated securities. |
| |||||||||||
B The Fund’s investments in affiliated securities did not have a change in unrealized appreciation (depreciation) at year end. |
| |||||||||||
See accompanying notes
35
American Beacon FundsSM
Statements of Changes in Net Assets
| Balanced Fund | Mid-Cap Value Fund | |||||||||||||||||||||||||||
| Year Ended October 31, 2019 | Year Ended October 31, 2018 | Year Ended October 31, 2019 | Year Ended October 31, 2018 | |||||||||||||||||||||||||
Increase (decrease) in net assets: | ||||||||||||||||||||||||||||
Operations: | ||||||||||||||||||||||||||||
Net investment income | $ | 5,313,804 | $ | 5,594,543 | $ | 7,325,185 | $ | 8,243,269 | ||||||||||||||||||||
Net realized gain (loss) from investments in unaffiliated securities, commission recapture, foreign currency transactions, and futures contracts | 18,166,457 | 22,789,700 | (23,372,878 | ) | 39,046,228 | |||||||||||||||||||||||
Change in net unrealized appreciation (depreciation) of investments in unaffiliated securities, foreign currency transactions, and futures contracts | 2,675,557 | (24,223,813 | ) | 54,366,985 | (114,181,076 | ) | ||||||||||||||||||||||
|
|
|
|
|
|
|
| |||||||||||||||||||||
Net increase (decrease) in net assets resulting from operations | 26,155,818 | 4,160,430 | 38,319,292 | (66,891,579 | ) | |||||||||||||||||||||||
|
|
|
|
|
|
|
| |||||||||||||||||||||
Distributions to shareholders: | ||||||||||||||||||||||||||||
Total retained earnings: | ||||||||||||||||||||||||||||
Institutional Class | (5,001,897 | ) | (6,261,952 | ) | (16,149,794 | ) | (9,434,653 | ) | ||||||||||||||||||||
Y Class | (5,879,168 | ) | (4,822,027 | ) | (6,006,150 | ) | (3,447,030 | ) | ||||||||||||||||||||
Investor Class | (9,902,997 | ) | (9,640,824 | ) | (22,741,996 | ) | (9,262,634 | ) | ||||||||||||||||||||
Advisor Class | (537,080 | ) | (761,574 | ) | (198,759 | ) | (94,728 | ) | ||||||||||||||||||||
A Class | (1,636,327 | ) | (1,718,656 | ) | (712,238 | ) | (434,137 | ) | ||||||||||||||||||||
C Class | (3,065,750 | ) | (2,976,692 | ) | (313,969 | ) | (184,144 | ) | ||||||||||||||||||||
R6 Class | - | - | (12,536 | ) | - | |||||||||||||||||||||||
|
|
|
|
|
|
|
| |||||||||||||||||||||
Net distributions to shareholders | (26,023,219 | ) | (26,181,725 | ) | (46,135,442 | ) | (22,857,326 | ) | ||||||||||||||||||||
|
|
|
|
|
|
|
| |||||||||||||||||||||
Capital share transactions (Note 11): | ||||||||||||||||||||||||||||
Proceeds from sales of shares | 35,227,904 | 53,469,502 | 101,076,057 | 405,914,174 | ||||||||||||||||||||||||
Reinvestment of dividends and distributions | 25,209,375 | 25,384,629 | 45,842,063 | 22,545,457 | ||||||||||||||||||||||||
Cost of shares redeemed | (101,347,208 | ) | (109,865,841 | ) | (389,366,433 | ) | (261,376,072 | ) | ||||||||||||||||||||
|
|
|
|
|
|
|
| |||||||||||||||||||||
Net increase (decrease) in net assets from capital share transactions | (40,909,929 | ) | (31,011,710 | ) | (242,448,313 | ) | 167,083,559 | |||||||||||||||||||||
|
|
|
|
|
|
|
| |||||||||||||||||||||
Net increase (decrease) in net assets | (40,777,330 | ) | (53,033,005 | ) | (250,264,463 | ) | 77,334,654 | |||||||||||||||||||||
|
|
|
|
|
|
|
| |||||||||||||||||||||
Net assets: | ||||||||||||||||||||||||||||
Beginning of period | 299,508,523 | 352,541,528 | 746,385,393 | 669,050,739 | ||||||||||||||||||||||||
|
|
|
|
|
|
|
| |||||||||||||||||||||
End of period | $ | 258,731,193 | $ | 299,508,523 | $ | 496,120,930 | $ | 746,385,393 | ||||||||||||||||||||
|
|
|
|
|
|
|
| |||||||||||||||||||||
See accompanying notes
36
American Beacon FundsSM
October 31, 2019
1. Organization and Significant Accounting Policies
American Beacon Funds (the “Trust”) is organized as a Massachusetts business trust. The Funds, each a series within the Trust, are registered under the Investment Company Act of 1940, as amended (the “Act”), as diversified,open-end management investment companies. As of October 31, 2019, the Trust consists ofthirty-two active series, two of which are presented in this filing: American Beacon Balanced Fund and American BeaconMid-Cap Value Fund (collectively, the “Funds” and each individually a “Fund”). The remaining thirty active series are reported in separate filings.
American Beacon Advisors, Inc. (the “Manager”) is a Delaware corporation and a wholly-owned subsidiary of Resolute Investment Managers, Inc. (“RIM”) organized in 1986 to provide business management, advisory, administrative, and asset management consulting services to the Trust and other investors. The Manager is registered as an investment advisor under the Investment Advisers Act of 1940, as amended (the “Advisers Act”). RIM is, in turn, a wholly-owned subsidiary of Resolute Acquisition, Inc., which is a wholly-owned subsidiary of Resolute Topco, Inc., a wholly-owned subsidiary of Resolute Investment Holdings, LLC (“RIH”). RIH is owned primarily by Kelso Investment Associates VIII, L.P., KEP VI, LLC and Estancia Capital Partners L.P., investment funds affiliated with Kelso & Company, L.P. (“Kelso”) or Estancia Capital Management, LLC (“Estancia”), which are private equity firms.
Recent Accounting Pronouncements
In March 2017, the Financial Accounting Standards Board (“FASB”) issued Accounting Standards Update (“ASU”)2017-08,Premium Amortization of Purchased Callable Debt Securities. The amendments in the ASU shorten the premium amortization period on a purchased callable debt security from the security’s contractual life to the earliest call date. It is anticipated that this change will enhance disclosures by reducing losses recognized when a security is called on an earlier date. This ASU is effective for fiscal years beginning after December 15, 2018. The Manager continues to evaluate the impact this ASU will have on the financial statements and other disclosures.
In August 2018, the FASB issued ASU2018-13,Fair Value Measurement (“Topic 820”). The amendments in the ASU impact disclosure requirements for fair value measurement. It is anticipated that this change will enhance the effectiveness of disclosures in the notes to the financial statements. This ASU is effective for fiscal years beginning after December 15, 2019. Early adoption is permitted and can include the entire standard or certain provisions that exclude or amend disclosures. For the year ended October 31, 2019, the Funds have chosen to adopt the standard. The adoption of this ASU guidance did not have a material impact on the financial statements and other disclosures.
Class Disclosure
Each Fund has multiple classes of shares designed to meet the needs of different groups of investors; however, not all of the Funds offer all classes. The following table sets forth the differences amongst the classes:
Class | Eligible Investors | Minimum Initial Investments | ||||
| Institutional | Large institutional investors - sold directly or through intermediary channels. | $ | 250,000 | |||
| Y Class | Large institutional retirement plan investors - sold directly or through intermediary channels. | $ | 100,000 | |||
| Investor | All investors using intermediary organizations, such as broker-dealers or retirement plan sponsors. | $ | 2,500 | |||
| Advisor Class | All investors who invest through intermediary organizations, such as broker-dealers or third party administrators. | $ | 2,500 | |||
37
American Beacon FundsSM
Notes to Financial Statements
October 31, 2019
Class | Eligible Investors | Minimum Initial Investments | ||||
| A Class | All investors who invest through intermediary organizations, such as broker-dealers or third party administrator. Retail investors who invest directly through a financial intermediary such as a broker, bank, or registered investment advisor which may include afront-end sales charge and a contingent deferred sales charge (“CDSC”). | $ | 2,500 | |||
| C Class | Retail investors who invest directly through a financial intermediary such as a broker or through employee directed benefit plans with applicable sales charges which may include CDSC. | $ | 1,000 | |||
| R6 Class | Large institutional retirement plan investors - sold through retirement plan sponsors. | None | ||||
Each class offered by the Trust has equal rights as to assets and voting privileges. Income andnon-class specific expenses are allocated daily to each class based on the relative net assets. Realized and unrealized capital gains and losses of each class are allocated daily based on the relative net assets of each class of the respective Fund. Class specific expenses, where applicable, currently include service, distribution, transfer agent fees, andsub-transfer agent fees that vary amongst the classes as described more fully in Note 2.
Significant Accounting Policies
The following is a summary of significant accounting policies, consistently followed by the Funds in preparation of the financial statements. The Funds are considered investment companies and accordingly, follow the investment company accounting and reporting guidance of the FASB Accounting Standards Codification Topic 946,Financial Services – Investment Companies,a part of Generally Accepted Accounting Principles (“U.S. GAAP”).
Security Transactions and Investment Income
Security transactions are recorded as of the trade date for financial reporting purposes. Securities purchased or sold on a when-issued or delayed-delivery basis may be settled beyond a standard settlement period for the security after the trade date.
Dividend income, net of foreign taxes, is recorded on theex-dividend date, except certain dividends from foreign securities which are recorded as soon as the information is available to the Funds. Interest income, net of foreign taxes, is earned from settlement date, recorded on the accrual basis, and adjusted, if necessary, for accretion of discounts and amortization of premiums. For convertible securities, premiums attributable to the conversion feature are not amortized. Realized gains (losses) from securities sold are determined on the basis of specific lot identification. Estimated tax liabilities on certain foreign securities are recorded on an accrual basis and are reflected as components of interest income or net change in unrealized appreciation (depreciation) on investments on the Statements of Operations, as appropriate. Tax liabilities realized as a result of such security sales are reflected as a component of net realized gain (loss) on investments on the Statements of Operations. Paydown gains (losses) on mortgage-related and other asset-backed securities, if any, are recorded as components of interest income on the Statements of Operations. Income or short-term capital gain distributions received from registered investment companies, if any, are recorded as dividend income. Long-term gain distributions received from registered investment companies, if any, are recorded as realized gains.
Debt obligations may be placed on anon-accrual status and related interest income may be reduced by ceasing current accruals and writing off interest receivable when the collection of all or a portion of interest has become doubtful based on consistently applied procedures. A debt obligation is removed fornon-accrual when the issuer resumes interest payments or when collectability of interest is probable. Realized gains (losses) from securities sold are determined on the basis of specific lot identification.
38
American Beacon FundsSM
Notes to Financial Statements
October 31, 2019
Distributions to Shareholders
The Balanced Fund distributes most or all of its net earning and realized gains, if any, each taxable year in the form of dividends from net investment income on a quarterly basis and distributions of realized net capital gains and net gains or losses from foreign currency transactions on an annual basis. TheMid-Cap Value Fund distributes most or all of its net earning and realized gains, if any, each taxable year in the form of dividends from net investment income and distributions of realized net capital gains and net gains or losses from foreign currency transactions on an annual basis. The Funds do not have a fixed dividend rate and do not guarantee that they will pay any distributions in any particular year. Dividends to shareholders are determined in accordance with federal income tax regulation, which may differ in amount and character from net investment income and realized gains recognized for purposes of U.S. GAAP. To the extent necessary to fully distribute capital gains, the Funds may designate earning and profits distributed to shareholders on the redemption of shares.
Commission Recapture
The Funds have established brokerage commission recapture arrangements with certain brokers or dealers. If the Funds’ investment advisor chooses to execute a transaction through a participating broker, the broker rebates a portion of the commission back to the Funds. Any collateral benefit received through participation in the commission recapture program is directed exclusively to the Funds. This amount is reported with the net realized gain in the Funds’ Statements of Operations, if applicable.
Allocation of Income, Trust Expenses, Gains, and Losses
Investment income, realized and unrealized gains and losses from investments of the Funds are allocated daily to each class of shares based upon the relative proportion of net assets of each class to the total net assets of the Funds. Expenses directly charged or attributable to the Fund will be paid from the assets of the Fund. Generally, expenses of the Trust will be allocated among and charged to the assets of the Funds on a basis that the Trust’s Board of Trustees (the “Board”) deems fair and equitable, which may be based on the relative net assets of the Funds or nature of the services performed and relative applicability to the Funds.
Use of Estimates
The preparation of financial statements in conformity with U.S. GAAP requires management to make estimates and assumptions that affect the amounts reported in the financial statements and accompanying notes. Actual results may differ from those estimated.
Other
Under the Trust’s organizational documents, its officers and trustees are indemnified against certain liabilities arising out of the performance of their duties to the Trust. In the normal course of business, the Trust enters into contracts that provide indemnification to the other party or parties against potential costs or liabilities. The Trust’s maximum exposure under these arrangements is dependent on claims that may be made in the future and, therefore, cannot be estimated. The Trust has had no prior claims or losses pursuant to any such agreement.
Concentration of Ownership
From time to time, the Funds may have a concentration of one or more accounts constituting a significant percentage of shares outstanding. Investment activities by holders of accounts that represent a significant ownership of more than 5% of the Funds’ outstanding shares could have a material impact on the Funds. As of October 31, 2019, based on management’s evaluation of the shareholder account base, exclusive of omnibus accounts, one account has been identified as representing anon-affiliated significant ownership of approximately 7% of the Balanced Fund’s outstanding shares.
39
American Beacon FundsSM
Notes to Financial Statements
October 31, 2019
2. Transactions with Affiliates
Management and InvestmentSub-Advisory Agreements
The Funds and the Manager are parties to a Management Agreement that obligates the Manager to provide the Funds with investment advisory and administrative services. As compensation for performing the duties under the Management Agreement, the Manager will receive an annualized management fee based on a percentage of each Funds’ average daily net assets that is calculated and accrued daily according to the following schedule:
First $15 billion | 0.35 | % | ||
Next $15 billion | 0.325 | % | ||
Over $30 billion | 0.30 | % |
The Trust, on behalf of the Funds, and the Manager have entered into Investment Advisory Agreements with Barrow, Hanley, Mewhinney & Strauss, LLC; Brandywine Global Investment Management, LLC; and Hotchkis and Wiley Capital Management, LLC for the Balanced Fund. In addition, the Manager manages a portion of the Balanced Fund pursuant to the Management Agreement. The Trust, on behalf of the Funds, and the Manager have entered into Investment Advisory Agreements with Barrow, Hanley, Mewhinney & Strauss, LLC; Pzena Investment Management, LLC; and WEDGE Capital Management, L.L.P. for theMid-Cap Value Fund. Pursuant to the Investment Advisory Agreements, the Funds have agreed to pay an annualizedsub-advisory fee that is calculated and accrued daily based on the Funds’ average daily net assets.
The Management andSub-Advisory Fees paid by the Funds for the year ended October 31, 2019 were as follows:
Balanced Fund
| Effective Fee Rate | Amount of Fees Paid | |||||||||||
Management Fees | 0.35 | % | $ | 961,308 | ||||||||
Sub-Advisor Fees | 0.18 | % | 483,500 | |||||||||
|
|
|
| |||||||||
Total | 0.53 | % | $ | 1,444,808 | ||||||||
|
|
|
| |||||||||
Mid-Cap Value Fund
| Effective Fee Rate | Amount of Fees Paid | |||||||||||
Management Fees | 0.35 | % | $ | 2,057,593 | ||||||||
Sub-Advisor Fees | 0.41 | % | 2,584,424 | |||||||||
|
|
|
| |||||||||
Total | 0.76 | % | $ | 4,642,017 | ||||||||
|
|
|
| |||||||||
As compensation for services provided by the Manager in connection with securities lending activities conducted by the Funds, the lending Fund pays to the Manager, with respect to cash collateral posted by borrowers, a fee up to 10% of the net monthly interest income (the gross interest income earned by the investment of cash collateral, less the amount paid to borrowers and related expenses) from such activities and, with respect to loan fees paid by borrowers, a fee up to 10% of such loan fees. These fees are included in “Income derived from securities lending” and “Management and investment advisory fees” on the Statements of Operations. During the year ended October 31, 2019, the Manager received securities lending fees of $661 and $1,746 for the securities lending activities of the Balanced Fund andMid-Cap Value Fund, respectively.
Distribution Plans
The Funds, except for the Advisor, A, and C Classes of the Funds, have adopted a “defensive” Distribution Plan (the “Plan”) in accordance with Rule12b-1 under the Act, pursuant to which no separate fees may be charged
40
American Beacon FundsSM
Notes to Financial Statements
October 31, 2019
to the Funds for distribution purposes. However, the Plan authorizes the management fee received by the Manager and the investment advisors hired by the Manager to be used for distribution purposes. Under this Plan, the Funds do not intend to compensate the Manager or any other party, either directly or indirectly, for the distribution of Fund shares.
Separate Distribution Plans (the “Distribution Plans”) have been adopted pursuant to Rule12b-1 under the Act for the Advisor, A, and C Classes of the Funds. Under the Distribution Plans, as compensation for distribution and shareholder servicing assistance, the Manager receives an annual fee of 0.25% of the average daily net assets of the Advisor and A Classes, and 1.00% of the average daily net assets of the C Class. The fee will be payable without regard to whether the amount of the fee is more or less than the actual expenses incurred in a particular month by the Manager for distribution assistance.
Service Plans
The Manager and the Trust entered into Service Plans that obligate the Manager to oversee additional shareholder servicing of the Investor, Advisor, A, and C Classes of the Funds. As compensation for performing the duties required under the Service Plans, the Manager receives an annualized fee up to 0.25% of the average daily net assets of the A and C Classes, up to 0.25% of the average daily net assets of the Advisor Class, and up to 0.375% of the average daily net assets of the Investor Class of the Funds.
Sub-Transfer Agent Fees
The Manager has entered into agreements, which include servicing agreements, with financial intermediaries that provide recordkeeping, processing, shareholder communications and other services to customers of the intermediaries that hold positions in the Institutional and Y Classes of the Funds and has agreed to compensate the intermediaries for providing these services. Intermediaries transact with the Funds primarily through the use of omnibus accounts on behalf of their customers who hold positions in the Funds. Certain services would have been provided by the Funds’ transfer agent and other service providers if the shareholders’ accounts were maintained directly by the Funds’ transfer agent. Accordingly, the Funds, pursuant to Board approval, have agreed to reimburse the Manager for certainnon-distribution shareholder services provided by financial intermediaries for the Institutional and Y Classes. The reimbursement amounts(sub-transfer agent fees) paid to the Manager are subject to a fee limit of up to 0.10% of an intermediary’s average net assets in the Institutional and Y Classes on an annual basis. During the year ended October 31, 2019, thesub-transfer agent fees, as reflected in “Transfer agent fees” on the Statements of Operations, were as follows:
Fund | Sub-Transfer Agent Fees | |||
Balanced | $ | 61,454 | ||
Mid-Cap Value | 162,226 | |||
As of October 31, 2019, the Funds owed the Manager the following reimbursement ofsub-transfer agent fees, as reflected in “Transfer agent fees payable” on the Statements of Assets and Liabilities:
Fund | Reimbursement Sub-Transfer Agent Fees | |||
Balanced | $ | 6,812 | ||
Mid-Cap Value | 8,134 | |||
Investments in Affiliated Funds
The Funds may invest in the American Beacon U.S. Government Money Market Select Fund (the “USG Select Fund”). Cash collateral received by the Funds in connection with securities lending may also be invested in the USG Select Fund. The Funds and the USG Select Fund have the same investment advisor and therefore, are considered to be affiliated. The Manager serves as investment advisor to the USG Select Fund and receives management fees
41
American Beacon FundsSM
Notes to Financial Statements
October 31, 2019
and administrative fees totaling 0.10% of the average daily net assets of the USG Select Fund. During the year ended October 31, 2019, the Manager earned fees on the Funds’ direct investments and securities lending collateral investments in the USG Select Fund as shown below:
Fund | Direct Investments in USG Select Fund | Securities Lending Collateral Investments in USG Select Fund | Total | |||||||||
Balanced | $ | 5,400 | $ | 1,164 | $ | 6,564 | ||||||
Mid-Cap Value | 20,299 | 4,003 | 24,302 | |||||||||
Interfund Credit Facility
Pursuant to an exemptive order issued by the U.S. Securities and Exchange Commission (“SEC”), the Funds, along with other registered investment companies having management contracts with the Manager, may participate in a credit facility whereby each fund, under certain conditions, is permitted to lend money directly to and borrow directly from other participating funds for temporary purposes. The interfund credit facility is advantageous to the funds because it provides added liquidity and eliminates the need to maintain higher cash balances to meet redemptions. This situation could arise when shareholder redemptions exceed anticipated volumes and certain funds have insufficient cash on hand to satisfy such redemptions or when sales of securities do not settle as expected, resulting in a cash shortfall for a fund. When a fund liquidates portfolio securities to meet redemption requests, they often do not receive payment in settlement for up to two days (or longer for certain foreign transactions). Redemption requests normally are satisfied on the next business day. The credit facility provides a source of immediate, short-term liquidity pending settlement of the sale of portfolio securities. The credit facility is administered by a credit facility team consisting of professionals from the Manager’s asset management, compliance, and accounting areas who report the activities of the credit facility to the Board. During the year ended October 31, 2019, the Balanced Fund borrowed on average $685,888 for 2 days at an average interest rate of 3.11% with interest charges of $114. These amounts are recorded as “Other expenses” in the Statements of Operations. During the year ended October 31, 2019, theMid-Cap Value Fund did not utilize the credit facility.
Expense Reimbursement Plan
The Manager contractually agreed to reduce fees and/or reimburse expenses for the classes of the Funds to the extent that total operating expenses exceed the Funds’ expense cap. During the year ended October 31, 2019, the Manager waived and/or reimbursed expenses as follows:
| Expense Cap | Expiration of Reimbursed Expenses | |||||||||||||||||||||||
Fund | Class | 11/1/2018 – 2/28/2019 | 3/1/2019 – 10/31/2019 | Reimbursed Expenses | (Recouped) Expenses | |||||||||||||||||||
Mid-Cap Value | R6 | 0.88 | %(1) | 0.83 | % | $ | 648 | $ | (27 | ) | 2021 - 2022 | |||||||||||||
(1) Voluntary expense cap.
Of these amounts, $162 was disclosed as a payable to the Manager on the Statements of Assets and Liabilities at October 31, 2019 for theMid-Cap Value Fund.
The Funds have adopted an Expense Reimbursement Plan whereby the Manager may seek repayment of such fee or voluntary reductions and expense reimbursements. Under the policy, the Manager can be reimbursed by the Funds for any contractual or voluntary fee reductions or expense reimbursements if reimbursement to the Manager (a) occurs within three years after the date of the Manager’s waiver/reimbursement and (b) does not cause the Funds’ annual operating expenses to exceed the lesser of the contractual percentage limit in effect at the time of the waiver/reimbursement or time of recoupment. The reimbursed expenses listed above will expire in 2021 and
42
American Beacon FundsSM
Notes to Financial Statements
October 31, 2019
2022. The Fund did not record a liability for potential reimbursement due to the current assessment that a reimbursement is uncertain. The carryover of excess expenses potentially reimbursable to the Manager, but not recorded as a liability are as follows:
Fund | Recouped Expenses | Excess Expense Carryover | Expired Expense Carryover | Expiration of Reimbursed Expenses | ||||||||||||
Mid-Cap Value | $ | 27 | * | $ | 2,051 | $ | – | 2020 - 2021 | ||||||||
* Amount related to R6 Class
Sales Commissions
The Funds’ Distributor, Resolute Investment Distributors, Inc. (“RID” or “Distributor”), may receive a portion of Class A sales charges from broker dealers and it may be used to offset distribution related expenses. During the year ended October 31, 2019, RID collected $6,499 and $325 for Balanced Fund andMid-Cap Value Fund, respectively, from the sale of Class A Shares.
A CDSC of 0.50% will be deducted with respect to Class A Shares on certain purchases of $1,000,000 or more that are redeemed in whole or part within 18 months of purchase, unless waived as discussed in the Funds’ Prospectus. Any applicable CDSC will be 0.50% of the lesser of the original purchase price or the value of the redemption of the Class A Shares redeemed. During the year ended October 31, 2019, there were no CDSC fees collected for Class A Shares of the Funds.
A CDSC of 1.00% will be deducted with respect to Class C Shares redeemed within 12 months of purchase, unless waived as discussed in the Funds’ Prospectus. Any applicable CDSC will be 1.00% of the lesser of the original purchase price or the value of the redemption of the Class C Shares redeemed. During the year ended October 31, 2019, CDSC fees of $3,005 and $797 were collected for the Class C Shares of Balanced Fund andMid-Cap Value Fund, respectively.
Trustee Fees and Expenses
As compensation for their service to the Trusts, each Trustee receives an annual retainer of $120,000, plus $10,000 for each Board meeting attended in person or via teleconference, $2,500 for attendance by Committee members at meetings of the Audit Committee and the Investment Committee, and $1,500 for attendance by Committee members at meetings of the Nominating and Governance Committee, plus reimbursement of reasonable expenses incurred in attending Board meetings, Committee meetings, and relevant educational seminars. The Trustees also may be compensated for attendance at special Board and/or Committee meetings from time to time. The Board Chair receives an additional annual retainer of $50,000 as well as a $2,500 fee each quarter for attendance at the committee meetings. The Chairpersons of the Audit Committee and the Investment Committee each receive an additional annual retainer of $25,000 and the Chairman of the Nominating and Governance Committee receives an additional annual retainer of $10,000. These expenses are allocated on a prorated basis to each fund of the Trusts according to its respective net assets.
3. Security Valuation and Fair Value Measurements
The price of the Fund’s shares is based on its net asset value (“NAV”) per share. The Fund’s NAV is computed by adding total assets, subtracting all the Fund’s liabilities, and dividing the result by the total number of shares outstanding.
The NAV of each class of the Fund’s shares is determined based on a pro rata allocation of the Fund’s investment income, expenses and total capital gains and losses. The Fund’s NAV per share is determined each business day as of the regular close of trading on the New York Stock Exchange (“NYSE” or “Exchange”), which is typically 4:00 p.m. Eastern Time (“ET”). However, if trading on the NYSE closes at a time other than 4:00 p.m. ET, the Fund’s NAV per share typically would still be determined as of the regular close of trading on the NYSE. The
43
American Beacon FundsSM
Notes to Financial Statements
October 31, 2019
Fund does not price its shares on days that the NYSE is closed. Foreign exchanges may permit trading in foreign securities on days when the Fund is not open for business, which may result in the value of the Fund’s portfolio investments being affected at a time when you are unable to buy or sell shares.
Equity securities, including shares ofclosed-end funds and exchange-traded funds (“ETFs”), are valued at the last sale price or official closing price taken from the primary exchange in which each security trades. Investments in other mutual funds are valued at the closing NAV per share on the day of valuation. Debt securities are valued at bid quotes from broker/dealers or evaluated bid prices from pricing services, who may consider a number of inputs and factors, such as prices of comparable securities, yield curves, spreads, credit ratings, coupon rates, maturity, default rates, and underlying collateral. Futures are valued based on their daily settlement prices. Exchange-traded andover-the-counter (“OTC”) options are valued at the last sale price. Options with no last sale for the day are priced at mid quote. Swaps are valued at evaluated mid prices from pricing services.
The valuation of securities traded on foreign markets and certain fixed-income securities will generally be based on prices determined as of the earlier closing time of the markets on which they primarily trade unless a significant event has occurred. When the Fund holds securities or other assets that are denominated in a foreign currency, the Fund will normally use the currency exchange rates as of 4:00 p.m. ET.
Securities may be valued at fair value, as determined in good faith and pursuant to procedures approved by the Board, under certain limited circumstances. For example, fair value pricing will be used when market quotations are not readily available or reliable, as determined by the Manager, such as when (i) trading for a security is restricted or stopped; (ii) a security’s trading market is closed (other than customary closings); or (iii) a security has beende-listed from a national exchange. A security with limited market liquidity may require fair value pricing if the Manager determines that the available price does not reflect the security’s true market value. In addition, if a significant event that the Manager determines to affect the value of one or more securities held by the Fund occurs after the close of a related exchange but before the determination of the Fund’s NAV, fair value pricing may be used on the affected security or securities. Securities of small-capitalization companies are also more likely to require a fair value determination using these procedures because they are more thinly traded and less liquid than the securities of larger-capitalization companies. The Fund may fair value securities as a result of significant events occurring after the close of the foreign markets in which the Fund invests as described below. In addition, the Fund may invest in illiquid securities requiring these procedures.
The Fund may use fair value pricing for securities primarily traded innon-U.S. markets because most foreign markets close well before the Fund’s pricing time of 4:00 p.m. ET. The earlier close of these foreign markets gives rise to the possibility that significant events, including broad market moves, may have occurred in the interim and may materially affect the value of those securities. If the Manager determines that the last quoted prices ofnon-U.S. securities will, in its judgment, materially affect the value of some or all its portfolio securities, the Manager can adjust the previous closing prices to reflect what it believes to be the fair value of the securities as of the close of the Exchange. In deciding whether it is necessary to adjust closing prices to reflect fair value, the Manager reviews a variety of factors, including developments in foreign markets, the performance of U.S. securities markets, and the performance of instruments trading in U.S. markets that represent foreign securities and baskets of foreign securities. These securities are fair valued using a pricing service, using methods approved by the Board, that considers the correlation of the trading patterns of the foreign security to intraday trading in the U.S. markets, based on indices of domestic securities and other appropriate indicators such as prices of relevant American Depositary Receipts (“ADRs”) and futures contracts. The Valuation Committee, established by the Board, may also fair value securities in other situations, such as when a particular foreign market is closed but the Fund is open. The Fund uses outside pricing services to provide closing prices and information to evaluate and/or adjust those prices. As a means of evaluating its security valuation process, the Valuation Committee routinely compares closing prices, the next day’s opening prices in the same markets and adjusted prices.
Attempts to determine the fair value of securities introduce an element of subjectivity to the pricing of securities. As a result, the price of a security determined through fair valuation techniques may differ from the price quoted or published by other sources and may not accurately reflect the market value of the security when
44
American Beacon FundsSM
Notes to Financial Statements
October 31, 2019
trading resumes. If a reliable market quotation becomes available for a security formerly valued through fair valuation techniques, the Manager compares the new market quotation to the fair value price to evaluate the effectiveness of the Fund’s fair valuation procedures. If any significant discrepancies are found, the Manager may adjust the Fund’s fair valuation procedures.
Valuation Inputs
Various inputs may be used to determine the fair value of the Funds’ investments. These inputs are summarized in three broad levels for financial statement purposes. The inputs or methodologies used to value securities are not necessarily an indication of the risk associated with investing in those securities.
| Level 1 | - | Quoted prices in active markets for identical securities. | ||
| Level 2 | - | Prices determined using other significant observable inputs. These may include quoted prices for similar securities, interest rates, prepayment speeds, credit risk, and others. | ||
| Level 3 | - | Prices determined using other significant unobservable inputs. Unobservable inputs reflect the Fund’s own assumptions about the factors market participants would use in pricing an investment. | ||
Level 1 and Level 2 trading assets and trading liabilities, at fair value
Common stocks, preferred securities, and financial derivative instruments, such as futures contracts that are traded on a national securities exchange, are stated at the last reported sale or settlement price on the day of valuation. To the extent these securities are actively traded and valuation adjustments are not applied, they are categorized as Level 1 of the fair value hierarchy. Preferred securities and other equities traded on inactive markets or valued by reference to similar instruments are generally categorized as Level 2 of the fair value hierarchy.
Fixed-income securities including corporate, convertible and municipal bonds and notes, U.S. government agencies, U.S. Treasury obligations, sovereign issues, bank loans, convertible preferred securities, andnon-U.S. bonds are normally valued by pricing service providers that use broker dealer quotations, reported trades or valuation estimates from their internal pricing models. The service providers’ internal models use inputs that are observable such as issuer details, interest rates, yield curves, prepayment speeds, credit risks/spreads, default rates, and quoted prices for similar assets. Securities that use similar valuation techniques and inputs as described above are categorized as Level 2 of the fair value hierarchy. Fixed-income securities purchased on a delayed-delivery basis aremarked-to-market daily until settlement at the forward settlement date and are categorized as Level 2 of the fair value hierarchy.
Mortgage-related and asset-backed securities (“ABS”) are usually issued as separate tranches, or classes, of securities within each deal. These securities are also normally valued by pricing service providers that use broker-dealer quotations or valuation estimates from their internal pricing models. The pricing models for these securities usually consider tranche-level attributes, current market data, estimated cash flows, and market-based yield spreads for each tranche, and incorporates deal collateral performance, as available. Mortgage-related and ABS that use similar valuation techniques and inputs as described above are categorized as Level 2 of the fair value hierarchy.
Investments in registeredopen-end investment management companies will be valued based upon the NAVs of such investments and are categorized as Level 1 of the fair value hierarchy.
4. Securities and Other Investments
Agency Mortgage-Backed Securities
Certain mortgage-backed securities (“MBS”) may be issued or guaranteed by the U.S. government or a government sponsored entity, such as the Federal National Mortgage Association (“Fannie Mae”) or the Federal
45
American Beacon FundsSM
Notes to Financial Statements
October 31, 2019
Home Loan Mortgage Corporation (“Freddie Mac”). Although these instruments may be guaranteed by the U.S. government or a government sponsored entity, many such MBS are not backed by the full faith and credit of the United States and are still exposed to the risk ofnon-payment.
American Depositary Receipts andNon-Voting Depositary Receipts
ADRs are depositary receipts for foreign issuers in registered form traded in U.S. securities markets.Non-Voting Depositary Receipts (“NVDRs”) represent financial interests in an issuer but the holder is not entitled to any voting rights. Depositary receipts may not be denominated in the same currency as the securities into which they may be converted. Investing in depositary receipts entails substantially the same risks as direct investment in foreign securities. There is generally less publicly available information about foreign companies and there may be less governmental regulation and supervision of foreign stock exchanges, brokers, and listed companies. In addition, such companies may use different accounting and financial standards (and certain currencies may become unavailable for transfer from a foreign currency), resulting in the Fund’s possible inability to convert immediately into U.S. currency proceeds realized upon the sale of portfolio securities of the affected foreign companies. In addition, the Funds may invest in unsponsored depositary receipts, the issuers of which are not obligated to disclose material information about the underlying securities to investors in the United States. Ownership of unsponsored depositary receipts may not entitle the Funds to the same benefits and rights as ownership of a sponsored depositary receipt or the underlying security.
Asset-Backed Securities
ABS are securities issued by trusts and special purpose entities that are backed by pools of assets, such as automobile and credit-card receivables and home equity loans, which pass through the payments on the underlying obligations to the security holders (less servicing fees paid to the originator or fees for any credit enhancement). Typically, loans or accounts receivable paper are transferred from the originator to a specially created trust, which repackages the trust’s interests as securities with a minimum denomination and a specific term. The securities are then privately placed or publicly offered. Examples include certificates for automobile receivables andso-called plastic bonds, backed by credit card receivables. The Balanced Fund is permitted to invest in ABS, subject to the Funds’ rating and quality requirements.
The value of an ABS is affected by, among other things, changes in the market’s perception of the asset backing the security, the creditworthiness of the servicing agent for the loan pool, the originator of the loans and the financial institution providing any credit enhancement. Payments of principal and interest passed through to holders of ABS are frequently supported by some form of credit enhancement, such as a letter of credit, surety bond, limited guarantee by another entity or by having a priority to certain of the borrower’s other assets. The degree of credit enhancement varies, and generally applies to only a portion of the ABS’s par value. Value is also affected if any credit enhancement has been exhausted.
Common Stock
Common stock generally takes the form of shares in a corporation which represent an ownership interest. It ranks below preferred stock and debt securities in claims for dividends and for assets of the company in a liquidation or bankruptcy. The value of a company’s common stock may fall as a result of factors directly relating to that company, such as decisions made by its management or decreased demand for the company’s products or services. A stock’s value may also decline because of factors affecting not just the company, but also companies in the same industry or sector. The price of a company’s stock may also be affected by changes in financial markets that are relatively unrelated to the company, such as changes in interest rates, currency exchange rates or industry regulation. Companies that elect to pay dividends on their common stock generally only do so after they invest in their own business and make required payments to bondholders and on other debt and preferred stock. Therefore, the value of a company’s common stock will usually be more volatile than its bonds, other debt and preferred stock. Common stock may be exchange-traded or OTC. OTC stock may be less liquid than exchange-traded stock.
46
American Beacon FundsSM
Notes to Financial Statements
October 31, 2019
Fixed-Income Investments
The Funds may hold debt, including government and corporate debt, and other fixed-income securities. Typically, the values of fixed-income securities change inversely with prevailing interest rates. Therefore, a fundamental risk of fixed-income securities is interest rate risk, which is the risk that their value will generally decline as prevailing interest rates rise, which may cause the Funds’ NAV to likewise decrease, and vice versa. How specific fixed-income securities may react to changes in interest rates will depend on the specific characteristics of each security. For example, while securities with longer maturities tend to produce higher yields, they also tend to be more sensitive to changes in prevailing interest rates and are, therefore, more volatile than shorter-term securities and are subject to greater market fluctuations as a result of changes in interest rates. Fixed-income securities are also subject to credit risk, which is the risk that the credit strength of an issuer of a fixed-income security will weaken and/or that the issuer will be unable to make timely principal and interest payments and that the security may go into default. In addition, there is prepayment risk, which is the risk that during periods of falling interest rates, certain fixed-income securities with higher interest rates, such as mortgage-backed securities (“MBS”) and ABS, may be prepaid by their issuers thereby reducing the amount of interest payments. This may result in a Fund having to reinvest its proceeds in lower yielding securities. Securities underlying MBS and ABS, which may include subprime mortgages, also may be subject to a higher degree of credit risk, valuation risk, and liquidity risk.
High-Yield Securities
Non-investment-grade securities are rated below the four highest credit grades by at least one of the public rating agencies (or are unrated if not publicly rated). Participation in high-yielding securities transactions generally involves greater returns in the form of higher average yields. However, participation in such transactions involves greater risks, including sensitivity to economic changes, solvency, and relative liquidity in the secondary trading market. Lower ratings may reflect a greater possibility that the financial condition of the issuer, or adverse changes in general economic conditions, or both, may impair the ability of the issuer to make payments of interest and principal. The prices and yields of lower-rated securities generally fluctuate more than higher-quality securities, and such prices may decline significantly in periods of general economic difficulty or rising interest rates.
Illiquid and Restricted Securities
Generally, an illiquid asset is an asset that the Funds reasonably expect cannot be sold or disposed of in current market conditions in seven calendar days or less without the sale or disposition significantly changing the market value of the investment. Historically, illiquid securities have included securities that have not been registered under the Securities Act, securities that are otherwise not readily marketable, and repurchase agreements having a remaining maturity of longer than seven calendar days. Securities that have not been registered under the Securities Act are referred to as private placements or restricted securities and are purchased directly from the issuer or in the secondary market. These securities may be sold only in a privately negotiated transaction or pursuant to an exemption from registration. A large institutional market exists for certain securities that are not registered under the Securities Act, including repurchase agreements, commercial paper, foreign securities, municipal securities and corporate bonds and notes. Institutional investors depend on an efficient institutional market in which the unregistered security can be readily resold or on an issuer’s ability to honor a demand for repayment. However, the fact that there are contractual or legal restrictions on resale of such investments to the general public or to certain institutions may not be indicative of their liquidity.
Limitations on resale may have an adverse effect on the marketability of portfolio securities, and the Fund might be unable to dispose of restricted or other illiquid securities promptly or at reasonable prices and might thereby experience difficulty satisfying redemptions within seven calendar days. In addition, the Fund may get only limited information about an issuer, so it may be less able to predict a loss. The Fund also might have to register such restricted securities in order to dispose of them resulting in additional expense and delay. Adverse market conditions could impede such a public offering of securities. In recognition of the increased size and liquidity of the institutional
47
American Beacon FundsSM
Notes to Financial Statements
October 31, 2019
market for unregistered securities and the importance of institutional investors in the formation of capital, the SEC adopted Rule 144A under the Securities Act. Rule 144A is designed to facilitate efficient trading among institutional investors by permitting the sale of certain unregistered securities to qualified institutional buyers. To the extent privately placed securities held by the Fund qualify under Rule 144A and an institutional market develops for those securities, the Fund likely will be able to dispose of the securities without registering them under the Securities Act. To the extent that institutional buyers become, for a time, uninterested in purchasing these securities, investing in Rule 144A securities could increase the level of the Fund’s illiquidity. The Manager or thesub-advisor, as applicable, may determine that certain securities qualified for trading under Rule 144A are liquid. Regulation S under the Securities Act permits the sale abroad of securities that are not registered for sale in the United States and includes a provision for U.S. investors, such as the Fund, to purchase such unregistered securities if certain conditions are met.
Securities sold in private placement offerings made in reliance on the “private placement” exemption from registration afforded by Section 4(a)(2) of the Securities Act and resold to qualified institutional buyers under Rule 144A under the Securities Act (“Section 4(a)(2) securities”) are restricted as to disposition under the federal securities laws, and generally are sold to institutional investors, such as the Fund, that agree they are purchasing the securities for investment and not with an intention to distribute to the public. Any resale by the purchaser must be pursuant to an exempt transaction and may be accomplished in accordance with Rule 144A. Section 4(a)(2) securities normally are resold to other institutional investors through or with the assistance of the issuer or dealers that make a market in the Section 4(a)(2) securities, thus providing liquidity. Restricted securities outstanding during the year ended October 31, 2019 are disclosed in the Notes to the Schedules of Investments.
Mortgage-Backed Securities
MBS often have stated maturities of up to thirty years when they are issued, depending upon the length of the mortgages underlying the securities. In practice however, unscheduled or early payments of principal and interest on the underlying mortgages may make the securities’ effective maturity shorter than this, and the prevailing interest rates may be higher or lower than the current yield of the Funds’ portfolio at the time resulting in reinvestment risk.
Rising or high interest rates may result in slower than expected principal payments which may tend to extend the duration of MBS, making them more volatile and more sensitive to changes in interest rates. This is known as extension risk.
MBS may have less potential for capital appreciation than comparable fixed-income securities due to the likelihood of increased prepayments of mortgages resulting from foreclosures or declining interest rates. These foreclosed or refinanced mortgages are paid off at face value (par) or less, causing a loss, particularly for any investor who may have purchased the security at a premium or a price above par. In such an environment, this risk limits the potential price appreciation of these securities.
Mortgage-Related and Other Asset-Backed Securities
The Balanced Fund may invest in mortgage or other ABS. These securities may include mortgage instruments issued by U.S. government agencies (“agency mortgages”) or those issued by private entities(“non-agency mortgages”). Specific types of instruments may include mortgage pass-through securities, collateralized mortgage obligations (“CMOs”), commercial mortgage-backed securities, mortgage dollar rolls, CMO residuals, stripped mortgage-backed securities and other securities that directly or indirectly represent a participation in, or are secured by a payable from, mortgage loans on real property. The value of the Funds’ MBS may be affected by, among other things, changes or perceived changes in interest rates, factors concerning the interests in and structure of the issuer or the originator of the mortgage, or the quality of the underlying assets. The mortgages underlying the securities may default or decline in quality or value. Through its investments in MBS, a Fund has exposure to subprime loans,Alt-A loans andnon-conforming loans as well as to the mortgage and credit markets generally. Underlying collateral related to subprime,Alt-A andnon-conforming mortgage loans has become
48
American Beacon FundsSM
Notes to Financial Statements
October 31, 2019
increasingly susceptible to defaults and declines in quality or value, especially in a declining residential real estate market. In addition, regulatory or tax changes may adversely affect the mortgage securities markets as a whole.
Other Investment Company Securities and Other Exchange-Traded Products
The Funds may invest in shares of other investment companies, includingopen-end funds,closed-end funds, business development companies, ETFs, unit investment trusts, and other investment companies of the Trust. The Funds may invest in securities of an investment company advised by the Manager or asub-advisor. Investments in the securities of other investment companies may involve duplication of advisory fees and certain other expenses. By investing in another investment company, the Funds become a shareholder of that investment company. As a result, the Funds’ shareholders indirectly will bear the Funds’ proportionate share of the fees and expenses paid by shareholders of the other investment company, in addition to the fees and expenses the Funds’ shareholders directly bear in connection with the Funds’ own operations. These other fees and expenses are reflected as Acquired Fund Fees and Expenses and are included in the Fees and Expenses Table for the Funds in their Prospectus, if applicable. Investments in other investment companies may involve the payment of substantial premiums above the value of such issuer’s portfolio securities.
Privately Issued Mortgage-Backed Securities
Pools created bynon-governmental issuers generally offer a higher rate of interest than government and government-related pools because there are no direct or indirect government guarantees of payments in such pools. However, timely payment of interest and principal of these pools is often partially supported by various enhancements such as over-collateralization and senior/subordination structures and by various forms of insurance or guarantees, including individual loan, title, pool and hazard insurance. The insurance and guarantees are issued by government entities, private insurers or the mortgage poolers. Although the market for such securities is becoming increasingly liquid, securities issued by certain private organizations may not be readily marketable.
Publicly Traded Partnerships; Master Limited Partnerships
The Funds may invest in publicly traded partnerships such as master limited partnerships (“MLPs”). MLPs issue units that are registered with the SEC and are freely tradable on a securities exchange or in the OTC market. An MLP may have one or more general partners, who conduct the business, and one or more limited partners, who contribute capital. An MLP also may be an entity similar to a limited partnership, such as a limited liability company, which has a manager or managing member andnon-managing members (who are like limited partners). The general partner or partners are jointly and severally responsible for the liabilities of the MLP. A Fund invests as a limited partner and normally would not be liable for the debts of an MLP beyond the amount the Fund has invested therein but it would not be shielded to the same extent that a shareholder of a corporation would be. In certain instances, creditors of an MLP would have the right to seek a return of capital that had been distributed to a limited partner. The right of an MLP’s creditors would continue even after a Fund had sold its investment in the partnership. MLPs typically invest in real estate and oil and gas equipment leasing assets, but they also finance entertainment, research and development, and other projects.
Real Estate Investment Trusts
The Funds may own shares of real estate investment trusts (“REITs”) which report information on the source of their distributions annually. The Fundsre-characterize distributions received from REIT investments based on information provided by the REITs into the following categories: ordinary income, long-term capital gains, and return of capital. If information is not available on a timely basis from the REITs, there-characterization will be estimated based on available information, which may include the previous year allocation. If new or additional information becomes available from the REITs at a later date, are-characterization will be made the following year.
49
American Beacon FundsSM
Notes to Financial Statements
October 31, 2019
U.S. Government Agency Securities
U.S. Government agency securities are issued or guaranteed by the U.S. Government or its agencies or instrumentalities. Some obligations issued by U.S. Government agencies and instrumentalities are supported by the full faith and credit of the U.S. Treasury; others by the right of the issuer to borrow from the U.S. Treasury; others by discretionary authority of the U.S. Government to purchase certain obligations of the agency or instrumentality; and others only by the credit of the agency or instrumentality. U.S. Government securities bear fixed, floating or variable rates of interest. While the U.S. Government currently provides financial support to certain U.S. Government-sponsored agencies or instrumentalities, no assurance can be given that it will always do so, since it is not so obligated by law. U.S. Government securities include U.S. Treasury bills, notes and bonds, Federal Home Loan Bank (“FHLB”) obligations, Federal Farm Credit Bank (“FFCB”) obligations, U.S. Government agency obligations and repurchase agreements secured thereby. U.S. Government agency securities are subject to credit risk and interest rate risk.
U.S. Treasury Obligations
U.S. Treasury obligations include bills (initial maturities of one year or less), notes (initial maturities between two and ten years), and bonds (initial maturities over ten years) issued by the U.S. Treasury, Separately Traded Registered Interest and Principal component parts of such obligations (known as “STRIPS”) and inflation-indexed securities. The prices of these securities (like all debt securities) change between issuance and maturity in response to fluctuating market interest rates. U.S. Treasury obligations are subject to credit risk and interest rate risk.
Variable or Floating Rate Obligations
The interest rates payable on certainfixed-income securities in which the Balanced Fund may invest are not fixed and may fluctuate based upon changes in market rates. A variable rate obligation has an interest rate which is adjusted at predesignated periods in response to changes in the market rate of interest on which the interest rate is based. Variable and floating rate obligations are less effective than fixed rate instruments at locking in a particular yield. Nevertheless, such obligations may fluctuate in value in response to interest rate changes if there is a delay between changes in market interest rates and the interest reset date for the obligation, or for other reasons.
5. Financial Derivative Instruments
The Funds may utilize derivative instruments to gain market exposure on cash balances or reduce market exposure in anticipation of liquidity needs. When considering the Funds’ use of derivatives, it is important to note that the Funds do not use derivatives for the purpose of creating financial leverage.
Futures Contracts
Futures contracts are contracts to buy or sell a standard quantity of securities at a specified price on a future date. The Funds may enter into financial futures contracts as a method for keeping assets readily convertible to cash if needed to meet shareholder redemptions or for other needs while maintaining exposure to the stock or bond market, as applicable. The primary risks associated with the use of futures contracts are the possibility of illiquid markets or imperfect correlation between the values of the contracts and the underlying securities or that the counterparty will fail to perform its obligations.
Upon entering into a futures contract, the Funds are required to set aside or deposit with a broker an amount, termed the initial margin, which typically represents a portion of the face value of the futures contract. The Funds usually reflects this amount on the Schedules of Investments as a U.S. Treasury Bill held as collateral for futures contracts or as cash deposited with broker on the Statements of Assets and Liabilities. Payments to and from the
50
American Beacon FundsSM
Notes to Financial Statements
October 31, 2019
broker, known as variation margin, are required to be made on a daily basis as the price of the futures contract fluctuates. Changes in initial settlement values are accounted for as unrealized appreciation (depreciation) until the contracts are terminated, at which time realized gains and losses are recognized. Futures contracts are valued at the most recent settlement price established each day by the exchange on which they are traded.
During the year ended October 31, 2019, the Funds entered into futures contracts primarily for exposing cash to markets.
The Funds’ average futures contracts outstanding fluctuate throughout the operating year as required to meet strategic requirements. The following table illustrates the average quarterly volume of futures contracts. For the purpose of this disclosure, volume is measured by contracts outstanding at each quarter end.
Average Futures Contracts Outstanding | ||||
Fund | Year Ended October 31, 2019 | |||
Balanced | 25 | |||
Mid-Cap Value | 79 | |||
The following is a summary of the fair valuations of the Funds’ derivative instruments categorized by risk exposure(1):
Balanced Fund
| Fair values of financial instruments on the Statements of Assets and Liabilities as of October 31, 2019: |
| ||||||||||||||||||||||||||||||||||||||||||||||||||||||
| Derivatives not accounted for as hedging instruments | |||||||||||||||||||||||||||||||||||||||||||||||||||||||
Assets: | Credit contracts | Foreign exchange contracts | Commodity contracts | Interest rate contracts | Equity contracts | Total | |||||||||||||||||||||||||||||||||||||||||||||||||
| Receivable for variation margin from open futures contracts(2) | $ | - | $ | - | $ | - | $ | - | $ | 23,883 | $ | 23,883 | |||||||||||||||||||||||||||||||||||||||||||
| The effect of financial derivative instruments on the Statements of Operations as of October 31, 2019: |
| ||||||||||||||||||||||||||||||||||||||||||||||||||||||
| Derivatives not accounted for as hedging instruments | |||||||||||||||||||||||||||||||||||||||||||||||||||||||
Realized gain (loss) from derivatives | Credit contracts | Foreign exchange contracts | Commodity contracts | Interest rate contracts | Equity contracts | Total | |||||||||||||||||||||||||||||||||||||||||||||||||
| Futures contracts | $ | - | $ | - | $ | - | $ | - | $ | (282,052 | ) | $ | (282,052 | ) | |||||||||||||||||||||||||||||||||||||||||
Net change in unrealized appreciation | Credit contracts | Foreign exchange contracts | Commodity contracts | Interest rate contracts | Equity contracts | Total | |||||||||||||||||||||||||||||||||||||||||||||||||
| Futures contracts | $ | - | $ | - | $ | - | $ | - | $ | 264,711 | $ | 264,711 | |||||||||||||||||||||||||||||||||||||||||||
Mid-Cap Value Fund
| Fair values of financial instruments on the Statements of Assets and Liabilities as of October 31, 2019: |
| ||||||||||||||||||||||||||||||||||||||||||||||||||||||
| Derivatives not accounted for as hedging instruments | |||||||||||||||||||||||||||||||||||||||||||||||||||||||
Assets: | Credit contracts | Foreign exchange contracts | Commodity contracts | Interest rate contracts | Equity contracts | Total | |||||||||||||||||||||||||||||||||||||||||||||||||
| Receivable for variation margin from open futures contracts(2) | $ | - | $ | - | $ | - | $ | - | $ | 83,789 | $ | 83,789 | |||||||||||||||||||||||||||||||||||||||||||
51
American Beacon FundsSM
Notes to Financial Statements
October 31, 2019
| The effect of financial derivative instruments on the Statements of Operations as of October 31, 2019: |
| ||||||||||||||||||||||||||||||||||||||||||||||||||||||
| Derivatives not accounted for as hedging instruments | |||||||||||||||||||||||||||||||||||||||||||||||||||||||
Realized gain (loss) from derivatives | Credit contracts | Foreign exchange contracts | Commodity contracts | Interest rate contracts | Equity contracts | Total | |||||||||||||||||||||||||||||||||||||||||||||||||
| Futures contracts | $ | - | $ | - | $ | - | $ | - | $ | 903,027 | $ | 903,027 | |||||||||||||||||||||||||||||||||||||||||||
Net change in unrealized appreciation | Credit contracts | Foreign exchange contracts | Commodity contracts | Interest rate contracts | Equity contracts | Total | |||||||||||||||||||||||||||||||||||||||||||||||||
| Futures contracts | $ | - | $ | - | $ | - | $ | - | $ | 1,531,334 | $ | 1,531,334 | |||||||||||||||||||||||||||||||||||||||||||
(1)See Note 3 in the Notes to Financial Statements for additional information.
(2)Includes cumulative appreciation (depreciation) of futures contracts as reported in the Fund’s Schedule of Investments footnotes. Only current day’s variation margin is reported within the Statements of Assets and Liabilities.
Offsetting Assets and Liabilities
The Funds are parties to enforceable master netting agreements between brokers and counterparties which provide for the right to offset under certain circumstances. The Funds employ multiple money managers and counterparties and have elected not to offset qualifying financial and derivative instruments on the Statements of Assets and Liabilities, as such all financial and derivative instruments are presented on a gross basis. The impacts of netting arrangements that provide the right to offset are detailed below. The net amount represents the net receivable or payable that would be due from or to the counterparty in the event of default. Exposure from borrowings and other financing agreements such as repurchase agreements can only be netted across transactions governed by the same Master Agreement with the same legal entity. All amounts reported below represent the balance as of the report date, October 31, 2019.
Balanced Fund
| Offsetting of Financial and Derivative Assets as of October 31, 2019: | ||||||||||||
| Assets | Liabilities | |||||||||||
| Futures Contracts(1) | $ | 23,883 | $ | - | ||||||||
|
|
|
| |||||||||
| Total derivative assets and liabilities in the Statement of Assets and Liabilities | $ | 23,883 | $ | - | ||||||||
|
|
|
| |||||||||
| Derivatives not subject to a Master Netting Agreement or similar agreement (“MNA”) | $ | (23,883 | ) | $ | - | |||||||
|
|
|
| |||||||||
(1) Includes cumulative appreciation or (depreciation) of futures contracts as reported in the Schedule of Investments footnotes. Only current day’s variation margin is reported within the Statements of Assets and Liabilities.
Mid-Cap Value Fund
| Offsetting of Financial and Derivative Assets as of October 31, 2019: | ||||||||||||
| Assets | Liabilities | |||||||||||
| Futures Contracts(1) | $ | 83,789 | $ | - | ||||||||
|
|
|
| |||||||||
| Total derivative assets and liabilities in the Statement of Assets and Liabilities | $ | 83,789 | $ | - | ||||||||
|
|
|
| |||||||||
| Derivatives not subject to a Master Netting Agreement or similar agreement (“MNA”) | $ | (83,789 | ) | $ | - | |||||||
|
|
|
| |||||||||
| Remaining Contractual Maturity of the Agreements As of October 31, 2019 | ||||||||||||||||||||||||||||||||||||
| Overnight and Continuous | <30 days | Between 30 & 90 days | >90 days | Total | ||||||||||||||||||||||||||||||||
Securities Lending Transactions | ||||||||||||||||||||||||||||||||||||
Common Stocks | $ | 1,233,330 | $ | - | $ | - | $ | - | $ | 1,233,330 | ||||||||||||||||||||||||||
|
|
|
|
|
|
|
|
|
| |||||||||||||||||||||||||||
Total Borrowings | $ | 1,233,330 | $ | - | $ | - | $ | - | $ | 1,233,330 | ||||||||||||||||||||||||||
|
|
|
|
|
|
|
|
|
| |||||||||||||||||||||||||||
Gross amount of recognized liabilities for securities lending transactions |
| $ | 1,233,330 | |||||||||||||||||||||||||||||||||
|
| |||||||||||||||||||||||||||||||||||
(1) Includes cumulative appreciation or (depreciation) of futures contracts as reported in the Schedule of Investments footnotes. Only current day’s variation margin is reported within the Statements of Assets and Liabilities.
52
American Beacon FundsSM
Notes to Financial Statements
October 31, 2019
6. Principal Risks
Investing in the Funds may involve certain risks including, but not limited to, those described below.
Asset-Backed and Mortgage Related Securities Risk
Investments in asset-backed and mortgage related securities are subject to market risks for fixed-income securities which include, but are not limited to, interest rate risk, prepayment risk and extension risk. Small movements in interest rates (both increases and decreases) may quickly and significantly reduce the value of certain MBS and ABS securities. If interest rates fall, the rate of prepayments tends to increase as borrowers are motivated to pay off debt and refinance at new lower rates. When mortgages and other obligations are prepaid and when securities are called, a Fund may have to reinvest in securities with a lower yield or fail to recover additional amounts (i.e., premiums) paid for securities with higher interest rates, resulting in an unexpected capital loss and/or a decrease in the amount of dividends and yield. Because prepayments increase when interest rates fall, the prices of MBS and ABS do not increase as much as other fixed income securities when interest rates fall. When interest rates rise, borrowers are less likely to prepay their mortgage and other loans. A decreased rate of prepayments lengthens the expected maturity of MBS and ABS. Therefore, the prices of MBS and ABS may decrease more than prices of other fixed-income securities when interest rates rise. Rising interest rates tend to extend the duration of these securities, making them more sensitive to changes in interest rates. Rising interest rates also may increase the risk of default by borrowers. As a result, in a period of rising interest rates, a Fund that holds these types of securities, may experience additional volatility and losses. A decline in the credit quality of and defaults by the issuers of asset-backed and mortgage related securities or instability in the markets for such securities may affect the value and liquidity of such securities, which could result in losses to a Fund. In addition, certain asset-backed and mortgage related securities may include securities backed by pools of loans made to “subprime” borrowers or borrowers with blemished credit histories; the risk of defaults is generally higher in the case of mortgage pools that include such subprime mortgages.
Credit Risk
The Funds are subject to the risk that the issuer or guarantor of a debt security, or the counterparty to a derivatives contract or a loan, will fail to make timely payment of interest or principal or otherwise honor its obligations or default completely. A decline in the credit rating of an individual security held by the Funds may have an adverse impact on its price and make it difficult for the Funds to sell it. Ratings represent a rating agency’s opinion regarding the quality of the security and are not a guarantee of quality. Rating agencies might not always change their credit rating on an issuer or security in a timely manner to reflect events that could affect the issuer’s ability to make timely payments on its obligations. Credit risk is typically greater for securities with ratings that are below investment grade.
Equity Investments Risk
Equity securities are subject to market risk. The Funds’ investments in equity securities may include common stocks, preferred stocks, securities convertible into or exchangeable for common stocks, REITs, depositary receipts, and U.S. dollar-denominated foreign stocks traded on U.S. exchanges. Such investments may expose the Funds to additional risk. The value of a company’s common stock may fall as a result of factors affecting the company, companies in the same industry or sector, or the financial markets overall. Common stock generally is subordinate to preferred stock upon the liquidation or bankruptcy of the issuing company. Preferred stocks and convertible securities are sensitive to movements in interest rates. Preferred stocks may be less liquid than common stocks and, unlike common stocks, participation in the growth of an issuer may be limited. Distributions on preferred stocks generally are payable at the discretion of an issuer and after required payments to bond holders. Convertible securities are subject to the risk that the credit standing of the issuer may have an effect on the convertible securities’ investment value. Investments in REITs are subject to the risks associated with investing in the real estate industry such as adverse developments affecting the real estate industry and real property
53
American Beacon FundsSM
Notes to Financial Statements
October 31, 2019
values. Depositary receipts and U.S.dollar-denominated foreign stocks traded on U.S. exchanges are subject to certain of the risks associated with investing directly in foreign securities, including, but not limited to, currency fluctuations and political and financial instability in the home country of a particular depositary receipt or foreign stock.
Foreign Investing and Emerging Markets Risk
Non-U.S. investments carry potential risks not associated with U.S. investments. Such risks include, but are not limited to: (1) currency exchange rate fluctuations, (2) political and financial instability, (3) less liquidity, (4) lack of uniform accounting, auditing and financial reporting standards, (5) increased price volatility, (6) less government regulation and supervision of foreign stock exchanges, brokers and listed companies, and (7) delays in transaction settlement in some foreign markets. To the extent the Funds invest a significant portion of its assets in securities of a single country or region, it is more likely to be affected by events or conditions of that country or region. In addition, the economies and political environments of emerging market countries tend to be more unstable than those of developed countries, resulting in more volatile rates of return than the developed markets and substantially greater risk to investors. There may be very limited oversight of certain foreign banks or securities depositories that hold foreign securities and currency and the laws of certain countries may limit the ability to recover such assets if a foreign bank or depository or their agents goes bankrupt. When investing in emerging markets, the risks of investing in foreign securities are heightened. Emerging markets have unique risks that are greater than, or in addition to, investing in developed markets because emerging markets are generally smaller, less developed, less liquid and more volatile than the securities markets of the U.S. and other developed markets. There are also risks of: greater political uncertainties; an economy’s dependence on revenues from particular commodities or on international aid or development assistance; currency transfer restrictions; a limited number of potential buyers for such securities, resulting in increased volatility and limited liquidity for emerging market securities; trading suspensions; and delays and disruptions in securities settlement procedures. In addition, there may be less information available to make investment decisions and more volatile rates of return.
Futures Contracts Risk
Futures contracts are derivative instruments where one party pays a fixed price for an agreed amount of securities or other underlying assets at an agreed date. The use of such derivative instruments may expose the Funds to additional risks that they would not be subject to if they invested directly in the securities underlying those derivatives. Futures contracts may experience potentially dramatic price changes (losses) and imperfect correlation between the price of the contract and the underlying security or index, which will increase the volatility of the Funds and may involve a small investment of cash (the amount of initial and variation margin) relative to the magnitude of the risk assumed (the potential increase or decrease in the price of the futures contract).
Illiquid and Restricted Securities Risk
Securities not registered in the U.S. under the Securities Act, including Rule 144A securities, are restricted as to their resale. Such securities may not be listed on an exchange and may have no active trading market. They may be more difficult to purchase or sell at an advantageous time or price because such securities may not be readily marketable in broad public markets. The Funds may not be able to sell a restricted security when thesub-advisor considers it desirable to do so and/or may have to sell the security at a lower price than the Funds believe is its fair market value. In addition, transaction costs may be higher for restricted securities and the Funds may receive only limited information regarding the issuer of a restricted security. The Funds may have to bear the expense of registering restricted securities for resale and the risk of substantial delays in effecting the registration.
Interest Rate Risk
Investments in fixed-income securities or derivatives that are influenced by interest rates are subject to interest rate risk. The value of the Funds’ fixed-income investments typically will fall when interest rates rise. The Funds may be particularly sensitive to changes in interest rates if it invests in debt securities with intermediate and
54
American Beacon FundsSM
Notes to Financial Statements
October 31, 2019
long terms to maturity. Debt securities with longer durations tend to be more sensitive to changes in interest rates, usually making them more volatile than debt securities with shorter durations. For example, if a bond has a duration of seven years, a 1% increase in interest rates could be expected to result in a 7% decrease in the value of the bond. Yields of debt securities will fluctuate over time. Following the financial crisis that started in 2008, the Federal Reserve has attempted to stabilize the economy and support the economic recovery by keeping the federal funds rate (the interest rate at which depository institutions lend reserve balances to each other overnight) at or near zero percent. The Federal Reserve has raised the federal funds rate several times since December 2015 and may continue to increase or decrease rates in the future. Interest rates may rise significantly and/or rapidly, potentially resulting in substantial losses to the Funds. During periods of very low or negative interest rates, the Funds may be unable to maintain positive returns. Certain European countries and Japan have recently experienced negative interest rates on deposits and debt securities have traded at negative yields. Negative interest rates may become more prevalent amongnon-U.S. issuers, and potentially within the United States. Changing interest rates, including rates that fall below zero, may have unpredictable effects on markets, may result in heightened market volatility and may detract from Fund performance to the extent the Funds are exposed to such interest rates.
Liquidity Risk
When there is little or no active trading market for a specific type of security, it can become more difficult to purchase or sell the securities at or near their perceived value. During such periods, certain investments held by the Funds may be difficult to sell or other investments may be difficult to purchase at favorable times or prices. As a result, the Fund may have to lower the price on certain securities that it is trying to sell, sell other securities instead or forgo an investment opportunity, any of which could have a negative effect on Fund management or performance. Additionally, the market for certain investments may become illiquid under adverse market or economic conditions independent of any specific adverse changes in the conditions of a particular issuer.
Market Risk
Conditions in the U.S. and many foreign economies have resulted, and may continue to result, in certain instruments experiencing unusual liquidity issues, increased price volatility and, in some cases, credit downgrades and increased likelihood of default. These events have reduced the willingness and ability of some lenders to extend credit, and have made it more difficult for some borrowers to obtain financing on attractive terms, if at all. In some cases, traditional market participants have been less willing to make a market in some types of debt instruments, which has affected the liquidity of those instruments. During times of market turmoil, investors tend to look to the safety of securities issued or backed by the U.S. Treasury, causing the prices of these securities to rise and the yields to decline. Reduced liquidity in fixed income and credit markets may negatively affect many issuers worldwide. In addition, global economies and financial markets are becoming increasingly interconnected, which increases the possibilities that conditions in one country or region might adversely impact issuers in a different country or region. A rise in protectionist trade policies, and the possibility of changes to some international trade agreements, could affect the economies of many nations, including the United States, in ways that cannot necessarily be foreseen at the present time.
In response to the financial crisis, the U.S. and other governments and the Federal Reserve and certain foreign central banks have taken steps to support financial markets. In some countries where economic conditions are recovering, they are nevertheless perceived as still fragile. Withdrawal of government support, failure of efforts in response to the crisis, or investor perception that such efforts are not succeeding, could adversely impact the value and liquidity of certain securities. The severity or duration of adverse economic conditions may also be affected by policy changes made by governments or quasi-governmental organizations, including changes in tax laws. The impact of new financial regulation legislation on the markets and the practical implications for market participants may not be fully known for some time. Regulatory changes are causing some financial services companies to exit long-standing lines of business, resulting in dislocations for other market participants. In addition, political and governmental events within the U.S. and abroad, such as the United States government’s
55
American Beacon FundsSM
Notes to Financial Statements
October 31, 2019
inability at times to agree on a long-term budget and deficit reduction plan, the threat of a federal government shutdown and threats not to increase the federal government’s debt limit, may affect investor and consumer confidence and may adversely impact financial markets and the broader economy, perhaps suddenly and to a significant degree. The U.S. government has reduced the federal corporate income tax rates, and future legislative, regulatory and policy changes may result in more restrictions on international trade, less stringent prudential regulation of certain players in the financial markets, and significant new investments in infrastructure and national defense. Markets may react strongly to expectations about the changes in these policies, which could increase volatility, especially if the markets’ expectations for changes in government policies are not borne out.
Changes in market conditions will not have the same impact on all types of securities. Interest rates have been unusually low in recent years in the United States and abroad. Because there is little precedent for this situation, it is difficult to predict the impact of a significant rate increase on various markets. For example, because investors may buy securities or other investments with borrowed money, a significant increase in interest rates may cause a decline in the markets for those investments. Because of the sharp decline in the worldwide price of oil, there is a concern that oil producing nations may withdraw significant assets now held in U.S. Treasuries, which could force a substantial increase in interest rates. Regulators have expressed concern that rate increases may cause investors to sell fixed income securities faster than the market can absorb them, contributing to price volatility. In addition, there is a risk that the prices of goods and services in the U.S. and many foreign economies may decline over time, known as deflation (the opposite of inflation). Deflation may have an adverse effect on stock prices and creditworthiness and may make defaults on debt more likely. If a country’s economy slips into a deflationary pattern, it could last for a prolonged period and may be difficult to reverse.
The precise timing and the resulting impact of the United Kingdom’s departure from the European Union (the “EU”), commonly referred to as “Brexit,” are not yet known. The effect on the United Kingdom’s economy will likely depend on the nature of trade relations with the EU and other major economies following its exit, which are matters to be negotiated. The outcomes may cause increased volatility and have a significant adverse impact on world financial markets, other international trade agreements, and the United Kingdom and European economies, as well as the broader global economy for some time, which could significantly adversely affect the value of the Fund’s investments in the United Kingdom and Europe.
Mortgage-Backed and Mortgage Related Securities Risk
Investments in mortgage-backed and mortgage-related securities are subject to market risks for fixed-income securities which include, but are not limited to, interest rate risk, credit risk, extension risk and prepayment risk. When mortgages and other obligations are prepaid and when securities are called, a Fund may have to reinvest in securities with a lower yield or fail to recover additional amounts (i.e., premiums) paid for securities with higher interest rates, resulting in an unexpected capital loss and/or a decrease in the amount of dividends and yield.
MultipleSub-Advisor Risk
The Manager may allocate the Funds’ assets among multiplesub-advisors, each of which is responsible for investing its allocated portion of the Funds’ assets. To a significant extent, the Funds’ performance will depend on the success of the Manager in allocating the Funds’ assets tosub-advisors and its selection and oversight of thesub-advisors. Because eachsub-advisor manages its allocated portion of the Funds independently from anothersub-advisor, the same security may be held in different portions of the Funds, or may be acquired for one portion of the Funds at a time when asub-advisor to another portion deems it appropriate to dispose of the security from that other portion, resulting in higher expenses without accomplishing any net result in the Funds’ holdings. Similarly, under some market conditions, onesub-advisor may believe that temporary, defensive investments in short-term instruments or cash are appropriate when anothersub-advisor believes continued exposure to the equity or debt markets is appropriate for its allocated portion of the Funds. Because eachsub-advisor directs the trading for its own portion of the Funds, and does not aggregate its transactions with those of the othersub-advisors, the Funds may incur higher brokerage costs than would be the case if a singlesub-adviser were
56
American Beacon FundsSM
Notes to Financial Statements
October 31, 2019
managing the entire Fund. In addition, while the Manager seeks to allocate the Funds’ assets among the Funds’sub-advisors in a manner that it believes is consistent with achieving the Funds’ investment objective(s), the Manager may be subject to potential conflicts of interest in allocating the Funds’ assets amongsub-advisors, due to factors that could impact the Manager’s revenues and profits.
Other Investment Companies Risk
The Funds may invest in shares of other registered investment companies, including money market funds. To the extent that the Funds invest in shares of other registered investment companies, the Funds will indirectly bear the fees and expenses, including for example advisory and administrative fees charged by those investment companies in addition to the Funds’ direct fees and expenses and will be subject to the risks associated with investments in those companies. For example, the Funds’ investments in money market funds are subject to interest rate risk, credit risk, and market risk. The Funds must rely on the investment company in which it invests to achieve its investment objective. If the investment company fails to achieve its investment objective, the value of the Funds’ investment will decline, adversely affecting the Funds’ performance. To the extent the Funds invest in other investment companies that invest in equity securities, fixed income securities and/or foreign securities, or track an index, the Funds are subject to the risks associated with the underlying investments held by the investment company or the index fluctuations to which the investment company is subject.
Prepayment and Extension Risk
When interest rates fall, borrowers will generally repay the loans that underlie certain debt securities, especially mortgage-related and other types of asset-backed securities, more quickly than expected, causing the issuer of the security to repay the principal prior to the security’s expected maturity date. The Fund may need to reinvest the proceeds at a lower interest rate, reducing its income. Securities subject to prepayment risk generally offer less potential for gains when prevailing interest rates fall. If the Fund buys those securities at a premium, accelerated prepayments on those securities could cause the Fund to lose a portion of its principal investment. The impact of prepayments on the price of a security may be difficult to predict and may increase the security’s price volatility.
Redemption Risk
The Funds may experience periods of heavy redemptions that could cause the Funds to sell assets at inopportune times or at a loss or depressed value. Redemption risk is greater to the extent that one or more investors or intermediaries control a large percentage of investments in the Funds, have short investment horizons, or have unpredictable cash flow needs. A general rise in interest rates has the potential to cause investors to move out of fixed-income securities on a large scale, which may increase redemptions from mutual funds that hold large amounts of fixed-income securities. This, coupled with a reduction in the ability or willingness of dealers and other institutional investors to buy or hold fixed-income securities, may result in decreased liquidity and increased volatility in the fixed-income markets, and heightened redemption risk. Heavy redemptions, whether by a few large investors or many smaller investors, could hurt the Funds’ performance. This risk is heightened if the Fund invests in emerging market securities, which are generally less liquid than the securities of U.S. and other developed markets. The sale of assets to meet redemption requests may create net capital gains or losses, which could cause the Funds to have to distribute substantial capital gains.
Sector Risk
Sector risk is the risk associated with a Fund holding a significant amount of investments in similar businesses, which would be similarly affected by particular economic or market events, which may, in certain circumstances, cause the value of the equity and debt securities of companies in a particular sector of the market to change. To the extent a Fund has substantial holdings within a particular sector, the risks to a Fund associated with that sector increase.
57
American Beacon FundsSM
Notes to Financial Statements
October 31, 2019
To the extent a Fund invests significantly in the financial services sector, the value of the Fund’s shares may be particularly vulnerable to factors affecting that sector, such as the availability and cost of capital funds, changes in interest rates, the rate of corporate and consumer debt defaults, extensive government regulation and price competition. The value of a Fund’s shares could experience significantly greater volatility than investment companies investing more broadly.
Securities Lending Risk
A Fund may lend its portfolio securities to brokers, dealers and financial institutions to seek income. There is a risk that a borrower may default on its obligations to return loaned securities; however, a Fund’s securities lending agent indemnifies the Fund against that risk. There is a risk that the assets of a Fund’s securities lending agent may be insufficient to satisfy any contractual indemnification requirements to the Fund. Borrowers of a Fund’s securities typically provide collateral in the form of cash that is reinvested in securities. A Fund will be responsible for the risks associated with the investment of cash collateral, including any collateral invested in an affiliated money market fund. A Fund may lose money on its investment of cash collateral or may fail to earn sufficient income on its investment to meet obligations to the borrower. In addition, delays may occur in the recovery of securities from borrowers, which could interfere with a Fund’s ability to vote proxies or to settle transactions and there is the risk of possible loss of rights in the collateral should the borrower fail financially. In any case in which the loaned securities are not returned to the Fund before anex-dividend date, the payment in lieu of the dividend that the Fund receives from the securities’ borrower would not be treated as a dividend for federal income tax purposes and thus would not qualify for treatment as “qualified dividend income”.
U.S. Government Securities and Government-Sponsored Enterprises Risk
A security backed by the U.S. Treasury or the full faith and credit of the United States is guaranteed only as to the timely payment of interest and principal when held to maturity. The market prices for such securities are not guaranteed and will fluctuate. Additionally, circumstances could arise that would prevent the payment of interest or principal. This could result in losses to the Fund. Investments in government-sponsored enterprises are debt obligations issued by agencies and instrumentalities of the U.S. Government. These obligations vary in the level of support they receive from the U.S. Government. They may be: (i) supported by the full faith and credit of the U.S. Treasury, such as those of the Government National Mortgage Association (‘‘Ginnie Mae’’); (ii) supported by the right of the issuer to borrow from the U.S. Treasury, such as those of the Federal Home Loan Bank and the Federal Farm Credit Banks; (iii) supported by the discretionary authority of the U.S. Government to purchase the agency obligations, such as those of Fannie Mae and Freddie Mac or (iv) supported only by the credit of the issuer, such as those of the Federal Farm Credit Bureau. The U.S. Government may choose not to provide financial support to U.S. Government-sponsored agencies or instrumentalities if it is not legally obligated to do so, in which case, if the issuer defaulted, to the extent the Funds holds securities of such issuers, it might not be able to recover its investment from the U.S. Government.
7. Federal Income and Excise Taxes
It is the policy of each Fund to qualify as a regulated investment company (“RIC”), by complying with all applicable provisions of Subchapter M of the Internal Revenue Code, as amended, and to make distributions of taxable income sufficient to relieve it from substantially all federal income and excise taxes. For federal income tax purposes, each Fund is treated as a single entity for the purpose of determining such qualification.
The Funds do not have any unrecorded tax liabilities in the accompanying financial statements. Each of the tax years in the four year period ended October 31, 2019 remain subject to examination by the Internal Revenue Service. If applicable, the Funds recognize interest accrued related to unrecognized tax benefits in interest expense and penalties in “Other expenses” on the Statements of Operations.
58
American Beacon FundsSM
Notes to Financial Statements
October 31, 2019
The Funds may be subject to taxes imposed by countries in which it invests. Such taxes are generally based on returns of income earned or gains realized or repatriated. Taxes are accrued and applied to net investment income, net realized capital gains and net unrealized appreciation (depreciation), as applicable, as the income is earned or capital gains are recorded.
Dividends are categorized in accordance with income tax regulations which may treat certain transactions differently than U.S. GAAP. Accordingly, the character of distributions and composition of net assets for tax purposes may differ from those reflected in the accompanying financial statements.
The tax character of distributions paid were as follows:
| Balanced Fund | Mid-Cap Value Fund | |||||||||||||||||||||||||||
| Year Ended October 31, 2019 | Year Ended October 31, 2018 | Year Ended October 31, 2019 | Year Ended October 31, 2018 | |||||||||||||||||||||||||
Distributions paid from: | ||||||||||||||||||||||||||||
Ordinary income* | ||||||||||||||||||||||||||||
Institutional Class | $ | 1,032,845 | $ | 3,590,211 | $ | 3,461,026 | $ | 2,517,255 | ||||||||||||||||||||
Y Class | 1,191,905 | 2,835,075 | 1,228,142 | 867,845 | ||||||||||||||||||||||||
Investor Class | 2,000,977 | 5,484,303 | 4,048,812 | 2,066,989 | ||||||||||||||||||||||||
Advisor Class | 106,216 | 404,894 | 27,459 | 5,325 | ||||||||||||||||||||||||
A Class | 329,762 | 990,798 | 108,815 | 59,166 | ||||||||||||||||||||||||
C Class | 447,883 | 1,588,575 | 11,735 | - | ||||||||||||||||||||||||
R6 Class | - | - | 2,691 | - | ||||||||||||||||||||||||
Long-term capital gains | ||||||||||||||||||||||||||||
Institutional Class | 3,969,052 | 2,671,741 | | 12,688,768 | | 6,917,398 | ||||||||||||||||||||||
Y Class | 4,687,263 | 1,986,952 | 4,778,008 | 2,579,185 | ||||||||||||||||||||||||
Investor Class | 7,902,020 | 4,156,521 | 18,693,184 | 7,195,645 | ||||||||||||||||||||||||
Advisor Class | 430,864 | 356,680 | 171,300 | 89,403 | ||||||||||||||||||||||||
A Class | 1,306,565 | 727,858 | 603,423 | 374,971 | ||||||||||||||||||||||||
C Class | 2,617,867 | 1,388,117 | 302,234 | 184,144 | ||||||||||||||||||||||||
R6 Class | - | - | 9,845 | - | ||||||||||||||||||||||||
|
|
|
|
|
|
|
| |||||||||||||||||||||
Total distributions paid | $ | 26,023,219 | $ | 26,181,725 | $ | 46,135,442 | $ | 22,857,326 | ||||||||||||||||||||
|
|
|
|
|
|
|
| |||||||||||||||||||||
* For tax purposes, short-term gains are considered ordinary income distributions.
As of October 31, 2019 the components of distributable earnings (deficits) on a tax basis were as follows:
Fund | Tax Cost | Unrealized Appreciation | Unrealized (Depreciation) | Net Unrealized Appreciation (Depreciation) | ||||||||||||
| Balanced | $ | 223,663,111 | $ | 40,402,798 | $ | (8,060,248 | ) | $ | 32,342,550 | |||||||
| Mid-Cap Value | 453,297,404 | 89,194,286 | (45,766,752 | ) | 43,427,534 | |||||||||||
Fund | Net Unrealized Appreciation (Depreciation) | Undistributed Ordinary Income | Undistributed Long-Term Capital Gains | Accumulated Capital and Other (Losses) | Other Temporary Differences | Distributable Earnings | ||||||||||||||||||
Balanced | $ | 32,342,550 | $ | 6,450,866 | $ | 15,454,073 | $ | - | $ | - | $ | 54,247,489 | ||||||||||||
Mid-Cap Value | 43,427,534 | 4,826,801 | - | (18,737,756 | ) | - | 29,516,579 | |||||||||||||||||
Financial reporting records are adjusted for permanent book/tax differences to reflect tax character. Financial records are not adjusted for temporary differences. The temporary differences between financial reporting andtax-basis reporting of unrealized appreciation (depreciation) are attributable primarily to the tax deferral of losses from wash sales, the realization for tax purposes of unrealized gains (losses) on certain derivative instruments, reclassifications of income from investments in real estate investment securities and publicly traded partnerships, and book amortization of premiums.
59
American Beacon FundsSM
Notes to Financial Statements
October 31, 2019
Due to inherent differences in the recognition of income, expenses, and realized gains (losses) under U.S. GAAP and federal income tax regulations, permanent differences between book and tax reporting have been identified and appropriately reclassified on the Statements of Assets and Liabilities.
Accordingly, the following amounts represent current year permanent differences derived fromtax-exempt interest and nondeductible expenses from investments in publicly traded partnerships as of October 31, 2019:
Fund | Paid-In-Capital |
| Distributable Earnings/(Deficits) | |||||||||
Balanced | $ | (65,537 | ) | $ | 65,537 | |||||||
Mid-Cap Value | (8,452 | ) | 8,452 | |||||||||
Under the Regulated Investment Company Modernization Act of 2010 (“RIC MOD”), net capital losses recognized by the Funds in taxable years beginning after December 22, 2010 are carried forward indefinitely and retain their character as short-term and/or long-term losses.
As of October 31, 2019, the Funds had the following capital loss carryforwards:
Fund | Short-Term Capital Loss Carryforwards | Long-Term Capital Loss Carryforwards | ||||||
Balanced | $ | - | $ | - | ||||
Mid-Cap Value | 18,737,756 | - | ||||||
8. Investment Transactions
The aggregate cost of purchases and proceeds from sales and maturities of investments, other than short-term obligations, for the year ended October 31, 2019 were as follows:
Fund | Purchases (non-U.S. Government Securities) | Purchases of U.S. Government Securities | Sales (non-U.S. Government Securities) | Sales of U.S. Government Securities | ||||||||||||
Balanced | $ | 54,965,973 | $ | 128,462,907 | $ | 104,053,998 | $ | 131,544,136 | ||||||||
Mid-Cap Value | 172,646,736 | - | 444,404,458 | - | ||||||||||||
A summary of the Funds’ transactions in the USG Select Fund for the year ended October 31, 2019 were as follows:
Fund | Type of | October 31, 2018 Shares/Fair Value | Purchases | Sales | October 31, 2019 Shares/Fair Value | Dividend Income | ||||||||||||||||||||||||||||||||||||
| Balanced | Direct | $ | 7,833,723 | $ | 144,063,630 | $ | 146,993,105 | $ | 4,904,248 | $ | 119,895 | |||||||||||||||||||||||||||||||
| Balanced | Securities Lending | 2,690,067 | 22,183,710 | 24,873,777 | - | N/A | ||||||||||||||||||||||||||||||||||||
| Mid-Cap Value | Direct | 22,792,845 | 390,037,841 | 394,771,630 | 18,059,056 | $ | 448,948 | |||||||||||||||||||||||||||||||||||
| Mid-Cap Value | Securities Lending | 12,169,943 | 80,534,797 | 91,471,410 | 1,233,330 | N/A | ||||||||||||||||||||||||||||||||||||
9. Securities Lending
The Funds may lend their securities to qualified financial institutions, such as certain broker-dealers, to earn additional income. The borrowers are required to secure their loans continuously with collateral in an amount at least equal to the fair value of the securities loaned, initially in an amount at least equal to 102% of the fair value of domestic securities loaned and 105% of the fair value of international securities loaned. Collateral is monitored andmarked-to-market daily. Dailymark-to-market amounts are required to be paid to the borrower or received
60
American Beacon FundsSM
Notes to Financial Statements
October 31, 2019
from the borrower by the end of the following business day. This one day settlement formark-to-market amounts may result in the collateral being temporarily less than the value of the securities on loan or temporarily more than the required minimum collateral.
To the extent that a loan is collateralized by cash, such cash collateral shall be invested by the securities lending agent (the “Agent”) in money market mutual funds and other short-term investments, provided the investments meet certain quality and diversification requirements. Securities purchased with cash collateral proceeds are listed in the Funds’ Schedule of Investments and the collateral is shown on the Statements of Assets and Liabilities as a payable.
Securities lending income is generated from the demand premium (if any) paid by the borrower to borrow a specific security and from the return on investment of cash collateral, reduced by negotiated rebate fees paid to the borrower and transaction costs. To the extent that a loan is secured bynon-cash collateral, securities lending income is generated as a demand premium reduced by transaction costs. The Funds, the Agent, and the Manager retained 80%, 10%, and 10%, respectively, of the income generated from securities lending.
While securities are on loan, the Funds continue to receive certain income associated with that security and any gain or loss in the market price that may occur during the term of the loan. In the case of domestic equities, the value of any dividend is received in the form of a substitute payment approximately equal to the dividend. In the case of foreign securities, a negotiated amount is received that is less than the actual dividend, but higher than the dividend amount minus the foreign tax that the Funds would be subject to on the dividend.
Securities lending transactions pose certain risks to the Funds, including that the borrower may not provide additional collateral when required or return the securities when due, that the value of the short-term investments will be less than the amount of cash collateral required to be returned to the borrower, thatnon-cash collateral may be subject to legal constraints in the event of a borrower bankruptcy, and that the cash collateral investments could become illiquid and unable to be used to return collateral to the borrower. The Funds could also experience delays and costs in gaining access to the collateral. The Funds bear the risk of any deficiency in the amount of the cash collateral available for return to the borrower and any action which impairs its ability to liquidatenon-cash collateral to satisfy a borrower default.
As of October 31, 2019, the value of outstanding securities on loan and the value of collateral were as follows:
Fund | Market Value of Securities on Loan | Cash Collateral Received | Non-Cash Collateral Received | Total Collateral Received | ||||||||||||||||||||||||
| Balanced | $ | 2,452,229 | $ | – | $ | 2,506,662 | $ | 2,506,662 | ||||||||||||||||||||
| Mid-Cap Value | 20,651,471 | 1,233,330 | 19,856,407 | 21,089,737 | ||||||||||||||||||||||||
Cash collateral is listed on the Funds’ Schedules of Investments and is shown on the Statements of Assets and Liabilities. Income earned on these investments is included in “Income derived from securities lending” on the Statements of Operations.
Non-cash collateral received by the Funds may not be sold orre-pledged except to satisfy a borrower default. Therefore,non-cash collateral is not included on the Funds’ Schedules of Investments or Statements of Assets and Liabilities.
10. Borrowing Arrangements
Effective November 15, 2018 (the “Effective Date”), the Funds, along with certain other funds managed by the Manager (“Participating Funds”), entered into a committed revolving line of credit (the “Committed Line”) agreement with State Street Bank and Trust Company (the “Bank”) to be used to facilitate portfolio liquidity. The maximum borrowing amount under the Committed Line is $250 million with interest at a rate equal to the higher of
61
American Beacon FundsSM
Notes to Financial Statements
October 31, 2019
(a) one-month London Inter-Bank Offered Rate (“LIBOR”) plus 1.25% per annum or (b) the Federal Funds rate plus 1.25% per annum on amounts borrowed. Each of the Participating Funds paid a closing fee of $100,000 on the Effective Date and a quarterly commitment fee at a rate of 0.25% per annum on the unused portion of the Committed Line amount. The Committed Line expires November 14, 2019, unless extended by the Bank or terminated by the Participating Funds in accordance with the agreement.
On the Effective Date, the Funds, along with certain other Participating Funds managed by the Manager, also entered into an uncommitted discretionary demand revolving line of credit (the “Uncommitted Line”) agreement with the Bank to be used to facilitate portfolio liquidity. The maximum borrowing amount under the Uncommitted Line is $50 million with interest at a rate equal to the higher of(a) one-month LIBOR plus 1.25% per annum or (b) the Federal Funds rate plus 1.25% per annum on each outstanding loan. Each of the Participating Funds paid a closing fee of $35,000 on the Effective Date. The Uncommitted Line expires November 14, 2019 unless extended by the Bank or terminated by the Participating Funds in accordance with the agreement.
The Participating Funds paid administration, legal and arrangement fees, which are recognized as a component of “Other expenses” on the Statements of Operations, along with commitment fees, that have been allocated among the Participating Funds based on average daily net assets.
During the year ended October 31, 2019, the Funds did not utilize this facility.
11. Capital Share Transactions
The tables below summarize the activity in capital shares for each Class of the Funds:
| Institutional Class | ||||||||||||||||||||||||||||
| Year Ended October 31, | ||||||||||||||||||||||||||||
| 2019 | 2018 | |||||||||||||||||||||||||||
Balanced Fund | Shares | Amount | Shares | Amount | ||||||||||||||||||||||||
| Shares sold | 456,844 | $ | 7,138,774 | 531,898 | $ | 8,911,974 | ||||||||||||||||||||||
| Reinvestment of dividends | 350,166 | 4,997,137 | 371,350 | 6,232,774 | ||||||||||||||||||||||||
| Shares redeemed | (1,674,089 | ) | (25,817,337 | ) | (2,279,037 | ) | (38,703,020 | ) | ||||||||||||||||||||
|
|
|
|
|
|
|
| |||||||||||||||||||||
| Net (decrease) in shares outstanding | (867,079 | ) | $ | (13,681,426 | ) | (1,375,789 | ) | $ | (23,558,272 | ) | ||||||||||||||||||
|
|
|
|
|
|
|
| |||||||||||||||||||||
| Y Class | ||||||||||||||||||||||||||||
| Year Ended October 31, | ||||||||||||||||||||||||||||
| 2019 | 2018 | |||||||||||||||||||||||||||
Balanced Fund | Shares | Amount | Shares | Amount | ||||||||||||||||||||||||
| Shares sold | 987,434 | $ | 15,397,785 | 1,548,487 | $ | 26,278,299 | ||||||||||||||||||||||
| Reinvestment of dividends | 378,979 | 5,443,121 | 262,445 | 4,429,699 | ||||||||||||||||||||||||
| Shares redeemed | (1,916,647 | ) | (29,418,048 | ) | (1,172,305 | ) | (19,896,265 | ) | ||||||||||||||||||||
|
|
|
|
|
|
|
| |||||||||||||||||||||
| Net increase (decrease) in shares outstanding | (550,234 | ) | $ | (8,577,142 | ) | 638,627 | $ | 10,811,733 | ||||||||||||||||||||
|
|
|
|
|
|
|
| |||||||||||||||||||||
| Investor Class | ||||||||||||||||||||||||||||
| Year Ended October 31, | ||||||||||||||||||||||||||||
| 2019 | 2018 | |||||||||||||||||||||||||||
Balanced Fund | Shares | Amount | Shares | Amount | ||||||||||||||||||||||||
| Shares sold | 527,105 | $ | 7,203,146 | 693,194 | $ | 10,443,570 | ||||||||||||||||||||||
| Reinvestment of dividends | 773,787 | 9,716,524 | 632,578 | 9,450,425 | ||||||||||||||||||||||||
| Shares redeemed | (2,084,851 | ) | (28,573,330 | ) | (1,856,761 | ) | (27,850,950 | ) | ||||||||||||||||||||
|
|
|
|
|
|
|
| |||||||||||||||||||||
| Net (decrease) in shares outstanding | (783,959 | ) | $ | (11,653,660 | ) | (530,989 | ) | $ | (7,956,955 | ) | ||||||||||||||||||
|
|
|
|
|
|
|
| |||||||||||||||||||||
| Advisor Class | ||||||||||||||||||||||||||||
| Year Ended October 31, | ||||||||||||||||||||||||||||
| 2019 | 2018 | |||||||||||||||||||||||||||
Balanced Fund | Shares | Amount | Shares | Amount | ||||||||||||||||||||||||
| Shares sold | 34,642 | $ | 505,559 | 60,001 | $ | 958,063 | ||||||||||||||||||||||
| Reinvestment of dividends | 40,103 | 536,879 | 48,037 | 761,574 | ||||||||||||||||||||||||
| Shares redeemed | (84,630 | ) | (1,245,331 | ) | (372,487 | ) | (5,908,441 | ) | ||||||||||||||||||||
|
|
|
|
|
|
|
| |||||||||||||||||||||
| Net (decrease) in shares outstanding | (9,885 | ) | $ | (202,893 | ) | (264,449 | ) | $ | (4,188,804 | ) | ||||||||||||||||||
|
|
|
|
|
|
|
| |||||||||||||||||||||
62
American Beacon FundsSM
Notes to Financial Statements
October 31, 2019
| A Class | ||||||||||||||||||||||||||||
| Year Ended October 31, | ||||||||||||||||||||||||||||
| 2019 | 2018 | |||||||||||||||||||||||||||
Balanced Fund | Shares | Amount | Shares | Amount | ||||||||||||||||||||||||
| Shares sold | 146,435 | $ | 2,007,483 | 160,555 | $ | 2,416,192 | ||||||||||||||||||||||
| Reinvestment of dividends | 125,852 | 1,576,366 | 111,181 | 1,658,485 | ||||||||||||||||||||||||
| Shares redeemed | (399,350 | ) | (5,397,912 | ) | (428,548 | ) | (6,460,378 | ) | ||||||||||||||||||||
|
|
|
|
|
|
|
| |||||||||||||||||||||
| Net (decrease) in shares outstanding | (127,063 | ) | $ | (1,814,063 | ) | (156,812 | ) | $ | (2,385,701 | ) | ||||||||||||||||||
|
|
|
|
|
|
|
| |||||||||||||||||||||
| C Class | ||||||||||||||||||||||||||||
| Year Ended October 31, | ||||||||||||||||||||||||||||
| 2019 | 2018 | |||||||||||||||||||||||||||
Balanced Fund | Shares | Amount | Shares | Amount | ||||||||||||||||||||||||
| Shares sold | 213,762 | $ | 2,975,157 | 293,469 | $ | 4,461,404 | ||||||||||||||||||||||
| Reinvestment of dividends | 233,638 | 2,939,348 | 188,746 | 2,851,672 | ||||||||||||||||||||||||
| Shares redeemed | (794,915 | ) | (10,895,250 | ) | (726,271 | ) | (11,046,787 | ) | ||||||||||||||||||||
|
|
|
|
|
|
|
| |||||||||||||||||||||
| Net (decrease) in shares outstanding | (347,515 | ) | $ | (4,980,745 | ) | (244,056 | ) | $ | (3,733,711 | ) | ||||||||||||||||||
|
|
|
|
|
|
|
| |||||||||||||||||||||
| Institutional Class | ||||||||||||||||||||||||||||
| Year Ended October 31, | ||||||||||||||||||||||||||||
| 2019 | 2018 | |||||||||||||||||||||||||||
Mid-Cap Value Fund | Shares | Amount | Shares | Amount | ||||||||||||||||||||||||
| Shares sold | 2,933,380 | $ | 43,338,685 | 6,269,618 | $ | 106,947,861 | ||||||||||||||||||||||
| Reinvestment of dividends | 1,242,979 | 15,910,136 | 526,390 | 9,164,443 | ||||||||||||||||||||||||
| Shares redeemed | (9,286,798 | ) | (138,322,894 | ) | (6,183,734 | ) | (105,856,767 | ) | ||||||||||||||||||||
|
|
|
|
|
|
|
| |||||||||||||||||||||
| Net increase (decrease) in shares outstanding | (5,110,439 | ) | $ | (79,074,073 | ) | 612,274 | $ | 10,255,537 | ||||||||||||||||||||
|
|
|
|
|
|
|
| |||||||||||||||||||||
| Y Class | ||||||||||||||||||||||||||||
| Year Ended October 31, | ||||||||||||||||||||||||||||
| 2019 | 2018 | |||||||||||||||||||||||||||
Mid-Cap Value Fund | Shares | Amount | Shares | Amount | ||||||||||||||||||||||||
| Shares sold | 1,021,924 | $ | 14,832,152 | 1,857,922 | $ | 31,620,714 | ||||||||||||||||||||||
| Reinvestment of dividends | 470,384 | 5,973,877 | 197,830 | 3,416,518 | ||||||||||||||||||||||||
| Shares redeemed | (2,233,351 | ) | (32,603,104 | ) | (1,620,549 | ) | (27,617,833 | ) | ||||||||||||||||||||
|
|
|
|
|
|
|
| |||||||||||||||||||||
| Net increase (decrease) in shares outstanding | (741,043 | ) | $ | (11,797,075 | ) | 435,203 | $ | 7,419,399 | ||||||||||||||||||||
|
|
|
|
|
|
|
| |||||||||||||||||||||
| Investor Class | ||||||||||||||||||||||||||||
| Year Ended October 31, | ||||||||||||||||||||||||||||
| 2019 | 2018 | |||||||||||||||||||||||||||
Mid-Cap Value Fund | Shares | Amount | Shares | Amount | ||||||||||||||||||||||||
| Shares sold | 2,591,144 | $ | 38,213,302 | 14,508,017 | $ | 258,034,860 | ||||||||||||||||||||||
| Reinvestment of dividends | 1,753,702 | 22,727,979 | 526,115 | 9,254,355 | ||||||||||||||||||||||||
| Shares redeemed | (13,815,110 | ) | (204,345,745 | ) | (6,582,101 | ) | (113,606,798 | ) | ||||||||||||||||||||
|
|
|
|
|
|
|
| |||||||||||||||||||||
| Net increase (decrease) in shares outstanding | (9,470,264 | ) | $ | (143,404,464 | ) | 8,452,031 | $ | 153,682,417 | ||||||||||||||||||||
|
|
|
|
|
|
|
| |||||||||||||||||||||
| Advisor Class | ||||||||||||||||||||||||||||
| Year Ended October 31, | ||||||||||||||||||||||||||||
| 2019 | 2018 | |||||||||||||||||||||||||||
Mid-Cap Value Fund | Shares | Amount | Shares | Amount | ||||||||||||||||||||||||
| Shares sold | 83,313 | $ | 1,198,170 | 113,873 | $ | 1,888,435 | ||||||||||||||||||||||
| Reinvestment of dividends | 15,813 | 198,759 | 5,543 | 94,728 | ||||||||||||||||||||||||
| Shares redeemed | (126,192 | ) | (1,844,844 | ) | (101,012 | ) | (1,693,636 | ) | ||||||||||||||||||||
|
|
|
|
|
|
|
| |||||||||||||||||||||
| Net increase (decrease) in shares outstanding | (27,066 | ) | $ | (447,915 | ) | 18,404 | $ | 289,527 | ||||||||||||||||||||
|
|
|
|
|
|
|
| |||||||||||||||||||||
| A Class | ||||||||||||||||||||||||||||
| Year Ended October 31, | ||||||||||||||||||||||||||||
| 2019 | 2018 | |||||||||||||||||||||||||||
Mid-Cap Value Fund | Shares | Amount | Shares | Amount | ||||||||||||||||||||||||
| Shares sold | 74,755 | $ | 1,099,220 | 343,780 | $ | 5,748,823 | ||||||||||||||||||||||
| Reinvestment of dividends | 56,526 | 708,842 | 25,397 | 433,278 | ||||||||||||||||||||||||
| Shares redeemed | (679,129 | ) | (10,091,248 | ) | (651,244 | ) | (10,958,448 | ) | ||||||||||||||||||||
|
|
|
|
|
|
|
| |||||||||||||||||||||
| Net (decrease) in shares outstanding | (547,848 | ) | $ | (8,283,186 | ) | (282,067 | ) | $ | (4,776,347 | ) | ||||||||||||||||||
|
|
|
|
|
|
|
| |||||||||||||||||||||
63
American Beacon FundsSM
Notes to Financial Statements
October 31, 2019
| C Class | ||||||||||||||||||||||||||||
| Year Ended October 31, | ||||||||||||||||||||||||||||
| 2019 | 2018 | |||||||||||||||||||||||||||
Mid-Cap Value Fund | Shares | Amount | Shares | Amount | ||||||||||||||||||||||||
| Shares sold | 14,869 | $ | 203,842 | 83,507 | $ | 1,358,250 | ||||||||||||||||||||||
| Reinvestment of dividends | 25,509 | 309,934 | 11,018 | 182,135 | ||||||||||||||||||||||||
| Shares redeemed | (140,085 | ) | (1,926,995 | ) | (95,319 | ) | (1,541,599 | ) | ||||||||||||||||||||
|
|
|
|
|
|
|
| |||||||||||||||||||||
| Net (decrease) in shares outstanding | (99,707 | ) | $ | (1,413,219 | ) | (794 | ) | $ | (1,214 | ) | ||||||||||||||||||
|
|
|
|
|
|
|
| |||||||||||||||||||||
| R6 Class | ||||||||||||||||||||||||||||
| Year Ended October 31, 2019 | February 28, 2018A to October 31, 2018 | |||||||||||||||||||||||||||
Mid-Cap Value Fund | Shares | Amount | Shares | Amount | ||||||||||||||||||||||||
| Shares sold | 149,021 | $ | 2,190,686 | 18,266 | $ | 315,231 | ||||||||||||||||||||||
| Reinvestment of dividends | 979 | 12,536 | – | – | ||||||||||||||||||||||||
| Shares redeemed | (16,218 | ) | (231,603 | ) | (5,909 | ) | (100,991 | ) | ||||||||||||||||||||
|
|
|
|
|
|
|
| |||||||||||||||||||||
| Net increase in shares outstanding | 133,782 | $ | 1,971,619 | 12,357 | $ | 214,240 | ||||||||||||||||||||||
|
|
|
|
|
|
|
| |||||||||||||||||||||
| A | Commencement of operations. |
12. Subsequent Events
At meetings held on November 11-12, 2019, the Board of the Trust approved the termination of Brandywine Global Investment Management, LLC on behalf of the American Beacon Balanced Fund, effective on or about January 15, 2020.
Management has evaluated subsequent events for possible recognition or disclosure in the financial statements through the date the financial statements are issued. Management has determined that there are no additional material events that would require disclosure in the Funds’ financial statements through this date.
64
American Beacon Balanced FundSM
Financial Highlights
(For a share outstanding throughout the period)
| Institutional ClassA | ||||||||||||||||||||||||||||||||||||
| Year Ended October 31, | ||||||||||||||||||||||||||||||||||||
| 2019 | 2018 | 2017 | 2016 | 2015 | ||||||||||||||||||||||||||||||||
|
| |||||||||||||||||||||||||||||||||||
Net asset value, beginning of period | $ | 16.20 | $ | 17.30 | $ | 15.26 | $ | 15.79 | $ | 16.79 | ||||||||||||||||||||||||||
|
|
|
|
|
|
|
|
|
| |||||||||||||||||||||||||||
Income (loss) from investment operations: | ||||||||||||||||||||||||||||||||||||
Net investment income | 0.31 | 0.28 | 0.36 | 0.27 | 0.32 | |||||||||||||||||||||||||||||||
Net gains (losses) on investments (both realized and unrealized) | 1.23 | (0.10 | ) | 2.04 | 0.20 | (0.32 | ) | |||||||||||||||||||||||||||||
|
|
|
|
|
|
|
|
|
| |||||||||||||||||||||||||||
Total income (loss) from investment operations | 1.54 | 0.18 | 2.40 | 0.47 | - | |||||||||||||||||||||||||||||||
|
|
|
|
|
|
|
|
|
| |||||||||||||||||||||||||||
Less distributions: | ||||||||||||||||||||||||||||||||||||
Dividends from net investment income | (0.26 | ) | (0.48 | ) | (0.36 | ) | (0.25 | ) | (0.22 | ) | ||||||||||||||||||||||||||
Distributions from net realized gains | (1.12 | ) | (0.80 | ) | - | (0.75 | ) | (0.78 | ) | |||||||||||||||||||||||||||
|
|
|
|
|
|
|
|
|
| |||||||||||||||||||||||||||
Total distributions | (1.38 | ) | (1.28 | ) | (0.36 | ) | (1.00 | ) | (1.00 | ) | ||||||||||||||||||||||||||
|
|
|
|
|
|
|
|
|
| |||||||||||||||||||||||||||
Net asset value, end of period | $ | 16.36 | $ | 16.20 | $ | 17.30 | $ | 15.26 | $ | 15.79 | ||||||||||||||||||||||||||
|
|
|
|
|
|
|
|
|
| |||||||||||||||||||||||||||
Total returnB | 10.89 | % | 0.84 | % | 15.82 | % | 3.30 | % | (0.07 | )% | ||||||||||||||||||||||||||
|
|
|
|
|
|
|
|
|
| |||||||||||||||||||||||||||
Ratios and supplemental data: |
| |||||||||||||||||||||||||||||||||||
Net assets, end of period | $ | 46,593,155 | $ | 60,191,704 | $ | 88,015,702 | $ | 485,231,068 | $ | 99,173,943 | ||||||||||||||||||||||||||
Ratios to average net assets: | ||||||||||||||||||||||||||||||||||||
Expenses, before reimbursements | 0.66 | % | 0.62 | % | 0.59 | % | 0.62 | % | 0.58 | % | ||||||||||||||||||||||||||
Expenses, net of reimbursements | 0.66 | % | 0.62 | % | 0.59 | % | 0.62 | % | 0.58 | % | ||||||||||||||||||||||||||
Net investment income, before expense reimbursements | 2.24 | % | 1.95 | % | 1.80 | % | 1.90 | % | 1.83 | % | ||||||||||||||||||||||||||
Net investment income, net of reimbursements | 2.24 | % | 1.95 | % | 1.80 | % | 1.90 | % | 1.83 | % | ||||||||||||||||||||||||||
Portfolio turnover rate | 68 | % | 28 | % | 32 | % | 16 | % | 62 | % | ||||||||||||||||||||||||||
| A | On May 31, 2016, the AMR Class closed and the assets were merged into the Institutional Class. |
| B | Based on net asset value, which does not reflect the sales charge, redemption fee, or contingent deferred sales charge, if applicable. May include adjustments in accordance with U.S. GAAP and as such, the net asset value for reporting purposes and the returns based upon those net asset values may differ from the net asset value and returns for shareholder transactions. |
See accompanying notes
65
American Beacon Balanced FundSM
Financial Highlights
(For a share outstanding throughout the period)
| Y Class | ||||||||||||||||||||||||||||||||||||
| Year Ended October 31, | ||||||||||||||||||||||||||||||||||||
| 2019 | 2018 | 2017 | 2016 | 2015 | ||||||||||||||||||||||||||||||||
|
| |||||||||||||||||||||||||||||||||||
Net asset value, beginning of period | $ | 16.31 | $ | 17.39 | $ | 15.30 | $ | 15.84 | $ | 16.83 | ||||||||||||||||||||||||||
|
|
|
|
|
|
|
|
|
| |||||||||||||||||||||||||||
Income (loss) from investment operations: | ||||||||||||||||||||||||||||||||||||
Net investment income | 0.33 | 0.35 | 0.24 | 0.30 | 0.30 | |||||||||||||||||||||||||||||||
Net gains (losses) on investments (both realized and unrealized) | 1.20 | (0.16 | ) | 2.20 | 0.13 | (0.30 | ) | |||||||||||||||||||||||||||||
|
|
|
|
|
|
|
|
|
| |||||||||||||||||||||||||||
Total income (loss) from investment operations | 1.53 | 0.19 | 2.44 | 0.43 | - | |||||||||||||||||||||||||||||||
|
|
|
|
|
|
|
|
|
| |||||||||||||||||||||||||||
Less distributions: | ||||||||||||||||||||||||||||||||||||
Dividends from net investment income | (0.25 | ) | (0.47 | ) | (0.35 | ) | (0.22 | ) | (0.21 | ) | ||||||||||||||||||||||||||
Distributions from net realized gains | (1.12 | ) | (0.80 | ) | - | (0.75 | ) | (0.78 | ) | |||||||||||||||||||||||||||
|
|
|
|
|
|
|
|
|
| |||||||||||||||||||||||||||
Total distributions | (1.37 | ) | (1.27 | ) | (0.35 | ) | (0.97 | ) | (0.99 | ) | ||||||||||||||||||||||||||
|
|
|
|
|
|
|
|
|
| |||||||||||||||||||||||||||
Net asset value, end of period | $ | 16.47 | $ | 16.31 | $ | 17.39 | $ | 15.30 | $ | 15.84 | ||||||||||||||||||||||||||
|
|
|
|
|
|
|
|
|
| |||||||||||||||||||||||||||
Total returnA | 10.75 | % | 0.88 | % | 16.05 | % | 3.06 | % | (0.07 | )% | ||||||||||||||||||||||||||
|
|
|
|
|
|
|
|
|
| |||||||||||||||||||||||||||
Ratios and supplemental data: |
| |||||||||||||||||||||||||||||||||||
Net assets, end of period | $ | 62,956,422 | $ | 71,296,735 | $ | 64,926,394 | $ | 28,843,268 | $ | 39,151,318 | ||||||||||||||||||||||||||
Ratios to average net assets: | ||||||||||||||||||||||||||||||||||||
Expenses, before reimbursements | 0.74 | % | 0.70 | % | 0.68 | % | 0.72 | % | 0.66 | % | ||||||||||||||||||||||||||
Expenses, net of reimbursements | 0.74 | % | 0.70 | % | 0.68 | % | 0.72 | % | 0.66 | % | ||||||||||||||||||||||||||
Net investment income, before expense reimbursements | 2.15 | % | 1.86 | % | 1.67 | % | 1.95 | % | 1.75 | % | ||||||||||||||||||||||||||
Net investment income, net of reimbursements | 2.15 | % | 1.86 | % | 1.67 | % | 1.95 | % | 1.75 | % | ||||||||||||||||||||||||||
Portfolio turnover rate | 68 | % | 28 | % | 32 | % | 16 | % | 62 | % | ||||||||||||||||||||||||||
| A | Based on net asset value, which does not reflect the sales charge, redemption fee, or contingent deferred sales charge, if applicable. May include adjustments in accordance with U.S. GAAP and as such, the net asset value for reporting purposes and the returns based upon those net asset values may differ from the net asset value and returns for shareholder transactions. |
See accompanying notes
66
American Beacon Balanced FundSM
Financial Highlights
(For a share outstanding throughout the period)
| Investor Class | ||||||||||||||||||||||||||||||||||||
| Year Ended October 31, | ||||||||||||||||||||||||||||||||||||
| 2019 | 2018 | 2017 | 2016 | 2015 | ||||||||||||||||||||||||||||||||
|
| |||||||||||||||||||||||||||||||||||
Net asset value, beginning of period | $ | 14.41 | $ | 15.51 | $ | 13.71 | $ | 14.30 | $ | 15.31 | ||||||||||||||||||||||||||
|
|
|
|
|
|
|
|
|
| |||||||||||||||||||||||||||
Income (loss) from investment operations: | ||||||||||||||||||||||||||||||||||||
Net investment income | 0.18 | 0.20 | 0.15 | 0.18 | 0.22 | |||||||||||||||||||||||||||||||
Net gains (losses) on investments (both realized and unrealized) | 1.11 | (0.07 | ) | 1.96 | 0.18 | (0.26 | ) | |||||||||||||||||||||||||||||
|
|
|
|
|
|
|
|
|
| |||||||||||||||||||||||||||
Total income (loss) from investment operations | 1.29 | 0.13 | 2.11 | 0.36 | (0.04 | ) | ||||||||||||||||||||||||||||||
|
|
|
|
|
|
|
|
|
| |||||||||||||||||||||||||||
Less distributions: | ||||||||||||||||||||||||||||||||||||
Dividends from net investment income | (0.22 | ) | (0.43 | ) | (0.31 | ) | (0.20 | ) | (0.19 | ) | ||||||||||||||||||||||||||
Distributions from net realized gains | (1.12 | ) | (0.80 | ) | - | (0.75 | ) | (0.78 | ) | |||||||||||||||||||||||||||
|
|
|
|
|
|
|
|
|
| |||||||||||||||||||||||||||
Total distributions | (1.34 | ) | (1.23 | ) | (0.31 | ) | (0.95 | ) | (0.97 | ) | ||||||||||||||||||||||||||
|
|
|
|
|
|
|
|
|
| |||||||||||||||||||||||||||
Net asset value, end of period | $ | 14.36 | $ | 14.41 | $ | 15.51 | $ | 13.71 | $ | 14.30 | ||||||||||||||||||||||||||
|
|
|
|
|
|
|
|
|
| |||||||||||||||||||||||||||
Total returnA | 10.50 | % | 0.62 | % | 15.52 | % | 2.85 | % | (0.35 | )% | ||||||||||||||||||||||||||
|
|
|
|
|
|
|
|
|
| |||||||||||||||||||||||||||
Ratios and supplemental data: |
| |||||||||||||||||||||||||||||||||||
Net assets, end of period | $ | 96,065,263 | $ | 107,677,984 | $ | 124,143,894 | $ | 127,235,433 | $ | 155,757,561 | ||||||||||||||||||||||||||
Ratios to average net assets: | ||||||||||||||||||||||||||||||||||||
Expenses, before reimbursements | 0.97 | % | 0.95 | % | 0.89 | % | 0.95 | % | 0.91 | % | ||||||||||||||||||||||||||
Expenses, net of reimbursements | 0.97 | % | 0.95 | % | 0.89 | % | 0.95 | % | 0.91 | % | ||||||||||||||||||||||||||
Net investment income, before expense reimbursements | 1.92 | % | 1.62 | % | 1.48 | % | 1.72 | % | 1.51 | % | ||||||||||||||||||||||||||
Net investment income, net of reimbursements | 1.92 | % | 1.62 | % | 1.48 | % | 1.72 | % | 1.51 | % | ||||||||||||||||||||||||||
Portfolio turnover rate | 68 | % | 28 | % | 32 | % | 16 | % | 62 | % | ||||||||||||||||||||||||||
| A | Based on net asset value, which does not reflect the sales charge, redemption fee, or contingent deferred sales charge, if applicable. May include adjustments in accordance with U.S. GAAP and as such, the net asset value for reporting purposes and the returns based upon those net asset values may differ from the net asset value and returns for shareholder transactions. |
See accompanying notes
67
American Beacon Balanced FundSM
Financial Highlights
(For a share outstanding throughout the period)
| Advisor Class | ||||||||||||||||||||||||||||||||||||
| Year Ended October 31, | ||||||||||||||||||||||||||||||||||||
| 2019 | 2018 | 2017 | 2016 | 2015 | ||||||||||||||||||||||||||||||||
|
| |||||||||||||||||||||||||||||||||||
Net asset value, beginning of period | $ | 15.29 | $ | 16.38 | $ | 14.46 | $ | 15.02 | $ | 16.04 | ||||||||||||||||||||||||||
|
|
|
|
|
|
|
|
|
| |||||||||||||||||||||||||||
Income (loss) from investment operations: | ||||||||||||||||||||||||||||||||||||
Net investment income | 0.26 | 0.16 | 0.21 | 0.24 | 0.22 | |||||||||||||||||||||||||||||||
Net gains (losses) on investments (both realized and unrealized) | 1.11 | (0.06 | ) | 1.99 | 0.12 | (0.29 | ) | |||||||||||||||||||||||||||||
|
|
|
|
|
|
|
|
|
| |||||||||||||||||||||||||||
Total income (loss) from investment operations | 1.37 | 0.10 | 2.20 | 0.36 | (0.07 | ) | ||||||||||||||||||||||||||||||
|
|
|
|
|
|
|
|
|
| |||||||||||||||||||||||||||
Less distributions: | ||||||||||||||||||||||||||||||||||||
Dividends from net investment income | (0.20 | ) | (0.39 | ) | (0.28 | ) | (0.17 | ) | (0.17 | ) | ||||||||||||||||||||||||||
Distributions from net realized gains | (1.12 | ) | (0.80 | ) | - | (0.75 | ) | (0.78 | ) | |||||||||||||||||||||||||||
|
|
|
|
|
|
|
|
|
| |||||||||||||||||||||||||||
Total distributions | (1.32 | ) | (1.19 | ) | (0.28 | ) | (0.92 | ) | (0.95 | ) | ||||||||||||||||||||||||||
|
|
|
|
|
|
|
|
|
| |||||||||||||||||||||||||||
Net asset value, end of period | $ | 15.34 | $ | 15.29 | $ | 16.38 | $ | 14.46 | $ | 15.02 | ||||||||||||||||||||||||||
|
|
|
|
|
|
|
|
|
| |||||||||||||||||||||||||||
Total returnA | 10.41 | % | 0.42 | % | 15.31 | % | 2.71 | % | (0.58 | )% | ||||||||||||||||||||||||||
|
|
|
|
|
|
|
|
|
| |||||||||||||||||||||||||||
Ratios and supplemental data: |
| |||||||||||||||||||||||||||||||||||
Net assets, end of period | $ | 6,039,168 | $ | 6,174,284 | $ | 10,944,675 | $ | 10,603,004 | $ | 13,510,138 | ||||||||||||||||||||||||||
Ratios to average net assets: | ||||||||||||||||||||||||||||||||||||
Expenses, before reimbursements | 1.14 | % | 1.12 | % | 1.08 | % | 1.12 | % | 1.06 | % | ||||||||||||||||||||||||||
Expenses, net of reimbursements | 1.14 | % | 1.12 | % | 1.08 | % | 1.12 | % | 1.06 | % | ||||||||||||||||||||||||||
Net investment income, before expense reimbursements | 1.76 | % | 1.45 | % | 1.29 | % | 1.55 | % | 1.35 | % | ||||||||||||||||||||||||||
Net investment income, net of reimbursements | 1.76 | % | 1.45 | % | 1.29 | % | 1.55 | % | 1.35 | % | ||||||||||||||||||||||||||
Portfolio turnover rate | 68 | % | 28 | % | 32 | % | 16 | % | 62 | % | ||||||||||||||||||||||||||
| A | Based on net asset value, which does not reflect the sales charge, redemption fee, or contingent deferred sales charge, if applicable. May include adjustments in accordance with U.S. GAAP and as such, the net asset value for reporting purposes and the returns based upon those net asset values may differ from the net asset value and returns for shareholder transactions. |
See accompanying notes
68
American Beacon Balanced FundSM
Financial Highlights
(For a share outstanding throughout the period)
| A Class | ||||||||||||||||||||||||||||||||||||
| Year Ended October 31, | ||||||||||||||||||||||||||||||||||||
| 2019 | 2018 | 2017 | 2016 | 2015 | ||||||||||||||||||||||||||||||||
|
| |||||||||||||||||||||||||||||||||||
Net asset value, beginning of period | $ | 14.38 | $ | 15.48 | $ | 13.69 | $ | 14.27 | $ | 15.29 | ||||||||||||||||||||||||||
|
|
|
|
|
|
|
|
|
| |||||||||||||||||||||||||||
Income (loss) from investment operations: | ||||||||||||||||||||||||||||||||||||
Net investment income | 0.22 | 0.22 | 0.16 | 0.21 | 0.23 | |||||||||||||||||||||||||||||||
Net gains (losses) on investments (both realized and unrealized) | 1.07 | (0.07 | ) | 1.93 | 0.15 | (0.29 | ) | |||||||||||||||||||||||||||||
|
|
|
|
|
|
|
|
|
| |||||||||||||||||||||||||||
Total income (loss) from investment operations | 1.29 | 0.15 | 2.09 | 0.36 | (0.06 | ) | ||||||||||||||||||||||||||||||
|
|
|
|
|
|
|
|
|
| |||||||||||||||||||||||||||
Less distributions: | ||||||||||||||||||||||||||||||||||||
Dividends from net investment income | (0.22 | ) | (0.45 | ) | (0.30 | ) | (0.19 | ) | (0.18 | ) | ||||||||||||||||||||||||||
Distributions from net realized gains | (1.12 | ) | (0.80 | ) | - | (0.75 | ) | (0.78 | ) | |||||||||||||||||||||||||||
|
|
|
|
|
|
|
|
|
| |||||||||||||||||||||||||||
Total distributions | (1.34 | ) | (1.25 | ) | (0.30 | ) | (0.94 | ) | (0.96 | ) | ||||||||||||||||||||||||||
|
|
|
|
|
|
|
|
|
| |||||||||||||||||||||||||||
Net asset value, end of period | $ | 14.33 | $ | 14.38 | $ | 15.48 | $ | 13.69 | $ | 14.27 | ||||||||||||||||||||||||||
|
|
|
|
|
|
|
|
|
| |||||||||||||||||||||||||||
Total returnA | 10.54 | % | 0.73 | % | 15.36 | % | 2.84 | % | (0.48 | )% | ||||||||||||||||||||||||||
|
|
|
|
|
|
|
|
|
| |||||||||||||||||||||||||||
Ratios and supplemental data: |
| |||||||||||||||||||||||||||||||||||
Net assets, end of period | $ | 16,228,685 | $ | 18,121,273 | $ | 21,934,880 | $ | 24,892,096 | $ | 29,074,120 | ||||||||||||||||||||||||||
Ratios to average net assets: | ||||||||||||||||||||||||||||||||||||
Expenses, before reimbursements or recoupments | 1.01 | % | 0.91 | % | 0.99 | % | 1.02 | % | 0.97 | % | ||||||||||||||||||||||||||
Expenses, net of reimbursements or recoupments | 1.01 | %B | 0.83 | % | 0.99 | % | 1.02 | % | 0.97 | % | ||||||||||||||||||||||||||
Net investment income, before expense reimbursements or recoupments | 1.88 | % | 1.66 | % | 1.39 | % | 1.64 | % | 1.44 | % | ||||||||||||||||||||||||||
Net investment income, net of reimbursements or recoupments | 1.88 | % | 1.74 | % | 1.39 | % | 1.64 | % | 1.44 | % | ||||||||||||||||||||||||||
Portfolio turnover rate | 68 | % | 28 | % | 32 | % | 16 | % | 62 | % | ||||||||||||||||||||||||||
| A | Based on net asset value, which does not reflect the sales charge, redemption fee, or contingent deferred sales charge, if applicable. May include adjustments in accordance with U.S. GAAP and as such, the net asset value for reporting purposes and the returns based upon those net asset values may differ from the net asset value and returns for shareholder transactions. |
| B | This ratio does not include a voluntary reimbursement of service fees as included in the prior year. |
See accompanying notes
69
American Beacon Balanced FundSM
Financial Highlights
(For a share outstanding throughout the period)
| C Class | ||||||||||||||||||||||||||||||||||||
| Year Ended October 31, | ||||||||||||||||||||||||||||||||||||
| 2019 | 2018 | 2017 | 2016 | 2015 | ||||||||||||||||||||||||||||||||
|
| |||||||||||||||||||||||||||||||||||
Net asset value, beginning of period | $ | 14.55 | $ | 15.64 | $ | 13.83 | $ | 14.43 | $ | 15.47 | ||||||||||||||||||||||||||
|
|
|
|
|
|
|
|
|
| |||||||||||||||||||||||||||
Income (loss) from investment operations: | ||||||||||||||||||||||||||||||||||||
Net investment income | 0.10 | 0.13 | 0.08 | 0.12 | 0.14 | |||||||||||||||||||||||||||||||
Net gains (losses) on investments (both realized and unrealized) | 1.09 | (0.09 | ) | 1.92 | 0.13 | (0.29 | ) | |||||||||||||||||||||||||||||
|
|
|
|
|
|
|
|
|
| |||||||||||||||||||||||||||
Total income (loss) from investment operations | 1.19 | 0.04 | 2.00 | 0.25 | (0.15 | ) | ||||||||||||||||||||||||||||||
|
|
|
|
|
|
|
|
|
| |||||||||||||||||||||||||||
Less distributions: | ||||||||||||||||||||||||||||||||||||
Dividends from net investment income | (0.14 | ) | (0.33 | ) | (0.19 | ) | (0.10 | ) | (0.11 | ) | ||||||||||||||||||||||||||
Distributions from net realized gains | (1.12 | ) | (0.80 | ) | - | (0.75 | ) | (0.78 | ) | |||||||||||||||||||||||||||
|
|
|
|
|
|
|
|
|
| |||||||||||||||||||||||||||
Total distributions | (1.26 | ) | (1.13 | ) | (0.19 | ) | (0.85 | ) | (0.89 | ) | ||||||||||||||||||||||||||
|
|
|
|
|
|
|
|
|
| |||||||||||||||||||||||||||
Net asset value, end of period | $ | 14.48 | $ | 14.55 | $ | 15.64 | $ | 13.83 | $ | 14.43 | ||||||||||||||||||||||||||
|
|
|
|
|
|
|
|
|
| |||||||||||||||||||||||||||
Total returnA | 9.63 | % | 0.04 | % | 14.50 | % | 2.03 | % | (1.14 | )% | ||||||||||||||||||||||||||
|
|
|
|
|
|
|
|
|
| |||||||||||||||||||||||||||
Ratios and supplemental data: |
| |||||||||||||||||||||||||||||||||||
Net assets, end of period | $ | 30,848,500 | $ | 36,046,543 | $ | 42,575,983 | $ | 40,827,570 | $ | 45,641,648 | ||||||||||||||||||||||||||
Ratios to average net assets: | ||||||||||||||||||||||||||||||||||||
Expenses, before reimbursements or recoupments | 1.76 | % | 1.66 | % | 1.73 | % | 1.77 | % | 1.72 | % | ||||||||||||||||||||||||||
Expenses, net of reimbursements or recoupments | 1.76 | %B | 1.54 | % | 1.73 | % | 1.77 | % | 1.72 | % | ||||||||||||||||||||||||||
Net investment income, before expense reimbursements or recoupments | 1.13 | % | 0.91 | % | 0.63 | % | 0.89 | % | 0.69 | % | ||||||||||||||||||||||||||
Net investment income, net of reimbursements or recoupments | 1.13 | % | 1.02 | % | 0.63 | % | 0.89 | % | 0.69 | % | ||||||||||||||||||||||||||
Portfolio turnover rate | 68 | % | 28 | % | 32 | % | 16 | % | 62 | % | ||||||||||||||||||||||||||
| A | Based on net asset value, which does not reflect the sales charge, redemption fee, or contingent deferred sales charge, if applicable. May include adjustments in accordance with U.S. GAAP and as such, the net asset value for reporting purposes and the returns based upon those net asset values may differ from the net asset value and returns for shareholder transactions. |
| B | This ratio does not include a voluntary reimbursement of service fees as included in the prior year. |
See accompanying notes
70
American BeaconMid-Cap Value FundSM
Financial Highlights
(For a share outstanding throughout the period)
| Institutional Class | ||||||||||||||||||||||||||||||||||||
| Year Ended October 31, | ||||||||||||||||||||||||||||||||||||
| 2019 | 2018 | 2017 | 2016 | 2015A | ||||||||||||||||||||||||||||||||
|
| |||||||||||||||||||||||||||||||||||
Net asset value, beginning of period | $ | 15.52 | $ | 17.25 | $ | 14.03 | $ | 14.62 | $ | 14.76 | ||||||||||||||||||||||||||
|
|
|
|
|
|
|
|
|
| |||||||||||||||||||||||||||
Income (loss) from investment operations: | ||||||||||||||||||||||||||||||||||||
Net investment income | 0.25 | 0.21 | 0.16 | 0.26 | 0.16 | |||||||||||||||||||||||||||||||
Net gains (losses) on investments (both realized and unrealized) | 0.65 | (1.34 | ) | 3.28 | 0.03 | 0.25 | ||||||||||||||||||||||||||||||
|
|
|
|
|
|
|
|
|
| |||||||||||||||||||||||||||
Total income (loss) from investment operations | 0.90 | (1.13 | ) | 3.44 | 0.29 | 0.41 | ||||||||||||||||||||||||||||||
|
|
|
|
|
|
|
|
|
| |||||||||||||||||||||||||||
Less distributions: | ||||||||||||||||||||||||||||||||||||
Dividends from net investment income | (0.22 | ) | (0.16 | ) | (0.22 | ) | (0.17 | ) | (0.10 | ) | ||||||||||||||||||||||||||
Distributions from net realized gains | (0.79 | ) | (0.44 | ) | - | (0.71 | ) | (0.45 | ) | |||||||||||||||||||||||||||
|
|
|
|
|
|
|
|
|
| |||||||||||||||||||||||||||
Total distributions | (1.01 | ) | (0.60 | ) | (0.22 | ) | (0.88 | ) | (0.55 | ) | ||||||||||||||||||||||||||
|
|
|
|
|
|
|
|
|
| |||||||||||||||||||||||||||
Redemption fees added to beneficial interests | - | - | - | - | 0.00 | B | ||||||||||||||||||||||||||||||
|
|
|
|
|
|
|
|
|
| |||||||||||||||||||||||||||
Net asset value, end of period | $ | 15.41 | $ | 15.52 | $ | 17.25 | $ | 14.03 | $ | 14.62 | ||||||||||||||||||||||||||
|
|
|
|
|
|
|
|
|
| |||||||||||||||||||||||||||
Total returnC | 7.08 | % | (6.89 | )% | 24.71 | % | 2.39 | % | 2.73 | % | ||||||||||||||||||||||||||
|
|
|
|
|
|
|
|
|
| |||||||||||||||||||||||||||
Ratios and supplemental data: |
| |||||||||||||||||||||||||||||||||||
Net assets, end of period | $ | 168,201,120 | $ | 248,752,034 | $ | 265,934,589 | $ | 195,472,135 | $ | 258,503,278 | ||||||||||||||||||||||||||
Ratios to average net assets: | ||||||||||||||||||||||||||||||||||||
Expenses, before reimbursements | 0.93 | % | 0.85 | % | 0.89 | % | 0.89 | % | 0.85 | % | ||||||||||||||||||||||||||
Expenses, net of reimbursements | 0.93 | % | 0.85 | % | 0.89 | % | 0.89 | % | 0.85 | % | ||||||||||||||||||||||||||
Net investment income, before expense reimbursements | 1.40 | % | 1.19 | % | 1.06 | % | 1.65 | % | 1.10 | % | ||||||||||||||||||||||||||
Net investment income, net of reimbursements | 1.40 | % | 1.19 | % | 1.06 | % | 1.65 | % | 1.10 | % | ||||||||||||||||||||||||||
Portfolio turnover rate | 30 | % | 34 | % | 28 | % | 27 | % | 79 | % | ||||||||||||||||||||||||||
| A | WEDGE Capital Management was added as an investment manager to theMid-Cap Value Fund on May 11, 2015. |
| B | Amount represents less than $0.01 per share. |
| C | Based on net asset value, which does not reflect the sales charge, redemption fee, or contingent deferred sales charge, if applicable. May include adjustments in accordance with U.S. GAAP and as such, the net asset value for reporting purposes and the returns based upon those net asset values may differ from the net asset value and returns for shareholder transactions. |
See accompanying notes
71
American BeaconMid-Cap Value FundSM
Financial Highlights
(For a share outstanding throughout the period)
| Y Class | ||||||||||||||||||||||||||||||||||||
| Year Ended October 31, | ||||||||||||||||||||||||||||||||||||
| 2019 | 2018 | 2017 | 2016 | 2015A | ||||||||||||||||||||||||||||||||
|
| |||||||||||||||||||||||||||||||||||
Net asset value, beginning of period | $ | 15.39 | $ | 17.11 | $ | 13.92 | $ | 14.52 | $ | 14.66 | ||||||||||||||||||||||||||
|
|
|
|
|
|
|
|
|
| |||||||||||||||||||||||||||
Income (loss) from investment operations: | ||||||||||||||||||||||||||||||||||||
Net investment income | 0.22 | 0.19 | 0.15 | 0.23 | 0.15 | |||||||||||||||||||||||||||||||
Net gains (losses) on investments (both realized and unrealized) | 0.65 | (1.32 | ) | 3.25 | 0.05 | 0.26 | ||||||||||||||||||||||||||||||
|
|
|
|
|
|
|
|
|
| |||||||||||||||||||||||||||
Total income (loss) from investment operations | 0.87 | (1.13 | ) | 3.40 | 0.28 | 0.41 | ||||||||||||||||||||||||||||||
|
|
|
|
|
|
|
|
|
| |||||||||||||||||||||||||||
Less distributions: | ||||||||||||||||||||||||||||||||||||
Dividends from net investment income | (0.20 | ) | (0.15 | ) | (0.21 | ) | (0.17 | ) | (0.10 | ) | ||||||||||||||||||||||||||
Distributions from net realized gains | (0.79 | ) | (0.44 | ) | - | (0.71 | ) | (0.45 | ) | |||||||||||||||||||||||||||
|
|
|
|
|
|
|
|
|
| |||||||||||||||||||||||||||
Total distributions | (0.99 | ) | (0.59 | ) | (0.21 | ) | (0.88 | ) | (0.55 | ) | ||||||||||||||||||||||||||
|
|
|
|
|
|
|
|
|
| |||||||||||||||||||||||||||
Redemption fees added to beneficial interests | - | - | - | - | 0.00 | B | ||||||||||||||||||||||||||||||
|
|
|
|
|
|
|
|
|
| |||||||||||||||||||||||||||
Net asset value, end of period | $ | 15.27 | $ | 15.39 | $ | 17.11 | $ | 13.92 | $ | 14.52 | ||||||||||||||||||||||||||
|
|
|
|
|
|
|
|
|
| |||||||||||||||||||||||||||
Total returnC | 6.97 | % | (6.96 | )% | 24.60 | % | 2.29 | % | 2.76 | % | ||||||||||||||||||||||||||
|
|
|
|
|
|
|
|
|
| |||||||||||||||||||||||||||
Ratios and supplemental data: |
| |||||||||||||||||||||||||||||||||||
Net assets, end of period | $ | 84,763,978 | $ | 96,799,413 | $ | 100,190,167 | $ | 68,994,531 | $ | 70,009,288 | ||||||||||||||||||||||||||
Ratios to average net assets: | ||||||||||||||||||||||||||||||||||||
Expenses, before reimbursements | 0.98 | % | 0.93 | % | 0.97 | % | 0.96 | % | 0.94 | % | ||||||||||||||||||||||||||
Expenses, net of reimbursements | 0.98 | % | 0.93 | % | 0.97 | % | 0.96 | % | 0.94 | % | ||||||||||||||||||||||||||
Net investment income, before expense reimbursements | 1.36 | % | 1.11 | % | 0.98 | % | 1.59 | % | 1.02 | % | ||||||||||||||||||||||||||
Net investment income, net of reimbursements | 1.36 | % | 1.11 | % | 0.98 | % | 1.59 | % | 1.02 | % | ||||||||||||||||||||||||||
Portfolio turnover rate | 30 | % | 34 | % | 28 | % | 27 | % | 79 | % | ||||||||||||||||||||||||||
| A | WEDGE Capital Management was added as an investment manager to theMid-Cap Value Fund on May 11, 2015. |
| B | Amount represents less than $0.01 per share. |
| C | Based on net asset value, which does not reflect the sales charge, redemption fee, or contingent deferred sales charge, if applicable. May include adjustments in accordance with U.S. GAAP and as such, the net asset value for reporting purposes and the returns based upon those net asset values may differ from the net asset value and returns for shareholder transactions. |
See accompanying notes
72
American BeaconMid-Cap Value FundSM
Financial Highlights
(For a share outstanding throughout the period)
| Investor Class | ||||||||||||||||||||||||||||||||||||
| Year Ended October 31, | ||||||||||||||||||||||||||||||||||||
| 2019 | 2018 | 2017 | 2016 | 2015A | ||||||||||||||||||||||||||||||||
|
| |||||||||||||||||||||||||||||||||||
Net asset value, beginning of period | $ | 15.65 | $ | 17.40 | $ | 14.14 | $ | 14.73 | $ | 14.89 | ||||||||||||||||||||||||||
|
|
|
|
|
|
|
|
|
| |||||||||||||||||||||||||||
Income (loss) from investment operations: | ||||||||||||||||||||||||||||||||||||
Net investment income | 0.18 | 0.16 | 0.14 | 0.21 | 0.13 | |||||||||||||||||||||||||||||||
Net gains (losses) on investments (both realized and unrealized) | 0.69 | (1.34 | ) | 3.31 | 0.05 | 0.25 | ||||||||||||||||||||||||||||||
|
|
|
|
|
|
|
|
|
| |||||||||||||||||||||||||||
Total income (loss) from investment operations | 0.87 | (1.18 | ) | 3.45 | 0.26 | 0.38 | ||||||||||||||||||||||||||||||
|
|
|
|
|
|
|
|
|
| |||||||||||||||||||||||||||
Less distributions: | ||||||||||||||||||||||||||||||||||||
Dividends from net investment income | (0.17 | ) | (0.13 | ) | (0.19 | ) | (0.14 | ) | (0.09 | ) | ||||||||||||||||||||||||||
Distributions from net realized gains | (0.79 | ) | (0.44 | ) | - | (0.71 | ) | (0.45 | ) | |||||||||||||||||||||||||||
|
|
|
|
|
|
|
|
|
| |||||||||||||||||||||||||||
Total distributions | (0.96 | ) | (0.57 | ) | (0.19 | ) | (0.85 | ) | (0.54 | ) | ||||||||||||||||||||||||||
|
|
|
|
|
|
|
|
|
| |||||||||||||||||||||||||||
Redemption fees added to beneficial interests | - | - | - | - | 0.00 | B | ||||||||||||||||||||||||||||||
|
|
|
|
|
|
|
|
|
| |||||||||||||||||||||||||||
Net asset value, end of period | $ | 15.56 | $ | 15.65 | $ | 17.40 | $ | 14.14 | $ | 14.73 | ||||||||||||||||||||||||||
|
|
|
|
|
|
|
|
|
| |||||||||||||||||||||||||||
Total returnC | 6.79 | % | (7.13 | )% | 24.52 | % | 2.12 | % | 2.52 | % | ||||||||||||||||||||||||||
|
|
|
|
|
|
|
|
|
| |||||||||||||||||||||||||||
Ratios and supplemental data: |
| |||||||||||||||||||||||||||||||||||
Net assets, end of period | $ | 229,639,964 | $ | 379,123,913 | $ | 274,552,551 | $ | 243,421,035 | $ | 304,799,582 | ||||||||||||||||||||||||||
Ratios to average net assets: | ||||||||||||||||||||||||||||||||||||
Expenses, before reimbursements | 1.18 | % | 1.12 | % | 1.09 | % | 1.12 | % | 1.09 | % | ||||||||||||||||||||||||||
Expenses, net of reimbursements | 1.18 | % | 1.12 | % | 1.09 | % | 1.12 | % | 1.09 | % | ||||||||||||||||||||||||||
Net investment income, before expense reimbursements | 1.12 | % | 0.92 | % | 0.86 | % | 1.44 | % | 0.87 | % | ||||||||||||||||||||||||||
Net investment income, net of reimbursements | 1.12 | % | 0.92 | % | 0.86 | % | 1.44 | % | 0.87 | % | ||||||||||||||||||||||||||
Portfolio turnover rate | 30 | % | 34 | % | 28 | % | 27 | % | 79 | % | ||||||||||||||||||||||||||
| A | WEDGE Capital Management was added as an investment manager to theMid-Cap Value Fund on May 11, 2015. |
| B | Amount represents less than $0.01 per share. |
| C | Based on net asset value, which does not reflect the sales charge, redemption fee, or contingent deferred sales charge, if applicable. May include adjustments in accordance with U.S. GAAP and as such, the net asset value for reporting purposes and the returns based upon those net asset values may differ from the net asset value and returns for shareholder transactions. |
See accompanying notes
73
American BeaconMid-Cap Value FundSM
Financial Highlights
(For a share outstanding throughout the period)
| Advisor Class | ||||||||||||||||||||||||||||||||||||
| Year Ended October 31, | ||||||||||||||||||||||||||||||||||||
| 2019 | 2018 | 2017 | 2016 | 2015A | ||||||||||||||||||||||||||||||||
|
| |||||||||||||||||||||||||||||||||||
Net asset value, beginning of period | $ | 15.17 | $ | 16.83 | $ | 13.69 | $ | 14.27 | $ | 14.46 | ||||||||||||||||||||||||||
|
|
|
|
|
|
|
|
|
| |||||||||||||||||||||||||||
Income (loss) from investment operations: | ||||||||||||||||||||||||||||||||||||
Net investment income | 0.15 | 0.10 | 0.10 | 0.16 | 0.08 | |||||||||||||||||||||||||||||||
Net gains (losses) on investments (both realized and unrealized) | 0.66 | (1.29 | ) | 3.18 | 0.05 | 0.25 | ||||||||||||||||||||||||||||||
|
|
|
|
|
|
|
|
|
| |||||||||||||||||||||||||||
Total income (loss) from investment operations | 0.81 | (1.19 | ) | 3.28 | 0.21 | 0.33 | ||||||||||||||||||||||||||||||
|
|
|
|
|
|
|
|
|
| |||||||||||||||||||||||||||
Less distributions: | ||||||||||||||||||||||||||||||||||||
Dividends from net investment income | (0.13 | ) | (0.03 | ) | (0.14 | ) | (0.08 | ) | (0.07 | ) | ||||||||||||||||||||||||||
Distributions from net realized gains | (0.79 | ) | (0.44 | ) | - | (0.71 | ) | (0.45 | ) | |||||||||||||||||||||||||||
|
|
|
|
|
|
|
|
|
| |||||||||||||||||||||||||||
Total distributions | (0.92 | ) | (0.47 | ) | (0.14 | ) | (0.79 | ) | (0.52 | ) | ||||||||||||||||||||||||||
|
|
|
|
|
|
|
|
|
| |||||||||||||||||||||||||||
Redemption fees added to beneficial interests | - | - | - | - | 0.00 | B | ||||||||||||||||||||||||||||||
|
|
|
|
|
|
|
|
|
| |||||||||||||||||||||||||||
Net asset value, end of period | $ | 15.06 | $ | 15.17 | $ | 16.83 | $ | 13.69 | $ | 14.27 | ||||||||||||||||||||||||||
|
|
|
|
|
|
|
|
|
| |||||||||||||||||||||||||||
Total returnC | 6.50 | % | (7.38 | )% | 24.10 | % | 1.82 | % | 2.25 | % | ||||||||||||||||||||||||||
|
|
|
|
|
|
|
|
|
| |||||||||||||||||||||||||||
Ratios and supplemental data: |
| |||||||||||||||||||||||||||||||||||
Net assets, end of period | $ | 3,163,999 | $ | 3,597,339 | $ | 3,682,231 | $ | 6,622,356 | $ | 6,684,131 | ||||||||||||||||||||||||||
Ratios to average net assets: | ||||||||||||||||||||||||||||||||||||
Expenses, before reimbursements | 1.45 | % | 1.39 | % | 1.40 | % | 1.40 | % | 1.37 | % | ||||||||||||||||||||||||||
Expenses, net of reimbursements | 1.45 | % | 1.39 | % | 1.40 | % | 1.40 | % | 1.37 | % | ||||||||||||||||||||||||||
Net investment income, before expense reimbursements | 0.90 | % | 0.64 | % | 0.55 | % | 1.16 | % | 0.58 | % | ||||||||||||||||||||||||||
Net investment income, net of reimbursements | 0.90 | % | 0.64 | % | 0.55 | % | 1.16 | % | 0.58 | % | ||||||||||||||||||||||||||
Portfolio turnover rate | 30 | % | 34 | % | 28 | % | 27 | % | 79 | % | ||||||||||||||||||||||||||
| A | WEDGE Capital Management was added as an investment manager to theMid-Cap Value Fund on May 11, 2015. |
| B | Amount represents less than $0.01 per share. |
| C | Based on net asset value, which does not reflect the sales charge, redemption fee, or contingent deferred sales charge, if applicable. May include adjustments in accordance with U.S. GAAP and as such, the net asset value for reporting purposes and the returns based upon those net asset values may differ from the net asset value and returns for shareholder transactions. |
See accompanying notes
74
American BeaconMid-Cap Value FundSM
Financial Highlights
(For a share outstanding throughout the period)
| A Class | ||||||||||||||||||||||||||||||||||||
| Year Ended October 31, | ||||||||||||||||||||||||||||||||||||
| 2019 | 2018 | 2017 | 2016 | 2015A | ||||||||||||||||||||||||||||||||
|
| |||||||||||||||||||||||||||||||||||
Net asset value, beginning of period | $ | 15.15 | $ | 16.84 | $ | 13.70 | $ | 14.28 | $ | 14.43 | ||||||||||||||||||||||||||
|
|
|
|
|
|
|
|
|
| |||||||||||||||||||||||||||
Income (loss) from investment operations: | ||||||||||||||||||||||||||||||||||||
Net investment income | 0.49 | 0.18 | 0.13 | 0.18 | 0.11 | |||||||||||||||||||||||||||||||
Net gains (losses) on investments (both realized and unrealized) | 0.32 | (1.36 | ) | 3.18 | 0.05 | 0.25 | ||||||||||||||||||||||||||||||
|
|
|
|
|
|
|
|
|
| |||||||||||||||||||||||||||
Total income (loss) from investment operations | 0.81 | (1.18 | ) | 3.31 | 0.23 | 0.36 | ||||||||||||||||||||||||||||||
|
|
|
|
|
|
|
|
|
| |||||||||||||||||||||||||||
Less distributions: | ||||||||||||||||||||||||||||||||||||
Dividends from net investment income | (0.14 | ) | (0.07 | ) | (0.17 | ) | (0.10 | ) | (0.06 | ) | ||||||||||||||||||||||||||
Distributions from net realized gains | (0.79 | ) | (0.44 | ) | - | (0.71 | ) | (0.45 | ) | |||||||||||||||||||||||||||
| �� |
|
|
|
|
|
|
|
|
|
| ||||||||||||||||||||||||||
Total distributions | (0.93 | ) | (0.51 | ) | (0.17 | ) | (0.81 | ) | (0.51 | ) | ||||||||||||||||||||||||||
|
|
|
|
|
|
|
|
|
| |||||||||||||||||||||||||||
Redemption fees added to beneficial interests | - | - | - | - | 0.00 | B | ||||||||||||||||||||||||||||||
|
|
|
|
|
|
|
|
|
| |||||||||||||||||||||||||||
Net asset value, end of period | $ | 15.03 | $ | 15.15 | $ | 16.84 | $ | 13.70 | $ | 14.28 | ||||||||||||||||||||||||||
|
|
|
|
|
|
|
|
|
| |||||||||||||||||||||||||||
Total returnC | 6.57 | % | (7.32 | )% | 24.26 | % | 1.98 | % | 2.35 | % | ||||||||||||||||||||||||||
|
|
|
|
|
|
|
|
|
| |||||||||||||||||||||||||||
Ratios and supplemental data: |
| |||||||||||||||||||||||||||||||||||
Net assets, end of period | $ | 3,748,595 | $ | 12,080,510 | $ | 18,170,218 | $ | 19,486,655 | $ | 16,422,504 | ||||||||||||||||||||||||||
Ratios to average net assets: | ||||||||||||||||||||||||||||||||||||
Expenses, before reimbursements | 1.35 | % | 1.25 | % | 1.27 | % | 1.26 | % | 1.25 | % | ||||||||||||||||||||||||||
Expenses, net of reimbursements | 1.35 | % | 1.25 | % | 1.27 | % | 1.26 | % | 1.25 | % | ||||||||||||||||||||||||||
Net investment income, before expense reimbursements | 0.94 | % | 0.78 | % | 0.69 | % | 1.30 | % | 0.71 | % | ||||||||||||||||||||||||||
Net investment income, net of reimbursements | 0.94 | % | 0.78 | % | 0.69 | % | 1.30 | % | 0.71 | % | ||||||||||||||||||||||||||
Portfolio turnover rate | 30 | % | 34 | % | 28 | % | 27 | % | 79 | % | ||||||||||||||||||||||||||
| A | WEDGE Capital Management was added as an investment manager to theMid-Cap Value Fund on May 11, 2015. |
| B | Amount represents less than $0.01 per share. |
| C | Based on net asset value, which does not reflect the sales charge, redemption fee, or contingent deferred sales charge, if applicable. May include adjustments in accordance with U.S. GAAP and as such, the net asset value for reporting purposes and the returns based upon those net asset values may differ from the net asset value and returns for shareholder transactions. |
See accompanying notes
75
American BeaconMid-Cap Value FundSM
Financial Highlights
(For a share outstanding throughout the period)
| C Class | ||||||||||||||||||||||||||||||||||||
| Year Ended October 31, | ||||||||||||||||||||||||||||||||||||
| 2019 | 2018 | 2017 | 2016 | 2015A | ||||||||||||||||||||||||||||||||
|
| |||||||||||||||||||||||||||||||||||
Net asset value, beginning of period | $ | 14.60 | $ | 16.27 | $ | 13.26 | $ | 13.87 | $ | 14.08 | ||||||||||||||||||||||||||
|
|
|
|
|
|
|
|
|
| |||||||||||||||||||||||||||
Income (loss) from investment operations: | ||||||||||||||||||||||||||||||||||||
Net investment income (loss) | 0.02 | 0.03 | (0.03 | ) | 0.07 | 0.01 | ||||||||||||||||||||||||||||||
Net gains (losses) on investments (both realized and unrealized) | 0.69 | (1.26 | ) | 3.11 | 0.06 | 0.23 | ||||||||||||||||||||||||||||||
|
|
|
|
|
|
|
|
|
| |||||||||||||||||||||||||||
Total income (loss) from investment operations | 0.71 | (1.23 | ) | 3.08 | 0.13 | 0.24 | ||||||||||||||||||||||||||||||
|
|
|
|
|
|
|
|
|
| |||||||||||||||||||||||||||
Less distributions: | ||||||||||||||||||||||||||||||||||||
Dividends from net investment income | (0.03 | ) | - | (0.07 | ) | (0.03 | ) | - | ||||||||||||||||||||||||||||
Distributions from net realized gains | (0.79 | ) | (0.44 | ) | - | (0.71 | ) | (0.45 | ) | |||||||||||||||||||||||||||
|
|
|
|
|
|
|
|
|
| |||||||||||||||||||||||||||
Total distributions | (0.82 | ) | (0.44 | ) | (0.07 | ) | (0.74 | ) | (0.45 | ) | ||||||||||||||||||||||||||
|
|
|
|
|
|
|
|
|
| |||||||||||||||||||||||||||
Redemption fees added to beneficial interests | - | - | - | - | 0.00 | B | ||||||||||||||||||||||||||||||
|
|
|
|
|
|
|
|
|
| |||||||||||||||||||||||||||
Net asset value, end of period | $ | 14.49 | $ | 14.60 | $ | 16.27 | $ | 13.26 | $ | 13.87 | ||||||||||||||||||||||||||
|
|
|
|
|
|
|
|
|
| |||||||||||||||||||||||||||
Total returnC | 5.94 | % | (7.85 | )% | 23.27 | % | 1.19 | % | 1.57 | % | ||||||||||||||||||||||||||
|
|
|
|
|
|
|
|
|
| |||||||||||||||||||||||||||
Ratios and supplemental data: |
| |||||||||||||||||||||||||||||||||||
Net assets, end of period | $ | 4,349,946 | $ | 5,840,412 | $ | 6,520,983 | $ | 6,030,130 | $ | 6,238,827 | ||||||||||||||||||||||||||
Ratios to average net assets: | ||||||||||||||||||||||||||||||||||||
Expenses, before reimbursements | 2.02 | % | 1.87 | % | 2.04 | % | 2.04 | % | 2.01 | % | ||||||||||||||||||||||||||
Expenses, net of reimbursements | 2.02 | % | 1.87 | % | 2.04 | % | 2.04 | % | 2.01 | % | ||||||||||||||||||||||||||
Net investment income (loss), before expense reimbursements | 0.32 | % | 0.17 | % | (0.09 | )% | 0.53 | % | (0.05 | )% | ||||||||||||||||||||||||||
Net investment income (loss), net of reimbursements | 0.32 | % | 0.17 | % | (0.09 | )% | 0.53 | % | (0.05 | )% | ||||||||||||||||||||||||||
Portfolio turnover rate | 30 | % | 34 | % | 28 | % | 27 | % | 79 | % | ||||||||||||||||||||||||||
| A | WEDGE Capital Management was added as an investment manager to theMid-Cap Value Fund on May 11, 2015. |
| B | Amount represents less than $0.01 per share. |
| C | Based on net asset value, which does not reflect the sales charge, redemption fee, or contingent deferred sales charge, if applicable. May include adjustments in accordance with U.S. GAAP and as such, the net asset value for reporting purposes and the returns based upon those net asset values may differ from the net asset value and returns for shareholder transactions. |
See accompanying notes
76
American BeaconMid-Cap Value FundSM
Financial Highlights
(For a share outstanding throughout the period)
| R6 Class | ||||||||||||
| Year Ended October 31, 2019 | February 28, 2018A to October 31, 2018 | |||||||||||
|
| |||||||||||
Net asset value, beginning of period | $ | 15.52 | $ | 16.94 | ||||||||
|
|
|
| |||||||||
Income (loss) from investment operations: | ||||||||||||
Net investment income | 0.20 | 0.10 | ||||||||||
Net gains (losses) on investments (both realized and unrealized) | 0.71 | (1.52 | ) | |||||||||
|
|
|
| |||||||||
Total income (loss) from investment operations | 0.91 | (1.42 | ) | |||||||||
|
|
|
| |||||||||
Less distributions: | ||||||||||||
Dividends from net investment income | (0.22 | ) | - | |||||||||
Distributions from net realized gains | (0.79 | ) | - | |||||||||
|
|
|
| |||||||||
Total distributions | (1.01 | ) | - | |||||||||
|
|
|
| |||||||||
Net asset value, end of period | $ | 15.42 | $ | 15.52 | ||||||||
|
|
|
| |||||||||
Total returnB | 7.15 | % | (8.38 | )%C | ||||||||
|
|
|
| |||||||||
Ratios and supplemental data: |
| |||||||||||
Net assets, end of period | $ | 2,253,328 | $ | 191,772 | ||||||||
Ratios to average net assets: | ||||||||||||
Expenses, before reimbursements | 0.90 | % | 3.09 | %D | ||||||||
Expenses, net of reimbursements | 0.83 | % | 0.88 | %D | ||||||||
Net investment income (loss), before expense reimbursements | 1.51 | % | (0.88 | )%D | ||||||||
Net investment income, net of reimbursements | 1.58 | % | 1.32 | %D | ||||||||
Portfolio turnover rate | 30 | % | 34 | %C | ||||||||
| A | Commencement of operations. |
| B | Based on net asset value, which does not reflect the sales charge, redemption fee, or contingent deferred sales charge, if applicable. May include adjustments in accordance with U.S. GAAP and as such, the net asset value for reporting purposes and the returns based upon those net asset values may differ from the net asset value and returns for shareholder transactions. |
| C | Not annualized. |
| D | Annualized. |
See accompanying notes
77
American Beacon FundsSM
October 31, 2019 (Unaudited)
Certain tax information regarding the Funds is required to be provided to shareholders based upon the Funds’ income and distributions for the taxable year ended October 31, 2019. The information and distributions reported herein may differ from information and distributions taxable to the shareholders for the calendar year ended December 31, 2019.
The Funds designated the following items with regard to distributions paid during the fiscal year ended October 31, 2019. All designations are based on financial information available as of this annual report and, accordingly, are subject to change. For each item, it is the intention of the Funds to designate the maximum amount permitted under the Internal Revenue Code of 1986, as amended, and the regulations there under.
Corporate Dividends-Received Deduction: | ||||
Balanced | 71.39 | % | ||
Mid-Cap Value | 100.00 | % | ||
Qualified Dividend Income: | ||||
Balanced | 97.00 | % | ||
Mid-Cap Value | 100.00 | % | ||
Long-Term Capital Gain Distributions: | ||||
Balanced | $ | 20,913,631 | ||
Mid-Cap Value | 37,246,762 | |||
Short-Term Capital Gain Distributions: | ||||
Balanced | $ | 991,251 | ||
Mid-Cap Value | - | |||
Shareholders will receive notification in January 2020 of the applicable tax information necessary to prepare their 2019 income tax returns.
78
Disclosure Regarding Approval of the Management and Investment Advisory Agreements(Unaudited)
Renewal and Approval of Management Agreement and Investment Advisory Agreements
Atin-person meetings held on May 9, 2019 and June4-5, 2019 (collectively, the “Meetings”), the Board of Trustees (“Board” or “Trustees”) considered and then, at its June 5, 2019 meeting, approved the renewal of:
(1) the Management Agreement between American Beacon Advisors, Inc. (“Manager” or “AmBeacon”) and the American Beacon Funds (“Trust”), on behalf of the American Beacon Balanced Fund (“Balanced Fund”) and the American BeaconMid-Cap Value Fund(“Mid-Cap Fund”) (each, a “Fund” and collectively, the “Funds”);
(2) the Investment Advisory Agreements among the Manager, the Trust, on behalf of the Balanced Fund, and each of Barrow, Hanley, Mewhinney & Strauss, LLC (“Barrow”), Brandywine Global Investment Management, LLC (“Brandywine”) and Hotchkis and Wiley Capital Management, LLC (“Hotchkis”); and
(3) the Investment Advisory Agreements among the Manager, the Trust, on behalf of theMid-Cap Fund, and each of Barrow, Pzena Investment Management, LLC (“Pzena”) and WEDGE Capital Management, LLP (“WEDGE”).
Barrow, Brandywine, Hotchkis, Pzena and WEDGE are hereinafter each referred to as a “subadvisor” and collectively as the “subadvisors.” The Management Agreement and the Investment Advisory Agreements are referred to herein individually as an “Agreement” and collectively as the “Agreements.” In preparation for its consideration of the renewal of the Agreements, the Board undertook steps to gather and consider information furnished by the Manager, the subadvisors, Broadridge, Inc. (“Broadridge”) and Morningstar, Inc. (“Morningstar”).The Board, with the assistance of independent legal counsel, requested and received certain relevant information from the Manager and the subadvisors.
In advance of the Meetings, the Board’s Investment Committee and/or the Manager coordinated the production of information from Broadridge and Morningstar regarding the performance, fees and expenses of the Funds as well as information from the Manager and the subadvisors. At the Meetings, the Board considered the information provided in connection with the renewal process, as well as information furnished to the Board throughout the year at regular meetings of the Board and its committees. In connection with the Board’s consideration of the Agreements, the Board received and evaluated such information as they deemed necessary. This information is described below in the section summarizing the factors the Board considered in connection with its renewal and approval of the Agreements, as well as the section describing additional Board considerations with respect to each Fund.
The Board noted that the Manager provides management and administrative services to the Funds pursuant to the Management Agreement. The Board considered that many mutual funds have separate contracts governing each type of service and observed that, with respect to such mutual funds, the actual management fee rates provided by Broadridge for peer group funds reflect the combined advisory and administrative expenses, reduced by any fee waivers and/or reimbursements.
A firm may not have been able to, or opted not to, provide information in response to certain information requests, in which case the Board conducted its evaluation of the firm based on information that was provided. In such cases, the Board determined that the omission of any such information was not material to its considerations. For each Fund, the class of shares used for comparative performance purposes was the share class with the lowest expenses available for purchase by the general public, which was the Institutional Class. The Board also considered that the use of Institutional Class performance generally facilitates a meaningful comparison for expense and performance purposes.
Provided below is an overview of certain factors the Board considered in connection with its renewal and approval of the Agreements. The Board did not identify any particular information that was most relevant to its consideration to renew or approve each Agreement, and each Trustee may have afforded different weight to the various factors. Legal counsel to the independent Trustees provided the Board with a memorandum regarding its responsibilities pertaining to the renewal and approval of investment advisory contracts, such as the Agreements.
79
Disclosure Regarding Approval of the Management and Investment Advisory Agreements(Unaudited)
The memorandum explained the regulatory requirements surrounding the Board’s process for evaluating investment advisors and the terms of investment advisory contracts. Based on its evaluation, the Board unanimously concluded that the terms of each Agreement were reasonable and fair and that the renewal and approval of each Agreement was in the best interests of the Funds and their shareholders.
Considerations With Respect to the Renewal of the Management Agreement and the Investment Advisory Agreements
In determining whether to renew the Agreements, the Board considered each Fund’s investment management and subadvisory relationships separately. In each instance, the Board considered, among other things, the following factors: (1) the nature, extent and quality of the services provided; (2) the investment performance of the Funds; (3) the costs incurred by the Manager in rendering services to the Funds and its resulting profits or losses; (4) comparisons of services and fee rates with contracts entered into by the Manager or the subadvisors or their affiliates with other clients (such as pension funds and other institutional clients); (5) the extent to which economies of scale, if any, have been taken into account in setting each fee rate schedule; (6) whether fee rate levels reflect economies of scale, if any, for the benefit of Fund investors; and (7) any other benefits derived or anticipated to be derived by the Manager or the subadvisors from their relationships with the Funds.
Nature, Extent and Quality of Services.With respect to the renewal of the Management Agreement, the Board considered, among other factors: each Fund’s long-term performance; the length of service of key investment personnel at the Manager; the cost structure of the Funds; the Manager’s culture of compliance and support that reduce risks to the Funds; the Manager’s quality of services; the Manager’s active role in monitoring and, as appropriate, recommending additional or replacement subadvisors; and the Manager’s efforts to retain key employees and maintain staffing levels.
With respect to the renewal of the Investment Advisory Agreements, the Board considered the level of staffing and the size of the subadvisors. The Board also considered the adequacy of the resources committed to the Funds by the subadvisors, and whether those resources were commensurate with the needs of the Funds and are sufficient to sustain appropriate levels of performance and compliance needs. In this regard, the Board considered the financial stability of the subadvisors. The Board also considered each subadvisor’s representations regarding its compliance program and code of ethics. Based on the foregoing information, the Board concluded that the nature, extent and quality of the management and advisory services provided by the Manager and the subadvisors were appropriate for each Fund.
Investment Performance.The Board evaluated the comparative information provided by Broadridge and the Manager regarding the performance of each Fund relative to its Broadridge performance universe, Morningstar Category, and benchmark index, as well as the Fund’s Morningstar rating. The Board considered the information provided by Broadridge regarding Broadridge’s independent methodology for selecting each Fund’s Broadridge performance universe. The Board also considered that the performance universes selected by Broadridge may not provide appropriate comparisons for a Fund. In addition, the Board considered the performance reports and discussions with management at Board and Committee meetings throughout the year. The Board also evaluated the comparative information provided by each subadvisor regarding the performance of its portion of the relevant Fund relative to the performance of a composite of similar accounts managed by the subadvisor and the relevant Fund’s benchmark index. In addition, the Board considered the Manager’s recommendation to continue to retain each subadvisor. A discussion regarding the Board’s considerations with respect to each Fund’s performance appears below under “Additional Considerations and Conclusions with Respect to Each Fund.”
Costs of the Services Provided to the Funds and the Profits Realized by the Manager from its Relationship with the Funds.In analyzing the cost of services and profitability of the Manager, the Board considered the revenues earned and the expenses incurred by the Manager, before and after the payment of distribution-related expenses by the Manager. The profits or losses were noted at both an aggregate level for all funds within the group of mutual funds sponsored by the Manager (the “Fund Complex”) and at an individual Fund level, with the Manager earning a profit with respect to each Fund before and after the payment of distribution-related expenses by the
80
Disclosure Regarding Approval of the Management and Investment Advisory Agreements(Unaudited)
Manager. The Board also considered comparative information provided by the Manager regarding the Manager’s overall profitability with respect to the Fund Complex relative to the overall profitability of other firms in the mutual fund industry, as disclosed in publicly available sources. Although the Board noted that, in certain cases, the fee rates paid by other clients of the Manager are lower than the fee rates paid by the Funds, the Manager represented that, among other matters, the difference is attributable to the fact that the Manager does not perform administrative services fornon-investment company clients and reflects the greater level of responsibility and regulatory requirements associated with managing the Funds.
The Board further considered that, with respect to each Fund, the Management Agreement provides for the Manager to receive a management fee comprised of an annualized fee that is retained by the Manager. In addition, the Board considered that the Manager receives fees for making direct investment decisions for the portion of the Balanced Fund with respect to which the Manager has not delegatedday-to-day management to a subadviser and for overseeing the securities lending program on behalf of each Fund. The Board also considered that the Manager receives fees for overseeing the securities lending program on behalf of each Fund. The Board also noted that certain share classes of the Funds maintain higher expense ratios in order to compensate third-party financial intermediaries.
In analyzing the fee rates charged by each subadvisor in connection with its investment advisory services to a Fund, the Board considered representations made by each subadvisor that the fee rate negotiated by the Manager is favorable relative to the fee rates that the subadvisor charges for any comparable client accounts. The Board did not request profitability data from the subadvisors because the Board did not view this data as imperative to its deliberations given thearm’s-length nature of the relationship between the Manager and the subadvisors with respect to the negotiation of subadvisory fee rates. In addition, the Board considered that it was advised that the subadvisors may not account for their profits on anaccount-by-account basis and that different firms likely employ different methodologies in connection with these calculations.
Based on the foregoing information, the Board concluded that the profitability levels of the Manager were reasonable in light of the services performed by the Manager. A discussion regarding the Board’s considerations with respect to each Fund’s fee rates is set forth below under “Additional Considerations and Conclusions with Respect to Each Fund.”
Economies of Scale.In considering the reasonableness of the management and investment advisory fees rates, the Board considered whether economies of scale will be realized as each Fund grows and whether fee rate levels reflect these economies of scale for the benefit of Fund shareholders. In this regard, the Board considered that, with respect to each subadvisor, the Manager has negotiated breakpoints with respect to each Fund’s subadvisory fee rate. In addition, the Board noted the Manager’s representation that the Management Agreements contain fee schedule breakpoints at higher asset levels with respect to each Fund, except for the portion of the Balanced Fund with respect to which the Manager has not delegatedday-to-day management to a subadvisor. Based on the foregoing information, the Board concluded that the Manager and subadvisor fee rate schedules for each Fund provide for a reasonable sharing of benefits from any economies of scale with each Fund.
Benefits Derived from the Relationship with the Funds.The Board considered the“fall-out” or ancillary benefits that accrue to the Manager and/or the subadvisors as a result of the advisory relationships with the Funds, including greater exposure in the marketplace with respect to the Manager’s or a subadvisor’s investment process and expanding the level of assets under management by the Manager and the subadvisors. The Board also considered that the Manager may invest the Funds’ cash balances and cash collateral provided by the borrowers of the Funds’ securities in the American Beacon U.S. Government Money Market Select Fund, which the Manager manages directly. In addition, the Board noted that each subadvisor benefits from soft dollar arrangements for proprietary and/or third-party research. Based on the foregoing information, the Board concluded that the potential benefits accruing to the Manager and the subadvisors by virtue of their relationships with the Funds appear to be fair and reasonable.
81
Disclosure Regarding Approval of the Management and Investment Advisory Agreements(Unaudited)
Additional Considerations and Conclusions with Respect to Each Fund
The performance comparisons below were made in comparison to each Fund’s Broadridge performance universe and Morningstar Category. With respect to the Broadridge performance universe, the 1st Quintile represents the top 20 percent of the universe based on performance and the 5th Quintile representing the bottom 20 percent of the universe based on performance. References below to each Fund’s Broadridge performance universe are to the universe of mutual funds with a comparable investment classification/objective included in the analysis provided by Broadridge. In reviewing the performance, the Trustees viewed longer-term performance over a full market cycle as the most important consideration, because relative performance over shorter periods may be significantly impacted by market or economic events and not necessarily reflective of manager skill.
The expense comparisons below were made in comparison to each Fund’s Broadridge expense universe and Broadridge expense group, with the 1st Quintile representing the lowest 20 percent of the universe or group based on lowest total expense and the 5th Quintile representing the highest 20 percent of the universe or group based on highest total expense. References below to each Fund’s expense group and expense universe are to the respective group or universe of comparable mutual funds included in the analysis by Broadridge. A Broadridge expense group consists of the Fund and a representative sample of funds with similar operating structures and asset sizes, as selected by Broadridge. A Broadridge expense universe includes all funds in the investment classification/objective with a similar operating structure as the share class of the Fund included in the Broadridge comparative information and provides a broader view of expenses across the Fund’s investment classification/objective. The Board also considered each Fund’s Morningstar fee level category. In reviewing expenses, the Board considered the positive impact of fee waivers where applicable and the Manager’s agreement to continue the fee waivers. In addition, information regarding the subadvisors’ use of soft dollars was requested from the Manager and was considered by the Board.
Additional Considerations and Conclusions with Respect to the American Beacon Balanced Fund
In considering the renewal of the Management Agreement for the Balanced Fund, the Board considered the following additional factors:
Broadridge Total Expenses Excluding12b-1 Fees and Morningstar Fee Level Ranking
Compared to Broadridge Expense Group | 1st Quintile | |
Compared to Broadridge Expense Universe | 2nd Quintile | |
Morningstar Fee Level Ranking – Institutional Class | Low Expense Ratio |
Broadridge and Morningstar Performance Analysis(five-year period ended December 31, 2018)
Compared to Broadridge Performance Universe | 3rd Quintile | |
Compared to Morningstar Category | 3rd Quintile |
The Board noted that AmBeacon receives an additional fee under the Management Agreement for making direct investment decisions with respect to an allocation of the Balanced Fund. In considering the renewal of the Management Agreement with AmBeacon and the Investment Advisory Agreements with Barrow, Brandywine, Hotchkis and AmBeacon, the Board considered that the diversification of investment strategies facilitated by the Balanced Fund’s multi-manager structure permits the Balanced Fund to mitigate the risks associated with a single subadvisor. The Board also considered the following additional factors:
82
Disclosure Regarding Approval of the Management and Investment Advisory Agreements(Unaudited)
Subadvisor Performance(compared to Broadridge Performance Universe for period indicated ended December 31, 2018)
Barrow | 5 Years | 2 | nd Quintile | |||||
Brandywine | 5 Years | 4 | th Quintile | |||||
Hotchkis* | 5 Years | 3 | rd Quintile | |||||
AmBeacon** | 5 Years | 2 | nd Quintile | |||||
* Hotchkis equity value-only return compared to the Broadridge large cap value performance universe |
| |||||||
** AmBeacon bond-only return compared to Broadridge core bond performance universe |
| |||||||
The Board also considered: (1) that the funds included in the Broadridge performance universe are managed pursuant to a variety of investment styles, and the Balanced Fund may underperform when a value investment style is out of favor; (2) the Manager invests the Balanced Fund’s fixed income portfolio exclusively in investment grade debt securities while the funds in the Broadridge performance universe may invest in high yield debt securities; (3) information provided by each subadvisor regarding fee rates charged for managing assets in the same or a similar strategy as the subadvisor manages its allocation of the Balanced Fund; (4) the Manager’s recommendation to continue to retain each subadvisor; and (5) the Manager’s representation that, while the Manager was recommending that the Board continue to retain Brandywine, the Manager continues to evaluate the performance of Brandywine’s portion of the Fund and whether to make any further recommendations with respect to that subadvisor.
Based on these and other considerations, the Board: (1) concluded that the fees paid to the Manager and the subadvisors under the Management and Investment Advisory Agreements are fair and reasonable; and (2) determined that the Balanced Fund and its shareholders would benefit from the Manager’s and subadvisors’ continued management of the Balanced Fund.
Additional Considerations and Conclusions with Respect to the American BeaconMid-Cap Value Fund
In considering the renewal of the Management Agreement for theMid-Cap Fund, the Board considered the following additional factors:
Broadridge Total Expense Analysis Excluding12b-1 Fees and Morningstar Fee Level Ranking
Compared to Broadridge Expense Group | 3rd Quintile | |
Compared to Broadridge Expense Universe | 4th Quintile | |
Morningstar Fee Level Ranking – Institutional Class | Average Expense Ratio |
Broadridge and Morningstar Performance Analysis(five-year period ended December 31, 2018)
Compared to Broadridge Performance Universe | 3rd Quintile | |
Compared to Morningstar Category | 4th Quintile |
In considering the renewal of the Investment Advisory Agreements with Barrow, Pzena and WEDGE, the Board considered that the diversification of investment strategies facilitated by theMid-Cap Fund’s multi-manager structure permits theMid-Cap Fund to mitigate the risks associated with a single subadvisor. The Board also considered the following additional factors:
Subadvisor Performance(compared to Broadridge Performance Universe for period indicated ended December 31, 2018)
| Barrow | 5 Years | 5th Quintile | ||
| Pzena | 5 Years | 2nd Quintile | ||
| WEDGE* | 3 Years | 3rd Quintile | ||
* Does not yet have a5-year performance record. | ||||
83
Disclosure Regarding Approval of the Management and Investment Advisory Agreements(Unaudited)
The Board also considered: (1) that theMid-Cap Fund’s Broadridge expense group and expense universe are comprised principally of single-manager funds, which typically reach breakpoints in their subadvisory fee schedules sooner than multi-manager funds; (2) the Manager’s representation that Barrow’s disciplined value investment style (in companies with lowprice-to-earnings, lowprice-to-book, and modest dividend yield) was out of favor during early 2016 and the latter part of 2018 but has rebounded in 2019; (3) information provided by each subadvisor regarding fee rates charged for managing assets in the same or a similar strategy as the subadvisor manages its allocation of theMid-Cap Fund; and (4) the Manager’s recommendation to continue to retain each subadvisor at the present time.
Based on these and other considerations, the Board: (1) concluded that the fees paid to the Manager and the subadvisors under the Management and Investment Advisory Agreements are fair and reasonable; and (2) determined that theMid-Cap Fund and its shareholders would benefit from the Manager’s and subadvisors’ continued management of theMid-Cap Fund.
84
Trustees and Officers of the American Beacon FundsSM(Unaudited)
The Trustees and officers of the American Beacon Funds (the “Trust”) are listed below, together with their principal occupations during the past five years. The address of each person listed below is 220 Las Colinas Boulevard East, Suite 1200, Irving, Texas 75039. Each Trustee overseesthirty-six funds in the fund complex that includes the Trust, the American Beacon Select Funds, the American Beacon Institutional Funds Trust, the American Beacon Sound Point Enhanced Income Fund, American Beacon Apollo Total Return Fund and the American Beacon Sound Point Alternative Lending Fund. The Trust’s Statement of Additional Information contains additional information about the Trustees and is available without charge by calling1-800-658-5811.
Name, Age | Position, Term of Office and Length of Time Served with the Trust | Principal Occupation(s) During Past 5 Years and Current Directorships | ||
| INTERESTED TRUSTEES | Term | |||
| Lifetime of Trust until removal, resignation or retirement* | ||||
| Alan D. Feld** (82) | Trustee since 1996 | Partner in the law firm of Akin, Gump, Strauss, Hauer & Feld, LLP (law firm) (1960-Present); Trustee, American Beacon Select Funds (1999-Present); Trustee, American Beacon Institutional Funds Trust (2017-Present); Trustee, American Beacon Sound Point Enhanced Income Fund (2018-Present); Trustee, American Beacon Apollo Total Return Fund (2018-Present); Trustee, American Beacon Sound Point Alternative Lending Fund (2019-Present). | ||
| NON-INTERESTED TRUSTEES | Term | |||
Lifetime of Trust until removal, resignation or retirement* | ||||
| Gilbert G. Alvarado (49) | Trustee since 2015 | Director, Kura MD, Inc. (local telehealth organization) (2015-present); Vice President & CFO, Sierra Health Foundation (health conversion private foundation) (2006-Present); Vice President & CFO, Sierra Health Foundation: Center for Health Program Management (California public benefit corporation) (2012-Present); Director, Innovative North State (2012-2015); Director, Sacramento Regional Technology Alliance (2011-2016); Director, Women’s Empowerment (2009-2014); Director, Valley Healthcare Staffing (2017-present); Trustee, American Beacon Select Funds (2015-Present); Trustee, American Beacon Institutional Funds Trust (2017-Present); Trustee, American Beacon Sound Point Enhanced Income Fund (2018-Present); Trustee, American Beacon Apollo Total Return Fund (2018-Present); Trustee, American Beacon Sound Point Alternative Lending Fund (2019-Present). | ||
| Joseph B. Armes (57) | Trustee since 2015 | Chairman & CEO, CSW Industrials f/k/a Capital Southwest Corporation (investment company) (2015-Present); Chairman of the Board of Capital Southwest Corporation, predecessor to CSW Industrials, Inc. (2014-2017) (investment company); CEO, Capital Southwest Corporation (2013-2015); President & CEO, JBA Investment Partners (family investment vehicle) (2010-Present); Director and Chair of Audit Committee, RSP Permian (oil and gas producer) (2013-Present); Trustee, American Beacon Select Funds (2015-Present); Trustee, American Beacon Institutional Funds Trust (2017-Present); Trustee, American Beacon Sound Point Enhanced Income Fund (2018-Present); Trustee, American Beacon Apollo Total Return Fund (2018-Present); Trustee, American Beacon Sound Point Alternative Lending Fund (2019-Present). | ||
| Gerard J. Arpey (61) | Trustee since 2012 | Director, The Home Depot, Inc. (2015-Present); Partner, Emerald Creek Group (private equity firm) (2011-Present); Director, S.C. Johnson & Son, Inc. (privately held company) (2008-present); Trustee, American Beacon Select Funds (2012-Present); Trustee, American Beacon Institutional Funds Trust (2017-Present); Trustee, American Beacon Sound Point Enhanced Income Fund (2018-Present); Trustee, American Beacon Apollo Total Return Fund (2018-Present); Trustee, American Beacon Sound Point Alternative Lending Fund (2019-Present). | ||
85
Trustees and Officers of the American Beacon FundsSM(Unaudited)
Name, Age | Position, Term of Office and Length of Time Served with the Trust | Principal Occupation(s) During Past 5 Years and Current Directorships | ||
| NON-INTERESTED TRUSTEES (CONT.) | Term | |||
Lifetime of Trust until removal, resignation or retirement* | ||||
| Brenda A. Cline (58) | Trustee since 2004 Chair since 2019 Vice Chair 2018 | Chief Financial Officer, Treasurer and Secretary, Kimbell Art Foundation (1993-Present); Director, Tyler Technologies, Inc. (public sector software solutions company) (2014-Present); Director, Range Resources Corporation (oil and natural gas company) (2015-Present); Trustee, CushingClosed-End andOpen-End Funds and ETFs (2017-Present); Trustee, American Beacon Select Funds (2004-Present); Trustee, American Beacon Institutional Funds Trust (2017-Present); Trustee, American Beacon Sound Point Enhanced Income Fund (2018-Present); Trustee, American Beacon Apollo Total Return Fund (2018-Present); Trustee, American Beacon Sound Point Alternative Lending Fund(2019-Present). | ||
| Eugene J. Duffy (65) | Trustee since 2008 | Managing Director, Global Investment Management Distribution, Mesirow Financial (2016-Present); Managing Director, Institutional Services, Intercontinental Real Estate Corporation (2014-Present); Principal and Executive Vice President, Paradigm Asset Management (1994-2014); Trustee, American Beacon Select Funds (2008-Present); Trustee, American Beacon Institutional Funds Trust (2017-Present); Trustee, American Beacon Sound Point Enhanced Income Fund (2018-Present); Trustee, American Beacon Apollo Total Return Fund (2018-Present); Trustee, American Beacon Sound Point Alternative Lending Fund (2019-Present). | ||
| Claudia A. Holz (62) | Trustee since 2018 | Partner, KPMG LLP (1990-2017); Trustee, American Beacon Select Funds (2018-Present); Trustee, American Beacon Institutional Funds Trust (2018-Present); Trustee, American Beacon Sound Point Enhanced Income Fund (2018-Present); Trustee, American Beacon Apollo Total Return Fund (2018-Present); Trustee, American Beacon Sound Point Alternative Lending Fund (2019-Present). | ||
| Douglas A. Lindgren (57) | Trustee since 2018 | CEO North America, Carne Global Financial Services (2016-2017); Managing Director, IPS Investment Management and Global Head, Content Management, UBS Wealth Management (2010-2016); Trustee, American Beacon Select Funds (2018-Present); Trustee, American Beacon Institutional Funds Trust (2018-Present); Trustee, American Beacon Sound Point Enhanced Income Fund (2018-Present); Trustee, American Beacon Apollo Total Return Fund (2018-Present); Trustee, American Beacon Sound Point Alternative Lending Fund (2019-Present). | ||
| Richard A. Massman (76) | Trustee since 2004 Chair 2008-2018 Chair Emeritus since 2019 | Consultant and General Counsel Emeritus, Hunt Consolidated, Inc. (holding company engaged in oil and gas exploration and production, refining, real estate, farming, ranching and venture capital activities) (2009-Present); Trustee, American Beacon Select Funds (2004-Present); Trustee, American Beacon Institutional Funds Trust (2017-Present); Trustee, American Beacon Sound Point Enhanced Income Fund (2018-Present); Trustee, American Beacon Apollo Total Return Fund (2018-Present); Trustee, American Beacon Sound Point Alternative Lending Fund (2019-Present). | ||
| Barbara J. McKenna, CFA (56) | Trustee since 2012 | President/Managing Principal, Longfellow Investment Management Company (2005-Present); Trustee, American Beacon Select Funds (2012-Present); Trustee, American Beacon Institutional Funds Trust (2017-Present); Trustee, American Beacon Sound Point Enhanced Income Fund (2018-Present); Trustee, American Beacon Apollo Total Return Fund (2018-Present); Trustee, American Beacon Sound Point Alternative Lending Fund (2019-Present). | ||
86
Trustees and Officers of the American Beacon FundsSM(Unaudited)
Name, Age | Position, Term of Office and Length of Time Served with the Trust | Principal Occupation(s) During Past 5 Years and Current Directorships | ||
| NON-INTERESTED TRUSTEES (CONT.) | Term | |||
Lifetime of Trust until removal, resignation or retirement* | ||||
| R. Gerald Turner (73) | Trustee since 2001 | President, Southern Methodist University (1995-Present); Director, J.C. Penney Company, Inc. (1996-Present); Director, Kronus Worldwide Inc. (chemical manufacturing) (2003-Present); Trustee, American Beacon Select Funds (2001-Present); Trustee, American Beacon Institutional Funds Trust (2017-Present); Trustee, American Beacon Sound Point Enhanced Income Fund (2018-Present); Trustee, American Beacon Apollo Total Return Fund (2018-Present); Trustee, American Beacon Sound Point Alternative Lending Fund (2019-Present). | ||
| OFFICERS | Term | |||
| One Year | ||||
| Gene L. Needles, Jr. (64) | President since 2009 | President (2009-2018), CEO and Director (2009-Present), and Chairman (2018-Present), American Beacon Advisors, Inc., President (2015-2018), Director and CEO (2015-Present), and Chairman (2018-Present), Resolute Investment Holdings, LLC; President (2015-2018), Director and CEO (2015-Present), and Chairman (2018-Present), Resolute Topco, Inc.; President (2015-2018); Director, and CEO (2015-Present), and Chairman (2018-Present), Resolute Acquisition, Inc.; President (2015-2018), Director and CEO (2015-Present), Chairman (2018-Present), Resolute Investment Managers, Inc.; Director, Chairman, President and CEO, Resolute Investment Distributors (2017-Present); Director, Chairman, President and CEO; Resolute Investment Services, Inc. (2017-Present); President and CEO, Lighthouse Holdings Parent, Inc. (2009-2015); President, CEO and Director, Lighthouse Holdings, Inc. (2009-2015); Manager, President and CEO, American Private Equity Management, LLC (2012-Present); Director, Chairman, President and CEO, Alpha Quant Advisors, LLC (2016-Present); Director, ARK Investment Management LLC (2016-Present); Director, Shapiro Capital Management LLC (2017-Present); Director, Chairman and CEO, Continuous Capital, LLC (2018-Present); President, American Beacon Cayman Managed Futures Strategy Fund, Ltd. (2014-Present); Director and President, American Beacon Cayman Transformational Innovation Company, LTD., (2017-2018); President, American Beacon Delaware Transformational Innovation Corporation (2017-2018); President American Beacon Cayman TargetRisk Company, Ltd. (2018-Present); Member, Investment Advisory Committee, Employees Retirement System of Texas (2017-Present); Trustee, American Beacon NextShares Trust (2015-Present); President, American Beacon Select Funds (2009-Present); President, American Beacon Institutional Funds Trust (2017-Present); President, American Beacon Sound Point Enhanced Income Fund (2018-Present); President, American Beacon Apollo Total Return Fund (2018-Present); Director, RSW Investments Holdings LLC, (2019-Present); Manager, SSI Investment Management, LLC (2019-Present); President, American Beacon Sound Point Alternative Lending Fund (2019-Present); Director, Green Harvest Asset Management (2019-Present). | ||
87
Trustees and Officers of the American Beacon FundsSM(Unaudited)
Name, Age | Position, Term of Office and Length of Time Served with the Trust | Principal Occupation(s) During Past 5 Years and Current Directorships | ||
| OFFICERS (CONT.) | Term | |||
| One Year | ||||
| Rosemary K. Behan (60) | VP, Secretary and Chief Legal Officer since 2006 | Vice President, Secretary and General Counsel, American Beacon Advisors, Inc. (2006-Present); Secretary, Resolute Investment Holdings, LLC (2015-Present); Secretary, Resolute Topco, Inc. (2015-Present); Secretary, Resolute Acquisition, Inc. (2015-Present); Vice President, Secretary and General Counsel, Resolute Investment Managers, Inc. (2015-Present); Secretary, Resolute Investment Distributors, Inc. (2017-Present); Vice President, Secretary and General Counsel, Resolute Investment Services, Inc. (2017-Present); Vice President and Secretary, Lighthouse Holdings Parent, Inc. (2008-2015); Vice President and Secretary, Lighthouse Holdings, Inc. (2008-2015); Secretary, American Private Equity Management, LLC (2008-Present); Secretary and General Counsel, Alpha Quant Advisors, LLC (2016-Present); Vice President and Secretary, Continuous Capital, LLC (2018-Present); Secretary, American Beacon Delaware Transformational Innovation Corporation (2017-2018); Secretary, American Beacon Cayman Transformational Innovation Company, Ltd. (2017-2018); Secretary, American Beacon Cayman Managed Futures Strategy Fund, Ltd. (2014-Present); Secretary, American Beacon Cayman TargetRisk Company, Ltd (2018-Present); Chief Legal Officer, Vice President and Secretary, American Beacon Select Funds (2006-Present); Chief Legal Officer, Vice President and Secretary, American Beacon Institutional Funds Trust (2017-Present); Chief Legal Officer, Vice President and Secretary, American Beacon Sound Point Enhanced Income Fund (2018-Present); Chief Legal Officer, Vice President and Secretary American Beacon Apollo Total Return Fund (2018-Present); Chief Legal Officer, Vice President and Secretary, American Beacon Sound Point Alternative Lending Fund (2019-Present); Secretary, Green Harvest Asset Management (2019-Present). | ||
| Brian E. Brett (59) | VP since 2004 | Senior Vice President, Head of Distribution (2012-Present), Vice President, Director of Sales (2004-2012), American Beacon Advisors, Inc.; Senior Vice President, Resolute Investment Managers, Inc. (2017-Present); Senior Vice President, Resolute Investment Distributors, Inc. (2018-Present), Senior Vice President, Resolute Investment Services, Inc. (2018-Present); Senior Vice President, Lighthouse Holdings Parent, Inc. (2008-2015); Senior Vice President, Lighthouse Holdings, Inc. (2008-2015); Vice President, American Beacon Select Funds (2004-Present); Vice President, American Beacon Institutional Funds Trust (2017-Present); Vice President American Beacon Sound Point Enhanced Income Fund (2018-Present); Vice President American Beacon Apollo Total Return Fund (2018-Present); Vice President, American Beacon Sound Point Alternative Lending Fund (2019-Present). | ||
| Paul B. Cavazos (50) | VP since 2016 | Chief Investment Officer and Senior Vice President, American Beacon Advisors, Inc. (2016-Present); Chief Investment Officer, DTE Energy (2007-2016); Vice President, American Private Equity Management, L.L.C. (2017-Present); Vice President, American Beacon Select Funds (2016-Present); Vice President, American Beacon Institutional Funds Trust (2017-Present); Vice President American Beacon Sound Point Enhanced Income Fund (2018-Present); Vice President American Beacon Apollo Total Return Fund (2018-Present); Vice President, American Beacon Sound Point Alternative Lending Fund (2019-Present). | ||
88
Trustees and Officers of the American Beacon FundsSM(Unaudited)
Name, Age | Position, Term of Office and Length of Time Served with the Trust | Principal Occupation(s) During Past 5 Years and Current Directorships | ||
| OFFICERS (CONT.) | Term | |||
| One Year | ||||
| Erica Duncan (49) | VP Since 2011 | Vice President, American Beacon Advisors, Inc. (2011-Present); Vice President, Resolute Investment Managers (2018-Present); Vice President, Resolute Investment Services, Inc. (2018-Present); Vice President, American Beacon Select Funds (2011-Present); Vice President, American Beacon Institutional Funds Trust (2017-Present); Vice President American Beacon Sound Point Enhanced Income Fund (2018-Present); Vice President American Beacon Apollo Total Return Fund (2018-Present); Vice President, American Beacon Sound Point Alternative Lending Fund (2019-Present). | ||
| Melinda G. Heika (58) | Treasurer since 2010 | Treasurer and CFO (2010-Present), American Beacon Advisors, Inc.; Treasurer, Resolute Topco, Inc. (2015-Present); Treasurer, Resolute Investment Holdings, LLC. (2015-Present); Treasurer, Resolute Acquisition, Inc. (2015-Present); Treasurer and CFO, Resolute Investment Managers, Inc. (2017-Present); Treasurer, Resolute Investment Distributors, Inc. (2017-2017); Treasurer and CFO, Resolute Investment Services, Inc. (2015-Present); Treasurer, Lighthouse Holdings Parent Inc., (2010-2015); Treasurer, Lighthouse Holdings, Inc. (2010-2015); Treasurer, American Private Equity Management, LLC (2012-Present); Treasurer and CFO, Alpha Quant Advisors, LLC (2016-Present); Treasurer and CFO, Continuous Capital, LLC (2018-Present); Treasurer, American Beacon Cayman Transformational Innovation, Ltd. (2017-2018); Treasurer, American Beacon Delaware Transformational Innovation Corporation (2017-2018); Director and Treasurer, American Beacon Cayman Managed Futures Strategy Fund, Ltd. (2014-Present); Treasurer, American Beacon Cayman TargetRisk Company, Ltd. (2018-Present); Treasurer, American Beacon Select Funds (2010-Present); Treasurer, American Beacon Institutional Funds Trust (2017-Present); Treasurer, American Beacon Sound Point Enhanced Income Fund (2018-Present); Treasurer, American Beacon Apollo Total Return Fund (2018-Present); Treasurer, American Beacon Sound Point Alternative Lending Fund (2019-Present); Treasurer, Green Harvest Asset Management (2019-Present). | ||
| Terri L. McKinney (55) | VP since 2010 | Vice President (2009-Present), Managing Director (2003-2009), American Beacon Advisors, Inc.; Vice President, Resolute Investment Managers, Inc. (2017-Present); Vice President, Resolute Investment Services, Inc (2018-Present); Vice President, Alpha Quant Advisors, LLC (2016-Present); Vice President, Continuous Capital, LLC (2018-Present); Vice President, American Beacon Select Funds (2010-Present); Vice President, American Beacon Institutional Funds Trust (2017-Present); Vice President, American Beacon Sound Point Enhanced Income Fund (2018-Present); Vice President, American Beacon Apollo Total Return Fund (2018-Present); Vice President, American Beacon Sound Point Alternative Lending Fund (2019-Present). | ||
89
Trustees and Officers of the American Beacon FundsSM(Unaudited)
Name, Age | Position, Term of Office and Length of Time Served with the Trust | Principal Occupation(s) During Past 5 Years and Current Directorships | ||
| OFFICERS (CONT.) | Term | |||
| One Year | ||||
| Jeffrey K. Ringdahl (44) | VP since 2010 | Director (2015-Present), President (2018-Present), Chief Operating Officer (2010-Present), Senior Vice President (2013-2018), Vice President (2010-2013), American Beacon Advisors, Inc.; Director (2015-Present), President (2018-Present), Senior Vice Present (2015-2018), Resolute Investment Holdings, LLC; Director (2015-Present), President (2018-Present), Senior Vice President (2015-2018), Resolute Topco, Inc.; Director (2015-Present), President (2018-Present), Senior Vice President (2015-2018), Resolute Acquisition, Inc.; Director (2015-Present), President & COO (2018-Present), Senior Vice President (2015-2018), Resolute Investment Managers, Inc.; Director and Executive Vice President (2017-Present), Resolute Investment Distributors, Inc.; Director (2017-Present), President & COO (2018-Present), Executive Vice President (2017-2018), Resolute Investment Services, Inc.; Senior Vice President (2017-Present), Vice President (2012-2017), Manager (2015-Present), American Private Equity Management, LLC; Senior Vice President, Lighthouse Holdings Parent, Inc. (2013-2015); Senior Vice President, Lighthouse Holdings, Inc. (2013-2015); Trustee, American Beacon NextShares Trust (2015-Present); Director, Executive Vice President & COO, Alpha Quant Advisors, LLC (2016-Present); Director, Shapiro Capital Management, LLC (2017-Present); Director, Executive Vice President & COO, Continuous Capital, LLC (2018-Present); Director and Vice President, American Beacon Cayman Transformational Innovation Company, Ltd., (2017-Present); Vice President, American Beacon Delaware Transformational Innovation Corporation (2017-2018); Director and Vice President, American Beacon Cayman Managed Futures Strategy Fund, Ltd. (2014-Present); Vice President, American Beacon Cayman TargetRisk Company, Ltd (2018-Present); Vice President, American Beacon Select Funds (2010-2018); Vice President, American Beacon Institutional Funds Trust (2017-Present); Vice President, American Beacon Sound Point Enhanced Income Fund (2018-Present); Vice President, American Beacon Apollo Total Return Fund (2018-Present); Director, RSW Investments Holdings LLC, (2019-Present); Manager, SSI Investment Management, LLC (2019-Present), Vice President, American Beacon Sound Point Alternative Lending Fund (2019-Present). | ||
| Samuel J. Silver (56) | VP Since 2011 | Vice President (2011-Present), Chief Fixed Income Officer (2016-Present), American Beacon Advisors, Inc. (2011-Present); Vice President, American Beacon Select Funds (2011-Present); Vice President, American Beacon Institutional Funds Trust (2017-Present); Vice President, American Beacon Sound Point Enhanced Income Fund (2018-Present); Vice President, American Beacon Apollo Total Return Fund (2018-Present); Vice President, American Beacon Sound Point Alternative Lending Fund (2019-Present). | ||
| Christina E. Sears (48) | Chief Compliance Officer since 2004 and Asst. Secretary since 1999 | Vice President, American Beacon Advisors, Inc. (2019-Present); Chief Compliance Officer, American Beacon Advisors, Inc. (2004-Present); Vice President, Resolute Investment Managers, Inc. (2017-Present); Vice President, Resolute Investment Distributors (2017-Present); Vice President, Resolute Investment Services, Inc. (2019-Present); Chief Compliance Officer, American Private Equity Management, LLC (2012-Present); Chief Compliance Officer (2016-2019) and Vice President, Alpha Quant Advisors, LLC (2016-Present); Vice President, Continuous Capital, LLC (2018-Present); Chief Compliance Officer (2004-Present) and Assistant Secretary (1999-Present), American Beacon Select Funds; Chief Compliance Officer and Assistant Secretary, American Beacon Institutional Funds Trust (2017-Present); Chief Compliance Officer and Assistant Secretary, American Beacon Sound Point Enhanced Income Fund (2018-Present); Chief Compliance Officer and Assistant Secretary, American Beacon Apollo Total Return Fund (2018-Present); Chief Compliance Officer and Assistant Secretary, American Beacon Sound Point Alternative Lending Fund (2019-Present). | ||
90
Trustees and Officers of the American Beacon FundsSM(Unaudited)
Name, Age | Position, Term of Office and Length of Time Served with the Trust | Principal Occupation(s) During Past 5 Years and Current Directorships | ||
| OFFICERS (CONT.) | Term | |||
| One Year | ||||
| Sonia L. Bates (62) | Asst. Treasurer since 2011 | Assistant Treasurer, American Beacon Advisors, Inc. (2011-2018); Assistant Treasurer, Lighthouse Holdings Parent Inc. (2011-2015); Assistant Treasurer, Lighthouse Holdings, Inc. (2011-2015); Assistant Treasurer, American Private Equity Management, LLC (2012-Present); Assistant Treasurer, American Beacon Cayman Transformational Innovation Company, Ltd. (2017-Present); Assistant Treasurer, American Beacon Cayman TargetRisk Company, Ltd. (2018-Present); Assistant Treasurer, American Beacon Select Funds (2011-Present); Assistant Treasurer, American Beacon Institutional Funds Trust (2017-Present); Assistant Treasurer, American Beacon Sound Point Enhanced Income Fund (2018-Present); Assistant Treasurer, American Beacon Apollo Total Return Fund (2018-Present); Assistant Treasurer, American Beacon Sound Point Alternative Lending Fund (2019-Present). | ||
| Shelley D. Abrahams (44) | Assistant Secretary since 2008 | Assistant Secretary, American Beacon Select Funds (2008-Present); Assistant Secretary, American Beacon Institutional Funds Trust (2017-Present); Assistant Secretary, American Beacon Sound Point Enhanced Income Fund (2018-Present); Assistant Secretary, American Beacon Apollo Total Return Fund (2018-Present); Assistant Secretary, American Beacon Sound Point Alternative Lending Fund (2019-Present); Assistant Secretary, Green Harvest Asset Management (2019-Present). | ||
| Rebecca L. Harris (52) | Assistant Secretary since 2010 | Vice President, American Beacon Advisors, Inc. (2011-Present); Vice President, Resolute Investment Managers, Inc. (2017-Present); Vice President, Resolute Investment Services (2015-Present); Vice President, Alpha Quant Advisors, LLC (2016-Present); Vice President, Continuous Capital, LLC (2018-Present); Assistant Secretary, American Beacon Select Funds (2010-Present); Assistant Secretary, American Beacon Institutional Funds Trust (2017-Present); Assistant Secretary, American Beacon Sound Point Enhanced Income Fund (2018-Present); Assistant Secretary, American Beacon Apollo Total Return Fund (2018-Present); Assistant Secretary, American Beacon Sound Point Alternative Lending Fund (2019-Present). | ||
| Teresa A. Oxford (61) | Assistant Secretary since 2015 | Assistant Secretary, American Beacon Advisors, Inc. (2015-Present); Assistant Secretary, Resolute Investment Distributors (2018-Present); Assistant Secretary, Resolute Investment Services (2018-Present); Assistant Secretary, Alpha Quant Advisors, LLC (2016-Present); Assistant Secretary, American Beacon Select Funds (2015-Present); Assistant Secretary, American Beacon Institutional Funds Trust (2017-Present); Assistant Secretary, American Beacon Sound Point Enhanced Income Fund (2018-Present); Assistant Secretary, American Beacon Apollo Total Return Fund (2018-Present); Assistant Secretary, American Beacon Sound Point Alternative Lending Fund (2019-Present); Assistant Secretary, Green Harvest Asset Management (2019-Present). | ||
* As of 11/12/2014, the Board adopted a retirement plan that requires Trustees, other than Messrs. Feld and Massman to retire no later than the last day of the calendar year in which they reach the age of 75. As of 11/7/17, the Board approved a waiver of the mandatory retirement policy with respect to Mr. Massman, who turned 75 in November 2018, to permit him to continue to serve on the Board as Chair Emeritus through 12/31/19.
** Mr. Feld is deemed to be an “interested person” of the Trusts, as defined by the 1940 Act. Mr. Feld’s law firm of Akin, Gump, Strauss, Hauer & Feld LLP has provided legal services within the past two fiscal years to one or more of the Trust’ssub-advisors.
91
American Beacon FundsSM
October 31, 2019 (Unaudited)
The American Beacon Funds recognize and respect the privacy of our shareholders. We are providing this notice to you so you will understand how shareholder information may be collected and used.
We may collect nonpublic personal information about you from one or more of the following sources:
| • | information we receive from you on applications or other forms; |
| • | information about your transactions with us or our service providers; and |
| • | information we receive from third parties. |
We do not disclose any nonpublic personal information about our customers or former customers to anyone, except as permitted by law.
We restrict access to your nonpublic personal information to those employees or service providers who need to know that information to provide products or services to you. To ensure the confidentiality of your nonpublic personal information, we maintain safeguards that comply with federal standards.
92

Delivery of Documents
eDelivery isNOW AVAILABLE- Stop traditional mail delivery and receive your
shareholder reports and summary prospectuson-line. Sign up at
www.americanbeaconfunds.com
If you invest in the Fund through a financial institution, you may be able to receive the Fund’s regulatory mailings, such as the Prospectus, Annual Report and Semi-Annual Report, bye-mail. If you are interested in this option, please go towww.icsdelivery.com and search for your financial institution’s name or contact your financial institution directly.
To obtain more information about the Fund:
 |  | |
| ByE-mail: | On the Internet: | |
| american_beacon.funds@ambeacon.com | Visit our website atwww.americanbeaconfunds.com | |
By Telephone: Call (800)658-5811 |
By Mail: American Beacon Funds P.O. Box 219643 Kansas City, MO 64121-9643 | |
| Availability of Quarterly Portfolio Schedules | Availability of Proxy Voting Policy and Records | |
| In addition to the Schedule of Investments provided in each semi-annual and annual report, the Fund files a complete schedule of its portfolio holdings with the Securities and Exchange Commission (“SEC”) onForm N-PORT as of the first and third fiscal quarters. The Fund’sForms N-PORT are available on the SEC’s website atwww.sec.gov. TheForms N-PORT may also be reviewed and copied at the SEC’s Public Reference Section, 100 F Street, NE, Washington, D.C. 20549-2736. Information regarding the operation of the SEC’s Public Reference Room may be obtained by calling(800)-SEC-0330. A complete schedule of the Fund’s portfolio holdings is also available atwww.americanbeaconfunds.com approximately twenty days after the end of each month. | A description of the policies and procedures the Fund uses to determine how to vote proxies relating to portfolio securities is available in the Fund’s Statement of Additional Information, is available free of charge on the Fund’s websitewww.americanbeaconfunds.com and by calling1-800-967-9009 or by accessing the SEC’s website atwww.sec.gov. The Fund’s proxy voting record for the most recent year ended June 30 is filed annually with the SEC onForm N-PX. The Fund’sForms N-PX are available on the SEC’s website atwww.sec.gov. The Fund’s proxy voting record may also be obtained by calling1-800-967-9009. | |


Fund Service Providers:
CUSTODIAN State Street Bank and Trust Company Boston, Massachusetts | TRANSFER AGENT DST Asset Manager Solutions, Inc. Quincy, Massachusetts | INDEPENDENT REGISTERED PUBLIC ACCOUNTING FIRM Ernst & Young LLP Dallas, Texas | DISTRIBUTOR Resolute Investment Distributors, Inc. Irving, Texas |
This report is prepared for shareholders of the American Beacon Funds and may be distributed to others only if preceded or accompanied by a current Prospectus or Summary Prospectus.
American Beacon Funds, American Beacon Balanced Fund and American BeaconMid-Cap Value Fund are service marks of American Beacon Advisors, Inc.
AR 10/19
About American Beacon Advisors
Since 1986, American Beacon Advisors has offered a variety of products and investment advisory services to numerous institutional and retail clients, including a variety of mutual funds, corporate cash management, and separate account management.
Our clients include defined benefit plans, defined contribution plans, foundations, endowments, corporations, financial planners, and other institutional investors. With American Beacon Advisors, you can put the experience of a multi-billion dollar asset management firm to work for your company.
GARCIA HAMILTON QUALITY BOND FUND RISKS
The use offixed-income securitiesentails interest rate and credit risks.Credit riskis the risk that the issuer of a bond will fail to make timely payment of interest or principal; and the decline in an issuer’s credit rating can cause the price of its bonds to go down. Please see the prospectus for a complete discussion of the Fund’s risks. There can be no assurances that the investment objectives of this Fund will be met.
This may contain information obtained from third parties, including ratings from credit rating agencies such as Standard & Poor’s. Reproduction and distribution of third-party content in any form is prohibited except with the prior written permission of the related third party. Third-party content providers do not guarantee the accuracy, completeness, timeliness or availability of any information, including ratings, and are not responsible for any errors or omissions (negligent or otherwise), regardless of the cause, or for the results obtained from the use of such content. THIRD-PARTY CONTENT PROVIDERS GIVE NO EXPRESS OR IMPLIED WARRANTIES, INCLUDING, BUT NOT LIMITED TO, ANY WARRANTIES OF MERCHANTABILITY OR FITNESS FOR A PARTICULAR PURPOSE OR USE. THIRD-PARTY CONTENT PROVIDERS SHALL NOT BE LIABLE FOR ANY DIRECT, INDIRECT, INCIDENTAL, EXEMPLARY, COMPENSATORY, PUNITIVE, SPECIAL OR CONSEQUENTIAL DAMAGES, COSTS, EXPENSES, LEGAL FEES OR LOSSES (INCLUDING LOST INCOME OR PROFITS AND OPPORTUNITY COSTS OR LOSSES CAUSED BY NEGLIGENCE) IN CONNECTION WITH ANY USE OF THEIR CONTENT, INCLUDING RATINGS.
Credit ratings are statements of opinions and are not statements of fact or recommendations to purchase, hold or sell securities. They do not address the suitability of securities or the suitability of securities for investment purposes and should not be relied on as investment advice.
Any opinions herein, including forecasts, reflect our judgment as of the end of the reporting period and are subject to change. Each advisor’s strategies and the Fund’s portfolio composition will change depending on economic and market conditions. This report is not a complete analysis of market conditions and therefore, should not be relied upon as investment advice. Although economic and market information has been compiled from reliable sources, American Beacon Advisors, Inc. makes no representation as to the completeness or accuracy of the statements contained herein.
American Beacon Funds | October 31, 2019 |
| 1 | ||||
| 2 | ||||
| 5 | ||||
| 7 | ||||
| 8 | ||||
| 10 | ||||
| 13 | ||||
| 29 | ||||
| 33 | ||||
Disclosure Regarding Approval of the Management and Investment Advisory Agreements | 34 | |||
| 38 | ||||
| 45 | ||||
| Back Cover | ||||
 | Dear Shareholders,
In recent months, you’ve likely seen and heard news reports about disruptive headwinds in the global economy –including the U.S. trade war with China and its toll on the global economy, slowing global growth, the Federal Reserve’s series of rate cuts, Brexit, disruptions in the Middle East and protests in Hong Kong – and watched a flood of reaction in the world’s markets.
As Peter L. Bernstein said in his treatise on risk,Against the Gods: The Remarkable Story of Risk, published by John Wiley & Sons, Inc. in September 1998, “Volatility is a proxy for uncertainty and must be accommodated in measuring investment risk.”
During times of economic uncertainty and market volatility, fear of loss can be a powerful emotion – one that drives many investors to making short-term decisions subject to a variety of potential error-leading biases. Unfortunately, some short-term investment decisions may create more volatility rather than mitigate it. |
Instead of dwelling on the markets’ short-term reaction to waves of negative global news, we encourage investors to focus on the horizon instead. Long-term investing isn’t about identifying and anticipating the next big market move, it is about identifying the right investment products for riding out those moves. As a long-term investor, you should keep in mind the three Ds:direction,disciplineanddiversification.
| u | Direction: Achieving your long-term financial goals requires an individualized plan of action. You may want your plan to provide some measure of protection against periods of geopolitical turmoil, economic uncertainty, market volatility and job insecurity. Your plan should be reviewed annually and be adjusted in the event your long-range needs change. |
| u | Discipline: Long-term, systematic participation in an investment portfolio requires your resolution to stay the course. Spending time in the market – rather than trying to time the market – may place you in a better position to reach your long-term financial goals. |
| u | Diversification: By investing in different investment styles and asset classes, you may be able to help mitigate financial risks across your investment portfolio. By allocating your investment portfolio according to your risk-tolerance level, you may be better positioned to weather storms and achieve your long-term financial goals. |
Since 1986, American Beacon has endeavored to provide investors with a disciplined approach to realizing long-term financial goals.As a manager of managers, we strive to provide investment products that may enable investors to participate during market upswings while potentially insulating against market downswings.
Many of thesub-advisors to our mutual funds pursue upside capture and/or downside protection using proprietary strategies. The investment teams behind our mutual funds seek to produce consistent, long-term results rather than focus only on short-term movements in the markets. In managing our investment products, we emphasize identifying opportunities that offer the potential for long-term rewards.
Our management approach is more than a concept; it’s the cornerstone of our culture. And we strive to apply it at every turn as we seek to provide a well-diversified line of investment solutions to help our shareholders seek long-term rewards while mitigating volatility and risk.
Thank you for your continued interest in American Beacon. For additional information about our investment products or to access your account information, please visit our website atwww.americanbeaconfunds.com.
Best Regards,

Gene L. Needles, Jr.
President
American Beacon Funds
1
October 31, 2019 (Unaudited)
During the 12 months ended October 31, 2019, the Federal Reserve (the “Fed”) hiked the federal funds rate in December 2018, paused for the first half of 2019, and then cut the rate three times in as many meetings. The most recent meeting, held at the end of October, saw the Fed vote to cut its target rate to a range of 1.50% to 1.75%. However, the Fed also indicated its “midcycle adjustment” was complete. The official statement changed with regard to future actions by removing the phrase “will act as appropriate to sustain the expansion,” which was added in advance of the recent rate cuts, addressing economic “uncertainties” and “muted inflation pressures.” Fed Chairman Jerome Powell was more explicit about the completion of the midcycle adjustment at his October press conference when he said further easing would only be needed if developments forced a “material reassessment” of the outlook. He was likely encouraged by recent developments on global trade since U.S. officials indicated they were “close to finalizing” sections of the Phase One agreement with China and the European Union granted the U.K. a Brexit extension. Additionally, the first release of third quarter GDP was reported at 1.9%, which surprised to the upside on solid consumer spending.
Multiple rate cuts from the Fed and uncertainties around global trade caused interest rates to decline and the yield curve to steepen during the period. The10-year Treasury yield fell 145 basis points (or 1.45%) to 1.69%. Thetwo-year Treasury yield declined 132 basis points (or 1.32%) to 1.52%, and the30-year Treasury yield declined 121 basis points (or 1.21%) to 2.17%. These moves caused thetwo- to30-year Treasury yield spread to increase by 11 basis points (or 0.11%) to 65 basis points (or 0.65%).
With the decline in rates during the year, the bond market posted a positive return of 11.51%, according to the Bloomberg Barclays U.S. Aggregate Bond Index. Spread product was mostly in favor over the period as three of the four spread sectors posted positive excess returns. The leader was the corporate sector with an excess return of 232 basis points (or 2.32%). The agency and asset-backed sectors followed with excess returns of 107 basis points (or 1.07%) and 59 basis points (or 0.59%), respectively. The laggard was the mortgage-backed sector with a negative excess return of-11 basis points (or-0.11%). Overall, the Bloomberg Barclays U.S. Aggregate Bond Index had an excess return of 63 basis points (or 0.63%) for the period.
2
American Beacon Garcia Hamilton Quality Bond FundSM Performance Overview
October 31, 2019 (Unaudited)
The Investor Class of the American Beacon Garcia Hamilton Quality Bond Fund (the “Fund”) returned 4.80% for the twelve months ended October 31, 2019. The Bloomberg Barclays U.S. Aggregate Bond Index (the “Index”) returned 11.51% for the same period.
Comparison of Change in Value of a $10,000 Investment for the period from 4/4/16 through 10/31/19
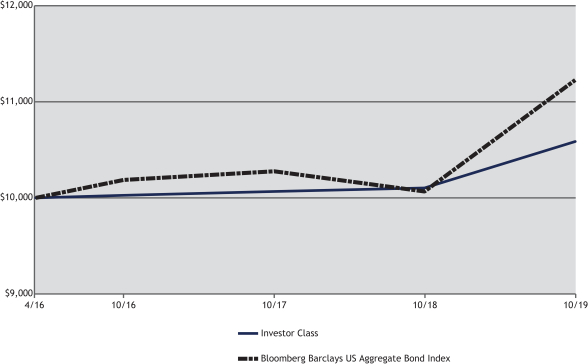
Total Returns for the Period ended October 31, 2019 |
| ||||||||||||||||||||||||||
Ticker | 1 Year | 3 Year | Since Inception | Value of $10,000 04/04/2016- | |||||||||||||||||||||||
Institutional Class (1,4) | GHQIX | 5.20 | % | 2.26 | % | 1.99 | % | $ | 10,731 | ||||||||||||||||||
Y Class (1,4) | GHQYX | 5.09 | % | 2.16 | % | 1.89 | % | $ | 10,693 | ||||||||||||||||||
Investor Class (1,4) | GHQPX | 4.80 | % | 1.84 | % | 1.61 | % | $ | 10,587 | ||||||||||||||||||
R6 Class (1,3,4) | GHQRX | 5.13 | % | 2.24 | % | 1.97 | % | $ | 10,724 | ||||||||||||||||||
Bloomberg Barclays U.S. Aggregate Bond Index (2) | 11.51 | % | 3.29 | % | 3.28 | % | $ | 11,224 | |||||||||||||||||||
| 1. | Performance shown is historical and is not indicative of future returns. Investment returns and principal value will vary, and shares may be worth more or less at redemption than at original purchase. Performance shown is calculated based on the published end of day net asset values as of the date indicated and current performance may be lower or higher than the performance data quoted. To obtain performance as of the most recent month end, please visitwww.americanbeaconfunds.com or call1-800-967-9009. Fund performance in the table above does not reflect the deduction of taxes a shareholder would pay on distributions or the redemption of shares. Generally accepted accounting principles require adjustments to be made to the net assets of the Fund at period end for financial reporting purposes only; and as such, the total return based on the unadjusted net asset value per share may differ from the total return reported in the financial highlights. A portion of the fees charged to each Class of the Fund has been waived since Fund inception. Performance prior to waiving fees was lower than the actual returns shown since inception. |
| 2. | The Bloomberg Barclays U.S. Aggregate Bond Index is a market value weighted performance benchmark for government, corporate, mortgage-backed and asset-backed fixed-rate debt securities of all maturities. One cannot directly invest in an index. |
| 3. | Fund performance for the periods represent the returns achieved by the Institutional Class from 4/4/16 through 2/28/19, the inception date of the R6 Class, and the returns of the R6 Class since its inception. Expenses of the R6 Class are lower than the Institutional Class. As a result, total returns shown may be lower than they would have been had the R6 Class been in existence since 4/4/16. |
3
American Beacon Garcia Hamilton Quality Bond FundSM
Performance Overview
October 31, 2019 (Unaudited)
| 4. | The Total Annual Fund Operating Expense ratios set forth in the most recent Fund prospectus for the Institutional, Y, Investor and R6 Class shares were 0.69%, 0.75%, 0.92% and 0.66%, respectively. The expense ratios above may vary from the expense ratios presented in other sections of this report that are based on expenses incurred during the period covered by this report. |
Duration management was the primary detractor from the Fund’s performance during the year relative to the Index. The Fund maintained a shorter duration than the Index as the manager believed the economy would continue to perform well. However, market reaction to the temporary government shutdown, ongoing concerns regarding Brexit, global trade discussions, and the Fed’smid-cycle adjustment were drags on performance. The Fund remains positioned for a market environment in which money supply is expanding rapidly, consumer confidence is high, and the labor market is very healthy. Historically, rates have the bias to move higher as the economy continues to grow and exceed market expectations.
In addition to active duration management, the Fund maintained a barbell yield-curve position. The Fund was overweight the shortest and longest durations along the curve and was underweight in the middle. Thesub-advisor believes the “belly” of the curve, which is the middle of the curve, is most overvalued and is maintaining the largest underweight there.
Sector positioning contributed to performance as the Fund was overweight the corporate sector and underweight the Treasury sector and the mortgage-backed securities sector. An underweight to the Treasury sector was a positive contributor as credit spreads tightened and the Fund’s underweight to mortgage-backed securities benefited performance as the sector underperformed.
Overall, the Fund continues to emphasize high-quality, active fixed-income investing that seeks to perform well in volatile markets and serves an important role in asset allocation.
| Top Ten Holdings (% Net Assets) |
| |||||||
| U.S. Treasury Notes/Bonds, 2.500%, Due 5/15/2046 | 8.4 | |||||||
| Federal Home Loan Banks, 2.032%, Due 9/13/2021,(3-mo. USD LIBOR - 0.095%) | 7.3 | |||||||
| Federal National Mortgage Association, 4.500%, Due 6/1/2039 | 7.0 | |||||||
| Federal Home Loan Banks, 2.010%, Due 12/18/2020,(3-mo. USD LIBOR - 0.135%) | 5.4 | |||||||
| Citigroup, Inc., 3.224%, Due 5/17/2024,(3-mo. USD LIBOR + 1.100%) | 4.6 | |||||||
| United Parcel Service, Inc., 2.549%, Due 4/1/2023,(3-mo. USD LIBOR + 0.450%) | 4.2 | |||||||
| U.S. Treasury Notes/Bonds, 1.752%, Due 1/31/2021,(3-mo. Treasury money market yield + 0.115%) | 4.2 | |||||||
| Morgan Stanley, 3.336%, Due 10/24/2023,(3-mo. USD LIBOR + 1.400%) | 3.9 | |||||||
| IBM Credit LLC, 2.226%, Due 1/20/2021,(3-mo. USD LIBOR + 0.260%) | 3.3 | |||||||
| Intel Corp., 2.531%, Due 5/11/2022,(3-mo. USD LIBOR + 0.350%) | 3.2 | |||||||
| Total Fund Holdings | 39 | |||||||
| Sector Allocation (% Investments) |
| |||||||
| Financial | 28.1 | |||||||
| U.S. Government Agency Obligations | 16.2 | |||||||
| Technology | 13.3 | |||||||
| U.S. Treasury Obligations | 12.7 | |||||||
| Industrial | 8.4 | |||||||
| U.S. Agency Mortgage-Backed Obligations | 8.0 | |||||||
| Communications | 7.0 | |||||||
| Consumer,Non-Cyclical | 4.3 | |||||||
| Utilities | 1.1 | |||||||
| Energy | 0.9 | |||||||
4
American Beacon Garcia Hamilton Quality Bond FundSM
October 31, 2019 (Unaudited)
Fund Expense Example
As a shareholder of a Fund, you incur two types of costs: (1) transaction costs, including sales charges (loads) on purchase payments and redemption fees if applicable, and (2) ongoing costs, including management fees, distribution(12b-1) fees,sub-transfer agent fees, and other Fund expenses. The Examples are intended to help you understand the ongoing cost (in dollars) of investing in the Fund and to compare these costs with the ongoing costs of investing in other mutual funds. The Examples are based on an investment of $1,000 invested at the beginning of the period in each Class and held for the entire period from May 1, 2019 through October 31, 2019.
Actual Expenses
The “Actual” lines of the table provide information about actual account values and actual expenses. You may use the information in this line, together with the amount you invested, to estimate the expenses that you paid over the period. Simply divide your account value by $1,000 (for example, an $8,600 account value divided by $1,000 = $8.60), then multiply the result by “Expenses Paid During Period” to estimate the expenses you paid on your account during this period. Shareholders of the Investor and Institutional Classes that invest in the Fund through an IRA or Roth IRA may be subject to a custodial IRA fee of $15 that is typically deducted each December. If your account was subject to a custodial IRA fee during the period, your costs would have been $15 higher.
Hypothetical Example for Comparison Purposes
The “Hypothetical” lines of the table provide information about hypothetical account values and hypothetical expenses based on the Fund’s actual expense ratio and an assumed 5% per year rate of return before expenses (not the Fund’s actual return). You may compare the ongoing costs of investing in the Fund with other funds by contrasting this 5% hypothetical example and the 5% hypothetical examples that appear in the shareholder reports of the other funds. The hypothetical account values and expenses may not be used to estimate the actual ending account balance or expenses you paid for the period. Shareholders of the Investor and Institutional Classes that invest in the Fund through an IRA or Roth IRA may be subject to a custodial IRA fee of $15 that is typically deducted each December. If your account was subject to a custodial IRA fee during the period, your costs would have been $15 higher.
You should also be aware that the expenses shown in the table highlight only your ongoing costs and do not reflect any transaction costs charged by the Fund, such as sales charges (loads). Similarly, the expense examples for other funds do not reflect any transaction costs charged by those funds, such as sales charges (loads), redemption fees or exchange fees. Therefore, the “Hypothetical” lines of the table are useful in comparing ongoing costs only and will not help you determine the relative total costs of owning different funds. If you were subject to any transaction costs during the period, your costs would have been higher.
5
American Beacon Garcia Hamilton Quality Bond FundSM
Expense Examples
October 31, 2019 (Unaudited)
| American Beacon Garcia Hamilton Quality Bond Fund | |||||||||||||||
| Beginning Account Value 5/1/2019 | Ending Account Value 10/31/2019 | Expenses Paid During Period 5/1/2019-10/31/2019* | |||||||||||||
| Institutional Class | |||||||||||||||
| Actual | $1,000.00 | $1,026.30 | $2.30 | ||||||||||||
| Hypothetical** | $1,000.00 | $1,022.94 | $2.29 | ||||||||||||
| Y Class | |||||||||||||||
| Actual | $1,000.00 | $1,025.80 | $2.81 | ||||||||||||
| Hypothetical** | $1,000.00 | $1,022.43 | $2.80 | ||||||||||||
| Investor Class | |||||||||||||||
| Actual | $1,000.00 | $1,024.40 | $4.24 | ||||||||||||
| Hypothetical** | $1,000.00 | $1,021.02 | $4.23 | ||||||||||||
| R6 Class | |||||||||||||||
| Actual | $1,000.00 | $1,025.60 | $2.09 | ||||||||||||
| Hypothetical** | $1,000.00 | $1,023.14 | $2.09 | ||||||||||||
| * | Expenses are equal to the Fund’s annualized expense ratios for thesix-month period of 0.45%, 0.55%, 0.83%, and 0.41% for the Institutional, Y, Investor, and R6 Classes, respectively, multiplied by the average account value over the period, multiplied by the number derived by dividing the number of days in the most recent fiscal half-year (184) by days in the year (365) to reflect the half-year period. |
| ** | 5% return before expenses. |
6
American Beacon Garcia Hamilton Quality Bond FundSM
Report of Independent Registered Public Accounting Firm
To the Shareholders and the Board of Trustees of
American Beacon Garcia Hamilton Quality Bond Fund
Opinion on the Financial Statements
We have audited the accompanying statement of assets and liabilities of American Beacon Garcia Hamilton Quality Bond Fund (the “Fund”) (one of the funds constituting American Beacon Funds (the “Trust”)), including the schedule of investments, as of October 31, 2019, and the related statement of operations for the year then ended, the statements of changes in net assets for each of the two years in the period then ended, the financial highlights for each of the three years in the period ended October 31, 2019 and the period from April 4, 2016 (commencement of operations) to October 31, 2016 and the related notes (collectively referred to as the “financial statements”). In our opinion, the financial statements present fairly, in all material respects, the financial position of the Fund at October 31, 2019, the results of its operations for the year then ended, the changes in its net assets for each of the two years in the period then ended and its financial highlights for each of the three years in the period ended October 31, 2019 and the period from April 4, 2016 (commencement of operations) to October 31, 2016, in conformity with U.S. generally accepted accounting principles.
Basis for Opinion
These financial statements are the responsibility of the Trust’s management. Our responsibility is to express an opinion on each of the Fund’s financial statements based on our audits. We are a public accounting firm registered with the Public Company Accounting Oversight Board (United States) (“PCAOB”) and are required to be independent with respect to the Trust in accordance with the U.S. federal securities laws and the applicable rules and regulations of the Securities and Exchange Commission and the PCAOB.
We conducted our audits in accordance with the standards of the PCAOB. Those standards require that we plan and perform the audit to obtain reasonable assurance about whether the financial statements are free of material misstatement, whether due to error or fraud. The Trust is not required to have, nor were we engaged to perform, an audit of the Trust’s internal control over financial reporting. As part of our audits, we are required to obtain an understanding of internal control over financial reporting, but not for the purpose of expressing an opinion on the effectiveness of the Trust’s internal control over financial reporting. Accordingly, we express no such opinion.
Our audits included performing procedures to assess the risks of material misstatement of the financial statements, whether due to error or fraud, and performing procedures that respond to those risks. Such procedures included examining, on a test basis, evidence regarding the amounts and disclosures in the financial statements. Our procedures included confirmation of securities owned as of October 31, 2019, by correspondence with the custodian. Our audits also included evaluating the accounting principles used and significant estimates made by management, as well as evaluating the overall presentation of the financial statements. We believe that our audits provide a reasonable basis for our opinion.

We have served as the auditor of one or more American Beacon investment companies since 1987.
Dallas, Texas
December 30, 2019
7
American Beacon Garcia Hamilton Quality Bond FundSM
Schedule of Investments
October 31, 2019
| Principal Amount | Fair Value | ||||||||||||||
| CORPORATE OBLIGATIONS - 62.30% | |||||||||||||||
| Communications - 6.89% | |||||||||||||||
| Comcast Corp., | |||||||||||||||
2.429%, Due 10/1/2020,(3-mo. USD LIBOR + 0.330%)A | $ | 5,730,000 | $ | 5,744,382 | |||||||||||
2.631%, Due 4/15/2024,(3-mo. USD LIBOR + 0.630%)A | 13,341,000 | 13,457,430 | |||||||||||||
| TWDC Enterprises 18 Corp., 2.523%, Due 3/4/2022,(3-mo. USD LIBOR + 0.390%)A | 13,772,000 | 13,839,564 | |||||||||||||
|
| ||||||||||||||
| 33,041,376 | |||||||||||||||
|
| ||||||||||||||
| Consumer,Non-Cyclical - 4.28% | |||||||||||||||
| PepsiCo, Inc., | |||||||||||||||
2.573%, Due 10/6/2021,(3-mo. USD LIBOR + 0.530%)A | 6,460,000 | 6,504,730 | |||||||||||||
2.631%, Due 5/2/2022,(3-mo. USD LIBOR + 0.365%)A | 10,285,000 | 10,328,372 | |||||||||||||
| UnitedHealth Group, Inc., 2.071%, Due 10/15/2020,(3-mo. USD LIBOR + 0.070%)A | 3,720,000 | 3,715,088 | |||||||||||||
|
| ||||||||||||||
| 20,548,190 | |||||||||||||||
|
| ||||||||||||||
| Energy - 0.87% | |||||||||||||||
| Chevron Corp., 2.688%, Due 11/15/2021,(3-mo. USD LIBOR + 0.530%)A | 4,140,000 | 4,173,198 | |||||||||||||
|
| ||||||||||||||
| Financial - 27.78% | |||||||||||||||
| American Express Co., 2.519%, Due 8/1/2022,(3-mo. USD LIBOR + 0.610%)A | 6,600,000 | 6,630,787 | |||||||||||||
| American Express Credit Corp., 2.838%, Due 3/3/2022,(3-mo. USD LIBOR + 0.700%)A | 7,068,000 | 7,113,571 | |||||||||||||
| Bank of America Corp., | |||||||||||||||
3.126%, Due 1/20/2023,(3-mo. USD LIBOR + 1.160%)A | 9,166,000 | 9,293,223 | |||||||||||||
2.917%, Due 3/5/2024,(3-mo. USD LIBOR + 0.790%)A | 7,830,000 | 7,880,443 | |||||||||||||
| Citigroup, Inc., 3.224%, Due 5/17/2024,(3-mo. USD LIBOR + 1.100%)A | 21,774,000 | 22,042,808 | |||||||||||||
| Fifth Third Bank, 2.549%, Due 2/1/2022,(3-mo. USD LIBOR + 0.640%)A | 5,580,000 | 5,610,417 | |||||||||||||
| Goldman Sachs Group, Inc., | |||||||||||||||
3.717%, Due 11/29/2023,(3-mo. USD LIBOR + 1.600%)A | 6,638,000 | 6,855,091 | |||||||||||||
3.448%, Due 11/23/2024,(3-mo. USD LIBOR + 1.300%)A | 8,145,000 | 8,180,617 | |||||||||||||
| JPMorgan Chase & Co., | |||||||||||||||
2.840%, Due 4/25/2023,(3-mo. USD LIBOR + 0.900%)A | 12,824,000 | 12,909,590 | |||||||||||||
3.166%, Due 10/24/2023,(3-mo. USD LIBOR + 1.230%)A | 8,400,000 | 8,546,709 | |||||||||||||
| Manufacturers & Traders Trust Co., 2.734%, Due 5/18/2022,(3-mo. USD LIBOR + 0.610%)A | 5,490,000 | 5,507,810 | |||||||||||||
| Morgan Stanley, 3.336%, Due 10/24/2023,(3-mo. USD LIBOR + 1.400%)A | 18,225,000 | 18,592,849 | |||||||||||||
| Wells Fargo & Co., 3.046%, Due 1/24/2023,(3-mo. USD LIBOR + 1.110%)A | 13,890,000 | 14,064,247 | |||||||||||||
|
| ||||||||||||||
| 133,228,162 | |||||||||||||||
|
| ||||||||||||||
| Industrial - 8.26% | |||||||||||||||
| John Deere Capital Corp., | |||||||||||||||
2.582%, Due 9/8/2022,(3-mo. USD LIBOR + 0.480%)A | 9,370,000 | 9,392,404 | |||||||||||||
2.652%, Due 6/7/2023,(3-mo. USD LIBOR + 0.550%)A | 10,095,000 | 10,115,634 | |||||||||||||
| United Parcel Service, Inc., 2.549%, Due 4/1/2023,(3-mo. USD LIBOR + 0.450%)A | 20,017,000 | 20,124,400 | |||||||||||||
|
| ||||||||||||||
| 39,632,438 | |||||||||||||||
|
| ||||||||||||||
| Technology - 13.14% | |||||||||||||||
| Apple, Inc., 2.685%, Due 2/9/2022,(3-mo. USD LIBOR + 0.500%)A | 14,585,000 | 14,695,547 | |||||||||||||
| IBM Credit LLC, 2.226%, Due 1/20/2021,(3-mo. USD LIBOR + 0.260%)A | 16,015,000 | 16,054,958 | |||||||||||||
| Intel Corp., 2.531%, Due 5/11/2022,(3-mo. USD LIBOR + 0.350%)A | 15,104,000 | 15,162,427 | |||||||||||||
| International Business Machines Corp., 2.576%, Due 5/13/2021,(3-mo. USD LIBOR + 0.400%)A | 4,890,000 | 4,912,460 | |||||||||||||
| QUALCOMM, Inc., 2.666%, Due 1/30/2023,(3-mo. USD LIBOR + 0.730%)A | 12,070,000 | 12,169,662 | |||||||||||||
|
| ||||||||||||||
| 62,995,054 | |||||||||||||||
|
| ||||||||||||||
| Utilities - 1.08% | |||||||||||||||
| Consolidated Edison Co. of New York, Inc., 2.506%, Due 6/25/2021, Series C,(3-mo. USD LIBOR + 0.400%)A | 5,180,000 | 5,199,441 | |||||||||||||
|
| ||||||||||||||
Total Corporate Obligations (Cost $297,553,136) | 298,817,859 | ||||||||||||||
|
| ||||||||||||||
See accompanying notes
8
American Beacon Garcia Hamilton Quality Bond FundSM
Schedule of Investments
October 31, 2019
| Principal Amount | Fair Value | ||||||||||||||
| U.S. AGENCY MORTGAGE-BACKED OBLIGATIONS - 7.89% | |||||||||||||||
| Federal Home Loan Mortgage Corp., 4.500%, Due 12/1/2034 | $ | 2,293,372 | $ | 2,487,334 | |||||||||||
| Federal National Mortgage Association, | |||||||||||||||
5.500%, Due 1/1/2024 | 1,208,330 | 1,261,390 | |||||||||||||
5.000%, Due 7/1/2026 | 493,483 | 508,273 | |||||||||||||
4.500%, Due 6/1/2039 | 31,692,781 | 33,574,552 | |||||||||||||
|
| ||||||||||||||
Total U.S. Agency Mortgage-Backed Obligations (Cost $37,870,378) | 37,831,549 | ||||||||||||||
|
| ||||||||||||||
| U.S. GOVERNMENT AGENCY OBLIGATIONS - 16.01% | |||||||||||||||
| Federal Farm Credit Banks Funding Corp., 1.904%, Due 3/17/2021,(1-mo. USD LIBOR + 0.015%)A | 7,115,000 | 7,106,779 | |||||||||||||
| Federal Home Loan Banks, | |||||||||||||||
2.010%, Due 12/18/2020,(3-mo. USD LIBOR - 0.135%)A | 25,750,000 | 25,726,880 | |||||||||||||
1.921%, Due 1/4/2021,(3-mo. USD LIBOR - 0.135%)A | 9,165,000 | 9,155,148 | |||||||||||||
2.032%, Due 9/13/2021,(3-mo. USD LIBOR - 0.095%)A | 34,815,000 | 34,786,632 | |||||||||||||
|
| ||||||||||||||
Total U.S. Government Agency Obligations (Cost $76,842,823) | 76,775,439 | ||||||||||||||
|
| ||||||||||||||
| U.S. TREASURY OBLIGATIONS - 12.53% | |||||||||||||||
| U.S. Treasury Notes/Bonds, | |||||||||||||||
1.752%, Due 1/31/2021,(3-mo. Treasury money market yield + 0.115%)A | 20,000,000 | 19,978,071 | |||||||||||||
2.500%, Due 5/15/2046 | 37,690,000 | 40,131,017 | |||||||||||||
|
| ||||||||||||||
Total U.S. Treasury Obligations (Cost $55,076,356) | 60,109,088 | ||||||||||||||
|
| ||||||||||||||
| Shares | |||||||||||||||
| SHORT-TERM INVESTMENTS - 0.76% (Cost $3,627,253) | |||||||||||||||
| Investment Companies - 0.76% | |||||||||||||||
| American Beacon U.S. Government Money Market Select Fund, Select Class, 1.75%B C | 3,627,253 | 3,627,253 | |||||||||||||
|
| ||||||||||||||
TOTAL INVESTMENTS - 99.49% (Cost $470,969,946) | 477,161,188 | ||||||||||||||
OTHER ASSETS, NET OF LIABILITIES - 0.51% | 2,461,739 | ||||||||||||||
|
| ||||||||||||||
TOTAL NET ASSETS - 100.00% | $ | 479,622,927 | |||||||||||||
|
| ||||||||||||||
| Percentages are stated as a percent of net assets. | |||||||||||||||
A Variable, floating, or adjustable rate securities with an interest rate that changes periodically. Rates are periodically reset with rates that are based on a predetermined benchmark such as a widely followed interest rate such asT-bills, LIBOR or PRIME plus a fixed spread. The interest rate disclosed reflects the rate in effect on October 31, 2019.
B The Fund is affiliated by having the same investment advisor.
C7-day yield.
LIBOR - London Interbank Offered Rate.
LLC - Limited Liability Company.
PRIME – A rate, charged by banks, based on the U.S. Federal Funds rate.
The Fund’s investments are summarized by level based on the inputs used to determine their values. As of October 31, 2019, the investments were classified as described below:
Garcia Hamilton Quality Bond Fund | Level 1 | Level 2 | Level 3 | Total | ||||||||||||||||||||||||
Assets | ||||||||||||||||||||||||||||
Corporate Obligations | $ | - | $ | 298,817,859 | $ | - | $ | 298,817,859 | ||||||||||||||||||||
U.S. Agency Mortgage-Backed Obligations | - | 37,831,549 | - | 37,831,549 | ||||||||||||||||||||||||
U.S. Government Agency Obligations | - | 76,775,439 | - | 76,775,439 | ||||||||||||||||||||||||
U.S. Treasury Obligations | - | 60,109,088 | - | 60,109,088 | ||||||||||||||||||||||||
Short-Term Investments | 3,627,253 | - | - | 3,627,253 | ||||||||||||||||||||||||
|
|
|
|
|
|
|
| |||||||||||||||||||||
Total Investments in Securities - Assets | $ | 3,627,253 | $ | 473,533,935 | $ | - | $ | 477,161,188 | ||||||||||||||||||||
|
|
|
|
|
|
|
| |||||||||||||||||||||
U.S. GAAP requires transfers between all levels to/from level 3 be disclosed. During the year ended October 31, 2019, there were no transfers into or out of Level 3.
See accompanying notes
9
American Beacon Garcia Hamilton Quality Bond FundSM
Statement of Assets and Liabilities
October 31, 2019
Assets: |
| |||
Investments in unaffiliated securities, at fair value† | $ | 473,533,935 | ||
Investments in affiliated securities, at fair value‡ | 3,627,253 | |||
Interest receivable | 1,780,914 | |||
Receivable for investments sold | 1,917,695 | |||
Receivable for fund shares sold | 216,068 | |||
Receivable for expense reimbursement (Note 2) | 115,945 | |||
Prepaid expenses | 27,316 | |||
|
| |||
Total assets | 481,219,126 | |||
|
| |||
Liabilities: |
| |||
Payable for fund shares redeemed | 1,152,745 | |||
Dividends payable | 130,681 | |||
Management andsub-advisory fees payable (Note 2) | 227,060 | |||
Service fees payable (Note 2) | 3,137 | |||
Transfer agent fees payable (Note 2) | 14,574 | |||
Custody and fund accounting fees payable | 11,020 | |||
Professional fees payable | 44,973 | |||
Trustee fees payable (Note 2) | 2,313 | |||
Payable for prospectus and shareholder reports | 5,924 | |||
Other liabilities | 3,772 | |||
|
| |||
Total liabilities | 1,596,199 | |||
|
| |||
Net assets | $ | 479,622,927 | ||
|
| |||
Analysis of net assets: |
| |||
Paid-in-capital | $ | 476,585,099 | ||
Total distributable earnings (deficits)A | 3,037,828 | |||
|
| |||
Net assets | $ | 479,622,927 | ||
|
| |||
Shares outstanding at no par value (unlimited shares authorized): | ||||
Institutional Class | 31,509,871 | |||
|
| |||
Y Class | 1,784,629 | |||
|
| |||
Investor Class | 1,483,357 | |||
|
| |||
R6 ClassB | 12,966,751 | |||
|
| |||
Net assets: | ||||
Institutional Class | $ | 316,582,604 | ||
|
| |||
Y Class | $ | 17,927,537 | ||
|
| |||
Investor Class | $ | 14,904,591 | ||
|
| |||
R6 ClassB | $ | 130,208,195 | ||
|
| |||
Net asset value, offering and redemption price per share: |
| |||
Institutional Class | $ | 10.05 | ||
|
| |||
Y Class | $ | 10.05 | ||
|
| |||
Investor Class | $ | 10.05 | ||
|
| |||
R6 ClassB | $ | 10.04 | ||
|
| |||
† Cost of investments in unaffiliated securities | $ | 467,342,693 | ||
‡ Cost of investments in affiliated securities | $ | 3,627,253 | ||
A The Fund’s investments in affiliated securities did not have unrealized appreciation (depreciation) at year end. | ||||
B Class commenced operations February 28, 2019 (Note 1). | ||||
See accompanying notes
10
American Beacon Garcia Hamilton Quality Bond FundSM
Statement of Operations
For the year ended October 31, 2019
Investment income: | ||||
Dividend income from affiliated securities (Note 7) | $ | 262,616 | ||
Interest income | 9,641,814 | |||
|
| |||
Total investment income | 9,904,430 | |||
|
| |||
Expenses: | ||||
Management andsub-advisory fees (Note 2) | 1,927,599 | |||
Transfer agent fees: | ||||
Institutional Class (Note 2) | 108,011 | |||
Y Class (Note 2) | 19,161 | |||
Investor Class | 1,732 | |||
R6 ClassA | 2,082 | |||
Custody and fund accounting fees | 62,247 | |||
Professional fees | 52,133 | |||
Registration fees and expenses | 62,461 | |||
Service fees (Note 2): | ||||
Investor Class | 54,616 | |||
Prospectus and shareholder report expenses | 28,358 | |||
Trustee fees (Note 2) | 24,775 | |||
Other expenses | 40,426 | |||
|
| |||
Total expenses | 2,383,601 | |||
|
| |||
Net fees waived and expenses (reimbursed) (Note 2) | (745,393 | ) | ||
|
| |||
Net expenses | 1,638,208 | |||
|
| |||
Net investment income | 8,266,222 | |||
|
| |||
Realized and unrealized gain from investments: | ||||
Net realized gain from: | ||||
Investments in unaffiliated securitiesB | 429,672 | |||
Change in net unrealized appreciation of: | ||||
Investments in unaffiliated securitiesC | 7,820,345 | |||
|
| |||
Net gain from investments | 8,250,017 | |||
|
| |||
Net increase in net assets resulting from operations | $ | 16,516,239 | ||
|
| |||
A Class commenced operations February 28, 2019. | ||||
B The Fund did not recognize net realized gains (losses) from the sale of investments in affiliated securities. | ||||
C The Fund’s investments in affiliated securities did not have a change in unrealized appreciation (depreciation) at year end. |
| |||
See accompanying notes
11
American Beacon Garcia Hamilton Quality Bond FundSM
Statement of Changes in Net Assets
| Garcia Hamilton Quality Bond Fund | ||||||||||||
| Year Ended October 31, 2019 | Year Ended October 31, 2018 | |||||||||||
Increase (decrease) in net assets: | ||||||||||||
Operations: | ||||||||||||
Net investment income | $ | 8,266,222 | $ | 3,376,947 | ||||||||
Net realized gain (loss) from investments in unaffiliated securities | 429,672 | (780,123 | ) | |||||||||
Change in net unrealized appreciation (depreciation) of investments in unaffiliated securities | 7,820,345 | (1,810,001 | ) | |||||||||
|
|
|
| |||||||||
Net increase in net assets resulting from operations | 16,516,239 | 786,823 | ||||||||||
|
|
|
| |||||||||
Distributions to shareholders: | ||||||||||||
Total retained earnings: | ||||||||||||
Institutional Class | (7,259,770 | ) | (3,305,504 | ) | ||||||||
Y Class | (437,870 | ) | (59,124 | ) | ||||||||
Investor Class | (280,134 | ) | (165,821 | ) | ||||||||
R6 ClassA | (480,168 | ) | – | |||||||||
|
|
|
| |||||||||
Net distributions to shareholders | (8,457,942 | ) | (3,530,449 | ) | ||||||||
|
|
|
| |||||||||
Capital share transactions (Note 9): | ||||||||||||
Proceeds from sales of shares | 295,256,390 | 128,042,724 | ||||||||||
Reinvestment of dividends and distributions | 6,819,084 | 3,065,757 | ||||||||||
Cost of shares redeemed | (80,111,918 | ) | (24,196,699 | ) | ||||||||
|
|
|
| |||||||||
Net increase in net assets from capital share transactions | 221,963,556 | 106,911,782 | ||||||||||
|
|
|
| |||||||||
Net increase in net assets | 230,021,853 | 104,168,156 | ||||||||||
|
|
|
| |||||||||
Net assets: | ||||||||||||
Beginning of period | 249,601,074 | 145,432,918 | ||||||||||
|
|
|
| |||||||||
End of period | $ | 479,622,927 | $ | 249,601,074 | ||||||||
|
|
|
| |||||||||
A Class commenced operations February 28, 2019. | ||||||||||||
See accompanying notes
12
American Beacon Garcia Hamilton Quality Bond FundSM
October 31, 2019
1. Organization and Significant Accounting Policies
American Beacon Funds (the “Trust”) is organized as a Massachusetts business trust. The Fund, a series within the Trust, is registered under the Investment Company Act of 1940, as amended (the “Act”), as a diversified,open-end management investment company. As of October 31, 2019, the Trust consists ofthirty-two active series, one of which is presented in this filing: American Beacon Garcia Hamilton Quality Bond Fund (the “Fund”). The remainingthirty-one active series are reported in separate filings.
American Beacon Advisors, Inc. (the “Manager”) is a Delaware corporation and a wholly-owned subsidiary of Resolute Investment Managers, Inc. (“RIM”) organized in 1986 to provide business management, advisory, administrative, and asset management consulting services to the Trust and other investors. The Manager is registered as an investment advisor under the Investment Advisers Act of 1940, as amended (the “Advisers Act”). RIM is, in turn, a wholly-owned subsidiary of Resolute Acquisition, Inc., which is a wholly-owned subsidiary of Resolute Topco, Inc., a wholly-owned subsidiary of Resolute Investment Holdings, LLC (“RIH”). RIH is owned primarily by Kelso Investment Associates VIII, L.P., KEP VI, LLC and Estancia Capital Partners L.P., investment funds affiliated with Kelso & Company, L.P. (“Kelso”) or Estancia Capital Management, LLC (“Estancia”), which are private equity firms.
Recent Accounting Pronouncements
In March 2017, the Financial Accounting Standards Board (“FASB”) issued Accounting Standards Update (“ASU”)2017-08,Premium Amortization of Purchased Callable Debt Securities. The amendments in the ASU shorten the premium amortization period on a purchased callable debt security from the security’s contractual life to the earliest call date. It is anticipated that this change will enhance disclosures by reducing losses recognized when a security is called on an earlier date. This ASU is effective for fiscal years beginning after December 15, 2018. The Manager continues to evaluate the impact this ASU will have on the financial statements and other disclosures.
In August 2018, the FASB issued ASU2018-13,Fair Value Measurement (“Topic 820”). The amendments in the ASU impact disclosure requirements for fair value measurement. It is anticipated that this change will enhance the effectiveness of disclosures in the notes to the financial statements. This ASU is effective for fiscal years beginning after December 15, 2019. Early adoption is permitted and can include the entire standard or certain provisions that exclude or amend disclosures. For the year ended October 31, 2019, the Fund has chosen to adopt the standard. The adoption of this ASU guidance did not have a material impact on the financial statements and other disclosures.
Class Disclosure
On February 28, 2019, the Fund created the R6 Class, a new class made available for sale to retirement plans pursuant to an amendment to the Fund’s registrations statement filed with the U.S. Securities and Exchange Commission (“SEC”). Refer to the Fund’s prospectus for more details.
The Fund has multiple classes of shares designed to meet the needs of different groups of investors. The following table sets forth the differences amongst the classes:
Class | Eligible Investors | Minimum Initial Investments | ||||
| Institutional | Large institutional investors - sold directly through intermediary channels. | $ | 250,000 | |||
| Y Class | Large institutional retirement plan investors - sold directly or through intermediary channels. | $ | 100,000 | |||
| Investor | All investors using intermediary organizations, such as broker-dealers or retirement plan sponsors. | $ | 2,500 | |||
| R6 Class | Large institutional retirement plan investors - sold through retirement plan sponsors. | None | ||||
13
American Beacon Garcia Hamilton Quality Bond FundSM
Notes to Financial Statements
October 31, 2019
Each class offered by the Trust has equal rights as to assets and voting privileges. Income andnon-class specific expenses are allocated daily to each class based on the relative net assets. Realized and unrealized capital gains and losses of each class are allocated daily based on the relative net assets of each class of the respective Fund. Class specific expenses, where applicable, currently include service, distribution, transfer agent fees, andsub-transfer agent fees that vary amongst the classes as described more fully in Note 2.
Significant Accounting Policies
The following is a summary of significant accounting policies, consistently followed by the Fund in preparation of the financial statements. The Fund is considered an investment company and accordingly, follows the investment company accounting and reporting guidance of the FASB Accounting Standards Codification Topic 946,Financial Services – Investment Companies,a part of Generally Accepted Accounting Principles (“U.S. GAAP”).
Security Transactions and Investment Income
Security transactions are recorded as of the trade date for financial reporting purposes. Securities purchased or sold on a when-issued or delayed-delivery basis may be settled beyond a standard settlement period for the security after the trade date.
Dividend income, net of foreign taxes, is recorded on theex-dividend date, except certain dividends from foreign securities which are recorded as soon as the information is available to the Fund. Interest income, net of foreign taxes, is earned from settlement date, recorded on the accrual basis, and adjusted, if necessary, for accretion of discounts and amortization of premiums. Realized gains (losses) from securities sold are determined based on specific lot identification.
Distributions to Shareholders
The Fund distributes most or all of its net earning and realized gains, if any, each taxable year in the form of dividends from net investment income on a monthly basis and distributions of realized net capital gains and net gains or losses from foreign currency transactions on an annual basis. The Fund does not have a fixed dividend rate and does not guarantee that they will pay any distributions in any particular year. Dividends to shareholders are determined in accordance with federal income tax regulation, which may differ in amount and character from net investment income and realized gains recognized for purposes of U.S. GAAP. To the extent necessary to fully distribute capital gains, the Fund may designate earning and profits distributed to shareholders on the redemption of shares.
Allocation of Income, Trust Expenses, Gains, and Losses
Investment income, realized and unrealized gains and losses from investments of the Fund is allocated daily to each class of shares based upon the relative proportion of net assets of each class to the total net assets of the Fund. Expenses directly charged or attributable to the Fund will be paid from the assets of the Fund. Generally, expenses of the Trust will be allocated among and charged to the assets of the Fund on a basis that the Trust’s Board of Trustees (the “Board”) deems fair and equitable, which may be based on the relative net assets of the Fund or nature of the services performed and relative applicability to the Fund.
Use of Estimates
The preparation of financial statements in conformity with U.S. GAAP requires management to make estimates and assumptions that affect the amounts reported in the financial statements and accompanying notes. Actual results may differ from those estimated.
14
American Beacon Garcia Hamilton Quality Bond FundSM
Notes to Financial Statements
October 31, 2019
Other
Under the Trust’s organizational documents, its officers and trustees are indemnified against certain liabilities arising out of the performance of their duties to the Trust. In the normal course of business, the Trust enters into contracts that provide indemnification to the other party or parties against potential costs or liabilities. The Trust’s maximum exposure under these arrangements is dependent on claims that may be made in the future and, therefore, cannot be estimated. The Trust has had no prior claims or losses pursuant to any such agreement.
2. Transactions with Affiliates
Management and InvestmentSub-Advisory Agreements
The Fund and the Manager are parties to a Management Agreement that obligates the Manager to provide the Fund with investment advisory and administrative services. As compensation for performing the duties under the Management Agreement, the Manager will receive an annualized management fee based on a percentage of the Fund’s average daily net assets that is calculated and accrued daily according to the following schedule:
First $5 billion | 0.35 | % | ||
Next $5 billion | 0.325 | % | ||
Next $10 billion | 0.30 | % | ||
Over $20 billion | 0.275 | % |
The Trust, on behalf of the Fund, and the Manager have entered into an Investment Advisory Agreement with Garcia Hamilton & Associates, L.P. (the“Sub-Advisor”) pursuant to which the Fund has agreed to pay an annualizedsub-advisory fee that is calculated and accrued daily based on the Fund’s average daily net assets according to the following schedule:
First $1 billion | 0.20 | % | ||
Over $1 billion | 0.15 | % |
The Management andSub-Advisory Fees paid by the Fund for the year ended October 31, 2019 were as follows:
| Effective Fee Rate | Amount of Fees Paid | |||||||||||
Management Fees | 0.35 | % | $ | 1,226,446 | ||||||||
Sub-Advisor Fees | 0.20 | % | 701,153 | |||||||||
|
|
|
| |||||||||
Total | 0.55 | % | $ | 1,927,599 | ||||||||
|
|
|
| |||||||||
Distribution Plans
The Fund has adopted a “defensive” Distribution Plan (the “Plan”) in accordance with Rule12b-1 under the Act, pursuant to which no separate fees may be charged to the Fund for distribution purposes. However, the Plan authorizes the management fee received by the Manager and the investment advisors hired by the Manager to be used for distribution purposes. Under this Plan, the Fund does not intend to compensate the Manager or any other party, either directly or indirectly, for the distribution of Fund shares.
Service Plans
The Manager and the Trust entered into a Service Plan that obligates the Manager to oversee additional shareholder servicing of the Investor Class of the Fund. As compensation for performing the duties required under the Service Plan, the Manager receives an annualized fee up to 0.375% of the average daily net assets of the Investor Class of the Fund.
15
American Beacon Garcia Hamilton Quality Bond FundSM
Notes to Financial Statements
October 31, 2019
Sub-Transfer Agent Fees
The Manager has entered into agreements, which include servicing agreements, with financial intermediaries that provide recordkeeping, processing, shareholder communications and other services to customers of the intermediaries that hold positions in the Institutional and Y Classes of the Fund and has agreed to compensate the intermediaries for providing these services. Intermediaries transact with the Fund primarily through the use of omnibus accounts on behalf of its customers who hold positions in the Fund. Certain services would have been provided by the Fund’s transfer agent and other service providers if the shareholders’ accounts were maintained directly by the Fund’s transfer agent. Accordingly, the Fund, pursuant to Board approval, has agreed to reimburse the Manager for certainnon-distribution shareholder services provided by financial intermediaries for the Institutional and Y Classes. The reimbursement amounts(sub-transfer agent fees) paid to the Manager are subject to a fee limit of up to 0.10% of an intermediary’s average net assets in the Institutional and Y Classes on an annual basis. During the year ended October 31, 2019, thesub-transfer agent fees, as reflected in “Transfer agent fees” on the Statement of Operations, were as follows:
Fund | Sub-Transfer Agent Fees | |||
Garcia Hamilton Quality Bond | $ | 117,285 | ||
As of October 31, 2019, the Fund owed the Manager the following reimbursement ofsub-transfer agent fees, as reflected in “Transfer agent fees payable” on the Statement of Assets and Liabilities:
Fund | Reimbursement Sub-Transfer Agent Fees | |||
Garcia Hamilton Quality Bond | $ | 11,106 | ||
Investments in Affiliated Funds
The Fund may invest in the American Beacon U.S. Government Money Market Select Fund (the “USG Select Fund”). The Fund and the USG Select Fund have the same investment advisor and therefore, are considered to be affiliated. The Manager serves as investment advisor to the USG Select Fund and receives management fees and administrative fees totaling 0.10% of the average daily net assets of the USG Select Fund. During the year ended October 31, 2019, the Manager earned fees on the Fund’s direct investments in the USG Select Fund as shown below:
Fund | Direct Investments in USG Select Fund | |||
Garcia Hamilton Quality Bond | $ | 12,107 | ||
Interfund Credit Facility
Pursuant to an exemptive order issued by the SEC, the Fund, along with other registered investment companies having management contracts with the Manager, may participate in a credit facility whereby each fund, under certain conditions, is permitted to lend money directly to and borrow directly from other participating funds for temporary purposes. The interfund credit facility is advantageous to the fund because it provides added liquidity and eliminates the need to maintain higher cash balances to meet redemptions. This situation could arise when shareholder redemptions exceed anticipated volumes and certain funds have insufficient cash on hand to satisfy such redemptions or when sales of securities do not settle as expected, resulting in a cash shortfall for a fund. When a fund liquidates portfolio securities to meet redemption requests, they often do not receive payment in settlement for up to two days (or longer for certain foreign transactions). Redemption requests normally are satisfied on the next business day. The credit facility provides a source of immediate, short-term liquidity pending settlement of the sale of portfolio securities. The credit facility is administered by a credit facility team consisting of professionals from the Manager’s asset management, compliance, and accounting areas who report the activities of the credit facility to the Board. During the year ended October 31, 2019, the Fund did not utilize the credit facility.
16
American Beacon Garcia Hamilton Quality Bond FundSM
Notes to Financial Statements
October 31, 2019
Expense Reimbursement Plan
The Manager contractually agreed to reduce fees and/or reimburse expenses for the classes of the Fund to the extent that total operating expenses exceed the Fund’s expense cap. During the year ended October 31, 2019, the Manager waived and/or reimbursed expenses as follows:
| Expense Cap | Expiration of Reimbursed Expenses | |||||||||||||||||||||
Fund | Class | 11/1/2018 - 8/25/2019 | 8/26/2019 - 10/31/2019 | Reimbursed Expenses | (Recouped) Expenses | |||||||||||||||||
Garcia Hamilton Quality Bond | Institutional | 0.45 | % | 0.45 | % | $ | 630,224 | $ | - | 2021-2022 | ||||||||||||
Garcia Hamilton Quality Bond | Y | 0.55 | % | 0.55 | % | 32,884 | - | 2021-2022 | ||||||||||||||
Garcia Hamilton Quality Bond | Investor | 0.83 | % | 0.83 | % | 28,699 | - | 2021-2022 | ||||||||||||||
Garcia Hamilton Quality Bond | R6(1) | 0.42 | % | 0.41 | % | 53,586 | - | 2021-2022 | ||||||||||||||
(1) Effective February 28, 2019. |
| |||||||||||||||||||||
Of these amounts, $115,945 was disclosed as a receivable from the Manager on the Statement of Assets and Liabilities at October 31, 2019.
The Fund has adopted an Expense Reimbursement Plan whereby the Manager may seek repayment of such fee or voluntary reductions and expense reimbursements. Under the policy, the Manager can be reimbursed by the Fund for any contractual or voluntary fee reductions or expense reimbursements if reimbursement to the Manager (a) occurs within three years after the date of the Manager’s waiver/reimbursement and (b) does not cause the Fund’s annual operating expenses to exceed the lesser of the contractual percentage limit in effect at the time of the waiver/reimbursement or time of recoupment. The reimbursed expenses listed above will expire in 2021 and 2022. The Fund did not record a liability for potential reimbursement due to the current assessment that a reimbursement is uncertain. The carryover of excess expenses potentially reimbursable to the Manager, but not recorded as a liability are as follows:
Fund | Recouped Expenses | Excess Expense Carryover | Expired Expense Carryover | Expiration of Reimbursed Expenses | ||||||||||||
Garcia Hamilton Quality Bond | $ | - | $ | 334,782 | $ | - | 2019-2020 | |||||||||
Garcia Hamilton Quality Bond | - | 410,947 | - | 2020-2021 | ||||||||||||
Trustee Fees and Expenses
As compensation for their service to the Trusts, each Trustee receives an annual retainer of $120,000, plus $10,000 for each Board meeting attended in person or via teleconference, $2,500 for attendance by Committee members at meetings of the Audit Committee and the Investment Committee, and $1,500 for attendance by Committee members at meetings of the Nominating and Governance Committee, plus reimbursement of reasonable expenses incurred in attending Board meetings, Committee meetings, and relevant educational seminars. The Trustees also may be compensated for attendance at special Board and/or Committee meetings from time to time. The Board Chair receives an additional annual retainer of $50,000 as well as a $2,500 fee each quarter for attendance at the committee meetings. The Chairpersons of the Audit Committee and the Investment Committee each receive an additional annual retainer of $25,000 and the Chairman of the Nominating and Governance Committee receives an additional annual retainer of $10,000. These expenses are allocated on a prorated basis to each fund of the Trusts according to its respective net assets.
17
American Beacon Garcia Hamilton Quality Bond FundSM
Notes to Financial Statements
October 31, 2019
3. Security Valuation and Fair Value Measurements
The price of the Fund’s shares is based on the Fund’s Net Asset Value (“NAV”). The NAV of the Fund, or each of its share classes, as applicable, is determined by dividing the total value of portfolio investments and other assets, less any liabilities attributable to the Fund or class, by the total number of shares outstanding of the Fund or class.
Investments are valued at the close of the New York Stock Exchange (the “Exchange”), normally at 4:00 p.m. Eastern Time, each day that the Exchange is open for business.
Debt securities normally are valued on the basis of prices provided by an independent pricing service and may take into account appropriate factors such asinstitution-size trading in similar groups of securities, yield, quality, coupon rate, maturity, type of issue, trading characteristics, and other market data. Prices of debt securities may be determined using quotes obtained from brokers.
Investments inopen-end mutual funds are valued at the closing NAV per share of the mutual fund on the day of valuation.
Securities for which the market prices are not readily available or are not reflective of the fair value of the security, as determined by the Manager, will be priced at fair value following procedures approved by the Board.
Other investments, including restricted securities and those financial instruments for which the above valuation procedures are inappropriate or are deemed not to reflect fair value, are stated at fair value, as determined in good faith by the Manager’s Valuation Committee, pursuant to procedures established by the Board.
Valuation Inputs
Various inputs may be used to determine the fair value of the Fund’s investments. These inputs are summarized in three broad levels for financial statement purposes. The inputs or methodologies used to value securities are not necessarily an indication of the risk associated with investing in those securities.
| Level 1 | - | Quoted prices in active markets for identical securities. | ||
| Level 2 | - | Prices determined using other significant observable inputs. These may include quoted prices for similar securities, interest rates, prepayment speeds, credit risk, and others. | ||
| Level 3 | - | Prices determined using other significant unobservable inputs. Unobservable inputs reflect the Fund’s own assumptions about the factors market participants would use in pricing an investment. | ||
Level 1 and Level 2 trading assets and trading liabilities, at fair value
Fixed-income securities including corporate, convertible and municipal bonds and notes, U.S. government agencies, U.S. Treasury obligations, sovereign issues, bank loans, convertible preferred securities, andnon-U.S. bonds are normally valued by pricing service providers that use broker dealer quotations, reported trades or valuation estimates from their internal pricing models. The service providers’ internal models use inputs that are observable such as issuer details, interest rates, yield curves, prepayment speeds, credit risks/spreads, default rates, and quoted prices for similar assets. Securities that use similar valuation techniques and inputs as described above are categorized as Level 2 of the fair value hierarchy.
Mortgage-related and asset-backed securities (“ABS”) are usually issued as separate tranches, or classes, of securities within each deal. These securities are also normally valued by pricing service providers that usebroker-dealer quotations or valuation estimates from their internal pricing models. The pricing models for these securities usually consider tranche-level attributes, current market data, estimated cash flows, and market-based yield spreads for each tranche, and incorporates deal collateral performance, as available. Mortgage-related and ABS that use similar valuation techniques and inputs as described above are categorized as Level 2 of the fair value hierarchy.
18
American Beacon Garcia Hamilton Quality Bond FundSM
Notes to Financial Statements
October 31, 2019
Investments in registeredopen-end investment management companies will be valued based upon the NAVs of such investments and are categorized as Level 1 of the fair value hierarchy.
4. Securities and Other Investments
Agency Mortgage-Backed Securities
Certain mortgage-backed securities (“MBS”) may be issued or guaranteed by the U.S. government or a government sponsored entity, such as the Federal National Mortgage Association (“Fannie Mae”) or the Federal Home Loan Mortgage Corporation (“Freddie Mac”). Although these instruments may be guaranteed by the U.S. government or a government sponsored entity, many such MBS are not backed by the full faith and credit of the United States and are still exposed to the risk ofnon-payment.
Fixed-Income Investments
The Fund may hold debt, including government and corporate debt, and other fixed-income securities. Typically, the values of fixed-income securities change inversely with prevailing interest rates. Therefore, a fundamental risk of fixed-income securities is interest rate risk, which is the risk that their value will generally decline as prevailing interest rates rise, which may cause the Fund’s NAV to likewise decrease, and vice versa. How specific fixed-income securities may react to changes in interest rates will depend on the specific characteristics of each security. For example, while securities with longer maturities tend to produce higher yields, they also tend to be more sensitive to changes in prevailing interest rates and are, therefore, more volatile than shorter-term securities and are subject to greater market fluctuations as a result of changes in interest rates. Fixed-income securities are also subject to credit risk, which is the risk that the credit strength of an issuer of a fixed-income security will weaken and/or that the issuer will be unable to make timely principal and interest payments and that the security may go into default. In addition, there is prepayment risk, which is the risk that during periods of falling interest rates, certain fixed-income securities with higher interest rates, such as MBS and ABS, may be prepaid by their issuers thereby reducing the amount of interest payments. This may result in a Fund having to reinvest its proceeds in lower yielding securities. Securities underlying MBS and ABS, which may include subprime mortgages, also may be subject to a higher degree of credit risk, valuation risk, and liquidity risk.
Mortgage-Backed Securities
MBS often have stated maturities of up to thirty years when they are issued, depending upon the length of the mortgages underlying the securities. In practice however, unscheduled or early payments of principal and interest on the underlying mortgages may make the securities’ effective maturity shorter than this, and the prevailing interest rates may be higher or lower than the current yield of the Fund’s portfolio at the time resulting in reinvestment risk.
Rising or high interest rates may result in slower than expected principal payments which may tend to extend the duration of MBS, making them more volatile and more sensitive to changes in interest rates. This is known as extension risk.
MBS may have less potential for capital appreciation than comparable fixed-income securities due to the likelihood of increased prepayments of mortgages resulting from foreclosures or declining interest rates. These foreclosed or refinanced mortgages are paid off at face value (par) or less, causing a loss, particularly for any investor who may have purchased the security at a premium or a price above par. In such an environment, this risk limits the potential price appreciation of these securities.
19
American Beacon Garcia Hamilton Quality Bond FundSM
Notes to Financial Statements
October 31, 2019
Mortgage-Related and Other Asset-Backed Securities
The Fund may invest in mortgage or other ABS. These securities may include mortgage instruments issued by U.S. government agencies (“agency mortgages”) or those issued by private entities(“non-agency mortgages”). Specific types of instruments may include mortgage pass-through securities, collateralized mortgage obligations (“CMOs”), commercial mortgage-backed securities, mortgage dollar rolls, CMO residuals, stripped mortgage-backed securities and other securities that directly or indirectly represent a participation in, or are secured by a payable from, mortgage loans on real property. The value of the Fund’s MBS may be affected by, among other things, changes or perceived changes in interest rates, factors concerning the interests in and structure of the issuer or the originator of the mortgage, or the quality of the underlying assets. The mortgages underlying the securities may default or decline in quality or value. Through its investments in MBS, a Fund has exposure to subprime loans,Alt-A loans andnon-conforming loans as well as to the mortgage and credit markets generally. Underlying collateral related to subprime,Alt-A andnon-conforming mortgage loans has become increasingly susceptible to defaults and declines in quality or value, especially in a declining residential real estate market. In addition, regulatory or tax changes may adversely affect the mortgage securities markets as a whole.
Other Investment Company Securities and Other Exchange-Traded Products
The Fund may invest in shares of other investment companies, includingopen-end funds,closed-end funds, business development companies, ETFs, unit investment trusts, and other investment companies of the Trust. The Fund may invest in securities of an investment company advised by the Manager or asub-advisor. Investments in the securities of other investment companies may involve duplication of advisory fees and certain other expenses. By investing in another investment company, the Fund becomes a shareholder of that investment company. As a result, the Fund’s shareholders indirectly will bear the Fund’s proportionate share of the fees and expenses paid by shareholders of the other investment company, in addition to the fees and expenses the Fund’s shareholders directly bear in connection with the Fund’s own operations. These other fees and expenses are reflected as Acquired Fund Fees and Expenses and are included in the Fees and Expenses Table for the Fund in its Prospectus, if applicable. Investments in other investment companies may involve the payment of substantial premiums above the value of such issuer’s portfolio securities.
U.S. Government Agency Securities
U.S. Government agency securities are issued or guaranteed by the U.S. Government or its agencies or instrumentalities. Some obligations issued by U.S. Government agencies and instrumentalities are supported by the full faith and credit of the U.S. Treasury; others by the right of the issuer to borrow from the U.S. Treasury; others by discretionary authority of the U.S. Government to purchase certain obligations of the agency or instrumentality; and others only by the credit of the agency or instrumentality. U.S. Government securities bear fixed, floating or variable rates of interest. While the U.S. Government currently provides financial support to certain U.S. Government-sponsored agencies or instrumentalities, no assurance can be given that it will always do so, since it is not so obligated by law. U.S. Government securities include U.S. Treasury bills, notes and bonds, Federal Home Loan Bank (“FHLB”) obligations, Federal Farm Credit Bank (“FFCB”) obligations, U.S. Government agency obligations and repurchase agreements secured thereby. U.S. Government agency securities are subject to credit risk and interest rate risk.
U.S. Treasury Obligations
U.S. Treasury obligations include bills (initial maturities of one year or less), notes (initial maturities between two and ten years), and bonds (initial maturities over ten years) issued by the U.S. Treasury, Separately Traded Registered Interest and Principal component parts of such obligations (known as “STRIPS”) and inflation-indexed securities. The prices of these securities (like all debt securities) change between issuance and maturity in response to fluctuating market interest rates. U.S. Treasury obligations are subject to credit risk and interest rate risk.
20
American Beacon Garcia Hamilton Quality Bond FundSM
Notes to Financial Statements
October 31, 2019
5. Principal Risks
Investing in the Fund may involve certain risks including, but not limited to, those described below.
Credit Risk
The Fund is subject to the risk that the issuer or guarantor of a debt security, or the counterparty to a derivatives contract or a loan, will fail to make timely payment of interest or principal or otherwise honor its obligations or default completely. A decline in the credit rating of an individual security held by the Fund may have an adverse impact on its price and make it difficult for the Fund to sell it. Ratings represent a rating agency’s opinion regarding the quality of the security and are not a guarantee of quality. Rating agencies might not always change their credit rating on an issuer or security in a timely manner to reflect events that could affect the issuer’s ability to make timely payments on its obligations. Credit risk is typically greater for securities with ratings that are below investment grade.
Floating Rate Securities Risk
The coupons on certain fixed income securities in which the Fund may invest are not fixed and may fluctuate based upon changes in market rates. The coupon on a floating rate security is generally based on an interest rate such as a money-market index, London Interbank Offered Rate (“LIBOR”) or a Treasury bill rate. Such securities are subject to interest rate risk and may fluctuate in value in response to interest rate changes if there is a delay between changes in market interest rates and the interest reset date for the obligation, or for other reasons. As short-term interest rates decline, the coupons on floating rate securities typically decrease. Alternatively, during periods of rising interest rates, changes in the coupons of floating rate securities may lag behind changes in market rates or may have limits on the maximum increases in the coupon rates. The value of floating rate securities may decline if their coupons do not rise as much, or as quickly, as interest rates in general. Conversely, floating rate securities will not generally increase in value if interest rates decline. Floating rate obligations are less effective than fixed rate obligations at locking in a particular yield and are subject to credit risk.
Interest Rate Risk
Investments in investment-grade andnon-investment grade fixed-income securities are subject to interest rate risk. The value of the Fund’s fixed-income investments typically will fall when interest rates rise. The Fund may be particularly sensitive to changes in interest rates if it invests in debt securities with intermediate and long terms to maturity. Debt securities with longer durations tend to be more sensitive to changes in interest rates, usually making them more volatile than debt securities with shorter durations. For example, if a bond has a duration of seven years, a 1% increase in interest rates could be expected to result in a 7% decrease in the value of the bond. Yields of debt securities will fluctuate over time. Following the financial crisis that started in 2008, the Federal Reserve attempted to stabilize the economy and support the economic recovery by keeping the federal funds rate (the interest rate at which depository institutions lend reserve balances to each other overnight) at or near zero percent. The Federal Reserve has raised the federal funds rate several times since December 2015 and may continue to increase or decrease rates in the future. Interest rates may rise significantly and/or rapidly, potentially resulting insubstantial losses to the Fund. During periods of very low or negative interest rates, the Fund may be unable to maintain positive returns. Certain European countries and Japan have recently experienced negative interest rates on deposits and debt securities have traded at negative yields. Negative interest rates may become more prevalent amongnon-U.S. issuers, and potentially within the United States. Changing interest rates, including rates that fall below zero, may have unpredictable effects on markets, may result in heightened market volatility and may detract from Fund’s performance to the extent the Fund is exposed to such interest rates.
21
American Beacon Garcia Hamilton Quality Bond FundSM
Notes to Financial Statements
October 31, 2019
Investment Risk
An investment in the Fund is not a deposit with a bank and is not insured or guaranteed by the Federal Deposit Insurance Corporation or any other government agency. When you sell your shares of the Fund, they could be worth less than what you paid for them. Therefore, you may lose money by investing in the Fund.
LIBOR Risk
The Fund’s investments, payment obligations and financing terms may be based on floating rates, such as LIBOR, Euro Interbank Offered Rate and other similar types of reference rates (each, a “Reference Rate”). On July 27, 2017, the Chief Executive of the UK Financial Conduct Authority (“FCA”), which regulates LIBOR, announced that the FCA will no longer persuade nor require banks to submit rates for the calculation of LIBOR and certain other Reference Rates after 2021. Such announcement indicates that the continuation of LIBOR and other Reference Rates on the current basis cannot and will not be guaranteed after 2021. This announcement and any additional regulatory or market changes may have an adverse impact on the Fund or its investments, including increased volatility or illiquidity in markets for instruments that rely on LIBOR.
Liquidity Risk
When there is little or no active trading market for a specific security it can become more difficult to purchase or sell the securities at or near their perceived value. During such periods, certain investments held by the Fund may be difficult to sell or other investments may be difficult to purchase at favorable times or prices. As a result, the Fund may have to lower the price on certain securities that it is trying to sell, sell other securities instead or forgo an investment opportunity, any of which could have a negative effect on Fund management or performance. Redemptions by a few large investors in the Fund at such times may have a significant adverse effect on the Fund’s NAV and remaining Fund shareholders. In addition, the market-making capacity of dealers in certain types of securities has been reduced in recent years, in part as a result of structural and regulatory changes, such as fewer proprietary trading desks and increased regulatory capital requirements for broker-dealers. Further, many broker-dealers have reduced their inventory of certain debt securities. This could negatively affect the Fund’s ability to buy or sell debt securities and increase the related volatility and trading costs. The Fund may lose money if it is forced to sell certain investments at unfavorable prices to meet redemption requests or other cash needs.
Market Risk
Conditions in the U.S. and many foreign economies have resulted, and may continue to result, in certain instruments experiencing unusual liquidity issues, increased price volatility and, in some cases, credit downgrades and increased likelihood of default. These events have reduced the willingness and ability of some lenders to extend credit, and have made it more difficult for some borrowers to obtain financing on attractive terms, if at all. In some cases, traditional market participants have been less willing to make a market in some types of debt instruments, which has affected the liquidity of those instruments. During times of market turmoil, investors tend to look to the safety of securities issued or backed by the U.S. Treasury, causing the prices of these securities to rise and the yields to decline. Reduced liquidity in fixed income and credit markets may negatively affect many issuers worldwide. In addition, global economies and financial markets are becoming increasingly interconnected, which increases the possibilities that conditions in one country or region might adversely impact issuers in a different country or region. A rise in protectionist trade policies, and the possibility of changes to some international trade agreements, could affect the economies of many nations, including the United States, in ways that cannot necessarily be foreseen at the present time.
In response to the financial crisis, the U.S. and other governments and the Federal Reserve and certain foreign central banks have taken steps to support financial markets. In some countries where economic conditions are recovering, they are nevertheless perceived as still fragile. Withdrawal of government support, failure of efforts in response to the crisis, or investor perception that such efforts are not succeeding, could adversely impact
22
American Beacon Garcia Hamilton Quality Bond FundSM
Notes to Financial Statements
October 31, 2019
the value and liquidity of certain securities. The severity or duration of adverse economic conditions may also be affected by policy changes made by governments or quasi-governmental organizations, including changes in tax laws. The impact of new financial regulation legislation on the markets and the practical implications for market participants may not be fully known for some time. Regulatory changes are causing some financial services companies to exit long-standing lines of business, resulting in dislocations for other market participants. In addition, political and governmental events within the U.S. and abroad, such as the United States government’s inability at times to agree on a long-term budget and deficit reduction plan, the threat of a federal government shutdown and threats not to increase the federal government’s debt limit, may affect investor and consumer confidence and may adversely impact financial markets and the broader economy, perhaps suddenly and to a significant degree. The U.S. government has reduced the federal corporate income tax rates, and future legislative, regulatory and policy changes may result in more restrictions on international trade, less stringent prudential regulation of certain players in the financial markets, and significant new investments in infrastructure and national defense. Markets may react strongly to expectations about the changes in these policies, which could increase volatility, especially if the markets’ expectations for changes in government policies are not borne out.
Changes in market conditions will not have the same impact on all types of securities. Interest rates have been unusually low in recent years in the United States and abroad. Because there is little precedent for this situation, it is difficult to predict the impact of a significant rate increase on various markets. For example, because investors may buy securities or other investments with borrowed money, a significant increase in interest rates may cause a decline in the markets for those investments. Because of the sharp decline in the worldwide price of oil, there is a concern that oil producing nations may withdraw significant assets now held in U.S. Treasuries, which could force a substantial increase in interest rates. Regulators have expressed concern that rate increases may cause investors to sell fixed income securities faster than the market can absorb them, contributing to price volatility. In addition, there is a risk that the prices of goods and services in the U.S. and many foreign economies may decline over time, known as deflation (the opposite of inflation). Deflation may have an adverse effect on stock prices and creditworthiness and may make defaults on debt more likely. If a country’s economy slips into a deflationary pattern, it could last for a prolonged period and may be difficult to reverse.
The precise timing and the resulting impact of the United Kingdom’s departure from the European Union (the “EU”), commonly referred to as “Brexit,” are not yet known. The effect on the United Kingdom’s economy will likely depend on the nature of trade relations with the EU and other major economies following its exit, which are matters to be negotiated. The outcomes may cause increased volatility and have a significant adverse impact on world financial markets, other international trade agreements, and the United Kingdom and European economies, as well as the broader global economy for some time, which could significantly adversely affect the value of the Fund’s investments in the United Kingdom and Europe.
Mortgage-Backed and Mortgage Related Securities Risk
Investments in mortgage-backed and mortgage-related securities are subject to market risks forfixed-income securities which include, but are not limited to, interest rate risk, credit risk, extension risk and prepayment risk. When mortgages and other obligations are prepaid and when securities are called, a Fund may have to reinvest in securities with a lower yield or fail to recover additional amounts (i.e., premiums) paid for securities with higher interest rates, resulting in an unexpected capital loss and/or a decrease in the amount of dividends and yield.
Other Investment Companies Risk
The Fund may invest in shares of other registered investment companies, including money market funds. To the extent that the Fund invests in shares of other registered investment companies, the Fund will indirectly bear the fees and expenses, including for example advisory and administrative fees charged by those investment companies in addition to the Fund’s direct fees and expenses and will be subject to the risks associated with investments in those companies. For example, the Fund’s investments in money market funds are subject to
23
American Beacon Garcia Hamilton Quality Bond FundSM
Notes to Financial Statements
October 31, 2019
interest rate risk, credit risk, and market risk. The Fund must rely on the investment company in which it invests to achieve its investment objective. If the investment company fails to achieve its investment objective, the value of the Fund’s investment will decline, adversely affecting the Fund’s performance. To the extent the Fund invests in other investment companies that invest in equity securities, fixed income securities and/or foreign securities, or track an index, the Fund is subject to the risks associated with the underlying investments held by the investment company or the index fluctuations to which the investment company is subject.
Prepayment Risk
When interest rates fall, borrowers will generally repay the loans that underlie certain debt securities, especially mortgage-related and other types of asset-backed securities, more quickly than expected, causing the issuer of the security to repay the principal prior to the security’s expected maturity date. The Fund may need to reinvest the proceeds at a lower interest rate, reducing its income. Securities subject to prepayment risk generally offer less potential for gains when prevailing interest rates fall. If the Fund buys those securities at a premium, accelerated prepayments on those securities could cause the Fund to lose a portion of its principal investment. The impact of prepayments on the price of a security may be difficult to predict and may increase the security’s price volatility.
Redemption Risk
The Fund may experience periods of heavy redemptions that could cause the Fund to sell assets at inopportune times or at a loss or depressed value. Redemption risk is greater to the extent that one or more investors or intermediaries control a large percentage of investments in the Fund, have short investment horizons, or have unpredictable cash flow needs. A general rise in interest rates has the potential to cause investors to move out of fixed-income securities on a large scale, which may increase redemptions from mutual funds that hold large amounts of fixed-income securities. This, coupled with a reduction in the ability or willingness of dealers and other institutional investors to buy or hold fixed-income securities, may result in decreased liquidity and increased volatility in the fixed-income markets, and heightened redemption risk. Heavy redemptions, whether by a few large investors or many smaller investors, could hurt the Fund’s performance. This risk is heightened if the Fund invests in emerging market securities, which are generally less liquid than the securities of U.S. and other developed markets. The sale of assets to meet redemption requests may create net capital gains or losses, which could cause the Fund to have to distribute substantial capital gains.
Sector Risk
Sector risk is the risk associated with the Fund holding a significant amount of investments in similar businesses, which would be similarly affected by particular economic or market events, which may, in certain circumstances, cause the value of the equity and debt securities of companies in a particular sector of the market to change. To the extent the Fund has substantial holdings within a particular sector, the risks to the Fund associated with that sector increase. To the extent a Fund invests in the financial services sector, the value of the Fund’s shares may be particularly vulnerable to factors affecting that sector, such as the availability and cost of capital funds, changes in interest rates, the rate of corporate and consumer debt defaults, extensive government regulation and price competition. The value of a Fund’s shares could experience significantly greater volatility than investment companies investing more broadly.
U.S. Government Securities and Government-Sponsored Enterprises Risk
A security backed by the U.S. Treasury or the full faith and credit of the United States is guaranteed only as to the timely payment of interest and principal when held to maturity. The market prices for such securities are not guaranteed and will fluctuate. Additionally, circumstances could arise that would prevent the payment of interest or principal. This could result in losses to the Fund. Investments in government-sponsored enterprises are debt obligations issued by agencies and instrumentalities of the U.S. Government. These obligations vary in the level of support they receive from the U.S. Government. They may be: (i) supported by the full faith and credit of
24
American Beacon Garcia Hamilton Quality Bond FundSM
Notes to Financial Statements
October 31, 2019
the U.S. Treasury, such as those of the Government National Mortgage Association (‘‘Ginnie Mae’’); (ii) supported by the right of the issuer to borrow from the U.S. Treasury, such as those of the Federal Home Loan Bank and the Federal Farm Credit Banks; (iii) supported by the discretionary authority of the U.S. Government to purchase the agency obligations, such as those of Fannie Mae and Freddie Mac or (iv) supported only by the credit of the issuer, such as those of the Federal Farm Credit Bureau. The U.S. Government may choose not to provide financial support to U.S. Government-sponsored agencies or instrumentalities if it is not legally obligated to do so, in which case, if the issuer defaulted, to the extent the Fund holds securities of such issuers, it might not be able to recover its investment from the U.S. Government.
6. Federal Income and Excise Taxes
It is the policy of the Fund to qualify as a regulated investment company (“RIC”), by complying with all applicable provisions of Subchapter M of the Internal Revenue Code, as amended, and to make distributions of taxable income sufficient to relieve it from substantially all federal income and excise taxes. For federal income tax purposes, the Fund is treated as a single entity for the purpose of determining such qualification.
The Fund does not have any unrecorded tax liabilities in the accompanying financial statements. Each of the tax years in the four year period ended October 31, 2019 remain subject to examination by the Internal Revenue Service. If applicable, the Fund recognizes interest accrued related to unrecognized tax benefits in interest expense and penalties in “Other expenses” on the Statement of Operations.
The Fund may be subject to taxes imposed by countries in which it invests. Such taxes are generally based on returns of income earned or gains realized or repatriated. Taxes are accrued and applied to net investment income, net realized capital gains and net unrealized appreciation (depreciation), as applicable, as the income is earned or capital gains are recorded.
Dividends are categorized in accordance with income tax regulations which may treat certain transactions differently than U.S. GAAP. Accordingly, the character of distributions and composition of net assets for tax purposes may differ from those reflected in the accompanying financial statements.
The tax character of distributions paid were as follows:
| Year Ended October 31, 2019 | �� | Year Ended October 31, 2018 | ||||||||||
Distributions paid from: |
| |||||||||||
Ordinary income* |
| |||||||||||
Institutional Class | $ | 7,259,770 | $ | 3,305,504 | ||||||||
Y Class | 437,870 | 59,124 | ||||||||||
Investor Class | 280,134 | 165,821 | ||||||||||
R6 Class | 480,168 | - | ||||||||||
|
|
|
| |||||||||
Total distributions paid | $ | 8,457,942 | $ | 3,530,449 | ||||||||
|
|
|
| |||||||||
* For tax purposes, short-term gains are considered ordinary income distributions.
As of October 31, 2019 the components of distributable earnings (deficits) on a tax basis were as follows:
Fund | Tax Cost | Unrealized Appreciation | Unrealized (Depreciation) | Net Unrealized Appreciation (Depreciation) | ||||||||||||||||||||||
| Garcia Hamilton Quality Bond | $471,269,271 | $ | 6,038,508 | $ | (146,591 | ) | $ | 5,891,917 | ||||||||||||||||||
Fund | Net Unrealized Appreciation (Depreciation) | Undistributed Ordinary Income | Undistributed Long-Term Capital Gains | Accumulated Capital and Other (Losses) | Other Temporary Differences | Distributable Earnings | ||||||||||||||||||||||||||||||||||||||
| Garcia Hamilton Quality Bond | $ | 5,891,917 | $ | 130,679 | $ | - | $ | (2,854,087 | ) | $ | (130,681 | ) | $ | 3,037,828 | ||||||||||||||||||||||||||||||
25
American Beacon Garcia Hamilton Quality Bond FundSM
Notes to Financial Statements
October 31, 2019
Financial reporting records are adjusted for permanent book/tax differences to reflect tax character. Financial records are not adjusted for temporary differences. The temporary differences between financial reporting andtax-basis reporting of unrealized appreciation (depreciation) are attributable primarily to the tax deferral of losses from wash sales, unused capital loss carryforwards, and dividends payable.
Due to inherent differences in the recognition of income, expenses, and realized gains (losses) under U.S. GAAP and federal income tax regulations, permanent differences between book and tax reporting have been identified and appropriately reclassified on the Statement of Assets and Liabilities. The Fund had no permanent differences as of October 31, 2019.
Under the Regulated Investment Company Modernization Act of 2010 (“RIC MOD”), net capital losses recognized by the Fund in taxable years beginning after December 22, 2010 are carried forward indefinitely and retain their character as short-term and/or long-term losses.
As of October 31, 2019, the Fund had the following capital loss carryforwards:
Fund | Short-Term Capital Loss Carryforwards | Long-Term Capital Loss Carryforwards | ||||||||||
| Garcia Hamilton Quality Bond | $ | 1,724,644 | $ | 1,129,443 | ||||||||
The Fund utilized $237,962 of capital loss carryforwards during the year ended October 31, 2019.
7. Investment Transactions
The aggregate cost of purchases and proceeds from sales and maturities of investments, other thanshort-term obligations, for the year ended October 31, 2019 were as follows:
Fund | Purchases (non-U.S. Government Securities) | Purchases of U.S. Government Securities | Sales (non-U.S. Government Securities) | Sales of U.S. Government Securities | ||||||||||||||||||||||||
| Garcia Hamilton Quality Bond | $ | 271,233,574 | $ | 174,232,844 | $ | 75,903,944 | $ | 113,372,042 | ||||||||||||||||||||
A summary of the Fund’s transactions in the USG Select Fund for the year ended October 31, 2019 were as follows:
Fund | Type of Transaction | October 31, 2018 Shares/Fair Value | Purchases | Sales | October 31, 2019 Shares/Fair Value | Dividend Income | ||||||||||||||||||||||||||||||||||||
| Garcia Hamilton Quality Bond | Direct | $ | 27,218,440 | $ | 394,521,845 | $ | 418,113,032 | $ | 3,627,253 | $ | 262,616 | |||||||||||||||||||||||||||||||
8. Borrowing Arrangements
Effective November 15, 2018 (the “Effective Date”), the Fund, along with certain other funds managed by the Manager (“Participating Funds”), entered into a committed revolving line of credit (the “Committed Line”) agreement with State Street Bank and Trust Company (the “Bank”) to be used to facilitate portfolio liquidity. The maximum borrowing amount under the Committed Line is $250 million with interest at a rate equal to the higher of(a) one-month LIBOR plus 1.25% per annum or (b) the Federal Funds rate plus 1.25% per annum on amounts borrowed. Each of the Participating Funds paid a closing fee of $100,000 on the Effective Date and a quarterly commitment fee at a rate of 0.25% per annum on the unused portion of the Committed Line amount. The Committed Line expires November 14, 2019, unless extended by the Bank or terminated by the Participating Funds in accordance with the agreement.
On the Effective Date, the Fund, along with certain other Participating Funds managed by the Manager, also entered into an uncommitted discretionary demand revolving line of credit (the “Uncommitted Line”) agreement
26
American Beacon Garcia Hamilton Quality Bond FundSM
Notes to Financial Statements
October 31, 2019
with the Bank to be used to facilitate portfolio liquidity. The maximum borrowing amount under the Uncommitted Line is $50 million with interest at a rate equal to the higher of(a) one-month LIBOR plus 1.25% per annum or (b) the Federal Funds rate plus 1.25% per annum on each outstanding loan. Each of the Participating Funds paid a closing fee of $35,000 on the Effective Date. The Uncommitted Line expires November 14, 2019 unless extended by the Bank or terminated by the Participating Funds in accordance with the agreement.
The Participating Funds paid administration, legal and arrangement fees, which are recognized as a component of “Other expenses” on the Statement of Operations, along with commitment fees, that have been allocated among the Participating Funds based on average daily net assets.
During the year ended October 31, 2019, the Fund did not utilize this facility.
9. Capital Share Transactions
The tables below summarize the activity in capital shares for each Class of the Fund:
| Institutional Class | ||||||||||||||||||||||||||||
| Year Ended October 31, | ||||||||||||||||||||||||||||
| 2019 | 2018 | |||||||||||||||||||||||||||
Garcia Hamilton Quality Bond Fund | Shares | Amount | Shares | Amount | ||||||||||||||||||||||||
| Shares sold | 13,533,670 | $ | 134,010,760 | 12,598,631 | $ | 124,573,816 | ||||||||||||||||||||||
| Reinvestment of dividends | 565,317 | 5,624,443 | 287,808 | 2,842,265 | ||||||||||||||||||||||||
| Shares redeemed | (6,579,506 | ) | (65,522,190 | ) | (2,278,673 | ) | (22,493,423 | ) | ||||||||||||||||||||
|
|
|
|
|
|
|
| |||||||||||||||||||||
| Net increase in shares outstanding | 7,519,481 | $ | 74,113,013 | 10,607,766 | $ | 104,922,658 | ||||||||||||||||||||||
|
|
|
|
|
|
|
| |||||||||||||||||||||
| Y Class | ||||||||||||||||||||||||||||
| Year Ended October 31, | ||||||||||||||||||||||||||||
| 2019 | 2018 | |||||||||||||||||||||||||||
Garcia Hamilton Quality Bond Fund | Shares | Amount | Shares | Amount | ||||||||||||||||||||||||
| Shares sold | 2,565,196 | $ | 25,317,668 | 77,645 | $ | 766,204 | ||||||||||||||||||||||
| Reinvestment of dividends | 43,701 | 435,013 | 5,845 | 57,695 | ||||||||||||||||||||||||
| Shares redeemed | (1,200,900 | ) | (12,027,942 | ) | (23,305 | ) | (230,768 | ) | ||||||||||||||||||||
|
|
|
|
|
|
|
| |||||||||||||||||||||
| Net increase in shares outstanding | 1,407,997 | $ | 13,724,739 | 60,185 | $ | 593,131 | ||||||||||||||||||||||
|
|
|
|
|
|
|
| |||||||||||||||||||||
| Investor Class | ||||||||||||||||||||||||||||
| Year Ended October 31, | ||||||||||||||||||||||||||||
| 2019 | 2018 | |||||||||||||||||||||||||||
Garcia Hamilton Quality Bond Fund | Shares | Amount | Shares | Amount | ||||||||||||||||||||||||
| Shares sold | 573,641 | $ | 5,677,383 | 273,789 | $ | 2,702,704 | ||||||||||||||||||||||
| Reinvestment of dividends | 28,161 | 280,122 | 16,784 | 165,797 | ||||||||||||||||||||||||
| Shares redeemed | (241,219 | ) | (2,393,292 | ) | (149,158 | ) | (1,472,508 | ) | ||||||||||||||||||||
|
|
|
|
|
|
|
| |||||||||||||||||||||
| Net increase in shares outstanding | 360,583 | $ | 3,564,213 | 141,415 | $ | 1,395,993 | ||||||||||||||||||||||
|
|
|
|
|
|
|
| |||||||||||||||||||||
| R6 Class | ||||||||||||||||||||||||||||
| February 28, 2019A to October 31, 2019 | ||||||||||||||||||||||||||||
Garcia Hamilton Quality Bond Fund | Shares | Amount | ||||||||||||||||||||||||||
| Shares sold | 12,935,747 | B | $ | 130,250,579 | B | |||||||||||||||||||||||
| Reinvestment of dividends | 47,760 | 479,506 | ||||||||||||||||||||||||||
| Shares redeemed | (16,756 | ) | (168,494 | ) | ||||||||||||||||||||||||
|
|
|
| |||||||||||||||||||||||||
| Net increase in shares outstanding | 12,966,751 | $ | 130,561,591 | |||||||||||||||||||||||||
|
|
|
| |||||||||||||||||||||||||
| A | Class commenced operations. |
| B | Seed capital was received on in the amount of $100,000 for the R6 Class. As a result, shares were issued in the amount of 10,132 for R6 Class. |
27
American Beacon Garcia Hamilton Quality Bond FundSM
Notes to Financial Statements
October 31, 2019
10. Subsequent Events
Management has evaluated subsequent events for possible recognition or disclosure in the financial statements through the date the financial statements are issued. Management has determined that there are no material events that would require disclosure in the Fund’s financial statements through this date.
28
American Beacon Garcia Hamilton Quality Bond FundSM
Financial Highlights
(For a share outstanding throughout the period)
| Institutional Class | ||||||||||||||||||||||||||||
| Year Ended October 31, | April 4, 2016A to October 31, | |||||||||||||||||||||||||||
| 2019 | 2018 | 2017 | 2016 | |||||||||||||||||||||||||
|
| |||||||||||||||||||||||||||
Net asset value, beginning of period | $ | 9.79 | $ | 9.91 | $ | 9.98 | $ | 10.00 | ||||||||||||||||||||
|
|
|
|
|
|
|
| |||||||||||||||||||||
Income (loss) from investment operations: | ||||||||||||||||||||||||||||
Net investment income | 0.24 | 0.20 | 0.14 | 0.05 | ||||||||||||||||||||||||
Net gains (losses) on investments (both realized and unrealized) | 0.26 | (0.13 | ) | (0.05 | ) | (0.02 | ) | |||||||||||||||||||||
|
|
|
|
|
|
|
| |||||||||||||||||||||
Total income (loss) from investment operations | 0.50 | 0.07 | 0.09 | 0.03 | ||||||||||||||||||||||||
|
|
|
|
|
|
|
| |||||||||||||||||||||
Less distributions: | ||||||||||||||||||||||||||||
Dividends from net investment income | (0.24 | ) | (0.19 | ) | (0.15 | ) | (0.05 | ) | ||||||||||||||||||||
Distributions from net realized gains | - | - | (0.01 | ) | - | |||||||||||||||||||||||
|
|
|
|
|
|
|
| |||||||||||||||||||||
Total distributions | (0.24 | ) | (0.19 | ) | (0.16 | ) | (0.05 | ) | ||||||||||||||||||||
|
|
|
|
|
|
|
| |||||||||||||||||||||
Net asset value, end of period | $ | 10.05 | $ | 9.79 | $ | 9.91 | $ | 9.98 | ||||||||||||||||||||
|
|
|
|
|
|
|
| |||||||||||||||||||||
Total returnB | 5.20 | % | 0.74 | % | 0.91 | % | 0.34 | %C | ||||||||||||||||||||
|
|
|
|
|
|
|
| |||||||||||||||||||||
Ratios and supplemental data: |
| |||||||||||||||||||||||||||
Net assets, end of period | $ | 316,582,604 | $ | 234,919,975 | $ | 132,575,412 | $ | 124,032,604 | ||||||||||||||||||||
Ratios to average net assets: | ||||||||||||||||||||||||||||
Expenses, before reimbursements | 0.66 | % | 0.69 | % | 0.70 | % | 1.06 | %D | ||||||||||||||||||||
Expenses, net of reimbursements | 0.45 | % | 0.45 | % | 0.45 | % | 0.45 | %D | ||||||||||||||||||||
Net investment income, before expense reimbursements | 2.18 | % | 1.68 | % | 1.12 | % | 0.29 | %D | ||||||||||||||||||||
Net investment income, net of reimbursements | 2.39 | % | 1.92 | % | 1.37 | % | 0.91 | %D | ||||||||||||||||||||
Portfolio turnover rate | 58 | % | 143 | % | 52 | % | 40 | %E | ||||||||||||||||||||
| A | Commencement of operations. |
| B | Based on net asset value, which does not reflect the sales charge, redemption fee, or contingent deferred sales charge, if applicable. May include adjustments in accordance with U.S. GAAP and as such, the net asset value for reporting purposes and the returns based upon those net asset values may differ from the net asset value and returns for shareholder transactions. |
| C | Not annualized. |
| D | Annualized. |
| E | Portfolio turnover rate is for the period from April 4, 2016 through October 31, 2016 and is not annualized. |
See accompanying notes
29
American Beacon Garcia Hamilton Quality Bond FundSM
Financial Highlights
(For a share outstanding throughout the period)
| Y Class | ||||||||||||||||||||||||||||
| Year Ended October 31, | April 4, 2016A to October 31, | |||||||||||||||||||||||||||
| 2019 | 2018 | 2017 | 2016 | |||||||||||||||||||||||||
|
| |||||||||||||||||||||||||||
Net asset value, beginning of period | $ | 9.79 | $ | 9.90 | $ | 9.98 | $ | 10.00 | ||||||||||||||||||||
|
|
|
|
|
|
|
| |||||||||||||||||||||
Income (loss) from investment operations: | ||||||||||||||||||||||||||||
Net investment income | 0.24 | 0.18 | 0.13 | 0.05 | ||||||||||||||||||||||||
Net gains (losses) on investments (both realized and unrealized) | 0.25 | (0.11 | ) | (0.06 | ) | (0.02 | ) | |||||||||||||||||||||
|
|
|
|
|
|
|
| |||||||||||||||||||||
Total income (loss) from investment operations | 0.49 | 0.07 | 0.07 | 0.03 | ||||||||||||||||||||||||
|
|
|
|
|
|
|
| |||||||||||||||||||||
Less distributions: | ||||||||||||||||||||||||||||
Dividends from net investment income | (0.23 | ) | (0.18 | ) | (0.14 | ) | (0.05 | ) | ||||||||||||||||||||
Distributions from net realized gains | - | - | �� | (0.01 | ) | - | ||||||||||||||||||||||
|
|
|
|
|
|
|
| |||||||||||||||||||||
Total distributions | (0.23 | ) | (0.18 | ) | (0.15 | ) | (0.05 | ) | ||||||||||||||||||||
|
|
|
|
|
|
|
| |||||||||||||||||||||
Net asset value, end of period | $ | 10.05 | $ | 9.79 | $ | 9.90 | $ | 9.98 | ||||||||||||||||||||
|
|
|
|
|
|
|
| |||||||||||||||||||||
Total returnB | 5.09 | % | 0.74 | % | 0.71 | % | 0.29 | %C | ||||||||||||||||||||
|
|
|
|
|
|
|
| |||||||||||||||||||||
Ratios and supplemental data: | ||||||||||||||||||||||||||||
Net assets, end of period | $ | 17,927,537 | $ | 3,685,857 | $ | 3,133,476 | $ | 3,265,315 | ||||||||||||||||||||
Ratios to average net assets: | ||||||||||||||||||||||||||||
Expenses, before reimbursements | 0.73 | % | 0.75 | % | 0.77 | % | 1.29 | %D | ||||||||||||||||||||
Expenses, net of reimbursements | 0.55 | % | 0.55 | % | 0.55 | % | 0.55 | %D | ||||||||||||||||||||
Net investment income, before expense reimbursements | 2.14 | % | 1.58 | % | 1.05 | % | 0.11 | %D | ||||||||||||||||||||
Net investment income, net of reimbursements | 2.32 | % | 1.78 | % | 1.27 | % | 0.85 | %D | ||||||||||||||||||||
Portfolio turnover rate | 58 | % | 143 | % | 52 | % | 40 | %E | ||||||||||||||||||||
| A | Commencement of operations. |
| B | Based on net asset value, which does not reflect the sales charge, redemption fee, or contingent deferred sales charge, if applicable. May include adjustments in accordance with U.S. GAAP and as such, the net asset value for reporting purposes and the returns based upon those net asset values may differ from the net asset value and returns for shareholder transactions. |
| C | Not annualized. |
| D | Annualized. |
| E | Portfolio turnover rate is for the period from April 4, 2016 through October 31, 2016 and is not annualized. |
See accompanying notes
30
American Beacon Garcia Hamilton Quality Bond FundSM
Financial Highlights
(For a share outstanding throughout the period)
| Investor Class | ||||||||||||||||||||||||||||
| Year Ended October 31, | April 4, 2016A to October 31, | |||||||||||||||||||||||||||
| 2019 | 2018 | 2017 | 2016 | |||||||||||||||||||||||||
|
| |||||||||||||||||||||||||||
Net asset value, beginning of period | $ | 9.79 | $ | 9.91 | $ | 9.99 | $ | 10.00 | ||||||||||||||||||||
|
|
|
|
|
|
|
| |||||||||||||||||||||
Income (loss) from investment operations: | ||||||||||||||||||||||||||||
Net investment income | 0.21 | 0.15 | 0.10 | 0.03 | ||||||||||||||||||||||||
Net gains (losses) on investments (both realized and unrealized) | 0.26 | (0.11 | ) | (0.06 | ) | (0.01 | ) | |||||||||||||||||||||
|
|
|
|
|
|
|
| |||||||||||||||||||||
Total income (loss) from investment operations | 0.47 | 0.04 | 0.04 | 0.02 | ||||||||||||||||||||||||
|
|
|
|
|
|
|
| |||||||||||||||||||||
Less distributions: | ||||||||||||||||||||||||||||
Dividends from net investment income | (0.21 | ) | (0.16 | ) | (0.11 | ) | (0.03 | ) | ||||||||||||||||||||
Distributions from net realized gains | - | - | (0.01 | ) | - | |||||||||||||||||||||||
|
|
|
|
|
|
|
| |||||||||||||||||||||
Total distributions | (0.21 | ) | (0.16 | ) | (0.12 | ) | (0.03 | ) | ||||||||||||||||||||
|
|
|
|
|
|
|
| |||||||||||||||||||||
Net asset value, end of period | $ | 10.05 | $ | 9.79 | $ | 9.91 | $ | 9.99 | ||||||||||||||||||||
|
|
|
|
|
|
|
| |||||||||||||||||||||
Total returnB | 4.80 | % | 0.36 | % | 0.43 | % | 0.24 | %C | ||||||||||||||||||||
|
|
|
|
|
|
|
| |||||||||||||||||||||
Ratios and supplemental data: | ||||||||||||||||||||||||||||
Net assets, end of period | $ | 14,904,591 | $ | 10,995,242 | $ | 9,724,030 | $ | 8,594,617 | ||||||||||||||||||||
Ratios to average net assets: | ||||||||||||||||||||||||||||
Expenses, before reimbursements | 1.04 | % | 0.92 | % | 0.94 | % | 1.19 | %D | ||||||||||||||||||||
Expenses, net of reimbursements | 0.83 | % | 0.83 | % | 0.83 | % | 0.83 | %D | ||||||||||||||||||||
Net investment income, before expense reimbursements | 1.81 | % | 1.41 | % | 0.89 | % | 0.21 | %D | ||||||||||||||||||||
Net investment income, net of reimbursements | 2.02 | % | 1.50 | % | 0.99 | % | 0.57 | %D | ||||||||||||||||||||
Portfolio turnover rate | 58 | % | 143 | % | 52 | % | 40 | %E | ||||||||||||||||||||
| A | Commencement of operations. |
| B | Based on net asset value, which does not reflect the sales charge, redemption fee, or contingent deferred sales charge, if applicable. May include adjustments in accordance with U.S. GAAP and as such, the net asset value for reporting purposes and the returns based upon those net asset values may differ from the net asset value and returns for shareholder transactions. |
| C | Not annualized. |
| D | Annualized. |
| E | Portfolio turnover rate is for the period from April 4, 2016 through October 31, 2016 and is not annualized. |
See accompanying notes
31
American Beacon Garcia Hamilton Quality Bond FundSM
Financial Highlights
(For a share outstanding throughout the period)
| R6 Class | ||||
| February 28, 2019A to October 31, 2019 | ||||
|
| |||
Net asset value, beginning of period | $ | 9.87 | ||
|
| |||
Income from investment operations: | ||||
Net investment income | 0.17 | |||
Net gains on investments (both realized and unrealized) | 0.17 | |||
|
| |||
Total income from investment operations | 0.34 | |||
|
| |||
Less distributions: | ||||
Dividends from net investment income | (0.17 | ) | ||
|
| |||
Total distributions | (0.17 | ) | ||
|
| |||
Net asset value, end of period | $ | 10.04 | ||
|
| |||
Total returnB | 3.44 | %C | ||
|
| |||
Ratios and supplemental data: | ||||
Net assets, end of period | $ | 130,208,195 | ||
Ratios to average net assets: | ||||
Expenses, before reimbursements | 0.66 | %D | ||
Expenses, net of reimbursements | 0.41 | %D | ||
Net investment income, before expense reimbursements | 1.90 | %D | ||
Net investment income, net of reimbursements | 2.15 | %D | ||
Portfolio turnover rate | 58 | %E | ||
| A | Commencement of operations. |
| B | Based on net asset value, which does not reflect the sales charge, redemption fee, or contingent deferred sales charge, if applicable. May include adjustments in accordance with U.S. GAAP and as such, the net asset value for reporting purposes and the returns based upon those net asset values may differ from the net asset value and returns for shareholder transactions. |
| C | Not annualized. |
| D | Annualized. |
| E | Portfolio turnover is for the period ended herein. |
See accompanying notes
32
American Beacon FundsSM
October 31, 2019 (Unaudited)
Certain tax information regarding the Funds are required to be provided to shareholders based upon the Funds’ income and distributions for the taxable year ended October 31, 2019. The information and distributions reported herein may differ from information and distributions taxable to the shareholders for the calendar year ended December 31, 2019.
The Fund designated the following items with regard to distributions paid during the fiscal year ended October 31, 2019. All designations are based on financial information available as of this annual report and, accordingly, are subject to change. For each item, it is the intention of the Funds to designate the maximum amount permitted under the Internal Revenue Code of 1986, as amended, and the regulations there under.
Corporate Dividends-Received Deduction:
Garcia Hamilton Quality Bond | - | % |
Qualified Dividend Income:
Garcia Hamilton Quality Bond | - | % |
Long-Term Capital Gain Distributions:
Garcia Hamilton Quality Bond | $ | - |
Short-Term Capital Gain Distributions:
Garcia Hamilton Quality Bond | $ | - |
Shareholders will receive notification in January 2020 of the applicable tax information necessary to prepare their 2019 income tax returns.
33
Disclosure Regarding Approval of the Management and Investment
Advisory Agreements(Unaudited)
Renewal and Approval of Management Agreement and Investment Advisory Agreement
Atin-person meetings held on May 9, 2019 and June4-5, 2019 (collectively, the “Meetings”), the Board of Trustees (“Board” or “Trustees”) considered and then, at its June 5, 2019 meeting, approved the renewal of:
(1) the Management Agreement between American Beacon Advisors, Inc. (“Manager”) and the American Beacon Funds (“Trust”), on behalf of the American Beacon Garcia Hamilton Quality Bond Fund (“Fund”); and
(2) the Investment Advisory Agreement among the Manager, Garcia Hamilton & Associates, LP (“subadvisor”), and the Trust, on behalf of the Fund.
The Management Agreement and the Investment Advisory Agreement are referred to herein individually as an “Agreement” and collectively as the “Agreements.” In preparation for its consideration of the renewal of the Agreements, the Board undertook steps to gather and consider information furnished by the Manager, the subadvisor, Broadridge, Inc. (“Broadridge”) and Morningstar, Inc. (“Morningstar”).The Board, with the assistance of independent legal counsel, requested and received certain relevant information from the Manager and the subadvisor.
In advance of the Meetings, the Board’s Investment Committee and/or the Manager coordinated the production of information from Broadridge and Morningstar regarding the performance, fees and expenses of the Fund as well as information from the Manager and the subadvisor. At the Meetings, the Board considered the information provided in connection with the renewal process, as well as information furnished to the Board throughout the year at regular meetings of the Board and its committees. In connection with the Board’s consideration of the Agreements, the Board received and evaluated such information as they deemed necessary. This information is described below in the section summarizing the factors the Board considered in connection with its renewal and approval of the Agreements, as well as the section describing additional Board considerations with respect to the Fund.
The Board noted that the Manager provides management and administrative services to the Fund pursuant to the Management Agreement. The Board considered that many mutual funds have separate contracts governing each type of service and observed that, with respect to such mutual funds, the actual management fee rates provided by Broadridge for peer group funds reflect the combined advisory and administrative expenses, reduced by any fee waivers and/or reimbursements.
A firm may not have been able to, or opted not to, provide information in response to certain information requests, in which case the Board conducted its evaluation of the firm based on information that was provided. In such cases, the Board determined that the omission of any such information was not material to its considerations. The class of shares used for comparative performance purposes was the share class with the lowest expenses available for purchase by the general public, which was the Institutional Class. The Board also considered that the use of Institutional Class performance generally facilitates a meaningful comparison for expense and performance purposes.
Provided below is an overview of certain factors the Board considered in connection with its renewal and approval of the Agreements. The Board did not identify any particular information that was most relevant to its consideration to renew or approve each Agreement, and each Trustee may have afforded different weight to the various factors. Legal counsel to the independent Trustees provided the Board with a memorandum regarding its responsibilities pertaining to the renewal and approval of investment advisory contracts, such as the Agreements. The memorandum explained the regulatory requirements surrounding the Board’s process for evaluating investment advisors and the terms of investment advisory contracts. Based on its evaluation, the Board unanimously concluded that the terms of each Agreement were reasonable and fair and that the renewal and approval of each Agreement was in the best interests of the Fund and its shareholders.
34
Disclosure Regarding Approval of the Management and Investment
Advisory Agreements(Unaudited)
Considerations With Respect to the Renewal of the Management Agreement and the Investment Advisory Agreement
In determining whether to renew the Agreements, the Board considered the Fund’s investment management and subadvisory relationships separately. In each instance, the Board considered, among other things, the following factors: (1) the nature, extent and quality of the services provided; (2) the investment performance of the Fund; (3) the costs incurred by the Manager in rendering services to the Fund and its resulting profits or losses; (4) comparisons of services and fee rates with contracts entered into by the Manager or the subadvisor or their affiliates with other clients (such as pension funds and other institutional clients); (5) the extent to which economies of scale, if any, have been taken into account in setting each fee rate schedule; (6) whether fee rate levels reflect economies of scale, if any, for the benefit of Fund investors; and (7) any other benefits derived or anticipated to be derived by the Manager or the subadvisor from their relationships with the Fund.
Nature, Extent and Quality of Services. With respect to the renewal of the Management Agreement, the Board considered, among other factors: the Fund’s performance since its inception on April 4, 2016; the length of service of key investment personnel at the Manager; the cost structure of the Fund; the Manager’s culture of compliance and support that reduce risks to the Fund; the Manager’s quality of services; the Manager’s active role in monitoring and, as appropriate, recommending additional or replacement subadvisors; and the Manager’s efforts to retain key employees and maintain staffing levels.
With respect to the renewal of the Investment Advisory Agreement, the Board considered the level of staffing and the size of the subadvisor. The Board also considered the adequacy of the resources committed to the Fund by the subadvisor, and whether those resources were commensurate with the needs of the Fund and are sufficient to sustain appropriate levels of performance and compliance needs. In this regard, the Board considered the financial stability of the subadvisor. The Board also considered the subadvisor’s representations regarding its compliance program and code of ethics. Based on the foregoing information, the Board concluded that the nature, extent and quality of the management and advisory services provided by the Manager and the subadvisor were appropriate for the Fund.
Investment Performance.The Board evaluated the comparative information provided by Broadridge and the Manager regarding the performance of the Fund relative to its Broadridge performance universe, Morningstar Category, and benchmark index, as well as the Fund’s Morningstar rating. The Board considered the information provided by Broadridge regarding Broadridge’s independent methodology for selecting the Fund’s Broadridge performance universe. The Board also considered that the performance universes selected by Broadridge may not provide appropriate comparisons for the Fund. In addition, the Board considered the performance reports and discussions with management at Board and Committee meetings throughout the year. The Board also evaluated the comparative information provided by the subadvisor regarding the performance of its portion of the Fund relative to the performance of a composite of similar accounts managed by the subadvisor and the Fund’s benchmark index. In addition, the Board considered the Manager’s recommendation to continue to retain the subadvisor. A discussion regarding the Board’s considerations with respect to the Fund’s performance appears below under “Additional Considerations and Conclusions with Respect to the Fund.”
Costs of the Services Provided to the Fund and the Profits Realized by the Manager from its Relationship with the Fund.In analyzing the cost of services and profitability of the Manager, the Board considered the revenues earned and the expenses incurred by the Manager, before and after the payment of distribution-related expenses by the Manager. The profits or losses were noted at both an aggregate level for all funds within the group of mutual funds sponsored by the Manager (the “Fund Complex”) and at an individual Fund level, with the Manager sustaining a loss before and after the payment of distribution-related expenses by the Manager for the Fund. The Board also considered comparative information provided by the Manager regarding the Manager’s overall profitability with respect to the Fund Complex relative to the overall profitability of other firms in the mutual fund industry, as disclosed in publicly available sources. Although the Board noted that, in certain cases, the fee rates paid by other clients of the Manager are lower than the fee rates paid by the Fund, the Manager represented that,
35
Disclosure Regarding Approval of the Management and Investment
Advisory Agreements(Unaudited)
among other matters, the difference is attributable to the fact that the Manager does not perform administrative services fornon-investment company clients and reflects the greater level of responsibility and regulatory requirements associated with managing the Fund.
The Board also noted that the Manager proposed to continue the expense waivers and reimbursements for the Fund that were in place during the last fiscal year. The Board further considered that, with respect to the Fund, the Management Agreement provides for the Manager to receive a management fee comprised of an annualized fee that is retained by the Manager. The Board also noted that certain share classes of the Fund maintain higher expense ratios in order to compensate third-party financial intermediaries.
In analyzing the fee rates charged by the subadvisor in connection with its investment advisory services to the Fund, the Board considered representations made by the subadvisor that the fee rate negotiated by the Manager is favorable relative to the fee rates that the subadvisor charges for any comparable client accounts. The Board did not request profitability data from the subadvisor because the Board did not view this data as imperative to its deliberations given thearm’s-length nature of the relationship between the Manager and the subadvisor with respect to the negotiation of subadvisory fee rates. In addition, the Board considered that it was advised that the subadvisor may not account for its profits on anaccount-by-account basis and that different firms likely employ different methodologies in connection with these calculations.
Based on the foregoing information, the Board concluded that the profitability levels of the Manager were reasonable in light of the services performed by the Manager. A discussion regarding the Board’s considerations with respect to the Fund’s fee rates is set forth below under “Additional Considerations and Conclusions with Respect to the Fund.”
Economies of Scale.In considering the reasonableness of the management and investment advisory fees rates, the Board considered whether economies of scale will be realized as the Fund grows and whether fee rate levels reflect these economies of scale for the benefit of Fund shareholders. In this regard, the Board considered that the Manager has negotiated breakpoints in the subadvisory fee rate for the Fund. In addition, the Board noted the Manager’s representation that the Management Agreement contains fee schedule breakpoints at higher asset levels with respect to the Fund. Based on the foregoing information, the Board concluded that the Manager and subadvisor fee rate schedules for the Fund provide for a reasonable sharing of benefits from any economies of scale with the Fund.
Benefits Derived from the Relationship with the Fund.The Board considered the“fall-out” or ancillary benefits that accrue to the Manager and/or the subadvisor as a result of the advisory relationships with the Fund, including greater exposure in the marketplace with respect to the Manager’s or the subadvisor’s investment process and expanding the level of assets under management by the Manager and the subadvisor. Based on the foregoing information, the Board concluded that the potential benefits accruing to the Manager and the subadvisor by virtue of their relationships with the Fund appear to be fair and reasonable.
Additional Considerations and Conclusions with Respect to the Fund
The performance comparisons below were made in comparison to the Fund’s Broadridge performance universe and Morningstar Category. With respect to the Broadridge performance universe, the 1st Quintile represents the top 20 percent of the universe based on performance and the 5th Quintile representing the bottom 20 percent of the universe based on performance. References below to the Fund’s Broadridge performance universe are to the universe of mutual funds with a comparable investment classification/objective included in the analysis provided by Broadridge.
The expense comparisons below were made in comparison to the Fund’s Broadridge expense universe and Broadridge expense group, with the 1st Quintile representing the lowest 20 percent of the universe or group based on lowest total expense and the 5th Quintile representing the highest 20 percent of the universe or group based on
36
Disclosure Regarding Approval of the Management and Investment
Advisory Agreements(Unaudited)
highest total expense. References below to the Fund’s expense group and expense universe are to the respective group or universe of comparable mutual funds included in the analysis by Broadridge. A Broadridge expense group consists of the Fund and a representative sample of funds with similar operating structures and asset sizes, as selected by Broadridge. A Broadridge expense universe includes all funds in the investment classification/objective with a similar operating structure as the share class of the Fund included in the Broadridge comparative information and provides a broader view of expenses across the Fund’s investment classification/objective. The Board also considered the Fund’s Morningstar fee level category. In reviewing expenses, the Board considered the positive impact of fee waivers where applicable and the Manager’s agreement to continue the fee waivers. In addition, information regarding the subadvisor’s use of soft dollars was requested from the Manager and was considered by the Board.
In considering the renewal of the Management Agreement and the Investment Advisory Agreement with the subadvisor for the Fund, the Board considered the following additional factors:
Broadridge Total Expenses Excluding12b-1 Fees and Morningstar Fee Level Ranking
Compared to Broadridge Expense Group | 2nd Quintile | |
Compared to Broadridge Expense Universe | 3rd Quintile | |
Morningstar Fee Level Ranking – Institutional Class | Below Average Expense Ratio |
Broadridge and Morningstar Performance Analysis(one-year period ended December 31, 2018)
Compared to Broadridge Performance Universe | 1st Quintile | |
Compared to Morningstar Category | 1st Quintile |
The Board also considered: (1) information provided by the subadvisor regarding fee rates charged for managing assets in the same or a similar strategy as the subadvisor manages the Fund; and (2) the Manager’s recommendation to continue to retain the subadvisor based upon, among other factors, the relatively brief period that this Fund has been in operation.
Based on these and other considerations, the Board: (1) concluded that the fees paid to the Manager and subadvisor under the Management and Investment Advisory Agreements are fair and reasonable; and (2) determined that the Fund and its shareholders would benefit from the Manager’s and subadvisor’s continued management of the Fund.
37
Trustees and Officers of the American Beacon FundsSM(Unaudited)
The Trustees and officers of the American Beacon Funds (the “Trust”) are listed below, together with their principal occupations during the past five years. The address of each person listed below is 220 Las Colinas Boulevard East, Suite 1200, Irving, Texas 75039. Each Trustee overseesthirty-six funds in the fund complex that includes the Trust, the American Beacon Select Funds, the American Beacon Institutional Funds Trust, the American Beacon Sound Point Enhanced Income Fund, American Beacon Apollo Total Return Fund and the American Beacon Sound Point Alternative Lending Fund. The Trust’s Statement of Additional Information contains additional information about the Trustees and is available without charge by calling1-800-658-5811.
Name, Age | Position, Term of Office and Length of Time Served with the Trust | Principal Occupation(s) During Past 5 Years and Current Directorships | ||
| INTERESTED TRUSTEES | Term | |||
| Lifetime of Trust until removal, resignation or retirement* | ||||
| Alan D. Feld** (82) | Trustee since 1996 | Partner in the law firm of Akin, Gump, Strauss, Hauer & Feld, LLP (law firm) (1960-Present); Trustee, American Beacon Select Funds (1999-Present); Trustee, American Beacon Institutional Funds Trust (2017-Present); Trustee, American Beacon Sound Point Enhanced Income Fund (2018-Present); Trustee, American Beacon Apollo Total Return Fund (2018-Present); Trustee, American Beacon Sound Point Alternative Lending Fund (2019-Present). | ||
| NON-INTERESTED TRUSTEES | Term | |||
| Lifetime of Trust until removal, resignation or retirement* | ||||
| Gilbert G. Alvarado (49) | Trustee since 2015 | Director, Kura MD, Inc. (local telehealth organization) (2015-present); Vice President & CFO, Sierra Health Foundation (health conversion private foundation) (2006-Present); Vice President & CFO, Sierra Health Foundation: Center for Health Program Management (California public benefit corporation) (2012-Present); Director, Innovative North State (2012-2015); Director, Sacramento Regional Technology Alliance (2011-2016); Director, Women’s Empowerment (2009-2014); Director, Valley Healthcare Staffing (2017-present); Trustee, American Beacon Select Funds (2015-Present); Trustee, American Beacon Institutional Funds Trust (2017-Present); Trustee, American Beacon Sound Point Enhanced Income Fund (2018-Present); Trustee, American Beacon Apollo Total Return Fund (2018-Present); Trustee, American Beacon Sound Point Alternative Lending Fund (2019-Present). | ||
| Joseph B. Armes (57) | Trustee since 2015 | Chairman & CEO, CSW Industrials f/k/a Capital Southwest Corporation (investment company) (2015-Present); Chairman of the Board of Capital Southwest Corporation, predecessor to CSW Industrials, Inc. (2014-2017) (investment company); CEO, Capital Southwest Corporation (2013-2015); President & CEO, JBA Investment Partners (family investment vehicle) (2010-Present); Director and Chair of Audit Committee, RSP Permian (oil and gas producer) (2013-Present); Trustee, American Beacon Select Funds (2015-Present); Trustee, American Beacon Institutional Funds Trust (2017-Present); Trustee, American Beacon Sound Point Enhanced Income Fund (2018-Present); Trustee, American Beacon Apollo Total Return Fund (2018-Present); Trustee, American Beacon Sound Point Alternative Lending Fund (2019-Present). | ||
| Gerard J. Arpey (61) | Trustee since 2012 | Director, The Home Depot, Inc. (2015-Present); Partner, Emerald Creek Group (private equity firm) (2011-Present); Director, S.C. Johnson & Son, Inc. (privately held company) (2008-present); Trustee, American Beacon Select Funds (2012-Present); Trustee, American Beacon Institutional Funds Trust (2017-Present); Trustee, American Beacon Sound Point Enhanced Income Fund (2018-Present); Trustee, American Beacon Apollo Total Return Fund (2018-Present); Trustee, American Beacon Sound Point Alternative Lending Fund (2019-Present). | ||
38
Trustees and Officers of the American Beacon FundsSM(Unaudited)
Name, Age | Position, Term of Office and Length of Time Served with the Trust | Principal Occupation(s) During Past 5 Years and Current Directorships | ||
| NON-INTERESTED TRUSTEES (CONT.) | Term | |||
| Lifetime of Trust until removal, resignation or retirement* | ||||
| Brenda A. Cline (58) | Trustee since 2004 Chair since 2019 Vice Chair 2018 | Chief Financial Officer, Treasurer and Secretary, Kimbell Art Foundation (1993-Present); Director, Tyler Technologies, Inc. (public sector software solutions company) (2014-Present); Director, Range Resources Corporation (oil and natural gas company) (2015-Present); Trustee, CushingClosed-End andOpen-End Funds and ETFs (2017-Present); Trustee, American Beacon Select Funds (2004-Present); Trustee, American Beacon Institutional Funds Trust (2017-Present); Trustee, American Beacon Sound Point Enhanced Income Fund (2018-Present); Trustee, American Beacon Apollo Total Return Fund (2018-Present); Trustee, American Beacon Sound Point Alternative Lending Fund (2019-Present). | ||
| Eugene J. Duffy (65) | Trustee since 2008 | Managing Director, Global Investment Management Distribution, Mesirow Financial (2016-Present); Managing Director, Institutional Services, Intercontinental Real Estate Corporation (2014-Present); Principal and Executive Vice President, Paradigm Asset Management (1994-2014); Trustee, American Beacon Select Funds (2008-Present); Trustee, American Beacon Institutional Funds Trust (2017-Present); Trustee, American Beacon Sound Point Enhanced Income Fund (2018-Present); Trustee, American Beacon Apollo Total Return Fund (2018-Present); Trustee, American Beacon Sound Point Alternative Lending Fund (2019-Present). | ||
| Claudia A. Holz (62) | Trustee since 2018 | Partner, KPMG LLP (1990-2017); Trustee, American Beacon Select Funds (2018-Present); Trustee, American Beacon Institutional Funds Trust (2018-Present); Trustee, American Beacon Sound Point Enhanced Income Fund (2018-Present); Trustee, American Beacon Apollo Total Return Fund (2018-Present); Trustee, American Beacon Sound Point Alternative Lending Fund (2019-Present). | ||
| Douglas A. Lindgren(57) | Trustee since 2018 | CEO North America, Carne Global Financial Services (2016-2017); Managing Director, IPS Investment Management and Global Head, Content Management, UBS Wealth Management (2010-2016); Trustee, American Beacon Select Funds (2018-Present); Trustee, American Beacon Institutional Funds Trust (2018-Present); Trustee, American Beacon Sound Point Enhanced Income Fund (2018-Present); Trustee, American Beacon Apollo Total Return Fund (2018-Present); Trustee, American Beacon Sound Point Alternative Lending Fund (2019-Present). | ||
| Richard A. Massman (76) | Trustee since 2004 Chair 2008-2018 Chair Emeritus since 2019 | Consultant and General Counsel Emeritus, Hunt Consolidated, Inc. (holding company engaged in oil and gas exploration and production, refining, real estate, farming, ranching and venture capital activities) (2009-Present); Trustee, American Beacon Select Funds (2004-Present); Trustee, American Beacon Institutional Funds Trust (2017-Present); Trustee, American Beacon Sound Point Enhanced Income Fund (2018-Present); Trustee, American Beacon Apollo Total Return Fund (2018-Present); Trustee, American Beacon Sound Point Alternative Lending Fund (2019-Present). | ||
| Barbara J. McKenna, CFA (56) | Trustee since 2012 | President/Managing Principal, Longfellow Investment Management Company (2005-Present); Trustee, American Beacon Select Funds (2012-Present); Trustee, American Beacon Institutional Funds Trust (2017-Present); Trustee, American Beacon Sound Point Enhanced Income Fund (2018-Present); Trustee, American Beacon Apollo Total Return Fund (2018-Present); Trustee, American Beacon Sound Point Alternative Lending Fund (2019-Present). | ||
39
Trustees and Officers of the American Beacon FundsSM(Unaudited)
Name, Age | Position, Term of Office and Length of Time Served with the Trust | Principal Occupation(s) During Past 5 Years and Current Directorships | ||
| NON-INTERESTED TRUSTEES (CONT.) | Term | |||
| Lifetime of Trust until removal, resignation or retirement* | ||||
| R. Gerald Turner (73) | Trustee since 2001 | President, Southern Methodist University (1995-Present); Director, J.C. Penney Company, Inc. (1996-Present); Director, Kronus Worldwide Inc. (chemical manufacturing) (2003-Present); Trustee, American Beacon Select Funds (2001-Present); Trustee, American Beacon Institutional Funds Trust (2017-Present); Trustee, American Beacon Sound Point Enhanced Income Fund (2018-Present); Trustee, American Beacon Apollo Total Return Fund (2018-Present); Trustee, American Beacon Sound Point Alternative Lending Fund (2019-Present). | ||
| OFFICERS | Term | |||
| One Year | ||||
| Gene L. Needles, Jr. (64) | President since 2009 | President (2009-2018), CEO and Director (2009-Present), and Chairman (2018-Present), American Beacon Advisors, Inc., President (2015-2018), Director and CEO (2015-Present), and Chairman (2018-Present), Resolute Investment Holdings, LLC; President (2015-2018), Director and CEO (2015-Present), and Chairman (2018-Present),Resolute Topco, Inc.; President (2015-2018); Director, and CEO (2015-Present), and Chairman (2018-Present), Resolute Acquisition, Inc.; President (2015-2018), Director and CEO (2015-Present), Chairman (2018-Present), Resolute Investment Managers, Inc.; Director, Chairman, President and CEO, Resolute Investment Distributors (2017-Present); Director, Chairman, President and CEO; Resolute Investment Services, Inc. (2017-Present); President and CEO, Lighthouse Holdings Parent, Inc. (2009-2015); President, CEO and Director, Lighthouse Holdings, Inc. (2009-2015); Manager, President and CEO, American Private Equity Management, LLC (2012-Present); Director, Chairman, President and CEO, Alpha Quant Advisors, LLC (2016-Present); Director, ARK Investment Management LLC (2016-Present); Director, Shapiro Capital Management LLC (2017-Present); Director, Chairman and CEO, Continuous Capital, LLC (2018-Present); President, American Beacon Cayman Managed Futures Strategy Fund, Ltd. (2014-Present); Director and President, American Beacon Cayman Transformational Innovation Company, LTD., (2017-2018); President, American Beacon Delaware Transformational Innovation Corporation (2017-2018); President American Beacon Cayman TargetRisk Company, Ltd. (2018-Present);Member, Investment Advisory Committee, Employees Retirement System of Texas (2017-Present); Trustee, American Beacon NextShares Trust (2015-Present); President, American Beacon Select Funds (2009-Present); President, American Beacon Institutional Funds Trust (2017-Present); President, American Beacon Sound Point Enhanced Income Fund (2018-Present); President, American Beacon Apollo Total Return Fund (2018-Present); Director, RSW Investments Holdings LLC, (2019-Present); Manager, SSI Investment Management, LLC (2019-Present); President, American Beacon Sound Point Alternative Lending Fund (2019-Present); Director, Green Harvest Asset Management (2019-Present). | ||
40
Trustees and Officers of the American Beacon FundsSM(Unaudited)
Name, Age | Position, Term of Office and Length of Time Served with the Trust | Principal Occupation(s) During Past 5 Years and Current Directorships | ||
| OFFICERS (CONT.) | Term | |||
| One Year | ||||
| Rosemary K. Behan (60) | VP, Secretary and Chief Legal Officer since 2006 | Vice President, Secretary and General Counsel, American Beacon Advisors, Inc. (2006-Present); Secretary, Resolute Investment Holdings, LLC (2015-Present); Secretary, Resolute Topco, Inc. (2015-Present); Secretary, Resolute Acquisition, Inc. (2015-Present); Vice President, Secretary and General Counsel, Resolute Investment Managers, Inc. (2015-Present); Secretary, Resolute Investment Distributors, Inc. (2017-Present); Vice President, Secretary and General Counsel, Resolute Investment Services, Inc. (2017-Present); Vice President and Secretary, Lighthouse Holdings Parent, Inc. (2008-2015); Vice President and Secretary, Lighthouse Holdings, Inc. (2008-2015); Secretary, American Private Equity Management, LLC (2008-Present); Secretary and General Counsel, Alpha Quant Advisors, LLC (2016-Present); Vice President and Secretary, Continuous Capital, LLC (2018-Present); Secretary, American Beacon Delaware Transformational Innovation Corporation (2017-2018); Secretary, American Beacon Cayman Transformational Innovation Company, Ltd. (2017-2018); Secretary, American Beacon Cayman Managed Futures Strategy Fund, Ltd. (2014-Present); Secretary, American Beacon Cayman TargetRisk Company, Ltd (2018-Present); Chief Legal Officer, Vice President and Secretary, American Beacon Select Funds (2006-Present); Chief Legal Officer, Vice President and Secretary, American Beacon Institutional Funds Trust (2017-Present); Chief Legal Officer, Vice President and Secretary, American Beacon Sound Point Enhanced Income Fund (2018-Present); Chief Legal Officer, Vice President and Secretary American Beacon Apollo Total Return Fund (2018-Present); Chief Legal Officer, Vice President and Secretary, American Beacon Sound Point Alternative Lending Fund (2019-Present); Secretary, Green Harvest Asset Management (2019-Present). | ||
| Brian E. Brett (59) | VP since 2004 | Senior Vice President, Head of Distribution (2012-Present), Vice President, Director of Sales (2004-2012), American Beacon Advisors, Inc.; Senior Vice President, Resolute Investment Managers, Inc. (2017-Present); Senior Vice President, Resolute Investment Distributors, Inc. (2018-Present), Senior Vice President, Resolute Investment Services, Inc. (2018-Present); Senior Vice President, Lighthouse Holdings Parent, Inc. (2008-2015); Senior Vice President, Lighthouse Holdings, Inc. (2008-2015); Vice President, American Beacon Select Funds (2004-Present); Vice President, American Beacon Institutional Funds Trust (2017-Present); Vice President American Beacon Sound Point Enhanced Income Fund (2018-Present); Vice President American Beacon Apollo Total Return Fund (2018-Present); Vice President, American Beacon Sound Point Alternative Lending Fund (2019-Present). | ||
| Paul B. Cavazos (50) | VP since 2016 | Chief Investment Officer and Senior Vice President, American Beacon Advisors, Inc. (2016-Present); Chief Investment Officer, DTE Energy (2007-2016); Vice President, American Private Equity Management, L.L.C. (2017-Present); Vice President, American Beacon Select Funds (2016-Present); Vice President, American Beacon Institutional Funds Trust (2017-Present); Vice President American Beacon Sound Point Enhanced Income Fund (2018-Present);Vice President American Beacon Apollo Total Return Fund (2018-Present); Vice President, American Beacon Sound Point Alternative Lending Fund (2019-Present). | ||
| Erica Duncan (49) | VP Since 2011 | Vice President, American Beacon Advisors, Inc. (2011-Present); Vice President, Resolute Investment Managers (2018-Present); Vice President, Resolute Investment Services, Inc. (2018-Present); Vice President, American Beacon Select Funds (2011-Present); Vice President, American Beacon Institutional Funds Trust (2017-Present); Vice President American Beacon Sound Point Enhanced Income Fund (2018-Present); Vice President American Beacon Apollo Total Return Fund (2018-Present); Vice President, American Beacon Sound Point Alternative Lending Fund (2019-Present). | ||
41
Trustees and Officers of the American Beacon FundsSM(Unaudited)
Name, Age | Position, Term of Office and Length of Time Served with the Trust | Principal Occupation(s) During Past 5 Years and Current Directorships | ||
| OFFICERS (CONT.) | Term | |||
| One Year | ||||
| Melinda G. Heika (58) | Treasurer since 2010 | Treasurer and CFO (2010-Present), American Beacon Advisors, Inc.; Treasurer, Resolute Topco, Inc. (2015-Present); Treasurer, Resolute Investment Holdings, LLC. (2015-Present); Treasurer, Resolute Acquisition, Inc. (2015-Present); Treasurer and CFO, Resolute Investment Managers, Inc. (2017-Present); Treasurer, Resolute Investment Distributors, Inc. (2017-2017); Treasurer and CFO, Resolute Investment Services, Inc. (2015-Present); Treasurer, Lighthouse Holdings Parent Inc., (2010-2015); Treasurer, Lighthouse Holdings, Inc. (2010-2015); Treasurer, American Private Equity Management, LLC (2012-Present); Treasurer and CFO, Alpha Quant Advisors, LLC (2016-Present); Treasurer and CFO, Continuous Capital, LLC (2018-Present); Treasurer, American Beacon Cayman Transformational Innovation, Ltd. (2017-2018); Treasurer, American Beacon Delaware Transformational Innovation Corporation (2017-2018); Director and Treasurer, American Beacon Cayman Managed Futures Strategy Fund, Ltd. (2014-Present); Treasurer, American Beacon Cayman TargetRisk Company, Ltd. (2018-Present); Treasurer, American Beacon Select Funds (2010-Present); Treasurer, American Beacon Institutional Funds Trust (2017-Present); Treasurer, American Beacon Sound Point Enhanced Income Fund (2018-Present); Treasurer, American Beacon Apollo Total Return Fund (2018-Present); Treasurer, American Beacon Sound Point Alternative Lending Fund (2019-Present); Treasurer, Green Harvest Asset Management (2019-Present). | ||
| Terri L. McKinney (55) | VP since 2010 | Vice President (2009-Present), Managing Director (2003-2009), American Beacon Advisors, Inc.; Vice President, Resolute Investment Managers, Inc. (2017-Present); Vice President, Resolute Investment Services, Inc (2018-Present); Vice President, Alpha Quant Advisors, LLC (2016-Present); Vice President, Continuous Capital, LLC (2018-Present); Vice President, American Beacon Select Funds (2010-Present); Vice President, American Beacon Institutional Funds Trust (2017-Present); Vice President, American Beacon Sound Point Enhanced Income Fund (2018-Present); Vice President, American Beacon Apollo Total Return Fund (2018-Present); Vice President, American Beacon Sound Point Alternative Lending Fund (2019-Present). | ||
42
Trustees and Officers of the American Beacon FundsSM(Unaudited)
Name, Age | Position, Term of Office and Length of Time Served with the Trust | Principal Occupation(s) During Past 5 Years and Current Directorships | ||
| OFFICERS (CONT.) | Term | |||
| One Year | ||||
| Jeffrey K. Ringdahl (44) | VP since 2010 | Director (2015-Present), President (2018-Present), Chief Operating Officer (2010-Present), Senior Vice President (2013-2018), Vice President (2010-2013), American Beacon Advisors, Inc.; Director (2015-Present), President (2018-Present), Senior Vice Present (2015-2018), Resolute Investment Holdings, LLC; Director (2015-Present), President (2018-Present), Senior Vice President (2015-2018), Resolute Topco, Inc.; Director (2015-Present), President (2018-Present), Senior Vice President (2015-2018), Resolute Acquisition, Inc.; Director (2015-Present), President & COO (2018-Present), Senior Vice President (2015-2018), Resolute Investment Managers, Inc.; Director and Executive Vice President (2017-Present), Resolute Investment Distributors, Inc.; Director (2017-Present), President & COO (2018-Present), Executive Vice President (2017-2018), Resolute Investment Services, Inc.; Senior Vice President (2017-Present), Vice President (2012-2017), Manager (2015-Present), American Private Equity Management, LLC; Senior Vice President, Lighthouse Holdings Parent, Inc. (2013-2015); Senior Vice President, Lighthouse Holdings, Inc. (2013-2015); Trustee, American Beacon NextShares Trust (2015-Present); Director, Executive Vice President & COO, Alpha Quant Advisors, LLC (2016-Present); Director, Shapiro Capital Management, LLC (2017-Present); Director, Executive Vice President & COO, Continuous Capital, LLC (2018-Present); Director and Vice President, American Beacon Cayman Transformational Innovation Company, Ltd., (2017-Present); Vice President, American Beacon Delaware Transformational Innovation Corporation (2017-2018); Director and Vice President, American Beacon Cayman Managed Futures Strategy Fund, Ltd. (2014-Present); Vice President, American Beacon Cayman TargetRisk Company, Ltd (2018-Present); Vice President, American Beacon Select Funds (2010-2018); Vice President, American Beacon Institutional Funds Trust (2017-Present); Vice President, American Beacon Sound Point Enhanced Income Fund (2018-Present); Vice President, American Beacon Apollo Total Return Fund (2018-Present); Director, RSW Investments Holdings LLC, (2019-Present); Manager, SSI Investment Management, LLC (2019-Present), Vice President, American Beacon Sound Point Alternative Lending Fund (2019-Present). | ||
| Samuel J. Silver (56) | VP Since 2011 | Vice President (2011-Present), Chief Fixed Income Officer (2016-Present), American Beacon Advisors, Inc. (2011-Present); Vice President, American Beacon Select Funds (2011-Present); Vice President, American Beacon Institutional Funds Trust (2017-Present); Vice President, American Beacon Sound Point Enhanced Income Fund (2018-Present); Vice President, American Beacon Apollo Total Return Fund (2018-Present); Vice President, American Beacon Sound Point Alternative Lending Fund (2019-Present). | ||
| Christina E. Sears (48) | Chief Compliance Officer since 2004 and Asst. Secretary since 1999 | Vice President, American Beacon Advisors, Inc. (2019-Present); Chief Compliance Officer, American Beacon Advisors, Inc. (2004-Present); Vice President, Resolute Investment Managers, Inc. (2017-Present); Vice President, Resolute Investment Distributors (2017-Present); Vice President, Resolute Investment Services, Inc. (2019-Present); Chief Compliance Officer, American Private Equity Management, LLC (2012-Present); Chief Compliance Officer (2016-2019) and Vice President, Alpha Quant Advisors, LLC (2016-Present); Vice President, Continuous Capital, LLC (2018-Present); Chief Compliance Officer (2004-Present) and Assistant Secretary (1999-Present), American Beacon Select Funds; Chief Compliance Officer and Assistant Secretary, American Beacon Institutional Funds Trust (2017-Present); Chief Compliance Officer and Assistant Secretary, American Beacon Sound Point Enhanced Income Fund (2018-Present); Chief Compliance Officer and Assistant Secretary, American Beacon Apollo Total Return Fund (2018-Present); Chief Compliance Officer and Assistant Secretary, American Beacon Sound Point Alternative Lending Fund (2019-Present). | ||
43
Trustees and Officers of the American Beacon FundsSM(Unaudited)
Name, Age | Position, Term of Office and Length of Time Served with the Trust | Principal Occupation(s) During Past 5 Years and Current Directorships | ||
| OFFICERS (CONT.) | Term | |||
| One Year | ||||
| Sonia L. Bates (62) | Asst. Treasurer since 2011 | Assistant Treasurer, American Beacon Advisors, Inc. (2011-2018); Assistant Treasurer, Lighthouse Holdings Parent Inc. (2011-2015); Assistant Treasurer, Lighthouse Holdings, Inc. (2011-2015); Assistant Treasurer, American Private Equity Management, LLC (2012-Present); Assistant Treasurer, American Beacon Cayman Transformational Innovation Company, Ltd. (2017-Present); Assistant Treasurer, American Beacon Cayman TargetRisk Company, Ltd. (2018-Present); Assistant Treasurer, American Beacon Select Funds (2011-Present); Assistant Treasurer, American Beacon Institutional Funds Trust (2017-Present); Assistant Treasurer, American Beacon Sound Point Enhanced Income Fund (2018-Present); Assistant Treasurer, American Beacon Apollo Total Return Fund (2018-Present); Assistant Treasurer, American Beacon Sound Point Alternative Lending Fund (2019-Present). | ||
| Shelley D. Abrahams (44) | Assistant Secretary since 2008 | Assistant Secretary, American Beacon Select Funds (2008-Present); Assistant Secretary, American Beacon Institutional Funds Trust (2017-Present); Assistant Secretary, American Beacon Sound Point Enhanced Income Fund (2018-Present); Assistant Secretary, American Beacon Apollo Total Return Fund (2018-Present); Assistant Secretary, American Beacon Sound Point Alternative Lending Fund (2019-Present); Assistant Secretary, Green Harvest Asset Management (2019-Present). | ||
| Rebecca L. Harris (52) | Assistant Secretary since 2010 | Vice President, American Beacon Advisors, Inc. (2011-Present); Vice President, Resolute Investment Managers, Inc. (2017-Present); Vice President, Resolute Investment Services (2015-Present); Vice President, Alpha Quant Advisors, LLC (2016-Present); Vice President, Continuous Capital, LLC (2018-Present); Assistant Secretary, American Beacon Select Funds (2010-Present); Assistant Secretary, American Beacon Institutional Funds Trust (2017-Present); Assistant Secretary, American Beacon Sound Point Enhanced Income Fund (2018-Present); Assistant Secretary, American Beacon Apollo Total Return Fund (2018-Present); Assistant Secretary, American Beacon Sound Point Alternative Lending Fund (2019-Present). | ||
| Teresa A. Oxford (61) | Assistant Secretary since 2015 | Assistant Secretary, American Beacon Advisors, Inc. (2015-Present); Assistant Secretary, Resolute Investment Distributors (2018-Present); Assistant Secretary, Resolute Investment Services (2018-Present); Assistant Secretary, Alpha Quant Advisors, LLC (2016-Present); Assistant Secretary, American Beacon Select Funds (2015-Present); Assistant Secretary, American Beacon Institutional Funds Trust (2017-Present); Assistant Secretary, American Beacon Sound Point Enhanced Income Fund (2018-Present); Assistant Secretary, American Beacon Apollo Total Return Fund (2018-Present); Assistant Secretary, American Beacon Sound Point Alternative Lending Fund (2019-Present); Assistant Secretary, Green Harvest Asset Management (2019-Present). | ||
* As of 11/12/2014, the Board adopted a retirement plan that requires Trustees, other than Messrs. Feld and Massman to retire no later than the last day of the calendar year in which they reach the age of 75. As of 11/7/17, the Board approved a waiver of the mandatory retirement policy with respect to Mr. Massman, who turned 75 in November 2018, to permit him to continue to serve on the Board as Chair Emeritus through 12/31/19.
** Mr. Feld is deemed to be an “interested person” of the Trusts, as defined by the 1940 Act. Mr. Feld’s law firm of Akin, Gump, Strauss, Hauer & Feld LLP has provided legal services within the past two fiscal years to one or more of the Trust’ssub-advisors.
44
American Beacon Garcia Hamilton Quality Bond FundSM
October 31, 2019 (Unaudited)
The American Beacon Funds recognize and respect the privacy of our shareholders. We are providing this notice to you so you will understand how shareholder information may be collected and used.
We may collect nonpublic personal information about you from one or more of the following sources:
| • | information we receive from you on applications or other forms; |
| • | information about your transactions with us or our service providers; and |
| • | information we receive from third parties. |
We do not disclose any nonpublic personal information about our customers or former customers to anyone, except as permitted by law.
We restrict access to your nonpublic personal information to those employees or service providers who need to know that information to provide products or services to you. To ensure the confidentiality of your nonpublic personal information, we maintain safeguards that comply with federal standards.
45
This page intentionally left blank.
46
This page intentionally left blank.
47
This page intentionally left blank.
48

Delivery of Documents
eDelivery isNOW AVAILABLE– Stop traditional mail delivery and receive your
shareholder reports and summary prospectuson-line. Sign up at
www.americanbeaconfunds.com
If you invest in the Fund through a financial institution, you may be able to receive the Fund’s regulatory mailings, such as the Prospectus, Annual Report and Semi-Annual Report, bye-mail. If you are interested in this option, please go towww.icsdelivery.com and search for your financial institution’s name or contact your financial institution directly.
To obtain more information about the Fund:
 |  | |
| ByE-mail: | On the Internet: | |
| american_beacon.funds@ambeacon.com | Visit our website atwww.americanbeaconfunds.com | |
By Telephone: Call (800)658-5811 |
By Mail: American Beacon Funds P.O. Box 219643 Kansas City, MO 64121-9643 | |
| Availability of Quarterly Portfolio Schedules | Availability of Proxy Voting Policy and Records | |
| In addition to the Schedule of Investments provided in each semi-annual and annual report, the Fund files a complete schedule of its portfolio holdings with the Securities and Exchange Commission (“SEC”) onForm N-PORT as of the first and third fiscal quarters. The Fund’sForms N-PORT are available on the SEC’s website atwww.sec.gov. TheForms N-PORT may also be reviewed and copied at the SEC’s Public Reference Section, 100 F Street, NE, Washington, D.C. 20549-2736. Information regarding the operation of the SEC’s Public Reference Room may be obtained by calling(800)-SEC-0330. A complete schedule of the Fund’s portfolio holdings is also available atwww.americanbeaconfunds.com approximately twenty days after the end of each month. | A description of the policies and procedures the Fund uses to determine how to vote proxies relating to portfolio securities is available in the Fund’s Statement of Additional Information, is available free of charge on the Fund’s websitewww.americanbeaconfunds.com and by calling1-800-967-9009 or by accessing the SEC’s website atwww.sec.gov. The Fund’s proxy voting record for the most recent year ended June 30 is filed annually with the SEC onForm N-PX. The Fund’sForms N-PX are available on the SEC’s website atwww.sec.gov. The Fund’s proxy voting record may also be obtained by calling1-800-967-9009. | |


Fund Service Providers:
CUSTODIAN State Street Bank and Trust Company Boston, Massachusetts | TRANSFER AGENT DST Asset Manager Solutions, Inc. Quincy, Massachusetts | INDEPENDENT REGISTERED PUBLIC ACCOUNTING FIRM Ernst & Young LLP Dallas, Texas | DISTRIBUTOR Resolute Investment Distributors, Inc. Irving, Texas |
This report is prepared for shareholders of the American Beacon Funds and may be distributed to others only if preceded or accompanied by a current Prospectus or Summary Prospectus.
American Beacon Funds and American Beacon Garcia Hamilton Quality Bond Fund are service marks of American Beacon Advisors, Inc.
AR 10/19

About American Beacon Advisors
Since 1986, American Beacon Advisors has offered a variety of products and investment advisory services to numerous institutional and retail clients, including a variety of mutual funds, corporate cash management, and separate account management.
Our clients include defined benefit plans, defined contribution plans, foundations, endowments, corporations, financial planners, and other institutional investors. With American Beacon Advisors, you can put the experience of a multi-billion dollar asset management firm to work for your company.
INTERNATIONAL EQUITY FUND RISKS
Investing inforeign securitiesmay involve heightened risk due to currency fluctuations and economic and political risks. Investing invalue stocksmay limit downside risk over time; however, the Fund may produce more modest gains than riskier stock funds as atrade-off for this potentially lower risk. The use offutures contractsfor cash management may subject the Fund to losing more money than invested. The Fund participates in asecurities lendingprogram. Please see the prospectus for a complete discussion of the Fund’s risks. There can be no assurances that the investment objectives of this Fund will be met.
TOCQUEVILLE INTERNATIONAL VALUE FUND RISKS
Investing inforeign securitiesincluding emerging markets may involve heightened risk due to currency fluctuations and economic and political risks. Investing invalue stocks may limit downside risk over time; however, the Fund may produce more modest gains than riskier stock funds as atrade-off for this potentially lower risk. The use offutures contracts for cash management may subject the Fund to losing more money than invested. The Fund participates in asecurities lending program. Please see the prospectus for a complete discussion of the Fund’s risks. There can be no assurances that the investment objectives of this Fund will be met.
Any opinions herein, including forecasts, reflect our judgment as of the end of the reporting period and are subject to change. Each advisor’s strategies and each Fund’s portfolio composition will change depending on economic and market conditions. This report is not a complete analysis of market conditions, and, therefore, should not be relied upon as investment advice. Although economic and market information has been compiled from reliable sources, American Beacon Advisors, Inc. makes no representation as to the completeness or accuracy of the statements contained herein.
American Beacon Funds | October 31, 2019 |
| 1 | ||||
| 2 | ||||
| 8 | ||||
| 10 | ||||
| 12 | ||||
| 19 | ||||
| 23 | ||||
| 28 | ||||
| 54 | ||||
| 61 | ||||
| 64 | ||||
Disclosure Regarding Approval of the Management and Investment Advisory Agreements | 65 | |||
| 70 | ||||
| 77 | ||||
| Back Cover | ||||
 | Dear Shareholders,
In recent months, you’ve likely seen and heard news reports about disruptive headwinds in the global economy –including the U.S. trade war with China and its toll on the global economy, slowing global growth, the Federal Reserve’s series of rate cuts, Brexit, disruptions in the Middle East and protests in Hong Kong – and watched a flood of reaction in the world’s markets.
As Peter L. Bernstein said in his treatise on risk,Against the Gods: The Remarkable Story of Risk, published by John Wiley & Sons, Inc. in September 1998, “Volatility is a proxy for uncertainty and must be accommodated in measuring investment risk.”
During times of economic uncertainty and market volatility, fear of loss can be a powerful emotion – one that drives many investors to making short-term decisions subject to a variety of potential error-leading biases. Unfortunately, some short-term investment decisions may create more volatility rather than mitigate it. |
Instead of dwelling on the markets’ short-term reaction to waves of negative global news, we encourage investors to focus on the horizon instead. Long-term investing isn’t about identifying and anticipating the next big market move, it is about identifying the right investment products for riding out those moves. As a long-term investor, you should keep in mind the three Ds:direction,disciplineanddiversification.
| u | Direction:Achieving your long-term financial goals requires an individualized plan of action. You may want your plan to provide some measure of protection against periods of geopolitical turmoil, economic uncertainty, market volatility and job insecurity. Your plan should be reviewed annually and be adjusted in the event your long-range needs change. |
| u | Discipline:Long-term, systematic participation in an investment portfolio requires your resolution to stay the course. Spending time in the market – rather than trying to time the market – may place you in a better position to reach your long-term financial goals. |
| u | Diversification:By investing in different investment styles and asset classes, you may be able to help mitigate financial risks across your investment portfolio. By allocating your investment portfolio according to your risk-tolerance level, you may be better positioned to weather storms and achieve your long-term financial goals. |
Since 1986, American Beacon has endeavored to provide investors with a disciplined approach to realizing long-term financial goals.As a manager of managers, we strive to provide investment products that may enable investors to participate during market upswings while potentially insulating against market downswings.
Many of thesub-advisors to our mutual funds pursue upside capture and/or downside protection using proprietary strategies. The investment teams behind our mutual funds seek to produce consistent, long-term results rather than focus only on short-term movements in the markets. In managing our investment products, we emphasize identifying opportunities that offer the potential for long-term rewards.
Our management approach is more than a concept; it’s the cornerstone of our culture. And we strive to apply it at every turn as we seek to provide a well-diversified line of investment solutions to help our shareholders seek long-term rewards while mitigating volatility and risk.
Thank you for your continued interest in American Beacon. For additional information about our investment products or to access your account information, please visit our website atwww.americanbeaconfunds.com.
Best Regards,

Gene L. Needles, Jr.
President
American Beacon Funds
1
International Equity Market Overview
October 31, 2019 (Unaudited)
Over the12-month period ended October 31, 2019, developed international equities rose more than 11% and emerging market equities rose almost 12%. While investor uncertainty about global growth and trade weighed on sentiment, central banks responded by loosening monetary policy and governments with budget surpluses were urged to implement fiscal stimulus, which has sustained strong equity returns.
Trade tensions have contributed to the slower economy. Global growth has declined 1.2 percentage points since President Donald Trump first ordered tariffs on steel and aluminum in the first quarter of 2018. Germany, an export powerhouse, reported slightly negative gross domestic product (“GDP”) growth in the second quarter while manufacturing indexes deteriorated. China – the world’s second-largest economy and source of almost 20% of global growth – reported GDP growth of 6.2%, a27-year low. While global manufacturing is weak, the global consumer remains more resilient. The majority of consumer data is still relatively positive – and the consumer expansion, though at low rates, is driving modestly positive global growth.
In the international equity markets, Growth continued to outperform Value despite a dramatic rise in deep-value equities in early September. The valuation gap between Growth and Value continues to reach extremes. Historically, the performance of Growth versus Value appears to have a correlation with interest rates. When interest rates decline, Growth has historically outperformed Value. When interest rates rise, Value tends to be more in favor. This implies that the recent rally in deep-value equities will not likely close the performance gap with Growth unless long-term rates rise, which would presumably occur if expectations rise for stronger economic growth. Without that acceleration, deep-value equities could prove to be a classic Value trap.
2
American Beacon International Equity FundSM
Performance Overview
October 31, 2019 (Unaudited)
The Investor Class of the American Beacon International Equity Fund (the “Fund”) returned 5.55% for the twelve months ended October 31, 2019. The Fund underperformed the MSCI EAFE Index (the “Index”) return of 11.04%.
Comparison of Change in Value of a $10,000 Investment for the period from 10/31/2009 through 10/31/2019
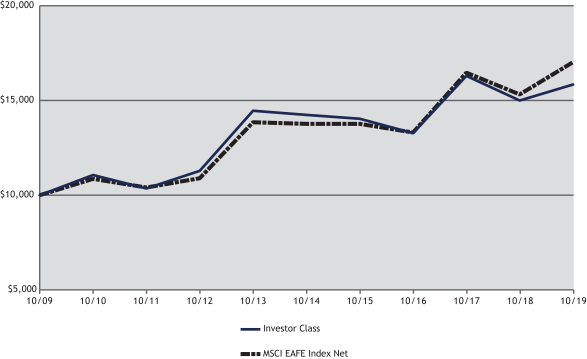
| Total Returns for the Period ended October 31, 2019 |
| |||||||||||||||||||||||||||||||
Ticker | 1 Year | 3 Years | 5 Years | 10 Years | Value of $10,000 10/31/2009- 10/31/2019 | |||||||||||||||||||||||||||
Institutional Class (1,7) | AAIEX | 5.94 | % | 6.39 | % | 2.50 | % | 5.02 | % | $ | 16,326 | |||||||||||||||||||||
Y Class (1,7) | ABEYX | 5.83 | % | 6.31 | % | 2.43 | % | 4.93 | % | $ | 16,185 | |||||||||||||||||||||
Investor Class (1,7) | AAIPX | 5.55 | % | 6.01 | % | 2.15 | % | 4.65 | % | $ | 15,758 | |||||||||||||||||||||
Advisor Class (1,2,7) | AAISX | 5.38 | % | 5.87 | % | 2.03 | % | 4.50 | % | $ | 15,530 | |||||||||||||||||||||
A Class without sales charge (1,3,7) | AIEAX | 5.51 | % | 5.97 | % | 2.11 | % | 4.57 | % | $ | 15,628 | |||||||||||||||||||||
A Class with sales Charge (1,3,7) | AIEAX | (0.56 | )% | 3.90 | % | 0.91 | % | 3.95 | % | $ | 14,733 | |||||||||||||||||||||
C Class without sales charge (1,4,7) | AILCX | 4.69 | % | 5.18 | % | 1.35 | % | 3.84 | % | $ | 14,573 | |||||||||||||||||||||
C Class with sales charge (1,4,7) | AILCX | 3.69 | % | 5.18 | % | 1.35 | % | 3.84 | % | $ | 14,573 | |||||||||||||||||||||
R6 Class (1,5,7) | AAERX | 5.98 | % | 6.45 | % | 2.54 | % | 5.04 | % | $ | 16,355 | |||||||||||||||||||||
MSCI EAFE Index Net (6) | 11.04 | % | 8.48 | % | 4.31 | % | 5.41 | % | $ | 16,931 | ||||||||||||||||||||||
| 1. | Performance shown is historical and is not indicative of future returns. Investment returns and principal value will vary, and shares may be worth more or less at redemption than at original purchase. Performance shown is calculated based on the published end of day net asset values as of date indicated and current performance may be lower or higher than the performance data quoted. To obtain performance as of the most recent month end, please visitwww.americanbeaconfunds.com or call1-800-967-9009. Fund performance in the table above does not reflect the deduction of taxes a shareholder would pay on distributions or the redemption of shares. Generally accepted accounting principles require adjustments to be made to the net assets of the Fund at period end for financial reporting purposes only; and as such, the total return based on the unadjusted net asset value per share may differ from the total return reported in the financial highlights. A portion of the fees charged to the Institutional Class of the Fund was waived from 2013 through 2015. Performance prior to waiving fees was lower than actual returns shown for 2013 through 2015. |
3
American Beacon International Equity FundSM
Performance Overview
October 31, 2019 (Unaudited)
| 2. | A portion of the fees charged to the Advisor Class of the Fund was waived in 2007 and 2009. Performance prior to waiving fees was lower than the actual returns shown for these periods. |
| 3. | Fund performance for theten-year period represents the total returns achieved by the Investor Class from 10/31/09 up to 5/17/10, the inception date of the A Class, and the returns of the A Class since its inception. Expenses of the A Class are higher than those of the Investor Class. As a result, total returns shown may be higher than they would have been had the A Class been in existence since 10/31/09. A portion of the fees charged to the A Class of the Fund was waived from 2010 through 2012 and fully recovered in 2013. Performance prior to waiving fees was lower than the actual returns shown for 2010 through 2012. The maximum sales charge for A Class is 5.75%. |
| 4. | Fund performance for theten-year period represents the total returns achieved by the Investor Class from 10/31/09 up to 9/1/10, the inception date of the C Class, and the returns of the C Class since its inception. Expenses of the C Class are higher than those of the Investor Class. As a result, total returns shown may be higher than they would have been had the C Class been in existence since 10/31/09. A portion of the fees charged to the C Class of the Fund was waived from 2010 through 2012, partially recovered in 2013, and fully recovered in 2015. Performance prior to waiving fees was lower than the actual returns shown for 2010 through 2012. The maximum contingent deferred sales charge for C Class is 1.00% for shares redeemed within one year of the date of purchase. |
| 5. | Fund performance for the three-year, five-year andten-year periods represents the returns achieved by the Institutional Class from 10/31/09 through 2/28/17, the inception date of the R6 Class, and the returns of the R6 Class since its inception. Expenses of the R6 Class are lower than those of the Institutional Class. As a result, total returns shown may be lower than they would have been had the R6 Class been in existence since 10/31/09. A portion of the fees charged to the R6 Class of the Fund has been waived since Class inception. Performance prior to waiving fees was lower than the actual returns shown since inception. |
| 6. | The MSCI EAFE Index is a market capitalization weighted index of international stock performance composed of equities from developed markets excluding the U.S. and Canada. One cannot directly invest in an index. |
| 7. | The Total Annual Fund Operating Expense ratios set forth in the most recent Fund prospectus for the Institutional, Y, Investor, Advisor, A, C and R6 Class shares were 0.74%, 0.81%, 1.07%, 1.21%, 1.09%, 1.82% and 0.71%, respectively. The expense ratios above may vary from the expense ratios presented in other sections of this report that are based on expenses incurred during the period covered by this report. |
The Fund underperformed the Index over the twelve-month period primarily due to stock selection while country allocation also slightly hampered performance.
Stock selections within Japan and Italy primarily contributed to the Fund’s relative underperformance, while stock selections in the United Kingdom added value. Detracting securities included Takeda Pharmaceutical Co. Ltd (down 6.27%) in Japan and Eni SpA (down 10.58%) within Italy. The Fund’s investments in the United Kingdom, including Cobham plc (up 52.18%) helped relative performance during the prior twelve months.
From a country allocation perspective, overweightingout-of-index Republic of Korea (up 5.22%) and underweighting Australia (up 17.10%) contributed to the Fund’s underperformance relative to the Index. However, underweighting both Japan (up 9.69%) and Spain (up 6.32%) added to relative value during the period.
Although economic and market conditions vary from period to period, the Fund’s primary strategy of investing in undervalued companies with above-average earnings growth expectations remains consistent.
| Top Ten Holdings (% Net Assets) |
| |||||||
| Samsung Electronics Co., Ltd. | 2.7 | |||||||
| Volkswagen AG | 2.4 | |||||||
| Novartis AG | 2.0 | |||||||
| BNP Paribas S.A. | 1.9 | |||||||
| SAP SE | 1.9 | |||||||
| Takeda Pharmaceutical Co., Ltd. | 1.8 | |||||||
| BP PLC | 1.7 | |||||||
| Sanofi | 1.7 | |||||||
| Vodafone Group PLC | 1.7 | |||||||
| Prudential PLC | 1.6 | |||||||
| Total Fund Holdings | 141 | |||||||
4
American Beacon International Equity FundSM
Performance Overview
October 31, 2019 (Unaudited)
| Sector Allocation (% Equities) |
| |||||||
| Financials | 18.9 | |||||||
| Industrials | 17.3 | |||||||
| Health Care | 11.3 | |||||||
| Communication Services | 9.4 | |||||||
| Energy | 8.9 | |||||||
| Materials | 8.4 | |||||||
| Consumer Staples | 7.5 | |||||||
| Information Technology | 7.1 | |||||||
| Consumer Discretionary | 4.9 | |||||||
| Utilities | 3.5 | |||||||
| Real Estate | 2.8 | |||||||
| Country Allocation (% Equities) |
| |||||||
| United Kingdom | 19.7 | |||||||
| Japan | 16.3 | |||||||
| Germany | 13.4 | |||||||
| France | 12.2 | |||||||
| Netherlands | 6.5 | |||||||
| Canada | 5.0 | |||||||
| Switzerland | 5.0 | |||||||
| Republic of Korea | 4.7 | |||||||
| Italy | 2.1 | |||||||
| United States | 1.9 | |||||||
| Singapore | 1.8 | |||||||
| Norway | 1.7 | |||||||
| Denmark | 1.5 | |||||||
| Ireland | 1.5 | |||||||
| Sweden | 1.3 | |||||||
| China | 1.2 | |||||||
| Finland | 0.8 | |||||||
| Hong Kong | 0.7 | |||||||
| Luxembourg | 0.7 | |||||||
| Spain | 0.7 | |||||||
| Belgium | 0.5 | |||||||
| Australia | 0.4 | |||||||
| Israel | 0.4 | |||||||
5
American Beacon Tocqueville International Value FundSM
Performance Overview
October 31, 2019 (Unaudited)
The Investor Class of the American Beacon Tocqueville International Value Fund (the “Fund”) returned 5.03% for the twelve month period ending October 31, 2019, which underperformed the MSCI EAFE Index (the “Index”) return of 11.04%.
Comparison of Change in Value of a $10,000 Investment for the period from 10/31/2009 through 10/31/2019

| Total Returns for the Period ended October 31, 2019 |
| |||||||||||||||||||||||||||||||
Ticker | 1 Year | 3 Years | 5 Years | 10 Years | Value of $10,000 | |||||||||||||||||||||||||||
Institutional Class (1,3,5) | TOVIX | 5.29 | % | 4.16 | % | 4.31 | % | 6.09 | % | $ | 18,065 | |||||||||||||||||||||
Y Class (1,2,5) | TOVYX | 5.23 | % | 4.14 | % | 4.30 | % | 6.09 | % | $ | 18,053 | |||||||||||||||||||||
Investor Class (1,5) | TIVFX | 5.03 | % | 4.07 | % | 4.26 | % | 6.06 | % | $ | 18,018 | |||||||||||||||||||||
MSCI EAFE Index Net (4) | 11.04 | % | 8.48 | % | 4.31 | % | 5.41 | % | $ | 16,931 | ||||||||||||||||||||||
| 1. | Performance shown is historical and is not indicative of future returns. Investment returns and principal value will vary, and shares may be worth more or less at redemption than at original purchase. Performance shown is calculated based on the published end of day net asset values as of date indicated and current performance may be lower or higher than the performance data quoted. To obtain performance as of the most recent month end, please visitwww.americanbeaconfunds.com or call1-800-967-9009. Fund performance in the table above does not reflect the deduction of taxes a shareholder would pay on distributions or the redemption of shares. Generally accepted accounting principles require adjustments to be made to the net assets of the Fund at period end for financial reporting purposes only; and as such, the total return based on the unadjusted net asset value per share may differ from the total return reported in the financial highlights. A portion of fees charged to each Class of the Fund has been waived since Fund inception. Performance prior to waiving fees was lower than actual returns shown since inception. |
| 2. | Fund performance for the one-year, three-year, five-year andten-year periods represents the total returns achieved by the Investor Class from 10/31/09 up to 1/18/19, the inception date of the Y Class. Expenses of the Y Class are lower than those of the Investor Class. As a result, total returns shown may be lower than they would have been had the Y Class been in existence since 10/31/09. |
| 3. | Fund performance for the one-year, three-year, five-year andten-year periods represents the total returns achieved by the Investor Class from 10/31/09 up to 1/18/19, the inception date of the Institutional Class. Expenses of the Institutional Class are lower than those of the Investor Class. As a result, total returns shown may be lower than they would have been had the Institutional Class been in existence since 10/31/09. |
6
American Beacon Tocqueville International Value FundSM
Performance Overview
October 31, 2019 (Unaudited)
| 4. | The MSCI EAFE Index is a market capitalization weighted index of international stock performance composed of equities from developed markets excluding the U.S. and Canada. One cannot directly invest in an index. |
| 5. | The Total Annual Fund Operating Expense ratios set forth in the most recent Fund prospectus for the Institutional, Y and Investor Class shares were 0.88%, 0.98% and 1.25%, respectively. The expense ratios above may vary from the expense ratios presented in other sections of this report that are based on expenses incurred during the period covered by this report. |
The Fund underperformed the Index over the twelve month period due to stock selection, while country allocation slightly offset relative performance.
Stock selections within Germany and Switzerland both contributed the most to the Fund’s relative underperformance. Stock selections in the United Kingdom partially helped performance.
From a country allocation perspective, the Fund’s underweight to Japan and Sweden added the most relative value. On the flip side, the Fund’s underweight to Australia detracted the most.
Although economic and market conditions vary from period to period, the Fund’s primary strategy of investing in undervalued companies with above-average earnings growth expectations remains consistent.
| Top Ten Holdings (% Net Assets) |
| |||||||
| FANUC Corp. | 3.5 | |||||||
| Sanofi | 3.5 | |||||||
| Bureau Veritas S.A. | 3.3 | |||||||
| Siemens AG, Sponsored ADR | 3.2 | |||||||
| Amano Corp. | 3.1 | |||||||
| CRH PLC | 3.1 | |||||||
| Samsung Electronics Co., Ltd. | 3.0 | |||||||
| Smiths Group PLC | 3.0 | |||||||
| Danone S.A. | 2.9 | |||||||
| Makita Corp. | 2.9 | |||||||
| Total Fund Holdings | 50 | |||||||
| Sector Allocation (% Equities) |
| |||||||
| Industrials | 30.5 | |||||||
| Information Technology | 19.4 | |||||||
| Consumer Staples | 15.7 | |||||||
| Health Care | 10.8 | |||||||
| Financials | 7.2 | |||||||
| Materials | 6.5 | |||||||
| Energy | 3.9 | |||||||
| Communication Services | 2.5 | |||||||
| Consumer Discretionary | 2.4 | |||||||
| Utilities | 1.1 | |||||||
| Country Allocation (% Equities) |
| |||||||
| Japan | 22.5 | |||||||
| France | 16.6 | |||||||
| Germany | 14.1 | |||||||
| United Kingdom | 11.8 | |||||||
| Switzerland | 5.0 | |||||||
| United States | 4.5 | |||||||
| Ireland | 3.3 | |||||||
| Canada | 3.2 | |||||||
| Republic of Korea | 3.1 | |||||||
| Spain | 3.0 | |||||||
| Netherlands | 2.9 | |||||||
| Belgium | 2.8 | |||||||
| Denmark | 1.8 | |||||||
| Finland | 1.6 | |||||||
| Taiwan | 1.3 | |||||||
| China | 1.1 | |||||||
| Bermuda | 0.9 | |||||||
| Italy | 0.5 | |||||||
| Brazil | 0.0 | * | ||||||
| * | Amount represents less than 0.05% |
7
American Beacon FundsSM
October 31, 2019 (Unaudited)
Fund Expense Example
As a shareholder of a Fund, you incur two types of costs: (1) transaction costs, including sales charges (loads) on purchase payments and redemption fees if applicable, and (2) ongoing costs, including management fees, distribution(12b-1) fees,Sub-transfer agent fees, and other Fund expenses. The Examples are intended to help you understand the ongoing cost (in dollars) of investing in the Fund and to compare these costs with the ongoing costs of investing in other mutual funds. The Examples are based on an investment of $1,000 invested at the beginning of the period in each Class and held for the entire period from May 1, 2019 through October 31, 2019.
Actual Expenses
The “Actual” lines of the table provide information about actual account values and actual expenses. You may use the information on this page, together with the amount you invested, to estimate the expenses that you paid over the period. Simply divide your account value by $1,000 (for example, an $8,600 account value divided by $1,000 = $8.60), then multiply the result by the “Expenses Paid During Period” to estimate the expenses you paid on your account during this period. Shareholders of the Investor and Institutional Classes that invest in the Fund through an IRA or Roth IRA may be subject to a custodial IRA fee of $15 that is typically deducted each December. If your account was subject to a custodial IRA fee during the period, your costs would have been $15 higher.
Hypothetical Example for Comparison Purposes
The “Hypothetical” lines of the table provide information about hypothetical account values and hypothetical expenses based on the Fund’s actual expense ratio and an assumed 5% per year rate of return before expenses (not the Fund’s actual return). You may compare the ongoing costs of investing in the Fund with other funds by contrasting this 5% hypothetical example and the 5% hypothetical examples that appear in the shareholder reports of the other funds. The hypothetical account values and expenses may not be used to estimate the actual ending account balance or expenses you paid for the period. Shareholders of the Investor and Institutional Classes that invest in the Fund through an IRA or Roth IRA may be subject to a custodial IRA fee of $15 that is typically deducted each December. If your account was subject to a custodial IRA fee during the period, your costs would have been $15 higher.
You should also be aware that the expenses shown in the table highlight only your ongoing costs and do not reflect any transaction costs charged by the Fund, such as sales charges (loads) or redemption fees as applicable. Similarly, the expense examples for other funds do not reflect any transaction costs charged by those funds, such as sales charges (loads), redemption fees or exchange fees. Therefore, the “Hypothetical” lines of the table is useful in comparing ongoing costs only and will not help you determine the relative total costs of owning different funds. If you were subject to any transaction costs during the period, your costs would have been higher.
8
American Beacon FundsSM
Expense Examples
October 31, 2019 (Unaudited)
| American Beacon International Equity Fund |
| ||||||||||||||
| Beginning Account Value 5/1/2019 | Ending Account Value 10/31/2019 | Expenses Paid During Period 5/1/2019-10/31/2019* | |||||||||||||
| Institutional Class | |||||||||||||||
| Actual | $1,000.00 | $1,007.80 | $3.74 | ||||||||||||
| Hypothetical** | $1,000.00 | $1,021.48 | $3.77 | ||||||||||||
| Y Class | |||||||||||||||
| Actual | $1,000.00 | $1,007.50 | $4.10 | ||||||||||||
| Hypothetical** | $1,000.00 | $1,021.12 | $4.13 | ||||||||||||
| Investor Class | |||||||||||||||
| Actual | $1,000.00 | $1,006.20 | $5.41 | ||||||||||||
| Hypothetical** | $1,000.00 | $1,019.81 | $5.45 | ||||||||||||
| Advisor Class | |||||||||||||||
| Actual | $1,000.00 | $1,005.50 | $6.12 | ||||||||||||
| Hypothetical** | $1,000.00 | $1,019.11 | $6.16 | ||||||||||||
| A Class | |||||||||||||||
| Actual | $1,000.00 | $1,005.60 | $5.86 | ||||||||||||
| Hypothetical** | $1,000.00 | $1,019.36 | $5.90 | ||||||||||||
| C Class | |||||||||||||||
| Actual | $1,000.00 | $1,001.70 | $9.49 | ||||||||||||
| Hypothetical** | $1,000.00 | $1,015.73 | $9.55 | ||||||||||||
| R6 Class | |||||||||||||||
| Actual | $1,000.00 | $1,008.40 | $3.34 | ||||||||||||
| Hypothetical** | $1,000.00 | $1,021.88 | $3.36 | ||||||||||||
| * | Expenses are equal to the Fund’s annualized expense ratios for thesix-month period of 0.74%, 0.81%, 1.07%, 1.21%, 1.16%, 1.88%, and 0.66% for the Institutional, Y, Investor, Advisor, A, C, and R6 Classes, respectively, multiplied by the average account value over the period, multiplied by the number derived by dividing the number of days in the most recent fiscal half-year (184) by days in the year (365) to reflect the half-year period. |
| ** | 5% return before expenses. |
| American Beacon Tocqueville International Value Fund |
| ||||||||||||||
| Beginning Account Value 5/1/2019 | Ending Account Value 10/31/2019 | Expenses Paid During Period 5/1/2019-10/31/2019* | |||||||||||||
| Institutional Class | |||||||||||||||
| Actual | $1,000.00 | $976.90 | $4.43 | ||||||||||||
| Hypothetical** | $1,000.00 | $1,020.72 | $4.53 | ||||||||||||
| Y Class | |||||||||||||||
| Actual | $1,000.00 | $976.90 | $4.88 | ||||||||||||
| Hypothetical** | $1,000.00 | $1,020.27 | $4.99 | ||||||||||||
| Investor Class | |||||||||||||||
| Actual | $1,000.00 | $975.60 | $5.23 | ||||||||||||
| Hypothetical** | $1,000.00 | $1,019.91 | $5.35 | ||||||||||||
| * | Expenses are equal to the Fund’s annualized expense ratios for thesix-month period of 0.89%, 0.98%, and 1.05% for the Institutional, Y, and Investor Classes, respectively, multiplied by the average account value over the period, multiplied by the number derived by dividing the number of days in the most recent fiscal half-year (184) by days in the year (365) to reflect the half-year period. |
| ** | 5% return before expenses. |
9
American Beacon FundsSM
Report of Independent Registered Public Accounting Firm
To the Shareholders and the Board of Trustees of
American Beacon International Equity Fund and American Beacon Tocqueville International Value Fund
Opinion on the Financial Statements
We have audited the accompanying statement of assets and liabilities of American Beacon International Equity Fund and American Beacon Tocqueville International Value Fund (collectively referred to as the “Funds”), (two of the funds constituting American Beacon Funds (the “Trust”)), including the schedules of investments, as of October 31, 2019, and the related statements of operations, changes in net assets, and the financial highlights for each of the periods indicated in the table below and the related notes (collectively referred to as the “financial statements”). In our opinion, the financial statements present fairly, in all material respects, the financial position of each of the Funds (two of the funds constituting American Beacon Funds) at October 31, 2019, the results of their operations, changes in net assets and financial highlights for each of the periods indicated in the table below, in conformity with U.S. generally accepted accounting principles.
Individual fund constituting the | Statement of operations | Statements of | Financial highlights | |||
| American Beacon International Equity Fund | For the year ended October 31, 2019 | For each of the two years in the period ended October 31, 2019 | For each of the five years in the period ended October 31, 2019 | |||
| American Beacon Tocqueville International Value Fund | For the year ended October 31, 2019 | For the year ended October 31, 2019 | For the year ended October 31, 2019 | |||
The statement of changes in net assets for the period ended October 31, 2018 and the financial highlights for the four years in the period ended October 31, 2018 of American Beacon Tocqueville International Value Fund were audited by other auditors whose report dated December 21, 2018, expressed an unqualified opinion on those financial statements, financial highlights and statement of changes in net assets.
Basis for Opinion
These financial statements are the responsibility of the Trust’s management. Our responsibility is to express an opinion on the Funds’ financial statements based on our audits. We are a public accounting firm registered with the Public Company Accounting Oversight Board (United States) (“PCAOB”) and are required to be independent with respect to the Trust in accordance with the U.S. federal securities laws and the applicable rules and regulations of the Securities and Exchange Commission and the PCAOB.
We conducted our audits in accordance with the standards of the PCAOB. Those standards require that we plan and perform the audit to obtain reasonable assurance about whether the financial statements are free of material misstatement, whether due to error or fraud. The Trust is not required to have, nor were we engaged to perform, an audit of the Trust’s internal control over financial reporting. As part of our audits, we are required to obtain an understanding of internal control over financial reporting, but not for the purpose of expressing an opinion on the effectiveness of the Trust’s internal control over financial reporting. Accordingly, we express no such opinion.
Our audits included performing procedures to assess the risks of material misstatement of the financial statements, whether due to error or fraud, and performing procedures that respond to those risks. Such procedures included examining, on a test basis, evidence regarding the amounts and disclosures in the financial statements. Our procedures included confirmation of securities owned as of October 31, 2019, by correspondence with the custodian and brokers or by other appropriate auditing procedures where replies from brokers were not received.
10
American Beacon FundsSM
Report of Independent Registered Public Accounting Firm
Our audits also included evaluating the accounting principles used and significant estimates made by management, as well as evaluating the overall presentation of the financial statements. We believe that our audits provide a reasonable basis for our opinion.

We have served as the auditor of one or more American Beacon investment companies since 1987.
Dallas, Texas
December 30, 2019
11
American Beacon International Equity FundSM
October 31, 2019
| Shares | Fair Value | ||||||||||||||
| Australia - 0.40% (Cost $8,204,125) | |||||||||||||||
| Common Stocks - 0.40% | |||||||||||||||
| BHP Group PLC | 547,291 | $ | 11,589,645 | ||||||||||||
|
| ||||||||||||||
| Belgium - 0.51% (Cost $14,061,610) | |||||||||||||||
| Common Stocks - 0.51% | |||||||||||||||
| Anheuser-Busch InBev S.A. | 181,115 | 14,551,900 | |||||||||||||
|
| ||||||||||||||
| Canada - 4.77% | |||||||||||||||
| Common Stocks - 4.77% | |||||||||||||||
| Barrick Gold Corp. | 1,257,300 | 21,826,728 | |||||||||||||
| Canadian Imperial Bank of Commerce | 87,619 | 7,471,331 | |||||||||||||
| Canadian National Railway Co. | 161,900 | 14,480,161 | |||||||||||||
| Encana Corp.A | 2,905,272 | 11,381,978 | |||||||||||||
| Gildan Activewear, Inc. | 235,265 | 6,010,680 | |||||||||||||
| Husky Energy, Inc. | 990,800 | 6,920,781 | |||||||||||||
| Manulife Financial Corp. | 521,197 | 9,706,903 | |||||||||||||
| National Bank of Canada | 293,802 | 15,173,041 | |||||||||||||
| Suncor Energy, Inc. | 602,200 | 17,904,603 | |||||||||||||
| Wheaton Precious Metals Corp. | 917,500 | 25,718,700 | |||||||||||||
|
| ||||||||||||||
Total Common Stocks | 136,594,906 | ||||||||||||||
|
| ||||||||||||||
Total Canada (Cost $144,432,314) | 136,594,906 | ||||||||||||||
|
| ||||||||||||||
| China - 1.13% | |||||||||||||||
| Common Stocks - 1.13% | |||||||||||||||
| China Merchants Port Holdings Co., Ltd. | 2,777,068 | 4,352,044 | |||||||||||||
| China Mobile Ltd. | 3,425,949 | 27,893,943 | |||||||||||||
|
| ||||||||||||||
Total Common Stocks | 32,245,987 | ||||||||||||||
|
| ||||||||||||||
Total China (Cost $41,692,344) | 32,245,987 | ||||||||||||||
|
| ||||||||||||||
| Denmark - 1.43% | |||||||||||||||
| Common Stocks - 1.43% | |||||||||||||||
| AP Moller - Maersk A/S, Class B | 9,647 | 12,295,648 | |||||||||||||
| Carlsberg A/S, Class B | 108,299 | 15,235,710 | |||||||||||||
| Vestas Wind Systems A/S | 162,857 | 13,293,457 | |||||||||||||
|
| ||||||||||||||
Total Common Stocks | 40,824,815 | ||||||||||||||
|
| ||||||||||||||
Total Denmark (Cost $34,585,235) | 40,824,815 | ||||||||||||||
|
| ||||||||||||||
| Finland - 0.72% | |||||||||||||||
| Common Stocks - 0.72% | |||||||||||||||
| Nordea Bank Abp | 1,324,472 | 9,688,314 | |||||||||||||
| Sampo OYJ, Class A | 268,295 | 10,993,686 | |||||||||||||
|
| ||||||||||||||
Total Common Stocks | 20,682,000 | ||||||||||||||
|
| ||||||||||||||
Total Finland (Cost $27,494,371) | 20,682,000 | ||||||||||||||
|
| ||||||||||||||
| France - 11.62% | |||||||||||||||
| Common Stocks - 11.62% | |||||||||||||||
| AirFrance-KLMB | 237,798 | 2,831,181 | |||||||||||||
| Air Liquide S.A. | 115,734 | 15,373,201 | |||||||||||||
| Atos SE | 43,322 | 3,354,167 | |||||||||||||
| BNP Paribas S.A. | 1,049,153 | 54,773,317 | |||||||||||||
| Carrefour S.A. | 612,284 | 10,417,337 | |||||||||||||
| Cie de Saint-Gobain | 357,376 | 14,536,261 | |||||||||||||
| Cie Generale des Etablissements Michelin SCA | 127,119 | 15,467,738 | |||||||||||||
| Credit Agricole S.A. | 792,346 | 10,326,072 | |||||||||||||
See accompanying notes
12
American Beacon International Equity FundSM
Schedule of Investments
October 31, 2019
| Shares | Fair Value | ||||||||||||||
| France - 11.62% (continued) | |||||||||||||||
| Common Stocks - 11.62% (continued) | |||||||||||||||
| Danone S.A. | 51,667 | $ | 4,284,935 | ||||||||||||
| Engie S.A. | 1,289,953 | 21,573,069 | |||||||||||||
| Ingenico Group S.A. | 39,485 | 4,216,160 | |||||||||||||
| Safran S.A. | 149,512 | 23,653,585 | |||||||||||||
| Sanofi | 543,467 | 50,078,343 | |||||||||||||
| TOTAL S.A. | 846,636 | 44,507,359 | |||||||||||||
| Veolia Environnement S.A. | 916,960 | 24,104,690 | |||||||||||||
| Vinci S.A. | 107,572 | 12,069,487 | |||||||||||||
| Vivendi S.A. | 762,804 | 21,234,846 | |||||||||||||
|
| ||||||||||||||
Total Common Stocks | 332,801,748 | ||||||||||||||
|
| ||||||||||||||
Total France (Cost $300,970,255) | 332,801,748 | ||||||||||||||
|
| ||||||||||||||
| Germany - 12.74% | |||||||||||||||
| Common Stocks - 10.37% | |||||||||||||||
| BASF SE | 499,843 | 38,036,502 | |||||||||||||
| Bayer AG | 407,568 | 31,628,317 | |||||||||||||
| Deutsche Post AG | 534,094 | 18,912,677 | |||||||||||||
| Deutsche Telekom AG | 2,117,029 | 37,230,168 | |||||||||||||
| E.ON SE | 2,342,080 | 23,605,738 | |||||||||||||
| Fresenius Medical Care AG & Co. KGaA | 299,946 | 21,704,286 | |||||||||||||
| Fresenius SE & Co. KGaA | 126,634 | 6,655,693 | |||||||||||||
| Infineon Technologies AG | 245,399 | 4,756,244 | |||||||||||||
| Merck KGaA | 154,409 | 18,409,496 | |||||||||||||
| SAP SE | 406,233 | 53,824,898 | |||||||||||||
| Siemens AG | 366,808 | 42,292,845 | |||||||||||||
|
| ||||||||||||||
Total Common Stocks | 297,056,864 | ||||||||||||||
|
| ||||||||||||||
| Preferred Stocks - 2.37% | �� | ||||||||||||||
| Volkswagen AGC | 356,605 | 67,891,050 | |||||||||||||
|
| ||||||||||||||
Total Germany (Cost $338,153,693) | 364,947,914 | ||||||||||||||
|
| ||||||||||||||
| Hong Kong - 0.71% | |||||||||||||||
| Common Stocks - 0.71% | |||||||||||||||
| CK Asset Holdings Ltd. | 2,368,582 | 16,534,235 | |||||||||||||
| ESR Cayman Ltd. | 1,728,000 | 3,742,104 | |||||||||||||
|
| ||||||||||||||
Total Common Stocks | 20,276,339 | ||||||||||||||
|
| ||||||||||||||
Total Hong Kong (Cost $20,049,995) | 20,276,339 | ||||||||||||||
|
| ||||||||||||||
| Ireland - 1.40% | |||||||||||||||
| Common Stocks - 1.40% | |||||||||||||||
| Bank of Ireland Group PLC | 2,397,731 | 11,531,101 | |||||||||||||
| Ryanair Holdings PLC, Sponsored ADRB | 384,478 | 28,697,438 | |||||||||||||
|
| ||||||||||||||
Total Common Stocks | 40,228,539 | ||||||||||||||
|
| ||||||||||||||
Total Ireland (Cost $48,952,817) | 40,228,539 | ||||||||||||||
|
| ||||||||||||||
| Israel - 0.40% (Cost $10,173,508) | |||||||||||||||
| Common Stocks - 0.40% | |||||||||||||||
| Bank LeumiLe-Israel BM | 1,564,809 | 11,392,699 | |||||||||||||
|
| ||||||||||||||
| Italy - 2.04% | |||||||||||||||
| Common Stocks - 2.04% | |||||||||||||||
| Eni SpA | 1,443,275 | 21,843,414 | |||||||||||||
See accompanying notes
13
American Beacon International Equity FundSM
Schedule of Investments
October 31, 2019
| Shares | Fair Value | ||||||||||||||
| Italy - 2.04% (continued) | |||||||||||||||
| Common Stocks - 2.04% (continued) | |||||||||||||||
| UniCredit SpA | 2,880,787 | $ | 36,524,711 | ||||||||||||
|
| ||||||||||||||
Total Common Stocks | 58,368,125 | ||||||||||||||
|
| ||||||||||||||
Total Italy (Cost $65,983,894) | 58,368,125 | ||||||||||||||
|
| ||||||||||||||
| Japan - 15.52% | |||||||||||||||
| Common Stocks - 15.52% | |||||||||||||||
| Asahi Group Holdings Ltd. | 208,800 | 10,498,972 | |||||||||||||
| Astellas Pharma, Inc. | 1,070,800 | 18,428,390 | |||||||||||||
| Coca-Cola Bottlers Japan Holdings, Inc. | 125,000 | 2,855,589 | |||||||||||||
| Daiwa House Industry Co., Ltd. | 805,554 | 27,861,322 | |||||||||||||
| Digital Garage, Inc. | 140,100 | 4,644,486 | |||||||||||||
| East Japan Railway Co. | 186,700 | 17,027,579 | |||||||||||||
| FANUC Corp. | 146,100 | 29,222,706 | |||||||||||||
| Hitachi Ltd. | 380,400 | 14,333,249 | |||||||||||||
| Kao Corp. | 232,260 | 18,806,199 | |||||||||||||
| KDDI Corp. | 866,600 | 24,066,427 | |||||||||||||
| Kirin Holdings Co., Ltd. | 834,000 | 17,801,371 | |||||||||||||
| Matsumotokiyoshi Holdings Co., Ltd. | 248,800 | 8,812,483 | |||||||||||||
| Mitsui Fudosan Co., Ltd. | 1,083,500 | 27,902,709 | |||||||||||||
| Murata Manufacturing Co., Ltd. | 94,200 | 5,114,312 | |||||||||||||
| Nexon Co., Ltd.B | 890,500 | 10,348,898 | |||||||||||||
| Nintendo Co., Ltd. | 600 | 222,379 | |||||||||||||
| Pan Pacific International Holdings Corp. | 554,392 | 8,763,285 | |||||||||||||
| Seven & i Holdings Co., Ltd. | 522,800 | 19,848,875 | |||||||||||||
| Shin-Etsu Chemical Co., Ltd. | 125,500 | 14,131,679 | |||||||||||||
| Sompo Holdings, Inc. | 361,200 | 14,295,479 | |||||||||||||
| Sumitomo Metal Mining Co., Ltd. | 536,500 | 18,163,200 | |||||||||||||
| Sumitomo Mitsui Financial Group, Inc. | 1,262,100 | 45,346,310 | |||||||||||||
| Suntory Beverage & Food Ltd. | 215,300 | 9,210,908 | |||||||||||||
| Suzuki Motor Corp. | 204,600 | 9,732,662 | |||||||||||||
| Takeda Pharmaceutical Co., Ltd. | 1,448,222 | 52,677,248 | |||||||||||||
| Yamaha Corp. | 301,900 | 14,173,840 | |||||||||||||
|
| ||||||||||||||
Total Common Stocks | 444,290,557 | ||||||||||||||
|
| ||||||||||||||
Total Japan (Cost $410,926,559) | 444,290,557 | ||||||||||||||
|
| ||||||||||||||
| Luxembourg - 0.71% | |||||||||||||||
| Common Stocks - 0.71% | |||||||||||||||
| SES S.A. | 768,346 | 14,884,979 | |||||||||||||
| Tenaris S.A. | 530,025 | 5,352,152 | |||||||||||||
|
| ||||||||||||||
Total Common Stocks | 20,237,131 | ||||||||||||||
|
| ||||||||||||||
Total Luxembourg (Cost $19,209,562) | 20,237,131 | ||||||||||||||
|
| ||||||||||||||
| Netherlands - 6.14% | |||||||||||||||
| Common Stocks - 6.14% | |||||||||||||||
| ABN AMRO Bank N.V.E | 515,293 | 9,591,845 | |||||||||||||
| Akzo Nobel N.V. | 157,633 | 14,512,953 | |||||||||||||
| ING Groep N.V. | 3,492,414 | 39,449,454 | |||||||||||||
| NXP Semiconductors N.V. | 162,300 | 18,450,264 | |||||||||||||
| Royal Dutch Shell PLC, Class A | 942,310 | 27,256,477 | |||||||||||||
| Royal Dutch Shell PLC, Class B | 1,537,902 | 44,185,259 | |||||||||||||
| Wolters Kluwer N.V. | 302,373 | 22,264,354 | |||||||||||||
|
| ||||||||||||||
Total Common Stocks | 175,710,606 | ||||||||||||||
|
| ||||||||||||||
Total Netherlands (Cost $169,203,661) | 175,710,606 | ||||||||||||||
|
| ||||||||||||||
See accompanying notes
14
American Beacon International Equity FundSM
Schedule of Investments
October 31, 2019
| Shares | Fair Value | ||||||||||||||
| Norway - 1.59% | |||||||||||||||
| Common Stocks - 1.59% | |||||||||||||||
| Equinor ASA | 666,211 | $ | 12,322,819 | ||||||||||||
| Mowi ASA | 344,441 | 8,397,391 | |||||||||||||
| Telenor ASA | 628,991 | 11,774,580 | |||||||||||||
| Yara International ASA | 334,185 | 13,005,966 | |||||||||||||
|
| ||||||||||||||
Total Common Stocks | 45,500,756 | ||||||||||||||
|
| ||||||||||||||
Total Norway (Cost $44,959,469) | 45,500,756 | ||||||||||||||
|
| ||||||||||||||
| Republic of Korea - 4.51% | |||||||||||||||
| Common Stocks - 4.51% | |||||||||||||||
| Hana Financial Group, Inc. | 495,880 | 14,363,450 | |||||||||||||
| KB Financial Group, Inc., ADRA | 413,917 | 14,785,115 | |||||||||||||
| Samsung Electronics Co., Ltd. | 1,783,231 | 77,248,565 | |||||||||||||
| SK Innovation Co., Ltd. | 26,233 | 3,607,615 | |||||||||||||
| SK Telecom Co., Ltd. | 94,174 | 19,183,668 | |||||||||||||
|
| ||||||||||||||
Total Common Stocks | 129,188,413 | ||||||||||||||
|
| ||||||||||||||
Total Republic of Korea (Cost $108,085,827) | 129,188,413 | ||||||||||||||
|
| ||||||||||||||
| Singapore - 1.66% | |||||||||||||||
| Common Stocks - 1.66% | |||||||||||||||
| DBS Group Holdings Ltd. | 1,090,010 | 20,831,534 | |||||||||||||
| Singapore Telecommunications Ltd. | 11,039,295 | 26,777,664 | |||||||||||||
|
| ||||||||||||||
Total Common Stocks | 47,609,198 | ||||||||||||||
|
| ||||||||||||||
Total Singapore (Cost $42,639,982) | 47,609,198 | ||||||||||||||
|
| ||||||||||||||
| Spain - 0.68% | |||||||||||||||
| Common Stocks - 0.68% | |||||||||||||||
| CaixaBank S.A. | 3,761,646 | 10,761,105 | |||||||||||||
| Red Electrica Corp. S.A. | 430,769 | 8,671,879 | |||||||||||||
|
| ||||||||||||||
Total Common Stocks | 19,432,984 | ||||||||||||||
|
| ||||||||||||||
Total Spain (Cost $20,543,313) | 19,432,984 | ||||||||||||||
|
| ||||||||||||||
| Sweden - 1.27% | |||||||||||||||
| Common Stocks - 1.27% | |||||||||||||||
| Assa Abloy AB, Class B | 955,808 | 22,668,479 | |||||||||||||
| Epiroc AB, Class AA | 1,217,191 | 13,690,042 | |||||||||||||
|
| ||||||||||||||
Total Common Stocks | 36,358,521 | ||||||||||||||
|
| ||||||||||||||
Total Sweden (Cost $28,022,551) | 36,358,521 | ||||||||||||||
|
| ||||||||||||||
| Switzerland - 4.70% | |||||||||||||||
| Common Stocks - 4.70% | |||||||||||||||
| ABB Ltd. | 1,993,492 | 41,809,782 | |||||||||||||
| Aryzta AGA B | 3,142,230 | 2,476,198 | |||||||||||||
| Cie Financiere Richemont S.A. | 16,453 | 1,294,225 | |||||||||||||
| Novartis AG | 667,618 | 58,261,768 | |||||||||||||
| Roche Holding AG | 102,558 | 30,855,767 | |||||||||||||
|
| ||||||||||||||
Total Common Stocks | 134,697,740 | ||||||||||||||
|
| ||||||||||||||
Total Switzerland (Cost $124,552,794) | 134,697,740 | ||||||||||||||
|
| ||||||||||||||
| United Kingdom - 18.72% | |||||||||||||||
| Common Stocks - 18.71% | |||||||||||||||
| AstraZeneca PLC | 193,510 | 18,802,248 | |||||||||||||
| Aviva PLC | 2,766,291 | 14,877,926 | |||||||||||||
| BAE Systems PLC | 3,389,682 | 25,299,935 | |||||||||||||
See accompanying notes
15
American Beacon International Equity FundSM
Schedule of Investments
October 31, 2019
| Shares | Fair Value | ||||||||||||||
| United Kingdom - 18.72% (continued) | |||||||||||||||
| Common Stocks - 18.71% (continued) | |||||||||||||||
| Balfour Beatty PLC | 3,140,341 | $ | 9,168,914 | ||||||||||||
| Barclays PLC | 12,602,693 | 27,393,184 | |||||||||||||
| BP PLC | 7,532,359 | 47,741,211 | |||||||||||||
| British American Tobacco PLC | 725,099 | 25,378,728 | |||||||||||||
| CK Hutchison Holdings Ltd. | 1,605,582 | 14,855,212 | |||||||||||||
| Cobham PLC | 2,404,030 | 4,913,988 | |||||||||||||
| Compass Group PLC | 357,879 | 9,531,177 | |||||||||||||
| Howden Joinery Group PLC | 1,051,393 | 7,863,738 | |||||||||||||
| Informa PLC | 1,521,370 | 15,272,979 | |||||||||||||
| Johnson Matthey PLC | 575,392 | 22,881,758 | |||||||||||||
| Linde PLC | 124,597 | 24,631,191 | |||||||||||||
| Lloyds Banking Group PLC | 15,397,933 | 11,329,167 | |||||||||||||
| M&G PLCB | 1,554,970 | 4,306,425 | |||||||||||||
| Micro Focus International PLC | 519,319 | 7,130,620 | |||||||||||||
| Prudential PLC | 2,631,511 | 45,966,702 | |||||||||||||
| RELX PLC | 1,232,162 | 29,655,191 | |||||||||||||
| Rolls-Royce Holdings PLCB | 2,596,270 | 23,844,229 | |||||||||||||
| RSA Insurance Group PLC | 1,284,009 | 8,685,446 | |||||||||||||
| SSE PLC | 950,417 | 15,801,462 | |||||||||||||
| Standard Chartered PLC | 3,365,304 | 30,558,323 | |||||||||||||
| Tesco PLC | 5,094,128 | 15,520,095 | |||||||||||||
| Unilever PLC | 345,006 | 20,658,119 | |||||||||||||
| Vodafone Group PLC | 23,535,054 | 47,985,180 | |||||||||||||
| Weir Group PLC | 315,807 | 5,508,271 | |||||||||||||
|
| ||||||||||||||
Total Common Stocks | 535,561,419 | ||||||||||||||
|
| ||||||||||||||
| Preferred Stocks - 0.01% | |||||||||||||||
| Rolls-Royce Holdings PLCC D H | 114,347,904 | 148,121 | |||||||||||||
|
| ||||||||||||||
Total United Kingdom (Cost $558,613,648) | 535,709,540 | ||||||||||||||
|
| ||||||||||||||
| United States - 1.76% | |||||||||||||||
| Common Stocks - 1.76% | |||||||||||||||
| Amcor PLC | 999,729 | 9,600,042 | |||||||||||||
| Aon PLC | 129,299 | 24,975,395 | |||||||||||||
| Ferguson PLC | 186,990 | 15,952,447 | |||||||||||||
|
| ||||||||||||||
Total Common Stocks | 50,527,884 | ||||||||||||||
|
| ||||||||||||||
Total United States (Cost $35,126,337) | 50,527,884 | ||||||||||||||
|
| ||||||||||||||
| SHORT-TERM INVESTMENTS - 4.76% | |||||||||||||||
| Investment Companies - 4.55% | |||||||||||||||
| American Beacon U.S. Government Money Market Select Fund, Select Class, 1.75%F G | 130,261,958 | 130,261,958 | |||||||||||||
|
| ||||||||||||||
| Principal Amount | |||||||||||||||
| U.S. Treasury Obligations - 0.21% | |||||||||||||||
| U.S. Treasury Bill, 1.87%, Due 2/13/2020I | $ | 6,000,000 | 5,973,694 | ||||||||||||
|
| ||||||||||||||
Total Short-Term Investments (Cost $136,230,238) | 136,235,652 | ||||||||||||||
|
| ||||||||||||||
| Shares | |||||||||||||||
| SECURITIES LENDING COLLATERAL - 0.43% (Cost $12,296,539) | |||||||||||||||
| Investment Companies - 0.43% | |||||||||||||||
| American Beacon U.S. Government Money Market Select Fund, Select Class, 1.75%F G | 12,296,539 | 12,296,539 | |||||||||||||
|
| ||||||||||||||
TOTAL INVESTMENTS - 100.32% (Cost $2,765,164,641) | 2,872,300,138 | ||||||||||||||
LIABILITIES, NET OF OTHER ASSETS - (0.32%) | (9,199,590 | ) | |||||||||||||
|
| ||||||||||||||
TOTAL NET ASSETS - 100.00% | $ | 2,863,100,548 | |||||||||||||
|
| ||||||||||||||
| Percentages are stated as a percent of net assets. | |||||||||||||||
See accompanying notes
16
American Beacon International Equity FundSM
Schedule of Investments
October 31, 2019
A All or a portion of this security is on loan, collateralized by either cash and/or U.S. Treasuries, at October 31, 2019 (Note 9).
BNon-income producing security.
C A type of Preferred Stock that has no maturity date.
D Fair valued pursuant to procedures approved by the Board of Trustees. At period end, the value of these securities amounted to $148,121 or 0.01% of net assets.
E Security exempt from registration under the Securities Act of 1933. These securities may be resold to qualified institutional buyers pursuant to Rule 144A. At the period end, the value of these securities amounted to $9,591,845 or 0.34% of net assets. The Fund has no right to demand registration of these securities.
F The Fund is affiliated by having the same investment advisor.
G7-day yield.
H Value was determined using significant unobservable inputs.
I This security or a piece thereof is held as segregated collateral.
ADR - American Depositary Receipt.
PLC - Public Limited Company.
| Long Futures Contracts Open on October 31, 2019: |
| |||||||||||||||
| Equity Futures Contracts | ||||||||||||||||
| Description | Number of Contracts | Expiration Date | Notional Amount | Contract Value | Unrealized Appreciation (Depreciation) | |||||||||||
| Mini MSCI EAFE Index Futures | 1,235 | December 2019 | $ | 118,003,999 | $ | 120,857,100 | $ | 2,853,101 | ||||||||
|
|
|
|
|
| |||||||||||
| $ | 118,003,999 | $ | 120,857,100 | $ | 2,853,101 | |||||||||||
|
|
|
|
|
| |||||||||||
| Index Abbreviations: | ||
| MSCI EAFE | MSCI Europe, Australasia, and Far East. | |
The Fund’s investments are summarized by level based on the inputs used to determine their values. As of October 31, 2019, the investments were classified as described below:
International Equity Fund | Level 1 | Level 2 | Level 3 | Total | ||||||||||||||||||||||||
Assets | ||||||||||||||||||||||||||||
Foreign Common Stocks | ||||||||||||||||||||||||||||
Australia | $ | 11,589,645 | $ | - | $ | - | $ | 11,589,645 | ||||||||||||||||||||
Belgium | 14,551,900 | - | - | 14,551,900 | ||||||||||||||||||||||||
Canada | 136,594,906 | - | - | 136,594,906 | ||||||||||||||||||||||||
China | 32,245,987 | - | - | 32,245,987 | ||||||||||||||||||||||||
Denmark | 40,824,815 | - | - | 40,824,815 | ||||||||||||||||||||||||
Finland | 20,682,000 | - | - | 20,682,000 | ||||||||||||||||||||||||
France | 332,801,748 | - | - | 332,801,748 | ||||||||||||||||||||||||
Germany | 297,056,864 | - | - | 297,056,864 | ||||||||||||||||||||||||
Hong Kong | 20,276,339 | - | - | 20,276,339 | ||||||||||||||||||||||||
Ireland | 40,228,539 | - | - | 40,228,539 | ||||||||||||||||||||||||
Israel | 11,392,699 | - | - | 11,392,699 | ||||||||||||||||||||||||
Italy | 58,368,125 | - | - | 58,368,125 | ||||||||||||||||||||||||
Japan | 444,290,557 | - | - | 444,290,557 | ||||||||||||||||||||||||
Luxembourg | 20,237,131 | - | - | 20,237,131 | ||||||||||||||||||||||||
Netherlands | 175,710,606 | - | - | 175,710,606 | ||||||||||||||||||||||||
Norway | 45,500,756 | - | - | 45,500,756 | ||||||||||||||||||||||||
Republic of Korea | 129,188,413 | - | - | 129,188,413 | ||||||||||||||||||||||||
Singapore | 47,609,198 | - | - | 47,609,198 | ||||||||||||||||||||||||
Spain | 19,432,984 | - | - | 19,432,984 | ||||||||||||||||||||||||
Sweden | 36,358,521 | - | - | 36,358,521 | ||||||||||||||||||||||||
Switzerland | 134,697,740 | - | - | 134,697,740 | ||||||||||||||||||||||||
United Kingdom | 535,561,419 | - | - | 535,561,419 | ||||||||||||||||||||||||
Foreign Preferred Stocks | ||||||||||||||||||||||||||||
Germany | 67,891,050 | - | - | 67,891,050 | ||||||||||||||||||||||||
United Kingdom | - | - | 148,121 | 148,121 | ||||||||||||||||||||||||
See accompanying notes
17
American Beacon International Equity FundSM
Schedule of Investments
October 31, 2019
International Equity Fund | Level 1 | Level 2 | Level 3 | Total | ||||||||||||||||||||||||
Common Stocks | ||||||||||||||||||||||||||||
United States | $ | 50,527,884 | $ | - | $ | - | $ | 50,527,884 | ||||||||||||||||||||
Short-Term Investments | 130,261,958 | 5,973,694 | - | 136,235,652 | ||||||||||||||||||||||||
Securities Lending Collateral | 12,296,539 | - | - | 12,296,539 | ||||||||||||||||||||||||
|
|
|
|
|
|
|
| |||||||||||||||||||||
Total Investments in Securities - Assets | $ | 2,866,178,323 | $ | 5,973,694 | $ | 148,121 | $ | 2,872,300,138 | ||||||||||||||||||||
|
|
|
|
|
|
|
| |||||||||||||||||||||
Financial Derivative Instruments - Assets | ||||||||||||||||||||||||||||
Futures Contracts | $ | 2,853,101 | $ | - | $ | - | $ | 2,853,101 | ||||||||||||||||||||
|
|
|
|
|
|
|
| |||||||||||||||||||||
Total Financial Derivative Instruments - Assets | $ | 2,853,101 | $ | - | $ | - | $ | 2,853,101 | ||||||||||||||||||||
|
|
|
|
|
|
|
| |||||||||||||||||||||
U.S. GAAP requires transfers between all levels to/from level 3 be disclosed. During the year ended October 31, 2019, there were no transfers into or out of Level 3.
The following table is a reconciliation of Level 3 assets within the Fund for which significant unobservable inputs were used to determine fair value. Transfers in or out of Level 3 represent the ending value of any security or instrument where a change in the level has occurred from the beginning to the end of the period:
| Security Type | Balance as of 10/31/2018 | Purchases | Sales | Accrued Discounts (Premiums) | Realized Gain (Loss) | Change in Unrealized Appreciation (Depreciation) | Transfer into Level 3 | Transfer out of Level 3 | Balance as of 10/31/2019 | Change in Unrealized Appreciation (Depreciation) at Period end** | ||||||||||||||||||||||||||||||
| Common Stocks | $ | 90,350 | $ | - | $ | 90,024 | $ | - | $ | (1,244 | ) | $ | 918 | $ | - | $ | - | $ | - | $ | - | |||||||||||||||||||
| Foreign Preferred Stocks | - | 147,303 | - | - | - | 818 | - | - | 148,121 | 818 | ||||||||||||||||||||||||||||||
|
|
|
|
|
|
|
|
|
|
|
|
|
|
|
|
|
|
|
| |||||||||||||||||||||
| $ | 90,350 | $ | 147,303 | $ | 90,024 | $ | - | $ | (1,244 | ) | $ | 1,736 | $ | - | $ | - | $ | 148,121 | $ | 818 | ||||||||||||||||||||
|
|
|
|
|
|
|
|
|
|
|
|
|
|
|
|
|
|
|
| |||||||||||||||||||||
| ** | Change in unrealized appreciation (depreciation) attributable to Level 3 securities held at period end. This balance is included in the change in unrealized appreciation (depreciation) on the Statements of Operations. |
The common stock and foreign preferred stock, classified as Level 3, were fair valued using the stated redemption value during the period, and the common stock was redeemed by the Fund on December 3, 2018. The securities were included in the Level 3 category due to the use of unobservable inputs that were significant to the valuation.
See accompanying notes
18
American Beacon Tocqueville International Value FundSM
Schedule of Investments
October 31, 2019
| Shares | Fair Value | ||||||||||||||
| Belgium - 2.69% (Cost $15,420,485) | |||||||||||||||
| Common Stocks - 2.69% | |||||||||||||||
| Groupe Bruxelles Lambert S.A. | 166,712 | $ | 16,730,327 | ||||||||||||
|
| ||||||||||||||
| Bermuda - 0.87% (Cost $11,865,127) | |||||||||||||||
| Common Stocks - 0.87% | |||||||||||||||
| Clear Media Ltd. | 11,736,000 | 5,391,765 | |||||||||||||
|
| ||||||||||||||
| Brazil - 0.03% (Cost $8,944,958) | |||||||||||||||
| Common Stocks - 0.03% | |||||||||||||||
| Estre Ambiental, Inc.A | 1,073,395 | 177,754 | |||||||||||||
|
| ||||||||||||||
| Canada - 3.06% | |||||||||||||||
| Common Stocks - 3.06% | |||||||||||||||
| MAG Silver Corp.A | 50,000 | 493,000 | |||||||||||||
| Nutrien Ltd. | 309,354 | 14,784,028 | |||||||||||||
| Wheaton Precious Metals Corp.B | 134,300 | 3,769,801 | |||||||||||||
|
| ||||||||||||||
Total Common Stocks | 19,046,829 | ||||||||||||||
|
| ||||||||||||||
Total Canada (Cost $18,324,560) | 19,046,829 | ||||||||||||||
|
| ||||||||||||||
| China - 0.99% (Cost $6,176,962) | |||||||||||||||
| Common Stocks - 0.99% | |||||||||||||||
| Alibaba Group Holding Ltd., Sponsored ADRA | 34,965 | 6,177,267 | |||||||||||||
|
| ||||||||||||||
| Denmark - 1.75% (Cost $15,558,289) | |||||||||||||||
| Common Stocks - 1.75% | |||||||||||||||
| ISS A/S | 415,300 | 10,867,930 | |||||||||||||
|
| ||||||||||||||
| Finland - 1.55% (Cost $14,850,497) | |||||||||||||||
| Common Stocks - 1.55% | |||||||||||||||
| Nokia OYJ, Sponsored ADRB | 2,647,200 | 9,662,280 | |||||||||||||
|
| ||||||||||||||
| France - 15.83% | |||||||||||||||
| Common Stocks - 15.83% | |||||||||||||||
| Bollore S.A. | 3,875,304 | 16,769,846 | |||||||||||||
| Bureau Veritas S.A. | 792,998 | 20,244,612 | |||||||||||||
| Danone S.A. | 219,000 | 18,162,477 | |||||||||||||
| Engie S.A. | 385,000 | 6,438,708 | |||||||||||||
| Sanofi | 238,901 | 22,013,786 | |||||||||||||
| Sopra Steria Group | 108,000 | 14,803,596 | |||||||||||||
|
| ||||||||||||||
Total Common Stocks | 98,433,025 | ||||||||||||||
|
| ||||||||||||||
Total France (Cost $94,301,186) | 98,433,025 | ||||||||||||||
|
| ||||||||||||||
| Germany - 13.43% | |||||||||||||||
| Common Stocks - 11.36% | |||||||||||||||
| Brenntag AG | 112,300 | 5,636,167 | |||||||||||||
| Duerr AG | 263,730 | 7,777,008 | |||||||||||||
| GEA Group AG | 244,500 | 7,474,454 | |||||||||||||
| Infineon Technologies AG | 810,169 | 15,702,435 | |||||||||||||
| Siemens AG, Sponsored ADR | 344,465 | 19,885,964 | |||||||||||||
| Software AG | 248,600 | 7,902,010 | |||||||||||||
| Wacker Neuson SE | 366,800 | 6,267,288 | |||||||||||||
|
| ||||||||||||||
Total Common Stocks | 70,645,326 | ||||||||||||||
|
| ||||||||||||||
| Preferred Stocks - 2.07% | |||||||||||||||
| Henkel AG & Co. KGaA | 123,800 | 12,865,745 | |||||||||||||
|
| ||||||||||||||
Total Germany (Cost $85,151,158) | 83,511,071 | ||||||||||||||
|
| ||||||||||||||
See accompanying notes
19
American Beacon Tocqueville International Value FundSM
Schedule of Investments
October 31, 2019
| Shares | Fair Value | ||||||||||||||
| Ireland - 3.10% (Cost $18,702,566) | |||||||||||||||
| Common Stocks - 3.10% | |||||||||||||||
| CRH PLC | 529,520 | $ | 19,299,942 | ||||||||||||
|
| ||||||||||||||
| Italy - 0.51% (Cost $3,303,394) | |||||||||||||||
| Common Stocks - 0.51% | |||||||||||||||
| Salvatore Ferragamo SpA | 168,900 | 3,155,266 | |||||||||||||
|
| ||||||||||||||
| Japan - 21.46% | |||||||||||||||
| Common Stocks - 21.46% | |||||||||||||||
| Amano Corp. | 639,003 | 19,053,520 | |||||||||||||
| FANUC Corp. | 107,370 | 21,475,989 | |||||||||||||
| Hitachi Ltd. | 377,568 | 14,226,541 | |||||||||||||
| Hoya Corp. | 144,500 | 12,849,648 | |||||||||||||
| Kao Corp. | 171,200 | 13,862,143 | |||||||||||||
| Makita Corp. | 522,200 | 17,819,307 | |||||||||||||
| Mitsubishi UFJ Financial Group, Inc. | 2,331,800 | 12,303,543 | |||||||||||||
| Nikon Corp. | 391,500 | 5,039,217 | |||||||||||||
| Nintendo Co., Ltd. | 16,700 | 5,972,349 | |||||||||||||
| Rohm Co., Ltd. | 90,100 | 7,225,354 | |||||||||||||
| Tokyo Broadcasting System Holdings, Inc. | 226,000 | 3,647,727 | |||||||||||||
|
| ||||||||||||||
Total Common Stocks | 133,475,338 | ||||||||||||||
|
| ||||||||||||||
Total Japan (Cost $114,542,177) | 133,475,338 | ||||||||||||||
|
| ||||||||||||||
| Netherlands - 2.73% (Cost $17,453,092) | |||||||||||||||
| Common Stocks - 2.73% | |||||||||||||||
| Royal Dutch Shell PLC, Class B, Sponsored ADR | 291,700 | 17,003,193 | |||||||||||||
|
| ||||||||||||||
| Republic of Korea - 2.98% (Cost $16,696,601) | |||||||||||||||
| Preferred Stocks - 2.98% | |||||||||||||||
| Samsung Electronics Co., Ltd.C | 524,900 | 18,520,044 | |||||||||||||
|
| ||||||||||||||
| Spain - 2.83% (Cost $17,623,388) | |||||||||||||||
| Common Stocks - 2.83% | |||||||||||||||
| Applus Services S.A. | 1,461,000 | 17,614,385 | |||||||||||||
|
| ||||||||||||||
| Switzerland - 4.73% | |||||||||||||||
| Common Stocks - 4.73% | |||||||||||||||
| Novartis AG, Sponsored ADR | 146,150 | 12,779,356 | |||||||||||||
| Roche Holding AG | 55,200 | 16,607,562 | |||||||||||||
|
| ||||||||||||||
Total Common Stocks | 29,386,918 | ||||||||||||||
|
| ||||||||||||||
Total Switzerland (Cost $25,509,360) | 29,386,918 | ||||||||||||||
|
| ||||||||||||||
| Taiwan - 1.25% (Cost $6,677,557) | |||||||||||||||
| Common Stocks - 1.25% | |||||||||||||||
| Taiwan Semiconductor Manufacturing Co., Ltd., Sponsored ADR | 150,000 | 7,744,500 | |||||||||||||
|
| ||||||||||||||
| United Kingdom - 11.23% | |||||||||||||||
| Common Stocks - 11.23% | |||||||||||||||
| Diageo PLC, Sponsored ADR | 80,390 | 13,173,510 | |||||||||||||
| IMI PLC | 740,800 | 9,624,742 | |||||||||||||
| Reckitt Benckiser Group PLC | 173,100 | 13,372,786 | |||||||||||||
| Smiths Group PLC | 906,545 | 18,947,222 | |||||||||||||
| Unilever N.V. | 248,401 | 14,715,275 | |||||||||||||
|
| ||||||||||||||
Total Common Stocks | 69,833,535 | ||||||||||||||
|
| ||||||||||||||
Total United Kingdom (Cost $63,999,295) | 69,833,535 | ||||||||||||||
|
| ||||||||||||||
See accompanying notes
20
American Beacon Tocqueville International Value FundSM
Schedule of Investments
October 31, 2019
| Shares | Fair Value | ||||||||||||||
| United States - 4.25% | |||||||||||||||
| Common Stocks - 4.25% | |||||||||||||||
| Aflac, Inc. | 251,535 | $ | 13,371,601 | ||||||||||||
| Bunge Ltd. | 133,400 | 7,203,600 | |||||||||||||
| Schlumberger Ltd. | 179,000 | 5,851,510 | |||||||||||||
|
| ||||||||||||||
Total Common Stocks | 26,426,711 | ||||||||||||||
|
| ||||||||||||||
Total United States (Cost $25,666,045) | 26,426,711 | ||||||||||||||
|
| ||||||||||||||
| SHORT-TERM INVESTMENTS - 3.99% (Cost $24,820,282) | |||||||||||||||
| Investment Companies - 3.99% | |||||||||||||||
| American Beacon U.S. Government Money Market Select Fund, Select Class, 1.75%D E | 24,820,282 | 24,820,282 | |||||||||||||
|
| ||||||||||||||
| SECURITIES LENDING COLLATERAL - 1.48% (Cost $9,185,400) | |||||||||||||||
| Investment Companies - 1.48% | |||||||||||||||
| American Beacon U.S. Government Money Market Select Fund, Select Class, 1.75%D E | 9,185,400 | 9,185,400 | |||||||||||||
|
| ||||||||||||||
TOTAL INVESTMENTS - 100.74% (Cost $614,772,379) | 626,463,762 | ||||||||||||||
LIABILITIES, NET OF OTHER ASSETS - (0.74%) | (4,627,130 | ) | |||||||||||||
|
| ||||||||||||||
TOTAL NET ASSETS - 100.00% | $ | 621,836,632 | |||||||||||||
|
| ||||||||||||||
| Percentages are stated as a percent of net assets. | |||||||||||||||
ANon-income producing security.
B All or a portion of this security is on loan, collateralized by either cash and/or U.S. Treasuries, at October 31, 2019 (Note 9).
C A type of Preferred Stock that has no maturity date.
D The Fund is affiliated by having the same investment advisor.
E7-day yield.
ADR - American Depositary Receipt.
PLC - Public Limited Company.
The Fund’s investments are summarized by level based on the inputs used to determine their values. As of October 31, 2019, the investments were classified as described below:
Tocqueville International Value Fund | Level 1 | Level 2 | Level 3 | Total | ||||||||||||||||||||||||
Assets | ||||||||||||||||||||||||||||
Foreign Common Stocks | ||||||||||||||||||||||||||||
Belgium | $ | 16,730,327 | $ | - | $ | - | $ | 16,730,327 | ||||||||||||||||||||
Bermuda | 5,391,765 | - | - | 5,391,765 | ||||||||||||||||||||||||
Brazil | 177,754 | - | - | 177,754 | ||||||||||||||||||||||||
Canada | 19,046,829 | - | - | 19,046,829 | ||||||||||||||||||||||||
China | 6,177,267 | - | - | 6,177,267 | ||||||||||||||||||||||||
Denmark | 10,867,930 | - | - | 10,867,930 | ||||||||||||||||||||||||
Finland | 9,662,280 | - | - | 9,662,280 | ||||||||||||||||||||||||
France | 98,433,025 | - | - | 98,433,025 | ||||||||||||||||||||||||
Germany | 70,645,326 | - | - | 70,645,326 | ||||||||||||||||||||||||
Ireland | 19,299,942 | - | - | 19,299,942 | ||||||||||||||||||||||||
Italy | 3,155,266 | - | - | 3,155,266 | ||||||||||||||||||||||||
Japan | 133,475,338 | - | - | 133,475,338 | ||||||||||||||||||||||||
Netherlands | 17,003,193 | - | - | 17,003,193 | ||||||||||||||||||||||||
Spain | 17,614,385 | - | - | 17,614,385 | ||||||||||||||||||||||||
Switzerland | 29,386,918 | - | - | 29,386,918 | ||||||||||||||||||||||||
Taiwan | 7,744,500 | - | - | 7,744,500 | ||||||||||||||||||||||||
United Kingdom | 69,833,535 | - | - | 69,833,535 | ||||||||||||||||||||||||
Foreign Preferred Stocks | ||||||||||||||||||||||||||||
Germany | 12,865,745 | - | - | 12,865,745 | ||||||||||||||||||||||||
Republic of Korea | 18,520,044 | - | - | 18,520,044 | ||||||||||||||||||||||||
See accompanying notes
21
American Beacon Tocqueville International Value FundSM
Schedule of Investments
October 31, 2019
Tocqueville International Value Fund | Level 1 | Level 2 | Level 3 | Total | ||||||||||||||||||||||||
Common Stocks | ||||||||||||||||||||||||||||
United States | $ | 26,426,711 | $ | - | $ | - | $ | 26,426,711 | ||||||||||||||||||||
Short-Term Investments | 24,820,282 | - | - | 24,820,282 | ||||||||||||||||||||||||
Securities Lending Collateral | 9,185,400 | - | - | 9,185,400 | ||||||||||||||||||||||||
|
|
|
|
|
|
|
| |||||||||||||||||||||
Total Investments in Securities - Assets | $ | 626,463,762 | $ | - | $ | - | $ | 626,463,762 | ||||||||||||||||||||
|
|
|
|
|
|
|
| |||||||||||||||||||||
U.S. GAAP requires transfers between all levels to/from level 3 be disclosed. During the year ended October 31, 2019, there were no transfers into or out of Level 3.
See accompanying notes
22
Statements of Assets and Liabilities
October 31, 2019
| International Equity Fund | Tocqueville International Value Fund | |||||||||||
Assets: | ||||||||||||
Investments in unaffiliated securities, at fair value†§ | $ | 2,729,741,641 | $ | 592,458,080 | ||||||||
Investments in affiliated securities, at fair value‡ | 142,558,497 | 34,005,682 | ||||||||||
Foreign currency, at fair value¤ | 28,924 | – | ||||||||||
Dividends and interest receivable | 7,508,394 | 1,518,218 | ||||||||||
Receivable for investments sold | 5,357,229 | 746,932 | ||||||||||
Receivable for fund shares sold | 5,071,002 | 625,614 | ||||||||||
Receivable for tax reclaims | 5,247,414 | 3,329,069 | ||||||||||
Receivable for expense reimbursement (Note 2) | 10,693 | – | ||||||||||
Receivable for variation margin on open futures contracts (Note 5) | 2,856,274 | – | ||||||||||
Prepaid expenses | 67,623 | 18,422 | ||||||||||
|
|
|
| |||||||||
Total assets | 2,898,447,691 | 632,702,017 | ||||||||||
|
|
|
| |||||||||
Liabilities: | ||||||||||||
Payable for investments purchased | 13,754,374 | 31 | ||||||||||
Payable for fund shares redeemed | 2,877,143 | 519,060 | ||||||||||
Payable for foreign currency, at fair value^ | – | 340,851 | ||||||||||
Payable for expense reimbursement (Note 2) | – | 49,861 | ||||||||||
Cash due to broker for futures contracts | 2,465,074 | – | ||||||||||
Management andsub-advisory fees payable (Note 2) | 3,333,821 | 211,961 | ||||||||||
Service fees payable (Note 2) | 92,216 | 941 | ||||||||||
Transfer agent fees payable (Note 2) | 159,521 | 5,634 | ||||||||||
Payable upon return of securities loaned (Note 9)§ | 12,296,539 | 9,185,400 | ||||||||||
Custody and fund accounting fees payable | 129,713 | 101,695 | ||||||||||
Professional fees payable | 69,229 | 76,199 | ||||||||||
Trustee fees payable (Note 2) | 18,994 | 5,318 | ||||||||||
Payable for prospectus and shareholder reports | 100,028 | 124,067 | ||||||||||
Miscellaneous payable | - | 197,103 | ||||||||||
Other liabilities | 50,491 | 47,264 | ||||||||||
|
|
|
| |||||||||
Total liabilities | 35,347,143 | 10,865,385 | ||||||||||
|
|
|
| |||||||||
Net assets | $ | 2,863,100,548 | $ | 621,836,632 | ||||||||
|
|
|
| |||||||||
Analysis of net assets: | ||||||||||||
Paid-in-capital | $ | 2,758,322,519 | $ | 605,515,464 | ||||||||
Total distributable earnings (deficits)A | 104,778,029 | 16,321,168 | ||||||||||
|
|
|
| |||||||||
Net assets | $ | 2,863,100,548 | $ | 621,836,632 | ||||||||
|
|
|
| |||||||||
See accompanying notes
23
American Beacon FundsSM
Statements of Assets and Liabilities
October 31, 2019
| International Equity Fund | Tocqueville International Value Fund | |||||||||||
Shares outstanding at no par value (unlimited shares authorized): | ||||||||||||
Institutional ClassB | 83,054,472 | 2,373,233 | ||||||||||
|
|
|
| |||||||||
Y ClassB | 47,661,864 | 14,663,491 | ||||||||||
|
|
|
| |||||||||
Investor Class | 12,367,210 | 22,766,862 | ||||||||||
|
|
|
| |||||||||
Advisor Class | 2,500,764 | N/A | ||||||||||
|
|
|
| |||||||||
A Class | 782,632 | N/A | ||||||||||
|
|
|
| |||||||||
C Class | 359,344 | N/A | ||||||||||
|
|
|
| |||||||||
R6 Class | 9,943,320 | N/A | ||||||||||
|
|
|
| |||||||||
Net assets: | ||||||||||||
Institutional ClassB | $ | 1,499,867,401 | $ | 37,138,368 | ||||||||
|
|
|
| |||||||||
Y ClassB | $ | 896,442,437 | $ | 229,275,205 | ||||||||
|
|
|
| |||||||||
Investor Class | $ | 221,043,036 | $ | 355,423,059 | ||||||||
|
|
|
| |||||||||
Advisor Class | $ | 45,797,068 | N/A | |||||||||
|
|
|
| |||||||||
A Class | $ | 13,973,709 | N/A | |||||||||
|
|
|
| |||||||||
C Class | $ | 6,174,460 | N/A | |||||||||
|
|
|
| |||||||||
R6 Class | $ | 179,802,437 | N/A | |||||||||
|
|
|
| |||||||||
Net asset value, offering and redemption price per share: | ||||||||||||
Institutional ClassB | $ | 18.06 | $ | 15.65 | ||||||||
|
|
|
| |||||||||
Y ClassB | $ | 18.81 | $ | 15.64 | ||||||||
|
|
|
| |||||||||
Investor Class | $ | 17.87 | $ | 15.61 | ||||||||
|
|
|
| |||||||||
Advisor Class | $ | 18.31 | N/A | |||||||||
|
|
|
| |||||||||
A Class | $ | 17.85 | N/A | |||||||||
|
|
|
| |||||||||
A Class (offering price) | $ | 18.94 | N/A | |||||||||
|
|
|
| |||||||||
C Class | $ | 17.18 | N/A | |||||||||
|
|
|
| |||||||||
R6 Class | $ | 18.08 | N/A | |||||||||
|
|
|
| |||||||||
† Cost of investments in unaffiliated securities | $ | 2,622,606,144 | $ | 580,766,697 | ||||||||
‡ Cost of investments in affiliated securities | $ | 142,558,497 | $ | 34,005,682 | ||||||||
§ Fair value of securities on loan | $ | 25,633,327 | $ | 10,772,475 | ||||||||
¤ Cost of foreign currency | $ | 28,827 | $ | – | ||||||||
^ Cost of payable for foreign currency | $ | – | $ | (323,957 | ) | |||||||
A The Fund’s investments in affiliated securities did not have unrealized appreciation (depreciation) at year end. |
| |||||||||||
| B Class commenced operations January 22, 2019 in the Tocqueville International Value Fund (Note 1). |
| |||||||||||
See accompanying notes
24
American Beacon FundsSM
Statements of Operations
For the year ended October 31, 2019
| International Equity Fund | Tocqueville International Value Fund | |||||||||||
Investment income: |
| |||||||||||
Dividend income from unaffiliated securities (net of foreign taxes)† | $ | 99,992,341 | $ | 21,503,632 | ||||||||
Dividend income from affiliated securities (Note 8) | 2,015,977 | 676,573 | ||||||||||
Interest income | 167,849 | 117,039 | ||||||||||
Income derived from securities lending (Note 9) | 981,832 | 171,542 | ||||||||||
|
|
|
| |||||||||
Total investment income | 103,157,999 | 22,468,786 | ||||||||||
|
|
|
| |||||||||
Expenses: |
| |||||||||||
Management andsub-advisory fees (Note 2) | 17,264,838 | 4,477,041 | ||||||||||
Investment advisor’s feesB | - | 2,106,854 | ||||||||||
Transfer agent fees: | ||||||||||||
Institutional Class (Note 2)A | 525,035 | 4,601 | ||||||||||
Y Class (Note 2)A | 939,874 | 99,843 | ||||||||||
Investor Class | 12,316 | 164,131 | ||||||||||
Advisor Class | 2,647 | - | ||||||||||
A Class | 4,100 | - | ||||||||||
C Class | 3,793 | - | ||||||||||
R6 Class | 5,934 | - | ||||||||||
Custody and fund accounting fees | 799,432 | 283,978 | ||||||||||
Professional fees | 181,753 | 146,004 | ||||||||||
Registration fees and expenses | 149,404 | 72,462 | ||||||||||
Service fees (Note 2): | ||||||||||||
Investor Class | 822,238 | 1,115,199 | ||||||||||
Advisor Class | 110,520 | - | ||||||||||
A Class | 23,354 | - | ||||||||||
C Class | 6,893 | - | ||||||||||
Distribution fees (Note 2): | ||||||||||||
Investor ClassG | - | 528,972 | ||||||||||
Advisor Class | 110,578 | - | ||||||||||
A Class | 33,509 | - | ||||||||||
C Class | 60,744 | - | ||||||||||
Administration feesE | - | 292,677 | ||||||||||
Prospectus and shareholder report expenses | 415,465 | 220,528 | ||||||||||
Trustee fees (Note 2) | 212,096 | 96,643 | ||||||||||
Other expenses | 474,805 | 192,153 | ||||||||||
|
|
|
| |||||||||
Total expenses | 22,159,328 | 9,801,086 | ||||||||||
|
|
|
| |||||||||
Net fees waived and expenses (reimbursed) (Note 2) | (43,265 | ) | (693,429 | )F | ||||||||
|
|
|
| |||||||||
Net expenses | 22,116,063 | 9,107,657 | ||||||||||
|
|
|
| |||||||||
Net investment income | 81,041,936 | 13,361,129 | ||||||||||
|
|
|
| |||||||||
See accompanying notes
25
American Beacon FundsSM
Statements of Operations
For the year ended October 31, 2019
| International Equity Fund | Tocqueville International Value Fund | |||||||||||
Realized and unrealized gain (loss) from investments: |
| |||||||||||
Net realized gain (loss) from: | ||||||||||||
Investments in unaffiliated securitiesC | $ | (71,915,300 | ) | $ | 2,997,047 | |||||||
Commission recapture (Note 1) | 27,427 | - | ||||||||||
Foreign currency transactions | (821,458 | ) | (911,262 | ) | ||||||||
Forward foreign currency contracts | (4,704,460 | ) | - | |||||||||
Futures contracts | 4,633,028 | - | ||||||||||
Change in net unrealized appreciation (depreciation) of: | ||||||||||||
Investments in unaffiliated securitiesD | 141,491,860 | 11,001,044 | ||||||||||
Foreign currency transactions | 87,203 | (878 | ) | |||||||||
Forward foreign currency contracts | 2,354,220 | - | ||||||||||
Futures contracts | 5,582,029 | - | ||||||||||
|
|
|
| |||||||||
Net gain from investments | 76,734,549 | 13,085,951 | ||||||||||
|
|
|
| |||||||||
Net increase in net assets resulting from operations | $ | 157,776,485 | $ | 26,447,080 | ||||||||
|
|
|
| |||||||||
† Foreign taxes | $ | 9,602,158 | $ | 2,131,591 | ||||||||
A Class commenced operations January 22, 2019 in the Tocqueville International Value Fund (Note 1). |
| |||||||||||
B This expense represents the Investment advisory fees paid to previous Advisor prior to the Reorganization. See Note 2. |
| |||||||||||
C The Fund did not recognize net realized gains (losses) from the sale of investments in affiliated securities. |
| |||||||||||
D The Fund’s investments in affiliated securities did not have a change in unrealized appreciation (depreciation) at year end. |
| |||||||||||
E This expense represents Administration fees paid to the previous Advisor prior to the Reorganization. See Note 2. |
| |||||||||||
F This expense includes $684,461 of fees waived by the Tocqueville International Value Fund prior to the Reorganization. See Note 1. |
| |||||||||||
G This expense represents Distribution fees paid to the previous Distributor prior to the Reorganization. See Note 2. |
| |||||||||||
See accompanying notes
26
American Beacon FundsSM
Statements of Changes in Net Assets
| International Equity Fund | Tocqueville International Value Fund | |||||||||||||||||||||||||||
| Year Ended October 31, 2019 | Year Ended October 31, 2018 | Year Ended October 31, 2019 | Year Ended October 31, 2018B | |||||||||||||||||||||||||
Increase (decrease) in net assets: | ||||||||||||||||||||||||||||
Operations: | ||||||||||||||||||||||||||||
Net investment income | $ | 81,041,936 | $ | 66,429,991 | $ | 13,361,129 | $ | 16,561,256 | ||||||||||||||||||||
Net realized gain (loss) from investments in unaffiliated securities, commission recapture, foreign currency transactions, forward foreign currency contracts, and futures contracts | (72,780,763 | ) | 170,565,282 | 2,085,785 | (9,208,831 | ) | ||||||||||||||||||||||
Change in net unrealized appreciation (depreciation) of investments in unaffiliated securities, foreign currency transactions, forward foreign currency contracts, and futures contracts | 149,515,312 | (482,846,814 | ) | 11,000,166 | (185,661,979 | ) | ||||||||||||||||||||||
|
|
|
|
|
|
|
| |||||||||||||||||||||
Net increase (decrease) in net assets resulting from operations | 157,776,485 | (245,851,541 | ) | 26,447,080 | (178,309,554 | ) | ||||||||||||||||||||||
|
|
|
|
|
|
|
| |||||||||||||||||||||
Distributions to shareholders: | ||||||||||||||||||||||||||||
Total retained earnings: | ||||||||||||||||||||||||||||
Institutional ClassA | (127,130,889 | ) | (51,858,343 | ) | - | - | ||||||||||||||||||||||
Y ClassA | (70,121,553 | ) | (30,796,239 | ) | - | - | ||||||||||||||||||||||
Investor Class | (20,019,511 | ) | (8,756,108 | ) | (12,373,617 | ) | (14,880,734 | ) | ||||||||||||||||||||
Advisor Class | (3,580,435 | ) | (1,516,721 | ) | - | - | ||||||||||||||||||||||
A Class | (1,054,868 | ) | (482,751 | ) | - | - | ||||||||||||||||||||||
C Class | (488,926 | ) | (155,808 | ) | - | - | ||||||||||||||||||||||
R6 Class | (7,544,822 | ) | (351,275 | ) | - | - | ||||||||||||||||||||||
|
|
|
|
|
|
|
| |||||||||||||||||||||
Net distributions to shareholders | (229,941,004 | ) | (93,917,245 | ) | (12,373,617 | ) | (14,880,734 | ) | ||||||||||||||||||||
|
|
|
|
|
|
|
| |||||||||||||||||||||
Capital share transactions (Note 11): | ||||||||||||||||||||||||||||
Proceeds from sales of shares | 802,141,221 | 802,744,600 | 577,502,947 | 500,256,514 | ||||||||||||||||||||||||
Reinvestment of dividends and distributions | 217,857,545 | 86,428,547 | 11,224,453 | 13,265,360 | ||||||||||||||||||||||||
Cost of shares redeemed | (971,911,716 | ) | (740,146,553 | ) | (1,040,964,339 | ) | (381,325,273 | ) | ||||||||||||||||||||
|
|
|
|
|
|
|
| |||||||||||||||||||||
Net increase (decrease) in net assets from capital share transactions | 48,087,050 | 149,026,594 | (452,236,939 | ) | 132,196,601 | |||||||||||||||||||||||
|
|
|
|
|
|
|
| |||||||||||||||||||||
Net (decrease) in net assets | (24,077,469 | ) | (190,742,192 | ) | (438,163,476 | ) | (60,993,687 | ) | ||||||||||||||||||||
|
|
|
|
|
|
|
| |||||||||||||||||||||
Net assets: | ||||||||||||||||||||||||||||
Beginning of period | 2,887,178,017 | 3,077,920,209 | 1,060,000,108 | 1,120,993,795 | ||||||||||||||||||||||||
|
|
|
|
|
|
|
| |||||||||||||||||||||
End of period | $ | 2,863,100,548 | $ | 2,887,178,017 | $ | 621,836,632 | $ | 1,060,000,108 | ||||||||||||||||||||
|
|
|
|
|
|
|
| |||||||||||||||||||||
| A Class commenced operations January 22, 2019 in the Tocqueville International Value Fund (Note 1). |
| |||||||||||||||||||||||||||
| B This Fund was reorganized on January 18, 2019 and became a series within the American Beacon Funds Trust thereafter. |
| |||||||||||||||||||||||||||
See accompanying notes
27
Notes to Financial Statements
October 31, 2019
1. Organization and Significant Accounting Policies
American Beacon Funds (the “Trust”) is organized as a Massachusetts business trust. The Funds, each a series within the Trust, are registered under the Investment Company Act of 1940, as amended (the “Act”), as diversified,open-end management investment companies. As of October 31, 2019, the Trust consists ofthirty-two active series, two of which are presented in this filing: American Beacon International Equity Fund and American Beacon Tocqueville International Value Fund (collectively, the “Funds” and each individually a “Fund”). The remaining thirty active series are reported in separate filings.
American Beacon Advisors, Inc. (the “Manager”) is a Delaware corporation and a wholly-owned subsidiary of Resolute Investment Managers, Inc. (“RIM”) organized in 1986 to provide business management, advisory, administrative, and asset management consulting services to the Trust and other investors. The Manager is registered as an investment advisor under the Investment Advisers Act of 1940, as amended (the “Advisers Act”). RIM is, in turn, a wholly-owned subsidiary of Resolute Acquisition, Inc., which is a wholly-owned subsidiary of Resolute Topco, Inc., a wholly-owned subsidiary of Resolute Investment Holdings, LLC (“RIH”). RIH is owned primarily by Kelso Investment Associates VIII, L.P., KEP VI, LLC and Estancia Capital Partners L.P., investment funds affiliated with Kelso & Company, L.P. (“Kelso”) or Estancia Capital Management, LLC (“Estancia”), which are private equity firms.
Fund Reorganization
On September 13, 2018, the Trust’s Board of Trustees approved a Plan of Reorganization and Termination (the “Plan”) to reorganize the Tocqueville International Value Fund (the “Target Fund” and “Predecessor Fund”) into the American Beacon Tocqueville International Value Fund (the “Acquiring Fund”), a newly-created series of the Trust (the “Reorganization”). Shareholders for the Target Fund approved the Plan at a special meeting on December 13, 2018. On January 18, 2019, pursuant to the Plan, the Target Fund transferred all its property and assets to the Acquiring Fund in exchange solely for voting shares of the Acquiring Fund and the assumption of all the Target Fund’s liabilities. The Target Fund’s shareholders received a pro rata portion of the Acquiring Fund’s shares in exchange for their shares therein and in liquidation and termination of the Target Fund. The accounting and performance history of the shares of the Target Fund was redesignated as that of the Investor Class of the Acquiring Fund. Institutional Class and Y Class commenced operations on January 22, 2019.
The Reorganization was structured to qualify as atax-free reorganization under the Internal Revenue Code for federal income tax purposes. As such, the Target Fund’s shareholders recognized no gain or loss for federal income tax purposes. The shares, net assets, net investment income, and net unrealized appreciation (depreciation) of the investments of the Target Fund as of the close of business on January 18, 2019 were as follows:
Investor Class Shares | 58,023,801 | |||
Net Assets | $ | 857,320,479 | ||
Net Investment Income | $ | 283,068 | ||
Unrealized Depreciation | $ | (8,771,740 | ) |
The Reorganization shifted the management oversight responsibility from Tocqueville Asset Management, L.P. (“Tocqueville”) to the Manager. The Manager engaged Tocqueville as thesub-advisor to the Acquiring Fund, thus maintaining the continuity of the portfolio management.
For financial reporting purposes, assets received, and shares issued by the Acquiring Fund were recorded at fair value; however, the cost basis of the investments received from the Target Fund was carried forward to align ongoing reporting of the Acquiring Fund’s realized and unrealized gains and losses with the amount distributable to shareholders for tax purposes.
28
American Beacon FundsSM
Notes to Financial Statements
October 31, 2019
Recent Accounting Pronouncements
In March 2017, the Financial Accounting Standards Board (“FASB”) issued Accounting Standards Update (“ASU”)2017-08,Premium Amortization of Purchased Callable Debt Securities. The amendments in the ASU shorten the premium amortization period on a purchased callable debt security from the security’s contractual life to the earliest call date. It is anticipated that this change will enhance disclosures by reducing losses recognized when a security is called on an earlier date. This ASU is effective for fiscal years beginning after December 15, 2018. The Manager continues to evaluate the impact this ASU will have on the financial statements and other disclosures.
In August 2018, the FASB issued ASU2018-13,Fair Value Measurement (“Topic 820”). The amendments in the ASU impact disclosure requirements for fair value measurement. It is anticipated that this change will enhance the effectiveness of disclosures in the notes to the financial statements. This ASU is effective for fiscal years beginning after December 15, 2019. Early adoption is permitted and can include the entire standard or certain provisions that exclude or amend disclosures. For the year ended October 31, 2019, the Funds have chosen to adopt the standard. The adoption of this ASU guidance did not have a material impact on the financial statements and other disclosures.
Class Disclosure
On January 22, 2019, the Tocqueville International Value Fund created the Institutional and Y Classes, new classes made available for sale pursuant to the Fund’s registration statement filed with the U.S. Securities and Exchange Commission (“SEC”). Refer to the Fund’s prospectus for more details.
Each Fund has multiple classes of shares designed to meet the needs of different groups of investors. The following table sets forth the differences amongst the classes:
Class | Eligible Investors | Minimum Initial Investments | ||||
| Institutional | Large institutional investors - sold directly or through intermediary channels. | $ | 250,000 | |||
| Y Class | Large institutional retirement plan investors - sold directly or through intermediary channels. | $ | 100,000 | |||
| Investor | All investors using intermediary organizations, such as broker-dealers or retirement plan sponsors. | $ | 2,500 | |||
| Advisor Class | All investors who invest through intermediary organizations, such as broker-dealers or third party administrators. | $ | 2,500 | |||
| A Class | All investors who invest through intermediary organizations, such as broker-dealers or third party administrator. Retail investors who invest directly through a financial intermediary such as a broker, bank, or registered investment advisor which may include afront-end sales charge and a contingent deferred sales charge (“CDSC”). | $ | 2,500 | |||
| C Class | Retail investors who invest directly through a financial intermediary such as a broker or through employee directed benefit plans with applicable sales charges which may include CDSC. | $ | 1,000 | |||
| R6 Class | Large institutional retirement plan investors - sold through retirement plan sponsors. | None | ||||
Each class offered by the Trust has equal rights as to assets and voting privileges. Income andnon-class specific expenses are allocated daily to each class based on the relative net assets. Realized and unrealized capital gains and losses of each class are allocated daily based on the relative net assets of each class of the respective Fund. Class specific expenses, where applicable, currently include service, distribution, transfer agent fees, andsub-transfer agent fees that vary amongst the classes as described more fully in Note 2.
29
American Beacon FundsSM
Notes to Financial Statements
October 31, 2019
Significant Accounting Policies
The following is a summary of significant accounting policies, consistently followed by the Funds in preparation of the financial statements. The Funds are considered investment companies and accordingly, follow the investment company accounting and reporting guidance of the FASB Accounting Standards Codification Topic 946,Financial Services – Investment Companies,a part of Generally Accepted Accounting Principles (“U.S. GAAP”).
Security Transactions and Investment Income
Security transactions are recorded as of the trade date for financial reporting purposes. Securities purchased or sold on a when-issued or delayed-delivery basis may be settled beyond a standard settlement period for the security after the trade date.
Dividend income, net of foreign taxes, is recorded on theex-dividend date, except certain dividends from foreign securities which are recorded as soon as the information is available to the Funds. Interest income, net of foreign taxes, is earned from settlement date, recorded on the accrual basis, and adjusted, if necessary, for accretion of discounts and amortization of premiums. Realized gains (losses) from securities sold are determined based on specific lot identification.
Currency Translation
All assets and liabilities initially expressed in foreign currency values are converted into U.S. dollar values at the mean of the bid and ask prices of such currencies against U.S. dollars as last quoted by a recognized dealer. Income, expenses, and purchases and sales of investments are translated into U.S. dollars at the rate of the exchange prevailing on the respective dates of such transactions. The effect of changes in foreign currency exchange rates on investments is separately identified from the fluctuations arising from changes in market values of securities held and is reported with all other foreign currency gains and losses on the Funds’ Statements of Operations.
Distributions to Shareholders
The Funds distribute most or all of its net earning and realized gains, if any, each taxable year in the form of dividends from net investment income and distributions of realized net capital gains and net gains from foreign currency translations on an annual basis. The Funds do not have a fixed dividend rate and do not guarantee that it will pay any distributions in any particular period. Dividends to shareholders are determined in accordance with federal income tax regulations, which may differ in amount and character from net investment income and realized gains recognized for purposes of U.S. GAAP. To the extent necessary to fully distribute capital gains, the Funds may designate earnings and profits distributed to shareholders on the redemption of shares.
Commission Recapture
The Funds have established brokerage commission recapture arrangements with certain brokers or dealers. If the Funds’ investment advisor chooses to execute a transaction through a participating broker, the broker rebates a portion of the commission back to the Funds. Any collateral benefit received through participation in the commission recapture program is directed exclusively to the Funds. This amount is reported with the net realized gain (loss) in the Funds’ Statements of Operations, if applicable.
Allocation of Income, Trust Expenses, Gains, and Losses
Investment income, realized and unrealized gains and losses from investments of the Funds are allocated daily to each class of shares based upon the relative proportion of net assets of each class to the total net assets of the Funds. Expenses directly charged or attributable to the Funds will be paid from the assets of the Fund. Generally, expenses of the Trust will be allocated among and charged to the assets of the Funds on a basis that the Trust’s Board of Trustees (the “Board”) deems fair and equitable, which may be based on the relative net assets of the Funds or nature of the services performed and relative applicability to the Funds.
30
American Beacon FundsSM
Notes to Financial Statements
October 31, 2019
Use of Estimates
The preparation of financial statements in conformity with U.S. GAAP requires management to make estimates and assumptions that affect the amounts reported in the financial statements and accompanying notes. Actual results may differ from those estimated.
Other
Under the Trust’s organizational documents, its officers and trustees are indemnified against certain liabilities arising out of the performance of their duties to the Trust. In the normal course of business, the Trust enters into contracts that provide indemnification to the other party or parties against potential costs or liabilities. The Trust’s maximum exposure under these arrangements is dependent on claims that may be made in the future and, therefore, cannot be estimated. The Trust has had no prior claims or losses pursuant to any such agreement.
2. Transactions with Affiliates
Management and InvestmentSub-Advisory Agreements
Prior to the Reorganization, the Advisor of the Predecessor fund received an investment advisory fee calculated daily and payable monthly, at an annual rate of 1.00% on the first $1 billion of the average daily assets and 0.75% of the average daily net assets in excess of $1 billion of the Predecessor Fund.
The Funds and the Manager are parties to a Management Agreement that obligates the Manager to provide the Funds with investment advisory and administrative services. As compensation for performing the duties under the Management Agreement, the Manager will receive an annualized management fee based on a percentage of the Funds’ average daily net assets that is calculated and accrued daily according to the following schedules:
International Equity Fund
First $15 billion | 0.35 | % | ||
Next $15 billion | 0.325 | % | ||
Over $30 billion | 0.30 | % |
Tocqueville International Value Fund
First $5 billion | 0.35 | % | ||
Next $5 billion | 0.325 | % | ||
Next $10 billion | 0.30 | % | ||
Over $20 billion | 0.275 | % |
The Trust, on behalf of the American Beacon International Equity Fund, and the Manager have entered into Investment Advisory Agreements with Causeway Capital Management LLC; Lazard Asset Management LLC; and Templeton Investment Counsel, LLC(“Sub-Advisors”) pursuant to which the Fund has agreed to pay an annualizedsub-advisory fee that is calculated and accrued daily based on the Fund’s average daily net assets.
The Trust, on behalf of the American Beacon Tocqueville International Value Fund, and the Manager have entered into an Investment Advisory Agreement with Tocqueville Asset Management L.P.(“Sub-Advisor”) pursuant to which the Fund has agreed to pay an annualizedsub-advisory fee that is calculated and accrued daily according to the following schedule:
First $1 billion | 0.40 | % | ||
Next $1 billion | 0.35 | % | ||
Over $2 billion | 0.325 | % |
31
American Beacon FundsSM
Notes to Financial Statements
October 31, 2019
The Management andSub-Advisory Fees paid by the Funds for the year ended October 31, 2019 were as follows:
International Equity Fund
| Effective Fee Rate | Amount of Fees Paid | |||||||||||
Management Fees | 0.35 | % | $ | 9,964,028 | ||||||||
Sub-Advisor Fees | 0.26 | % | 7,300,810 | |||||||||
|
|
|
| |||||||||
Total | 0.61 | % | $ | 17,264,838 | ||||||||
|
|
|
| |||||||||
Tocqueville International Value Fund
| Effective Fee Rate | Amount of Fees Paid* | |||||||||||
Management Fees | 0.35 | % | $ | 2,099,452 | ||||||||
Sub-Advisor Fees | 0.40 | % | 2,377,589 | |||||||||
|
|
|
| |||||||||
Total | 0.75 | % | $ | 4,477,041 | ||||||||
|
|
|
| |||||||||
| * | This includes fees paid since the reorganization on January 18, 2019. |
As compensation for services provided by the Manager in connection with securities lending activities conducted by the Funds, the lending Fund pays to the Manager, with respect to cash collateral posted by borrowers, a fee of 10% of the net monthly interest income (the gross interest income earned by the investment of cash collateral, less the amount paid to borrowers and related expenses) from such activities and, with respect to loan fees paid by borrowers, a fee up to 10% of such loan fees. These fees are included in “Income derived from securities lending” and “Management and investment advisory fees” on the Statements of Operations. During the year ended October 31, 2019, the Manager received securities lending fees of $100,599 and $19,356 for the securities lending activities of the International Equity Fund and Tocqueville International Value Fund, respectively.
Administration Services Agreement
Prior to the Reorganization, the Predecessor Fund paid the Advisor, pursuant to an Administrative Services Agreement, a fee computed and paid monthly at an annual rate of 0.15% on the first $400 million of the average daily net assets, 0.13% on the next $600 million of the average daily net assets; and 0.12% on all the average daily net assets over $1 billion.
Distribution Plans
Prior to the Reorganization, the Predecessor Shares incurred $528,972 of Distribution Fees. Since the Reorganization, the Shares were redesignated to the Investor Class and Distribution Fees are no longer applicable.
The Funds, except for the Advisor, A, and C Classes of the Funds, have adopted a “defensive” Distribution Plan (the “Plan”) in accordance with Rule12b-1 under the Act, pursuant to which no separate fees may be charged to the Funds for distribution purposes. However, the Plan authorizes the management fee received by the Manager and the investment advisors hired by the Manager to be used for distribution purposes. Under this Plan, the Funds do not intend to compensate the Manager or any other party, either directly or indirectly, for the distribution of Fund shares.
Separate Distribution Plans (the “Distribution Plans”) have been adopted pursuant to Rule12b-1 under the Act for the Advisor, A, and C Classes of the Funds. Under the Distribution Plans, as compensation for distribution and shareholder servicing assistance, the Manager receives an annual fee of 0.25% of the average daily net assets of the Advisor and A Classes and 1.00% of the average daily net assets of the C Class. The fee will be payable without regard to whether the amount of the fee is more or less than the actual expenses incurred in a particular month by the Manager for distribution assistance.
32
American Beacon FundsSM
Notes to Financial Statements
October 31, 2019
Service Plans
The Manager and the Trust entered into Service Plans that obligate the Manager to oversee additional shareholder servicing of the Investor, Advisor, A, and C Classes of the Funds. As compensation for performing the duties required under the Service Plans, the Manager receives an annualized fee up to 0.25% of the average daily net assets of the A and C Classes, up to 0.25% of the average daily net assets of the Advisor Class, and up to 0.375% of the average daily net assets of the Investor Class of the Funds.
Sub-Transfer Agent Fees
The Manager has entered into agreements, which include servicing agreements, with financial intermediaries that provide recordkeeping, processing, shareholder communications and other services to customers of the intermediaries that hold positions in the Institutional and Y Classes of the Funds and has agreed to compensate the intermediaries for providing these services. Intermediaries transact with the Funds primarily through the use of omnibus accounts on behalf of their customers who hold positions in the Funds. Certain services would have been provided by the Funds’ transfer agent and other service providers if the shareholders’ accounts were maintained directly by the Funds’ transfer agent. Accordingly, the Funds, pursuant to Board approval, have agreed to reimburse the Manager for certainnon-distribution shareholder services provided by financial intermediaries for the Institutional and Y Classes. The reimbursement amounts(sub-transfer agent fees) paid to the Manager are subject to a fee limit of up to 0.10% of an intermediary’s average net assets in the Institutional and Y Classes on an annual basis. During the year ended October 31, 2019, thesub-transfer agent fees, as reflected in “Transfer agent fees” on the Statements of Operations, were as follows:
Fund | Sub-Transfer Agent Fees | |||
International Equity | $ | 1,371,105 | ||
Tocqueville International Value | 89,921 | |||
As of October 31, 2019, the Funds owed the Manager the following reimbursement ofsub-transfer agent fees, as reflected in “Transfer agent fees payable” on the Statements of Assets and Liabilities:
Fund | Reimbursement Sub-Transfer Agent Fees | |||
International Equity | $ | 128,636 | ||
As of October 31, 2019, the Funds owed the Manager the following reimbursement ofsub-transfer agent fees, as reflected in “Transfer agent fees payable” on the Statements of Assets and Liabilities:
Fund | Reimbursement Sub-Transfer Agent Fees* | |||
Tocqueville International Value | $ | 14,584 | ||
| * | This balance is presented as a contra liability as of October 31, 2019. |
Investments in Affiliated Funds
The Funds may invest in the American Beacon U.S. Government Money Market Select Fund (the “USG Select Fund”). Cash collateral received by the Funds in connection with securities lending may also be invested in the USG Select Fund. The Funds and the USG Select Fund have the same investment advisor and therefore, are considered to be affiliated. The Manager serves as investment advisor to the USG Select Fund and receives management fees and administrative fees totaling 0.10% of the average daily net assets of the USG Select Fund. During the year ended October 31, 2019, the Manager earned fees on the Funds’ direct investments and securities lending collateral investments in the USG Select Fund as shown below:
33
American Beacon FundsSM
Notes to Financial Statements
October 31, 2019
Fund | Direct Investments in USG Select Fund | Securities Lending Collateral Investments in USG Select Fund | Total | |||||||||
International Equity | $ | 91,589 | $ | 37,256 | $ | 128,845 | ||||||
Tocqueville International Value | 30,671 | 6,239 | 36,910 | |||||||||
Interfund Credit Facility
Pursuant to an exemptive order issued by the SEC, the Funds, along with other registered investment companies having management contracts with the Manager, may participate in a credit facility whereby each fund, under certain conditions, is permitted to lend money directly to and borrow directly from other participating funds for temporary purposes. The interfund credit facility is advantageous to the Funds because it provides added liquidity and eliminates the need to maintain higher cash balances to meet redemptions. This situation could arise when shareholder redemptions exceed anticipated volumes and certain funds have insufficient cash on hand to satisfy such redemptions or when sales of securities do not settle as expected, resulting in a cash shortfall for a fund. When a fund liquidates portfolio securities to meet redemption requests, they often do not receive payment in settlement for up to two days (or longer for certain foreign transactions). Redemption requests normally are satisfied on the next business day. The credit facility provides a source of immediate, short-term liquidity pending settlement of the sale of portfolio securities. The credit facility is administered by a credit facility team consisting of professionals from the Manager’s asset management, compliance, and accounting areas who report the activities of the credit facility to the Board. During the year ended October 31, 2019, the Funds did not utilize the credit facility.
Expense Reimbursement Plan
The Manager contractually agreed to reduce fees and/or reimburse expenses for the R6 Class of the International Equity Fund and the Institutional and Y Classes of the Tocqueville International Value Fund to the extent that total operating expenses exceed the Funds’ expense cap. During the year ended October 31, 2019, the Manager waived and/or reimbursed expenses as follows:
Fund | Class | Expense Cap | Reimbursed Expenses | Expenses Ineligible for Recoupment | (Recouped) Expenses | Expiration of Reimbursed Expenses | ||||||||||||||||
| 11/1/2018 - 10/31/2019 | ||||||||||||||||||||||
International Equity | R6 | 0.66 | % | $ | 43,265 | $ | – | $ | – | 2021 - 2022 | ||||||||||||
Tocqueville International Value | Institutional(1) | 0.89 | % | 8,968 | – | – | 2021 - 2022 | |||||||||||||||
Tocqueville International Value | Y(1) | 0.99 | % | – | – | – | 2021 - 2022 | |||||||||||||||
Tocqueville International Value | Investor | 1.25 | % | 684,461 | 684,461 | – | 2021 - 2022 | |||||||||||||||
| (1) | Class commenced operations January 22, 2019. |
Of these amounts, $10,693 was disclosed as a receivable to the Manager for the International Equity Fund and $49,861 was disclosed as a payable to the Manager for the Tocqueville International Value Fund on the Statements of Assets and Liabilities at October 31, 2019.
The Funds have adopted an Expense Reimbursement Plan whereby the Manager may seek repayment of such fee reductions and expense reimbursements. Under the policy, the Manager can be reimbursed by the Funds for any contractual or voluntary fee reductions or expense reimbursements if reimbursement to the Manager (a) occurs within three years after the date of the Manager’s waiver/reimbursement and (b) does not cause the Funds’ annual operating expenses to exceed the lesser of the contractual percentage limit in effect at the time of the waiver/reimbursement or time of recoupment. The reimbursed expenses listed above will expire in 2021-2022. The Funds
34
American Beacon FundsSM
Notes to Financial Statements
October 31, 2019
did not record a liability for potential reimbursements due to the current assessment that reimbursements are unlikely. The carryover of excess expenses potentially reimbursable to the Manager are as follows:
Fund | Recouped Expenses | Excess Expense Carryover | Expired Expense Carryover | Expiration of Reimbursed Expenses | ||||||||||||
International Equity | $ | – | $ | 3,001 | $ | – | 2019 - 2020 | |||||||||
International Equity | – | 8,383 | – | 2020 - 2021 | ||||||||||||
Sales Commissions
The Funds’ Distributor, Resolute Investment Distributors, Inc. (“RID” or “Distributor”), may receive a portion of Class A sales charges from broker dealers and it may be used to offset distribution related expenses. During the year ended October 31, 2019, RID collected $1,371 for International Equity Fund from the sale of Class A Shares. The Tocqueville International Value Fund does not offer Class A Shares.
A CDSC of 0.50% will be deducted with respect to Class A Shares on certain purchases of $1,000,000 or more that are redeemed in whole or part within 18 months of purchase, unless waived as discussed in the Funds’ Prospectus. Any applicable CDSC will be 0.50% of the lesser of the original purchase price or the value of the redemption of the Class A Shares redeemed. During the year ended October 31, 2019, there were no CDSC fees collected for Class A Shares of the International Equity Fund.
A CDSC of 1.00% will be deducted with respect to Class C shares of the International Equity Fund redeemed within 12 months of purchase, unless waived as discussed in the Funds’ Prospectus. Any applicable CDSC will be 1.00% of the lesser of the original purchase price or the value of the redemption of the Class C Shares redeemed. During the year ended October 31, 2019, CDSC fees of $254 were collected for the Class C Shares of International Equity Fund. The Tocqueville International Value Fund does not offer Class C Shares.
Trustee Fees and Expenses
As compensation for their service to the Trusts, each Trustee receives an annual retainer of $120,000, plus $10,000 for each Board meeting attended in person or via teleconference, $2,500 for attendance by Committee members at meetings of the Audit Committee and the Investment Committee, and $1,500 for attendance by Committee members at meetings of the Nominating and Governance Committee, plus reimbursement of reasonable expenses incurred in attending Board meetings, Committee meetings, and relevant educational seminars. The Trustees also may be compensated for attendance at special Board and/or Committee meetings from time to time. The Board Chair receives an additional annual retainer of $50,000 as well as a $2,500 fee each quarter for attendance at the committee meetings. The Chairpersons of the Audit Committee and the Investment Committee each receive an additional annual retainer of $25,000 and the Chairman of the Nominating and Governance Committee receives an additional annual retainer of $10,000. These expenses are allocated on a prorated basis to each fund of the Trusts according to its respective net assets.
3. Security Valuation and Fair Value Measurements
The price of the Fund’s shares is based on its net asset value (“NAV”) per share. The Fund’s NAV is computed by adding total assets, subtracting all the Fund’s liabilities, and dividing the result by the total number of shares outstanding.
The NAV of each class of the Fund’s shares is determined based on a pro rata allocation of the Fund’s investment income, expenses and total capital gains and losses. The Fund’s NAV per share is determined each business day as of the regular close of trading on the New York Stock Exchange (“NYSE” or “Exchange”), which is typically 4:00 p.m. Eastern Time (“ET”). However, if trading on the NYSE closes at a time other than 4:00 p.m. ET, the Fund’s NAV per share typically would still be determined as of the regular close of trading on the NYSE. The Fund does not price its shares on days that the NYSE is closed. Foreign exchanges may permit trading in foreign
35
American Beacon FundsSM
Notes to Financial Statements
October 31, 2019
securities on days when the Fund is not open for business, which may result in the value of the Fund’s portfolio investments being affected at a time when you are unable to buy or sell shares.
Equity securities, including shares ofclosed-end funds and exchange-traded funds (“ETFs”), are valued at the last sale price or official closing price taken from the primary exchange in which each security trades. Investments in other mutual funds are valued at the closing NAV per share on the day of valuation. Debt securities are valued at bid quotes from broker/dealers or evaluated bid prices from pricing services, who may consider a number of inputs and factors, such as prices of comparable securities, yield curves, spreads, credit ratings, coupon rates, maturity, default rates, and underlying collateral. Futures are valued based on their daily settlement prices. Exchange-traded andover-the-counter (“OTC”) options are valued at the last sale price. Options with no last sale for the day are priced at mid quote. Swaps are valued at evaluated mid prices from pricing services.
The valuation of securities traded on foreign markets and certain fixed-income securities will generally be based on prices determined as of the earlier closing time of the markets on which they primarily trade unless a significant event has occurred. When the Fund holds securities or other assets that are denominated in a foreign currency, the Fund will normally use the currency exchange rates as of 4:00 p.m. ET.
Securities may be valued at fair value, as determined in good faith and pursuant to procedures approved by the Board, under certain limited circumstances. For example, fair value pricing will be used when market quotations are not readily available or reliable, as determined by the Manager, such as when (i) trading for a security is restricted or stopped; (ii) a security’s trading market is closed (other than customary closings); or (iii) a security has beende-listed from a national exchange. A security with limited market liquidity may require fair value pricing if the Manager determines that the available price does not reflect the security’s true market value. In addition, if a significant event that the Manager determines to affect the value of one or more securities held by the Fund occurs after the close of a related exchange but before the determination of the Fund’s NAV, fair value pricing may be used on the affected security or securities. Securities of small-capitalization companies are also more likely to require a fair value determination using these procedures because they are more thinly traded and less liquid than the securities of larger-capitalization companies. The Fund may fair value securities as a result of significant events occurring after the close of the foreign markets in which the Fund invests as described below. In addition, the Fund may invest in illiquid securities requiring these procedures.
The Fund may use fair value pricing for securities primarily traded innon-U.S. markets because most foreign markets close well before the Fund’s pricing time of 4:00 p.m. ET. The earlier close of these foreign markets gives rise to the possibility that significant events, including broad market moves, may have occurred in the interim and may materially affect the value of those securities. If the Manager determines that the last quoted prices ofnon-U.S. securities will, in its judgment, materially affect the value of some or all its portfolio securities, the Manager can adjust the previous closing prices to reflect what it believes to be the fair value of the securities as of the close of the Exchange. In deciding whether it is necessary to adjust closing prices to reflect fair value, the Manager reviews a variety of factors, including developments in foreign markets, the performance of U.S. securities markets, and the performance of instruments trading in U.S. markets that represent foreign securities and baskets of foreign securities. These securities are fair valued using a pricing service, using methods approved by the Board, that considers the correlation of the trading patterns of the foreign security to intraday trading in the U.S. markets, based on indices of domestic securities and other appropriate indicators such as prices of relevant American Depositary Receipts (“ADRs”) and futures contracts. The Valuation Committee, established by the Board, may also fair value securities in other situations, such as when a particular foreign market is closed but the Fund is open. The Fund uses outside pricing services to provide closing prices and information to evaluate and/or adjust those prices. As a means of evaluating its security valuation process, the Valuation Committee routinely compares closing prices, the next day’s opening prices in the same markets and adjusted prices.
Attempts to determine the fair value of securities introduce an element of subjectivity to the pricing of securities. As a result, the price of a security determined through fair valuation techniques may differ from the price quoted or published by other sources and may not accurately reflect the market value of the security when
36
American Beacon FundsSM
Notes to Financial Statements
October 31, 2019
trading resumes. If a reliable market quotation becomes available for a security formerly valued through fair valuation techniques, the Manager compares the new market quotation to the fair value price to evaluate the effectiveness of the Fund’s fair valuation procedures. If any significant discrepancies are found, the Manager may adjust the Fund’s fair valuation procedures.
Valuation Inputs
Various inputs may be used to determine the fair value of the Funds’ investments. These inputs are summarized in three broad levels for financial statement purposes. The inputs or methodologies used to value securities are not necessarily an indication of the risk associated with investing in those securities.
| Level 1 | - | Quoted prices in active markets for identical securities. | ||
| Level 2 | - | Prices determined using other significant observable inputs. These may include quoted prices for similar securities, interest rates, prepayment speeds, credit risk, and others. | ||
| Level 3 | - | Prices determined using other significant unobservable inputs. Unobservable inputs reflect the Fund’s own assumptions about the factors market participants would use in pricing an investment. | ||
Level 1 and Level 2 trading assets and trading liabilities, at fair value
Common stocks, preferred securities, and financial derivative instruments, such as futures contracts that are traded on a national securities exchange, are stated at the last reported sale or settlement price on the day of valuation. To the extent these securities are actively traded and valuation adjustments are not applied, they are categorized as Level 1 of the fair value hierarchy. Preferred securities and other equities traded on inactive markets or valued by reference to similar instruments are generally categorized as Level 2 of the fair value hierarchy. Valuation adjustments may be applied to certain securities that are solely traded on a foreign exchange to account for the market movement between the close of the foreign market and the close of the Exchange. These securities are valued using pricing service providers that consider the correlation of the trading patterns of the foreign security to the intraday trading in the U.S. markets for investments. Securities using these valuation adjustments are categorized as Level 2 of the fair value hierarchy.
Investments in registeredopen-end investment management companies will be valued based upon the NAVs of such investments and are categorized as Level 1 of the fair value hierarchy.
OTC financial derivative instruments, such as forward foreign currency contracts derive their value from underlying asset prices, indices, reference rates, and other inputs or a combination of these factors. These contracts are normally valued on the basis of broker dealer quotations or pricing service providers. Depending on the product and the terms of the transaction, the fair value of the financial derivative contracts can be estimated by a pricing service provider using a series of techniques, including simulation pricing models. The pricing models use inputs that are observed from actively quoted markets such as issuer details, indices, spreads, interest rates, curves, dividends, and exchange rates. Financial derivatives that use similar valuation techniques and inputs as described above are categorized as Level 2 of the fair value hierarchy.
Level 3 trading assets and trading liabilities, at fair value
The valuation techniques and significant inputs used in determining the fair values of financial instruments classified as Level 3 of the fair value hierarchy are as follows.
Securities and other assets for which market quotes are not readily available are valued at fair value as determined in good faith by the Board or persons acting at their direction and may be categorized as Level 3 of the fair value hierarchy.
37
American Beacon FundsSM
Notes to Financial Statements
October 31, 2019
Market quotes are considered not readily available in circumstances where there is an absence of current or reliable market-based data (e.g., trade information or broker quotes), including where events occur after the close of the relevant market, but prior to the Exchange close, that materially affect the values of the Fund’s securities or assets. In addition, market quotes are considered not readily available when, due to extraordinary circumstances, the exchanges or markets on which the securities trade, do not open for trading for the entire day and no other market prices are available. The Board has delegated to the Manager the responsibility for monitoring significant events that may materially affect the fair values of a Fund’s securities or assets and for determining whether the value of the applicable securities or assets should bere-evaluated in light of such significant events.
The Board has adopted methods for valuing securities and other assets in circumstances where market quotes are not readily available, and has delegated the responsibility for applying the valuation methods to the Manager. For instances in which daily market quotes are not readily available, investments may be valued pursuant to guidelines established by the Board. In the event that the security or asset cannot be valued, pursuant to one of the valuation methods established by the Board, the fair value of the security or asset will be determined in good faith by the Valuation Committee, generally based upon recommendations provided by the Manager.
When a Fund uses fair valuation methods applied by the Manager that use significant unobservable inputs to determine its NAV, the securities priced using this methodology are categorized as Level 3 of the fair value hierarchy. These methods may require subjective determinations about the value of a security. While the Trust’s policy is intended to result in a calculation of the Fund’s NAV that fairly reflects security values as of the time of pricing, the Trust cannot guarantee that values determined by the Board or persons acting at their direction would accurately reflect the price that a Fund could obtain for a security if it were to dispose of that security as of the time of pricing (for instance, in a forced or distressed sale). The prices used by a Fund may differ from the value that would be realized if the securities were sold.
4. Securities and Other Investments
American Depositary Receipts
ADRs are depositary receipts for foreign issuers in registered form traded in U.S. securities markets. Depositary receipts may not be denominated in the same currency as the securities into which they may be converted. Investing in depositary receipts entails substantially the same risks as direct investment in foreign securities. There is generally less publicly available information about foreign companies and there may be less governmental regulation and supervision of foreign stock exchanges, brokers, and listed companies. In addition, such companies may use different accounting and financial standards (and certain currencies may become unavailable for transfer from a foreign currency), resulting in the Funds’ possible inability to convert immediately into U.S. currency proceeds realized upon the sale of portfolio securities of the affected foreign companies. In addition, the Funds may invest in unsponsored depositary receipts, the issuers of which are not obligated to disclose material information about the underlying securities to investors in the United States. Ownership of unsponsored depositary receipts may not entitle the Funds to the same benefits and rights as ownership of a sponsored depositary receipt or the underlying security.
Common Stock
Common stock generally takes the form of shares in a corporation which represent an ownership interest. It ranks below preferred stock and debt securities in claims for dividends and for assets of the company in a liquidation or bankruptcy. The value of a company’s common stock may fall as a result of factors directly relating to that company, such as decisions made by its management or decreased demand for the company’s products or services. A stock’s value may also decline because of factors affecting not just the company, but also companies in the same industry or sector. The price of a company’s stock may also be affected by changes in financial markets that are relatively unrelated to the company, such as changes in interest rates, currency exchange rates or industry regulation. Companies that elect to pay dividends on their common stock generally only do so after they invest in
38
American Beacon FundsSM
Notes to Financial Statements
October 31, 2019
their own business and make required payments to bondholders and on other debt and preferred stock. Therefore, the value of a company’s common stock will usually be more volatile than its bonds, other debt and preferred stock. Common stock may be exchange-traded or OTC. OTC stock may be less liquid than exchange-traded stock.
Foreign Securities
The Funds may invest in U.S. dollar-denominated andnon-U.S. dollar denominated equity and debt securities of foreign issuers and foreign branches of U.S. banks, including negotiable certificates of deposit (“CDs”), bankers’ acceptances, and commercial paper. Foreign issuers are issuers organized and doing business principally outside the United States and include corporations, banks,non-U.S. governments, and quasi-governmental organizations. While investments in foreign securities may be intended to reduce risk by providing further diversification, such investments involve sovereign and other risks, in addition to the credit and market risks normally associated with domestic securities. These additional risks include the possibility of adverse political and economic developments (including political or social instability, nationalization, expropriation, or confiscatory taxation); the potentially adverse effects of unavailability of public information regarding issuers, different governmental supervision and regulation of financial markets, reduced liquidity of certain financial markets, and the lack of uniform accounting, auditing, and financial reporting standards or the application of standards that are different or less stringent than those applied in the United States; different laws and customs governing securities tracking; and possibly limited access to the courts to enforce the Funds’ rights as an investor.
Illiquid and Restricted Securities
Generally, an illiquid asset is an asset that the Funds reasonably expect cannot be sold or disposed of in current market conditions in seven calendar days or less without the sale or disposition significantly changing the market value of the investment. Historically, illiquid securities have included securities that have not been registered under the Securities Act, securities that are otherwise not readily marketable, and repurchase agreements having a remaining maturity of longer than seven calendar days. Securities that have not been registered under the Securities Act are referred to as private placements or restricted securities and are purchased directly from the issuer or in the secondary market. These securities may be sold only in a privately negotiated transaction or pursuant to an exemption from registration. A large institutional market exists for certain securities that are not registered under the Securities Act, including repurchase agreements, commercial paper, foreign securities, municipal securities and corporate bonds and notes. Institutional investors depend on an efficient institutional market in which the unregistered security can be readily resold or on an issuer’s ability to honor a demand for repayment. However, the fact that there are contractual or legal restrictions on resale of such investments to the general public or to certain institutions may not be indicative of their liquidity.
Limitations on resale may have an adverse effect on the marketability of portfolio securities, and the Fund might be unable to dispose of restricted or other illiquid securities promptly or at reasonable prices and might thereby experience difficulty satisfying redemptions within seven calendar days. In addition, the Fund may get only limited information about an issuer, so it may be less able to predict a loss. The Fund also might have to register such restricted securities in order to dispose of them resulting in additional expense and delay. Adverse market conditions could impede such a public offering of securities. In recognition of the increased size and liquidity of the institutional market for unregistered securities and the importance of institutional investors in the formation of capital, the SEC adopted Rule 144A under the Securities Act. Rule 144A is designed to facilitate efficient trading among institutional investors by permitting the sale of certain unregistered securities to qualified institutional buyers. To the extent privately placed securities held by the Fund qualify under Rule 144A and an institutional market develops for those securities, the Fund likely will be able to dispose of the securities without registering them under the Securities Act. To the extent that institutional buyers become, for a time, uninterested in purchasing these securities, investing in Rule 144A securities could increase the level of the Fund’s illiquidity. The Manager or thesub-advisor, as applicable, may determine that certain securities qualified for trading under Rule 144A are liquid. Regulation S under the Securities Act permits the sale abroad of securities that are not registered for sale in the United States and includes a provision for U.S. investors, such as the Fund, to purchase such unregistered securities if certain conditions are met.
39
American Beacon FundsSM
Notes to Financial Statements
October 31, 2019
Securities sold in private placement offerings made in reliance on the “private placement” exemption from registration afforded by Section 4(a)(2) of the Securities Act and resold to qualified institutional buyers under Rule 144A under the Securities Act (“Section 4(a)(2) securities”) are restricted as to disposition under the federal securities laws, and generally are sold to institutional investors, such as the Fund, that agree they are purchasing the securities for investment and not with an intention to distribute to the public. Any resale by the purchaser must be pursuant to an exempt transaction and may be accomplished in accordance with Rule 144A. Section 4(a)(2) securities normally are resold to other institutional investors through or with the assistance of the issuer or dealers that make a market in the Section 4(a)(2) securities, thus providing liquidity.
Restricted securities outstanding during the year ended October 31, 2019 are disclosed in the Notes to the Schedules of Investments.
Other Investment Company Securities and Other Exchange-Traded Products
The Funds may invest in shares of other investment companies, includingopen-end funds,closed-end funds, business development companies, ETFs, unit investment trusts, and other investment companies of the Trust. The Funds may invest in securities of an investment company advised by the Manager or asub-advisor. Investments in the securities of other investment companies may involve duplication of advisory fees and certain other expenses. By investing in another investment company, the Funds become a shareholder of that investment company. As a result, the Funds’ shareholders indirectly will bear the Funds’ proportionate share of the fees and expenses paid by shareholders of the other investment company, in addition to the fees and expenses the Funds’ shareholders directly bear in connection with the Funds’ own operations. These other fees and expenses are reflected as Acquired Fund Fees and Expenses and are included in the Fees and Expenses Table for the Funds in their Prospectus, if applicable. Investments in other investment companies may involve the payment of substantial premiums above the value of such issuer’s portfolio securities.
Preferred Stock
A preferred stock blends the characteristics of a bond and common stock. It can offer the higher yield of a bond and has priority over common stock in equity ownership, but does not have the seniority of a bond and its participation in the issuer’s growth may be limited. Preferred stock generally has preference over common stock in the receipt of dividends and in any residual assets after payment to creditors should the issuer be dissolved. Although the dividend is set at a fixed or variable rate, in some circumstances it can be changed or omitted by the issuer. Preferred stocks are subject to the risks associated with other types of equity securities, as well as additional risks, such as credit risk, interest rate risk, potentially greater volatility and risks related to deferral,non-cumulative dividends, subordination, liquidity, limited voting rights, and special redemption rights.
5. Financial Derivative Instruments
The Funds may utilize derivative instruments to gain market exposure on cash balances to hedge foreign currency exposure or reduce market exposure in anticipation of liquidity needs. When considering the Funds’ use of derivatives, it is important to note that the Funds do not use derivatives for the purpose of creating financial leverage.
Forward Foreign Currency Contracts
The Funds may enter into forward foreign currency contracts to hedge the exchange rate risk on investment transactions or to hedge the value of the Funds’ securities denominated in foreign currencies. Forward foreign currency contracts are valued at the forward exchange rate prevailing on the day of valuation. The Funds may also use currency contracts to increase exposure to a foreign currency or to shift exposure to foreign currency fluctuations from one country to another. The Funds bear the market risk that arises from changes in foreign exchange rates, and accordingly, the unrealized gain (loss) on these contracts is reflected in the accompanying financial statements. The Funds also bear the credit risk if the counterparty fails to perform under the contract.
40
American Beacon FundsSM
Notes to Financial Statements
October 31, 2019
During the year ended October 31, 2019, the International Equity Fund entered into forward foreign currency contracts primarily for hedging foreign currency fluctuations.
The Fund’s forward foreign currency contract notional dollar values fluctuate throughout the operating year as required to meet strategic requirements. The following table illustrates the average quarterly volume of forward foreign currency contracts. For the purpose of this disclosure, volume is measured by the amounts bought and sold in USD at each quarter end.
Average Forward Foreign Currency Notional Amounts | ||||||||
Fund | Purchased Contracts | Sold Contracts | ||||||
International Equity | $ | 102,661,725 | $ | 32,027,484 | ||||
Futures Contracts
Futures contracts are contracts to buy or sell a standard quantity of securities at a specified price on a future date. The Funds may enter into financial futures contracts as a method for keeping assets readily convertible to cash if needed to meet shareholder redemptions or for other needs while maintaining exposure to the stock or bond market, as applicable. The primary risks associated with the use of futures contracts are the possibility of illiquid markets or imperfect correlation between the values of the contracts and the underlying securities or that the counterparty will fail to perform its obligations.
Upon entering into a futures contract, the Funds are required to set aside or deposit with a broker an amount, termed the initial margin, which typically represents a portion of the face value of the futures contract. The Funds usually reflects this amount on the Schedules of Investments as a U.S. Treasury Bill held as collateral for futures contracts or as cash deposited with broker on the Statements of Assets and Liabilities. Payments to and from the broker, known as variation margin, are required to be made on a daily basis as the price of the futures contract fluctuates. Changes in initial settlement values are accounted for as unrealized appreciation (depreciation) until the contracts are terminated, at which time realized gains and losses are recognized. Futures contracts are valued at the most recent settlement price established each day by the exchange on which they are traded.
During the year ended October 31, 2019, the International Equity Fund entered into futures contracts primarily for return enhancement, hedging and exposing cash to markets.
The Fund’s average futures contracts outstanding fluctuate throughout the operating year as required to meet strategic requirements. The following table illustrates the average quarterly volume of futures contracts. For the purpose of this disclosure, volume is measured by contracts outstanding at each quarter end.
Average Futures Contracts Outstanding | ||||
Fund | Year Ended October 31, 2019 | |||
International Equity | 1,077 | |||
41
American Beacon FundsSM
Notes to Financial Statements
October 31, 2019
The following is a summary of the fair valuations of the Funds’ derivative instruments categorized by risk exposure(1):
International Equity Fund
| Fair values of financial instruments on the Statements of Assets and Liabilities as of October 31, 2019: |
| ||||||||||||||||||||||||||||||||||||||||||||||||||||||
| Derivatives not accounted for as hedging instruments | |||||||||||||||||||||||||||||||||||||||||||||||||||||||
Assets: | Credit contracts | Foreign exchange contracts | Commodity contracts | Interest rate contracts | Equity contracts | Total | |||||||||||||||||||||||||||||||||||||||||||||||||
| Receivable for variation margin from open futures contracts(2) | $ | – | $ | - | $ | – | $ | – | $ | 2,853,101 | $ | 2,853,101 | |||||||||||||||||||||||||||||||||||||||||||
| The effect of financial derivative instruments on the Statements of Operations as of October 31, 2019: |
| ||||||||||||||||||||||||||||||||||||||||||||||||||||||
| Derivatives not accounted for as hedging instruments | |||||||||||||||||||||||||||||||||||||||||||||||||||||||
Realized gain (loss) from derivatives | Credit contracts | Foreign exchange contracts | Commodity contracts | Interest rate contracts | Equity contracts | Total | |||||||||||||||||||||||||||||||||||||||||||||||||
| Forward foreign currency contracts | $ | – | $ | (4,704,460 | ) | $ | – | $ | – | $ | – | $ | (4,704,460 | ) | |||||||||||||||||||||||||||||||||||||||||
| Futures contracts | – | – | – | – | 4,633,028 | 4,633,028 | |||||||||||||||||||||||||||||||||||||||||||||||||
Net change in unrealized appreciation | Credit contracts | Foreign exchange contracts | Commodity contracts | Interest rate contracts | Equity contracts | Total | |||||||||||||||||||||||||||||||||||||||||||||||||
| Forward foreign currency contracts | $ | – | $ | 2,354,220 | $ | – | $ | – | $ | – | $ | 2,354,220 | |||||||||||||||||||||||||||||||||||||||||||
| Futures contracts | – | – | – | – | 5,582,029 | 5,582,029 | |||||||||||||||||||||||||||||||||||||||||||||||||
(1)See Note 3 in the Notes to Financial Statements for additional information.
(2)Includes cumulative appreciation (depreciation) of futures contracts as reported in the Fund’s Schedule of Investments footnotes. Only current day’s variation margin is reported within the Statements of Assets and Liabilities.
Master Agreements
Master Securities Forward Transaction Agreements (“Master Forward Agreements”) govern the considerations and factors surrounding the settlement of certain forward settling transactions, such as delayed delivery or sale-buyback financing transactions by and between a Fund and select counterparties. The Master Forward Agreements maintain provisions for, among other things, initiation and confirmation, payment and transfer, events of default, termination, and maintenance of collateral.
Offsetting Assets and Liabilities
The Funds are parties to enforceable master netting agreements between brokers and counterparties which provide for the right to offset under certain circumstances. The Funds employ multiple money managers and counterparties and have elected not to offset qualifying financial and derivative instruments on the Statements of Assets and Liabilities, as such all financial and derivative instruments are presented on a gross basis. The impacts of netting arrangements that provide the right to offset are detailed below. The net amount represents the net receivable or payable that would be due from or to the counterparty in the event of default. Exposure from borrowings and other financing agreements such as repurchase agreements can only be netted across transactions governed by the same Master Agreement with the same legal entity. All amounts reported below represent the balance as of the report date, October 31, 2019.
International Equity Fund
| Offsetting of Financial and Derivative Assets as of October 31, 2019: | ||||||||||||
| Assets | Liabilities | |||||||||||
| Futures Contracts(1) | $ | 2,853,101 | $ | - | ||||||||
|
|
|
| |||||||||
| Total derivative assets and liabilities in the Statement of Assets and Liabilities | $ | 2,853,101 | $ | - | ||||||||
|
|
|
| |||||||||
| Derivatives not subject to a Master Netting Agreement or similar agreement (“MNA”) | $ | (2,853,101 | ) | $ | - | |||||||
|
|
|
| |||||||||
42
American Beacon FundsSM
Notes to Financial Statements
October 31, 2019
| Remaining Contractual Maturity of the Agreements As of October 31, 2019 | ||||||||||||||||||||||||||||||||||||
| Overnight and Continuous | <30 days | Between 30 & 90 days | >90 days | Total | ||||||||||||||||||||||||||||||||
Securities Lending Transactions | ||||||||||||||||||||||||||||||||||||
Common Stocks | $ | 12,296,539 | $ | - | $ | - | $ | - | $ | 12,296,539 | ||||||||||||||||||||||||||
|
|
|
|
|
|
|
|
|
| |||||||||||||||||||||||||||
Total Borrowings | $ | 12,296,539 | $ | - | $ | - | $ | - | $ | 12,296,539 | ||||||||||||||||||||||||||
|
|
|
|
|
|
|
|
|
| |||||||||||||||||||||||||||
Gross amount of recognized liabilities for securities lending transactions |
| $ | 12,296,539 | |||||||||||||||||||||||||||||||||
|
| |||||||||||||||||||||||||||||||||||
Tocqueville International Value Fund
| Remaining Contractual Maturity of the Agreements As of October 31, 2019 | ||||||||||||||||||||||||||||||||||||
| Overnight and Continuous | <30 days | Between 30 & 90 days | >90 days | Total | ||||||||||||||||||||||||||||||||
Securities Lending Transactions | ||||||||||||||||||||||||||||||||||||
Common Stocks | $ | 9,185,400 | $ | - | $ | - | $ | - | $ | 9,185,400 | ||||||||||||||||||||||||||
|
|
|
|
|
|
|
|
|
| |||||||||||||||||||||||||||
Total Borrowings | $ | 9,185,400 | $ | - | $ | - | $ | - | $ | 9,185,400 | ||||||||||||||||||||||||||
|
|
|
|
|
|
|
|
|
| |||||||||||||||||||||||||||
Gross amount of recognized liabilities for securities lending transactions |
| $ | 9,185,400 | |||||||||||||||||||||||||||||||||
|
| |||||||||||||||||||||||||||||||||||
(1)Includes cumulative appreciation (depreciation) of futures contracts as reported in the Fund’s Schedule of Investments footnotes. Only current day’s variation margin is reported within the Statements of Assets and Liabilities.
6. Principal Risks
Investing in the Funds may involve certain risks including, but not limited to, those described below.
Counterparty Risk
The Funds are subject to the risk that a party or participant to a transaction, such as a broker or derivative counterparty, will be unwilling or unable to satisfy its obligation to make timely principal, interest or settlement payments or to otherwise honor its obligations to the Funds. As a result the Funds may obtain no recovery of its investment or may only obtain a limited recovery, and any recovery may be delayed. Not all derivative transactions require a counterparty to post collateral, which may expose the Funds to greater losses in the event of a default by a counterparty.
Some of the markets in which the Funds may effect derivative transactions are OTC or “interdealer” markets. The participants in such markets are typically not subject to credit evaluation and regulatory oversight to the same extent as are members of “exchange-based” markets. This exposes the Funds to the risk that a counterparty will not settle a transaction in accordance with its terms and conditions because of a credit or liquidity problem with the counterparty and the recent turbulence in the financial markets highlights the importance of being aware of counterparty risk resulting from OTC derivative transactions. The Funds are subject to the risk that a party or participant to a transaction, such as a broker or derivative counterparty, will be unwilling or unable to satisfy its obligation to make timely principal, interest or settlement payments or to otherwise honor its obligations to the Funds. As a result, the Funds may obtain no recovery of its investment or may only obtain a limited recovery, and any recovery may be delayed. Not all derivative transactions require a counterparty to post collateral, which may expose the Funds to greater losses in the event of a default by a counterparty.
Credit Risk
The Funds are subject to the risk that the issuer or guarantor of a debt security, or the counterparty to a derivatives contract or a loan, will fail to make timely payment of interest or principal or otherwise honor its obligations or default completely. A decline in the credit rating of an individual security held by the Funds may
43
American Beacon FundsSM
Notes to Financial Statements
October 31, 2019
have an adverse impact on its price and make it difficult for the Funds to sell it. Ratings represent a rating agency’s opinion regarding the quality of the security and are not a guarantee of quality. Rating agencies might not always change their credit rating on an issuer or security in a timely manner to reflect events that could affect the issuer’s ability to make timely payments on its obligations. Credit risk is typically greater for securities with ratings that are below investment grade. Since the Funds can invest significantly in high-yield investments considered speculative in nature, this risk may be substantial.
Currency Risk
The Funds may have exposure to foreign currencies by investing in securities denominated innon-U.S. currencies or in securities denominated innon-U.S. currencies, purchasing or selling forward currency exchange contracts innon-U.S. currencies,non-U.S. currency futures contracts, options onnon-U.S. currencies andnon-U.S. currency futures and swaps for cross-currency investments. Foreign currencies may decline in value relative to the U.S. dollar, or, in the case of hedging positions, the U.S. dollar may decline in value relative to the currency being hedged, and thereby affect a Funds’ investments in foreign(non-U.S.) currencies or in securities that trade in, and receive revenues in, or in derivatives that provide exposure to, foreign(non-U.S.) currencies. Currency exchange rates may fluctuate significantly over short periods of time for a number of reasons, including changes in interest rates, intervention (or the failure to intervene) by U.S. or foreign governments, central banks or supranational entities such as the International Monetary Fund, or by the imposition of currency controls or other political developments in the United States or abroad. As a result, the Funds’ investments in foreign currency denominated securities may reduce the returns of the Funds. Currency futures, forwards, options or swaps may not always work as intended, and in specific cases, the Funds may be worse off than if it had not used such instrument(s). There may not always be suitable hedging instruments available. Even where suitable hedging instruments are available, the Funds may choose to not hedge its currency risks.
Equity Investments Risk
Equity securities are subject to market risk. The Funds’ investments in equity securities may include common stocks, preferred stocks, securities convertible into or exchangeable for common stocks, REITs, depositary receipts, and U.S. dollar-denominated foreign stocks traded on U.S. exchanges. Such investments may expose the Funds to additional risk. The value of a company’s common stock may fall as a result of factors affecting the company, companies in the same industry or sector, or the financial markets overall. Common stock generally is subordinate to preferred stock upon the liquidation or bankruptcy of the issuing company. Preferred stocks and convertible securities are sensitive to movements in interest rates. Preferred stocks may be less liquid than common stocks and, unlike common stocks, participation in the growth of an issuer may be limited. Distributions on preferred stocks generally are payable at the discretion of an issuer and after required payments to bond holders. Convertible securities are subject to the risk that the credit standing of the issuer may have an effect on the convertible securities’ investment value. Investments in REITs are subject to the risks associated with investing in the real estate industry such as adverse developments affecting the real estate industry and real property values. Depositary receipts and U.S. dollar-denominated foreign stocks traded on U.S. exchanges are subject to certain of the risks associated with investing directly in foreign securities, including, but not limited to, currency fluctuations and political and financial instability in the home country of a particular depositary receipt or foreign stock.
Foreign Investing and Emerging Markets Risk
Non-U.S. investments carry potential risks not associated with U.S. investments. Such risks include, but are not limited to: (1) currency exchange rate fluctuations, (2) political and financial instability, (3) less liquidity, (4) lack of uniform accounting, auditing and financial reporting standards, (5) increased price volatility, (6) less government regulation and supervision of foreign stock exchanges, brokers and listed companies, and (7) delays in transaction settlement in some foreign markets. To the extent the Funds invest a significant portion of its assets in securities of a single country or region, it is more likely to be affected by events or conditions of that country or region. In addition, the economies and political environments of emerging market countries tend to be more
44
American Beacon FundsSM
Notes to Financial Statements
October 31, 2019
unstable than those of developed countries, resulting in more volatile rates of return than the developed markets and substantially greater risk to investors. There may be very limited oversight of certain foreign banks or securities depositories that hold foreign securities and currency and the laws of certain countries may limit the ability to recover such assets if a foreign bank or depository or their agents goes bankrupt. When investing in emerging markets, the risks of investing in foreign securities are heightened. Emerging markets have unique risks that are greater than, or in addition to, investing in developed markets because emerging markets are generally smaller, less developed, less liquid and more volatile than the securities markets of the U.S. and other developed markets. There are also risks of: greater political uncertainties; an economy’s dependence on revenues from particular commodities or on international aid or development assistance; currency transfer restrictions; a limited number of potential buyers for such securities, resulting in increased volatility and limited liquidity for emerging market securities; trading suspensions; and delays and disruptions in securities settlement procedures. In addition, there may be less information available to make investment decisions and more volatile rates of return.
Forward Foreign Currency Contracts Risk
Forward foreign currency contracts, includingnon-deliverable forwards, are derivative instruments pursuant to a contract with a counterparty to pay a fixed price for an agreed amount of securities or other underlying assets at an agreed date or to buy or sell a specific currency at a future date at a price set at the time of the contract. The use of forward foreign currency contracts may expose the Funds to additional risks that it would not be subject to if it invested directly in the securities or currencies underlying the forward foreign currency contract.
Futures Contracts Risk
Futures contracts are derivative instruments where one party pays a fixed price for an agreed amount of securities or other underlying assets at an agreed date. The use of such derivative instruments may expose the Funds to additional risks that they would not be subject to if they invested directly in the securities underlying those derivatives. Futures contracts may experience potentially dramatic price changes (losses) and imperfect correlation between the price of the contract and the underlying security or index, which will increase the volatility of the Funds and may involve a small investment of cash (the amount of initial and variation margin) relative to the magnitude of the risk assumed (the potential increase or decrease in the price of the futures contract).
Market Risk
Conditions in the U.S. and many foreign economies have resulted, and may continue to result, in certain instruments experiencing unusual liquidity issues, increased price volatility and, in some cases, credit downgrades and increased likelihood of default. These events have reduced the willingness and ability of some lenders to extend credit, and have made it more difficult for some borrowers to obtain financing on attractive terms, if at all. In some cases, traditional market participants have been less willing to make a market in some types of debt instruments, which has affected the liquidity of those instruments. During times of market turmoil, investors tend to look to the safety of securities issued or backed by the U.S. Treasury, causing the prices of these securities to rise and the yields to decline. Reduced liquidity in fixed income and credit markets may negatively affect many issuers worldwide. In addition, global economies and financial markets are becoming increasingly interconnected, which increases the possibilities that conditions in one country or region might adversely impact issuers in a different country or region. A rise in protectionist trade policies, and the possibility of changes to some international trade agreements, could affect the economies of many nations in ways that cannot necessarily be foreseen at the present time.
In response to the financial crisis, the U.S. and other governments and the Federal Reserve and certain foreign central banks have taken steps to support financial markets. In some countries where economic conditions are recovering, they are nevertheless perceived as still fragile. Withdrawal of government support, failure of efforts in response to the crisis, or investor perception that such efforts are not succeeding, could adversely impact
45
American Beacon FundsSM
Notes to Financial Statements
October 31, 2019
the value and liquidity of certain securities. The severity or duration of adverse economic conditions may also be affected by policy changes made by governments or quasi-governmental organizations, including changes in tax laws. The impact of new financial regulation legislation on the markets and the practical implications for market participants may not be fully known for some time. Regulatory changes are causing some financial services companies to exit long-standing lines of business, resulting in dislocations for other market participants. In addition, political and governmental events within the U.S. and abroad, such as the U.S. government’s inability at times to agree on a long-term budget and deficit reduction plan, the threat of a federal government shutdown and threats not to increase the federal government’s debt limit, may affect investor and consumer confidence and may adversely impact financial markets and the broader economy, perhaps suddenly and to a significant degree. The U.S. government has recently reduced the federal corporate income tax rates, and future legislative, regulatory and policy changes may result in more restrictions on international trade, less stringent prudential regulation of certain players in the financial markets, and significant new investments in infrastructure and national defense. Markets may react strongly to expectations about the changes in these policies, which could increase volatility, especially if the markets’ expectations for changes in government policies are not borne out.
Changes in market conditions will not have the same impact on all types of securities. Interest rates have been unusually low in recent years in the U.S. and abroad. Because there is little precedent for this situation, it is difficult to predict the impact of a significant rate increase on various markets. For example, because investors may buy securities or other investments with borrowed money, a significant increase in interest rates may cause a decline in the markets for those investments. Regulators have expressed concern that rate increases may cause investors to sell fixed income securities faster than the market can absorb them, contributing to price volatility. In addition, there is a risk that the prices of goods and services in the U.S. and many foreign economies may decline over time, known as deflation (the opposite of inflation). Deflation may have an adverse effect on stock prices and creditworthiness and may make defaults on debt more likely. If a country’s economy slips into a deflationary pattern, it could last for a prolonged period and may be difficult to reverse.
The precise timing and the resulting impact of the United Kingdom’s departure from the European Union (the “EU”), commonly referred to as “Brexit,” are not yet known. The effect on the United Kingdom’s economy will likely depend on the nature of trade relations with the EU and other major economies following its exit, which are matters to be negotiated. The outcomes may cause increased volatility and have a significant adverse impact on world financial markets, other international trade agreements, and the United Kingdom and European economies, as well as the broader global economy for some time, which could significantly adversely affect the value of the Fund’s investments in the United Kingdom and Europe.
Market Timing Risk
Because the Funds invest in foreign securities, it is particularly subject to the risk of market timing activities. Frequent trading by Fund shareholders poses risks to other shareholders in the Funds, including (i) the dilution of the Funds’ NAV, (ii) an increase in the Funds’ expenses, and (iii) interference with the portfolio manager’s ability to execute efficient investment strategies. Because of specific securities in which the Funds may invest, it could be subject to the risk of market timing activities by shareholders. Some examples of these types of securities are high-yield and foreign securities. The limited trading activity of some high-yield securities may result in market prices that do not reflect the true market value of these securities. The Funds generally prices foreign securities using their closing prices from the foreign markets in which they trade, typically prior to the Funds’ calculation of its NAV. These prices may be affected by events that occur after the close of a foreign market but before the Funds price its shares. In such instances, the Funds may fair value high yield and foreign securities. However, some investors may engage in frequent short-term trading in the Funds to take advantage of any price differentials that may be reflected in the NAV of the Funds’ shares. While the Manager monitors trading in the Funds, there is no guarantee that it can detect all market timing activities.
46
American Beacon FundsSM
Notes to Financial Statements
October 31, 2019
MultipleSub-Advisor Risk
The Manager may allocate the Funds’ assets among multiplesub-advisors, each of which is responsible for investing its allocated portion of the Funds’ assets. To a significant extent, the Funds’ performance will depend on the success of the Manager in allocating the Funds’ assets tosub-advisors and its selection and oversight of thesub-advisors. Because eachsub-advisor manages its allocated portion of the Funds independently from anothersub-advisor, the same security may be held in different portions of the Funds, or may be acquired for one portion of the Funds at a time when asub-advisor to another portion deems it appropriate to dispose of the security from that other portion, resulting in higher expenses without accomplishing any net result in the Funds’ holdings. Similarly, under some market conditions, onesub-advisor may believe that temporary, defensive investments in short-term instruments or cash are appropriate when anothersub-advisor believes continued exposure to the equity or debt markets is appropriate for its allocated portion of the Funds. Because eachsub-advisor directs the trading for its own portion of the Funds, and does not aggregate its transactions with those of the othersub-advisors, the Funds may incur higher brokerage costs than would be the case if a singlesub-adviser were managing the entire Fund. In addition, while the Manager seeks to allocate the Funds’ assets among the Funds’sub-advisors in a manner that it believes is consistent with achieving the Funds’ investment objective(s), the Manager may be subject to potential conflicts of interest in allocating the Funds’ assets amongsub-advisors due to factors that could impact the Manager’s revenues and profits.
Other Investment Companies Risk
The Funds may invest in shares of other registered investment companies, including money market funds, exchange-traded funds (“ETFs”). To the extent that the Funds invest in shares of other registered investment companies, the Funds will indirectly bear the fees and expenses, including for example, advisory and administrative fees, charged by those investment companies in addition to the Fund’s direct fees and expenses and will be subject to the risks associated with investments in those companies. For example, the Fund’s investments in money market funds are subject to interest rate risk, credit risk, and market risk. The Funds must rely on the investment company in which it invests to achieve its investment objective. If the investment company fails to achieve its investment objective, the value of the Fund’s investment may decline, adversely affecting the Fund’s performance. ETFs are subject to the following risks that do not apply to conventional funds: (1) the market price of an ETF’s shares may trade at a discount or premium to its NAV; (2) an active trading market for an ETF’s shares may not develop or be maintained; or (3) trading of an ETF’s shares may be halted if the listing exchange’s officials deem such action appropriate, the shares are delisted from the exchange, or the activation of market-wide “circuit breakers” (which are tied to large decreases in stock prices) halts stock trading generally. An ETF that tracks an index may not precisely replicate the returns of its benchmark index. To the extent the Funds invest in other investment companies that invest in equity securities, fixed-income securities and/or foreign securities, or that track an index, the Funds are subject to the risks associated with the underlying investments held by the investment company or the index fluctuations to which the investment company is subject. ETFs have expenses associated with their operation, typically including advisory fees. For example, the Funds’ investments in money market funds are subject to interest rate risk, credit risk, and market risk.
Securities Lending Risk
A Fund may lend its portfolio securities to brokers, dealers and financial institutions to seek income. There is a risk that a borrower may default on its obligations to return loaned securities; however, a Fund’s securities lending agent indemnifies the Fund against that risk. There is a risk that the assets of a Fund’s securities lending agent may be insufficient to satisfy any contractual indemnification requirements to the Fund. Borrowers of a Fund’s securities typically provide collateral in the form of cash that is reinvested in securities. A Fund will be responsible for the risks associated with the investment of cash collateral, including any collateral invested in an affiliated money market fund. A Fund may lose money on its investment of cash collateral or may fail to earn sufficient income on its investment to meet obligations to the borrower. In addition, delays may occur in the recovery of securities from borrowers, which could interfere with a Fund’s ability to vote proxies or to settle
47
American Beacon FundsSM
Notes to Financial Statements
October 31, 2019
transactions and there is the risk of possible loss of rights in the collateral should the borrower fail financially. In any case in which the loaned securities are not returned to the Fund before anex-dividend date, the payment in lieu of the dividend that the Fund receives from the securities’ borrower would not be treated as a dividend for federal income tax purposes and thus would not qualify for treatment as “qualified dividend income”.
Valuation Risk
This is the risk that a Fund has valued a security at a price different from the price at which it can be sold. This risk may be especially pronounced for investments, such as derivatives, which may be illiquid or which may become illiquid and for securities that trade in relatively thin markets and/or markets that experience extreme volatility. If market conditions make it difficult to value certain investments, a Fund may value these investments using more subjective methods, such as fair-value methodologies. Investors who purchase or redeem Fund shares on days when a Fund is holding fair-valued securities may receive fewer or more shares, or lower or higher redemption proceeds, than they would have received if the Fund had not fair-valued the securities or had used a different valuation methodology. The value of foreign securities, certain fixed-income securities and currencies, as applicable, may be materially affected by events after the close of the markets on which they are traded, but before a Fund determines its NAV per share. The Fund’s ability to value its investments in an accurate and timely manner may be impacted by technological issues and/or errors by third-party service providers, such as pricing services or accounting agents.
7. Federal Income and Excise Taxes
It is the policy of each Fund to qualify as a regulated investment company (“RIC”), by complying with all applicable provisions of Subchapter M of the Internal Revenue Code, as amended, and to make distributions of taxable income sufficient to relieve it from substantially all federal income and excise taxes. For federal income tax purposes, each Fund is treated as a single entity for the purpose of determining such qualification.
The Funds do not have any unrecorded tax liabilities in the accompanying financial statements. Each of the tax years in the four year period ended October 31, 2019 remain subject to examination by the Internal Revenue Service. If applicable, the Funds recognize interest accrued related to unrecognized tax benefits in interest expense and penalties in “Other expenses” on the Statements of Operations.
The Funds may be subject to taxes imposed by countries in which it invests. Such taxes are generally based on returns of income earned or gains realized or repatriated. Taxes are accrued and applied to net investment income, net realized capital gains and net unrealized appreciation (depreciation), as applicable, as the income is earned or capital gains are recorded.
Dividends are categorized in accordance with income tax regulations which may treat certain transactions differently than U.S. GAAP. Accordingly, the character of distributions and composition of net assets for tax purposes may differ from those reflected in the accompanying financial statements.
The tax character of distributions paid were as follows:
| International Equity Fund | Tocqueville International Value Fund | |||||||||||||||||||||||||||
| Year Ended October 31, 2019 | Year Ended October 31, 2018 | Year Ended October 31, 2019 | Year Ended October 31, 2018 | |||||||||||||||||||||||||
Distributions paid from: | ||||||||||||||||||||||||||||
Ordinary income* | ||||||||||||||||||||||||||||
Institutional Class | $ | 34,537,408 | $ | 33,083,270 | $ | - | $ | - | ||||||||||||||||||||
Y Class | 18,518,557 | 19,410,963 | - | - | ||||||||||||||||||||||||
Investor Class | 4,755,772 | 5,187,972 | 12,373,617 | 11,212,289 | ||||||||||||||||||||||||
Advisor Class | 791,389 | 904,837 | - | - | ||||||||||||||||||||||||
A Class | 242,775 | 277,117 | - | - | ||||||||||||||||||||||||
C Class | 73,960 | 71,451 | - | - | ||||||||||||||||||||||||
R6 Class | 2,075,537 | 225,362 | - | - | ||||||||||||||||||||||||
48
American Beacon FundsSM
Notes to Financial Statements
October 31, 2019
| International Equity Fund | Tocqueville International Value Fund | |||||||||||||||||||||||||||
| Year Ended October 31, 2019 | Year Ended October 31, 2018 | Year Ended October 31, 2019 | Year Ended October 31, 2018 | |||||||||||||||||||||||||
Long-term capital gains | ||||||||||||||||||||||||||||
Institutional Class | $ | 92,593,481 | $ | 18,775,073 | $ | - | $ | - | ||||||||||||||||||||
Y Class | 51,602,996 | 11,385,276 | - | - | ||||||||||||||||||||||||
Investor Class | 15,263,739 | 3,568,136 | - | 3,668,445 | ||||||||||||||||||||||||
Advisor Class | 2,789,046 | 611,884 | - | - | ||||||||||||||||||||||||
A Class | 812,093 | 205,634 | - | - | ||||||||||||||||||||||||
C Class | 414,966 | 84,357 | - | - | ||||||||||||||||||||||||
R6 Class | 5,469,285 | 125,913 | - | - | ||||||||||||||||||||||||
|
|
|
|
|
|
|
| |||||||||||||||||||||
Total distributions paid | $ | 229,941,004 | $ | 93,917,245 | $ | 12,373,617 | $ | 14,880,734 | ||||||||||||||||||||
|
|
|
|
|
|
|
| |||||||||||||||||||||
* For tax purposes, short-term capital gains are considered ordinary income distributions.
As of October 31, 2019 the components of distributable earnings (deficits) on a tax basis were as follows:
Fund | Tax Cost | Unrealized Appreciation | Unrealized (Depreciation) | Net Unrealized Appreciation (Depreciation) | ||||||||||||||||||||||||
| International Equity | $ | 2,784,288,995 | $ | 281,532,547 | $ | (193,543,869 | ) | $ | 87,988,678 | |||||||||||||||||||
| Tocqueville International Value | 617,210,711 | 46,352,615 | (37,194,512 | ) | 9,158,103 | |||||||||||||||||||||||
Fund | Net Unrealized Appreciation (Depreciation) | Undistributed Ordinary Income | Undistributed Long-Term Capital Gains | Accumulated Capital and Other (Losses) | Other Temporary Differences | Distributable Earnings | ||||||||||||||||||||||||||||||||||||||
| International Equity | $ | 87,988,678 | $ | 75,079,811 | $ | - | $ | (58,290,462 | ) | $ | 2 | $ | 104,778,029 | |||||||||||||||||||||||||||||||
| Tocqueville International Value | 9,158,103 | 11,863,415 | - | (4,700,350 | ) | - | 16,321,168 | |||||||||||||||||||||||||||||||||||||
Financial reporting records are adjusted for permanent book/tax differences to reflect tax character. Financial records are not adjusted for temporary differences. The temporary differences between financial reporting andtax-basis reporting of unrealized appreciation (depreciation) are attributable primarily to the tax deferral of losses from wash sales, the realization for tax purposes of unrealized gains (losses) on certain derivative instruments, and the realization for tax purposes of unrealized gains from passive foreign investment companies.
Due to inherent differences in the recognition of income, expenses, and realized gains (losses) under U.S. GAAP and federal income tax regulations, permanent differences between book and tax reporting have been identified and appropriately reclassified on the Statements of Assets and Liabilities.
Accordingly, the following amounts represent current year permanent differences derived from Section 732 basis adjustments as of October 31, 2019:
Fund | Paid-In-Capital | Distributable Earnings/(Deficits) | ||||||||||
| International Equity | $ | 152,597 | $ | (152,597 | ) | |||||||
| Tocqueville International Value | - | - | ||||||||||
Under the Regulated Investment Company Modernization Act of 2010 (“RIC MOD”), net capital losses recognized by the Funds in taxable years beginning after December 22, 2010 are carried forward indefinitely and retain their character as short-term and/or long-term losses.
49
American Beacon FundsSM
Notes to Financial Statements
October 31, 2019
As of October 31, 2019, the Funds had the following capital loss carryforwards:
Fund | Short-Term Capital Loss Carryforwards | Long-Term Capital Loss Carryforwards | ||||||||||
| International Equity | $ | 26,829,245 | $ | 31,461,217 | ||||||||
| Tocqueville International Value | 4,700,350 | - | ||||||||||
Tocqueville International Value Fund utilized $2,557,991 in short-term capital loss carryforwards during the year ending October 31, 2019.
8. Investment Transactions
The aggregate cost of purchases and proceeds from sales and maturities of investments, other than short-term obligations, for the year ended October 31, 2019 were as follows:
Fund | Purchases (non-U.S. Government Securities) | Sales (non-U.S. Government Securities) | ||||||||||
| International Equity | $ | 973,870,336 | $ | 1,116,489,726 | ||||||||
| Tocqueville International Value | 268,562,985 | 688,382,419 | ||||||||||
A summary of the Funds’ transactions in the USG Select Fund for the year ended October 31, 2019 were as follows:
Fund | Type of | October 31, 2018 Shares/Fair Value | Purchases | Sales | October 31, 2019 Shares/Fair Value | Dividend Income | ||||||||||||||||||||||||||||||||||||
| International Equity | Direct | $ | 78,615,200 | $ | 962,961,523 | $ | 911,314,765 | $ | 130,261,958 | $ | 2,015,977 | |||||||||||||||||||||||||||||||
| International Equity | Securities Lending | 43,093,443 | 960,702,674 | 991,499,578 | 12,296,539 | N/A | ||||||||||||||||||||||||||||||||||||
| Tocqueville International Value | Direct | - | 325,084,882 | 300,264,600 | 24,820,282 | 676,573 | ||||||||||||||||||||||||||||||||||||
| Tocqueville International Value | Securities Lending | - | 167,528,949 | 158,343,549 | 9,185,400 | N/A | ||||||||||||||||||||||||||||||||||||
9. Securities Lending
The Funds may lend their securities to qualified financial institutions, such as certain broker-dealers, to earn additional income. The borrowers are required to secure their loans continuously with collateral in an amount at least equal to the fair value of the securities loaned, initially in an amount at least equal to 102% of the fair value of domestic securities loaned and 105% of the fair value of international securities loaned. Collateral is monitored andmarked-to-market daily. Dailymark-to-market amounts are required to be paid to the borrower or received from the borrower by the end of the following business day. This one day settlement formark-to-market amounts may result in the collateral being temporarily less than the value of the securities on loan or temporarily more than the required minimum collateral.
To the extent that a loan is collateralized by cash, such cash collateral shall be invested by the securities lending agent (the “Agent”) in money market mutual funds and other short-term investments, provided the investments meet certain quality and diversification requirements. Securities purchased with cash collateral proceeds are listed in the Funds’ Schedules of Investments and the collateral is shown on the Statements of Assets and Liabilities as a payable.
Securities lending income is generated from the demand premium (if any) paid by the borrower to borrow a specific security and from the return on investment of cash collateral, reduced by negotiated rebate fees paid to the borrower and transaction costs. To the extent that a loan is secured bynon-cash collateral, securities lending income is generated as a demand premium reduced by transaction costs. The Funds, the Agent, and the Manager retained 80%, 10%, and 10%, respectively, of the income generated from securities lending.
While securities are on loan, the Funds continue to receive certain income associated with that security and any gain or loss in the market price that may occur during the term of the loan. In the case of domestic equities,
50
American Beacon FundsSM
Notes to Financial Statements
October 31, 2019
the value of any dividend is received in the form of a substitute payment approximately equal to the dividend. In the case of foreign securities, a negotiated amount is received that is less than the actual dividend, but higher than the dividend amount minus the foreign tax that the Funds would be subject to on the dividend.
Securities lending transactions pose certain risks to the Funds, including that the borrower may not provide additional collateral when required or return the securities when due, that the value of the short-term investments will be less than the amount of cash collateral required to be returned to the borrower, thatnon-cash collateral may be subject to legal constraints in the event of a borrower bankruptcy, and that the cash collateral investments could become illiquid and unable to be used to return collateral to the borrower. The Funds could also experience delays and costs in gaining access to the collateral. The Funds bear the risk of any deficiency in the amount of the cash collateral available for return to the borrower and any action which impairs its ability to liquidatenon-cash collateral to satisfy a borrower default.
As of October 31, 2019, the value of outstanding securities on loan and the value of collateral were as follows:
Fund | Market Value of Securities on Loan | Cash Collateral Received | Non-Cash Collateral Received | Total Collateral Received | ||||||||||||||||||||||||
| International Equity | $ | 25,633,327 | $ | 12,296,539 | $ | 15,226,887 | $ | 27,523,426 | ||||||||||||||||||||
| Tocqueville International Value | 10,772,475 | 9,185,400 | 1,834,586 | 11,019,986 | ||||||||||||||||||||||||
Cash collateral is listed on the Funds’ Schedules of Investments and is shown on the Statements of Assets and Liabilities. Income earned on these investments is included in “Income derived from securities lending” on the Statements of Operations.
Non-cash collateral received by the Funds may not be sold orre-pledged except to satisfy a borrower default. Therefore,non-cash collateral is not included on the Funds’ Schedules of Investments or Statements of Assets and Liabilities.
10. Borrowing Arrangements
Effective November 15, 2018 (the “Effective Date”), the Funds, along with certain other funds managed by the Manager (“Participating Funds”), entered into a committed revolving line of credit (the “Committed Line”) agreement with State Street Bank and Trust Company (the “Bank”) to be used to facilitate portfolio liquidity. The maximum borrowing amount under the Committed Line is $250 million with interest at a rate equal to the higher of(a) one-month London Inter-Bank Offered Rate (“LIBOR”) plus 1.25% per annum or (b) the Federal Funds rate plus 1.25% per annum on amounts borrowed. Each of the Participating Funds paid a closing fee of $100,000 on the Effective Date and a quarterly commitment fee at a rate of 0.25% per annum on the unused portion of the Committed Line amount. The Committed Line expires November 14, 2019, unless extended by the Bank or terminated by the Participating Funds in accordance with the agreement.
On the Effective Date, the Funds, along with certain other Participating Funds managed by the Manager, also entered into an uncommitted discretionary demand revolving line of credit (the “Uncommitted Line”) agreement with the Bank to be used to facilitate portfolio liquidity. The maximum borrowing amount under the Uncommitted Line is $50 million with interest at a rate equal to the higher of(a) one-month LIBOR plus 1.25% per annum or (b) the Federal Funds rate plus 1.25% per annum on each outstanding loan. Each of the Participating Funds paid a closing fee of $35,000 on the Effective Date. The Uncommitted Line expires November 14, 2019 unless extended by the Bank or terminated by the Participating Funds in accordance with the agreement.
The Participating Funds paid administration, legal and arrangement fees, which are recognized as a component of “Other expenses” on the Statements of Operations, along with commitment fees, that have been allocated among the Participating Funds based on average daily net assets.
During the year ended October 31, 2019, the Funds did not utilize this facility.
51
American Beacon FundsSM
Notes to Financial Statements
October 31, 2019
11. Capital Share Transactions
The tables below summarize the activity in capital shares for each Class of the Funds:
| Institutional Class | ||||||||||||||||||||||||||||
| Year Ended October 31, | ||||||||||||||||||||||||||||
| 2019 | 2018 | |||||||||||||||||||||||||||
International Equity Fund | Shares | Amount | Shares | Amount | ||||||||||||||||||||||||
| Shares sold | 24,359,431 | $ | 419,653,044 | 25,895,144 | $ | 534,557,653 | ||||||||||||||||||||||
| Reinvestment of dividends | 7,634,480 | 120,930,168 | 2,331,173 | 48,325,212 | ||||||||||||||||||||||||
| Shares redeemed | (35,164,350 | ) | (612,015,555 | ) | (20,735,988 | ) | (420,683,891 | ) | ||||||||||||||||||||
|
|
|
|
|
|
|
| |||||||||||||||||||||
| Net increase (decrease) in shares outstanding | (3,170,439 | ) | $ | (71,432,343 | ) | 7,490,329 | $ | 162,198,974 | ||||||||||||||||||||
|
|
|
|
|
|
|
| |||||||||||||||||||||
| Y Class | ||||||||||||||||||||||||||||
| Year Ended October 31, | ||||||||||||||||||||||||||||
| 2019 | 2018 | |||||||||||||||||||||||||||
International Equity Fund | Shares | Amount | Shares | Amount | ||||||||||||||||||||||||
| Shares sold | 8,988,272 | $ | 160,621,998 | 7,511,577 | $ | 160,616,651 | ||||||||||||||||||||||
| Reinvestment of dividends | 3,927,273 | 64,839,285 | 1,249,691 | 26,893,341 | ||||||||||||||||||||||||
| Shares redeemed | (11,858,802 | ) | (213,196,249 | ) | (9,727,486 | ) | (207,013,204 | ) | ||||||||||||||||||||
|
|
|
|
|
|
|
| |||||||||||||||||||||
| Net increase (decrease) in shares outstanding | 1,056,743 | $ | 12,265,034 | (966,218 | ) | $ | (19,503,212 | ) | ||||||||||||||||||||
|
|
|
|
|
|
|
| |||||||||||||||||||||
| Investor Class | ||||||||||||||||||||||||||||
| Year Ended October 31, | ||||||||||||||||||||||||||||
| 2019 | 2018 | |||||||||||||||||||||||||||
International Equity Fund | Shares | Amount | Shares | Amount | ||||||||||||||||||||||||
| Shares sold | 1,642,389 | $ | 28,386,833 | 1,848,441 | $ | 37,668,754 | ||||||||||||||||||||||
| Reinvestment of dividends | 1,262,316 | 19,843,606 | 423,698 | 8,719,712 | ||||||||||||||||||||||||
| Shares redeemed | (4,080,763 | ) | (69,925,950 | ) | (4,046,440 | ) | (82,887,269 | ) | ||||||||||||||||||||
|
|
|
|
|
|
|
| |||||||||||||||||||||
| Net (decrease) in shares outstanding | (1,176,058 | ) | $ | (21,695,511 | ) | (1,774,301 | ) | $ | (36,498,803 | ) | ||||||||||||||||||
|
|
|
|
|
|
|
| |||||||||||||||||||||
| Advisor Class | ||||||||||||||||||||||||||||
| Year Ended October 31, | ||||||||||||||||||||||||||||
| 2019 | 2018 | |||||||||||||||||||||||||||
International Equity Fund | Shares | Amount | Shares | Amount | ||||||||||||||||||||||||
| Shares sold | 562,306 | $ | 9,859,157 | 522,085 | $ | 10,866,488 | ||||||||||||||||||||||
| Reinvestment of dividends | 221,918 | 3,579,533 | 72,002 | 1,516,353 | ||||||||||||||||||||||||
| Shares redeemed | (849,750 | ) | (15,010,142 | ) | (662,602 | ) | (13,941,921 | ) | ||||||||||||||||||||
|
|
|
|
|
|
|
| |||||||||||||||||||||
| Net (decrease) in shares outstanding | (65,526 | ) | $ | (1,571,452 | ) | (68,515 | ) | $ | (1,559,080 | ) | ||||||||||||||||||
|
|
|
|
|
|
|
| |||||||||||||||||||||
| A Class | ||||||||||||||||||||||||||||
| Year Ended October 31, | ||||||||||||||||||||||||||||
| 2019 | 2018 | |||||||||||||||||||||||||||
International Equity Fund | Shares | Amount | Shares | Amount | ||||||||||||||||||||||||
| Shares sold | 285,160 | $ | 4,957,603 | 341,544 | $ | 6,990,871 | ||||||||||||||||||||||
| Reinvestment of dividends | 65,896 | 1,035,879 | 22,967 | 472,205 | ||||||||||||||||||||||||
| Shares redeemed | (332,804 | ) | (5,767,829 | ) | (464,462 | ) | (9,545,785 | ) | ||||||||||||||||||||
|
|
|
|
|
|
|
| |||||||||||||||||||||
| Net increase (decrease) in shares outstanding | 18,252 | $ | 225,653 | (99,951 | ) | $ | (2,082,709 | ) | ||||||||||||||||||||
|
|
|
|
|
|
|
| |||||||||||||||||||||
| C Class | ||||||||||||||||||||||||||||
| Year Ended October 31, | ||||||||||||||||||||||||||||
| 2019 | 2018 | |||||||||||||||||||||||||||
International Equity Fund | Shares | Amount | Shares | Amount | ||||||||||||||||||||||||
| Shares sold | 87,222 | $ | 1,451,278 | 98,798 | $ | 1,957,866 | ||||||||||||||||||||||
| Reinvestment of dividends | 30,807 | 468,881 | 7,541 | 150,449 | ||||||||||||||||||||||||
| Shares redeemed | (130,112 | ) | (2,138,130 | ) | (117,307 | ) | (2,311,646 | ) | ||||||||||||||||||||
|
|
|
|
|
|
|
| |||||||||||||||||||||
| Net (decrease) in shares outstanding | (12,083 | ) | $ | (217,971 | ) | (10,968 | ) | $ | (203,331 | ) | ||||||||||||||||||
|
|
|
|
|
|
|
| |||||||||||||||||||||
52
American Beacon FundsSM
Notes to Financial Statements
October 31, 2019
| R6 Class | ||||||||||||||||||||||||||||
| Year Ended October 31, | ||||||||||||||||||||||||||||
| 2019 | 2018 | |||||||||||||||||||||||||||
International Equity Fund | Shares | Amount | Shares | Amount | ||||||||||||||||||||||||
| Shares sold | 9,972,905 | $ | 177,211,308 | 2,465,662 | $ | 50,086,317 | ||||||||||||||||||||||
| Reinvestment of dividends | 451,747 | 7,160,193 | 16,937 | 351,275 | ||||||||||||||||||||||||
| Shares redeemed | (3,082,577 | ) | (53,857,861 | ) | (186,126 | ) | (3,762,837 | ) | ||||||||||||||||||||
|
|
|
|
|
|
|
| |||||||||||||||||||||
| Net increase in shares outstanding | 7,342,075 | $ | 130,513,640 | 2,296,473 | $ | 46,674,755 | ||||||||||||||||||||||
|
|
|
|
|
|
|
| |||||||||||||||||||||
| Institutional Class | ||||||||||||||||||||||||||||
| January 22, 2019A to October 31, 2019 | ||||||||||||||||||||||||||||
Tocqueville International Value Fund | Shares | Amount | ||||||||||||||||||||||||||
| Shares sold | 2,912,811 | $ | 45,150,396 | |||||||||||||||||||||||||
| Shares redeemed | (539,578 | ) | (8,170,774 | ) | ||||||||||||||||||||||||
|
|
|
| |||||||||||||||||||||||||
| Net increase in shares outstanding | 2,373,233 | $ | 36,979,622 | |||||||||||||||||||||||||
|
|
|
| |||||||||||||||||||||||||
| Y Class | ||||||||||||||||||||||||||||
| January 22, 2019A to October 31, 2019 | ||||||||||||||||||||||||||||
Tocqueville International Value Fund | Shares | Amount | ||||||||||||||||||||||||||
| Shares sold | 24,079,914 | $ | 375,416,084 | |||||||||||||||||||||||||
| Shares redeemed | (9,416,423 | ) | (141,613,817 | ) | ||||||||||||||||||||||||
|
|
|
| |||||||||||||||||||||||||
| Net increase in shares outstanding | 14,663,491 | $ | 233,802,267 | |||||||||||||||||||||||||
|
|
|
| |||||||||||||||||||||||||
| Investor Class | ||||||||||||||||||||||||||||
| Year Ended October 31, | ||||||||||||||||||||||||||||
| 2019 | 2018 | |||||||||||||||||||||||||||
Tocqueville International Value Fund | Shares | Amount | Shares | Amount | ||||||||||||||||||||||||
| Shares sold | 10,601,835 | $ | 156,936,467 | 28,716,655 | $ | 500,256,514 | ||||||||||||||||||||||
| Reinvestment of dividends | 783,284 | 11,224,453 | 766,784 | 13,265,360 | ||||||||||||||||||||||||
| Shares redeemed | (59,020,135 | ) | (891,179,748 | ) | (22,853,917 | ) | (381,325,273 | ) | ||||||||||||||||||||
|
|
|
|
|
|
|
| |||||||||||||||||||||
| Net increase (decrease) in shares outstanding | (47,635,016 | ) | $ | (723,018,828 | ) | 6,629,522 | $ | 132,196,601 | ||||||||||||||||||||
|
|
|
|
|
|
|
| |||||||||||||||||||||
A Commencement of operations.
12. Subsequent Events
At meetings held on November 11-12, 2019, the Board of the Trust approved the termination of Templeton Investment Counsel, LLC and appointment of American Century Investment Management, Inc. on behalf of the American Beacon International Equity Fund, effective on or about January 15, 2020.
Management has evaluated subsequent events for possible recognition or disclosure in the financial statements through the date the financial statements are issued. Management has determined that there are no additional material events that would require disclosure in the Funds’ financial statements through this date.
53
American Beacon International Equity FundSM
(For a share outstanding throughout the period)
| Institutional ClassA | ||||||||||||||||||||||||||||||||||||
| Year Ended October 31, | ||||||||||||||||||||||||||||||||||||
| 2019 | 2018 | 2017 | 2016 | 2015 | ||||||||||||||||||||||||||||||||
|
| |||||||||||||||||||||||||||||||||||
Net asset value, beginning of period | $ | 18.71 | $ | 20.88 | $ | 17.41 | $ | 18.79 | $ | 19.51 | ||||||||||||||||||||||||||
|
|
|
|
|
|
|
|
|
| |||||||||||||||||||||||||||
Income (loss) from investment operations: | ||||||||||||||||||||||||||||||||||||
Net investment income | 0.55 | 0.44 | 0.39 | 0.29 | 0.35 | |||||||||||||||||||||||||||||||
Net gains (losses) on investments (both realized and unrealized) | 0.34 | (1.95 | ) | 3.51 | (1.24 | ) | (0.55 | ) | ||||||||||||||||||||||||||||
|
|
|
|
|
|
|
|
|
| |||||||||||||||||||||||||||
Total income (loss) from investment operations | 0.89 | (1.51 | ) | 3.90 | (0.95 | ) | (0.20 | ) | ||||||||||||||||||||||||||||
|
|
|
|
|
|
|
|
|
| |||||||||||||||||||||||||||
Less distributions: | ||||||||||||||||||||||||||||||||||||
Dividends from net investment income | (0.40 | ) | (0.35 | ) | (0.43 | ) | (0.27 | ) | (0.52 | ) | ||||||||||||||||||||||||||
Distributions from net realized gains | (1.14 | ) | (0.31 | ) | - | (0.16 | ) | - | ||||||||||||||||||||||||||||
|
|
|
|
|
|
|
|
|
| |||||||||||||||||||||||||||
Total distributions | (1.54 | ) | (0.66 | ) | (0.43 | ) | (0.43 | ) | (0.52 | ) | ||||||||||||||||||||||||||
|
|
|
|
|
|
|
|
|
| |||||||||||||||||||||||||||
Redemption fees added to beneficial interests | - | - | - | - | 0.00 | B | ||||||||||||||||||||||||||||||
|
|
|
|
|
|
|
|
|
| |||||||||||||||||||||||||||
Net asset value, end of period | $ | 18.06 | $ | 18.71 | $ | 20.88 | $ | 17.41 | $ | 18.79 | ||||||||||||||||||||||||||
|
|
|
|
|
|
|
|
|
| |||||||||||||||||||||||||||
Total returnC | 5.94 | % | (7.55 | )% | 22.94 | % | (5.07 | )% | (0.99 | )% | ||||||||||||||||||||||||||
|
|
|
|
|
|
|
|
|
| |||||||||||||||||||||||||||
Ratios and supplemental data: | ||||||||||||||||||||||||||||||||||||
Net assets, end of period | $ | 1,499,867,401 | $ | 1,613,462,237 | $ | 1,644,165,106 | $ | 1,450,052,040 | $ | 1,037,148,821 | ||||||||||||||||||||||||||
Ratios to average net assets: | ||||||||||||||||||||||||||||||||||||
Expenses, before reimbursements | 0.73 | % | 0.73 | % | 0.73 | % | 0.69 | % | 0.70 | % | ||||||||||||||||||||||||||
Expenses, net of reimbursements | 0.73 | % | 0.73 | % | 0.73 | % | 0.69 | % | 0.69 | % | ||||||||||||||||||||||||||
Net investment income, before expense reimbursements | 2.93 | % | 2.17 | % | 2.01 | % | 2.22 | % | 1.93 | % | ||||||||||||||||||||||||||
Net investment income, net of reimbursements | 2.93 | % | 2.17 | % | 2.01 | % | 2.22 | % | 1.94 | % | ||||||||||||||||||||||||||
Portfolio turnover rate | 36 | % | 29 | % | 32 | % | 25 | % | 33 | % | ||||||||||||||||||||||||||
| A | On May 31, 2016, the AMR Class closed and the assets were merged into the Institutional Class. |
| B | Amount represents less than $0.01 per share. |
| C | Based on net asset value, which does not reflect the sales charge, redemption fee, or contingent deferred sales charge, if applicable. May include adjustments in accordance with U.S. GAAP and as such, the net asset value for reporting purposes and the returns based upon those net asset values may differ from the net asset value and returns for shareholder transactions. |
See accompanying notes
54
American Beacon International Equity FundSM
Financial Highlights
(For a share outstanding throughout the period)
| Y Class | ||||||||||||||||||||||||||||||||||||
| Year Ended October 31, | ||||||||||||||||||||||||||||||||||||
| 2019 | 2018 | 2017 | 2016 | 2015 | ||||||||||||||||||||||||||||||||
|
| |||||||||||||||||||||||||||||||||||
Net asset value, beginning of period | $ | 19.42 | $ | 21.64 | $ | 18.03 | $ | 19.46 | $ | 20.21 | ||||||||||||||||||||||||||
|
|
|
|
|
|
|
|
|
| |||||||||||||||||||||||||||
Income (loss) from investment operations: | ||||||||||||||||||||||||||||||||||||
Net investment income | 0.54 | 0.46 | 0.38 | 0.41 | 0.35 | |||||||||||||||||||||||||||||||
Net gains (losses) on investments (both realized and unrealized) | 0.37 | (2.04 | ) | 3.65 | (1.40 | ) | (0.57 | ) | ||||||||||||||||||||||||||||
|
|
|
|
|
|
|
|
|
| |||||||||||||||||||||||||||
Total income (loss) from investment operations | 0.91 | (1.58 | ) | 4.03 | (0.99 | ) | (0.22 | ) | ||||||||||||||||||||||||||||
|
|
|
|
|
|
|
|
|
| |||||||||||||||||||||||||||
Less distributions: | ||||||||||||||||||||||||||||||||||||
Dividends from net investment income | (0.38 | ) | (0.33 | ) | (0.42 | ) | (0.28 | ) | (0.53 | ) | ||||||||||||||||||||||||||
Distributions from net realized gains | (1.14 | ) | (0.31 | ) | - | (0.16 | ) | - | ||||||||||||||||||||||||||||
|
|
|
|
|
|
|
|
|
| |||||||||||||||||||||||||||
Total distributions | (1.52 | ) | (0.64 | ) | (0.42 | ) | (0.44 | ) | (0.53 | ) | ||||||||||||||||||||||||||
|
|
|
|
|
|
|
|
|
| |||||||||||||||||||||||||||
Redemption fees added to beneficial interests | - | - | - | - | 0.00 | A | ||||||||||||||||||||||||||||||
|
|
|
|
|
|
|
|
|
| |||||||||||||||||||||||||||
Net asset value, end of period | $ | 18.81 | $ | 19.42 | $ | 21.64 | $ | 18.03 | $ | 19.46 | ||||||||||||||||||||||||||
|
|
|
|
|
|
|
|
|
| |||||||||||||||||||||||||||
Total returnB | 5.83 | % | (7.58 | )% | 22.84 | % | (5.14 | )% | (1.06 | )% | ||||||||||||||||||||||||||
|
|
|
|
|
|
|
|
|
| |||||||||||||||||||||||||||
Ratios and supplemental data: | ||||||||||||||||||||||||||||||||||||
Net assets, end of period | $ | 896,442,437 | $ | 904,847,058 | $ | 1,029,629,647 | $ | 820,596,038 | $ | 587,949,806 | ||||||||||||||||||||||||||
Ratios to average net assets: | ||||||||||||||||||||||||||||||||||||
Expenses, before reimbursements | 0.80 | % | 0.80 | % | 0.80 | % | 0.77 | % | 0.77 | % | ||||||||||||||||||||||||||
Expenses, net of reimbursements | 0.80 | % | 0.80 | % | 0.80 | % | 0.77 | % | 0.77 | % | ||||||||||||||||||||||||||
Net investment income, before expense reimbursements | 2.87 | % | 2.10 | % | 1.95 | % | 2.43 | % | 1.87 | % | ||||||||||||||||||||||||||
Net investment income, net of reimbursements | 2.87 | % | 2.10 | % | 1.95 | % | 2.43 | % | 1.87 | % | ||||||||||||||||||||||||||
Portfolio turnover rate | 36 | % | 29 | % | 32 | % | 25 | % | 33 | % | ||||||||||||||||||||||||||
| A | Amount represents less than $0.01 per share. |
| B | Based on net asset value, which does not reflect the sales charge, redemption fee, or contingent deferred sales charge, if applicable. May include adjustments in accordance with U.S. GAAP and as such, the net asset value for reporting purposes and the returns based upon those net asset values may differ from the net asset value and returns for shareholder transactions. |
See accompanying notes
55
American Beacon International Equity FundSM
Financial Highlights
(For a share outstanding throughout the period)
| Investor Class | ||||||||||||||||||||||||||||||||||||
| Year Ended October 31, | ||||||||||||||||||||||||||||||||||||
| 2019 | 2018 | 2017 | 2016 | 2015 | ||||||||||||||||||||||||||||||||
|
| |||||||||||||||||||||||||||||||||||
Net asset value, beginning of period | $ | 18.52 | $ | 20.67 | $ | 17.24 | $ | 18.60 | $ | 19.32 | ||||||||||||||||||||||||||
|
|
|
|
|
|
|
|
|
| |||||||||||||||||||||||||||
Income (loss) from investment operations: | ||||||||||||||||||||||||||||||||||||
Net investment income | 0.49 | 0.41 | 0.35 | 0.34 | 0.31 | |||||||||||||||||||||||||||||||
Net gains (losses) on investments (both realized and unrealized) | 0.33 | (1.97 | ) | 3.45 | (1.33 | ) | (0.57 | ) | ||||||||||||||||||||||||||||
|
|
|
|
|
|
|
|
|
| |||||||||||||||||||||||||||
Total income (loss) from investment operations | 0.82 | (1.56 | ) | 3.80 | (0.99 | ) | (0.26 | ) | ||||||||||||||||||||||||||||
|
|
|
|
|
|
|
|
|
| |||||||||||||||||||||||||||
Less distributions: | ||||||||||||||||||||||||||||||||||||
Dividends from net investment income | (0.33 | ) | (0.28 | ) | (0.37 | ) | (0.21 | ) | (0.46 | ) | ||||||||||||||||||||||||||
Distributions from net realized gains | (1.14 | ) | (0.31 | ) | - | (0.16 | ) | - | ||||||||||||||||||||||||||||
|
|
|
|
|
|
|
|
|
| |||||||||||||||||||||||||||
Total distributions | (1.47 | ) | (0.59 | ) | (0.37 | ) | (0.37 | ) | (0.46 | ) | ||||||||||||||||||||||||||
|
|
|
|
|
|
|
|
|
| |||||||||||||||||||||||||||
Redemption fees added to beneficial interests | - | - | - | - | 0.00 | A | ||||||||||||||||||||||||||||||
|
|
|
|
|
|
|
|
|
| |||||||||||||||||||||||||||
Net asset value, end of period | $ | 17.87 | $ | 18.52 | $ | 20.67 | $ | 17.24 | $ | 18.60 | ||||||||||||||||||||||||||
|
|
|
|
|
|
|
|
|
| |||||||||||||||||||||||||||
Total returnB | 5.55 | % | (7.86 | )% | 22.50 | % | (5.38 | )% | (1.35 | )% | ||||||||||||||||||||||||||
|
|
|
|
|
|
|
|
|
| |||||||||||||||||||||||||||
Ratios and supplemental data: | ||||||||||||||||||||||||||||||||||||
Net assets, end of period | $ | 221,043,036 | $ | 250,804,403 | $ | 316,589,769 | $ | 334,895,337 | $ | 342,720,411 | ||||||||||||||||||||||||||
Ratios to average net assets: | ||||||||||||||||||||||||||||||||||||
Expenses, before reimbursements | 1.05 | % | 1.06 | % | 1.07 | % | 1.06 | % | 1.03 | % | ||||||||||||||||||||||||||
Expenses, net of reimbursements | 1.05 | % | 1.06 | % | 1.07 | % | 1.06 | % | 1.03 | % | ||||||||||||||||||||||||||
Net investment income, before expense reimbursements | 2.59 | % | 1.83 | % | 1.69 | % | 1.95 | % | 1.60 | % | ||||||||||||||||||||||||||
Net investment income, net of reimbursements | 2.59 | % | 1.83 | % | 1.69 | % | 1.95 | % | 1.60 | % | ||||||||||||||||||||||||||
Portfolio turnover rate | 36 | % | 29 | % | 32 | % | 25 | % | 33 | % | ||||||||||||||||||||||||||
| A | Amount represents less than $0.01 per share. |
| B | Based on net asset value, which does not reflect the sales charge, redemption fee, or contingent deferred sales charge, if applicable. May include adjustments in accordance with U.S. GAAP and as such, the net asset value for reporting purposes and the returns based upon those net asset values may differ from the net asset value and returns for shareholder transactions. |
See accompanying notes
56
American Beacon International Equity FundSM
Financial Highlights
(For a share outstanding throughout the period)
| Advisor ClassA | ||||||||||||||||||||||||||||||||||||
| Year Ended October 31, | ||||||||||||||||||||||||||||||||||||
| 2019 | 2018 | 2017 | 2016 | 2015 | ||||||||||||||||||||||||||||||||
|
| |||||||||||||||||||||||||||||||||||
Net asset value, beginning of period | $ | 18.93 | $ | 21.15 | $ | 17.62 | $ | 19.01 | $ | 19.76 | ||||||||||||||||||||||||||
|
|
|
|
|
|
|
|
|
| |||||||||||||||||||||||||||
Income (loss) from investment operations: | ||||||||||||||||||||||||||||||||||||
Net investment income | 0.43 | 0.36 | 0.23 | 0.35 | 0.38 | |||||||||||||||||||||||||||||||
Net gains (losses) on investments (both realized and unrealized) | 0.39 | (1.99 | ) | 3.64 | (1.37 | ) | (0.68 | ) | ||||||||||||||||||||||||||||
|
|
|
|
|
|
|
|
|
| |||||||||||||||||||||||||||
Total income (loss) from investment operations | 0.82 | (1.63 | ) | 3.87 | (1.02 | ) | (0.30 | ) | ||||||||||||||||||||||||||||
|
|
|
|
|
|
|
|
|
| |||||||||||||||||||||||||||
Less distributions: | ||||||||||||||||||||||||||||||||||||
Dividends from net investment income | (0.30 | ) | (0.28 | ) | (0.34 | ) | (0.21 | ) | (0.45 | ) | ||||||||||||||||||||||||||
Distributions from net realized gains | (1.14 | ) | (0.31 | ) | - | (0.16 | ) | - | ||||||||||||||||||||||||||||
|
|
|
|
|
|
|
|
|
| |||||||||||||||||||||||||||
Total distributions | (1.44 | ) | (0.59 | ) | (0.34 | ) | (0.37 | ) | (0.45 | ) | ||||||||||||||||||||||||||
|
|
|
|
|
|
|
|
|
| |||||||||||||||||||||||||||
Redemption fees added to beneficial interests | - | - | - | - | 0.00 | B | ||||||||||||||||||||||||||||||
|
|
|
|
|
|
|
|
|
| |||||||||||||||||||||||||||
Net asset value, end of period | $ | 18.31 | $ | 18.93 | $ | 21.15 | $ | 17.62 | $ | 19.01 | ||||||||||||||||||||||||||
|
|
|
|
|
|
|
|
|
| |||||||||||||||||||||||||||
Total returnC | 5.38 | % | (7.99 | )% | 22.38 | % | (5.40 | )% | (1.51 | )% | ||||||||||||||||||||||||||
|
|
|
|
|
|
|
|
|
| |||||||||||||||||||||||||||
Ratios and supplemental data: | ||||||||||||||||||||||||||||||||||||
Net assets, end of period | $ | 45,797,068 | $ | 48,571,916 | $ | 55,715,606 | $ | 23,692,313 | $ | 22,912,069 | ||||||||||||||||||||||||||
Ratios to average net assets: | ||||||||||||||||||||||||||||||||||||
Expenses, before reimbursements | 1.20 | % | 1.20 | % | 1.20 | % | 1.19 | % | 1.16 | % | ||||||||||||||||||||||||||
Expenses, net of reimbursements | 1.20 | % | 1.20 | % | 1.20 | % | 1.19 | % | 1.16 | % | ||||||||||||||||||||||||||
Net investment income, before expense reimbursements | 2.40 | % | 1.70 | % | 1.51 | % | 1.87 | % | 1.55 | % | ||||||||||||||||||||||||||
Net investment income, net of reimbursements | 2.40 | % | 1.70 | % | 1.51 | % | 1.87 | % | 1.55 | % | ||||||||||||||||||||||||||
Portfolio turnover rate | 36 | % | 29 | % | 32 | % | 25 | % | 33 | % | ||||||||||||||||||||||||||
| A | On January 15, 2016, the Retirement Class closed and the assets were merged into the Advisor Class. |
| B | Amount represents less than $0.01 per share. |
| C | Based on net asset value, which does not reflect the sales charge, redemption fee, or contingent deferred sales charge, if applicable. May include adjustments in accordance with U.S. GAAP and as such, the net asset value for reporting purposes and the returns based upon those net asset values may differ from the net asset value and returns for shareholder transactions. |
See accompanying notes
57
American Beacon International Equity FundSM
Financial Highlights
(For a share outstanding throughout the period)
| A Class | ||||||||||||||||||||||||||||||||||||
| Year Ended October 31, | ||||||||||||||||||||||||||||||||||||
| 2019 | 2018 | 2017 | 2016 | 2015 | ||||||||||||||||||||||||||||||||
|
| |||||||||||||||||||||||||||||||||||
Net asset value, beginning of period | $ | 18.50 | $ | 20.63 | $ | 17.23 | $ | 18.59 | $ | 19.32 | ||||||||||||||||||||||||||
|
|
|
|
|
|
|
|
|
| |||||||||||||||||||||||||||
Income (loss) from investment operations: | ||||||||||||||||||||||||||||||||||||
Net investment income | 0.45 | 0.38 | 0.30 | 0.32 | 0.31 | |||||||||||||||||||||||||||||||
Net gains (losses) on investments (both realized and unrealized) | 0.36 | (1.95 | ) | 3.48 | (1.30 | ) | (0.59 | ) | ||||||||||||||||||||||||||||
|
|
|
|
|
|
|
|
|
| |||||||||||||||||||||||||||
Total income (loss) from investment operations | 0.81 | (1.57 | ) | 3.78 | (0.98 | ) | (0.28 | ) | ||||||||||||||||||||||||||||
|
|
|
|
|
|
|
|
|
| |||||||||||||||||||||||||||
Less distributions: | ||||||||||||||||||||||||||||||||||||
Dividends from net investment income | (0.32 | ) | (0.25 | ) | (0.38 | ) | (0.22 | ) | (0.45 | ) | ||||||||||||||||||||||||||
Distributions from net realized gains | (1.14 | ) | (0.31 | ) | - | (0.16 | ) | - | ||||||||||||||||||||||||||||
|
|
|
|
|
|
|
|
|
| |||||||||||||||||||||||||||
Total distributions | (1.46 | ) | (0.56 | ) | (0.38 | ) | (0.38 | ) | (0.45 | ) | ||||||||||||||||||||||||||
|
|
|
|
|
|
|
|
|
| |||||||||||||||||||||||||||
Redemption fees added to beneficial interests | - | - | - | - | 0.00 | A | ||||||||||||||||||||||||||||||
|
|
|
|
|
|
|
|
|
| |||||||||||||||||||||||||||
Net asset value, end of period | $ | 17.85 | $ | 18.50 | $ | 20.63 | $ | 17.23 | $ | 18.59 | ||||||||||||||||||||||||||
|
|
|
|
|
|
|
|
|
| |||||||||||||||||||||||||||
Total returnB | 5.46 | % | (7.89 | )% | 22.43 | % | (5.34 | )% | (1.42 | )% | ||||||||||||||||||||||||||
|
|
|
|
|
|
|
|
|
| |||||||||||||||||||||||||||
Ratios and supplemental data: | ||||||||||||||||||||||||||||||||||||
Net assets, end of period | $ | 13,973,709 | $ | 14,141,551 | $ | 17,829,657 | $ | 18,673,142 | $ | 10,747,749 | ||||||||||||||||||||||||||
Ratios to average net assets: | ||||||||||||||||||||||||||||||||||||
Expenses, before reimbursements | 1.15 | % | 1.08 | % | 1.12 | % | 1.07 | % | 1.08 | % | ||||||||||||||||||||||||||
Expenses, net of reimbursements | 1.15 | % | 1.08 | % | 1.12 | % | 1.07 | % | 1.08 | % | ||||||||||||||||||||||||||
Net investment income, before expense reimbursements | 2.50 | % | 1.80 | % | 1.65 | % | 1.94 | % | 1.55 | % | ||||||||||||||||||||||||||
Net investment income, net of reimbursements | 2.50 | % | 1.80 | % | 1.65 | % | 1.94 | % | 1.55 | % | ||||||||||||||||||||||||||
Portfolio turnover rate | 36 | % | 29 | % | 32 | % | 25 | % | 33 | % | ||||||||||||||||||||||||||
| A | Amount represents less than $0.01 per share. |
| B | Based on net asset value, which does not reflect the sales charge, redemption fee, or contingent deferred sales charge, if applicable. May include adjustments in accordance with U.S. GAAP and as such, the net asset value for reporting purposes and the returns based upon those net asset values may differ from the net asset value and returns for shareholder transactions. |
See accompanying notes
58
American Beacon International Equity FundSM
Financial Highlights
(For a share outstanding throughout the period)
| C Class | ||||||||||||||||||||||||||||||||||||
| Year Ended October 31, | ||||||||||||||||||||||||||||||||||||
| 2019 | 2018 | 2017 | 2016 | 2015 | ||||||||||||||||||||||||||||||||
|
| |||||||||||||||||||||||||||||||||||
Net asset value, beginning of period | $ | 17.84 | $ | 19.93 | $ | 16.73 | $ | 18.09 | $ | 18.83 | ||||||||||||||||||||||||||
|
|
|
|
|
|
|
|
|
| |||||||||||||||||||||||||||
Income (loss) from investment operations: | ||||||||||||||||||||||||||||||||||||
Net investment income | 0.29 | 0.22 | 0.17 | 0.18 | 0.16 | |||||||||||||||||||||||||||||||
Net gains (losses) on investments (both realized and unrealized) | 0.37 | (1.87 | ) | 3.36 | (1.28 | ) | (0.56 | ) | ||||||||||||||||||||||||||||
|
|
|
|
|
|
|
|
|
| |||||||||||||||||||||||||||
Total income (loss) from investment operations | 0.66 | (1.65 | ) | 3.53 | (1.10 | ) | (0.40 | ) | ||||||||||||||||||||||||||||
|
|
|
|
|
|
|
|
|
| |||||||||||||||||||||||||||
Less distributions: | ||||||||||||||||||||||||||||||||||||
Dividends from net investment income | (0.18 | ) | (0.13 | ) | (0.33 | ) | (0.10 | ) | (0.34 | ) | ||||||||||||||||||||||||||
Distributions from net realized gains | (1.14 | ) | (0.31 | ) | - | (0.16 | ) | - | ||||||||||||||||||||||||||||
|
|
|
|
|
|
|
|
|
| |||||||||||||||||||||||||||
Total distributions | (1.32 | ) | (0.44 | ) | (0.33 | ) | (0.26 | ) | (0.34 | ) | ||||||||||||||||||||||||||
|
|
|
|
|
|
|
|
|
| |||||||||||||||||||||||||||
Redemption fees added to beneficial interests | - | - | - | - | 0.00 | A | ||||||||||||||||||||||||||||||
|
|
|
|
|
|
|
|
|
| |||||||||||||||||||||||||||
Net asset value, end of period | $ | 17.18 | $ | 17.84 | $ | 19.93 | $ | 16.73 | $ | 18.09 | ||||||||||||||||||||||||||
|
|
|
|
|
|
|
|
|
| |||||||||||||||||||||||||||
Total returnB | 4.69 | % | (8.52 | )% | 21.50 | % | (6.12 | )% | (2.12 | )% | ||||||||||||||||||||||||||
|
|
|
|
|
|
|
|
|
| |||||||||||||||||||||||||||
Ratios and supplemental data: | ||||||||||||||||||||||||||||||||||||
Net assets, end of period | $ | 6,174,460 | $ | 6,625,329 | $ | 7,622,425 | $ | 2,945,246 | $ | 3,899,081 | ||||||||||||||||||||||||||
Ratios to average net assets: | ||||||||||||||||||||||||||||||||||||
Expenses, before reimbursements | 1.87 | % | 1.81 | % | 1.88 | % | 1.85 | % | 1.82 | % | ||||||||||||||||||||||||||
Expenses, net of reimbursements | 1.87 | % | 1.81 | % | 1.88 | % | 1.85 | % | 1.83 | % | ||||||||||||||||||||||||||
Net investment income, before expense reimbursements | 1.73 | % | 1.08 | % | 0.96 | % | 1.12 | % | 0.77 | % | ||||||||||||||||||||||||||
Net investment income, net of reimbursements | 1.73 | % | 1.08 | % | 0.96 | % | 1.12 | % | 0.77 | % | ||||||||||||||||||||||||||
Portfolio turnover rate | 36 | % | 29 | % | 32 | % | 25 | % | 33 | % | ||||||||||||||||||||||||||
| A | Amount represents less than $0.01 per share. |
| B | Based on net asset value, which does not reflect the sales charge, redemption fee, or contingent deferred sales charge, if applicable. May include adjustments in accordance with U.S. GAAP and as such, the net asset value for reporting purposes and the returns based upon those net asset values may differ from the net asset value and returns for shareholder transactions. |
See accompanying notes
59
American Beacon International Equity FundSM
Financial Highlights
(For a share outstanding throughout the period)
| R6 Class | ||||||||||||||||||||
| Year Ended October 31, | February 28, 2017A to | |||||||||||||||||||
| 2019 | 2018 | 2017 | ||||||||||||||||||
|
| |||||||||||||||||||
Net asset value, beginning of period | $ | 18.73 | $ | 20.89 | $ | 17.80 | ||||||||||||||
|
|
|
|
|
| |||||||||||||||
Income (loss) from investment operations: | ||||||||||||||||||||
Net investment income | 0.51 | 0.39 | 0.08 | |||||||||||||||||
Net gains (losses) on investments (both realized and unrealized) | 0.39 | (1.88 | ) | 3.01 | ||||||||||||||||
|
|
|
|
|
| |||||||||||||||
Total income (loss) from investment operations | 0.90 | (1.49 | ) | 3.09 | ||||||||||||||||
|
|
|
|
|
| |||||||||||||||
Less distributions: | ||||||||||||||||||||
Dividends from net investment income | (0.41 | ) | (0.36 | ) | - | |||||||||||||||
Distributions from net realized gains | (1.14 | ) | (0.31 | ) | - | |||||||||||||||
|
|
|
|
|
| |||||||||||||||
Total distributions | (1.55 | ) | (0.67 | ) | - | |||||||||||||||
|
|
|
|
|
| |||||||||||||||
Net asset value, end of period | $ | 18.08 | $ | 18.73 | $ | 20.89 | ||||||||||||||
|
|
|
|
|
| |||||||||||||||
Total returnB | 5.98 | % | (7.47 | )% | 17.36 | %C | ||||||||||||||
|
|
|
|
|
| |||||||||||||||
Ratios and supplemental data: |
| |||||||||||||||||||
Net assets, end of period | $ | 179,802,437 | $ | 48,725,523 | $ | 6,367,999 | ||||||||||||||
Ratios to average net assets: | ||||||||||||||||||||
Expenses, before reimbursements | 0.70 | % | 0.70 | % | 0.89 | %D | ||||||||||||||
Expenses, net of reimbursements | 0.66 | % | 0.66 | % | 0.66 | %D | ||||||||||||||
Net investment income, before expense reimbursements | 3.09 | % | 2.11 | % | 1.63 | %D | ||||||||||||||
Net investment income, net of reimbursements | 3.13 | % | 2.15 | % | 1.85 | %D | ||||||||||||||
Portfolio turnover rate | 36 | % | 29 | % | 32 | %E | ||||||||||||||
| A | Commencement of operations. |
| B | Based on net asset value, which does not reflect the sales charge, redemption fee, or contingent deferred sales charge, if applicable. May include adjustments in accordance with U.S. GAAP and as such, the net asset value for reporting purposes and the returns based upon those net asset values may differ from the net asset value and returns for shareholder transactions. |
| C | Not annualized. |
| D | Annualized. |
| E | Portfolio turnover rate is for the period from February 28, 2017 through October 31, 2017 and is not annualized. |
See accompanying notes
60
American Beacon Tocqueville International Value FundSM
Financial Highlights
(For a share outstanding throughout the period)
| Institutional Class | ||||
January 22, 2019A to October 31, 2019 | ||||
|
| |||
Net asset value, beginning of period | $ | 14.78 | ||
|
| |||
Income from investment operations: | ||||
Net investment income | 0.21 | |||
Net gains on investments (both realized and unrealized) | 0.66 | |||
|
| |||
Total income (loss) from investment operations | 0.87 | |||
|
| |||
Net asset value, end of period | $ | 15.65 | ||
|
| |||
Total returnB | 5.89 | %C | ||
|
| |||
Ratios and supplemental data: |
| |||
Net assets, end of period | $ | 37,138,368 | ||
Ratios to average net assets: | ||||
Expenses, before reimbursements | 0.93 | %D | ||
Expenses, net of reimbursements | 0.89 | %D | ||
Net investment income, before expense reimbursements | 2.18 | %D | ||
Net investment income, net of reimbursements | 2.22 | %D | ||
Portfolio turnover rate | 35 | %E | ||
| A | Commencement of operations. |
| B | Based on net asset value, which does not reflect the sales charge, redemption fee, or contingent deferred sales charge, if applicable. May include adjustments in accordance with U.S. GAAP and as such, the net asset value for reporting purposes and the returns based upon those net asset values may differ from the net asset value and returns for shareholder transactions. |
| C | Not annualized. |
| D | Annualized. |
| E | Portfolio turnover is for the period ended herein. |
See accompanying notes
61
American Beacon Tocqueville International Value FundSM
Financial Highlights
(For a share outstanding throughout the period)
| Y Class | ||||
January 22, 2019A to October 31, 2019 | ||||
|
| |||
Net asset value, beginning of period | $ | 14.78 | ||
|
| |||
Income from investment operations: | ||||
Net investment income | 0.23 | |||
Net gains on investments (both realized and unrealized) | 0.63 | |||
|
| |||
Total income (loss) from investment operations | 0.86 | |||
|
| |||
Net asset value, end of period | $ | 15.64 | ||
|
| |||
Total returnB | 5.82 | %C | ||
|
| |||
Ratios and supplemental data: |
| |||
Net assets, end of period | $ | 229,275,205 | ||
Ratios to average net assets: | ||||
Expenses, before reimbursements | 0.98 | %D | ||
Expenses, net of reimbursements | 0.98 | %D | ||
Net investment income, before expense reimbursements | 2.10 | %D | ||
Net investment income, net of reimbursements | 2.10 | %D | ||
Portfolio turnover rate | 35 | %E | ||
| A | Commencement of operations. |
| B | Based on net asset value, which does not reflect the sales charge, redemption fee, or contingent deferred sales charge, if applicable. May include adjustments in accordance with U.S. GAAP and as such, the net asset value for reporting purposes and the returns based upon those net asset values may differ from the net asset value and returns for shareholder transactions. |
| C | Not annualized. |
| D | Annualized. |
| E | Portfolio turnover is for the period ended herein. |
See accompanying notes
62
American Beacon Tocqueville International Value FundSM
Financial Highlights
(For a share outstanding throughout the period)
| Investor Class | ||||||||||||||||||||||||||||||||||||
| Year Ended October 31, | ||||||||||||||||||||||||||||||||||||
| 2019 | 2018 | 2017 | 2016 | 2015 | ||||||||||||||||||||||||||||||||
|
| |||||||||||||||||||||||||||||||||||
Net asset value, beginning of period | $ | 15.06 | $ | 17.58 | $ | 14.44 | $ | 14.59 | $ | 14.48 | ||||||||||||||||||||||||||
|
|
|
|
|
|
|
|
|
| |||||||||||||||||||||||||||
Income (loss) from investment operations: | ||||||||||||||||||||||||||||||||||||
Net investment income | 0.40 | 0.24 | A | 0.14 | A | 0.14 | A | 0.15 | A | |||||||||||||||||||||||||||
Net gains (losses) on investments (both realized and unrealized) | 0.34 | (2.53 | ) | 3.23 | 0.14 | 0.80 | ||||||||||||||||||||||||||||||
|
|
|
|
|
|
|
|
|
| |||||||||||||||||||||||||||
Total income (loss) from investment operations | 0.74 | (2.29 | ) | 3.37 | 0.28 | 0.95 | ||||||||||||||||||||||||||||||
|
|
|
|
|
|
|
|
|
| |||||||||||||||||||||||||||
Less distributions: | ||||||||||||||||||||||||||||||||||||
Dividends from net investment income | (0.19 | ) | (0.17 | ) | (0.15 | ) | (0.25 | ) | (0.32 | ) | ||||||||||||||||||||||||||
Distributions from net realized gains | - | (0.06 | ) | (0.08 | ) | (0.18 | ) | (0.52 | ) | |||||||||||||||||||||||||||
|
|
|
|
|
|
|
|
|
| |||||||||||||||||||||||||||
Total distributions | (0.19 | ) | (0.23 | ) | (0.23 | ) | (0.43 | ) | (0.84 | ) | ||||||||||||||||||||||||||
|
|
|
|
|
|
|
|
|
| |||||||||||||||||||||||||||
Redemption fees added to beneficial interests | - | - | - | - | 0.00 | B | ||||||||||||||||||||||||||||||
|
|
|
|
|
|
|
|
|
| |||||||||||||||||||||||||||
Net asset value, end of period | $ | 15.61 | $ | 15.06 | $ | 17.58 | $ | 14.44 | $ | 14.59 | ||||||||||||||||||||||||||
|
|
|
|
|
|
|
|
|
| |||||||||||||||||||||||||||
Total returnC | 5.03 | % | (13.20 | )% | 23.70 | % | 2.00 | % | 7.20 | % | ||||||||||||||||||||||||||
|
|
|
|
|
|
|
|
|
| |||||||||||||||||||||||||||
Ratios and supplemental data: | ||||||||||||||||||||||||||||||||||||
Net assets, end of period | $ | 355,423,059 | $ | 1,060,000,108 | $ | 1,120,993,795 | $ | 525,808,058 | $ | 333,761,762 | ||||||||||||||||||||||||||
Ratios to average net assets: | ||||||||||||||||||||||||||||||||||||
Expenses, before reimbursements | 1.29 | % | 1.48 | % | 1.53 | % | 1.58 | % | 1.57 | % | ||||||||||||||||||||||||||
Expenses, net of reimbursements | 1.18 | % | 1.25 | % | 1.25 | % | 1.25 | % | 1.25 | % | ||||||||||||||||||||||||||
Net investment income, before expense reimbursements | 1.42 | % | 1.09 | % | 0.73 | % | 0.90 | % | 0.71 | % | ||||||||||||||||||||||||||
Net investment income, net of reimbursements | 1.53 | % | 1.32 | % | 1.01 | % | 1.23 | % | 1.03 | % | ||||||||||||||||||||||||||
Portfolio turnover rate | 35 | % | 25 | % | 22 | % | 26 | % | 42 | % | ||||||||||||||||||||||||||
| A | Net investment income per share is calculated using the ending balance prior to consideration or adjustment for permanentbook-to-tax differences. |
| B | Amount represents less than $0.01 per share. |
| C | Based on net asset value, which does not reflect the sales charge, redemption fee, or contingent deferred sales charge, if applicable. May include adjustments in accordance with U.S. GAAP and as such, the net asset value for reporting purposes and the returns based upon those net asset values may differ from the net asset value and returns for shareholder transactions. |
See accompanying notes
63
American Beacon FundsSM
October 31, 2019 (Unaudited)
Certain tax information regarding the Funds is required to be provided to shareholders based upon the Funds’ income and distributions for the taxable year ended October 31, 2019. The information and distributions reported herein may differ from information and distributions taxable to the shareholders for the calendar year ended December 31, 2019.
The Funds designated the following items with regard to distributions paid during the fiscal year ended October 31, 2019. All designations are based on financial information available as of this annual report and, accordingly, are subject to change. For each item, it is the intention of the Funds to designate the maximum amount permitted under the Internal Revenue Code of 1986, as amended, and the regulations there under.
Corporate Dividends-Received Deduction: | ||||
International Equity | N/A | |||
Tocqueville International Value | N/A | |||
Qualified Dividend Income: | ||||
International Equity | 100 | % | ||
Tocqueville International Value | 100 | % | ||
Long-Term Capital Gain Distributions: | ||||
International Equity | $ | 168,945,606 | ||
Tocqueville International Value | - | |||
Short-Term Capital Gain Distributions: | ||||
International Equity | $ | 2,971,370 | ||
Tocqueville International Value | - | |||
Foreign tax credit: | ||||
International Equity | $ | 9,599,774 | ||
Tocqueville International Value | 1,847,761 | |||
The foreign tax credits for International Equity and Tocqueville International Value are based on foreign source income of $109,594,494 and $23,112,399, respectively for the year ended October 31, 2019.
Shareholders will receive notification in January 2020 of the applicable tax information necessary to prepare their 2019 income tax returns.
64
Disclosure Regarding Approval of the Management and Investment Advisory Agreements(Unaudited)
Renewal and Approval of Management Agreement and Investment Advisory Agreements
Atin-person meetings held on May 9, 2019 and June4-5, 2019 (collectively, the “Meetings”), the Board of Trustees (“Board” or “Trustees”) considered and then, at its June 5, 2019 meeting, approved the renewal of:
(1) the Management Agreement between American Beacon Advisors, Inc. (“Manager”) and the American Beacon Funds (“Trust”), on behalf of the American Beacon International Equity Fund (“Fund”); and
(2) the Investment Advisory Agreements among the Manager, the Trust, on behalf of the Fund, and each of Causeway Capital Management LLC (“Causeway”), Lazard Asset Management LLC (“Lazard”) and Templeton Investment Counsel, LLC (“Templeton”) (each, a “subadvisor” and collectively, the “subadvisors”).
The Management Agreement and the Investment Advisory Agreements are referred to herein individually as an “Agreement” and collectively as the “Agreements.” In preparation for its consideration of the renewal of the Agreements, the Board undertook steps to gather and consider information furnished by the Manager, the subadvisors, Broadridge, Inc. (“Broadridge”) and Morningstar, Inc. (“Morningstar”).The Board, with the assistance of independent legal counsel, requested and received certain relevant information from the Manager and the subadvisors.
In advance of the Meetings, the Board’s Investment Committee and/or the Manager coordinated the production of information from Broadridge and Morningstar regarding the performance, fees and expenses of the Fund as well as information from the Manager and the subadvisors. At the Meetings, the Board considered the information provided in connection with the renewal process, as well as information furnished to the Board throughout the year at regular meetings of the Board and its committees. In connection with the Board’s consideration of the Agreements, the Board received and evaluated such information as they deemed necessary. This information is described below in the section summarizing the factors the Board considered in connection with its renewal and approval of the Agreements, as well as the section describing additional Board considerations with respect to the Fund.
The Board noted that the Manager provides management and administrative services to the Fund pursuant to the Management Agreement. The Board considered that many mutual funds have separate contracts governing each type of service and observed that, with respect to such mutual funds, the actual management fee rates provided by Broadridge for peer group funds reflect the combined advisory and administrative expenses, reduced by any fee waivers and/or reimbursements.
A firm may not have been able to, or opted not to, provide information in response to certain information requests, in which case the Board conducted its evaluation of the firm based on information that was provided. In such cases, the Board determined that the omission of any such information was not material to its considerations. The class of shares used for comparative performance purposes was the share class with the lowest expenses available for purchase by the general public, which was the Institutional Class. The Board also considered that the use of Institutional Class performance generally facilitates a meaningful comparison for expense and performance purposes.
Provided below is an overview of certain factors the Board considered in connection with its renewal and approval of the Agreements. The Board did not identify any particular information that was most relevant to its consideration to renew or approve each Agreement, and each Trustee may have afforded different weight to the various factors. Legal counsel to the independent Trustees provided the Board with a memorandum regarding its responsibilities pertaining to the renewal and approval of investment advisory contracts, such as the Agreements. The memorandum explained the regulatory requirements surrounding the Board’s process for evaluating investment advisors and the terms of investment advisory contracts. Based on its evaluation, the Board unanimously concluded that the terms of each Agreement were reasonable and fair and that the renewal and approval of each Agreement was in the best interests of the Fund and its shareholders.
65
Disclosure Regarding Approval of the Management and Investment Advisory Agreements(Unaudited)
Considerations With Respect to the Renewal of the Management Agreement and the Investment Advisory Agreements
In determining whether to renew the Agreements, the Board considered the Fund’s investment management and subadvisory relationships separately. In each instance, the Board considered, among other things, the following factors: (1) the nature, extent and quality of the services provided; (2) the investment performance of the Fund; (3) the costs incurred by the Manager in rendering services to the Fund and its resulting profits or losses; (4) comparisons of services and fee rates with contracts entered into by the Manager or the subadvisors or their affiliates with other clients (such as pension funds and other institutional clients); (5) the extent to which economies of scale, if any, have been taken into account in setting each fee rate schedule; (6) whether fee rate levels reflect economies of scale, if any, for the benefit of Fund investors; and (7) any other benefits derived or anticipated to be derived by the Manager or the subadvisors from their relationships with the Fund.
Nature, Extent and Quality of Services.With respect to the renewal of the Management Agreement, the Board considered, among other factors: the Fund’s long-term performance; the length of service of key investment personnel at the Manager; the cost structure of the Fund; the Manager’s culture of compliance and support that reduce risks to the Fund; the Manager’s quality of services; the Manager’s active role in monitoring and, as appropriate, recommending additional or replacement subadvisors; and the Manager’s efforts to retain key employees and maintain staffing levels.
With respect to the renewal of the Investment Advisory Agreements, the Board considered the level of staffing and the size of the subadvisors. The Board also considered the adequacy of the resources committed to the Fund by the subadvisors, and whether those resources were commensurate with the needs of the Fund and are sufficient to sustain appropriate levels of performance and compliance needs. In this regard, the Board considered the financial stability of the subadvisors. The Board also considered each subadvisor’s representations regarding its compliance program and code of ethics. Based on the foregoing information, the Board concluded that the nature, extent and quality of the management and advisory services provided by the Manager and the subadvisors were appropriate for the Fund.
Investment Performance.The Board evaluated the comparative information provided by Broadridge and the Manager regarding the performance of the Fund relative to its Broadridge performance universe, Morningstar Category, and benchmark index, as well as the Fund’s Morningstar rating. The Board considered the information provided by Broadridge regarding Broadridge’s independent methodology for selecting the Fund’s Broadridge performance universe. The Board also considered that the performance universes selected by Broadridge may not provide appropriate comparisons for the Fund. In addition, the Board considered the performance reports and discussions with management at Board and Committee meetings throughout the year. The Board also evaluated the comparative information provided by each subadvisor regarding the performance of its portion of the Fund relative to the performance of the Fund’s benchmark index, and, with respect to Causeway and Lazard, a composite of similar accounts managed by the subadvisor. In addition, the Board considered the Manager’s recommendation to continue to retain each subadvisor. A discussion regarding the Board’s considerations with respect to the Fund’s performance appears below under “Additional Considerations and Conclusions with Respect to the Fund.”
Costs of the Services Provided to the Fund and the Profits Realized by the Manager from its Relationship with the Fund.In analyzing the cost of services and profitability of the Manager, the Board considered the revenues earned and the expenses incurred by the Manager, before and after the payment of distribution-related expenses by the Manager. The profits or losses were noted at both an aggregate level for all funds within the group of mutual funds sponsored by the Manager (the “Fund Complex”) and at an individual Fund level, with the Manager earning a profit before and after the payment of distribution-related expenses by the Manager for the Fund. The Board also considered comparative information provided by the Manager regarding the Manager’s overall profitability with respect to the Fund Complex relative to the overall profitability of other firms in the mutual fund industry, as disclosed in publicly available sources. Although the Board noted that, in certain cases, the fee rates paid by other clients of the Manager are lower than the fee rates paid by the Fund, the Manager represented that,
66
Disclosure Regarding Approval of the Management and Investment Advisory Agreements(Unaudited)
among other matters, the difference is attributable to the fact that the Manager does not perform administrative services fornon-investment company clients and reflects the greater level of responsibility and regulatory requirements associated with managing the Fund.
The Board also noted that the Manager proposed to continue the expense waivers and reimbursements for the Fund’s R6 Class shares that were in place during the last fiscal year. The Board further considered that, with respect to the Fund, the Management Agreement provides for the Manager to receive a management fee comprised of an annualized fee that is retained by the Manager. In addition, the Board considered that the Manager receives fees for overseeing the securities lending program on behalf of the Fund. The Board also noted that certain share classes of the Fund maintain higher expense ratios in order to compensate third-party financial intermediaries.
In analyzing the fee rates charged by each subadvisor in connection with its investment advisory services to the Fund, the Board considered representations made by Causeway and Lazard that the fee rate negotiated by the Manager is favorable relative to the fee rates that the relevant subadvisor charges for any comparable client accounts, and representations made by Templeton that, for fee comparison purposes, it does not manage any comparable client accounts and therefore could not provide fee schedules for comparable investment accounts managed by Templeton. The Board did not request profitability data from the subadvisors because the Board did not view this data as imperative to its deliberations given thearm’s-length nature of the relationship between the Manager and the subadvisors with respect to the negotiation of subadvisory fee rates. In addition, the Board considered that it was advised that the subadvisors may not account for their profits on anaccount-by-account basis and that different firms likely employ different methodologies in connection with these calculations.
Based on the foregoing information, the Board concluded that the profitability levels of the Manager were reasonable in light of the services performed by the Manager. A discussion regarding the Board’s considerations with respect to the Fund’s fee rates is set forth below under “Additional Considerations and Conclusions with Respect to the Fund.”
Economies of Scale.In considering the reasonableness of the management and investment advisory fees rates, the Board considered whether economies of scale will be realized as the Fund grows and whether fee rate levels reflect these economies of scale for the benefit of Fund shareholders. In this regard, the Board considered that, with respect to each subadvisor, the Manager has negotiated breakpoints in the subadvisory fee rate for the Fund. In addition, the Board noted the Manager’s representation that the Management Agreement contains fee schedule breakpoints at higher asset levels with respect to the Fund. Based on the foregoing information, the Board concluded that the Manager and subadvisor fee rate schedules for the Fund provide for a reasonable sharing of benefits from any economies of scale with the Fund.
Benefits Derived from the Relationship with the Fund.The Board considered the“fall-out” or ancillary benefits that accrue to the Manager and/or the subadvisors as a result of the advisory relationships with the Fund, including greater exposure in the marketplace with respect to the Manager’s or a subadvisor’s investment process and expanding the level of assets under management by the Manager and the subadvisors. The Board also considered that the Manager may invest the Fund’s cash balances and cash collateral provided by the borrowers of the Fund’s securities in the American Beacon U.S. Government Money Market Select Fund, which the Manager manages directly. In addition, the Board noted that each subadvisor benefits from soft dollar arrangements for proprietary and/or third-party research. Based on the foregoing information, the Board concluded that the potential benefits accruing to the Manager and the subadvisors by virtue of their relationships with the Fund appear to be fair and reasonable.
Additional Considerations and Conclusions with Respect to the Fund
The performance comparisons below were made in comparison to the Fund’s Broadridge performance universe and Morningstar Category. With respect to the Broadridge performance universe, the 1st Quintile represents the top 20 percent of the universe based on performance and the 5th Quintile representing the bottom
67
Disclosure Regarding Approval of the Management and Investment Advisory Agreements(Unaudited)
20 percent of the universe based on performance. References below to the Fund’s Broadridge performance universe are to the universe of mutual funds with a comparable investment classification/objective included in the analysis provided by Broadridge. In reviewing the performance, the Trustees viewed longer-term performance over a full market cycle as the most important consideration, because relative performance over shorter periods may be significantly impacted by market or economic events and not necessarily reflective of manager skill.
The expense comparisons below were made in comparison to the Fund’s Broadridge expense universe and Broadridge expense group, with the 1st Quintile representing the lowest 20 percent of the universe or group based on lowest total expense and the 5th Quintile representing the highest 20 percent of the universe or group based on highest total expense. References below to the Fund’s expense group and expense universe are to the respective group or universe of comparable mutual funds included in the analysis by Broadridge. A Broadridge expense group consists of the Fund and a representative sample of funds with similar operating structures and asset sizes, as selected by Broadridge. A Broadridge expense universe includes all funds in the investment classification/objective with a similar operating structure as the share class of the Fund included in the Broadridge comparative information and provides a broader view of expenses across the Fund’s investment classification/objective. The Board also considered the Fund’s Morningstar fee level category. In reviewing expenses, the Board considered the positive impact of fee waivers where applicable and the Manager’s agreement to continue the fee waivers. In addition, information regarding the subadvisors’ use of soft dollars was requested from the Manager and was considered by the Board.
In considering the renewal of the Management Agreement for the Fund, the Board considered the following additional factors:
Broadridge Total Expenses Excluding12b-1 Fees and Morningstar Fee Level Ranking
Compared to Broadridge Expense Group | 1st Quintile | |
Compared to Broadridge Expense Universe | 1st Quintile | |
Morningstar Fee Level Ranking – Institutional Class | Below Average Expense Ratio |
Broadridge and Morningstar Performance Analysis(five-year period ended December 31, 2018)
Compared to Broadridge Performance Universe | 4th Quintile | |
Compared to Morningstar Category | 2nd Quintile |
In considering the renewal of the Investment Advisory Agreements with each subadvisor, the Board considered that the diversification of investment strategies facilitated by the Fund’s multi-manager structure permits the Fund to mitigate the risks associated with a single subadvisor. The Board also considered the following additional factors:
Subadvisor Performance(compared to Broadridge Performance Universe for period indicated ended December 31, 2018)
Causeway | 5 Years | 2 | nd Quintile | |||||
Lazard | 5 Years | 1 | st Quintile | |||||
Templeton | 5 Years | 5 | th Quintile |
The Board also considered: (1) that, given the Fund’s value focus, the Morningstar Foreign Large Value category would provide a more appropriate peer group comparison than the Broadridge performance universe, which utilizes the Lipper Foreign Large Core category; (2) the Fund’s more limited exposure to emerging market countries than the funds in its Broadridge performance universe and, accordingly, the Manager expects the Fund to underperform its Broadridge and Morningstar peer groups when emerging markets outperform developed markets; (3) Templeton’s representations regarding the implementation of enhancements to its investment process and personnel changes; (4) information provided by each subadvisor, other than Templeton, regarding fee rates charged for managing assets in the same or a similar strategy as the subadvisor manages its allocation of the Fund;
68
Disclosure Regarding Approval of the Management and Investment Advisory Agreements(Unaudited)
(5) Templeton’s representation that it has no other comparable accounts in the same strategy as the subadvisor manages its allocation of the Fund; (6) the Manager’s recommendation to continue to retain each subadvisor; and (7) the Manager’s representation that, while the Manager was recommending that the Board continue to retain Templeton, the Manager continues to evaluate the performance of Templeton’s portion of the Fund and whether to make any further recommendations with respect to that subadvisor.
Based on these and other considerations, the Board: (1) concluded that the fees paid to the Manager and the subadvisors under the Management and Investment Advisory Agreements are fair and reasonable; and (2) determined that the Fund and its shareholders would benefit from the Manager’s and subadvisors’ continued management of the Fund.
69
Trustees and Officers of the American Beacon FundsSM(Unaudited)
The Trustees and officers of the American Beacon Funds (the “Trust”) are listed below, together with their principal occupations during the past five years. The address of each person listed below is 220 Las Colinas Boulevard East, Suite 1200, Irving, Texas 75039. Each Trustee overseesthirty-six funds in the fund complex that includes the Trust, the American Beacon Select Funds, the American Beacon Institutional Funds Trust, the American Beacon Sound Point Enhanced Income Fund, American Beacon Apollo Total Return Fund and the American Beacon Sound Point Alternative Lending Fund. The Trust’s Statement of Additional Information contains additional information about the Trustees and is available without charge by calling1-800-658-5811.
Name, Age | Position, Term of Office and Length of Time Served with the Trust | Principal Occupation(s) During Past 5 Years and Current Directorships | ||
| INTERESTED TRUSTEES | Term | |||
Lifetime of Trust until removal, resignation or retirement* | ||||
| Alan D. Feld** (82) | Trustee since 1996 | Partner in the law firm of Akin, Gump, Strauss, Hauer & Feld, LLP (law firm) (1960-Present); Trustee, American Beacon Select Funds (1999-Present); Trustee, American Beacon Institutional Funds Trust (2017-Present); Trustee, American Beacon Sound Point Enhanced Income Fund (2018-Present); Trustee, American Beacon Apollo Total Return Fund (2018-Present); Trustee, American Beacon Sound Point Alternative Lending Fund (2019-Present). | ||
| NON-INTERESTED TRUSTEES | Term | |||
Lifetime of Trust until removal, resignation or retirement* | ||||
| Gilbert G. Alvarado (49) | Trustee since 2015 | Director, Kura MD, Inc. (local telehealth organization) (2015-present); Vice President & CFO, Sierra Health Foundation (health conversion private foundation) (2006-Present); Vice President & CFO, Sierra Health Foundation: Center for Health Program Management (California public benefit corporation) (2012-Present); Director, Innovative North State (2012-2015); Director, Sacramento Regional Technology Alliance (2011-2016); Director, Women’s Empowerment (2009-2014); Director, Valley Healthcare Staffing (2017-present); Trustee, American Beacon Select Funds (2015-Present); Trustee, American Beacon Institutional Funds Trust (2017-Present); Trustee, American Beacon Sound Point Enhanced Income Fund (2018-Present); Trustee, American Beacon Apollo Total Return Fund (2018-Present); Trustee, American Beacon Sound Point Alternative Lending Fund (2019-Present). | ||
| Joseph B. Armes (57) | Trustee since 2015 | Chairman & CEO, CSW Industrials f/k/a Capital Southwest Corporation (investment company) (2015-Present); Chairman of the Board of Capital Southwest Corporation, predecessor to CSW Industrials, Inc. (2014-2017) (investment company); CEO, Capital Southwest Corporation (2013-2015); President & CEO, JBA Investment Partners (family investment vehicle) (2010-Present); Director and Chair of Audit Committee, RSP Permian (oil and gas producer) (2013-Present); Trustee, American Beacon Select Funds (2015-Present); Trustee, American Beacon Institutional Funds Trust (2017-Present); Trustee, American Beacon Sound Point Enhanced Income Fund (2018-Present); Trustee, American Beacon Apollo Total Return Fund (2018-Present); Trustee, American Beacon Sound Point Alternative Lending Fund (2019-Present). | ||
| Gerard J. Arpey (61) | Trustee since 2012 | Director, The Home Depot, Inc. (2015-Present); Partner, Emerald Creek Group (private equity firm) (2011-Present); Director, S.C. Johnson & Son, Inc. (privately held company) (2008-present); Trustee, American Beacon Select Funds (2012-Present); Trustee, American Beacon Institutional Funds Trust (2017-Present); Trustee, American Beacon Sound Point Enhanced Income Fund (2018-Present); Trustee, American Beacon Apollo Total Return Fund (2018-Present); Trustee, American Beacon Sound Point Alternative Lending Fund (2019-Present). | ||
70
Trustees and Officers of the American Beacon FundsSM(Unaudited)
Name, Age | Position, Term of Office and Length of Time Served with the Trust | Principal Occupation(s) During Past 5 Years and Current Directorships | ||
| NON-INTERESTED TRUSTEES (CONT.) | Term | |||
Lifetime of Trust until removal, resignation or retirement* | ||||
| Brenda A. Cline (58) | Trustee since 2004 Chair since 2019 Vice Chair 2018 | Chief Financial Officer, Treasurer and Secretary, Kimbell Art Foundation (1993-Present); Director, Tyler Technologies, Inc. (public sector software solutions company) (2014-Present); Director, Range Resources Corporation (oil and natural gas company) (2015-Present); Trustee, CushingClosed-End andOpen-End Funds and ETFs (2017-Present); Trustee, American Beacon Select Funds (2004-Present); Trustee, American Beacon Institutional Funds Trust (2017-Present); Trustee, American Beacon Sound Point Enhanced Income Fund (2018-Present); Trustee, American Beacon Apollo Total Return Fund (2018-Present); Trustee, American Beacon Sound Point Alternative Lending Fund (2019-Present). | ||
| Eugene J. Duffy (65) | Trustee since 2008 | Managing Director, Global Investment Management Distribution, Mesirow Financial (2016-Present); Managing Director, Institutional Services, Intercontinental Real Estate Corporation (2014-Present); Principal and Executive Vice President, Paradigm Asset Management (1994-2014); Trustee, American Beacon Select Funds (2008-Present); Trustee, American Beacon Institutional Funds Trust (2017-Present); Trustee, American Beacon Sound Point Enhanced Income Fund (2018-Present); Trustee, American Beacon Apollo Total Return Fund (2018-Present); Trustee, American Beacon Sound Point Alternative Lending Fund (2019-Present). | ||
| Claudia A. Holz (62) | Trustee since 2018 | Partner, KPMG LLP (1990-2017); Trustee, American Beacon Select Funds (2018-Present); Trustee, American Beacon Institutional Funds Trust (2018-Present); Trustee, American Beacon Sound Point Enhanced Income Fund (2018-Present); Trustee, American Beacon Apollo Total Return Fund (2018-Present); Trustee, American Beacon Sound Point Alternative Lending Fund (2019-Present). | ||
| Douglas A. Lindgren (57) | Trustee since 2018 | CEO North America, Carne Global Financial Services (2016-2017); Managing Director, IPS Investment Management and Global Head, Content Management, UBS Wealth Management (2010-2016); Trustee, American Beacon Select Funds (2018-Present); Trustee, American Beacon Institutional Funds Trust (2018-Present); Trustee, American Beacon Sound Point Enhanced Income Fund (2018-Present); Trustee, American Beacon Apollo Total Return Fund (2018-Present); Trustee, American Beacon Sound Point Alternative Lending Fund (2019-Present). | ||
| Richard A. Massman (76) | Trustee since 2004 Chair 2008-2018 Chair Emeritus since 2019 | Consultant and General Counsel Emeritus, Hunt Consolidated, Inc. (holding company engaged in oil and gas exploration and production, refining, real estate, farming, ranching and venture capital activities) (2009-Present); Trustee, American Beacon Select Funds (2004-Present); Trustee, American Beacon Institutional Funds Trust (2017-Present); Trustee, American Beacon Sound Point Enhanced Income Fund (2018-Present); Trustee, American Beacon Apollo Total Return Fund (2018-Present); Trustee, American Beacon Sound Point Alternative Lending Fund (2019-Present). | ||
| Barbara J. McKenna, CFA (56) | Trustee since 2012 | President/Managing Principal, Longfellow Investment Management Company (2005-Present); Trustee, American Beacon Select Funds (2012-Present); Trustee, American Beacon Institutional Funds Trust (2017-Present); Trustee, American Beacon Sound Point Enhanced Income Fund (2018-Present); Trustee, American Beacon Apollo Total Return Fund (2018-Present); Trustee, American Beacon Sound Point Alternative Lending Fund (2019-Present). | ||
71
Trustees and Officers of the American Beacon FundsSM(Unaudited)
Name, Age | Position, Term of Office and Length of Time Served with the Trust | Principal Occupation(s) During Past 5 Years and Current Directorships | ||
| NON-INTERESTED TRUSTEES (CONT.) | Term | |||
Lifetime of Trust until removal, resignation or retirement* | ||||
| R. Gerald Turner (73) | Trustee since 2001 | President, Southern Methodist University (1995-Present); Director, J.C. Penney Company, Inc. (1996-Present); Director, Kronus Worldwide Inc. (chemical manufacturing) (2003-Present); Trustee, American Beacon Select Funds (2001-Present); Trustee, American Beacon Institutional Funds Trust (2017-Present); Trustee, American Beacon Sound Point Enhanced Income Fund (2018-Present); Trustee, American Beacon Apollo Total Return Fund (2018-Present); Trustee, American Beacon Sound Point Alternative Lending Fund (2019-Present). | ||
| OFFICERS | Term | |||
| One Year | ||||
| Gene L. Needles, Jr. (64) | President since 2009 | President (2009-2018), CEO and Director (2009-Present), and Chairman (2018-Present), American Beacon Advisors, Inc., President (2015-2018), Director and CEO (2015-Present), and Chairman (2018-Present), Resolute Investment Holdings, LLC; President (2015-2018), Director and CEO (2015-Present), and Chairman (2018-Present), Resolute Topco, Inc.; President (2015-2018); Director, and CEO (2015-Present), and Chairman (2018-Present), Resolute Acquisition, Inc.; President (2015-2018), Director and CEO (2015-Present), Chairman (2018-Present), Resolute Investment Managers, Inc.; Director, Chairman, President and CEO, Resolute Investment Distributors (2017-Present); Director, Chairman, President and CEO; Resolute Investment Services, Inc. (2017-Present); President and CEO, Lighthouse Holdings Parent, Inc. (2009-2015); President, CEO and Director, Lighthouse Holdings, Inc. (2009-2015); Manager, President and CEO, American Private Equity Management, LLC (2012-Present); Director, Chairman, President and CEO, Alpha Quant Advisors, LLC (2016-Present); Director, ARK Investment Management LLC (2016-Present); Director, Shapiro Capital Management LLC (2017-Present); Director, Chairman and CEO, Continuous Capital, LLC (2018-Present); President, American Beacon Cayman Managed Futures Strategy Fund, Ltd. (2014-Present); Director and President, American Beacon Cayman Transformational Innovation Company, LTD., (2017-2018); President, American Beacon Delaware Transformational Innovation Corporation (2017-2018); President American Beacon Cayman TargetRisk Company, Ltd. (2018-Present); Member, Investment Advisory Committee, Employees Retirement System of Texas (2017-Present); Trustee, American Beacon NextShares Trust (2015-Present); President, American Beacon Select Funds (2009-Present); President, American Beacon Institutional Funds Trust (2017-Present); President, American Beacon Sound Point Enhanced Income Fund (2018-Present); President, American Beacon Apollo Total Return Fund (2018-Present); Director, RSW Investments Holdings LLC, (2019-Present); Manager, SSI Investment Management, LLC (2019-Present); President, American Beacon Sound Point Alternative Lending Fund (2019-Present); Director, Green Harvest Asset Management (2019-Present). | ||
72
Trustees and Officers of the American Beacon FundsSM(Unaudited)
Name, Age | Position, Term of Office and Length of Time Served with the Trust | Principal Occupation(s) During Past 5 Years and Current Directorships | ||
| OFFICERS (CONT.) | Term | |||
| One Year | ||||
| Rosemary K. Behan (60) | VP, Secretary and Chief Legal Officer since 2006 | Vice President, Secretary and General Counsel, American Beacon Advisors, Inc. (2006-Present); Secretary, Resolute Investment Holdings, LLC (2015-Present); Secretary, Resolute Topco, Inc. (2015-Present); Secretary, Resolute Acquisition, Inc. (2015-Present); Vice President, Secretary and General Counsel, Resolute Investment Managers, Inc. (2015-Present); Secretary, Resolute Investment Distributors, Inc. (2017-Present); Vice President, Secretary and General Counsel, Resolute Investment Services, Inc. (2017-Present); Vice President and Secretary, Lighthouse Holdings Parent, Inc. (2008-2015); Vice President and Secretary, Lighthouse Holdings, Inc. (2008-2015); Secretary, American Private Equity Management, LLC (2008-Present); Secretary and General Counsel, Alpha Quant Advisors, LLC (2016-Present); Vice President and Secretary, Continuous Capital, LLC (2018-Present); Secretary, American Beacon Delaware Transformational Innovation Corporation (2017-2018); Secretary, American Beacon Cayman Transformational Innovation Company, Ltd. (2017-2018); Secretary, American Beacon Cayman Managed Futures Strategy Fund, Ltd. (2014-Present); Secretary, American Beacon Cayman TargetRisk Company, Ltd (2018-Present); Chief Legal Officer, Vice President and Secretary, American Beacon Select Funds (2006-Present); Chief Legal Officer, Vice President and Secretary, American Beacon Institutional Funds Trust (2017-Present); Chief Legal Officer, Vice President and Secretary, American Beacon Sound Point Enhanced Income Fund (2018-Present); Chief Legal Officer, Vice President and Secretary American Beacon Apollo Total Return Fund (2018-Present); Chief Legal Officer, Vice President and Secretary, American Beacon Sound Point Alternative Lending Fund (2019-Present); Secretary, Green Harvest Asset Management (2019-Present). | ||
| Brian E. Brett (59) | VP since 2004 | Senior Vice President, Head of Distribution (2012-Present), Vice President, Director of Sales (2004-2012), American Beacon Advisors, Inc.; Senior Vice President, Resolute Investment Managers, Inc. (2017-Present); Senior Vice President, Resolute Investment Distributors, Inc. (2018-Present), Senior Vice President, Resolute Investment Services, Inc. (2018-Present); Senior Vice President, Lighthouse Holdings Parent, Inc. (2008-2015); Senior Vice President, Lighthouse Holdings, Inc. (2008-2015); Vice President, American Beacon Select Funds (2004-Present); Vice President, American Beacon Institutional Funds Trust (2017-Present); Vice President American Beacon Sound Point Enhanced Income Fund (2018-Present); Vice President American Beacon Apollo Total Return Fund (2018-Present); Vice President, American Beacon Sound Point Alternative Lending Fund (2019-Present). | ||
| Paul B. Cavazos (50) | VP since 2016 | Chief Investment Officer and Senior Vice President, American Beacon Advisors, Inc. (2016-Present); Chief Investment Officer, DTE Energy (2007-2016); Vice President, American Private Equity Management, L.L.C. (2017-Present); Vice President, American Beacon Select Funds (2016-Present); Vice President, American Beacon Institutional Funds Trust (2017-Present); Vice President American Beacon Sound Point Enhanced Income Fund (2018-Present); Vice President American Beacon Apollo Total Return Fund (2018-Present); Vice President, American Beacon Sound Point Alternative Lending Fund (2019-Present). | ||
73
Trustees and Officers of the American Beacon FundsSM(Unaudited)
Name, Age | Position, Term of Office and Length of Time Served with the Trust | Principal Occupation(s) During Past 5 Years and Current Directorships | ||
| OFFICERS (CONT.) | Term | |||
| One Year | ||||
| Erica Duncan (49) | VP Since 2011 | Vice President, American Beacon Advisors, Inc. (2011-Present); Vice President, Resolute Investment Managers (2018-Present); Vice President, Resolute Investment Services, Inc. (2018-Present); Vice President, American Beacon Select Funds (2011-Present); Vice President, American Beacon Institutional Funds Trust (2017-Present); Vice President American Beacon Sound Point Enhanced Income Fund (2018-Present); Vice President American Beacon Apollo Total Return Fund (2018-Present); Vice President, American Beacon Sound Point Alternative Lending Fund (2019-Present). | ||
| Melinda G. Heika (58) | Treasurer since 2010 | Treasurer and CFO (2010-Present), American Beacon Advisors, Inc.; Treasurer, Resolute Topco, Inc. (2015-Present); Treasurer, Resolute Investment Holdings, LLC. (2015-Present); Treasurer, Resolute Acquisition, Inc. (2015-Present); Treasurer and CFO, Resolute Investment Managers, Inc. (2017-Present); Treasurer, Resolute Investment Distributors, Inc. (2017-2017); Treasurer and CFO, Resolute Investment Services, Inc. (2015-Present); Treasurer, Lighthouse Holdings Parent Inc., (2010-2015); Treasurer, Lighthouse Holdings, Inc. (2010-2015); Treasurer, American Private Equity Management, LLC (2012-Present); Treasurer and CFO, Alpha Quant Advisors, LLC (2016-Present); Treasurer and CFO, Continuous Capital, LLC (2018-Present); Treasurer, American Beacon Cayman Transformational Innovation, Ltd. (2017-2018); Treasurer, American Beacon Delaware Transformational Innovation Corporation (2017-2018); Director and Treasurer, American Beacon Cayman Managed Futures Strategy Fund, Ltd. (2014-Present); Treasurer, American Beacon Cayman TargetRisk Company, Ltd. (2018-Present); Treasurer, American Beacon Select Funds (2010-Present); Treasurer, American Beacon Institutional Funds Trust (2017-Present); Treasurer, American Beacon Sound Point Enhanced Income Fund (2018-Present); Treasurer, American Beacon Apollo Total Return Fund (2018-Present); Treasurer, American Beacon Sound Point Alternative Lending Fund (2019-Present); Treasurer, Green Harvest Asset Management (2019-Present). | ||
| Terri L. McKinney (55) | VP since 2010 | Vice President (2009-Present), Managing Director (2003-2009), American Beacon Advisors, Inc.; Vice President, Resolute Investment Managers, Inc. (2017-Present); Vice President, Resolute Investment Services, Inc (2018-Present); Vice President, Alpha Quant Advisors, LLC (2016-Present); Vice President, Continuous Capital, LLC (2018-Present); Vice President, American Beacon Select Funds (2010-Present); Vice President, American Beacon Institutional Funds Trust (2017-Present); Vice President, American Beacon Sound Point Enhanced Income Fund (2018-Present); Vice President, American Beacon Apollo Total Return Fund (2018-Present); Vice President, American Beacon Sound Point Alternative Lending Fund (2019-Present). | ||
74
Trustees and Officers of the American Beacon FundsSM(Unaudited)
Name, Age | Position, Term of Office and Length of Time Served with the Trust | Principal Occupation(s) During Past 5 Years and Current Directorships | ||
| OFFICERS (CONT.) | Term | |||
| One Year | ||||
| Jeffrey K. Ringdahl (44) | VP since 2010 | Director (2015-Present), President (2018-Present), Chief Operating Officer (2010-Present), Senior Vice President (2013-2018), Vice President (2010-2013), American Beacon Advisors, Inc.; Director (2015-Present), President (2018-Present), Senior Vice Present (2015-2018), Resolute Investment Holdings, LLC; Director (2015-Present), President (2018-Present), Senior Vice President (2015-2018), Resolute Topco, Inc.; Director (2015-Present), President (2018-Present), Senior Vice President (2015-2018), Resolute Acquisition, Inc.; Director (2015-Present), President & COO (2018-Present), Senior Vice President (2015-2018), Resolute Investment Managers, Inc.; Director and Executive Vice President (2017-Present), Resolute Investment Distributors, Inc.; Director (2017-Present), President & COO (2018-Present), Executive Vice President (2017-2018), Resolute Investment Services, Inc.; Senior Vice President (2017-Present), Vice President (2012-2017), Manager (2015-Present), American Private Equity Management, LLC; Senior Vice President, Lighthouse Holdings Parent, Inc. (2013-2015); Senior Vice President, Lighthouse Holdings, Inc. (2013-2015); Trustee, American Beacon NextShares Trust (2015-Present); Director, Executive Vice President & COO, Alpha Quant Advisors, LLC (2016-Present); Director, Shapiro Capital Management, LLC (2017-Present); Director, Executive Vice President & COO, Continuous Capital, LLC (2018-Present); Director and Vice President, American Beacon Cayman Transformational Innovation Company, Ltd., (2017-Present); Vice President, American Beacon Delaware Transformational Innovation Corporation (2017-2018); Director and Vice President, American Beacon Cayman Managed Futures Strategy Fund, Ltd. (2014-Present); Vice President, American Beacon Cayman TargetRisk Company, Ltd (2018-Present); Vice President, American Beacon Select Funds (2010-2018); Vice President, American Beacon Institutional Funds Trust (2017-Present); Vice President, American Beacon Sound Point Enhanced Income Fund (2018-Present); Vice President, American Beacon Apollo Total Return Fund (2018-Present); Director, RSW Investments Holdings LLC, (2019-Present); Manager, SSI Investment Management, LLC (2019-Present), Vice President, American Beacon Sound Point Alternative Lending Fund (2019-Present). | ||
| Samuel J. Silver (56) | VP Since 2011 | Vice President (2011-Present), Chief Fixed Income Officer (2016-Present), American Beacon Advisors, Inc. (2011-Present); Vice President, American Beacon Select Funds (2011-Present); Vice President, American Beacon Institutional Funds Trust (2017-Present); Vice President, American Beacon Sound Point Enhanced Income Fund (2018-Present); Vice President, American Beacon Apollo Total Return Fund (2018-Present); Vice President, American Beacon Sound Point Alternative Lending Fund (2019-Present). | ||
| Christina E. Sears (48) | Chief Compliance Officer since 2004 and Asst. Secretary since 1999 | Vice President, American Beacon Advisors, Inc. (2019-Present); Chief Compliance Officer, American Beacon Advisors, Inc. (2004-Present); Vice President, Resolute Investment Managers, Inc. (2017-Present); Vice President, Resolute Investment Distributors (2017-Present); Vice President, Resolute Investment Services, Inc. (2019-Present); Chief Compliance Officer, American Private Equity Management, LLC (2012-Present); Chief Compliance Officer (2016-2019) and Vice President, Alpha Quant Advisors, LLC (2016-Present); Vice President, Continuous Capital, LLC (2018-Present); Chief Compliance Officer (2004-Present) and Assistant Secretary (1999-Present), American Beacon Select Funds; Chief Compliance Officer and Assistant Secretary, American Beacon Institutional Funds Trust (2017-Present); Chief Compliance Officer and Assistant Secretary, American Beacon Sound Point Enhanced Income Fund (2018-Present); Chief Compliance Officer and Assistant Secretary, American Beacon Apollo Total Return Fund (2018-Present); Chief Compliance Officer and Assistant Secretary, American Beacon Sound Point Alternative Lending Fund (2019-Present). | ||
75
Trustees and Officers of the American Beacon FundsSM(Unaudited)
Name, Age | Position, Term of Office and Length of Time Served with the Trust | Principal Occupation(s) During Past 5 Years and Current Directorships | ||
| OFFICERS (CONT.) | Term | |||
| One Year | ||||
| Sonia L. Bates (62) | Asst. Treasurer since 2011 | Assistant Treasurer, American Beacon Advisors, Inc. (2011-2018); Assistant Treasurer, Lighthouse Holdings Parent Inc. (2011-2015); Assistant Treasurer, Lighthouse Holdings, Inc. (2011-2015); Assistant Treasurer, American Private Equity Management, LLC (2012-Present); Assistant Treasurer, American Beacon Cayman Transformational Innovation Company, Ltd. (2017-Present); Assistant Treasurer, American Beacon Cayman TargetRisk Company, Ltd. (2018-Present); Assistant Treasurer, American Beacon Select Funds (2011-Present); Assistant Treasurer, American Beacon Institutional Funds Trust (2017-Present); Assistant Treasurer, American Beacon Sound Point Enhanced Income Fund (2018-Present); Assistant Treasurer, American Beacon Apollo Total Return Fund (2018-Present); Assistant Treasurer, American Beacon Sound Point Alternative Lending Fund (2019-Present). | ||
| Shelley D. Abrahams (44) | Assistant Secretary since 2008 | Assistant Secretary, American Beacon Select Funds (2008-Present); Assistant Secretary, American Beacon Institutional Funds Trust (2017-Present); Assistant Secretary, American Beacon Sound Point Enhanced Income Fund (2018-Present); Assistant Secretary, American Beacon Apollo Total Return Fund (2018-Present); Assistant Secretary, American Beacon Sound Point Alternative Lending Fund (2019-Present); Assistant Secretary, Green Harvest Asset Management (2019-Present). | ||
| Rebecca L. Harris (52) | Assistant Secretary since 2010 | Vice President, American Beacon Advisors, Inc. (2011-Present); Vice President, Resolute Investment Managers, Inc. (2017-Present); Vice President, Resolute Investment Services (2015-Present); Vice President, Alpha Quant Advisors, LLC (2016-Present); Vice President, Continuous Capital, LLC (2018-Present); Assistant Secretary, American Beacon Select Funds (2010-Present); Assistant Secretary, American Beacon Institutional Funds Trust (2017-Present); Assistant Secretary, American Beacon Sound Point Enhanced Income Fund (2018-Present); Assistant Secretary, American Beacon Apollo Total Return Fund (2018-Present); Assistant Secretary, American Beacon Sound Point Alternative Lending Fund (2019-Present). | ||
| Teresa A. Oxford (61) | Assistant Secretary since 2015 | Assistant Secretary, American Beacon Advisors, Inc. (2015-Present); Assistant Secretary, Resolute Investment Distributors (2018-Present); Assistant Secretary, Resolute Investment Services (2018-Present); Assistant Secretary, Alpha Quant Advisors, LLC (2016-Present); Assistant Secretary, American Beacon Select Funds (2015-Present); Assistant Secretary, American Beacon Institutional Funds Trust (2017-Present); Assistant Secretary, American Beacon Sound Point Enhanced Income Fund (2018-Present); Assistant Secretary, American Beacon Apollo Total Return Fund (2018-Present); Assistant Secretary, American Beacon Sound Point Alternative Lending Fund (2019-Present); Assistant Secretary, Green Harvest Asset Management (2019-Present). | ||
* As of 11/12/2014, the Board adopted a retirement plan that requires Trustees, other than Messrs. Feld and Massman to retire no later than the last day of the calendar year in which they reach the age of 75. As of 11/7/17, the Board approved a waiver of the mandatory retirement policy with respect to Mr. Massman, who turned 75 in November 2018, to permit him to continue to serve on the Board as Chair Emeritus through 12/31/19.
** Mr. Feld is deemed to be an “interested person” of the Trusts, as defined by the 1940 Act. Mr. Feld’s law firm of Akin, Gump, Strauss, Hauer & Feld LLP has provided legal services within the past two fiscal years to one or more of the Trust’ssub-advisors.
76
American Beacon FundsSM
October 31, 2019 (Unaudited)
The American Beacon Funds recognize and respect the privacy of our shareholders. We are providing this notice to you so you will understand how shareholder information may be collected and used.
We may collect nonpublic personal information about you from one or more of the following sources:
| • | information we receive from you on applications or other forms; |
| • | information about your transactions with us or our service providers; and |
| • | information we receive from third parties. |
We do not disclose any nonpublic personal information about our customers or former customers to anyone, except as permitted by law.
We restrict access to your nonpublic personal information to those employees or service providers who need to know that information to provide products or services to you. To ensure the confidentiality of your nonpublic personal information, we maintain safeguards that comply with federal standards.
77
This page intentionally left blank.
78
This page intentionally left blank.
79
This page intentionally left blank.
80

eDelivery isNOW AVAILABLE - Stop traditional mail delivery and receive your
shareholder reports and summary prospectuson-line. Sign up at
www.americanbeaconfunds.com
If you invest in the Fund through a financial institution, you may be able to receive the Fund’s regulatory mailings, such as the Prospectus, Annual Report and Semi-Annual Report, bye-mail. If you are interested in this option, please go towww.icsdelivery.com and search for your financial institution’s name or contact your financial institution directly.
To obtain more information about the Fund:
 |  | |
| ByE-mail: | On the Internet: | |
| american_beacon.funds@ambeacon.com | Visit our website atwww.americanbeaconfunds.com | |
By Telephone: Call (800)658-5811 |
By Mail: American Beacon Funds P.O. Box 219643 Kansas City, MO 64121-9643 | |
| Availability of Quarterly Portfolio Schedules | Availability of Proxy Voting Policy and Records | |
| In addition to the Schedule of Investments provided in eachsemi-annual and annual report, the Fund files a complete schedule of its portfolio holdings with the Securities and Exchange Commission (“SEC”) onForm N-PORT as of the first and third fiscal quarters. The Fund’sForms N-PORT are available on the SEC’s website atwww.sec.gov. TheForms N-PORT may also be reviewed and copied at the SEC’s Public Reference Section, 100 F Street, NE, Washington, D.C. 20549-2736. Information regarding the operation of the SEC’s Public Reference Room may be obtained by calling(800)-SEC-0330. A complete schedule of the Fund’s portfolio holdings is also available atwww.americanbeaconfunds.com approximately twenty days after the end of each month. | A description of the policies and procedures the Fund uses to determine how to vote proxies relating to portfolio securities is available in the Fund’s Statement of Additional Information, is available free of charge on the Fund’s websitewww.americanbeaconfunds.com and by calling1-800-967-9009 or by accessing the SEC’s website atwww.sec.gov. The Fund’s proxy voting record for the most recent year ended June 30 is filed annually with the SEC onForm N-PX. The Fund’sForms N-PX are available on the SEC’s website atwww.sec.gov. The Fund’s proxy voting record may also be obtained by calling1-800-967-9009. | |


Fund Service Providers:
CUSTODIAN State Street Bank and Trust Company Boston, Massachusetts | TRANSFER AGENT DST Asset Manager Solutions, Inc. Quincy, Massachusetts | INDEPENDENT REGISTERED PUBLIC ACCOUNTING FIRM Ernst & Young LLP Dallas, Texas | DISTRIBUTOR Resolute Investment Distributors, Inc. Irving, Texas |
This report is prepared for shareholders of the American Beacon Funds and may be distributed to others only if preceded or accompanied by a current Prospectus or Summary Prospectus.
American Beacon Funds, American Beacon International Equity Fund and American Beacon Tocqueville International Value Fund are service marks of American Beacon Advisors, Inc.
AR 10/19
About American Beacon Advisors
Since 1986, American Beacon Advisors has offered a variety of products and investment advisory services to numerous institutional and retail clients, including a variety of mutual funds, corporate cash management, and separate account management.
Our clients include defined benefit plans, defined contribution plans, foundations, endowments, corporations, financial planners, and other institutional investors. With American Beacon Advisors, you can put the experience of a multi-billion dollar asset management firm to work for your company.
LARGE CAP VALUE FUND RISKS
Investing invalue stocksmay limit downside risk over time; however, the Fund may produce more modest gains than riskier stock funds as atrade-off for this potentially lower risk. Investing inforeign securitiesmay involve heightened risk due to currency fluctuations and economic and political risks. The use offutures contractsfor cash management may subject the Fund to losing more money than invested. The Fund participates in asecurities lendingprogram. Please see the prospectus for a complete discussion of the Fund’s risks. There can be no assurances that the investment objectives of this Fund will be met.
Any opinions herein, including forecasts, reflect our judgment as of the end of the reporting period and are subject to change. Each advisor’s strategies and the Fund’s portfolio composition will change depending on economic and market conditions. This report is not a complete analysis of market conditions and therefore, should not be relied upon as investment advice. Although economic and market information has been compiled from reliable sources, American Beacon Advisors, Inc. makes no representation as to the completeness or accuracy of the statements contained herein.
American Beacon Funds | October 31, 2019 |
Contents
| 1 | ||||
| 2 | ||||
| 6 | ||||
| 8 | ||||
Schedule of Investments: | ||||
| 9 | ||||
| 17 | ||||
| 20 | ||||
Financial Highlights: | ||||
| 39 | ||||
| 46 | ||||
Disclosure Regarding Approval of the Management and Investment Advisory Agreements | 47 | |||
| 52 | ||||
| 59 | ||||
Additional Fund Information | Back Cover | |||
 | Dear Shareholders,
In recent months, you’ve likely seen and heard news reports about disruptive headwinds in the global economy –including the U.S. trade war with China and its toll on the global economy, slowing global growth, the Federal Reserve’s series of rate cuts, Brexit, disruptions in the Middle East and protests in Hong Kong – and watched a flood of reaction in the world’s markets.
As Peter L. Bernstein said in his treatise on risk,Against the Gods: The Remarkable Story of Risk, published by John Wiley & Sons, Inc. in September 1998, “Volatility is a proxy for uncertainty and must be accommodated in measuring investment risk.”
During times of economic uncertainty and market volatility, fear of loss can be a powerful emotion – one that drives many investors to making short-term decisions subject to a variety of potential error-leading biases. Unfortunately, some short-term investment decisions may create more volatility rather than mitigate it. |
Instead of dwelling on the markets’ short-term reaction to waves of negative global news, we encourage investors to focus on the horizon instead. Long-term investing isn’t about identifying and anticipating the next big market move, it is about identifying the right investment products for riding out those moves. As a long-term investor, you should keep in mind the three Ds:direction,disciplineanddiversification.
| u | Direction:Achieving your long-term financial goals requires an individualized plan of action. You may want your plan to provide some measure of protection against periods of geopolitical turmoil, economic uncertainty, market volatility and job insecurity. Your plan should be reviewed annually and be adjusted in the event your long-range needs change. |
| u | Discipline:Long-term, systematic participation in an investment portfolio requires your resolution to stay the course. Spending time in the market – rather than trying to time the market – may place you in a better position to reach your long-term financial goals. |
| u | Diversification:By investing in different investment styles and asset classes, you may be able to help mitigate financial risks across your investment portfolio. By allocating your investment portfolio according to your risk-tolerance level, you may be better positioned to weather storms and achieve your long-term financial goals. |
Since 1986, American Beacon has endeavored to provide investors with a disciplined approach to realizing long-term financial goals.As a manager of managers, we strive to provide investment products that may enable investors to participate during market upswings while potentially insulating against market downswings.
Many of thesub-advisors to our mutual funds pursue upside capture and/or downside protection using proprietary strategies. The investment teams behind our mutual funds seek to produce consistent, long-term results rather than focus only on short-term movements in the markets. In managing our investment products, we emphasize identifying opportunities that offer the potential for long-term rewards.
Our management approach is more than a concept; it’s the cornerstone of our culture. And we strive to apply it at every turn as we seek to provide a well-diversified line of investment solutions to help our shareholders seeklong-term rewards while mitigating volatility and risk.
Thank you for your continued interest in American Beacon. For additional information about our investment products or to access your account information, please visit our website atwww.americanbeaconfunds.com.
Best Regards,

Gene L. Needles, Jr.
President
American Beacon Funds
1
Domestic Equity Market Overview
October 31, 2019 (Unaudited)
For the12-month period ended October 31, 2019, the U.S. equity markets rallied strongly after a depressed start to the period that saw market volatility spike to its highest level in seven years during the fourth quarter of 2018. The S&P 500 Index and the Dow Jones Industrial Average returned 14.33% and 10.32%, respectively, for the period. Growth broadly outperformed Value across all market caps; the Russell 1000 Growth Index and the Russell 1000 Value Index returned 17.10% and 11.21%, respectively, and the Russell Midcap Growth Index and the Russell Midcap Value Index returned 18.93% and 10.08%, respectively. Large andmid-cap stocks also did significantly better thansmall-cap stocks; the Russell 1000 Index returned 14.15% and the Russell Midcap Index returned 13.72%, compared to the Russell 2000 Index return of 4.90%.
All of this occurred in an environment that saw rising fears of economic recession as the current expansion entered its 11th year, intensified by the effects of an escalating trade war, as well as concerns over the ability of the Federal Reserve (the “Fed”) policy to forestall the effects of an economic downturn. Feeding these uncertainties, growth slowed during the period as the third quarter’s gross domestic product decelerated to 1.9% from its peak rate of 3.5% in the second quarter of 2018. Corporate earnings growth also slowed with profit growth.
The Fed did alter its policy course at year end 2018 and began lowering the federal funds rate in the third quarter of 2019. At the same time, the economic strength underlying the U.S. economy remained resilient with the September unemployment rate at 3.5%, a40-year low. In addition, the consumer continued to show good strength with both income and expenditures growing at healthy rates. Also, ongoing tariff negotiations between the U.S. and China are providing hope to prospects of settlement. Collectively, all of these factors kept the markets positive going into the fiscal year end.
2
American Beacon Large Cap Value FundSM
Performance Overview
October 31, 2019 (Unaudited)
The Investor Class of the American Beacon Large Cap Value Fund (the “Fund”) returned 9.81% for the twelve months ended October 31, 2019, underperforming the Russell 1000® Value Index (the “Index”) return of 11.21% for the same period.
Comparison of Change in Value of a $10,000 Investment for the period from 10/31/2009 through 10/31/2019
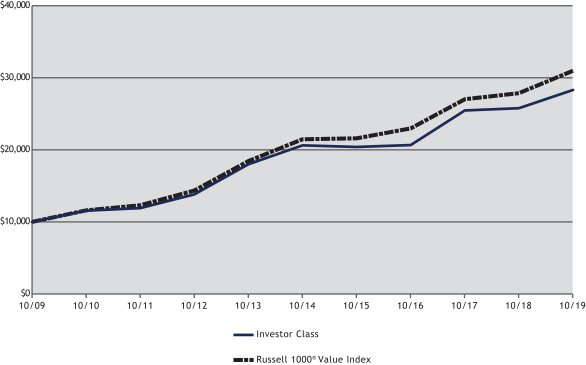
| Total Returns for the Period ended October 31, 2019 |
| |||||||||||||||||||||||||||||||
Ticker | 1 Year | 3 Years | 5 Years | 10 Years | Value of $10,000 10/31/2009- 10/31/2019 | |||||||||||||||||||||||||||
Institutional Class (1,6) | AADEX | 10.18 | % | 11.40 | % | 6.89 | % | 11.34 | % | $ | 29,271 | |||||||||||||||||||||
Y Class (1,6) | ABLYX | 10.05 | % | 11.30 | % | 6.80 | % | 11.24 | % | $ | 29,011 | |||||||||||||||||||||
Investor Class (1,6) | AAGPX | 9.81 | % | 11.03 | % | 6.53 | % | 10.96 | % | $ | 28,282 | |||||||||||||||||||||
Advisor Class (1,6) | AVASX | 9.56 | % | 10.84 | % | 6.36 | % | 10.79 | % | $ | 27,870 | |||||||||||||||||||||
A Class without sales charge (1,2,6) | ALVAX | 9.68 | % | 10.97 | % | 6.48 | % | 10.86 | % | $ | 28,046 | |||||||||||||||||||||
A Class with sales charge (1,2,6) | ALVAX | 3.36 | % | 8.80 | % | 5.23 | % | 10.21 | % | $ | 26,427 | |||||||||||||||||||||
C Class without sales charge (1,3,6) | ALVCX | 8.94 | % | 10.23 | % | 5.74 | % | 10.11 | % | $ | 26,202 | |||||||||||||||||||||
C Class with sales charge (1,3,6) | ALVCX | 7.94 | % | 10.23 | % | 5.74 | % | 10.11 | % | $ | 26,202 | |||||||||||||||||||||
R6 Class (1,4,6) | AALRX | 10.15 | % | 11.40 | % | 6.89 | % | 11.34 | % | $ | 29,273 | |||||||||||||||||||||
Russell 1000® Value Index (5) | 11.21 | % | 10.51 | % | 7.61 | % | 11.96 | % | $ | 30,959 | ||||||||||||||||||||||
| 1. | Performance shown is historical and is not indicative of future returns. Investment returns and principal value will vary, and shares may be worth more or less at redemption than at original purchase. Performance shown is calculated based on the published end of day net asset values as of date indicated, and current performance may be lower or higher than the performance data quoted. To obtain performance as of the most recent month end, please visitwww.americanbeaconfunds.com or call1-800-967-9009. Fund performance in the table above does not reflect the deduction of taxes a shareholder would pay on distributions or the redemption of shares. Generally accepted accounting principles require adjustments to be made to the net assets of the Fund at period end for financial reporting purposes only; and as such, the total return based on the unadjusted net asset value per share may differ from the total return reported in the financial highlights. |
3
American Beacon Large Cap Value FundSM
Performance Overview
October 31, 2019 (Unaudited)
| 2. | Fund performance for theten-year period represents the total returns achieved by the Investor Class from 10/31/09 through 5/17/10, the inception date of the A Class, and the returns of the A Class since its inception. Expenses of the A Class are higher than those of the Investor Class. As a result, total returns shown may be higher than they would have been had the A Class been in existence since 10/31/09. A Class shares have a maximum sales charge of 5.75%. |
| 3. | Fund performance for theten-year period represents the total returns achieved by the Investor Class from 10/31/09 through 9/1/10, the inception date of the C Class, and the returns of the C Class since its inception. Expenses of the C Class are higher than those of the Investor Class. As a result, total returns shown may be higher than they would have been had the C Class been in existence since 10/31/09. A portion of the fees charged to the C Class was waived from 2010 through 2012, partially recovered in 2013 and 2014, and waived in 2018. Performance prior to waiving fees was lower than the actual returns shown for 2010 through 2012 and for 2018. C Class shares have a maximum contingent deferred sales charge of 1.00% for shares redeemed within one year of the date of purchase. |
| 4. | Fund performance for the three-year, five-year andten-year periods represents the returns achieved by the Institutional Class from 10/31/09 through 2/28/17, the inception date of the R6 Class, and the returns of the R6 Class since its inception. Expenses of the R6 Class are lower than those of the Institutional Class. As a result, total returns shown may be lower than they would have been had the R6 Class been in existence since 10/31/09. A portion of the fees charged to the R6 Class of the Fund was waived in 2017 and 2018 and partially recovered in 2019. Performance prior to waiving fees was lower than the actual returns shown for 2017 and 2018. |
| 5. | The Russell 1000 Value Index is an unmanaged index of those stocks in the Russell 1000 Index with lowerprice-to-book ratios and lower forecasted growth values. Russell 1000 Value Index and Russell 1000 Index are registered trademarks of Frank Russell Company. Frank Russell Company (“Russell”) is the source and owner of the trademarks, service marks and copyrights related to the Russell Indexes. Russell® is a trademark of Frank Russell Company. Neither Russell nor its licensors accept any liability for any errors or omissions in the Russell Indexes and/or Russell ratings or underlying data, and no party may rely on any Russell Indexes and/or Russell ratings and/or underlying data contained in this communication. No further distribution of Russell Data is permitted without Russell’s express written consent. Russell does not promote, sponsor or endorse the content of this communication. One cannot directly invest in an index. |
| 6. | The Total Annual Fund Operating Expense ratios set forth in the most recent Fund prospectus for the Institutional, Y, Investor, Advisor, A, C and R6 Class shares were 0.62%, 0.68%, 0.95%, 1.09%, 0.93%, 1.64% and 0.59%, respectively. The expense ratios above may vary from the expense ratios presented in other sections of this report that are based on expenses incurred during the period covered by this report. |
The Fund underperformed the Index as sector allocation detracted more value than that gained by stock selection for the twelve month period.
The Fund’s investments in the Consumer Discretionary and Financials sectors helped the most with respect to stock selection. Positions in Dollar General Corp. (up 44.7%) and PulteGroup, Inc. (up 62.9%) added to the Fund’s returns in the Consumer Discretionary sector. Within Financials, positions in American International Group (up 33.1%) and The Blackstone Group LP (up 48.7%) contributed to the Fund’s relative performance. Meanwhile, in the Consumer Staples sector, the Fund’s positions in Altria Group, Inc. (down 26.2%) and Imperial Brands Plc. Sponsored ADR (down 29.3%) hurt the Fund’s performance the most for the period.
Sector allocation weighed on relative performance as an overweight to Energy (down 12.3%) and an underweight to Real Estate (up 25.2%) hurt relative performance compared to the Index. The Fund’s overweight position in the Industrials sector (up 16.8%) somewhat muted relative underperformance during the period.
Thesub-advisors continue to invest in a broadly diversified portfolio of companies that they believe have attractive valuations and above-average earnings growth potential. This approach should allow the Fund to benefit over the longer term.
4
American Beacon Large Cap Value FundSM
Performance Overview
October 31, 2019 (Unaudited)
| Top Ten Holdings (% Net Assets) |
| |||||||
| JPMorgan Chase & Co. | 2.8 | |||||||
| Citigroup, Inc. | 2.7 | |||||||
| Wells Fargo & Co. | 2.4 | |||||||
| Medtronic PLC | 2.3 | |||||||
| Comcast Corp., Class A | 2.1 | |||||||
| Microsoft Corp. | 1.9 | |||||||
| American International Group, Inc. | 1.8 | |||||||
| Bank of America Corp. | 1.8 | |||||||
| BP PLC, Sponsored ADR | 1.7 | |||||||
| General Motors Co. | 1.7 | |||||||
| Total Fund Holdings | 190 | |||||||
| Sector Allocation (% Equities) |
| |||||||
| Financials | 23.8 | |||||||
| Health Care | 13.6 | |||||||
| Energy | 11.6 | |||||||
| Industrials | 11.0 | |||||||
| Information Technology | 10.1 | |||||||
| Consumer Discretionary | 8.5 | |||||||
| Communication Services | 6.2 | |||||||
| Materials | 5.7 | |||||||
| Consumer Staples | 5.3 | |||||||
| Utilities | 4.0 | |||||||
| Real Estate | 0.2 | |||||||
5
American Beacon Large Cap Value FundSM
October 31, 2019 (Unaudited)
Fund Expense Example
As a shareholder of a Fund, you incur two types of costs: (1) transaction costs, including sales charges (loads) on purchase payments and redemption fees if applicable, and (2) ongoing costs, including management fees, distribution(12b-1) fees,sub-transfer agent fees, and other Fund expenses. The Examples are intended to help you understand the ongoing cost (in dollars) of investing in the Fund and to compare these costs with the ongoing costs of investing in other mutual funds. The Examples are based on an investment of $1,000 invested at the beginning of the period in each Class and held for the entire period from May 1, 2019 through October 31, 2019.
Actual Expenses
The “Actual” lines of the table provide information about actual account values and actual expenses. You may use the information in this line, together with the amount you invested, to estimate the expenses that you paid over the period. Simply divide your account value by $1,000 (for example, an $8,600 account value divided by $1,000 = $8.60), then multiply the result by the “Expenses Paid During Period” to estimate the expenses you paid on your account during this period. Shareholders of the Investor and Institutional Classes that invest in the Fund through an IRA or Roth IRA may be subject to a custodial IRA fee of $15 that is typically deducted each December. If your account was subject to a custodial IRA fee during the period, your costs would have been $15 higher.
Hypothetical Example for Comparison Purposes
The “Hypothetical” lines of the table provide information about hypothetical account values and hypothetical expenses based on the Fund’s actual expense ratio and an assumed 5% per year rate of return before expenses (not the Fund’s actual return). You may compare the ongoing costs of investing in the Fund with other funds by contrasting this 5% hypothetical example and the 5% hypothetical examples that appear in the shareholder reports of the other funds. The hypothetical account values and expenses may not be used to estimate the actual ending account balance or expenses you paid for the period. Shareholders of the Investor and Institutional Classes that invest in the Fund through an IRA or Roth IRA may be subject to a custodial IRA fee of $15 that is typically deducted each December. If your account was subject to a custodial IRA fee during the period, your costs would have been $15 higher.
You should also be aware that the expenses shown in the table highlight only your ongoing costs and do not reflect any transaction costs charged by the Fund, such as sales charges (loads) or redemption fees, as applicable. Similarly, the expense examples for other funds do not reflect any transaction costs charged by those funds, such as sales charges (loads), redemption fees or exchange fees. Therefore, the “Hypothetical” lines of the table are useful in comparing ongoing costs only and will not help you determine the relative total costs of owning different funds. If you were subject to any transaction costs during the period, your costs would have been higher.
6
American Beacon Large Cap Value FundSM
Expense Example
October 31, 2019 (Unaudited)
| American Beacon Large Cap Value Fund | |||||||||||||||
| Beginning Account Value 5/1/2019 | Ending Account Value 10/31/2019 | Expenses Paid During Period 5/1/2019-10/31/2019* | |||||||||||||
| Institutional Class | |||||||||||||||
| Actual | $1,000.00 | $1,025.30 | $3.32 | ||||||||||||
| Hypothetical** | $1,000.00 | $1,021.93 | $3.31 | ||||||||||||
| Y Class | |||||||||||||||
| Actual | $1,000.00 | $1,025.20 | $3.62 | ||||||||||||
| Hypothetical** | $1,000.00 | $1,021.63 | $3.62 | ||||||||||||
| Investor Class | |||||||||||||||
| Actual | $1,000.00 | $1,023.60 | $5.00 | ||||||||||||
| Hypothetical** | $1,000.00 | $1,020.27 | $4.99 | ||||||||||||
| Advisor Class | |||||||||||||||
| Actual | $1,000.00 | $1,023.10 | $5.71 | ||||||||||||
| Hypothetical** | $1,000.00 | $1,019.56 | $5.70 | ||||||||||||
| A Class | |||||||||||||||
| Actual | $1,000.00 | $1,023.50 | $5.36 | ||||||||||||
| Hypothetical** | $1,000.00 | $1,019.91 | $5.35 | ||||||||||||
| C Class | |||||||||||||||
| Actual | $1,000.00 | $1,019.60 | $8.70 | ||||||||||||
| Hypothetical** | $1,000.00 | $1,016.59 | $8.69 | ||||||||||||
| R6 Class | |||||||||||||||
| Actual | $1,000.00 | $1,025.40 | $2.96 | ||||||||||||
| Hypothetical** | $1,000.00 | $1,022.28 | $2.96 | ||||||||||||
| * | Expenses are equal to the Fund’s annualized expense ratios for thesix-month period of 0.65%, 0.71%, 0.98%, 1.12%, 1.05%, 1.71%, and 0.58% for the Institutional, Y, Investor, Advisor, A, C, and R6 Classes, respectively, multiplied by the average account value over the period, multiplied by the number derived by dividing the number of days in the most recent fiscal half-year (184) by days in the year (365) to reflect the half-year period. |
| ** | 5% return before expenses. |
7
American Beacon Large Cap Value FundSM
Report of Independent Registered Public Accounting Firm
To the Shareholders and the Board of Trustees of
American Beacon Large Cap Value Fund
Opinion on the Financial Statements
We have audited the accompanying statement of assets and liabilities of American Beacon Large Cap Value Fund (the “Fund”) (one of the funds constituting American Beacon Funds (the “Trust”)), including the schedule of investments, as of October 31, 2019, and the related statement of operations for the year then ended, the statements of changes in net assets for each of the two years in the period then ended, the financial highlights for each of the five years in the period then ended and the related notes (collectively referred to as the “financial statements”). In our opinion, the financial statements present fairly, in all material respects, the financial position of the Fund at October 31, 2019, the results of its operations for the year then ended, the changes in its net assets for each of the two years in the period then ended and its financial highlights for each of the five years in the period then ended, in conformity with U.S. generally accepted accounting principles.
Basis for Opinion
These financial statements are the responsibility of the Trust’s management. Our responsibility is to express an opinion on the Fund’s financial statements based on our audits. We are a public accounting firm registered with the Public Company Accounting Oversight Board (United States) (“PCAOB”) and are required to be independent with respect to the Trust in accordance with the U.S. federal securities laws and the applicable rules and regulations of the Securities and Exchange Commission and the PCAOB.
We conducted our audits in accordance with the standards of the PCAOB. Those standards require that we plan and perform the audit to obtain reasonable assurance about whether the financial statements are free of material misstatement, whether due to error or fraud. The Trust is not required to have, nor were we engaged to perform, an audit of the Trust’s internal control over financial reporting. As part of our audits, we are required to obtain an understanding of internal control over financial reporting, but not for the purpose of expressing an opinion on the effectiveness of the Trust’s internal control over financial reporting. Accordingly, we express no such opinion.
Our audits included performing procedures to assess the risks of material misstatement of the financial statements, whether due to error or fraud, and performing procedures that respond to those risks. Such procedures included examining, on a test basis, evidence regarding the amounts and disclosures in the financial statements. Our procedures included confirmation of securities owned as of October 31, 2019, by correspondence with the custodian and brokers or by other appropriate auditing procedures where replies from brokers were not received. Our audits also included evaluating the accounting principles used and significant estimates made by management, as well as evaluating the overall presentation of the financial statements. We believe that our audits provide a reasonable basis for our opinion.

We have served as the auditor of one or more American Beacon investment companies since 1987.
Dallas, Texas
December 30, 2019
8
American Beacon Large Cap Value FundSM
October 31, 2019
| Shares | Fair Value | ||||||||||||||
| COMMON STOCKS - 96.86% | |||||||||||||||
| Communication Services - 6.02% | |||||||||||||||
| Diversified Telecommunication Services - 1.20% | |||||||||||||||
| AT&T, Inc. | 1,520,900 | $ | 58,539,441 | ||||||||||||
| Verizon Communications, Inc. | 104,195 | 6,300,672 | |||||||||||||
|
| ||||||||||||||
| 64,840,113 | |||||||||||||||
|
| ||||||||||||||
| Interactive Media & Services - 0.92% | |||||||||||||||
| Alphabet, Inc., Class AA | 15,700 | 19,763,160 | |||||||||||||
| Facebook, Inc., Class AA | 157,200 | 30,127,380 | |||||||||||||
|
| ||||||||||||||
| 49,890,540 | |||||||||||||||
|
| ||||||||||||||
| Media - 3.44% | |||||||||||||||
| CBS Corp., Class B, NVDR | 293,103 | 10,563,432 | |||||||||||||
| Comcast Corp., Class A | 2,555,843 | 114,552,883 | |||||||||||||
| Discovery, Inc., Class CA | 1,045,000 | 26,375,800 | |||||||||||||
| Interpublic Group of Cos., Inc. | 300,000 | 6,525,000 | |||||||||||||
| News Corp., Class A | 1,294,300 | 17,744,853 | |||||||||||||
| Omnicom Group, Inc. | 135,427 | 10,453,610 | |||||||||||||
|
| ||||||||||||||
| 186,215,578 | |||||||||||||||
|
| ||||||||||||||
| Wireless Telecommunication Services - 0.46% | |||||||||||||||
| Vodafone Group PLC, Sponsored ADR | 1,225,850 | 25,031,857 | |||||||||||||
|
| ||||||||||||||
Total Communication Services | 325,978,088 | ||||||||||||||
|
| ||||||||||||||
| Consumer Discretionary - 8.22% | |||||||||||||||
| Auto Components - 1.37% | |||||||||||||||
| Adient PLC | 406,398 | 8,611,574 | |||||||||||||
| Aptiv PLC | 131,226 | 11,751,288 | |||||||||||||
| Goodyear Tire & Rubber Co. | 639,100 | 10,142,517 | |||||||||||||
| Lear Corp. | 18,118 | 2,133,757 | |||||||||||||
| Magna International, Inc. | 776,541 | 41,754,609 | |||||||||||||
|
| ||||||||||||||
| 74,393,745 | |||||||||||||||
|
| ||||||||||||||
| Automobiles - 1.97% | |||||||||||||||
| General Motors Co. | 2,549,149 | 94,726,377 | |||||||||||||
| Harley-Davidson, Inc.B | 304,968 | 11,866,305 | |||||||||||||
|
| ||||||||||||||
| 106,592,682 | |||||||||||||||
|
| ||||||||||||||
| Hotels, Restaurants & Leisure - 1.06% | |||||||||||||||
| Aramark | 998,367 | 43,688,540 | |||||||||||||
| Norwegian Cruise Line Holdings Ltd.A | 265,600 | 13,481,856 | |||||||||||||
|
| ||||||||||||||
| 57,170,396 | |||||||||||||||
|
| ||||||||||||||
| Household Durables - 1.29% | |||||||||||||||
| DR Horton, Inc. | 336,900 | 17,643,453 | |||||||||||||
| Mohawk Industries, Inc.A | 191,100 | 27,399,918 | |||||||||||||
| PulteGroup, Inc. | 627,300 | 24,615,252 | |||||||||||||
|
| ||||||||||||||
| 69,658,623 | |||||||||||||||
|
| ||||||||||||||
| Internet & Direct Marketing Retail - 0.18% | |||||||||||||||
| eBay, Inc. | 278,700 | 9,824,175 | |||||||||||||
|
| ||||||||||||||
| Multiline Retail - 1.29% | |||||||||||||||
| Dollar General Corp. | 437,343 | 70,123,577 | |||||||||||||
|
| ||||||||||||||
See accompanying notes
9
American Beacon Large Cap Value FundSM
Schedule of Investments
October 31, 2019
| Shares | Fair Value | ||||||||||||||
| COMMON STOCKS - 96.86% (continued) | |||||||||||||||
| Consumer Discretionary - 8.22% (continued) | |||||||||||||||
| Specialty Retail - 1.02% | |||||||||||||||
| Advance Auto Parts, Inc. | 119,974 | $ | 19,493,375 | ||||||||||||
| Lowe’s Cos., Inc. | 321,867 | 35,923,576 | |||||||||||||
|
| ||||||||||||||
| 55,416,951 | |||||||||||||||
|
| ||||||||||||||
| Textiles, Apparel & Luxury Goods - 0.04% | |||||||||||||||
| Hanesbrands, Inc. | 138,581 | 2,107,817 | |||||||||||||
|
| ||||||||||||||
Total Consumer Discretionary | 445,287,966 | ||||||||||||||
|
| ||||||||||||||
| Consumer Staples - 5.16% | |||||||||||||||
| Beverages - 1.02% | |||||||||||||||
| Diageo PLC, Sponsored ADR | 101,624 | 16,653,125 | |||||||||||||
| Molson Coors Brewing Co., Class B | 585,750 | 30,880,740 | |||||||||||||
| PepsiCo, Inc. | 54,566 | 7,484,818 | |||||||||||||
|
| ||||||||||||||
| 55,018,683 | |||||||||||||||
|
| ||||||||||||||
| Food Products - 1.86% | |||||||||||||||
| Archer-Daniels-Midland Co. | 166,190 | 6,986,628 | |||||||||||||
| Danone S.A., Sponsored ADR | 367,124 | 6,057,546 | |||||||||||||
| Ingredion, Inc. | 262,500 | 20,737,500 | |||||||||||||
| JM Smucker Co. | 43,889 | 4,638,189 | |||||||||||||
| Mondelez International, Inc., Class A | 178,400 | 9,357,080 | |||||||||||||
| Nestle S.A., Sponsored ADR | 215,893 | 23,135,094 | |||||||||||||
| Tyson Foods, Inc., Class A | 361,040 | 29,890,501 | |||||||||||||
|
| ||||||||||||||
| 100,802,538 | |||||||||||||||
|
| ||||||||||||||
| Household Products - 0.29% | |||||||||||||||
| Colgate-Palmolive Co. | 37,433 | 2,567,904 | |||||||||||||
| Kimberly-Clark Corp. | 33,860 | 4,499,317 | |||||||||||||
| Procter & Gamble Co. | 24,445 | 3,043,647 | |||||||||||||
| Reckitt Benckiser Group PLC, Sponsored ADRB | 356,873 | 5,627,887 | |||||||||||||
|
| ||||||||||||||
| 15,738,755 | |||||||||||||||
|
| ||||||||||||||
| Personal Products - 0.33% | |||||||||||||||
| Unilever PLC, Sponsored ADR | 299,300 | 17,990,923 | |||||||||||||
|
| ||||||||||||||
| Tobacco - 1.66% | |||||||||||||||
| Altria Group, Inc. | 614,525 | 27,524,575 | |||||||||||||
| Imperial Brands PLC, Sponsored ADR | 628,767 | 13,832,874 | |||||||||||||
| Philip Morris International, Inc. | 593,975 | 48,373,324 | |||||||||||||
|
| ||||||||||||||
| 89,730,773 | |||||||||||||||
|
| ||||||||||||||
Total Consumer Staples | 279,281,672 | ||||||||||||||
|
| ||||||||||||||
| Energy - 11.24% | |||||||||||||||
| Energy Equipment & Services - 1.81% | |||||||||||||||
| Halliburton Co. | 1,889,200 | 36,367,100 | |||||||||||||
| National Oilwell Varco, Inc. | 1,083,200 | 24,501,984 | |||||||||||||
| Schlumberger Ltd. | 1,145,217 | 37,437,144 | |||||||||||||
|
| ||||||||||||||
| 98,306,228 | |||||||||||||||
|
| ||||||||||||||
| Oil, Gas & Consumable Fuels - 9.43% | |||||||||||||||
| Apache Corp. | 951,200 | 20,602,992 | |||||||||||||
| BP PLC, Sponsored ADR | 2,481,676 | 94,080,337 | |||||||||||||
| Canadian Natural Resources Ltd. | 2,115,703 | 53,358,030 | |||||||||||||
| Chevron Corp. | 580,648 | 67,436,459 | |||||||||||||
| ConocoPhillips | 1,291,845 | 71,309,844 | |||||||||||||
See accompanying notes
10
American Beacon Large Cap Value FundSM
Schedule of Investments
October 31, 2019
| Shares | Fair Value | ||||||||||||||
| COMMON STOCKS - 96.86% (continued) | |||||||||||||||
| Energy - 11.24% (continued) | |||||||||||||||
| Oil, Gas & Consumable Fuels - 9.43% (continued) | |||||||||||||||
| EOG Resources, Inc. | 120,008 | $ | 8,317,754 | ||||||||||||
| Exxon Mobil Corp. | 119,676 | 8,086,507 | |||||||||||||
| Hess Corp. | 370,192 | 24,340,124 | |||||||||||||
| Kosmos Energy Ltd. | 820,845 | 5,089,239 | |||||||||||||
| Marathon Oil Corp. | 1,904,486 | 21,958,723 | |||||||||||||
| Marathon Petroleum Corp. | 180,680 | 11,554,486 | |||||||||||||
| Murphy Oil Corp.B | 765,760 | 15,797,629 | |||||||||||||
| Phillips 66 | 460,851 | 53,836,614 | |||||||||||||
| Pioneer Natural Resources Co. | 36,196 | 4,452,832 | |||||||||||||
| Royal Dutch Shell PLC, Class A, Sponsored ADR | 337,322 | 19,554,556 | |||||||||||||
| Royal Dutch Shell PLC, Class B, Sponsored ADR | 349,100 | 20,349,039 | |||||||||||||
| Suncor Energy, Inc. | 355,169 | 10,544,968 | |||||||||||||
|
| ||||||||||||||
| 510,670,133 | |||||||||||||||
|
| ||||||||||||||
Total Energy | 608,976,361 | ||||||||||||||
|
| ||||||||||||||
| Financials - 23.03% | |||||||||||||||
| Banks - 11.86% | |||||||||||||||
| Banco Santander S.A., Sponsored ADRB | 4,603,800 | 18,231,048 | |||||||||||||
| Bank of America Corp. | 3,077,244 | 96,225,420 | |||||||||||||
| BB&T Corp. | 368,827 | 19,566,272 | |||||||||||||
| CIT Group, Inc. | 133,200 | 5,712,948 | |||||||||||||
| Citigroup, Inc. | 1,999,421 | 143,678,393 | |||||||||||||
| Citizens Financial Group, Inc. | 552,553 | 19,427,763 | |||||||||||||
| Fifth Third Bancorp | 237,200 | 6,897,776 | |||||||||||||
| JPMorgan Chase & Co. | 1,228,185 | 153,424,870 | |||||||||||||
| PNC Financial Services Group, Inc. | 128,064 | 18,786,989 | |||||||||||||
| US Bancorp | 513,032 | 29,253,085 | |||||||||||||
| Wells Fargo & Co. | 2,538,882 | 131,082,478 | |||||||||||||
|
| ||||||||||||||
| 642,287,042 | |||||||||||||||
|
| ||||||||||||||
| Capital Markets - 3.36% | |||||||||||||||
| Bank of New York Mellon Corp. | 371,627 | 17,373,562 | |||||||||||||
| BlackRock, Inc. | 26,297 | 12,141,325 | |||||||||||||
| E*TRADE Financial Corp. | 351,600 | 14,693,364 | |||||||||||||
| Goldman Sachs Group, Inc. | 285,762 | 60,975,895 | |||||||||||||
| Moody’s Corp. | 52,168 | 11,512,956 | |||||||||||||
| Morgan Stanley | 299,578 | 13,795,567 | |||||||||||||
| Nasdaq, Inc. | 152,269 | 15,191,878 | |||||||||||||
| State Street Corp. | 447,751 | 29,582,909 | |||||||||||||
| T Rowe Price Group, Inc. | 56,031 | 6,488,390 | |||||||||||||
|
| ||||||||||||||
| 181,755,846 | |||||||||||||||
|
| ||||||||||||||
| Consumer Finance - 1.50% | |||||||||||||||
| American Express Co. | 83,889 | 9,838,502 | |||||||||||||
| Capital One Financial Corp. | 287,291 | 26,789,886 | |||||||||||||
| Discover Financial Services | 147,600 | 11,846,376 | |||||||||||||
| Navient Corp. | 833,622 | 11,478,975 | |||||||||||||
| SLM Corp. | 2,547,596 | 21,501,710 | |||||||||||||
|
| ||||||||||||||
| 81,455,449 | |||||||||||||||
|
| ||||||||||||||
| Diversified Financial Services - 1.66% | |||||||||||||||
| AXA Equitable Holdings, Inc. | 899,200 | 19,422,720 | |||||||||||||
| Berkshire Hathaway, Inc., Class BA | 331,337 | 70,435,619 | |||||||||||||
|
| ||||||||||||||
| 89,858,339 | |||||||||||||||
|
| ||||||||||||||
See accompanying notes
11
American Beacon Large Cap Value FundSM
Schedule of Investments
October 31, 2019
| Shares | Fair Value | ||||||||||||||
| COMMON STOCKS - 96.86% (continued) | |||||||||||||||
| Financials - 23.03% (continued) | |||||||||||||||
| Insurance - 3.97% | |||||||||||||||
| American International Group, Inc. | 1,842,468 | $ | 97,577,105 | ||||||||||||
| Aon PLC | 157,591 | 30,440,278 | |||||||||||||
| Chubb Ltd. | 172,858 | 26,347,016 | |||||||||||||
| Marsh & McLennan Cos., Inc. | 169,133 | 17,525,562 | |||||||||||||
| Travelers Cos., Inc. | 327,952 | 42,981,389 | |||||||||||||
|
| ||||||||||||||
| 214,871,350 | |||||||||||||||
|
| ||||||||||||||
| Mortgage Real Estate Investment Trusts (REITs) - 0.68% | |||||||||||||||
| Annaly Capital Management, Inc. | 2,567,300 | 23,054,354 | |||||||||||||
| Two Harbors Investment Corp. | 990,300 | 13,735,461 | |||||||||||||
|
| ||||||||||||||
| 36,789,815 | |||||||||||||||
|
| ||||||||||||||
Total Financials | 1,247,017,841 | ||||||||||||||
|
| ||||||||||||||
| Health Care - 13.16% | |||||||||||||||
| Biotechnology - 0.71% | |||||||||||||||
| AbbVie, Inc. | 202,000 | 16,069,100 | |||||||||||||
| Biogen, Inc.A | 31,100 | 9,289,881 | |||||||||||||
| Gilead Sciences, Inc. | 204,640 | 13,037,614 | |||||||||||||
|
| ||||||||||||||
| 38,396,595 | |||||||||||||||
|
| ||||||||||||||
| Health Care Equipment & Supplies - 3.50% | |||||||||||||||
| Abbott Laboratories | 202,263 | 16,911,209 | |||||||||||||
| Danaher Corp. | 164,390 | 22,656,230 | |||||||||||||
| Medtronic PLC | 1,151,442 | 125,392,034 | |||||||||||||
| Zimmer Biomet Holdings, Inc. | 177,117 | 24,482,883 | |||||||||||||
|
| ||||||||||||||
| 189,442,356 | |||||||||||||||
|
| ||||||||||||||
| Health Care Providers & Services - 3.06% | |||||||||||||||
| Anthem, Inc. | 192,900 | 51,905,532 | |||||||||||||
| Centene Corp.A | 146,600 | 7,781,528 | |||||||||||||
| Cigna Corp. | 140,554 | 25,083,267 | |||||||||||||
| CVS Health Corp. | 776,490 | 51,551,171 | |||||||||||||
| HCA Healthcare, Inc. | 50,900 | 6,797,186 | |||||||||||||
| McKesson Corp. | 67,037 | 8,915,921 | |||||||||||||
| UnitedHealth Group, Inc. | 53,500 | 13,519,450 | |||||||||||||
|
| ||||||||||||||
| 165,554,055 | |||||||||||||||
|
| ||||||||||||||
| Life Sciences Tools & Services - 0.34% | |||||||||||||||
| Thermo Fisher Scientific, Inc. | 61,379 | 18,535,231 | |||||||||||||
|
| ||||||||||||||
| Pharmaceuticals - 5.55% | |||||||||||||||
| AstraZeneca PLC, Sponsored ADR | 328,400 | 16,101,452 | |||||||||||||
| Bristol-Myers Squibb Co. | 649,752 | 37,276,272 | |||||||||||||
| GlaxoSmithKline PLC, Sponsored ADR | 457,934 | 20,973,377 | |||||||||||||
| Horizon Therapeutics PLCA | 252,922 | 7,311,975 | |||||||||||||
| Jazz Pharmaceuticals PLCA | 105,168 | 13,212,256 | |||||||||||||
| Johnson & Johnson | 476,140 | 62,869,525 | |||||||||||||
| Merck & Co., Inc. | 489,348 | 42,406,898 | |||||||||||||
| Mylan N.V.A | 501,085 | 9,595,778 | |||||||||||||
| Novartis AG, Sponsored ADR | 32,790 | 2,867,158 | |||||||||||||
| Pfizer, Inc. | 1,357,548 | 52,089,117 | |||||||||||||
| Roche Holding AG, Sponsored ADR | 156,197 | 5,876,131 | |||||||||||||
| Sanofi, ADR | 651,882 | 30,038,722 | |||||||||||||
|
| ||||||||||||||
| 300,618,661 | |||||||||||||||
|
| ||||||||||||||
Total Health Care | 712,546,898 | ||||||||||||||
|
| ||||||||||||||
See accompanying notes
12
American Beacon Large Cap Value FundSM
Schedule of Investments
October 31, 2019
| Shares | Fair Value | ||||||||||||||
| COMMON STOCKS - 96.86% (continued) | |||||||||||||||
| Industrials - 10.64% | |||||||||||||||
| Aerospace & Defense - 2.17% | |||||||||||||||
| Embraer S.A., Sponsored ADR | 229,600 | $ | 3,988,152 | ||||||||||||
| General Dynamics Corp. | 64,796 | 11,455,933 | |||||||||||||
| Lockheed Martin Corp. | 38,973 | 14,680,349 | |||||||||||||
| Northrop Grumman Corp. | 79,585 | 28,052,121 | |||||||||||||
| Raytheon Co. | 124,737 | 26,470,439 | |||||||||||||
| United Technologies Corp. | 229,881 | 33,006,314 | |||||||||||||
|
| ||||||||||||||
| 117,653,308 | |||||||||||||||
|
| ||||||||||||||
| Air Freight & Logistics - 0.24% | |||||||||||||||
| FedEx Corp. | 86,900 | 13,266,154 | |||||||||||||
|
| ||||||||||||||
| Airlines - 0.64% | |||||||||||||||
| American Airlines Group, Inc. | 1,147,940 | 34,507,076 | |||||||||||||
|
| ||||||||||||||
| Building Products - 1.16% | |||||||||||||||
| Johnson Controls International PLC | 1,446,797 | 62,689,714 | |||||||||||||
|
| ||||||||||||||
| Construction & Engineering - 0.09% | |||||||||||||||
| Fluor Corp. | 316,800 | 5,103,648 | |||||||||||||
|
| ||||||||||||||
| Electrical Equipment - 0.48% | |||||||||||||||
| Eaton Corp. PLC | 295,485 | 25,739,698 | |||||||||||||
|
| ||||||||||||||
| Industrial Conglomerates - 2.71% | |||||||||||||||
| 3M Co. | 68,267 | 11,263,372 | |||||||||||||
| General Electric Co. | 7,914,772 | 78,989,425 | |||||||||||||
| Honeywell International, Inc. | 326,667 | 56,425,191 | |||||||||||||
|
| ||||||||||||||
| 146,677,988 | |||||||||||||||
|
| ||||||||||||||
| Machinery - 2.06% | |||||||||||||||
| CNH Industrial N.V. | 2,532,839 | 27,633,273 | |||||||||||||
| Cummins, Inc. | 152,997 | 26,388,923 | |||||||||||||
| Illinois Tool Works, Inc. | 132,393 | 22,318,812 | |||||||||||||
| Ingersoll-Rand PLC | 109,064 | 13,839,131 | |||||||||||||
| PACCAR, Inc. | 89,951 | 6,841,673 | |||||||||||||
| Stanley Black & Decker, Inc. | 96,675 | 14,629,828 | |||||||||||||
|
| ||||||||||||||
| 111,651,640 | |||||||||||||||
|
| ||||||||||||||
| Professional Services - 0.21% | |||||||||||||||
| Equifax, Inc. | 84,012 | 11,485,281 | |||||||||||||
|
| ||||||||||||||
| Road & Rail - 0.45% | |||||||||||||||
| Canadian National Railway Co. | 84,820 | 7,580,363 | |||||||||||||
| Union Pacific Corp. | 100,100 | 16,562,546 | |||||||||||||
|
| ||||||||||||||
| 24,142,909 | |||||||||||||||
|
| ||||||||||||||
| Trading Companies & Distributors - 0.43% | |||||||||||||||
| AerCap Holdings N.V.A | 405,600 | 23,476,128 | |||||||||||||
|
| ||||||||||||||
Total Industrials | 576,393,544 | ||||||||||||||
|
| ||||||||||||||
| Information Technology - 9.78% | |||||||||||||||
| Communications Equipment - 0.25% | |||||||||||||||
| Telefonaktiebolaget LM Ericsson, Sponsored ADRB | 1,567,020 | 13,664,415 | |||||||||||||
|
| ||||||||||||||
See accompanying notes
13
American Beacon Large Cap Value FundSM
Schedule of Investments
October 31, 2019
| Shares | Fair Value | ||||||||||||||
| COMMON STOCKS - 96.86% (continued) | |||||||||||||||
| Information Technology - 9.78% (continued) | |||||||||||||||
| Electronic Equipment, Instruments & Components - 1.04% | |||||||||||||||
| Corning, Inc. | 998,440 | $ | 29,583,777 | ||||||||||||
| IPG Photonics Corp.A | 127,800 | 17,160,984 | |||||||||||||
| TE Connectivity Ltd. | 105,000 | 9,397,500 | |||||||||||||
|
| ||||||||||||||
| 56,142,261 | |||||||||||||||
|
| ||||||||||||||
| IT Services - 1.39% | |||||||||||||||
| Accenture PLC, Class A | 181,763 | 33,702,495 | |||||||||||||
| Cognizant Technology Solutions Corp., Class A | 86,270 | 5,257,294 | |||||||||||||
| Fidelity National Information Services, Inc. | 130,595 | 17,207,197 | |||||||||||||
| Fiserv, Inc.A | 181,154 | 19,227,686 | |||||||||||||
|
| ||||||||||||||
| 75,394,672 | |||||||||||||||
|
| ||||||||||||||
| Semiconductors & Semiconductor Equipment - 2.83% | |||||||||||||||
| Analog Devices, Inc. | 89,026 | 9,492,842 | |||||||||||||
| Marvell Technology Group Ltd. | 1,189,300 | 29,007,027 | |||||||||||||
| NVIDIA Corp. | 110,300 | 22,172,506 | |||||||||||||
| NXP Semiconductors N.V. | 51,089 | 5,807,797 | |||||||||||||
| QUALCOMM, Inc. | 629,499 | 50,636,900 | |||||||||||||
| Texas Instruments, Inc. | 308,125 | 36,355,669 | |||||||||||||
|
| ||||||||||||||
| 153,472,741 | |||||||||||||||
|
| ||||||||||||||
| Software - 3.57% | |||||||||||||||
| Microsoft Corp. | 704,969 | 101,071,406 | |||||||||||||
| Oracle Corp. | 1,617,414 | 88,132,889 | |||||||||||||
| Teradata Corp.A | 134,394 | 4,022,412 | |||||||||||||
|
| ||||||||||||||
| 193,226,707 | |||||||||||||||
|
| ||||||||||||||
| Technology Hardware, Storage & Peripherals - 0.70% | |||||||||||||||
| Hewlett Packard Enterprise Co. | 2,300,844 | 37,756,850 | |||||||||||||
|
| ||||||||||||||
Total Information Technology | 529,657,646 | ||||||||||||||
|
| ||||||||||||||
| Materials - 5.56% | |||||||||||||||
| Chemicals - 3.84% | |||||||||||||||
| Air Products & Chemicals, Inc. | 256,947 | 54,796,517 | |||||||||||||
| Corteva, Inc.A | 799,481 | 21,090,309 | |||||||||||||
| Dow, Inc.A | 331,617 | 16,743,342 | |||||||||||||
| DuPont de Nemours, Inc. | 633,089 | 41,726,896 | |||||||||||||
| Eastman Chemical Co. | 255,026 | 19,392,177 | |||||||||||||
| Huntsman Corp. | 597,400 | 13,220,462 | |||||||||||||
| PPG Industries, Inc. | 205,067 | 25,657,983 | |||||||||||||
| Sherwin-Williams Co. | 26,458 | 15,142,443 | |||||||||||||
|
| ||||||||||||||
| 207,770,129 | |||||||||||||||
|
| ||||||||||||||
| Containers & Packaging - 0.93% | |||||||||||||||
| Crown Holdings, Inc.A | 464,700 | 33,848,748 | |||||||||||||
| International Paper Co. | 383,786 | 16,763,773 | |||||||||||||
|
| ||||||||||||||
| 50,612,521 | |||||||||||||||
|
| ||||||||||||||
| Metals & Mining - 0.79% | |||||||||||||||
| Freeport-McMoRan, Inc. | 1,047,100 | 10,282,522 | |||||||||||||
| Newmont Goldcorp Corp. | 823,000 | 32,697,790 | |||||||||||||
|
| ||||||||||||||
| 42,980,312 | |||||||||||||||
|
| ||||||||||||||
Total Materials | 301,362,962 | ||||||||||||||
|
| ||||||||||||||
See accompanying notes
14
American Beacon Large Cap Value FundSM
Schedule of Investments
October 31, 2019
| Shares | Fair Value | ||||||||||||||
| COMMON STOCKS - 96.86% (continued) | |||||||||||||||
| Real Estate - 0.22% | |||||||||||||||
| Equity Real Estate Investment Trusts (REITs) - 0.22% | |||||||||||||||
| Gaming and Leisure Properties, Inc. | 172,600 | $ | 6,966,136 | ||||||||||||
| Public Storage | 21,773 | 4,852,331 | |||||||||||||
|
| ||||||||||||||
| 11,818,467 | |||||||||||||||
|
| ||||||||||||||
Total Real Estate | 11,818,467 | ||||||||||||||
|
| ||||||||||||||
| Utilities - 3.83% | |||||||||||||||
| Electric Utilities - 3.10% | |||||||||||||||
| Duke Energy Corp. | 304,634 | 28,714,801 | |||||||||||||
| Entergy Corp. | 396,426 | 48,157,830 | |||||||||||||
| FirstEnergy Corp. | 375,368 | 18,137,782 | |||||||||||||
| PPL Corp. | 855,254 | 28,642,456 | |||||||||||||
| Southern Co. | 595,218 | 37,296,360 | |||||||||||||
| Xcel Energy, Inc. | 105,186 | 6,680,363 | |||||||||||||
|
| ||||||||||||||
| 167,629,592 | |||||||||||||||
|
| ||||||||||||||
| Multi-Utilities - 0.73% | |||||||||||||||
| Dominion Energy, Inc. | 480,590 | 39,672,705 | |||||||||||||
|
| ||||||||||||||
Total Utilities | 207,302,297 | ||||||||||||||
|
| ||||||||||||||
Total Common Stocks (Cost $4,051,983,814) | 5,245,623,742 | ||||||||||||||
|
| ||||||||||||||
| SHORT-TERM INVESTMENTS - 3.18% | |||||||||||||||
| Investment Companies - 3.09% | |||||||||||||||
| American Beacon U.S. Government Money Market Select Fund, Select Class, 1.75%C D | 167,279,955 | 167,279,955 | |||||||||||||
|
| ||||||||||||||
| Principal Amount | |||||||||||||||
| U.S. Treasury Obligations - 0.09% | |||||||||||||||
| U.S. Treasury Bill, 1.87%, Due 2/13/2020E | $ | 5,000,000 | 4,978,078 | ||||||||||||
|
| ||||||||||||||
Total Short-Term Investments (Cost $172,253,522) | 172,258,033 | ||||||||||||||
|
| ||||||||||||||
| Shares | |||||||||||||||
| SECURITIES LENDING COLLATERAL - 0.38% (Cost $20,296,656) | |||||||||||||||
| Investment Companies - 0.38% | |||||||||||||||
| American Beacon U.S. Government Money Market Select Fund, Select Class, 1.75%C D | 20,296,656 | 20,296,656 | |||||||||||||
|
| ||||||||||||||
TOTAL INVESTMENTS - 100.42% (Cost $4,244,533,992) | 5,438,178,431 | ||||||||||||||
LIABILITIES, NET OF OTHER ASSETS - (0.42%) | (22,742,940 | ) | |||||||||||||
|
| ||||||||||||||
TOTAL NET ASSETS - 100.00% | $ | 5,415,435,491 | |||||||||||||
|
| ||||||||||||||
| Percentages are stated as a percent of net assets. | |||||||||||||||
ANon-income producing security.
B All or a portion of this security is on loan, collateralized by either cash and/or U.S. Treasuries, at October 31, 2019 (Note 9).
C The Fund is affiliated by having the same investment advisor.
D7-day yield.
E This security or a piece thereof is held as segregated collateral.
ADR - American Depositary Receipt.
NVDR - Non Voting Depositary Receipt.
PLC - Public Limited Company.
See accompanying notes
15
American Beacon Large Cap Value FundSM
Schedule of Investments
October 31, 2019
| Long Futures Contracts Open on October 31, 2019: |
| |||||||||||||||
| Equity Futures Contracts | ||||||||||||||||
| Description | Number of Contracts | Expiration Date | Notional Amount | Contract Value | Unrealized Appreciation (Depreciation) | |||||||||||
| S&P 500E-Mini Index Futures | 1,063 | December 2019 | $ | 158,748,860 | $ | 161,352,770 | $ | 2,603,910 | ||||||||
|
|
|
|
|
| |||||||||||
| $ | 158,748,860 | $ | 161,352,770 | $ | 2,603,910 | |||||||||||
|
|
|
|
|
| |||||||||||
| Index Abbreviations: | ||
| S&P 500 | Standard & Poor’s U.S. EquityLarge-Cap Index. | |
The Fund’s investments are summarized by level based on the inputs used to determine their values. As of October 31, 2019, the investments were classified as described below:
Large Cap Value Fund | Level 1 | Level 2 | Level 3 | Total | ||||||||||||||||||||||||
Assets | ||||||||||||||||||||||||||||
Common Stocks | $ | 5,245,623,742 | $ | - | $ | - | $ | 5,245,623,742 | ||||||||||||||||||||
Short-Term Investments | 167,279,955 | 4,978,078 | - | 172,258,033 | ||||||||||||||||||||||||
Securities Lending Collateral | 20,296,656 | - | - | 20,296,656 | ||||||||||||||||||||||||
|
|
|
|
|
|
|
| |||||||||||||||||||||
Total Investments in Securities - Assets | $ | 5,433,200,353 | $ | 4,978,078 | $ | - | $ | 5,438,178,431 | ||||||||||||||||||||
|
|
|
|
|
|
|
| |||||||||||||||||||||
Financial Derivative Instruments - Assets | ||||||||||||||||||||||||||||
Futures Contracts | $ | 2,603,910 | $ | - | $ | - | $ | 2,603,910 | ||||||||||||||||||||
|
|
|
|
|
|
|
| |||||||||||||||||||||
Total Financial Derivative Instruments - Assets | $ | 2,603,910 | $ | - | $ | - | $ | 2,603,910 | ||||||||||||||||||||
|
|
|
|
|
|
|
| |||||||||||||||||||||
U.S. GAAP requires transfers between all levels to/from level 3 be disclosed. During the year ended October 31, 2019, there were no transfers into or out of Level 3.
See accompanying notes
16
American Beacon Large Cap Value FundSM
Statement of Assets and Liabilities
October 31, 2019
Assets: |
| |||
Investments in unaffiliated securities, at fair value†§ | $ | 5,250,601,820 | ||
Investments in affiliated securities, at fair value‡ | 187,576,611 | |||
Dividends and interest receivable | 5,580,380 | |||
Receivable for investments sold | 631,038 | |||
Receivable for fund shares sold | 2,179,647 | |||
Receivable for tax reclaims | 578,349 | |||
Receivable for expense reimbursement (Note 2) | 159,529 | |||
Receivable for variation margin on open futures contracts (Note 5) | 2,606,286 | |||
Prepaid expenses | 62,453 | |||
|
| |||
Total assets | 5,449,976,113 | |||
|
| |||
Liabilities: |
| |||
Payable for investments purchased | 4,213,207 | |||
Payable for fund shares redeemed | 3,551,384 | |||
Cash due to broker for futures contracts | 635,735 | |||
Management andsub-advisory fees payable (Note 2) | 5,178,226 | |||
Service fees payable (Note 2) | 192,735 | |||
Transfer agent fees payable (Note 2) | 88,793 | |||
Payable upon return of securities loaned (Note 9)§ | 20,296,656 | |||
Custody and fund accounting fees payable | 87,866 | |||
Professional fees payable | 61,108 | |||
Trustee fees payable (Note 2) | 37,815 | |||
Payable for prospectus and shareholder reports | 103,885 | |||
Other liabilities | 93,212 | |||
|
| |||
Total liabilities | 34,540,622 | |||
|
| |||
Net assets | $ | 5,415,435,491 | ||
|
| |||
Analysis of net assets: |
| |||
Paid-in-capital | $ | 3,828,733,102 | ||
Total distributable earnings (deficits)A | 1,586,702,389 | |||
|
| |||
Net assets | $ | 5,415,435,491 | ||
|
| |||
Shares outstanding at no par value (unlimited shares authorized): | ||||
Institutional Class | 110,804,834 | |||
|
| |||
Y Class | 10,727,471 | |||
|
| |||
Investor Class | 43,161,993 | |||
|
| |||
Advisor Class | 2,573,552 | |||
|
| |||
A Class | 1,526,109 | |||
|
| |||
C Class | 267,848 | |||
|
| |||
R6 Class | 26,120,435 | |||
|
| |||
Net assets: | ||||
Institutional Class | $ | 3,137,789,485 | ||
|
| |||
Y Class | $ | 301,457,382 | ||
|
| |||
Investor Class | $ | 1,124,625,846 | ||
|
| |||
Advisor Class | $ | 66,077,449 | ||
|
| |||
A Class | $ | 39,157,098 | ||
|
| |||
C Class | $ | 6,811,169 | ||
|
| |||
R6 Class | $ | 739,517,062 | ||
|
| |||
Net asset value, offering and redemption price per share: |
| |||
Institutional Class | $ | 28.32 | ||
|
| |||
Y Class | $ | 28.10 | ||
|
| |||
Investor Class | $ | 26.06 | ||
|
| |||
Advisor Class | $ | 25.68 | ||
|
| |||
A Class | $ | 25.66 | ||
|
| |||
A Class (offering price) | $ | 27.23 | ||
|
| |||
C Class | $ | 25.43 | ||
|
| |||
R6 Class | $ | 28.31 | ||
|
| |||
† Cost of investments in unaffiliated securities | $ | 4,056,957,381 | ||
‡ Cost of investments in affiliated securities | $ | 187,576,611 | ||
§ Fair value of securities on loan | $ | 48,563,589 | ||
A The Fund’s investments in affiliated securities did not have unrealized appreciation (depreciation) at year end. | ||||
See accompanying notes
17
American Beacon Large Cap Value FundSM
Statement of Operations
For the year ended October 31, 2019
Investment income: | ||||
Dividend income from unaffiliated securities (net of foreign taxes)† | $ | 148,337,805 | ||
Dividend income from affiliated securities (Note 8) | 3,661,511 | |||
Interest income | 193,330 | |||
Income derived from securities lending (Note 9) | 111,850 | |||
|
| |||
Total investment income | 152,304,496 | |||
|
| |||
Expenses: | ||||
Management andsub-advisory fees (Note 2) | 31,149,968 | |||
Transfer agent fees: | ||||
Institutional Class (Note 2) | 1,094,270 | |||
Y Class (Note 2) | 306,345 | |||
Investor Class | 51,197 | |||
Advisor Class | 3,261 | |||
A Class | 2,298 | |||
R6 Class | 19,962 | |||
Custody and fund accounting fees | 636,870 | |||
Professional fees | 273,021 | |||
Registration fees and expenses | 136,955 | |||
Service fees (Note 2): | ||||
Investor Class | 4,535,505 | |||
Advisor Class | 164,549 | |||
A Class | 72,845 | |||
C Class | 6,803 | |||
Distribution fees (Note 2): | ||||
Advisor Class | 164,038 | |||
A Class | 117,558 | |||
C Class | 66,992 | |||
Prospectus and shareholder report expenses | 392,829 | |||
Trustee fees (Note 2) | 428,587 | |||
Other expenses | 637,734 | |||
|
| |||
Total expenses | 40,261,587 | |||
|
| |||
Net fees waived and expenses (reimbursed) (Note 2) | (128,272 | ) | ||
|
| |||
Net expenses | 40,133,315 | |||
|
| |||
Net investment income | 112,171,181 | |||
|
| |||
Realized and unrealized gain (loss) from investments: | ||||
Net realized gain (loss) from: | ||||
Investments in unaffiliated securitiesA | 361,981,952 | |||
Commission recapture (Note 1) | 47,799 | |||
Foreign currency transactions | (1,788 | ) | ||
Futures contracts | 4,328,396 | |||
Change in net unrealized appreciation of: | ||||
Investments in unaffiliated securitiesB | 23,464,371 | |||
Futures contracts | 14,221,296 | |||
|
| |||
Net gain from investments | 404,042,026 | |||
|
| |||
Net increase in net assets resulting from operations | $ | 516,213,207 | ||
|
| |||
† Foreign taxes | $ | 1,092,237 | ||
A The Fund did not recognize net realized gains (losses) from the sale of investments in affiliated securities. | ||||
B The Fund’s investments in affiliated securities did not have a change in unrealized appreciation (depreciation) at year end. |
| |||
See accompanying notes
18
American Beacon Large Cap Value FundSM
Statement of Changes in Net Assets
| Year Ended October 31, 2019 | Year Ended October 31, 2018 | |||||||||||
Increase (decrease) in net assets: | ||||||||||||
Operations: | ||||||||||||
Net investment income | $ | 112,171,181 | $ | 120,020,703 | ||||||||
Net realized gain from investments in unaffiliated securities, commission recapture, foreign currency transactions, and futures contracts | 366,356,359 | 496,658,492 | ||||||||||
Change in net unrealized appreciation (depreciation) of investments in unaffiliated securities, and futures contracts | 37,685,667 | (479,861,151 | ) | |||||||||
|
|
|
| |||||||||
Net increase in net assets resulting from operations | 516,213,207 | 136,818,044 | ||||||||||
|
|
|
| |||||||||
Distributions to shareholders: | ||||||||||||
Total retained earnings: | ||||||||||||
Institutional Class | (307,696,338 | ) | (459,420,239 | ) | ||||||||
Y Class | (24,499,396 | ) | (38,692,156 | ) | ||||||||
Investor Class | (128,259,878 | ) | (196,784,505 | ) | ||||||||
Advisor Class | (5,201,321 | ) | (8,664,880 | ) | ||||||||
A Class | (4,356,396 | ) | (4,240,901 | ) | ||||||||
C Class | (544,161 | ) | (808,195 | ) | ||||||||
R6 Class | (48,893,430 | ) | (17,634,896 | ) | ||||||||
|
|
|
| |||||||||
Net distributions to shareholders | (519,450,920 | ) | (726,245,772 | ) | ||||||||
|
|
|
| |||||||||
Capital share transactions (Note 11): | ||||||||||||
Proceeds from sales of shares | 777,784,227 | 1,360,517,349 | ||||||||||
Reinvestment of dividends and distributions | 486,264,603 | 686,933,740 | ||||||||||
Cost of shares redeemed | (2,033,070,711 | ) | (2,588,058,224 | ) | ||||||||
|
|
|
| |||||||||
Net (decrease) in net assets from capital share transactions | (769,021,881 | ) | (540,607,135 | ) | ||||||||
|
|
|
| |||||||||
Net (decrease) in net assets | (772,259,594 | ) | (1,130,034,863 | ) | ||||||||
|
|
|
| |||||||||
Net assets: | ||||||||||||
Beginning of period | 6,187,695,085 | 7,317,729,948 | ||||||||||
|
|
|
| |||||||||
End of period | $ | 5,415,435,491 | $ | 6,187,695,085 | ||||||||
|
|
|
| |||||||||
See accompanying notes
19
American Beacon Large Cap Value FundSM
October 31, 2019
1. Organization and Significant Accounting Policies
American Beacon Funds (the “Trust”) is organized as a Massachusetts business trust. The Fund, a series within the Trust, is registered under the Investment Company Act of 1940, as amended (the “Act”), as a diversified,open-end management investment company. As of October 31, 2019, the Trust consists ofthirty-two active series, one of which is presented in this filing: American Beacon Large Cap Value Fund (the “Fund”). The remainingthirty-one active series are reported in separate filings.
American Beacon Advisors, Inc. (the “Manager”) is a Delaware corporation and a wholly-owned subsidiary of Resolute Investment Managers, Inc. (“RIM”) organized in 1986 to provide business management, advisory, administrative, and asset management consulting services to the Trust and other investors. The Manager is registered as an investment advisor under the Investment Advisers Act of 1940, as amended (the “Advisers Act”). RIM is, in turn, a wholly-owned subsidiary of Resolute Acquisition, Inc., which is a wholly-owned subsidiary of Resolute Topco, Inc., a wholly-owned subsidiary of Resolute Investment Holdings, LLC (“RIH”). RIH is owned primarily by Kelso Investment Associates VIII, L.P., KEP VI, LLC and Estancia Capital Partners L.P., investment funds affiliated with Kelso & Company, L.P. (“Kelso”) or Estancia Capital Management, LLC (“Estancia”), which are private equity firms.
Recent Accounting Pronouncements
In March 2017, the Financial Accounting Standards Board (“FASB”) issued Accounting Standards Update (“ASU”)2017-08,Premium Amortization of Purchased Callable Debt Securities. The amendments in the ASU shorten the premium amortization period on a purchased callable debt security from the security’s contractual life to the earliest call date. It is anticipated that this change will enhance disclosures by reducing losses recognized when a security is called on an earlier date. This ASU is effective for fiscal years beginning after December 15, 2018. The Manager continues to evaluate the impact this ASU will have on the financial statements and other disclosures.
In August 2018, the FASB issued ASU2018-13,Fair Value Measurement (“Topic 820”). The amendments in the ASU impact disclosure requirements for fair value measurement. It is anticipated that this change will enhance the effectiveness of disclosures in the notes to the financial statements. This ASU is effective for fiscal years beginning after December 15, 2019. Early adoption is permitted and can include the entire standard or certain provisions that exclude or amend disclosures. For the year ended October 31, 2019, the Fund has chosen to adopt the standard. The adoption of this ASU guidance did not have a material impact on the financial statements and other disclosures.
Class Disclosure
The Fund has multiple classes of shares designed to meet the needs of different groups of investors. The following table sets forth the differences amongst the classes:
Class | Eligible Investors | Minimum Initial Investments | ||||
| Institutional | Large institutional investors - sold directly or through intermediary channels. | $ | 250,000 | |||
| Y Class | Large institutional retirement plan investors - sold directly or through intermediary channels. | $ | 100,000 | |||
| Investor | All investors using intermediary organizations, such as broker-dealers or retirement plan sponsors. | $ | 2,500 | |||
| Advisor Class | All investors who invest through intermediary organizations, such as broker-dealers or third party administrators. | $ | 2,500 | |||
| A Class | All investors who invest through intermediary organizations, such as broker-dealers or third party administrator. Retail investors who invest directly through a financial intermediary such as a broker, bank, or registered investment advisor which may include afront-end sales charge and a contingent deferred sales charge (“CDSC”). | $ | 2,500 | |||
20
American Beacon Large Cap Value FundSM
Notes to Financial Statements
October 31, 2019
Class | Eligible Investors | Minimum Initial Investments | ||||
| C Class | Retail investors who invest directly through a financial intermediary such as a broker or through employee directed benefit plans with applicable sales charges which may include CDSC. | $ | 1,000 | |||
| R6 Class | Large institutional retirement plan investors—sold through retirement plan sponsors. | None | ||||
Each class offered by the Trust has equal rights as to assets and voting privileges. Income andnon-class specific expenses are allocated daily to each class based on the relative net assets. Realized and unrealized capital gains and losses of each class are allocated daily based on the relative net assets of each class of the respective Fund. Class specific expenses, where applicable, currently include service, distribution, transfer agent fees, andsub-transfer agent fees that vary amongst the classes as described more fully in Note 2.
Significant Accounting Policies
The following is a summary of significant accounting policies, consistently followed by the Fund in preparation of the financial statements. The Fund is considered an investment company and accordingly, follows the investment company accounting and reporting guidance of the FASB Accounting Standards Codification Topic 946,Financial Services – Investment Companies,a part of Generally Accepted Accounting Principles (“U.S. GAAP”).
Security Transactions and Investment Income
Security transactions are recorded as of the trade date for financial reporting purposes. Securities purchased or sold on a when-issued or delayed-delivery basis may be settled beyond a standard settlement period for the security after the trade date.
Dividend income, net of foreign taxes, is recorded on theex-dividend date, except certain dividends from foreign securities which are recorded as soon as the information is available to the Fund. Interest income, net of foreign taxes, is earned from settlement date, recorded on the accrual basis, and adjusted, if necessary, for accretion of discounts and amortization of premiums. Realized gains (losses) from securities sold are determined based on specific lot identification.
Distributions to Shareholders
The Fund distributes most or all of its net earnings and realized gains, if any, each taxable year in the form of dividends from net investment income and distributions of realized net capital gains and net gains from foreign currency transactions on an annual basis. The Fund does not have a fixed dividend rate and does not guarantee that it will pay any distributions in any particular period. Dividends to shareholders are determined in accordance with federal income tax regulations, which may differ in amount and character from net investment income and realized gains recognized for purposes of U.S. GAAP. To the extent necessary to fully distribute capital gains, the Fund may designate earnings and profits distributed to shareholders on the redemption of shares.
Commission Recapture
The Fund has established brokerage commission recapture arrangements with certain brokers or dealers. If the Fund’s investment advisor chooses to execute a transaction through a participating broker, the broker rebates a portion of the commission back to the Fund. Any collateral benefit received through participation in the commission recapture program is directed exclusively to the Fund. This amount is reported with the net realized gain in the Fund’s Statement of Operations, if applicable.
21
American Beacon Large Cap Value FundSM
Notes to Financial Statements
October 31, 2019
Allocation of Income, Trust Expenses, Gains, and Losses
Investment income, realized and unrealized gains and losses from investments of the Fund is allocated daily to each class of shares based upon the relative proportion of net assets of each class to the total net assets of the Fund. Expenses directly charged or attributable to the Fund will be paid from the assets of the Fund. Generally, expenses of the Trust will be allocated among and charged to the assets of the Fund on a basis that the Trust’s Board of Trustees (the “Board”) deems fair and equitable, which may be based on the relative net assets of the Fund or nature of the services performed and relative applicability to the Fund.
Use of Estimates
The preparation of financial statements in conformity with U.S. GAAP requires management to make estimates and assumptions that affect the amounts reported in the financial statements and accompanying notes. Actual results may differ from those estimated.
Other
Under the Trust’s organizational documents, its officers and trustees are indemnified against certain liabilities arising out of the performance of their duties to the Trust. In the normal course of business, the Trust enters into contracts that provide indemnification to the other party or parties against potential costs or liabilities. The Trust’s maximum exposure under these arrangements is dependent on claims that may be made in the future and, therefore, cannot be estimated. The Trust has had no prior claims or losses pursuant to any such agreement.
2. Transactions with Affiliates
Management and InvestmentSub-Advisory Agreements
The Fund and the Manager are parties to a Management Agreement that obligates the Manager to provide the Fund with investment advisory and administrative services. As compensation for performing the duties under the Management Agreement, the Manager will receive an annualized management fee based on a percentage of the Fund’s average daily net assets that is calculated and accrued daily according to the following schedule:
First $15 billion | 0.35 | % | ||
Next $15 billion | 0.325 | % | ||
Over $30 billion | 0.30 | % |
The Trust, on behalf of the Fund, and the Manager have entered into Investment Advisory Agreements with Barrow, Hanley, Mewhinney & Strauss, LLC; Brandywine Global Investment Management, LLC; Hotchkis and Wiley Capital Management, LLC; and Massachusetts Financial Services Company(“Sub-Advisors”) pursuant to which the Fund has agreed to pay an annualizedsub-advisory fee that is calculated and accrued daily based on the Fund’s average daily net assets.
The Management andSub-Advisory Fees paid by the Fund for the year ended October 31, 2019 were as follows:
| Effective Fee Rate | Amount of Fees Paid | |||||||||||
Management Fees | 0.35 | % | $ | 19,827,185 | ||||||||
Sub-Advisor Fees | 0.20 | % | 11,322,783 | |||||||||
|
|
|
| |||||||||
Total | 0.55 | % | $ | 31,149,968 | ||||||||
|
|
|
| |||||||||
22
American Beacon Large Cap Value FundSM
Notes to Financial Statements
October 31, 2019
As compensation for services provided by the Manager in connection with securities lending activities conducted by the Fund, the lending Fund pays to the Manager, with respect to cash collateral posted by borrowers, a fee up to 10% of the net monthly interest income (the gross interest income earned by the investment of cash collateral, less the amount paid to borrowers and related expenses) from such activities and, with respect to loan fees paid by borrowers, a fee up to 10% of such loan fees. These fees are included in “Income derived from securities lending” and “Management and investment advisory fees” on the Statement of Operations. During the year ended October 31, 2019, the Manager received securities lending fees of $15,156 for the securities lending activities of the Fund.
Distribution Plans
The Fund, except for the Advisor, A, and C Classes of the Fund, has adopted a “defensive” Distribution Plan (the “Plan”) in accordance with Rule12b-1 under the Act, pursuant to which no separate fees may be charged to the Fund for distribution purposes. However, the Plan authorizes the management fee received by the Manager and the investment advisors hired by the Manager to be used for distribution purposes. Under this Plan, the Fund does not intend to compensate the Manager or any other party, either directly or indirectly, for the distribution of Fund shares.
Separate Distribution Plans (the “Distribution Plans”) have been adopted pursuant to Rule12b-1 under the Act for the Advisor, A, and C Classes of the Fund. Under the Distribution Plans, as compensation for distribution and shareholder servicing assistance, the Manager receives an annual fee of 0.25% of the average daily net assets of the Advisor and A Classes and 1.00% of the average daily net assets of the C Class. The fee will be payable without regard to whether the amount of the fee is more or less than the actual expenses incurred in a particular month by the Manager for distribution assistance.
Service Plans
The Manager and the Trust entered into a Service Plan that obligates the Manager to oversee additional shareholder servicing of the Investor, Advisor, A, and C Classes of the Fund. As compensation for performing the duties required under the Service Plan, the Manager receives an annualized fee up to 0.25% of the average daily net assets of the A and C Classes, up to 0.25% of the average daily net assets of the Advisor Class, and up to 0.375% of the average daily net assets of the Investor Class of the Fund.
Sub-Transfer Agent Fees
The Manager has entered into agreements, which include servicing agreements, with financial intermediaries that provide recordkeeping, processing, shareholder communications and other services to customers of the intermediaries that hold positions in the Institutional and Y Classes of the Fund and has agreed to compensate the intermediaries for providing these services. Intermediaries transact with the Fund primarily through the use of omnibus accounts on behalf of its customers who hold positions in the Fund. Certain services would have been provided by the Fund’s transfer agent and other service providers if the shareholders’ accounts were maintained directly by the Fund’s transfer agent. Accordingly, the Fund, pursuant to Board approval, has agreed to reimburse the Manager for certainnon-distribution shareholder services provided by financial intermediaries for the Institutional and Y Classes. The reimbursement amounts(sub-transfer agent fees) paid to the Manager are subject to a fee limit of up to 0.10% of an intermediary’s average net assets in the Institutional and Y Classes on an annual basis. During the year ended October 31, 2019, thesub-transfer agent fees, as reflected in “Transfer agent fees” on the Statement of Operations, were as follows:
Fund | Sub-Transfer Agent Fees | |||
Large Cap Value | $ | 1,289,142 | ||
23
American Beacon Large Cap Value FundSM
Notes to Financial Statements
October 31, 2019
As of October 31, 2019, the Fund owed the Manager the following reimbursement ofsub-transfer agent fees, as reflected in “Transfer agent fees payable” on the Statement of Assets and Liabilities:
Fund | Reimbursement Sub-Transfer Agent Fees | |||
Large Cap Value | $ | 41,540 | ||
Investments in Affiliated Funds
The Fund may invest in the American Beacon U.S. Government Money Market Select Fund (the “USG Select Fund”). Cash collateral received by the Fund in connection with securities lending may also be invested in the USG Select Fund. The Fund and the USG Select Fund have the same investment advisor and therefore, are considered to be affiliated. The Manager serves as investment advisor to the USG Select Fund and receives management fees and administrative fees totaling 0.10% of the average daily net assets of the USG Select Fund. During the year ended October 31, 2019, the Manager earned fees on the Fund’s direct investments and securities lending collateral investments in the USG Select Fund as shown below:
Fund | Direct Investments in USG Select Fund | Securities Lending Collateral Investments in USG Select Fund | Total | |||||||||
Large Cap Value | $ | 165,292 | $ | 33,248 | $ | 198,540 | ||||||
Interfund Credit Facility
Pursuant to an exemptive order issued by the SEC, the Fund, along with other registered investment companies having management contracts with the Manager, may participate in a credit facility whereby each fund, under certain conditions, is permitted to lend money directly to and borrow directly from other participating funds for temporary purposes. The interfund credit facility is advantageous to the funds because it provides added liquidity and eliminates the need to maintain higher cash balances to meet redemptions. This situation could arise when shareholder redemptions exceed anticipated volumes and certain funds have insufficient cash on hand to satisfy such redemptions or when sales of securities do not settle as expected, resulting in a cash shortfall for a fund. When a fund liquidates portfolio securities to meet redemption requests, they often do not receive payment in settlement for up to two days (or longer for certain foreign transactions). Redemption requests normally are satisfied on the next business day. The credit facility provides a source of immediate, short-term liquidity pending settlement of the sale of portfolio securities. The credit facility is administered by a credit facility team consisting of professionals from the Manager’s asset management, compliance, and accounting areas who report the activities of the credit facility to the Board. During the year ended October 31, 2019, the Fund participated as a lender by loaning an average amount of $6,352,992 for 131 days at an average interest rate of 2.96% with interest charges earned of $67,332. This amount is included in “Interest income” on the Statement of Operations.
Expense Reimbursement Plan
The Manager contractually agreed to reduce fees and/or reimburse expenses for the classes of the Fund to the extent that total operating expenses exceed the Fund’s expense cap. During the year ended October 31, 2019, the Manager waived and/or reimbursed expenses as follows:
| Expense Cap | Expiration of Reimbursed Expenses | |||||||||||||||||||
Fund | Class | 11/1/2018 - 10/31/2019 | Reimbursed Expenses | (Recouped) Expenses | ||||||||||||||||
Large Cap Value | R6 | 0.58 | % | $ | 169,110 | $ | (40,838 | ) | 2021 - 2022 | |||||||||||
24
American Beacon Large Cap Value FundSM
Notes to Financial Statements
October 31, 2019
Of these amounts, $159,529 was disclosed as a receivable from the Manager on the Statement of Assets and Liabilities at October 31, 2019.
The Fund has adopted an Expense Reimbursement Plan whereby the Manager may seek repayment of such fee or voluntary reductions and expense reimbursements. Under the policy, the Manager can be reimbursed by the Fund for any contractual or voluntary fee reductions or expense reimbursements if reimbursement to the Manager (a) occurs within three years after the date of the Manager’s waiver/reimbursement and (b) does not cause the Fund’s annual operating expenses to exceed the lesser of the contractual percentage limit in effect at the time of the waiver/reimbursement or time of recoupment. The reimbursed expenses listed above will expire in 2021 - 2022. The Fund did not record a liability for potential reimbursement due to the current assessment that a reimbursement is uncertain. The carryover of excess expenses potentially reimbursable to the Manager are as follows:
Fund | Recouped Expenses | Excess Expense Carryover | Expired Expense Carryover | Expiration of Reimbursed Expenses | ||||||||||||
Large Cap Value | $ | 29,307 | $ | - | $ | - | 2020 – 2021 | |||||||||
Large Cap Value | 1,950 | - | - | 2019 - 2020 | ||||||||||||
Sales Commissions
The Fund’s Distributor, Resolute Investment Distributors, Inc. (“RID” or “Distributor”), may receive a portion of Class A sales charges from broker dealers and it may be used to offset distribution related expenses. During the year ended October 31, 2019, RID collected $527 from the sale of Class A Shares of the Fund.
A CDSC of 0.50% will be deducted with respect to Class A Shares on certain purchases of $1,000,000 or more that are redeemed in whole or part within 18 months of purchase, unless waived as discussed in the Fund’s Prospectus. Any applicable CDSC will be 0.50% of the lesser of the original purchase price or the value of the redemption of the Class A Shares redeemed. During the year ended October 31, 2019, there were no CDSC fees collected for Class A Shares of the Fund.
A CDSC of 1.00% will be deducted with respect to Class C Shares redeemed within 12 months of purchase, unless waived as discussed in the Fund’s Prospectus. Any applicable CDSC will be 1.00% of the lesser of the original purchase price or the value of the redemption of the Class C Shares redeemed. During the year ended October 31, 2019, CDSC fees of $3,155 were collected for Class C Shares of the Fund.
Trustee Fees and Expenses
As compensation for their service to the Trusts, each Trustee receives an annual retainer of $120,000, plus $10,000 for each Board meeting attended in person or via teleconference, $2,500 for attendance by Committee members at meetings of the Audit Committee and the Investment Committee, and $1,500 for attendance by Committee members at meetings of the Nominating and Governance Committee, plus reimbursement of reasonable expenses incurred in attending Board meetings, Committee meetings, and relevant educational seminars. The Trustees also may be compensated for attendance at special Board and/or Committee meetings from time to time. The Board Chair receives an additional annual retainer of $50,000 as well as a $2,500 fee each quarter for attendance at the committee meetings. The Chairpersons of the Audit Committee and the Investment Committee each receive an additional annual retainer of $25,000 and the Chairman of the Nominating and Governance Committee receives an additional annual retainer of $10,000. These expenses are allocated on a prorated basis to each fund of the Trusts according to its respective net assets.
25
American Beacon Large Cap Value FundSM
Notes to Financial Statements
October 31, 2019
3. Security Valuation and Fair Value Measurements
The price of the Fund’s shares is based on its net asset value (“NAV”) per share. The Fund’s NAV is computed by adding total assets, subtracting all the Fund’s liabilities, and dividing the result by the total number of shares outstanding.
The NAV of each class of the Fund’s shares is determined based on a pro rata allocation of the Fund’s investment income, expenses and total capital gains and losses. The Fund’s NAV per share is determined each business day as of the regular close of trading on the New York Stock Exchange (“NYSE” or “Exchange”), which is typically 4:00 p.m. Eastern Time (“ET”). However, if trading on the NYSE closes at a time other than 4:00 p.m. ET, the Fund’s NAV per share typically would still be determined as of the regular close of trading on the NYSE. The Fund does not price its shares on days that the NYSE is closed. Foreign exchanges may permit trading in foreign securities on days when the Fund is not open for business, which may result in the value of the Fund’s portfolio investments being affected at a time when you are unable to buy or sell shares.
Equity securities, including shares ofclosed-end funds and exchange-traded funds (“ETFs”), are valued at the last sale price or official closing price taken from the primary exchange in which each security trades. Investments in other mutual funds are valued at the closing NAV per share on the day of valuation. Debt securities are valued at bid quotes from broker/dealers or evaluated bid prices from pricing services, who may consider a number of inputs and factors, such as prices of comparable securities, yield curves, spreads, credit ratings, coupon rates, maturity, default rates, and underlying collateral. Futures are valued based on their daily settlement prices. Exchange-traded andover-the-counter (“OTC”) options are valued at the last sale price. Options with no last sale for the day are priced at mid quote. Swaps are valued at evaluated mid prices from pricing services.
The valuation of securities traded on foreign markets and certain fixed-income securities will generally be based on prices determined as of the earlier closing time of the markets on which they primarily trade unless a significant event has occurred. When the Fund holds securities or other assets that are denominated in a foreign currency, the Fund will normally use the currency exchange rates as of 4:00 p.m. ET.
Securities may be valued at fair value, as determined in good faith and pursuant to procedures approved by the Board, under certain limited circumstances. For example, fair value pricing will be used when market quotations are not readily available or reliable, as determined by the Manager, such as when (i) trading for a security is restricted or stopped; (ii) a security’s trading market is closed (other than customary closings); or (iii) a security has beende-listed from a national exchange. A security with limited market liquidity may require fair value pricing if the Manager determines that the available price does not reflect the security’s true market value. In addition, if a significant event that the Manager determines to affect the value of one or more securities held by the Fund occurs after the close of a related exchange but before the determination of the Fund’s NAV, fair value pricing may be used on the affected security or securities. Securities of small-capitalization companies are also more likely to require a fair value determination using these procedures because they are more thinly traded and less liquid than the securities of larger-capitalization companies. The Fund may fair value securities as a result of significant events occurring after the close of the foreign markets in which the Fund invests as described below. In addition, the Fund may invest in illiquid securities requiring these procedures.
The Fund may use fair value pricing for securities primarily traded innon-U.S. markets because most foreign markets close well before the Fund’s pricing time of 4:00 p.m. ET. The earlier close of these foreign markets gives rise to the possibility that significant events, including broad market moves, may have occurred in the interim and may materially affect the value of those securities. If the Manager determines that the last quoted prices ofnon-U.S. securities will, in its judgment, materially affect the value of some or all its portfolio securities, the Manager can adjust the previous closing prices to reflect what it believes to be the fair value of the securities as of the close of the Exchange. In deciding whether it is necessary to adjust closing prices to reflect fair value, the Manager reviews a variety of factors, including developments in foreign markets, the performance of U.S. securities markets, and the performance of instruments trading in U.S. markets that represent foreign securities
26
American Beacon Large Cap Value FundSM
Notes to Financial Statements
October 31, 2019
and baskets of foreign securities. These securities are fair valued using a pricing service, using methods approved by the Board, that considers the correlation of the trading patterns of the foreign security to intraday trading in the U.S. markets, based on indices of domestic securities and other appropriate indicators such as prices of relevant American Depositary Receipts (“ADRs”) and futures contracts. The Valuation Committee, established by the Board, may also fair value securities in other situations, such as when a particular foreign market is closed but the Fund is open. The Fund uses outside pricing services to provide closing prices and information to evaluate and/or adjust those prices. As a means of evaluating its security valuation process, the Valuation Committee routinely compares closing prices, the next day’s opening prices in the same markets and adjusted prices.
Attempts to determine the fair value of securities introduce an element of subjectivity to the pricing of securities. As a result, the price of a security determined through fair valuation techniques may differ from the price quoted or published by other sources and may not accurately reflect the market value of the security when trading resumes. If a reliable market quotation becomes available for a security formerly valued through fair valuation techniques, the Manager compares the new market quotation to the fair value price to evaluate the effectiveness of the Fund’s fair valuation procedures. If any significant discrepancies are found, the Manager may adjust the Fund’s fair valuation procedures.
Valuation Inputs
Various inputs may be used to determine the fair value of the Fund’s investments. These inputs are summarized in three broad levels for financial statement purposes. The inputs or methodologies used to value securities are not necessarily an indication of the risk associated with investing in those securities.
| Level 1 | - | Quoted prices in active markets for identical securities. | ||
| Level 2 | - | Prices determined using other significant observable inputs. These may include quoted prices for similar securities, interest rates, prepayment speeds, credit risk, and others. | ||
| Level 3 | - | Prices determined using other significant unobservable inputs. Unobservable inputs reflect the Fund’s own assumptions about the factors market participants would use in pricing an investment. | ||
Level 1 and Level 2 trading assets and trading liabilities, at fair value
Common stocks, preferred securities and financial derivative instruments, such as futures contracts that are traded on a national securities exchange, are stated at the last reported sale or settlement price on the day of valuation. To the extent these securities are actively traded and valuation adjustments are not applied, they are categorized as Level 1 of the fair value hierarchy. Preferred securities and other equities traded on inactive markets or valued by reference to similar instruments are generally categorized as Level 2 of the fair value hierarchy.
Investments in registeredopen-end investment management companies will be valued based upon the NAVs of such investments and are categorized as Level 1 of the fair value hierarchy.
4. Securities and Other Investments
American Depositary Receipts andNon-Voting Depositary Receipts
ADRs are depositary receipts for foreign issuers in registered form traded in U.S. securities markets.Non-Voting Depositary Receipts (“NVDRs”) represent financial interests in an issuer but the holder is not entitled to any voting rights. Depositary receipts may not be denominated in the same currency as the securities into which they may be converted. Investing in depositary receipts entails substantially the same risks as direct investment in foreign securities. There is generally less publicly available information about foreign companies and there may be less governmental regulation and supervision of foreign stock exchanges, brokers, and listed companies. In
27
American Beacon Large Cap Value FundSM
Notes to Financial Statements
October 31, 2019
addition, such companies may use different accounting and financial standards (and certain currencies may become unavailable for transfer from a foreign currency), resulting in the Fund possible inability to convert immediately into U.S. currency proceeds realized upon the sale of portfolio securities of the affected foreign companies. In addition, the Fund may invest in unsponsored depositary receipts, the issuers of which are not obligated to disclose material information about the underlying securities to investors in the United States. Ownership of unsponsored depositary receipts may not entitle the Fund to the same benefits and rights as ownership of a sponsored depositary receipt or the underlying security.
Common Stock
Common stock generally takes the form of shares in a corporation which represent an ownership interest. It ranks below preferred stock and debt securities in claims for dividends and for assets of the company in a liquidation or bankruptcy. The value of a company’s common stock may fall as a result of factors directly relating to that company, such as decisions made by its management or decreased demand for the company’s products or services. A stock’s value may also decline because of factors affecting not just the company, but also companies in the same industry or sector. The price of a company’s stock may also be affected by changes in financial markets that are relatively unrelated to the company, such as changes in interest rates, currency exchange rates or industry regulation. Companies that elect to pay dividends on their common stock generally only do so after they invest in their own business and make required payments to bondholders and on other debt and preferred stock. Therefore, the value of a company’s common stock will usually be more volatile than its bonds, other debt and preferred stock. Common stock may be exchange-traded or OTC. OTC stock may be less liquid than exchange-traded stock.
Other Investment Company Securities and Other Exchange-Traded Products
The Fund may invest in shares of other investment companies, includingopen-end funds,closed-end funds, business development companies, ETFs, unit investment trusts, and other investment companies of the Trust. The Fund may invest in investment company securities advised by the Manager or asub-advisor. Investments in the securities of other investment companies may involve duplication of advisory fees and certain other expenses. By investing in another investment company, the Fund becomes a shareholder of that investment company. As a result, the Fund’s shareholders indirectly will bear the Fund’s proportionate share of the fees and expenses paid by shareholders of the other investment company, in addition to the fees and expenses the Fund’s shareholders directly bear in connection with the Fund’s own operations. These other fees and expenses are reflected as Acquired Fund Fees and Expenses and are included in the Fees and Expenses Table for the Fund in its Prospectus, if applicable. Investments in other investment companies may involve the payment of substantial premiums above the value of such issuer’s portfolio securities.
Publicly Traded Partnerships; Master Limited Partnerships
The Fund may invest in publicly traded partnerships such as master limited partnerships (“MLPs”). MLPs issue units that are registered with the SEC and are freely tradable on a securities exchange or in the OTC market. An MLP may have one or more general partners, who conduct the business, and one or more limited partners, who contribute capital. An MLP also may be an entity similar to a limited partnership, such as a limited liability company, which has a manager or managing member andnon-managing members (who are like limited partners). The general partner or partners are jointly and severally responsible for the liabilities of the MLP. A Fund invests as a limited partner and normally would not be liable for the debts of an MLP beyond the amount the Fund has invested therein but it would not be shielded to the same extent that a shareholder of a corporation would be. In certain instances, creditors of an MLP would have the right to seek a return of capital that had been distributed to a limited partner. The right of an MLP’s creditors would continue even after a Fund had sold its investment in the partnership. MLPs typically invest in real estate and oil and gas equipment leasing assets, but they also finance entertainment, research and development, and other projects.
28
American Beacon Large Cap Value FundSM
Notes to Financial Statements
October 31, 2019
Real Estate Investment Trusts
The Fund may own shares of real estate investment trusts (“REITs”) which report information on the source of their distributions annually. The Fundre-characterizes distributions received from REIT investments based on information provided by the REITs into the following categories: ordinary income, long-term capital gains, and return of capital. If information is not available on a timely basis from the REITs, there-characterization will be estimated based on available information, which may include the previous year allocation. If new or additional information becomes available from the REITs at a later date, are-characterization will be made the following year.
5. Financial Derivative Instruments
The Fund may utilize derivative instruments to gain market exposure on cash balances to hedge foreign currency exposure or reduce market exposure in anticipation of liquidity needs. When considering the Fund’s use of derivatives, it is important to note that the Fund does not use derivatives for the purpose of creating financial leverage.
Futures Contracts
Futures contracts are contracts to buy or sell a standard quantity of securities at a specified price on a future date. The Fund may enter into financial futures contracts as a method for keeping assets readily convertible to cash if needed to meet shareholder redemptions or for other needs while maintaining exposure to the stock or bond market, as applicable. The primary risks associated with the use of futures contracts are the possibility of illiquid markets or imperfect correlation between the values of the contracts and the underlying securities or that the counterparty will fail to perform its obligations.
Upon entering into a futures contract, the Fund is required to set aside or deposit with a broker an amount, termed the initial margin, which typically represents a portion of the face value of the futures contract. The Fund usually reflects this amount on the Schedule of Investments as a U.S. Treasury Bill held as collateral for futures contracts or as cash deposited with broker on the Statement of Assets and Liabilities. Payments to and from the broker, known as variation margin, are required to be made on a daily basis as the price of the futures contract fluctuates. Changes in initial settlement values are accounted for as unrealized appreciation (depreciation) until the contracts are terminated, at which time realized gains and losses are recognized. Futures contracts are valued at the most recent settlement price established each day by the exchange on which they are traded.
During the year ended October 31, 2019, the Fund entered into futures contracts primarily for exposing cash to markets.
The Fund’s average futures contracts outstanding fluctuate throughout the operating year as required to meet strategic requirements. The following table illustrates the average quarterly volume of futures contracts. For the purpose of this disclosure, volume is measured by contracts outstanding at each quarter end.
Average Futures Contracts Outstanding | ||||
Fund | Year Ended October 31, 2019 | |||
Large Cap Value | 1,075 | |||
29
American Beacon Large Cap Value FundSM
Notes to Financial Statements
October 31, 2019
The following is a summary of the fair valuations of the Fund’s derivative instruments categorized by risk exposure(1):
| Fair values of financial instruments on the Statement of Assets and Liabilities as of October 31, 2019: |
| ||||||||||||||||||||||||||||||||||||||||||||||||||||||
| Derivatives not accounted for as hedging instruments | |||||||||||||||||||||||||||||||||||||||||||||||||||||||
Assets: | Credit contracts | Foreign exchange contracts | Commodity contracts | Interest rate contracts | Equity contracts | Total | |||||||||||||||||||||||||||||||||||||||||||||||||
| Receivable for variation margin from open futures contracts(2) | $ | - | $ | - | $ | - | $ | - | $ | 2,603,910 | $ | 2,603,910 | |||||||||||||||||||||||||||||||||||||||||||
| The effect of financial derivative instruments on the Statement of Operations as of October 31, 2019: |
| ||||||||||||||||||||||||||||||||||||||||||||||||||||||
| Derivatives not accounted for as hedging instruments | |||||||||||||||||||||||||||||||||||||||||||||||||||||||
Realized gain (loss) from derivatives | Credit contracts | Foreign exchange contracts | Commodity contracts | Interest rate contracts | Equity contracts | Total | |||||||||||||||||||||||||||||||||||||||||||||||||
| Futures contracts | $ | - | $ | - | $ | - | $ | - | $ | 4,328,396 | $ | 4,328,396 | |||||||||||||||||||||||||||||||||||||||||||
Net change in unrealized appreciation | Credit contracts | Foreign exchange contracts | Commodity contracts | Interest rate contracts | Equity contracts | Total | |||||||||||||||||||||||||||||||||||||||||||||||||
| Futures contracts | $ | - | $ | - | $ | - | $ | - | $ | 14,221,296 | $ | 14,221,296 | |||||||||||||||||||||||||||||||||||||||||||
(1)See Note 3 in the Notes to Financial Statements for additional information.
(2)Includes cumulative appreciation (depreciation) of futures contracts as reported in the Fund’s Schedule of Investments footnotes. Only current day’s variation margin is reported within the Statement of Assets and Liabilities.
Offsetting Assets and Liabilities
The Fund is a party to enforceable master netting agreements between brokers and counterparties which provide for the right to offset under certain circumstances. The Fund employs multiple money managers and counterparties and has elected not to offset qualifying financial and derivative instruments on the Statement of Assets and Liabilities, as such all financial and derivative instruments are presented on a gross basis. The impacts of netting arrangements that provide the right to offset are detailed below, if applicable. The net amount represents the net receivable or payable that would be due from or to the counterparty in the event of default. Exposure from borrowings and other financing agreements such as repurchase agreements can only be netted across transactions governed by the same Master Agreement with the same legal entity. All amounts reported below represent the balance as of the report date, October 31, 2019.
| Offsetting of Financial and Derivative Assets as of October 31, 2019: | ||||||||||||
| Assets | Liabilities | |||||||||||
| Futures Contracts(1) | $ | 2,603,910 | $ | - | ||||||||
|
|
|
| |||||||||
| Total derivative assets and liabilities in the Statement of Assets and Liabilities | $ | 2,603,910 | $ | - | ||||||||
|
|
|
| |||||||||
| Derivatives not subject to a Master Netting Agreement or similar agreement (“MNA”) | $ | (2,606,910 | ) | $ | - | |||||||
|
|
|
| |||||||||
| Remaining Contractual Maturity of the Agreements As of October 31, 2019 | ||||||||||||||||||||||||||||||||||||
| Overnight and Continuous | <30 days | Between 30 & 90 days | >90 days | Total | ||||||||||||||||||||||||||||||||
Securities Lending Transactions | ||||||||||||||||||||||||||||||||||||
Common Stocks | $ | 20,296,656 | $ | - | $ | - | $ | - | $ | 20,296,656 | ||||||||||||||||||||||||||
|
|
|
|
|
|
|
|
|
| |||||||||||||||||||||||||||
Total Borrowings | $ | 20,296,656 | $ | - | $ | - | $ | - | $ | 20,296,656 | ||||||||||||||||||||||||||
|
|
|
|
|
|
|
|
|
| |||||||||||||||||||||||||||
Gross amount of recognized liabilities for securities lending transactions |
| $ | 20,296,656 | |||||||||||||||||||||||||||||||||
|
| |||||||||||||||||||||||||||||||||||
(1) Includes cumulative appreciation or (depreciation) of futures contracts as reported in the Schedule of Investments footnotes. Only current day’s variation margin is reported within the Statement of Assets and Liabilities.
30
American Beacon Large Cap Value FundSM
Notes to Financial Statements
October 31, 2019
6. Principal Risks
Investing in the Fund may involve certain risks including, but not limited to, those described below.
Equity Investments Risk
Equity securities are subject to market risk. The Fund’s investments in equity securities may include common stocks, preferred stocks, securities convertible into or exchangeable for common stocks, REITs, depositary receipts, and U.S. dollar-denominated foreign stocks traded on U.S. exchanges. Such investments may expose the Fund to additional risk. The value of a company’s common stock may fall as a result of factors affecting the company, companies in the same industry or sector, or the financial markets overall. Common stock generally is subordinate to preferred stock upon the liquidation or bankruptcy of the issuing company. Preferred stocks and convertible securities are sensitive to movements in interest rates. Preferred stocks may be less liquid than common stocks and, unlike common stocks, participation in the growth of an issuer may be limited. Distributions on preferred stocks generally are payable at the discretion of an issuer and after required payments to bond holders. Convertible securities are subject to the risk that the credit standing of the issuer may have an effect on the convertible securities’ investment value. Investments in REITs are subject to the risks associated with investing in the real estate industry such as adverse developments affecting the real estate industry and real property values. Depositary receipts and U.S. dollar-denominated foreign stocks traded on U.S. exchanges are subject to certain of the risks associated with investing directly in foreign securities, including, but not limited to, currency fluctuations and political and financial instability in the home country of a particular depositary receipt or foreign stock.
Foreign Investing and Emerging Markets Risk
Non-U.S. investments carry potential risks not associated with U.S. investments. Such risks include, but are not limited to: (1) currency exchange rate fluctuations, (2) political and financial instability, (3) less liquidity, (4) lack of uniform accounting, auditing and financial reporting standards, (5) increased price volatility, (6) less government regulation and supervision of foreign stock exchanges, brokers and listed companies, and (7) delays in transaction settlement in some foreign markets. To the extent the Fund invests a significant portion of its assets in securities of a single country or region, it is more likely to be affected by events or conditions of that country or region. In addition, the economies and political environments of emerging market countries tend to be more unstable than those of developed countries, resulting in more volatile rates of return than the developed markets and substantially greater risk to investors. There may be very limited oversight of certain foreign banks or securities depositories that hold foreign securities and currency and the laws of certain countries may limit the ability to recover such assets if a foreign bank or depository or their agents goes bankrupt. When investing in emerging markets, the risks of investing in foreign securities are heightened. Emerging markets have unique risks that are greater than, or in addition to, investing in developed markets because emerging markets are generally smaller, less developed, less liquid and more volatile than the securities markets of the U.S. and other developed markets. There are also risks of: greater political uncertainties; an economy’s dependence on revenues from particular commodities or on international aid or development assistance; currency transfer restrictions; a limited number of potential buyers for such securities, resulting in increased volatility and limited liquidity for emerging market securities; trading suspensions; and delays and disruptions in securities settlement procedures. In addition, there may be less information available to make investment decisions and more volatile rates of return.
Futures Contracts Risk
Futures contracts are derivative instruments where one party pays a fixed price for an agreed amount of securities or other underlying assets at an agreed date. The use of such derivative instruments may expose the Fund to additional risks that it would not be subject to if it invested directly in the securities underlying those derivatives. Futures contracts may experience potentially dramatic price changes (losses) and imperfect correlation between the price of the contract and the underlying security or index, which will increase the volatility of the Fund and may involve a small investment of cash (the amount of initial and variation margin) relative to the magnitude of the risk assumed (the potential increase or decrease in the price of the futures contract).
31
American Beacon Large Cap Value FundSM
Notes to Financial Statements
October 31, 2019
Market Risk
Since the financial crisis that started in 2008, the U.S. and many foreign economies continue to experience its after-effects. Conditions in the U.S. and many foreign economies have resulted, and may continue to result, in certain instruments experiencing unusual liquidity issues, increased price volatility and, in some cases, credit downgrades and increased likelihood of default. These events have reduced the willingness and ability of some lenders to extend credit, and have made it more difficult for some borrowers to obtain financing on attractive terms, if at all. In some cases, traditional market participants have been less willing to make a market in some types of debt instruments, which has affected the liquidity of those instruments. During times of market turmoil, investors tend to look to the safety of securities issued or backed by the U.S. Treasury, causing the prices of these securities to rise and the yields to decline. Reduced liquidity in fixed income and credit markets may negatively affect many issuers worldwide. In addition, global economies and financial markets are becoming increasingly interconnected, which increases the possibilities that conditions in one country or region might adversely impact issuers in a different country or region. A rise in protectionist trade policies, and the possibility of changes to some international trade agreements, could affect the economies of many nations in ways that cannot necessarily be foreseen at the present time.
In response to the financial crisis, the U.S. and other governments and the Federal Reserve and certain foreign central banks have taken steps to support financial markets. In some countries where economic conditions are recovering, they are nevertheless perceived as still fragile. Withdrawal of government support, failure of efforts in response to the crisis, or investor perception that such efforts are not succeeding, could adversely impact the value and liquidity of certain securities. The severity or duration of adverse economic conditions may also be affected by policy changes made by governments or quasi-governmental organizations, including changes in tax laws. The impact of new financial regulation legislation on the markets and the practical implications for market participants may not be fully known for some time. Regulatory changes are causing some financial services companies to exit long-standing lines of business, resulting in dislocations for other market participants. In addition, political and diplomatic events within the U.S. and abroad, such as the U.S. government’s inability at times to agree on a long-term budget and deficit reduction plan, the threat of a federal government shutdown and threats not to increase the federal government’s debt limit, may affect investor and consumer confidence and may adversely impact financial markets and the broader economy, perhaps suddenly and to a significant degree. The U.S. government has recently reduced federal corporate income tax rates, and future legislative, regulatory and policy changes may result in more restrictions on international trade, less stringent prudential regulation of certain players in the financial markets, and significant new investments in infrastructure and national defense. Markets may react strongly to expectations about the changes in these policies, which could increase volatility, especially if the markets’ expectations for changes in government policies are not borne out.
Changes in market conditions will not have the same impact on all types of securities. Interest rates have been unusually low in recent years in the U.S. and abroad. Because there is little precedent for this situation, it is difficult to predict the impact of a significant rate increase on various markets. For example, because investors may buy securities or other investments with borrowed money, a significant increase in interest rates may cause a decline in the markets for those investments. Because of the sharp decline in the worldwide price of oil, there is a concern that oil producing nations may withdraw significant assets now held in U.S. Treasuries, which could force a substantial increase in interest rates. Regulators have expressed concern that rate increases may cause investors to sell fixed income securities faster than the market can absorb them, contributing to price volatility. In addition, there is a risk that the prices of goods and services in the U.S. and many foreign economies may decline over time, known as deflation (the opposite of inflation). Deflation may have an adverse effect on stock prices and creditworthiness and may make defaults on debt more likely. If a country’s economy slips into a deflationary pattern, it could last for a prolonged period and may be difficult to reverse. The precise details and the resulting impact of the United Kingdom’s vote to leave the European Union (the “EU”), commonly referred to as “Brexit,” are not yet known. The effect on the United Kingdom’s economy will likely depend on the nature of trade relations with the EU and other major economies following its exit, which are matters to be negotiated. The outcomes may cause increased volatility and have a significant adverse impact on world financial markets, other international trade agreements, and the United Kingdom and European economies, as well as the broader global economy for some time, which could significantly adversely affect the value of the Fund’s investments in the United Kingdom and Europe.
32
American Beacon Large Cap Value FundSM
Notes to Financial Statements
October 31, 2019
MultipleSub-Advisor Risk
The Manager may allocate the Fund’s assets among multiplesub-advisors, each of which is responsible for investing its allocated portion of the Fund’s assets. To a significant extent, the Fund’s performance will depend on the success of the Manager in allocating the Fund’s assets tosub-advisors and its selection and oversight of thesub-advisors. Because eachsub-advisor manages its allocated portion of the Fund independently from anothersub-advisor, the same security may be held in different portions of the Fund, or may be acquired for one portion of the Fund at a time when asub-advisor to another portion deems it appropriate to dispose of the security from that other portion, resulting in higher expenses without accomplishing any net result in the Fund’s holdings. Similarly, under some market conditions, onesub-advisor may believe that temporary, defensive investments in short-term instruments or cash are appropriate when anothersub-advisor believes continued exposure to the equity or debt markets is appropriate for its allocated portion of the Fund. Because eachsub-advisor directs the trading for its own portion of the Fund, and does not aggregate its transactions with those of the othersub-advisors, the Fund may incur higher brokerage costs than would be the case if a singlesub-adviser were managing the entire Fund. In addition, while the Manager seeks to allocate the Fund’s assets among the Fund’ssub-advisors in a manner that it believes is consistent with achieving the Fund’s investment objective(s), the Manager may be subject to potential conflicts of interest in allocating the Fund’s assets amongsub-advisors, due to factors that could impact the Manager’s revenues and profits.
Other Investment Companies Risk
The Fund may invest in shares of other registered investment companies, including money market funds that are advised by the Manager. To the extent that the Funds invests in shares of other registered investment companies, the Fund will indirectly bear fees and expenses, including for example, advisory and administrative fees, charged by those investment companies in addition to the Funds’ direct fees and expenses and will be subject to the risks associated with investments in those companies. For example, the Funds’ investments in money market funds are subject to interest rate risk, credit risk, and market risk. The Fund must rely on the investment company in which it invests to achieve its investment objective. If the investment company fails to achieve its investment objective, the value of the Funds’ investment will decline, adversely affecting the Funds’ performance. To the extent the Funds invest in other investment companies that invest in equity securities, fixed-income securities and/or foreign securities, or track an index, the Fund is subject to the risks associated with the underlying investments held by the investment company or the index fluctuations to which the investment company is subject.
Sector Risk
Sector risk is the risk associated with a Fund holding a significant amount of investments in similar businesses, which would be similarly affected by particular economic or market events, which may, in certain circumstances, cause the value of the equity and debt securities of companies in a particular sector of the market to change. To the extent a Fund has substantial holdings within a particular sector, the risks to a Fund associated with that sector increase.
To the extent a Fund invests significantly in the financial services sector, the value of the Fund’s shares may be particularly vulnerable to factors affecting that sector, such as the availability and cost of capital funds, changes in interest rates, the rate of corporate and consumer debt defaults, extensive government regulation and price competition. The value of a Fund’s shares could experience significantly greater volatility than investment companies investing more broadly.
Securities Lending Risk
A Fund may lend its portfolio securities to brokers, dealers and financial institutions to seek income. There is a risk that a borrower may default on its obligations to return loaned securities; however, a Fund’s securities lending agent indemnifies the Fund against that risk. There is a risk that the assets of a Fund’s securities lending
33
American Beacon Large Cap Value FundSM
Notes to Financial Statements
October 31, 2019
agent may be insufficient to satisfy any contractual indemnification requirements to the Fund. Borrowers of a Fund’s securities typically provide collateral in the form of cash that is reinvested in securities. A Fund will be responsible for the risks associated with the investment of cash collateral, including any collateral invested in an affiliated money market fund. A Fund may lose money on its investment of cash collateral or may fail to earn sufficient income on its investment to meet obligations to the borrower. In addition, delays may occur in the recovery of securities from borrowers, which could interfere with a Fund’s ability to vote proxies or to settle transactions and there is the risk of possible loss of rights in the collateral should the borrower fail financially. In any case in which the loaned securities are not returned to the Fund before anex-dividend date, the payment in lieu of the dividend that the Fund receives from the securities’ borrower would not be treated as a dividend for federal income tax purposes and thus would not qualify for treatment as “qualified dividend income”.
7. Federal Income and Excise Taxes
It is the policy of the Fund to qualify as a regulated investment company (“RIC”), by complying with all applicable provisions of Subchapter M of the Internal Revenue Code, as amended, and to make distributions of taxable income sufficient to relieve it from substantially all federal income and excise taxes. For federal income tax purposes, the Fund is treated as a single entity for the purpose of determining such qualification.
The Fund does not have any unrecorded tax liabilities in the accompanying financial statements. Each of the tax years in the four year period ended October 31, 2019 remain subject to examination by the Internal Revenue Service. If applicable, the Fund recognizes interest accrued related to unrecognized tax benefits in interest expense and penalties in “Other expenses” on the Statement of Operations.
The Fund may be subject to taxes imposed by countries in which it invests. Such taxes are generally based on returns of income earned or gains realized or repatriated. Taxes are accrued and applied to net investment income, net realized capital gains and net unrealized appreciation (depreciation), as applicable, as the income is earned or capital gains are recorded.
Dividends are categorized in accordance with income tax regulations which may treat certain transactions differently than U.S. GAAP. Accordingly, the character of distributions and composition of net assets for tax purposes may differ from those reflected in the accompanying financial statements.
The tax character of distributions paid were as follows:
| Year Ended October 31, 2019 | Year Ended October 31, 2018 | |||||||||||
Distributions paid from: | ||||||||||||
Ordinary income* | ||||||||||||
Institutional Class | $ | 82,267,452 | $ | 165,506,978 | ||||||||
Y Class | 6,344,886 | 13,806,107 | ||||||||||
Investor Class | 30,326,749 | 66,628,592 | ||||||||||
Advisor Class | 1,133,733 | 2,835,000 | ||||||||||
A Class | 1,059,821 | 1,445,057 | ||||||||||
C Class | 88,990 | 235,964 | ||||||||||
R6 Class | 13,223,221 | 6,390,376 | ||||||||||
Long-term capital gains | ||||||||||||
Institutional Class | 225,428,886 | 293,913,261 | ||||||||||
Y Class | 18,154,510 | 24,886,049 | ||||||||||
Investor Class | 97,933,129 | 130,155,913 | ||||||||||
Advisor Class | 4,067,588 | 5,829,879 | ||||||||||
A Class | 3,296,575 | 2,795,844 | ||||||||||
C Class | 455,171 | 572,231 | ||||||||||
R6 Class | 35,670,209 | 11,244,521 | ||||||||||
|
|
|
| |||||||||
Total distributions paid | $ | 519,450,920 | $ | 726,245,772 | ||||||||
|
|
|
| |||||||||
* For tax purposes, short-term gains are considered ordinary income distributions.
34
American Beacon Large Cap Value FundSM
Notes to Financial Statements
October 31, 2019
As of October 31, 2019 the components of distributable earnings (deficits) on a tax basis were as follows:
Fund | Tax Cost | Unrealized Appreciation | Unrealized (Depreciation) | Net Unrealized Appreciation (Depreciation) | ||||||||||||||||||||||
| Large Cap Value | $4,339,764,821 | $ | 1,344,205,897 | $ | (245,792,287 | ) | $ | 1,098,413,610 | ||||||||||||||||||
Fund | Net Unrealized Appreciation (Depreciation) | Undistributed Ordinary Income | Undistributed Long-Term Capital Gains | Accumulated Capital and Other (Losses) | Other Temporary Differences | Distributable Earnings | ||||||||||||||||||||||||||||||||||||
| Large Cap Value | $1,098,413,610 | $ | 102,769,462 | $ | 385,519,316 | $ | - | $ | 1 | $ | 1,586,702,389 | |||||||||||||||||||||||||||||||
Financial reporting records are adjusted for permanent book/tax differences to reflect tax character. Financial records are not adjusted for temporary differences. The temporary differences between financial reporting andtax-basis reporting of unrealized appreciation (depreciation) are attributable primarily to the tax deferral of losses from wash sales, the realization for tax purposes of unrealized gains (losses) on certain derivative instruments, and reclassifications of income from investments in real estate investment securities and publicly traded partnerships.
Due to inherent differences in the recognition of income, expenses, and realized gains (losses) under U.S. GAAP and federal income tax regulations, permanent differences between book and tax reporting have been identified and appropriately reclassified on the Statement of Assets and Liabilities.
Accordingly, the following amounts represent current year permanent differences derived fromtax-exempt interest and nondeductible expenses from investments in publicly traded partnerships as of October 31, 2019:
Fund | Paid-In-Capital | Distributable Earnings/(Deficits) | ||||||||||
| Large Cap Value | $ | 58,968 | $ | (58,968 | ) | |||||||
Under the Regulated Investment Company Modernization Act of 2010 (“RIC MOD”), net capital losses recognized by the Fund in taxable years beginning after December 22, 2010 are carried forward indefinitely and retain their character as short-term and/or long-term losses.
As of October 31, 2019, the Fund did not have any capital loss carryforwards.
8. Investment Transactions
The aggregate cost of purchases and proceeds from sales and maturities of investments, other than short-term obligations, for the year ended October 31, 2019 were as follows:
Fund | Purchases (non-U.S. Government Securities) | Sales (non-U.S. Government Securities) | ||||||||||
| Large Cap Value | $ | 1,235,765,286 | $ | 2,270,634,320 | ||||||||
A summary of the Fund’s transactions in the USG Select Fund for the year ended October 31, 2019 were as follows:
Fund | Type of | October 31, 2018 Shares/Fair Value | Purchases | Sales | October 31, 2019 Shares/Fair Value | Dividend Income | ||||||||||||||||||||||||||||||||||||
| Large Cap Value | Direct | $ | 266,324,811 | $ | 2,525,364,188 | $ | 2,624,409,044 | $ | 167,279,955 | $ | 3,661,511 | |||||||||||||||||||||||||||||||
| Large Cap Value | Securities Lending | 17,240,346 | 447,522,595 | 444,466,285 | 20,296,656 | N/A | ||||||||||||||||||||||||||||||||||||
35
American Beacon Large Cap Value FundSM
Notes to Financial Statements
October 31, 2019
9. Securities Lending
The Fund may lend its securities to qualified financial institutions, such as certain broker-dealers, to earn additional income. The borrowers are required to secure their loans continuously with collateral in an amount at least equal to the fair value of the securities loaned, initially in an amount at least equal to 102% of the fair value of domestic securities loaned and 105% of the fair value of international securities loaned. Collateral is monitored andmarked-to-market daily. Dailymark-to-market amounts are required to be paid to the borrower or received from the borrower by the end of the following business day. This one day settlement formark-to-market amounts may result in the collateral being temporarily less than the value of the securities on loan or temporarily more than the required minimum collateral.
To the extent that a loan is collateralized by cash, such cash collateral shall be invested by the securities lending agent (the “Agent”) in money market mutual funds and other short-term investments, provided the investments meet certain quality and diversification requirements. Securities purchased with cash collateral proceeds are listed in the Fund’s Schedule of Investments and the collateral is shown on the Statement of Assets and Liabilities as a payable.
Securities lending income is generated from the demand premium (if any) paid by the borrower to borrow a specific security and from the return on investment of cash collateral, reduced by negotiated rebate fees paid to the borrower and transaction costs. To the extent that a loan is secured bynon-cash collateral, securities lending income is generated as a demand premium reduced by transaction costs. The Fund, the Agent, and the Manager retained 80%, 10%, and 10%, respectively, of the income generated from securities lending.
While securities are on loan, the Fund continues to receive certain income associated with that security and any gain or loss in the market price that may occur during the term of the loan. In the case of domestic equities, the value of any dividend is received in the form of a substitute payment approximately equal to the dividend. In the case of foreign securities, a negotiated amount is received that is less than the actual dividend, but higher than the dividend amount minus the foreign tax that the Fund would be subject to on the dividend.
Securities lending transactions pose certain risks to the Fund, including that the borrower may not provide additional collateral when required or return the securities when due, that the value of the short-term investments will be less than the amount of cash collateral required to be returned to the borrower, thatnon-cash collateral may be subject to legal constraints in the event of a borrower bankruptcy, and that the cash collateral investments could become illiquid and unable to be used to return collateral to the borrower. The Fund could also experience delays and costs in gaining access to the collateral. The Fund bears the risk of any deficiency in the amount of the cash collateral available for return to the borrower and any action which impairs its ability to liquidatenon-cash collateral to satisfy a borrower default.
As of October 31, 2019, the value of outstanding securities on loan and the value of collateral were as follows:
Fund | Market Value of Securities on Loan | Cash Collateral Received | Non-Cash Collateral Received | Total Collateral Received | ||||||||||||||||||||||||
| Large Cap Value | $ | 48,563,589 | $ | 20,296,656 | $ | 29,714,969 | $ | 50,011,625 | ||||||||||||||||||||
Cash collateral is listed on the Fund’s Schedule of Investments and is shown on the Statement of Assets and Liabilities. Income earned on these investments is included in “Income derived from securities lending” on the Statement of Operations.
Non-cash collateral received by the Fund may not be sold orre-pledged except to satisfy a borrower default. Therefore,non-cash collateral is not included on the Fund’s Schedule of Investments or Statement of Assets and Liabilities.
36
American Beacon Large Cap Value FundSM
Notes to Financial Statements
October 31, 2019
10. Borrowing Arrangements
Effective November 15, 2018 (the “Effective Date”), the Fund, along with certain other funds managed by the Manager (“Participating Funds”), entered into a committed revolving line of credit (the “Committed Line”) agreement with State Street Bank and Trust Company (the “Bank”) to be used to facilitate portfolio liquidity. The maximum borrowing amount under the Committed Line is $250 million with interest at a rate equal to the higher of(a) one-month London Inter-Bank Offered Rate (“LIBOR”) plus 1.25% per annum or (b) the Federal Funds rate plus 1.25% per annum on amounts borrowed. Each of the Participating Funds paid a closing fee of $100,000 on the Effective Date and a quarterly commitment fee at a rate of 0.25% per annum on the unused portion of the Committed Line amount. The Committed Line expires November 14, 2019, unless extended by the Bank or terminated by the Participating Funds in accordance with the agreement.
On the Effective Date, the Fund, along with certain other Participating Funds managed by the Manager, also entered into an uncommitted discretionary demand revolving line of credit (the “Uncommitted Line”) agreement with the Bank to be used to facilitate portfolio liquidity. The maximum borrowing amount under the Uncommitted Line is $50 million with interest at a rate equal to the higher of(a) one-month LIBOR plus 1.25% per annum or (b) the Federal Funds rate plus 1.25% per annum on each outstanding loan. Each of the Participating Funds paid a closing fee of $35,000 on the Effective Date. The Uncommitted Line expires November 14, 2019 unless extended by the Bank or terminated by the Participating Funds in accordance with the agreement.
The Participating Funds paid administration, legal and arrangement fees, which are recognized as a component of “Other expenses” on the Statement of Operations, along with commitment fees, that have been allocated among the Participating Funds based on average daily net assets.
During the year ended October 31, 2019, the Fund did not utilize this facility.
11. Capital Share Transactions
The tables below summarize the activity in capital shares for each Class of the Fund:
| Institutional Class | ||||||||||||||||||||||||||||
| Year Ended October 31, | ||||||||||||||||||||||||||||
| 2019 | 2018 | |||||||||||||||||||||||||||
Large Cap Value Fund | Shares | Amount | Shares | Amount | ||||||||||||||||||||||||
| Shares sold | 12,472,307 | $ | 327,028,863 | 15,590,380 | $ | 461,010,040 | ||||||||||||||||||||||
| Reinvestment of dividends | 12,176,926 | 280,069,287 | 14,507,737 | 424,641,445 | ||||||||||||||||||||||||
| Shares redeemed | (44,099,255 | ) | (1,164,568,728 | ) | (53,655,757 | ) | (1,600,135,398 | ) | ||||||||||||||||||||
|
|
|
|
|
|
|
| |||||||||||||||||||||
| Net (decrease) in shares outstanding | (19,450,022 | ) | $ | (557,470,578 | ) | (23,557,640 | ) | $ | (714,483,913 | ) | ||||||||||||||||||
|
|
|
|
|
|
|
| |||||||||||||||||||||
| Y Class | ||||||||||||||||||||||||||||
| Year Ended October 31, | ||||||||||||||||||||||||||||
| 2019 | 2018 | |||||||||||||||||||||||||||
Large Cap Value Fund | Shares | Amount | Shares | Amount | ||||||||||||||||||||||||
| Shares sold | 2,802,221 | $ | 72,004,319 | 3,099,705 | $ | 91,175,749 | ||||||||||||||||||||||
| Reinvestment of dividends | 1,034,674 | 23,631,954 | 1,294,567 | 37,646,020 | ||||||||||||||||||||||||
| Shares redeemed | (3,676,176 | ) | (96,626,161 | ) | (6,308,043 | ) | (182,284,089 | ) | ||||||||||||||||||||
|
|
|
|
|
|
|
| |||||||||||||||||||||
| Net increase (decrease) in shares outstanding | 160,719 | $ | (989,888 | ) | (1,913,771 | ) | $ | (53,462,320 | ) | |||||||||||||||||||
|
|
|
|
|
|
|
| |||||||||||||||||||||
| Investor Class | ||||||||||||||||||||||||||||
| Year Ended October 31, | ||||||||||||||||||||||||||||
| 2019 | 2018 | |||||||||||||||||||||||||||
Large Cap Value Fund | Shares | Amount | Shares | Amount | ||||||||||||||||||||||||
| Shares sold | 4,427,172 | $ | 107,951,684 | 6,511,604 | $ | 180,144,427 | ||||||||||||||||||||||
| Reinvestment of dividends | 5,946,641 | 126,187,719 | 7,135,711 | 194,091,350 | ||||||||||||||||||||||||
| Shares redeemed | (24,387,033 | ) | (587,725,924 | ) | (25,281,746 | ) | (699,918,301 | ) | ||||||||||||||||||||
|
|
|
|
|
|
|
| |||||||||||||||||||||
| Net (decrease) in shares outstanding | (14,013,220 | ) | $ | (353,586,521 | ) | (11,634,431 | ) | $ | (325,682,524 | ) | ||||||||||||||||||
|
|
|
|
|
|
|
| |||||||||||||||||||||
37
American Beacon Large Cap Value FundSM
Notes to Financial Statements
October 31, 2019
| Advisor Class | ||||||||||||||||||||||||||||
| Year Ended October 31, | ||||||||||||||||||||||||||||
| 2019 | 2018 | |||||||||||||||||||||||||||
Large Cap Value Fund | Shares | Amount | Shares | Amount | ||||||||||||||||||||||||
| Shares sold | 607,878 | $ | 13,597,178 | 327,661 | $ | 8,945,251 | ||||||||||||||||||||||
| Reinvestment of dividends | 232,028 | 4,858,669 | 297,468 | 7,987,006 | ||||||||||||||||||||||||
| Shares redeemed | (686,434 | ) | (16,861,299 | ) | (1,295,285 | ) | (35,519,351 | ) | ||||||||||||||||||||
|
|
|
|
|
|
|
| |||||||||||||||||||||
| Net increase (decrease) in shares outstanding | 153,472 | $ | 1,594,548 | (670,156 | ) | $ | (18,587,094 | ) | ||||||||||||||||||||
|
|
|
|
|
|
|
| |||||||||||||||||||||
| A Class | ||||||||||||||||||||||||||||
| Year Ended October 31, | ||||||||||||||||||||||||||||
| 2019 | 2018 | |||||||||||||||||||||||||||
Large Cap Value Fund | Shares | Amount | Shares | Amount | ||||||||||||||||||||||||
| Shares sold | 993,379 | $ | 22,618,536 | 652,905 | $ | 17,333,416 | ||||||||||||||||||||||
| Reinvestment of dividends | 206,632 | 4,320,676 | 156,140 | 4,195,476 | ||||||||||||||||||||||||
| Shares redeemed | (1,316,813 | ) | (31,831,074 | ) | (567,054 | ) | (15,500,596 | ) | ||||||||||||||||||||
|
|
|
|
|
|
|
| |||||||||||||||||||||
| Net increase (decrease) in shares outstanding | (116,802 | ) | $ | (4,891,862 | ) | 241,991 | $ | 6,028,296 | ||||||||||||||||||||
|
|
|
|
|
|
|
| |||||||||||||||||||||
| C Class | ||||||||||||||||||||||||||||
| Year Ended October 31, | ||||||||||||||||||||||||||||
| 2019 | 2018 | |||||||||||||||||||||||||||
Large Cap Value Fund | Shares | Amount | Shares | Amount | ||||||||||||||||||||||||
| Shares sold | 63,051 | $ | 1,486,421 | 28,678 | $ | 766,750 | ||||||||||||||||||||||
| Reinvestment of dividends | 24,012 | 500,403 | 27,603 | 737,547 | ||||||||||||||||||||||||
| Shares redeemed | (85,733 | ) | (2,081,682 | ) | (85,211 | ) | (2,307,165 | ) | ||||||||||||||||||||
|
|
|
|
|
|
|
| |||||||||||||||||||||
| Net increase (decrease) in shares outstanding | 1,330 | $ | (94,858 | ) | (28,930 | ) | $ | (802,868 | ) | |||||||||||||||||||
|
|
|
|
|
|
|
| |||||||||||||||||||||
| R6 Class | ||||||||||||||||||||||||||||
| Year Ended October 31, | ||||||||||||||||||||||||||||
| 2019 | 2018 | |||||||||||||||||||||||||||
Large Cap Value Fund | Shares | Amount | Shares | Amount | ||||||||||||||||||||||||
| Shares sold | 8,939,449 | $ | 233,097,226 | 19,947,926 | $ | 601,141,716 | ||||||||||||||||||||||
| Reinvestment of dividends | 2,031,139 | 46,695,895 | 602,696 | 17,634,896 | ||||||||||||||||||||||||
| Shares redeemed | (4,956,502 | ) | (133,375,843 | ) | (1,767,061 | ) | (52,393,324 | ) | ||||||||||||||||||||
|
|
|
|
|
|
|
| |||||||||||||||||||||
| Net increase in shares outstanding | 6,014,086 | $ | 146,417,278 | 18,783,561 | $ | 566,383,288 | ||||||||||||||||||||||
|
|
|
|
|
|
|
| |||||||||||||||||||||
12. Subsequent Events
At meetings held on November 11-12, 2019, the Board of the Trust approved the termination of Brandywine Global Investment Management, LLC on behalf of the Fund, effective on or about January 15, 2020.
Management has evaluated subsequent events for possible recognition or disclosure in the financial statements through the date the financial statements are issued. Management has determined that there are no additional material events that would require disclosure in the Fund’s financial statements through this date.
38
American Beacon Large Cap Value FundSM
Financial Highlights
(For a share outstanding throughout the period)
| Institutional ClassA | ||||||||||||||||||||||||||||||||||||
| Year Ended October 31, | ||||||||||||||||||||||||||||||||||||
| 2019 | 2018 | 2017 | 2016 | 2015 | ||||||||||||||||||||||||||||||||
|
| |||||||||||||||||||||||||||||||||||
Net asset value, beginning of period | $ | 28.41 | $ | 30.98 | $ | 25.80 | $ | 28.38 | $ | 31.21 | ||||||||||||||||||||||||||
|
|
|
|
|
|
|
|
|
| |||||||||||||||||||||||||||
Income (loss) from investment operations: | ||||||||||||||||||||||||||||||||||||
Net investment income | 0.63 | 0.63 | 0.59 | 0.61 | 0.55 | |||||||||||||||||||||||||||||||
Net gains (losses) on investments (both realized and unrealized) | 1.69 | (0.07 | ) | 5.41 | (0.29 | ) | (0.70 | ) | ||||||||||||||||||||||||||||
|
|
|
|
|
|
|
|
|
| |||||||||||||||||||||||||||
Total income (loss) from investment operations | 2.32 | 0.56 | 6.00 | 0.32 | (0.15 | ) | ||||||||||||||||||||||||||||||
|
|
|
|
|
|
|
|
|
| |||||||||||||||||||||||||||
Less distributions: | ||||||||||||||||||||||||||||||||||||
Dividends from net investment income | (0.55 | ) | (0.55 | ) | (0.60 | ) | (0.52 | ) | (0.67 | ) | ||||||||||||||||||||||||||
Distributions from net realized gains | (1.86 | ) | (2.58 | ) | (0.22 | ) | (2.38 | ) | (2.01 | ) | ||||||||||||||||||||||||||
|
|
|
|
|
|
|
|
|
| |||||||||||||||||||||||||||
Total distributions | (2.41 | ) | (3.13 | ) | (0.82 | ) | (2.90 | ) | (2.68 | ) | ||||||||||||||||||||||||||
|
|
|
|
|
|
|
|
|
| |||||||||||||||||||||||||||
Net asset value, end of period | $ | 28.32 | $ | 28.41 | $ | 30.98 | $ | 25.80 | $ | 28.38 | ||||||||||||||||||||||||||
|
|
|
|
|
|
|
|
|
| |||||||||||||||||||||||||||
Total returnB | 10.14 | % | 1.51 | % | 23.60 | % | 1.69 | % | (0.76 | )% | ||||||||||||||||||||||||||
|
|
|
|
|
|
|
|
|
| |||||||||||||||||||||||||||
Ratios and supplemental data: | ||||||||||||||||||||||||||||||||||||
Net assets, end of period | $ | 3,137,789,485 | $ | 3,700,700,522 | $ | 4,765,771,483 | $ | 5,137,688,375 | $ | 6,198,883,300 | ||||||||||||||||||||||||||
Ratios to average net assets: | ||||||||||||||||||||||||||||||||||||
Expenses, before reimbursements | 0.63 | % | 0.62 | % | 0.60 | % | 0.60 | % | 0.58 | % | ||||||||||||||||||||||||||
Expenses, net of reimbursements | 0.63 | % | 0.62 | % | 0.60 | % | 0.60 | % | 0.58 | % | ||||||||||||||||||||||||||
Net investment income, before expense reimbursements | 2.07 | % | 1.83 | % | 1.78 | % | 2.16 | % | 1.88 | % | ||||||||||||||||||||||||||
Net investment income, net of reimbursements | 2.07 | % | 1.83 | % | 1.78 | % | 2.16 | % | 1.88 | % | ||||||||||||||||||||||||||
Portfolio turnover rate | 23 | % | 23 | % | 25 | % | 25 | % | 32 | % | ||||||||||||||||||||||||||
| A | On May 31, 2016, the AMR Class closed and the assets were merged into the Institutional Class. |
| B | Based on net asset value, which does not reflect the sales charge, redemption fee, or contingent deferred sales charge, if applicable. May include adjustments in accordance with U.S. GAAP and as such, the net asset value for reporting purposes and the returns based upon those net asset values may differ from the net asset value and returns for shareholder transactions. |
See accompanying notes
39
American Beacon Large Cap Value FundSM
Financial Highlights
(For a share outstanding throughout the period)
| Y Class | ||||||||||||||||||||||||||||||||||||
| Year Ended October 31, | ||||||||||||||||||||||||||||||||||||
| 2019 | 2018 | 2017 | 2016 | 2015 | ||||||||||||||||||||||||||||||||
|
| |||||||||||||||||||||||||||||||||||
Net asset value, beginning of period | $ | 28.20 | $ | 30.78 | $ | 25.64 | $ | 28.21 | $ | 31.04 | ||||||||||||||||||||||||||
|
|
|
|
|
|
|
|
|
| |||||||||||||||||||||||||||
Income (loss) from investment operations: | ||||||||||||||||||||||||||||||||||||
Net investment income | 0.56 | 0.57 | 0.48 | 0.59 | 0.56 | |||||||||||||||||||||||||||||||
Net gains (losses) on investments (both realized and unrealized) | 1.72 | (0.04 | ) | 5.46 | (0.29 | ) | (0.72 | ) | ||||||||||||||||||||||||||||
|
|
|
|
|
|
|
|
|
| |||||||||||||||||||||||||||
Total income (loss) from investment operations | 2.28 | 0.53 | 5.94 | 0.30 | (0.16 | ) | ||||||||||||||||||||||||||||||
|
|
|
|
|
|
|
|
|
| |||||||||||||||||||||||||||
Less distributions: | ||||||||||||||||||||||||||||||||||||
Dividends from net investment income | (0.52 | ) | (0.53 | ) | (0.58 | ) | (0.49 | ) | (0.66 | ) | ||||||||||||||||||||||||||
Distributions from net realized gains | (1.86 | ) | (2.58 | ) | (0.22 | ) | (2.38 | ) | (2.01 | ) | ||||||||||||||||||||||||||
|
|
|
|
|
|
|
|
|
| |||||||||||||||||||||||||||
Total distributions | (2.38 | ) | (3.11 | ) | (0.80 | ) | (2.87 | ) | (2.67 | ) | ||||||||||||||||||||||||||
|
|
|
|
|
|
|
|
|
| |||||||||||||||||||||||||||
Net asset value, end of period | $ | 28.10 | $ | 28.20 | $ | 30.78 | $ | 25.64 | $ | 28.21 | ||||||||||||||||||||||||||
|
|
|
|
|
|
|
|
|
| |||||||||||||||||||||||||||
Total returnA | 10.05 | % | 1.42 | % | 23.51 | % | 1.61 | % | (0.80 | )% | ||||||||||||||||||||||||||
|
|
|
|
|
|
|
|
|
| |||||||||||||||||||||||||||
Ratios and supplemental data: |
| |||||||||||||||||||||||||||||||||||
Net assets, end of period | $ | 301,457,382 | $ | 298,017,629 | $ | 384,155,569 | $ | 349,542,346 | $ | 419,096,844 | ||||||||||||||||||||||||||
Ratios to average net assets: | ||||||||||||||||||||||||||||||||||||
Expenses, before reimbursements | 0.70 | % | 0.68 | % | 0.67 | % | 0.67 | % | 0.67 | % | ||||||||||||||||||||||||||
Expenses, net of reimbursements | 0.70 | % | 0.68 | % | 0.67 | % | 0.67 | % | 0.67 | % | ||||||||||||||||||||||||||
Net investment income, before expense reimbursements | 1.98 | % | 1.77 | % | 1.69 | % | 2.08 | % | 1.80 | % | ||||||||||||||||||||||||||
Net investment income, net of reimbursements | 1.98 | % | 1.77 | % | 1.69 | % | 2.08 | % | 1.80 | % | ||||||||||||||||||||||||||
Portfolio turnover rate | 23 | % | 23 | % | 25 | % | 25 | % | 32 | % | ||||||||||||||||||||||||||
| A | Based on net asset value, which does not reflect the sales charge, redemption fee, or contingent deferred sales charge, if applicable. May include adjustments in accordance with U.S. GAAP and as such, the net asset value for reporting purposes and the returns based upon those net asset values may differ from the net asset value and returns for shareholder transactions. |
See accompanying notes
40
American Beacon Large Cap Value FundSM
Financial Highlights
(For a share outstanding throughout the period)
| Investor Class | ||||||||||||||||||||||||||||||||||||
| Year Ended October 31, | ||||||||||||||||||||||||||||||||||||
| 2019 | 2018 | 2017 | 2016 | 2015 | ||||||||||||||||||||||||||||||||
|
| |||||||||||||||||||||||||||||||||||
Net asset value, beginning of period | $ | 26.33 | $ | 28.92 | $ | 24.13 | $ | 26.70 | $ | 29.51 | ||||||||||||||||||||||||||
|
|
|
|
|
|
|
|
|
| |||||||||||||||||||||||||||
Income (loss) from investment operations: | ||||||||||||||||||||||||||||||||||||
Net investment income | 0.41 | 0.41 | 0.40 | 0.46 | 0.45 | |||||||||||||||||||||||||||||||
Net gains (losses) on investments (both realized and unrealized) | 1.63 | 0.02 | 5.12 | (0.25 | ) | (0.68 | ) | |||||||||||||||||||||||||||||
|
|
|
|
|
|
|
|
|
| |||||||||||||||||||||||||||
Total income (loss) from investment operations | 2.04 | 0.43 | 5.52 | 0.21 | (0.23 | ) | ||||||||||||||||||||||||||||||
|
|
|
|
|
|
|
|
|
| |||||||||||||||||||||||||||
Less distributions: | ||||||||||||||||||||||||||||||||||||
Dividends from net investment income | (0.45 | ) | (0.44 | ) | (0.51 | ) | (0.40 | ) | (0.57 | ) | ||||||||||||||||||||||||||
Distributions from net realized gains | (1.86 | ) | (2.58 | ) | (0.22 | ) | (2.38 | ) | (2.01 | ) | ||||||||||||||||||||||||||
|
|
|
|
|
|
|
|
|
| |||||||||||||||||||||||||||
Total distributions | (2.31 | ) | (3.02 | ) | (0.73 | ) | (2.78 | ) | (2.58 | ) | ||||||||||||||||||||||||||
|
|
|
|
|
|
|
|
|
| |||||||||||||||||||||||||||
Net asset value, end of period | $ | 26.06 | $ | 26.33 | $ | 28.92 | $ | 24.13 | $ | 26.70 | ||||||||||||||||||||||||||
|
|
|
|
|
|
|
|
|
| |||||||||||||||||||||||||||
Total returnA | 9.77 | % | 1.18 | % | 23.20 | % | 1.33 | % | (1.07 | )% | ||||||||||||||||||||||||||
|
|
|
|
|
|
|
|
|
| |||||||||||||||||||||||||||
Ratios and supplemental data: | ||||||||||||||||||||||||||||||||||||
Net assets, end of period | $ | 1,124,625,846 | $ | 1,505,354,807 | $ | 1,990,199,621 | $ | 2,245,534,741 | $ | 3,167,585,961 | ||||||||||||||||||||||||||
Ratios to average net assets: | ||||||||||||||||||||||||||||||||||||
Expenses, before reimbursements | 0.96 | % | 0.95 | % | 0.92 | % | 0.93 | % | 0.93 | % | ||||||||||||||||||||||||||
Expenses, net of reimbursements | 0.96 | % | 0.95 | % | 0.92 | % | 0.93 | % | 0.93 | % | ||||||||||||||||||||||||||
Net investment income, before expense reimbursements | 1.74 | % | 1.50 | % | 1.46 | % | 1.84 | % | 1.54 | % | ||||||||||||||||||||||||||
Net investment income, net of reimbursements | 1.74 | % | 1.50 | % | 1.46 | % | 1.84 | % | 1.54 | % | ||||||||||||||||||||||||||
Portfolio turnover rate | 23 | % | 23 | % | 25 | % | 25 | % | 32 | % | ||||||||||||||||||||||||||
| A | Based on net asset value, which does not reflect the sales charge, redemption fee, or contingent deferred sales charge, if applicable. May include adjustments in accordance with U.S. GAAP and as such, the net asset value for reporting purposes and the returns based upon those net asset values may differ from the net asset value and returns for shareholder transactions. |
See accompanying notes
41
American Beacon Large Cap Value FundSM
Financial Highlights
(For a share outstanding throughout the period)
| Advisor ClassA | ||||||||||||||||||||||||||||||||||||
| Year Ended October 31, | ||||||||||||||||||||||||||||||||||||
| 2019 | 2018 | 2017 | 2016 | 2015 | ||||||||||||||||||||||||||||||||
|
| |||||||||||||||||||||||||||||||||||
Net asset value, beginning of period | $ | 25.95 | $ | 28.54 | $ | 23.82 | $ | 26.40 | $ | 29.24 | ||||||||||||||||||||||||||
|
|
|
|
|
|
|
|
|
| |||||||||||||||||||||||||||
Income (loss) from investment operations: | ||||||||||||||||||||||||||||||||||||
Net investment income | 0.47 | 0.28 | 0.21 | 0.40 | 0.40 | |||||||||||||||||||||||||||||||
Net gains (losses) on investments (both realized and unrealized) | 1.52 | 0.10 | 5.20 | (0.22 | ) | (0.66 | ) | |||||||||||||||||||||||||||||
|
|
|
|
|
|
|
|
|
| |||||||||||||||||||||||||||
Total income (loss) from investment operations | 1.99 | 0.38 | 5.41 | 0.18 | (0.26 | ) | ||||||||||||||||||||||||||||||
|
|
|
|
|
|
|
|
|
| |||||||||||||||||||||||||||
Less distributions: | ||||||||||||||||||||||||||||||||||||
Dividends from net investment income | (0.40 | ) | (0.39 | ) | (0.47 | ) | (0.38 | ) | (0.57 | ) | ||||||||||||||||||||||||||
Distributions from net realized gains | (1.86 | ) | (2.58 | ) | (0.22 | ) | (2.38 | ) | (2.01 | ) | ||||||||||||||||||||||||||
|
|
|
|
|
|
|
|
|
| |||||||||||||||||||||||||||
Total distributions | (2.26 | ) | (2.97 | ) | (0.69 | ) | (2.76 | ) | (2.58 | ) | ||||||||||||||||||||||||||
|
|
|
|
|
|
|
|
|
| |||||||||||||||||||||||||||
Net asset value, end of period | $ | 25.68 | $ | 25.95 | $ | 28.54 | $ | 23.82 | $ | 26.40 | ||||||||||||||||||||||||||
|
|
|
|
|
|
|
|
|
| |||||||||||||||||||||||||||
Total returnB | 9.64 | % | 1.00 | % | 23.00 | % | 1.21 | % | (1.19 | )% | ||||||||||||||||||||||||||
|
|
|
|
|
|
|
|
|
| |||||||||||||||||||||||||||
Ratios and supplemental data: | ||||||||||||||||||||||||||||||||||||
Net assets, end of period | $ | 66,077,449 | $ | 62,811,940 | $ | 88,196,090 | $ | 113,168,437 | $ | 140,975,319 | ||||||||||||||||||||||||||
Ratios to average net assets: | ||||||||||||||||||||||||||||||||||||
Expenses, before reimbursements | 1.10 | % | 1.09 | % | 1.07 | % | 1.08 | % | 1.07 | % | ||||||||||||||||||||||||||
Expenses, net of reimbursements | 1.10 | % | 1.09 | % | 1.07 | % | 1.08 | % | 1.07 | % | ||||||||||||||||||||||||||
Net investment income, before expense reimbursements | 1.58 | % | 1.36 | % | 1.31 | % | 1.69 | % | 1.40 | % | ||||||||||||||||||||||||||
Net investment income, net of reimbursements | 1.58 | % | 1.36 | % | 1.31 | % | 1.69 | % | 1.40 | % | ||||||||||||||||||||||||||
Portfolio turnover rate | 23 | % | 23 | % | 25 | % | 25 | % | 32 | % | ||||||||||||||||||||||||||
| A | On January 15, 2016, the Retirement Class closed and the assets were merged into the Advisor Class. |
| B | Based on net asset value, which does not reflect the sales charge, redemption fee, or contingent deferred sales charge, if applicable. May include adjustments in accordance with U.S. GAAP and as such, the net asset value for reporting purposes and the returns based upon those net asset values may differ from the net asset value and returns for shareholder transactions. |
See accompanying notes
42
American Beacon Large Cap Value FundSM
Financial Highlights
(For a share outstanding throughout the period)
| A Class | ||||||||||||||||||||||||||||||||||||
| Year Ended October 31, | ||||||||||||||||||||||||||||||||||||
| 2019 | 2018 | 2017 | 2016 | 2015 | ||||||||||||||||||||||||||||||||
|
| |||||||||||||||||||||||||||||||||||
Net asset value, beginning of period | $ | 26.00 | $ | 28.61 | $ | 23.90 | $ | 26.51 | $ | 29.38 | ||||||||||||||||||||||||||
|
|
|
|
|
|
|
|
|
| |||||||||||||||||||||||||||
Income (loss) from investment operations: | ||||||||||||||||||||||||||||||||||||
Net investment income | 0.40 | 0.48 | 0.28 | 0.42 | 0.47 | |||||||||||||||||||||||||||||||
Net gains (losses) on investments (both realized and unrealized) | 1.59 | (0.06 | ) | 5.17 | (0.21 | ) | (0.71 | ) | ||||||||||||||||||||||||||||
|
|
|
|
|
|
|
|
|
| |||||||||||||||||||||||||||
Total income (loss) from investment operations | 1.99 | 0.42 | 5.45 | 0.21 | (0.24 | ) | ||||||||||||||||||||||||||||||
|
|
|
|
|
|
|
|
|
| |||||||||||||||||||||||||||
Less distributions: | ||||||||||||||||||||||||||||||||||||
Dividends from net investment income | (0.47 | ) | (0.45 | ) | (0.52 | ) | (0.44 | ) | (0.62 | ) | ||||||||||||||||||||||||||
Distributions from net realized gains | (1.86 | ) | (2.58 | ) | (0.22 | ) | (2.38 | ) | (2.01 | ) | ||||||||||||||||||||||||||
|
|
|
|
|
|
|
|
|
| |||||||||||||||||||||||||||
Total distributions | (2.33 | ) | (3.03 | ) | (0.74 | ) | (2.82 | ) | (2.63 | ) | ||||||||||||||||||||||||||
|
|
|
|
|
|
|
|
|
| |||||||||||||||||||||||||||
Net asset value, end of period | $ | 25.66 | $ | 26.00 | $ | 28.61 | $ | 23.90 | $ | 26.51 | ||||||||||||||||||||||||||
|
|
|
|
|
|
|
|
|
| |||||||||||||||||||||||||||
Total returnA | 9.72 | % | 1.15 | % | 23.13 | % | 1.33 | % | (1.14 | )% | ||||||||||||||||||||||||||
|
|
|
|
|
|
|
|
|
| |||||||||||||||||||||||||||
Ratios and supplemental data: |
| |||||||||||||||||||||||||||||||||||
Net assets, end of period | $ | 39,157,098 | $ | 42,722,617 | $ | 40,073,435 | $ | 35,071,001 | $ | 39,401,153 | ||||||||||||||||||||||||||
Ratios to average net assets: | ||||||||||||||||||||||||||||||||||||
Expenses, before reimbursements | 1.01 | % | 0.93 | % | 0.98 | % | 0.98 | % | 0.97 | % | ||||||||||||||||||||||||||
Expenses, net of reimbursements | 1.01 | % | 0.93 | % | 0.98 | % | 0.98 | % | 0.97 | % | ||||||||||||||||||||||||||
Net investment income, before expense reimbursements | 1.68 | % | 1.49 | % | 1.38 | % | 1.78 | % | 1.48 | % | ||||||||||||||||||||||||||
Net investment income, net of reimbursements | 1.68 | % | 1.49 | % | 1.38 | % | 1.78 | % | 1.48 | % | ||||||||||||||||||||||||||
Portfolio turnover rate | 23 | % | 23 | % | 25 | % | 25 | % | 32 | % | ||||||||||||||||||||||||||
| A | Based on net asset value, which does not reflect the sales charge, redemption fee, or contingent deferred sales charge, if applicable. May include adjustments in accordance with U.S. GAAP and as such, the net asset value for reporting purposes and the returns based upon those net asset values may differ from the net asset value and returns for shareholder transactions. |
See accompanying notes
43
American Beacon Large Cap Value FundSM
Financial Highlights
(For a share outstanding throughout the period)
| C Class | ||||||||||||||||||||||||||||||||||||
| Year Ended October 31, | ||||||||||||||||||||||||||||||||||||
| 2019 | 2018 | 2017 | 2016 | 2015 | ||||||||||||||||||||||||||||||||
|
| |||||||||||||||||||||||||||||||||||
Net asset value, beginning of period | $ | 25.71 | $ | 28.27 | $ | 23.57 | $ | 26.17 | $ | 29.03 | ||||||||||||||||||||||||||
|
|
|
|
|
|
|
|
|
| |||||||||||||||||||||||||||
Income (loss) from investment operations: | ||||||||||||||||||||||||||||||||||||
Net investment income | 0.26 | 0.21 | 0.09 | 0.20 | 0.27 | |||||||||||||||||||||||||||||||
Net gains (losses) on investments (both realized and unrealized) | 1.57 | 0.05 | 5.11 | (0.19 | ) | (0.70 | ) | |||||||||||||||||||||||||||||
|
|
|
|
|
|
|
|
|
| |||||||||||||||||||||||||||
Total income (loss) from investment operations | 1.83 | 0.26 | 5.20 | 0.01 | (0.43 | ) | ||||||||||||||||||||||||||||||
|
|
|
|
|
|
|
|
|
| |||||||||||||||||||||||||||
Less distributions: | ||||||||||||||||||||||||||||||||||||
Dividends from net investment income | (0.25 | ) | (0.24 | ) | (0.28 | ) | (0.23 | ) | (0.42 | ) | ||||||||||||||||||||||||||
Distributions from net realized gains | (1.86 | ) | (2.58 | ) | (0.22 | ) | (2.38 | ) | (2.01 | ) | ||||||||||||||||||||||||||
|
|
|
|
|
|
|
|
|
| |||||||||||||||||||||||||||
Total distributions | (2.11 | ) | (2.82 | ) | (0.50 | ) | (2.61 | ) | (2.43 | ) | ||||||||||||||||||||||||||
|
|
|
|
|
|
|
|
|
| |||||||||||||||||||||||||||
Net asset value, end of period | $ | 25.43 | $ | 25.71 | $ | 28.27 | $ | 23.57 | $ | 26.17 | ||||||||||||||||||||||||||
|
|
|
|
|
|
|
|
|
| |||||||||||||||||||||||||||
Total returnA | 8.94 | % | 0.57 | % | 22.27 | % | 0.51 | % | (1.83 | )% | ||||||||||||||||||||||||||
|
|
|
|
|
|
|
|
|
| |||||||||||||||||||||||||||
Ratios and supplemental data: |
| |||||||||||||||||||||||||||||||||||
Net assets, end of period | $6,811,169 | $ | 6,851,003 | $ | 8,351,349 | $ | 8,950,263 | $ | 12,389,141 | |||||||||||||||||||||||||||
Ratios to average net assets: | ||||||||||||||||||||||||||||||||||||
Expenses, before reimbursements | 1.70 | % | 1.64 | % | 1.72 | % | 1.74 | % | 1.73 | % | ||||||||||||||||||||||||||
Expenses, net of reimbursements | 1.70 | %B | 1.54 | % | 1.72 | % | 1.74 | % | 1.73 | % | ||||||||||||||||||||||||||
Net investment income, before expense reimbursements | 0.99 | % | 0.79 | % | 0.66 | % | 1.02 | % | 0.73 | % | ||||||||||||||||||||||||||
Net investment income, net of reimbursements | 0.99 | % | 0.90 | % | 0.66 | % | 1.02 | % | 0.73 | % | ||||||||||||||||||||||||||
Portfolio turnover rate | 23 | % | 23 | % | 25 | % | 25 | % | 32 | % | ||||||||||||||||||||||||||
| A | Based on net asset value, which does not reflect the sales charge, redemption fee, or contingent deferred sales charge, if applicable. May include adjustments in accordance with U.S. GAAP and as such, the net asset value for reporting purposes and the returns based upon those net asset values may differ from the net asset value and returns for shareholder transactions. |
| B | This ratio does not include a voluntary reimbursement of service fees as included in the prior year. |
See accompanying notes
44
American Beacon Large Cap Value FundSM
Financial Highlights
(For a share outstanding throughout the period)
| R6 Class | ||||||||||||||||||||
| Year Ended October 31, | February 28, 2017A to October 31, | |||||||||||||||||||
| 2019 | 2018 | 2017 | ||||||||||||||||||
|
| |||||||||||||||||||
Net asset value, beginning of period | $ | 28.41 | $ | 30.98 | $ | 28.64 | ||||||||||||||
|
|
|
|
|
| |||||||||||||||
Income from investment operations: | ||||||||||||||||||||
Net investment income | 0.61 | 0.59 | 0.12 | |||||||||||||||||
Net gains (losses) on investments (both realized and unrealized) | 1.71 | (0.02 | ) | 2.22 | ||||||||||||||||
|
|
|
|
|
| |||||||||||||||
Total income from investment operations | 2.32 | 0.57 | 2.34 | |||||||||||||||||
|
|
|
|
|
| |||||||||||||||
Less distributions: | ||||||||||||||||||||
Dividends from net investment income | (0.56 | ) | (0.56 | ) | - | |||||||||||||||
Distributions from net realized gains | (1.86 | ) | (2.58 | ) | - | |||||||||||||||
|
|
|
|
|
| |||||||||||||||
Total distributions | (2.42 | ) | (3.14 | ) | - | |||||||||||||||
|
|
|
|
|
| |||||||||||||||
Net asset value, end of period | $ | 28.31 | $ | 28.41 | $ | 30.98 | ||||||||||||||
|
|
|
|
|
| |||||||||||||||
Total returnB | 10.15 | % | 1.54 | % | 8.17 | %C | ||||||||||||||
|
|
|
|
|
| |||||||||||||||
Ratios and supplemental data: |
| |||||||||||||||||||
Net assets, end of period | $ | 739,517,062 | $ | 571,236,567 | $ | 40,982,401 | ||||||||||||||
Ratios to average net assets: | ||||||||||||||||||||
Expenses, before reimbursements | 0.60 | % | 0.59 | % | 0.60 | %D | ||||||||||||||
Expenses, net of reimbursements | 0.58 | % | 0.58 | % | 0.58 | %D | ||||||||||||||
Net investment income, before expense reimbursements | 2.07 | % | 1.75 | % | 1.38 | %D | ||||||||||||||
Net investment income, net of reimbursements | 2.09 | % | 1.76 | % | 1.40 | %D | ||||||||||||||
Portfolio turnover rate | 23 | % | 23 | % | 25 | %E | ||||||||||||||
| A | Commencement of operations. |
| B | Based on net asset value, which does not reflect the sales charge, redemption fee, or contingent deferred sales charge, if applicable. May include adjustments in accordance with U.S. GAAP and as such, the net asset value for reporting purposes and the returns based upon those net asset values may differ from the net asset value and returns for shareholder transactions. |
| C | Not annualized. |
| D | Annualized. |
| E | Portfolio turnover rate is for the period from February 28, 2017 through October 31, 2017 and is not annualized. |
See accompanying notes
45
American Beacon FundsSM
October 31, 2019 (Unaudited)
Certain tax information regarding the Funds are required to be provided to shareholders based upon the Funds’ income and distributions for the taxable year ended October 31, 2019. The information and distributions reported herein may differ from information and distributions taxable to the shareholders for the calendar year ended December 31, 2019.
The Fund designated the following items with regard to distributions paid during the fiscal year ended October 31, 2019. All designations are based on financial information available as of this annual report and, accordingly, are subject to change. For each item, it is the intention of the Funds to designate the maximum amount permitted under the Internal Revenue Code of 1986, as amended, and the regulations there under.
Corporate Dividends-Received Deduction: | ||||
Large Cap Value | 87.40 | % | ||
Qualified Dividend Income: | ||||
Large Cap Value | 100.00 | % | ||
Long-Term Capital Gain Distributions: | ||||
Large Cap Value | $ | 385,006,068 | ||
Short-Term Capital Gain Distributions: | ||||
Large Cap Value | $ | 20,974,195 | ||
Shareholders will receive notification in January 2020 of the applicable tax information necessary to prepare their 2019 income tax returns.
46
Disclosure Regarding Approval of the Management and Investment Advisory Agreements(Unaudited)
Renewal and Approval of Management Agreement and Investment Advisory Agreements
Atin-person meetings held on May 9, 2019 and June4-5, 2019 (collectively, the “Meetings”), the Board of Trustees (“Board” or “Trustees”) considered and then, at its June 5, 2019 meeting, approved the renewal of:
(1) the Management Agreement between American Beacon Advisors, Inc. (“Manager”) and the American Beacon Funds (“Trust”), on behalf of the American Beacon Large Cap Value Fund (“Fund”); and
(2) the Investment Advisory Agreements among the Manager, the Trust, on behalf of the Fund, and each of Barrow, Hanley, Mewhinney & Strauss, LLC (“Barrow”), Brandywine Global Investment Management, LLC (“Brandywine”), Hotchkis and Wiley Capital Management, LLC (“Hotchkis”) and Massachusetts Financial Services Company (“MFS”) (each, a “subadvisor” and collectively, the “subadvisors”).
The Management Agreement and the Investment Advisory Agreements are referred to herein individually as an “Agreement” and collectively as the “Agreements.” In preparation for its consideration of the renewal of the Agreements, the Board undertook steps to gather and consider information furnished by the Manager, the subadvisors, Broadridge, Inc. (“Broadridge”) and Morningstar, Inc. (“Morningstar”).The Board, with the assistance of independent legal counsel, requested and received certain relevant information from the Manager and the subadvisors.
In advance of the Meetings, the Board’s Investment Committee and/or the Manager coordinated the production of information from Broadridge and Morningstar regarding the performance, fees and expenses of the Fund as well as information from the Manager and the subadvisors. At the Meetings, the Board considered the information provided in connection with the renewal process, as well as information furnished to the Board throughout the year at regular meetings of the Board and its committees. In connection with the Board’s consideration of the Agreements, the Board received and evaluated such information as they deemed necessary. This information is described below in the section summarizing the factors the Board considered in connection with its renewal and approval of the Agreements, as well as the section describing additional Board considerations with respect to the Fund.
The Board noted that the Manager provides management and administrative services to the Fund pursuant to the Management Agreement. The Board considered that many mutual funds have separate contracts governing each type of service and observed that, with respect to such mutual funds, the actual management fee rates provided by Broadridge for peer group funds reflect the combined advisory and administrative expenses, reduced by any fee waivers and/or reimbursements.
A firm may not have been able to, or opted not to, provide information in response to certain information requests, in which case the Board conducted its evaluation of the firm based on information that was provided. In such cases, the Board determined that the omission of any such information was not material to its considerations. The class of shares used for comparative performance purposes was the share class with the lowest expenses available for purchase by the general public, which was the Institutional Class. The Board also considered that the use of Institutional Class performance generally facilitates a meaningful comparison for expense and performance purposes.
Provided below is an overview of certain factors the Board considered in connection with its renewal and approval of the Agreements. The Board did not identify any particular information that was most relevant to its consideration to renew or approve each Agreement, and each Trustee may have afforded different weight to the various factors. Legal counsel to the independent Trustees provided the Board with a memorandum regarding its responsibilities pertaining to the renewal and approval of investment advisory contracts, such as the Agreements. The memorandum explained the regulatory requirements surrounding the Board’s process for evaluating investment advisors and the terms of investment advisory contracts. Based on its evaluation, the Board unanimously concluded that the terms of each Agreement were reasonable and fair and that the renewal and approval of each Agreement was in the best interests of the Fund and its shareholders.
47
Disclosure Regarding Approval of the Management and Investment Advisory Agreements(Unaudited)
Considerations With Respect to the Renewal of the Management Agreement and the Investment Advisory Agreements
In determining whether to renew the Agreements, the Board considered the Fund’s investment management and subadvisory relationships separately. In each instance, the Board considered, among other things, the following factors: (1) the nature, extent and quality of the services provided; (2) the investment performance of the Fund; (3) the costs incurred by the Manager in rendering services to the Fund and its resulting profits or losses; (4) comparisons of services and fee rates with contracts entered into by the Manager or the subadvisors or their affiliates with other clients (such as pension funds and other institutional clients); (5) the extent to which economies of scale, if any, have been taken into account in setting each fee rate schedule; (6) whether fee rate levels reflect economies of scale, if any, for the benefit of Fund investors; and (7) any other benefits derived or anticipated to be derived by the Manager or the subadvisors from their relationships with the Fund.
Nature, Extent and Quality of Services.With respect to the renewal of the Management Agreement, the Board considered, among other factors: the Fund’s long-term performance; the length of service of key investment personnel at the Manager; the cost structure of the Fund; the Manager’s culture of compliance and support that reduce risks to the Fund; the Manager’s quality of services; the Manager’s active role in monitoring and, as appropriate, recommending additional or replacement subadvisors; and the Manager’s efforts to retain key employees and maintain staffing levels.
With respect to the renewal of the Investment Advisory Agreements, the Board considered the level of staffing and the size of the subadvisors. The Board also considered the adequacy of the resources committed to the Fund by the subadvisors, and whether those resources were commensurate with the needs of the Fund and are sufficient to sustain appropriate levels of performance and compliance needs. In this regard, the Board considered the financial stability of the subadvisors. The Board also considered each subadvisor’s representations regarding its compliance program and code of ethics. Based on the foregoing information, the Board concluded that the nature, extent and quality of the management and advisory services provided by the Manager and the subadvisors were appropriate for the Fund.
Investment Performance.The Board evaluated the comparative information provided by Broadridge and the Manager regarding the performance of the Fund relative to its Broadridge performance universe, Morningstar Category, and benchmark index, as well as the Fund’s Morningstar rating. The Board considered the information provided by Broadridge regarding Broadridge’s independent methodology for selecting the Fund’s Broadridge performance universe. The Board also considered that the performance universes selected by Broadridge may not provide appropriate comparisons for the Fund. In addition, the Board considered the performance reports and discussions with management at Board and Committee meetings throughout the year. The Board also evaluated the comparative information provided by each subadvisor regarding the performance of its portion of the Fund relative to the performance of similar accounts or a composite of similar accounts managed by the subadvisor and the Fund’s benchmark index. In addition, the Board considered the Manager’s recommendation to continue to retain each subadvisor. A discussion regarding the Board’s considerations with respect to the Fund’s performance appears below under “Additional Considerations and Conclusions with Respect to the Fund.”
Costs of the Services Provided to the Fund and the Profits Realized by the Manager from its Relationship with the Fund.In analyzing the cost of services and profitability of the Manager, the Board considered the revenues earned and the expenses incurred by the Manager, before and after the payment of distribution-related expenses by the Manager. The profits or losses were noted at both an aggregate level for all funds within the group of mutual funds sponsored by the Manager (the “Fund Complex”) and at an individual Fund level, with the Manager earning a profit before and after the payment of distribution-related expenses by the Manager for the Fund. The Board also considered comparative information provided by the Manager regarding the Manager’s overall profitability with respect to the Fund Complex relative to the overall profitability of other firms in the mutual fund industry, as disclosed in publicly available sources. Although the Board noted that, in certain cases, the fee rates paid by other clients of the Manager are lower than the fee rates paid by the Fund, the Manager represented that,
48
Disclosure Regarding Approval of the Management and Investment Advisory Agreements(Unaudited)
among other matters, the difference is attributable to the fact that the Manager does not perform administrative services fornon-investment company clients and reflects the greater level of responsibility and regulatory requirements associated with managing the Fund.
The Board also noted that the Manager proposed to continue the expense waivers and reimbursements for the Fund’s R6 Class shares that were in place during the last fiscal year. The Board further considered that, with respect to the Fund, the Management Agreement provides for the Manager to receive a management fee comprised of an annualized fee that is retained by the Manager. In addition, the Board considered that the Manager receives fees for overseeing the securities lending program on behalf of the Fund. The Board also noted that certain share classes of the Fund maintain higher expense ratios in order to compensate third-party financial intermediaries.
In analyzing the fee rates charged by each subadvisor in connection with its investment advisory services to the Fund, the Board considered representations made by each subadvisor that the fee rate negotiated by the Manager is favorable relative to the fee rates that the subadvisor charges for any comparable client accounts. The Board did not request profitability data from the subadvisors because the Board did not view this data as imperative to its deliberations given thearm’s-length nature of the relationship between the Manager and the subadvisors with respect to the negotiation of subadvisory fee rates. In addition, the Board considered that it was advised that the subadvisors may not account for their profits on anaccount-by-account basis and that different firms likely employ different methodologies in connection with these calculations.
Based on the foregoing information, the Board concluded that the profitability levels of the Manager were reasonable in light of the services performed by the Manager. A discussion regarding the Board’s considerations with respect to the Fund’s fee rates is set forth below under “Additional Considerations and Conclusions with Respect to the Fund.”
Economies of Scale.In considering the reasonableness of the management and investment advisory fees rates, the Board considered whether economies of scale will be realized as the Fund grows and whether fee rate levels reflect these economies of scale for the benefit of Fund shareholders. In this regard, the Board considered that, with respect to each subadvisor, the Manager has negotiated breakpoints in the subadvisory fee rate for the Fund. In addition, the Board noted the Manager’s representation that the Management Agreement contains fee schedule breakpoints at higher asset levels with respect to the Fund. Based on the foregoing information, the Board concluded that the Manager and subadvisor fee rate schedules for the Fund provide for a reasonable sharing of benefits from any economies of scale with the Fund.
Benefits Derived from the Relationship with the Fund.The Board considered the“fall-out” or ancillary benefits that accrue to the Manager and/or the subadvisors as a result of the advisory relationships with the Fund, including greater exposure in the marketplace with respect to the Manager’s or a subadvisor’s investment process and expanding the level of assets under management by the Manager and the subadvisors. The Board also considered that the Manager may invest the Fund’s cash balances and cash collateral provided by the borrowers of the Fund’s securities in the American Beacon U.S. Government Money Market Select Fund, which the Manager manages directly. In addition, the Board noted that each subadvisor benefits from soft dollar arrangements for proprietary and/or third-party research. Based on the foregoing information, the Board concluded that the potential benefits accruing to the Manager and the subadvisors by virtue of their relationships with the Fund appear to be fair and reasonable.
Additional Considerations and Conclusions with Respect to the Fund
The performance comparisons below were made in comparison to the Fund’s Broadridge performance universe and Morningstar Category. With respect to the Broadridge performance universe, the 1st Quintile represents the top 20 percent of the universe based on performance and the 5th Quintile representing the bottom 20 percent of the universe based on performance. References below to the Fund’s Broadridge performance universe are to the universe of mutual funds with a comparable investment classification/objective included in the
49
Disclosure Regarding Approval of the Management and Investment Advisory Agreements(Unaudited)
analysis provided by Broadridge. In reviewing the performance, the Trustees viewed longer-term performance over a full market cycle as the most important consideration, because relative performance over shorter periods may be significantly impacted by market or economic events and not necessarily reflective of manager skill.
The expense comparisons below were made in comparison to the Fund’s Broadridge expense universe and Broadridge expense group, with the 1st Quintile representing the lowest 20 percent of the universe or group based on lowest total expense and the 5th Quintile representing the highest 20 percent of the universe or group based on highest total expense. References below to the Fund’s expense group and expense universe are to the respective group or universe of comparable mutual funds included in the analysis by Broadridge. A Broadridge expense group consists of the Fund and a representative sample of funds with similar operating structures and asset sizes, as selected by Broadridge. A Broadridge expense universe includes all funds in the investment classification/objective with a similar operating structure as the share class of the Fund included in the Broadridge comparative information and provides a broader view of expenses across the Fund’s investment classification/objective. The Board also considered the Fund’s Morningstar fee level category. In reviewing expenses, the Board considered the positive impact of fee waivers where applicable and the Manager’s agreement to continue the fee waivers. In addition, information regarding the subadvisors’ use of soft dollars was requested from the Manager and was considered by the Board.
In considering the renewal of the Management Agreement for the Fund, the Board considered the following additional factors:
Broadridge Total Expenses Excluding12b-1 Fees and Morningstar Fee Level Ranking
Compared to Broadridge Expense Group | 2nd Quintile | |
Compared to Broadridge Expense Universe | 2nd Quintile | |
Morningstar Fee Level Ranking – Institutional Class | Below Average Expense Ratio |
Broadridge and Morningstar Performance Analysis(five-year period ended December 31, 2018)
Compared to Broadridge Performance Universe | 4th Quintile | |
Compared to Morningstar Category | 4th Quintile |
In considering the renewal of the Investment Advisory Agreements with each subadvisor, the Board considered that the diversification of investment strategies facilitated by the Fund’s multi-manager structure permits the Fund to mitigate the risks associated with a single subadvisor. The Board also considered the following additional factors:
Subadvisor Performance(compared to Broadridge Performance Universe for period indicated ended December 31, 2018)
Barrow | 5 Years | 2 | nd Quintile | |||||
Brandywine | 5 Years | 5 | th Quintile | |||||
Hotchkis | 5 Years | 3 | rd Quintile | |||||
MFS | 5 Years | 1 | st Quintile |
The Board also considered: (1) Brandywine’s value-disciplined consistent process and consistent team; (2) the Manager’s explanation that Brandywine’s deep value investment style (in companies with more significant discounts toprice-to-earnings andprice-to book ratios relative to other investment managers) was out of favor for the latter part of 2018 but has rebounded in 2019; (3) information provided by each subadvisor regarding fee rates charged for managing assets in the same or a similar strategy as the subadvisor manages its allocation of the Fund; (4) Brandywine’s and Hotchkis’ improved recent short-term performance; (5) the Manager’s recommendation to continue to retain each subadvisor; and (6) the Manager’s representation that, while the Manager was recommending that the Board continue to retain Brandywine, the Manager continues to evaluate the performance of Brandywine’s portion of the Fund and whether to make any further recommendations with respect to that subadvisor.
50
Disclosure Regarding Approval of the Management and Investment Advisory Agreements(Unaudited)
Based on these and other considerations, the Board: (1) concluded that the fees paid to the Manager and the subadvisors under the Management and Investment Advisory Agreements are fair and reasonable; and (2) determined that the Fund and its shareholders would benefit from the Manager’s and subadvisors’ continued management of the Fund.
51
Trustees and Officers of the American Beacon FundsSM(Unaudited)
The Trustees and officers of the American Beacon Funds (the “Trust”) are listed below, together with their principal occupations during the past five years. The address of each person listed below is 220 Las Colinas Boulevard East, Suite 1200, Irving, Texas 75039. Each Trustee overseesthirty-six funds in the fund complex that includes the Trust, the American Beacon Select Funds, the American Beacon Institutional Funds Trust, the American Beacon Sound Point Enhanced Income Fund, American Beacon Apollo Total Return Fund and the American Beacon Sound Point Alternative Lending Fund. The Trust’s Statement of Additional Information contains additional information about the Trustees and is available without charge by calling1-800-658-5811.
Name, Age | Position, Term of Office and Length of Time Served with the Trust | Principal Occupation(s) During Past 5 Years and Current Directorships | ||
| INTERESTED TRUSTEES | Term | |||
Lifetime of Trust until removal, resignation or retirement* | ||||
| Alan D. Feld** (82) | Trustee since 1996 | Partner in the law firm of Akin, Gump, Strauss, Hauer & Feld, LLP (law firm) (1960-Present); Trustee, American Beacon Select Funds (1999-Present); Trustee, American Beacon Institutional Funds Trust (2017-Present); Trustee, American Beacon Sound Point Enhanced Income Fund (2018-Present); Trustee, American Beacon Apollo Total Return Fund (2018-Present); Trustee, American Beacon Sound Point Alternative Lending Fund (2019-Present). | ||
| NON-INTERESTED TRUSTEES | Term | |||
Lifetime of Trust until removal, resignation or retirement* | ||||
| Gilbert G. Alvarado (49) | Trustee since 2015 | Director, Kura MD, Inc. (local telehealth organization) (2015-present); Vice President & CFO, Sierra Health Foundation (health conversion private foundation) (2006-Present); Vice President & CFO, Sierra Health Foundation: Center for Health Program Management (California public benefit corporation) (2012-Present); Director, Innovative North State (2012-2015); Director, Sacramento Regional Technology Alliance (2011-2016); Director, Women’s Empowerment (2009-2014); Director, Valley Healthcare Staffing (2017-present); Trustee, American Beacon Select Funds (2015-Present); Trustee, American Beacon Institutional Funds Trust (2017-Present); Trustee, American Beacon Sound Point Enhanced Income Fund (2018-Present); Trustee, American Beacon Apollo Total Return Fund (2018-Present); Trustee, American Beacon Sound Point Alternative Lending Fund (2019-Present). | ||
| Joseph B. Armes (57) | Trustee since 2015 | Chairman & CEO, CSW Industrials f/k/a Capital Southwest Corporation (investment company) (2015-Present); Chairman of the Board of Capital Southwest Corporation, predecessor to CSW Industrials, Inc. (2014-2017) (investment company); CEO, Capital Southwest Corporation(2013-2015); President & CEO, JBA Investment Partners (family investment vehicle) (2010-Present); Director and Chair of Audit Committee, RSP Permian (oil and gas producer) (2013-Present); Trustee, American Beacon Select Funds (2015-Present); Trustee, American Beacon Institutional Funds Trust (2017-Present); Trustee, American Beacon Sound Point Enhanced Income Fund (2018-Present); Trustee, American Beacon Apollo Total Return Fund (2018-Present); Trustee, American Beacon Sound Point Alternative Lending Fund (2019-Present). | ||
| Gerard J. Arpey (61) | Trustee since 2012 | Director, The Home Depot, Inc. (2015-Present); Partner, Emerald Creek Group (private equity firm) (2011-Present); Director, S.C. Johnson & Son, Inc. (privately held company) (2008-present); Trustee, American Beacon Select Funds (2012-Present); Trustee, American Beacon Institutional Funds Trust (2017-Present); Trustee, American Beacon Sound Point Enhanced Income Fund (2018-Present); Trustee, American Beacon Apollo Total Return Fund (2018-Present); Trustee, American Beacon Sound Point Alternative Lending Fund (2019-Present). | ||
52
Trustees and Officers of the American Beacon FundsSM(Unaudited)
Name, Age | Position, Term of Office and Length of Time Served with the Trust | Principal Occupation(s) During Past 5 Years and Current Directorships | ||
| NON-INTERESTED TRUSTEES (CONT.) | Term | |||
Lifetime of Trust until removal, resignation or retirement* | ||||
| Brenda A. Cline (58) | Trustee since 2004 Chair since 2019 Vice Chair 2018 | Chief Financial Officer, Treasurer and Secretary, Kimbell Art Foundation (1993-Present); Director, Tyler Technologies, Inc. (public sector software solutions company) (2014-Present); Director, Range Resources Corporation (oil and natural gas company) (2015-Present); Trustee, CushingClosed-End andOpen-End Funds and ETFs (2017-Present); Trustee, American Beacon Select Funds (2004-Present); Trustee, American Beacon Institutional Funds Trust (2017-Present); Trustee, American Beacon Sound Point Enhanced Income Fund (2018-Present); Trustee, American Beacon Apollo Total Return Fund (2018-Present); Trustee, American Beacon Sound Point Alternative Lending Fund(2019-Present). | ||
| Eugene J. Duffy (65) | Trustee since 2008 | Managing Director, Global Investment Management Distribution, Mesirow Financial (2016-Present); Managing Director, Institutional Services, Intercontinental Real Estate Corporation (2014-Present); Principal and Executive Vice President, Paradigm Asset Management (1994-2014); Trustee, American Beacon Select Funds (2008-Present); Trustee, American Beacon Institutional Funds Trust (2017-Present); Trustee, American Beacon Sound Point Enhanced Income Fund (2018-Present); Trustee, American Beacon Apollo Total Return Fund (2018-Present); Trustee, American Beacon Sound Point Alternative Lending Fund (2019-Present). | ||
| Claudia A. Holz (62) | Trustee since 2018 | Partner, KPMG LLP (1990-2017); Trustee, American Beacon Select Funds (2018-Present); Trustee, American Beacon Institutional Funds Trust (2018-Present); Trustee, American Beacon Sound Point Enhanced Income Fund (2018-Present); Trustee, American Beacon Apollo Total Return Fund (2018-Present); Trustee, American Beacon Sound Point Alternative Lending Fund (2019-Present). | ||
| Douglas A. Lindgren (57) | Trustee since 2018 | CEO North America, Carne Global Financial Services (2016-2017); Managing Director, IPS Investment Management and Global Head, Content Management, UBS Wealth Management (2010-2016); Trustee, American Beacon Select Funds (2018-Present); Trustee, American Beacon Institutional Funds Trust (2018-Present); Trustee, American Beacon Sound Point Enhanced Income Fund (2018-Present); Trustee, American Beacon Apollo Total Return Fund (2018-Present); Trustee, American Beacon Sound Point Alternative Lending Fund (2019-Present). | ||
| Richard A. Massman (76) | Trustee since 2004 Chair 2008-2018 Chair Emeritus since 2019 | Consultant and General Counsel Emeritus, Hunt Consolidated, Inc. (holding company engaged in oil and gas exploration and production, refining, real estate, farming, ranching and venture capital activities) (2009-Present); Trustee, American Beacon Select Funds (2004-Present); Trustee, American Beacon Institutional Funds Trust (2017-Present); Trustee, American Beacon Sound Point Enhanced Income Fund (2018-Present); Trustee, American Beacon Apollo Total Return Fund (2018-Present); Trustee, American Beacon Sound Point Alternative Lending Fund (2019-Present). | ||
| Barbara J. McKenna, CFA (56) | Trustee since 2012 | President/Managing Principal, Longfellow Investment Management Company (2005-Present); Trustee, American Beacon Select Funds (2012-Present); Trustee, American Beacon Institutional Funds Trust (2017-Present); Trustee, American Beacon Sound Point Enhanced Income Fund (2018-Present); Trustee, American Beacon Apollo Total Return Fund (2018-Present); Trustee, American Beacon Sound Point Alternative Lending Fund (2019-Present). | ||
53
Trustees and Officers of the American Beacon FundsSM(Unaudited)
Name, Age | Position, Term of Office and Length of Time Served with the Trust | Principal Occupation(s) During Past 5 Years and Current Directorships | ||
| NON-INTERESTED TRUSTEES (CONT.) | Term | |||
Lifetime of Trust until removal, resignation or retirement* | ||||
| R. Gerald Turner (73) | Trustee since 2001 | President, Southern Methodist University (1995-Present); Director, J.C. Penney Company, Inc. (1996-Present); Director, Kronus Worldwide Inc. (chemical manufacturing) (2003-Present); Trustee, American Beacon Select Funds (2001-Present); Trustee, American Beacon Institutional Funds Trust (2017-Present); Trustee, American Beacon Sound Point Enhanced Income Fund (2018-Present); Trustee, American Beacon Apollo Total Return Fund (2018-Present); Trustee, American Beacon Sound Point Alternative Lending Fund (2019-Present). | ||
| OFFICERS | Term | |||
| One Year | ||||
| Gene L. Needles, Jr. (64) | President since 2009 | President (2009-2018), CEO and Director (2009-Present), and Chairman (2018-Present), American Beacon Advisors, Inc., President (2015-2018), Director and CEO (2015-Present), and Chairman (2018-Present), Resolute Investment Holdings, LLC; President (2015-2018), Director and CEO (2015-Present), and Chairman (2018-Present), Resolute Topco, Inc.; President (2015-2018); Director, and CEO (2015-Present), and Chairman (2018-Present), Resolute Acquisition, Inc.; President (2015-2018), Director and CEO (2015-Present), Chairman (2018-Present), Resolute Investment Managers, Inc.; Director, Chairman, President and CEO, Resolute Investment Distributors (2017-Present); Director, Chairman, President and CEO; Resolute Investment Services, Inc. (2017-Present); President and CEO, Lighthouse Holdings Parent, Inc. (2009-2015); President, CEO and Director, Lighthouse Holdings, Inc. (2009-2015); Manager, President and CEO, American Private Equity Management, LLC (2012-Present); Director, Chairman, President and CEO, Alpha Quant Advisors, LLC (2016-Present); Director, ARK Investment Management LLC (2016-Present); Director, Shapiro Capital Management LLC (2017-Present); Director, Chairman and CEO, Continuous Capital, LLC (2018-Present); President, American Beacon Cayman Managed Futures Strategy Fund, Ltd. (2014-Present); Director and President, American Beacon Cayman Transformational Innovation Company, LTD., (2017-2018); President, American Beacon Delaware Transformational Innovation Corporation (2017-2018); President American Beacon Cayman TargetRisk Company, Ltd. (2018-Present);Member, Investment Advisory Committee, Employees Retirement System of Texas (2017-Present); Trustee, American Beacon NextShares Trust (2015-Present); President, American Beacon Select Funds (2009-Present); President, American Beacon Institutional Funds Trust (2017-Present); President, American Beacon Sound Point Enhanced Income Fund (2018-Present); President, American Beacon Apollo Total Return Fund (2018-Present); Director, RSW Investments Holdings LLC, (2019-Present); Manager, SSI Investment Management, LLC (2019-Present); President, American Beacon Sound Point Alternative Lending Fund (2019-Present); Director, Green Harvest Asset Management (2019-Present). | ||
54
Trustees and Officers of the American Beacon FundsSM(Unaudited)
Name, Age | Position, Term of Office and Length of Time Served with the Trust | Principal Occupation(s) During Past 5 Years and Current Directorships | ||
| OFFICERS (CONT.) | Term | |||
| One Year | ||||
| Rosemary K. Behan (60) | VP, Secretary and Chief Legal Officer since 2006 | Vice President, Secretary and General Counsel, American Beacon Advisors, Inc. (2006-Present); Secretary, Resolute Investment Holdings, LLC (2015-Present); Secretary, Resolute Topco, Inc. (2015-Present); Secretary, Resolute Acquisition, Inc. (2015-Present); Vice President, Secretary and General Counsel, Resolute Investment Managers, Inc. (2015-Present); Secretary, Resolute Investment Distributors, Inc. (2017-Present); Vice President, Secretary and General Counsel, Resolute Investment Services, Inc. (2017-Present); Vice President and Secretary, Lighthouse Holdings Parent, Inc. (2008-2015); Vice President and Secretary, Lighthouse Holdings, Inc. (2008-2015); Secretary, American Private Equity Management, LLC (2008-Present); Secretary and General Counsel, Alpha Quant Advisors, LLC (2016-Present); Vice President and Secretary, Continuous Capital, LLC (2018-Present); Secretary, American Beacon Delaware Transformational Innovation Corporation (2017-2018); Secretary, American Beacon Cayman Transformational Innovation Company, Ltd. (2017-2018); Secretary, American Beacon Cayman Managed Futures Strategy Fund, Ltd. (2014-Present); Secretary, American Beacon Cayman TargetRisk Company, Ltd (2018-Present); Chief Legal Officer, Vice President and Secretary, American Beacon Select Funds (2006-Present); Chief Legal Officer, Vice President and Secretary, American Beacon Institutional Funds Trust (2017-Present); Chief Legal Officer, Vice President and Secretary, American Beacon Sound Point Enhanced Income Fund (2018-Present); Chief Legal Officer, Vice President and Secretary American Beacon Apollo Total Return Fund (2018-Present); Chief Legal Officer, Vice President and Secretary, American Beacon Sound Point Alternative Lending Fund (2019-Present); Secretary, Green Harvest Asset Management (2019-Present). | ||
| Brian E. Brett (59) | VP since 2004 | Senior Vice President, Head of Distribution (2012-Present), Vice President, Director of Sales (2004-2012), American Beacon Advisors, Inc.; Senior Vice President, Resolute Investment Managers, Inc. (2017-Present); Senior Vice President, Resolute Investment Distributors, Inc. (2018-Present), Senior Vice President, Resolute Investment Services, Inc. (2018-Present); Senior Vice President, Lighthouse Holdings Parent, Inc. (2008-2015); Senior Vice President, Lighthouse Holdings, Inc. (2008-2015); Vice President, American Beacon Select Funds (2004-Present); Vice President, American Beacon Institutional Funds Trust (2017-Present); Vice President American Beacon Sound Point Enhanced Income Fund (2018-Present); Vice President American Beacon Apollo Total Return Fund (2018-Present); Vice President, American Beacon Sound Point Alternative Lending Fund (2019-Present). | ||
| Paul B. Cavazos (50) | VP since 2016 | Chief Investment Officer and Senior Vice President, American Beacon Advisors, Inc. (2016-Present); Chief Investment Officer, DTE Energy (2007-2016); Vice President, American Private Equity Management, L.L.C. (2017-Present); Vice President, American Beacon Select Funds (2016-Present); Vice President, American Beacon Institutional Funds Trust (2017-Present); Vice President American Beacon Sound Point Enhanced Income Fund (2018-Present); Vice President American Beacon Apollo Total Return Fund (2018-Present); Vice President, American Beacon Sound Point Alternative Lending Fund (2019-Present). | ||
| Erica Duncan (49) | VP Since 2011 | Vice President, American Beacon Advisors, Inc. (2011-Present); Vice President, Resolute Investment Managers (2018-Present); Vice President, Resolute Investment Services, Inc. (2018-Present); Vice President, American Beacon Select Funds (2011-Present); Vice President, American Beacon Institutional Funds Trust (2017-Present); Vice President American Beacon Sound Point Enhanced Income Fund (2018-Present); Vice President American Beacon Apollo Total Return Fund (2018-Present); Vice President, American Beacon Sound Point Alternative Lending Fund (2019-Present). | ||
55
Trustees and Officers of the American Beacon FundsSM(Unaudited)
Name, Age | Position, Term of Office and Length of Time Served with the Trust | Principal Occupation(s) During Past 5 Years and Current Directorships | ||
| OFFICERS (CONT.) | Term | |||
| One Year | ||||
| Melinda G. Heika (58) | Treasurer since 2010 | Treasurer and CFO (2010-Present), American Beacon Advisors, Inc.; Treasurer, Resolute Topco, Inc. (2015-Present); Treasurer, Resolute Investment Holdings, LLC. (2015-Present); Treasurer, Resolute Acquisition, Inc. (2015-Present); Treasurer and CFO, Resolute Investment Managers, Inc. (2017-Present); Treasurer, Resolute Investment Distributors, Inc. (2017-2017); Treasurer and CFO, Resolute Investment Services, Inc. (2015-Present); Treasurer, Lighthouse Holdings Parent Inc., (2010-2015); Treasurer, Lighthouse Holdings, Inc. (2010-2015); Treasurer, American Private Equity Management, LLC (2012-Present); Treasurer and CFO, Alpha Quant Advisors, LLC (2016-Present); Treasurer and CFO, Continuous Capital, LLC (2018-Present); Treasurer, American Beacon Cayman Transformational Innovation, Ltd. (2017-2018); Treasurer, American Beacon Delaware Transformational Innovation Corporation (2017-2018); Director and Treasurer, American Beacon Cayman Managed Futures Strategy Fund, Ltd. (2014-Present); Treasurer, American Beacon Cayman TargetRisk Company, Ltd. (2018-Present); Treasurer, American Beacon Select Funds (2010-Present); Treasurer, American Beacon Institutional Funds Trust (2017-Present); Treasurer, American Beacon Sound Point Enhanced Income Fund (2018-Present); Treasurer, American Beacon Apollo Total Return Fund (2018-Present); Treasurer, American Beacon Sound Point Alternative Lending Fund (2019-Present); Treasurer, Green Harvest Asset Management (2019-Present). | ||
| Terri L. McKinney (55) | VP since 2010 | Vice President (2009-Present), Managing Director (2003-2009), American Beacon Advisors, Inc.; Vice President, Resolute Investment Managers, Inc. (2017-Present); Vice President, Resolute Investment Services, Inc (2018-Present); Vice President, Alpha Quant Advisors, LLC (2016-Present); Vice President, Continuous Capital, LLC (2018-Present); Vice President, American Beacon Select Funds (2010-Present); Vice President, American Beacon Institutional Funds Trust (2017-Present); Vice President, American Beacon Sound Point Enhanced Income Fund (2018-Present); Vice President, American Beacon Apollo Total Return Fund (2018-Present); Vice President, American Beacon Sound Point Alternative Lending Fund (2019-Present). | ||
56
Trustees and Officers of the American Beacon FundsSM(Unaudited)
Name, Age | Position, Term of Office and Length of Time Served with the Trust | Principal Occupation(s) During Past 5 Years and Current Directorships | ||
| OFFICERS (CONT.) | Term | |||
| One Year | ||||
| Jeffrey K. Ringdahl (44) | VP since 2010 | Director (2015-Present), President (2018-Present), Chief Operating Officer (2010-Present), Senior Vice President (2013-2018), Vice President (2010-2013), American Beacon Advisors, Inc.; Director (2015-Present), President (2018-Present), Senior Vice Present (2015-2018), Resolute Investment Holdings, LLC; Director (2015-Present), President (2018-Present), Senior Vice President (2015-2018), Resolute Topco, Inc.; Director (2015-Present), President (2018-Present), Senior Vice President (2015-2018), Resolute Acquisition, Inc.; Director (2015-Present), President & COO (2018-Present), Senior Vice President (2015-2018), Resolute Investment Managers, Inc.; Director and Executive Vice President (2017-Present), Resolute Investment Distributors, Inc.; Director (2017-Present), President & COO (2018-Present), Executive Vice President (2017-2018), Resolute Investment Services, Inc.; Senior Vice President (2017-Present), Vice President (2012-2017), Manager (2015-Present), American Private Equity Management, LLC; Senior Vice President, Lighthouse Holdings Parent, Inc. (2013-2015); Senior Vice President, Lighthouse Holdings, Inc. (2013-2015); Trustee, American Beacon NextShares Trust (2015-Present); Director, Executive Vice President & COO, Alpha Quant Advisors, LLC (2016-Present); Director, Shapiro Capital Management, LLC (2017-Present); Director, Executive Vice President & COO, Continuous Capital, LLC (2018-Present); Director and Vice President, American Beacon Cayman Transformational Innovation Company, Ltd., (2017-Present); Vice President, American Beacon Delaware Transformational Innovation Corporation (2017-2018); Director and Vice President, American Beacon Cayman Managed Futures Strategy Fund, Ltd. (2014-Present); Vice President, American Beacon Cayman TargetRisk Company, Ltd (2018-Present); Vice President, American Beacon Select Funds (2010-2018); Vice President, American Beacon Institutional Funds Trust (2017-Present); Vice President, American Beacon Sound Point Enhanced Income Fund (2018-Present); Vice President, American Beacon Apollo Total Return Fund (2018-Present); Director, RSW Investments Holdings LLC, (2019-Present); Manager, SSI Investment Management, LLC (2019-Present), Vice President, American Beacon Sound Point Alternative Lending Fund (2019-Present). | ||
| Samuel J. Silver (56) | VP Since 2011 | Vice President (2011-Present), Chief Fixed Income Officer (2016-Present), American Beacon Advisors, Inc. (2011-Present); Vice President, American Beacon Select Funds (2011-Present); Vice President, American Beacon Institutional Funds Trust (2017-Present); Vice President, American Beacon Sound Point Enhanced Income Fund (2018-Present); Vice President, American Beacon Apollo Total Return Fund (2018-Present); Vice President, American Beacon Sound Point Alternative Lending Fund (2019-Present). | ||
| Christina E. Sears (48) | Chief Compliance Officer since 2004 and Asst. Secretary since 1999 | Vice President, American Beacon Advisors, Inc. (2019-Present); Chief Compliance Officer, American Beacon Advisors, Inc. (2004-Present); Vice President, Resolute Investment Managers, Inc. (2017-Present); Vice President, Resolute Investment Distributors (2017-Present); Vice President, Resolute Investment Services, Inc. (2019-Present); Chief Compliance Officer, American Private Equity Management, LLC (2012-Present); Chief Compliance Officer (2016-2019) and Vice President, Alpha Quant Advisors, LLC (2016-Present); Vice President, Continuous Capital, LLC (2018-Present); Chief Compliance Officer (2004-Present) and Assistant Secretary (1999-Present), American Beacon Select Funds; Chief Compliance Officer and Assistant Secretary, American Beacon Institutional Funds Trust (2017-Present); Chief Compliance Officer and Assistant Secretary, American Beacon Sound Point Enhanced Income Fund (2018-Present); Chief Compliance Officer and Assistant Secretary, American Beacon Apollo Total Return Fund (2018-Present); Chief Compliance Officer and Assistant Secretary, American Beacon Sound Point Alternative Lending Fund (2019-Present). | ||
57
Trustees and Officers of the American Beacon FundsSM(Unaudited)
Name, Age | Position, Term of Office and Length of Time Served with the Trust | Principal Occupation(s) During Past 5 Years and Current Directorships | ||
| OFFICERS (CONT.) | Term | |||
| One Year | ||||
| Sonia L. Bates (62) | Asst. Treasurer since 2011 | Assistant Treasurer, American Beacon Advisors, Inc. (2011-2018); Assistant Treasurer, Lighthouse Holdings Parent Inc. (2011-2015); Assistant Treasurer, Lighthouse Holdings, Inc. (2011-2015); Assistant Treasurer, American Private Equity Management, LLC (2012-Present); Assistant Treasurer, American Beacon Cayman Transformational Innovation Company, Ltd. (2017-Present); Assistant Treasurer, American Beacon Cayman TargetRisk Company, Ltd. (2018-Present); Assistant Treasurer, American Beacon Select Funds (2011-Present); Assistant Treasurer, American Beacon Institutional Funds Trust (2017-Present); Assistant Treasurer, American Beacon Sound Point Enhanced Income Fund (2018-Present); Assistant Treasurer, American Beacon Apollo Total Return Fund (2018-Present); Assistant Treasurer, American Beacon Sound Point Alternative Lending Fund (2019-Present). | ||
| Shelley D. Abrahams (44) | Assistant Secretary since 2008 | Assistant Secretary, American Beacon Select Funds (2008-Present); Assistant Secretary, American Beacon Institutional Funds Trust (2017-Present); Assistant Secretary, American Beacon Sound Point Enhanced Income Fund (2018-Present); Assistant Secretary, American Beacon Apollo Total Return Fund (2018-Present); Assistant Secretary, American Beacon Sound Point Alternative Lending Fund (2019-Present); Assistant Secretary, Green Harvest Asset Management (2019-Present). | ||
| Rebecca L. Harris (52) | Assistant Secretary since 2010 | Vice President, American Beacon Advisors, Inc. (2011-Present); Vice President, Resolute Investment Managers, Inc. (2017-Present); Vice President, Resolute Investment Services (2015-Present); Vice President, Alpha Quant Advisors, LLC (2016-Present); Vice President, Continuous Capital, LLC (2018-Present); Assistant Secretary, American Beacon Select Funds (2010-Present); Assistant Secretary, American Beacon Institutional Funds Trust (2017-Present); Assistant Secretary, American Beacon Sound Point Enhanced Income Fund (2018-Present); Assistant Secretary, American Beacon Apollo Total Return Fund (2018-Present); Assistant Secretary, American Beacon Sound Point Alternative Lending Fund (2019-Present). | ||
| Teresa A. Oxford (61) | Assistant Secretary since 2015 | Assistant Secretary, American Beacon Advisors, Inc. (2015-Present); Assistant Secretary, Resolute Investment Distributors (2018-Present); Assistant Secretary, Resolute Investment Services (2018-Present); Assistant Secretary, Alpha Quant Advisors, LLC (2016-Present); Assistant Secretary, American Beacon Select Funds (2015-Present); Assistant Secretary, American Beacon Institutional Funds Trust (2017-Present); Assistant Secretary, American Beacon Sound Point Enhanced Income Fund (2018-Present); Assistant Secretary, American Beacon Apollo Total Return Fund (2018-Present); Assistant Secretary, American Beacon Sound Point Alternative Lending Fund (2019-Present); Assistant Secretary, Green Harvest Asset Management (2019-Present). | ||
* As of 11/12/2014, the Board adopted a retirement plan that requires Trustees, other than Messrs. Feld and Massman to retire no later than the last day of the calendar year in which they reach the age of 75. As of 11/7/17, the Board approved a waiver of the mandatory retirement policy with respect to Mr. Massman, who turned 75 in November 2018, to permit him to continue to serve on the Board as Chair Emeritus through 12/31/19.
** Mr. Feld is deemed to be an “interested person” of the Trusts, as defined by the 1940 Act. Mr. Feld’s law firm of Akin, Gump, Strauss, Hauer & Feld LLP has provided legal services within the past two fiscal years to one or more of the Trust’ssub-advisors.
58
American Beacon FundsSM
October 31, 2019 (Unaudited)
The American Beacon Funds recognize and respect the privacy of our shareholders. We are providing this notice to you so you will understand how shareholder information may be collected and used.
We may collect nonpublic personal information about you from one or more of the following sources:
| • | information we receive from you on applications or other forms; |
| • | information about your transactions with us or our service providers; and |
| • | information we receive from third parties. |
We do not disclose any nonpublic personal information about our customers or former customers to anyone, except as permitted by law.
We restrict access to your nonpublic personal information to those employees or service providers who need to know that information to provide products or services to you. To ensure the confidentiality of your nonpublic personal information, we maintain safeguards that comply with federal standards.
59
This page intentionally left blank.
60

Delivery of Documents
eDelivery isNOW AVAILABLE - Stop traditional mail delivery and receive your
shareholder reports and summary prospectuson-line. Sign up at
www.americanbeaconfunds.com
If you invest in the Fund through a financial institution, you may be able to receive the Fund’s regulatory mailings, such as the Prospectus, Annual Report and Semi-Annual Report, bye-mail. If you are interested in this option, please go towww.icsdelivery.com and search for your financial institution’s name or contact your financial institution directly.
To obtain more information about the Fund:
 |  | |
| ByE-mail: | On the Internet: | |
| american_beacon.funds@ambeacon.com | Visit our website atwww.americanbeaconfunds.com | |
By Telephone: Call (800)658-5811 |
By Mail: American Beacon Funds P.O. Box 219643 Kansas City, MO 64121-9643 | |
| Availability of Quarterly Portfolio Schedules | Availability of Proxy Voting Policy and Records | |
| In addition to the Schedule of Investments provided in each semi-annual and annual report, the Fund files a complete schedule of its portfolio holdings with the Securities and Exchange Commission (“SEC”) on FormN-PORT as of the first and third fiscal quarters. The Fund’s FormsN-PORT are available on the SEC’s website atwww.sec.gov. TheForms N-PORT may also be reviewed and copied at the SEC’s Public Reference Section, 100 F Street, NE, Washington, D.C. 20549-1520. Information regarding the operation of the SEC’s Public Reference Room may be obtained by calling(800)-SEC-0330. A complete schedule of the Fund’s portfolio holdings is also available atwww.americanbeaconfunds.com approximately twenty days after the end of each month. | A description of the policies and procedures the Fund uses to determine how to vote proxies relating to portfolio securities is available in the Fund’s Statement of Additional Information, is available free of charge on the Fund’s websitewww.americanbeaconfunds.com and by calling1-800-967-9009 or by accessing the SEC’s website atwww.sec.gov. The Fund’s proxy voting record for the most recent year ended June 30 is filed annually with the SEC on FormN-PX. The Fund’s FormsN-PX are available on the SEC’s website atwww.sec.gov. The Fund’s proxy voting record may also be obtained by calling1-800-967-9009. | |


Fund Service Providers:
CUSTODIAN State Street Bank and Trust Company Boston, Massachusetts | TRANSFER AGENT DST Asset Manager Solutions, Inc. Quincy, Massachusetts | INDEPENDENT REGISTERED PUBLIC ACCOUNTING FIRM Ernst & Young LLP Dallas, Texas | DISTRIBUTOR Resolute Investment Distributors, Inc. Irving, Texas |
This report is prepared for shareholders of the American Beacon Funds and may be distributed to others only if preceded or accompanied by a current Prospectus or Summary Prospectus.
American Beacon Funds and American Beacon Large Cap Value Fund are service marks of American Beacon Advisors, Inc.
AR 10/19

About American Beacon Advisors
Since 1986, American Beacon Advisors has offered a variety of products and investment advisory services to numerous institutional and retail clients, including a variety of mutual funds, corporate cash management, and separate account management.
Our clients include defined benefit plans, defined contribution plans, foundations, endowments, corporations, financial planners, and other institutional investors. With American Beacon Advisors, you can put the experience of a multi-billion dollar asset management firm to work for your company.
SMALL CAP VALUE FUND RISKS
Investing insmall-capitalization stocksmay involve greater volatility and lower liquidity than larger company stocks. Investing invalue stocksmay limit downside risk over time; however, the Fund may produce more modest gains than riskier stock funds as atrade-off for this potentially lower risk. Investing inforeign securitiesmay involve heightened risk due to currency fluctuations and economic and political risks. The use offutures contractsfor cash management may subject the Fund to losing more money than invested. The Fund participates in asecurities lendingprogram. Please see the prospectus for a complete discussion of the Fund’s risks. There can be no assurances that the investment objectives of this Fund will be met.
Any opinions herein, including forecasts, reflect our judgment as of the end of the reporting period and are subject to change. Each advisor’s strategies and the Fund’s portfolio composition will change depending on economic and market conditions. This report is not a complete analysis of market conditions and therefore, should not be relied upon as investment advice. Although economic and market information has been compiled from reliable sources, American Beacon Advisors, Inc. makes no representation as to the completeness or accuracy of the statements contained herein.
American Beacon Funds | October 31, 2019 |
| 1 | ||||
| 2 | ||||
| 6 | ||||
| 8 | ||||
| 9 | ||||
| 27 | ||||
| 30 | ||||
| 49 | ||||
| 56 | ||||
Disclosure Regarding Approval of the Management and Investment Advisory Agreements | 57 | |||
| 62 | ||||
| 69 | ||||
| Back Cover | ||||
 | Dear Shareholders,
In recent months, you’ve likely seen and heard news reports about disruptive headwinds in the global economy –including the U.S. trade war with China and its toll on the global economy, slowing global growth, the Federal Reserve’s series of rate cuts, Brexit, disruptions in the Middle East and protests in Hong Kong – and watched a flood of reaction in the world’s markets.
As Peter L. Bernstein said in his treatise on risk,Against the Gods: The Remarkable Story of Risk, published by John Wiley & Sons, Inc. in September 1998, “Volatility is a proxy for uncertainty and must be accommodated in measuring investment risk.”
During times of economic uncertainty and market volatility, fear of loss can be a powerful emotion – one that drives many investors to making short-term decisions subject to a variety of potential error-leading biases. Unfortunately, some short-term investment decisions may create more volatility rather than mitigate it. |
Instead of dwelling on the markets’ short-term reaction to waves of negative global news, we encourage investors to focus on the horizon instead. Long-term investing isn’t about identifying and anticipating the next big market move, it is about identifying the right investment products for riding out those moves. As a long-term investor, you should keep in mind the three Ds:direction,disciplineanddiversification.
| u | Direction: Achieving your long-term financial goals requires an individualized plan of action. You may want your plan to provide some measure of protection against periods of geopolitical turmoil, economic uncertainty, market volatility and job insecurity. Your plan should be reviewed annually and be adjusted in the event your long-range needs change. |
| u | Discipline: Long-term, systematic participation in an investment portfolio requires your resolution to stay the course. Spending time in the market – rather than trying to time the market – may place you in a better position to reach your long-term financial goals. |
| u | Diversification: By investing in different investment styles and asset classes, you may be able to help mitigate financial risks across your investment portfolio. By allocating your investment portfolio according to your risk-tolerance level, you may be better positioned to weather storms and achieve your long-term financial goals. |
Since 1986, American Beacon has endeavored to provide investors with a disciplined approach to realizing long-term financial goals.As a manager of managers, we strive to provide investment products that may enable investors to participate during market upswings while potentially insulating against market downswings.
Many of thesub-advisors to our mutual funds pursue upside capture and/or downside protection using proprietary strategies. The investment teams behind our mutual funds seek to produce consistent, long-term results rather than focus only on short-term movements in the markets. In managing our investment products, we emphasize identifying opportunities that offer the potential for long-term rewards.
Our management approach is more than a concept; it’s the cornerstone of our culture. And we strive to apply it at every turn as we seek to provide a well-diversified line of investment solutions to help our shareholders seek long-term rewards while mitigating volatility and risk.
Thank you for your continued interest in American Beacon. For additional information about our investment products or to access your account information, please visit our website atwww.americanbeaconfunds.com.
Best Regards,

Gene L. Needles, Jr.
President
American Beacon Funds
1
Domestic Equity Market Overview
October 31, 2019 (Unaudited)
For the12-month period ended October 31, 2019, the U.S. equity markets rallied strongly after a depressed start to the period that saw market volatility spike to its highest level in seven years during the fourth quarter of 2018. The S&P 500 Index and the Dow Jones Industrial Average returned 14.33% and 10.32%, respectively, for the period. Growth broadly outperformed Value across all market caps; the Russell 1000 Growth Index and the Russell 1000 Value Index returned 17.10% and 11.21%, respectively, and the Russell Midcap Growth Index and the Russell Midcap Value Index returned 18.93% and 10.08%, respectively. Large andmid-cap stocks also did significantly better thansmall-cap stocks; the Russell 1000 Index returned 14.15% and the Russell Midcap Index returned 13.72%, compared to the Russell 2000 Index return of 4.90%.
All of this occurred in an environment that saw rising fears of economic recession as the current expansion entered its 11th year, intensified by the effects of an escalating trade war, as well as concerns over the ability of the Federal Reserve (the “Fed”) policy to forestall the effects of an economic downturn. Feeding these uncertainties, growth slowed during the period as the third quarter’s gross domestic product decelerated to 1.9% from its peak rate of 3.5% in the second quarter of 2018. Corporate earnings growth also slowed with profit growth.
The Fed did alter its policy course at year end 2018 and began lowering the federal funds rate in the third quarter of 2019. At the same time, the economic strength underlying the U.S. economy remained resilient with the September unemployment rate at 3.5%, a40-year low. In addition, the consumer continued to show good strength with both income and expenditures growing at healthy rates. Also, ongoing tariff negotiations between the U.S. and China are providing hope to prospects of settlement. Collectively, all of these factors kept the markets positive going into the fiscal year end.
2
American Beacon Small Cap Value FundSM
Performance Overview
October 31, 2019 (Unaudited)
The Investor Class of the American Beacon Small Cap Value Fund (the “Fund”) returned 1.67% for the twelve months ended October 31, 2019, underperforming the Russell 2000® Value Index (the “Index”) return of 3.22% for the same period.
Comparison of Change in Value of a $10,000 Investment for the period from 10/31/2009 through 10/31/2019
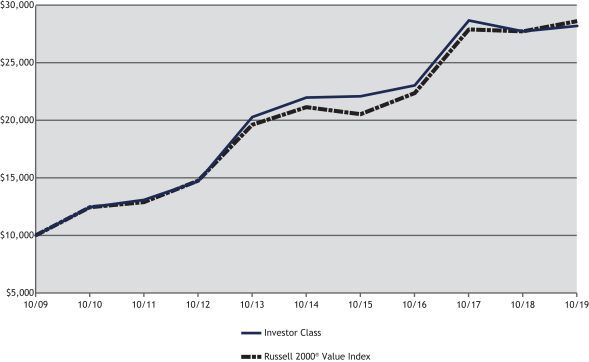
| Total Returns for the Period ended October 31, 2019 |
| |||||||||||||||||||||||||||||||
Ticker | 1 Year | 3 Years | 5 Years | 10 Years | Value of $10,000 | |||||||||||||||||||||||||||
Institutional Class (1,6) | AVFIX | 2.01 | % | 7.31 | % | 5.44 | % | 11.29 | % | $ | 29,154 | |||||||||||||||||||||
Y Class (1,6) | ABSYX | 1.93 | % | 7.22 | % | 5.36 | % | 11.18 | % | $ | 28,864 | |||||||||||||||||||||
Investor Class (1,6) | AVPAX | 1.67 | % | 6.96 | % | 5.10 | % | 10.91 | % | $ | 28,177 | |||||||||||||||||||||
Advisor Class (1,6) | AASSX | 1.48 | % | 6.78 | % | 4.92 | % | 10.74 | % | $ | 27,740 | |||||||||||||||||||||
A Class without sales charge (1,2,6) | ABSAX | 1.56 | % | 6.87 | % | 5.01 | % | 10.79 | % | $ | 27,854 | |||||||||||||||||||||
A Class with sales charge (1,2,6) | ABSAX | (4.26 | )% | 4.78 | % | 3.78 | % | 10.13 | % | $ | 26,246 | |||||||||||||||||||||
C Class without sales charge (1,3,6) | ASVCX | 0.85 | % | 6.16 | % | 4.28 | % | 10.04 | % | $ | 26,035 | |||||||||||||||||||||
C Class with sales charge (1,3,6) | ASVCX | (0.15 | )% | 6.16 | % | 4.28 | % | 10.04 | % | $ | 26,035 | |||||||||||||||||||||
R6 Class (1,4,6) . . | AASRX | 2.01 | % | 7.33 | % | 5.45 | % | 11.30 | % | $ | 29,164 | |||||||||||||||||||||
Russell 2000® Value Index (5) | 3.22 | % | 8.60 | % | 6.24 | % | 11.08 | % | $ | 28,607 | ||||||||||||||||||||||
| 1. | Performance shown is historical and is not indicative of future returns. Investment returns and principal value will vary, and shares may be worth more or less at redemption than at original purchase. Performance shown is calculated based on the published end of day net asset values as of date indicated, and current performance may be lower or higher than the performance data quoted. To obtain performance as of the most recent month end, please visitwww.americanbeaconfunds.com or call1-800-967-9009. Fund performance in the table above does not reflect the deduction of taxes a shareholder would pay on distributions or the redemption of shares. Generally accepted accounting principles require adjustments to be made to the net assets of the Fund at period end for financial reporting purposes only; and as such, the total return based on the unadjusted net asset value per share may differ from the total return reported in the financial highlights. |
| 2. | Fund performance for theten-year period represents the total returns achieved by the Investor Class from 10/31/09 up to 5/17/10, the inception date of the A Class, and the returns of the A Class since its inception. Expenses of the A Class are higher than those of the Investor Class. As a result, total returns |
3
American Beacon Small Cap Value FundSM
Performance Overview
October 31, 2019 (Unaudited)
| shown may be higher than they would have been had the A Class been in existence since 10/31/09. A portion of the fees charged to the A Class of the Fund was waived in 2010, 2012, 2013 and 2014 and fully recovered in 2015. Performance prior to waiving fees was lower than the actual returns shown for 2010, 2012, 2013 and 2014. The maximum sales charge for A Class is 5.75%. |
| 3. | Fund performance for theten-year period represents the total returns achieved by the Investor Class from 10/31/09 up to 9/1/10, the inception date of the C Class, and the returns of the C Class since its inception. Expenses of the C Class are higher than those of the Investor Class. As a result, total returns shown may be higher than they would have been had the C Class been in existence since 10/31/09. A portion of the fees charged to the C Class of the Fund was waived in 2010, 2012 and 2013, fully recovered in 2015, and waived in 2018. Performance prior to waiving fees was lower than the actual returns shown in 2010, 2012, 2013 and 2018. The maximum contingent deferred sales charge for C Class is 1.00% for shares redeemed within one year of the date of purchase. |
| 4. | Fund performance for the three-year, five-year andten-year periods represents the returns achieved by the Institutional Class from 10/31/09 through 2/28/17, the inception date of the R6 Class, and the returns of the R6 Class since its inception. Expenses of the R6 Class are lower than those of the Institutional Class. As a result, total returns shown may be lower than they would have been had the R6 Class been in existence since 10/31/09. |
| 5. | The Russell 2000 Value Index is an unmanaged index of those stocks in the Russell 2000 Index with lowerprice-to-book ratios and lower forecasted growth values. Russell 2000 Value Index and Russell 2000 Index are registered trademarks of Frank Russell Company. Frank Russell Company (“Russell”) is the source and owner of the trademarks, service marks and copyrights related to the Russell Indexes. Russell® is a trademark of Frank Russell Company. Neither Russell nor its licensors accept any liability for any errors or omissions in the Russell Indexes and/or Russell ratings or underlying data, and no party may rely on any Russell Indexes and/or Russell ratings and/or underlying data contained in this communication. No further distribution of Russell Data is permitted without Russell’s express written consent. Russell does not promote, sponsor or endorse the content of this communication. One cannot directly invest in an index. |
| 6. | The Total Annual Fund Operating Expense ratios set forth in the most recent Fund prospectus for the Institutional, Y, Investor, Advisor, A, C and R6 Class shares were 0.81%, 0.88%, 1.14%, 1.29%, 1.21%, 1.87% and 0.78%, respectively. The expense ratios above may vary from the expense ratios presented in other sections of this report that are based on expenses incurred during the period covered by this report |
The Fund trailed the Index during the period due mainly to security selection, while sector allocation was slightly additive to relative performance.
Most of the Fund’s underperformance related to security selection was attributed to holdings in the Financials and Energy sectors. In the Financials sector, the Fund’s positions in Webster Financial Corp. (down 23.6%) and Texas Capital Bancshares, Inc. (down 16.7%) negatively impacted performance. In the Energy sector, detractors included Callon Petroleum Co. (down 62.9%) and Whiting Petroleum Corp. (down 82.8%). On the other hand, positive security selection in the Consumer Discretionary sector added relative value. In this sector, Sonic Automotive Inc. (up 75.9%) and an absence from Index-position Signet Jewelers Ltd. (down 68.9%) were the largest contributors.
From a sector allocation perspective, the Fund’s overweight positions in the Information Technology sector (up 26.3%) and the Industrials sector (up 9.2%) contributed to relative performance. This relative performance was partially offset by an underweight to the Real Estate sector (up 19.1%).
Thesub-advisors continue to focus on uncovering investment opportunities through stock selection that should benefit the Fund’s performance over the longer term.
4
American Beacon Small Cap Value FundSM
Performance Overview
October 31, 2019 (Unaudited)
| Top Ten Holdings (% Net Assets) |
| |||||||
| Diodes, Inc. | 1.5 | |||||||
| Brooks Automation, Inc. | 1.0 | |||||||
| Portland General Electric Co. | 1.0 | |||||||
| Enstar Group Ltd. | 0.9 | |||||||
| Federal Signal Corp. | 0.9 | |||||||
| Seritage Growth Properties, Class A | 0.9 | |||||||
| Vishay Intertechnology, Inc. | 0.9 | |||||||
| MGIC Investment Corp. | 0.7 | |||||||
| Simpson Manufacturing Co., Inc. | 0.7 | |||||||
| Stifel Financial Corp. | 0.6 | |||||||
| Total Fund Holdings | 708 | |||||||
| Sector Allocation (% Equities) |
| |||||||
| Financials | 28.0 | |||||||
| Industrials | 21.1 | |||||||
| Information Technology | 14.0 | |||||||
| Consumer Discretionary | 13.0 | |||||||
| Real Estate | 5.4 | |||||||
| Energy | 4.4 | |||||||
| Materials | 4.2 | |||||||
| Utilities | 3.0 | |||||||
| Health Care | 2.8 | |||||||
| Communication Services | 2.1 | |||||||
| Consumer Staples | 1.8 | |||||||
| Exchange-Traded Instruments | 0.2 | |||||||
5
American Beacon Small Cap Value FundSM
October 31, 2019 (Unaudited)
Fund Expense Example
As a shareholder of a Fund, you incur two types of costs: (1) transaction costs, including sales charges (loads) on purchase payments and redemption fees if applicable, and (2) ongoing costs, including management fees, distribution(12b-1) fees,Sub-transfer agent fees, and other Fund expenses. The Examples are intended to help you understand the ongoing cost (in dollars) of investing in the Fund and to compare these costs with the ongoing costs of investing in other mutual funds. The Examples are based on an investment of $1,000 invested at the beginning of the period in each Class and held for the entire period from May 1, 2019 through October 31, 2019.
Actual Expenses
The “Actual” lines of the table provide information about actual account values and actual expenses. You may use the information on this page, together with the amount you invested, to estimate the expenses that you paid over the period. Simply divide your account value by $1,000 (for example, an $8,600 account value divided by $1,000 = $8.60), then multiply the result by the “Expenses Paid During Period” to estimate the expenses you paid on your account during this period. Shareholders of the Investor and Institutional Classes that invest in the Fund through an IRA or Roth IRA may be subject to a custodial IRA fee of $15 that is typically deducted each December. If your account was subject to a custodial IRA fee during the period, your costs would have been $15 higher.
Hypothetical Example for Comparison Purposes
The “Hypothetical” lines of the table provide information about hypothetical account values and hypothetical expenses based on the Fund’s actual expense ratio and an assumed 5% per year rate of return before expenses (not the Fund’s actual return). You may compare the ongoing costs of investing in the Fund with other funds by contrasting this 5% hypothetical example and the 5% hypothetical examples that appear in the shareholder reports of the other funds. The hypothetical account values and expenses may not be used to estimate the actual ending account balance or expenses you paid for the period. Shareholders of the Investor and Institutional Classes that invest in the Fund through an IRA or Roth IRA may be subject to a custodial IRA fee of $15 that is typically deducted each December. If your account was subject to a custodial IRA fee during the period, your costs would have been $15 higher.
You should also be aware that the expenses shown in the table highlight only your ongoing costs and do not reflect any transaction costs charged by the Fund, such as sales charges (loads) or redemption fees, as applicable. Similarly, the expense examples for other funds do not reflect any transaction costs charged by those funds, such as sales charges (loads), redemption fees or exchange fees. Therefore, the “Hypothetical” lines of the table are useful in comparing ongoing costs only and will not help you determine the relative total costs of owning different funds. If you were subject to any transaction costs during the period, your costs would have been higher.
6
American Beacon Small Cap Value FundSM
Expense Example
October 31, 2019 (Unaudited)
| American Beacon Small Cap Value Fund |
| ||||||||||||||
| Beginning Account Value 5/1/2019 | Ending Account Value 10/31/2019 | Expenses Paid During Period 5/1/2019-10/31/2019* | |||||||||||||
| Institutional Class | |||||||||||||||
| Actual | $1,000.00 | $973.90 | $4.13 | ||||||||||||
| Hypothetical** | $1,000.00 | $1,021.02 | $4.23 | ||||||||||||
| Y Class | |||||||||||||||
| Actual | $1,000.00 | $973.50 | $4.53 | ||||||||||||
| Hypothetical** | $1,000.00 | $1,020.62 | $4.63 | ||||||||||||
| Investor Class | |||||||||||||||
| Actual | $1,000.00 | $972.30 | $5.77 | ||||||||||||
| Hypothetical** | $1,000.00 | $1,019.36 | $5.90 | ||||||||||||
| Advisor Class | |||||||||||||||
| Actual | $1,000.00 | $971.50 | $6.61 | ||||||||||||
| Hypothetical** | $1,000.00 | $1,018.50 | $6.77 | ||||||||||||
| A Class | |||||||||||||||
| Actual | $1,000.00 | $971.70 | $6.36 | ||||||||||||
| Hypothetical** | $1,000.00 | $1,018.75 | $6.51 | ||||||||||||
| C Class | |||||||||||||||
| Actual | $1,000.00 | $968.40 | $9.77 | ||||||||||||
| Hypothetical** | $1,000.00 | $1,015.28 | $10.01 | ||||||||||||
| R6 Class | |||||||||||||||
| Actual | $1,000.00 | $973.90 | $3.98 | ||||||||||||
| Hypothetical** | $1,000.00 | $1,021.17 | $4.08 | ||||||||||||
| * | Expenses are equal to the Fund’s annualized expense ratios for thesix-month period of 0.83%, 0.91%, 1.16%, 1.33%, 1.28%, 1.97%, and 0.80% for the Institutional, Y, Investor, Advisor, A, C, and R6 Classes, respectively, multiplied by the average account value over the period, multiplied by the number derived by dividing the number of days in the most recent fiscal half-year (184) by days in the year (365) to reflect the half-year period. |
| ** | 5% return before expenses. |
7
American Beacon Small Cap Value FundSM
Report of Independent Registered Public Accounting Firm
To the Shareholders and the Board of Trustees of
American Beacon Small Cap Value Fund
Opinion on the Financial Statements
We have audited the accompanying statement of assets and liabilities of American Beacon Small Cap Value Fund (the “Fund”) (one of the funds constituting American Beacon Funds (the “Trust”)), including the schedule of investments, as of October 31, 2019, and the related statement of operations for the year then ended, the statements of changes in net assets for each of the two years in the period then ended, the financial highlights for each of the five years in the period then ended and the related notes (collectively referred to as the “financial statements”). In our opinion, the financial statements present fairly, in all material respects, the financial position of the Fund at October 31, 2019, the results of its operations for the year then ended, the changes in its net assets for each of the two years in the period then ended and its financial highlights for each of the five years in the period then ended, in conformity with U.S. generally accepted accounting principles.
Basis for Opinion
These financial statements are the responsibility of the Trust’s management. Our responsibility is to express an opinion on the Fund’s financial statements based on our audits. We are a public accounting firm registered with the Public Company Accounting Oversight Board (United States) (“PCAOB”) and are required to be independent with respect to the Trust in accordance with the U.S. federal securities laws and the applicable rules and regulations of the Securities and Exchange Commission and the PCAOB
We conducted our audits in accordance with the standards of the PCAOB. Those standards require that we plan and perform the audit to obtain reasonable assurance about whether the financial statements are free of material misstatement, whether due to error or fraud. The Trust is not required to have, nor were we engaged to perform, an audit of the Trust’s internal control over financial reporting. As part of our audits, we are required to obtain an understanding of internal control over financial reporting, but not for the purpose of expressing an opinion on the effectiveness of the Trust’s internal control over financial reporting. Accordingly, we express no such opinion.
Our audits included performing procedures to assess the risks of material misstatement of the financial statements, whether due to error or fraud, and performing procedures that respond to those risks. Such procedures included examining, on a test basis, evidence regarding the amounts and disclosures in the financial statements. Our procedures included confirmation of securities owned as of October 31, 2019, by correspondence with the custodian and brokers or by other appropriate auditing procedures where replies from brokers were not received. Our audits also included evaluating the accounting principles used and significant estimates made by management, as well as evaluating the overall presentation of the financial statements. We believe that our audits provide a reasonable basis for our opinion.

We have served as the auditor of one or more American Beacon investment companies since 1987.
Dallas, Texas
December 30, 2019
8
American Beacon Small Cap Value FundSM
Schedule of Investments
October 31, 2019
| Shares | Fair Value | ||||||||||||||
| COMMON STOCKS - 96.49% | |||||||||||||||
| Communication Services - 2.07% | |||||||||||||||
| Entertainment - 0.14% | |||||||||||||||
| IMAX Corp.A | 410,584 | $ | 8,765,968 | ||||||||||||
|
| ||||||||||||||
| Media - 1.93% | |||||||||||||||
| AMC Networks, Inc., Class AA | 126,981 | 5,530,023 | |||||||||||||
| Emerald Expositions Events, Inc. | 80,092 | 778,494 | |||||||||||||
| Entravision Communications Corp., Class A | 272,576 | 774,116 | |||||||||||||
| EW Scripps Co., Class A | 63,919 | 858,752 | |||||||||||||
| Gannett Co., Inc. | 303,388 | 3,291,760 | |||||||||||||
| Gray Television, Inc.A | 1,244,556 | 20,423,164 | |||||||||||||
| John Wiley & Sons, Inc., Class A | 137,610 | 6,339,693 | |||||||||||||
| Liberty Latin America Ltd., Class CA | 144,525 | 2,660,705 | |||||||||||||
| MDC Partners, Inc., Class AA | 1,749,072 | 5,474,595 | |||||||||||||
| Meredith Corp. | 210,959 | 7,953,154 | |||||||||||||
| MSG Networks, Inc., Class AA | 538,119 | 8,722,909 | |||||||||||||
| New Media Investment Group, Inc.B | 288,258 | 2,539,553 | |||||||||||||
| Nexstar Media Group, Inc., Class A | 120,325 | 11,706,419 | |||||||||||||
| Scholastic Corp. | 308,791 | 11,888,453 | |||||||||||||
| TEGNA, Inc. | 1,996,092 | 30,001,263 | |||||||||||||
| WideOpenWest, Inc.A | 115,069 | 730,688 | |||||||||||||
|
| ||||||||||||||
| 119,673,741 | |||||||||||||||
|
| ||||||||||||||
Total Communication Services | 128,439,709 | ||||||||||||||
|
| ||||||||||||||
| Consumer Discretionary - 12.57% | |||||||||||||||
| Auto Components - 1.89% | |||||||||||||||
| Adient PLC | 1,454,292 | 30,816,447 | |||||||||||||
| American Axle & Manufacturing Holdings, Inc.A | 3,289,883 | 27,503,422 | |||||||||||||
| Cooper Tire & Rubber Co. | 378,145 | 10,678,815 | |||||||||||||
| Cooper-Standard Holdings, Inc.A | 45,152 | 1,438,543 | |||||||||||||
| Dana, Inc. | 383,253 | 6,220,196 | |||||||||||||
| Delphi Technologies PLC | 137,299 | 1,676,421 | |||||||||||||
| Dorman Products, Inc.A | 86,490 | 6,222,955 | |||||||||||||
| Gentherm, Inc.A | 250,682 | 10,470,987 | |||||||||||||
| Goodyear Tire & Rubber Co. | 122,300 | 1,940,901 | |||||||||||||
| Modine Manufacturing Co.A | 156,297 | 1,786,475 | |||||||||||||
| Motorcar Parts of America, Inc.A | 79,425 | 1,513,841 | |||||||||||||
| Stoneridge, Inc.A | 278,155 | 8,589,426 | |||||||||||||
| Visteon Corp.A | 89,727 | 8,346,406 | |||||||||||||
|
| ||||||||||||||
| 117,204,835 | |||||||||||||||
|
| ||||||||||||||
| Automobiles - 0.36% | |||||||||||||||
| Thor Industries, Inc.B | 30,694 | 1,941,702 | |||||||||||||
| Winnebago Industries, Inc. | 430,910 | 20,713,844 | |||||||||||||
|
| ||||||||||||||
| 22,655,546 | |||||||||||||||
|
| ||||||||||||||
| Diversified Consumer Services - 0.50% | |||||||||||||||
| Adtalem Global Education, Inc.A | 326,864 | 9,734,010 | |||||||||||||
| American Public Education, Inc.A | 38,661 | 839,717 | |||||||||||||
| Graham Holdings Co., Class B | 11,623 | 7,318,538 | |||||||||||||
| H&R Block, Inc.B | 495,992 | 12,394,840 | |||||||||||||
| WW International, Inc. | 13,294 | 463,562 | |||||||||||||
|
| ||||||||||||||
| 30,750,667 | |||||||||||||||
|
| ||||||||||||||
| Hotels, Restaurants & Leisure - 1.24% | |||||||||||||||
| BJ’s Restaurants, Inc. | 172,445 | 6,827,098 | |||||||||||||
| Bloomin’ Brands, Inc. | 666,066 | 13,194,767 | |||||||||||||
See accompanying notes
9
American Beacon Small Cap Value FundSM
Schedule of Investments
October 31, 2019
| Shares | Fair Value | ||||||||||||||
| COMMON STOCKS - 96.49% (continued) | |||||||||||||||
| Consumer Discretionary - 12.57% (continued) | |||||||||||||||
| Hotels, Restaurants & Leisure - 1.24% (continued) | |||||||||||||||
| Brinker International, Inc.B | 129,384 | $ | 5,751,119 | ||||||||||||
| Cheesecake Factory, Inc.B | 380,779 | 15,912,754 | |||||||||||||
| Dave & Buster’s Entertainment, Inc.B | 177,322 | 7,053,869 | |||||||||||||
| Hilton Grand Vacations, Inc.A | 270,212 | 9,384,463 | |||||||||||||
| Ruth’s Hospitality Group, Inc. | 198,207 | 4,079,100 | |||||||||||||
| Twin River Worldwide Holdings, Inc.B | 49,600 | 1,244,960 | |||||||||||||
| Wyndham Destinations, Inc. | 286,894 | 13,314,751 | |||||||||||||
|
| ||||||||||||||
| 76,762,881 | |||||||||||||||
|
| ||||||||||||||
| Household Durables - 2.99% | |||||||||||||||
| Beazer Homes USA, Inc.A | 42,262 | 634,353 | |||||||||||||
| Cavco Industries, Inc.A | 64,858 | 12,430,036 | |||||||||||||
| Century Communities, Inc.A | 122,533 | 3,696,821 | |||||||||||||
| Ethan Allen Interiors, Inc. | 211,476 | 4,168,192 | |||||||||||||
| Flexsteel Industries, Inc. | 26,762 | 443,446 | |||||||||||||
| GoPro, Inc., Class AA B | 149,996 | 623,983 | |||||||||||||
| Green Brick Partners, Inc.A | 40,301 | 405,831 | |||||||||||||
| Helen of Troy Ltd.A | 74,543 | 11,163,560 | |||||||||||||
| Hooker Furniture Corp. | 59,847 | 1,416,578 | |||||||||||||
| KB Home | 535,815 | 19,123,237 | |||||||||||||
| LGI Homes, Inc.A B | 60,564 | 4,753,063 | |||||||||||||
| Lifetime Brands, Inc. | 21,174 | 169,180 | |||||||||||||
| M/I Homes, Inc.A | 256,970 | 11,352,935 | |||||||||||||
| MDC Holdings, Inc. | 357,674 | 13,845,561 | |||||||||||||
| Meritage Homes Corp.A | 124,772 | 8,994,813 | |||||||||||||
| Taylor Morrison Home Corp.A | 692,631 | 17,350,407 | |||||||||||||
| Toll Brothers, Inc. | 364,554 | 14,498,313 | |||||||||||||
| TRI Pointe Group, Inc.A | 918,148 | 14,451,649 | |||||||||||||
| Tupperware Brands Corp. | 245,469 | 2,363,866 | |||||||||||||
| Whirlpool Corp. | 251,886 | 38,316,898 | |||||||||||||
| William Lyon Homes, Class AA | 148,132 | 2,866,354 | |||||||||||||
| ZAGG, Inc.A B | 275,962 | 2,033,840 | |||||||||||||
|
| ||||||||||||||
| 185,102,916 | |||||||||||||||
|
| ||||||||||||||
| Internet & Direct Marketing Retail - 0.03% | |||||||||||||||
| Groupon, Inc.A | 205,596 | 571,557 | |||||||||||||
| Lands’ End, Inc.A B | 45,043 | 543,669 | |||||||||||||
| PetMed Express, Inc.B | 45,762 | 1,071,517 | |||||||||||||
|
| ||||||||||||||
| 2,186,743 | |||||||||||||||
|
| ||||||||||||||
| Leisure Products - 0.41% | |||||||||||||||
| American Outdoor Brands Corp.A | 307,482 | 2,176,973 | |||||||||||||
| Brunswick Corp. | 228,986 | 13,336,145 | |||||||||||||
| Johnson Outdoors, Inc., Class A | 14,459 | 846,574 | |||||||||||||
| Malibu Boats, Inc., Class AA | 248,323 | 8,100,296 | |||||||||||||
| Nautilus, Inc.A | 442,744 | 730,528 | |||||||||||||
|
| ||||||||||||||
| 25,190,516 | |||||||||||||||
|
| ||||||||||||||
| Multiline Retail - 0.28% | |||||||||||||||
| Big Lots, Inc.B | 111,361 | 2,413,193 | |||||||||||||
| Dillard’s, Inc., Class AB | 215,135 | 14,840,012 | |||||||||||||
|
| ||||||||||||||
| 17,253,205 | |||||||||||||||
|
| ||||||||||||||
| Specialty Retail - 3.94% | |||||||||||||||
| Aaron’s, Inc. | 248,106 | 18,590,583 | |||||||||||||
| Abercrombie & Fitch Co., Class A | 537,204 | 8,697,333 | |||||||||||||
| Asbury Automotive Group, Inc.A | 65,379 | 6,742,536 | |||||||||||||
See accompanying notes
10
American Beacon Small Cap Value FundSM
Schedule of Investments
October 31, 2019
| Shares | Fair Value | ||||||||||||||
| COMMON STOCKS - 96.49% (continued) | |||||||||||||||
| Consumer Discretionary - 12.57% (continued) | |||||||||||||||
| Specialty Retail - 3.94% (continued) | |||||||||||||||
| AutoNation, Inc.A | 273,564 | $ | 13,910,729 | ||||||||||||
| Barnes & Noble Education, Inc.A | 293,209 | 1,205,089 | |||||||||||||
| Bed Bath & Beyond, Inc.B | 478,961 | 6,561,766 | |||||||||||||
| Buckle, Inc.B | 155,778 | 3,258,876 | |||||||||||||
| Caleres, Inc. | 26,827 | 577,317 | |||||||||||||
| Camping World Holdings, Inc., Class AB | 100,637 | 951,020 | |||||||||||||
| Children’s Place, Inc.B | 113,441 | 9,291,952 | |||||||||||||
| Citi Trends, Inc. | 35,118 | 626,856 | |||||||||||||
| Designer Brands, Inc., Class A | 92,387 | 1,524,386 | |||||||||||||
| Dick’s Sporting Goods, Inc.B | 502,803 | 19,574,121 | |||||||||||||
| Foot Locker, Inc. | 236,400 | 10,285,764 | |||||||||||||
| Genesco, Inc.A | 123,452 | 4,796,110 | |||||||||||||
| Group 1 Automotive, Inc. | 310,825 | 30,908,438 | |||||||||||||
| Guess?, Inc.B | 425,058 | 7,119,722 | |||||||||||||
| Haverty Furniture Cos, Inc. | 44,191 | 801,625 | |||||||||||||
| Hibbett Sports, Inc.A | 56,492 | 1,347,899 | |||||||||||||
| Lithia Motors, Inc., Class A | 57,882 | 9,115,257 | |||||||||||||
| Lumber Liquidators Holdings, Inc.A B | 56,719 | 523,516 | |||||||||||||
| MarineMax, Inc.A | 32,160 | 496,872 | |||||||||||||
| Office Depot, Inc. | 11,447,654 | 23,582,167 | |||||||||||||
| Party City Holdco, Inc.A B | 66,255 | 372,353 | |||||||||||||
| Penske Automotive Group, Inc. | 255,999 | 12,472,271 | |||||||||||||
| Sally Beauty Holdings, Inc.A B | 209,513 | 3,247,452 | |||||||||||||
| Sonic Automotive, Inc., Class A | 702,108 | 22,628,941 | |||||||||||||
| Sportsman’s Warehouse Holdings, Inc.A | 79,620 | 542,212 | |||||||||||||
| Urban Outfitters, Inc.A B | 450,972 | 12,942,896 | |||||||||||||
| Williams-Sonoma, Inc.B | 163,128 | 10,895,319 | |||||||||||||
| Zumiez, Inc.A | 13,541 | 432,093 | |||||||||||||
|
| ||||||||||||||
| 244,023,471 | |||||||||||||||
|
| ||||||||||||||
| Textiles, Apparel & Luxury Goods - 0.93% | |||||||||||||||
| G-III Apparel Group Ltd.A | 591,611 | 14,855,352 | |||||||||||||
| Hanesbrands, Inc. | 962,900 | 14,645,709 | |||||||||||||
| Movado Group, Inc. | 243,906 | 6,353,751 | |||||||||||||
| Oxford Industries, Inc. | 127,933 | 8,809,466 | |||||||||||||
| Unifi, Inc.A | 20,918 | 571,062 | |||||||||||||
| Vera Bradley, Inc.A | 180,930 | 1,946,807 | |||||||||||||
| Wolverine World Wide, Inc. | 355,737 | 10,558,274 | |||||||||||||
|
| ||||||||||||||
| 57,740,421 | |||||||||||||||
|
| ||||||||||||||
Total Consumer Discretionary | 778,871,201 | ||||||||||||||
|
| ||||||||||||||
| Consumer Staples - 1.74% | |||||||||||||||
| Food & Staples Retailing - 0.37% | |||||||||||||||
| Andersons, Inc. | 100,932 | 1,859,167 | |||||||||||||
| Ingles Markets, Inc., Class A | 37,700 | 1,486,511 | |||||||||||||
| Performance Food Group Co.A | 318,534 | 13,572,734 | |||||||||||||
| SpartanNash Co. | 189,556 | 2,482,236 | |||||||||||||
| Village Super Market, Inc., Class A | 33,132 | 877,998 | |||||||||||||
| Weis Markets, Inc. | 70,878 | 2,728,094 | |||||||||||||
|
| ||||||||||||||
| 23,006,740 | |||||||||||||||
|
| ||||||||||||||
| Food Products - 1.07% | |||||||||||||||
| Darling Ingredients, Inc.A | 1,500,686 | 28,963,240 | |||||||||||||
| Flowers Foods, Inc. | 368,002 | 7,993,003 | |||||||||||||
| Fresh Del Monte Produce, Inc. | 418,645 | 13,354,776 | |||||||||||||
See accompanying notes
11
American Beacon Small Cap Value FundSM
Schedule of Investments
October 31, 2019
| Shares | Fair Value | ||||||||||||||
| COMMON STOCKS - 96.49% (continued) | |||||||||||||||
| Consumer Staples - 1.74% (continued) | |||||||||||||||
| Food Products - 1.07% (continued) | |||||||||||||||
| Hain Celestial Group, Inc.A B | 434,219 | $ | 10,264,937 | ||||||||||||
| SunOpta, Inc.A B | 2,995,678 | 5,721,745 | |||||||||||||
|
| ||||||||||||||
| 66,297,701 | |||||||||||||||
|
| ||||||||||||||
| Household Products - 0.10% | |||||||||||||||
| Energizer Holdings, Inc.B | 144,531 | 6,141,122 | |||||||||||||
|
| ||||||||||||||
| Metals & Mining - 0.00% | |||||||||||||||
| Ferroglobe Representation & Warranty InsuranceC D | 2,123,070 | - | |||||||||||||
|
| ||||||||||||||
| Personal Products - 0.11% | |||||||||||||||
| Edgewell Personal Care Co.A | 96,958 | 3,393,530 | |||||||||||||
| Nu Skin Enterprises, Inc., Class A | 40,600 | 1,809,948 | |||||||||||||
| USANA Health Sciences, Inc.A | 24,700 | 1,830,517 | |||||||||||||
|
| ||||||||||||||
| 7,033,995 | |||||||||||||||
|
| ||||||||||||||
| Tobacco - 0.09% | |||||||||||||||
| Universal Corp. | 97,084 | 5,320,203 | |||||||||||||
|
| ||||||||||||||
Total Consumer Staples | 107,799,761 | ||||||||||||||
|
| ||||||||||||||
| Energy - 4.22% | |||||||||||||||
| Energy Equipment & Services - 1.66% | |||||||||||||||
| Apergy Corp.A | 322,443 | 8,115,890 | |||||||||||||
| Archrock, Inc. | 577,990 | 5,571,824 | |||||||||||||
| Cactus, Inc., Class AA | 290,564 | 8,635,562 | |||||||||||||
| Dril-Quip, Inc.A | 152,217 | 6,243,941 | |||||||||||||
| Frank’s International N.V.A | 5,023,124 | 24,613,308 | |||||||||||||
| FTS International, Inc.A | 153,534 | 233,372 | |||||||||||||
| Helix Energy Solutions Group, Inc.A | 397,404 | 3,413,700 | |||||||||||||
| Key Energy Services, Inc.A B | 301,510 | 359,792 | |||||||||||||
| Liberty Oilfield Services, Inc., Class AB | 113,879 | 1,048,826 | |||||||||||||
| Mammoth Energy Services, Inc. | 254,646 | 407,434 | |||||||||||||
| Matrix Service Co.A | 51,116 | 958,936 | |||||||||||||
| McDermott International, Inc.A B | 362,934 | 591,582 | |||||||||||||
| National Energy Services Reunited Corp.A | 67,291 | 464,981 | |||||||||||||
| Newpark Resources, Inc.A | 1,973,219 | 11,839,314 | |||||||||||||
| NexTier Oilfield Solutions, Inc.A | 1,967,711 | 8,500,514 | |||||||||||||
| Nine Energy Service, Inc.A B | 367,425 | 2,075,951 | |||||||||||||
| Oceaneering International, Inc.A | 263,500 | 3,731,160 | |||||||||||||
| Patterson-UTI Energy, Inc. | 954,287 | 7,939,668 | |||||||||||||
| ProPetro Holding Corp.A | 145,426 | 1,127,051 | |||||||||||||
| Quintana Energy Services, Inc.A | 290,256 | 484,728 | |||||||||||||
| RPC, Inc.B | 103,250 | 427,455 | |||||||||||||
| SEACOR Holdings, Inc.A | 53,432 | 2,292,767 | |||||||||||||
| Select Energy Services, Inc., Class AA | 213,500 | 1,622,600 | |||||||||||||
| Solaris Oilfield Infrastructure, Inc., Class A | 173,207 | 1,842,922 | |||||||||||||
|
| ||||||||||||||
| 102,543,278 | |||||||||||||||
|
| ||||||||||||||
| Oil, Gas & Consumable Fuels - 2.56% | |||||||||||||||
| Altus Midstream Co., Class AA B | 1,425,176 | 3,135,387 | |||||||||||||
| Amplify Energy Corp. | 66,805 | 484,336 | |||||||||||||
| Antero Resources Corp.A B | 291,200 | 728,000 | |||||||||||||
| Arch Coal, Inc., Class AB | 102,294 | 8,069,974 | |||||||||||||
| Berry Petroleum Corp. | 552,813 | 5,190,914 | |||||||||||||
| Bonanza Creek Energy, Inc.A | 343,432 | 6,119,958 | |||||||||||||
| Callon Petroleum Co.A B | 3,925,972 | 14,918,694 | |||||||||||||
| Carrizo Oil & Gas, Inc.A B | 1,121,060 | 8,251,002 | |||||||||||||
| CNX Midstream Partners LP, MLP | 61,800 | 947,394 | |||||||||||||
| CONSOL Energy, Inc.A | 17,937 | 237,306 | |||||||||||||
See accompanying notes
12
American Beacon Small Cap Value FundSM
Schedule of Investments
October 31, 2019
| Shares | Fair Value | ||||||||||||||
| COMMON STOCKS - 96.49% (continued) | |||||||||||||||
| Energy - 4.22% (continued) | |||||||||||||||
| Oil, Gas & Consumable Fuels - 2.56% (continued) | |||||||||||||||
| Contura Energy, Inc.A | 60,561 | $ | 1,389,269 | ||||||||||||
| Delek US Holdings, Inc. | 222,912 | 8,905,334 | |||||||||||||
| Diamond S Shipping Inc.A | 35,284 | 515,146 | |||||||||||||
| Earthstone Energy, Inc., Class AA | 369,337 | 1,433,028 | |||||||||||||
| Enerplus Corp. | 474,054 | 2,858,546 | |||||||||||||
| Falcon Minerals Corp.B | 97,032 | 597,717 | |||||||||||||
| Gran Tierra Energy, Inc.A B | 2,072,611 | 2,238,420 | |||||||||||||
| Hess Midstream Partners LP | 130,437 | 2,779,612 | |||||||||||||
| Hoegh LNG Partners LP | 25,391 | 378,326 | |||||||||||||
| Kosmos Energy Ltd. | 2,583,108 | 16,015,270 | |||||||||||||
| Murphy Oil Corp. | 97,031 | 2,001,749 | |||||||||||||
| Noble Midstream Partners LP, MLP | 33,921 | 818,174 | |||||||||||||
| Oasis Midstream Partners LP, MLP | 44,978 | 775,421 | |||||||||||||
| Oasis Petroleum, Inc.A | 641,244 | 1,673,647 | |||||||||||||
| Par Pacific Holdings, Inc.A | 36,839 | 834,403 | |||||||||||||
| PBF Energy, Inc., Class A | 86,076 | 2,778,533 | |||||||||||||
| PDC Energy, Inc.A | 289,636 | 5,778,238 | |||||||||||||
| Peabody Energy Corp. | 125,883 | 1,325,548 | |||||||||||||
| Penn Virginia Corp.A | 145,812 | 3,470,326 | |||||||||||||
| QEP Resources, Inc. | 478,769 | 1,594,301 | |||||||||||||
| Range Resources Corp.B | 1,298,800 | 5,234,164 | |||||||||||||
| Renewable Energy Group, Inc.A B | 54,412 | 889,092 | |||||||||||||
| REX American Resources Corp.A | 16,401 | 1,327,169 | |||||||||||||
| SRC Energy, Inc.A | 1,648,438 | 5,143,127 | |||||||||||||
| Talos Energy, Inc.A | 225,257 | 4,849,783 | |||||||||||||
| W&T Offshore, Inc.A | 1,163,186 | 4,687,640 | |||||||||||||
| Whiting Petroleum Corp.A B | 700,854 | 4,443,414 | |||||||||||||
| World Fuel Services Corp. | 355,419 | 14,845,852 | |||||||||||||
| WPX Energy, Inc.A | 1,124,900 | 11,226,502 | |||||||||||||
|
| ||||||||||||||
| 158,890,716 | |||||||||||||||
|
| ||||||||||||||
Total Energy | 261,433,994 | ||||||||||||||
|
| ||||||||||||||
| Financials - 27.09% | |||||||||||||||
| Banks - 15.25% | |||||||||||||||
| 1st Source Corp. | 19,656 | 1,005,994 | |||||||||||||
| Amalgamated Bank, Class A | 58,334 | 1,062,262 | |||||||||||||
| Ameris Bancorp | 71,720 | 3,073,202 | |||||||||||||
| Associated Banc-Corp | 1,471,395 | 29,589,753 | |||||||||||||
| Atlantic Union Bankshares Corp. | 365,486 | 13,471,814 | |||||||||||||
| Banc of California, Inc. | 112,278 | 1,546,068 | |||||||||||||
| Bancorp, Inc.A | 159,350 | 1,736,915 | |||||||||||||
| BancorpSouth Bank | 162,769 | 4,992,125 | |||||||||||||
| Bank of NT Butterfield & Son Ltd. | 973,033 | 32,061,437 | |||||||||||||
| BankUnited, Inc. | 290,078 | 9,949,675 | |||||||||||||
| Banner Corp. | 293,658 | 15,851,659 | |||||||||||||
| Bar Harbor Bankshares | 37,094 | 929,205 | |||||||||||||
| Berkshire Hills Bancorp, Inc. | 592,769 | 18,393,622 | |||||||||||||
| Boston Private Financial Holdings, Inc. | 1,209,896 | 13,611,330 | |||||||||||||
| Bridge Bancorp, Inc. | 31,190 | 1,010,556 | |||||||||||||
| Brookline Bancorp, Inc. | 213,631 | 3,354,007 | |||||||||||||
| Bryn Mawr Bank Corp. | 141,653 | 5,398,396 | |||||||||||||
| Cadence BanCorpB | 350,340 | 5,388,229 | |||||||||||||
| Camden National Corp. | 19,774 | 876,186 | |||||||||||||
| Carolina Financial Corp. | 166,497 | 6,318,561 | |||||||||||||
| Cathay General Bancorp | 496,830 | 17,672,243 | |||||||||||||
See accompanying notes
13
American Beacon Small Cap Value FundSM
Schedule of Investments
October 31, 2019
| Shares | Fair Value | ||||||||||||||
| COMMON STOCKS - 96.49% (continued) | |||||||||||||||
| Financials - 27.09% (continued) | |||||||||||||||
| Banks - 15.25% (continued) | |||||||||||||||
| CenterState Bank Corp. | 350,933 | $ | 8,899,661 | ||||||||||||
| Central Pacific Financial Corp. | 261,098 | 7,550,954 | |||||||||||||
| CIT Group, Inc. | 139,312 | 5,975,092 | |||||||||||||
| City Holding Co. | 12,548 | 995,558 | |||||||||||||
| Columbia Banking System, Inc. | 101,111 | 3,973,662 | |||||||||||||
| Community Trust Bancorp, Inc. | 32,573 | 1,427,023 | |||||||||||||
| ConnectOne Bancorp, Inc. | 59,892 | 1,454,178 | |||||||||||||
| Customers Bancorp, Inc.A | 83,881 | 1,977,914 | |||||||||||||
| CVB Financial Corp. | 173,800 | 3,611,564 | |||||||||||||
| Eagle Bancorp, Inc. | 22,498 | 1,015,560 | |||||||||||||
| Enterprise Financial Services Corp. | 51,694 | 2,264,197 | |||||||||||||
| Equity Bancshares, Inc., Class AA | 49,400 | 1,371,344 | |||||||||||||
| Financial Institutions, Inc. | 39,388 | 1,237,965 | |||||||||||||
| First BanCorp/Puerto Rico | 175,651 | 1,847,849 | |||||||||||||
| First Bancorp/NC | 24,800 | 936,200 | |||||||||||||
| First Business Financial Services, Inc. | 21,559 | 524,315 | |||||||||||||
| First Citizens BancShares, Inc., Class A | 11,841 | 5,824,825 | |||||||||||||
| First Commonwealth Financial Corp. | 195,897 | 2,760,189 | |||||||||||||
| First Financial Bancorp | 55,689 | 1,305,350 | |||||||||||||
| First Financial Corp. | 85,021 | 3,729,871 | |||||||||||||
| First Hawaiian, Inc. | 1,389,147 | 37,965,388 | |||||||||||||
| First Horizon National Corp. | 1,380,806 | 22,051,472 | |||||||||||||
| First Internet Bancorp | 38,952 | 885,768 | |||||||||||||
| First Interstate BancSystem, Inc., Class A | 236,515 | 9,924,169 | |||||||||||||
| First Merchants Corp. | 63,801 | 2,523,330 | |||||||||||||
| First Mid Bancshares, Inc. | 12,252 | 427,595 | |||||||||||||
| First Midwest Bancorp, Inc. | 1,081,430 | 22,212,572 | |||||||||||||
| First of Long Island Corp. | 61,000 | 1,429,840 | |||||||||||||
| Flushing Financial Corp. | 95,082 | 2,057,574 | |||||||||||||
| FNB Corp. | 1,347,843 | 16,254,987 | |||||||||||||
| Franklin Financial Network, Inc. | 58,947 | 1,961,167 | |||||||||||||
| Fulton Financial Corp. | 1,778,190 | 30,335,921 | |||||||||||||
| Great Southern Bancorp, Inc. | 29,538 | 1,784,686 | |||||||||||||
| Great Western Bancorp, Inc. | 191,400 | 6,674,118 | |||||||||||||
| Hancock Whitney Corp. | 965,862 | 37,668,618 | |||||||||||||
| Hanmi Financial Corp. | 91,853 | 1,768,170 | |||||||||||||
| Heartland Financial USA, Inc. | 42,433 | 1,985,016 | |||||||||||||
| Heritage Commerce Corp. | 149,907 | 1,801,882 | |||||||||||||
| Heritage Financial Corp. | 36,208 | 996,806 | |||||||||||||
| Hilltop Holdings, Inc. | 147,125 | 3,436,840 | |||||||||||||
| Home BancShares, Inc. | 187,635 | 3,467,495 | |||||||||||||
| HomeTrust Bancshares, Inc. | 16,893 | 451,043 | |||||||||||||
| Hope Bancorp, Inc. | 621,145 | 8,863,739 | |||||||||||||
| Horizon Bancorp, Inc. | 124,862 | 2,279,356 | |||||||||||||
| IBERIABANK Corp. | 253,866 | 18,631,226 | |||||||||||||
| International Bancshares Corp. | 498,573 | 20,421,550 | |||||||||||||
| Investors Bancorp, Inc. | 986,343 | 11,885,433 | |||||||||||||
| Lakeland Bancorp, Inc. | 113,586 | 1,879,848 | |||||||||||||
| Live Oak Bancshares, Inc. | 89,877 | 1,631,268 | |||||||||||||
| Metropolitan Bank Holding Corp.A | 10,200 | 437,988 | |||||||||||||
| Midland States Bancorp, Inc. | 61,970 | 1,660,796 | |||||||||||||
| MidWestOne Financial Group, Inc. | 15,616 | 509,004 | |||||||||||||
| National Bank Holdings Corp., Class A | 488,498 | 16,804,331 | |||||||||||||
| Northrim BanCorp, Inc. | 12,286 | 478,540 | |||||||||||||
| OFG Bancorp | 237,570 | 4,825,047 | |||||||||||||
| Old National Bancorp | 1,941,390 | 34,935,313 | |||||||||||||
See accompanying notes
14
American Beacon Small Cap Value FundSM
Schedule of Investments
October 31, 2019
| Shares | Fair Value | ||||||||||||||
| COMMON STOCKS - 96.49% (continued) | |||||||||||||||
| Financials - 27.09% (continued) | |||||||||||||||
| Banks - 15.25% (continued) | |||||||||||||||
| Opus Bank | 40,460 | $ | 1,003,003 | ||||||||||||
| Orrstown Financial Services, Inc. | 19,116 | 414,626 | |||||||||||||
| Pacific Premier Bancorp, Inc. | 27,420 | 925,562 | |||||||||||||
| Park National Corp. | 4,714 | 477,293 | |||||||||||||
| Peapack Gladstone Financial Corp. | �� | 63,422 | 1,851,922 | ||||||||||||
| Pinnacle Financial Partners, Inc. | 64,495 | 3,793,596 | |||||||||||||
| Popular, Inc. | 729,355 | 39,720,673 | |||||||||||||
| Preferred Bank | 18,411 | 981,490 | |||||||||||||
| Prosperity Bancshares, Inc.B | 570,914 | 39,404,484 | |||||||||||||
| RBB Bancorp | 23,627 | 475,848 | |||||||||||||
| Renasant Corp. | 117,355 | 4,072,218 | |||||||||||||
| Republic Bancorp, Inc., Class A | 48,475 | 2,155,683 | |||||||||||||
| S&T Bancorp, Inc. | 61,389 | 2,311,603 | |||||||||||||
| Sandy Spring Bancorp, Inc. | 52,285 | 1,803,832 | |||||||||||||
| Seacoast Banking Corp. of FloridaA | 733,393 | 20,535,004 | |||||||||||||
| Simmons First National Corp., Class A | 235,001 | 5,621,224 | |||||||||||||
| South State Corp. | 213,822 | 16,862,003 | |||||||||||||
| Southern National Bancorp of Virginia, Inc. | 59,545 | 943,193 | |||||||||||||
| Sterling Bancorp | 267,760 | 5,261,484 | |||||||||||||
| TCF Financial Corp. | 523,203 | 20,713,607 | |||||||||||||
| Texas Capital Bancshares, Inc.A | 589,657 | 31,876,857 | |||||||||||||
| Towne Bank | 102,664 | 2,883,832 | |||||||||||||
| TriCo Bancshares | 23,420 | 881,295 | |||||||||||||
| Triumph Bancorp, Inc.A | 165,439 | 5,368,496 | |||||||||||||
| Trustmark Corp. | 198,644 | 6,817,462 | |||||||||||||
| UMB Financial Corp. | 405,072 | 26,434,999 | |||||||||||||
| Umpqua Holdings Corp. | 1,690,268 | 26,740,040 | |||||||||||||
| United Bankshares, Inc. | 184,733 | 7,304,343 | |||||||||||||
| United Community Banks, Inc. | 431,470 | 13,034,709 | |||||||||||||
| Univest Financial Corp. | 19,052 | 490,589 | |||||||||||||
| Valley National Bancorp | 1,523,178 | 17,638,401 | |||||||||||||
| Veritex Holdings, Inc. | 368,048 | 9,061,342 | |||||||||||||
| Webster Financial Corp. | 499,472 | 22,026,715 | |||||||||||||
| WesBanco, Inc. | 297,752 | 11,192,498 | |||||||||||||
| West Bancorp, Inc. | 20,220 | 474,766 | |||||||||||||
| Westamerica Bancorp | 19,168 | 1,265,471 | |||||||||||||
| Wintrust Financial Corp. | 205,343 | 13,104,990 | |||||||||||||
|
| ||||||||||||||
| 945,209,559 | |||||||||||||||
|
| ||||||||||||||
| Capital Markets - 2.96% | |||||||||||||||
| AllianceBernstein Holding LP, MLP | 512,246 | 15,039,543 | |||||||||||||
| Artisan Partners Asset Management, Inc., Class A | 290,276 | 7,939,049 | |||||||||||||
| Blucora, Inc.A | 533,037 | 11,529,590 | |||||||||||||
| BrightSphere Investment Group, Inc.A | 438,692 | 4,307,955 | |||||||||||||
| Cowen, Inc., Class AA | 116,156 | 1,738,855 | |||||||||||||
| Donnelley Financial Solutions, Inc.A | 300,846 | 3,399,560 | |||||||||||||
| Evercore, Inc., Class A | 486,377 | 35,816,802 | |||||||||||||
| Federated Investors, Inc., Class B | 359,615 | 11,486,103 | |||||||||||||
| GAIN Capital Holdings, Inc.B | 97,286 | 410,547 | |||||||||||||
| GAMCO Investors, Inc., Class A | 24,607 | 387,806 | |||||||||||||
| Greenhill & Co., Inc.B | 98,252 | 1,591,682 | |||||||||||||
| INTL. FCStone, Inc.A | 73,481 | 2,939,240 | |||||||||||||
| Janus Henderson Group PLC | 96,000 | 2,220,480 | |||||||||||||
| Lazard Ltd., Class A | 115,000 | 4,292,950 | |||||||||||||
| Legg Mason, Inc. | 47,946 | 1,786,468 | |||||||||||||
| Moelis & Co., Class A | 106,451 | 3,798,172 | |||||||||||||
See accompanying notes
15
American Beacon Small Cap Value FundSM
Schedule of Investments
October 31, 2019
| Shares | Fair Value | ||||||||||||||
| COMMON STOCKS - 96.49% (continued) | |||||||||||||||
| Financials - 27.09% (continued) | |||||||||||||||
| Capital Markets - 2.96% (continued) | |||||||||||||||
| Oppenheimer Holdings, Inc., Class A | 47,588 | $ | 1,294,394 | ||||||||||||
| Piper Jaffray Cos. | 82,301 | 6,463,920 | |||||||||||||
| Sculptor Capital Management, Inc.B | 49,582 | 890,989 | |||||||||||||
| Stifel Financial Corp. | 715,423 | 40,049,379 | |||||||||||||
| Victory Capital Holdings, Inc., Class A | 87,066 | 1,354,747 | |||||||||||||
| Virtus Investment Partners, Inc. | 17,194 | 1,865,205 | |||||||||||||
| Waddell & Reed Financial, Inc., Class AB | 984,112 | 16,296,895 | |||||||||||||
| Westwood Holdings Group, Inc. | 70,760 | 2,139,075 | |||||||||||||
| WisdomTree Investments, Inc. | 856,845 | 4,378,478 | |||||||||||||
|
| ||||||||||||||
| 183,417,884 | |||||||||||||||
|
| ||||||||||||||
| Consumer Finance - 1.55% | |||||||||||||||
| Encore Capital Group, Inc.A B | 51,449 | 1,707,592 | |||||||||||||
| Enova International, Inc.A | 115,579 | 2,714,951 | |||||||||||||
| EZCORP, Inc., Class AA B | 250,857 | 1,319,508 | |||||||||||||
| Green Dot Corp., Class AA | 89,789 | 2,589,515 | |||||||||||||
| Navient Corp. | 804,159 | 11,073,269 | |||||||||||||
| Nelnet, Inc., Class A | 123,671 | 7,577,322 | |||||||||||||
| OneMain Holdings, Inc. | 358,613 | 14,344,520 | |||||||||||||
| PRA Group, Inc.A | 910,086 | 30,879,218 | |||||||||||||
| SLM Corp. | 2,832,513 | 23,906,410 | |||||||||||||
|
| ||||||||||||||
| 96,112,305 | |||||||||||||||
|
| ||||||||||||||
| Diversified Financial Services - 0.06% | |||||||||||||||
| FGL Holdings | 270,451 | 2,442,173 | |||||||||||||
| Jefferies Financial Group, Inc. | 70,533 | 1,316,851 | |||||||||||||
|
| ||||||||||||||
| 3,759,024 | |||||||||||||||
|
| ||||||||||||||
| Insurance - 4.06% | |||||||||||||||
| Ambac Financial Group, Inc.A | 189,038 | 3,875,279 | |||||||||||||
| American Equity Investment Life Holding Co. | 658,233 | 16,245,190 | |||||||||||||
| Argo Group International Holdings Ltd. | 311,488 | 19,271,763 | |||||||||||||
| Assured Guaranty Ltd. | 279,021 | 13,091,665 | |||||||||||||
| Axis Capital Holdings Ltd. | 220,671 | 13,114,477 | |||||||||||||
| Brighthouse Financial, Inc.A | 97,000 | 3,662,720 | |||||||||||||
| CNO Financial Group, Inc. | 2,366,308 | 37,032,720 | |||||||||||||
| Employers Holdings, Inc. | 117,849 | 4,989,727 | |||||||||||||
| Enstar Group Ltd.A | 271,002 | 54,444,302 | |||||||||||||
| FBL Financial Group, Inc., Class A | 31,102 | 1,784,633 | |||||||||||||
| Global Indemnity Ltd. | 392,528 | 9,718,993 | |||||||||||||
| Greenlight Capital Re Ltd., Class AA | 117,597 | 1,270,048 | |||||||||||||
| Horace Mann Educators Corp. | 306,911 | 13,369,043 | |||||||||||||
| Kemper Corp. | 91,612 | 6,585,071 | |||||||||||||
| MBIA, Inc.A | 360,095 | 3,345,283 | |||||||||||||
| National General Holdings Corp. | 466,113 | 9,937,529 | |||||||||||||
| National Western Life Group, Inc., Class A | 13,706 | 3,736,256 | |||||||||||||
| ProAssurance Corp. | 42,767 | 1,677,322 | |||||||||||||
| Safety Insurance Group, Inc. | 68,052 | 6,614,654 | |||||||||||||
| Selective Insurance Group, Inc. | 139,108 | 9,615,145 | |||||||||||||
| Stewart Information Services Corp. | 31,570 | 1,291,844 | |||||||||||||
| Third Point Reinsurance Ltd.A | 131,897 | 1,251,702 | |||||||||||||
| United Fire Group, Inc. | 62,552 | 2,847,367 | |||||||||||||
| White Mountains Insurance Group Ltd. | 11,870 | 12,712,770 | |||||||||||||
|
| ||||||||||||||
| 251,485,503 | |||||||||||||||
|
| ||||||||||||||
See accompanying notes
16
American Beacon Small Cap Value FundSM
Schedule of Investments
October 31, 2019
| Shares | Fair Value | ||||||||||||||
| COMMON STOCKS - 96.49% (continued) | |||||||||||||||
| Financials - 27.09% (continued) | |||||||||||||||
| Mortgage Real Estate Investment Trusts (REITs) - 0.34% | |||||||||||||||
| Apollo Commercial Real Estate Finance, Inc. | 528,347 | $ | 9,668,750 | ||||||||||||
| Colony Credit Real Estate, Inc. | 128,856 | 1,846,507 | |||||||||||||
| Ellington Financial, Inc. | 100,351 | 1,848,465 | |||||||||||||
| Exantas Capital Corp. | 156,891 | 1,845,038 | |||||||||||||
| Great Ajax Corp. | 55,013 | 860,954 | |||||||||||||
| MFA Financial, Inc. | 503,003 | 3,817,793 | |||||||||||||
| Ready Capital Corp. | 80,722 | 1,277,829 | |||||||||||||
|
| ||||||||||||||
| 21,165,336 | |||||||||||||||
|
| ||||||||||||||
| Thrifts & Mortgage Finance - 2.87% | |||||||||||||||
| Axos Financial, Inc.A | 51,642 | 1,500,200 | |||||||||||||
| Capitol Federal Financial, Inc. | 349,997 | 4,994,457 | |||||||||||||
| Dime Community Bancshares, Inc. | 140,215 | 2,704,747 | |||||||||||||
| Essent Group Ltd. | 502,034 | 26,150,951 | |||||||||||||
| First Defiance Financial Corp. | 15,700 | 485,444 | |||||||||||||
| Flagstar Bancorp, Inc. | 152,230 | 5,532,038 | |||||||||||||
| FS Bancorp, Inc. | 9,133 | 522,864 | |||||||||||||
| Hingham Institution for Savings | 4,500 | 854,955 | |||||||||||||
| HomeStreet, Inc.A | 62,643 | 1,879,916 | |||||||||||||
| Kearny Financial Corp. | 240,327 | 3,371,788 | |||||||||||||
| Luther Burbank Corp. | 325,813 | 3,769,656 | |||||||||||||
| Merchants Bancorp | 54,330 | 887,209 | |||||||||||||
| Meridian Bancorp, Inc. | 123,820 | 2,421,919 | |||||||||||||
| MGIC Investment Corp. | 3,344,202 | 45,849,009 | |||||||||||||
| New York Community Bancorp, Inc. | 53,914 | 628,098 | |||||||||||||
| Northfield Bancorp, Inc. | 198,240 | 3,372,062 | |||||||||||||
| Northwest Bancshares, Inc. | 250,011 | 4,217,686 | |||||||||||||
| OceanFirst Financial Corp. | 165,572 | 3,962,138 | |||||||||||||
| Oritani Financial Corp. | 93,948 | 1,753,070 | |||||||||||||
| PennyMac Financial Services, Inc.A | 64,481 | 2,007,294 | |||||||||||||
| Provident Financial Services, Inc. | 124,031 | 3,094,574 | |||||||||||||
| Radian Group, Inc. | 706,940 | 17,744,194 | |||||||||||||
| Southern Missouri Bancorp, Inc. | 12,578 | 457,965 | |||||||||||||
| Sterling Bancorp, Inc. | 89,077 | 863,156 | |||||||||||||
| Territorial Bancorp, Inc. | 15,826 | 467,817 | |||||||||||||
| TFS Financial Corp. | 64,980 | 1,251,515 | |||||||||||||
| TrustCo Bank Corp. | 210,387 | 1,817,744 | |||||||||||||
| United Financial Bancorp, Inc. | 219,307 | 3,096,615 | |||||||||||||
| Walker & Dunlop, Inc. | 82,480 | 5,195,415 | |||||||||||||
| Washington Federal, Inc. | 711,149 | 25,928,493 | |||||||||||||
| Waterstone Financial, Inc. | 52,215 | 972,765 | |||||||||||||
|
| ||||||||||||||
| 177,755,754 | |||||||||||||||
|
| ||||||||||||||
Total Financials | 1,678,905,365 | ||||||||||||||
|
| ||||||||||||||
| Health Care - 2.71% | |||||||||||||||
| Biotechnology - 0.15% | |||||||||||||||
| Emergent BioSolutions, Inc.A | 162,426 | 9,284,270 | |||||||||||||
|
| ||||||||||||||
| Health Care Equipment & Supplies - 0.36% | |||||||||||||||
| Invacare Corp.B | 1,055,934 | 8,151,811 | |||||||||||||
| Natus Medical, Inc.A | 109,838 | 3,699,344 | |||||||||||||
| NuVasive, Inc.A | 152,119 | 10,730,474 | |||||||||||||
|
| ||||||||||||||
| 22,581,629 | |||||||||||||||
|
| ||||||||||||||
| Health Care Providers & Services - 1.79% | |||||||||||||||
| Amedisys, Inc.A | 56,508 | 7,262,408 | |||||||||||||
| AMN Healthcare Services, Inc.A | 431,812 | 25,373,273 | |||||||||||||
See accompanying notes
17
American Beacon Small Cap Value FundSM
Schedule of Investments
October 31, 2019
| Shares | Fair Value | ||||||||||||||
| COMMON STOCKS - 96.49% (continued) | |||||||||||||||
| Health Care - 2.71% (continued) | |||||||||||||||
| Health Care Providers & Services - 1.79% (continued) | |||||||||||||||
| Encompass Health Corp. | 360,929 | $ | 23,106,675 | ||||||||||||
| Hanger, Inc.A | 768,105 | 17,366,854 | |||||||||||||
| LHC Group, Inc.A | 87,305 | 9,688,236 | |||||||||||||
| Magellan Health, Inc.A | 27,934 | 1,812,917 | |||||||||||||
| MEDNAX, Inc.A | 74,200 | 1,629,432 | |||||||||||||
| Patterson Cos., Inc.B | 300,103 | 5,140,764 | |||||||||||||
| R1 RCM, Inc.A | 897,426 | 9,539,638 | |||||||||||||
| Select Medical Holdings Corp.A | 433,117 | 7,891,392 | |||||||||||||
| Tivity Health, Inc.A B | 128,311 | 2,079,921 | |||||||||||||
|
| ||||||||||||||
| 110,891,510 | |||||||||||||||
|
| ||||||||||||||
| Health Care Technology - 0.09% | |||||||||||||||
| Computer Programs & Systems, Inc. | 65,458 | 1,510,116 | |||||||||||||
| NextGen Healthcare, Inc.A | 233,802 | 3,952,423 | |||||||||||||
|
| ||||||||||||||
| 5,462,539 | |||||||||||||||
|
| ||||||||||||||
| Life Sciences Tools & Services - 0.20% | |||||||||||||||
| Medpace Holdings, Inc.A | 165,540 | 12,188,710 | |||||||||||||
�� |
| ||||||||||||||
| Pharmaceuticals - 0.12% | |||||||||||||||
| Prestige Consumer Healthcare, Inc.A | 52,682 | 1,868,104 | |||||||||||||
| Supernus Pharmaceuticals, Inc.A | 143,550 | 3,989,255 | |||||||||||||
| Taro Pharmaceutical Industries Ltd. | 22,598 | 1,826,822 | |||||||||||||
|
| ||||||||||||||
| 7,684,181 | |||||||||||||||
|
| ||||||||||||||
Total Health Care | 168,092,839 | ||||||||||||||
|
| ||||||||||||||
| Industrials - 20.41% | |||||||||||||||
| Aerospace & Defense - 1.01% | |||||||||||||||
| AAR Corp. | 149,167 | 6,227,722 | |||||||||||||
| Aerojet Rocketdyne Holdings, Inc.A | 329,128 | 14,228,203 | |||||||||||||
| AeroVironment, Inc.A | 124,465 | 7,216,481 | |||||||||||||
| Astronics Corp.A | 295,491 | 8,551,509 | |||||||||||||
| Embraer S.A., Sponsored ADR | 1,047,308 | 18,191,740 | |||||||||||||
| Moog, Inc., Class A | 46,084 | 3,857,692 | |||||||||||||
| National Presto Industries, Inc.B | 19,188 | 1,651,895 | |||||||||||||
| Triumph Group, Inc.B | 26,079 | 541,661 | |||||||||||||
| Vectrus, Inc.A | 40,163 | 1,835,851 | |||||||||||||
|
| ||||||||||||||
| 62,302,754 | |||||||||||||||
|
| ||||||||||||||
| Air Freight & Logistics - 0.46% | |||||||||||||||
| Air Transport Services Group, Inc.A | 1,252,796 | 26,195,964 | |||||||||||||
| Hub Group, Inc., Class AA | 55,210 | 2,528,618 | |||||||||||||
|
| ||||||||||||||
| 28,724,582 | |||||||||||||||
|
| ||||||||||||||
| Airlines - 0.60% | |||||||||||||||
| Hawaiian Holdings, Inc. | 161,544 | 4,621,774 | |||||||||||||
| JetBlue Airways Corp.A | 789,050 | 15,228,665 | |||||||||||||
| SkyWest, Inc. | 137,004 | 8,158,588 | |||||||||||||
| Spirit Airlines, Inc.A | 249,387 | 9,366,976 | |||||||||||||
|
| ||||||||||||||
| 37,376,003 | |||||||||||||||
|
| ||||||||||||||
| Building Products - 3.14% | |||||||||||||||
| Advanced Drainage Systems, Inc. | 137,046 | 5,073,443 | |||||||||||||
| Apogee Enterprises, Inc. | 33,612 | 1,261,794 | |||||||||||||
| Armstrong Flooring, Inc.A | 591,570 | 3,632,240 | |||||||||||||
See accompanying notes
18
American Beacon Small Cap Value FundSM
Schedule of Investments
October 31, 2019
| Shares | Fair Value | ||||||||||||||
| COMMON STOCKS - 96.49% (continued) | |||||||||||||||
| Industrials - 20.41% (continued) | |||||||||||||||
| Building Products - 3.14% (continued) | |||||||||||||||
| Builders FirstSource, Inc.A | 789,307 | $ | 17,846,231 | ||||||||||||
| Caesarstone Ltd.B | 102,448 | 1,730,347 | |||||||||||||
| Continental Building Products, Inc.A | 35,400 | 1,058,814 | |||||||||||||
| Gibraltar Industries, Inc.A | 692,401 | 36,856,505 | |||||||||||||
| Insteel Industries, Inc. | 107,243 | 2,045,124 | |||||||||||||
| JELD-WEN Holding, Inc.A | 79,572 | 1,359,885 | |||||||||||||
| Masonite International Corp.A | 378,233 | 23,227,289 | |||||||||||||
| Patrick Industries, Inc.A | 63,600 | 3,142,476 | |||||||||||||
| Resideo Technologies, Inc.A | 1,903,984 | 18,144,968 | |||||||||||||
| Simpson Manufacturing Co., Inc. | 517,759 | 42,787,604 | |||||||||||||
| Universal Forest Products, Inc. | 721,053 | 36,312,229 | |||||||||||||
|
| ||||||||||||||
| 194,478,949 | |||||||||||||||
|
| ||||||||||||||
| Commercial Services & Supplies - 1.98% | |||||||||||||||
| ACCO Brands Corp. | 656,083 | 6,003,159 | |||||||||||||
| Deluxe Corp. | 404,461 | 20,963,214 | |||||||||||||
| Ennis, Inc. | 64,295 | 1,259,539 | |||||||||||||
| Herman Miller, Inc. | 256,716 | 11,937,294 | |||||||||||||
| HNI Corp. | 86,345 | 3,281,110 | |||||||||||||
| Interface, Inc. | 61,680 | 1,025,738 | |||||||||||||
| KAR Auction Services, Inc.B | 338,200 | 8,407,652 | |||||||||||||
| Knoll, Inc. | 973,955 | 26,043,557 | |||||||||||||
| Matthews International Corp., Class A | 206,621 | 7,640,845 | |||||||||||||
| Mobile Mini, Inc. | 739,725 | 27,828,455 | |||||||||||||
| Quad/Graphics, Inc. | 694,831 | 3,147,584 | |||||||||||||
| Steelcase, Inc., Class A | 254,348 | 4,443,460 | |||||||||||||
| Team, Inc.A | 34,833 | 632,567 | |||||||||||||
|
| ||||||||||||||
| 122,614,174 | |||||||||||||||
|
| ||||||||||||||
| Construction & Engineering - 1.80% | |||||||||||||||
| Aegion Corp.A | 222,980 | 4,831,977 | |||||||||||||
| Arcosa, Inc. | 11,700 | 449,397 | |||||||||||||
| Construction Partners, Inc., Class AA | 380,504 | 6,514,228 | |||||||||||||
| EMCOR Group, Inc. | 307,901 | 27,005,997 | |||||||||||||
| Fluor Corp. | 620,300 | 9,993,033 | |||||||||||||
| Granite Construction, Inc. | 253,841 | 5,975,417 | |||||||||||||
| MasTec, Inc.A | 6,678 | 420,313 | |||||||||||||
| MYR Group, Inc.A | 26,150 | 899,822 | |||||||||||||
| Primoris Services Corp. | 1,464,489 | 29,934,155 | |||||||||||||
| Quanta Services, Inc. | 247,973 | 10,427,265 | |||||||||||||
| Tutor Perini Corp.A B | 885,524 | 13,699,056 | |||||||||||||
| Valmont Industries, Inc. | 9,034 | 1,239,374 | |||||||||||||
|
| ||||||||||||||
| 111,390,034 | |||||||||||||||
|
| ||||||||||||||
| Electrical Equipment - 1.46% | |||||||||||||||
| Atkore International Group, Inc.A | 154,173 | 5,349,803 | |||||||||||||
| AZZ, Inc. | 103,017 | 3,996,029 | |||||||||||||
| Encore Wire Corp. | 395,969 | 22,253,458 | |||||||||||||
| EnerSys | 309,744 | 20,709,484 | |||||||||||||
| Generac Holdings, Inc.A | 39,125 | 3,778,693 | |||||||||||||
| GrafTech International Ltd.B | 136,100 | 1,644,088 | |||||||||||||
| Preformed Line Products Co. | 14,297 | 780,616 | |||||||||||||
| Regal Beloit Corp. | 302,909 | 22,430,411 | |||||||||||||
| Thermon Group Holdings, Inc.A | 66,478 | 1,584,171 | |||||||||||||
| TPI Composites, Inc.A B | 373,684 | 7,671,733 | |||||||||||||
|
| ||||||||||||||
| 90,198,486 | |||||||||||||||
|
| ||||||||||||||
See accompanying notes
19
American Beacon Small Cap Value FundSM
Schedule of Investments
October 31, 2019
| Shares | Fair Value | ||||||||||||||
| COMMON STOCKS - 96.49% (continued) | |||||||||||||||
| Industrials - 20.41% (continued) | |||||||||||||||
| Machinery - 6.26% | |||||||||||||||
| Actuant Corp., Class A | 1,106,239 | $ | 27,401,540 | ||||||||||||
| Allison Transmission Holdings, Inc. | 305,300 | 13,314,133 | |||||||||||||
| Astec Industries, Inc. | 263,921 | 9,260,988 | |||||||||||||
| Barnes Group, Inc. | 412,292 | 24,098,467 | |||||||||||||
| Blue Bird Corp.A | 205,636 | 4,018,127 | |||||||||||||
| Colfax Corp.A B | 855,830 | 28,755,888 | |||||||||||||
| Columbus McKinnon Corp. | 57,935 | 2,173,721 | |||||||||||||
| Commercial Vehicle Group, Inc.A | 237,565 | 1,731,849 | |||||||||||||
| Energy Recovery, Inc.A B | 438,982 | 4,086,922 | |||||||||||||
| EnPro Industries, Inc. | 69,230 | 4,814,947 | |||||||||||||
| Federal Signal Corp. | 1,663,086 | 53,950,510 | |||||||||||||
| Gorman-Rupp Co. | 35,773 | 1,321,455 | |||||||||||||
| Graham Corp. | 38,692 | 876,761 | |||||||||||||
| Greenbrier Cos., Inc. | 413,374 | 12,107,724 | |||||||||||||
| Harsco Corp.A | 506,957 | 10,276,018 | |||||||||||||
| Hillenbrand, Inc. | 292,399 | 9,002,965 | |||||||||||||
| Hyster-Yale Materials Handling, Inc. | 53,363 | 2,706,571 | |||||||||||||
| Kennametal, Inc. | 765,620 | 23,695,939 | |||||||||||||
| Lindsay Corp.B | 97,546 | 9,209,318 | |||||||||||||
| Manitowoc Co., Inc.A | 155,651 | 1,986,107 | |||||||||||||
| Meritor, Inc.A | 315,851 | 6,958,198 | |||||||||||||
| Miller Industries, Inc. | 250,683 | 9,012,054 | |||||||||||||
| Mueller Industries, Inc. | 21,684 | 667,217 | |||||||||||||
| Mueller Water Products, Inc., Class A | 86,020 | 1,006,434 | |||||||||||||
| Navistar International Corp.A | 499,630 | 15,628,426 | |||||||||||||
| Oshkosh Corp. | 192,767 | 16,458,447 | |||||||||||||
| Park-Ohio Holdings Corp. | 106,477 | 3,275,233 | |||||||||||||
| REV Group, Inc.B | 111,707 | 1,389,635 | |||||||||||||
| Rexnord Corp.A | 398,928 | 11,285,673 | |||||||||||||
| Spartan Motors, Inc. | 30,400 | 531,088 | |||||||||||||
| Standex International Corp. | 31,357 | 2,376,233 | |||||||||||||
| Terex Corp. | 1,121,133 | 30,887,214 | |||||||||||||
| Timken Co. | 415,152 | 20,342,448 | |||||||||||||
| TriMas Corp.A | 277,168 | 8,958,070 | |||||||||||||
| Trinity Industries, Inc.B | 331,032 | 6,547,813 | |||||||||||||
| Wabash National Corp. | 561,739 | 8,010,398 | |||||||||||||
|
| ||||||||||||||
| 388,124,531 | |||||||||||||||
|
| ||||||||||||||
| Marine - 0.38% | |||||||||||||||
| Matson, Inc. | 615,743 | 23,509,068 | |||||||||||||
|
| ||||||||||||||
| Professional Services - 0.88% | |||||||||||||||
| BG Staffing, Inc. | 40,100 | 767,113 | |||||||||||||
| GP Strategies Corp.A | 74,099 | 822,499 | |||||||||||||
| Hudson Global, Inc.A | 61,058 | 683,850 | |||||||||||||
| Huron Consulting Group, Inc.A | 102,960 | 6,809,774 | |||||||||||||
| InnerWorkings, Inc.A | 400,516 | 1,942,503 | |||||||||||||
| Kelly Services, Inc., Class A | 250,567 | 6,016,114 | |||||||||||||
| Korn Ferry | 376,469 | 13,812,648 | |||||||||||||
| ManpowerGroup, Inc. | 159,352 | 14,488,284 | |||||||||||||
| Mistras Group, Inc.A | 44,303 | 686,696 | |||||||||||||
| Resources Connection, Inc. | 89,687 | 1,313,914 | |||||||||||||
| TrueBlue, Inc.A | 309,317 | 7,083,359 | |||||||||||||
|
| ||||||||||||||
| 54,426,754 | |||||||||||||||
|
| ||||||||||||||
See accompanying notes
20
American Beacon Small Cap Value FundSM
Schedule of Investments
October 31, 2019
| Shares | Fair Value | ||||||||||||||
| COMMON STOCKS - 96.49% (continued) | |||||||||||||||
| Industrials - 20.41% (continued) | |||||||||||||||
| Road & Rail - 0.69% | |||||||||||||||
| ArcBest Corp. | 408,386 | $ | 11,798,272 | ||||||||||||
| Avis Budget Group, Inc.A | 202,292 | 6,010,095 | |||||||||||||
| Covenant Transportation Group, Inc., Class AA | 92,170 | 1,416,653 | |||||||||||||
| Knight-Swift Transportation Holdings, Inc. | 29,690 | 1,082,497 | |||||||||||||
| Landstar System, Inc. | 41,774 | 4,726,728 | |||||||||||||
| Marten Transport Ltd. | 360,570 | 7,809,946 | |||||||||||||
| Ryder System, Inc. | 142,027 | 6,906,773 | |||||||||||||
| Schneider National, Inc., Class B | 24,412 | 558,302 | |||||||||||||
| Universal Logistics Holdings, Inc. | 97,438 | 1,837,194 | |||||||||||||
| Werner Enterprises, Inc. | 24,900 | 908,850 | |||||||||||||
|
| ||||||||||||||
| 43,055,310 | |||||||||||||||
|
| ||||||||||||||
| Trading Companies & Distributors - 1.75% | |||||||||||||||
| Air Lease Corp. | 297,483 | 13,083,302 | |||||||||||||
| Aircastle Ltd. | 522,686 | 14,227,513 | |||||||||||||
| Applied Industrial Technologies, Inc. | 54,327 | 3,250,928 | |||||||||||||
| BMC Stock Holdings, Inc.A | 144,015 | 3,886,965 | |||||||||||||
| CAI International, Inc.A | 54,483 | 1,295,061 | |||||||||||||
| DXP Enterprises, Inc.A | 26,600 | 918,232 | |||||||||||||
| GATX Corp. | 92,895 | 7,389,797 | |||||||||||||
| H&E Equipment Services, Inc. | 90,700 | 3,078,358 | |||||||||||||
| Kaman Corp. | 94,452 | 5,541,499 | |||||||||||||
| NOW, Inc.A | 262,770 | 2,769,596 | |||||||||||||
| Rush Enterprises, Inc., Class A | 589,613 | 25,760,192 | |||||||||||||
| Textainer Group Holdings Ltd.A | 30,221 | 312,787 | |||||||||||||
| Titan Machinery, Inc.A | 40,271 | 668,499 | |||||||||||||
| Triton International Ltd. | 328,858 | 12,069,088 | |||||||||||||
| WESCO International, Inc.A | 288,294 | 14,457,944 | |||||||||||||
|
| ||||||||||||||
| 108,709,761 | |||||||||||||||
|
| ||||||||||||||
Total Industrials | 1,264,910,406 | ||||||||||||||
|
| ||||||||||||||
| Information Technology - 13.50% | |||||||||||||||
| Communications Equipment - 0.98% | |||||||||||||||
| Casa Systems, Inc.A | 357,387 | 2,401,641 | |||||||||||||
| Ciena Corp.A | 612,242 | 22,726,423 | |||||||||||||
| CommScope Holding Co., Inc.A B | 579,043 | 6,485,281 | |||||||||||||
| EchoStar Corp., Class AA | 104,000 | 4,056,000 | |||||||||||||
| Lumentum Holdings, Inc.A B | 215,336 | 13,492,954 | |||||||||||||
| NETGEAR, Inc.A | 345,329 | 9,382,589 | |||||||||||||
| Plantronics, Inc. | 34,279 | 1,351,278 | |||||||||||||
| Ribbon Communications, Inc.A | 207,611 | 890,651 | |||||||||||||
|
| ||||||||||||||
| 60,786,817 | |||||||||||||||
|
| ||||||||||||||
| Electronic Equipment, Instruments & Components - 6.31% | |||||||||||||||
| Anixter International, Inc.A | 74,325 | 6,150,394 | |||||||||||||
| Avnet, Inc. | 914,938 | 36,194,947 | |||||||||||||
| AVX Corp. | 929,705 | 14,243,081 | |||||||||||||
| Belden, Inc. | 139,398 | 7,148,329 | |||||||||||||
| Benchmark Electronics, Inc. | 147,421 | 4,997,572 | |||||||||||||
| Celestica, Inc.A | 842,355 | 6,081,803 | |||||||||||||
| Coherent, Inc.A | 106,837 | 15,910,166 | |||||||||||||
| ePlus, Inc.A | 9,800 | 765,674 | |||||||||||||
| FabrinetA | 398,533 | 22,409,511 | |||||||||||||
| FARO Technologies, Inc.A | 451,419 | 21,523,658 | |||||||||||||
| II-VI, Inc.A | 995,440 | 32,998,836 | |||||||||||||
See accompanying notes
21
American Beacon Small Cap Value FundSM
Schedule of Investments
October 31, 2019
| Shares | Fair Value | ||||||||||||||
| COMMON STOCKS - 96.49% (continued) | |||||||||||||||
| Information Technology - 13.50% (continued) | |||||||||||||||
| Electronic Equipment, Instruments & Components - 6.31% (continued) | |||||||||||||||
| Insight Enterprises, Inc.A | 179,807 | $ | 11,036,554 | ||||||||||||
| Itron, Inc.A | 156,087 | 11,903,195 | |||||||||||||
| Jabil, Inc. | 427,348 | 15,734,953 | |||||||||||||
| KEMET Corp. | 848,271 | 18,441,412 | |||||||||||||
| Kimball Electronics, Inc.A | 82,359 | 1,223,855 | |||||||||||||
| Methode Electronics, Inc. | 240,231 | 8,263,946 | |||||||||||||
| MTS Systems Corp. | 374,293 | 21,140,069 | |||||||||||||
| PC Connection, Inc. | 41,104 | 2,007,519 | |||||||||||||
| Plexus Corp.A | 36,165 | 2,674,040 | |||||||||||||
| Sanmina Corp.A | 677,147 | 20,808,727 | |||||||||||||
| ScanSource, Inc.A | 307,850 | 9,943,555 | |||||||||||||
| SYNNEX Corp. | 136,006 | 16,013,346 | |||||||||||||
| Tech Data Corp.A | 220,728 | 26,818,452 | |||||||||||||
| Vishay Intertechnology, Inc. | 2,809,436 | 56,610,135 | |||||||||||||
|
| ||||||||||||||
| 391,043,729 | |||||||||||||||
|
| ||||||||||||||
| IT Services - 1.38% | |||||||||||||||
| Cass Information Systems, Inc. | 15,700 | 899,767 | |||||||||||||
| CSG Systems International, Inc. | 401,790 | 23,159,176 | |||||||||||||
| KBR, Inc. | 1,170,917 | 32,973,023 | |||||||||||||
| NIC, Inc. | 432,503 | 10,172,470 | |||||||||||||
| Sykes Enterprises, Inc.A | 247,097 | 7,634,062 | |||||||||||||
| Virtusa Corp.A | 294,133 | 10,965,278 | |||||||||||||
|
| ||||||||||||||
| 85,803,776 | |||||||||||||||
|
| ||||||||||||||
| Semiconductors & Semiconductor Equipment - 4.06% | |||||||||||||||
| Amkor Technology, Inc.A | 518,840 | 6,449,181 | |||||||||||||
| Brooks Automation, Inc. | 1,399,333 | 59,429,672 | |||||||||||||
| Cabot Microelectronics Corp. | 76,326 | 11,534,385 | |||||||||||||
| ChipMOS Technologies, Inc., ADRB | 173,401 | 3,405,596 | |||||||||||||
| Cohu, Inc. | 1,048,360 | 17,423,743 | |||||||||||||
| Diodes, Inc.A | 1,954,164 | 91,161,751 | |||||||||||||
| First Solar, Inc.A | 167,488 | 8,674,204 | |||||||||||||
| MKS Instruments, Inc. | 156,208 | 16,904,830 | |||||||||||||
| Photronics, Inc.A | 1,858,166 | 21,926,359 | |||||||||||||
| Rambus, Inc.A | 152,600 | 2,112,747 | |||||||||||||
| Semtech Corp.A | 249,824 | 12,606,119 | |||||||||||||
|
| ||||||||||||||
| 251,628,587 | |||||||||||||||
|
| ||||||||||||||
| Software - 0.62% | |||||||||||||||
| Cision Ltd.A | 70,898 | 713,943 | |||||||||||||
| CommVault Systems, Inc.A | 42,238 | 2,097,961 | |||||||||||||
| Ebix, Inc.B | 41,846 | 1,783,895 | |||||||||||||
| LogMeIn, Inc. | 162,989 | 10,705,118 | |||||||||||||
| Verint Systems, Inc.A | 505,973 | 22,966,114 | |||||||||||||
|
| ||||||||||||||
| 38,267,031 | |||||||||||||||
|
| ||||||||||||||
| Technology Hardware, Storage & Peripherals - 0.15% | |||||||||||||||
| 3D Systems Corp.A B | 70,011 | 664,404 | |||||||||||||
| NCR Corp.A | 237,217 | 6,929,109 | |||||||||||||
| Super Micro Computer, Inc.A | 91,700 | 1,896,356 | |||||||||||||
|
| ||||||||||||||
| 9,489,869 | |||||||||||||||
|
| ||||||||||||||
Total Information Technology | 837,019,809 | ||||||||||||||
|
| ||||||||||||||
See accompanying notes
22
American Beacon Small Cap Value FundSM
Schedule of Investments
October 31, 2019
| Shares | Fair Value | ||||||||||||||
| COMMON STOCKS - 96.49% (continued) | |||||||||||||||
| Materials - 4.04% | |||||||||||||||
| Chemicals - 1.63% | |||||||||||||||
| American Vanguard Corp. | 62,496 | $ | 873,694 | ||||||||||||
| Cabot Corp. | 723,541 | 31,539,152 | |||||||||||||
| FutureFuel Corp. | 119,200 | 1,469,736 | |||||||||||||
| Huntsman Corp. | 611,100 | 13,523,643 | |||||||||||||
| Innophos Holdings, Inc. | 73,260 | 2,389,741 | |||||||||||||
| Koppers Holdings, Inc.A | 15,594 | 500,568 | |||||||||||||
| Kraton Corp.A | 340,849 | 7,641,835 | |||||||||||||
| Kronos Worldwide, Inc. | 74,434 | 943,823 | |||||||||||||
| Livent Corp.A B | 258,200 | 1,771,252 | |||||||||||||
| LSB Industries, Inc.A | 67,493 | 285,495 | |||||||||||||
| Minerals Technologies, Inc. | 128,036 | 6,331,380 | |||||||||||||
| PolyOne Corp. | 732,090 | 23,463,485 | |||||||||||||
| Quaker Chemical Corp. | 19,991 | 3,056,224 | |||||||||||||
| Stepan Co. | 50,463 | 4,931,244 | |||||||||||||
| Trinseo S.A. | 33,000 | 1,402,500 | |||||||||||||
| Valvoline, Inc. | 38,041 | 811,795 | |||||||||||||
|
| ||||||||||||||
| 100,935,567 | |||||||||||||||
|
| ||||||||||||||
| Containers & Packaging - 0.05% | |||||||||||||||
| Greif, Inc., Class A | 62,490 | 2,447,733 | |||||||||||||
| Silgan Holdings, Inc. | 29,600 | 910,792 | |||||||||||||
|
| ||||||||||||||
| 3,358,525 | |||||||||||||||
|
| ||||||||||||||
| Metals & Mining - 1.88% | |||||||||||||||
| Allegheny Technologies, Inc.A | 1,173,987 | 24,665,467 | |||||||||||||
| Carpenter Technology Corp. | 424,782 | 20,822,814 | |||||||||||||
| Century Aluminum Co.A | 126,600 | 738,078 | |||||||||||||
| Cleveland-Cliffs, Inc.B | 1,610,480 | 11,643,770 | |||||||||||||
| Coeur Mining, Inc.A | 2,316,442 | 12,786,760 | |||||||||||||
| Commercial Metals Co. | 255,400 | 4,936,882 | |||||||||||||
| Elah Holdings, Inc.A | 3,535 | 194,425 | |||||||||||||
| Ferroglobe PLC | 2,803,168 | 1,732,919 | |||||||||||||
| Haynes International, Inc. | 25,001 | 861,534 | |||||||||||||
| Kaiser Aluminum Corp. | 13,047 | 1,397,073 | |||||||||||||
| Pan American Silver Corp.B | 528,604 | 9,012,698 | |||||||||||||
| Schnitzer Steel Industries, Inc., Class A | 807,271 | 17,227,163 | |||||||||||||
| Warrior Met Coal, Inc. | 174,413 | 3,397,565 | |||||||||||||
| Worthington Industries, Inc. | 194,562 | 7,161,827 | |||||||||||||
|
| ||||||||||||||
| 116,578,975 | |||||||||||||||
|
| ||||||||||||||
| Paper & Forest Products - 0.48% | |||||||||||||||
| Domtar Corp. | 378,476 | 13,772,742 | |||||||||||||
| Louisiana-Pacific Corp. | 277,873 | 8,122,228 | |||||||||||||
| Mercer International, Inc. | 70,238 | 856,904 | |||||||||||||
| PH Glatfelter Co. | 38,131 | 686,358 | |||||||||||||
| Schweitzer-Mauduit International, Inc. | 156,007 | 6,316,723 | |||||||||||||
|
| ||||||||||||||
| 29,754,955 | |||||||||||||||
|
| ||||||||||||||
Total Materials | 250,628,022 | ||||||||||||||
|
| ||||||||||||||
| Real Estate - 5.27% | |||||||||||||||
| Equity Real Estate Investment Trusts (REITs) - 5.01% | |||||||||||||||
| Agree Realty Corp. | 190,278 | 14,988,198 | |||||||||||||
| Brandywine Realty Trust | 1,297,697 | 19,828,810 | |||||||||||||
| CareTrust REIT, Inc. | 190,812 | 4,625,283 | |||||||||||||
| Colony Capital, Inc. | 1,778,255 | 9,958,228 | |||||||||||||
| CoreCivic, Inc. | 406,668 | 6,205,754 | |||||||||||||
See accompanying notes
23
American Beacon Small Cap Value FundSM
Schedule of Investments
October 31, 2019
| Shares | Fair Value | ||||||||||||||
| COMMON STOCKS - 96.49% (continued) | |||||||||||||||
| Real Estate - 5.27% (continued) | |||||||||||||||
| Equity Real Estate Investment Trusts (REITs) - 5.01% (continued) | |||||||||||||||
| Cousins Properties, Inc. | 185,543 | $ | 7,445,841 | ||||||||||||
| DiamondRock Hospitality Co. | 728,830 | 7,273,723 | |||||||||||||
| Empire State Realty Trust, Inc., Class A | 877,957 | 12,704,038 | |||||||||||||
| GEO Group, Inc. | 1,077,373 | 16,397,617 | |||||||||||||
| Hersha Hospitality TrustB | 493,144 | 6,805,387 | |||||||||||||
| Industrial Logistics Properties Trust | 155,991 | 3,313,249 | |||||||||||||
| Kite Realty Group Trust | 262,452 | 4,676,895 | |||||||||||||
| Lexington Realty Trust | 2,837,900 | 30,876,352 | |||||||||||||
| Outfront Media, Inc. | 413,953 | 10,891,103 | |||||||||||||
| Physicians Realty Trust | 799,644 | 14,929,353 | |||||||||||||
| Piedmont Office Realty Trust, Inc., Class A | 288,552 | 6,475,107 | |||||||||||||
| PotlatchDeltic Corp. | 352,240 | 14,959,633 | |||||||||||||
| Preferred Apartment Communities, Inc., Class AB | 717,541 | 10,275,187 | |||||||||||||
| Retail Opportunity Investments Corp. | 202,994 | 3,788,883 | |||||||||||||
| Retail Properties of America, Inc., Class A | 586,206 | 8,066,195 | |||||||||||||
| Ryman Hospitality Properties, Inc. | 173,407 | 14,595,667 | |||||||||||||
| Seritage Growth Properties, Class AB | 1,242,333 | 54,029,062 | |||||||||||||
| Sunstone Hotel Investors, Inc. | 1,005,675 | 13,586,669 | |||||||||||||
| Urban Edge Properties | 658,209 | 13,894,792 | |||||||||||||
|
| ||||||||||||||
| 310,591,026 | |||||||||||||||
|
| ||||||||||||||
| Real Estate Management & Development - 0.26% | |||||||||||||||
| Consolidated-Tomoka Land Co. | 19,000 | 1,215,430 | |||||||||||||
| Five Point Holdings LLC, Class AA B | 112,542 | 743,903 | |||||||||||||
| Marcus & Millichap, Inc.A | 22,700 | 810,844 | |||||||||||||
| Newmark Group, Inc., Class A | 1,255,407 | 13,332,422 | |||||||||||||
|
| ||||||||||||||
| 16,102,599 | |||||||||||||||
|
| ||||||||||||||
Total Real Estate | 326,693,625 | ||||||||||||||
|
| ||||||||||||||
| Utilities - 2.87% | |||||||||||||||
| Electric Utilities - 1.29% | |||||||||||||||
| ALLETE, Inc. | 167,085 | 14,379,335 | |||||||||||||
| El Paso Electric Co. | 26,805 | 1,788,161 | |||||||||||||
| Otter Tail Corp. | 25,682 | 1,455,656 | |||||||||||||
| PNM Resources, Inc. | 25,601 | 1,335,092 | |||||||||||||
| Portland General Electric Co. | 1,049,160 | 59,676,221 | |||||||||||||
| Spark Energy, Inc., Class AB | 117,261 | 1,122,188 | |||||||||||||
|
| ||||||||||||||
| 79,756,653 | |||||||||||||||
|
| ||||||||||||||
| Gas Utilities - 0.53% | |||||||||||||||
| Chesapeake Utilities Corp. | 117,186 | 11,109,233 | |||||||||||||
| Northwest Natural Holding Co. | 25,369 | 1,759,594 | |||||||||||||
| South Jersey Industries, Inc. | 51,994 | 1,672,127 | |||||||||||||
| Southwest Gas Holdings, Inc. | 165,396 | 14,439,071 | |||||||||||||
| Spire, Inc. | 19,299 | 1,622,274 | |||||||||||||
| Star Group LP | 89,719 | 833,489 | |||||||||||||
| Suburban Propane Partners LP, MLP | 72,371 | 1,751,378 | |||||||||||||
|
| ||||||||||||||
| 33,187,166 | |||||||||||||||
|
| ||||||||||||||
| Independent Power & Renewable Electricity Producers - 0.21% | |||||||||||||||
| Clearway Energy, Inc., Class A | 83,226 | 1,428,990 | |||||||||||||
| Clearway Energy, Inc., Class C | 643,592 | 11,668,323 | |||||||||||||
|
| ||||||||||||||
| 13,097,313 | |||||||||||||||
|
| ||||||||||||||
See accompanying notes
24
American Beacon Small Cap Value FundSM
Schedule of Investments
October 31, 2019
| Shares | Fair Value | ||||||||||||||
| COMMON STOCKS - 96.49% (continued) | |||||||||||||||
| Utilities - 2.87% (continued) | |||||||||||||||
| Multi-Utilities - 0.81% | |||||||||||||||
| Avista Corp. | 680,865 | $ | 32,701,946 | ||||||||||||
| NorthWestern Corp. | 216,723 | 15,716,752 | |||||||||||||
| Unitil Corp. | 26,288 | 1,636,954 | |||||||||||||
|
| ||||||||||||||
| 50,055,652 | |||||||||||||||
|
| ||||||||||||||
| Water Utilities - 0.03% | |||||||||||||||
| California Water Service Group | 32,087 | 1,795,910 | |||||||||||||
|
| ||||||||||||||
Total Utilities | 177,892,694 | ||||||||||||||
|
| ||||||||||||||
Total Common Stocks (Cost $5,433,853,703) | 5,980,687,425 | ||||||||||||||
|
| ||||||||||||||
| EXCHANGE-TRADED INSTRUMENTS - 0.16% (Cost $9,961,777) | |||||||||||||||
| Exchange-Traded Funds - 0.16% | |||||||||||||||
| iShares Russell 2000 Value ETF | 81,000 | 9,913,590 | |||||||||||||
|
| ||||||||||||||
| SHORT-TERM INVESTMENTS - 3.44% | |||||||||||||||
| Investment Companies - 3.27% | |||||||||||||||
| American Beacon U.S. Government Money Market Select Fund, Select Class, 1.75%E F | 202,748,699 | 202,748,699 | |||||||||||||
|
| ||||||||||||||
| Principal Amount | |||||||||||||||
| U.S. Treasury Obligations - 0.17% | |||||||||||||||
| U.S. Treasury Bill, 1.87%, Due 2/13/2020G | $ | 10,500,000 | 10,453,964 | ||||||||||||
|
| ||||||||||||||
Total Short-Term Investments (Cost $213,193,189) | 213,202,663 | ||||||||||||||
|
| ||||||||||||||
| Shares |
| ||||||||||||||
| SECURITIES LENDING COLLATERAL - 1.38% (Cost $85,718,589) | |||||||||||||||
| Investment Companies - 1.38% | |||||||||||||||
| American Beacon U.S. Government Money Market Select Fund, Select Class, 1.75%E F | 85,718,589 | 85,718,589 | |||||||||||||
|
| ||||||||||||||
TOTAL INVESTMENTS - 101.47% (Cost $5,742,727,258) | 6,289,522,267 | ||||||||||||||
LIABILITIES, NET OF OTHER ASSETS - (1.47%) | (91,252,111 | ) | |||||||||||||
|
| ||||||||||||||
TOTAL NET ASSETS - 100.00% | $ | 6,198,270,156 | |||||||||||||
|
| ||||||||||||||
| Percentages are stated as a percent of net assets. | |||||||||||||||
ANon-income producing security.
B All or a portion of this security is on loan, collateralized by either cash and/or U.S. Treasuries, at October 31, 2019 (Note 9).
C Value was determined using significant unobservable inputs.
D Fair valued pursuant to procedures approved by the Board of Trustees. At period end, the value of these securities amounted to $0 or 0.00% of net assets.
E The Fund is affiliated by having the same investment advisor.
F7-day yield.
G This security or a piece thereof is held as segregated collateral.
ADR - American Depositary Receipt.
ETF - Exchange-Traded Fund.
LLC - Limited Liability Company.
LP - Limited Partnership.
MLP – Master Limited Partnership.
PLC - Public Limited Company.
See accompanying notes
25
American Beacon Small Cap Value FundSM
Schedule of Investments
October 31, 2019
| Long Futures Contracts Open on October 31, 2019: |
| |||||||||||||||
| Equity Futures Contracts | ||||||||||||||||
| Description | Number of Contracts | Expiration Date | Notional Amount | Contract Value | Unrealized Appreciation (Depreciation) | |||||||||||
| Russell 2000 E-Mini Index Futures | 2,454 | December 2019 | $ | 190,666,103 | $ | 191,829,180 | $ | 1,163,077 | ||||||||
|
|
|
|
|
| |||||||||||
| $ | 190,666,103 | $ | 191,829,180 | $ | 1,163,077 | |||||||||||
|
|
|
|
|
| |||||||||||
The Fund’s investments are summarized by level based on the inputs used to determine their values. As of October 31, 2019, the investments were classified as described below:
Small Cap Value Fund | Level 1 | Level 2 | Level 3 | Total | ||||||||||||||||||||||||
Assets | ||||||||||||||||||||||||||||
Common Stocks | $ | 5,980,687,425 | $ | - | $ | 0 | (1) | $ | 5,980,687,425 | |||||||||||||||||||
Exchange-Traded Instruments | 9,913,590 | - | - | 9,913,590 | ||||||||||||||||||||||||
Short-Term Investments | 202,748,699 | 10,453,964 | - | 213,202,663 | ||||||||||||||||||||||||
Securities Lending Collateral | 85,718,589 | - | - | 85,718,589 | ||||||||||||||||||||||||
|
|
|
|
|
|
|
| |||||||||||||||||||||
Total Investments in Securities - Assets | $ | 6,279,068,303 | $ | 10,453,964 | $ | - | $ | 6,289,522,267 | ||||||||||||||||||||
|
|
|
|
|
|
|
| |||||||||||||||||||||
Financial Derivative Instruments - Assets | ||||||||||||||||||||||||||||
Futures Contracts | $ | 1,163,077 | $ | - | $ | - | $ | 1,163,077 | ||||||||||||||||||||
|
|
|
|
|
|
|
| |||||||||||||||||||||
Total Financial Derivative Instruments - Assets | $ | 1,163,077 | $ | - | $ | - | $ | 1,163,077 | ||||||||||||||||||||
|
|
|
|
|
|
|
| |||||||||||||||||||||
(1) Investment held in the Fund’s Portfolio with $0 fair value.
U.S. GAAP requires transfers between all levels to/from level 3 be disclosed. During the year ended October 31, 2019, there were no transfers into or out of Level 3.
The following table is a reconciliation of Level 3 assets within the Fund for which significant unobservable inputs were used to determine fair value. Transfers in or out of Level 3 represent the ending value of any security or instrument where a change in the level has occurred from the beginning to the end of the period:
| Security Type | Balance as of 10/31/2018 | Purchases | Sales | Accrued Discounts (Premiums) | Realized Gain (Loss) | Change in Unrealized Appreciation (Depreciation) | Transfer into Level 3 | Transfer out of Level 3 | Balance as of | Unrealized Appreciation (Depreciation) at Period end** | ||||||||||||||||||||||||
| Common Stocks | $ 0(1) | $ - | $ - | $ | - | $ | - | $ | - | $ | - | $ | - | $ | 0 | (1) | $ | - | ||||||||||||||||
| ** | Change in unrealized appreciation (depreciation) attributable to Level 3 securities held at period end. This balance is included in the change in unrealized appreciation (depreciation) on the Statement of Operations. |
| (1) | Investment held in the Fund’s Portfolio with $0 fair value. |
The common stock, classified as Level 3, is beneficial interest units in a representation and warranty insurance trust. The shares have been fair valued at $0 due to limited market transparency.
See accompanying notes
26
American Beacon Small Cap Value FundSM
Statement of Assets and Liabilities
October 31, 2019
Assets: |
| |||
Investments in unaffiliated securities, at fair value†§ | $ | 6,001,054,979 | ||
Investments in affiliated securities, at fair value‡ | 288,467,288 | |||
Cash | 44,261 | |||
Dividends and interest receivable | 2,336,273 | |||
Receivable for investments sold | 29,788,890 | |||
Receivable for fund shares sold | 3,573,905 | |||
Receivable for variation margin on open futures contracts (Note 5) | 1,167,762 | |||
Prepaid expenses | 63,159 | |||
|
| |||
Total assets | 6,326,496,517 | |||
|
| |||
Liabilities: |
| |||
Payable for investments purchased | 30,210,282 | |||
Payable for fund shares redeemed | 4,631,039 | |||
Cash due to broker for futures contracts | 2,575,030 | |||
Management andsub-advisory fees payable (Note 2) | 4,389,138 | |||
Service fees payable (Note 2) | 173,987 | |||
Transfer agent fees payable (Note 2) | 127,864 | |||
Payable upon return of securities loaned (Note 9)§ | 85,718,589 | |||
Custody and fund accounting fees payable | 111,596 | |||
Professional fees payable | 57,249 | |||
Trustee fees payable (Note 2) | 42,010 | |||
Payable for prospectus and shareholder reports | 108,863 | |||
Other liabilities | 80,714 | |||
|
| |||
Total liabilities | 128,226,361 | |||
|
| |||
Net assets | $ | 6,198,270,156 | ||
|
| |||
Analysis of net assets: |
| |||
Paid-in-capital | $ | 5,650,193,108 | ||
Total distributable earnings (deficits)A | 548,077,048 | |||
|
| |||
Net assets | $ | 6,198,270,156 | ||
|
| |||
Shares outstanding at no par value (unlimited shares authorized): |
| |||
Institutional Class | 176,127,129 | |||
|
| |||
Y Class | 11,186,081 | |||
|
| |||
Investor Class | 19,195,024 | |||
|
| |||
Advisor Class | 2,827,909 | |||
|
| |||
A Class | 2,922,564 | |||
|
| |||
C Class | 615,311 | |||
|
| |||
R6 Class | 56,579,514 | |||
|
| |||
Net assets: |
| |||
Institutional Class | $ | 4,073,332,655 | ||
|
| |||
Y Class | $ | 254,599,477 | ||
|
| |||
Investor Class | $ | 424,569,237 | ||
|
| |||
Advisor Class | $ | 61,618,406 | ||
|
| |||
A Class | $ | 63,246,155 | ||
|
| |||
C Class | $ | 12,619,613 | ||
|
| |||
R6 Class | $ | 1,308,284,613 | ||
|
| |||
Net asset value, offering and redemption price per share: |
| |||
Institutional Class | $ | 23.13 | ||
|
| |||
Y Class | $ | 22.76 | ||
|
| |||
Investor Class | $ | 22.12 | ||
|
| |||
Advisor Class | $ | 21.79 | ||
|
| |||
A Class | $ | 21.64 | ||
|
| |||
A Class (offering price) | $ | 22.96 | ||
|
| |||
C Class | $ | 20.51 | ||
|
| |||
R6 Class | $ | 23.12 | ||
|
| |||
† Cost of investments in unaffiliated securities | $ | 5,454,259,970 | ||
‡ Cost of investments in affiliated securities | $ | 288,467,288 | ||
§ Fair value of securities on loan | $ | 333,549,228 | ||
| A The Fund’s investments in affiliated securities did not have unrealized appreciation (depreciation) at year end. | ||||
See accompanying notes
27
American Beacon Small Cap Value FundSM
Statement of Operations
For the year ended October 31, 2019
Investment income: |
| |||
Dividend income from unaffiliated securities (net of foreign taxes)† | $ | 110,808,896 | ||
Dividend income from affiliated securities (Note 8) | 4,990,046 | |||
Interest income | 754,684 | |||
Income derived from securities lending (Note 9) | 1,742,480 | |||
|
| |||
Total investment income | 118,296,106 | |||
|
| |||
Expenses: |
| |||
Management andsub-advisory fees (Note 2) | 46,959,994 | |||
Transfer agent fees: | ||||
Institutional Class (Note 2) | 1,321,729 | |||
Y Class (Note 2) | 304,122 | |||
Investor Class | 26,324 | |||
Advisor Class | 6,632 | |||
A Class | 14,641 | |||
C Class | 4,212 | |||
R6 Class | 36,790 | |||
Custody and fund accounting fees | 619,663 | |||
Professional fees | 287,927 | |||
Registration fees and expenses | 151,214 | |||
Service fees (Note 2): | ||||
Investor Class | 1,604,605 | |||
Advisor Class | 194,862 | |||
A Class | 125,754 | |||
C Class | 16,284 | |||
Distribution fees (Note 2): | ||||
Advisor Class | 172,147 | |||
A Class | 163,376 | |||
C Class | 127,208 | |||
Prospectus and shareholder report expenses | 466,690 | |||
Trustee fees (Note 2) | 474,848 | |||
Other expenses | 629,605 | |||
|
| |||
Total expenses | 53,708,627 | |||
|
| |||
Net investment income | 64,587,479 | |||
|
| |||
Realized and unrealized gain (loss) from investments: |
| |||
Net realized gain (loss) from: | ||||
Investments in unaffiliated securitiesA | (4,029,021 | ) | ||
Redemption in kind (Note 7) | 1,590,938 | |||
Commission recapture (Note 1) | 30,147 | |||
Foreign currency transactions | 274 | |||
Futures contracts | (4,931,502 | ) | ||
Change in net unrealized appreciation of: | ||||
Investments in unaffiliated securitiesB | 37,418,329 | |||
Foreign currency transactions | 2,413 | |||
Futures contracts | 23,713,219 | |||
|
| |||
Net gain from investments | 53,794,797 | |||
|
| |||
Net increase in net assets resulting from operations | $ | 118,382,276 | ||
|
| |||
† Foreign taxes | $ | 198,431 | ||
A The Fund did not recognize net realized gains (losses) from the sale of investments in affiliated securities. | ||||
B The Fund’s investments in affiliated securities did not have a change in unrealized appreciation (depreciation) at year end. |
| |||
See accompanying notes
28
American Beacon Small Cap Value FundSM
Statement of Changes in Net Assets
| Year Ended October 31, 2019 | Year Ended October 31, 2018 | |||||||||||
Increase (decrease) in net assets: |
| |||||||||||
Operations: |
| |||||||||||
Net investment income | $ | 64,587,479 | $ | 44,003,539 | ||||||||
Net realized gain (loss) from investments in unaffiliated securities, redemption in kind, commission recapture, foreign currency transactions, and futures contracts | (7,339,164 | ) | 706,938,150 | |||||||||
Change in net unrealized appreciation (depreciation) of investments in unaffiliated securities, foreign currency transactions, and futures contracts | 61,133,961 | (944,177,325 | ) | |||||||||
|
|
|
| |||||||||
Net increase (decrease) in net assets resulting from operations | 118,382,276 | (193,235,636 | ) | |||||||||
|
|
|
| |||||||||
Distributions to shareholders: |
| |||||||||||
Total retained earnings: | ||||||||||||
Institutional Class | (510,792,954 | ) | (483,990,858 | ) | ||||||||
Y Class | (37,948,891 | ) | (34,475,891 | ) | ||||||||
Investor Class | (60,820,852 | ) | (58,686,508 | ) | ||||||||
Advisor Class | (8,576,120 | ) | (8,714,846 | ) | ||||||||
A Class | (8,031,568 | ) | (6,415,873 | ) | ||||||||
C Class | (1,576,223 | ) | (1,398,033 | ) | ||||||||
R6 Class | (107,632,048 | ) | (35,513,779 | ) | ||||||||
|
|
|
| |||||||||
Net distributions to shareholders | (735,378,656 | ) | (629,195,788 | ) | ||||||||
|
|
|
| |||||||||
Capital share transactions (Note 11): |
| |||||||||||
Proceeds from sales of shares | 1,663,527,301 | 1,841,822,459 | ||||||||||
Reinvestment of dividends and distributions | 708,177,544 | 608,543,857 | ||||||||||
Cost of shares redeemed | (2,101,711,543 | ) | (2,123,030,353 | ) | ||||||||
|
|
|
| |||||||||
Net increase in net assets from capital share transactions | 269,993,302 | 327,335,963 | ||||||||||
|
|
|
| |||||||||
Net (decrease) in net assets | (347,003,078 | ) | (495,095,461 | ) | ||||||||
|
|
|
| |||||||||
Net assets: |
| |||||||||||
Beginning of period | 6,545,273,234 | 7,040,368,695 | ||||||||||
|
|
|
| |||||||||
End of period | $ | 6,198,270,156 | $ | 6,545,273,234 | ||||||||
|
|
|
| |||||||||
See accompanying notes
29
American Beacon Small Cap Value FundSM
October 31, 2019
1. Organization and Significant Accounting Policies
American Beacon Funds (the “Trust”) is organized as a Massachusetts business trust. The Fund, a series within the Trust, is registered under the Investment Company Act of 1940, as amended (the “Act”), as a diversified,open-end management investment company. As of October 31, 2019, the Trust consists ofthirty-two active series, one of which is presented in this filing: American Beacon Small Cap Value Fund (the “Fund”). The remainingthirty-one active series are reported in separate filings.
American Beacon Advisors, Inc. (the “Manager”) is a Delaware corporation and a wholly-owned subsidiary of Resolute Investment Managers, Inc. (“RIM”) organized in 1986 to provide business management, advisory, administrative, and asset management consulting services to the Trust and other investors. The Manager is registered as an investment advisor under the Investment Advisers Act of 1940, as amended (the “Advisers Act”). RIM is, in turn, a wholly-owned subsidiary of Resolute Acquisition, Inc., which is a wholly-owned subsidiary of Resolute Topco, Inc., a wholly-owned subsidiary of Resolute Investment Holdings, LLC (“RIH”). RIH is owned primarily by Kelso Investment Associates VIII, L.P., KEP VI, LLC and Estancia Capital Partners L.P., investment funds affiliated with Kelso & Company, L.P. (“Kelso”) or Estancia Capital Management, LLC (“Estancia”), which are private equity firms.
Recent Accounting Pronouncements
In March 2017, the Financial Accounting Standards Board (“FASB”) issued Accounting Standards Update (“ASU”)2017-08,Premium Amortization of Purchased Callable Debt Securities. The amendments in the ASU shorten the premium amortization period on a purchased callable debt security from the security’s contractual life to the earliest call date. It is anticipated that this change will enhance disclosures by reducing losses recognized when a security is called on an earlier date. This ASU is effective for fiscal years beginning after December 15, 2018. The Manager continues to evaluate the impact this ASU will have on the financial statements and other disclosures.
In August 2018, the FASB issued ASU2018-13,Fair Value Measurement (“Topic 820”). The amendments in the ASU impact disclosure requirements for fair value measurement. It is anticipated that this change will enhance the effectiveness of disclosures in the notes to the financial statements. This ASU is effective for fiscal years beginning after December 15, 2019. Early adoption is permitted and can include the entire standard or certain provisions that exclude or amend disclosures. For the year ended October 31, 2019, the Fund has chosen to adopt the standard. The adoption of this ASU guidance did not have a material impact on the financial statements and other disclosures.
Class Disclosure
The Fund has multiple classes of shares designed to meet the needs of different groups of investors. The following table sets forth the differences amongst the classes:
Class | Eligible Investors | Minimum Initial Investments | ||||
| Institutional | Large institutional investors - sold directly or through intermediary channels. | $ | 250,000 | |||
| Y Class | Large institutional retirement plan investors - sold directly or through intermediary channels. | $ | 100,000 | |||
| Investor | All investors using intermediary organizations, such as broker-dealers or retirement plan sponsors. | $ | 2,500 | |||
| Advisor Class | All investors who invest through intermediary organizations, such as broker-dealers or third party administrators. | $ | 2,500 | |||
| A Class | All investors who invest through intermediary organizations, such as broker-dealers or third party administrator. Retail investors who invest directly through a financial intermediary such as a broker, bank, or registered investment advisor which may include afront-end sales charge and a contingent deferred sales charge (“CDSC”). | $ | 2,500 | |||
30
American Beacon Small Cap Value FundSM
Notes to Financial Statements
October 31, 2019
Class | Eligible Investors | Minimum Initial Investments | ||||
| C Class | Retail investors who invest directly through a financial intermediary, such as a broker or through employee directed benefit plans with applicable sales charges which may include CDSC. | $ | 1,000 | |||
| R6 Class | Large institutional retirement plan investors - sold through retirement plan sponsors. | None | ||||
Each class offered by the Trust has equal rights as to assets and voting privileges. Income andnon-class specific expenses are allocated daily to each class based on the relative net assets. Realized and unrealized capital gains and losses of each class are allocated daily based on the relative net assets of each class of the respective Fund. Class specific expenses, where applicable, currently include service, distribution, transfer agent fees, andsub-transfer agent fees that vary amongst the classes as described more fully in Note 2.
Significant Accounting Policies
The following is a summary of significant accounting policies, consistently followed by the Fund in preparation of the financial statements. The Fund is considered an investment company and accordingly, follows the investment company accounting and reporting guidance of the FASB Accounting Standards Codification Topic 946,Financial Services - Investment Companies,a part of Generally Accepted Accounting Principles (“U.S. GAAP”).
Security Transactions and Investment Income
Security transactions are recorded as of the trade date for financial reporting purposes. Securities purchased or sold on a when-issued or delayed-delivery basis may be settled beyond a standard settlement period for the security after the trade date.
Dividend income, net of foreign taxes, is recorded on theex-dividend date, except certain dividends from foreign securities which are recorded as soon as the information is available to the Fund. Interest income, net of foreign taxes, is earned from settlement date, recorded on the accrual basis, and adjusted, if necessary, for accretion of discounts and amortization of premiums. Realized gains (losses) from securities sold are determined based on specific lot identification.
Distributions to Shareholders
The Fund distributes most or all of its net earning and realized gains, if any, each taxable year in the form of dividends from net investment income and distributions of realized net capital gains and net gains from foreign currency translations on an annual basis. The Fund does not have a fixed dividend rate and does not guarantee that it will pay any distributions in any particular period. Dividends to shareholders are determined in accordance with federal income tax regulations, which may differ in amount and character from net investment income and realized gains recognized for purposes of U.S. GAAP. To the extent necessary to fully distribute capital gains, the Fund may designate earnings and profits distributed to shareholders on the redemption of shares.
Commission Recapture
The Fund has established brokerage commission recapture arrangements with certain brokers or dealers. If the Fund’s investment advisor chooses to execute a transaction through a participating broker, the broker rebates a portion of the commission back to the Fund. Any collateral benefit received through participation in the commission recapture program is directed exclusively to the Fund. This amount is reported with the net realized gain in the Fund’s Statement of Operations, if applicable.
31
American Beacon Small Cap Value FundSM
Notes to Financial Statements
October 31, 2019
Allocation of Income, Trust Expenses, Gains, and Losses
Investment income, realized and unrealized gains and losses from investments of the Fund is allocated daily to each class of shares based upon the relative proportion of net assets of each class to the total net assets of the Fund. Expenses directly charged or attributable to the Fund will be paid from the assets of the Fund. Generally, expenses of the Trust will be allocated among and charged to the assets of the Fund on a basis that the Trust’s Board of Trustees (the “Board”) deems fair and equitable, which may be based on the relative net assets of the Fund or nature of the services performed and relative applicability to the Fund.
Use of Estimates
The preparation of financial statements in conformity with U.S. GAAP requires management to make estimates and assumptions that affect the amounts reported in the financial statements and accompanying notes. Actual results may differ from those estimated.
Other
Under the Trust’s organizational documents, its officers and trustees are indemnified against certain liabilities arising out of the performance of their duties to the Trust. In the normal course of business, the Trust enters into contracts that provide indemnification to the other party or parties against potential costs or liabilities. The Trust’s maximum exposure under these arrangements is dependent on claims that may be made in the future and, therefore, cannot be estimated. The Trust has had no prior claims or losses pursuant to any such agreement.
2. Transactions with Affiliates
Management and InvestmentSub-Advisory Agreements
The Fund and the Manager are parties to a Management Agreement that obligates the Manager to provide the Fund with investment advisory and administrative services. As compensation for performing the duties under the Management Agreement, the Manager will receive an annualized management fee based on a percentage of the Fund’s average daily net assets that is calculated and accrued daily according to the following schedule:
First $15 billion | 0.35 | % | ||
Next $15 billion | 0.325 | % | ||
Over $30 billion | 0.30 | % |
The Trust, on behalf of the Fund, and the Manager have entered into Investment Advisory Agreements with Barrow, Hanley, Mewhinney & Strauss, LLC; Brandywine Global Investment Management, LLC; Foundry Partners, LLC; Hillcrest Asset Management, LLC; Hotchkis and Wiley Capital Management, LLC; and Mellon Investments Corporation(“Sub-Advisors”) pursuant to which the Fund has agreed to pay an annualizedsub-advisory fee that is calculated and accrued daily based on the Fund’s average daily net assets.
The Management andSub-Advisory Fees paid by the Fund for the year ended October 31, 2019 were as follows:
| Effective Fee Rate | Amount of Fees Paid | |||||||||||
Management Fees | 0.35 | % | $ | 22,057,579 | ||||||||
Sub-Advisor Fees | 0.38 | % | 24,902,415 | |||||||||
|
|
|
| |||||||||
Total | 0.73 | % | $ | 46,959,994 | ||||||||
|
|
|
| |||||||||
As compensation for services provided by the Manager in connection with securities lending activities conducted by the Fund, the lending Fund pays to the Manager, with respect to cash collateral posted by borrowers, a fee up to 10% of the net monthly interest income (the gross interest income earned by the investment of cash
32
American Beacon Small Cap Value FundSM
Notes to Financial Statements
October 31, 2019
collateral, less the amount paid to borrowers and related expenses) from such activities and, with respect to loan fees paid by borrowers, a fee up to 10% of such loan fees. These fees are included in “Income derived from securities lending” and “Management and investment advisory fees” on the Statement of Operations. During the year ended October 31, 2019, the Manager received securities lending fees of $212,913 for the securities lending activities of the Fund.
Distribution Plans
The Fund, except for the Advisor, A, and C Classes of the Fund, has adopted a “defensive” Distribution Plan (the “Plan”) in accordance with Rule12b-1 under the Act, pursuant to which no separate fees may be charged to the Fund for distribution purposes. However, the Plan authorizes the management fee received by the Manager and the investment advisors hired by the Manager to be used for distribution purposes. Under this Plan, the Fund does not intend to compensate the Manager or any other party, either directly or indirectly, for the distribution of Fund shares.
Separate Distribution Plans (the “Distribution Plans”) have been adopted pursuant to Rule12b-1 under the Act for the Advisor, A, and C Classes of the Fund. Under the Distribution Plans, as compensation for distribution and shareholder servicing assistance, the Manager receives an annual fee of 0.25% of the average daily net assets of the Advisor and A Classes and 1.00% of the average daily net assets of the C Class. The fee will be payable without regard to whether the amount of the fee is more or less than the actual expenses incurred in a particular month by the Manager for distribution assistance.
Service Plans
The Manager and the Trust entered into a Service Plan that obligates the Manager to oversee additional shareholder servicing of the Investor, Advisor, A, and C Classes of the Fund. As compensation for performing the duties required under the Service Plan, the Manager receives an annualized fee up to 0.25% of the average daily net assets of the A and C Classes, up to 0.25% of the average daily net assets of the Advisor Class, and up to 0.375% of the average daily net assets of the Investor Class of the Fund.
Sub-Transfer Agent Fees
The Manager has entered into agreements, which include servicing agreements, with financial intermediaries that provide recordkeeping, processing, shareholder communications and other services to customers of the intermediaries that hold positions in the Institutional and Y Classes of the Fund and has agreed to compensate the intermediaries for providing these services. Intermediaries transact with the Fund primarily through the use of omnibus accounts on behalf of its customers who hold positions in the Fund. Certain services would have been provided by the Fund’s transfer agent and other service providers if the shareholders’ accounts were maintained directly by the Fund’s transfer agent. Accordingly, the Fund, pursuant to Board approval, has agreed to reimburse the Manager for certainnon-distribution shareholder services provided by financial intermediaries for the Institutional and Y Classes. The reimbursement amounts(sub-transfer agent fees) paid to the Manager are subject to a fee limit of up to 0.10% of an intermediary’s average net assets in the Institutional and Y Classes on an annual basis. During the year ended October 31, 2019, thesub-transfer agent fees, as reflected in “Transfer agent fees” on the Statement of Operations, were as follows:
Fund | Sub-Transfer Agent Fees | |||
Small Cap Value | $ | 1,463,002 | ||
As of October 31, 2019, the Fund owed the Manager the following reimbursement ofsub-transfer agent fees, as reflected in “Transfer agent fees payable” on the Statement of Assets and Liabilities:
Fund | Reimbursement Sub-Transfer Agent Fees | |||
Small Cap Value | $ | 67,435 | ||
33
American Beacon Small Cap Value FundSM
Notes to Financial Statements
October 31, 2019
Brokerage Commissions
Affiliated entities of asub-advisor to the Fund received commissions on purchases and sales of the Fund’s portfolio securities totaling $155,758 for the year ended October 31, 2019.
Investments in Affiliated Funds
The Fund may invest in the American Beacon U.S. Government Money Market Select Fund (the “USG Select Fund”). Cash collateral received by the Fund in connection with securities lending may also be invested in the USG Select Fund. The Fund and the USG Select Fund have the same investment advisor and therefore, are considered to be affiliated. The Manager serves as investment advisor to the USG Select Fund and receives management fees and administrative fees totaling 0.10% of the average daily net assets of the USG Select Fund. During the year ended October 31, 2019, the Manager earned fees on the Fund’s direct investments and securities lending collateral investments in the USG Select Fund as shown below:
Fund | Direct Investments in USG Select Fund | Securities Lending Collateral Investments in USG Select Fund | Total | |||||||||
Small Cap Value | $ | 224,988 | $ | 100,044 | $ | 325,032 | ||||||
Interfund Credit Facility
Pursuant to an exemptive order issued by the SEC, the Fund, along with other registered investment companies having management contracts with the Manager, may participate in a credit facility whereby each fund, under certain conditions, is permitted to lend money directly to and borrow directly from other participating funds for temporary purposes. The interfund credit facility is advantageous to the Fund because it provides added liquidity and eliminates the need to maintain higher cash balances to meet redemptions. This situation could arise when shareholder redemptions exceed anticipated volumes and certain funds have insufficient cash on hand to satisfy such redemptions or when sales of securities do not settle as expected, resulting in a cash shortfall for a fund. When a fund liquidates portfolio securities to meet redemption requests, they often do not receive payment in settlement for up to two days (or longer for certain foreign transactions). Redemption requests normally are satisfied on the next business day. The credit facility provides a source of immediate, short-term liquidity pending settlement of the sale of portfolio securities. The credit facility is administered by a credit facility team consisting of professionals from the Manager’s asset management, compliance, and accounting areas who report the activities of the credit facility to the Board. During the year ended October 31, 2019, the Fund participated as a lender by loaning an average amount of $24,169,396 for 2 days at an average interest rate of 3.05% with interest charges earned of $4,035. This amount is included in “Interest income” on the Statement of Operations.
Expense Reimbursement Plan
The Fund has adopted an Expense Reimbursement Plan whereby the Manager may seek repayment of such fee or voluntary reductions and expense reimbursements. Under the policy, the Manager can be reimbursed by the Fund for any contractual or voluntary fee reductions or expense reimbursements if reimbursement to the Manager (a) occurs within three years after the date of the Manager’s waiver/reimbursement and (b) does not cause the Fund’s annual operating expenses to exceed the lesser of the contractual percentage limit in effect at the time of the waiver/reimbursement or time of recoupment. During the year ended October 31, 2019 there were no waived fees, expenses reimbursed, or recouped expenses.
Sales Commissions
The Fund’s Distributor, Resolute Investment Distributors, Inc. (“RID” or “Distributor”), may receive a portion of Class A sales charges from broker dealers and it may be used to offset distribution related expenses. During the year ended October 31, 2019, RID collected $2,700 from the sale of Class A Shares.
34
American Beacon Small Cap Value FundSM
Notes to Financial Statements
October 31, 2019
A CDSC of 0.50% will be deducted with respect to Class A Shares on certain purchases of $1,000,000 or more that are redeemed in whole or part within 18 months of purchase, unless waived as discussed in the Fund’s Prospectus. Any applicable CDSC will be 0.50% of the lesser of the original purchase price or the value of the redemption of the Class A Shares redeemed. During the year ended October 31, 2019, CDSC fees of $50 were collected for Class A Shares of the Fund.
A CDSC of 1.00% will be deducted with respect to Class C Shares redeemed within 12 months of purchase, unless waived as discussed in the Fund’s Prospectus. Any applicable CDSC will be 1.00% of the lesser of the original purchase price or the value of the redemption of the Class C Shares redeemed. During the year ended October 31, 2019, CDSC fees of $254 were collected for Class C Shares of the Fund.
Trustee Fees and Expenses
As compensation for their service to the Trusts, each Trustee receives an annual retainer of $120,000, plus $10,000 for each Board meeting attended in person or via teleconference, $2,500 for attendance by Committee members at meetings of the Audit Committee and the Investment Committee, and $1,500 for attendance by Committee members at meetings of the Nominating and Governance Committee, plus reimbursement of reasonable expenses incurred in attending Board meetings, Committee meetings, and relevant educational seminars. The Trustees also may be compensated for attendance at special Board and/or Committee meetings from time to time. The Board Chair receives an additional annual retainer of $50,000 as well as a $2,500 fee each quarter for attendance at the committee meetings. The Chairpersons of the Audit Committee and the Investment Committee each receive an additional annual retainer of $25,000 and the Chairman of the Nominating and Governance Committee receives an additional annual retainer of $10,000. These expenses are allocated on a prorated basis to each fund of the Trusts according to its respective net assets.
3. Security Valuation and Fair Value Measurements
The price of the Fund’s shares is based on its net asset value (“NAV”) per share. The Fund’s NAV is computed by adding total assets, subtracting all the Fund’s liabilities, and dividing the result by the total number of shares outstanding.
The NAV of each class of the Fund’s shares is determined based on a pro rata allocation of the Fund’s investment income, expenses and total capital gains and losses. The Fund’s NAV per share is determined each business day as of the regular close of trading on the New York Stock Exchange (“NYSE” or “Exchange”), which is typically 4:00 p.m. Eastern Time (“ET”). However, if trading on the NYSE closes at a time other than 4:00 p.m. ET, the Fund’s NAV per share typically would still be determined as of the regular close of trading on the NYSE. The Fund does not price its shares on days that the NYSE is closed. Foreign exchanges may permit trading in foreign securities on days when the Fund is not open for business, which may result in the value of the Fund’s portfolio investments being affected at a time when you are unable to buy or sell shares.
Equity securities, including shares ofclosed-end funds and exchange-traded funds (“ETFs”), are valued at the last sale price or official closing price taken from the primary exchange in which each security trades. Investments in other mutual funds are valued at the closing NAV per share on the day of valuation. Debt securities are valued at bid quotes from broker/dealers or evaluated bid prices from pricing services, who may consider a number of inputs and factors, such as prices of comparable securities, yield curves, spreads, credit ratings, coupon rates, maturity, default rates, and underlying collateral. Futures are valued based on their daily settlement prices. Exchange-traded andover-the-counter (“OTC”) options are valued at the last sale price. Options with no last sale for the day are priced at mid quote. Swaps are valued at evaluated mid prices from pricing services.
The valuation of securities traded on foreign markets and certain fixed-income securities will generally be based on prices determined as of the earlier closing time of the markets on which they primarily trade unless a significant event has occurred. When the Fund holds securities or other assets that are denominated in a foreign currency, the Fund will normally use the currency exchange rates as of 4:00 p.m. ET.
35
American Beacon Small Cap Value FundSM
Notes to Financial Statements
October 31, 2019
Securities may be valued at fair value, as determined in good faith and pursuant to procedures approved by the Board, under certain limited circumstances. For example, fair value pricing will be used when market quotations are not readily available or reliable, as determined by the Manager, such as when (i) trading for a security is restricted or stopped; (ii) a security’s trading market is closed (other than customary closings); or (iii) a security has beende-listed from a national exchange. A security with limited market liquidity may require fair value pricing if the Manager determines that the available price does not reflect the security’s true market value. In addition, if a significant event that the Manager determines to affect the value of one or more securities held by the Fund occurs after the close of a related exchange but before the determination of the Fund’s NAV, fair value pricing may be used on the affected security or securities. Securities of small-capitalization companies are also more likely to require a fair value determination using these procedures because they are more thinly traded and less liquid than the securities of larger-capitalization companies. The Fund may fair value securities as a result of significant events occurring after the close of the foreign markets in which the Fund invests as described below. In addition, the Fund may invest in illiquid securities requiring these procedures.
The Fund may use fair value pricing for securities primarily traded innon-U.S. markets because most foreign markets close well before the Fund’s pricing time of 4:00 p.m. ET. The earlier close of these foreign markets gives rise to the possibility that significant events, including broad market moves, may have occurred in the interim and may materially affect the value of those securities. If the Manager determines that the last quoted prices ofnon-U.S. securities will, in its judgment, materially affect the value of some or all its portfolio securities, the Manager can adjust the previous closing prices to reflect what it believes to be the fair value of the securities as of the close of the Exchange. In deciding whether it is necessary to adjust closing prices to reflect fair value, the Manager reviews a variety of factors, including developments in foreign markets, the performance of U.S. securities markets, and the performance of instruments trading in U.S. markets that represent foreign securities and baskets of foreign securities. These securities are fair valued using a pricing service, using methods approved by the Board, that considers the correlation of the trading patterns of the foreign security to intraday trading in the U.S. markets, based on indices of domestic securities and other appropriate indicators such as prices of relevant American Depositary Receipts (“ADRs”) and futures contracts. The Valuation Committee, established by the Board, may also fair value securities in other situations, such as when a particular foreign market is closed but the Fund is open. The Fund uses outside pricing services to provide closing prices and information to evaluate and/or adjust those prices. As a means of evaluating its security valuation process, the Valuation Committee routinely compares closing prices, the next day’s opening prices in the same markets and adjusted prices.
Attempts to determine the fair value of securities introduce an element of subjectivity to the pricing of securities. As a result, the price of a security determined through fair valuation techniques may differ from the price quoted or published by other sources and may not accurately reflect the market value of the security when trading resumes. If a reliable market quotation becomes available for a security formerly valued through fair valuation techniques, the Manager compares the new market quotation to the fair value price to evaluate the effectiveness of the Fund’s fair valuation procedures. If any significant discrepancies are found, the Manager may adjust the Fund’s fair valuation procedures.
Valuation Inputs
Various inputs may be used to determine the fair value of the Fund’s investments. These inputs are summarized in three broad levels for financial statement purposes. The inputs or methodologies used to value securities are not necessarily an indication of the risk associated with investing in those securities.
| Level 1 | - | Quoted prices in active markets for identical securities. | ||
| Level 2 | - | Prices determined using other significant observable inputs. These may include quoted prices for similar securities, interest rates, prepayment speeds, credit risk, and others. | ||
| Level 3 | - | Prices determined using other significant unobservable inputs. Unobservable inputs reflect the Fund’s own assumptions about the factors market participants would use in pricing an investment. | ||
36
American Beacon Small Cap Value FundSM
Notes to Financial Statements
October 31, 2019
Level 1 and Level 2 trading assets and trading liabilities, at fair value
Common stocks, ETFs, preferred securities, and financial derivative instruments, such as futures contracts that are traded on a national securities exchange, are stated at the last reported sale or settlement price on the day of valuation. To the extent these securities are actively traded and valuation adjustments are not applied, they are categorized as Level 1 of the fair value hierarchy. Preferred securities and other equities traded on inactive markets or valued by reference to similar instruments are generally categorized as Level 2 of the fair value hierarchy.
Investments in registeredopen-end investment management companies will be valued based upon the NAVs of such investments and are categorized as Level 1 of the fair value hierarchy.
Level 3 trading assets and trading liabilities, at fair value
The valuation techniques and significant inputs used in determining the fair values of financial instruments classified as Level 3 of the fair value hierarchy are as follows.
Securities and other assets for which market quotes are not readily available are valued at fair value as determined in good faith by the Board or persons acting at their direction and may be categorized as Level 3 of the fair value hierarchy.
Market quotes are considered not readily available in circumstances where there is an absence of current or reliable market-based data (e.g., trade information or broker quotes), including where events occur after the close of the relevant market, but prior to the Exchange close, that materially affect the values of the Fund’s securities or assets. In addition, market quotes are considered not readily available when, due to extraordinary circumstances, the exchanges or markets on which the securities trade, do not open for trading for the entire day and no other market prices are available. The Board has delegated to the Manager the responsibility for monitoring significant events that may materially affect the fair values of a Fund’s securities or assets and for determining whether the value of the applicable securities or assets should bere-evaluated in light of such significant events.
The Board has adopted methods for valuing securities and other assets in circumstances where market quotes are not readily available, and has delegated the responsibility for applying the valuation methods to the Manager. For instances in which daily market quotes are not readily available, investments may be valued pursuant to guidelines established by the Board. In the event that the security or asset cannot be valued, pursuant to one of the valuation methods established by the Board, the fair value of the security or asset will be determined in good faith by the Valuation Committee, generally based upon recommendations provided by the Manager.
When a Fund uses fair valuation methods applied by the Manager that use significant unobservable inputs to determine its NAV, the securities priced using this methodology are categorized as Level 3 of the fair value hierarchy. These methods may require subjective determinations about the value of a security. While the Trust’s policy is intended to result in a calculation of the Fund’s NAV that fairly reflects security values as of the time of pricing, the Trust cannot guarantee that values determined by the Board or persons acting at their direction would accurately reflect the price that a Fund could obtain for a security if it were to dispose of that security as of the time of pricing (for instance, in a forced or distressed sale). The prices used by a Fund may differ from the value that would be realized if the securities were sold.
4. Securities and Other Investments
American Depositary Receipts
ADRs are depositary receipts for foreign issuers in registered form traded in U.S. securities markets. Depositary receipts may not be denominated in the same currency as the securities into which they may be
37
American Beacon Small Cap Value FundSM
Notes to Financial Statements
October 31, 2019
converted. Investing in depositary receipts entails substantially the same risks as direct investment in foreign securities. There is generally less publicly available information about foreign companies and there may be less governmental regulation and supervision of foreign stock exchanges, brokers, and listed companies. In addition, such companies may use different accounting and financial standards (and certain currencies may become unavailable for transfer from a foreign currency), resulting in the Fund’s possible inability to convert immediately into U.S. currency proceeds realized upon the sale of portfolio securities of the affected foreign companies. In addition, the Fund may invest in unsponsored depositary receipts, the issuers of which are not obligated to disclose material information about the underlying securities to investors in the United States. Ownership of unsponsored depositary receipts may not entitle the Fund to the same benefits and rights as ownership of a sponsored depositary receipt or the underlying security.
Common Stock
Common stock generally takes the form of shares in a corporation which represent an ownership interest. It ranks below preferred stock and debt securities in claims for dividends and for assets of the company in a liquidation or bankruptcy. The value of a company’s common stock may fall as a result of factors directly relating to that company, such as decisions made by its management or decreased demand for the company’s products or services. A stock’s value may also decline because of factors affecting not just the company, but also companies in the same industry or sector. The price of a company’s stock may also be affected by changes in financial markets that are relatively unrelated to the company, such as changes in interest rates, currency exchange rates or industry regulation. Companies that elect to pay dividends on their common stock generally only do so after they invest in their own business and make required payments to bondholders and on other debt and preferred stock. Therefore, the value of a company’s common stock will usually be more volatile than its bonds, other debt and preferred stock. Common stock may be exchange-traded or OTC. OTC stock may be less liquid than exchange-traded stock.
Other Investment Company Securities and Other Exchange-Traded Products
The Fund may invest in shares of other investment companies, includingopen-end funds,closed-end funds, business development companies, ETFs, unit investment trusts, and other investment companies of the Trust. The Fund may invest in securities of an investment company advised by the Manager or asub-advisor. Investments in the securities of other investment companies may involve duplication of advisory fees and certain other expenses. By investing in another investment company, the Fund becomes a shareholder of that investment company. As a result, the Fund’s shareholders indirectly will bear the Fund’s proportionate share of the fees and expenses paid by shareholders of the other investment company, in addition to the fees and expenses the Fund’s shareholders directly bear in connection with the Fund’s own operations. Investments in other investment companies may involve the payment of substantial premiums above the value of such issuer’s portfolio securities.
Real Estate Investment Trusts
The Fund may own shares of real estate investment trusts (“REITs”) which report information on the source of their distributions annually. The Fundre-characterizes distributions received from REIT investments based on information provided by the REITs into the following categories: ordinary income, long-term capital gains, and return of capital. If information is not available on a timely basis from the REITs, there-characterization will be estimated based on available information, which may include the previous year allocation. If new or additional information becomes available from the REITs at a later date, are-characterization will be made the following year.
5. Financial Derivative Instruments
The Fund may utilize derivative instruments to gain market exposure on cash balances or reduce market exposure in anticipation of liquidity needs. When considering the Fund’s use of derivatives, it is important to note that the Fund does not use derivatives for the purpose of creating financial leverage.
38
American Beacon Small Cap Value FundSM
Notes to Financial Statements
October 31, 2019
Futures Contracts
Futures contracts are contracts to buy or sell a standard quantity of securities at a specified price on a future date. The Fund may enter into financial futures contracts as a method for keeping assets readily convertible to cash if needed to meet shareholder redemptions or for other needs while maintaining exposure to the stock or bond market, as applicable. The primary risks associated with the use of futures contracts are the possibility of illiquid markets or imperfect correlation between the values of the contracts and the underlying securities or that the counterparty will fail to perform its obligations.
Upon entering into a futures contract, the Fund is required to set aside or deposit with a broker an amount, termed the initial margin, which typically represents a portion of the face value of the futures contract. The Fund usually reflects this amount on the Schedule of Investments as a U.S. Treasury Bill held as collateral for futures contracts or as cash deposited with broker on the Statement of Assets and Liabilities. Payments to and from the broker, known as variation margin, are required to be made on a daily basis as the price of the futures contract fluctuates. Changes in initial settlement values are accounted for as unrealized appreciation (depreciation) until the contracts are terminated, at which time realized gains and losses are recognized. Futures contracts are valued at the most recent settlement price established each day by the exchange on which they are traded.
During the year ended October 31, 2019, the Fund entered into futures contracts primarily for exposing cash to markets.
The Fund’s average futures contracts outstanding fluctuate throughout the operating year as required to meet strategic requirements. The following table illustrates the average quarterly volume of futures contracts. For the purpose of this disclosure, volume is measured by contracts outstanding at each quarter end.
Average Futures Contracts Outstanding | ||||
Fund | Year Ended October 31, 2019 | |||
Small Cap Value | 2,749 | |||
The following is a summary of the fair valuations of the Fund’s derivative instruments categorized by risk exposure(1):
| Fair values of financial instruments on the Statement of Assets and Liabilities as of October 31, 2019: |
| ||||||||||||||||||||||||||||||||||||||||||||||||||||||
| Derivatives not accounted for as hedging instruments | |||||||||||||||||||||||||||||||||||||||||||||||||||||||
Assets: | Credit contracts | Foreign exchange contracts | Commodity contracts | Interest rate contracts | Equity contracts | Total | |||||||||||||||||||||||||||||||||||||||||||||||||
| Receivable for variation margin from open futures contracts(2) | $ | - | $ | - | $ | - | $ | - | $ | 1,163,077 | $ | 1,163,077 | |||||||||||||||||||||||||||||||||||||||||||
| The effect of financial derivative instruments on the Statement of Operations as of October 31, 2019: |
| ||||||||||||||||||||||||||||||||||||||||||||||||||||||
| Derivatives not accounted for as hedging instruments | |||||||||||||||||||||||||||||||||||||||||||||||||||||||
Realized gain (loss) from derivatives | Credit contracts | Foreign exchange contracts | Commodity contracts | Interest rate contracts | Equity contracts | Total | |||||||||||||||||||||||||||||||||||||||||||||||||
| Futures contracts | $ | - | $ | - | $ | - | $ | - | $ | (4,931,502 | ) | $ | (4,931,502 | ) | |||||||||||||||||||||||||||||||||||||||||
Net change in unrealized appreciation | Credit contracts | Foreign exchange contracts | Commodity contracts | Interest rate contracts | Equity contracts | Total | |||||||||||||||||||||||||||||||||||||||||||||||||
| Futures contracts | $ | - | $ | - | $ | - | $ | - | $ | 23,713,219 | $ | 23,713,219 | |||||||||||||||||||||||||||||||||||||||||||
(1)See Note 3 in the Notes to Financial Statements for additional information.
(2)Includes cumulative appreciation (depreciation) of futures contracts as reported in the Fund’s Schedule of Investments footnotes. Only current day’s variation margin is reported within the Statement of Assets and Liabilities.
39
American Beacon Small Cap Value FundSM
Notes to Financial Statements
October 31, 2019
Offsetting Assets and Liabilities
The Fund is a party to enforceable master netting agreements between brokers and counterparties which provide for the right to offset under certain circumstances. The Fund employs multiple money managers and counterparties and has elected not to offset qualifying financial and derivative instruments on the Statement of Assets and Liabilities, as such all financial and derivative instruments are presented on a gross basis. The impacts of netting arrangements that provide the right to offset are detailed below. The net amount represents the net receivable or payable that would be due from or to the counterparty in the event of default. Exposure from borrowings and other financing agreements such as repurchase agreements can only be netted across transactions governed by the same Master Agreement with the same legal entity. All amounts reported below represent the balance as of the report date, October 31, 2019.
| Offsetting of Financial and Derivative Assets as of October 31, 2019: | ||||||||||||
| Assets | Liabilities | |||||||||||
| Futures Contracts(1) | $ | 1,163,077 | $ | - | ||||||||
|
|
|
| |||||||||
| Total derivative assets and liabilities in the Statement of Assets and Liabilities | $ | 1,163,077 | $ | - | ||||||||
|
|
|
| |||||||||
| Derivatives not subject to a Master Netting Agreement or similar agreement (“MNA”) | $ | (1,163,077 | ) | $ | - | |||||||
|
|
|
| |||||||||
| Remaining Contractual Maturity of the Agreements As of October 31, 2019 | ||||||||||||||||||||||||||||||||||||
| Overnight and Continuous | <30 days | Between 30 & 90 days | >90 days | Total | ||||||||||||||||||||||||||||||||
Securities Lending Transactions | ||||||||||||||||||||||||||||||||||||
Common Stocks | $ | 85,718,589 | $ | - | $ | - | $ | - | $ | 85,718,589 | ||||||||||||||||||||||||||
|
|
|
|
|
|
|
|
|
| |||||||||||||||||||||||||||
Total Borrowings | $ | 85,718,589 | $ | - | $ | - | $ | - | $ | 85,718,589 | ||||||||||||||||||||||||||
|
|
|
|
|
|
|
|
|
| |||||||||||||||||||||||||||
Gross amount of recognized liabilities for securities lending transactions |
| $ | 85,718,589 | |||||||||||||||||||||||||||||||||
|
| |||||||||||||||||||||||||||||||||||
| (1) | Includes cumulative appreciation or (depreciation) of futures contracts as reported in the Schedule of Investments footnotes. Only current |
day’s variation margin is reported within the Statement of Assets and Liabilities.
6. Principal Risks
Investing in the Fund may involve certain risks including, but not limited to, those described below.
Equity Investments Risk
Equity securities are subject to market risk. The Fund’s investments in equity securities may include common stocks, preferred stocks, securities convertible into or exchangeable for common stocks, REITs, depositary receipts, and U.S. dollar-denominated foreign stocks traded on U.S. exchanges. Such investments may expose the Fund to additional risk. The value of a company’s common stock may fall as a result of factors affecting the company, companies in the same industry or sector, or the financial markets overall. Common stock generally is subordinate to preferred stock upon the liquidation or bankruptcy of the issuing company. Preferred stocks and convertible securities are sensitive to movements in interest rates. Preferred stocks may be less liquid than common stocks and, unlike common stocks, participation in the growth of an issuer may be limited. Distributions on preferred stocks generally are payable at the discretion of an issuer and after required payments to bond holders. Convertible securities are subject to the risk that the credit standing of the issuer may have an effect on the convertible securities’ investment value. Investments in REITs are subject to the risks associated with investing in the real estate industry such as adverse developments affecting the real estate industry and real property values. Depositary receipts and U.S. dollar-denominated foreign stocks traded on U.S. exchanges are subject to certain of the risks associated with investing directly in foreign securities, including, but not limited to, currency fluctuations and political and financial instability in the home country of a particular depositary receipt or foreign stock.
Foreign Investing and Emerging Markets Risk
Non-U.S. investments carry potential risks not associated with U.S. investments. Such risks include, but are not limited to: (1) currency exchange rate fluctuations, (2) political and financial instability, (3) less liquidity,
40
American Beacon Small Cap Value FundSM
Notes to Financial Statements
October 31, 2019
(4) lack of uniform accounting, auditing and financial reporting standards, (5) increased price volatility, (6) less government regulation and supervision of foreign stock exchanges, brokers and listed companies, and (7) delays in transaction settlement in some foreign markets. To the extent the Fund invests a significant portion of its assets in securities of a single country or region, it is more likely to be affected by events or conditions of that country or region. In addition, the economies and political environments of emerging market countries tend to be more unstable than those of developed countries, resulting in more volatile rates of return than the developed markets and substantially greater risk to investors. There may be very limited oversight of certain foreign banks or securities depositories that hold foreign securities and currency and the laws of certain countries may limit the ability to recover such assets if a foreign bank or depository or their agents goes bankrupt. When investing in emerging markets, the risks of investing in foreign securities are heightened. Emerging markets have unique risks that are greater than, or in addition to, investing in developed markets because emerging markets are generally smaller, less developed, less liquid and more volatile than the securities markets of the U.S. and other developed markets. There are also risks of: greater political uncertainties; an economy’s dependence on revenues from particular commodities or on international aid or development assistance; currency transfer restrictions; a limited number of potential buyers for such securities, resulting in increased volatility and limited liquidity for emerging market securities; trading suspensions; and delays and disruptions in securities settlement procedures. In addition, there may be less information available to make investment decisions and more volatile rates of return.
Futures Contracts Risk
Futures contracts are derivative instruments where one party pays a fixed price for an agreed amount of securities or other underlying assets at an agreed date. The use of such derivative instruments may expose the Fund to additional risks that it would not be subject to if it invested directly in the securities underlying those derivatives. Futures contracts may experience potentially dramatic price changes (losses) and imperfect correlation between the price of the contract and the underlying security or index, which will increase the volatility of the Fund and may involve a small investment of cash (the amount of initial and variation margin) relative to the magnitude of the risk assumed (the potential increase or decrease in the price of the futures contract).
Market Risk
Conditions in the U.S. and many foreign economies have resulted, and may continue to result, in certain instruments experiencing unusual liquidity issues, increased price volatility and, in some cases, credit downgrades and increased likelihood of default. These events have reduced the willingness and ability of some lenders to extend credit, and have made it more difficult for some borrowers to obtain financing on attractive terms, if at all. In some cases, traditional market participants have been less willing to make a market in some types of debt instruments, which has affected the liquidity of those instruments. During times of market turmoil, investors tend to look to the safety of securities issued or backed by the U.S. Treasury, causing the prices of these securities to rise and the yields to decline. Reduced liquidity in fixed income and credit markets may negatively affect many issuers worldwide. In addition, global economies and financial markets are becoming increasingly interconnected, which increases the possibilities that conditions in one country or region might adversely impact issuers in a different country or region. A rise in protectionist trade policies, and the possibility of changes to some international trade agreements, could affect the economies of many nations, including the United States, in ways that cannot necessarily be foreseen at the present time.
In response to the financial crisis, the U.S. and other governments and the Federal Reserve and certain foreign central banks have taken steps to support financial markets. In some countries where economic conditions are recovering, they are nevertheless perceived as still fragile. Withdrawal of government support, failure of efforts in response to the crisis, or investor perception that such efforts are not succeeding, could adversely impact the value and liquidity of certain securities. The severity or duration of adverse economic conditions may also be affected by policy changes made by governments or quasi-governmental organizations, including changes in tax laws. The impact of new financial regulation legislation on the markets and the practical implications for market participants may not be fully known for some time. Regulatory changes are causing some financial services
41
American Beacon Small Cap Value FundSM
Notes to Financial Statements
October 31, 2019
companies to exit long-standing lines of business, resulting in dislocations for other market participants. In addition, political and governmental events within the U.S. and abroad, such as the United States government’s inability at times to agree on a long-term budget and deficit reduction plan, the threat of a federal government shutdown and threats not to increase the federal government’s debt limit, may affect investor and consumer confidence and may adversely impact financial markets and the broader economy, perhaps suddenly and to a significant degree. The U.S. government has reduced the federal corporate income tax rates, and future legislative, regulatory and policy changes may result in more restrictions on international trade, less stringent prudential regulation of certain players in the financial markets, and significant new investments in infrastructure and national defense. Markets may react strongly to expectations about the changes in these policies, which could increase volatility, especially if the markets’ expectations for changes in government policies are not borne out.
Changes in market conditions will not have the same impact on all types of securities. Interest rates have been unusually low in recent years in the United States and abroad. Because there is little precedent for this situation, it is difficult to predict the impact of a significant rate increase on various markets. For example, because investors may buy securities or other investments with borrowed money, a significant increase in interest rates may cause a decline in the markets for those investments. Because of the sharp decline in the worldwide price of oil, there is a concern that oil producing nations may withdraw significant assets now held in U.S. Treasuries, which could force a substantial increase in interest rates. Regulators have expressed concern that rate increases may cause investors to sell fixed income securities faster than the market can absorb them, contributing to price volatility. In addition, there is a risk that the prices of goods and services in the U.S. and many foreign economies may decline over time, known as deflation (the opposite of inflation). Deflation may have an adverse effect on stock prices and creditworthiness and may make defaults on debt more likely. If a country’s economy slips into a deflationary pattern, it could last for a prolonged period and may be difficult to reverse.
The precise timing and the resulting impact of the United Kingdom’s departure from the European Union (the “EU”), commonly referred to as “Brexit,” are not yet known. The effect on the United Kingdom’s economy will likely depend on the nature of trade relations with the EU and other major economies following its exit, which are matters to be negotiated. The outcomes may cause increased volatility and have a significant adverse impact on world financial markets, other international trade agreements, and the United Kingdom and European economies, as well as the broader global economy for some time, which could significantly adversely affect the value of the Fund’s investments in the United Kingdom and Europe.
MultipleSub-Advisor Risk
The Manager may allocate the Fund’s assets among multiplesub-advisors, each of which is responsible for investing its allocated portion of the Fund’s assets. To a significant extent, the Fund’s performance will depend on the success of the Manager in allocating the Fund’s assets tosub-advisors and its selection and oversight of thesub-advisors. Because eachsub-advisor manages its allocated portion of the Fund independently from anothersub-advisor, the same security may be held in different portions of the Fund, or may be acquired for one portion of the Fund at a time when asub-advisor to another portion deems it appropriate to dispose of the security from that other portion, resulting in higher expenses without accomplishing any net result in the Fund’s holdings. Similarly, under some market conditions, onesub-advisor may believe that temporary, defensive investments in short-term instruments or cash are appropriate when anothersub-advisor believes continued exposure to the equity or debt markets is appropriate for its allocated portion of the Fund. Because eachsub-advisor directs the trading for its own portion of the Fund, and does not aggregate its transactions with those of the othersub-advisors, the Fund may incur higher brokerage costs than would be the case if a singlesub-adviser were managing the entire Fund. In addition, while the Manager seeks to allocate the Fund’s assets among the Fund’ssub-advisors in a manner that it believes is consistent with achieving the Fund’s investment objective(s), the Manager may be subject to potential conflicts of interest in allocating the Fund’s assets amongsub-advisors, due to factors that could impact the Manager’s revenues and profits.
42
American Beacon Small Cap Value FundSM
Notes to Financial Statements
October 31, 2019
Other Investment Companies Risk
The Fund may invest in shares of other registered investment companies, including money market funds, exchange-traded funds (“ETFs”). To the extent that the Fund invests in shares of other registered investment companies, the Fund will indirectly bear the fees and expenses, including for example, advisory and administrative fees, charged by those investment companies in addition to the Fund’s direct fees and expenses and will be subject to the risks associated with investments in those companies. For example, the Fund’s investments in money market funds are subject to interest rate risk, credit risk, and market risk. The Fund must rely on the investment company in which it invests to achieve its investment objective. If the investment company fails to achieve its investment objective, the value of the Fund’s investment may decline, adversely affecting the Fund’s performance. ETFs are subject to the following risks that do not apply to conventional funds: (1) the market price of an ETF’s shares may trade at a discount or premium to its NAV; (2) an active trading market for an ETF’s shares may not develop or be maintained; or (3) trading of an ETF’s shares may be halted if the listing exchange’s officials deem such action appropriate, the shares are delisted from the exchange, or the activation of market-wide “circuit breakers” (which are tied to large decreases in stock prices) halts stock trading generally. An ETF that tracks an index may not precisely replicate the returns of its benchmark index. To the extent the Fund invests in other investment companies that invest in equity securities, fixed-income securities and/or foreign securities, or that track an index, the Fund is subject to the risks associated with the underlying investments held by the investment company or the index fluctuations to which the investment company is subject. ETFs have expenses associated with their operation, typically including advisory fees. For example, the Funds’ investments in money market funds are subject to interest rate risk, credit risk, and market risk.
Sector Risk
Sector risk is the risk associated with a Fund holding a significant amount of investments in similar businesses, which would be similarly affected by particular economic or market events, which may, in certain circumstances, cause the value of the equity and debt securities of companies in a particular sector of the market to change. To the extent a Fund has substantial holdings within a particular sector, the risks to a Fund associated with that sector increase.
To the extent a Fund invests significantly in the financial services sector, the value of the Fund’s shares may be particularly vulnerable to factors affecting that sector, such as the availability and cost of capital funds, changes in interest rates, the rate of corporate and consumer debt defaults, extensive government regulation and price competition. The value of a Fund’s shares could experience significantly greater volatility than investment companies investing more broadly.
Securities Lending Risk
A Fund may lend its portfolio securities to brokers, dealers and financial institutions to seek income. There is a risk that a borrower may default on its obligations to return loaned securities; however, a Fund’s securities lending agent indemnifies the Fund against that risk. There is a risk that the assets of a Fund’s securities lending agent may be insufficient to satisfy any contractual indemnification requirements to the Fund. Borrowers of a Fund’s securities typically provide collateral in the form of cash that is reinvested in securities. A Fund will be responsible for the risks associated with the investment of cash collateral, including any collateral invested in an affiliated money market fund. A Fund may lose money on its investment of cash collateral or may fail to earn sufficient income on its investment to meet obligations to the borrower. In addition, delays may occur in the recovery of securities from borrowers, which could interfere with a Fund’s ability to vote proxies or to settle transactions and there is the risk of possible loss of rights in the collateral should the borrower fail financially. In any case in which the loaned securities are not returned to the Fund before anex-dividend date, the payment in lieu of the dividend that the Fund receives from the securities’ borrower would not be treated as a dividend for federal income tax purposes and thus would not qualify for treatment as “qualified dividend income”.
43
American Beacon Small Cap Value FundSM
Notes to Financial Statements
October 31, 2019
7. Federal Income and Excise Taxes
It is the policy of the Fund to qualify as a regulated investment company (“RIC”), by complying with all applicable provisions of Subchapter M of the Internal Revenue Code, as amended, and to make distributions of taxable income sufficient to relieve it from substantially all federal income and excise taxes. For federal income tax purposes, the Fund is treated as a single entity for the purpose of determining such qualification.
The Fund does not have any unrecorded tax liabilities in the accompanying financial statements. Each of the tax years in the four year period ended October 31, 2019 remain subject to examination by the Internal Revenue Service. If applicable, the Fund recognizes interest accrued related to unrecognized tax benefits in interest expense and penalties in “Other expenses” on the Statement of Operations.
The Fund may be subject to taxes imposed by countries in which it invests. Such taxes are generally based on returns of income earned or gains realized or repatriated. Taxes are accrued and applied to net investment income, net realized capital gains and net unrealized appreciation (depreciation), as applicable, as the income is earned or capital gains are recorded.
Dividends are categorized in accordance with income tax regulations which may treat certain transactions differently than U.S. GAAP. Accordingly, the character of distributions and composition of net assets for tax purposes may differ from those reflected in the accompanying financial statements.
The tax character of distributions paid were as follows:
| Year Ended October 31, 2019 | Year Ended October 31, 2018 | |||||||||||
Distributions paid from: |
| |||||||||||
Ordinary income* |
| |||||||||||
Institutional Class | $ | 91,820,913 | $ | 108,083,614 | ||||||||
Y Class | 6,588,024 | 7,511,690 | ||||||||||
Investor Class | 9,370,479 | 11,549,809 | ||||||||||
Advisor Class | 1,173,357 | 1,566,030 | ||||||||||
A Class | 1,198,755 | 1,244,711 | ||||||||||
C Class | 200,548 | 245,106 | ||||||||||
R6 Class | 19,595,965 | 8,023,251 | ||||||||||
Long-term capital gains |
| |||||||||||
Institutional Class | 418,972,041 | 375,907,244 | ||||||||||
Y Class | 31,360,867 | 26,964,201 | ||||||||||
Investor Class | 51,450,373 | 47,136,699 | ||||||||||
Advisor Class | 7,402,763 | 7,148,816 | ||||||||||
A Class | 6,832,813 | 5,171,162 | ||||||||||
C Class | 1,375,675 | 1,152,927 | ||||||||||
R6 Class | 88,036,083 | 27,490,528 | ||||||||||
|
|
|
| |||||||||
Total distributions paid | $ | 735,378,656 | $ | 629,195,788 | ||||||||
|
|
|
| |||||||||
* For tax purposes, short-term gains are considered ordinary income distributions.
As of October 31, 2019, the components of distributable earnings (deficits) on a tax basis were as follows:
Fund | Tax Cost | Unrealized Appreciation | Unrealized (Depreciation) | Net Unrealized Appreciation (Depreciation) | ||||||||||||
Small Cap Value | $ | 5,842,323,929 | $ | 923,554,132 | $ | (476,353,508 | ) | $ | 447,200,624 | |||||||
Fund | Net Unrealized Appreciation (Depreciation) | Undistributed Ordinary Income | Undistributed Long-Term Capital Gains | Accumulated Capital and Other (Losses) | Other Temporary Differences | Distributable Earnings | ||||||||||||||||||||||||||||||||||||||
| Small Cap Value | $ | 447,200,624 | $ | 58,096,707 | $ | 42,779,716 | $ | – | $ | 1 | $ | 548,077,048 | ||||||||||||||||||||||||||||||||
44
American Beacon Small Cap Value FundSM
Notes to Financial Statements
October 31, 2019
Financial reporting records are adjusted for permanent book/tax differences to reflect tax character. Financial records are not adjusted for temporary differences. The temporary differences between financial reporting andtax-basis reporting of unrealized appreciation (depreciation) are attributable primarily to the tax deferral of losses from wash sales, the realization for tax purposes of unrealized gains (losses) on certain derivative instruments, reclassifications of income from investments in real estate investment securities and publicly traded partnerships, and the realization for tax purposes of unrealized gains from passive foreign investment companies.
A shareholder of the Fund elected to receive securities rather than cash for their redemption proceeds. The Fund realized gains of $1,590,938 as a result of the in-kind distribution, as disclosed in the Statement of Operations for the year ended October 31, 2019. Those gains were not recognized for federal income tax purposes.
Due to inherent differences in the recognition of income, expenses, and realized gains (losses) under U.S. GAAP and federal income tax regulations, permanent differences between book and tax reporting have been identified and appropriately reclassified on the Statement of Assets and Liabilities.
Accordingly, the following amounts represent current year permanent differences derived from net realized gains from redemption of shares andtax-exempt interest and nondeductible expenses from investments in publicly traded partnerships as of October 31, 2019:
Fund | Paid-In-Capital | Distributable Earnings/(Deficits) | ||||||||||
| Small Cap Value | $ | 953,988 | $ | (953,988 | ) | |||||||
Under the Regulated Investment Company Modernization Act of 2010 (“RIC MOD”), net capital losses recognized by the Fund in taxable years beginning after December 22, 2010 are carried forward indefinitely and retain their character as short-term and/or long-term losses.
As of October 31, 2019, the Fund did not have any capital loss carryforwards.
8. Investment Transactions
The aggregate cost of purchases and proceeds from sales and maturities of investments, other than short-term obligations, for the year ended October 31, 2019 were as follows:
Fund | Purchases(non-U.S. Government Securities) | Sales(non-U.S. Government Securities) | ||||||||||
Small Cap Value | $ | 2,915,408,387 | $ | 3,143,849,969 | ||||||||
A summary of the Fund’s transactions in the USG Select Fund for the year ended October 31, 2019 were as follows:
Fund | Type of Transaction | October 31, 2018 Shares/Fair Value | Purchases | Sales | October 31, 2019 Shares/Fair Value | Dividend Income | ||||||||||||||||||||||||||||||||||||
| Small Cap Value | Direct | $ | 231,346,704 | $ | 2,201,302,929 | $ | 2,229,900,934 | $ | 202,748,699 | $ | 4,990,046 | |||||||||||||||||||||||||||||||
| Small Cap Value | Securities Lending | 131,390,683 | 788,290,622 | 833,962,716 | 85,718,589 | N/A | ||||||||||||||||||||||||||||||||||||
9. Securities Lending
The Fund may lend its securities to qualified financial institutions, such as certain broker-dealers, to earn additional income. The borrowers are required to secure their loans continuously with collateral in an amount at least equal to the fair value of the securities loaned, initially in an amount at least equal to 102% of the fair value
45
American Beacon Small Cap Value FundSM
Notes to Financial Statements
October 31, 2019
of domestic securities loaned and 105% of the fair value of international securities loaned. Collateral is monitored andmarked-to-market daily. Dailymark-to-market amounts are required to be paid to the borrower or received from the borrower by the end of the following business day. This one day settlement formark-to-market amounts may result in the collateral being temporarily less than the value of the securities on loan or temporarily more than the required minimum collateral.
To the extent that a loan is collateralized by cash, such cash collateral shall be invested by the securities lending agent (the “Agent”) in money market mutual funds and other short-term investments, provided the investments meet certain quality and diversification requirements. Securities purchased with cash collateral proceeds are listed in the Fund’s Schedule of Investments and the collateral is shown on the Statement of Assets and Liabilities as a payable.
Securities lending income is generated from the demand premium (if any) paid by the borrower to borrow a specific security and from the return on investment of cash collateral, reduced by negotiated rebate fees paid to the borrower and transaction costs. To the extent that a loan is secured bynon-cash collateral, securities lending income is generated as a demand premium reduced by transaction costs. The Fund, the Agent, and the Manager retained 80%, 10%, and 10%, respectively, of the income generated from securities lending.
While securities are on loan, the Fund continues to receive certain income associated with that security and any gain or loss in the market price that may occur during the term of the loan. In the case of domestic equities, the value of any dividend is received in the form of a substitute payment approximately equal to the dividend. In the case of foreign securities, a negotiated amount is received that is less than the actual dividend, but higher than the dividend amount minus the foreign tax that the Fund would be subject to on the dividend.
Securities lending transactions pose certain risks to the Fund, including that the borrower may not provide additional collateral when required or return the securities when due, that the value of the short-term investments will be less than the amount of cash collateral required to be returned to the borrower, thatnon-cash collateral may be subject to legal constraints in the event of a borrower bankruptcy, and that the cash collateral investments could become illiquid and unable to be used to return collateral to the borrower. The Fund could also experience delays and costs in gaining access to the collateral. The Fund bears the risk of any deficiency in the amount of the cash collateral available for return to the borrower and any action which impairs its ability to liquidatenon-cash collateral to satisfy a borrower default.
As of October 31, 2019, the value of outstanding securities on loan and the value of collateral were as follows:
Fund | Market Value of Securities on Loan | Cash Collateral Received | Non-Cash Collateral Received | Total Collateral Received | ||||||||||||||||||||||||
Small Cap Value | $ | 333,549,228 | $ | 85,718,589 | $ | 261,578,219 | $ | 347,296,808 | ||||||||||||||||||||
Cash collateral is listed on the Fund’s Schedule of Investments and is shown on the Statement of Assets and Liabilities. Income earned on these investments is included in “Income derived from securities lending” on the Statement of Operations.
Non-cash collateral received by the Fund may not be sold orre-pledged except to satisfy a borrower default. Therefore,non-cash collateral is not included on the Fund’s Schedule of Investments or Statement of Assets and Liabilities.
10. Borrowing Arrangements
Effective November 15, 2018 (the “Effective Date”), the Fund, along with certain other funds managed by the Manager (“Participating Funds”), entered into a committed revolving line of credit (the “Committed Line”) agreement with State Street Bank and Trust Company (the “Bank”) to be used to facilitate portfolio liquidity. The maximum borrowing amount under the Committed Line is $250 million with interest at a rate equal to the higher of
46
American Beacon Small Cap Value FundSM
Notes to Financial Statements
October 31, 2019
(a) one-month London Inter-Bank Offered Rate (“LIBOR”) plus 1.25% per annum or (b) the Federal Funds rate plus 1.25% per annum on amounts borrowed. Each of the Participating Funds paid a closing fee of $100,000 on the Effective Date and a quarterly commitment fee at a rate of 0.25% per annum on the unused portion of the Committed Line amount. The Committed Line expires November 14, 2019, unless extended by the Bank or terminated by the Participating Funds in accordance with the agreement.
On the Effective Date, the Fund, along with certain other Participating Funds managed by the Manager, also entered into an uncommitted discretionary demand revolving line of credit (the “Uncommitted Line”) agreement with the Bank to be used to facilitate portfolio liquidity. The maximum borrowing amount under the Uncommitted Line is $50 million with interest at a rate equal to the higher of(a) one-month LIBOR plus 1.25% per annum or (b) the Federal Funds rate plus 1.25% per annum on each outstanding loan. Each of the Participating Funds paid a closing fee of $35,000 on the Effective Date. The Uncommitted Line expires November 14, 2019 unless extended by the Bank or terminated by the Participating Funds in accordance with the agreement.
The Participating Funds paid administration, legal and arrangement fees, which are recognized as a component of “Other expenses” on the Statement of Operations, along with commitment fees, that have been allocated among the Participating Funds based on average daily net assets.
During the year ended October 31, 2019, the Fund did not utilize this facility.
11. Capital Share Transactions
The tables below summarize the activity in capital shares for each Class of the Fund:
| Institutional Class | ||||||||||||||||||||||||||||
| Year Ended October 31, | ||||||||||||||||||||||||||||
| 2019 | 2018 | |||||||||||||||||||||||||||
Small Cap Value Fund | Shares | Amount | Shares | Amount | ||||||||||||||||||||||||
| Shares sold | 40,786,232 | $ | 905,837,102 | 28,795,136 | $ | 813,629,911 | ||||||||||||||||||||||
| Reinvestment of dividends | 25,003,927 | 493,827,557 | 16,834,084 | 466,809,134 | ||||||||||||||||||||||||
| Shares redeemed | (65,827,022 | ) | (1,494,733,270 | ) | (56,760,794 | ) | (1,614,754,138 | ) | ||||||||||||||||||||
|
|
|
|
|
|
|
| |||||||||||||||||||||
| Net (decrease) in shares outstanding | (36,863 | ) | $ | (95,068,611 | ) | (11,131,574 | ) | $ | (334,315,093 | ) | ||||||||||||||||||
|
|
|
|
|
|
|
| |||||||||||||||||||||
| Y Class | ||||||||||||||||||||||||||||
| Year Ended October 31, | ||||||||||||||||||||||||||||
| 2019 | 2018 | |||||||||||||||||||||||||||
Small Cap Value Fund | Shares | Amount | Shares | Amount | ||||||||||||||||||||||||
| Shares sold | 4,930,647 | $ | 109,885,695 | 4,344,937 | $ | 121,072,021 | ||||||||||||||||||||||
| Reinvestment of dividends | 1,746,520 | 33,969,817 | 1,202,236 | 32,893,173 | ||||||||||||||||||||||||
| Shares redeemed | (8,766,203 | ) | (193,165,982 | ) | (5,295,216 | ) | (145,505,953 | ) | ||||||||||||||||||||
|
|
|
|
|
|
|
| |||||||||||||||||||||
| Net increase (decrease) in shares outstanding | (2,089,036 | ) | $ | (49,310,470 | ) | 251,957 | $ | 8,459,241 | ||||||||||||||||||||
|
|
|
|
|
|
|
| |||||||||||||||||||||
| Investor Class | ||||||||||||||||||||||||||||
| Year Ended October 31, | ||||||||||||||||||||||||||||
| 2019 | 2018 | |||||||||||||||||||||||||||
Small Cap Value Fund | Shares | Amount | Shares | Amount | ||||||||||||||||||||||||
| Shares sold | 3,715,943 | $ | 80,851,925 | 3,480,761 | $ | 95,354,068 | ||||||||||||||||||||||
| Reinvestment of dividends | 3,117,232 | 59,040,372 | 2,130,538 | 56,927,968 | ||||||||||||||||||||||||
| Shares redeemed | (9,082,162 | ) | (197,139,665 | ) | (7,367,883 | ) | (200,093,625 | ) | ||||||||||||||||||||
|
|
|
|
|
|
|
| |||||||||||||||||||||
| Net (decrease) in shares outstanding | (2,248,987 | ) | $ | (57,247,368 | ) | (1,756,584 | ) | $ | (47,811,589 | ) | ||||||||||||||||||
|
|
|
|
|
|
|
| |||||||||||||||||||||
| Advisor Class | ||||||||||||||||||||||||||||
| Year Ended October 31, | ||||||||||||||||||||||||||||
| 2019 | 2018 | |||||||||||||||||||||||||||
Small Cap Value Fund | Shares | Amount | Shares | Amount | ||||||||||||||||||||||||
| Shares sold | 670,232 | $ | 14,157,059 | 690,534 | $ | 18,573,884 | ||||||||||||||||||||||
| Reinvestment of dividends | 459,107 | 8,576,120 | 330,358 | 8,714,846 | ||||||||||||||||||||||||
| Shares redeemed | (1,433,579 | ) | (31,013,154 | ) | (1,403,591 | ) | (37,945,197 | ) | ||||||||||||||||||||
|
|
|
|
|
|
|
| |||||||||||||||||||||
| Net (decrease) in shares outstanding | (304,240 | ) | $ | (8,279,975 | ) | (382,699 | ) | $ | (10,656,467 | ) | ||||||||||||||||||
|
|
|
|
|
|
|
| |||||||||||||||||||||
47
American Beacon Small Cap Value FundSM
Notes to Financial Statements
October 31, 2019
| A Class | ||||||||||||||||||||||||||||
| Year Ended October 31, | ||||||||||||||||||||||||||||
| 2019 | 2018 | |||||||||||||||||||||||||||
Small Cap Value Fund | Shares | Amount | Shares | Amount | ||||||||||||||||||||||||
| Shares sold | 951,880 | $ | 20,693,725 | 1,187,223 | $ | 32,064,750 | ||||||||||||||||||||||
| Reinvestment of dividends | 428,578 | 7,950,119 | 241,813 | 6,345,165 | ||||||||||||||||||||||||
| Shares redeemed | (1,150,666 | ) | (24,626,471 | ) | (1,004,403 | ) | (26,949,383 | ) | ||||||||||||||||||||
|
|
|
|
|
|
|
| |||||||||||||||||||||
| Net increase in shares outstanding | 229,792 | $ | 4,017,373 | 424,633 | $ | 11,460,532 | ||||||||||||||||||||||
|
|
|
|
|
|
|
| |||||||||||||||||||||
| C Class | ||||||||||||||||||||||||||||
| Year Ended October 31, | ||||||||||||||||||||||||||||
| 2019 | 2018 | |||||||||||||||||||||||||||
Small Cap Value Fund | Shares | Amount | Shares | Amount | ||||||||||||||||||||||||
| Shares sold | 130,548 | $ | 2,643,117 | 94,040 | $ | 2,432,559 | ||||||||||||||||||||||
| Reinvestment of dividends | 85,773 | 1,516,472 | 53,040 | 1,339,793 | ||||||||||||||||||||||||
| Shares redeemed | (172,252 | ) | (3,441,752 | ) | (144,241 | ) | (3,717,938 | ) | ||||||||||||||||||||
|
|
|
|
|
|
|
| |||||||||||||||||||||
| Net increase in shares outstanding | 44,069 | $ | 717,837 | 2,839 | $ | 54,414 | ||||||||||||||||||||||
|
|
|
|
|
|
|
| |||||||||||||||||||||
| R6 Class | ||||||||||||||||||||||||||||
| Year Ended October 31, | ||||||||||||||||||||||||||||
| 2019 | 2018 | |||||||||||||||||||||||||||
Small Cap Value Fund | Shares | Amount | Shares | Amount | ||||||||||||||||||||||||
| Shares sold | 23,696,726 | $ | 529,458,678 | 26,568,807 | $ | 758,695,266 | ||||||||||||||||||||||
| Reinvestment of dividends | 5,232,882 | 103,297,087 | 1,281,161 | 35,513,778 | ||||||||||||||||||||||||
| Shares redeemed | (6,869,399 | ) | (157,591,249 | ) | (3,354,657 | ) | (94,064,119 | ) | ||||||||||||||||||||
|
|
|
|
|
|
|
| |||||||||||||||||||||
| Net increase in shares outstanding | 22,060,209 | $ | 475,164,516 | 24,495,311 | $ | 700,144,925 | ||||||||||||||||||||||
|
|
|
|
|
|
|
| |||||||||||||||||||||
12. Subsequent Events
Management has evaluated subsequent events for possible recognition or disclosure in the financial statements through the date the financial statements are issued. Management has determined that there are no material events that would require disclosure in the Fund’s financial statements through this date.
48
American Beacon Small Cap Value FundSM
Financial Highlights
(For a share outstanding throughout the period)
| Institutional Class | ||||||||||||||||||||||||||||||||||||
| Year Ended October 31, | ||||||||||||||||||||||||||||||||||||
| 2019 | 2018 | 2017 | 2016A | 2015 | ||||||||||||||||||||||||||||||||
|
| |||||||||||||||||||||||||||||||||||
Net asset value, beginning of period | $ | 26.14 | $ | 29.51 | $ | 24.36 | $ | 24.69 | $ | 27.80 | ||||||||||||||||||||||||||
|
|
|
|
|
|
|
|
|
| |||||||||||||||||||||||||||
Income (loss) from investment operations: | ||||||||||||||||||||||||||||||||||||
Net investment income | 0.26 | 0.21 | 0.17 | 0.23 | 0.24 | |||||||||||||||||||||||||||||||
Net gains (losses) on investments (both realized and unrealized) | (0.25 | ) | (0.94 | ) | 5.83 | 0.79 | 0.02 | |||||||||||||||||||||||||||||
|
|
|
|
|
|
|
|
|
| |||||||||||||||||||||||||||
Total income (loss) from investment operations | 0.01 | (0.73 | ) | 6.00 | 1.02 | 0.26 | ||||||||||||||||||||||||||||||
|
|
|
|
|
|
|
|
|
| |||||||||||||||||||||||||||
Less distributions: | ||||||||||||||||||||||||||||||||||||
Dividends from net investment income | (0.18 | ) | (0.15 | ) | (0.23 | ) | (0.20 | ) | (0.19 | ) | ||||||||||||||||||||||||||
Distributions from net realized gains | (2.84 | ) | (2.49 | ) | (0.62 | ) | (1.15 | ) | (3.18 | ) | ||||||||||||||||||||||||||
|
|
|
|
|
|
|
|
|
| |||||||||||||||||||||||||||
Total distributions | (3.02 | ) | (2.64 | ) | (0.85 | ) | (1.35 | ) | (3.37 | ) | ||||||||||||||||||||||||||
|
|
|
|
|
|
|
|
|
| |||||||||||||||||||||||||||
Net asset value, end of period | $ | 23.13 | $ | 26.14 | $ | 29.51 | $ | 24.36 | $ | 24.69 | ||||||||||||||||||||||||||
|
|
|
|
|
|
|
|
|
| |||||||||||||||||||||||||||
Total returnB | 2.01 | % | (2.96 | )% | 24.80 | % | 4.58 | % | 0.87 | % | ||||||||||||||||||||||||||
|
|
|
|
|
|
|
|
|
| |||||||||||||||||||||||||||
Ratios and supplemental data: | ||||||||||||||||||||||||||||||||||||
Net assets, end of period | $ | 4,073,332,655 | $ | 4,604,864,422 | $ | 5,527,380,111 | $ | 4,717,291,753 | $ | 4,313,522,956 | ||||||||||||||||||||||||||
Ratios to average net assets: | ||||||||||||||||||||||||||||||||||||
Expenses, before reimbursements | 0.83 | % | 0.80 | % | 0.82 | % | 0.83 | % | 0.81 | % | ||||||||||||||||||||||||||
Expenses, net of reimbursements | 0.83 | % | 0.80 | % | 0.82 | % | 0.83 | % | 0.81 | % | ||||||||||||||||||||||||||
Net investment income, before expense reimbursements | 1.07 | % | 0.66 | % | 0.58 | % | 1.01 | % | 0.99 | % | ||||||||||||||||||||||||||
Net investment income, net of reimbursements | 1.07 | % | 0.66 | % | 0.58 | % | 1.01 | % | 0.99 | % | ||||||||||||||||||||||||||
Portfolio turnover rate | 48 | % | 69 | % | 48 | % | 53 | % | 47 | % | ||||||||||||||||||||||||||
| A | On June 20, 2016, Dreman Value Management, LLC was terminated and ceased managing assets of the Small Cap Value Fund, and was replaced by Foundry Partners, LLC. |
| B | Based on net asset value, which does not reflect the sales charge, redemption fee, or contingent deferred sales charge, if applicable. May include adjustments in accordance with U.S. GAAP and as such, the net asset value for reporting purposes and the returns based upon those net asset values may differ from the net asset value and returns for shareholder transactions. |
See accompanying notes
49
American Beacon Small Cap Value FundSM
Financial Highlights
(For a share outstanding throughout the period)
| Y Class | ||||||||||||||||||||||||||||||||||||
| Year Ended October 31, | ||||||||||||||||||||||||||||||||||||
| 2019 | 2018 | 2017 | 2016A | 2015 | ||||||||||||||||||||||||||||||||
|
| |||||||||||||||||||||||||||||||||||
Net asset value, beginning of period | $ | 25.77 | $ | 29.13 | $ | 24.06 | $ | 24.41 | $ | 27.52 | ||||||||||||||||||||||||||
|
|
|
|
|
|
|
|
|
| |||||||||||||||||||||||||||
Income (loss) from investment operations: | ||||||||||||||||||||||||||||||||||||
Net investment income | 0.26 | 0.17 | 0.12 | 0.23 | 0.23 | |||||||||||||||||||||||||||||||
Net gains (losses) on investments (both realized and unrealized) | (0.27 | ) | (0.90 | ) | 5.78 | 0.76 | 0.01 | |||||||||||||||||||||||||||||
|
|
|
|
|
|
|
|
|
| |||||||||||||||||||||||||||
Total income (loss) from investment operations | (0.01 | ) | (0.73 | ) | 5.90 | 0.99 | 0.24 | |||||||||||||||||||||||||||||
|
|
|
|
|
|
|
|
|
| |||||||||||||||||||||||||||
Less distributions: | ||||||||||||||||||||||||||||||||||||
Dividends from net investment income | (0.16 | ) | (0.14 | ) | (0.21 | ) | (0.19 | ) | (0.17 | ) | ||||||||||||||||||||||||||
Distributions from net realized gains | (2.84 | ) | (2.49 | ) | (0.62 | ) | (1.15 | ) | (3.18 | ) | ||||||||||||||||||||||||||
|
|
|
|
|
|
|
|
|
| |||||||||||||||||||||||||||
Total distributions | (3.00 | ) | (2.63 | ) | (0.83 | ) | (1.34 | ) | (3.35 | ) | ||||||||||||||||||||||||||
|
|
|
|
|
|
|
|
|
| |||||||||||||||||||||||||||
Net asset value, end of period | $ | 22.76 | $ | 25.77 | $ | 29.13 | $ | 24.06 | $ | 24.41 | ||||||||||||||||||||||||||
|
|
|
|
|
|
|
|
|
| |||||||||||||||||||||||||||
Total returnB | 1.93 | % | (3.03 | )% | 24.70 | % | 4.49 | % | 0.79 | % | ||||||||||||||||||||||||||
|
|
|
|
|
|
|
|
|
| |||||||||||||||||||||||||||
Ratios and supplemental data: |
| |||||||||||||||||||||||||||||||||||
Net assets, end of period | $ | 254,599,477 | $ | 342,125,601 | $ | 379,409,116 | $ | 296,082,333 | $ | 251,360,287 | ||||||||||||||||||||||||||
Ratios to average net assets: | ||||||||||||||||||||||||||||||||||||
Expenses, before reimbursements | 0.90 | % | 0.87 | % | 0.90 | % | 0.90 | % | 0.90 | % | ||||||||||||||||||||||||||
Expenses, net of reimbursements | 0.90 | % | 0.87 | % | 0.90 | % | 0.90 | % | 0.90 | % | ||||||||||||||||||||||||||
Net investment income, before expense reimbursements | 1.00 | % | 0.59 | % | 0.50 | % | 0.94 | % | 0.90 | % | ||||||||||||||||||||||||||
Net investment income, net of reimbursements | 1.00 | % | 0.59 | % | 0.50 | % | 0.94 | % | 0.90 | % | ||||||||||||||||||||||||||
Portfolio turnover rate | 48 | % | 69 | % | 48 | % | 53 | % | 47 | % | ||||||||||||||||||||||||||
| A | On June 20, 2016, Dreman Value Management, LLC was terminated and ceased managing assets of the Small Cap Value Fund, and was replaced by Foundry Partners, LLC. |
| B | Based on net asset value, which does not reflect the sales charge, redemption fee, or contingent deferred sales charge, if applicable. May include adjustments in accordance with U.S. GAAP and as such, the net asset value for reporting purposes and the returns based upon those net asset values may differ from the net asset value and returns for shareholder transactions. |
See accompanying notes
50
American Beacon Small Cap Value FundSM
Financial Highlights
(For a share outstanding throughout the period)
| Investor Class | ||||||||||||||||||||||||||||||||||||
| Year Ended October 31, | ||||||||||||||||||||||||||||||||||||
| 2019 | 2018 | 2017 | 2016A | 2015 | ||||||||||||||||||||||||||||||||
|
| |||||||||||||||||||||||||||||||||||
Net asset value, beginning of period | $ | 25.12 | $ | 28.46 | $ | 23.52 | $ | 23.86 | $ | 26.96 | ||||||||||||||||||||||||||
|
|
|
|
|
|
|
|
|
| |||||||||||||||||||||||||||
Income (loss) from investment operations: | ||||||||||||||||||||||||||||||||||||
Net investment income | 0.22 | 0.11 | 0.11 | 0.19 | 0.18 | |||||||||||||||||||||||||||||||
Net gains (losses) on investments (both realized and unrealized) | (0.29 | ) | (0.89 | ) | 5.60 | 0.73 | (0.02 | ) | ||||||||||||||||||||||||||||
|
|
|
|
|
|
|
|
|
| |||||||||||||||||||||||||||
Total income (loss) from investment operations | (0.07 | ) | (0.78 | ) | 5.71 | 0.92 | 0.16 | |||||||||||||||||||||||||||||
|
|
|
|
|
|
|
|
|
| |||||||||||||||||||||||||||
Less distributions: | ||||||||||||||||||||||||||||||||||||
Dividends from net investment income | �� | (0.09 | ) | (0.07 | ) | (0.15 | ) | (0.11 | ) | (0.08 | ) | |||||||||||||||||||||||||
Distributions from net realized gains | (2.84 | ) | (2.49 | ) | (0.62 | ) | (1.15 | ) | (3.18 | ) | ||||||||||||||||||||||||||
|
|
|
|
|
|
|
|
|
| |||||||||||||||||||||||||||
Total distributions | (2.93 | ) | (2.56 | ) | (0.77 | ) | (1.26 | ) | (3.26 | ) | ||||||||||||||||||||||||||
|
|
|
|
|
|
|
|
|
| |||||||||||||||||||||||||||
Net asset value, end of period | $ | 22.12 | $ | 25.12 | $ | 28.46 | $ | 23.52 | $ | 23.86 | ||||||||||||||||||||||||||
|
|
|
|
|
|
|
|
|
| |||||||||||||||||||||||||||
Total returnB | 1.67 | % | (3.28 | )% | 24.43 | % | 4.27 | % | 0.50 | % | ||||||||||||||||||||||||||
|
|
|
|
|
|
|
|
|
| |||||||||||||||||||||||||||
Ratios and supplemental data: |
| |||||||||||||||||||||||||||||||||||
Net assets, end of period | $ | 424,569,237 | $ | 538,602,473 | $ | 660,241,571 | $ | 617,552,712 | $ | 723,044,801 | ||||||||||||||||||||||||||
Ratios to average net assets: | ||||||||||||||||||||||||||||||||||||
Expenses, before reimbursements | 1.14 | % | 1.13 | % | 1.12 | % | 1.14 | % | 1.15 | % | ||||||||||||||||||||||||||
Expenses, net of reimbursements | 1.14 | % | 1.13 | % | 1.12 | % | 1.14 | % | 1.15 | % | ||||||||||||||||||||||||||
Net investment income, before expense reimbursements | 0.76 | % | 0.33 | % | 0.27 | % | 0.70 | % | 0.67 | % | ||||||||||||||||||||||||||
Net investment income, net of reimbursements | 0.76 | % | 0.33 | % | 0.27 | % | 0.70 | % | 0.67 | % | ||||||||||||||||||||||||||
Portfolio turnover rate | 48 | % | 69 | % | 48 | % | 53 | % | 47 | % | ||||||||||||||||||||||||||
| A | On June 20, 2016, Dreman Value Management, LLC was terminated and ceased managing assets of the Small Cap Value Fund, and was replaced by Foundry Partners, LLC. |
| B | Based on net asset value, which does not reflect the sales charge, redemption fee, or contingent deferred sales charge, if applicable. May include adjustments in accordance with U.S. GAAP and as such, the net asset value for reporting purposes and the returns based upon those net asset values may differ from the net asset value and returns for shareholder transactions. |
See accompanying notes
51
American Beacon Small Cap Value FundSM
Financial Highlights
(For a share outstanding throughout the period)
| Advisor ClassA | ||||||||||||||||||||||||||||||||||||
| Year Ended October 31, | ||||||||||||||||||||||||||||||||||||
| 2019 | 2018 | 2017 | 2016B | 2015 | ||||||||||||||||||||||||||||||||
|
| |||||||||||||||||||||||||||||||||||
Net asset value, beginning of period | $ | 24.77 | $ | 28.09 | $ | 23.22 | $ | 23.60 | $ | 26.69 | ||||||||||||||||||||||||||
|
|
|
|
|
|
|
|
|
| |||||||||||||||||||||||||||
Income (loss) from investment operations: | ||||||||||||||||||||||||||||||||||||
Net investment income | 0.14 | 0.06 | 0.03 | 0.12 | 0.13 | |||||||||||||||||||||||||||||||
Net gains (losses) on investments (both realized and unrealized) | (0.25 | ) | (0.88 | ) | 5.57 | 0.73 | 0.01 | |||||||||||||||||||||||||||||
|
|
|
|
|
|
|
|
|
| |||||||||||||||||||||||||||
Total income (loss) from investment operations | (0.11 | ) | (0.82 | ) | 5.60 | 0.85 | 0.14 | |||||||||||||||||||||||||||||
|
|
|
|
|
|
|
|
|
| |||||||||||||||||||||||||||
Less distributions: | ||||||||||||||||||||||||||||||||||||
Dividends from net investment income | (0.03 | ) | (0.01 | ) | (0.11 | ) | (0.08 | ) | (0.05 | ) | ||||||||||||||||||||||||||
Distributions from net realized gains | (2.84 | ) | (2.49 | ) | (0.62 | ) | (1.15 | ) | (3.18 | ) | ||||||||||||||||||||||||||
|
|
|
|
|
|
|
|
|
| |||||||||||||||||||||||||||
Total distributions | (2.87 | ) | (2.50 | ) | (0.73 | ) | (1.23 | ) | (3.23 | ) | ||||||||||||||||||||||||||
|
|
|
|
|
|
|
|
|
| |||||||||||||||||||||||||||
Net asset value, end of period | $ | 21.79 | $ | 24.77 | $ | 28.09 | $ | 23.22 | $ | 23.60 | ||||||||||||||||||||||||||
|
|
|
|
|
|
|
|
|
| |||||||||||||||||||||||||||
Total returnC | 1.48 | % | (3.44 | )% | 24.26 | % | 4.01 | % | 0.41 | % | ||||||||||||||||||||||||||
|
|
|
|
|
|
|
|
|
| |||||||||||||||||||||||||||
Ratios and supplemental data: |
| |||||||||||||||||||||||||||||||||||
Net assets, end of period | $ | 61,618,406 | $ | 77,578,775 | $ | 98,718,359 | $ | 110,205,158 | $ | 98,224,328 | ||||||||||||||||||||||||||
Ratios to average net assets: | ||||||||||||||||||||||||||||||||||||
Expenses, before reimbursements | 1.34 | % | 1.28 | % | 1.30 | % | 1.31 | % | 1.31 | % | ||||||||||||||||||||||||||
Expenses, net of reimbursements | 1.34 | % | 1.28 | % | 1.30 | % | 1.31 | % | 1.31 | % | ||||||||||||||||||||||||||
Net investment income, before expense reimbursements | 0.56 | % | 0.18 | % | 0.11 | % | 0.53 | % | 0.51 | % | ||||||||||||||||||||||||||
Net investment income, net of reimbursements | 0.56 | % | 0.18 | % | 0.11 | % | 0.53 | % | 0.51 | % | ||||||||||||||||||||||||||
Portfolio turnover rate | 48 | % | 69 | % | 48 | % | 53 | % | 47 | % | ||||||||||||||||||||||||||
| A | On January 15, 2016, the Retirement Class closed and the assets were merged into the Advisor Class. |
| B | On June 20, 2016, Dreman Value Management, LLC was terminated and ceased managing assets of the Small Cap Value Fund, and was replaced by Foundry Partners, LLC. |
| C | Based on net asset value, which does not reflect the sales charge, redemption fee, or contingent deferred sales charge, if applicable. May include adjustments in accordance with U.S. GAAP and as such, the net asset value for reporting purposes and the returns based upon those net asset values may differ from the net asset value and returns for shareholder transactions. |
See accompanying notes
52
American Beacon Small Cap Value FundSM
Financial Highlights
(For a share outstanding throughout the period)
| A Class | ||||||||||||||||||||||||||||||||||||
| Year Ended October 31, | ||||||||||||||||||||||||||||||||||||
| 2019 | 2018 | 2017 | 2016A | 2015 | ||||||||||||||||||||||||||||||||
|
| |||||||||||||||||||||||||||||||||||
Net asset value, beginning of period | $ | 24.65 | $ | 27.99 | $ | 23.14 | $ | 23.54 | $ | 26.63 | ||||||||||||||||||||||||||
|
|
|
|
|
|
|
|
|
| |||||||||||||||||||||||||||
Income (loss) from investment operations: | ||||||||||||||||||||||||||||||||||||
Net investment income | 0.14 | 0.07 | 0.07 | 0.15 | 0.13 | |||||||||||||||||||||||||||||||
Net gains (losses) on investments (both realized and unrealized) | (0.24 | ) | (0.86 | ) | 5.53 | 0.73 | 0.02 | |||||||||||||||||||||||||||||
|
|
|
|
|
|
|
|
|
| |||||||||||||||||||||||||||
Total income (loss) from investment operations | (0.10 | ) | (0.79 | ) | 5.60 | 0.88 | 0.15 | |||||||||||||||||||||||||||||
|
|
|
|
|
|
|
|
|
| |||||||||||||||||||||||||||
Less distributions: | ||||||||||||||||||||||||||||||||||||
Dividends from net investment income | (0.07 | ) | (0.06 | ) | (0.13 | ) | (0.13 | ) | (0.06 | ) | ||||||||||||||||||||||||||
Distributions from net realized gains | (2.84 | ) | (2.49 | ) | (0.62 | ) | (1.15 | ) | (3.18 | ) | ||||||||||||||||||||||||||
|
|
|
|
|
|
|
|
|
| |||||||||||||||||||||||||||
Total distributions | (2.91 | ) | (2.55 | ) | (0.75 | ) | (1.28 | ) | (3.24 | ) | ||||||||||||||||||||||||||
|
|
|
|
|
|
|
|
|
| |||||||||||||||||||||||||||
Net asset value, end of period | $ | 21.64 | $ | 24.65 | $ | 27.99 | $ | 23.14 | $ | 23.54 | ||||||||||||||||||||||||||
|
|
|
|
|
|
|
|
|
| |||||||||||||||||||||||||||
Total returnB | 1.56 | % | (3.37 | )% | 24.36 | % | 4.17 | % | 0.45 | % | ||||||||||||||||||||||||||
|
|
|
|
|
|
|
|
|
| |||||||||||||||||||||||||||
Ratios and supplemental data: |
| |||||||||||||||||||||||||||||||||||
Net assets, end of period | $ | 63,246,155 | $ | 66,380,615 | $ | 63,481,305 | $ | 63,277,387 | $ | 54,815,183 | ||||||||||||||||||||||||||
Ratios to average net assets: | ||||||||||||||||||||||||||||||||||||
Expenses, before reimbursements | 1.26 | % | 1.20 | % | 1.20 | % | 1.21 | % | 1.21 | % | ||||||||||||||||||||||||||
Expenses, net of reimbursements | 1.26 | % | 1.20 | % | 1.20 | % | 1.21 | % | 1.22 | % | ||||||||||||||||||||||||||
Net investment income, before expense reimbursements | 0.64 | % | 0.25 | % | 0.20 | % | 0.64 | % | 0.56 | % | ||||||||||||||||||||||||||
Net investment income, net of reimbursements | 0.64 | % | 0.25 | % | 0.20 | % | 0.64 | % | 0.54 | % | ||||||||||||||||||||||||||
Portfolio turnover rate | 48 | % | 69 | % | 48 | % | 53 | % | 47 | % | ||||||||||||||||||||||||||
| A | On June 20, 2016, Dreman Value Management, LLC was terminated and ceased managing assets of the Small Cap Value Fund, and was replaced by Foundry Partners, LLC. |
| B | Based on net asset value, which does not reflect the sales charge, redemption fee, or contingent deferred sales charge, if applicable. May include adjustments in accordance with U.S. GAAP and as such, the net asset value for reporting purposes and the returns based upon those net asset values may differ from the net asset value and returns for shareholder transactions. |
See accompanying notes
53
American Beacon Small Cap Value FundSM
Financial Highlights
(For a share outstanding throughout the period)
| C Class | ||||||||||||||||||||||||||||||||||||
| Year Ended October 31, | ||||||||||||||||||||||||||||||||||||
| 2019 | 2018 | 2017 | 2016A | 2015 | ||||||||||||||||||||||||||||||||
|
| |||||||||||||||||||||||||||||||||||
Net asset value, beginning of period | $ | 23.60 | $ | 26.98 | $ | 22.39 | $ | 22.84 | $ | 26.05 | ||||||||||||||||||||||||||
|
|
|
|
|
|
|
|
|
| |||||||||||||||||||||||||||
Income (loss) from investment operations: | ||||||||||||||||||||||||||||||||||||
Net investment income (loss) | (0.01 | )D | (0.08 | ) | (0.14 | ) | (0.02 | ) | 0.03 | |||||||||||||||||||||||||||
Net gains (losses) on investments (both realized and unrealized) | (0.24 | ) | (0.81 | ) | 5.35 | 0.72 | (0.06 | ) | ||||||||||||||||||||||||||||
|
|
|
|
|
|
|
|
|
| |||||||||||||||||||||||||||
Total income (loss) from investment operations | (0.25 | ) | (0.89 | ) | 5.21 | 0.70 | (0.03 | ) | ||||||||||||||||||||||||||||
|
|
|
|
|
|
|
|
|
| |||||||||||||||||||||||||||
Less distributions: | ||||||||||||||||||||||||||||||||||||
Dividends from net investment income | - | - | - | - | - | |||||||||||||||||||||||||||||||
Distributions from net realized gains | (2.84 | ) | (2.49 | ) | (0.62 | ) | (1.15 | ) | (3.18 | ) | ||||||||||||||||||||||||||
|
|
|
|
|
|
|
|
|
| |||||||||||||||||||||||||||
Total distributions | (2.84 | ) | (2.49 | ) | (0.62 | ) | (1.15 | ) | (3.18 | ) | ||||||||||||||||||||||||||
|
|
|
|
|
|
|
|
|
| |||||||||||||||||||||||||||
Net asset value, end of period | $ | 20.51 | $ | 23.60 | $ | 26.98 | $ | 22.39 | $ | 22.84 | ||||||||||||||||||||||||||
|
|
|
|
|
|
|
|
|
| |||||||||||||||||||||||||||
Total returnB | 0.85 | % | (3.89 | )% | 23.39 | % | 3.42 | % | (0.31 | )% | ||||||||||||||||||||||||||
|
|
|
|
|
|
|
|
|
| |||||||||||||||||||||||||||
Ratios and supplemental data: |
| |||||||||||||||||||||||||||||||||||
Net assets, end of period | $ | 12,619,613 | $ | 13,480,297 | $ | 15,335,554 | $ | 11,938,196 | $ | 11,718,580 | ||||||||||||||||||||||||||
Ratios to average net assets: | ||||||||||||||||||||||||||||||||||||
Expenses, before reimbursements | 1.95 | % | 1.86 | % | 1.96 | % | 1.96 | % | 1.97 | % | ||||||||||||||||||||||||||
Expenses, net of reimbursements | 1.95 | %C | 1.76 | % | 1.96 | % | 1.96 | % | 1.98 | % | ||||||||||||||||||||||||||
Net investment income (loss), before expense reimbursements | (0.06 | )% | (0.41 | )% | (0.58 | )% | (0.12 | )% | (0.17 | )% | ||||||||||||||||||||||||||
Net investment income (loss), net of reimbursements | (0.06 | )% | (0.31 | )% | (0.58 | )% | (0.12 | )% | (0.17 | )% | ||||||||||||||||||||||||||
Portfolio turnover rate | 48 | % | 69 | % | 48 | % | 53 | % | 47 | % | ||||||||||||||||||||||||||
| A | On June 20, 2016, Dreman Value Management, LLC was terminated and ceased managing assets of the Small Cap Value Fund, and was replaced by Foundry Partners, LLC. |
| B | Based on net asset value, which does not reflect the sales charge, redemption fee, or contingent deferred sales charge, if applicable. May include adjustments in accordance with U.S. GAAP and as such, the net asset value for reporting purposes and the returns based upon those net asset values may differ from the net asset value and returns for shareholder transactions. |
| C | This ratio does not include a voluntary reimbursement of service fees as included in the prior year. |
| D | Per share amounts have been calculated using the average shares method. |
See accompanying notes
54
American Beacon Small Cap Value FundSM
Financial Highlights
(For a share outstanding throughout the period)
| R6 Class | ||||||||||||||||||||
| Year Ended October 31, | February 28, 2017A to October 31, | |||||||||||||||||||
| 2019 | 2018 | 2017 | ||||||||||||||||||
|
| |||||||||||||||||||
Net asset value, beginning of period | $ | 26.14 | $ | 29.51 | $ | 28.03 | ||||||||||||||
|
|
|
|
|
| |||||||||||||||
Income from investment operations: | ||||||||||||||||||||
Net investment income (loss) | 0.26 | 0.22 | (0.00 | )B | ||||||||||||||||
Net gains (losses) on investments (both realized and unrealized) | (0.25 | ) | (0.94 | ) | 1.48 | |||||||||||||||
|
|
|
|
|
| |||||||||||||||
Total income (loss) from investment operations | 0.01 | (0.72 | ) | 1.48 | ||||||||||||||||
|
|
|
|
|
| |||||||||||||||
Less distributions: | ||||||||||||||||||||
Dividends from net investment income | (0.19 | ) | (0.16 | ) | - | |||||||||||||||
Distributions from net realized gains | (2.84 | ) | (2.49 | ) | - | |||||||||||||||
|
|
|
|
|
| |||||||||||||||
Total distributions | (3.03 | ) | (2.65 | ) | - | |||||||||||||||
|
|
|
|
|
| |||||||||||||||
Net asset value, end of period | $ | 23.12 | $ | 26.14 | $ | 29.51 | ||||||||||||||
|
|
|
|
|
| |||||||||||||||
Total returnC | 2.01 | % | (2.93 | )% | 5.28 | %D | ||||||||||||||
|
|
|
|
|
| |||||||||||||||
Ratios and supplemental data: |
| |||||||||||||||||||
Net assets, end of period | $ | 1,308,284,613 | $ | 902,241,051 | $ | 295,802,679 | ||||||||||||||
Ratios to average net assets: | ||||||||||||||||||||
Expenses, before reimbursements | 0.80 | % | 0.77 | % | 0.80 | %E | ||||||||||||||
Expenses, net of reimbursements | 0.80 | % | 0.77 | % | 0.80 | %E | ||||||||||||||
Net investment income (loss), before expense reimbursements | 1.08 | % | 0.66 | % | (0.04 | )%E | ||||||||||||||
Net investment income (loss), net of reimbursements | 1.08 | % | 0.66 | % | (0.04 | )%E | ||||||||||||||
Portfolio turnover rate | 48 | % | 69 | % | 48 | %F | ||||||||||||||
| A | Commencement of operations. |
| B | Amount represents less than $0.01 per share. |
| C | Based on net asset value, which does not reflect the sales charge, redemption fee, or contingent deferred sales charge, if applicable. May include adjustments in accordance with U.S. GAAP and as such, the net asset value for reporting purposes and the returns based upon those net asset values may differ from the net asset value and returns for shareholder transactions. |
| D | Not annualized. |
| E | Annualized. |
| F | Portfolio turnover rate is for the period from February 28, 2017 through October 31, 2017 and is not annualized. |
See accompanying notes
55
American Beacon FundsSM
October 31, 2019 (Unaudited)
Certain tax information regarding the Funds are required to be provided to shareholders based upon the Funds’ income and distributions for the taxable year ended October 31, 2019. The information and distributions reported herein may differ from information and distributions taxable to the shareholders for the calendar year ended December 31, 2019.
The Fund designated the following items with regard to distributions paid during the fiscal year ended October 31, 2019. All designations are based on financial information available as of this annual report and, accordingly, are subject to change. For each item, it is the intention of the Funds to designate the maximum amount permitted under the Internal Revenue Code of 1986, as amended, and the regulations there under.
Corporate Dividends-Received Deduction: | ||||
Small Cap Value | 59.18 | % | ||
Qualified Dividend Income: | ||||
Small Cap Value | 63.16 | % | ||
Long-Term Capital Gain Distributions: | ||||
Small Cap Value | $ | 605,430,615 | ||
Short-Term Capital Gain Distributions: | ||||
Small Cap Value | $ | 88,241,641 | ||
Shareholders will receive notification in January 2020 of the applicable tax information necessary to prepare their 2019 income tax returns.
56
Disclosure Regarding Approval of the Management and Investment Advisory Agreements(Unaudited)
Renewal and Approval of Management Agreement and Investment Advisory Agreements
Atin-person meetings held on May 9, 2019 and June4-5, 2019 (collectively, the “Meetings”), the Board of Trustees (“Board” or “Trustees”) considered and then, at its June 5, 2019 meeting, approved the renewal of:
(1) the Management Agreement between American Beacon Advisors, Inc. (“Manager”) and the American Beacon Funds (“Trust”), on behalf of the American Beacon Small Cap Value Fund (“Fund”); and
(2) the Investment Advisory Agreements among the Manager, the Trust, on behalf of the Fund, and each of Barrow, Hanley, Mewhinney & Strauss, LLC (“Barrow”), Brandywine Global Investment Management, LLC (“Brandywine”), Foundry Partners, LLC (“Foundry”), Hillcrest Asset Management LLC (“Hillcrest”), Hotchkis and Wiley Capital Management, LLC (“Hotchkis”), and Mellon Investments Corp. (“Mellon”) (each, a “subadvisor” and collectively, the “subadvisors”).
The Management Agreement and the Investment Advisory Agreements are referred to herein individually as an “Agreement” and collectively as the “Agreements.” In preparation for its consideration of the renewal of the Agreements, the Board undertook steps to gather and consider information furnished by the Manager, the subadvisors, Broadridge, Inc. (“Broadridge”) and Morningstar, Inc. (“Morningstar”).The Board, with the assistance of independent legal counsel, requested and received certain relevant information from the Manager and the subadvisors.
In advance of the Meetings, the Board’s Investment Committee and/or the Manager coordinated the production of information from Broadridge and Morningstar regarding the performance, fees and expenses of the Fund as well as information from the Manager and the subadvisors. At the Meetings, the Board considered the information provided in connection with the renewal process, as well as information furnished to the Board throughout the year at regular meetings of the Board and its committees. In connection with the Board’s consideration of the Agreements, the Board received and evaluated such information as they deemed necessary. This information is described below in the section summarizing the factors the Board considered in connection with its renewal and approval of the Agreements, as well as the section describing additional Board considerations with respect to the Fund.
The Board noted that the Manager provides management and administrative services to the Fund pursuant to the Management Agreement. The Board considered that many mutual funds have separate contracts governing each type of service and observed that, with respect to such mutual funds, the actual management fee rates provided by Broadridge for peer group funds reflect the combined advisory and administrative expenses, reduced by any fee waivers and/or reimbursements.
A firm may not have been able to, or opted not to, provide information in response to certain information requests, in which case the Board conducted its evaluation of the firm based on information that was provided. In such cases, the Board determined that the omission of any such information was not material to its considerations. The class of shares used for comparative performance purposes was the share class with the lowest expenses available for purchase by the general public, which was the Institutional Class. The Board also considered that the use of Institutional Class performance generally facilitates a meaningful comparison for expense and performance purposes.
Provided below is an overview of certain factors the Board considered in connection with its renewal and approval of the Agreements. The Board did not identify any particular information that was most relevant to its consideration to renew or approve each Agreement, and each Trustee may have afforded different weight to the various factors. Legal counsel to the independent Trustees provided the Board with a memorandum regarding its responsibilities pertaining to the renewal and approval of investment advisory contracts, such as the Agreements. The memorandum explained the regulatory requirements surrounding the Board’s process for evaluating investment advisors and the terms of investment advisory contracts. Based on its evaluation, the Board unanimously concluded that the terms of each Agreement were reasonable and fair and that the renewal and approval of each Agreement was in the best interests of the Fund and its shareholders.
57
Disclosure Regarding Approval of the Management and Investment Advisory Agreements(Unaudited)
Considerations With Respect to the Renewal of the Management Agreement and the Investment Advisory Agreements
In determining whether to renew the Agreements, the Board considered the Fund’s investment management and subadvisory relationships separately. In each instance, the Board considered, among other things, the following factors: (1) the nature, extent and quality of the services provided; (2) the investment performance of the Fund; (3) the costs incurred by the Manager in rendering services to the Fund and its resulting profits or losses; (4) comparisons of services and fee rates with contracts entered into by the Manager or the subadvisors or their affiliates with other clients (such as pension funds and other institutional clients); (5) the extent to which economies of scale, if any, have been taken into account in setting each fee rate schedule; (6) whether fee rate levels reflect economies of scale, if any, for the benefit of Fund investors; and (7) any other benefits derived or anticipated to be derived by the Manager or the subadvisors from their relationships with the Fund.
Nature, Extent and Quality of Services.With respect to the renewal of the Management Agreement, the Board considered, among other factors: the Fund’s long-term performance; the length of service of key investment personnel at the Manager; the cost structure of the Fund; the Manager’s culture of compliance and support that reduce risks to the Fund; the Manager’s quality of services; the Manager’s active role in monitoring and, as appropriate, recommending additional or replacement subadvisors; and the Manager’s efforts to retain key employees and maintain staffing levels.
With respect to the renewal of the Investment Advisory Agreements, the Board considered the level of staffing and the size of the subadvisors. The Board also considered the adequacy of the resources committed to the Fund by the subadvisors, and whether those resources were commensurate with the needs of the Fund and are sufficient to sustain appropriate levels of performance and compliance needs. In this regard, the Board considered the financial stability of the subadvisors. The Board also considered each subadvisor’s representations regarding its compliance program and code of ethics. Based on the foregoing information, the Board concluded that the nature, extent and quality of the management and advisory services provided by the Manager and the subadvisors were appropriate for the Fund.
Investment Performance.The Board evaluated the comparative information provided by Broadridge and the Manager regarding the performance of the Fund relative to its Broadridge performance universe, Morningstar Category, and benchmark index, as well as the Fund’s Morningstar rating. The Board considered the information provided by Broadridge regarding Broadridge’s independent methodology for selecting the Fund’s Broadridge performance universe. The Board also considered that the performance universes selected by Broadridge may not provide appropriate comparisons for the Fund. In addition, the Board considered the performance reports and discussions with management at Board and Committee meetings throughout the year. The Board also evaluated the comparative information provided by each subadvisor regarding the performance of its portion of the Fund relative to the performance of similar accounts or a composite of similar accounts managed by the subadvisor and the Fund’s benchmark index. In addition, the Board considered the Manager’s recommendation to continue to retain each subadvisor. A discussion regarding the Board’s considerations with respect to the Fund’s performance appears below under “Additional Considerations and Conclusions with Respect to the Fund.”
Costs of the Services Provided to the Fund and the Profits Realized by the Manager from its Relationship with the Fund.In analyzing the cost of services and profitability of the Manager, the Board considered the revenues earned and the expenses incurred by the Manager, before and after the payment of distribution-related expenses by the Manager. The profits or losses were noted at both an aggregate level for all funds within the group of mutual funds sponsored by the Manager (the “Fund Complex”) and at an individual Fund level, with the Manager earning a profit before and after the payment of distribution-related expenses by the Manager for the Fund. The Board also considered comparative information provided by the Manager regarding the Manager’s overall profitability with respect to the Fund Complex relative to the overall profitability of other firms in the mutual fund industry, as disclosed in publicly available sources. Although the Board noted that, in certain cases, the fee rates paid by other clients of the Manager are lower than the fee rates paid by the Fund, the Manager represented that,
58
Disclosure Regarding Approval of the Management and Investment Advisory Agreements(Unaudited)
among other matters, the difference is attributable to the fact that the Manager does not perform administrative services fornon-investment company clients and reflects the greater level of responsibility and regulatory requirements associated with managing the Fund.
The Board further considered that, with respect to the Fund, the Management Agreement provides for the Manager to receive a management fee comprised of an annualized fee that is retained by the Manager. In addition, the Board considered that the Manager receives fees for overseeing the securities lending program on behalf of the Fund. The Board also noted that certain share classes of the Fund maintain higher expense ratios in order to compensate third-party financial intermediaries.
In analyzing the fee rates charged by each subadvisor in connection with its investment advisory services to the Fund, the Board considered representations made by each subadvisor that the fee rate negotiated by the Manager is favorable relative to the fee rates that the subadvisor charges for any comparable client accounts. The Board did not request profitability data from the subadvisors because the Board did not view this data as imperative to its deliberations given thearm’s-length nature of the relationship between the Manager and the subadvisors with respect to the negotiation of subadvisory fee rates. In addition, the Board considered that it was advised that the subadvisors may not account for their profits on anaccount-by-account basis and that different firms likely employ different methodologies in connection with these calculations.
Based on the foregoing information, the Board concluded that the profitability levels of the Manager were reasonable in light of the services performed by the Manager. A discussion regarding the Board’s considerations with respect to the Fund’s fee rates is set forth below under “Additional Considerations and Conclusions with Respect to the Fund.”
Economies of Scale.In considering the reasonableness of the management and investment advisory fees rates, the Board considered whether economies of scale will be realized as the Fund grows and whether fee rate levels reflect these economies of scale for the benefit of Fund shareholders. In this regard, the Board considered that, with respect to each subadvisor, the Manager has negotiated breakpoints in the subadvisory fee rate for the Fund. In addition, the Board noted the Manager’s representation that the Management Agreement contains fee schedule breakpoints at higher asset levels with respect to the Fund. Based on the foregoing information, the Board concluded that the Manager and subadvisor fee rate schedules for the Fund provide for a reasonable sharing of benefits from any economies of scale with the Fund.
Benefits Derived from the Relationship with the Fund.The Board considered the“fall-out” or ancillary benefits that accrue to the Manager and/or the subadvisors as a result of the advisory relationships with the Fund, including greater exposure in the marketplace with respect to the Manager’s or a subadvisor’s investment process and expanding the level of assets under management by the Manager and the subadvisors. The Board also considered that the Manager may invest the Fund’s cash balances and cash collateral provided by the borrowers of the Fund’s securities in the American Beacon U.S. Government Money Market Select Fund, which the Manager manages directly. In addition, the Board noted that Barrow, Brandywine, Foundry, Hotchkis and Mellon benefit from soft dollar arrangements for proprietary and/or third-party research. Based on the foregoing information, the Board concluded that the potential benefits accruing to the Manager and the subadvisors by virtue of their relationships with the Fund appear to be fair and reasonable.
Additional Considerations and Conclusions with Respect to the Fund
The performance comparisons below were made in comparison to the Fund’s Broadridge performance universe and Morningstar Category. With respect to the Broadridge performance universe, the 1st Quintile represents the top 20 percent of the universe based on performance and the 5th Quintile representing the bottom 20 percent of the universe based on performance. References below to the Fund’s Broadridge performance universe are to the universe of mutual funds with a comparable investment classification/objective included in the analysis provided by Broadridge. In reviewing the performance, the Trustees viewed longer-term performance over
59
Disclosure Regarding Approval of the Management and Investment Advisory Agreements(Unaudited)
a full market cycle as the most important consideration, because relative performance over shorter periods may be significantly impacted by market or economic events and not necessarily reflective of manager skill.
The expense comparisons below were made in comparison to the Fund’s Broadridge expense universe and Broadridge expense group, with the 1st Quintile representing the lowest 20 percent of the universe or group based on lowest total expense and the 5th Quintile representing the highest 20 percent of the universe or group based on highest total expense. References below to the Fund’s expense group and expense universe are to the respective group or universe of comparable mutual funds included in the analysis by Broadridge. A Broadridge expense group consists of the Fund and a representative sample of funds with similar operating structures and asset sizes, as selected by Broadridge. A Broadridge expense universe includes all funds in the investment classification/objective with a similar operating structure as the share class of the Fund included in the Broadridge comparative information and provides a broader view of expenses across the Fund’s investment classification/objective. The Board also considered the Fund’s Morningstar fee level category. In reviewing expenses, the Board considered the positive impact of fee waivers where applicable and the Manager’s agreement to continue the fee waivers. In addition, information regarding the subadvisors’ use of soft dollars was requested from the Manager and was considered by the Board.
In considering the renewal of the Management Agreement for the Fund, the Board considered the following additional factors:
Broadridge Total Expense Analysis Excluding12b-1 Fees and Morningstar Fee Level Ranking
Compared to Broadridge Expense Group | 2nd Quintile | |
Compared to Broadridge Expense Universe | 1st Quintile | |
Morningstar Fee Level Ranking – Institutional Class | Low Expense Ratio |
Broadridge and Morningstar Performance Analysis(five-year period ended December 31, 2018)
Compared to Broadridge Performance Universe | 2nd Quintile | |
Compared to Morningstar Category | 2nd Quintile |
In considering the renewal of the Investment Advisory Agreements with each subadvisor, the Board considered that the diversification of investment strategies facilitated by the Fund’s multi-manager structure permits the Fund to mitigate the risks associated with a single subadvisor. The Board also considered the following additional factors:
Subadvisor Performance(compared to Broadridge Performance Universe for period indicated ended December 31, 2018)
Barrow (Fundamental Strategy) | 5 Years | 2 | nd Quintile | |||
Barrow (Diversified Strategy)* | 3 Years | 2 | nd Quintile | |||
Brandywine | 5 Years | 3 | rd Quintile | |||
Foundry | 5 Years | 1 | st Quintile | |||
Hillcrest* | 3 Years | 5 | th Quintile | |||
Hotchkis (Fundamental Strategy) | 5 Years | 1 | st Quintile | |||
Hotchkis (Diversified Strategy)* | 1 Year | 2 | nd Quintile | |||
Mellon | 5 Years | 1 | st Quintile | |||
* Does not yet have a5-year performance record. |
| |||||
The Board also considered: (1) that the three-year period was not long enough to fully evaluate the performance of Hillcrest, and the Manager was closely monitoring this performance; (2) that Hillcrest’s investment style, which favors low valuation companies (as measured byprice-to-earnings andprice-to-book) and sound financial health (as measured by expectedearnings-per-share growth and return on equity), has not been rewarded in recent market conditions; (3) information provided by each subadvisor regarding fee rates charged for managing
60
Disclosure Regarding Approval of the Management and Investment Advisory Agreements(Unaudited)
assets in the same or a similar strategy as the subadvisor manages its allocation of the Fund; and (4) the Manager’s recommendation to continue to retain each subadvisor at the present time.
Based on these and other considerations, the Board: (1) concluded that the fees paid to the Manager and the subadvisors under the Management and Investment Advisory Agreements are fair and reasonable; and (2) determined that the Fund and its shareholders would benefit from the Manager’s and subadvisors’ continued management of the Fund.
61
Trustees and Officers of the American Beacon FundsSM(Unaudited)
The Trustees and officers of the American Beacon Funds (the “Trust”) are listed below, together with their principal occupations during the past five years. The address of each person listed below is 220 Las Colinas Boulevard East, Suite 1200, Irving, Texas 75039. Each Trustee overseesthirty-six funds in the fund complex that includes the Trust, the American Beacon Select Funds, the American Beacon Institutional Funds Trust, the American Beacon Sound Point Enhanced Income Fund, American Beacon Apollo Total Return Fund and the American Beacon Sound Point Alternative Lending Fund. The Trust’s Statement of Additional Information contains additional information about the Trustees and is available without charge by calling1-800-658-5811.
Name, Age | Position, Term of Office and Length of Time Served with the Trust | Principal Occupation(s) During Past 5 Years and Current Directorships | ||
| INTERESTED TRUSTEES | Term | |||
| Lifetime of Trust until removal, resignation or retirement* | ||||
| Alan D. Feld** (82) | Trustee since 1996 | Partner in the law firm of Akin, Gump, Strauss, Hauer & Feld, LLP (law firm) (1960-Present); Trustee, American Beacon Select Funds (1999-Present); Trustee, American Beacon Institutional Funds Trust (2017-Present); Trustee, American Beacon Sound Point Enhanced Income Fund (2018-Present); Trustee, American Beacon Apollo Total Return Fund (2018-Present); Trustee, American Beacon Sound Point Alternative Lending Fund (2019-Present). | ||
| NON-INTERESTED TRUSTEES | Term | |||
| Lifetime of Trust until removal, resignation or retirement* | ||||
| Gilbert G. Alvarado (49) | Trustee since 2015 | Director, Kura MD, Inc. (local telehealth organization) (2015-present); Vice President & CFO, Sierra Health Foundation (health conversion private foundation) (2006-Present); Vice President & CFO, Sierra Health Foundation: Center for Health Program Management (California public benefit corporation) (2012-Present); Director, Innovative North State (2012-2015); Director, Sacramento Regional Technology Alliance (2011-2016); Director, Women’s Empowerment (2009-2014); Director, Valley Healthcare Staffing (2017-present); Trustee, American Beacon Select Funds (2015-Present); Trustee, American Beacon Institutional Funds Trust (2017-Present); Trustee, American Beacon Sound Point Enhanced Income Fund (2018-Present); Trustee, American Beacon Apollo Total Return Fund (2018-Present); Trustee, American Beacon Sound Point Alternative Lending Fund (2019-Present). | ||
| Joseph B. Armes (57) | Trustee since 2015 | Chairman & CEO, CSW Industrials f/k/a Capital Southwest Corporation (investment company) (2015-Present); Chairman of the Board of Capital Southwest Corporation, predecessor to CSW Industrials, Inc. (2014-2017) (investment company); CEO, Capital Southwest Corporation (2013-2015); President & CEO, JBA Investment Partners (family investment vehicle) (2010-Present); Director and Chair of Audit Committee, RSP Permian (oil and gas producer) (2013-Present); Trustee, American Beacon Select Funds (2015-Present); Trustee, American Beacon Institutional Funds Trust (2017-Present); Trustee, American Beacon Sound Point Enhanced Income Fund (2018-Present); Trustee, American Beacon Apollo Total Return Fund (2018-Present); Trustee, American Beacon Sound Point Alternative Lending Fund (2019-Present). | ||
| Gerard J. Arpey (61) | Trustee since 2012 | Director, The Home Depot, Inc. (2015-Present); Partner, Emerald Creek Group (private equity firm) (2011-Present); Director, S.C. Johnson & Son, Inc. (privately held company) (2008-present); Trustee, American Beacon Select Funds (2012-Present); Trustee, American Beacon Institutional Funds Trust (2017-Present); Trustee, American Beacon Sound Point Enhanced Income Fund (2018-Present); Trustee, American Beacon Apollo Total Return Fund (2018-Present); Trustee, American Beacon Sound Point Alternative Lending Fund (2019-Present). | ||
62
Trustees and Officers of the American Beacon FundsSM(Unaudited)
Name, Age | Position, Term of Office and Length of Time Served with the Trust | Principal Occupation(s) During Past 5 Years and Current Directorships | ||
| NON-INTERESTED TRUSTEES (CONT.) | Term | |||
| Lifetime of Trust until removal, resignation or retirement* | ||||
| Brenda A. Cline (58) | Trustee since 2004 Chair since 2019 Vice Chair 2018 | Chief Financial Officer, Treasurer and Secretary, Kimbell Art Foundation (1993-Present); Director, Tyler Technologies, Inc. (public sector software solutions company) (2014-Present); Director, Range Resources Corporation (oil and natural gas company) (2015-Present); Trustee, CushingClosed-End andOpen-End Funds and ETFs (2017-Present); Trustee, American Beacon Select Funds (2004-Present); Trustee, American Beacon Institutional Funds Trust (2017-Present); Trustee, American Beacon Sound Point Enhanced Income Fund (2018-Present); Trustee, American Beacon Apollo Total Return Fund (2018-Present); Trustee, American Beacon Sound Point Alternative Lending Fund (2019-Present). | ||
| Eugene J. Duffy (65) | Trustee since 2008 | Managing Director, Global Investment Management Distribution, Mesirow Financial (2016-Present); Managing Director, Institutional Services, Intercontinental Real Estate Corporation (2014-Present); Principal and Executive Vice President, Paradigm Asset Management (1994-2014); Trustee, American Beacon Select Funds (2008-Present); Trustee, American Beacon Institutional Funds Trust (2017-Present); Trustee, American Beacon Sound Point Enhanced Income Fund (2018-Present); Trustee, American Beacon Apollo Total Return Fund (2018-Present); Trustee, American Beacon Sound Point Alternative Lending Fund (2019-Present). | ||
| Claudia A. Holz (62) | Trustee since 2018 | Partner, KPMG LLP (1990-2017); Trustee, American Beacon Select Funds (2018-Present); Trustee, American Beacon Institutional Funds Trust (2018-Present); Trustee, American Beacon Sound Point Enhanced Income Fund (2018-Present); Trustee, American Beacon Apollo Total Return Fund (2018-Present); Trustee, American Beacon Sound Point Alternative Lending Fund (2019-Present). | ||
| Douglas A. Lindgren (57) | Trustee since 2018 | CEO North America, Carne Global Financial Services (2016-2017); Managing Director, IPS Investment Management and Global Head, Content Management, UBS Wealth Management (2010-2016); Trustee, American Beacon Select Funds (2018-Present); Trustee, American Beacon Institutional Funds Trust (2018-Present); Trustee, American Beacon Sound Point Enhanced Income Fund (2018-Present); Trustee, American Beacon Apollo Total Return Fund (2018-Present); Trustee, American Beacon Sound Point Alternative Lending Fund (2019-Present). | ||
| Richard A. Massman (76) | Trustee since 2004 Chair 2008-2018 Chair Emeritus since 2019 | Consultant and General Counsel Emeritus, Hunt Consolidated, Inc. (holding company engaged in oil and gas exploration and production, refining, real estate, farming, ranching and venture capital activities) (2009-Present); Trustee, American Beacon Select Funds (2004-Present); Trustee, American Beacon Institutional Funds Trust (2017-Present); Trustee, American Beacon Sound Point Enhanced Income Fund (2018-Present); Trustee, American Beacon Apollo Total Return Fund (2018-Present); Trustee, American Beacon Sound Point Alternative Lending Fund (2019-Present). | ||
| Barbara J. McKenna, CFA (56) | Trustee since 2012 | President/Managing Principal, Longfellow Investment Management Company (2005-Present); Trustee, American Beacon Select Funds (2012-Present); Trustee, American Beacon Institutional Funds Trust (2017-Present); Trustee, American Beacon Sound Point Enhanced Income Fund (2018-Present); Trustee, American Beacon Apollo Total Return Fund (2018-Present); Trustee, American Beacon Sound Point Alternative Lending Fund (2019-Present). | ||
63
Trustees and Officers of the American Beacon FundsSM(Unaudited)
Name, Age | Position, Term of Office and Length of Time Served with the Trust | Principal Occupation(s) During Past 5 Years and Current Directorships | ||
| NON-INTERESTED TRUSTEES (CONT.) | Term | |||
| Lifetime of Trust until removal, resignation or retirement* | ||||
| R. Gerald Turner (73) | Trustee since 2001 | President, Southern Methodist University (1995-Present); Director, J.C. Penney Company, Inc. (1996-Present); Director, Kronus Worldwide Inc. (chemical manufacturing) (2003-Present); Trustee, American Beacon Select Funds (2001-Present); Trustee, American Beacon Institutional Funds Trust (2017-Present); Trustee, American Beacon Sound Point Enhanced Income Fund (2018-Present); Trustee, American Beacon Apollo Total Return Fund (2018-Present); Trustee, American Beacon Sound Point Alternative Lending Fund (2019-Present). | ||
| OFFICERS | Term | |||
| One Year | ||||
| Gene L. Needles, Jr. (64) | President since 2009 | President (2009-2018), CEO and Director (2009-Present), and Chairman (2018-Present), American Beacon Advisors, Inc., President (2015-2018), Director and CEO (2015-Present), and Chairman (2018-Present), Resolute Investment Holdings, LLC; President (2015-2018), Director and CEO (2015-Present), and Chairman (2018-Present), Resolute Topco, Inc.; President (2015-2018); Director, and CEO (2015-Present), and Chairman (2018-Present), Resolute Acquisition, Inc.; President (2015-2018), Director and CEO (2015-Present), Chairman (2018-Present), Resolute Investment Managers, Inc.; Director, Chairman, President and CEO, Resolute Investment Distributors (2017-Present); Director, Chairman, President and CEO; Resolute Investment Services, Inc. (2017-Present); President and CEO, Lighthouse Holdings Parent, Inc. (2009-2015); President, CEO and Director, Lighthouse Holdings, Inc. (2009-2015); Manager, President and CEO, American Private Equity Management, LLC (2012-Present); Director, Chairman, President and CEO, Alpha Quant Advisors, LLC (2016-Present); Director, ARK Investment Management LLC (2016-Present); Director, Shapiro Capital Management LLC (2017-Present); Director, Chairman and CEO, Continuous Capital, LLC (2018-Present); President, American Beacon Cayman Managed Futures Strategy Fund, Ltd. (2014-Present); Director and President, American Beacon Cayman Transformational Innovation Company, LTD., (2017-2018); President, American Beacon Delaware Transformational Innovation Corporation (2017-2018); President American Beacon Cayman TargetRisk Company, Ltd. (2018-Present); Member, Investment Advisory Committee, Employees Retirement System of Texas (2017-Present); Trustee, American Beacon NextShares Trust (2015-Present); President, American Beacon Select Funds (2009-Present); President, American Beacon Institutional Funds Trust (2017-Present); President, American Beacon Sound Point Enhanced Income Fund (2018-Present); President, American Beacon Apollo Total Return Fund (2018-Present); Director, RSW Investments Holdings LLC, (2019-Present); Manager, SSI Investment Management, LLC (2019-Present); President, American Beacon Sound Point Alternative Lending Fund (2019-Present); Director, Green Harvest Asset Management (2019-Present). | ||
64
Trustees and Officers of the American Beacon FundsSM(Unaudited)
Name, Age | Position, Term of Office and Length of Time Served with the Trust | Principal Occupation(s) During Past 5 Years and Current Directorships | ||
| OFFICERS (CONT.) | Term | |||
| One Year | ||||
| Rosemary K. Behan (60) | VP, Secretary and Chief Legal Officer since 2006 | Vice President, Secretary and General Counsel, American Beacon Advisors, Inc. (2006-Present); Secretary, Resolute Investment Holdings, LLC (2015-Present); Secretary, Resolute Topco, Inc. (2015-Present); Secretary, Resolute Acquisition, Inc. (2015-Present); Vice President, Secretary and General Counsel, Resolute Investment Managers, Inc. (2015-Present); Secretary, Resolute Investment Distributors, Inc. (2017-Present); Vice President, Secretary and General Counsel, Resolute Investment Services, Inc. (2017-Present); Vice President and Secretary, Lighthouse Holdings Parent, Inc. (2008-2015); Vice President and Secretary, Lighthouse Holdings, Inc. (2008-2015); Secretary, American Private Equity Management, LLC (2008-Present); Secretary and General Counsel, Alpha Quant Advisors, LLC (2016-Present); Vice President and Secretary, Continuous Capital, LLC (2018-Present); Secretary, American Beacon Delaware Transformational Innovation Corporation (2017-2018); Secretary, American Beacon Cayman Transformational Innovation Company, Ltd. (2017-2018); Secretary, American Beacon Cayman Managed Futures Strategy Fund, Ltd. (2014-Present); Secretary, American Beacon Cayman TargetRisk Company, Ltd (2018-Present); Chief Legal Officer, Vice President and Secretary, American Beacon Select Funds (2006-Present); Chief Legal Officer, Vice President and Secretary, American Beacon Institutional Funds Trust (2017-Present); Chief Legal Officer, Vice President and Secretary, American Beacon Sound Point Enhanced Income Fund (2018-Present); Chief Legal Officer, Vice President and Secretary American Beacon Apollo Total Return Fund (2018-Present); Chief Legal Officer, Vice President and Secretary, American Beacon Sound Point Alternative Lending Fund (2019-Present); Secretary, Green Harvest Asset Management (2019-Present). | ||
| Brian E. Brett (59) | VP since 2004 | Senior Vice President, Head of Distribution (2012-Present), Vice President, Director of Sales (2004-2012), American Beacon Advisors, Inc.; Senior Vice President, Resolute Investment Managers, Inc. (2017-Present); Senior Vice President, Resolute Investment Distributors, Inc. (2018-Present), Senior Vice President, Resolute Investment Services, Inc. (2018-Present); Senior Vice President, Lighthouse Holdings Parent, Inc. (2008-2015); Senior Vice President, Lighthouse Holdings, Inc. (2008-2015); Vice President, American Beacon Select Funds (2004-Present); Vice President, American Beacon Institutional Funds Trust (2017-Present); Vice President American Beacon Sound Point Enhanced Income Fund (2018-Present); Vice President American Beacon Apollo Total Return Fund (2018-Present); Vice President, American Beacon Sound Point Alternative Lending Fund (2019-Present). | ||
| Paul B. Cavazos (50) | VP since 2016 | Chief Investment Officer and Senior Vice President, American Beacon Advisors, Inc. (2016-Present); Chief Investment Officer, DTE Energy (2007-2016); Vice President, American Private Equity Management, L.L.C. (2017-Present); Vice President, American Beacon Select Funds (2016-Present); Vice President, American Beacon Institutional Funds Trust (2017-Present); Vice President American Beacon Sound Point Enhanced Income Fund (2018-Present); Vice President American Beacon Apollo Total Return Fund (2018-Present); Vice President, American Beacon Sound Point Alternative Lending Fund (2019-Present). | ||
| Erica Duncan (49) | VP Since 2011 | Vice President, American Beacon Advisors, Inc. (2011-Present); Vice President, Resolute Investment Managers (2018-Present); Vice President, Resolute Investment Services, Inc. (2018-Present); Vice President, American Beacon Select Funds (2011-Present); Vice President, American Beacon Institutional Funds Trust (2017-Present); Vice President American Beacon Sound Point Enhanced Income Fund (2018-Present); Vice President American Beacon Apollo Total Return Fund (2018-Present); Vice President, American Beacon Sound Point Alternative Lending Fund (2019-Present). | ||
65
Trustees and Officers of the American Beacon FundsSM(Unaudited)
Name, Age | Position, Term of Office and Length of Time Served with the Trust | Principal Occupation(s) During Past 5 Years and Current Directorships | ||
| OFFICERS (CONT.) | Term | |||
| One Year | ||||
| Melinda G. Heika (58) | Treasurer since 2010 | Treasurer and CFO (2010-Present), American Beacon Advisors, Inc.; Treasurer, Resolute Topco, Inc. (2015-Present); Treasurer, Resolute Investment Holdings, LLC. (2015-Present); Treasurer, Resolute Acquisition, Inc. (2015-Present); Treasurer and CFO, Resolute Investment Managers, Inc. (2017-Present); Treasurer, Resolute Investment Distributors, Inc. (2017-2017); Treasurer and CFO, Resolute Investment Services, Inc. (2015-Present); Treasurer, Lighthouse Holdings Parent Inc., (2010-2015); Treasurer, Lighthouse Holdings, Inc. (2010-2015); Treasurer, American Private Equity Management, LLC (2012-Present); Treasurer and CFO, Alpha Quant Advisors, LLC (2016-Present); Treasurer and CFO, Continuous Capital, LLC (2018-Present); Treasurer, American Beacon Cayman Transformational Innovation, Ltd. (2017-2018); Treasurer, American Beacon Delaware Transformational Innovation Corporation (2017-2018); Director and Treasurer, American Beacon Cayman Managed Futures Strategy Fund, Ltd. (2014-Present); Treasurer, American Beacon Cayman TargetRisk Company, Ltd. (2018-Present); Treasurer, American Beacon Select Funds (2010-Present); Treasurer, American Beacon Institutional Funds Trust (2017-Present); Treasurer, American Beacon Sound Point Enhanced Income Fund (2018-Present); Treasurer, American Beacon Apollo Total Return Fund (2018-Present); Treasurer, American Beacon Sound Point Alternative Lending Fund (2019-Present); Treasurer, Green Harvest Asset Management (2019-Present). | ||
| Terri L. McKinney (55) | VP since 2010 | Vice President (2009-Present), Managing Director (2003-2009), American Beacon Advisors, Inc.; Vice President, Resolute Investment Managers, Inc. (2017-Present); Vice President, Resolute Investment Services, Inc (2018-Present); Vice President, Alpha Quant Advisors, LLC (2016-Present); Vice President, Continuous Capital, LLC (2018-Present); Vice President, American Beacon Select Funds (2010-Present); Vice President, American Beacon Institutional Funds Trust (2017-Present); Vice President, American Beacon Sound Point Enhanced Income Fund (2018-Present); Vice President, American Beacon Apollo Total Return Fund (2018-Present); Vice President, American Beacon Sound Point Alternative Lending Fund (2019-Present). | ||
66
Trustees and Officers of the American Beacon FundsSM(Unaudited)
Name, Age | Position, Term of Office and Length of Time Served with the Trust | Principal Occupation(s) During Past 5 Years and Current Directorships | ||
| OFFICERS (CONT.) | Term | |||
| One Year | ||||
| Jeffrey K. Ringdahl (44) | VP since 2010 | Director (2015-Present), President (2018-Present), Chief Operating Officer (2010-Present), Senior Vice President (2013-2018), Vice President (2010-2013), American Beacon Advisors, Inc.; Director (2015-Present), President (2018-Present), Senior Vice Present (2015-2018), Resolute Investment Holdings, LLC; Director (2015-Present), President (2018-Present), Senior Vice President (2015-2018), Resolute Topco, Inc.; Director (2015-Present), President (2018-Present), Senior Vice President (2015-2018), Resolute Acquisition, Inc.; Director (2015-Present), President & COO (2018-Present), Senior Vice President (2015-2018), Resolute Investment Managers, Inc.; Director and Executive Vice President (2017-Present), Resolute Investment Distributors, Inc.; Director (2017-Present), President & COO (2018-Present), Executive Vice President (2017-2018), Resolute Investment Services, Inc.; Senior Vice President (2017-Present), Vice President (2012-2017), Manager (2015-Present), American Private Equity Management, LLC; Senior Vice President, Lighthouse Holdings Parent, Inc. (2013-2015); Senior Vice President, Lighthouse Holdings, Inc. (2013-2015); Trustee, American Beacon NextShares Trust (2015-Present); Director, Executive Vice President & COO, Alpha Quant Advisors, LLC (2016-Present); Director, Shapiro Capital Management, LLC (2017-Present); Director, Executive Vice President & COO, Continuous Capital, LLC (2018-Present); Director and Vice President, American Beacon Cayman Transformational Innovation Company, Ltd., (2017-Present); Vice President, American Beacon Delaware Transformational Innovation Corporation (2017-2018); Director and Vice President, American Beacon Cayman Managed Futures Strategy Fund, Ltd. (2014-Present); Vice President, American Beacon Cayman TargetRisk Company, Ltd (2018-Present); Vice President, American Beacon Select Funds (2010-2018); Vice President, American Beacon Institutional Funds Trust (2017-Present); Vice President, American Beacon Sound Point Enhanced Income Fund (2018-Present); Vice President, American Beacon Apollo Total Return Fund (2018-Present); Director, RSW Investments Holdings LLC, (2019-Present); Manager, SSI Investment Management, LLC (2019-Present), Vice President, American Beacon Sound Point Alternative Lending Fund (2019-Present). | ||
| Samuel J. Silver (56) | VP Since 2011 | Vice President (2011-Present), Chief Fixed Income Officer (2016-Present), American Beacon Advisors, Inc. (2011-Present); Vice President, American Beacon Select Funds (2011-Present); Vice President, American Beacon Institutional Funds Trust (2017-Present); Vice President, American Beacon Sound Point Enhanced Income Fund (2018-Present); Vice President, American Beacon Apollo Total Return Fund (2018-Present); Vice President, American Beacon Sound Point Alternative Lending Fund (2019-Present). | ||
| Christina E. Sears (48) | Chief Compliance Officer since 2004 and Asst. Secretary since 1999 | Vice President, American Beacon Advisors, Inc. (2019-Present); Chief Compliance Officer, American Beacon Advisors, Inc. (2004-Present); Vice President, Resolute Investment Managers, Inc. (2017-Present); Vice President, Resolute Investment Distributors (2017-Present); Vice President, Resolute Investment Services, Inc. (2019-Present); Chief Compliance Officer, American Private Equity Management, LLC (2012-Present); Chief Compliance Officer (2016-2019) and Vice President, Alpha Quant Advisors, LLC (2016-Present); Vice President, Continuous Capital, LLC (2018-Present); Chief Compliance Officer (2004-Present) and Assistant Secretary (1999-Present), American Beacon Select Funds; Chief Compliance Officer and Assistant Secretary, American Beacon Institutional Funds Trust (2017-Present); Chief Compliance Officer and Assistant Secretary, American Beacon Sound Point Enhanced Income Fund (2018-Present); Chief Compliance Officer and Assistant Secretary, American Beacon Apollo Total Return Fund (2018-Present); Chief Compliance Officer and Assistant Secretary, American Beacon Sound Point Alternative Lending Fund (2019-Present). | ||
67
Trustees and Officers of the American Beacon FundsSM(Unaudited)
Name, Age | Position, Term of Office and Length of Time Served with the Trust | Principal Occupation(s) During Past 5 Years and Current Directorships | ||
| OFFICERS (CONT.) | Term | |||
| One Year | ||||
| Sonia L. Bates (62) | Asst. Treasurer since 2011 | Assistant Treasurer, American Beacon Advisors, Inc. (2011-2018); Assistant Treasurer, Lighthouse Holdings Parent Inc. (2011-2015); Assistant Treasurer, Lighthouse Holdings, Inc. (2011-2015); Assistant Treasurer, American Private Equity Management, LLC (2012-Present); Assistant Treasurer, American Beacon Cayman Transformational Innovation Company, Ltd. (2017-Present); Assistant Treasurer, American Beacon Cayman TargetRisk Company, Ltd. (2018-Present); Assistant Treasurer, American Beacon Select Funds (2011-Present); Assistant Treasurer, American Beacon Institutional Funds Trust (2017-Present); Assistant Treasurer, American Beacon Sound Point Enhanced Income Fund (2018-Present); Assistant Treasurer, American Beacon Apollo Total Return Fund (2018-Present); Assistant Treasurer, American Beacon Sound Point Alternative Lending Fund (2019-Present). | ||
| Shelley D. Abrahams (44) | Assistant Secretary since 2008 | Assistant Secretary, American Beacon Select Funds (2008-Present); Assistant Secretary, American Beacon Institutional Funds Trust (2017-Present); Assistant Secretary, American Beacon Sound Point Enhanced Income Fund (2018-Present); Assistant Secretary, American Beacon Apollo Total Return Fund (2018-Present); Assistant Secretary, American Beacon Sound Point Alternative Lending Fund (2019-Present); Assistant Secretary, Green Harvest Asset Management (2019-Present). | ||
| Rebecca L. Harris (52) | Assistant Secretary since 2010 | Vice President, American Beacon Advisors, Inc. (2011-Present); Vice President, Resolute Investment Managers, Inc. (2017-Present); Vice President, Resolute Investment Services (2015-Present); Vice President, Alpha Quant Advisors, LLC (2016-Present); Vice President, Continuous Capital, LLC (2018-Present); Assistant Secretary, American Beacon Select Funds (2010-Present); Assistant Secretary, American Beacon Institutional Funds Trust (2017-Present); Assistant Secretary, American Beacon Sound Point Enhanced Income Fund (2018-Present); Assistant Secretary, American Beacon Apollo Total Return Fund (2018-Present); Assistant Secretary, American Beacon Sound Point Alternative Lending Fund (2019-Present). | ||
| Teresa A. Oxford (61) | Assistant Secretary since 2015 | Assistant Secretary, American Beacon Advisors, Inc. (2015-Present); Assistant Secretary, Resolute Investment Distributors (2018-Present); Assistant Secretary, Resolute Investment Services (2018-Present); Assistant Secretary, Alpha Quant Advisors, LLC (2016-Present); Assistant Secretary, American Beacon Select Funds (2015-Present); Assistant Secretary, American Beacon Institutional Funds Trust (2017-Present); Assistant Secretary, American Beacon Sound Point Enhanced Income Fund (2018-Present); Assistant Secretary, American Beacon Apollo Total Return Fund (2018-Present); Assistant Secretary, American Beacon Sound Point Alternative Lending Fund (2019-Present); Assistant Secretary, Green Harvest Asset Management (2019-Present). | ||
* As of 11/12/2014, the Board adopted a retirement plan that requires Trustees, other than Messrs. Feld and Massman to retire no later than the last day of the calendar year in which they reach the age of 75. As of 11/7/17, the Board approved a waiver of the mandatory retirement policy with respect to Mr. Massman, who turned 75 in November 2018, to permit him to continue to serve on the Board as Chair Emeritus through 12/31/19.
** Mr. Feld is deemed to be an “interested person” of the Trusts, as defined by the 1940 Act. Mr. Feld’s law firm of Akin, Gump, Strauss, Hauer & Feld LLP has provided legal services within the past two fiscal years to one or more of the Trust’ssub-advisors.
68
American Beacon FundsSM
October 31, 2019 (Unaudited)
The American Beacon Funds recognize and respect the privacy of our shareholders. We are providing this notice to you so you will understand how shareholder information may be collected and used.
We may collect nonpublic personal information about you from one or more of the following sources:
| • | information we receive from you on applications or other forms; |
| • | information about your transactions with us or our service providers; and |
| • | information we receive from third parties. |
We do not disclose any nonpublic personal information about our customers or former customers to anyone, except as permitted by law.
We restrict access to your nonpublic personal information to those employees or service providers who need to know that information to provide products or services to you. To ensure the confidentiality of your nonpublic personal information, we maintain safeguards that comply with federal standards.
69
This page intentionally left blank.
70
This page intentionally left blank.
71
This page intentionally left blank.
72

Delivery of Documents
eDelivery isNOW AVAILABLE- Stop traditional mail delivery and receive your
shareholder reports and summary prospectuson-line. Sign up at
www.americanbeaconfunds.com
If you invest in the Fund through a financial institution, you may be able to receive the Fund’s regulatory mailings, such as the Prospectus, Annual Report and Semi-Annual Report, bye-mail. If you are interested in this option, please go towww.icsdelivery.comand search for your financial institution’s name or contact your financial institution directly.
To obtain more information about the Fund:
 |  | |
| ByE-mail: | On the Internet: | |
| american_beacon.funds@ambeacon.com | Visit our website atwww.americanbeaconfunds.com | |
By Telephone: Call (800)658-5811 |
By Mail: American Beacon Funds P.O. Box 219643 Kansas City, MO 64121-9643 | |
| Availability of Quarterly Portfolio Schedules | Availability of Proxy Voting Policy and Records | |
| In addition to the Schedule of Investments provided in each semi-annual and annual report, the Fund files a complete schedule of its portfolio holdings with the Securities and Exchange Commission (“SEC”) on FormN-PORT as of the first and third fiscal quarters. The Fund’s FormsN-PORT are available on the SEC’s website atwww.sec.gov. The FormsN-PORT may also be reviewed and copied at the SEC’s Public Reference Section, 100 F Street, NE, Washington, D.C. 20549-1520. Information regarding the operation of the SEC’s Public Reference Room may be obtained by calling(800)-SEC-0330. A complete schedule of the Fund’s portfolio holdings is also available atwww.americanbeaconfunds.com approximately twenty days after the end of each month. | A description of the policies and procedures the Fund uses to determine how to vote proxies relating to portfolio securities is available in the Fund’s Statement of Additional Information, is available free of charge on the Fund’s websitewww.americanbeaconfunds.com and by calling1-800-967-9009 or by accessing the SEC’s website atwww.sec.gov. The Fund’s proxy voting record for the most recent year ended June 30 is filed annually with the SEC on FormN-PX. The Fund’s FormsN-PX are available on the SEC’s website atwww.sec.gov. The Fund’s proxy voting record may also be obtained by calling1-800-967-9009. | |


Fund Service Providers:
CUSTODIAN State Street Bank and Trust Company Boston, Massachusetts | TRANSFER AGENT DST Asset Manager Solutions, Inc. Quincy, Massachusetts | INDEPENDENT REGISTERED PUBLIC ACCOUNTING FIRM Ernst & Young LLP Dallas, Texas | DISTRIBUTOR Resolute Investment Distributors, Inc. Irving, Texas |
This report is prepared for shareholders of the American Beacon Funds and may be distributed to others only if preceded or accompanied by a current Prospectus or Summary Prospectus.
American Beacon Funds and American Beacon Small Cap Value Fund are service marks of American Beacon Advisors, Inc.
AR 10/19
| ITEM 2. | CODE OF ETHICS. |
The Trust adopted a code of ethics that applies to its principal executive and financial officers (the “Code”). The Trust amended its code August 19, 2019 to disclose the addition of the American Beacon Sound Point Enhanced Income Fund, American Beacon Apollo Total Return Fund and American Beacon Sound Point Alternative Lending Fund and to disclose a change to limit the value of gifts received by the principal officer or financial officer to $100. The Trust did not grant any waivers to the provisions of the Code during the period covered by the shareholder reports presented in Item 1. The Code is filed herewith as Exhibit 99.CODE ETH.
| ITEM 3. | AUDIT COMMITTEE FINANCIAL EXPERT. |
The Trust’s Board of Trustees has determined that Gilbert G. Alvarado and Claudia Holz, members of the Trust’s Audit and Compliance Committee, are “audit committee financial experts” as defined in FormN-CSR. Mr. Gilbert Alvarado and Ms. Claudia Holz are “independent” as defined in FormN-CSR.
| ITEM 4. | PRINCIPAL ACCOUNTANT FEES AND SERVICES. |
(a) Audit Fees | Fiscal Year Ended | |||
$239,905 | 10/31/2018 | |||
$291,427 | 10/31/2019 | |||
(b) Audit-Related Fees | Fiscal Year Ended | |||
$10,000 | 10/31/2018 | |||
$0 | 10/31/2019 | |||
(c) Tax Fees | Fiscal Year Ended | |||
$25,859 | 10/31/2018 | |||
$43,525 | 10/31/2019 | |||
(d) All Other Fees | Fiscal Year Ended | |||
$0 | 10/31/2018 | |||
$0 | 10/31/2019 | |||
e)(1) Pursuant to its charter, the Trust’s Audit and Compliance Committee shall have the following duties and powers pertaining topre-approval of audit andnon-audit services provided by the Trust’s principal accountant:
• to approve, prior to appointment, the engagement of auditors to annually audit and provide their opinion on the Trusts’ financial statements, and, in connection therewith, reviewing and evaluating matters potentially affecting the independence and capabilities of the auditors;
• to approve, prior to appointment, the engagement of the auditors to providenon-audit services to the Trusts, an investment adviser to any series of the Trusts or any entity controlling, controlled by, or under common control with an investment adviser (“adviser affiliate”) that provides ongoing services to the Trusts, if the engagement relates directly to the operations and financial reporting of the Trusts;
• to consider whether thenon-audit services provided by a Trust’s auditor to an investment adviser or any adviser affiliate that provides ongoing services to a series of the Trusts, which services were notpre-approved by the Committee, are compatible with maintaining the auditor’s independence;
• to review the arrangements for and scope of the annual audit and any special audits; and
• to review and approving the fees proposed to be charged to the Trusts by the auditors for each audit andnon-audit service.
The Audit and Compliance Committee may delegate any portion of its authority, including the authority to grantpre-approvals of audit and permittednon-audit services, to a subcommittee of one or more members. Any decisions of the subcommittee to grantpre-approvals shall be presented to the full audit committee at its next regularly scheduled meeting.
(e)(2) None of the fees disclosed in paragraphs (b) through (d) above were approved by the audit committee pursuant to paragraph (c)(7)(i)(C) of Rule2-01 of RegulationS-X.
| (f) Not applicable. | ||
| (g) AggregateNon-Audit Fees for Services Rendered to the: | ||
Registrant | Adviser | Adviser’s Affiliates Providing Ongoing Services to Registrant | Fiscal Year Ended | |||||||
$35,859 | $ | 391,405 | N/A | 10/31/2018 | ||||||
$43,525 | $ | 625,313 | N/A | 10/31/2019 | ||||||
| (h) Not applicable. | ||
| ITEM 5. | AUDIT COMMITTEE OF LISTED REGISTRANTS. |
Not applicable.
| ITEM 6. | SCHEDULE OF INVESTMENTS. |
The schedules of investments for each series of the Trust are included in the shareholder reports presented in Item 1.
| ITEM 7. | DISCLOSURE OF PROXY VOTING POLICIES AND PROCEDURES FORCLOSED-END MANAGEMENT INVESTMENT COMPANIES. |
Not applicable.
| ITEM 8. | PORTFOLIO MANAGERS OFCLOSED-END MANAGEMENT INVESTMENT COMPANIES. |
Not applicable.
| ITEM 9. | PURCHASES OF EQUITY SECURITIES BYCLOSED-END MANAGEMENT INVESTMENT COMPANY AND AFFILIATED PURCHASERS. |
Not applicable.
| ITEM 10. | SUBMISSION OF MATTERS TO A VOTE OF SECURITY HOLDERS. |
The Trust has made no material changes to the procedures by which shareholders may recommend nominees to the Trust’s Board of Trustees since the Trust last disclosed such procedures in Schedule 14A.
| ITEM 11. | CONTROLS AND PROCEDURES. |
(a) Based upon an evaluation within 90 days of the filing date of this report, the principal executive and financial officers concluded that the disclosure controls and procedures of the Trust are effective.
(b) There were no changes in the Trust’s internal control over financial reporting during the second fiscal quarter of the period covered by this report that has materially affected, or is reasonably likely to materially affect, the Trust’s internal control over financial reporting.
| ITEM 12. | EXHIBITS. |
(a)(1) Filed herewith asEX-99.CODE ETH.
(a)(2) A separate certification for each principal executive officer and principal financial officer of the Trust as required by Rule30a-2(a) under the Investment Company Act of 1940 is attached hereto asEX-99.CERT.
(a)(3) Not applicable.
(b) The certifications required by Rule30a-2(b) under the Investment Company Act of 1940 are attached hereto asEX-99.906CERT.
SIGNATURES
Pursuant to the requirements of the Securities Exchange Act of 1934 and the Investment Company Act of 1940, the registrant has duly caused this report to be signed on its behalf by the undersigned, thereunto duly authorized.
(Registrant): American Beacon Funds
| By | /s/ Gene L. Needles, Jr. | |
| Gene L. Needles, Jr. | ||
| President | ||
| American Beacon Funds | ||
Date: January 9, 2020
Pursuant to the requirements of the Securities Exchange Act of 1934 and the Investment Company Act of 1940, this report has been signed below by the following persons on behalf of the registrant and in the capacities and on the dates indicated.
| By | /s/ Gene L. Needles, Jr. | |
| Gene L. Needles, Jr. | ||
| President | ||
| American Beacon Funds | ||
Date: January 9, 2020
| By | /s/ Melinda G. Heika | |
| Melinda G. Heika | ||
| Treasurer | ||
| American Beacon Funds | ||
Date: January 9, 2020