UNITED STATES
SECURITIES AND EXCHANGE COMMISSION
Washington, D.C. 20549
FORM N-CSR
CERTIFIED SHAREHOLDER REPORT OF REGISTERED
MANAGEMENT INVESTMENT COMPANIES
Investment Company Act file number: 811-4984
AMERICAN BEACON FUNDS
(Exact name of registrant as specified in charter)
220 East Las Colinas Boulevard, Suite 1200
Irving, Texas 75039
(Address of principal executive offices)-(Zip code)
GENE L. NEEDLES, JR., PRESIDENT
220 East Las Colinas Boulevard, Suite 1200
Irving, Texas 75039
(Name and address of agent for service)
Registrant’s telephone number, including area code: (817) 391-6100
Date of fiscal year end: June 30, 2020
Date of reporting period: June 30, 2020
Form N-CSR is to be used by management investment companies to file reports with the Commission not later than 10 days after the transmission to stockholders of any report that is required to be transmitted to stockholders under Rule 30e-1 under the Investment Company Act of 1940 (17 CFR 270.30e-1). The Commission may use the information provided on Form N-CSR in its regulatory, disclosure review, inspection, and policymaking roles.
A registrant is required to disclose the information specified by Form N-CSR, and the Commission will make this information public. A registrant is not required to respond to the collection of information contained in Form N-CSR unless the Form displays a currently valid Office of Management and Budget (“OMB”) control number. Please direct comments concerning the accuracy of the information collection burden estimate and any suggestions for reducing the burden to Secretary, Securities and Exchange Commission, 450 Fifth Street, NW, Washington, DC 20549-0609. The OMB has reviewed this collection of information under the clearance requirements of 44 U.S.C. § 3507.
ITEM 1. REPORTS TO STOCKHOLDERS.
About American Beacon Advisors
Since 1986, American Beacon Advisors, Inc. has offered a variety of products and investment advisory services to numerous institutional and retail clients, including a variety of mutual funds, corporate cash management, and separate account management.
Our clients include defined benefit plans, defined contribution plans, foundations, endowments, corporations, financial planners, and other institutional investors. With American Beacon Advisors, you can put the experience of a multi-billion dollar asset management firm to work for your company.
ARK TRANSFORMATIONAL INNOVATION FUND
Because the Fund may invest in fewer issuers than a more diversified portfolio, the fluctuating value of a single holding may have a greater effect on the value of the Fund. Companies that the sub-advisor believes are capitalizing on disruptive innovation and developing technologies to displace older technologies or create new markets may not in fact do so. Investing in foreign securities may involve heightened risk due to currency fluctuations and economic and political risks. Regulatory changes may impair the Fund’s ability to qualify for federal income tax treatment as a regulated investment company, which could result in the Fund and shareholders incurring significant income tax expense. To the extent the Fund invests more heavily in particular sectors, its performance will be sensitive to factors affecting those sectors. Information Technology sector companies may face intense competition and rapid product obsolescence, have limited product lines, markets, financial resources or personnel, and lose patent, copyright and trademark protections. Investing in Health Care sector companies involves risk due to government regulations, product litigation, competitive forces, and loss of patent protection. Please see the prospectus for a complete discussion of the Fund’s risks. There can be no assurances that the investment objectives of this Fund will be met.
Any opinions herein, including forecasts, reflect our judgment as of the end of the reporting period and are subject to change. Each advisor’s strategies and each Fund’s portfolio composition will change depending on economic and market conditions. This report is not a complete analysis of market conditions, and, therefore, should not be relied upon as investment advice. Although economic and market information has been compiled from reliable sources, American Beacon Advisors, Inc. makes no representation as to the completeness or accuracy of the statements contained herein.
American Beacon Funds | June 30, 2020 |
| 1 | ||||
| 3 | ||||
| 6 | ||||
| 8 | ||||
Schedule of Investments: | ||||
| 9 | ||||
| 12 | ||||
| 15 | ||||
Financial Highlights: | ||||
| 32 | ||||
| 37 | ||||
Disclosure Regarding Approvals of the Management and Investment Advisory Agreements | 38 | |||
| 42 | ||||
| 43 | ||||
| 50 | ||||
| Back Cover |
 | Dear Shareholders,
Unlike anything we’ve experienced in our lifetimes, the COVID-19 pandemic continues to have an overwhelming effect on the world’s population, economies and markets. During this reporting period, news reports related to the virus dominated headlines:
u On March 15, the Federal Reserve cut the federal funds rate by 100 basis points (1%) to a range of 0% to 0.25%, and announced quantitative easing would be unlimited.
u Also in March, the U.S. government passed a stimulus package in three phases: phase one for approximately $8.3 billion, phase two for approximately $100 billion, and phase three for approximately $2 trillion. |
| u | On April 20, the price of U.S. oil turned negative for the first time in history, closing at -$37.60 per barrel for oil deliveries in May. However, by the end of June, the average crude oil spot price – which calculates an equally weighted price for West Texas Intermediate, Brent and Dubai crude oils – was $39.46 per barrel. |
| u | Although equity markets around the world have rebounded since the lows experienced earlier this year, uncertainty and volatility remain while economies continue to feel the effects of the pandemic. In the U.S., initial estimates indicated gross domestic product fell 9.5% for the second quarter – an annualized decline of 32.9% – making it the sharpest economic contraction in modern history. |
| u | As of June 30, the virus had infected more than 10 million individuals around the world, resulting in more than 503,000 deaths. The U.S. alone accounted for more than 2.5 million confirmed cases and more than 126,000 deaths. |
Now more than ever, we recognize that fear of loss can be a powerful emotion, leading many investors to make short-term decisions subject to a variety of potential error-leading biases. Unfortunately, short-term investment decisions may derail future plans. We encourage investors to maintain focus on their long-term financial goals, working with financial professionals to make thoughtful adjustments to their changing needs.
The three Ds – direction, discipline and diversification – may help frame this conversation.
| u | Direction: Achieving your long-term financial goals requires an individualized plan of action. You may want your plan to provide some measure of protection against periods of geopolitical turmoil, economic uncertainty, market volatility and job insecurity. Your plan should be reviewed annually and be adjusted in the event your long-range needs change. |
| u | Discipline: Long-term, systematic participation in an investment portfolio requires your resolution to stay the course. Spending time in the market – rather than trying to time the market – may place you in a better position to reach your long-term financial goals. |
| u | Diversification: By investing in different investment styles and asset classes, you may be able to help mitigate financial risks across your investment portfolio. By allocating your investment portfolio according to your risk-tolerance level, you may be better positioned to weather storms and achieve your long-term financial goals. |
1
President’s Message
American Beacon has endeavored to provide investors with a disciplined approach to realizing long-term financial goals since 1986. As a manager of managers, we strive to provide investment products that may enable investors to participate during market upswings while potentially insulating against market downswings. The investment teams behind our mutual funds seek to produce consistent, long-term results rather than focus only on short-term movements in the markets. In managing our investment products, we emphasize identifying opportunities that offer the potential for long-term rewards.
Thank you for staying the course with American Beacon. For additional information about our investment products or to access your account information, please visit our website at www.americanbeaconfunds.com.
Best Regards,

Gene L. Needles, Jr.
President
American Beacon Funds
2
June 30, 2020 (Unaudited)
For the 12-month period ended June 30, 2020, equity markets were slightly higher overall; this was despite record drawdowns in 2020 with the beginning of the COVID-19 pandemic. The spread of the contagion and global attempts to slow or stop it via self-imposed shutdowns introduced innumerable uncertainties for investors. Chief among those uncertainties were the economic effects from nations shutting down portions of their economies and varied fiscal policies enacted to support the same economies. Through all of this, the MSCI All Country World Index rose 2.11%, driven higher by resilient U.S. equities as international developed and emerging market equities did not fare as well.
In the U.S., the S&P 500 Index was up 7.51%, driven by positive returns from five of its 11 sectors. The top performers were growth-oriented sectors, including Information Technology (up 35.90%) and Consumer Discretionary (up 12.59%), followed by Communication Services (up 11.08%) and Health Care (up 10.90%). Energy (down 36.09%) and Financials (down 13.92%), were the worst-performing sectors. From a style standpoint, Growth continued the trend of outpacing Value as the Russell 3000 Growth Index returned 21.94% versus the Russell 3000 Value Index return of -9.42%. From a capitalization perspective, small-cap stocks struggled compared to their larger-capitalization peers, evidenced by the Russell 2000 Index return of -6.63% compared to the Russell 1000 Index return of 7.48%.
International developed markets ended the period lower as the MSCI EAFE Index was down 5.13%. In Europe, the top-performing countries were Denmark and the Netherlands, represented by the MSCI Denmark Index (up 22.32%) and the MSCI Netherlands Index (up 8.86%), respectively. The worst-performing countries in Europe were Austria and Norway, represented by the MSCI Austria Index (down 27.80%) and the MSCI Norway Index (down 23.07%), respectively. In New Zealand, which largely quashed the presence of COVID-19 through top-down health policy and a cooperative public, equities posted large gains as the MSCI New Zealand Index returned 21.99%.
Finally, in the developing world, emerging markets took the initial brunt of the pandemic, both in spread of infection and economic shutdown, resulting in the MSCI Emerging Market Index returning -3.39%. Taiwan led the emerging-markets countries with the MSCI Taiwan Index up 21.88%. China, the largest constituent, was up 13.13%, represented by the MSCI China Index. Argentina, having recently elected a populist Peronist president and dealing with a debt default, returned -46.50%, represented by the MSCI Argentina Index.
3
American Beacon ARK Transformational Innovation FundSM
Performance Overview
June 30, 2020 (Unaudited)
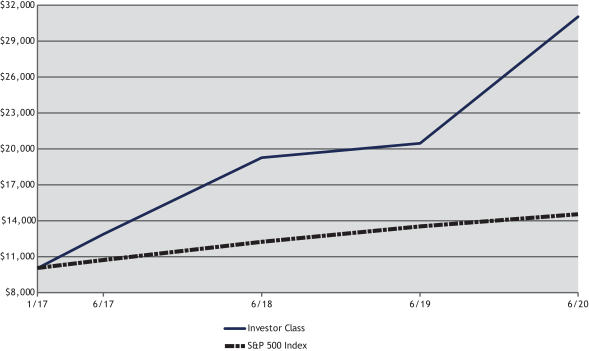
The Investor Class of the American Beacon ARK Transformational Innovation Fund (the “Fund”) returned 51.75% for the twelve months ended June 30, 2020. The Fund outperformed the S&P 500 Index (the “Index”) return of 7.51% for the same period.
Comparison of Changes in Value of a $10,000 Investment for the period 1/27/2017 through 6/30/2020
| Total Returns for the Period ended June 30, 2020 |
| ||||||||||||||||||||||||||
Ticker | 1 Year | 3 Year | Since Inception | Value of $10,000 | |||||||||||||||||||||||
R5 Class (1,4) | ADNIX | 52.22 | % | 34.42 | % | 39.52 | % | $ | 31,260 | ||||||||||||||||||
Y Class (1,4) | ADNYX | 52.17 | % | 34.27 | % | 39.39 | % | $ | 31,154 | ||||||||||||||||||
Investor Class (1,4) | ADNPX | 51.75 | % | 33.94 | % | 39.02 | % | $ | 30,877 | ||||||||||||||||||
A Class without Sales Charge (1,2,4) | ADNAX | 51.66 | % | 34.18 | % | 39.30 | % | $ | 31,090 | ||||||||||||||||||
A Class with Sales Charge (1,2,4) | ADNAX | 42.97 | % | 31.54 | % | 36.91 | % | $ | 29,303 | ||||||||||||||||||
C Class without Sales Charge (1,2,4) | ADNCX | 50.54 | % | 33.68 | % | 38.85 | % | $ | 30,743 | ||||||||||||||||||
C Class with Sales Charge (1,2,4) | ADNCX | 49.54 | % | 33.68 | % | 38.85 | % | $ | 30,743 | ||||||||||||||||||
S&P 500 Index (3) | 7.51 | % | 10.73 | % | 11.40 | % | $ | 14,469 | |||||||||||||||||||
| 1. | Performance shown is historical and is not indicative of future returns. Investment returns and principal value will vary, and shares may be worth more or less at redemption than at original purchase. Performance shown is calculated based on the published end of day net asset values as of the date indicated and current performance may be lower or higher than the performance data quoted. To obtain performance as of the most recent month end, please visit www.americanbeaconfunds.com or call 1-800-967-9009. Fund performance in the table above does not reflect the deduction of taxes a shareholder would pay on distributions or the redemption of shares. Generally accepted accounting principles require adjustments to be made to the net assets of the Fund at period end for financial reporting purposes only; and as such, the total return based on the unadjusted net asset value per share may differ from the total return reported in the financial highlights. Please note that the recent performance of the securities market has helped produce short-term returns that are not typical and may not continue in the future. A portion of the fees charged to each Class of the Fund has been waived since Fund inception. Performance prior to waiving fees was lower than the actual returns shown since inception. The strategy employed by the Fund’s sub-advisor has the potential for more volatility than broad market averages, which may result in significant fluctuations in the Fund’s short-term returns, both positive and negative. |
| 2. | A Class shares have a maximum sales charge of 5.75%. The maximum contingent deferred sales charge for the C Class is 1.00% for shares redeemed within one year of the date of purchase. |
4
American Beacon ARK Transformational Innovation FundSM
Performance Overview
June 30, 2020 (Unaudited)
| 3. | The S&P 500 Index is an unmanaged index of common stocks publicly traded in the United States. The S&P 500 Index is a product of S&P Dow Jones Indices LLC, a division of S&P Global or its affiliates (“SPDJI”) and has been licensed for use by American Beacon Advisors. Standard & Poor’s® and S&P are registered trademarks of Standard & Poor’s Financial Services LLC, a division of S&P Global (“S&P”). Dow Jones® is a registered trademark of Dow Jones Trademark Holdings LLC (“Dow Jones”). The American Beacon ARK Transformational Innovation Fund is not sponsored, endorsed, sold or promoted by SPDJI, Dow Jones, S&P or their respective affiliates, and none of such parties make any representation regarding the advisability of investing in such product(s) nor do they have any liability for any errors, omissions or interruptions of the S&P 500 Index. One cannot directly invest in an index. |
| 4. | The Total Annual Fund Operating Expense ratios set forth in the most recent Fund prospectus for the R5, Y, Investor, A and C Class shares were 1.75%, 1.95%, 2.04%, 2.32% and 3.26%, respectively. The expense ratios above may vary from the expense ratios presented in other sections of this report that are based on expenses incurred during the period covered by this report. |
The Fund outperformed the Index primarily due to security selection although sector allocation also contributed positively over the period. The Fund’s outperformance relative to the Index was principally attributable to holdings in the Consumer Discretionary and Health Care sectors. Within the Consumer Discretionary sector, Tesla, Inc. (up 516.2%) was the largest contributor partly as it was able to resume Shanghai production on the first working day after the extended Lunar New Year break in China, supported by the Chinese government with masks, disinfectant, other supplies, and dorm rooms to protect its workers. In the Health Care sector, the primary positions adding relative value were Invitae Corp. (up 48.4%), driven in part by its ability to provide telehealth services and deliver remote genetic testing, and CRISPR Therapeutics AG (up 64.0%). On the negative side, a position in the Financials sector that detracted from value relative to the Index was out-of-Index LendingClub Inc. (down 70.7%).
The Fund benefited from sector allocation over the period. Having a null weight to the Energy sector, which was the worst performing sector within the Index (down 36.0%) added to relative performance. Additionally, a significant overweight to the best performing sector in the Index, Information Technology (up 35.9%), contributed to relative performance.
The sub-advisor will continue to focus on identifying companies best positioned for long-term exponential growth and capital appreciation created by disruptive innovation.
| Top Ten Holdings (% Net Assets) | ||||||||
| Tesla, Inc. | 10.3 | |||||||
| Invitae Corp. | 8.2 | |||||||
| Square, Inc., Class A | 7.5 | |||||||
| CRISPR Therapeutics AG | 5.1 | |||||||
| Roku, Inc. | 4.8 | |||||||
| Illumina, Inc. | 4.4 | |||||||
| 2U, Inc. | 4.2 | |||||||
| Zillow Group, Inc., Class C | 3.8 | |||||||
| LendingTree, Inc. | 3.6 | |||||||
| Proto Labs, Inc. | 3.6 | |||||||
| Total Fund Holdings | 46 | |||||||
| Industry Allocation (% of Investments) | ||||||||
| Biotechnology | 22.4 | |||||||
| Software | 15.9 | |||||||
| Automobiles | 10.9 | |||||||
| IT Services | 8.2 | |||||||
| Life Sciences Tools & Services | 7.4 | |||||||
| Interactive Media & Services | 7.2 | |||||||
| Entertainment | 6.6 | |||||||
| Semiconductors & Semiconductor Equipment | 6.3 | |||||||
| Consumer Finance | 4.1 | |||||||
| Machinery | 3.8 | |||||||
| Technology Hardware, Storage & Peripherals | 3.3 | |||||||
| Health Care Equipment & Supplies | 1.3 | |||||||
| Diversified Telecommunication Services | 0.9 | |||||||
| Internet & Direct Marketing Retail | 0.7 | |||||||
| Health Care Technology | 0.6 | |||||||
| Aerospace & Defense | 0.4 | |||||||
5
American Beacon ARK Transformational Innovation FundSM
June 30, 2020 (Unaudited)
Fund Expense Example
As a shareholder of a Fund, you incur two types of costs: (1) transaction costs, including sales charges (loads) on purchase payments and redemption fees, if applicable, and (2) ongoing costs, including management fees, distribution (12b-1) fees, sub-transfer agent fees, and other Fund expenses. The Examples are intended to help you understand the ongoing cost (in dollars) of investing in the Fund and to compare these costs with the ongoing costs of investing in other mutual funds. The Examples are based on an investment of $1,000 invested at the beginning of the period in each Class and held for the entire period from January 1, 2020 through June 30, 2020.
Actual Expenses
The “Actual” lines of the tables provide information about actual account values and actual expenses. You may use the information on this page, together with the amount you invested, to estimate the expenses that you paid over the period. Simply divide your account value by $1,000 (for example, an $8,600 account value divided by $1,000 = $8.60), then multiply the result by the “Expenses Paid During Period” to estimate the expenses you paid on your account during this period. Shareholders of the Investor and R5 Classes that invest in the Fund through an IRA or Roth IRA may be subject to a custodial IRA fee of $15 that is typically deducted each December. If your account was subject to a custodial IRA fee during the period, your costs would have been $15 higher.
Hypothetical Example for Comparison Purposes
The “Hypothetical” lines of the tables provide information about hypothetical account values and hypothetical expenses based on the Fund’s actual expense ratio and an assumed 5% per year rate of return before expenses (not the Fund’s actual return). You may compare the ongoing costs of investing in the Fund with other funds by contrasting this 5% hypothetical example and the 5% hypothetical examples that appear in the shareholder reports of the other funds. The hypothetical account values and expenses may not be used to estimate the actual ending account balance or expenses you paid for the period. Shareholders of the Investor and R5 Classes that invest in the Funds through an IRA or Roth IRA may be subject to a custodial IRA fee of $15 that is typically deducted each December. If your account was subject to a custodial IRA fee during the period, your costs would have been $15 higher.
You should also be aware that the expenses shown in the table highlight only your ongoing costs and do not reflect any transaction costs charged by the Fund, such as sales charges (loads) or redemption fees, as applicable. Similarly, the expense examples for other funds do not reflect any transaction costs charged by those funds, such as sales charges (loads), redemption fees or exchange fees. Therefore, the “Hypothetical” lines of the tables are useful in comparing ongoing costs only and will not help you determine the relative total costs of owning different funds. If you were subject to any transaction costs during the period, your costs would have been higher.
6
American Beacon ARK Transformational Innovation FundSM
Expense Examples
June 30, 2020 (Unaudited)
| American Beacon ARK Transformational Innovation Fund |
| ||||||||||||||
| Beginning Account Value 1/1/2020 | Ending Account Value 6/30/2020 | Expenses Paid During Period 1/1/2020-6/30/2020* | |||||||||||||
| R5 Class** | |||||||||||||||
| Actual | $1,000.00 | $1,445.70 | $6.08 | ||||||||||||
| Hypothetical*** | $1,000.00 | $1,019.89 | $5.02 | ||||||||||||
| Y Class | |||||||||||||||
| Actual | $1,000.00 | $1,445.00 | $6.69 | ||||||||||||
| Hypothetical*** | $1,000.00 | $1,019.39 | $5.52 | ||||||||||||
| Investor Class | |||||||||||||||
| Actual | $1,000.00 | $1,443.40 | $8.38 | ||||||||||||
| Hypothetical*** | $1,000.00 | $1,018.00 | $6.92 | ||||||||||||
| A Class | |||||||||||||||
| Actual | $1,000.00 | $1,442.70 | $8.50 | ||||||||||||
| Hypothetical*** | $1,000.00 | $1,017.90 | $7.02 | ||||||||||||
| C Class | |||||||||||||||
| Actual | $1,000.00 | $1,437.50 | $13.03 | ||||||||||||
| Hypothetical*** | $1,000.00 | $1,014.17 | $10.77 | ||||||||||||
| * | Expenses are equal to the Fund’s annualized expense ratios for the six-month period of 1.00%, 1.10%, 1.38%, 1.40%, and 2.15% for the R5, Y, Investor, A, and C Classes, respectively, multiplied by the average account value over the period, multiplied by the number derived by dividing the number of days in the most recent fiscal half-year (182) by days in the year (366) to reflect the half-year period. |
| ** | Formerly known as Institutional Class. |
| *** | 5% return before expenses. |
7
American Beacon ARK Transformational Innovation FundSM
Report of Independent Registered Public Accounting Firm
To the Board of Trustees of American Beacon Funds and Shareholders of American Beacon ARK Transformational Innovation Fund
Opinion on the Financial Statements
We have audited the accompanying statement of assets and liabilities, including the schedule of investments, of American Beacon ARK Transformational Innovation Fund (one of the series constituting American Beacon Funds, referred to hereafter as the “Fund”) as of June 30, 2020, the related statement of operations for the year ended June 30, 2020, the statement of changes in net assets for each of the two years in the period ended June 30, 2020, including the related notes, and the financial highlights for each of the periods indicated therein (collectively referred to as the “financial statements”). In our opinion, the financial statements present fairly, in all material respects, the financial position of the Fund as of June 30, 2020, the results of its operations for the year then ended, the changes in its net assets for each of the two years in the period ended June 30, 2020 and the financial highlights for each of the periods indicated therein, in conformity with accounting principles generally accepted in the United States of America.
Basis for Opinion
These financial statements are the responsibility of the Fund’s management. Our responsibility is to express an opinion on the Fund’s financial statements based on our audits. We are a public accounting firm registered with the Public Company Accounting Oversight Board (United States) (PCAOB) and are required to be independent with respect to the Fund in accordance with the U.S. federal securities laws and the applicable rules and regulations of the Securities and Exchange Commission and the PCAOB.
We conducted our audits of these financial statements in accordance with the standards of the PCAOB. Those standards require that we plan and perform the audit to obtain reasonable assurance about whether the financial statements are free of material misstatement, whether due to error or fraud.
Our audits included performing procedures to assess the risks of material misstatement of the financial statements, whether due to error or fraud, and performing procedures that respond to those risks. Such procedures included examining, on a test basis, evidence regarding the amounts and disclosures in the financial statements. Our audits also included evaluating the accounting principles used and significant estimates made by management, as well as evaluating the overall presentation of the financial statements. Our procedures included confirmation of securities owned as of June 30, 2020 by correspondence with the custodian, transfer agent, and brokers; when replies were not received from brokers, we performed other auditing procedures. We believe that our audits provide a reasonable basis for our opinion.
PricewaterhouseCoopers LLP
Boston, MA
September 1, 2020
We have served as the auditor of one or more investment companies in the American Beacon family of funds since 2016.
8
American Beacon ARK Transformational Innovation FundSM
Schedule of Investments
June 30, 2020
| Shares | Fair Value | ||||||||||||||
| COMMON STOCKS - 94.17% | |||||||||||||||
| Communication Services - 13.81% | |||||||||||||||
| Diversified Telecommunication Services - 0.86% | |||||||||||||||
| Iridium Communications, Inc.A | 113,549 | $ | 2,888,686 | ||||||||||||
|
| ||||||||||||||
| Entertainment - 6.22% | |||||||||||||||
| Netflix, Inc.A | 1,894 | 861,846 | |||||||||||||
| Roku, Inc.A B | 139,931 | 16,306,159 | |||||||||||||
| Spotify Technology S.A.A | 14,653 | 3,783,258 | |||||||||||||
|
| ||||||||||||||
| 20,951,263 | |||||||||||||||
|
| ||||||||||||||
| Interactive Media & Services - 6.73% | |||||||||||||||
| Eventbrite, Inc., Class AA | 9,767 | 83,703 | |||||||||||||
| Pinterest, Inc., Class AA | 335,501 | 7,438,057 | |||||||||||||
| Twitter, Inc.A | 76,382 | 2,275,420 | |||||||||||||
| Zillow Group, Inc., Class CA B | 223,486 | 12,875,029 | |||||||||||||
|
| ||||||||||||||
| 22,672,209 | |||||||||||||||
|
| ||||||||||||||
Total Communication Services | 46,512,158 | ||||||||||||||
|
| ||||||||||||||
| Consumer Discretionary - 10.95% | |||||||||||||||
| Auto Components - 0.05% | |||||||||||||||
| Aptiv PLC | 1,901 | 148,126 | |||||||||||||
|
| ||||||||||||||
| Automobiles - 10.25% | |||||||||||||||
| Tesla, Inc.A | 31,977 | 34,529,084 | |||||||||||||
|
| ||||||||||||||
| Internet & Direct Marketing Retail - 0.65% | |||||||||||||||
| MercadoLibre, Inc.A | 2,224 | 2,192,353 | |||||||||||||
|
| ||||||||||||||
Total Consumer Discretionary | 36,869,563 | ||||||||||||||
|
| ||||||||||||||
| Financials - 3.85% | |||||||||||||||
| Consumer Finance - 3.85% | |||||||||||||||
| LendingClub Corp.A | 183,369 | 834,329 | |||||||||||||
| LendingTree, Inc.A B | 41,923 | �� | 12,137,966 | ||||||||||||
|
| ||||||||||||||
| 12,972,295 | |||||||||||||||
|
| ||||||||||||||
Total Financials | 12,972,295 | ||||||||||||||
|
| ||||||||||||||
| Health Care - 29.81% | |||||||||||||||
| Biotechnology - 21.09% | |||||||||||||||
| Cellectis S.A., ADRA | 12,046 | 214,419 | |||||||||||||
| CRISPR Therapeutics AGA | 235,795 | 17,328,575 | |||||||||||||
| Editas Medicine, Inc.A B | 276,142 | 8,168,280 | |||||||||||||
| Intellia Therapeutics, Inc.A B | 158,149 | 3,324,292 | |||||||||||||
| Invitae Corp.A B | 906,925 | 27,470,758 | |||||||||||||
| Iovance Biotherapeutics, Inc.A | 142,293 | 3,905,943 | |||||||||||||
| Organovo Holdings, Inc.A | 70,569 | 38,820 | |||||||||||||
| Seres Therapeutics, Inc.A B | 398,088 | 1,894,899 | |||||||||||||
| Syros Pharmaceuticals, Inc.A | 186,593 | 1,989,081 | |||||||||||||
| Twist Bioscience Corp.A | 34,419 | 1,559,181 | |||||||||||||
| Veracyte, Inc.A B | 198,585 | 5,143,351 | |||||||||||||
|
| ||||||||||||||
| 71,037,599 | |||||||||||||||
|
| ||||||||||||||
| Health Care Equipment & Supplies - 1.21% | |||||||||||||||
| Cerus Corp.A | 616,222 | 4,067,065 | |||||||||||||
|
| ||||||||||||||
| Health Care Technology - 0.56% | |||||||||||||||
| Teladoc Health, Inc.A | 9,903 | 1,889,889 | |||||||||||||
|
| ||||||||||||||
See accompanying notes
9
American Beacon ARK Transformational Innovation FundSM
Schedule of Investments
June 30, 2020
| Shares | Fair Value | ||||||||||||||
| COMMON STOCKS - 94.17% (continued) | |||||||||||||||
| Health Care - 29.81% (continued) | |||||||||||||||
| Life Sciences Tools & Services - 6.95% | |||||||||||||||
| Compugen Ltd.A B | 219,844 | $ | 3,302,057 | ||||||||||||
| Illumina, Inc.A | 39,928 | 14,787,335 | |||||||||||||
| NanoString Technologies, Inc.A B | 181,795 | 5,335,683 | |||||||||||||
|
| ||||||||||||||
| 23,425,075 | |||||||||||||||
|
| ||||||||||||||
Total Health Care | 100,419,628 | ||||||||||||||
|
| ||||||||||||||
| Industrials - 3.98% | |||||||||||||||
| Aerospace & Defense - 0.38% | |||||||||||||||
| AeroVironment, Inc.A | 16,063 | 1,279,097 | |||||||||||||
|
| ||||||||||||||
| Machinery - 3.60% | |||||||||||||||
| Proto Labs, Inc.A | 107,779 | 12,121,904 | |||||||||||||
|
| ||||||||||||||
Total Industrials | 13,401,001 | ||||||||||||||
|
| ||||||||||||||
| Information Technology - 31.77% | |||||||||||||||
| IT Services - 7.76% | |||||||||||||||
| PayPal Holdings, Inc.A | 4,550 | 792,746 | |||||||||||||
| Square, Inc., Class AA | 241,440 | 25,336,714 | |||||||||||||
|
| ||||||||||||||
| 26,129,460 | |||||||||||||||
|
| ||||||||||||||
| Semiconductors & Semiconductor Equipment - 5.92% | |||||||||||||||
| NVIDIA Corp. | 6,949 | 2,639,995 | |||||||||||||
| Teradyne, Inc. | 100,928 | 8,529,425 | |||||||||||||
| Xilinx, Inc. | 89,292 | 8,785,440 | |||||||||||||
|
| ||||||||||||||
| 19,954,860 | |||||||||||||||
|
| ||||||||||||||
| Software - 15.01% | |||||||||||||||
| 2U, Inc.A B | 376,553 | 14,293,952 | |||||||||||||
| Autodesk, Inc.A | 24,964 | 5,971,139 | |||||||||||||
| Materialise N.V., ADRA B | 75,126 | 1,694,843 | |||||||||||||
| PagerDuty, Inc.A | 270,462 | 7,740,622 | |||||||||||||
| salesforce.com, Inc.A | 11,282 | 2,113,457 | |||||||||||||
| Slack Technologies, Inc., Class AA B | 218,124 | 6,781,475 | |||||||||||||
| Splunk, Inc.A | 42,309 | 8,406,798 | |||||||||||||
| Zscaler Inc.A | 32,484 | 3,556,998 | |||||||||||||
|
| ||||||||||||||
| 50,559,284 | |||||||||||||||
|
| ||||||||||||||
| Technology Hardware, Storage & Peripherals - 3.08% | |||||||||||||||
| Pure Storage, Inc., Class AA | 410,411 | 7,112,423 | |||||||||||||
| Stratasys Ltd.A | 205,628 | 3,261,260 | |||||||||||||
|
| ||||||||||||||
| 10,373,683 | |||||||||||||||
|
| ||||||||||||||
Total Information Technology | 107,017,287 | ||||||||||||||
|
| ||||||||||||||
Total Common Stocks (Cost $233,092,536) | 317,191,932 | ||||||||||||||
|
| ||||||||||||||
| SHORT-TERM INVESTMENTS - 5.04% (Cost $16,973,816) | |||||||||||||||
| Investment Companies - 5.04% | |||||||||||||||
| American Beacon U.S. Government Money Market Select Fund, Select Class, 0.07%C D | 16,973,816 | 16,973,816 | |||||||||||||
|
| ||||||||||||||
| SECURITIES LENDING COLLATERAL - 3.59% (Cost $12,077,937) | |||||||||||||||
| Investment Companies - 3.59% | |||||||||||||||
| American Beacon U.S. Government Money Market Select Fund, Select Class, 0.07%C D | 12,077,937 | 12,077,937 | |||||||||||||
|
| ||||||||||||||
TOTAL INVESTMENTS - 102.80% (Cost $262,144,289) | 346,243,685 | ||||||||||||||
LIABILITIES, NET OF OTHER ASSETS - (2.80%) | (9,427,156 | ) | |||||||||||||
|
| ||||||||||||||
TOTAL NET ASSETS - 100.00% | $ | 336,816,529 | |||||||||||||
|
| ||||||||||||||
See accompanying notes
10
American Beacon ARK Transformational Innovation FundSM
Schedule of Investments
June 30, 2020
| Percentages are stated as a percent of net assets. |
A Non-income producing security.
B All or a portion of this security is on loan, collateralized by either cash and/or U.S.Treasuries, at June 30, 2020 (Note 8).
C The Fund is affiliated by having the same investment advisor.
D 7-day yield.
ADR - American Depositary Receipt.
PLC - Public Limited Company.
The Fund’s investments are summarized by level based on the inputs used to determine their values. As of June 30, 2020, the investments were classified as described below:
ARK Transformational Innovation Fund | Level 1 | Level 2 | Level 3 | Total | ||||||||||||||||||||||||
Assets | ||||||||||||||||||||||||||||
Common Stocks | $ | 317,191,932 | $ | - | $ | - | $ | 317,191,932 | ||||||||||||||||||||
Short-Term Investments | 16,973,816 | - | - | 16,973,816 | ||||||||||||||||||||||||
Securities Lending Collateral | 12,077,937 | - | - | 12,077,937 | ||||||||||||||||||||||||
|
|
|
|
|
|
|
| |||||||||||||||||||||
Total Investments in Securities - Assets | $ | 346,243,685 | $ | - | $ | - | $ | 346,243,685 | ||||||||||||||||||||
|
|
|
|
|
|
|
| |||||||||||||||||||||
U.S. GAAP requires transfers between all levels to/from level 3 be disclosed. During the year ended June 30, 2020, there were no transfers into or out of Level 3.
See accompanying notes
11
American Beacon ARK Transformational Innovation FundSM
Statement of Assets and Liabilities
June 30, 2020
Assets: | ||||
Investments in unaffiliated securities, at fair value†§ | $ | 317,191,932 | ||
Investments in affiliated securities, at fair value‡ | 29,051,753 | |||
Dividends and interest receivable | 781 | |||
Receivable for fund shares sold | 4,409,839 | |||
Receivable for tax reclaims | 553 | |||
Prepaid expenses | 59,438 | |||
|
| |||
Total assets | 350,714,296 | |||
|
| |||
Liabilities: | ||||
Payable for investments purchased | 1,224,651 | |||
Payable for fund shares redeemed | 247,175 | |||
Payable for expense reimbursement (Note 2) | 11,906 | |||
Management and sub-advisory fees payable (Note 2) | 207,497 | |||
Service fees payable (Note 2) | 35,117 | |||
Transfer agent fees payable (Note 2) | 17,958 | |||
Payable upon return of securities loaned (Note 8)§ | 12,077,937 | |||
Custody and fund accounting fees payable | 8,617 | |||
Professional fees payable | 63,553 | |||
Trustee fees payable (Note 2) | 7 | |||
Payable for prospectus and shareholder reports | 15 | |||
Other liabilities | 3,334 | |||
|
| |||
Total liabilities | 13,897,767 | |||
|
| |||
Net assets | $ | 336,816,529 | ||
|
| |||
Analysis of net assets: | ||||
Paid-in-capital | $ | 251,166,308 | ||
Total distributable earnings (deficits)A | 85,650,221 | |||
|
| |||
Net assets | $ | 336,816,529 | ||
|
| |||
Shares outstanding at no par value (unlimited shares authorized): | ||||
R5 ClassB | 307,885 | |||
|
| |||
Y Class | 8,075,286 | |||
|
| |||
Investor Class | 2,566,743 | |||
|
| |||
A Class | 864,744 | |||
|
| |||
C Class | 562,393 | |||
|
| |||
Net assets: | ||||
R5 ClassB | $ | 8,438,698 | ||
|
| |||
Y Class | $ | 220,504,263 | ||
|
| |||
Investor Class | $ | 69,421,549 | ||
|
| |||
A Class | $ | 23,391,480 | ||
|
| |||
C Class | $ | 15,060,539 | ||
|
| |||
Net asset value, offering and redemption price per share: | ||||
R5 ClassB | $ | 27.41 | ||
|
| |||
Y Class | $ | 27.31 | ||
|
| |||
Investor Class | $ | 27.05 | ||
|
| |||
A Class | $ | 27.05 | ||
|
| |||
A Class (offering price) | $ | 28.70 | ||
|
| |||
C Class | $ | 26.78 | ||
|
| |||
† Cost of investments in unaffiliated securities | $ | 233,092,536 | ||
‡ Cost of investments in affiliated securities | $ | 29,051,753 | ||
§ Fair value of securities on loan | $ | 52,466,814 | ||
A The Fund’s investments in affiliated securities did not have unrealized appreciation (depreciation) at year end. |
| |||
B Formerly known as Institutional Class. |
| |||
See accompanying notes
12
American Beacon ARK Transformational Innovation FundSM
Statement of Operations
For the year ended June 30, 2020
Investment income: | ||||
Dividend income from unaffiliated securities (net of foreign taxes)† | $ | 62,347 | A | |
Dividend income from affiliated securities (Note 2) | 42,418 | |||
Interest income | 37 | |||
Income derived from securities lending (Note 8) | 77,584 | |||
|
| |||
Total investment income | 182,386 | |||
|
| |||
Expenses: | ||||
Management and sub-advisory fees (Note 2) | 902,866 | |||
Transfer agent fees: | ||||
R5 Class (Note 2)B | 2,972 | |||
Y Class (Note 2) | 68,584 | |||
Investor Class | 2,059 | |||
Custody and fund accounting fees | 48,327 | |||
Professional fees | 72,918 | |||
Registration fees and expenses | 65,292 | |||
Service fees (Note 2): | ||||
Investor Class | 55,695 | |||
A Class | 21,923 | |||
C Class | 6,829 | |||
Distribution fees (Note 2): | ||||
A Class | 20,938 | |||
C Class | 47,070 | |||
Prospectus and shareholder report expenses | 30,131 | |||
Trustee fees (Note 2) | 7,540 | |||
Other expenses | 22,566 | |||
|
| |||
Total expenses | 1,375,710 | |||
|
| |||
Net fees waived and expenses (reimbursed) (Note 2) | (168,749 | ) | ||
|
| |||
Net expenses | 1,206,961 | |||
|
| |||
Net investment (loss) | (1,024,575 | ) | ||
|
| |||
Realized and unrealized gain (loss) from investments: | ||||
Net realized gain (loss) from: | ||||
Investments in unaffiliated securitiesC | 3,477,003 | |||
Foreign currency transactions | (111 | ) | ||
Change in net unrealized appreciation of: | ||||
Investments in unaffiliated securitiesD | 79,013,992 | |||
Foreign currency transactions | 3 | |||
|
| |||
Net gain from investments | 82,490,887 | |||
|
| |||
Net increase in net assets resulting from operations | $ | 81,466,312 | ||
|
| |||
† Foreign taxes | $ | 456 | ||
A Includes significant dividends of $21,421. | ||||
B Formerly known as Institutional Class. | ||||
C The Fund did not recognize net realized gains (losses) from the sale of investments in affiliated securities. |
| |||
D The Fund’s investments in affiliated securities did not have a change in unrealized appreciation (depreciation) at year end. |
| |||
See accompanying notes
13
American Beacon ARK Transformational Innovation FundSM
Statement of Changes in Net Assets
| Year Ended June 30, 2020 | Year Ended June 30, 2019 | |||||||||||
Increase (decrease) in net assets: | ||||||||||||
Operations: | ||||||||||||
Net investment (loss) | $ | (1,024,575 | ) | $ | (285,487 | ) | ||||||
Net realized gain from investments in unaffiliated securities and foreign currency transactions | 3,476,892 | 1,603,369 | ||||||||||
Change in net unrealized appreciation of investments in unaffiliated securities and foreign currency transactions | 79,013,995 | 1,828,947 | ||||||||||
|
|
|
| |||||||||
Net increase in net assets resulting from operations | 81,466,312 | 3,146,829 | ||||||||||
|
|
|
| |||||||||
Distributions to shareholders: | ||||||||||||
Total retained earnings: | ||||||||||||
R5 ClassA | (134,305 | ) | (142,278 | ) | ||||||||
Y Class | (1,391,035 | ) | (764,186 | ) | ||||||||
Investor Class | (319,336 | ) | (482,172 | ) | ||||||||
A Class | (205,755 | ) | - | |||||||||
C Class | (94,357 | ) | - | |||||||||
|
|
|
| |||||||||
Net distributions to shareholders | (2,144,788 | ) | (1,388,636 | ) | ||||||||
|
|
|
| |||||||||
Capital share transactions (Note 10): | ||||||||||||
Proceeds from sales of shares | 262,403,322 | 44,421,838 | ||||||||||
Reinvestment of dividends and distributions | 2,143,123 | 1,386,473 | ||||||||||
Cost of shares redeemed | (57,256,735 | ) | (21,809,490 | ) | ||||||||
|
|
|
| |||||||||
Net increase in net assets from capital share transactions | 207,289,710 | 23,998,821 | ||||||||||
|
|
|
| |||||||||
Net increase in net assets | 286,611,234 | 25,757,014 | ||||||||||
|
|
|
| |||||||||
Net assets: | ||||||||||||
Beginning of period | 50,205,295 | 24,448,281 | ||||||||||
|
|
|
| |||||||||
End of period | $ | 336,816,529 | $ | 50,205,295 | ||||||||
|
|
|
| |||||||||
| A Formerly known as Institutional Class. | ||||||||||||
See accompanying notes
14
American Beacon ARK Transformational Innovation FundSM
June 30, 2020
1. Organization and Significant Accounting Policies
American Beacon Funds (the “Trust”) is organized as a Massachusetts business trust. The Fund, a series within the Trust, is registered under the Investment Company Act of 1940, as amended (the “Act”), as a non-diversified, open-end management investment company. As of June 30, 2020, the Trust consists of twenty-seven active series, one of which is presented in this filing: American Beacon ARK Transformational Innovation Fund (the “Fund”). The remaining twenty-six active series are reported in separate filings.
American Beacon Advisors, Inc. (the “Manager”) is a Delaware corporation and a wholly-owned subsidiary of Resolute Investment Managers, Inc. (“RIM”) organized in 1986 to provide business management, advisory, administrative, and asset management consulting services to the Trust and other investors. The Manager is registered as an investment advisor under the Investment Advisers Act of 1940, as amended (the “Advisers Act”). RIM is, in turn, a wholly-owned subsidiary of Resolute Acquisition, Inc., which is a wholly-owned subsidiary of Resolute Topco, Inc., a wholly-owned subsidiary of Resolute Investment Holdings, LLC (“RIH”). RIH is owned primarily by Kelso Investment Associates VIII, L.P., KEP VI, LLC and Estancia Capital Partners L.P., investment funds affiliated with Kelso & Company, L.P. (“Kelso”) or Estancia Capital Management, LLC (“Estancia”), which are private equity firms.
Recently Adopted Accounting Pronouncements
In August 2018, the Financial Accounting Standards Board (“FASB”) issued Accounting Standards Update (“ASU”) 2018-13, Fair Value Measurement (“Topic 820”). The amendments in the ASU impact disclosure requirements for fair value measurement. It is anticipated that this change will enhance the effectiveness of disclosures in the notes to the financial statements. This ASU is effective for fiscal years beginning after December 15, 2019. Early adoption is permitted and can include the entire standard or certain provisions that exclude or amend disclosures. For the year ended June 30, 2020, the Fund has chosen to adopt the standard. The adoption of this ASU guidance did not have a material impact on the financial statements and other disclosures.
In March 2020, the FASB issued ASU 2020-04, which provides optional expedients and exceptions for contracts, hedging relationships and other transactions affected by the transitioning away from the London Interbank Offered Rate (LIBOR) and other reference rates that are expected to be discontinued. The ASU is effective immediately upon release of the update on March 12, 2020 through December 31, 2022. At this time, management is evaluating the implications of these changes on the financial statements.
Class Disclosure
Effective February 28, 2020, the name of the Institutional Class changed to R5 Class.
The Fund has multiple classes of shares designed to meet the needs of different groups of investors. The following table sets forth the differences amongst the classes:
Class | Eligible Investors | Minimum Initial Investments | ||||
| R5 Class | Large institutional investors - sold directly or through intermediary channels. | $ | 250,000 | |||
| Y Class | Large institutional retirement plan investors - sold directly or through intermediary channels. | $ | 100,000 | |||
| Investor Class | All investors using intermediary organizations, such as broker-dealers or retirement plan sponsors. | $ | 2,500 | |||
| A Class | All investors who invest through intermediary organizations, such as broker-dealers or third party administrator. Retail investors who invest directly through a financial intermediary such as a broker, bank, or registered investment advisor which may include a front-end sales charge and a contingent deferred sales charge (“CDSC”). | $ | 2,500 | |||
| C Class | Retail investors who invest directly through a financial intermediary such as a broker or through employee directed benefit plans with applicable sales charges which may include CDSC. | $ | 1,000 | |||
15
American Beacon ARK Transformational Innovation FundSM
Notes to Financial Statements
June 30, 2020
Each class offered by the Trust has equal rights as to assets and voting privileges. Income and non-class specific expenses are allocated daily to each class based on the relative net assets. Realized and unrealized capital gains and losses of each class are allocated daily based on the relative net assets of each class of the respective Fund. Class specific expenses, where applicable, currently include service, distribution, transfer agent fees, and sub-transfer agent fees that vary amongst the classes as described more fully in Note 2.
Significant Accounting Policies
The following is a summary of significant accounting policies, consistently followed by the Fund in preparation of the financial statements. The Fund is considered an investment company and accordingly, follows the investment company accounting and reporting guidance of the FASB Accounting Standards Codification Topic 946, Financial Services – Investment Companies, a part of Generally Accepted Accounting Principles (“U.S. GAAP”).
Security Transactions and Investment Income
Security transactions are recorded as of the trade date for financial reporting purposes. Securities purchased or sold on a when-issued or delayed-delivery basis may be settled beyond a standard settlement period for the security after the trade date.
Dividend income, net of foreign taxes, is recorded on the ex-dividend date, except certain dividends from foreign securities which are recorded as soon as the information is available to the Fund. Interest income, net of foreign taxes, is earned from settlement date, recorded on the accrual basis, and adjusted, if necessary, for accretion of discounts and amortization of premiums. Realized gains (losses) from securities sold are determined based on specific lot identification.
Currency Translation
All assets and liabilities initially expressed in foreign currency values are converted into U.S. dollar values at the mean of the bid and ask prices of such currencies against U.S. dollars as last quoted by a recognized dealer. Income, expenses, and purchases and sales of investments are translated into U.S. dollars at the rate of the exchange prevailing on the respective dates of such transactions. The effect of changes in foreign currency exchange rates on investments is separately identified from the fluctuations arising from changes in market values of securities held and is reported with all other foreign currency gains and losses on the Fund’s Statement of Operations.
Distributions to Shareholders
The Fund distributes most or all of its net earnings and realized gains, if any, each taxable year in the form of dividends from net investment income and distributions of realized net capital gains and net gains from foreign currency transactions on an annual basis. The Fund does not have a fixed dividend rate and does not guarantee that it will pay any distributions in any particular period. Dividends to shareholders are determined in accordance with federal income tax regulations, which may differ in amount and character from net investment income and realized gains recognized for purposes of U.S. GAAP. To the extent necessary to fully distribute capital gains, the Fund may designate earnings and profits distributed to shareholders on the redemption of shares.
Commission Recapture
The Fund has established brokerage commission recapture arrangements with certain brokers or dealers. If the Fund’s investment advisor chooses to execute a transaction through a participating broker, the broker rebates a portion of the commission back to the Fund. Any collateral benefit received through participation in the commission recapture program is directed exclusively to the Fund. This amount is reported with the net realized gain (loss) in the Fund’s Statement of Operations, if applicable.
16
American Beacon ARK Transformational Innovation FundSM
Notes to Financial Statements
June 30, 2020
Allocation of Income, Trust Expenses, Gains, and Losses
Investment income, realized and unrealized gains and losses from investments of the Fund is allocated daily to each class of shares based upon the relative proportion of net assets of each class to the total net assets of the Fund. Expenses directly charged or attributable to the Fund will be paid from the assets of the Fund. Generally, expenses of the Trust will be allocated among and charged to the assets of the Fund on a basis that the Trust’s Board of Trustees (the “Board”) deems fair and equitable, which may be based on the relative net assets of the Fund or nature of the services performed and relative applicability to the Fund.
Use of Estimates
The preparation of financial statements in conformity with U.S. GAAP requires management to make estimates and assumptions that affect the amounts reported in the financial statements and accompanying notes. Actual results may differ from those estimated.
Other
Under the Trust’s organizational documents, its officers and trustees are indemnified against certain liabilities arising out of the performance of their duties to the Trust. In the normal course of business, the Trust enters into contracts that provide indemnification to the other party or parties against potential costs or liabilities. The Trust’s maximum exposure under these arrangements is dependent on claims that may be made in the future and, therefore, cannot be estimated. The Trust has had no prior claims or losses pursuant to any such agreement.
2. Transactions with Affiliates
Management and Investment Sub-Advisory Agreements
The Fund and the Manager are parties to a Management Agreement that obligates the Manager to provide the Fund with investment advisory and administrative services. As compensation for performing the duties under the Management Agreement, the Manager will receive an annualized management fee based on a percentage of the Fund’s average daily net assets that is calculated and accrued daily according to the following schedule:
First $5 billion | 0.35 | % | ||
Next $5 billion | 0.325 | % | ||
Next $10 billion | 0.30 | % | ||
Over $20 billion | 0.275 | % |
The Trust, on behalf of the Fund, and the Manager have entered into an Investment Advisory Agreement with ARK Investment Management LLC (the “Sub-Advisor”) pursuant to which the Fund has agreed to pay an annualized sub-advisory fee that is calculated and accrued daily based on the Fund’s average daily net assets according to the following schedule:
First $5 billion | 0.55 | % | ||
Next $5 billion | 0.525 | % | ||
Next $10 billion | 0.50 | % | ||
Over $20 billion | 0.475 | % |
The Management and Sub-Advisory Fees paid by the Fund for the year ended June 30, 2020 were as follows:
| Effective Fee Rate | Amount of Fees Paid | |||||||||||
Management Fees | 0.35 | % | $ | 356,243 | ||||||||
Sub-Advisor Fees | 0.55 | % | 546,623 | |||||||||
|
|
|
| |||||||||
Total | 0.90 | % | $ | 902,866 | ||||||||
|
|
|
| |||||||||
17
American Beacon ARK Transformational Innovation FundSM
Notes to Financial Statements
June 30, 2020
As compensation for services provided by the Manager in connection with securities lending activities conducted by the Fund, the lending Fund pays to the Manager, with respect to cash collateral posted by borrowers, a fee of 10% of the net monthly interest income (the gross interest income earned by the investment of cash collateral, less the amount paid to borrowers and related expenses) from such activities and, with respect to loan fees paid by borrowers, a fee of 10% of such loan fees. Securities lending income is generated from the demand premium (if any) paid by the borrower to borrow a specific security and from the return on investment of cash collateral, reduced by negotiated rebate fees paid to the borrower and transaction costs. To the extent that a loan is secured by non-cash collateral, securities lending income is generated as a demand premium reduced by transaction costs. These fees are included in “Income derived from securities lending” and “Management and investment advisory fees” on the Statement of Operations. During the year ended June 30, 2020, the Manager received securities lending fees of $9,835 for the securities lending activities of the Fund.
Distribution Plans
The Fund, except for the A and C Classes of the Fund, has adopted a “defensive” Distribution Plan (the “Plan”) in accordance with Rule 12b-1 under the Act, pursuant to which no separate fees may be charged to the Fund for distribution purposes. However, the Plan authorizes the management fee received by the Manager and the investment advisors hired by the Manager to be used for distribution purposes. Under this Plan, the Fund does not intend to compensate the Manager or any other party, either directly or indirectly, for the distribution of Fund shares.
Separate Distribution Plans (the “Distribution Plans”) have been adopted pursuant to Rule 12b-1 under the Act for the A and C Classes of the Fund. Under the Distribution Plans, as compensation for distribution and shareholder servicing assistance, the Manager receives an annual fee of 0.25% of the average daily net assets of the A Class and 1.00% of the average daily net assets of the C Class. The fee will be payable without regard to whether the amount of the fee is more or less than the actual expenses incurred in a particular month by the Manager for distribution assistance.
Service Plans
The Manager and the Trust entered into a Service Plan that obligates the Manager to oversee additional shareholder servicing of the Investor, A, and C Classes of the Fund. As compensation for performing the duties required under the Service Plan, the Manager receives an annualized fee up to 0.25% of the average daily net assets of the A and C Classes, and up to 0.375% of the average daily net assets of the Investor Class of the Fund.
Sub-Transfer Agent Fees
The Manager has entered into agreements, which include servicing agreements, with financial intermediaries that provide recordkeeping, processing, shareholder communications and other services to customers of the intermediaries that hold positions in the R5 and Y Classes of the Fund and has agreed to compensate the intermediaries for providing these services. Intermediaries transact with the Fund primarily through the use of omnibus accounts on behalf of its customers who hold positions in the Fund. Certain services would have been provided by the Fund’s transfer agent and other service providers if the shareholders’ accounts were maintained directly by the Fund’s transfer agent. Accordingly, the Fund, pursuant to Board approval, has agreed to reimburse the Manager for certain non-distribution shareholder services provided by financial intermediaries for the R5 and Y Classes. The reimbursement amounts (sub-transfer agent fees) paid to the Manager are subject to a fee limit of up to 0.10% of an intermediary’s average net assets in the R5 and Y Classes on an annual basis. During the year ended June 30, 2020, the sub-transfer agent fees, as reflected in “Transfer agent fees” on the Statement of Operations, were as follows:
Fund | Sub-Transfer Agent Fees | |||
ARK Transformational Innovation | $ | 67,542 | ||
18
American Beacon ARK Transformational Innovation FundSM
Notes to Financial Statements
June 30, 2020
As of June 30, 2020, the Fund owed the Manager the following reimbursement of sub-transfer agent fees, as reflected in “Transfer agent fees payable” on the Statement of Assets and Liabilities:
Fund | Reimbursement Sub-Transfer Agent Fees | |||
ARK Transformational Innovation | $ | 15,628 | ||
Investments in Affiliated Funds
The Fund may invest in the American Beacon U.S. Government Money Market Select Fund (the “USG Select Fund”). Cash collateral received by the Fund in connection with securities lending may also be invested in the USG Select Fund. The Fund held the following shares with a June 30, 2020 fair value and dividend income earned from the investment in the USG Select Fund:
| Affiliated Security | Type of Transaction | Fund | June 30, 2020 Shares/Principal | Change in Unrealized Gain (Loss) | Realized Gain (Loss) | Dividend Income | June 30, 2020 Fair Value | |||||||||||||||||
| U.S. Government Money Market Select | Direct | ARK Transformational Innovation | $ | 16,973,816 | $ | - | $ | - | $ | 42,418 | $ | 16,973,816 | ||||||||||||
| U.S. Government Money Market Select | Securities Lending | ARK Transformational Innovation | 12,077,937 | - | - | N/A | 12,077,937 | |||||||||||||||||
The Fund and the USG Select Fund have the same investment advisor and therefore, are considered to be affiliated. The Manager serves as investment advisor to the USG Select Fund and receives management fees and administrative fees totaling 0.10% of the average daily net assets of the USG Select Fund. During the year ended June 30, 2020, the Manager earned fees on the Fund’s direct investments and securities lending collateral investments in the USG Select Fund as shown below:
Fund | Direct Investments in USG Select Fund | Securities Lending Collateral Investments in USG Select Fund | Total | |||||||||
ARK Transformational Innovation | $ | 5,487 | $ | 5,257 | $ | 10,744 | ||||||
Interfund Credit Facility
Pursuant to an exemptive order issued by the U.S. Securities and Exchange Commission (“SEC”), the Fund, along with other registered investment companies having management contracts with the Manager, may participate in a credit facility whereby each fund, under certain conditions, is permitted to lend money directly to and borrow directly from other participating funds for temporary purposes. The interfund credit facility is advantageous to the funds because it provides added liquidity and eliminates the need to maintain higher cash balances to meet redemptions. This situation could arise when shareholder redemptions exceed anticipated volumes and certain funds have insufficient cash on hand to satisfy such redemptions or when sales of securities do not settle as expected, resulting in a cash shortfall for a fund. When a fund liquidates portfolio securities to meet redemption requests, they often do not receive payment in settlement for up to two days (or longer for certain foreign transactions). Redemption requests normally are satisfied on the next business day. The credit facility provides a source of immediate, short-term liquidity pending settlement of the sale of portfolio securities. The credit facility is administered by a credit facility team consisting of professionals from the Manager’s asset management, compliance, and accounting areas who report the activities of the credit facility to the Board. During the year ended June 30, 2020, the Fund borrowed on average $214,822 for 2 days at an average interest rate of 2.49% with interest charges of $29. These amounts are recorded as “Other expenses” in the Statement of Operations.
Expense Reimbursement Plan
The Manager contractually agreed to reduce fees and/or reimburse expenses for the classes of the Fund to the extent that total operating expenses exceed the Fund’s expense cap. During the year ended June 30, 2020, the Manager waived and/or reimbursed expenses as follows:
19
American Beacon ARK Transformational Innovation FundSM
Notes to Financial Statements
June 30, 2020
| Expense Cap | Expiration of Reimbursed Expenses | |||||||||||||||||
Fund | Class | 7/1/2019 - 6/30/2020 | Reimbursed Expenses | (Recouped) Expenses | ||||||||||||||
ARK Transformational Innovation | R5* | 0.99 | % | $ | 11,090 | $ | (1,104 | )** | 2022-2023 | |||||||||
ARK Transformational Innovation | Y | 1.09 | % | 104,433 | (6,612 | )** | 2022-2023 | |||||||||||
ARK Transformational Innovation | Investor | 1.37 | % | 23,775 | (5,101 | )** | 2022-2023 | |||||||||||
ARK Transformational Innovation | A | 1.39 | % | 21,751 | - | 2022-2023 | ||||||||||||
ARK Transformational Innovation | C | 2.14 | % | 7,700 | (1,074 | )** | 2022-2023 | |||||||||||
* Formerly Institutional Class
** These amounts represent Recouped Expenses from prior fiscal years and are reflected in Total Expenses on the Statement of Operations.
Of these amounts, $11,906 was disclosed as a payable to the Manager on the Statement of Assets and Liabilities at June 30, 2020.
The Fund has adopted an Expense Reimbursement Plan whereby the Manager may seek repayment of such fee or voluntary reductions and expense reimbursements. Under the policy, the Manager can be reimbursed by the Fund for any contractual or voluntary fee reductions or expense reimbursements if reimbursement to the Manager (a) occurs within three years from the date of the Manager’s waiver/reimbursement and (b) does not cause the Fund’s annual operating expenses to exceed the lesser of the contractual percentage limit in effect at the time of the waiver/reimbursement or time of recoupment. The reimbursed expenses listed above will expire in 2022 and 2023. The Fund did not record a liability for potential reimbursement due to the current assessment that a reimbursement is uncertain. The carryover of excess expenses potentially reimbursable to the Manager, but not recorded as a liability are as follows:
Fund | Recouped Expenses | Excess Expense Carryover | Expired Expense Carryover | Expiration of Reimbursed Expenses | ||||||||||||
ARK Transformational Innovation | $ | 7,706 | $ | - | $ | 133,927 | 2019-2020 | |||||||||
ARK Transformational Innovation | 5,111 | 462,907 | - | 2020-2021 | ||||||||||||
ARK Transformational Innovation | 1,074 | 252,640 | - | 2021-2022 | ||||||||||||
Sales Commissions
The Fund’s Distributor, Resolute Investment Distributors, Inc. (“RID” or “Distributor”), may receive a portion of Class A sales charges from broker dealers which may be used to offset distribution related expenses. During the year ended June 30, 2020, RID collected $87,578 from the sale of Class A Shares of the Fund.
A CDSC of 0.50% will be deducted with respect to Class A Shares on certain purchases of $1,000,000 or more that are redeemed in whole or part within 18 months of purchase, unless waived as discussed in the Fund’s Prospectus. Any applicable CDSC will be 0.50% of the lesser of the original purchase price or the value of the redemption of the Class A Shares redeemed. During the year ended June 30, 2020, CDSC fees of $6 were collected for the Class A Shares of the Fund.
A CDSC of 1.00% will be deducted with respect to Class C Shares redeemed within 12 months of purchase, unless waived as discussed in the Fund’s Prospectus. Any applicable CDSC will be 1.00% of the lesser of the original purchase price or the value of the redemption of the Class C Shares redeemed. During the year ended June 30, 2020, CDSC fees of $7,122 were collected for Class C Shares of the Fund.
Trustee Fees and Expenses
Effective January 1, 2020, as compensation for their service to the American Beacon Funds Complex, including the Trust (collectively, the “Trusts”), each Trustee is compensated from the Trusts as follows: (1) an annual retainer of $120,000; (2) meeting attendance fee (for attendance in person or via teleconference) of (a) $12,000 for in person attendance, or $5,000 for telephonic attendance, by Board members for each regularly
20
American Beacon ARK Transformational Innovation FundSM
Notes to Financial Statements
June 30, 2020
scheduled or special Board meeting, (b) $2,500 for attendance by Committee members at meetings of the Audit Committee and the Investment Committee, (c) $1,500 for attendance by Committee members at meetings of the Nominating and Governance Committee; and (d) $2,500 for attendance by Board members for each special telephonic Board meeting; and (3) reimbursement of reasonable expenses incurred in attending Board meetings, Committee meetings, and relevant educational seminars. The Trustees also may be compensated for attendance at special Board and/or Committee meetings from time to time. For her service as Board Chair, Ms. Cline receives an additional annual retainer of $50,000. Although she attends several committee meetings at each quarterly Board meeting, she receives only a single $2,500 fee each quarter for her attendance at those meetings. The chairpersons of the Audit Committee and the Investment Committee each receive an additional annual retainer of $25,000 and the Chair of the Nominating and Governance Committee receives an additional annual retainer of $15,000.
3. Security Valuation and Fair Value Measurements
The price of the Fund’s shares is based on its net asset value (“NAV”) per share. The Fund’s NAV is computed by adding total assets, subtracting all the Fund’s liabilities, and dividing the result by the total number of shares outstanding.
The NAV of each class of the Fund’s shares is determined based on a pro rata allocation of the Fund’s investment income, expenses and total capital gains and losses. The Fund’s NAV per share is determined each business day as of the regular close of trading on the New York Stock Exchange (“NYSE” or “Exchange”), which is typically 4:00 p.m. Eastern Time (“ET”). However, if trading on the NYSE closes at a time other than 4:00 p.m. ET, the Fund’s NAV per share typically would still be determined as of the regular close of trading on the NYSE. The Fund does not price its shares on days that the NYSE is closed. Foreign exchanges may permit trading in foreign securities on days when the Fund is not open for business, which may result in the value of the Fund’s portfolio investments being affected at a time when you are unable to buy or sell shares.
Equity securities, including shares of closed-end funds and exchange-traded funds (“ETFs”), are valued at the last sale price or official closing price taken from the primary exchange in which each security trades. Investments in other mutual funds are valued at the closing NAV per share on the day of valuation. Debt securities are valued at bid quotes from broker/dealers or evaluated bid prices from pricing services, who may consider a number of inputs and factors, such as prices of comparable securities, yield curves, spreads, credit ratings, coupon rates, maturity, default rates, and underlying collateral. Futures are valued based on their daily settlement prices. Exchange-traded and over-the-counter (“OTC”) options are valued at the last sale price. Options with no last sale for the day are priced at mid quote. Swaps are valued at evaluated mid prices from pricing services.
The valuation of securities traded on foreign markets and certain fixed-income securities will generally be based on prices determined as of the earlier closing time of the markets on which they primarily trade unless a significant event has occurred. When the Fund holds securities or other assets that are denominated in a foreign currency, the Fund will normally use the currency exchange rates as of 4:00 p.m. ET.
Securities may be valued at fair value, as determined in good faith and pursuant to procedures approved by the Board, under certain limited circumstances. For example, fair value pricing will be used when market quotations are not readily available or reliable, as determined by the Manager, such as when (i) trading for a security is restricted or stopped; (ii) a security’s trading market is closed (other than customary closings); or (iii) a security has been de-listed from a national exchange. A security with limited market liquidity may require fair value pricing if the Manager determines that the available price does not reflect the security’s true market value. In addition, if a significant event that the Manager determines to affect the value of one or more securities held by the Fund occurs after the close of a related exchange but before the determination of the Fund’s NAV, fair value pricing may be used on the affected security or securities. Securities of small-capitalization companies are also more likely to require a fair value determination using these procedures because they are more thinly traded and less liquid than the securities of larger-capitalization companies. The Fund may fair value securities as a result of significant events occurring after the close of the foreign markets in which the Fund invests as described below. In addition, the Fund may invest in illiquid securities requiring these procedures.
21
American Beacon ARK Transformational Innovation FundSM
Notes to Financial Statements
June 30, 2020
The Fund may use fair value pricing for securities primarily traded in non-U.S. markets because most foreign markets close well before the Fund’s pricing time of 4:00 p.m. ET. The earlier close of these foreign markets gives rise to the possibility that significant events, including broad market moves, may have occurred in the interim and may materially affect the value of those securities. If the Manager determines that the last quoted prices of non-U.S. securities will, in its judgment, materially affect the value of some or all its portfolio securities, the Manager can adjust the previous closing prices to reflect what it believes to be the fair value of the securities as of the close of the Exchange. In deciding whether it is necessary to adjust closing prices to reflect fair value, the Manager reviews a variety of factors, including developments in foreign markets, the performance of U.S. securities markets, and the performance of instruments trading in U.S. markets that represent foreign securities and baskets of foreign securities. These securities are fair valued using a pricing service, using methods approved by the Board, that considers the correlation of the trading patterns of the foreign security to intraday trading in the U.S. markets, based on indices of domestic securities and other appropriate indicators such as prices of relevant American Depositary Receipts (“ADRs”) and futures contracts. The Valuation Committee, established by the Board, may also fair value securities in other situations, such as when a particular foreign market is closed but the Fund is open. The Fund uses outside pricing services to provide closing prices and information to evaluate and/or adjust those prices. As a means of evaluating its security valuation process, the Valuation Committee routinely compares closing prices, the next day’s opening prices in the same markets and adjusted prices.
Attempts to determine the fair value of securities introduce an element of subjectivity to the pricing of securities. As a result, the price of a security determined through fair valuation techniques may differ from the price quoted or published by other sources and may not accurately reflect the market value of the security when trading resumes. If a reliable market quotation becomes available for a security formerly valued through fair valuation techniques, the Manager compares the new market quotation to the fair value price to evaluate the effectiveness of the Fund’s fair valuation procedures. If any significant discrepancies are found, the Manager may adjust the Fund’s fair valuation procedures.
Valuation Inputs
Various inputs may be used to determine the fair value of the Fund’s investments. These inputs are summarized in three broad levels for financial statement purposes. The inputs or methodologies used to value securities are not necessarily an indication of the risk associated with investing in those securities.
| Level 1 | - | Quoted prices in active markets for identical securities. | ||
| Level 2 | - | Prices determined using other significant observable inputs. These may include quoted prices for similar securities, interest rates, prepayment speeds, credit risk, and others. | ||
| Level 3 | - | Prices determined using other significant unobservable inputs. Unobservable inputs reflect the Fund’s own assumptions about the factors market participants would use in pricing an investment. | ||
Level 1 and Level 2 trading assets and trading liabilities, at fair value
Common stocks, ETFs, and financial derivative instruments, such as futures contracts or options that are traded on a national securities exchange, are stated at the last reported sale or settlement price on the day of valuation. To the extent these securities are actively traded and valuation adjustments are not applied, they are categorized as Level 1 of the fair value hierarchy. Valuation adjustments may be applied to certain securities that are solely traded on a foreign exchange to account for the market movement between the close of the foreign market and the close of the Exchange. These securities are valued using pricing service providers that consider the correlation of the trading patterns of the foreign security to the intraday trading in the U.S. markets for investments. Securities using these valuation adjustments are categorized as Level 2 of the fair value hierarchy.
Investments in registered open-end investment management companies will be valued based upon the NAVs of such investments and are categorized as Level 1 of the fair value hierarchy.
22
American Beacon ARK Transformational Innovation FundSM
Notes to Financial Statements
June 30, 2020
4. Securities and Other Investments
American Depositary Receipts
ADRs are depositary receipts for foreign issuers in registered form traded in U.S. securities markets. Depositary receipts may not be denominated in the same currency as the securities into which they may be converted. Investing in depositary receipts entails substantially the same risks as direct investment in foreign securities. There is generally less publicly available information about foreign companies and there may be less governmental regulation and supervision of foreign stock exchanges, brokers, and listed companies. In addition, such companies may use different accounting and financial standards (and certain currencies may become unavailable for transfer from a foreign currency), resulting in the Fund’s possible inability to convert immediately into U.S. currency proceeds realized upon the sale of portfolio securities of the affected foreign companies. In addition, the Fund may invest in unsponsored depositary receipts, the issuers of which are not obligated to disclose material information about the underlying securities to investors in the United States. Ownership of unsponsored depositary receipts may not entitle the Fund to the same benefits and rights as ownership of a sponsored depositary receipt or the underlying security.
Common Stock
Common stock generally takes the form of shares in a corporation which represent an ownership interest. It ranks below preferred stock and debt securities in claims for dividends and for assets of the company in a liquidation or bankruptcy. The value of a company’s common stock may fall as a result of factors directly relating to that company, such as decisions made by its management or decreased demand for the company’s products or services. A stock’s value may also decline because of factors affecting not just the company, but also companies in the same industry or sector. The price of a company’s stock may also be affected by changes in financial markets that are relatively unrelated to the company, such as changes in interest rates, currency exchange rates or industry regulation. Companies that elect to pay dividends on their common stock generally only do so after they invest in their own business and make required payments to bondholders and on other debt and preferred stock. Therefore, the value of a company’s common stock will usually be more volatile than its bonds, other debt and preferred stock. Common stock may be exchange-traded or OTC. OTC stock may be less liquid than exchange-traded stock.
Foreign Securities
The Fund may invest in securities of foreign issuers. Foreign issuers are issuers organized and doing business principally outside the United States and include corporations, banks, non-U.S. governments, and quasi-governmental organizations. While investments in foreign securities may be intended to reduce risk by providing further diversification, such investments involve sovereign and other risks, in addition to the credit and market risks normally associated with domestic securities. These additional risks include the possibility of adverse political and economic developments (including political or social instability, nationalization, expropriation, or confiscatory taxation); the potentially adverse effects of unavailability of public information regarding issuers, different governmental supervision and regulation of financial markets, reduced liquidity of certain financial markets, and the lack of uniform accounting, auditing, and financial reporting standards or the application of standards that are different or less stringent than those applied in the United States; different laws and customs governing securities tracking; and possibly limited access to the courts to enforce the Fund’s rights as an investor.
Other Investment Company Securities and Other Exchange-Traded Products
The Fund may invest in shares of other investment companies, including open-end funds, closed-end funds, business development companies (“BDCs”), ETFs, unit investment trusts, and other investment companies of the Trust. The Fund may invest in securities of an investment company advised by the Manager or a sub-advisor. Investments in the securities of other investment companies may involve duplication of advisory fees and certain other expenses. By investing in another investment company, the Fund becomes a shareholder of that investment
23
American Beacon ARK Transformational Innovation FundSM
Notes to Financial Statements
June 30, 2020
company. As a result, the Fund’s shareholders indirectly will bear the Fund’s proportionate share of the fees and expenses paid by shareholders of the other investment company, in addition to the fees and expenses the Fund’s shareholders directly bear in connection with the Fund’s own operations. These other fees and expenses are reflected as Acquired Fund Fees and Expenses and are included in the Fees and Expenses Table for the Fund in its Prospectus, if applicable. Investments in other investment companies may involve the payment of substantial premiums above the value of such issuer’s portfolio securities.
5. Principal Risks
Investing in the Fund may involve certain risks including, but not limited to, those described below.
Asset Selection Risk
Assets selected by the sub-advisor or the Manager for the Fund may not perform to expectations. The sub-advisor’s investment models may rely in part on data derived from third parties and may not perform as intended. This could result in the Fund’s underperformance compared to other funds with similar investment objectives.
Currency Risk
The Fund may have exposure to foreign currencies by making direct investments in non-U.S. currencies or in securities denominated in non-U.S. currencies, or by purchasing or selling forward currency exchange contracts in non-U.S. currencies. Foreign currencies may decline in value relative to the U.S. dollar, or, in the case of hedging positions, the U.S. dollar may decline in value relative to the currency being hedged, and thereby affect the Fund’s investments in foreign (non-U.S.) currencies or in securities that trade in, and receive revenues in, or in derivatives that provide exposure to, foreign (non-U.S.) currencies. Currency exchange rates may fluctuate significantly over short periods of time for a number of reasons, including changes in interest rates, intervention (or the failure to intervene) by U.S. or foreign governments, central banks or supranational entities such as the International Monetary Fund, or by the imposition of currency controls or other political developments in the United States or abroad. As a result, the Fund’s investments in foreign currency denominated securities may reduce the returns of the Fund. Currency futures, forwards, options or swaps may not always work as intended, and in specific cases, the Fund may be worse off than if it had not used such instrument(s). There may not always be suitable hedging instruments available. Even where suitable hedging instruments are available, the Fund may choose to not hedge its currency risks.
Equity Investments Risk
Equity securities are subject to investment and market risk. The Fund’s investments in equity securities may include common stocks. Investing in such securities may expose the funds to additional risk. The value of a company’s common stock may fall as a result of factors affecting the company, companies in the same industry or sector, or the financial markets overall. Common stock generally is subordinate to preferred stock upon the liquidation or bankruptcy of the issuing company.
Foreign Investing and Emerging Markets Risk
Non-U.S. investments carry potential risks not associated with U.S. investments. Such risks include, but are not limited to: (1) currency exchange rate fluctuations, (2) political and financial instability, (3) less liquidity, (4) lack of uniform accounting, auditing and financial reporting standards, (5) increased price volatility, (6) less government regulation and supervision of foreign stock exchanges, brokers and listed companies, and (7) delays in transaction settlement in some foreign markets. To the extent the Fund invests a significant portion of its assets in securities of a single country or region, it is more likely to be affected by events or conditions of that country or region. In addition, the economies and political environments of emerging market countries tend to be more
24
American Beacon ARK Transformational Innovation FundSM
Notes to Financial Statements
June 30, 2020
unstable than those of developed countries, resulting in more volatile rates of return than the developed markets and substantially greater risk to investors. There may be very limited oversight of certain foreign banks or securities depositories that hold foreign securities and currency and the laws of certain countries may limit the ability to recover such assets if a foreign bank or depository or their agents goes bankrupt. When investing in emerging markets, the risks of investing in foreign securities are heightened. Emerging markets have unique risks that are greater than, or in addition to, investing in developed markets because emerging markets are generally smaller, less developed, less liquid and more volatile than the securities markets of the U.S. and other developed markets. There are also risks of: greater political uncertainties; an economy’s dependence on revenues from particular commodities or on international aid or development assistance; currency transfer restrictions; a limited number of potential buyers for such securities, resulting in increased volatility and limited liquidity for emerging market securities; trading suspensions; and delays and disruptions in securities settlement procedures. In addition, there may be less information available to make investment decisions and more volatile rates of return.
Market Disruption Risk
Geopolitical and other events, including war, terrorism, economic uncertainty, trade disputes, pandemics, public health crises and related geopolitical events have led, and in the future may continue to lead, to instability in world economies and markets generally. This instability has disrupted, and may continue to disrupt, U.S. and world economies and markets and adversely affect the value of your investment. Events that have led to market disruptions include the recent pandemic spread of the novel coronavirus known as COVID-19, the duration and full effects of which are still uncertain. Market disruptions have caused, and may continue to cause, broad changes in market value, negative public perceptions concerning these developments, and adverse investor sentiment or publicity. Changes in value may be temporary or may last for extended periods.
Market Risk
Conditions in the U.S. and many foreign economies have resulted, and may continue to result, in certain instruments experiencing unusual liquidity issues, increased price volatility and, in some cases, credit downgrades and increased likelihood of default. These events have reduced the willingness and ability of some lenders to extend credit, and have made it more difficult for some borrowers to obtain financing on attractive terms, if at all. In some cases, traditional market participants have been less willing to make a market in some types of debt instruments, which has affected the liquidity of those instruments. During times of market turmoil, investors tend to look to the safety of securities issued or backed by the U.S. Treasury, causing the prices of these securities to rise and the yields to decline. Reduced liquidity in fixed income and credit markets may negatively affect many issuers worldwide. In addition, global economies and financial markets are becoming increasingly interconnected, which increases the possibilities that conditions in one country or region might adversely impact issuers in a different country or region. A rise in protectionist trade policies, and the possibility of changes to some international trade agreements, could affect the economies of many nations, including the United States, in ways that cannot necessarily be foreseen at the present time.
In response to the financial crisis, the U.S. and other governments and the Federal Reserve and certain foreign central banks have taken steps to support financial markets. In some countries where economic conditions are recovering, they are nevertheless perceived as still fragile. Withdrawal of government support, failure of efforts in response to the crisis, or investor perception that such efforts are not succeeding, could adversely impact the value and liquidity of certain securities. The severity or duration of adverse economic conditions may also be affected by policy changes made by governments or quasi-governmental organizations, including changes in tax laws. The impact of new financial regulation legislation on the markets and the practical implications for market participants may not be fully known for some time. Regulatory changes are causing some financial services companies to exit long-standing lines of business, resulting in dislocations for other market participants.
In addition, political and governmental events within the U.S. and abroad, such as the U.S. government’s inability at times to agree on a long-term budget and deficit reduction plan, the threat of a federal government shutdown and threats not to increase the federal government’s debt limit, may affect investor and consumer
25
American Beacon ARK Transformational Innovation FundSM
Notes to Financial Statements
June 30, 2020
confidence and may adversely impact financial markets and the broader economy, perhaps suddenly and to a significant degree. The U.S. government has reduced the federal corporate income tax rates, and future legislative, regulatory and policy changes may result in more restrictions on international trade, less stringent prudential regulation of certain players in the financial markets, and significant new investments in infrastructure and national defense. Markets may react strongly to expectations about the changes in these policies, which could increase volatility, especially if the markets’ expectations for changes in government policies are not borne out.
Changes in market conditions will not have the same impact on all types of securities. Interest rates have been unusually low in recent years in the U.S. and abroad. Because there is little precedent for this situation, it is difficult to predict the impact of a significant rate increase on various markets. For example, because investors may buy securities or other investments with borrowed money, a significant increase in interest rates may cause a decline in the markets for those investments. Because of the sharp decline in the worldwide price of oil, there is a concern that oil producing nations may withdraw significant assets now held in U.S. Treasuries, which could force a substantial increase in interest rates. Regulators have expressed concern that rate increases may cause investors to sell fixed income securities faster than the market can absorb them, contributing to price volatility. In addition, there is a risk that the prices of goods and services in the U.S. and many foreign economies may decline over time, known as deflation (the opposite of inflation). Deflation may have an adverse effect on stock prices and creditworthiness and may make defaults on debt more likely. If a country’s economy slips into a deflationary pattern, it could last for a prolonged period and may be difficult to reverse.
The impact of the United Kingdom’s departure from the EU, which occurred on January 31, 2020, commonly known as Brexit, is not yet known. The effect on the United Kingdom’s economy will likely depend on the nature of trade relations with the EU and other major economies following its exit, which are matters to be negotiated. The outcomes may cause increased volatility and have a significant adverse impact on world financial markets, other international trade agreements, and the United Kingdom and European economies, as well as the broader global economy for some time, which could significantly adversely affect the value of a Fund’s investments in the United Kingdom and Europe.
Non-Diversification Risk
The Fund is non-diversified, which means the Fund may focus its investments in the securities of a comparatively small number of issuers. Investments in securities of a limited number of issuers exposes the Fund to greater market risk and potential losses than if assets were diversified among the securities of a greater number of issuers.
Other Investment Companies Risk
The Fund may invest in shares of other registered investment companies, including money market funds that are advised by the Manager. To the extent that the Fund invests in shares of other registered investment companies, the Fund will indirectly bear the fees and expenses, including for example advisory and administrative fees, charged by those investment companies in addition to the Fund’s direct fees and expenses and will be subject to the risks associated with investments in those companies. For example, the Fund’s investments in money market funds are subject to interest rate risk, credit risk, and market risk. The Fund must rely on the investment company in which it invests to achieve its investment objective. If the investment company fails to achieve its investment objective, the value of the Fund’s investment will decline, adversely affecting the Fund’s performance. To the extent the Fund invests in other investment companies that invest in equity securities, fixed-income securities and/or foreign securities, or track an index, the Fund is subject to the risks associated with the underlying investments held by the investment company or the index fluctuations to which the investment company is subject.
Sector Risk
Sector risk is the risk associated with a Fund holding a significant amount of investments in similar businesses, which would be similarly affected by particular economic or market events, which may, in certain
26
American Beacon ARK Transformational Innovation FundSM
Notes to Financial Statements
June 30, 2020
circumstances, cause the value of the equity and debt securities of companies in a particular sector of the market to change. To the extent a Fund has substantial holdings within a particular sector, the risks to a Fund associated with that sector increase.
Securities Lending Risk
A Fund may lend its portfolio securities to brokers, dealers and financial institutions to seek income. There is a risk that a borrower may default on its obligations to return loaned securities; however, a Fund’s securities lending agent indemnifies the Fund against that risk. There is a risk that the assets of a Fund’s securities lending agent may be insufficient to satisfy any contractual indemnification requirements to the Fund. Borrowers of a Fund’s securities typically provide collateral in the form of cash that is reinvested in securities. A Fund will be responsible for the risks associated with the investment of cash collateral, including any collateral invested in an affiliated money market fund. A Fund may lose money on its investment of cash collateral or may fail to earn sufficient income on its investment to meet obligations to the borrower. In addition, delays may occur in the recovery of securities from borrowers, which could interfere with a Fund’s ability to vote proxies or to settle transactions and there is the risk of possible loss of rights in the collateral should the borrower fail financially. In any case in which the loaned securities are not returned to the Fund before an ex-dividend date, the payment in lieu of the dividend that the Fund receives from the securities’ borrower would not be treated as a dividend for federal income tax purposes and thus would not qualify for treatment as “qualified dividend income”.
Valuation Risk
This is the risk that the Fund has valued a security at a price different from the price at which it can be sold. This risk may be especially pronounced for investments, such as derivatives, which may be illiquid or which may become illiquid and for securities that trade in relatively thin markets and/or markets that experience extreme volatility. If market conditions make it difficult to value certain investments, the Fund may value these investments using more subjective methods, such as fair-value methodologies. Investors who purchase or redeem Fund shares on days when the Fund is holding fair-valued securities may receive fewer or more shares, or lower or higher redemption proceeds, than they would have received if the Fund had not fair-valued the securities or had used a different valuation methodology. The value of foreign securities, certain fixed-income securities and currencies, as applicable, may be materially affected by events after the close of the markets on which they are traded, but before the Fund determines its NAV. The Fund’s ability to value its investments in an accurate and timely manner may be impacted by technological issues and/or errors by third-party service providers, such as pricing services or accounting agents.
Offsetting Assets and Liabilities
The Fund is a party to enforceable master netting agreements between brokers and counterparties which provide for the right to offset under certain circumstances. The Fund employs multiple money managers and counterparties and has elected not to offset qualifying financial and derivative instruments on the Statement of Assets and Liabilities, as such all financial and derivative instruments are presented on a gross basis. The impacts of netting arrangements that provide the right to offset are detailed below, if applicable. The net amount represents the net receivable or payable that would be due from or to the counterparty in the event of default. Exposure from borrowings and other financing agreements such as repurchase agreements can only be netted across transactions governed by the same Master Agreement with the same legal entity. All amounts reported below represent the balance as of the report date, June 30, 2020.
| Remaining Contractual Maturity of the Agreements As of June 30, 2020 | ||||||||||||||||||||||||||||||||||||
| Overnight and Continuous | <30 days | Between 30 & 90 days | >90 days | Total | ||||||||||||||||||||||||||||||||
Securities Lending Transactions | ||||||||||||||||||||||||||||||||||||
Common Stocks | $ | 12,077,937 | $ | - | $ | - | $ | - | $ | 12,077,937 | ||||||||||||||||||||||||||
|
|
|
|
|
|
|
|
|
| |||||||||||||||||||||||||||
Total Borrowings | $ | 12,077,937 | $ | - | $ | - | $ | - | $ | 12,077,937 | ||||||||||||||||||||||||||
|
|
|
|
|
|
|
|
|
| |||||||||||||||||||||||||||
Gross amount of recognized liabilities for securities lending transactions |
| $ | 12,077,937 | |||||||||||||||||||||||||||||||||
|
| |||||||||||||||||||||||||||||||||||
27
American Beacon ARK Transformational Innovation FundSM
Notes to Financial Statements
June 30, 2020
6. Federal Income and Excise Taxes
It is the policy of the Fund to qualify as a regulated investment company (“RIC”), by complying with all applicable provisions of Subchapter M of the Internal Revenue Code, as amended, and to make distributions of taxable income sufficient to relieve it from substantially all federal income and excise taxes. For federal income tax purposes, the Fund is treated as a single entity for the purpose of determining such qualification.
The Fund does not have any unrecorded tax liabilities in the accompanying financial statements. Each of the tax years in the four year period ended June 30, 2020 remain subject to examination by the Internal Revenue Service. If applicable, the Fund recognizes interest accrued related to unrecognized tax benefits in interest expense and penalties in “Other expenses” on the Statement of Operations.
The Fund may be subject to taxes imposed by countries in which it invests. Such taxes are generally based on returns of income earned or gains realized or repatriated. Taxes are accrued and applied to net investment income, net realized capital gains and net unrealized appreciation (depreciation), as applicable, as the income is earned or capital gains are recorded.
Dividends are categorized in accordance with income tax regulations which may treat certain transactions differently than U.S. GAAP. Accordingly, the character of distributions and composition of net assets for tax purposes may differ from those reflected in the accompanying financial statements.
The tax character of distributions paid were as follows:
| Year Ended June 30, 2020 | Year Ended June 30, 2019 | |||||||||||
Distributions paid from: | ||||||||||||
Ordinary Income* | ||||||||||||
R5 Class** | $ | 41,867 | $ | 50,634 | ||||||||
Y Class | 433,634 | 271,960 | ||||||||||
Investor Class | 99,548 | 171,596 | ||||||||||
A Class*** | 64,141 | - | ||||||||||
C Class*** | 26,402 | - | ||||||||||
Long-term capital gains | ||||||||||||
R5 Class** | 92,438 | 91,644 | ||||||||||
Y Class | 957,401 | 492,226 | ||||||||||
Investor Class | 219,788 | 310,576 | ||||||||||
A Class*** | 141,614 | - | ||||||||||
C Class*** | 67,955 | - | ||||||||||
|
|
|
| |||||||||
Total distributions paid | $ | 2,144,788 | $ | 1,388,636 | ||||||||
|
|
|
| |||||||||
* For tax purposes, short-term capital gains are considered ordinary income distributions.
** Formerly known as Institutional Class.
*** Class commenced operations on January 2, 2019.
As of June 30, 2020, the components of distributable earnings (deficits) on a tax basis were as follows:
Fund | Tax Cost | Unrealized Appreciation | Unrealized (Depreciation) | Net Unrealized Appreciation (Depreciation) | ||||||||||||||||||||||||
ARK Transformational Innovation | $ | 265,169,421 | $ | 84,540,610 | $ | (3,466,342 | ) | $ | 81,074,268 | |||||||||||||||||||
Fund | Net Unrealized Appreciation (Depreciation) | Undistributed Ordinary Income | Undistributed Long-Term Capital Gains | Accumulated Capital and Other (Losses) | Other Temporary Differences | Distributable Earnings | ||||||||||||||||||||||||||||||||||||||
| ARK Transformational Innovation | $ | 81,074,268 | $ | 2,722,387 | $ | 1,853,566 | $ | - | $ | - | $ | 85,650,221 | ||||||||||||||||||||||||||||||||
28
American Beacon ARK Transformational Innovation FundSM
Notes to Financial Statements
June 30, 2020
Financial reporting records are adjusted for permanent book/tax differences to reflect tax character. Financial records are not adjusted for temporary differences. The temporary differences between financial reporting and tax-basis reporting of unrealized appreciation (depreciation) are attributable primarily to the tax deferral of losses from wash sales and the realization for tax purposes of unrealized gains from passive foreign investment companies.
Due to inherent differences in the recognition of income, expenses, and realized gains (losses) under U.S. GAAP and federal income tax regulations, permanent differences between book and tax reporting have been identified and appropriately reclassified on the Statement of Assets and Liabilities.
As of June 30, 2020, the Fund did not have any permanent differences.
Under the Regulated Investment Company Modernization Act of 2010 (“RIC MOD”), net capital losses recognized by the Fund in taxable years beginning after December 22, 2010 are carried forward indefinitely and retain their character as short-term and/or long-term losses.
As of June 30, 2020, the Fund did not have any capital loss carryforwards.
7. Investment Transactions
The aggregate cost of purchases and proceeds from sales and maturities of investments, other than short-term obligations, for the year ended June 30, 2020 were as follows:
Fund | Purchases (non-U.S. Government Securities) | Sales (non-U.S. Government Securities) | ||||||||||
| ARK Transformational Innovation | $ | 214,837,603 | $ | 28,602,918 | ||||||||
A summary of the Fund’s transactions in the USG Select Fund for the year ended June 30, 2020 were as follows:
Fund | Type of Transaction | June 30, 2019 Shares/Fair Value | Purchases | Sales | June 30, 2020 Shares/Fair Value | |||||||||||||||||||||||||||||
| ARK Transformational Innovation | Direct | $ | 1,684,972 | $ | 132,270,600 | $ | 116,981,756 | $ | 16,973,816 | |||||||||||||||||||||||||
| ARK Transformational Innovation | Securities Lending | 4,858,315 | 117,756,725 | 110,537,103 | 12,077,937 | |||||||||||||||||||||||||||||
8. Securities Lending
The Fund may lend its securities to qualified financial institutions, such as certain broker-dealers, to earn additional income. The borrowers are required to secure their loans continuously with collateral in an amount at least equal to the fair value of the securities loaned, initially in an amount at least equal to 102% of the fair value of domestic securities loaned and 105% of the fair value of international securities loaned. Collateral is monitored and marked-to-market daily. Daily mark-to-market amounts are required to be paid to the borrower or received from the borrower by the end of the following business day. This one day settlement for mark-to-market amounts may result in the collateral being temporarily less than the value of the securities on loan or temporarily more than the required minimum collateral.
To the extent that a loan is collateralized by cash, such cash collateral shall be invested by the securities lending agent (the “Agent”) in money market mutual funds and other short-term investments, provided the investments meet certain quality and diversification requirements. Securities purchased with cash collateral proceeds are listed in the Fund’s Schedule of Investments and the collateral is shown on the Statement of Assets and Liabilities as a payable.
29
American Beacon ARK Transformational Innovation FundSM
Notes to Financial Statements
June 30, 2020
Securities lending income is generated from the demand premium (if any) paid by the borrower to borrow a specific security and from the return on investment of cash collateral, reduced by negotiated rebate fees paid to the borrower and transaction costs. To the extent that a loan is secured by non-cash collateral, securities lending income is generated as a demand premium reduced by transaction costs. The Fund, the Agent, and the Manager retained 80%, 10%, and 10%, respectively, of the income generated from securities lending.
While securities are on loan, the Fund continues to receive certain income associated with that security and any gain or loss in the market price that may occur during the term of the loan. In the case of domestic equities, the value of any dividend is received in the form of a substitute payment approximately equal to the dividend. In the case of foreign securities, a negotiated amount is received that is less than the actual dividend, but higher than the dividend amount minus the foreign tax that the Fund would be subject to on the dividend.
Securities lending transactions pose certain risks to the Fund, including that the borrower may not provide additional collateral when required or return the securities when due, that the value of the short-term investments will be less than the amount of cash collateral required to be returned to the borrower, that non-cash collateral may be subject to legal constraints in the event of a borrower bankruptcy, and that the cash collateral investments could become illiquid and unable to be used to return collateral to the borrower. The Fund could also experience delays and costs in gaining access to the collateral. The Fund bears the risk of any deficiency in the amount of the cash collateral available for return to the borrower and any action which impairs its ability to liquidate non-cash collateral to satisfy a borrower default.
As of June 30, 2020, the value of outstanding securities on loan and the value of collateral were as follows:
Fund | Market Value of Securities on Loan | Cash Collateral Received | Non-Cash Collateral Received | Total Collateral Received | ||||||||||||||||||||||||
| ARK Transformational Innovation | $ | 52,466,814 | $ | 12,077,937 | $ | 39,786,990 | $ | 51,864,927 | ||||||||||||||||||||
Cash collateral is listed on the Fund’s Schedule of Investments and is shown on the Statement of Assets and Liabilities. Income earned on these investments is included in “Income derived from securities lending” on the Statement of Operations.
Non-cash collateral received by the Fund may not be sold or re-pledged except to satisfy a borrower default. Therefore, non-cash collateral is not included on the Fund’s Schedule of Investments or Statement of Assets and Liabilities.
9. Borrowing Arrangements
Effective November 14, 2019 (the “Effective Date”), the Fund, along with certain other funds managed by the Manager (“Participating Funds”), entered into a committed revolving line of credit (the “Committed Line”) agreement with State Street Bank and Trust Company (the “Bank”) to be used to facilitate portfolio liquidity. The maximum borrowing amount under the Committed Line is $250 million with interest at a rate equal to the higher of (a) one-month London Inter-Bank Offered Rate (“LIBOR”) plus 1.25% per annum or (b) the Federal Funds rate plus 1.25% per annum on amounts borrowed. Each of the Participating Funds paid a closing fee of $100,000 on the Effective Date and a quarterly commitment fee at a rate of 0.25% per annum on the unused portion of the Committed Line amount. Effective August 6, 2020, the Committed Line was reduced from $250 million to $150 million. The Committed Line expires November 12, 2020, unless extended by the Bank or terminated by the Participating Funds in accordance with the agreement.
On the Effective Date, the Fund, along with certain other Participating Funds managed by the Manager, also entered into an uncommitted discretionary demand revolving line of credit (the “Uncommitted Line”) agreement with the Bank to be used to facilitate portfolio liquidity. The maximum borrowing amount under the Uncommitted Line is $50 million with interest at a rate equal to the higher of (a) one-month LIBOR plus 1.25% per annum or (b) the Federal Funds rate plus 1.25% per annum on each outstanding loan. Each of the Participating Funds paid a closing fee of $35,000 on the Effective Date. The Uncommitted Line expires November 12, 2020 unless extended by the Bank or terminated by the Participating Funds in accordance with the agreement.
30
American Beacon ARK Transformational Innovation FundSM
Notes to Financial Statements
June 30, 2020
The Participating Funds paid administration, legal and arrangement fees, which are recognized as a component of “Other expenses” on the Statement of Operations, along with commitment fees, that have been allocated among the Participating Funds based on average daily net assets.
During the year ended June 30, 2020, the Fund did not utilize this facility.
10. Capital Share Transactions
The tables below summarize the activity in capital shares for each Class of the Fund:
| R5 ClassA | ||||||||||||||||||||||||||||
| Year Ended June 30, 2020 | Year Ended June 30, 2019 | |||||||||||||||||||||||||||
ARK Transformational Innovation Fund | Shares | Amount | Shares | Amount | ||||||||||||||||||||||||
| Shares sold | 211,399 | $ | 4,119,685 | 40,549 | $ | 728,736 | ||||||||||||||||||||||
| Reinvestment of dividends | 7,013 | 134,305 | 9,765 | 142,277 | ||||||||||||||||||||||||
| Shares redeemed | (54,426 | ) | (1,119,434 | ) | (317,709 | ) | (6,128,970 | ) | ||||||||||||||||||||
|
|
|
|
|
|
|
| |||||||||||||||||||||
| Net increase (decrease) in shares outstanding | 163,986 | $ | 3,134,556 | (267,395 | ) | $ | (5,257,957 | ) | ||||||||||||||||||||
|
|
|
|
|
|
|
| |||||||||||||||||||||
| Y Class | ||||||||||||||||||||||||||||
| Year Ended June 30, 2020 | Year Ended June 30, 2019 | |||||||||||||||||||||||||||
ARK Transformational Innovation Fund | Shares | Amount | Shares | Amount | ||||||||||||||||||||||||
| Shares sold | 7,882,726 | $ | 165,768,592 | 1,580,266 | $ | 27,393,997 | ||||||||||||||||||||||
| Reinvestment of dividends | 72,789 | 1,389,552 | 52,436 | 762,415 | ||||||||||||||||||||||||
| Shares redeemed | (1,650,988 | ) | (33,215,198 | ) | (394,373 | ) | (6,778,738 | ) | ||||||||||||||||||||
|
|
|
|
|
|
|
| |||||||||||||||||||||
| Net increase in shares outstanding | 6,304,527 | $ | 133,942,946 | 1,238,329 | $ | 21,377,674 | ||||||||||||||||||||||
|
|
|
|
|
|
|
| |||||||||||||||||||||
| Investor Class | ||||||||||||||||||||||||||||
| Year Ended June 30, 2020 | Year Ended June 30, 2019 | |||||||||||||||||||||||||||
ARK Transformational Innovation Fund | Shares | Amount | Shares | Amount | ||||||||||||||||||||||||
| Shares sold | 2,976,316 | $ | 65,972,944 | 600,909 | $ | 10,765,757 | ||||||||||||||||||||||
| Reinvestment of dividends | 16,860 | 319,154 | 33,295 | 481,781 | ||||||||||||||||||||||||
| Shares redeemed | (932,039 | ) | (19,565,829 | ) | (501,964 | ) | (8,430,227 | ) | ||||||||||||||||||||
|
|
|
|
|
|
|
| |||||||||||||||||||||
| Net increase in shares outstanding | 2,061,137 | $ | 46,726,269 | 132,240 | $ | 2,817,311 | ||||||||||||||||||||||
|
|
|
|
|
|
|
| |||||||||||||||||||||
| A Class | ||||||||||||||||||||||||||||
| Year Ended June 30, 2020 | January 2, 2019B to June 30, 2019 | |||||||||||||||||||||||||||
ARK Transformational Innovation Fund | Shares | Amount | Shares | Amount | ||||||||||||||||||||||||
| Shares sold | 779,816 | $ | 16,042,273 | 205,747 | $ | 3,588,662 | ||||||||||||||||||||||
| Reinvestment of dividends | 10,864 | 205,755 | – | – | ||||||||||||||||||||||||
| Shares redeemed | (121,725 | ) | (2,378,018 | ) | (9,958 | ) | (178,778 | ) | ||||||||||||||||||||
|
|
|
|
|
|
|
| |||||||||||||||||||||
| Net increase in shares outstanding | 668,955 | $ | 13,870,010 | 195,789 | $ | 3,409,884 | ||||||||||||||||||||||
|
|
|
|
|
|
|
| |||||||||||||||||||||
| C Class | ||||||||||||||||||||||||||||
| Year Ended June 30, 2020 | January 2, 2019B to June 30, 2019 | |||||||||||||||||||||||||||
ARK Transformational Innovation Fund | Shares | Amount | Shares | Amount | ||||||||||||||||||||||||
| Shares sold | 507,395 | $ | 10,499,828 | 114,562 | $ | 1,944,686 | ||||||||||||||||||||||
| Reinvestment of dividends | 5,014 | 94,357 | – | – | ||||||||||||||||||||||||
| Shares redeemed | (47,542 | ) | (978,256 | ) | (17,036 | ) | (292,777 | ) | ||||||||||||||||||||
|
|
|
|
|
|
|
| |||||||||||||||||||||
| Net increase in shares outstanding | 464,867 | $ | 9,615,929 | 97,526 | $ | 1,651,909 | ||||||||||||||||||||||
|
|
|
|
|
|
|
| |||||||||||||||||||||
| A | Formerly known as Institutional Class. |
| B | Commencement of operations. |
11. Subsequent Events
Management has evaluated subsequent events for possible recognition or disclosure in the financial statements through the date the financial statements are issued. Management has determined that there are no material events that would require disclosure in the Fund’s financial statements through this date.
31
American Beacon ARK Transformational Innovation FundSM
Financial Highlights
(For a share outstanding throughout the period)
| R5 ClassA | ||||||||||||||||||||||||||||
| Year Ended June 30, 2020 | Year Ended June 30, 2019 | Year Ended June 30, 2018 | January 27, 2017B to June 30, 2017 | |||||||||||||||||||||||||
|
|
|
|
|
|
|
| |||||||||||||||||||||
Net asset value, beginning of period | $ | 18.59 | $ | 18.60 | $ | 12.87 | $ | 10.00 | ||||||||||||||||||||
|
|
|
|
|
|
|
| |||||||||||||||||||||
Income (loss) from investment operations: | ||||||||||||||||||||||||||||
Net investment income (loss) | (0.16 | )C D | (0.29 | ) | 0.06 | (0.03 | ) | |||||||||||||||||||||
Net gains on investments (both realized and unrealized) | 9.60 | 1.24 | 6.25 | 2.90 | ||||||||||||||||||||||||
|
|
|
|
|
|
|
| |||||||||||||||||||||
Total income from investment operations | 9.44 | 0.95 | 6.31 | 2.87 | ||||||||||||||||||||||||
|
|
|
|
|
|
|
| |||||||||||||||||||||
Less distributions: | ||||||||||||||||||||||||||||
Dividends from net investment income | (0.03 | ) | - | (0.09 | ) | - | ||||||||||||||||||||||
Distributions from net realized gains | (0.59 | ) | (0.96 | ) | (0.49 | ) | - | |||||||||||||||||||||
|
|
|
|
|
|
|
| |||||||||||||||||||||
Total distributions | (0.62 | ) | (0.96 | ) | (0.58 | ) | - | |||||||||||||||||||||
|
|
|
|
|
|
|
| |||||||||||||||||||||
Net asset value, end of period | $ | 27.41 | $ | 18.59 | $ | 18.60 | $ | 12.87 | ||||||||||||||||||||
|
|
|
|
|
|
|
| |||||||||||||||||||||
Total returnE | 52.22 | % | 6.55 | % | 49.76 | % | 28.70 | %F | ||||||||||||||||||||
|
|
|
|
|
|
|
| |||||||||||||||||||||
Ratios and supplemental data: |
| |||||||||||||||||||||||||||
Net assets, end of period | $ | 8,438,698 | $ | 2,674,638 | $ | 7,650,448 | $ | 3,603,636 | ||||||||||||||||||||
Ratios to average net assets: | ||||||||||||||||||||||||||||
Expenses, before reimbursements | 1.24 | % | 1.74 | % | 4.74 | % | 10.29 | %G | ||||||||||||||||||||
Expenses, net of reimbursementsH | 1.00 | % | 1.00 | % | 1.02 | % | 0.99 | %G | ||||||||||||||||||||
Net investment (loss), before expense reimbursements | (1.04 | )% | (1.42 | )% | (3.59 | )% | (10.01 | )%G | ||||||||||||||||||||
Net investment income (loss), net of reimbursements | (0.80 | )% | (0.68 | )% | 0.14 | % | (0.70 | )%G | ||||||||||||||||||||
Portfolio turnover rate | 28 | % | 63 | % | 59 | % | 28 | %I | ||||||||||||||||||||
| A | Prior to February 28, 2020, the R5 Class was known as Institutional Class. |
| B | Commencement of operations. |
| C | Per share amounts have been calculated using the average shares method. |
| D | Net investment income includes a significant dividend payment from Xilinx, Inc. amounting to $0.0021. |
| E | Based on net asset value, which does not reflect the sales charge, redemption fee, or contingent deferred sales charge, if applicable. May include adjustments in accordance with U.S. GAAP and as such, the net asset value for reporting purposes and the returns based upon those net asset values may differ from the net asset value and returns for shareholder transactions. |
| F | Not annualized. |
| G | Annualized. |
| H | Expense ratios may exceed stated expense caps in Note 2 due to security lending expenses. |
| I | Portfolio turnover rate is for the period from January 27, 2017 through June 30, 2017 and is not annualized. |
See accompanying notes
32
American Beacon ARK Transformational Innovation FundSM
Financial Highlights
(For a share outstanding throughout the period)
| Y Class | ||||||||||||||||||||||||||||
| Year Ended June 30, 2020 | Year Ended June 30, 2019 | Year Ended June 30, 2018 | January 27, 2017A to June 30, 2017 | |||||||||||||||||||||||||
|
|
|
|
|
|
|
| |||||||||||||||||||||
Net asset value, beginning of period | $ | 18.54 | $ | 18.57 | $ | 12.87 | $ | 10.00 | ||||||||||||||||||||
|
|
|
|
|
|
|
| |||||||||||||||||||||
Income (loss) from investment operations: | ||||||||||||||||||||||||||||
Net investment income (loss) | (0.19 | )B C | (0.06 | ) | (0.02 | )B | (0.03 | ) | ||||||||||||||||||||
Net gains on investments (both realized and unrealized) | 9.58 | 0.99 | 6.30 | 2.90 | ||||||||||||||||||||||||
|
|
|
|
|
|
|
| |||||||||||||||||||||
Total income from investment operations | 9.39 | 0.93 | 6.28 | 2.87 | ||||||||||||||||||||||||
|
|
|
|
|
|
|
| |||||||||||||||||||||
Less distributions: | ||||||||||||||||||||||||||||
Dividends from net investment income | (0.03 | ) | - | (0.09 | ) | - | ||||||||||||||||||||||
Distributions from net realized gains | (0.59 | ) | (0.96 | ) | (0.49 | ) | - | |||||||||||||||||||||
|
|
|
|
|
|
|
| |||||||||||||||||||||
Total distributions | (0.62 | ) | (0.96 | ) | (0.58 | ) | - | |||||||||||||||||||||
|
|
|
|
|
|
|
| |||||||||||||||||||||
Net asset value, end of period | $ | 27.31 | $ | 18.54 | $ | 18.57 | $ | 12.87 | ||||||||||||||||||||
|
|
|
|
|
|
|
| |||||||||||||||||||||
Total returnD | 52.09 | % | 6.45 | % | 49.52 | % | 28.70 | %E | ||||||||||||||||||||
|
|
|
|
|
|
|
| |||||||||||||||||||||
Ratios and supplemental data: |
| |||||||||||||||||||||||||||
Net assets, end of period | $ | 220,504,263 | $ | 32,822,832 | $ | 9,887,450 | $ | 153,410 | ||||||||||||||||||||
Ratios to average net assets: | ||||||||||||||||||||||||||||
Expenses, before reimbursements | 1.26 | % | 1.94 | % | 4.84 | % | 14.30 | %F | ||||||||||||||||||||
Expenses, net of reimbursementsG | 1.10 | % | 1.10 | % | 1.12 | % | 1.09 | %F | ||||||||||||||||||||
Net investment (loss), before expense reimbursements | (1.08 | )% | (1.62 | )% | (3.85 | )% | (14.01 | )%F | ||||||||||||||||||||
Net investment (loss), net of reimbursements | (0.92 | )% | (0.78 | )% | (0.13 | )% | (0.81 | )%F | ||||||||||||||||||||
Portfolio turnover rate | 28 | % | 63 | % | 59 | % | 28 | %H | ||||||||||||||||||||
| A | Commencement of operations. |
| B | Per share amounts have been calculated using the average shares method. |
| C | Net investment income includes a significant dividend payment from Xilinx, Inc. amounting to $0.0042. |
| D | Based on net asset value, which does not reflect the sales charge, redemption fee, or contingent deferred sales charge, if applicable. May include adjustments in accordance with U.S. GAAP and as such, the net asset value for reporting purposes and the returns based upon those net asset values may differ from the net asset value and returns for shareholder transactions. |
| E | Not annualized. |
| F | Annualized. |
| G | Expense ratios may exceed stated expense caps in Note 2 due to security lending expenses. |
| H | Portfolio turnover rate is for the period from January 27, 2017 through June 30, 2017 and is not annualized. |
See accompanying notes
33
American Beacon ARK Transformational Innovation FundSM
Financial Highlights
(For a share outstanding throughout the period)
| Investor Class | ||||||||||||||||||||||||||||
| Year Ended June 30, 2020 | Year Ended June 30, 2019 | Year Ended June 30, 2018 | January 27, 2017A to June 30, 2017 | |||||||||||||||||||||||||
|
|
|
|
|
|
|
| |||||||||||||||||||||
Net asset value, beginning of period | $ | 18.42 | $ | 18.51 | $ | 12.85 | $ | 10.00 | ||||||||||||||||||||
|
|
|
|
|
|
|
| |||||||||||||||||||||
Income (loss) from investment operations: | ||||||||||||||||||||||||||||
Net investment income (loss) | (0.25 | )B C | (0.17 | ) | (0.06 | )B | (0.02 | ) | ||||||||||||||||||||
Net gains on investments (both realized and unrealized) | 9.50 | 1.04 | 6.30 | 2.87 | ||||||||||||||||||||||||
|
|
|
|
|
|
|
| |||||||||||||||||||||
Total income from investment operations | 9.25 | 0.87 | 6.24 | 2.85 | ||||||||||||||||||||||||
|
|
|
|
|
|
|
| |||||||||||||||||||||
Less distributions: | ||||||||||||||||||||||||||||
Dividends from net investment income | (0.03 | ) | - | (0.09 | ) | - | ||||||||||||||||||||||
Distributions from net realized gains | (0.59 | ) | (0.96 | ) | (0.49 | ) | - | |||||||||||||||||||||
|
|
|
|
|
|
|
| |||||||||||||||||||||
Total distributions | (0.62 | ) | (0.96 | ) | (0.58 | ) | - | |||||||||||||||||||||
|
|
|
|
|
|
|
| |||||||||||||||||||||
Net asset value, end of period | $ | 27.05 | $ | 18.42 | $ | 18.51 | $ | 12.85 | ||||||||||||||||||||
|
|
|
|
|
|
|
| |||||||||||||||||||||
Total returnD | 51.66 | % | 6.13 | % | 49.28 | % | 28.50 | %E | ||||||||||||||||||||
|
|
|
|
|
|
|
| |||||||||||||||||||||
Ratios and supplemental data: |
| |||||||||||||||||||||||||||
Net assets, end of period | $ | 69,421,549 | $ | 9,310,932 | $ | 6,910,383 | $ | 1,083,835 | ||||||||||||||||||||
Ratios to average net assets: | ||||||||||||||||||||||||||||
Expenses, before reimbursements | 1.52 | % | 2.03 | % | 4.96 | % | 12.53 | %F | ||||||||||||||||||||
Expenses, net of reimbursementsG | 1.38 | % | 1.38 | % | 1.40 | % | 1.37 | %F | ||||||||||||||||||||
Net investment (loss), before expense reimbursements | (1.34 | )% | (1.71 | )% | (3.92 | )% | (12.37 | )%F | ||||||||||||||||||||
Net investment (loss), net of reimbursements | (1.19 | )% | (1.06 | )% | (0.36 | )% | (1.21 | )%F | ||||||||||||||||||||
Portfolio turnover rate | 28 | % | 63 | % | 59 | % | 28 | %H | ||||||||||||||||||||
| A | Commencement of operations. |
| B | Per share amounts have been calculated using the average shares method. |
| C | Net investment income includes a significant dividend payment from Xilinx, Inc. amounting to $0.0063. |
| D | Based on net asset value, which does not reflect the sales charge, redemption fee, or contingent deferred sales charge, if applicable. May include adjustments in accordance with U.S. GAAP and as such, the net asset value for reporting purposes and the returns based upon those net asset values may differ from the net asset value and returns for shareholder transactions. |
| E | Not annualized. |
| F | Annualized. |
| G | Expense ratios may exceed stated expense caps in Note 2 due to security lending expenses. |
| H | Portfolio turnover rate is for the period from January 27, 2017 through June 30, 2017 and is not annualized. |
See accompanying notes
34
American Beacon ARK Transformational Innovation FundSM
Financial Highlights
(For a share outstanding throughout the period)
| A Class | ||||||||||||
| Year Ended June 30, 2020 | January 2, 2019A to June 30, 2019 | |||||||||||
|
|
|
| |||||||||
Net asset value, beginning of period | $ | 18.42 | $ | 14.72 | ||||||||
|
|
|
| |||||||||
Income (loss) from investment operations: | ||||||||||||
Net investment (loss) | (0.06 | )B | (0.05 | ) | ||||||||
Net gains on investments (both realized and unrealized) | 9.31 | 3.75 | ||||||||||
|
|
|
| |||||||||
Total income from investment operations | 9.25 | 3.70 | ||||||||||
|
|
|
| |||||||||
Less distributions: | ||||||||||||
Dividends from net investment income | (0.03 | ) | - | |||||||||
Distributions from net realized gains | (0.59 | ) | - | |||||||||
|
|
|
| |||||||||
Total distributions | (0.62 | ) | - | |||||||||
|
|
|
| |||||||||
Net asset value, end of period | $ | 27.05 | $ | 18.42 | ||||||||
|
|
|
| |||||||||
Total returnC | 51.66 | % | 25.14 | %D | ||||||||
|
|
|
| |||||||||
Ratios and supplemental data: |
| |||||||||||
Net assets, end of period | $ | 23,391,480 | $ | 3,606,814 | ||||||||
Ratios to average net assets: | ||||||||||||
Expenses, before reimbursements | 1.66 | % | 2.31 | %E | ||||||||
Expenses, net of reimbursementsF | 1.40 | % | 1.40 | %E | ||||||||
Net investment (loss), before expense reimbursements | (1.47 | )% | (2.00 | )%E | ||||||||
Net investment (loss), net of reimbursements | (1.21 | )% | (1.09 | )%E | ||||||||
Portfolio turnover rate | 28 | % | 63 | % | ||||||||
| A | Commencement of operations. |
| B | Net investment income includes a significant dividend payment from Xilinx, Inc. amounting to $(0.0608). |
| C | Based on net asset value, which does not reflect the sales charge, redemption fee, or contingent deferred sales charge, if applicable. May include adjustments in accordance with U.S. GAAP and as such, the net asset value for reporting purposes and the returns based upon those net asset values may differ from the net asset value and returns for shareholder transactions. |
| D | Not annualized. |
| E | Annualized. |
| F | Expense ratios may exceed stated expense caps in Note 2 due to security lending expenses. |
See accompanying notes
35
American Beacon ARK Transformational Innovation FundSM
Financial Highlights
(For a share outstanding throughout the period)
| C Class | ||||||||||||
| Year Ended June 30, 2020 | January 2, 2019A to June 30, 2019 | |||||||||||
|
|
|
| |||||||||
Net asset value, beginning of period | $ | 18.35 | $ | 14.72 | ||||||||
|
|
|
| |||||||||
Income (loss) from investment operations: | ||||||||||||
Net investment income (loss) | (0.09 | )B | (0.10 | ) | ||||||||
Net gains on investments (both realized and unrealized) | 9.11 | 3.73 | ||||||||||
|
|
|
| |||||||||
Total income from investment operations | 9.02 | 3.63 | ||||||||||
|
|
|
| |||||||||
Less distributions: | ||||||||||||
Distributions from net realized gains | (0.59 | ) | - | |||||||||
|
|
|
| |||||||||
Total distributions | (0.59 | ) | - | |||||||||
|
|
|
| |||||||||
Net asset value, end of period | $ | 26.78 | $ | 18.35 | ||||||||
|
|
|
| |||||||||
Total returnC | 50.54 | % | 24.66 | %D | ||||||||
|
|
|
| |||||||||
Ratios and supplemental data: |
| |||||||||||
Net assets, end of period | $ | 15,060,539 | $ | 1,790,079 | ||||||||
Ratios to average net assets: | ||||||||||||
Expenses, before reimbursements | 2.31 | % | 3.25 | %E | ||||||||
Expenses, net of reimbursementsF | 2.15 | % | 2.15 | %E | ||||||||
Net investment (loss), before expense reimbursements | (2.13 | )% | (2.94 | )%E | ||||||||
Net investment (loss), net of reimbursements | (1.97 | )% | (1.83 | )%E | ||||||||
Portfolio turnover rate | 28 | % | 63 | % | ||||||||
| A | Commencement of operations. |
| B | Net investment income includes a significant dividend payment from Xilinx, Inc. amounting to $(0.0873). |
| C | Based on net asset value, which does not reflect the sales charge, redemption fee, or contingent deferred sales charge, if applicable. May include adjustments in accordance with U.S. GAAP and as such, the net asset value for reporting purposes and the returns based upon those net asset values may differ from the net asset value and returns for shareholder transactions. |
| D | Not annualized. |
| E | Annualized. |
| F | Expense ratios may exceed stated expense caps in Note 2 due to security lending expenses. |
See accompanying notes
36
American Beacon ARK Transformational Innovation FundSM
June 30, 2020 (Unaudited)
Certain tax information regarding the Funds are required to be provided to shareholders based upon the Fund’s income and distributions for the taxable year ended June 30, 2020. The information and distributions reported herein may differ from information and distributions taxable to the shareholders for the calendar year ended December 31, 2019.
The Fund designated the following items with regard to distributions paid during the fiscal year ended June 30, 2020. All designations are based on financial information available as of this annual report and, accordingly, are subject to change. For each item, it is the intention of the Funds to designate the maximum amount permitted under the Internal Revenue Code of 1986, as amended, and the regulations there under.
Corporate Dividends-Received Deduction:
ARK Transformational Innovation | 4.21 | % |
Qualified Dividend Income:
ARK Transformational Innovation | 5.34 | % |
Long-Term Capital Gain Distributions:
ARK Transformational Innovation | $ | 1,479,196 |
Short-Term Capital Gain Distributions:
ARK Transformational Innovation | $ | 574,704 |
Shareholders will receive notification in January 2021 of the applicable tax information necessary to prepare their 2020 income tax returns.
37
Disclosure Regarding Approval of the Management and Investment Advisory Agreements (Unaudited)
At meetings held on May 14, 2020 and June 3-4, 2020 (collectively, the “Meetings”), via videoconference, the Board of Trustees (“Board” or “Trustees”) considered and then, at its June 4, 2020 meeting, approved the renewal of:
(1) the Management Agreement between American Beacon Advisors, Inc. (“Manager”) and the American Beacon Funds (“Trust”), on behalf of the American Beacon ARK Transformational Innovation Fund (“Fund”); and
(2) the Investment Advisory Agreement among the Manager, ARK Investment Management LLC (the “subadvisor”), and the Trust, on behalf of the Fund.
The Management Agreement and the Investment Advisory Agreement are referred to herein individually as an “Agreement” and collectively as the “Agreements.” In preparation for its consideration of the renewal of the Agreements, the Board undertook steps to gather and consider information furnished by the Manager, the subadvisor, Broadridge, Inc. (“Broadridge”) and Morningstar, Inc. (“Morningstar”). The Board, with the assistance of independent legal counsel, requested and received certain relevant information from the Manager and the subadvisor.
In advance of the Meetings, the Board’s Investment Committee and/or the Manager coordinated the production of information from Broadridge and Morningstar regarding the performance, fees and expenses of the Fund as well as information from the Manager and the subadvisor. At the Meetings, the Board considered the information provided in connection with the renewal process, as well as information furnished to the Board throughout the year at regular meetings of the Board and its committees. In connection with the Board’s consideration of the Agreements, the Board received and evaluated such information as they deemed necessary. This information is described below in the section summarizing the factors the Board considered in connection with its renewal and approval of the Agreements, as well as the section describing additional Board considerations with respect to the Fund.
The Board noted that the Manager provides management and administrative services to the Fund pursuant to the Management Agreement. The Board considered that many mutual funds have separate contracts governing each type of service and observed that, with respect to such mutual funds, the actual management fee rates provided by Broadridge for peer group funds reflect the combined advisory and administrative expenses, reduced by any fee waivers and/or reimbursements.
A firm may not have been able to, or opted not to, provide information in response to certain information requests, in which case the Board conducted its evaluation of the firm based on information that was provided. In such cases, the Board determined that the omission of any such information was not material to its considerations. The class of shares used for comparative performance purposes was the share class with the lowest expenses available for purchase by the general public, which was the R5 Class. The Board also considered that the use of R5 Class performance generally facilitates a meaningful comparison for expense and performance purposes.
Provided below is an overview of certain factors the Board considered in connection with its decision to approve the renewal of the Agreements. The Board did not identify any particular information that was most relevant to its consideration of whether to approve the renewal of each Agreement, and each Trustee may have afforded different weight to the various factors. Legal counsel to the independent Trustees provided the Board with a memorandum regarding its responsibilities pertaining to the renewal of investment advisory contracts, such as the Agreements, and related regulatory guidelines. Based on its evaluation, the Board unanimously concluded that the terms of each Agreement were reasonable and fair and that the approval of the renewal of each Agreement was in the best interests of the Fund and its shareholders.
38
Disclosure Regarding Approval of the Management and Investment Advisory Agreements (Unaudited)
Considerations With Respect to the Renewal of the Management Agreement and the Investment Advisory Agreement
In determining whether to approve the renewal of the Agreements, the Board considered the Fund’s investment management and subadvisory relationships separately. In each instance, the Board considered, among other things, the following factors: (1) the nature, extent and quality of the services provided; (2) the investment performance of the Fund and the subadvisor for the Fund; (3) the costs incurred by the Manager and the subadvisor in rendering services to the Fund and their resulting profits or losses; (4) comparisons of services and fee rates with contracts entered into by the Manager or the subadvisor or their affiliates with other clients (such as pension funds and other institutional clients); (5) the extent to which economies of scale, if any, have been taken into account in setting each fee rate schedule; (6) whether fee rate levels reflect economies of scale, if any, for the benefit of Fund investors; and (7) any other benefits derived or anticipated to be derived by the Manager or the subadvisor from their relationships with the Fund.
Nature, Extent and Quality of Services. With respect to the renewal of the Management Agreement, the Board considered, among other factors: the Fund’s performance since its inception on January 27, 2017; the length of service of key investment personnel at the Manager; the cost structure of the Fund; the Manager’s culture of compliance and support that reduce risks to the Fund; the Manager’s quality of services; the Manager’s active role in monitoring and, as appropriate, recommending additional or replacement subadvisors; and the Manager’s efforts to retain key employees and maintain staffing levels.
With respect to the renewal of the Investment Advisory Agreement, the Board considered, among other factors: the level of staffing and the size of the subadvisor; the adequacy of the resources committed to the Funds by the subadvisor; the financial stability of the subadvisor; and the subadvisor’s representations regarding its compliance program. Based on the foregoing information, the Board concluded that the nature, extent and quality of the management and advisory services provided by the Manager and the subadvisor were appropriate for the Fund.
Investment Performance. The Board evaluated the comparative information provided by Broadridge and the Manager regarding the performance of the Fund relative to its Broadridge performance universe, Morningstar Category, and/or benchmark index, as well as the Fund’s Morningstar rating. The Board considered the information provided by Broadridge regarding its independent methodology for selecting the Fund’s Broadridge performance universe. The Board also considered that the performance universes selected by Broadridge may not provide appropriate comparisons for the Fund. In addition, the Board considered the performance reports and discussions with management at Board and Committee meetings throughout the year. The Board also evaluated the comparative information provided by the subadvisor regarding the performance of the Fund relative to the Fund’s benchmark index and a composite of other comparable investment accounts managed by the subadvisor. In addition, the Board considered the Manager’s recommendation to continue to retain the subadvisor. A summary of the Board’s considerations with respect to the Fund’s performance appears below under “Additional Considerations and Conclusions with Respect to the Fund.”
Costs of the Services Provided to the Fund and the Profits Realized by the Manager from its Relationship with the Fund. In analyzing the cost of services and profitability of the Manager, the Board considered the revenues earned and the expenses incurred by the Manager, before and after the payment of distribution-related expenses by the Manager. The profits or losses were noted at both an aggregate level for all funds within the group of mutual funds sponsored by the Manager (the “Fund Complex”) and at an individual Fund level, with the Manager sustaining a loss before and after the payment of distribution-related expenses by the Manager for the Fund. The Board also considered comparative information provided by the Manager regarding the Manager’s overall profitability with respect to the Fund Complex relative to the overall profitability of other firms in the mutual fund industry, as disclosed in publicly available sources. Although the Board noted that, in certain cases, the fee rates paid by other clients of the Manager are lower than the fee rates paid by the Fund, the Manager represented that, among other matters, the difference is attributable to the fact that the Manager does not perform administrative services for non-investment company clients and reflects the greater level of responsibility and regulatory requirements associated with managing the Fund.
39
Disclosure Regarding Approval of the Management and Investment Advisory Agreements (Unaudited)
The Board also noted that the Manager proposed to continue the expense waivers and reimbursements for the Fund that were in place during the last fiscal year. The Board further considered that, with respect to the Fund, the Management Agreement provides for the Manager to receive a management fee comprised of an annualized fee that is retained by the Manager. In addition, the Board considered that the Manager receives fees for overseeing the securities lending program on behalf of the Fund. The Board also noted that certain share classes of the Fund maintain higher expense ratios in order to compensate third-party financial intermediaries.
In analyzing the fee rates charged by the subadvisor in connection with its investment advisory services to the Fund, the Board considered representations made by the subadvisor that the Fund’s subadvisory fee rate schedule generally was favorable compared to other comparable client accounts. The Board also considered the cost of services and profitability of the subadvisor.
Based on the foregoing information, the Board concluded that the profitability levels of the Manager were reasonable in light of the services performed by the Manager and the profitability levels of the subadvisor were reasonable in light of the services performed by the subadvisor. A discussion regarding the Board’s considerations with respect to the Fund’s fee rates is set forth below under “Additional Considerations and Conclusions with Respect to the Fund.”
Economies of Scale. In considering the reasonableness of the management and investment advisory fees rates, the Board considered whether economies of scale will be realized as the Fund grows and whether fee rate levels reflect these economies of scale for the benefit of Fund shareholders. In this regard, the Board considered that the Manager has negotiated breakpoints for the subadvisory fee rate for the Fund. The Board considered that the Fund’s current assets did not exceed the threshold necessary to reach the first subadvisory fee rate breakpoint.
In addition, the Board noted the Manager’s representation that the Management Agreement contains fee schedule breakpoints at higher asset levels with respect to the Fund. In this regard, the Board considered the Manager’s representation that the Fund’s current assets did not exceed the threshold necessary to reach the first management fee breakpoint. Based on the foregoing information, the Board concluded that the Manager and subadvisor fee rate schedules for the Fund provide for a reasonable sharing of benefits from any economies of scale with the Fund.
Benefits Derived from the Relationship with the Fund. The Board considered the “fall-out” or ancillary benefits that accrue to the Manager and/or the subadvisor as a result of the advisory relationships with the Fund, including greater exposure in the marketplace with respect to the Manager’s or the subadvisor’s investment process and expanding the level of assets under management by the Manager and the subadvisor. The Board also considered that the Manager may invest the Fund’s cash balances and cash collateral provided by the borrowers of the Fund’s securities in the American Beacon U.S. Government Money Market Select Fund, which the Manager manages directly. In addition, the Board noted that the subadvisor benefits from soft dollar arrangements for proprietary and/or third-party research. Based on the foregoing information, the Board concluded that the potential benefits accruing to the Manager and the subadvisor by virtue of their relationships with the Fund appear to be fair and reasonable.
Additional Considerations and Conclusions with Respect to the Fund
The performance comparisons below were made for the Fund’s R5 Class shares in comparison to the Fund’s Broadridge performance universe and Morningstar Category. With respect to the Broadridge performance universe, the 1st Quintile represents the top 20 percent of the universe based on performance and the 5th Quintile represents the bottom 20 percent of the universe based on performance. References below to the Fund’s Broadridge performance universe are to the universe of mutual funds with a comparable investment classification/objective included in the analysis provided by Broadridge.
40
Disclosure Regarding Approval of the Management and Investment Advisory Agreements (Unaudited)
The expense comparisons below were made for the Fund’s R5 Class shares in comparison to the Fund’s Broadridge expense universe and Broadridge expense group, with the 1st Quintile representing the lowest 20 percent of the universe or group based on lowest total expense and the 5th Quintile representing the highest 20 percent of the universe or group based on highest total expense. References below to the Fund’s expense group and expense universe are to the respective group or universe of comparable mutual funds included in the analysis by Broadridge. A Broadridge expense group consists of the Fund and a representative sample of funds with similar operating structures and asset sizes, as selected by Broadridge. A Broadridge expense universe includes all funds with a comparable investment classification/objective and a similar operating structure as the share class of the Fund included in the Broadridge comparative information, including the expense group, and provides a broader view of expenses across the Fund’s investment classification/objective. The Board also considered the Fund’s Morningstar fee level category with the 1st Quintile representing the lowest 20 percent of the category constituents and the 5th Quintile representing the highest 20 percent of the category in terms of total expense. In reviewing expenses, the Board considered the positive impact of the fee waiver and the Manager’s agreement to continue the fee waiver. In addition, information regarding the subadvisor’s use of soft dollars was requested from the Manager and was considered by the Board.
In considering the renewal of the Agreements for the Fund, the Board considered the following additional factors:
Broadridge Total Expense Analysis Excluding 12b-1 Fees and Morningstar Fee Level Ranking
Compared to Broadridge Expense Group | 3 | rd Quintile | ||
Compared to Broadridge Expense Universe | 4 | th Quintile | ||
Morningstar Fee Level Ranking | 4 | th Quintile |
Broadridge and Morningstar Performance Analysis (one-year period ended December 31, 2019)
Compared to Broadridge Performance Universe | 4 | th Quintile | ||
Compared to Morningstar Category | 4 | th Quintile |
The Board also considered: (1) information provided by the subadvisor regarding the fee rate charged for managing an account in the same or a similar strategy as the subadvisor manages the Fund; (2) that the subadvisor is an affiliate of the Manager; (3) the subadvisor’s representation that it had earned a profit with respect to the services that it provided to the Fund; and (4) the Manager’s recommendation to continue to retain the subadvisor based upon, among other factors, the relatively brief period that this Fund has been in operation.
Based on these and other considerations, the Board: (1) concluded that the fees paid to the Manager and the subadvisor under the Management and Investment Advisory Agreements are fair and reasonable; and (2) determined that the Fund and its shareholders would benefit from the Manager’s and subadvisor’s continued management of the Fund.
41
Disclosure Regarding Liquidity Risk Management Program (Unaudited)
Rule 22e-4 under the Investment Company Act of 1940, as amended (“Rule 22e-4”), requires open-end registered investment companies (other than money market funds) to adopt and implement a written liquidity risk management program that is reasonably designed to assess and manage liquidity risk. The Fund has adopted a Liquidity Risk Management Program (the “Program”) that is designed to assess and manage liquidity risk, which is the risk that the Fund could not meet requests to redeem its shares without significant dilution of the remaining shareholders’ interests in the Fund. The Program was effective on December 1, 2018 and was approved by the Fund’s Board of Trustees (the “Board”) on March 6, 2019, in accordance with applicable Securities and Exchange Commission (“SEC”) guidance.
Pursuant to Rule 22e-4, the Program includes the following elements:
| • | Assessment, management, and periodic review of liquidity risk; |
| • | Classification of each of the Fund’s portfolio investments into one of four liquidity categories: highly liquid, moderately liquid, less liquid, and illiquid; |
| • | Determination and review of a highly liquid investment minimum for any Fund that does not primarily hold assets that are highly liquid investments; |
| • | Policies and procedures to respond to a shortfall in the highly liquid investment minimum, including associated reports to the Board and the SEC; |
| • | A prohibition against a Fund acquiring an illiquid investment if immediately after the acquisition the Fund would have more than 15% of its net assets invested in illiquid investments that are assets; |
| • | Reporting of breaches of the illiquid investment prohibition to the Board and the SEC; and |
| • | Policies and procedures regarding how and when a Fund will satisfy redemption requests by distributing portfolio securities or other assets. |
The Board has approved the designation of the Manager’s Liquidity Committee as the Program administrator with responsibility for administering the Program. Since the implementation of the Program, the Liquidity Committee has provided written reports to the Board on a quarterly basis regarding the Fund’s liquidity risk. In addition, at the Board’s March 3-4, 2020 meetings, the Board reviewed the Liquidity Committee’s written report (“Report”) that addressed the operation of the Program and assessed the adequacy and effectiveness of its implementation from the Program’s inception on December 1, 2018 through December 31, 2019 (the “review period”).
Key conclusions that the Liquidity Committee included in the Report are listed below:
| • | The Program is reasonably designed to assess and manage the Fund’s liquidity risk. |
| • | The operation of the Program was adequate during the review period. |
| • | The Fund included in this shareholder report was deemed to primarily hold assets that are highly liquid, and no highly liquid investment minimum was recommended. |
| • | The Program was effectively implemented by the Liquidity Committee during the review period. |
| • | Administration of the Program by the Liquidity Committee continues to be appropriate. |
42
Trustees and Officers of the American Beacon FundsSM (Unaudited)
The Trustees and officers of the American Beacon Funds (the “Trust”) are listed below, together with their principal occupations during the past five years. The address of each person listed below is 220 Las Colinas Boulevard East, Suite 1200, Irving, Texas 75039. Each Trustee oversees twenty-seven funds in the fund complex that includes the Trust, the American Beacon Select Funds, the American Beacon Institutional Funds Trust, the American Beacon Sound Point Enhanced Income Fund, and the American Beacon Apollo Total Return Fund. The Trust’s Statement of Additional Information contains additional information about the Trustees and is available without charge by calling 1-800-658-5811.
Name, Age | Position, Term of Office and Length of Time Served with the Trust | Principal Occupation(s) During Past 5 Years and Current Directorships | ||
| NON-INTERESTED TRUSTEES | Term | |||
Lifetime of Trust until retirement* | ||||
| Gilbert G. Alvarado (50) | Trustee since 2015 | President, SJVIIF, LLC, Impact Investment Fund (2018-Present); Director, Kura MD, Inc. (local telehealth organization) (2015-2017); Senior Vice President & CFO, Sierra Health Foundation (health conversion private foundation) (2006-Present); Senior Vice President & CFO, Sierra Health Foundation: Center for Health Program Management (California public benefit corporation) (2012-Present); Director, Innovative North State (2012-2015); Director, Sacramento Regional Technology Alliance (2011-2016); Director, Valley Healthcare Staffing (2017–2018); Trustee, American Beacon Select Funds (2015-Present); Trustee, American Beacon Institutional Funds Trust (2017-Present); Trustee, American Beacon Sound Point Enhanced Income Fund (2018–Present); Trustee, American Beacon Apollo Total Return Fund (2018–Present). | ||
| Joseph B. Armes (58) | Trustee since 2015 | Director, Switchback Energy Acquisition (2019-Present); Chairman & CEO, CSW Industrials f/k/a Capital Southwest Corporation (investment company) (2015-Present); Chairman of the Board of Capital Southwest Corporation, predecessor to CSW Industrials, Inc. (2014-2017) (investment company); CEO, Capital Southwest Corporation (2013-2015); President & CEO, JBA Investment Partners (family investment vehicle) (2010-Present); Director and Chair of Audit Committee, RSP Permian (oil and gas producer) (2013-2018); Trustee, American Beacon Select Funds (2015-Present); Trustee, American Beacon Institutional Funds Trust (2017-Present); Trustee, American Beacon Sound Point Enhanced Income Fund (2018–Present); Trustee, American Beacon Apollo Total Return Fund (2018–Present). | ||
| Gerard J. Arpey (61) | Trustee since 2012 | Director, The Home Depot, Inc. (2015-Present); Partner, Emerald Creek Group (private equity firm) (2011-Present); Director, S.C. Johnson & Son, Inc. (privately held company) (2008-present); Trustee, American Beacon Select Funds (2012-Present); Trustee, American Beacon Institutional Funds Trust (2017-Present); Trustee, American Beacon Sound Point Enhanced Income Fund (2018–Present); Trustee, American Beacon Apollo Total Return Fund (2018–Present). | ||
| Brenda A. Cline (59) | Trustee since 2004 Chair since 2019 Vice Chair 2018 | Chief Financial Officer, Treasurer and Secretary, Kimbell Art Foundation (1993-Present); Director, Tyler Technologies, Inc. (public sector software solutions company) (2014-Present); Director, Range Resources Corporation (oil and natural gas company) (2015-Present); Trustee, Cushing Closed-End and Open-End Funds (2017-Present); Trustee, American Beacon Select Funds (2004-Present); Trustee, American Beacon Institutional Funds Trust (2017-Present); Trustee, American Beacon Sound Point Enhanced Income Fund (2018–Present); Trustee, American Beacon Apollo Total Return Fund (2018–Present). | ||
43
Trustees and Officers of the American Beacon FundsSM (Unaudited)
Name, Age | Position, Term of Office and Length of Time Served with the Trust | Principal Occupation(s) During Past 5 Years and Current Directorships | ||
| NON-INTERESTED TRUSTEES (CONT.) | Term | |||
Lifetime of Trust until retirement* | ||||
| Eugene J. Duffy (65) | Trustee since 2008 | Managing Director, Global Investment Management Distribution, Mesirow Financial (2016-Present); Managing Director, Institutional Services, Intercontinental Real Estate Corporation (2014-Present); Trustee, American Beacon Select Funds (2008-Present); Trustee, American Beacon Institutional Funds Trust (2017-Present); Trustee, American Beacon Sound Point Enhanced Income Fund (2018–Present); Trustee, American Beacon Apollo Total Return Fund (2018–Present). | ||
| Claudia A. Holz (62) | Trustee since 2018 | Partner, KPMG LLP (1990 – 2017); Trustee, American Beacon Select Funds (2018-Present); Trustee, American Beacon Institutional Funds Trust (2018-Present); Trustee, American Beacon Sound Point Enhanced Income Fund (2018–Present); Trustee, American Beacon Apollo Total Return Fund (2018–Present). | ||
| Douglas A. Lindgren (58) | Trustee since 2018 | CEO North America, Carne Global Financial Services (2016-2017); Consultant, Carne Financial Services (2017-2019); Managing Director, IPS Investment Management and Global Head, Content Management, UBS Wealth Management (2010-2016); Trustee, American Beacon Select Funds (2018-Present); Trustee, American Beacon Institutional Funds Trust (2018-Present); Trustee, American Beacon Sound Point Enhanced Income Fund (2018–Present); Trustee, American Beacon Apollo Total Return Fund (2018–Present). | ||
| Barbara J. McKenna, CFA (57) | Trustee since 2012 | President/Managing Principal, Longfellow Investment Management Company (2005-Present); Trustee, American Beacon Select Funds (2012-Present); Trustee, American Beacon Institutional Funds Trust (2017-Present); Trustee, American Beacon Sound Point Enhanced Income Fund (2018–Present); Trustee, American Beacon Apollo Total Return Fund (2018–Present). | ||
| R. Gerald Turner (74) | Trustee since 2001 | President, Southern Methodist University (1995-Present); Director, J.C. Penney Company, Inc. (1996-2019); Director, Kronus Worldwide Inc. (chemical manufacturing) (2003-Present); Trustee, American Beacon Select Funds (2001-Present); Trustee, American Beacon Institutional Funds Trust (2017-Present); Trustee, American Beacon Sound Point Enhanced Income Fund (2018 – Present); Trustee, American Beacon Apollo Total Return Fund (2018–Present). | ||
44
Trustees and Officers of the American Beacon FundsSM (Unaudited)
Name, Age | Position, Term of Office and Length of Time Served with the Trust | Principal Occupation(s) During Past 5 Years and Current Directorships | ||
| OFFICERS | Term | |||
| One Year | ||||
| Gene L. Needles, Jr. (65) | President since 2009 | President (2009-2018), CEO and Director (2009–Present), and Chairman (2018-Present), American Beacon Advisors, Inc., President (2015-2018), Director and CEO (2015–Present), and Chairman (2018-Present), Resolute Investment Holdings, LLC; President (2015-2018), Director and CEO (2015-Present), and Chairman (2018-Present), Resolute Topco, Inc.; President (2015-2018); Director, and CEO (2015-Present), and Chairman (2018-Present), Resolute Acquisition, Inc.; President (2015-2018), Director and CEO (2015-Present), Chairman (2018-Present), Resolute Investment Managers, Inc.; Director, Chairman, President and CEO, Resolute Investment Distributors (2017-Present); Director, Chairman, President and CEO; Resolute Investment Services, Inc. (2017-Present); President and CEO, Lighthouse Holdings Parent, Inc. (2009-2015); President, CEO and Director, Lighthouse Holdings, Inc. (2009-2015); Manager, President and CEO, American Private Equity Management, LLC (2012-Present); Director, Chairman, President and CEO, Alpha Quant Advisors, LLC (2016-2020); Director, ARK Investment Management LLC (2016-Present); Director, Shapiro Capital Management LLC (2017-Present); Director, Chairman and CEO, Continuous Capital, LLC (2018-Present); Director, Green Harvest Asset Management (2019-Present); Director, National Investment Services of America, LLC (2019 – Present); President, American Beacon Cayman Managed Futures Strategy Fund, Ltd. (2014-Present); Director and President, American Beacon Cayman Transformational Innovation Company, LTD., (2017-2018); President, American Beacon Delaware Transformational Innovation Corporation (2017-2018); President American Beacon Cayman TargetRisk Company, Ltd. (2018-Present); Member, Investment Advisory Committee, Employees Retirement System of Texas (2017-Present); Trustee, American Beacon NextShares Trust (2015-Present); President, American Beacon Select Funds (2009-Present); President, American Beacon Institutional Funds Trust (2017-Present); President, American Beacon Sound Point Enhanced Income Fund (2018-Present); President, American Beacon Apollo Total Return Fund (2018-Present); Director, RSW Investments Holdings LLC, (2019-Present); Manager, SSI Investment Management, LLC (2019-Present). | ||
45
Trustees and Officers of the American Beacon FundsSM (Unaudited)
Name, Age | Position, Term of Office and Length of Time Served with the Trust | Principal Occupation(s) During Past 5 Years and Current Directorships | ||
| OFFICERS (CONT.) | Term | |||
| One Year | ||||
| Rosemary K. Behan (61) | VP, Secretary and Chief Legal Officer since 2006 | Vice President, Secretary and General Counsel, American Beacon Advisors, Inc. (2006-Present); Secretary, Resolute Investment Holdings, LLC (2015-Present); Secretary, Resolute Topco, Inc. (2015-Present); Secretary, Resolute Acquisition, Inc. (2015–Present); Vice President, Secretary and General Counsel, Resolute Investment Managers, Inc. (2015-Present); Secretary, Resolute Investment Distributors, Inc. (2017-Present); Vice President, Secretary and General Counsel, Resolute Investment Services, Inc. (2017-Present); Vice President and Secretary, Lighthouse Holdings Parent, Inc. (2008-2015); Vice President and Secretary, Lighthouse Holdings, Inc. (2008-2015); Secretary, American Private Equity Management, LLC (2008-Present); Secretary and General Counsel, Alpha Quant Advisors, LLC (2016-2020); Vice President and Secretary, Continuous Capital, LLC (2018-Present); Secretary, Green Harvest Asset Management (2019-Present); Secretary, American Beacon Delaware Transformational Innovation Corporation (2017-2018); Secretary, American Beacon Cayman Transformational Innovation Company, Ltd. (2017-2018); Secretary, American Beacon Cayman Managed Futures Strategy Fund, Ltd. (2014-Present); Secretary, American Beacon Cayman TargetRisk Company, Ltd (2018-Present); Chief Legal Officer, Vice President and Secretary, American Beacon Select Funds (2006-Present); Chief Legal Officer, Vice President and Secretary, American Beacon Institutional Funds Trust (2017-Present); Chief Legal Officer, Vice President and Secretary, American Beacon Sound Point Enhanced Income Fund (2018-Present); Chief Legal Officer, Vice President and Secretary American Beacon Apollo Total Return Fund (2018-Present). | ||
| Brian E. Brett (60) | VP since 2004 | Senior Vice President, Head of Distribution (2012-Present), Vice President, Director of Sales (2004-2012), American Beacon Advisors, Inc.; Senior Vice President, Resolute Investment Managers, Inc. (2017-Present); Senior Vice President, Resolute Investment Distributors, Inc. (2018-Present), Senior Vice President, Resolute Investment Services, Inc. (2018-Present); Senior Vice President, Lighthouse Holdings Parent, Inc. (2008-2015); Senior Vice President, Lighthouse Holdings, Inc. (2008-2015); Vice President, American Beacon Select Funds (2004-Present); Vice President, American Beacon Institutional Funds Trust (2017-Present); Vice President American Beacon Sound Point Enhanced Income Fund (2018-Present); Vice President American Beacon Apollo Total Return Fund (2018-Present). | ||
| Paul B. Cavazos (51) | VP since 2016 | Chief Investment Officer and Senior Vice President, American Beacon Advisors, Inc. (2016-Present); Chief Investment Officer, DTE Energy (2007-2016); Vice President, American Private Equity Management, L.L.C. (2017–Present); Vice President, American Beacon Select Funds (2016-Present); Vice President, American Beacon Institutional Funds Trust (2017-Present); Vice President American Beacon Sound Point Enhanced Income Fund (2018-Present); Vice President American Beacon Apollo Total Return Fund (2018-Present). | ||
| Erica Duncan (49) | VP Since 2011 | Vice President, American Beacon Advisors, Inc. (2011-Present); Vice President, Resolute Investment Managers (2018-Present); Vice President, Resolute Investment Services, Inc. (2018-Present); Vice President, American Beacon Select Funds (2011-Present); Vice President, American Beacon Institutional Funds Trust (2017-Present); Vice President American Beacon Sound Point Enhanced Income Fund (2018-Present); Vice President American Beacon Apollo Total Return Fund (2018-Present). | ||
46
Trustees and Officers of the American Beacon FundsSM (Unaudited)
Name, Age | Position, Term of Office and Length of Time Served with the Trust | Principal Occupation(s) During Past 5 Years and Current Directorships | ||
| OFFICERS (CONT.) | Term | |||
| One Year | ||||
| Melinda G. Heika (59) | Principal Accounting Officer since 2017 and Treasurer since 2010 | Treasurer and CFO (2010-Present), American Beacon Advisors, Inc.; Treasurer, Resolute Topco, Inc. (2015-Present); Treasurer, Resolute Investment Holdings, LLC. (2015-Present); Treasurer, Resolute Acquisition, Inc. (2015-Present); Treasurer and CFO, Resolute Investment Managers, Inc. (2017-Present); Treasurer, Resolute Investment Distributors, Inc. (2017-2017); Treasurer and CFO, Resolute Investment Services, Inc. (2015-Present); Treasurer, Lighthouse Holdings Parent Inc., (2010-2015); Treasurer, Lighthouse Holdings, Inc. (2010-2015); Treasurer, American Private Equity Management, LLC (2012-Present); Treasurer and CFO, Alpha Quant Advisors, LLC (2016-2020); Treasurer and CFO, Continuous Capital, LLC (2018-Present); Treasurer, Green Harvest Asset Management (2019-Present); Treasurer, American Beacon Cayman Transformational Innovation, Ltd. (2017-2018); Treasurer, American Beacon Delaware Transformational Innovation Corporation (2017-2018); Director and Treasurer, American Beacon Cayman Managed Futures Strategy Fund, Ltd. (2014-Present); Treasurer, American Beacon Cayman TargetRisk Company, Ltd. (2018-Present); Principal Accounting Officer (2017-Present) and Treasurer, American Beacon Select Funds (2010-Present); Principal Accounting Officer and Treasurer, American Beacon Institutional Funds Trust (2017-Present); Principal Accounting Officer and Treasurer, American Beacon Sound Point Enhanced Income Fund (2018-Present); Principal Accounting Officer and Treasurer, American Beacon Apollo Total Return Fund (2018-Present). | ||
| Terri L. McKinney (56) | VP since 2010 | Vice President (2009-Present), Managing Director (2003-2009), American Beacon Advisors, Inc.; Vice President, Resolute Investment Managers, Inc. (2017-Present); Vice President, Resolute Investment Services, Inc (2018-Present); Vice President, Alpha Quant Advisors, LLC (2016-Present); Vice President, Continuous Capital, LLC (2018-Present); Vice President, American Beacon Select Funds (2010-Present); Vice President, American Beacon Institutional Funds Trust (2017-Present); Vice President, American Beacon Sound Point Enhanced Income Fund (2018-Present); Vice President, American Beacon Apollo Total Return Fund (2018-Present). | ||
47
Trustees and Officers of the American Beacon FundsSM (Unaudited)
Name, Age | Position, Term of Office and Length of Time Served with the Trust | Principal Occupation(s) During Past 5 Years and Current Directorships | ||
| OFFICERS (CONT.) | Term | |||
| One Year | ||||
| Jeffrey K. Ringdahl (45) | VP since 2010 | Director (2015-Present), President (2018-Present), Chief Operating Officer (2010-Present), Senior Vice President (2013-2018), Vice President (2010-2013), American Beacon Advisors, Inc.; Director (2015-Present), President (2018-Present), Senior Vice Present (2015-2018), Resolute Investment Holdings, LLC; Director (2015-Present), President (2018-Present), Senior Vice President (2015-2018), Resolute Topco, Inc.; Director (2015-Present), President (2018-Present), Senior Vice President (2015-2018), Resolute Acquisition, Inc.; Director (2015-Present), President & COO (2018-Present), Senior Vice President (2015-2018), Resolute Investment Managers, Inc.; Director and Executive Vice President (2017-Present), Resolute Investment Distributors, Inc.; Director (2017-Present), President & COO (2018-Present), Executive Vice President (2017-2018), Resolute Investment Services, Inc.; Senior Vice President (2017-Present), Vice President (2012-2017), Manager (2015-Present), American Private Equity Management, LLC; Senior Vice President, Lighthouse Holdings Parent, Inc. (2013-2015); Senior Vice President, Lighthouse Holdings, Inc. (2013-2015); Trustee, American Beacon NextShares Trust (2015-Present); Director, Executive Vice President & COO, Alpha Quant Advisors, LLC (2016-2020); Director, Shapiro Capital Management, LLC (2017-Present); Director, Executive Vice President & COO, Continuous Capital, LLC (2018-Present); Director, RSW Investments Holdings LLC, (2019-Present); Manager, SSI Investment Management, LLC (2019-Present); Director, National Investment Services of America, LLC (2019-Present); Director and Vice President, American Beacon Cayman Transformational Innovation Company, Ltd., (2017-Present); Vice President, American Beacon Delaware Transformational Innovation Corporation (2017-2018); Director and Vice President, American Beacon Cayman Managed Futures Strategy Fund, Ltd. (2014-Present); Vice President, American Beacon Cayman TargetRisk Company, Ltd (2018-Present); Vice President, American Beacon Select Funds (2010-2018); Vice President, American Beacon Institutional Funds Trust (2017-Present); Vice President, American Beacon Sound Point Enhanced Income Fund (2018-Present); Vice President, American Beacon Apollo Total Return Fund (2018-Present). | ||
| Samuel J. Silver (57) | VP Since 2011 | Vice President (2011-Present), Chief Fixed Income Officer (2016-Present), American Beacon Advisors, Inc. (2011-Present); Vice President, American Beacon Select Funds (2011-Present); Vice President, American Beacon Institutional Funds Trust (2017-Present); Vice President, American Beacon Sound Point Enhanced Income Fund (2018-Present); Vice President, American Beacon Apollo Total Return Fund (2018-Present). | ||
| Christina E. Sears (48) | Chief Compliance Officer since 2004 and Asst. Secretary since 1999 | Vice President, American Beacon Advisors, Inc. (2019-Present); Chief Compliance Officer, American Beacon Advisors, Inc. (2004-Present); Vice President, Resolute Investment Managers, Inc. (2017-Present); Vice President, Resolute Investment Distributors (2017-Present); Vice President, Resolute Investment Services, Inc. (2019-Present); Chief Compliance Officer, American Private Equity Management, LLC (2012-Present); Chief Compliance Officer (2016-2019) and Vice President, Alpha Quant Advisors, LLC (2016-2020); Vice President, Continuous Capital, LLC (2018-Present); Chief Compliance Officer (2004-Present) and Assistant Secretary (1999-Present), American Beacon Select Funds; Chief Compliance Officer and Assistant Secretary, American Beacon Institutional Funds Trust (2017-Present); Chief Compliance Officer and Assistant Secretary, American Beacon Sound Point Enhanced Income Fund (2018-Present); Chief Compliance Officer and Assistant Secretary, American Beacon Apollo Total Return Fund (2018-Present). | ||
48
Trustees and Officers of the American Beacon FundsSM (Unaudited)
Name, Age | Position, Term of Office and Length of Time Served with the Trust | Principal Occupation(s) During Past 5 Years and Current Directorships | ||
| OFFICERS (CONT.) | Term | |||
| One Year | ||||
| Sonia L. Bates (63) | Asst. Treasurer since 2011 | Assistant Treasurer, American Beacon Advisors, Inc. (2011-2018); Assistant Treasurer, Lighthouse Holdings Parent Inc. (2011-2015); Assistant Treasurer, Lighthouse Holdings, Inc. (2011-2015); Assistant Treasurer, American Private Equity Management, LLC (2012-Present); Assistant Treasurer, American Beacon Cayman Transformational Innovation Company, Ltd. (2017-Present); Assistant Treasurer, American Beacon Cayman TargetRisk Company, Ltd. (2018-Present); Assistant Treasurer, American Beacon Select Funds (2011-Present); Assistant Treasurer, American Beacon Institutional Funds Trust (2017-Present); Assistant Treasurer, American Beacon Sound Point Enhanced Income Fund (2018-Present); Assistant Treasurer, American Beacon Apollo Total Return Fund (2018-Present). | ||
| Shelley D. Abrahams (45) | Assistant Secretary since 2008 | Assistant Secretary, American Beacon Select Funds (2008-Present); Assistant Secretary, American Beacon Institutional Funds Trust (2017-Present); Assistant Secretary, American Beacon Sound Point Enhanced Income Fund (2018-Present); Assistant Secretary, American Beacon Apollo Total Return Fund (2018-Present); | ||
| Rebecca L. Harris (53) | Assistant Secretary since 2010 | Vice President, American Beacon Advisors, Inc. (2011-Present); Vice President, Resolute Investment Managers, Inc. (2017-Present); Vice President, Resolute Investment Services (2015-Present); Vice President, Alpha Quant Advisors, LLC (2016-2020); Vice President, Continuous Capital, LLC (2018-Present); Assistant Secretary, American Beacon Select Funds (2010-Present); Assistant Secretary, American Beacon Institutional Funds Trust (2017-Present); Assistant Secretary, American Beacon Sound Point Enhanced Income Fund (2018-Present); Assistant Secretary, American Beacon Apollo Total Return Fund (2018-Present). | ||
| Teresa A. Oxford (61) | Assistant Secretary since 2015 | Assistant Secretary, American Beacon Advisors, Inc. (2015-Present); Assistant Secretary, Resolute Investment Distributors (2018-Present); Assistant Secretary, Resolute Investment Services (2018-Present); Assistant Secretary, Alpha Quant Advisors, LLC (2016-2020); Assistant Secretary, American Beacon Select Funds (2015-Present); Assistant Secretary, American Beacon Institutional Funds Trust (2017-Present); Assistant Secretary, American Beacon Sound Point Enhanced Income Fund (2018-Present); Assistant Secretary, American Beacon Apollo Total Return Fund (2018-Present); . | ||
| Peter A. Davidson (47)** | Assistant Secretary Since 2020 | Assistant Secretary, American Beacon Select Funds (2020-Present); Assistant Secretary, American Beacon Institutional Funds Trust (2020-Present); Assistant Secretary, American Beacon Sound Point Enhanced Income Fund (2020-Present); Assistant Secretary, American Beacon Apollo Total Return Fund (2020-Present). | ||
* As of 11/12/2014, the Board adopted a retirement plan that requires Trustees to retire no later than the last day of the calendar year in which they reach the age of 75.
** Mr. Davidson resigned as of July 31, 2020.
49
American Beacon FundsSM
June 30, 2020 (Unaudited)
The American Beacon Interval Funds recognize and respect the privacy of our shareholders. We are providing this notice to you so you will understand how shareholder information may be collected and used.
We may collect nonpublic personal information about you from one or more of the following sources:
| • | information we receive from you on applications or other forms; |
| • | information about your transactions with us or our service providers; and |
| • | information we receive from third parties. |
We do not disclose any nonpublic personal information about our customers or former customers to anyone, except as permitted by law.
We restrict access to your nonpublic personal information to those employees or service providers who need to know that information to provide products or services to you. To ensure the confidentiality of your nonpublic personal information, we maintain safeguards that comply with federal standards.
50
This page intentionally left blank.
51
This page intentionally left blank.
52

Delivery of Documents
eDelivery is NOW AVAILABLE - Stop traditional mail delivery and receive your
shareholder reports and summary prospectus on-line. Sign up at
www.americanbeaconfunds.com
If you invest in the Fund through a financial institution, you may be able to receive the Fund’s regulatory mailings, such as the Prospectus, Annual Report and Semi-Annual Report, by e-mail. If you are interested in this option, please go to www.icsdelivery.com and search for your financial institution’s name or contact your financial institution directly.
To obtain more information about the Fund:
 |  | |
| By E-mail: | On the Internet: | |
| american_beacon.funds@ambeacon.com | Visit our website at www.americanbeaconfunds.com | |
By Telephone: Call (800) 658-5811 |
By Mail: American Beacon Funds P.O. Box 219643 Kansas City, MO 64121-9643 | |
| Availability of Quarterly Portfolio Schedules | Availability of Proxy Voting Policy and Records | |
| In addition to the Schedule of Investments provided in each semi-annual and annual report, the Fund files a complete schedule of its portfolio holdings with the Securities and Exchange Commission (“SEC”) on Form N-PORT as of the end of each fiscal quarter. The Fund’s Forms N-PORT are available on the SEC’s website at www.sec.gov. The Forms N-PORT may also be reviewed and copied at the SEC’s Public Reference Section, 100 F Street, NE, Washington, D.C. 20549-2736. Information regarding the operation of the SEC’s Public Reference Room may be obtained by calling (800)- SEC-0330. A complete schedule of the Fund’s portfolio holdings is also available at www.americanbeaconfunds.com approximately twenty days after the end of each month. | A description of the policies and procedures the Fund uses to determine how to vote proxies relating to portfolio securities is available in the Fund’s Statement of Additional Information, is available free of charge on the Fund’s website www.americanbeaconfunds.com and by calling 1-800-967-9009 or by accessing the SEC’s website at www.sec.gov. The Fund’s proxy voting record for the most recent year ended June 30 is filed annually with the SEC on Form N-PX. The Fund’s Forms N-PX are available on the SEC’s website at www.sec.gov. The Fund’s proxy voting record may also be obtained by calling 1-800-967-9009. | |


Fund Service Providers:
CUSTODIAN State Street Bank and Trust Company Boston, Massachusetts | TRANSFER AGENT DST Asset Manager Solutions, Inc. Quincy, Massachusetts | INDEPENDENT REGISTERED PUBLIC ACCOUNTING FIRM PricewaterhouseCoopers LLP Boston, Massachusetts | DISTRIBUTOR Resolute Investment Distributors, Inc. Irving, Texas |
This report is prepared for shareholders of the American Beacon Funds and may be distributed to others only if preceded or accompanied by a current Prospectus or Summary Prospectus.
American Beacon Funds and American Beacon ARK Transformational Innovation Fund are service marks of American Beacon Advisors, Inc.
AR 6/20
About American Beacon Advisors
Since 1986, American Beacon Advisors, Inc., has offered a variety of products and investment advisory services to numerous institutional and retail clients, including a variety of mutual funds, corporate cash management, and separate account management.
Our clients include defined benefit plans, defined contribution plans, foundations, endowments, corporations, financial planners, and other institutional investors. With American Beacon Advisors, you can put the experience of a multi-billion dollar asset management firm to work for your company.
SHAPIRO EQUITY OPPORTUNITIES FUND
Investing in value stocks may limit downside risk over time; however, the Fund may produce more modest gains than riskier stock funds as a trade-off for this potentially lower risk. Because the Fund may invest in fewer issuers than a more diversified portfolio, the fluctuating value of a single holding may have a greater effect on the value of the Fund. The Fund participates in a securities lending program. The use of futures contracts for cash management may subject the Fund to losing more money than invested. Please see the prospectus for a complete discussion of the Fund’s risks. There can be no assurances that the investment objectives of this Fund will be met.
SHAPIRO SMID CAP EQUITY FUND
Investing in value stocks may limit downside risk over time; however, the Fund may produce more modest gains than riskier stock funds as a trade-off for this potentially lower risk. Investing in small- or mid-capitalization stocks may involve greater volatility and lower liquidity than larger company stocks. Because the Fund may invest in fewer issuers than a more diversified portfolio, the fluctuating value of a single holding may have a greater effect on the value of the Fund. The Fund participates in a securities lending program. The use of futures contracts for cash management may subject the Fund to losing more money than invested. Please see the prospectus for a complete discussion of the Fund’s risks. There can be no assurances that the investment objectives of this Fund will be met.
Any opinions herein, including forecasts, reflect our judgment as of the end of the reporting period and are subject to change. Each advisor’s strategies and each Fund’s portfolio composition will change depending on economic and market conditions. This report is not a complete analysis of market conditions, and, therefore, should not be relied upon as investment advice. Although economic and market information has been compiled from reliable sources, American Beacon Advisors, Inc. makes no representation as to the completeness or accuracy of the statements contained herein.
American Beacon Funds | June 30, 2020 |
| 1 | ||||
| 3 | ||||
| 8 | ||||
| 10 | ||||
| 11 | ||||
| 14 | ||||
| 17 | ||||
| 20 | ||||
| 37 | ||||
| 40 | ||||
| 43 | ||||
Disclosure Regarding Approval of the Management and Investment Advisory Agreements | 44 | |||
| 49 | ||||
| 50 | ||||
| 56 | ||||
| Back Cover |
 | Dear Shareholders,
Unlike anything we’ve experienced in our lifetimes, the COVID-19 pandemic continues to have an overwhelming effect on the world’s population, economies and markets. During this reporting period, news reports related to the virus dominated headlines:
u On March 15, the Federal Reserve cut the federal funds rate by 100 basis points (1%) to a range of 0% to 0.25%, and announced quantitative easing would be unlimited.
u Also in March, the U.S. government passed a stimulus package in three phases: phase one for approximately $8.3 billion, phase two for approximately $100 billion, and phase three for approximately $2 trillion. |
| u | On April 20, the price of U.S. oil turned negative for the first time in history, closing at -$37.60 per barrel for oil deliveries in May. However, by the end of June, the average crude oil spot price – which calculates an equally weighted price for West Texas Intermediate, Brent and Dubai crude oils – was $39.46 per barrel. |
| u | Although equity markets around the world have rebounded since the lows experienced earlier this year, uncertainty and volatility remain while economies continue to feel the effects of the pandemic. In the U.S., initial estimates indicated gross domestic product fell 9.5% for the second quarter – an annualized decline of 32.9% – making it the sharpest economic contraction in modern history. |
| u | As of June 30, the virus had infected more than 10 million individuals around the world, resulting in more than 503,000 deaths. The U.S. alone accounted for more than 2.5 million confirmed cases and more than 126,000 deaths. |
Now more than ever, we recognize that fear of loss can be a powerful emotion, leading many investors to make short-term decisions subject to a variety of potential error-leading biases. Unfortunately, short-term investment decisions may derail future plans. We encourage investors to maintain focus on their long-term financial goals, working with financial professionals to make thoughtful adjustments to their changing needs.
The three Ds – direction, discipline and diversification – may help frame this conversation.
| u | Direction: Achieving your long-term financial goals requires an individualized plan of action. You may want your plan to provide some measure of protection against periods of geopolitical turmoil, economic uncertainty, market volatility and job insecurity. Your plan should be reviewed annually and be adjusted in the event your long-range needs change. |
| u | Discipline: Long-term, systematic participation in an investment portfolio requires your resolution to stay the course. Spending time in the market – rather than trying to time the market – may place you in a better position to reach your long-term financial goals. |
| u | Diversification: By investing in different investment styles and asset classes, you may be able to help mitigate financial risks across your investment portfolio. By allocating your investment portfolio according to your risk-tolerance level, you may be better positioned to weather storms and achieve your long-term financial goals. |
1
President’s Message
American Beacon has endeavored to provide investors with a disciplined approach to realizing long-term financial goals since 1986. As a manager of managers, we strive to provide investment products that may enable investors to participate during market upswings while potentially insulating against market downswings. The investment teams behind our mutual funds seek to produce consistent, long-term results rather than focus only on short-term movements in the markets. In managing our investment products, we emphasize identifying opportunities that offer the potential for long-term rewards.
Thank you for staying the course with American Beacon. For additional information about our investment products or to access your account information, please visit our website at www.americanbeaconfunds.com.
Best Regards,

Gene L. Needles, Jr.
President
American Beacon Funds
2
June 30, 2020 (Unaudited)
For the 12-month period ended June 30, 2020, equity markets were slightly higher overall; this was despite record drawdowns in 2020 with the beginning of the COVID-19 pandemic. The spread of the contagion and global attempts to slow or stop it via self-imposed shutdowns introduced innumerable uncertainties for investors. Chief among those uncertainties were the economic effects from nations shutting down portions of their economies and varied fiscal policies enacted to support the same economies. Through all of this, the MSCI All Country World Index rose 2.11%, driven higher by resilient U.S. equities as international developed and emerging market equities did not fare as well.
In the U.S., the S&P 500 Index was up 7.51%, driven by positive returns from five of its 11 sectors. The top performers were growth-oriented sectors, including Information Technology (up 35.90%) and Consumer Discretionary (up 12.59%), followed by Communication Services (up 11.08%) and Health Care (up 10.90%). Energy (down 36.09%) and Financials (down 13.92%), were the worst-performing sectors. From a style standpoint, Growth continued the trend of outpacing Value as the Russell 3000 Growth Index returned 21.94% versus the Russell 3000 Value Index return of -9.42%. From a capitalization perspective, small-cap stocks struggled compared to their larger-capitalization peers, evidenced by the Russell 2000 Index return of -6.63% compared to the Russell 1000 Index return of 7.48%.
International developed markets ended the period lower as the MSCI EAFE Index was down 5.13%. In Europe, the top-performing countries were Denmark and the Netherlands, represented by the MSCI Denmark Index (up 22.32%) and the MSCI Netherlands Index (up 8.86%), respectively. The worst-performing countries in Europe were Austria and Norway, represented by the MSCI Austria Index (down 27.80%) and the MSCI Norway Index (down 23.07%), respectively. In New Zealand, which largely quashed the presence of COVID-19 through top-down health policy and a cooperative public, equities posted large gains as the MSCI New Zealand Index returned 21.99%.
Finally, in the developing world, emerging markets took the initial brunt of the pandemic, both in spread of infection and economic shutdown, resulting in the MSCI Emerging Market Index returning -3.39%. Taiwan led the emerging-markets countries with the MSCI Taiwan Index up 21.88%. China, the largest constituent, was up 13.13%, represented by the MSCI China Index. Argentina, having recently elected a populist Peronist president and dealing with a debt default, returned -46.50%, represented by the MSCI Argentina Index.
3
American Beacon Shapiro Equity Opportunities FundSM
Performance Overview
June 30, 2020 (Unaudited)
The Investor Class of the American Beacon Shapiro Equity Opportunities Fund (the “Fund”) returned -12.20% for the twelve months ended June 30, 2020. The Fund underperformed the Russell 3000® Index (the “Index”) return of 6.53% for the period. For additional comparison, the Russell 3000® Value Index returned -9.42% for the period.
Comparison of Changes in Value of a $10,000 Investment for the period 9/12/2017 through 6/30/2020
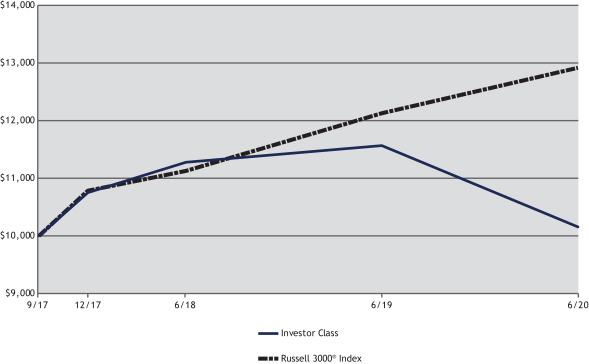
| Total Returns for the Period ended June 30, 2020 |
| |||||||||||||||||||||
Ticker | 1 Year | Since Inception | Value of $10,000 | |||||||||||||||||||
R5 Class (1,3) | SHXIX | (11.84 | )% | 0.94 | % | $ | 10,265 | |||||||||||||||
Y Class (1,3) | SHXYX | (11.92 | )% | 0.90 | % | $ | 10,255 | |||||||||||||||
Investor Class (1,3) | SHXPX | (12.20 | )% | 0.54 | % | $ | 10,152 | |||||||||||||||
Russell 3000® Index (2) | 6.53 | % | 9.57 | % | $ | 12,917 | ||||||||||||||||
| 1. | Performance shown is historical and is not indicative of future returns. Investment returns and principal value will vary, and shares may be worth more or less at redemption than at original purchase. Performance shown is calculated based on the published end-of-day net asset values as of date indicated, and current performance may be lower or higher than the performance data quoted. To obtain performance as of the most recent month end, please call 1-800-967-9009 or visit www.americanbeaconfunds.com. Fund performance in the table above does not reflect the deduction of taxes a shareholder would pay on distributions or the redemption of shares. Generally accepted accounting principles require adjustments to be made to the net assets of the Fund at period end for financial reporting purposes only; and as such, the total return based on the unadjusted net asset value per share may differ from the total return reported in the financial highlights. A portion of the fees charged to the R5 Class and Y Class of the Fund has been waived since Fund inception. Performance prior to waiving was lower than actual returns shown since inception. A portion of the fees charged to the Investor Class of the Fund was waived from Fund inception to 2020. Performance prior to waiving was lower than actual returns shown from inception to 2020. |
| 2. | The Russell 3000® Index measures the performance of the 3,000 largest U.S. companies based on total market capitalization, which represents approximately 98% of the U.S. equity market. American Beacon Funds is not promoted, sponsored or endorsed by, nor in any way affiliated with the London Stock Exchange Group plc and its group undertakings (collectively, the “LSE Group”). FTSE Russell is a trading name of certain of the LSE Group companies. LSE Group is not responsible for and has not reviewed the American Beacon The London Company Income Equity Fund nor any associated |
4
American Beacon Shapiro Equity Opportunities FundSM
Performance Overview
June 30, 2020 (Unaudited)
| literature or publications and LSE Group makes no representation or warranty, express or implied, as to their accuracy, or completeness, or otherwise. All rights in the Russell 3000 Value Index (the “Index”) vest in the relevant LSE Group company which owns the Index. Russell 3000® is a trade mark of the relevant LSE Group company and is used by any other LSE Group company under license. The Index is calculated by or on behalf of FTSE International Limited or its affiliate, agent or partner. The LSE Group does not accept any liability whatsoever to any person arising out of (a) the use of, reliance on or any error in the Index or (b) investment in or operation of the Fund. The LSE Group makes no claim, prediction, warranty or representation either as to the results to be obtained from the Fund or the suitability of the Index for the purpose to which it is being put by the Fund. One cannot directly invest in an index. |
| 3. | The Total Annual Fund Operating Expense ratios set forth in the most recent Fund prospectus for the R5, Y and Investor Class shares were 0.99%, 1.07% and 2.58%, respectively. The expense ratios above may vary from the expense ratios presented in other sections of this report that are based on expenses incurred during the period covered by this report. |
The Fund underperformed the Index primarily due to stock selection, although sector allocation also detracted over the period. Most of the Fund’s underperformance related to security selection was attributed to holdings in the Communication Services and Consumer Discretionary sectors. In the Communication Services sector, Lions Gate Entertainment Corp. Class B (down 43.5%) and ViacomCBS, Inc. Class B (down 37.5%) were the largest detractors. In the Consumer Discretionary sector, Urban Outfitters, Inc. (down 38.8%), Hanesbrands, Inc. (down 30.1%) and General Motors Co. (down 32.0%) detracted from performance. The underperformance was partially offset by security selection in the Consumer Staples sector where Kroger Co. (up 43.2%) was the largest contributor to performance.
From a sector allocation perspective, an underweight allocation to the Information Technology sector (up 34.0%), the best performing sector in the Index, detracted from Fund performance. Overweighting the Energy sector (down 37.6%), the worst performing sector in the Index, also hurt the Fund’s relative returns. The Fund’s overweight allocation to the Consumer Discretionary sector (up 14.6%) contributed positively to performance.
Looking forward, the Fund’s sub-advisor will continue to employ a team-based investment process that is driven by deep fundamental research in a concentrated, value-oriented approach.
| Top Ten Holdings (% Net Assets) |
| |||||||
| Hanesbrands, Inc. | 5.6 | |||||||
| Micron Technology, Inc. | 5.5 | |||||||
| FedEx Corp. | 5.2 | |||||||
| Berkshire Hathaway, Inc., Class B | 5.1 | |||||||
| Axalta Coating Systems Ltd. | 5.0 | |||||||
| DuPont de Nemours, Inc. | 5.0 | |||||||
| Regions Financial Corp. | 5.0 | |||||||
| FireEye, Inc. | 4.7 | |||||||
| Pfizer, Inc. | 4.6 | |||||||
| Bank of America Corp. | 4.5 | |||||||
| Total Fund Holdings | 26 | |||||||
| Sector Allocation (% Equities) |
| |||||||
| Materials | 18.7 | |||||||
| Consumer Discretionary | 16.6 | |||||||
| Information Technology | 16.6 | |||||||
| Financials | 14.7 | |||||||
| Communication Services | 13.3 | |||||||
| Industrials | 9.9 | |||||||
| Health Care | 6.2 | |||||||
| Energy | 4.0 | |||||||
5
American Beacon Shapiro SMID Cap Equity FundSM
Performance Overview
June 30, 2020 (Unaudited)
The Investor Class of the American Beacon Shapiro SMID Cap Equity Fund (the “Fund”) returned -16.43% for the twelve months ended June 30, 2020. The Fund underperformed the Russell 2500® Index (the “Index”) return of -4.70% for the same period. For additional comparison, the Russell 2500® Value Index returned -15.50% for the period.
Comparison of Changes in Value of a $10,000 Investment for the period 9/12/2017 through 6/30/2020
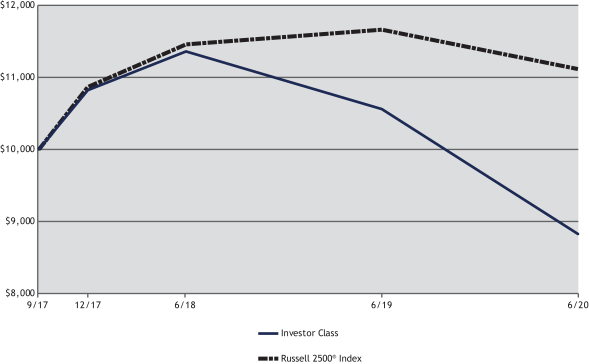
| Total Returns for the Period ended June 30, 2020 |
| |||||||||||||||||||||
Ticker | 1 Year | Since Inception 09/12/2017 | Value of $10,000 09/12/2017- 06/30/2020 | |||||||||||||||||||
R5 Class (1,3) | SHDIX | (16.09 | )% | (4.00 | )% | $ | 8,919 | |||||||||||||||
Y Class (1,3) | SHDYX | (16.21 | )% | (4.08 | )% | $ | 8,899 | |||||||||||||||
Investor Class (1,3) | SHDPX | (16.43 | )% | (4.37 | )% | $ | 8,824 | |||||||||||||||
Russell 2500® Index (2) | (4.70 | )% | 3.84 | % | $ | 11,113 | ||||||||||||||||
| 1. | Performance shown is historical and is not indicative of future returns. Investment returns and principal value will vary, and shares may be worth more or less at redemption than at original purchase. Performance shown is calculated based on the published end-of-day net asset values as of date indicated, and current performance may be lower or higher than the performance data quoted. To obtain performance as of the most recent month end, please visit www.americanbeaconfunds.com or call 1-800-967-9009. Fund performance in the table above does not reflect the deduction of taxes a shareholder would pay on distributions or the redemption of shares. Generally accepted accounting principles require adjustments to be made to the net assets of the Fund at period end for financial reporting purposes only; and as such, the total return based on the unadjusted net asset value per share may differ from the total return reported in the financial highlights. A portion of the fees charged to each Class of the Fund has been waived since Fund inception. Performance prior to waiving fees was lower than actual returns shown since inception. |
| 2. | The Russell 2500® Index is an unmanaged index that measures the performance of the small to mid-cap segment of the U.S. equity universe. It is a subset of the Russell 3000® Index and includes approximately 2,500 of the smallest securities based on a combination of their market capitalization and current index membership. American Beacon Funds is not promoted, sponsored or endorsed by, nor in any way affiliated with the London Stock Exchange Group plc and its group undertakings (collectively, the “LSE Group”). FTSE Russell is a trading name of certain of the LSE Group companies. LSE Group is not responsible for and has not reviewed the American Beacon The London Company Income Equity Fund nor any associated literature or publications and LSE Group makes no representation or warranty, express or implied, as to their accuracy, or completeness, or otherwise. All rights in the Russell 2500 |
6
American Beacon Shapiro SMID Cap Equity FundSM
Performance Overview
June 30, 2020 (Unaudited)
| Index (the “Index”) vest in the relevant LSE Group company which owns the Index. Russell 3000® and Russell 2500® are trade marks of the relevant LSE Group company and are used by any other LSE Group company under license. The Index is calculated by or on behalf of FTSE International Limited or its affiliate, agent or partner. The LSE Group does not accept any liability whatsoever to any person arising out of (a) the use of, reliance on or any error in the Index or (b) investment in or operation of the Fund. The LSE Group makes no claim, prediction, warranty or representation either as to the results to be obtained from the Fund or the suitability of the Index for the purpose to which it is being put by the Fund. One cannot directly invest in an index. |
| 3. | The Total Annual Fund Operating Expense ratios set forth in the most recent Fund prospectus for the R5, Y and Investor Class shares were 2.85%, 2.88% and 3.88%, respectively. The expense ratios above may vary from the expense ratios presented in other sections of this report that are based on expenses incurred during the period covered by this report. |
The Fund underperformed the Index primarily due to stock selection, but sector allocation also detracted over the period. Most of the Fund’s underperformance related to security selection was attributed to holdings in the Communication Services and Health Care sectors. In the Communication Services sector, AMC Networks, Inc. (down 57.4%) and Lions Gate Entertainment Corp. Class B (down 43.9%) were the largest detractors during the period. In the Health Care sector, positions in Allscripts Healthcare Solutions, Inc. (down 41.8%) and Varex Imaging Corp. (down 23.5%) detracted from performance. The aforementioned underperformance was partially offset by security selection in the Industrials sector. Positions in Maxar Technologies, Inc. (up 137.8%) and BWX Technologies, Inc. (up 22.8%) were the largest contributors to performance.
From a sector allocation perspective, overweighting the Energy sector (down 55.1%), the worst performing sector in the Index, and underweighting the Health Care sector (up 20.1%) hurt returns relative to the Index. Partially offsetting losses was an underweight allocation to the second-worst performer within the Index, Financials (down 19.7%), which added value to relative performance.
Looking forward, the Fund’s sub-advisor will continue to employ a team-oriented investment process that is driven by deep fundamental research in a concentrated, value-oriented approach.
| Top Ten Holdings (% Net Assets) |
| |||||||
| Hanesbrands, Inc. | 5.7 | |||||||
| FireEye, Inc. | 5.3 | |||||||
| Axalta Coating Systems Ltd. | 5.2 | |||||||
| Carter’s, Inc. | 5.2 | |||||||
| Regions Financial Corp. | 5.1 | |||||||
| Lions Gate Entertainment Corp., Class B | 5.0 | |||||||
| Urban Outfitters, Inc. | 5.0 | |||||||
| Graphic Packaging Holding Co. | 4.6 | |||||||
| Albemarle Corp. | 4.5 | |||||||
| WPX Energy, Inc. | 4.4 | |||||||
| Total Fund Holdings | 27 | |||||||
| Sector Allocation (% Equities) |
| |||||||
| Materials | 21.9 | |||||||
| Information Technology | 19.8 | |||||||
| Consumer Discretionary | 15.9 | |||||||
| Communication Services | 15.7 | |||||||
| Financials | 9.1 | |||||||
| Industrials | 7.1 | |||||||
| Health Care | 6.1 | |||||||
| Energy | 4.4 | |||||||
7
Expense Examples
June 30, 2020 (Unaudited)
Fund Expense Example
As a shareholder of a Fund, you incur two types of costs: (1) transaction costs, including sales charges (loads) on purchase payments and redemption fees, if applicable, and (2) ongoing costs, including management fees, distribution (12b-1) fees, sub-transfer agent fees, and other Fund expenses. The Examples are intended to help you understand the ongoing cost (in dollars) of investing in the Funds and to compare these costs with the ongoing costs of investing in other mutual funds. The Examples are based on an investment of $1,000 invested at the beginning of the period in each Class and held for the entire period from January 1, 2020 through June 30, 2020.
Actual Expenses
The “Actual” lines of the tables provide information about actual account values and actual expenses. You may use the information on this page, together with the amount you invested, to estimate the expenses that you paid over the period. Simply divide your account value by $1,000 (for example, an $8,600 account value divided by $1,000 = $8.60), then multiply the result by the “Expenses Paid During Period” to estimate the expenses you paid on your account during this period. Shareholders of the Investor and R5 Classes that invest in the Funds through an IRA or Roth IRA may be subject to a custodial IRA fee of $15 that is typically deducted each December. If your account was subject to a custodial IRA fee during the period, your costs would have been $15 higher.
Hypothetical Example for Comparison Purposes
The “Hypothetical” lines of the tables provide information about hypothetical account values and hypothetical expenses based on the Funds’ actual expense ratio and an assumed 5% per year rate of return before expenses (not the Funds’ actual return). You may compare the ongoing costs of investing in the Funds with other funds by contrasting this 5% hypothetical example and the 5% hypothetical examples that appear in the shareholder reports of the other funds. The hypothetical account values and expenses may not be used to estimate the actual ending account balance or expenses you paid for the period. Shareholders of the Investor and R5 Classes that invest in the Funds through an IRA or Roth IRA may be subject to a custodial IRA fee of $15 that is typically deducted each December. If your account was subject to a custodial IRA fee during the period, your costs would have been $15 higher.
You should also be aware that the expenses shown in the table highlight only your ongoing costs and do not reflect any transaction costs charged by the Funds, such as sales charges (loads) or redemption fees, as applicable. Similarly, the expense examples for other funds do not reflect any transaction costs charged by those funds, such as sales charges (loads), redemption fees or exchange fees. Therefore, the “Hypothetical” lines of the tables are useful in comparing ongoing costs only and will not help you determine the relative total costs of owning different funds. If you were subject to any transaction costs during the period, your costs would have been higher.
8
American Beacon FundsSM
Expense Examples
June 30, 2020 (Unaudited)
| American Beacon Shapiro Equity Opportunities Fund |
| ||||||||||||||
| Beginning Account Value 1/1/2020 | Ending Account Value 6/30/2020 | Expenses Paid During Period 1/1/2020-6/30/2020* | |||||||||||||
| R5 Class** | |||||||||||||||
| Actual | $1,000.00 | $809.60 | $3.55 | ||||||||||||
| Hypothetical*** | $1,000.00 | $1,020.94 | $3.97 | ||||||||||||
| Y Class | |||||||||||||||
| Actual | $1,000.00 | $809.40 | $4.00 | ||||||||||||
| Hypothetical*** | $1,000.00 | $1,020.44 | $4.47 | ||||||||||||
| Investor Class | |||||||||||||||
| Actual | $1,000.00 | $807.40 | $5.26 | ||||||||||||
| Hypothetical*** | $1,000.00 | $1,019.05 | $5.87 | ||||||||||||
| * | Expenses are equal to the Fund’s annualized expense ratios for the six-month period of 0.79%, 0.89%, and 1.17% for the R5, Y, and Investor Classes, respectively, multiplied by the average account value over the period, multiplied by the number derived by dividing the number of days in the most recent fiscal half-year (182) by days in the year (366) to reflect the half-year period. |
| ** | Formerly known as Institutional Class. |
| *** | 5% return before expenses. |
| American Beacon Shapiro SMID Cap Equity Fund |
| ||||||||||||||
| Beginning Account Value 1/1/2020 | Ending Account Value 6/30/2020 | Expenses Paid During Period 1/1/2020-6/30/2020* | |||||||||||||
| R5 Class** | |||||||||||||||
| Actual | $1,000.00 | $779.90 | $3.94 | ||||||||||||
| Hypothetical*** | $1,000.00 | $1,020.44 | $4.47 | ||||||||||||
| Y Class | |||||||||||||||
| Actual | $1,000.00 | $779.50 | $4.38 | ||||||||||||
| Hypothetical*** | $1,000.00 | $1,019.94 | $4.97 | ||||||||||||
| Investor Class | |||||||||||||||
| Actual | $1,000.00 | $777.90 | $5.61 | ||||||||||||
| Hypothetical*** | $1,000.00 | $1,018.55 | $6.37 | ||||||||||||
| * | Expenses are equal to the Fund’s annualized expense ratios for the six-month period of 0.89%, 0.99%, and 1.27% for the R5, Y, and Investor Classes, respectively, multiplied by the average account value over the period, multiplied by the number derived by dividing the number of days in the most recent fiscal half-year (182) by days in the year (366) to reflect the half-year period. |
| ** | Formerly known as Institutional Class. |
| *** | 5% return before expenses. |
9
Report of Independent Registered Public Accounting Firm
To the Board of Trustees of American Beacon Funds and the Shareholders of American Beacon Shapiro Equity Opportunities Fund and American Beacon Shapiro SMID Cap Equity Fund
Opinion on the Financial Statements
We have audited the accompanying statements of assets and liabilities, including the schedules of investments, of American Beacon Shapiro Equity Opportunities Fund and American Beacon Shapiro SMID Cap Equity Fund (two of the series constituting American Beacon Funds, referred to hereafter as the “Funds”) as of June 30, 2020, the related statements of operations for the year ended June 30, 2020, the statements of changes in net assets for each of the two years in the period ended June 30, 2020, including the related notes, and the financial highlights for the years ended June 30, 2020 and 2019, and the period September 12, 2017 (commencement of operations) through June 30, 2018 (collectively referred to as the “financial statements”). In our opinion, the financial statements present fairly, in all material respects, the financial position of each of the Funds as of June 30, 2020, the results of each of their operations for the year then ended, the changes in each of their net assets for each of the two years in the period ended June 30, 2020 and the financial highlights of each Fund for the years ended June 30, 2020 and 2019, and the period September 12, 2017 (commencement of operations) through June 30, 2018 in conformity with accounting principles generally accepted in the United States of America.
Basis for Opinions
These financial statements are the responsibility of the Funds’ management. Our responsibility is to express an opinion on the Funds’ financial statements based on our audits. We are a public accounting firm registered with the Public Company Accounting Oversight Board (United States) (PCAOB) and are required to be independent with respect to the Funds in accordance with the U.S. federal securities laws and the applicable rules and regulations of the Securities and Exchange Commission and the PCAOB.
We conducted our audits of these financial statements in accordance with the standards of the PCAOB. Those standards require that we plan and perform the audit to obtain reasonable assurance about whether the financial statements are free of material misstatement, whether due to error or fraud.
Our audits included performing procedures to assess the risks of material misstatement of the financial statements, whether due to error or fraud, and performing procedures that respond to those risks. Such procedures included examining, on a test basis, evidence regarding the amounts and disclosures in the financial statements. Our audits also included evaluating the accounting principles used and significant estimates made by management, as well as evaluating the overall presentation of the financial statements. Our procedures included confirmation of securities owned as of June 30, 2020 by correspondence with the custodian, transfer agent, and brokers; when replies were not received from brokers, we performed other auditing procedures. We believe that our audits provide a reasonable basis for our opinions.
PricewaterhouseCoopers LLP
Boston, MA
September 1, 2020
We have served as the auditor of one or more investment companies in the American Beacon family of funds since 2016.
10
American Beacon Shapiro Equity Opportunities FundSM
June 30, 2020
| Shares | Fair Value | ||||||||||||||
| COMMON STOCKS - 99.55% | |||||||||||||||
| Communication Services - 13.20% | |||||||||||||||
| Entertainment - 9.70% | |||||||||||||||
| Lions Gate Entertainment Corp., Class BA | 457,900 | $ | 3,127,457 | ||||||||||||
| Live Nation Entertainment, Inc.A | 13,700 | 607,321 | |||||||||||||
| Walt Disney Co. | 28,050 | 3,127,856 | |||||||||||||
|
| ||||||||||||||
| 6,862,634 | |||||||||||||||
|
| ||||||||||||||
| Media - 3.50% | |||||||||||||||
| ViacomCBS, Inc., Class B | 106,200 | 2,476,584 | |||||||||||||
|
| ||||||||||||||
Total Communication Services | 9,339,218 | ||||||||||||||
|
| ||||||||||||||
| Consumer Discretionary - 16.54% | |||||||||||||||
| Automobiles - 4.33% | |||||||||||||||
| General Motors Co. | 121,000 | 3,061,300 | |||||||||||||
|
| ||||||||||||||
| Hotels, Restaurants & Leisure - 2.39% | |||||||||||||||
| Starbucks Corp. | 23,000 | 1,692,570 | |||||||||||||
|
| ||||||||||||||
| Specialty Retail - 4.26% | |||||||||||||||
| Urban Outfitters, Inc.A | 198,100 | 3,015,082 | |||||||||||||
|
| ||||||||||||||
| Textiles, Apparel & Luxury Goods - 5.56% | |||||||||||||||
| Hanesbrands, Inc.B | 348,400 | 3,933,436 | |||||||||||||
|
| ||||||||||||||
Total Consumer Discretionary | 11,702,388 | ||||||||||||||
|
| ||||||||||||||
| Energy - 3.96% | |||||||||||||||
| Oil, Gas & Consumable Fuels - 3.96% | |||||||||||||||
| Devon Energy Corp. | 132,000 | 1,496,880 | |||||||||||||
| WPX Energy, Inc.A | 204,700 | 1,305,986 | |||||||||||||
|
| ||||||||||||||
| 2,802,866 | |||||||||||||||
|
| ||||||||||||||
Total Energy | 2,802,866 | ||||||||||||||
|
| ||||||||||||||
| Financials - 14.59% | |||||||||||||||
| Banks - 9.49% | |||||||||||||||
| Bank of America Corp. | 133,200 | 3,163,500 | |||||||||||||
| Regions Financial Corp. | 319,900 | 3,557,288 | |||||||||||||
|
| ||||||||||||||
| 6,720,788 | |||||||||||||||
|
| ||||||||||||||
| Diversified Financial Services - 5.10% | |||||||||||||||
| Berkshire Hathaway, Inc., Class BA | 20,210 | 3,607,687 | |||||||||||||
|
| ||||||||||||||
Total Financials | 10,328,475 | ||||||||||||||
|
| ||||||||||||||
| Health Care - 6.20% | |||||||||||||||
| Pharmaceuticals - 6.20% | |||||||||||||||
| Merck & Co., Inc. | 14,800 | 1,144,484 | |||||||||||||
| Pfizer, Inc. | 99,100 | 3,240,570 | |||||||||||||
|
| ||||||||||||||
| 4,385,054 | |||||||||||||||
|
| ||||||||||||||
Total Health Care | 4,385,054 | ||||||||||||||
|
| ||||||||||||||
| Industrials - 9.91% | |||||||||||||||
| Aerospace & Defense - 2.73% | |||||||||||||||
| Maxar Technologies, Inc.A | 107,500 | 1,930,700 | |||||||||||||
|
| ||||||||||||||
See accompanying notes
11
American Beacon Shapiro Equity Opportunities FundSM
Schedule of Investments
June 30, 2020
| Shares | Fair Value | ||||||||||||||
| COMMON STOCKS - 99.55% (continued) | |||||||||||||||
| Industrials - 9.91% (continued) | |||||||||||||||
| Air Freight & Logistics - 5.20% | |||||||||||||||
| FedEx Corp. | 26,270 | $ | 3,683,579 | ||||||||||||
|
| ||||||||||||||
| Machinery - 1.98% | |||||||||||||||
| Westinghouse Air Brake Technologies Corp. | 24,300 | 1,398,951 | |||||||||||||
|
| ||||||||||||||
Total Industrials | 7,013,230 | ||||||||||||||
|
| ||||||||||||||
| Information Technology - 16.57% | |||||||||||||||
| Electronic Equipment, Instruments & Components - 4.39% | |||||||||||||||
| Corning, Inc. | 120,000 | 3,108,000 | |||||||||||||
|
| ||||||||||||||
| Semiconductors & Semiconductor Equipment - 5.47% | |||||||||||||||
| Micron Technology, Inc.A | 75,100 | 3,869,152 | |||||||||||||
|
| ||||||||||||||
| Software - 4.68% | |||||||||||||||
| FireEye, Inc.A | 271,900 | 3,310,382 | |||||||||||||
|
| ||||||||||||||
| Technology Hardware, Storage & Peripherals - 2.03% | |||||||||||||||
| Apple, Inc. | 3,950 | 1,440,960 | |||||||||||||
|
| ||||||||||||||
Total Information Technology | 11,728,494 | ||||||||||||||
|
| ||||||||||||||
| Materials - 18.58% | |||||||||||||||
| Chemicals - 14.31% | |||||||||||||||
| Albemarle Corp. | 40,400 | 3,119,284 | |||||||||||||
| Axalta Coating Systems Ltd.A | 155,200 | 3,499,760 | |||||||||||||
| DuPont de Nemours, Inc. | 66,000 | 3,506,580 | |||||||||||||
|
| ||||||||||||||
| 10,125,624 | |||||||||||||||
|
| ||||||||||||||
| Containers & Packaging - 4.27% | |||||||||||||||
| Graphic Packaging Holding Co. | 216,200 | 3,024,638 | |||||||||||||
|
| ||||||||||||||
Total Materials | 13,150,262 | ||||||||||||||
|
| ||||||||||||||
Total Common Stocks (Cost $88,519,038) | 70,449,987 | ||||||||||||||
|
| ||||||||||||||
| SHORT-TERM INVESTMENTS - 0.40% (Cost $284,009) | |||||||||||||||
| Investment Companies - 0.40% | |||||||||||||||
| American Beacon U.S. Government Money Market Select Fund, Select Class, 0.07%C D | 284,009 | 284,009 | |||||||||||||
|
| ||||||||||||||
TOTAL INVESTMENTS - 99.95% (Cost $88,803,047) | 70,733,996 | ||||||||||||||
OTHER ASSETS, NET OF LIABILITIES - 0.05% | 34,011 | ||||||||||||||
|
| ||||||||||||||
TOTAL NET ASSETS - 100.00% | $ | 70,768,007 | |||||||||||||
|
| ||||||||||||||
| Percentages are stated as a percent of net assets. | |||||||||||||||
A Non-income producing security.
B All or a portion of this security is on loan, collateralized by either cash and/or U.S.Treasuries, at June 30, 2020 (Note 8).
C The Fund is affiliated by having the same investment advisor.
D 7-day yield.
See accompanying notes
12
American Beacon Shapiro Equity Opportunities FundSM
Schedule of Investments
June 30, 2020
The Fund’s investments are summarized by level based on the inputs used to determine their values. As of June 30, 2020, the investments were classified as described below:
Shapiro Equity Opportunities Fund | Level 1 | Level 2 | Level 3 | Total | ||||||||||||||||||||||||
Assets |
| |||||||||||||||||||||||||||
Common Stocks | $ | 70,449,987 | $ | - | $ | - | $ | 70,449,987 | ||||||||||||||||||||
Short-Term Investments | 284,009 | - | - | 284,009 | ||||||||||||||||||||||||
|
|
|
|
|
|
|
| |||||||||||||||||||||
Total Investments in Securities - Assets | $ | 70,733,996 | $ | - | $ | - | $ | 70,733,996 | ||||||||||||||||||||
|
|
|
|
|
|
|
| |||||||||||||||||||||
U.S. GAAP requires transfers between all levels to/from level 3 be disclosed. During the year ended June 30, 2020, there were no transfers into or out of Level 3.
See accompanying notes
13
American Beacon Shapiro SMID Cap Equity FundSM
Schedule of Investments
June 30, 2020
| Shares | Fair Value | ||||||||||||||
| COMMON STOCKS - 99.71% | |||||||||||||||
| Communication Services - 15.70% | |||||||||||||||
| Entertainment - 11.37% | |||||||||||||||
| IMAX Corp.A | 11,700 | $ | 131,157 | ||||||||||||
| Liberty Media Corp-Liberty Braves, Class CA B | 7,800 | 153,972 | |||||||||||||
| Lions Gate Entertainment Corp., Class BA | 38,600 | 263,638 | |||||||||||||
| Live Nation Entertainment, Inc.A | 1,200 | 53,196 | |||||||||||||
|
| ||||||||||||||
| 601,963 | |||||||||||||||
|
| ||||||||||||||
| Media - 4.33% | |||||||||||||||
| AMC Networks, Inc., Class AA C | 9,800 | 229,222 | |||||||||||||
|
| ||||||||||||||
Total Communication Services | 831,185 | ||||||||||||||
|
| ||||||||||||||
| Consumer Discretionary - 15.83% | |||||||||||||||
| Specialty Retail - 4.97% | |||||||||||||||
| Urban Outfitters, Inc.A | 17,300 | 263,306 | |||||||||||||
|
| ||||||||||||||
| Textiles, Apparel & Luxury Goods - 10.86% | |||||||||||||||
| Carter’s, Inc. | 3,400 | 274,380 | |||||||||||||
| Hanesbrands, Inc.C | 26,600 | 300,314 | |||||||||||||
|
| ||||||||||||||
| 574,694 | |||||||||||||||
|
| ||||||||||||||
Total Consumer Discretionary | 838,000 | ||||||||||||||
|
| ||||||||||||||
| Energy - 4.39% | |||||||||||||||
| Oil, Gas & Consumable Fuels - 4.39% | |||||||||||||||
| WPX Energy, Inc.A | 36,400 | 232,232 | |||||||||||||
|
| ||||||||||||||
| Financials - 9.03% | |||||||||||||||
| Banks - 9.03% | |||||||||||||||
| Cadence BanCorp | 23,700 | 209,982 | |||||||||||||
| Regions Financial Corp. | 24,100 | 267,992 | |||||||||||||
|
| ||||||||||||||
| 477,974 | |||||||||||||||
|
| ||||||||||||||
Total Financials | 477,974 | ||||||||||||||
|
| ||||||||||||||
| Health Care - 6.13% | |||||||||||||||
| Health Care Equipment & Supplies - 2.26% | |||||||||||||||
| Varex Imaging Corp.A | 7,900 | 119,685 | |||||||||||||
|
| ||||||||||||||
| Health Care Technology - 3.87% | |||||||||||||||
| Allscripts Healthcare Solutions, Inc.A | 30,300 | 205,131 | |||||||||||||
|
| ||||||||||||||
Total Health Care | 324,816 | ||||||||||||||
|
| ||||||||||||||
| Industrials - 7.03% | |||||||||||||||
| Aerospace & Defense - 5.08% | |||||||||||||||
| BWX Technologies, Inc. | 1,000 | 56,640 | |||||||||||||
| Maxar Technologies, Inc.A | 11,815 | 212,197 | |||||||||||||
|
| ||||||||||||||
| 268,837 | |||||||||||||||
|
| ||||||||||||||
| Machinery - 1.95% | |||||||||||||||
| Westinghouse Air Brake Technologies Corp. | 1,800 | 103,626 | |||||||||||||
|
| ||||||||||||||
Total Industrials | 372,463 | ||||||||||||||
|
| ||||||||||||||
| Information Technology - 19.72% | |||||||||||||||
| Communications Equipment - 2.97% | |||||||||||||||
| Ciena Corp.A | 2,900 | 157,064 | |||||||||||||
|
| ||||||||||||||
See accompanying notes
14
American Beacon Shapiro SMID Cap Equity FundSM
Schedule of Investments
June 30, 2020
| Shares | Fair Value | ||||||||||||||
| COMMON STOCKS - 99.71% (continued) | |||||||||||||||
| Information Technology - 19.72% (continued) | |||||||||||||||
| IT Services - 5.95% | |||||||||||||||
| GreenSky, Inc., Class AA C | 18,800 | $ | 92,120 | ||||||||||||
| Perspecta, Inc. | 9,600 | 223,008 | |||||||||||||
|
| ||||||||||||||
| 315,128 | |||||||||||||||
|
| ||||||||||||||
| Semiconductors & Semiconductor Equipment - 3.23% | |||||||||||||||
| Entegris, Inc. | 2,900 | 171,245 | |||||||||||||
|
| ||||||||||||||
| Software - 7.57% | |||||||||||||||
| ChannelAdvisor Corp.A | 7,700 | 121,968 | |||||||||||||
| FireEye, Inc.A | 22,900 | 278,808 | |||||||||||||
|
| ||||||||||||||
| 400,776 | |||||||||||||||
|
| ||||||||||||||
Total Information Technology | 1,044,213 | ||||||||||||||
|
| ||||||||||||||
| Materials - 21.88% | |||||||||||||||
| Chemicals - 13.32% | |||||||||||||||
| Albemarle Corp. | 3,100 | 239,351 | |||||||||||||
| Axalta Coating Systems Ltd.A | 12,200 | 275,110 | |||||||||||||
| PQ Group Holdings, Inc.A | 14,437 | 191,146 | |||||||||||||
|
| ||||||||||||||
| 705,607 | |||||||||||||||
|
| ||||||||||||||
| Containers & Packaging - 4.60% | |||||||||||||||
| Graphic Packaging Holding Co. | 17,400 | 243,426 | |||||||||||||
|
| ||||||||||||||
| Metals & Mining - 3.96% | |||||||||||||||
| Compass Minerals International, Inc. | 4,300 | 209,625 | |||||||||||||
|
| ||||||||||||||
Total Materials | 1,158,658 | ||||||||||||||
|
| ||||||||||||||
Total Common Stocks (Cost $7,119,451) | 5,279,541 | ||||||||||||||
|
| ||||||||||||||
| SHORT-TERM INVESTMENTS - 1.32% (Cost $69,818) | |||||||||||||||
| Investment Companies - 1.32% | |||||||||||||||
| American Beacon U.S. Government Money Market Select Fund, Select Class, 0.07%D E | 69,818 | 69,818 | |||||||||||||
|
| ||||||||||||||
| SECURITIES LENDING COLLATERAL - 1.43% (Cost $75,500) | |||||||||||||||
| Investment Companies - 1.43% | |||||||||||||||
| American Beacon U.S. Government Money Market Select Fund, Select Class, 0.07%D E | 75,500 | 75,500 | |||||||||||||
|
| ||||||||||||||
TOTAL INVESTMENTS - 102.46% (Cost $7,264,769) | 5,424,859 | ||||||||||||||
LIABILITIES, NET OF OTHER ASSETS - (2.46%) | (130,208 | ) | |||||||||||||
|
| ||||||||||||||
TOTAL NET ASSETS - 100.00% | $ | 5,294,651 | |||||||||||||
|
| ||||||||||||||
| Percentages are stated as a percent of net assets. | |||||||||||||||
A Non-income producing security.
B Tracking Stock - A form of common stock that is issued by a parent company and tracks the performance of a specific division of that parent company. It allows investors the chance to invest in an individual sector of a company while the parent company maintains overall control.
C All or a portion of this security is on loan, collateralized by either cash and/or U.S.Treasuries, at June 30, 2020 (Note 8).
D The Fund is affiliated by having the same investment advisor.
E 7-day yield.
See accompanying notes
15
American Beacon Shapiro SMID Cap Equity FundSM
Schedule of Investments
June 30, 2020
The Fund’s investments are summarized by level based on the inputs used to determine their values. As of June 30, 2020, the investments were classified as described below:
Shapiro SMID Cap Equity Fund | Level 1 | Level 2 | Level 3 | Total | ||||||||||||||||||||||||
Assets | ||||||||||||||||||||||||||||
Common Stocks | $ | 5,279,541 | $ | - | $ | - | $ | 5,279,541 | ||||||||||||||||||||
Short-Term Investments | 69,818 | - | - | 69,818 | ||||||||||||||||||||||||
Securities Lending Collateral | 75,500 | - | - | 75,500 | ||||||||||||||||||||||||
|
|
|
|
|
|
|
| |||||||||||||||||||||
Total Investments in Securities - Assets | $ | 5,424,859 | $ | - | $ | - | $ | 5,424,859 | ||||||||||||||||||||
|
|
|
|
|
|
|
| |||||||||||||||||||||
U.S. GAAP requires transfers between all levels to/from level 3 be disclosed. During the year ended June 30, 2020, there were no transfers into or out of Level 3.
See accompanying notes
16
Statements of Assets and Liabilities
June 30, 2020
| Shapiro Equity Opportunities Fund | Shapiro SMID Cap Equity Fund | |||||||||||
Assets: |
| |||||||||||
Investments in unaffiliated securities, at fair value†§ | $ | 70,449,987 | $ | 5,279,541 | ||||||||
Investments in affiliated securities, at fair value‡ | 284,009 | 145,318 | ||||||||||
Dividends and interest receivable | 132,980 | 6,679 | ||||||||||
Receivable for expense reimbursement (Note 2) | 10,359 | 7,417 | ||||||||||
Prepaid expenses | 10,236 | 9,401 | ||||||||||
|
|
|
| |||||||||
Total assets | 70,887,571 | 5,448,356 | ||||||||||
|
|
|
| |||||||||
Liabilities: |
| |||||||||||
Payable for investments purchased | – | 20,846 | ||||||||||
Management and sub-advisory fees payable (Note 2) | 42,114 | 3,422 | ||||||||||
Service fees payable (Note 2) | – | 237 | ||||||||||
Transfer agent fees payable (Note 2) | 3,038 | 231 | ||||||||||
Payable upon return of securities loaned (Note 8)§ | – | 75,500 | ||||||||||
Custody and fund accounting fees payable | 9,036 | 7,836 | ||||||||||
Professional fees payable | 46,750 | 40,647 | ||||||||||
Trustee fees payable (Note 2) | 9 | - | ||||||||||
Payable for prospectus and shareholder reports | 16,139 | 4,384 | ||||||||||
Other liabilities | 2,478 | 602 | ||||||||||
|
|
|
| |||||||||
Total liabilities | 119,564 | 153,705 | ||||||||||
|
|
|
| |||||||||
Net assets | $ | 70,768,007 | $ | 5,294,651 | ||||||||
|
|
|
| |||||||||
Analysis of net assets: |
| |||||||||||
Paid-in-capital | $ | 87,902,012 | $ | 7,066,673 | ||||||||
Total distributable earnings (deficits)A | (17,134,005 | ) | (1,772,022 | ) | ||||||||
|
|
|
| |||||||||
Net assets | $ | 70,768,007 | $ | 5,294,651 | ||||||||
|
|
|
| |||||||||
Shares outstanding at no par value (unlimited shares authorized): |
| |||||||||||
R5 ClassB | 4,257,343 | 561,183 | ||||||||||
|
|
|
| |||||||||
Y Class | 3,207,318 | 13,765 | ||||||||||
|
|
|
| |||||||||
Investor Class | 34,298 | 121,332 | ||||||||||
|
|
|
| |||||||||
Net assets: |
| |||||||||||
R5 ClassB | $ | 40,207,550 | $ | 4,276,389 | ||||||||
|
|
|
| |||||||||
Y Class | $ | 30,239,629 | $ | 104,553 | ||||||||
|
|
|
| |||||||||
Investor Class | $ | 320,828 | $ | 913,709 | ||||||||
|
|
|
| |||||||||
Net asset value, offering and redemption price per share: |
| |||||||||||
R5 ClassB | $ | 9.44 | $ | 7.62 | ||||||||
|
|
|
| |||||||||
Y Class | $ | 9.43 | $ | 7.60 | ||||||||
|
|
|
| |||||||||
Investor Class | $ | 9.35 | $ | 7.53 | ||||||||
|
|
|
| |||||||||
† Cost of investments in unaffiliated securities | $ | 88,519,038 | $ | 7,119,451 | ||||||||
‡ Cost of investments in affiliated securities | $ | 284,009 | $ | 145,318 | ||||||||
§ Fair value of securities on loan | $ | 3,723,024 | $ | 429,458 | ||||||||
A The Fund’s investments in affiliated securities did not have unrealized appreciation (depreciation) at year end. |
| |||||||||||
B Formerly known as Institutional Class. |
| |||||||||||
See accompanying notes
17
American Beacon FundsSM
Statements of Operations
For the year ended June 30, 2020
| Shapiro Equity Opportunities Fund | Shapiro SMID Cap Equity Fund | |||||||||||
Investment income: |
| |||||||||||
Dividend income from unaffiliated securities | $ | 1,677,296 | $ | 78,301 | ||||||||
Dividend income from affiliated securities (Note 2) | 29,417 | 2,103 | ||||||||||
Income derived from securities lending (Note 8) | 8,981 | 4,750 | ||||||||||
|
|
|
| |||||||||
Total investment income | 1,715,694 | 85,154 | ||||||||||
|
|
|
| |||||||||
Expenses: |
| |||||||||||
Management and sub-advisory fees (Note 2) | 578,720 | 46,872 | ||||||||||
Transfer agent fees: | ||||||||||||
R5 Class (Note 2)A | 1,704 | 1,350 | ||||||||||
Y Class (Note 2) | 40,128 | 386 | ||||||||||
Investor Class | 1,464 | 1,450 | ||||||||||
Custody and fund accounting fees | 51,941 | 44,514 | ||||||||||
Professional fees | 72,297 | 45,942 | ||||||||||
Registration fees and expenses | 47,511 | 46,513 | ||||||||||
Service fees (Note 2): | ||||||||||||
Investor Class | – | 1,621 | ||||||||||
Prospectus and shareholder report expenses | 30,892 | 8,352 | ||||||||||
Trustee fees (Note 2) | 6,656 | 502 | ||||||||||
Other expenses | 15,371 | 8,144 | ||||||||||
|
|
|
| |||||||||
Total expenses | 846,684 | 205,646 | ||||||||||
|
|
|
| |||||||||
Net fees waived and expenses (reimbursed) (Note 2)B | (159,343 | ) | (145,927 | ) | ||||||||
|
|
|
| |||||||||
Net expenses | 687,341 | 59,719 | ||||||||||
|
|
|
| |||||||||
Net investment income | 1,028,353 | 25,435 | ||||||||||
|
|
|
| |||||||||
Realized and unrealized gain (loss) from investments: |
| |||||||||||
Net realized gain from: | ||||||||||||
Investments in unaffiliated securitiesC | 2,480,388 | 199,585 | ||||||||||
Commission recapture (Note 1) | 43,403 | 3,666 | ||||||||||
Change in net unrealized (depreciation) of: | ||||||||||||
Investments in unaffiliated securitiesD | (16,277,785 | ) | (1,282,195 | ) | ||||||||
|
|
|
| |||||||||
Net (loss) from investments | (13,753,994 | ) | (1,078,944 | ) | ||||||||
|
|
|
| |||||||||
Net (decrease) in net assets resulting from operations | $ | (12,725,641 | ) | $ | (1,053,509 | ) | ||||||
|
|
|
| |||||||||
A Formerly known as Institutional Class. |
| |||||||||||
B The Manager voluntarily reimbursed service fees in the amount of $583 for Shapiro Equity Opportunities Fund. |
| |||||||||||
C The Fund did not recognize net realized gains (losses) from the sale of investments in affiliated securities. |
| |||||||||||
D The Fund’s investments in affiliated securities did not have a change in unrealized appreciation (depreciation) at year end. |
| |||||||||||
See accompanying notes
18
American Beacon FundsSM
Statements of Changes in Net Assets
| Shapiro Equity Opportunities Fund | Shapiro SMID Cap Equity Fund | |||||||||||||||||||||||||||
| Year Ended June 30, 2020 | Year Ended June 30, 2019 | Year Ended June 30, 2020 | Year Ended June 30, 2019 | |||||||||||||||||||||||||
Increase (decrease) in net assets: |
| |||||||||||||||||||||||||||
Operations: |
| |||||||||||||||||||||||||||
Net investment income | $ | 1,028,353 | $ | 761,339 | $ | 25,435 | $ | 27,014 | ||||||||||||||||||||
Net realized gain from investments in unaffiliated securities and commission recapture | 2,523,791 | 3,253,924 | 203,251 | 554,602 | ||||||||||||||||||||||||
Change in net unrealized (depreciation) of investments in unaffiliated securities | (16,277,785 | ) | (2,329,134 | ) | (1,282,195 | ) | (936,368 | ) | ||||||||||||||||||||
|
|
|
|
|
|
|
| |||||||||||||||||||||
Net increase (decrease) in net assets resulting from operations | (12,725,641 | ) | 1,686,129 | (1,053,509 | ) | (354,752 | ) | |||||||||||||||||||||
|
|
|
|
|
|
|
| |||||||||||||||||||||
Distributions to shareholders: |
| |||||||||||||||||||||||||||
Total retained earnings: | ||||||||||||||||||||||||||||
R5 ClassA | (2,950,289 | ) | (1,211,245 | ) | (370,701 | ) | (391,569 | ) | ||||||||||||||||||||
Y Class | (1,902,194 | ) | (707,549 | ) | (24,212 | ) | (14,218 | ) | ||||||||||||||||||||
Investor Class | (35,837 | ) | (12,800 | ) | (82,175 | ) | (47,151 | ) | ||||||||||||||||||||
|
|
|
|
|
|
|
| |||||||||||||||||||||
Net distributions to shareholders | (4,888,320 | ) | (1,931,594 | ) | (477,088 | ) | (452,938 | ) | ||||||||||||||||||||
|
|
|
|
|
|
|
| |||||||||||||||||||||
Capital share transactions (Note 10): |
| |||||||||||||||||||||||||||
Proceeds from sales of shares | 5,448,119 | 25,831,453 | 92,937 | 1,989,470 | ||||||||||||||||||||||||
Reinvestment of dividends and distributions | 4,873,847 | 1,931,594 | 237,804 | 452,938 | ||||||||||||||||||||||||
Cost of shares redeemed | (11,099,690 | ) | (8,754,700 | ) | (316,417 | ) | (517,419 | ) | ||||||||||||||||||||
|
|
|
|
|
|
|
| |||||||||||||||||||||
Net increase (decrease) in net assets from capital share transactions | (777,724 | ) | 19,008,347 | 14,324 | 1,924,989 | |||||||||||||||||||||||
|
|
|
|
|
|
|
| |||||||||||||||||||||
Net increase (decrease) in net assets | (18,391,685 | ) | 18,762,882 | (1,516,273 | ) | 1,117,299 | ||||||||||||||||||||||
|
|
|
|
|
|
|
| |||||||||||||||||||||
Net assets: |
| |||||||||||||||||||||||||||
Beginning of period | 89,159,692 | 70,396,810 | 6,810,924 | 5,693,625 | ||||||||||||||||||||||||
|
|
|
|
|
|
|
| |||||||||||||||||||||
End of period | $ | 70,768,007 | $ | 89,159,692 | $ | 5,294,651 | $ | 6,810,924 | ||||||||||||||||||||
|
|
|
|
|
|
|
| |||||||||||||||||||||
A Formerly known as Institutional Class. |
| |||||||||||||||||||||||||||
See accompanying notes
19
Notes to Financial Statements
June 30, 2020
1. Organization and Significant Accounting Policies
American Beacon Funds (the “Trust”) is organized as a Massachusetts business trust. The Funds, each a series within the Trust, are registered under the Investment Company Act of 1940, as amended (the “Act”), as non-diversified, open-end management investment companies. As of June 30, 2020, the Trust consists of twenty-seven active series, two of which are presented in this filing: American Beacon Shapiro Equity Opportunities Fund and American Beacon Shapiro SMID Cap Equity Fund (collectively, the “Funds” and each individually a “Fund”). The remaining twenty-five active series are reported in separate filings.
American Beacon Advisors, Inc. (the “Manager”) is a Delaware corporation and a wholly-owned subsidiary of Resolute Investment Managers, Inc. (“RIM”) organized in 1986 to provide business management, advisory, administrative, and asset management consulting services to the Trust and other investors. The Manager is registered as an investment advisor under the Investment Advisers Act of 1940, as amended (the “Advisers Act”). RIM is, in turn, a wholly-owned subsidiary of Resolute Acquisition, Inc., which is a wholly-owned subsidiary of Resolute Topco, Inc., a wholly-owned subsidiary of Resolute Investment Holdings, LLC (“RIH”). RIH is owned primarily by Kelso Investment Associates VIII, L.P., KEP VI, LLC and Estancia Capital Partners L.P., investment funds affiliated with Kelso & Company, L.P. (“Kelso”) or Estancia Capital Management, LLC (“Estancia”), which are private equity firms.
Recently Adopted Accounting Pronouncements
In August 2018, the Financial Accounting Standards Board (“FASB”) issued Accounting Standards Update (“ASU”) 2018-13, Fair Value Measurement (“Topic 820”). The amendments in the ASU impact disclosure requirements for fair value measurement. It is anticipated that this change will enhance the effectiveness of disclosures in the notes to the financial statements. This ASU is effective for fiscal years beginning after December 15, 2019. Early adoption is permitted and can include the entire standard or certain provisions that exclude or amend disclosures. For the year ended June 30, 2020, the Funds have chosen to adopt the standard. The adoption of this ASU guidance did not have a material impact on the financial statements and other disclosures.
In March 2020, the FASB issued ASU 2020-04, which provides optional expedients and exceptions for contracts, hedging relationships and other transactions affected by the transitioning away from the London Interbank Offered Rate (LIBOR) and other reference rates that are expected to be discontinued. The ASU is effective immediately upon release of the update on March 12, 2020 through December 31, 2022. At this time, management is evaluating the implications of these changes on the financial statements.
Class Disclosure
Effective February 28, 2020, the name of the Institutional Class changed to R5 Class.
Each Fund has multiple classes of shares designed to meet the needs of different groups of investors; however, not all of the Funds offer all classes. The following table sets forth the differences amongst the classes:
Class | Eligible Investors | Minimum Initial Investments | ||||
| R5 Class | Large institutional investors - sold directly through intermediary channels. | $ | 250,000 | |||
| Y Class | Large institutional retirement plan investors - sold directly or through intermediary channels. | $ | 100,000 | |||
| Investor Class | All investors using intermediary organizations, such as broker-dealers or retirement plan sponsors. | $ | 2,500 | |||
Each class offered by the Trust has equal rights as to assets and voting privileges. Income and non-class specific expenses are allocated daily to each class based on the relative net assets. Realized and unrealized capital gains and losses of each class are allocated daily based on the relative net assets of each class of the respective Fund. Class specific expenses, where applicable, currently include service, distribution, transfer agent fees, and sub-transfer agent fees that vary amongst the classes as described more fully in Note 2.
20
American Beacon FundsSM
Notes to Financial Statements
June 30, 2020
Significant Accounting Policies
The following is a summary of significant accounting policies, consistently followed by the Funds in preparation of the financial statements. The Funds are considered investment companies and accordingly, follow the investment company accounting and reporting guidance of the FASB Accounting Standards Codification Topic 946, Financial Services – Investment Companies, a part of Generally Accepted Accounting Principles (“U.S. GAAP”).
Security Transactions and Investment Income
Security transactions are recorded as of the trade date for financial reporting purposes. Securities purchased or sold on a when-issued or delayed-delivery basis may be settled beyond a standard settlement period for the security after the trade date.
Dividend income, net of foreign taxes, is recorded on the ex-dividend date, except certain dividends from foreign securities which are recorded as soon as the information is available to the Funds. Interest income, net of foreign taxes, is earned from settlement date, recorded on the accrual basis, and adjusted, if necessary, for accretion of discounts and amortization of premiums. Realized gains (losses) from securities sold are determined based on specific lot identification.
Currency Translation
All assets and liabilities initially expressed in foreign currency values are converted into U.S. dollar values at the mean of the bid and ask prices of such currencies against U.S. dollars as last quoted by a recognized dealer. Income, expenses, and purchases and sales of investments are translated into U.S. dollars at the rate of the exchange prevailing on the respective dates of such transactions. The effect of changes in foreign currency exchange rates on investments is separately identified from the fluctuations arising from changes in market values of securities held and is reported with all other foreign currency gains and losses on the Funds’ Statements of Operations.
Distributions to Shareholders
The Funds distribute most or all of its net earnings and realized gains, if any, each taxable year in the form of dividends from net investment income and distributions of realized net capital gains and net gains from foreign currency transactions on an annual basis. The Funds do not have a fixed dividend rate and do not guarantee that it will pay any distributions in any particular period. Dividends to shareholders are determined in accordance with federal income tax regulations, which may differ in amount and character from net investment income and realized gains recognized for purposes of U.S. GAAP. To the extent necessary to fully distribute capital gains, the Funds may designate earnings and profits distributed to shareholders on the redemption of shares.
Commission Recapture
The Funds have established brokerage commission recapture arrangements with certain brokers or dealers. If the Funds’ investment advisor chooses to execute a transaction through a participating broker, the broker rebates a portion of the commission back to the Funds. Any collateral benefit received through participation in the commission recapture program is directed exclusively to the Funds. This amount is reported with the net realized gain (loss) in the Funds’ Statements of Operations, if applicable.
Allocation of Income, Trust Expenses, Gains, and Losses
Investment income, realized and unrealized gains and losses from investments of the Funds are allocated daily to each class of shares based upon the relative proportion of net assets of each class to the total net assets of the Funds. Expenses directly charged or attributable to the Fund will be paid from the assets of the Fund.
21
American Beacon FundsSM
Notes to Financial Statements
June 30, 2020
Generally, expenses of the Trust will be allocated among and charged to the assets of the Funds on a basis that the Trust’s Board of Trustees (the “Board”) deems fair and equitable, which may be based on the relative net assets of the Funds or nature of the services performed and relative applicability to the Funds.
Use of Estimates
The preparation of financial statements in conformity with U.S. GAAP requires management to make estimates and assumptions that affect the amounts reported in the financial statements and accompanying notes. Actual results may differ from those estimated.
Other
Under the Trust’s organizational documents, its officers and trustees are indemnified against certain liabilities arising out of the performance of their duties to the Trust. In the normal course of business, the Trust enters into contracts that provide indemnification to the other party or parties against potential costs or liabilities. The Trust’s maximum exposure under these arrangements is dependent on claims that may be made in the future and, therefore, cannot be estimated. The Trust has had no prior claims or losses pursuant to any such agreement.
2. Transactions with Affiliates
Management and Investment Sub-Advisory Agreements
The Funds and the Manager are parties to a Management Agreement that obligates the Manager to provide the Funds with investment advisory and administrative services. As compensation for performing the duties under the Management Agreement, the Manager will receive an annualized management fee based on a percentage of each Fund’s average daily net assets that is calculated and accrued daily according to the following schedule:
First $5 billion | 0.35 | % | ||
Next $5 billion | 0.325 | % | ||
Next $10 billion | 0.30 | % | ||
Over $20 billion | 0.275 | % |
The Trust, on behalf of the Funds, and the Manager have entered into an Investment Advisory Agreement with Shapiro Capital Management LLC (“Shapiro”), an affiliate of the Manager pursuant to which each Fund has agreed to pay Shapiro an annualized sub-advisory fee that is calculated and accrued daily based on the Funds’ average daily net assets according to the following schedule:
Shapiro Equity Opportunities Fund
First $250 million | 0.35 | % | ||
Next $250 million | 0.30 | % | ||
Over $500 million | 0.25 | % |
Shapiro SMID Cap Equity Fund
First $250 million | 0.40 | % | ||
Next $250 million | 0.35 | % | ||
Over $500 million | 0.30 | % |
22
American Beacon FundsSM
Notes to Financial Statements
June 30, 2020
The Management and Sub-Advisory Fees paid by the Funds for the year ended June 30, 2020 were as follows:
Shapiro Equity Opportunities Fund
| Effective Fee Rate | Amount of Fees Paid | |||||||||||
Management Fees | 0.35 | % | $ | 289,679 | ||||||||
Sub-Advisor Fees | 0.35 | % | 289,041 | |||||||||
|
|
|
| |||||||||
Total | 0.70 | % | $ | 578,720 | ||||||||
|
|
|
| |||||||||
Shapiro SMID Cap Equity Fund
| Effective Fee Rate | Amount of Fees Paid | |||||||||||
Management Fees | 0.35 | % | $ | 22,128 | ||||||||
Sub-Advisor Fees | 0.40 | % | 24,744 | |||||||||
|
|
|
| |||||||||
Total | 0.75 | % | $ | 46,872 | ||||||||
|
|
|
| |||||||||
As compensation for services provided by the Manager in connection with securities lending activities conducted by the Funds, the lending Fund pays to the Manager, with respect to cash collateral posted by borrowers, a fee of 10% of the net monthly interest income (the gross interest income earned by the investment of cash collateral, less the amount paid to borrowers and related expenses) from such activities and, with respect to loan fees paid by borrowers, a fee of 10% of such loan fees. Securities lending income is generated from the demand premium (if any) paid by the borrower to borrow a specific security and from the return on investment of cash collateral, reduced by negotiated rebate fees paid to the borrower and transaction costs. To the extent that a loan is secured by non-cash collateral, securities lending income is generated as a demand premium reduced by transaction costs. These fees are included in “Income derived from securities lending” and “Management and investment advisory fees” on the Statements of Operations. During the year ended June 30, 2020, the Manager received securities lending fees of $962 and $468 for the securities lending activities of the Shapiro Equity Opportunities Fund and Shapiro SMID Cap Equity Fund, respectively.
Service Plans
The Manager and the Trust entered into Service Plans that obligate the Manager to oversee additional shareholder servicing of the Investor Class of the Funds. As compensation for performing the duties required under the Service Plans, the Manager receives an annualized fee up to 0.375% of the average daily net assets attributable to the Investor Class of the Funds.
Sub-Transfer Agent Fees
The Manager has entered into agreements, which include servicing agreements, with financial intermediaries that provide recordkeeping, processing, shareholder communications and other services to customers of the intermediaries that hold positions in the R5 and Y Classes of the Funds and has agreed to compensate the intermediaries for providing these services. Intermediaries transact with the Funds primarily through the use of omnibus accounts on behalf of their customers who hold positions in the Funds. Certain services would have been provided by the Funds’ transfer agent and other service providers if the shareholders’ accounts were maintained directly by the Funds’ transfer agent. Accordingly, the Funds, pursuant to Board approval, have agreed to reimburse the Manager for certain non-distribution shareholder services provided by financial intermediaries for the R5 and Y Classes. The reimbursement amounts (sub-transfer agent fees) paid to the Manager are subject to a fee limit of up to 0.10% of an intermediary’s average net assets in the R5 and Y Classes on an annual basis. During the year ended June 30, 2020, the sub-transfer agent fees, as reflected in “Transfer agent fees” on the Statements of Operations, were as follows:
Fund | Sub-Transfer Agent Fees | |||
Shapiro Equity Opportunities | $ | 38,245 | ||
Shapiro SMID Cap Equity | 1,500 | |||
23
American Beacon FundsSM
Notes to Financial Statements
June 30, 2020
As of June 30, 2020, the Funds owed the Manager the following reimbursement of sub-transfer agent fees, as reflected in “Transfer agent fees payable” on the Statements of Assets and Liabilities:
Fund | Reimbursement Sub-Transfer Agent Fees | |||
Shapiro Equity Opportunities | $ | 2,174 | ||
Shapiro SMID Cap Equity | 28 | * | ||
* This balance is presented as a contra liability as of June 30, 2020.
Investments in Affiliated Funds
The Funds may invest in the American Beacon U.S. Government Money Market Select Fund (the “USG Select Fund”). Cash collateral received by the Funds in connection with securities lending may also be invested in the USG Select Fund. The Funds listed below held the following shares with a June 30, 2020 fair value and dividend income earned from the investment in the USG Select Fund:
Affiliated Security | Type of Transaction | Fund | June 30, 2020 Shares/Principal | Change in Unrealized Gain (Loss) | Realized Gain (Loss) | Dividend Income | June 30, 2020 Fair Value | ||||||||||||||||||||||||||||||||||||||||||||||||||||||||||
| U.S. Government Money Market Select | Direct | Shapiro Equity Opportunities | $ | 284,009 | $ | - | $ | - | $ | 29,417 | $ | 284,009 | |||||||||||||||||||||||||||||||||||||||||||||||||||||
| U.S. Government Money Market Select | Direct | Shapiro SMID Cap Equity | 69,818 | - | - | 2,103 | 69,818 | ||||||||||||||||||||||||||||||||||||||||||||||||||||||||||
| U.S. Government Money Market Select | Securities Lending | Shapiro SMID Cap Equity | 75,500 | - | - | - | 75,500 | ||||||||||||||||||||||||||||||||||||||||||||||||||||||||||
The Funds and the USG Select Fund have the same investment advisor and therefore, are considered to be affiliated. The Manager serves as investment advisor to the USG Select Fund and receives management fees and administrative fees totaling 0.10% of the average daily net assets of the USG Select Fund. During the year ended June 30, 2020, the Manager earned fees on the Funds’ direct investments and securities lending collateral investments in the USG Select Fund as shown below:
Fund | Direct Investments in USG Select Fund | Securities Lending Collateral Investments in USG Select Fund | Total | |||||||||
Shapiro Equity Opportunities | $ | 1,937 | $ | 502 | $ | 2,439 | ||||||
Shapiro SMID Cap Equity | 150 | 161 | 311 | |||||||||
Interfund Credit Facility
Pursuant to an exemptive order issued by the U.S. Securities and Exchange Commission (“SEC”), the Funds, along with other registered investment companies having management contracts with the Manager, may participate in a credit facility whereby each fund, under certain conditions, is permitted to lend money directly to and borrow directly from other participating funds for temporary purposes. The interfund credit facility is advantageous to the funds because it provides added liquidity and eliminates the need to maintain higher cash balances to meet redemptions. This situation could arise when shareholder redemptions exceed anticipated volumes and certain funds have insufficient cash on hand to satisfy such redemptions or when sales of securities do not settle as expected, resulting in a cash shortfall for a fund. When a fund liquidates portfolio securities to meet redemption requests, they often do not receive payment in settlement for up to two days (or longer for certain foreign transactions). Redemption requests normally are satisfied on the next business day. The credit facility provides a source of immediate, short-term liquidity pending settlement of the sale of portfolio securities. The credit facility is administered by a credit facility team consisting of professionals from the Manager’s asset
24
American Beacon FundsSM
Notes to Financial Statements
June 30, 2020
management, compliance, and accounting areas who report the activities of the credit facility to the Board. During the year ended June 30, 2020, the Shapiro Equity Opportunities Fund borrowed on average $2,702,305 for 5 days at an average interest rate of 1.36% with interest charges of $349 and the Shapiro SMID Cap Equity Fund borrowed on average $32,381 for 5 days at an average interest rate of 1.78% with interest charges of $8. These amounts are recorded as “Other expenses” in the Statements of Operations.
Expense Reimbursement Plan
The Manager contractually agreed to reduce fees and/or reimburse expenses for the classes of the Funds to the extent that total operating expenses exceed the Funds’ expense cap. During the year ended June 30, 2020, the Manager waived and/or reimbursed expenses as follows:
| Expense Cap | ||||||||||||||||||
Fund | Class | 7/1/2019 - 6/30/2020 | Reimbursed Expenses | (Recouped) Expenses | Expiration of Reimbursed Expenses | |||||||||||||
Shapiro Equity Opportunities | R5* | 0.79 | % | $ | 88,743 | $ | – | 2022-2023 | ||||||||||
Shapiro Equity Opportunities | Y | 0.89 | % | 64,957 | – | 2022-2023 | ||||||||||||
Shapiro Equity Opportunities | Investor | 1.17 | % | 5,060 | (5,287 | )** | 2022-2023 | |||||||||||
Shapiro SMID Cap Equity | R5* | 0.89 | % | 112,171 | – | 2022-2023 | ||||||||||||
Shapiro SMID Cap Equity | Y | 0.99 | % | 6,781 | – | 2022-2023 | ||||||||||||
Shapiro SMID Cap Equity | Investor | 1.27 | % | 26,975 | (3,928 | )** | 2022-2023 | |||||||||||
* Formerly Institutional Class
** These amounts represent Recouped Expenses from prior fiscal years and are reflected in Total Expenses on the Statement of Operations.
Of these amounts, $10,359 and $7,417 were disclosed as a receivable from the Manager on the Statements of Assets and Liabilities at June 30, 2020 for the Shapiro Equity Opportunities Fund and Shapiro SMID Cap Equity Fund, respectively.
The Funds have adopted an Expense Reimbursement Plan whereby the Manager may seek repayment of such fee or voluntary reductions and expense reimbursements. Under the policy, the Manager can be reimbursed by the Funds for any contractual or voluntary fee reductions or expense reimbursements if reimbursement to the Manager (a) occurs within three years from the date of the Manager’s waiver/reimbursement and (b) does not cause the Funds’ annual operating expenses to exceed the lesser of the contractual percentage limit in effect at the time of the waiver/reimbursement or time of recoupment. The reimbursed expenses listed above will expire in 2022 and 2023. The Funds did not record a liability for potential reimbursements due to the current assessment that reimbursements are uncertain. The carryover of excess expenses potentially reimbursable to the Manager, but not recorded as a liability are as follows:
Fund | Recouped Expenses | Excess Expense Carryover | Expired Expense Carryover | Expiration of Reimbursed Expenses | ||||||||||||
Shapiro Equity Opportunities | $ | 4,794 | $ | 119,182 | $ | - | 2020-2021 | |||||||||
Shapiro Equity Opportunities | 493 | 146,388 | - | 2021-2022 | ||||||||||||
Shapiro SMID Cap Equity | 3,928 | 119,042 | - | 2020-2021 | ||||||||||||
Shapiro SMID Cap Equity | - | 127,374 | - | 2021-2022 | ||||||||||||
Concentration of Ownership
From time to time, the Funds may have a concentration of one or more accounts constituting a significant percentage of shares outstanding. Investment activities by holders of accounts that represent a significant ownership of more than 5% of the Funds’ outstanding shares could have a material impact on the Funds. As of June 30, 2020, based on management’s evaluation of the shareholder account base, two accounts have been identified as representing an unaffiliated significant ownership of approximately 51% for the Shapiro Equity Opportunities Fund and one account has been identified as representing an affiliated significant ownership of approximately 44% for and the Shapiro SMID Cap Equity Fund.
25
American Beacon FundsSM
Notes to Financial Statements
June 30, 2020
Trustee Fees and Expenses
Effective January 1, 2020, as compensation for their service to the American Beacon Funds Complex, including the Trust (collectively, the “Trusts”), each Trustee is compensated from the Trusts as follows: (1) an annual retainer of $120,000; (2) meeting attendance fee (for attendance in person or via teleconference) of (a) $12,000 for in person attendance, or $5,000 for telephonic attendance, by Board members for each regularly scheduled or special Board meeting, (b) $2,500 for attendance by Committee members at meetings of the Audit Committee and the Investment Committee, (c) $1,500 for attendance by Committee members at meetings of the Nominating and Governance Committee; and (d) $2,500 for attendance by Board members for each special telephonic Board meeting; and (3) reimbursement of reasonable expenses incurred in attending Board meetings, Committee meetings, and relevant educational seminars. The Trustees also may be compensated for attendance at special Board and/or Committee meetings from time to time. For her service as Board Chair, Ms. Cline receives an additional annual retainer of $50,000. Although she attends several committee meetings at each quarterly Board meeting, she receives only a single $2,500 fee each quarter for her attendance at those meetings. The chairpersons of the Audit Committee and the Investment Committee each receive an additional annual retainer of $25,000 and the Chair of the Nominating and Governance Committee receives an additional annual retainer of $15,000.
3. Security Valuation and Fair Value Measurements
The price of the Fund’s shares is based on its net asset value (“NAV”) per share. The Fund’s NAV is computed by adding total assets, subtracting all the Fund’s liabilities, and dividing the result by the total number of shares outstanding.
The NAV of each class of the Fund’s shares is determined based on a pro rata allocation of the Fund’s investment income, expenses and total capital gains and losses. The Fund’s NAV per share is determined each business day as of the regular close of trading on the New York Stock Exchange (“NYSE” or “Exchange”), which is typically 4:00 p.m. Eastern Time (“ET”). However, if trading on the NYSE closes at a time other than 4:00 p.m. ET, the Fund’s NAV per share typically would still be determined as of the regular close of trading on the NYSE. The Fund does not price its shares on days that the NYSE is closed. Foreign exchanges may permit trading in foreign securities on days when the Fund is not open for business, which may result in the value of the Fund’s portfolio investments being affected at a time when you are unable to buy or sell shares.
Equity securities, including shares of closed-end funds and exchange-traded funds (“ETFs”), are valued at the last sale price or official closing price taken from the primary exchange in which each security trades. Investments in other mutual funds are valued at the closing NAV per share on the day of valuation. Debt securities are valued at bid quotes from broker/dealers or evaluated bid prices from pricing services, who may consider a number of inputs and factors, such as prices of comparable securities, yield curves, spreads, credit ratings, coupon rates, maturity, default rates, and underlying collateral. Futures are valued based on their daily settlement prices. Exchange-traded and over-the-counter (“OTC”) options are valued at the last sale price. Options with no last sale for the day are priced at mid quote. Swaps are valued at evaluated mid prices from pricing services.
The valuation of securities traded on foreign markets and certain fixed-income securities will generally be based on prices determined as of the earlier closing time of the markets on which they primarily trade unless a significant event has occurred. When the Fund holds securities or other assets that are denominated in a foreign currency, the Fund will normally use the currency exchange rates as of 4:00 p.m. ET.
Securities may be valued at fair value, as determined in good faith and pursuant to procedures approved by the Board, under certain limited circumstances. For example, fair value pricing will be used when market quotations are not readily available or reliable, as determined by the Manager, such as when (i) trading for a security is restricted or stopped; (ii) a security’s trading market is closed (other than customary closings); or (iii) a security has been de-listed from a national exchange. A security with limited market liquidity may require fair value pricing if the Manager determines that the available price does not reflect the security’s true market value.
26
American Beacon FundsSM
Notes to Financial Statements
June 30, 2020
In addition, if a significant event that the Manager determines to affect the value of one or more securities held by the Fund occurs after the close of a related exchange but before the determination of the Fund’s NAV, fair value pricing may be used on the affected security or securities. Securities of small-capitalization companies are also more likely to require a fair value determination using these procedures because they are more thinly traded and less liquid than the securities of larger-capitalization companies. The Fund may fair value securities as a result of significant events occurring after the close of the foreign markets in which the Fund invests as described below. In addition, the Fund may invest in illiquid securities requiring these procedures.
The Fund may use fair value pricing for securities primarily traded in non-U.S. markets because most foreign markets close well before the Fund’s pricing time of 4:00 p.m. ET. The earlier close of these foreign markets gives rise to the possibility that significant events, including broad market moves, may have occurred in the interim and may materially affect the value of those securities. If the Manager determines that the last quoted prices of non-U.S. securities will, in its judgment, materially affect the value of some or all its portfolio securities, the Manager can adjust the previous closing prices to reflect what it believes to be the fair value of the securities as of the close of the Exchange. In deciding whether it is necessary to adjust closing prices to reflect fair value, the Manager reviews a variety of factors, including developments in foreign markets, the performance of U.S. securities markets, and the performance of instruments trading in U.S. markets that represent foreign securities and baskets of foreign securities. These securities are fair valued using a pricing service, using methods approved by the Board, that considers the correlation of the trading patterns of the foreign security to intraday trading in the U.S. markets, based on indices of domestic securities and other appropriate indicators such as prices of relevant American Depositary Receipts (“ADRs”) and futures contracts. The Valuation Committee, established by the Board, may also fair value securities in other situations, such as when a particular foreign market is closed but the Fund is open. The Fund uses outside pricing services to provide closing prices and information to evaluate and/or adjust those prices. As a means of evaluating its security valuation process, the Valuation Committee routinely compares closing prices, the next day’s opening prices in the same markets and adjusted prices.
Attempts to determine the fair value of securities introduce an element of subjectivity to the pricing of securities. As a result, the price of a security determined through fair valuation techniques may differ from the price quoted or published by other sources and may not accurately reflect the market value of the security when trading resumes. If a reliable market quotation becomes available for a security formerly valued through fair valuation techniques, the Manager compares the new market quotation to the fair value price to evaluate the effectiveness of the Fund’s fair valuation procedures. If any significant discrepancies are found, the Manager may adjust the Fund’s fair valuation procedures.
Valuation Inputs
Various inputs may be used to determine the fair value of the Funds’ investments. These inputs are summarized in three broad levels for financial statement purposes. The inputs or methodologies used to value securities are not necessarily an indication of the risk associated with investing in those securities.
| Level 1 | - | Quoted prices in active markets for identical securities. | ||
| Level 2 | - | Prices determined using other significant observable inputs. These may include quoted prices for similar securities, interest rates, prepayment speeds, credit risk, and others. | ||
| Level 3 | - | Prices determined using other significant unobservable inputs. Unobservable inputs reflect the Fund’s own assumptions about the factors market participants would use in pricing an investment. | ||
Level 1 and Level 2 trading assets and trading liabilities, at fair value
Common stocks, ETF and financial derivative instruments, such as futures contracts that are traded on a national securities exchange, are stated at the last reported sale or settlement price on the day of valuation. To the extent these securities are actively traded and valuation adjustments are not applied, they are categorized as Level 1 of the fair value hierarchy. Preferred securities and other equities traded on inactive markets or valued by reference to similar instruments are generally categorized as Level 2 of the fair value hierarchy.
27
American Beacon FundsSM
Notes to Financial Statements
June 30, 2020
Investments in registered open-end investment management companies will be valued based upon the NAVs of such investments and are categorized as Level 1 of the fair value hierarchy.
4. Securities and Other Investments
Common Stock
Common stock generally takes the form of shares in a corporation which represent an ownership interest. It ranks below preferred stock and debt securities in claims for dividends and for assets of the company in a liquidation or bankruptcy. The value of a company’s common stock may fall as a result of factors directly relating to that company, such as decisions made by its management or decreased demand for the company’s products or services. A stock’s value may also decline because of factors affecting not just the company, but also companies in the same industry or sector. The price of a company’s stock may also be affected by changes in financial markets that are relatively unrelated to the company, such as changes in interest rates, currency exchange rates or industry regulation. Companies that elect to pay dividends on their common stock generally only do so after they invest in their own business and make required payments to bondholders and on other debt and preferred stock. Therefore, the value of a company’s common stock will usually be more volatile than its bonds, other debt and preferred stock. Common stock may be exchange-traded or OTC. OTC stock may be less liquid than exchange-traded stock.
Other Investment Company Securities and Other Exchange-Traded Products
The Funds may invest in shares of other investment companies, including open-end funds, closed-end funds, business development companies (“BDCs”), ETFs, unit investment trusts, and other investment companies of the Trust. The Funds may invest in securities of an investment company advised by the Manager or a sub-advisor. Investments in the securities of other investment companies may involve duplication of advisory fees and certain other expenses. By investing in another investment company, the Funds become a shareholder of that investment company. As a result, the Funds’ shareholders indirectly will bear the Funds’ proportionate share of the fees and expenses paid by shareholders of the other investment company, in addition to the fees and expenses the Funds’ shareholders directly bear in connection with the Funds’ own operations. These other fees and expenses are reflected as Acquired Fund Fees and Expenses and are included in the Fees and Expenses Table for the Funds in their Prospectus, if applicable. Investments in other investment companies may involve the payment of substantial premiums above the value of such issuer’s portfolio securities.
5. Principal Risks
Investing in the Funds may involve certain risks including, but not limited to, those described below.
Equity Investments Risk
Equity securities are subject to market risk. The Funds’ investments in equity securities may include common stocks, preferred stocks, securities convertible into or exchangeable for common stocks, REITs, depositary receipts, and U.S. dollar-denominated foreign stocks traded on U.S. exchanges. Such investments may expose the Funds to additional risk. The value of a company’s common stock may fall as a result of factors affecting the company, companies in the same industry or sector, or the financial markets overall. Common stock generally is subordinate to preferred stock upon the liquidation or bankruptcy of the issuing company. Preferred stocks and convertible securities are sensitive to movements in interest rates. Preferred stocks may be less liquid than common stocks and, unlike common stocks, participation in the growth of an issuer may be limited. Distributions on preferred stocks generally are payable at the discretion of an issuer and after required payments to bond holders. Convertible securities are subject to the risk that the credit standing of the issuer may have an effect on the convertible securities’ investment value. Investments in REITs are subject to the risks associated with investing in the real estate industry such as adverse developments affecting the real estate industry and real property values. Depositary receipts and U.S. dollar-denominated foreign stocks traded on U.S. exchanges are subject to
28
American Beacon FundsSM
Notes to Financial Statements
June 30, 2020
certain of the risks associated with investing directly in foreign securities, including, but not limited to, currency fluctuations and political and financial instability in the home country of a particular depositary receipt or foreign stock.
Focused Holdings Risk
Because the Funds may have a focused portfolio of fewer companies, the increase or decrease of the value of a single investment may have a greater impact on the Funds’ NAV and total return when compared to other diversified funds.
Market Disruption Risk
Geopolitical and other events, including war, terrorism, economic uncertainty, trade disputes, pandemics, public health crises and related geopolitical events have led, and in the future may continue to lead, to instability in world economies and markets generally. This instability has disrupted, and may continue to disrupt, U.S. and world economies and markets and adversely affect the value of your investment. Events that have led to market disruptions include the recent pandemic spread of the novel coronavirus known as COVID-19, the duration and full effects of which are still uncertain. Market disruptions have caused, and may continue to cause, broad changes in market value, negative public perceptions concerning these developments, and adverse investor sentiment or publicity. Changes in value may be temporary or may last for extended periods.
Market Risk
Conditions in the U.S. and many foreign economies have resulted, and may continue to result, in certain instruments experiencing unusual liquidity issues, increased price volatility and, in some cases, credit downgrades and increased likelihood of default. These events have reduced the willingness and ability of some lenders to extend credit, and have made it more difficult for some borrowers to obtain financing on attractive terms, if at all. In some cases, traditional market participants have been less willing to make a market in some types of debt instruments, which has affected the liquidity of those instruments. During times of market turmoil, investors tend to look to the safety of securities issued or backed by the U.S. Treasury, causing the prices of these securities to rise and the yields to decline. Reduced liquidity in fixed income and credit markets may negatively affect many issuers worldwide. In addition, global economies and financial markets are becoming increasingly interconnected, which increases the possibilities that conditions in one country or region might adversely impact issuers in a different country or region. A rise in protectionist trade policies, and the possibility of changes to some international trade agreements, could affect the economies of many nations, including the United States, in ways that cannot necessarily be foreseen at the present time.
In response to the financial crisis, the U.S. and other governments and the Federal Reserve and certain foreign central banks have taken steps to support financial markets. In some countries where economic conditions are recovering, they are nevertheless perceived as still fragile. Withdrawal of government support, failure of efforts in response to the crisis, or investor perception that such efforts are not succeeding, could adversely impact the value and liquidity of certain securities. The severity or duration of adverse economic conditions may also be affected by policy changes made by governments or quasi-governmental organizations, including changes in tax laws. The impact of new financial regulation legislation on the markets and the practical implications for market participants may not be fully known for some time. Regulatory changes are causing some financial services companies to exit long-standing lines of business, resulting in dislocations for other market participants.
In addition, political and governmental events within the U.S. and abroad, such as the U.S. government’s inability at times to agree on a long-term budget and deficit reduction plan, the threat of a federal government shutdown and threats not to increase the federal government’s debt limit, may affect investor and consumer confidence and may adversely impact financial markets and the broader economy, perhaps suddenly and to a significant degree. The U.S. government has reduced the federal corporate income tax rates, and future legislative, regulatory and policy changes may result in more restrictions on international trade, less stringent
29
American Beacon FundsSM
Notes to Financial Statements
June 30, 2020
prudential regulation of certain players in the financial markets, and significant new investments in infrastructure and national defense. Markets may react strongly to expectations about the changes in these policies, which could increase volatility, especially if the markets’ expectations for changes in government policies are not borne out.
Changes in market conditions will not have the same impact on all types of securities. Interest rates have been unusually low in recent years in the U.S. and abroad. Because there is little precedent for this situation, it is difficult to predict the impact of a significant rate increase on various markets. For example, because investors may buy securities or other investments with borrowed money, a significant increase in interest rates may cause a decline in the markets for those investments. Because of the sharp decline in the worldwide price of oil, there is a concern that oil producing nations may withdraw significant assets now held in U.S. Treasuries, which could force a substantial increase in interest rates. Regulators have expressed concern that rate increases may cause investors to sell fixed income securities faster than the market can absorb them, contributing to price volatility. In addition, there is a risk that the prices of goods and services in the U.S. and many foreign economies may decline over time, known as deflation (the opposite of inflation). Deflation may have an adverse effect on stock prices and creditworthiness and may make defaults on debt more likely. If a country’s economy slips into a deflationary pattern, it could last for a prolonged period and may be difficult to reverse.
The impact of the United Kingdom’s departure from the EU, which occurred on January 31, 2020, commonly known as Brexit, is not yet known. The effect on the United Kingdom’s economy will likely depend on the nature of trade relations with the EU and other major economies following its exit, which are matters to be negotiated. The outcomes may cause increased volatility and have a significant adverse impact on world financial markets, other international trade agreements, and the United Kingdom and European economies, as well as the broader global economy for some time, which could significantly adversely affect the value of a Fund’s investments in the United Kingdom and Europe.
Non-Diversification Risk
The Funds are non-diversified, which means the Funds may focus their investments in the securities of a comparatively small number of issuers. Investments in securities of a limited number of issuers exposes the Funds to greater market risk and potential losses than if assets were diversified among the securities of a greater number of issuers.
Other Investment Companies Risk
The Funds may invest in shares of other registered investment companies, including ETFs and money market funds. To the extent that the Funds invest in shares of other registered investment companies, the Funds will indirectly bear the fees and expenses charged by those investment companies in addition to the Funds’ direct fees and expenses and will be subject to the risks associated with investments in those companies. For example, ETF shares may trade at a premium or discount to their NAV. An ETF that tracks an index may not precisely replicate the returns of its benchmark index.
Securities Lending Risk
A Fund may lend its portfolio securities to brokers, dealers and financial institutions to seek income. There is a risk that a borrower may default on its obligations to return loaned securities; however, a Fund’s securities lending agent indemnifies the Fund against that risk. There is a risk that the assets of a Fund’s securities lending agent may be insufficient to satisfy any contractual indemnification requirements to the Fund. Borrowers of a Fund’s securities typically provide collateral in the form of cash that is reinvested in securities. A Fund will be responsible for the risks associated with the investment of cash collateral, including any collateral invested in an affiliated money market fund. A Fund may lose money on its investment of cash collateral or may fail to earn sufficient income on its investment to meet obligations to the borrower. In addition, delays may occur in the recovery of securities from borrowers, which could interfere with a Fund’s ability to vote proxies or to settle transactions and there is the risk of possible loss of rights in the collateral should the borrower fail financially. In
30
American Beacon FundsSM
Notes to Financial Statements
June 30, 2020
any case in which the loaned securities are not returned to the Fund before an ex-dividend date, the payment in lieu of the dividend that the Fund receives from the securities’ borrower would not be treated as a dividend for federal income tax purposes and thus would not qualify for treatment as “qualified dividend income”.
Securities Selection Risk
Securities selected by the sub-advisor or the Manager for the Funds may not perform to expectations. This could result in the Funds’ underperformance compared to other funds with similar investment objectives.
Offsetting Assets and Liabilities
The Funds are parties to enforceable master netting agreements between brokers and counterparties which provide for the right to offset under certain circumstances. The Funds employ multiple money managers and counterparties and have elected not to offset qualifying financial and derivative instruments on the Statements of Assets and Liabilities, as such all financial and derivative instruments are presented on a gross basis. The impacts of netting arrangements that provide the right to offset are detailed below, if applicable. The net amount represents the net receivable or payable that would be due from or to the counterparty in the event of default. Exposure from borrowings and other financing agreements such as repurchase agreements can only be netted across transactions governed by the same Master Agreement with the same legal entity. All amounts reported below represent the balance as of the report date, June 30, 2020.
Shapiro SMID Cap Equity Fund
| Remaining Contractual Maturity of the Agreements As of June 30, 2020 | ||||||||||||||||||||||||||||||||||||
| Overnight and Continuous | <30 days | Between 30 & 90 days |
| >90 days |
| Total | ||||||||||||||||||||||||||||||
Securities Lending Transactions |
| |||||||||||||||||||||||||||||||||||
Common Stocks | $ | 75,500 | $ | - | $ | - | $ | - | $ | 75,500 | ||||||||||||||||||||||||||
|
|
|
|
|
|
|
|
|
| |||||||||||||||||||||||||||
Total Borrowings | $ | 75,500 | $ | - | $ | - | $ | - | $ | 75,500 | ||||||||||||||||||||||||||
|
|
|
|
|
|
|
|
|
|
|
| |||||||||||||||||||||||||
Gross amount of recognized liabilities for securities lending transactions |
| $ | 75,500 | |||||||||||||||||||||||||||||||||
|
| |||||||||||||||||||||||||||||||||||
6. Federal Income and Excise Taxes
It is the policy of each Fund to qualify as a regulated investment company (“RIC”), by complying with all applicable provisions of Subchapter M of the Internal Revenue Code, as amended, and to make distributions of taxable income sufficient to relieve it from substantially all federal income and excise taxes. For federal income tax purposes, each Fund is treated as a single entity for the purpose of determining such qualification.
The Funds do not have any unrecorded tax liabilities in the accompanying financial statements. Each of the tax years in the three year period ended June 30, 2020 remain subject to examination by the Internal Revenue Service. If applicable, the Funds recognize interest accrued related to unrecognized tax benefits in interest expense and penalties in “Other expenses” on the Statements of Operations.
The Funds may be subject to taxes imposed by countries in which it invests. Such taxes are generally based on returns of income earned or gains realized or repatriated. Taxes are accrued and applied to net investment income, net realized capital gains and net unrealized appreciation (depreciation), as applicable, as the income is earned or capital gains are recorded.
Dividends are categorized in accordance with income tax regulations which may treat certain transactions differently than U.S. GAAP. Accordingly, the character of distributions and composition of net assets for tax purposes may differ from those reflected in the accompanying financial statements.
31
American Beacon FundsSM
Notes to Financial Statements
June 30, 2020
The tax character of distributions paid were as follows:
| Shapiro Equity Opportunities Fund | Shapiro SMID Cap Equity Fund | |||||||||||||||||||||||||||
| Year Ended June 30, 2020 | Year Ended June 30, 2019 | Year Ended June 30, 2020 | Year Ended June 30, 2019 | |||||||||||||||||||||||||
Distributions paid from: | ||||||||||||||||||||||||||||
Ordinary income* | ||||||||||||||||||||||||||||
R5 Class** | $ | 2,227,652 | $ | 1,140,700 | $ | 165,368 | $ | 343,027 | ||||||||||||||||||||
Y Class | 1,436,275 | 666,340 | 10,801 | 12,456 | ||||||||||||||||||||||||
Investor Class | 26,686 | 12,054 | 36,657 | 41,306 | ||||||||||||||||||||||||
Long-term capital gains | ||||||||||||||||||||||||||||
R5 Class** | 722,637 | 70,546 | 205,333 | 48,542 | ||||||||||||||||||||||||
Y Class | 465,919 | 41,209 | 13,411 | 1,762 | ||||||||||||||||||||||||
Investor Class | 9,151 | 745 | 45,518 | 5,845 | ||||||||||||||||||||||||
|
|
|
|
|
|
|
| |||||||||||||||||||||
Total distributions paid | $ | 4,888,320 | $ | 1,931,594 | $ | 477,088 | $ | 452,938 | ||||||||||||||||||||
|
|
|
|
|
|
|
| |||||||||||||||||||||
* For tax purposes, short-term capital gains are considered ordinary income distributions.
** Formerly known as Institutional Class.
As of June 30, 2020, the components of distributable earnings (deficits) on a tax basis were as follows:
Fund | Tax Cost | Unrealized Appreciation | Unrealized (Depreciation) | Net Unrealized Appreciation (Depreciation) | ||||||||||||||||||||||||
Shapiro Equity Opportunities | $ | 90,291,915 | $ | 3,616,405 | $ | (23,174,324 | ) | $ | (19,557,919 | ) | ||||||||||||||||||
Shapiro SMID Cap Equity | 7,283,868 | 303,504 | (2,162,513 | ) | (1,859,009 | ) | ||||||||||||||||||||||
Fund | Net Unrealized Appreciation (Depreciation) | Undistributed Ordinary Income | Undistributed Long-Term Capital Gains | Accumulated Capital and Other (Losses) | Other Temporary Differences | Distributable Earnings | ||||||||||||||||||
Shapiro Equity Opportunities | $ | (19,557,919 | ) | $ | 1,146,516 | $ | 1,279,812 | $ | - | $ | (2,414 | ) | $ | (17,134,005 | ) | |||||||||
Shapiro SMID Cap Equity | (1,859,009 | ) | 89,784 | - | - | (2,797 | ) | (1,772,022 | ) | |||||||||||||||
Financial reporting records are adjusted for permanent book/tax differences to reflect tax character. Financial records are not adjusted for temporary differences. The temporary differences between financial reporting and tax-basis reporting of unrealized appreciation (depreciation) are attributable primarily to the tax deferral of losses from wash sales and organizational expenses.
Due to inherent differences in the recognition of income, expenses, and realized gains (losses) under U.S. GAAP and federal income tax regulations, permanent differences between book and tax reporting have been identified and appropriately reclassified on the Statements of Assets and Liabilities.
The Funds had no permanent differences as of June 30, 2020.
Under the Regulated Investment Company Modernization Act of 2010 (“RIC MOD”), net capital losses recognized by the Funds in taxable years beginning after December 22, 2010 are carried forward indefinitely and retain their character as short-term and/or long-term losses.
As of June 30, 2020, the Funds did not have any capital loss carryforwards.
32
American Beacon FundsSM
Notes to Financial Statements
June 30, 2020
7. Investment Transactions
The aggregate cost of purchases and proceeds from sales and maturities of investments, other than short-term obligations, for the year ended June 30, 2020 were as follows:
Fund | Purchases (non-U.S. Government Securities) | Sales (non-U.S. Government Securities) | ||||||||||
| Shapiro Equity Opportunities | $ | 47,184,937 | $ | 49,039,434 | ||||||||
| Shapiro SMID Cap Equity | 2,892,253 | 3,082,846 | ||||||||||
A summary of the Funds’ transactions in the USG Select Fund for the year ended June 30, 2020 were as follows:
Fund | Type of Transaction | June 30, 2019 Shares/Fair Value | Purchases | Sales | June 30, 2020 Shares/Fair Value | |||||||||||||||||||||||||||||
| Shapiro Equity Opportunities | Direct | $ | 3,080,491 | $ | 28,030,919 | $ | 30,827,401 | $ | 284,009 | |||||||||||||||||||||||||
| Shapiro Equity Opportunities | Securities Lending | 544,670 | 30,282,135 | 30,826,805 | - | |||||||||||||||||||||||||||||
| Shapiro SMID Cap Equity | Direct | 252,400 | 2,196,280 | 2,378,862 | 69,818 | |||||||||||||||||||||||||||||
| Shapiro SMID Cap Equity | Securities Lending | 363,460 | 3,518,964 | 3,806,924 | 75,500 | |||||||||||||||||||||||||||||
8. Securities Lending
The Funds may lend their securities to qualified financial institutions, such as certain broker-dealers, to earn additional income. The borrowers are required to secure their loans continuously with collateral in an amount at least equal to the fair value of the securities loaned, initially in an amount at least equal to 102% of the fair value of domestic securities loaned and 105% of the fair value of international securities loaned. Collateral is monitored and marked-to-market daily. Daily mark-to-market amounts are required to be paid to the borrower or received from the borrower by the end of the following business day. This one day settlement for mark-to-market amounts may result in the collateral being temporarily less than the value of the securities on loan or temporarily more than the required minimum collateral.
To the extent that a loan is collateralized by cash, such cash collateral shall be invested by the securities lending agent (the “Agent”) in money market mutual funds and other short-term investments, provided the investments meet certain quality and diversification requirements. Securities purchased with cash collateral proceeds are listed in the Funds’ Schedule of Investments and the collateral is shown on the Statements of Assets and Liabilities as a payable.
Securities lending income is generated from the demand premium (if any) paid by the borrower to borrow a specific security and from the return on investment of cash collateral, reduced by negotiated rebate fees paid to the borrower and transaction costs. To the extent that a loan is secured by non-cash collateral, securities lending income is generated as a demand premium reduced by transaction costs. The Funds, the Agent, and the Manager retained 80%, 10%, and 10%, respectively, of the income generated from securities lending.
While securities are on loan, the Funds continue to receive certain income associated with that security and any gain or loss in the market price that may occur during the term of the loan. In the case of domestic equities, the value of any dividend is received in the form of a substitute payment approximately equal to the dividend. In the case of foreign securities, a negotiated amount is received that is less than the actual dividend, but higher than the dividend amount minus the foreign tax that the Funds would be subject to on the dividend.
Securities lending transactions pose certain risks to the Funds, including that the borrower may not provide additional collateral when required or return the securities when due, that the value of the short-term investments
33
American Beacon FundsSM
Notes to Financial Statements
June 30, 2020
will be less than the amount of cash collateral required to be returned to the borrower, that non-cash collateral may be subject to legal constraints in the event of a borrower bankruptcy, and that the cash collateral investments could become illiquid and unable to be used to return collateral to the borrower. The Funds could also experience delays and costs in gaining access to the collateral. The Funds bear the risk of any deficiency in the amount of the cash collateral available for return to the borrower and any action which impairs its ability to liquidate non-cash collateral to satisfy a borrower default.
As of June 30, 2020, the value of outstanding securities on loan and the value of collateral were as follows:
Fund | Market Value of Securities on Loan | Cash Collateral Received | Non-Cash Collateral Received | Total Collateral Received | ||||||||||||||||||||||
| Shapiro Equity Opportunities | $3,723,024 | $ | – | $ | 3,792,275 | $ | 3,792,275 | |||||||||||||||||||
| Shapiro SMID Cap Equity | 429,458 | 75,500 | 362,605 | 438,105 | ||||||||||||||||||||||
Cash collateral is listed on the Funds’ Schedules of Investments and is shown on the Statements of Assets and Liabilities. Income earned on these investments is included in “Income derived from securities lending” on the Statements of Operations.
Non-cash collateral received by the Funds may not be sold or re-pledged except to satisfy a borrower default. Therefore, non-cash collateral is not included on the Funds’ Schedules of Investments or Statements of Assets and Liabilities.
9. Borrowing Arrangements
Effective November 14, 2019 (the “Effective Date”), the Funds, along with certain other funds managed by the Manager (“Participating Funds”), entered into a committed revolving line of credit (the “Committed Line”) agreement with State Street Bank and Trust Company (the “Bank”) to be used to facilitate portfolio liquidity. The maximum borrowing amount under the Committed Line is $250 million with interest at a rate equal to the higher of (a) one-month London Inter-Bank Offered Rate (“LIBOR”) plus 1.25% per annum or (b) the Federal Funds rate plus 1.25% per annum on amounts borrowed. Each of the Participating Funds paid a closing fee of $100,000 on the Effective Date and a quarterly commitment fee at a rate of 0.25% per annum on the unused portion of the Committed Line amount. Effective August 6, 2020, the Committed Line was reduced from $250 million to $150 million. The Committed Line expires November 12, 2020, unless extended by the Bank or terminated by the Participating Funds in accordance with the agreement.
On the Effective Date, the Funds, along with certain other Participating Funds managed by the Manager, also entered into an uncommitted discretionary demand revolving line of credit (the “Uncommitted Line”) agreement with the Bank to be used to facilitate portfolio liquidity. The maximum borrowing amount under the Uncommitted Line is $50 million with interest at a rate equal to the higher of (a) one-month LIBOR plus 1.25% per annum or (b) the Federal Funds rate plus 1.25% per annum on each outstanding loan. Each of the Participating Funds paid a closing fee of $35,000 on the Effective Date. The Uncommitted Line expires November 12, 2020 unless extended by the Bank or terminated by the Participating Funds in accordance with the agreement.
The Participating Funds paid administration, legal and arrangement fees, which are recognized as a component of “Other expenses” on the Statements of Operations, along with commitment fees, that have been allocated among the Participating Funds based on average daily net assets.
During the year ended June 30, 2020, the Funds did not utilize this facility.
34
American Beacon FundsSM
Notes to Financial Statements
June 30, 2020
10. Capital Share Transactions
The tables below summarize the activity in capital shares for each Class of the Funds:
| R5 ClassA | ||||||||||||||||||||||||||||
| Year Ended June 30, 2020 | Year Ended June 30, 2019 | |||||||||||||||||||||||||||
Shapiro Equity Opportunities Fund | Shares | Amount | Shares | Amount | ||||||||||||||||||||||||
| Shares sold | 237,120 | $ | 2,564,845 | 759,395 | $ | 8,443,778 | ||||||||||||||||||||||
| Reinvestment of dividends | 254,403 | 2,935,816 | 130,945 | 1,211,245 | ||||||||||||||||||||||||
| Shares redeemed | (923,683 | ) | (6,848,462 | ) | (79,687 | ) | (878,814 | ) | ||||||||||||||||||||
|
|
|
|
|
|
|
| |||||||||||||||||||||
| Net increase (decrease) in shares outstanding | (432,160 | ) | $ | (1,347,801 | ) | 810,653 | $ | 8,776,209 | ||||||||||||||||||||
|
|
|
|
|
|
|
| |||||||||||||||||||||
| Y Class | ||||||||||||||||||||||||||||
| Year Ended June 30, 2020 | Year Ended June 30, 2019 | |||||||||||||||||||||||||||
Shapiro Equity Opportunities Fund | Shares | Amount | Shares | Amount | ||||||||||||||||||||||||
| Shares sold | 271,716 | $ | 2,702,820 | 1,553,828 | $ | 16,745,549 | ||||||||||||||||||||||
| Reinvestment of dividends | 164,978 | 1,902,194 | 76,492 | 707,549 | ||||||||||||||||||||||||
| Shares redeemed | (377,492 | ) | (3,757,703 | ) | (820,703 | ) | (7,762,611 | ) | ||||||||||||||||||||
|
|
|
|
|
|
|
| |||||||||||||||||||||
| Net increase in shares outstanding | 59,202 | $ | 847,311 | 809,617 | $ | 9,690,487 | ||||||||||||||||||||||
|
|
|
|
|
|
|
| |||||||||||||||||||||
| Investor Class | ||||||||||||||||||||||||||||
| Year Ended June 30, 2020 | Year Ended June 30, 2019 | |||||||||||||||||||||||||||
Shapiro Equity Opportunities Fund | Shares | Amount | Shares | Amount | ||||||||||||||||||||||||
| Shares sold | 18,019 | $ | 180,454 | 59,227 | $ | 642,126 | ||||||||||||||||||||||
| Reinvestment of dividends | 3,127 | 35,837 | 1,391 | 12,800 | ||||||||||||||||||||||||
| Shares redeemed | (52,559 | ) | (493,525 | ) | (10,971 | ) | (113,275 | ) | ||||||||||||||||||||
|
|
|
|
|
|
|
| |||||||||||||||||||||
| Net increase (decrease) in shares outstanding | (31,413 | ) | $ | (277,234 | ) | 49,647 | $ | 541,651 | ||||||||||||||||||||
|
|
|
|
|
|
|
| |||||||||||||||||||||
| R5 ClassA | ||||||||||||||||||||||||||||
| Year Ended June 30, 2020 | Year Ended June 30, 2019 | |||||||||||||||||||||||||||
Shapiro SMID Cap Equity Fund | Shares | Amount | Shares | Amount | ||||||||||||||||||||||||
| Shares sold | 1,641 | $ | 15,879 | 72,855 | $ | 727,095 | ||||||||||||||||||||||
| Reinvestment of dividends | 15,115 | 146,313 | 48,885 | 391,569 | ||||||||||||||||||||||||
| Shares redeemed | - | - | (27,245 | ) | (251,564 | ) | ||||||||||||||||||||||
|
|
|
|
|
|
|
| |||||||||||||||||||||
| Net increase in shares outstanding | 16,756 | $ | 162,192 | 94,495 | $ | 867,100 | ||||||||||||||||||||||
|
|
|
|
|
|
|
| |||||||||||||||||||||
| Y Class | ||||||||||||||||||||||||||||
| Year Ended June 30, 2020 | Year Ended June 30, 2019 | |||||||||||||||||||||||||||
Shapiro SMID Cap Equity Fund | Shares | Amount | Shares | Amount | ||||||||||||||||||||||||
| Shares sold | 548 | $ | 5,300 | 37,537 | $ | 345,903 | ||||||||||||||||||||||
| Reinvestment of dividends | 1,736 | 16,765 | 1,777 | 14,218 | ||||||||||||||||||||||||
| Shares redeemed | (29,530 | ) | (220,721 | ) | (17,256 | ) | (167,561 | ) | ||||||||||||||||||||
|
|
|
|
|
|
|
| |||||||||||||||||||||
| Net increase (decrease) in shares outstanding | (27,246 | ) | $ | (198,656 | ) | 22,058 | $ | 192,560 | ||||||||||||||||||||
|
|
|
|
|
|
|
| |||||||||||||||||||||
| Investor Class | ||||||||||||||||||||||||||||
| Year Ended June 30, 2020 | Year Ended June 30, 2019 | |||||||||||||||||||||||||||
Shapiro SMID Cap Equity Fund | Shares | Amount | Shares | Amount | ||||||||||||||||||||||||
| Shares sold | 8,136 | $ | 71,758 | 88,862 | $ | 916,472 | ||||||||||||||||||||||
| Reinvestment of dividends | 7,792 | 74,726 | 5,916 | 47,151 | ||||||||||||||||||||||||
| Shares redeemed | (10,591 | ) | (95,696 | ) | (9,856 | ) | (98,294 | ) | ||||||||||||||||||||
|
|
|
|
|
|
|
| |||||||||||||||||||||
| Net increase in shares outstanding | 5,337 | $ | 50,788 | 84,922 | $ | 865,329 | ||||||||||||||||||||||
|
|
|
|
|
|
|
| |||||||||||||||||||||
| A | Formerly known as Institutional Class. |
35
American Beacon FundsSM
Notes to Financial Statements
June 30, 2020
11. Subsequent Events
Management has evaluated subsequent events for possible recognition or disclosure in the financial statements through the date the financial statements are issued. Management has determined that there are no material events that would require disclosure in the Funds’ financial statements through this date.
36
American Beacon Shapiro Equity Opportunities FundSM
(For a share outstanding throughout the period)
| R5 ClassA | ||||||||||||||||||||
| Year Ended June 30, | September 12, 2017B to June 30, | |||||||||||||||||||
| 2020 | 2019 | 2018 | ||||||||||||||||||
|
| |||||||||||||||||||
Net asset value, beginning of period | $ | 11.28 | $ | 11.29 | $ | 10.00 | ||||||||||||||
|
|
|
|
|
| |||||||||||||||
Income (loss) from investment operations: | ||||||||||||||||||||
Net investment income | 0.14 | 0.11 | 0.02 | |||||||||||||||||
Net gains (losses) on investments (both realized and unrealized) | (1.36 | ) | 0.16 | 1.29 | ||||||||||||||||
|
|
|
|
|
| |||||||||||||||
Total income (loss) from investment operations | (1.22 | ) | 0.27 | 1.31 | ||||||||||||||||
|
|
|
|
|
| |||||||||||||||
Less distributions: | ||||||||||||||||||||
Dividends from net investment income | (0.11 | ) | (0.07 | ) | (0.02 | ) | ||||||||||||||
Distributions from net realized gains | (0.51 | ) | (0.21 | ) | (0.00 | )C | ||||||||||||||
|
|
|
|
|
| |||||||||||||||
Total distributions | (0.62 | ) | (0.28 | ) | (0.02 | ) | ||||||||||||||
|
|
|
|
|
| |||||||||||||||
Net asset value, end of period | $ | 9.44 | $ | 11.28 | $ | 11.29 | ||||||||||||||
|
|
|
|
|
| |||||||||||||||
Total returnD | (11.84 | )% | 2.97 | % | 13.07 | %E | ||||||||||||||
|
|
|
|
|
| |||||||||||||||
Ratios and supplemental data: |
| |||||||||||||||||||
Net assets, end of period | $ | 40,207,550 | $ | 52,917,588 | $ | 43,796,676 | ||||||||||||||
Ratios to average net assets: | ||||||||||||||||||||
Expenses, before reimbursements | 0.97 | % | 0.98 | % | 2.81 | %F | ||||||||||||||
Expenses, net of reimbursements | 0.79 | % | 0.79 | % | 0.79 | %F | ||||||||||||||
Net investment income (loss), before expense reimbursements | 1.11 | % | 0.80 | % | (1.53 | )%F | ||||||||||||||
Net investment income, net of reimbursements | 1.29 | % | 0.99 | % | 0.49 | %F | ||||||||||||||
Portfolio turnover rate | 59 | % | 54 | % | 9 | %G | ||||||||||||||
| A | Prior to February 28, 2020, the R5 Class was known as Institutional Class. |
| B | Commencement of operations. |
| C | Amount represents less than $0.01 per share. |
| D | Based on net asset value, which does not reflect the sales charge, redemption fee, or contingent deferred sales charge, if applicable. May include adjustments in accordance with U.S. GAAP and as such, the net asset value for reporting purposes and the returns based upon those net asset values may differ from the net asset value and returns for shareholder transactions. |
| E | Not annualized. |
| F | Annualized. |
| G | Portfolio turnover rate is for the period from September 12, 2017 through June 30, 2018 and is not annualized. |
See accompanying notes
37
American Beacon Shapiro Equity Opportunities FundSM
Financial Highlights
(For a share outstanding throughout the period)
| Y Class | ||||||||||||||||||||
| Year Ended June 30, | September 12, 2017A to June 30, | |||||||||||||||||||
| 2020 | 2019 | 2018 | ||||||||||||||||||
|
| |||||||||||||||||||
Net asset value, beginning of period | $ | 11.28 | $ | 11.30 | $ | 10.00 | ||||||||||||||
|
|
|
|
|
| |||||||||||||||
Income (loss) from investment operations: | ||||||||||||||||||||
Net investment income | 0.12 | 0.10 | 0.03 | |||||||||||||||||
Net gains (losses) on investments (both realized and unrealized) | (1.35 | ) | 0.16 | 1.29 | ||||||||||||||||
|
|
|
|
|
| |||||||||||||||
Total income (loss) from investment operations | (1.23 | ) | 0.26 | 1.32 | ||||||||||||||||
|
|
|
|
|
| |||||||||||||||
Less distributions: | ||||||||||||||||||||
Dividends from net investment income | (0.11 | ) | (0.07 | ) | (0.02 | ) | ||||||||||||||
Distributions from net realized gains | (0.51 | ) | (0.21 | ) | (0.00 | )B | ||||||||||||||
|
|
|
|
|
| |||||||||||||||
Total distributions | (0.62 | ) | (0.28 | ) | (0.02 | ) | ||||||||||||||
|
|
|
|
|
| |||||||||||||||
Net asset value, end of period | $ | 9.43 | $ | 11.28 | $ | 11.30 | ||||||||||||||
|
|
|
|
|
| |||||||||||||||
Total returnC | (11.92 | )% | 2.88 | % | 13.17 | %D | ||||||||||||||
|
|
|
|
|
| |||||||||||||||
Ratios and supplemental data: |
| |||||||||||||||||||
Net assets, end of period | $ | 30,239,629 | $ | 35,505,884 | $ | 26,419,367 | ||||||||||||||
Ratios to average net assets: | ||||||||||||||||||||
Expenses, before reimbursements | 1.09 | % | 1.06 | % | 2.77 | %E | ||||||||||||||
Expenses, net of reimbursements | 0.89 | % | 0.89 | % | 0.89 | %E | ||||||||||||||
Net investment income (loss), before expense reimbursements | 0.99 | % | 0.77 | % | (0.79 | )%E | ||||||||||||||
Net investment income, net of reimbursements | 1.19 | % | 0.94 | % | 1.09 | %E | ||||||||||||||
Portfolio turnover rate | 59 | % | 54 | % | 9 | %F | ||||||||||||||
| A | Commencement of operations. |
| B | Amount represents less than $0.01 per share. |
| C | Based on net asset value, which does not reflect the sales charge, redemption fee, or contingent deferred sales charge, if applicable. May include adjustments in accordance with U.S. GAAP and as such, the net asset value for reporting purposes and the returns based upon those net asset values may differ from the net asset value and returns for shareholder transactions. |
| D | Not annualized. |
| E | Annualized. |
| F | Portfolio turnover rate is for the period from September 12, 2017 through June 30, 2018 and is not annualized. |
See accompanying notes
38
American Beacon Shapiro Equity Opportunities FundSM
Financial Highlights
(For a share outstanding throughout the period)
| Investor Class | ||||||||||||||||||||
| Year Ended June 30, | September 12, 2017A to June 30, | |||||||||||||||||||
| 2020 | 2019 | 2018 | ||||||||||||||||||
|
| |||||||||||||||||||
Net asset value, beginning of period | $ | 11.20 | $ | 11.25 | $ | 10.00 | ||||||||||||||
|
|
|
|
|
| |||||||||||||||
Income (loss) from investment operations: | ||||||||||||||||||||
Net investment income | 0.08 | 0.07 | 0.02 | |||||||||||||||||
Net gains (losses) on investments (both realized and unrealized) | (1.34 | ) | 0.16 | 1.25 | ||||||||||||||||
|
|
|
|
|
| |||||||||||||||
Total income (loss) from investment operations | (1.26 | ) | 0.23 | 1.27 | ||||||||||||||||
|
|
|
|
|
| |||||||||||||||
Less distributions: | ||||||||||||||||||||
Dividends from net investment income | (0.08 | ) | (0.07 | ) | (0.02 | ) | ||||||||||||||
Distributions from net realized gains | (0.51 | ) | (0.21 | ) | (0.00 | )B | ||||||||||||||
|
|
|
|
|
| |||||||||||||||
Total distributions | (0.59 | ) | (0.28 | ) | (0.02 | ) | ||||||||||||||
|
|
|
|
|
| |||||||||||||||
Net asset value, end of period | $ | 9.35 | $ | 11.20 | $ | 11.25 | ||||||||||||||
|
|
|
|
|
| |||||||||||||||
Total returnC | (12.20 | )% | 2.62 | % | 12.67 | %D | ||||||||||||||
|
|
|
|
|
| |||||||||||||||
Ratios and supplemental data: |
| |||||||||||||||||||
Net assets, end of period | $ | 320,828 | $ | 736,220 | $ | 180,767 | ||||||||||||||
Ratios to average net assets: | ||||||||||||||||||||
Expenses, before reimbursements | 2.20 | % | 2.57 | % | 4.88 | %E | ||||||||||||||
Expenses, net of reimbursements | 1.17 | % | 1.17 | % | 1.17 | %E | ||||||||||||||
Net investment income (loss), before expense reimbursements | (0.11 | )% | (0.74 | )% | (3.54 | )%E | ||||||||||||||
Net investment income, net of reimbursements | 0.92 | % | 0.66 | % | 0.17 | %E | ||||||||||||||
Portfolio turnover rate | 59 | % | 54 | % | 9 | %F | ||||||||||||||
| A | Commencement of operations. |
| B | Amount represents less than $0.01 per share. |
| C | Based on net asset value, which does not reflect the sales charge, redemption fee, or contingent deferred sales charge, if applicable. May include adjustments in accordance with U.S. GAAP and as such, the net asset value for reporting purposes and the returns based upon those net asset values may differ from the net asset value and returns for shareholder transactions. |
| D | Not annualized. |
| E | Annualized. |
| F | Portfolio turnover rate is for the period from September 12, 2017 through June 30, 2018 and is not annualized. |
See accompanying notes
39
American Beacon Shapiro SMID Cap Equity FundSM
Financial Highlights
(For a share outstanding throughout the period)
| R5 ClassA | ||||||||||||||||||||
| Year Ended June 30, | September 12, 2017B to June 30, | |||||||||||||||||||
| 2020 | 2019 | 2018 | ||||||||||||||||||
|
| |||||||||||||||||||
Net asset value, beginning of period | $ | 9.72 | $ | 11.39 | $ | 10.00 | ||||||||||||||
|
|
|
|
|
| |||||||||||||||
Income (loss) from investment operations: | ||||||||||||||||||||
Net investment income | 0.04 | 0.05 | 0.01 | |||||||||||||||||
Net gains (losses) on investments (both realized and unrealized) | (1.46 | ) | (0.97 | ) | 1.38 | |||||||||||||||
|
|
|
|
|
| |||||||||||||||
Total income (loss) from investment operations | (1.42 | ) | (0.92 | ) | 1.39 | |||||||||||||||
|
|
|
|
|
| |||||||||||||||
Less distributions: | ||||||||||||||||||||
Dividends from net investment income | (0.05 | ) | (0.04 | ) | - | |||||||||||||||
Distributions from net realized gains | (0.63 | ) | (0.71 | ) | - | |||||||||||||||
|
|
|
|
|
| |||||||||||||||
Total distributions | (0.68 | ) | (0.75 | ) | - | |||||||||||||||
|
|
|
|
|
| |||||||||||||||
Net asset value, end of period | $ | 7.62 | $ | 9.72 | $ | 11.39 | ||||||||||||||
|
|
|
|
|
| |||||||||||||||
Total returnC | (16.09 | )% | (6.67 | )% | 13.90 | %D | ||||||||||||||
|
|
|
|
|
| |||||||||||||||
Ratios and supplemental data: |
| |||||||||||||||||||
Net assets, end of period | $ | 4,276,389 | $ | 5,293,291 | $ | 5,124,948 | ||||||||||||||
Ratios to average net assets: | ||||||||||||||||||||
Expenses, before reimbursements | 3.22 | % | 2.84 | % | 4.32 | %E | ||||||||||||||
Expenses, net of reimbursementsF | 0.90 | % | 0.89 | % | 0.89 | %E | ||||||||||||||
Net investment (loss), before expense reimbursements | (1.84 | )% | (1.47 | )% | (3.34 | )%E | ||||||||||||||
Net investment income, net of reimbursements | 0.48 | % | 0.48 | % | 0.08 | %E | ||||||||||||||
Portfolio turnover rate | 48 | % | 56 | % | 22 | %G | ||||||||||||||
| A | Prior to February 28, 2020, the R5 Class was known as Institutional Class. |
| B | Commencement of operations. |
| C | Based on net asset value, which does not reflect the sales charge, redemption fee, or contingent deferred sales charge, if applicable. May include adjustments in accordance with U.S. GAAP and as such, the net asset value for reporting purposes and the returns based upon those net asset values may differ from the net asset value and returns for shareholder transactions. |
| D | Not annualized. |
| E | Annualized. |
| F | Expense ratios may exceed stated expense caps in Note 2 due to security lending expenses. |
| G | Portfolio turnover rate is for the period from September 12, 2017 through June 30, 2018 and is not annualized. |
See accompanying notes
40
American Beacon Shapiro SMID Cap Equity FundSM
Financial Highlights
(For a share outstanding throughout the period)
| Y Class | ||||||||||||||||||||
| Year Ended June 30, | September 12, 2017A to June 30, | |||||||||||||||||||
| 2020 | 2019 | 2018 | ||||||||||||||||||
|
| |||||||||||||||||||
Net asset value, beginning of period | $ | 9.71 | $ | 11.39 | $ | 10.00 | ||||||||||||||
|
|
|
|
|
| |||||||||||||||
Income (loss) from investment operations: | ||||||||||||||||||||
Net investment income | 0.05 | 0.04 | 0.01 | |||||||||||||||||
Net gains (losses) on investments (both realized and unrealized) | (1.48 | ) | (0.97 | ) | 1.38 | |||||||||||||||
|
|
|
|
|
| |||||||||||||||
Total income (loss) from investment operations | (1.43 | ) | (0.93 | ) | 1.39 | |||||||||||||||
|
|
|
|
|
| |||||||||||||||
Less distributions: | ||||||||||||||||||||
Dividends from net investment income | (0.05 | ) | (0.04 | ) | - | |||||||||||||||
Distributions from net realized gains | (0.63 | ) | (0.71 | ) | - | |||||||||||||||
|
|
|
|
|
| |||||||||||||||
Total distributions | (0.68 | ) | (0.75 | ) | - | |||||||||||||||
|
|
|
|
|
| |||||||||||||||
Net asset value, end of period | $ | 7.60 | $ | 9.71 | $ | 11.39 | ||||||||||||||
|
|
|
|
|
| |||||||||||||||
Total returnB | (16.21 | )% | (6.76 | )% | 13.90 | %C | ||||||||||||||
|
|
|
|
|
| |||||||||||||||
Ratios and supplemental data: |
| |||||||||||||||||||
Net assets, end of period | $ | 104,553 | $ | 398,161 | $ | 215,795 | ||||||||||||||
Ratios to average net assets: | ||||||||||||||||||||
Expenses, before reimbursements | 3.33 | % | 2.87 | % | 5.69 | %D | ||||||||||||||
Expenses, net of reimbursementsE | 1.00 | % | 0.99 | % | 0.99 | %D | ||||||||||||||
Net investment (loss), before expense reimbursements | (1.91 | )% | (1.47 | )% | (4.47 | )%D | ||||||||||||||
Net investment income, net of reimbursements | 0.42 | % | 0.41 | % | 0.22 | %D | ||||||||||||||
Portfolio turnover rate | 48 | % | 56 | % | 22 | %F | ||||||||||||||
| A | Commencement of operations. |
| B | Based on net asset value, which does not reflect the sales charge, redemption fee, or contingent deferred sales charge, if applicable. May include adjustments in accordance with U.S. GAAP and as such, the net asset value for reporting purposes and the returns based upon those net asset values may differ from the net asset value and returns for shareholder transactions. |
| C | Not annualized. |
| D | Annualized. |
| E | Expense ratios may exceed stated expense caps in Note 2 due to security lending expenses. |
| F | Portfolio turnover rate is for the period from September 12, 2017 through June 30, 2018 and is not annualized. |
See accompanying notes
41
American Beacon Shapiro SMID Cap Equity FundSM
Financial Highlights
(For a share outstanding throughout the period)
| Investor Class | ||||||||||||||||||||
| Year Ended June 30, | September 12, 2017A to June 30, | |||||||||||||||||||
| 2020 | 2019 | 2018 | ||||||||||||||||||
|
| |||||||||||||||||||
Net asset value, beginning of period | $ | 9.65 | $ | 11.36 | $ | 10.00 | ||||||||||||||
|
|
|
|
|
| |||||||||||||||
Income (loss) from investment operations: | ||||||||||||||||||||
Net investment income (loss) | 0.01 | 0.04 | (0.01 | ) | ||||||||||||||||
Net gains (losses) on investments (both realized and unrealized) | (1.45 | ) | (1.00 | ) | 1.37 | |||||||||||||||
|
|
|
|
|
| |||||||||||||||
Total income (loss) from investment operations | (1.44 | ) | (0.96 | ) | 1.36 | |||||||||||||||
|
|
|
|
|
| |||||||||||||||
Less distributions: | ||||||||||||||||||||
Dividends from net investment income | (0.05 | ) | (0.04 | ) | - | |||||||||||||||
Distributions from net realized gains | (0.63 | ) | (0.71 | ) | - | |||||||||||||||
|
|
|
|
|
| |||||||||||||||
Total distributions | (0.68 | ) | (0.75 | ) | - | |||||||||||||||
|
|
|
|
|
| |||||||||||||||
Net asset value, end of period | $ | 7.53 | $ | 9.65 | $ | 11.36 | ||||||||||||||
|
|
|
|
|
| |||||||||||||||
Total returnB | (16.43 | )% | (7.06 | )% | 13.60 | %C | ||||||||||||||
|
|
|
|
|
| |||||||||||||||
Ratios and supplemental data: |
| |||||||||||||||||||
Net assets, end of period | $ | 913,709 | $ | 1,119,472 | $ | 352,882 | ||||||||||||||
Ratios to average net assets: | ||||||||||||||||||||
Expenses, before reimbursements | 3.86 | % | 3.87 | % | 6.12 | %D | ||||||||||||||
Expenses, net of reimbursementsE | 1.28 | % | 1.27 | % | 1.27 | %D | ||||||||||||||
Net investment (loss), before expense reimbursements | (2.49 | )% | (2.44 | )% | (5.09 | )%D | ||||||||||||||
Net investment income (loss), net of reimbursements | 0.09 | % | 0.16 | % | (0.24 | )%D | ||||||||||||||
Portfolio turnover rate | 48 | % | 56 | % | 22 | %F | ||||||||||||||
| A | Commencement of operations. |
| B | Based on net asset value, which does not reflect the sales charge, redemption fee, or contingent deferred sales charge, if applicable. May include adjustments in accordance with U.S. GAAP and as such, the net asset value for reporting purposes and the returns based upon those net asset values may differ from the net asset value and returns for shareholder transactions. |
| C | Not annualized. |
| D | Annualized. |
| E | Expense ratios may exceed stated expense caps in Note 2 due to security lending expenses. |
| F | Portfolio turnover rate is for the period from September 12, 2017 through June 30, 2018 and is not annualized. |
See accompanying notes
42
Federal Tax Information
June 30, 2020 (Unaudited)
Certain tax information regarding the Funds are required to be provided to shareholders based upon the Fund’s income and distributions for the taxable year ended June 30, 2020. The information and distributions reported herein may differ from information and distributions taxable to the shareholders for the calendar year ended December 31, 2019.
The Fund designated the following items with regard to distributions paid during the fiscal year ended June 30, 2020. All designations are based on financial information available as of this annual report and, accordingly, are subject to change. For each item, it is the intention of the Funds to designate the maximum amount permitted under the Internal Revenue Code of 1986, as amended, and the regulations there under.
Corporate Dividends-Received Deduction:
Shapiro Equity Opportunities | 39.28 | % | ||
Shapiro SMID Cap Equity | 48.80 | % |
Qualified Dividend Income:
Shapiro Equity Opportunities | 39.28 | % | ||
Shapiro SMID Cap Equity | 48.80 | % |
Long-Term Capital Gain Distributions:
Shapiro Equity Opportunities | $ | 1,197,707 | ||
Shapiro SMID Cap Equity | $ | 264,262 |
Short-Term Capital Gain Distributions:
Shapiro Equity Opportunities | $ | 2,824,751 | ||
Shapiro SMID Cap Equity | $ | 179,754 |
Shareholders will receive notification in January 2021 of the applicable tax information necessary to prepare their 2020 income tax returns.
43
Disclosure Regarding Approval of the Management and Investment Advisory Agreements (Unaudited)
At meetings held on May 14, 2020 and June 3-4, 2020 (collectively, the “Meetings”) via videoconference, the Board of Trustees (“Board” or “Trustees”) considered and then, at its June 4, 2020 meeting, approved the renewal of:
(1) the Management Agreement between American Beacon Advisors, Inc. (“Manager”) and the American Beacon Funds (“Trust”), on behalf of the American Beacon Shapiro Equity Opportunities Fund (“Equity Opportunities Fund”) and the American Beacon Shapiro SMID Cap Equity Fund (“SMID Cap Fund”) (each, a “Fund” and collectively, the “Funds”); and
(2) the Investment Advisory Agreement among the Manager, Shapiro Capital Management, LLC (the “subadvisor”), and the Trust, on behalf of the Funds.
The Management Agreement and the Investment Advisory Agreement are referred to herein individually as an “Agreement” and collectively as the “Agreements.” In preparation for its consideration of the renewal of the Agreements, the Board undertook steps to gather and consider information furnished by the Manager, the subadvisor, Broadridge, Inc. (“Broadridge”) and Morningstar, Inc. (“Morningstar”). The Board, with the assistance of independent legal counsel, requested and received certain relevant information from the Manager and the subadvisor.
In advance of the Meetings, the Board’s Investment Committee and/or the Manager coordinated the production of information from Broadridge and Morningstar regarding the performance, fees and expenses of the Funds as well as information from the Manager and the subadvisor. At the Meetings, the Board considered the information provided in connection with the renewal process, as well as information furnished to the Board throughout the year at regular meetings of the Board and its committees. In connection with the Board’s consideration of the Agreements, the Board received and evaluated such information as they deemed necessary. This information is described below in the section summarizing the factors the Board considered in connection with its renewal and approval of the Agreements, as well as the section describing additional Board considerations with respect to each Fund.
The Board noted that the Manager provides management and administrative services to the Funds pursuant to the Management Agreement. The Board considered that many mutual funds have separate contracts governing each type of service and observed that, with respect to such mutual funds, the actual management fee rates provided by Broadridge for peer group funds reflect the combined advisory and administrative expenses, reduced by any fee waivers and/or reimbursements.
A firm may not have been able to, or opted not to, provide information in response to certain information requests, in which case the Board conducted its evaluation of the firm based on information that was provided. In such cases, the Board determined that the omission of any such information was not material to its considerations. For each Fund, the class of shares used for comparative performance purposes was the share class with the lowest expenses available for purchase by the general public, which was the R5 Class. The Board also considered that the use of R5 Class performance generally facilitates a meaningful comparison for expense and performance purposes.
Provided below is an overview of certain factors the Board considered in connection with its decision to approve the renewal of the Agreements. The Board did not identify any particular information that was most relevant to its consideration of whether to approve the renewal of each Agreement, and each Trustee may have afforded different weight to the various factors. Legal counsel to the independent Trustees provided the Board with a memorandum regarding its responsibilities pertaining to the renewal of investment advisory contracts, such as the Agreements, and related regulatory guidelines. Based on its evaluation, the Board unanimously concluded that the terms of each Agreement were reasonable and fair and that the approval of the renewal of each Agreement was in the best interests of the Funds and their shareholders.
44
Disclosure Regarding Approval of the Management and Investment Advisory Agreements (Unaudited)
Considerations With Respect to the Renewal of the Management Agreement and the Investment Advisory Agreement
In determining whether to approve the renewal of the Agreements, the Board considered each Fund’s investment management and subadvisory relationships separately. In each instance, the Board considered, among other things, the following factors: (1) the nature, extent and quality of the services provided; (2) the investment performance of the Funds and the subadvisor for the Funds; (3) the costs incurred by the Manager and the subadvisor in rendering services to the Funds and their resulting profits or losses; (4) comparisons of services and fee rates with contracts entered into by the Manager or the subadvisor or their affiliates with other clients (such as pension funds and other institutional clients); (5) the extent to which economies of scale, if any, have been taken into account in setting each fee rate schedule; (6) whether fee rate levels reflect economies of scale, if any, for the benefit of Fund investors; and (7) any other benefits derived or anticipated to be derived by the Manager or the subadvisor from their relationships with the Funds.
Nature, Extent and Quality of Services. With respect to the renewal of the Management Agreement, the Board considered, among other factors: each Fund’s performance since its inception on September 12, 2017; the length of service of key investment personnel at the Manager; the cost structure of the Funds; the Manager’s culture of compliance and support that reduce risks to the Funds; the Manager’s quality of services; the Manager’s active role in monitoring and, as appropriate, recommending additional or replacement subadvisors; and the Manager’s efforts to retain key employees and maintain staffing levels.
With respect to the renewal of the Investment Advisory Agreement, the Board considered, among other factors: the level of staffing and the size of the subadvisor; the adequacy of the resources committed to the Funds by the subadvisor; the financial stability of the subadvisor; and subadvisor’s representations regarding its compliance program. Based on the foregoing information, the Board concluded that the nature, extent and quality of the management and advisory services provided by the Manager and the subadvisor were appropriate for each Fund.
Investment Performance. The Board evaluated the comparative information provided by Broadridge and the Manager regarding the performance of each Fund relative to its Broadridge performance universe, Morningstar Category, and/or benchmark index, as well as the Fund’s Morningstar rating. The Board considered the information provided by Broadridge regarding Broadridge’s independent methodology for selecting each Fund’s Broadridge performance universe. The Board also considered that the performance universes selected by Broadridge may not provide appropriate comparisons for a Fund. In addition, the Board considered the performance reports and discussions with management at Board and Committee meetings throughout the year. The Board also evaluated the comparative information provided by the subadvisor regarding the performance of each Fund relative to the performance of each Fund’s benchmark index and, with respect to the Equity Opportunities Fund, a composite of comparable investment accounts managed by the subadvisor. In addition, the Board considered the Manager’s recommendation to continue to retain the subadvisor. A summary of the Board’s considerations with respect to each Fund’s performance appears below under “Additional Considerations and Conclusions with Respect to Each Fund.”
Costs of the Services Provided to the Funds and the Profits Realized by the Manager from its Relationship with the Funds. In analyzing the cost of services and profitability of the Manager, the Board considered the revenues earned and the expenses incurred by the Manager, before and after the payment of distribution-related expenses by the Manager. The profits or losses were noted at both an aggregate level for all funds within the group of mutual funds sponsored by the Manager (the “Fund Complex”) and at an individual Fund level, with the Manager sustaining a loss before and after the payment of distribution-related expenses by the Manager with respect to each Fund. The Board also considered comparative information provided by the Manager regarding the Manager’s overall profitability with respect to the Fund Complex relative to the overall profitability of other firms in the mutual fund industry, as disclosed in publicly available sources. Although the Board noted that, in certain cases, the fee rates paid by other clients of the Manager are lower than the fee rates paid by the Funds, the Manager
45
Disclosure Regarding Approval of the Management and Investment Advisory Agreements (Unaudited)
represented that, among other matters, the difference is attributable to the fact that the Manager does not perform administrative services for non-investment company clients and reflects the greater level of responsibility and regulatory requirements associated with managing the Funds.
The Board also noted that the Manager proposed to continue the expense waivers and reimbursements for the Funds that were in place during the last fiscal year. The Board further considered that, with respect to each Fund, the Management Agreement provides for the Manager to receive a management fee comprised of an annualized fee that is retained by the Manager. In addition, the Board considered that the Manager receives fees for administering and overseeing the securities lending program on behalf of the Funds. The Board also noted that certain share classes of the Funds maintain higher expense ratios in order to compensate third-party financial intermediaries.
In analyzing the fee rates charged by the subadvisor in connection with its investment advisory services to the Funds, the Board considered representations made by the subadvisor that the fee rate schedule for the Equity Opportunities Fund generally was favorable compared to other comparable accounts, and that the subadvisor does not manage any comparable client accounts with respect to the SMID Cap Fund. The Board also considered the cost of services and profitability of the subadvisor.
Based on the foregoing information, the Board concluded that the profitability levels of the Manager were reasonable in light of the services performed by the Manager and the profitability levels of the subadvisor were reasonable in light of the services performed by the subadvisor. A discussion regarding the Board’s considerations with respect to each Fund’s fee rates is set forth below under “Additional Considerations and Conclusions with Respect to Each Fund.”
Economies of Scale. In considering the reasonableness of the management and investment advisory fees rates, the Board considered whether economies of scale will be realized as each Fund grows and whether fee rate levels reflect these economies of scale for the benefit of Fund shareholders. In this regard, the Board considered that the Manager has negotiated breakpoints for the subadvisory fee rate for the Funds. The Board considered that no Fund’s current assets exceeded the threshold necessary to reach the first subadvisory fee rate breakpoint.
In addition, the Board noted the Manager’s representation that the Management Agreement contains fee schedule breakpoints at higher asset levels with respect to each Fund. In this regard, the Board considered the Manager’s representation that no Fund’s current assets exceeded the threshold necessary to reach the first management fee breakpoint. Based on the foregoing information, the Board concluded that the Manager and subadvisor fee rate schedules for each Fund provide for a reasonable sharing of benefits from any economies of scale with each Fund.
Benefits Derived from the Relationship with the Funds. The Board considered the “fall-out” or ancillary benefits that accrue to the Manager and/or the subadvisor as a result of the advisory relationships with the Funds, including greater exposure in the marketplace with respect to the Manager’s or the subadvisor’s investment process and expanding the level of assets under management by the Manager and the subadvisor. The Board also considered that the Manager may invest the Funds’ cash balances and cash collateral provided by the borrowers of the Funds’ securities in the American Beacon U.S. Government Money Market Select Fund, which the Manager manages directly. Based on the foregoing information, the Board concluded that the potential benefits accruing to the Manager and the subadvisor by virtue of their relationships with the Funds appear to be fair and reasonable.
Additional Considerations and Conclusions with Respect to Each Fund
The performance comparisons below were made for each Fund’s R5 Class shares in comparison to each Fund’s Broadridge performance universe and Morningstar Category. With respect to the Broadridge performance universe, the 1st Quintile represents the top 20 percent of the universe based on performance and the 5th Quintile represents the bottom 20 percent of the universe based on performance. References below to each Fund’s Broadridge performance universe are to the universe of mutual funds with a comparable investment classification/objective included in the analysis provided by Broadridge.
46
Disclosure Regarding Approval of the Management and Investment Advisory Agreements (Unaudited)
The expense comparisons below were made for each Fund’s R5 Class shares in comparison to each Fund’s Broadridge expense universe and Broadridge expense group, with the 1st Quintile representing the lowest 20 percent of the universe or group based on lowest total expense and the 5th Quintile representing the highest 20 percent of the universe or group based on highest total expense. References below to each Fund’s expense group and expense universe are to the respective group or universe of comparable mutual funds included in the analysis by Broadridge. A Broadridge expense group consists of the Fund and a representative sample of funds with similar operating structures and asset sizes, as selected by Broadridge. A Broadridge expense universe includes all funds with a comparable investment classification/objective and a similar operating structure as the share class of the Fund included in the Broadridge comparative information, including the expense group, and provides a broader view of expenses across the Fund’s investment classification/objective. The Board also considered each Fund’s Morningstar fee level category with the 1st Quintile representing the lowest 20 percent of the category constituents and the 5th Quintile representing the highest 20 percent of the category in terms of total expense. In reviewing expenses, the Board considered the positive impact of fee waivers and the Manager’s agreement to continue the fee waivers. In addition, information regarding the subadvisor’s use of soft dollars was requested from the Manager and was considered by the Board.
Additional Considerations and Conclusions with Respect to the American Beacon Shapiro Equity Opportunities Fund
In considering the renewal of the Agreements for the Equity Opportunities Fund, the Board considered the following additional factors:
Broadridge Total Expense Analysis Excluding 12b-1 Fees and Morningstar Fee Level Ranking
Compared to Broadridge Expense Group | 2 | nd Quintile | ||
Compared to Broadridge Expense Universe | 4 | th Quintile | ||
Morningstar Fee Level Ranking | 4 | th Quintile |
Broadridge and Morningstar Performance Analysis (one-year period ended December 31, 2019)
Compared to Broadridge Performance Universe | 1 | st Quintile | ||
Compared to Morningstar Category | 1 | st Quintile |
The Board also considered: (1) the subadvisor’s representation that the fee rate charged to the Equity Opportunities Fund is lower than the fee rate schedule for the subadvisor’s separate account clients in the same strategy as the Equity Opportunities Fund; (2) that the subadvisor is an affiliate of the Manager; (3) the subadvisor’s representation that it had earned a profit with respect to the services that it provides to the Equity Opportunities Fund; and (4) the Manager’s recommendation to continue to retain the subadvisor based upon, among other factors, the relatively brief period that the Equity Opportunities Fund has been in operation.
Based on these and other considerations, the Board: (1) concluded that the fees paid to the Manager and the subadvisor under the Management and Investment Advisory Agreements are fair and reasonable; and (2) determined that the Equity Opportunities Fund and its shareholders would benefit from the Manager’s and subadvisor’s continued management of the Equity Opportunities Fund.
47
Disclosure Regarding Approval of the Management and Investment Advisory Agreements (Unaudited)
Additional Considerations and Conclusions with Respect to the American Beacon Shapiro SMID Cap Equity Fund
In considering the renewal of the Agreements for the SMID Cap Fund, the Board considered the following additional factors:
Broadridge Total Expense Analysis Excluding 12b-1 Fees and Morningstar Fee Level Ranking
Compared to Broadridge Expense Group | 1 | st Quintile | ||
Compared to Broadridge Expense Universe | 3 | rd Quintile | ||
Morningstar Fee Level Ranking | 3 | rd Quintile |
Broadridge and Morningstar Performance Analysis (one-year period ended December 31, 2018)
Compared to Broadridge Performance Universe | 2 | nd Quintile | ||
Compared to Morningstar Category | 3 | rd Quintile |
The Board also considered: (1) the subadvisor’s representation that it has no other comparable accounts in the same strategy as the subadvisor manages the SMID Cap Fund; (2) that the subadvisor is an affiliate of the Manager; (3) the subadvisor’s representation that it had incurred a loss with respect to the services that it provides to the SMID Cap Fund; and (4) the Manager’s recommendation to continue to retain the subadvisor based upon, among other factors, the relatively brief period that the SMID Cap Fund has been in operation.
Based on these and other considerations, the Board: (1) concluded that the fees paid to the Manager and the subadvisor under the Management and Investment Advisory Agreements are fair and reasonable; and (2) determined that the SMID Cap Fund and its shareholders would benefit from the Manager’s and subadvisor’s continued management of the SMID Cap Fund.
48
Disclosure Regarding Liquidity Risk Management Program (Unaudited)
Rule 22e-4 under the Investment Company Act of 1940, as amended (“Rule 22e-4”), requires open-end registered investment companies (other than money market funds) to adopt and implement a written liquidity risk management program that is reasonably designed to assess and manage liquidity risk. Each Fund has adopted a Liquidity Risk Management Program (the “Program”) that is designed to assess and manage liquidity risk, which is the risk that the Fund could not meet requests to redeem its shares without significant dilution of the remaining shareholders’ interests in the Fund. The Program was effective on December 1, 2018 and was approved by each Fund’s Board of Trustees (the “Board”) on March 6, 2019, in accordance with applicable Securities and Exchange Commission (“SEC”) guidance.
Pursuant to Rule 22e-4, the Program includes the following elements:
| • | Assessment, management, and periodic review of liquidity risk; |
| • | Classification of each of the Fund’s portfolio investments into one of four liquidity categories: highly liquid, moderately liquid, less liquid, and illiquid; |
| • | Determination and review of a highly liquid investment minimum for any Fund that does not primarily hold assets that are highly liquid investments; |
| • | Policies and procedures to respond to a shortfall in the highly liquid investment minimum, including associated reports to the Board and the SEC; |
| • | A prohibition against a Fund acquiring an illiquid investment if immediately after the acquisition the Fund would have more than 15% of its net assets invested in illiquid investments that are assets; |
| • | Reporting of breaches of the illiquid investment prohibition to the Board and the SEC; and |
| • | Policies and procedures regarding how and when a Fund will satisfy redemption requests by distributing portfolio securities or other assets. |
The Board has approved the designation of the Manager’s Liquidity Committee as the Program administrator with responsibility for administering the Program. Since the implementation of the Program, the Liquidity Committee has provided written reports to the Board on a quarterly basis regarding each Fund’s liquidity risk. In addition, at the Board’s March 3-4, 2020 meetings, the Board reviewed the Liquidity Committee’s written report (“Report”) that addressed the operation of the Program and assessed the adequacy and effectiveness of its implementation from the Program’s inception on December 1, 2018 through December 31, 2019 (the “review period”).
Key conclusions that the Liquidity Committee included in the Report are listed below:
| • | The Program is reasonably designed to assess and manage each Fund’s liquidity risk. |
| • | The operation of the Program was adequate during the review period. |
| • | Each Fund included in this shareholder report was deemed to primarily hold assets that are highly liquid, and no highly liquid investment minimum was recommended. |
| • | The Program was effectively implemented by the Liquidity Committee during the review period. |
| • | Administration of the Program by the Liquidity Committee continues to be appropriate. |
49
Trustees and Officers of the American Beacon FundsSM (Unaudited)
The Trustees and officers of the American Beacon Funds (the “Trust”) are listed below, together with their principal occupations during the past five years. The address of each person listed below is 220 Las Colinas Boulevard East, Suite 1200, Irving, Texas 75039. Each Trustee oversees twenty-seven funds in the fund complex that includes the Trust, the American Beacon Select Funds, the American Beacon Institutional Funds Trust, the American Beacon Sound Point Enhanced Income Fund, and the American Beacon Apollo Total Return Fund. The Trust’s Statement of Additional Information contains additional information about the Trustees and is available without charge by calling 1-800-658-5811.
Name, Age | Position, Term of Office and Length of Time Served with the Trust | Principal Occupation(s) During Past 5 Years and Current Directorships | ||
| NON-INTERESTED TRUSTEES | Term | |||
Lifetime of Trust until removal, resignation or retirement* | ||||
| Gilbert G. Alvarado (50) | Trustee since 2015 | President, SJVIIF, LLC, Impact Investment Fund (2018-Present); Director, Kura MD, Inc. (local telehealth organization) (2015-2017); Senior Vice President & CFO, Sierra Health Foundation (health conversion private foundation) (2006-Present); Senior Vice President & CFO, Sierra Health Foundation: Center for Health Program Management (California public benefit corporation) (2012-Present); Director, Innovative North State (2012-2015); Director, Sacramento Regional Technology Alliance (2011-2016); Director, Valley Healthcare Staffing (2017–2018); Trustee, American Beacon Select Funds (2015-Present); Trustee, American Beacon Institutional Funds Trust (2017-Present); Trustee, American Beacon Sound Point Enhanced Income Fund (2018–Present); Trustee, American Beacon Apollo Total Return Fund (2018–Present). | ||
| Joseph B. Armes (58) | Trustee since 2015 | Director, Switchback Energy Acquisition (2019-Present); Chairman & CEO, CSW Industrials f/k/a Capital Southwest Corporation (investment company) (2015-Present); Chairman of the Board of Capital Southwest Corporation, predecessor to CSW Industrials, Inc. (2014-2017) (investment company); CEO, Capital Southwest Corporation (2013-2015); President & CEO, JBA Investment Partners (family investment vehicle) (2010-Present); Director and Chair of Audit Committee, RSP Permian (oil and gas producer) (2013-2018); Trustee, American Beacon Select Funds (2015-Present); Trustee, American Beacon Institutional Funds Trust (2017-Present); Trustee, American Beacon Sound Point Enhanced Income Fund (2018–Present); Trustee, American Beacon Apollo Total Return Fund (2018–Present). | ||
| Gerard J. Arpey (61) | Trustee since 2012 | Director, The Home Depot, Inc. (2015-Present); Partner, Emerald Creek Group (private equity firm) (2011-Present); Director, S.C. Johnson & Son, Inc. (privately held company) (2008-present); Trustee, American Beacon Select Funds (2012-Present); Trustee, American Beacon Institutional Funds Trust (2017-Present); Trustee, American Beacon Sound Point Enhanced Income Fund (2018–Present); Trustee, American Beacon Apollo Total Return Fund (2018–Present). | ||
| Brenda A. Cline (59) | Trustee since 2004 Chair since 2019 Vice Chair 2018 | Chief Financial Officer, Treasurer and Secretary, Kimbell Art Foundation (1993-Present); Director, Tyler Technologies, Inc. (public sector software solutions company) (2014-Present); Director, Range Resources Corporation (oil and natural gas company) (2015-Present); Trustee, Cushing Closed-End and Open-End Funds (2017-Present); Trustee, American Beacon Select Funds (2004-Present); Trustee, American Beacon Institutional Funds Trust (2017-Present); Trustee, American Beacon Sound Point Enhanced Income Fund (2018–Present); Trustee, American Beacon Apollo Total Return Fund (2018–Present). | ||
50
Trustees and Officers of the American Beacon FundsSM (Unaudited)
Name, Age | Position, Term of Office and Length of Time Served with the Trust | Principal Occupation(s) During Past 5 Years and Current Directorships | ||
| NON-INTERESTED TRUSTEES (CONT.) | Term | |||
Lifetime of Trust until removal, resignation or retirement* | ||||
| Eugene J. Duffy (65) | Trustee since 2008 | Managing Director, Global Investment Management Distribution, Mesirow Financial (2016-Present); Managing Director, Institutional Services, Intercontinental Real Estate Corporation (2014-Present); Trustee, American Beacon Select Funds (2008-Present); Trustee, American Beacon Institutional Funds Trust (2017-Present); Trustee, American Beacon Sound Point Enhanced Income Fund (2018–Present); Trustee, American Beacon Apollo Total Return Fund (2018–Present). | ||
| Claudia A. Holz (62) | Trustee since 2018 | Partner, KPMG LLP (1990 – 2017); Trustee, American Beacon Select Funds (2018-Present); Trustee, American Beacon Institutional Funds Trust (2018-Present); Trustee, American Beacon Sound Point Enhanced Income Fund (2018–Present); Trustee, American Beacon Apollo Total Return Fund (2018–Present). | ||
| Douglas A. Lindgren (58) | Trustee since 2018 | CEO North America, Carne Global Financial Services (2016-2017); Consultant, Carne Financial Services (2017-2019); Managing Director, IPS Investment Management and Global Head, Content Management, UBS Wealth Management (2010-2016); Trustee, American Beacon Select Funds (2018-Present); Trustee, American Beacon Institutional Funds Trust (2018-Present); Trustee, American Beacon Sound Point Enhanced Income Fund (2018–Present); Trustee, American Beacon Apollo Total Return Fund (2018–Present). | ||
| Barbara J. McKenna, CFA (57) | Trustee since 2012 | President/Managing Principal, Longfellow Investment Management Company (2005-Present); Trustee, American Beacon Select Funds (2012-Present); Trustee, American Beacon Institutional Funds Trust (2017-Present); Trustee, American Beacon Sound Point Enhanced Income Fund (2018–Present); Trustee, American Beacon Apollo Total Return Fund (2018–Present). | ||
| R. Gerald Turner (74) | Trustee since 2001 | President, Southern Methodist University (1995-Present); Director, J.C. Penney Company, Inc. (1996-2019); Director, Kronus Worldwide Inc. (chemical manufacturing) (2003-Present); Trustee, American Beacon Select Funds (2001-Present); Trustee, American Beacon Institutional Funds Trust (2017-Present); Trustee, American Beacon Sound Point Enhanced Income Fund (2018 – Present); Trustee, American Beacon Apollo Total Return Fund (2018–Present). | ||
51
Trustees and Officers of the American Beacon FundsSM (Unaudited)
Name, Age | Position, Term of Office and Length of Time Served with the Trust | Principal Occupation(s) During Past 5 Years and Current Directorships | ||
| OFFICERS | Term | |||
| One Year | ||||
| Gene L. Needles, Jr. (65) | President since 2009 | President (2009-2018), CEO and Director (2009–Present), and Chairman (2018-Present), American Beacon Advisors, Inc., President (2015-2018), Director and CEO (2015–Present), and Chairman (2018-Present), Resolute Investment Holdings, LLC; President (2015-2018), Director and CEO (2015-Present), and Chairman (2018-Present),Resolute Topco, Inc.; President (2015-2018); Director, and CEO (2015-Present), and Chairman (2018-Present), Resolute Acquisition, Inc.; President (2015-2018), Director and CEO (2015-Present), Chairman (2018-Present), Resolute Investment Managers, Inc.; Director, Chairman, President and CEO, Resolute Investment Distributors (2017-Present); Director, Chairman, President and CEO; Resolute Investment Services, Inc. (2017-Present); President and CEO, Lighthouse Holdings Parent, Inc. (2009-2015); President, CEO and Director, Lighthouse Holdings, Inc. (2009-2015); Manager, President and CEO, American Private Equity Management, LLC (2012-Present); Director, Chairman, President and CEO, Alpha Quant Advisors, LLC (2016-2020); Director, ARK Investment Management LLC (2016-Present); Director, Shapiro Capital Management LLC (2017-Present); Director, Chairman and CEO, Continuous Capital, LLC (2018-Present); Director, Green Harvest Asset Management (2019-Present); Director, National Investment Services of America, LLC (2019 – Present); President, American Beacon Cayman Managed Futures Strategy Fund, Ltd. (2014-Present); Director and President, American Beacon Cayman Transformational Innovation Company, LTD., (2017-2018); President, American Beacon Delaware Transformational Innovation Corporation (2017-2018); President American Beacon Cayman TargetRisk Company, Ltd. (2018-Present);Member, Investment Advisory Committee, Employees Retirement System of Texas (2017-Present); Trustee, American Beacon NextShares Trust (2015-Present); President, American Beacon Select Funds (2009-Present); President, American Beacon Institutional Funds Trust (2017-Present); President, American Beacon Sound Point Enhanced Income Fund (2018-Present); President, American Beacon Apollo Total Return Fund (2018-Present); Director, RSW Investments Holdings LLC, (2019-Present); Manager, SSI Investment Management, LLC (2019-Present). | ||
| Rosemary K. Behan (61) | VP, Secretary and Chief Legal Officer since 2006 | Vice President, Secretary and General Counsel, American Beacon Advisors, Inc. (2006-Present); Secretary, Resolute Investment Holdings, LLC (2015-Present); Secretary, Resolute Topco, Inc. (2015-Present); Secretary, Resolute Acquisition, Inc. (2015–Present); Vice President, Secretary and General Counsel, Resolute Investment Managers, Inc. (2015-Present); Secretary, Resolute Investment Distributors, Inc. (2017-Present); Vice President, Secretary and General Counsel, Resolute Investment Services, Inc. (2017-Present); Vice President and Secretary, Lighthouse Holdings Parent, Inc. (2008-2015); Vice President and Secretary, Lighthouse Holdings, Inc. (2008-2015); Secretary, American Private Equity Management, LLC (2008-Present); Secretary and General Counsel, Alpha Quant Advisors, LLC (2016-2020); Vice President and Secretary, Continuous Capital, LLC (2018-Present); Secretary, Green Harvest Asset Management (2019-Present); Secretary, American Beacon Delaware Transformational Innovation Corporation (2017-2018); Secretary, American Beacon Cayman Transformational Innovation Company, Ltd. (2017-2018); Secretary, American Beacon Cayman Managed Futures Strategy Fund, Ltd. (2014-Present); Secretary, American Beacon Cayman TargetRisk Company, Ltd (2018-Present); Chief Legal Officer, Vice President and Secretary, American Beacon Select Funds (2006-Present); Chief Legal Officer, Vice President and Secretary, American Beacon Institutional Funds Trust (2017-Present); Chief Legal Officer, Vice President and Secretary, American Beacon Sound Point Enhanced Income Fund (2018-Present); Chief Legal Officer, Vice President and Secretary American Beacon Apollo Total Return Fund (2018-Present). | ||
52
Trustees and Officers of the American Beacon FundsSM (Unaudited)
Name, Age | Position, Term of Office and Length of Time Served with the Trust | Principal Occupation(s) During Past 5 Years and Current Directorships | ||
| OFFICERS (CONT.) | Term | |||
| One Year | ||||
| Brian E. Brett (60) | VP since 2004 | Senior Vice President, Head of Distribution (2012-Present), Vice President, Director of Sales (2004-2012), American Beacon Advisors, Inc.; Senior Vice President, Resolute Investment Managers, Inc. (2017-Present); Senior Vice President, Resolute Investment Distributors, Inc. (2018-Present), Senior Vice President, Resolute Investment Services, Inc. (2018-Present); Senior Vice President, Lighthouse Holdings Parent, Inc. (2008-2015); Senior Vice President, Lighthouse Holdings, Inc. (2008-2015); Vice President, American Beacon Select Funds (2004-Present); Vice President, American Beacon Institutional Funds Trust (2017-Present); Vice President American Beacon Sound Point Enhanced Income Fund (2018-Present); Vice President American Beacon Apollo Total Return Fund (2018-Present). | ||
| Paul B. Cavazos (51) | VP since 2016 | Chief Investment Officer and Senior Vice President, American Beacon Advisors, Inc. (2016-Present); Chief Investment Officer, DTE Energy (2007-2016); Vice President, American Private Equity Management, L.L.C. (2017–Present); Vice President, American Beacon Select Funds (2016-Present); Vice President, American Beacon Institutional Funds Trust (2017-Present); Vice President American Beacon Sound Point Enhanced Income Fund (2018-Present); Vice President American Beacon Apollo Total Return Fund (2018-Present). | ||
| Erica Duncan (49) | VP Since 2011 | Vice President, American Beacon Advisors, Inc. (2011-Present); Vice President, Resolute Investment Managers (2018-Present); Vice President, Resolute Investment Services, Inc. (2018-Present); Vice President, American Beacon Select Funds (2011-Present); Vice President, American Beacon Institutional Funds Trust (2017-Present); Vice President American Beacon Sound Point Enhanced Income Fund (2018-Present); Vice President American Beacon Apollo Total Return Fund (2018-Present). | ||
| Melinda G. Heika (59) | Principal Accounting Officer since 2017 and Treasurer since 2010 | Treasurer and CFO (2010-Present), American Beacon Advisors, Inc.; Treasurer, Resolute Topco, Inc. (2015-Present); Treasurer, Resolute Investment Holdings, LLC. (2015-Present); Treasurer, Resolute Acquisition, Inc. (2015-Present); Treasurer and CFO, Resolute Investment Managers, Inc. (2017-Present); Treasurer, Resolute Investment Distributors, Inc. (2017-2017); Treasurer and CFO, Resolute Investment Services, Inc. (2015-Present); Treasurer, Lighthouse Holdings Parent Inc., (2010-2015); Treasurer, Lighthouse Holdings, Inc. (2010-2015); Treasurer, American Private Equity Management, LLC (2012-Present); Treasurer and CFO, Alpha Quant Advisors, LLC (2016-2020); Treasurer and CFO, Continuous Capital, LLC (2018-Present); Treasurer, Green Harvest Asset Management (2019-Present); Treasurer, American Beacon Cayman Transformational Innovation, Ltd. (2017-2018); Treasurer, American Beacon Delaware Transformational Innovation Corporation (2017-2018); Director and Treasurer, American Beacon Cayman Managed Futures Strategy Fund, Ltd. (2014-Present); Treasurer, American Beacon Cayman TargetRisk Company, Ltd. (2018-Present); Principal Accounting Officer (2017-Present) and Treasurer, American Beacon Select Funds (2010-Present); Principal Accounting Officer and Treasurer, American Beacon Institutional Funds Trust (2017-Present); Principal Accounting Officer and Treasurer, American Beacon Sound Point Enhanced Income Fund (2018-Present); Principal Accounting Officer and Treasurer, American Beacon Apollo Total Return Fund (2018-Present). | ||
| Terri L. McKinney (56) | VP since 2010 | Vice President (2009-Present), Managing Director (2003-2009), American Beacon Advisors, Inc.; Vice President, Resolute Investment Managers, Inc. (2017-Present); Vice President, Resolute Investment Services, Inc (2018-Present); Vice President, Alpha Quant Advisors, LLC (2016-Present); Vice President, Continuous Capital, LLC (2018-Present); Vice President, American Beacon Select Funds (2010-Present); Vice President, American Beacon Institutional Funds Trust (2017-Present); Vice President, American Beacon Sound Point Enhanced Income Fund (2018-Present); Vice President, American Beacon Apollo Total Return Fund (2018-Present). | ||
53
Trustees and Officers of the American Beacon FundsSM (Unaudited)
Name, Age | Position, Term of Office and Length of Time Served with the Trust | Principal Occupation(s) During Past 5 Years and Current Directorships | ||
| OFFICERS (CONT.) | Term | |||
| One Year | ||||
| Jeffrey K. Ringdahl (45) | VP since 2010 | Director (2015-Present), President (2018-Present), Chief Operating Officer (2010-Present), Senior Vice President (2013-2018), Vice President (2010-2013), American Beacon Advisors, Inc.; Director (2015-Present), President (2018-Present), Senior Vice Present (2015-2018), Resolute Investment Holdings, LLC; Director (2015-Present), President (2018-Present), Senior Vice President (2015-2018), Resolute Topco, Inc.; Director (2015-Present), President (2018-Present), Senior Vice President (2015-2018), Resolute Acquisition, Inc.; Director (2015-Present), President & COO (2018-Present), Senior Vice President (2015-2018), Resolute Investment Managers, Inc.; Director and Executive Vice President (2017-Present), Resolute Investment Distributors, Inc.; Director (2017-Present), President & COO (2018-Present), Executive Vice President (2017-2018), Resolute Investment Services, Inc.; Senior Vice President (2017-Present), Vice President (2012-2017), Manager (2015-Present), American Private Equity Management, LLC; Senior Vice President, Lighthouse Holdings Parent, Inc. (2013-2015); Senior Vice President, Lighthouse Holdings, Inc. (2013-2015); Trustee, American Beacon NextShares Trust (2015-Present); Director, Executive Vice President & COO, Alpha Quant Advisors, LLC (2016-2020); Director, Shapiro Capital Management, LLC (2017-Present); Director, Executive Vice President & COO, Continuous Capital, LLC (2018-Present); Director, RSW Investments Holdings LLC, (2019-Present); Manager, SSI Investment Management, LLC (2019-Present); Director, National Investment Services of America, LLC (2019-Present); Director and Vice President, American Beacon Cayman Transformational Innovation Company, Ltd., (2017-Present); Vice President, American Beacon Delaware Transformational Innovation Corporation (2017-2018); Director and Vice President, American Beacon Cayman Managed Futures Strategy Fund, Ltd. (2014-Present); Vice President, American Beacon Cayman TargetRisk Company, Ltd (2018-Present); Vice President, American Beacon Select Funds (2010-2018); Vice President, American Beacon Institutional Funds Trust (2017-Present); Vice President, American Beacon Sound Point Enhanced Income Fund (2018-Present); Vice President, American Beacon Apollo Total Return Fund (2018-Present). | ||
| Samuel J. Silver (57) | VP Since 2011 | Vice President (2011-Present), Chief Fixed Income Officer (2016-Present), American Beacon Advisors, Inc. (2011-Present); Vice President, American Beacon Select Funds (2011-Present); Vice President, American Beacon Institutional Funds Trust (2017-Present); Vice President, American Beacon Sound Point Enhanced Income Fund (2018-Present); Vice President, American Beacon Apollo Total Return Fund (2018-Present). | ||
| Christina E. Sears (48) | Chief Compliance Officer since 2004 and Asst. Secretary since 1999 | Vice President, American Beacon Advisors, Inc. (2019-Present); Chief Compliance Officer, American Beacon Advisors, Inc. (2004-Present); Vice President, Resolute Investment Managers, Inc. (2017-Present); Vice President, Resolute Investment Distributors (2017-Present); Vice President, Resolute Investment Services, Inc. (2019-Present); Chief Compliance Officer, American Private Equity Management, LLC (2012-Present); Chief Compliance Officer (2016-2019) and Vice President, Alpha Quant Advisors, LLC (2016-2020); Vice President, Continuous Capital, LLC (2018-Present); Chief Compliance Officer (2004-Present) and Assistant Secretary (1999-Present), American Beacon Select Funds; Chief Compliance Officer and Assistant Secretary, American Beacon Institutional Funds Trust (2017-Present); Chief Compliance Officer and Assistant Secretary, American Beacon Sound Point Enhanced Income Fund (2018-Present); Chief Compliance Officer and Assistant Secretary, American Beacon Apollo Total Return Fund (2018-Present). | ||
54
Trustees and Officers of the American Beacon FundsSM (Unaudited)
Name, Age | Position, Term of Office and Length of Time Served with the Trust | Principal Occupation(s) During Past 5 Years and Current Directorships | ||
| OFFICERS (CONT.) | Term | |||
| One Year | ||||
| Sonia L. Bates (63) | Asst. Treasurer since 2011 | Assistant Treasurer, American Beacon Advisors, Inc. (2011-2018); Assistant Treasurer, Lighthouse Holdings Parent Inc. (2011-2015); Assistant Treasurer, Lighthouse Holdings, Inc. (2011-2015); Assistant Treasurer, American Private Equity Management, LLC (2012-Present); Assistant Treasurer, American Beacon Cayman Transformational Innovation Company, Ltd. (2017-Present); Assistant Treasurer, American Beacon Cayman TargetRisk Company, Ltd. (2018-Present); Assistant Treasurer, American Beacon Select Funds (2011-Present); Assistant Treasurer, American Beacon Institutional Funds Trust (2017-Present); Assistant Treasurer, American Beacon Sound Point Enhanced Income Fund (2018-Present); Assistant Treasurer, American Beacon Apollo Total Return Fund (2018-Present). | ||
| Shelley D. Abrahams (45) | Assistant Secretary since 2008 | Assistant Secretary, American Beacon Select Funds (2008-Present); Assistant Secretary, American Beacon Institutional Funds Trust (2017-Present); Assistant Secretary, American Beacon Sound Point Enhanced Income Fund (2018-Present); Assistant Secretary, American Beacon Apollo Total Return Fund (2018-Present); | ||
| Rebecca L. Harris (53) | Assistant Secretary since 2010 | Vice President, American Beacon Advisors, Inc. (2011-Present); Vice President, Resolute Investment Managers, Inc. (2017-Present); Vice President, Resolute Investment Services (2015-Present); Vice President, Alpha Quant Advisors, LLC (2016-2020); Vice President, Continuous Capital, LLC (2018-Present); Assistant Secretary, American Beacon Select Funds (2010-Present); Assistant Secretary, American Beacon Institutional Funds Trust (2017-Present); Assistant Secretary, American Beacon Sound Point Enhanced Income Fund (2018-Present); Assistant Secretary, American Beacon Apollo Total Return Fund (2018-Present). | ||
| Teresa A. Oxford (61) | Assistant Secretary since 2015 | Assistant Secretary, American Beacon Advisors, Inc. (2015-Present); Assistant Secretary, Resolute Investment Distributors (2018-Present); Assistant Secretary, Resolute Investment Services (2018-Present); Assistant Secretary, Alpha Quant Advisors, LLC (2016-2020); Assistant Secretary, American Beacon Select Funds (2015-Present); Assistant Secretary, American Beacon Institutional Funds Trust (2017-Present); Assistant Secretary, American Beacon Sound Point Enhanced Income Fund (2018-Present); Assistant Secretary, American Beacon Apollo Total Return Fund (2018-Present); . | ||
| Peter A. Davidson (47)** | Assistant Secretary Since 2020 | Assistant Secretary, American Beacon Select Funds (2020-Present); Assistant Secretary, American Beacon Institutional Funds Trust (2020-Present); Assistant Secretary, American Beacon Sound Point Enhanced Income Fund (2020-Present); Assistant Secretary, American Beacon Apollo Total Return Fund (2020-Present). | ||
* As of 11/12/2014, the Board adopted a retirement plan that requires Trustees to retire no later than the last day of the calendar year in which they reach the age of 75.
** Mr. Davidson resigned as of July 31, 2020.
55
Privacy Policy
June 30, 2020 (Unaudited)
The American Beacon Funds recognize and respect the privacy of our shareholders. We are providing this notice to you so you will understand how shareholder information may be collected and used.
We may collect nonpublic personal information about you from one or more of the following sources:
| • | information we receive from you on applications or other forms; |
| • | information about your transactions with us or our service providers; and |
| • | information we receive from third parties. |
We do not disclose any nonpublic personal information about our customers or former customers to anyone, except as permitted by law.
We restrict access to your nonpublic personal information to those employees or service providers who need to know that information to provide products or services to you. To ensure the confidentiality of your nonpublic personal information, we maintain safeguards that comply with federal standards.
56

eDelivery is NOW AVAILABLE - Stop traditional mail delivery and receive your
shareholder reports and summary prospectus on-line. Sign up at
www.americanbeaconfunds.com
If you invest in the Fund through a financial institution, you may be able to receive the Fund’s regulatory mailings, such as the Prospectus, Annual Report and Semi-Annual Report, by e-mail. If you are interested in this option, please go to www.icsdelivery.com and search for your financial institution’s name or contact your financial institution directly.
To obtain more information about the Fund:
 |  | |
| By E-mail: | On the Internet: | |
| american_beacon.funds@ambeacon.com | Visit our website at www.americanbeaconfunds.com | |
By Telephone: Call (800) 658-5811 |
By Mail: American Beacon Funds P.O. Box 219643 Kansas City, MO 64121-9643 | |
| Availability of Quarterly Portfolio Schedules | Availability of Proxy Voting Policy and Records | |
| In addition to the Schedule of Investments provided in each semi-annual and annual report, the Fund files a complete schedule of its portfolio holdings with the Securities and Exchange Commission (“SEC”) on Form N-PORT as of the end of each fiscal quarter. The Fund’s Forms N-PORT are available on the SEC’s website at www.sec.gov. The Forms N-PORT may also be reviewed and copied at the SEC’s Public Reference Section, 100 F Street, NE, Washington, D.C. 20549-2736. Information regarding the operation of the SEC’s Public Reference Room may be obtained by calling (800)-SEC-0330. A complete schedule of the Fund’s portfolio holdings is also available at www.americanbeaconfunds.com approximately sixty days after the end of each quarter. | A description of the policies and procedures the Fund uses to determine how to vote proxies relating to portfolio securities is available in the Fund’s Statement of Additional Information, is available free of charge on the Fund’s website www.americanbeaconfunds.com and by calling 1-800-967-9009 or by accessing the SEC’s website at www.sec.gov. The Fund’s proxy voting record for the most recent year ended June 30 is filed annually with the SEC on Form N-PX. The Fund’s Forms N-PX are available on the SEC’s website at www.sec.gov. The Fund’s proxy voting record may also be obtained by calling 1-800-967-9009. | |


Fund Service Providers:
CUSTODIAN State Street Bank and Trust Company Boston, Massachusetts | TRANSFER AGENT DST Asset Manager Solutions, Inc. Quincy, Massachusetts | INDEPENDENT REGISTERED PUBLIC ACCOUNTING FIRM PricewaterhouseCoopers LLP Boston, Massachusetts | DISTRIBUTOR Resolute Investment Distributors, Inc. Irving, Texas |
This report is prepared for shareholders of the American Beacon Funds and may be distributed to others only if preceded or accompanied by a current Prospectus or Summary Prospectus.
American Beacon Funds, American Beacon Shapiro Equity Opportunities Fund and Shapiro SMID Cap Equity Fund are service marks of American Beacon Advisors, Inc.
AR 6/20

About American Beacon Advisors
Since 1986, American Beacon Advisors, Inc. has offered a variety of products and investment advisory services to numerous institutional and retail clients, including a variety of mutual funds, corporate cash management, and separate account management.
Our clients include defined benefit plans, defined contribution plans, foundations, endowments, corporations, financial planners, and other institutional investors. With American Beacon Advisors, you can put the experience of a multi-billion dollar asset management firm to work for your company.
SSI ALTERNATIVE INCOME FUND
The use of fixed-income securities, including convertible securities, entails interest rate and credit risks. In addition, the value of a convertible security could fluctuate based on the value of the underlying stock. Investing in derivative instruments involves liquidity, credit, interest rate and market risks. The Fund’s investments in high-yield securities, including restricted securities and floating rate securities, are subject to greater levels of credit, interest rate, market and liquidity risks than investment-grade securities. Short sales involve special risks, including greater reliance on the sub-advisor’s ability to accurately anticipate the future value of a security or instrument; the Fund’s losses are potentially unlimited in a short sale. Investing in foreign and emerging market securities may involve heightened risk due to currency fluctuations and economic and political risks. Investing in small- or mid-capitalization stocks may involve greater volatility and lower liquidity than larger company stocks. Please see the prospectus for a complete discussion of the Fund’s risks. There can be no assurances that the investment objectives of this Fund will be met.
TWENTYFOUR SHORT TERM BOND FUND
The Fund’s investments in debt securities entail interest rate risk which is the risk that debt securities will decrease in value with increases in market interest rates. Investing in high-yield securities is subject to greater levels of credit, interest rate, market and liquidity risks than investment-grade securities. Investing in derivative instruments, including forwards, futures, options, swaps and other instruments, involves liquidity, credit, interest rate and market risks and in some cases the addition of financial leverage, which can magnify these risks. Investing in foreign securities may involve heightened risk due to currency fluctuations and economic and political risks. The Fund may have high portfolio turnover risk, which could increase the Fund’s transaction costs and possibly have a negative impact on performance. Because the Fund may invest in fewer issuers than a more diversified portfolio, the fluctuating value of a single holding may have a greater effect on the value of the Fund. To the extent the Fund invests more heavily in particular sectors, its performance will be sensitive to factors affecting those sectors. Financial sector companies are heavily regulated and particularly sensitive to interest rate fluctuations. To the extent the Fund invests more heavily in a particular country or geographic region, its performance will be sensitive to factors affecting that country or region. United Kingdom securities are subject to continued uncertainty and instability arising from the United Kingdom’s departure from the European Union. Geopolitical and other events have led to market disruptions causing adverse changes in the value of investments broadly. Changes in value may be temporary or may last for extended periods. Please see the prospectus for a complete discussion of the Fund’s risks. There can be no assurances that the investment objectives of this Fund will be met.
TWENTYFOUR STRATEGIC INCOME FUND
Investing in derivative instruments involves liquidity, credit, interest rate and market risks. Investments in high-yield securities are subject to greater levels of credit, interest rate, market and liquidity risks than investment-grade securities. Because the Fund may invest in fewer issuers than a more diversified portfolio, the fluctuating value of a single holding may have a greater effect on the value of the Fund. Investing in foreign and emerging market securities may involve heightened risk due to currency fluctuations and economic and political risks. Please see the prospectus for a complete discussion of the Fund’s risks. There can be no assurances that the investment objectives of this Fund will be met.
Any opinions herein, including forecasts, reflect our judgment as of the end of the reporting period and are subject to change. Each advisor’s strategies and each Fund’s portfolio composition will change depending on economic and market conditions. This report is not a complete analysis of market conditions, and, therefore, should not be relied upon as investment advice. Although economic and market information has been compiled from reliable sources, American Beacon Advisors, Inc. makes no representation as to the completeness or accuracy of the statements contained herein.
American Beacon Funds | June 30, 2020 |
| 1 | ||||
| 4 | ||||
| 14 | ||||
| 17 | ||||
Schedules of Investments: | ||||
| 19 | ||||
| 29 | ||||
| 33 | ||||
| 42 | ||||
| 47 | ||||
Financial Highlights: | ||||
| 80 | ||||
| 83 | ||||
| 87 | ||||
| 93 | ||||
Disclosure Regarding Approvals of the Management and Investment Advisory Agreements | 94 | |||
| 102 | ||||
| 103 | ||||
| 109 | ||||
| Back Cover |
 | Dear Shareholders,
Unlike anything we’ve experienced in our lifetimes, the COVID-19 pandemic continues to have an overwhelming effect on the world’s population, economies and markets. During this reporting period, news reports related to the virus dominated headlines:
u On March 15, the Federal Reserve cut the federal funds rate by 100 basis points (1%) to a range of 0% to 0.25%, and announced quantitative easing would be unlimited.
u Also in March, the U.S. government passed a stimulus package in three phases: phase one for approximately $8.3 billion, phase two for approximately $100 billion, and phase three for approximately $2 trillion. |
| u | On April 20, the price of U.S. oil turned negative for the first time in history, closing at -$37.60 per barrel for oil deliveries in May. However, by the end of June, the average crude oil spot price – which calculates an equally weighted price for West Texas Intermediate, Brent and Dubai crude oils – was $39.46 per barrel. |
| u | Although equity markets around the world have rebounded since the lows experienced earlier this year, uncertainty and volatility remain while economies continue to feel the effects of the pandemic. In the U.S., initial estimates indicated gross domestic product fell 9.5% for the second quarter – an annualized decline of 32.9% – making it the sharpest economic contraction in modern history. |
| u | As of June 30, the virus had infected more than 10 million individuals around the world, resulting in more than 503,000 deaths. The U.S. alone accounted for more than 2.5 million confirmed cases and more than 126,000 deaths. |
Now more than ever, we recognize that fear of loss can be a powerful emotion, leading many investors to make short-term decisions subject to a variety of potential error-leading biases. Unfortunately, short-term investment decisions may derail future plans. We encourage investors to maintain focus on their long-term financial goals, working with financial professionals to make thoughtful adjustments to their changing needs.
The three Ds – direction, discipline and diversification – may help frame this conversation.
| u | Direction: Achieving your long-term financial goals requires an individualized plan of action. You may want your plan to provide some measure of protection against periods of geopolitical turmoil, economic uncertainty, market volatility and job insecurity. Your plan should be reviewed annually and be adjusted in the event your long-range needs change. |
| u | Discipline: Long-term, systematic participation in an investment portfolio requires your resolution to stay the course. Spending time in the market – rather than trying to time the market – may place you in a better position to reach your long-term financial goals. |
| u | Diversification: By investing in different investment styles and asset classes, you may be able to help mitigate financial risks across your investment portfolio. By allocating your investment portfolio according to your risk-tolerance level, you may be better positioned to weather storms and achieve your long-term financial goals. |
1
President’s Message
American Beacon has endeavored to provide investors with a disciplined approach to realizing long-term financial goals since 1986. As a manager of managers, we strive to provide investment products that may enable investors to participate during market upswings while potentially insulating against market downswings. The investment teams behind our mutual funds seek to produce consistent, long-term results rather than focus only on short-term movements in the markets. In managing our investment products, we emphasize identifying opportunities that offer the potential for long-term rewards.
Thank you for staying the course with American Beacon. For additional information about our investment products or to access your account information, please visit our website at www.americanbeaconfunds.com.
Best Regards,

Gene L. Needles, Jr.
President
American Beacon Funds
2
Global Bond Market Overview
June 30, 2020 (Unaudited)
The 12-month period began in July 2019 with the credit markets grinding steadily tighter, and the second half of the 2019 calendar year ended on a strong note. U.S. investment-grade and high-yield bonds fared particularly well as the Federal Reserve’s concerns around potentially slower global growth, low inflation, and lingering trade uncertainty resulted in three interest rate cuts in 2019, providing a meaningful tailwind for risk assets. Fixed-rate, high-yield bonds outperformed floating-rate, leveraged loans given declining interest rates and investor appetite for yield. For the second half of 2019, the ICE BofA U.S. Corporate Index (“Investment Grade”) returned 4.3%, which was in line with the ICE BofA U.S. High Yield Index (“High Yield”) return of 3.9%. The S&P/LSTA Leveraged Loan Index (“Loans”) returned 2.7% and the JP Morgan Emerging Market Bond Global Diversified Index (“Emerging Market”) returned 3.3%. By comparison, the ICE BofA U.S. Treasury Index (“Treasuries”) returned 1.6%.
Despite the supportive backdrop, the lowest-rated CCC issues in the high-yield and loan markets underperformed higher-rated securities notably. This trend was atypical during a period of market strength, and it likely reflected late-cycle skepticism from investors and weakening credit technicals in the collateralized loan obligation market.
Markets entered 2020 with a flurry of tense global headlines, which muted gains in various credit sectors. Escalating tensions between the U.S. and Iran, the initial outbreak of COVID-19 and a ramp up of the U.S. presidential election rhetoric caused investors to look for the sidelines as concerns mounted. By mid-March, virus lockdowns were in place across much of the globe and the stampede into safe-haven assets had begun. Unlike the slow-building correction during the 2008 financial crisis, this crisis took place seemingly overnight.
As recently as late February 2020, the S&P 500 Index closed at an all-time high, yet by the end of March, it was down 20% year-to-date and officially entered bear-market territory. March was a month for the record books for all the wrong reasons. The CBOE Volatility Index registered the highest reading since 2009. Oil markets had their worst month since futures started trading in 1983 as the West Texas Intermediate (“WTI”) crude oil benchmark fell 55%. At one point, the WTI futures contract traded at negative levels as participants struggled with limited storage capacity. The 10-year Treasury briefly traded at a record low 0.32%. Investment Grade fell 7.5%, its worst monthly performance in history, and High Yield declined nearly 12%. Spreads and yields in the high-yield and loan markets reached their widest levels since the financial crisis in 2008.
In response, the Fed implemented a far-reaching set of programs measured in the trillions of dollars that dwarfed all previous policy accommodations. The huge wave of money led to a rapid turnaround of investor sentiment and a rebound in financial markets. Congress also did its part by expanding unemployment benefits and providing financing to cash-starved companies, among other programs.
In the second quarter of 2020, High Yield posted a 9.6% return, Investment Grade returned 9.3% and the S&P 500 gained 20.5%. Countries across the globe made progress re-opening their economies, and the corporate bond market opened with immense volume allowing issuers to raise large amounts of liquidity. Despite investors’ initial concern about the economic impact of the virus, the sheer volume of money injected into the system by the U.S. government brought risk markets back to life. However, caution is warranted as episodes of volatility are likely to prevail for the foreseeable future.
Unfortunately, not all companies could be saved from the economic fallout. By period end, markets began to witness an uptick in distressed credit, which may reach default rates of 10% or more.
For the 12-month period ended June 30, 2020, Investment Grade returned 9.3%, High Yield returned -1.10%, Loans returned -2.0% and Emerging Markets returned 0.5%. Lastly, given the record-low interest rates, Treasuries outperformed with a 10.8% return.
3
American Beacon SSI Alternative Income FundSM
June 30, 2020 (Unaudited)
The Investor Class of the American Beacon SSI Alternative Income Fund (the “Fund”) returned 2.60% for the twelve-month period ending June 30, 2020. The Fund outperformed the ICE BofA 3-Month U.S. Treasury Bill Index (the “Index”) return of 1.64% for the period.
Comparison of Change in Value of a $10,000 Investment for the period from 5/25/2012 through 6/30/2020
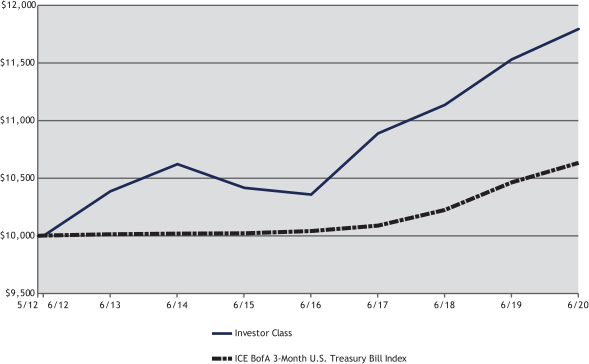
| Total Returns for the Period ended June 30, 2020 |
| |||||||||||||||||||||||||||||||
Ticker | 1 Year | 3 Year | 5 Year | Since Inception 5/25/2012 | Value of $10,000 06/30/2020 | |||||||||||||||||||||||||||
R5 Class (1,2,4) | SHDIX | 2.60 | % | 3.00 | % | 2.79 | % | 2.31 | % | $ | 12,029 | |||||||||||||||||||||
Y Class (1,4) | SHDYX | 2.55 | % | 2.99 | % | 2.78 | % | 2.30 | % | $ | 12,023 | |||||||||||||||||||||
Investor Class (1,4) | SHDPX | 2.28 | % | 2.69 | % | 2.51 | % | 2.06 | % | $ | 11,792 | |||||||||||||||||||||
ICE BofA 3-Month U.S. Treasury Bill Index (3) | 1.64 | % | 1.77 | % | 1.19 | % | 0.76 | % | $ | 10,633 | ||||||||||||||||||||||
| 1. | Performance shown is historical and is not indicative of future returns. Investment returns and principal value will vary, and shares may be worth more or less at redemption than at original purchase. Performance shown is calculated based on the published end-of-day net asset values as of date indicated, and current performance may be lower or higher than the performance data quoted. To obtain performance as of the most recent month end, please call 1-800-967-9009 or visit www.americanbeaconfunds.com. Fund performance in the table above does not reflect the deduction of taxes a shareholder would pay on distributions or the redemption of shares. Generally accepted accounting principles require adjustments to be made to the net assets of the Fund at period end for financial reporting purposes only; and as such, the total return based on the unadjusted net asset value per share may differ from the total return reported in the financial highlights. A portion of fees charged to the Investor Class of the Fund was waived from Fund inception to 2013, recovered in 2015, and waived in 2016, 2019 and 2020. Performance prior to waiving fees was lower than actual returns shown. A portion of fees charged to the Y Class of the Fund was waived from Fund inception to 2014, recovered in 2015, and waived in 2016, 2019 and 2020. Performance prior to waiving fees was lower than actual returns shown. |
| 2. | Fund performance for the five-year and since inception periods represents the total returns achieved by the Y Class from 5/25/12 up to 5/17/19, the inception date of the R5 Class. Expenses of the R5 Class are lower than those of the Y Class. As a result, total returns shown are lower than they would have been had the R5 Class been in existence since 5/25/12. A portion of fees charged to the R5 Class of the Fund has been waived since Fund inception. Performance prior to waiving fees was lower than actual returns shown. Effective February 28, 2020, the Institutional Class was renamed R5 Class. |
4
American Beacon SSI Alternative Income FundSM
Performance Overview
June 30, 2020 (Unaudited)
| 3. | ICE BofA 3-Month U.S. Treasury Bill Index is an index of U.S. Treasury securities maturing in less than 3 months that assumes reinvestment of all income and is intended to track the daily performance of 3-month U.S. Treasury bills. One cannot directly invest in an index. |
| 4. | The Total Annual Fund Operating Expense ratios set forth in the most recent Fund prospectus for the R5, Y and Investor Class shares were 2.77%, 2.15% and 2.40%, respectively. The expense ratios above may vary from the expense ratios presented in other sections of this report that are based on expenses incurred during the period covered by this report. |
During the second half of 2019 and early 2020, the convertible market backdrop was favorable with steady economic growth and strong corporate profits. In late February, as the COVID-19 pandemic emerged, the economy saw a sharp contraction and the financial markets suffered dramatic declines in the first quarter 2020, rebounding sharply beginning in late March. Throughout the varying market environments seen over the last twelve months, convertibles demonstrated attractive risk-adjusted returns. During the second half of 2019, they captured a good portion of the equity market gain. The asset class declined during the first quarter 2020 market turmoil, as credit spreads widened and valuations cheapened, but held up better than equities. During the second quarter 2020, convertibles generated strong returns, benefiting from improving market sentiment and the ongoing recovery in the credit markets. Technology and Health Care represent the two largest sectors of the convertible market, in which many companies performed well through the economic slowdown and whose convertible bonds generated gains when markets rebounded. New issuance has been very strong, with a record level of domestic convertible securities issued during the first half of 2020.
The Fund generated positive returns with low volatility during the second half of 2019. As the pandemic intensified in February and March, significant cash was raised in anticipation of market turmoil and widening credit spreads. In late March and April, investment levels were lifted as some of the hardest hit positions were selectively increased. During the most recent quarter, the fund benefited from positive sentiment, elevated equity volatility and the ongoing recovery in credit markets. Convertible bonds that suffered the greatest price dislocations during the first quarter of 2020 have been the most significant contributors to recent returns. Technology, Finance and Health Care are the largest sectors in the Fund and continue to offer opportunities for volatility monetization and valuation improvement. The fund is now close to fully invested, enabling it to take advantage of the strengthening convertible market.
Conditions remain favorable for the Fund entering the second half of 2020; valuations are improving but remain attractive, yields are relatively high, implied credit spreads remain unusually wide, and equity volatility remains elevated and can be monetized.
5
American Beacon SSI Alternative Income FundSM
Performance Overview
June 30, 2020 (Unaudited)
| Top Ten Holdings (% Net Assets) |
| |||||||
| MGIC Investment Corp., 9.000%, Due 4/1/2063 | 1.9 | |||||||
| Snap, Inc., 0.250%, Due 5/1/2025 | 1.7 | |||||||
| American Eagle Outfitters, Inc., 3.750%, Due 4/15/2025 | 1.6 | |||||||
| NCL Corp. Ltd., 6.000%, Due 5/15/2024 | 1.5 | |||||||
| IAC Financeco, Inc., 2.000%, Due 1/15/2030 | 1.5 | |||||||
| PennyMac Corp., 5.500%, Due 11/1/2024 | 1.5 | |||||||
| JOYY, Inc., 1.375%, Due 6/15/2026 | 1.4 | |||||||
| AMG Capital Trust, 5.150%, Due 10/15/2037 | 1.4 | |||||||
| New York Community Capital Trust, 6.000%, Due 11/1/2051 | 1.4 | |||||||
| Ligand Pharmaceuticals, Inc., 0.750%, Due 5/15/2023 | 1.4 | |||||||
| Total Fund Holdings | 115 | |||||||
| Industry Allocation (% Equities) |
| |||||||
| Equity Real Estate Investment Trusts (REITs) | 34.7 | |||||||
| Diversified Financial Services | 21.5 | |||||||
| Chemicals | 15.0 | |||||||
| Capital Markets | 13.0 | |||||||
| Technology Hardware, Storage & Peripherals | 9.0 | |||||||
| Auto Components | 6.8 | |||||||
6
American Beacon TwentyFour Short Term Bond FundSM
Performance Overview
June 30, 2020 (Unaudited)
The Y Class of the American Beacon TwentyFour Short Term Bond Fund (the “Fund”) returned -0.29% for the period ended June 30, 2020, underperforming the ICE BofA 1-3 Year U.S. Corporate Bond Index (the “Index”) return of 1.98% for the same period. Please note that the Fund’s inception date was February 18, 2020, and the returns discussed herein represent only the time period since inception.
Comparison of Change in Value of a $100,000 Investment for the period from 2/18/2020 through 6/30/2020
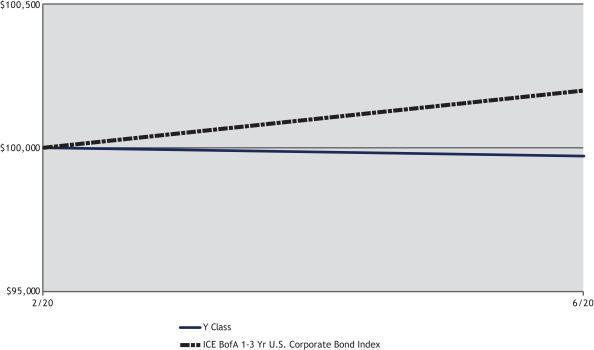
| Total Returns for the Period ended June 30, 2020 | |||||||||||||||
Ticker | Since Inception | Value of $100,000 06/30/2020 | |||||||||||||
Y Class (1,3) | TFBYX | -0.29 | % | $ | 99,712 | ||||||||||
A without Sales Charge (1,3) | TFBAX | -0.39 | % | $ | 99,612 | ||||||||||
A with Sales Charge (1,3) | TFBAX | -2.91 | % | $ | 97,088 | ||||||||||
C without Sales Charge (1,3) | TFBCX | -0.79 | % | $ | 99,211 | ||||||||||
C with Sales Charge (1,3) | TFBCX | -1.79 | % | $ | 98,211 | ||||||||||
R6 Class (1,3) | TFBRX | -0.19 | % | $ | 99,813 | ||||||||||
ICE BofA 1-3 Yr U.S. Corporate Bond Index (2) | 1.98 | % | $ | 101,984 | |||||||||||
| * | Unannualized. |
| 1. | Performance shown is historical and is not indicative of future returns. Investment returns and principal value will vary, and shares may be worth more or less at redemption than at original purchase. Performance shown is calculated based on the published end-of-day net asset values as of date indicated, and current performance may be lower or higher than the performance data quoted. To obtain performance as of the most recent month end, please visit www.americanbeaconfunds.com or call 1-800-967-9009. Fund performance in the table above does not reflect the deduction of taxes a shareholder would pay on distributions or the redemption of shares. Generally accepted accounting principles require adjustments to be made to the net assets of the Fund at period end for financial reporting purposes only; and as such, the total return based on the unadjusted net asset value per share may differ from the total return reported in the financial highlights. A portion of the fees charged to each Class of the Fund has been waived since Fund inception. Performance prior to waiving fees was lower than the actual returns shown since inception. A Class shares have a maximum sales charge of 3.75%. The maximum contingent deferred sales charge for the C Class is 1.00% for shares redeemed within one year of the date of purchase. |
7
American Beacon TwentyFour Short Term Bond FundSM
Performance Overview
June 30, 2020 (Unaudited)
| 2. | The ICE BofA 1-3 Year U.S. Corporate Bond Index is an unmanaged index that tracks the performance of the U.S. dollar-denominated investment-grade public debt issued in the US. domestic bond market. Qualifying bonds must have at least one year but less than three years remaining term to maturity, a fixed coupon schedule and a minimum amount outstanding of $150 million. One cannot directly invest in an index. |
| 3. | The Total Fund Operating Expense ratios set forth in the most recent Fund prospectus for the A, C, Y and R6 Class shares were 1.76%, 2.51%, 1.46% and 1.36%, respectively. The expense ratios above may vary from the expense ratios presented in other sections of this report that are based on expenses incurred during the period covered by this report. |
The period began in early 2020 as the U.S. Federal Reserve Bank’s (the “Fed’s”) interest rate cuts from the previous year were beginning to instill confidence in investors. In addition, dialogue between the U.S. and its major trading counterparts was improving and provided a stable backdrop for several equity market indices to reach new highs during the period. Other than the uncertainty surrounding the U.S. Presidential election in November, the year was expected to be a good one. From a fixed-income standpoint, however, yields were low and credit spreads were very narrow.
Within a month, the coronavirus pandemic quickly changed everything. The Fund’s portfolio was established with a tilt towards conservatism given the relative lack of opportunity in the fixed-income markets, but it had not anticipated such a sudden and massive dislocation.
The Fund’s largest allocation was to the Financial sectors (including Banks, Insurance companies and other financial service providers), several of which were adversely affected by the Fed’s lowering of interest rates to near 0%, the widening in credit spreads and the rise in potential loan losses. The Fund was also overweight triple-B rated issuers (investment grade) and held a small amount of exposure to non-investment grade issuers which underperformed as the credit markets deteriorated. The Fund’s weighted-average credit quality was investment grade. While the Fund invested in non-U.S. dollar denominated instruments, all currencies exposures were hedged back to the U.S. dollar.
Despite the sheer magnitude of the disruption, the markets turned around quite rapidly as investors began to understand the extent of government support that was deployed in response to the crisis. By early April, the equity markets were notably pointing upwards and credit spreads were quickly narrowing. By June, the NASDAQ had already reached new highs. With so much stimulus in the economy and so little business and consumer spending taking place, the excess liquidity flowed into the financial markets.
While the Fund benefitted from the recovery, it lagged the Index as its holdings in the Financial sectors underperformed given their exposure to consumers, interest rates and the credit markets. The Energy markets also staged a remarkable recovery where the Fund held little exposure.
Additionally, given that the Fund’s portfolio was assembled just before the crisis hit, there was less opportunity for trading in the new-issue market where issuers desperately sought liquidity. Likewise, trading in the secondary market was also limited as the Fund focused on preserving its own liquidity. The Fund’s positioning was directed toward quality given the uncertain and unprecedented nature of the virus.
Over time, the Fund seeks to fully implement its top-down asset allocation and duration management process, with rigorous bottom-up credit analysis, in a highly flexible approach that seeks to take advantage of prevailing market conditions.
8
American Beacon TwentyFour Short Term Bond FundSM
Performance Overview
June 30, 2020 (Unaudited)
| Top Ten Holdings (% Net Assets) |
| |||||||
| Ripon Mortgages PLC, 1.756%, Due 8/20/2056, 1X C1, (3-mo. GBP LIBOR + 1.500%) | 4.2 | |||||||
| U.S. Treasury Notes/Bonds, 1.750%, Due 7/31/2021 | 2.7 | |||||||
| Rothesay Life PLC, 8.000%, Due 10/30/2025 | 2.7 | |||||||
| Barclays Bank PLC, 10.000%, Due 5/21/2021 | 2.4 | |||||||
| Argenta Spaarbank N.V., 3.875%, Due 5/24/2026, (5-Yr. Annual EUR Swap + 3.950%) | 2.2 | |||||||
| Credit Agricole S.A., 7.375%, Due 12/18/2023 | 2.1 | |||||||
| Phoenix Group Holdings PLC, 6.625%, Due 12/18/2025 | 2.1 | |||||||
| UBS Group AG, 6.875%, Due 3/22/2021, (5-Yr. USD ICE Swap + 5.497%) | 2.0 | |||||||
| SSE PLC, 4.750%, Due 9/16/2077, (5-Yr. Semi-Annual USD Swap + 2.574%) | 2.0 | |||||||
| Orange S.A., 5.750%, Due 4/1/2023, (5-Yr. GBP Swap + 3.353%) | 2.0 | |||||||
| Total Fund Holdings | 63 | |||||||
| Sector Allocation (% Fixed Income) |
| |||||||
| Financial | 58.2 | |||||||
| Communications | 8.0 | |||||||
| Utilities | 7.9 | |||||||
| Industrial | 7.1 | |||||||
| Consumer, Non-Cyclical | 5.6 | |||||||
| Collateralized Mortgage Obligations | 5.4 | |||||||
| U.S. Treasury Obligations | 3.0 | |||||||
| Consumer, Cyclical | 2.8 | |||||||
| Technology | 2.0 | |||||||
| Industry Allocation (% Fixed Income) |
| |||||||
| Insurance | 24.8 | |||||||
| Banks | 23.2 | |||||||
| Telecommunications | 6.8 | |||||||
| Collateralized Mortgage Obligations | 5.4 | |||||||
| Electric | 4.0 | |||||||
| Trucking & Leasing | 3.3 | |||||||
| Real Estate Investment Trusts | 3.1 | |||||||
| Diversified Financial Services | 3.1 | |||||||
| U.S. Treasury Obligations | 3.0 | |||||||
| Transportation | 2.7 | |||||||
| Real Estate | 2.6 | |||||||
| Gas | 2.5 | |||||||
| Software | 2.0 | |||||||
| Food | 1.7 | |||||||
| Entertainment | 1.5 | |||||||
| Health Care – Services | 1.4 | |||||||
| Auto Parts & Equipment | 1.4 | |||||||
| Commercial Services | 1.4 | |||||||
| Savings & Loans | 1.3 | |||||||
| Water | 1.3 | |||||||
| Media | 1.2 | |||||||
| Machinery – Diversified | 1.2 | |||||||
| Beverages | 1.1 | |||||||
| Country Allocation (% Investments) |
| |||||||
| United Kingdom | 64.8 | |||||||
| United States | 13.2 | |||||||
| France | 5.9 | |||||||
| Australia | 2.7 | |||||||
| Belgium | 2.4 | |||||||
| Germany | 2.3 | |||||||
| Switzerland | 2.2 | |||||||
| South Africa | 1.4 | |||||||
| Luxembourg | 1.3 | |||||||
| Mexico | 1.3 | |||||||
| Norway | 1.3 | |||||||
| Netherlands | 1.2 | |||||||
9
American Beacon TwentyFour Strategic Income FundSM
Performance Overview
June 30, 2020 (Unaudited)
The Investor Class of the American Beacon TwentyFour Strategic Income Fund (the “Fund”) returned 3.58% for the twelve-month period ended June 30, 2020, underperforming the Bloomberg Barclays Global Aggregate Index (the “Index”) return of 4.22% but outperforming the BofA U.S. Dollar 3-Month LIBOR Constant Maturity Index return of 2.13% for the same period.
Comparison of Change in Value of a $10,000 Investment for the period from 4/3/2017 through 6/30/2020
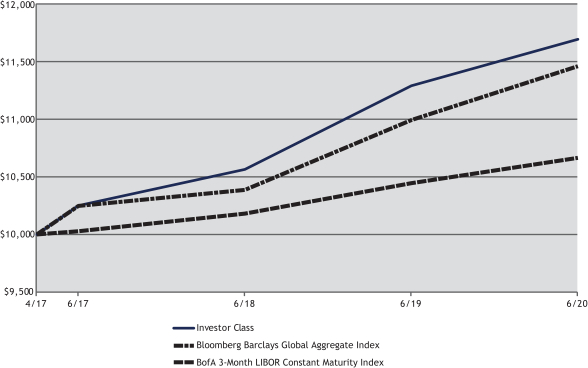
| Total Returns for the Period ended June 30, 2020 |
| ||||||||||||||||||||||||||
Ticker | 1 Year | 3 Year | Since Inception | Value of $10,000 06/30/2020 | |||||||||||||||||||||||
R5 Class (1,5) | TFGIX | 3.81 | % | 4.84 | % | 5.30 | % | $ | 11,822 | ||||||||||||||||||
Y Class (1,5) | TFGYX | 3.82 | % | 4.78 | % | 5.24 | % | $ | 11,802 | ||||||||||||||||||
Investor Class (1,5) | TFGPX | 3.58 | % | 4.49 | % | 4.94 | % | $ | 11,691 | ||||||||||||||||||
A without Sales Charge (1,2,5) | TFSAX | 3.44 | % | 4.65 | % | 5.12 | % | $ | 11,756 | ||||||||||||||||||
A with Sales Charge (1,2,5) | TFSAX | -0.48 | % | 3.31 | % | 3.88 | % | $ | 11,314 | ||||||||||||||||||
C without Sales Charge (1,3,5) | TFGCX | 2.72 | % | 4.22 | % | 4.72 | % | $ | 11,614 | ||||||||||||||||||
C with Sales Charge (1,3,5) | TFGCX | 1.72 | % | 4.22 | % | 4.72 | % | $ | 11,614 | ||||||||||||||||||
Ultra Class (1,5) | TFGUX | 3.99 | % | 4.94 | % | 5.39 | % | $ | 11,854 | ||||||||||||||||||
Bloomberg Barclays Global Aggregate Index (4) | 4.22 | % | 3.79 | % | 4.28 | % | $ | 11,456 | |||||||||||||||||||
BofA 3 Month LIBOR Constant Maturity Index (4) | 2.13 | % | 2.08 | % | 2.01 | % | $ | 10,664 | |||||||||||||||||||
| 1. | Performance shown is historical and is not indicative of future returns. Investment returns and principal value will vary, and shares may be worth more or less at redemption than at original purchase. Performance shown is calculated based on the published end-of-day net asset values as of date indicated, and current performance may be lower or higher than the performance data quoted. To obtain performance as of the most recent month end, please visit www.americanbeaconfunds.com or call 1-800-967-9009. Fund performance in the table above does not reflect the deduction of taxes a shareholder would pay on distributions or the redemption of shares. Generally accepted accounting principles require adjustments to be made to the net assets of the Fund period end for financial reporting purposes only; and as such, the total return based on the unadjusted net asset value per share may differ from the total return reported in the financial highlights. A portion of the fees charged to each Class of the Fund has been waived since Fund inception. Performance prior to waiving fees was lower than the actual returns shown since inception. |
10
American Beacon TwentyFour Strategic Income FundSM
Performance Overview
June 30, 2020 (Unaudited)
| 2. | Fund performance for the three-year and since inception periods represents the total returns achieved by the R5 Class from 4/3/17 up to 10/29/18, the inception date of the A Class. Expenses of the A Class are higher than those of the R5 Class. As a result, total returns shown may be higher than they would have been had the A Class been in existence since 4/3/17. A Class shares have a maximum sales charge of 3.75%. |
| 3. | Fund performance for the three-year and since inception periods represents the total returns achieved by the R5 Class from 4/03/17 up to 10/29/18, the inception date of the C Class. Expenses of the C Class are higher than those of the R5 Class. As a result, total returns shown may be higher than they would have been had the C Class been in existence since 4/03/17. The maximum contingent deferred sales charge for the C Class is 1.00% for shares redeemed within one year of the date of purchase. |
| 4. | The ICE BofA U.S. Dollar 3-Month LIBOR Constant Maturity Index tracks the performance of a synthetic asset paying LIBOR to a stated maturity. The index is based on the assumed purchase at par of a synthetic instrument having exactly its stated maturity and with a coupon equal to that day’s fixing rate. That issue is assumed to be sold the following business day (at a yield equal to the current day fixing rate) and rolled into a new instrument. The Bloomberg Barclays Global Aggregate Index tracks the performance of global investment-grade debt, including treasury, government-related, corporate and securitized fixed-rate bonds, denominated in local currencies from developed and emerging markets issuers. Securities must have at least one year until final maturity, or average life as applicable, and must meet minimum issue size criteria. One cannot directly invest in an index. |
| 5. | The Total Annual Fund Operating Expense ratios set forth in the most recent Fund prospectus for the R5, Y, Investor, A, C and Ultra Class shares were 1.22%, 1.42%, 1.69%, 1.78%, 2.58% and 1.32%, respectively. The expense ratios above may vary from the expense ratios presented in other sections of this report that are based on expenses incurred during the period covered by this report. |
In the latter half of 2019, the Fund had been increasing its exposure to U.S. Treasuries and select developed-country sovereigns in response to softening economic data, declining interest rates and an uncertain outlook for U.S. global political relations. Credit spreads had become narrow as investors searched broadly for yield, and the risk-adjusted opportunity warranted a more cautious approach to credit risk. The Fund’s weighted-average credit quality was increased to investment grade (BBB average rating), and its credit maturities were shortened to reduce risk exposures. The Fund’s government holdings, on the other hand, were extended in maturity to provide an offset for the shorter credit maturities and to benefit from potentially declining interest rates. Overall, the Fund was defensively positioned with increased flexibility and liquidity to provide for the ability to react quickly to market developments.
The economic outlook improved in early 2020 as the U.S. Federal Reserve Bank’s (the “Fed’s”) interest rate cuts were beginning to instill confidence, and U.S. dialogue with China was improving. Several equity market indices reached new highs during period as markets quieted. Other than the uncertainty of the November election, 2020 had the potential to be a good year; albeit, yields were low and credit spreads were very narrow.
Shortly into the year, however, the coronavirus pandemic quickly changed everything. While the Fund had not anticipated such a massive dislocation, its preparations proved beneficial nonetheless. Although the Fund produced a negative return during the virus-stricken first quarter of 2020, it outperformed its peer group (Morningstar Multi-Sector Bond Funds) and was well positioned to take advantage of the destruction. As a reminder, the Fund’s Index includes only investment-grade bonds and had a much longer duration, whereas the peer group represents a broader asset allocation and credit quality that was more similar to that of the Fund.
Throughout the year, the Fund’s largest allocation was to the Financial sectors (including Banks, Insurance and savings and loans), which were adversely affected by the Fed’s lowering of interest rates to near 0%, the widening in credit spreads and the rise in potential loan losses. Likewise, high yield, emerging market, and European collateralized loan obligation exposures in the Fund underperformed the Index as well.
However, as investors began to understand the magnitude of government support that was deployed in response to the crisis, they quickly returned to the risk markets. As early as April, the equity markets were notably pointing upwards and credit spreads were quickly narrowing. By June, the NASDAQ had already reached a new high. With so much stimulus in the economy and so little business and consumer spending taking place, the excess liquidity flowed into the financial markets.
During the second quarter of 2020, the Fund significantly outperformed the Index due to its overweight positions in the risk sectors. Likewise, the Fund also outperformed its peer group as it was able to utilize the flexibility within its portfolio to take advantage of the volatile markets. The new-issue market was attractive as issuers desperately sought liquidity, and dislocations in the secondary market offered attractive trading opportunities. As such, the Fund reduced its government holdings and increased its credit maturities during the quarter yet maintained an emphasis on quality given the uncertain and unprecedented nature of the virus.
11
American Beacon TwentyFour Strategic Income FundSM
Performance Overview
June 30, 2020 (Unaudited)
Overall, the Fund survived the year and produced positive total returns as expected from fixed income.
The Fund’s positions denominated in local currencies continued to be hedged back to the U.S. dollar.
The sub-advisor’s investment process incorporates top-down asset allocation and duration management with rigorous bottom-up credit analysis in a highly flexible approach that seeks to take advantage of prevailing market conditions. This team-based process has remained consistent since the Fund’s inception.
| Top Ten Holdings (% Net Assets) |
| |||||||
| U.S. Treasury Notes/Bonds, 0.375%, Due 3/31/2022 | 8.0 | |||||||
| U.S. Treasury Notes/Bonds, 0.125%, Due 4/30/2022 | 6.9 | |||||||
| Coventry Building Society, 6.875%, Due 9/18/2024, (5-Yr. UK Government Bond + 6.111%) | 1.9 | |||||||
| Madison Park Euro Funding DAC, 3.100%, Due 7/15/2030, (3-mo. EUR EURIBOR + 3.100%) | 1.8 | |||||||
| Durham Mortgages B PLC, 1.456%, Due 3/31/2054, 2018-BX C, (3-mo. GBP LIBOR + 1.200%) | 1.6 | |||||||
| Nationwide Building Society, 10.250%, Due 12/31/2999, Series CCDS | 1.3 | |||||||
| Pension Insurance Corp. PLC, 7.375%, Due 7/25/2029, (5-Yr. UK Government Bond + 6.658%) | 1.0 | |||||||
| Ares European CLO B.V., 5.260%, Due 10/15/2030, (3-mo. EUR EURIBOR + 5.260%) | 1.0 | |||||||
| Credit Suisse Group AG, 7.500%, Due 7/17/2023, (5-Yr. Semi-Annual USD Swap + 4.600%) | 1.0 | |||||||
| Barclays PLC, 7.875%, Due 9/15/2022, (5-Yr. GBP Swap + 6.099%) | 1.0 | |||||||
| Total Fund Holdings | 216 | |||||||
| Industry Allocation (% Fixed Income) |
| |||||||
| Banks | 23.5 | |||||||
| U.S. Treasury Obligations | 15.8 | |||||||
| Insurance | 11.3 | |||||||
| Asset-Backed Securities | 8.5 | |||||||
| Collateralized Mortgage Obligation | 6.2 | |||||||
| Diversified Financial Servises | 4.6 | |||||||
| Savings & Loans | 4.2 | |||||||
| Telecommunications | 3.5 | |||||||
| Real Estate | 3.2 | |||||||
| Media | 2.1 | |||||||
| Oil & Gas | 2.0 | |||||||
| Commercial Services | 1.0 | |||||||
| Foreign Sovereign Obligations | 1.0 | |||||||
| Building Materials | 1.0 | |||||||
| Electric | 0.9 | |||||||
| Packaging & Containers | 0.9 | |||||||
| Food | 0.9 | |||||||
| Agriculture | 0.8 | |||||||
| Real Estate Investment Trust | 0.8 | |||||||
| Miscellaneous Manufacturing | 0.8 | |||||||
| Household Products/Wares | 0.6 | |||||||
| Mining | 0.6 | |||||||
| Semiconductors | 0.6 | |||||||
| Auto Manufacturers | 0.5 | |||||||
| Computers | 0.5 | |||||||
| Lodging | 0.5 | |||||||
| Retail | 0.5 | |||||||
| Energy - Alternate Sources | 0.5 | |||||||
| Software | 0.5 | |||||||
| Home Builders | 0.4 | |||||||
| Health Care – Services | 0.3 | |||||||
| Pharmaceuticals | 0.3 | |||||||
| Cosmetics/Personal Care | 0.3 | |||||||
| Auto Parts & Equipment | 0.2 | |||||||
| Environmental Control | 0.2 | |||||||
| Foreign Convertible Obligations | 0.2 | |||||||
| Electronics | 0.1 | |||||||
| Engineering & Construction | 0.1 | |||||||
| Chemicals | 0.1 | |||||||
12
American Beacon TwentyFour Strategic Income FundSM
Performance Overview
June 30, 2020 (Unaudited)
| Country Allocation (% Investments) |
| |||||||
| United Kingdom | 29.1 | |||||||
| United States | 24.8 | |||||||
| Netherlands | 6.6 | |||||||
| Ireland | 5.2 | |||||||
| France | 3.9 | |||||||
| Italy | 3.4 | |||||||
| Spain | 2.8 | |||||||
| Germany | 2.4 | |||||||
| Chile | 2.2 | |||||||
| Mexico | 2.2 | |||||||
| Switzerland | 2.2 | |||||||
| Sweden | 2.0 | |||||||
| Cayman Islands | 1.3 | |||||||
| Saudi Arabia | 1.2 | |||||||
| Austria | 1.0 | |||||||
| Canada | 0.9 | |||||||
| Luxembourg | 0.9 | |||||||
| Australia | 0.8 | |||||||
| China | 0.8 | |||||||
| Ukraine | 0.8 | |||||||
| Georgia | 0.7 | |||||||
| Israel | 0.7 | |||||||
| Paraguay | 0.6 | |||||||
| Hong Kong | 0.5 | |||||||
| Romania | 0.5 | |||||||
| United Arab Emirates | 0.5 | |||||||
| Qatar | 0.4 | |||||||
| British Virgin Islands | 0.3 | |||||||
| Panama | 0.3 | |||||||
| Finland | 0.2 | |||||||
| Belgium | 0.2 | |||||||
| Brazil | 0.2 | |||||||
| Colombia | 0.2 | |||||||
| Swaziland | 0.2 | |||||||
13
American Beacon FundsSM
June 30, 2020 (Unaudited)
Fund Expense Example
As a shareholder of a Fund, you incur two types of costs: (1) transaction costs, including sales charges (loads) on purchase payments and redemption fees, if applicable, and (2) ongoing costs, including management fees, distribution (12b-1) fees, sub-transfer agent fees, and other Fund expenses. The Examples are intended to help you understand the ongoing cost (in dollars) of investing in the Fund and to compare these costs with the ongoing costs of investing in other mutual funds. The Examples are based on an investment of $1,000 invested at the beginning of the period in each Class and held for the entire period from February 18, 2020 through June 30, 2020 for the TwentyFour Short Term Bond Fund and January 1, 2020 through June 30, 2020 for SSI Alternative Income Fund and TwentyFour Strategic Income Fund.
Actual Expenses
The “Actual” lines of the tables provide information about actual account values and actual expenses. You may use the information on this page, together with the amount you invested, to estimate the expenses that you paid over the period. Simply divide your account value by $1,000 (for example, an $8,600 account value divided by $1,000 = $8.60), then multiply the result by the “Expenses Paid During Period” to estimate the expenses you paid on your account during this period. Shareholders of the Investor and R5 Classes that invest in the Fund through an IRA or Roth IRA may be subject to a custodial IRA fee of $15 that is typically deducted each December. If your account was subject to a custodial IRA fee during the period, your costs would have been $15 higher.
Hypothetical Example for Comparison Purposes
The “Hypothetical” lines of the tables provide information about hypothetical account values and hypothetical expenses based on the Fund’s actual expense ratio and an assumed 5% per year rate of return before expenses (not the Fund’s actual return). You may compare the ongoing costs of investing in the Fund with other funds by contrasting this 5% hypothetical example and the 5% hypothetical examples that appear in the shareholder reports of the other funds. The hypothetical account values and expenses may not be used to estimate the actual ending account balance or expenses you paid for the period. Shareholders of the Investor and R5 Classes that invest in the Funds through an IRA or Roth IRA may be subject to a custodial IRA fee of $15 that is typically deducted each December. If your account was subject to a custodial IRA fee during the period, your costs would have been $15 higher.
You should also be aware that the expenses shown in the table highlight only your ongoing costs and do not reflect any transaction costs charged by the Fund, such as sales charges (loads) or redemption fees, as applicable. Similarly, the expense examples for other funds do not reflect any transaction costs charged by those funds, such as sales charges (loads), redemption fees or exchange fees. Therefore, the “Hypothetical” lines of the tables are useful in comparing ongoing costs only and will not help you determine the relative total costs of owning different funds. If you were subject to any transaction costs during the period, your costs would have been higher.
14
American Beacon FundsSM
Expense Examples
June 30, 2020 (Unaudited)
| American Beacon SSI Alternative Income Fund |
| ||||||||||||||
| Beginning Account Value 1/1/2020 | Ending Account Value 6/30/2020 | Expenses Paid During Period 1/1/2020-6/30/2020* | |||||||||||||
| R5 Class** | |||||||||||||||
| Actual | $1,000.00 | $1,001.00 | $10.85 | ||||||||||||
| Hypothetical*** | $1,000.00 | $1,014.02 | $10.92 | ||||||||||||
| Y Class | |||||||||||||||
| Actual | $1,000.00 | $1,000.00 | $11.34 | ||||||||||||
| Hypothetical*** | $1,000.00 | $1,013.53 | $11.41 | ||||||||||||
| Investor Class | |||||||||||||||
| Actual | $1,000.00 | $999.00 | $12.52 | ||||||||||||
| Hypothetical*** | $1,000.00 | $1,012.33 | $12.61 | ||||||||||||
| * | Expenses are equal to the Fund’s annualized expense ratios for the six-month period of 2.18%, 2.28%, and 2.52% for the R5, Y, and Investor Classes, respectively, multiplied by the average account value over the period, multiplied by the number derived by dividing the number of days in the most recent fiscal half-year (182) by days in the year (366) to reflect the half-year period. |
| ** | Formerly known as Institutional Class. |
| *** | 5% return before expenses. |
| American Beacon TwentyFour Short Term Bond Fund |
| ||||||||||||||
| Beginning Account Value 2/19/2020 | Ending Account Value 6/30/2020 | Expenses Paid During Period 2/18/2020-6/30/2020* | |||||||||||||
| Y Class | |||||||||||||||
| Actual | $1,000.00 | $999.10 | $2.07 | ||||||||||||
| Hypothetical** | $1,000.00 | $1,016.10 | $2.09 | ||||||||||||
| A Class | |||||||||||||||
| Actual | $1,000.00 | $998.10 | $3.16 | ||||||||||||
| Hypothetical** | $1,000.00 | $1,015.01 | $3.19 | ||||||||||||
| C Class | |||||||||||||||
| Actual | $1,000.00 | $994.10 | $5.87 | ||||||||||||
| Hypothetical** | $1,000.00 | $1,012.28 | $5.92 | ||||||||||||
| R6 Class | |||||||||||||||
| Actual | $1,000.00 | $999.10 | $1.71 | ||||||||||||
| Hypothetical** | $1,000.00 | $1,016.46 | $1.72 | ||||||||||||
| * | Expenses are equal to the Fund’s annualized expense ratios for the six-month period of 0.57%, 0.87%, 1.62%, and 0.47% for the Y, A, C, and R6 Classes, respectively, multiplied by the average account value over the period, multiplied by the number derived by dividing the number of days in the most recent fiscal half-year (133) by days in the year (366) to reflect the half-year period. |
| ** | 5% return before expenses. |
15
American Beacon FundsSM
Expense Examples
June 30, 2020 (Unaudited)
| American Beacon TwentyFour Strategic Income Fund |
| ||||||||||||||
| Beginning Account Value 1/1/2020 | Ending Account Value 6/30/2020 | Expenses Paid During Period 1/1/2020-6/30/2020* | |||||||||||||
| R5 Class** | |||||||||||||||
| Actual | $1,000.00 | $998.60 | $3.58 | ||||||||||||
| Hypothetical*** | $1,000.00 | $1,021.28 | $3.62 | ||||||||||||
| Y Class | |||||||||||||||
| Actual | $1,000.00 | $998.50 | $4.07 | ||||||||||||
| Hypothetical*** | $1,000.00 | $1,020.79 | $4.12 | ||||||||||||
| Investor Class | |||||||||||||||
| Actual | $1,000.00 | $997.00 | $5.41 | ||||||||||||
| Hypothetical*** | $1,000.00 | $1,019.44 | $5.47 | ||||||||||||
| A Class | |||||||||||||||
| Actual | $1,000.00 | $996.80 | $5.56 | ||||||||||||
| Hypothetical*** | $1,000.00 | $1,019.29 | $5.62 | ||||||||||||
| C Class | |||||||||||||||
| Actual | $1,000.00 | $993.00 | $9.27 | ||||||||||||
| Hypothetical*** | $1,000.00 | $1,015.56 | $9.37 | ||||||||||||
| Ultra Class | |||||||||||||||
| Actual | $1,000.00 | $998.60 | $3.33 | ||||||||||||
| Hypothetical*** | $1,000.00 | $1,021.53 | $3.37 | ||||||||||||
| * | Expenses are equal to the Fund’s annualized expense ratios for the six-month period of 0.72%, 0.82%, 1.09%, 1.12%, 1.87%, and 0.67% for the R5, Y, Investor, A, C, and Ultra Classes, respectively, multiplied by the average account value over the period, multiplied by the number derived by dividing the number of days in the most recent fiscal half-year (182) by days in the year (366) to reflect the half-year period. |
| ** | Formerly known as Institutional Class. |
| *** | 5% return before expenses. |
16
American Beacon FundsSM
Report of Independent Registered Public Accounting Firm
To the Board of Trustees of American Beacon Funds and Shareholders of American Beacon SSI Alternative Income Fund, American Beacon TwentyFour Short Term Bond Fund and American Beacon TwentyFour Strategic Income Fund
Opinions on the Financial Statements
We have audited the accompanying statements of assets and liabilities, including the schedules of investments, of each of the funds indicated in the table below (three of the series constituting American Beacon Funds, hereafter collectively referred to as the “Funds”) as of June 30, 2020, the related statements of operations and of changes in net assets for each of the periods indicated in the table below, including the related notes, and the financial highlights for each of the periods indicated in the table below (collectively referred to as the “financial statements”). In our opinion, the financial statements present fairly, in all material respects, the financial position of each of the Funds as of June 30, 2020, the results of each of their operations, the changes in each of their net assets and each of the financial highlights for each of the periods indicated in the table below, in conformity with accounting principles generally accepted in the United States of America.
Fund Name | Statements of Operations | Statements of Changes in Net Assets | Financial Highlights | |||
| American Beacon SSI Alternative Income Fund | For the year ended June 30, 2020 | For the period April 1, 2019 through June 30, 2019 and for the year ended June 30, 2020 | For the period May 20, 2019 (commencement of operations) through June 30, 2019 and for the year ended June 30, 2020 for R5 Class
For the period April 1, 2019 through June 30, 2019 and for the year ended June 30, 2020 for Y Class and Investor Class | |||
| American Beacon TwentyFour Short Term Bond Fund | For the period February 18, 2020 (commencement of operations) through June 30, 2020 | For the period February 18, 2020 (commencement of operations) through June 30, 2020 | For the period February 18, 2020 (commencement of operations) through June 30, 2020 | |||
| American Beacon TwentyFour Strategic Income Fund | For the year ended June 30, 2020 | For the years ended June 30, 2020 and 2019 | For each of the periods indicated therein | |||
The financial statements of American Beacon SSI Alternative Income Fund as of March 31, 2019 and for the year ended March 31, 2019 and the financial highlights for each of the periods ended on or prior to March 31, 2019 (not presented herein, other than the statements of changes in net assets and the financial highlights) were audited by other auditors whose report dated May 24, 2019 expressed an unqualified opinion on those financial statements and financial highlights.
Basis for Opinions
These financial statements are the responsibility of the Funds’ management. Our responsibility is to express an opinion on the Funds’ financial statements based on our audits. We are a public accounting firm registered with the Public Company Accounting Oversight Board (United States) (PCAOB) and are required to be independent with respect to the Funds in accordance with the U.S. federal securities laws and the applicable rules and regulations of the Securities and Exchange Commission and the PCAOB.
We conducted our audits of these financial statements in accordance with the standards of the PCAOB. Those standards require that we plan and perform the audit to obtain reasonable assurance about whether the financial statements are free of material misstatement, whether due to error or fraud.
Our audits included performing procedures to assess the risks of material misstatement of the financial statements, whether due to error or fraud, and performing procedures that respond to those risks. Such procedures included examining, on a test basis, evidence regarding the amounts and disclosures in the financial statements. Our audits also included evaluating the accounting principles used and significant estimates made by management, as well as
17
American Beacon FundsSM
Report of Independent Registered Public Accounting Firm
evaluating the overall presentation of the financial statements. Our procedures included confirmation of securities owned as of June 30, 2020 by correspondence with the custodian, transfer agent, and brokers; when replies were not received from brokers, we performed other auditing procedures. We believe that our audits provide a reasonable basis for our opinions.
PricewaterhouseCoopers LLP
Boston, MA
September 1, 2020
We have served as the auditor of one or more investment companies in the American Beacon family of funds since 2016.
18
American Beacon SSI Alternative Income FundSM
Schedule of Investments
June 30, 2020
| Shares | Fair Value | ||||||||||||||
| SECURITIES HELD LONG - 99.51% | |||||||||||||||
| CONVERTIBLE PREFERRED STOCKS - 6.53% | |||||||||||||||
| Consumer Discretionary - 0.44% | |||||||||||||||
| Auto Components - 0.44% | |||||||||||||||
| Aptiv PLC, Series A, 5.500%, Due 6/15/2023 | 6,025 | $ | 619,250 | ||||||||||||
|
| ||||||||||||||
| Financials - 0.85% | |||||||||||||||
| Capital Markets - 0.85% | |||||||||||||||
| Cowen, Inc., Series A, 5.625%A B | 1,485 | 1,196,073 | |||||||||||||
|
| ||||||||||||||
| Information Technology - 0.59% | |||||||||||||||
| Technology Hardware, Storage & Peripherals - 0.59% | |||||||||||||||
| NCR Corp., Series A, 5.500%, PIK (In-kind rate 5.500%)A | 948 | 828,362 | |||||||||||||
|
| ||||||||||||||
| Materials - 0.98% | |||||||||||||||
| Chemicals - 0.98% | |||||||||||||||
| Lyondellbasell Advanced Polymers, Inc., 6.000%A | 1,340 | 1,373,500 | |||||||||||||
|
| ||||||||||||||
| Real Estate - 3.67% | |||||||||||||||
| Diversified Financial Services - 1.40% | |||||||||||||||
| AMG Capital Trust, 5.150%, Due 10/15/2037B | 49,805 | 1,968,217 | |||||||||||||
|
| ||||||||||||||
| Equity Real Estate Investment Trusts (REITs) - 2.27% | |||||||||||||||
| New York Community Capital Trust, 6.000%, Due 11/1/2051 | 43,399 | 1,939,068 | |||||||||||||
| QTS Realty Trust, Inc., Series B, 6.500%A | 8,713 | 1,245,352 | |||||||||||||
|
| ||||||||||||||
| 3,184,420 | |||||||||||||||
|
| ||||||||||||||
Total Real Estate | 5,152,637 | ||||||||||||||
|
| ||||||||||||||
Total Convertible Preferred Stocks (Cost $10,095,346) | 9,169,822 | ||||||||||||||
|
| ||||||||||||||
| Principal Amount | |||||||||||||||
| CONVERTIBLE OBLIGATIONS - 77.10% | |||||||||||||||
| Communications - 8.80% | |||||||||||||||
| Internet - 7.58% | |||||||||||||||
| Boingo Wireless, Inc., 1.000%, Due 10/1/2023B | $ | 1,086,000 | 963,825 | ||||||||||||
| FireEye, Inc., 1.625%, Due 6/1/2035, Series BB C | 41,000 | 38,650 | |||||||||||||
| IAC Financeco, Inc., 2.000%, Due 1/15/2030B D | 1,662,000 | 2,153,976 | |||||||||||||
| Palo Alto Networks, Inc., 0.750%, Due 7/1/2023B | 1,332,000 | 1,423,877 | |||||||||||||
| Perficient, Inc., 2.375%, Due 9/15/2023B | 966,000 | 1,118,391 | |||||||||||||
| Q2 Holdings, Inc., 0.750%, Due 6/1/2026B | 1,038,000 | 1,178,677 | |||||||||||||
| Snap, Inc., 0.250%, Due 5/1/2025B D | 1,836,000 | 2,340,702 | |||||||||||||
| Zillow Group, Inc., 2.750%, Due 5/15/2025B | 1,234,000 | 1,434,784 | |||||||||||||
|
| ||||||||||||||
| 10,652,882 | |||||||||||||||
|
| ||||||||||||||
| Telecommunications - 1.22% | |||||||||||||||
| Infinera Corp., 2.125%, Due 9/1/2024B | 624,000 | 530,816 | |||||||||||||
| Liberty Interactive LLC, 3.500%, Due 1/15/2031C | 485,000 | 357,397 | |||||||||||||
| Vonage Holdings Corp., 1.750%, Due 6/1/2024B | 894,000 | 833,869 | |||||||||||||
|
| ||||||||||||||
| 1,722,082 | |||||||||||||||
|
| ||||||||||||||
Total Communications | 12,374,964 | ||||||||||||||
|
| ||||||||||||||
| Consumer, Cyclical - 11.84% | |||||||||||||||
| Airlines - 1.01% | |||||||||||||||
| Southwest Airlines Co., 1.250%, Due 5/1/2025B | 1,182,000 | 1,419,619 | |||||||||||||
|
| ||||||||||||||
| Apparel - 0.27% | |||||||||||||||
| Under Armour, Inc., 1.500%, Due 6/1/2024B D | 333,000 | 376,826 | |||||||||||||
|
| ||||||||||||||
See accompanying notes
19
American Beacon SSI Alternative Income FundSM
Schedule of Investments
June 30, 2020
| Principal Amount | Fair Value | ||||||||||||||
| CONVERTIBLE OBLIGATIONS - 77.10% (continued) | |||||||||||||||
| Consumer, Cyclical - 11.84% (continued) | |||||||||||||||
| Auto Parts & Equipment - 0.53% | |||||||||||||||
| Meritor, Inc., 3.250%, Due 10/15/2037B C | $ | 754,000 | $ | 751,101 | |||||||||||
|
| ||||||||||||||
| Entertainment - 1.56% | |||||||||||||||
| Liberty Media Corp., 2.250%, Due 12/1/2048B C D | 1,427,000 | 1,454,304 | |||||||||||||
| Penn National Gaming, Inc., 2.750%, Due 5/15/2026B | 491,000 | 735,460 | |||||||||||||
|
| ||||||||||||||
| 2,189,764 | |||||||||||||||
|
| ||||||||||||||
| Home Builders - 0.87% | |||||||||||||||
| Winnebago Industries, Inc., 1.500%, Due 4/1/2025B D | 998,000 | 1,222,550 | |||||||||||||
|
| ||||||||||||||
| Leisure Time - 2.92% | |||||||||||||||
| Callaway Golf Co., 2.750%, Due 5/1/2026B D | 655,000 | 806,649 | |||||||||||||
| NCL Corp. Ltd., 6.000%, Due 5/15/2024B D | 1,636,000 | 2,178,135 | |||||||||||||
| Royal Caribbean Cruises Ltd., 4.250%, Due 6/15/2023B D | 1,202,000 | 1,117,860 | |||||||||||||
|
| ||||||||||||||
| 4,102,644 | |||||||||||||||
|
| ||||||||||||||
| Retail - 4.68% | |||||||||||||||
| American Eagle Outfitters, Inc., 3.750%, Due 4/15/2025B D | 1,574,000 | 2,238,485 | |||||||||||||
| Bloomin’ Brands, Inc., 5.000%, Due 5/1/2025B D | 1,636,000 | 1,867,162 | |||||||||||||
| Burlington Stores, Inc., 2.250%, Due 4/15/2025B D | 676,000 | 768,240 | |||||||||||||
| Dick’s Sporting Goods, Inc., 3.250%, Due 4/15/2025B D | 785,000 | 1,086,570 | |||||||||||||
| National Vision Holdings, Inc., 2.500%, Due 5/15/2025B D | 522,000 | 624,084 | |||||||||||||
|
| ||||||||||||||
| 6,584,541 | |||||||||||||||
|
| ||||||||||||||
Total Consumer, Cyclical | 16,647,045 | ||||||||||||||
|
| ||||||||||||||
| Consumer, Non-Cyclical - 16.09% | |||||||||||||||
| Biotechnology - 8.84% | |||||||||||||||
| Apellis Pharmaceuticals, Inc., 3.500%, Due 9/15/2026B D | 686,000 | 763,357 | |||||||||||||
| Exact Sciences Corp., 0.375%, Due 3/15/2027 | 1,231,000 | 1,275,257 | |||||||||||||
| Gossamer Bio, Inc., 5.000%, Due 6/1/2027B | 611,000 | 611,681 | |||||||||||||
| Halozyme Therapeutics, Inc., 1.250%, Due 12/1/2024B D | 1,353,000 | 1,714,116 | |||||||||||||
| Innoviva, Inc., 2.125%, Due 1/15/2023B | 1,238,000 | 1,221,751 | |||||||||||||
| Insmed, Inc., 1.750%, Due 1/15/2025B | 1,085,000 | 1,054,485 | |||||||||||||
| Ionis Pharmaceuticals, Inc., 0.125%, Due 12/15/2024B D | 1,218,000 | 1,186,866 | |||||||||||||
| Ligand Pharmaceuticals, Inc., 0.750%, Due 5/15/2023B | 2,170,000 | 1,903,167 | |||||||||||||
| Radius Health, Inc., 3.000%, Due 9/1/2024B | 1,636,000 | 1,196,872 | |||||||||||||
| Retrophin, Inc., 2.500%, Due 9/15/2025B | 949,000 | 782,761 | |||||||||||||
| Theravance Biopharma, Inc., 3.250%, Due 11/1/2023B | 742,000 | 714,617 | |||||||||||||
|
| ||||||||||||||
| 12,424,930 | |||||||||||||||
|
| ||||||||||||||
| Commercial Services - 2.72% | |||||||||||||||
| 2U, Inc., 2.250%, Due 5/1/2025B D | 499,000 | 743,990 | |||||||||||||
| Chegg, Inc., 0.125%, Due 3/15/2025B | 626,000 | 885,258 | |||||||||||||
| FTI Consulting, Inc., 2.000%, Due 8/15/2023B | 832,000 | 1,051,514 | |||||||||||||
| Sabre GLBL, Inc., 4.000%, Due 4/15/2025B D | 894,000 | 1,139,764 | |||||||||||||
|
| ||||||||||||||
| 3,820,526 | |||||||||||||||
|
| ||||||||||||||
| Food - 0.64% | |||||||||||||||
| Chefs’ Warehouse, Inc., 1.875%, Due 12/1/2024B D | 1,264,000 | 906,654 | |||||||||||||
|
| ||||||||||||||
| Health Care - Products - 0.56% | |||||||||||||||
| NanoString Technologies, Inc., 2.625%, Due 3/1/2025B D | 679,000 | 628,499 | |||||||||||||
| Varex Imaging Corp., 4.000%, Due 6/1/2025B D | 166,000 | 160,813 | |||||||||||||
|
| ||||||||||||||
| 789,312 | |||||||||||||||
|
| ||||||||||||||
See accompanying notes
20
American Beacon SSI Alternative Income FundSM
Schedule of Investments
June 30, 2020
| Principal Amount | Fair Value | ||||||||||||||
| CONVERTIBLE OBLIGATIONS - 77.10% (continued) | |||||||||||||||
| Consumer, Non-Cyclical - 16.09% (continued) | |||||||||||||||
| Health Care - Services - 0.94% | |||||||||||||||
| Invitae Corp., 2.000%, Due 9/1/2024B D | $ | 1,095,000 | $ | 1,317,507 | |||||||||||
|
| ||||||||||||||
| Pharmaceuticals - 2.39% | |||||||||||||||
| Aerie Pharmaceuticals, Inc., 1.500%, Due 10/1/2024B D | 1,227,000 | 1,089,069 | |||||||||||||
| Coherus Biosciences, Inc., 1.500%, Due 4/15/2026B D | 534,000 | 593,862 | |||||||||||||
| Jazz Investments Ltd., | |||||||||||||||
1.500%, Due 8/15/2024B | 1,397,000 | 1,277,315 | |||||||||||||
2.000%, Due 6/15/2026D | 399,000 | 402,150 | |||||||||||||
|
| ||||||||||||||
| 3,362,396 | |||||||||||||||
|
| ||||||||||||||
Total Consumer, Non-Cyclical | 22,621,325 | ||||||||||||||
|
| ||||||||||||||
| Energy - 3.65% | |||||||||||||||
| Energy - Alternate Sources - 2.36% | |||||||||||||||
| Enphase Energy, Inc., 0.250%, Due 3/1/2025B D | 1,672,000 | 1,509,431 | |||||||||||||
| SunPower Corp., 4.000%, Due 1/15/2023B | 2,256,000 | 1,810,145 | |||||||||||||
|
| ||||||||||||||
| 3,319,576 | |||||||||||||||
|
| ||||||||||||||
| Oil & Gas - 0.39% | |||||||||||||||
| Helix Energy Solutions Group, Inc., 4.125%, Due 9/15/2023B | 662,000 | 546,888 | |||||||||||||
|
| ||||||||||||||
| Pipelines - 0.90% | |||||||||||||||
| Cheniere Energy, Inc., 4.250%, Due 3/15/2045B C | 2,001,000 | 1,265,304 | |||||||||||||
|
| ||||||||||||||
Total Energy | 5,131,768 | ||||||||||||||
|
| ||||||||||||||
| Financial - 19.22% | |||||||||||||||
| Banks - 1.13% | |||||||||||||||
| Hope Bancorp, Inc., 2.000%, Due 5/15/2038B C | 1,935,000 | 1,589,215 | |||||||||||||
|
| ||||||||||||||
| Diversified Financial Services - 2.83% | |||||||||||||||
| Encore Capital Group, Inc., 2.875%, Due 3/15/2021B | 903,000 | 867,605 | |||||||||||||
| i3 Verticals LLC, 1.000%, Due 2/15/2025B D | 905,000 | 855,527 | |||||||||||||
| PRA Group, Inc., | |||||||||||||||
3.000%, Due 8/1/2020 | 623,000 | 618,611 | |||||||||||||
3.500%, Due 6/1/2023B | 1,118,000 | 1,145,041 | |||||||||||||
| WisdomTree Investments, Inc., 4.250%, Due 6/15/2023D | 515,000 | 489,817 | |||||||||||||
|
| ||||||||||||||
| 3,976,601 | |||||||||||||||
|
| ||||||||||||||
| Insurance - 1.90% | |||||||||||||||
| MGIC Investment Corp., 9.000%, Due 4/1/2063B D | 2,231,000 | 2,677,200 | |||||||||||||
|
| ||||||||||||||
| Investment Companies - 0.99% | |||||||||||||||
| New Mountain Finance Corp., 5.750%, Due 8/15/2023B C | 1,482,000 | 1,389,375 | |||||||||||||
|
| ||||||||||||||
| REITS - 12.37% | |||||||||||||||
| Apollo Commercial Real Estate Finance, Inc., | |||||||||||||||
4.750%, Due 8/23/2022 | 989,000 | 859,322 | |||||||||||||
5.375%, Due 10/15/2023B | 2,131,000 | 1,728,528 | |||||||||||||
| Arbor Realty Trust, Inc., 4.750%, Due 11/1/2022B D | 1,953,000 | 1,767,106 | |||||||||||||
| Blackstone Mortgage Trust, Inc., 4.750%, Due 3/15/2023 | 1,265,000 | 1,156,684 | |||||||||||||
| Granite Point Mortgage Trust, Inc., | |||||||||||||||
5.625%, Due 12/1/2022D | 1,928,000 | 1,486,970 | |||||||||||||
6.375%, Due 10/1/2023B | 830,000 | 581,000 | |||||||||||||
| iStar, Inc., 3.125%, Due 9/15/2022 | 782,000 | 832,341 | |||||||||||||
| KKR Real Estate Finance Trust, Inc., 6.125%, Due 5/15/2023B | 1,353,000 | 1,298,316 | |||||||||||||
| MFA Financial, Inc., 6.250%, Due 6/15/2024 | 1,813,000 | 1,586,375 | |||||||||||||
| New York Mortgage Trust, Inc., 6.250%, Due 1/15/2022 | 1,432,000 | 1,281,640 | |||||||||||||
| PennyMac Corp., 5.500%, Due 11/1/2024B D | 2,162,000 | 2,039,111 | |||||||||||||
| Redwood Trust, Inc., 4.750%, Due 8/15/2023 | 800,000 | 714,836 | |||||||||||||
See accompanying notes
21
American Beacon SSI Alternative Income FundSM
Schedule of Investments
June 30, 2020
| Principal Amount | Fair Value | ||||||||||||||
| CONVERTIBLE OBLIGATIONS - 77.10% (continued) | |||||||||||||||
| Financial - 19.22% (continued) | |||||||||||||||
| REITS - 12.37% (continued) | |||||||||||||||
| Two Harbors Investment Corp., 6.250%, Due 1/15/2022B | $ | 1,268,000 | $ | 1,241,848 | |||||||||||
| Western Asset Mortgage Capital Corp., 6.750%, Due 10/1/2022C | 1,151,000 | 817,210 | |||||||||||||
|
| ||||||||||||||
| 17,391,287 | |||||||||||||||
|
| ||||||||||||||
Total Financial | 27,023,678 | ||||||||||||||
|
| ||||||||||||||
| Industrial - 6.44% | |||||||||||||||
| Aerospace/Defense - 0.49% | |||||||||||||||
| Kaman Corp., 3.250%, Due 5/1/2024B | 719,000 | 681,863 | |||||||||||||
|
| ||||||||||||||
| Electronics - 3.42% | |||||||||||||||
| II-VI, Inc., 0.250%, Due 9/1/2022B | 1,470,000 | 1,742,446 | |||||||||||||
| Knowles Corp., 3.250%, Due 11/1/2021B | 811,000 | 860,714 | |||||||||||||
| OSI Systems, Inc., 1.250%, Due 9/1/2022B | 1,475,000 | 1,411,391 | |||||||||||||
| Vishay Intertechnology, Inc., 2.250%, Due 6/15/2025B | 854,000 | 796,429 | |||||||||||||
|
| ||||||||||||||
| 4,810,980 | |||||||||||||||
|
| ||||||||||||||
| Engineering & Construction - 0.77% | |||||||||||||||
| Granite Construction, Inc., 2.750%, Due 11/1/2024B D | 1,348,000 | 1,082,613 | |||||||||||||
|
| ||||||||||||||
| Transportation - 1.76% | |||||||||||||||
| Air Transport Services Group, Inc., 1.125%, Due 10/15/2024B | 1,072,000 | 1,009,456 | |||||||||||||
| SEACOR Holdings, Inc., 3.250%, Due 5/15/2030B C | 1,956,000 | 1,464,653 | |||||||||||||
|
| ||||||||||||||
| 2,474,109 | |||||||||||||||
|
| ||||||||||||||
Total Industrial | 9,049,565 | ||||||||||||||
|
| ||||||||||||||
| Technology - 10.11% | |||||||||||||||
| Computers - 1.04% | |||||||||||||||
| Lumentum Holdings, Inc., 0.500%, Due 12/15/2026, Series QIBB D | 1,381,000 | 1,453,502 | |||||||||||||
|
| ||||||||||||||
| Semiconductors - 0.22% | |||||||||||||||
| Cree, Inc., 0.875%, Due 9/1/2023 | 268,000 | 314,789 | |||||||||||||
|
| ||||||||||||||
| Software - 8.85% | |||||||||||||||
| Allscripts Healthcare Solutions, Inc., 0.875%, Due 1/1/2027B D | 1,464,000 | 1,119,235 | |||||||||||||
| Cerence, Inc., 3.000%, Due 6/1/2025B D | 299,000 | 392,758 | |||||||||||||
| Envestnet, Inc., 1.750%, Due 6/1/2023B | 776,000 | 954,572 | |||||||||||||
| Everbridge, Inc., 0.125%, Due 12/15/2024B D | 605,000 | 822,106 | |||||||||||||
| Health Catalyst, Inc., 2.500%, Due 4/15/2025B D | 343,000 | 396,297 | |||||||||||||
| J2 Global, Inc., 1.750%, Due 11/1/2026B D | 1,385,000 | 1,164,774 | |||||||||||||
| New Relic, Inc., 0.500%, Due 5/1/2023B | 1,650,000 | 1,594,305 | |||||||||||||
| Nuance Communications, Inc., 1.000%, Due 12/15/2035B C | 797,000 | 940,255 | |||||||||||||
| SailPoint Technologies Holding, Inc., 0.125%, Due 9/15/2024B D | 1,352,000 | 1,518,759 | |||||||||||||
| Splunk, Inc., 1.125%, Due 6/15/2027B D | 333,000 | 354,763 | |||||||||||||
| Tabula Rasa HealthCare, Inc., 1.750%, Due 2/15/2026B D | 1,297,000 | 1,327,301 | |||||||||||||
| Workday, Inc., 0.250%, Due 10/1/2022B | 563,000 | 773,836 | |||||||||||||
| Workiva, Inc., 1.125%, Due 8/15/2026B D | 1,178,000 | 1,077,399 | |||||||||||||
|
| ||||||||||||||
| 12,436,360 | |||||||||||||||
|
| ||||||||||||||
Total Technology | 14,204,651 | ||||||||||||||
|
| ||||||||||||||
| Utilities - 0.95% | |||||||||||||||
| Electric - 0.95% | |||||||||||||||
| NRG Energy, Inc., 2.750%, Due 6/1/2048B C | 1,314,000 | 1,328,471 | |||||||||||||
|
| ||||||||||||||
Total Convertible Obligations (Cost $104,609,149) | 108,381,467 | ||||||||||||||
|
| ||||||||||||||
See accompanying notes
22
American Beacon SSI Alternative Income FundSM
Schedule of Investments
June 30, 2020
| Principal Amount | Fair Value | ||||||||||||||
| FOREIGN CONVERTIBLE OBLIGATIONS - 7.34% | |||||||||||||||
| Basic Materials - 0.55% | |||||||||||||||
| Mining - 0.55% | |||||||||||||||
| First Majestic Silver Corp., 1.875%, Due 3/1/2023B | $ | 628,000 | $ | 776,773 | |||||||||||
|
| ||||||||||||||
| Communications - 3.94% | |||||||||||||||
| Internet - 3.94% | |||||||||||||||
| Farfetch Ltd., 3.750%, Due 5/1/2027B D | 524,000 | 709,692 | |||||||||||||
| JOYY, Inc., 1.375%, Due 6/15/2026B | 1,834,000 | 2,019,546 | |||||||||||||
| Momo, Inc., 1.250%, Due 7/1/2025B | 1,814,000 | 1,397,445 | |||||||||||||
| Weibo Corp., 1.250%, Due 11/15/2022B | 1,525,000 | 1,418,167 | |||||||||||||
|
| ||||||||||||||
| 5,544,850 | |||||||||||||||
|
| ||||||||||||||
| Consumer, Cyclical - 1.13% | |||||||||||||||
| Airlines - 0.64% | |||||||||||||||
| Copa Holdings S.A., 4.500%, Due 4/15/2025B D | 786,000 | 893,444 | |||||||||||||
|
| ||||||||||||||
| Lodging - 0.49% | |||||||||||||||
| Huazhu Group Ltd., 3.000%, Due 5/1/2026B D | 652,000 | 690,519 | |||||||||||||
|
| ||||||||||||||
| Financial - 0.60% | |||||||||||||||
| Financial Services - 0.60% | |||||||||||||||
| Encore Capital Europe Finance Ltd., 4.500%, Due 9/1/2023 | 876,000 | 844,304 | |||||||||||||
|
| ||||||||||||||
| Industrial - 0.52% | |||||||||||||||
| Transportation - 0.52% | |||||||||||||||
| SFL Corp. Ltd., 4.875%, Due 5/1/2023B | 787,000 | 724,217 | |||||||||||||
|
| ||||||||||||||
| Technology - 0.60% | |||||||||||||||
| Software - 0.60% | |||||||||||||||
| Bilibili, Inc., 1.250%, Due 6/15/2027D | 665,000 | 845,714 | |||||||||||||
|
| ||||||||||||||
Total Foreign Convertible Obligations (Cost $9,920,773) | 10,319,821 | ||||||||||||||
|
| ||||||||||||||
| Shares | |||||||||||||||
| SHORT-TERM INVESTMENTS - 8.54% (Cost $12,005,454) | |||||||||||||||
| Investment Companies - 8.54% | |||||||||||||||
| American Beacon U.S. Government Money Market Select Fund, Select Class, 0.07%E F | 12,005,454 | 12,005,454 | |||||||||||||
|
| ||||||||||||||
TOTAL SECURITIES HELD LONG (Cost $136,630,722) | 139,876,564 | ||||||||||||||
|
| ||||||||||||||
| SECURITIES SOLD SHORT - (29.06%) | |||||||||||||||
| COMMON STOCKS - (29.06%) | |||||||||||||||
| Communication Services - (3.78%) | |||||||||||||||
| Diversified Telecommunication Services - (0.17%) | |||||||||||||||
| Vonage Holdings Corp.G | (24,102 | ) | (242,466 | ) | |||||||||||
|
| ||||||||||||||
| Entertainment - (0.50%) | |||||||||||||||
| Bilibili, Inc., ADRG | (11,438 | ) | (529,808 | ) | |||||||||||
| Live Nation Entertainment, Inc.G | (3,953 | ) | (175,237 | ) | |||||||||||
|
| ||||||||||||||
| (705,045 | ) | ||||||||||||||
|
| ||||||||||||||
| Interactive Media & Services - (3.07%) | |||||||||||||||
| IAC/InterActiveCorpG | (4,122 | ) | (1,333,055 | ) | |||||||||||
| JOYY, Inc., ADRG | (12,618 | ) | (1,117,324 | ) | |||||||||||
| Momo, Inc., ADR | (5,719 | ) | (99,968 | ) | |||||||||||
See accompanying notes
23
American Beacon SSI Alternative Income FundSM
Schedule of Investments
June 30, 2020
| Shares | Fair Value | ||||||||||||||
| COMMON STOCKS - (29.06%) (continued) | |||||||||||||||
| Communication Services - (3.78%) (continued) | |||||||||||||||
| Interactive Media & Services - (3.07%) (continued) | |||||||||||||||
| Snap, Inc., Class AG | (44,183 | ) | $ | (1,037,858 | ) | ||||||||||
| Zillow Group, Inc., Class CG | (12,552 | ) | (723,121 | ) | |||||||||||
|
| ||||||||||||||
| (4,311,326 | ) | ||||||||||||||
|
| ||||||||||||||
| Wireless Telecommunication Services - (0.04%) | |||||||||||||||
| Boingo Wireless, Inc.G | (3,846 | ) | (51,229 | ) | |||||||||||
|
| ||||||||||||||
Total Communication Services | (5,310,066 | ) | |||||||||||||
|
| ||||||||||||||
| Consumer Discretionary - (6.30%) | |||||||||||||||
| Auto Components - (0.30%) | |||||||||||||||
| Aptiv PLC | (5,362 | ) | (417,807 | ) | |||||||||||
|
| ||||||||||||||
| Automobiles - (0.44%) | |||||||||||||||
| Winnebago Industries, Inc. | (9,313 | ) | (620,432 | ) | |||||||||||
|
| ||||||||||||||
| Diversified Consumer Services - (0.41%) | |||||||||||||||
| Chegg, Inc.G | (8,514 | ) | (572,652 | ) | |||||||||||
|
| ||||||||||||||
| Hotels, Restaurants & Leisure - (2.71%) | |||||||||||||||
| Bloomin’ Brands, Inc. | (102,717 | ) | (1,094,963 | ) | |||||||||||
| Huazhu Group Ltd., ADR | (10,921 | ) | (382,781 | ) | |||||||||||
| Norwegian Cruise Line Holdings Ltd.G | (79,101 | ) | (1,299,630 | ) | |||||||||||
| Penn National Gaming, Inc.G | (16,747 | ) | (511,453 | ) | |||||||||||
| Royal Caribbean Cruises Ltd. | (10,509 | ) | (528,603 | ) | |||||||||||
|
| ||||||||||||||
| (3,817,430 | ) | ||||||||||||||
|
| ||||||||||||||
| Internet & Direct Marketing Retail - (0.24%) | |||||||||||||||
| Farfetch Ltd., Class AG | (19,715 | ) | (340,478 | ) | |||||||||||
|
| ||||||||||||||
| Leisure Products - (0.28%) | |||||||||||||||
| Callaway Golf Co. | (22,150 | ) | (387,847 | ) | |||||||||||
|
| ||||||||||||||
| Specialty Retail - (1.80%) | |||||||||||||||
| American Eagle Outfitters, Inc. | (107,871 | ) | (1,175,794 | ) | |||||||||||
| Burlington Stores, Inc.G | (2,001 | ) | (394,057 | ) | |||||||||||
| Dick’s Sporting Goods, Inc. | (15,330 | ) | (632,516 | ) | |||||||||||
| National Vision Holdings, Inc.G | (10,861 | ) | (331,477 | ) | |||||||||||
|
| ||||||||||||||
| (2,533,844 | ) | ||||||||||||||
|
| ||||||||||||||
| Textiles, Apparel & Luxury Goods - (0.12%) | |||||||||||||||
| Under Armour, Inc., Class CG | (18,741 | ) | (165,670 | ) | |||||||||||
|
| ||||||||||||||
Total Consumer Discretionary | (8,856,160 | ) | |||||||||||||
|
| ||||||||||||||
| Consumer Staples - (0.14%) | |||||||||||||||
| Food & Staples Retailing - (0.14%) | |||||||||||||||
| Chefs’ Warehouse, Inc.G | (14,303 | ) | (194,235 | ) | |||||||||||
|
| ||||||||||||||
| Energy - (0.50%) | |||||||||||||||
| Energy Equipment & Services - (0.26%) | |||||||||||||||
| Helix Energy Solutions Group, Inc.G | (34,954 | ) | (121,290 | ) | |||||||||||
| SEACOR Holdings, Inc.G | (8,531 | ) | (241,598 | ) | |||||||||||
|
| ||||||||||||||
| (362,888 | ) | ||||||||||||||
|
| ||||||||||||||
See accompanying notes
24
American Beacon SSI Alternative Income FundSM
Schedule of Investments
June 30, 2020
| Shares | Fair Value | ||||||||||||||
| COMMON STOCKS - (29.06%) (continued) | |||||||||||||||
| Energy - (0.50%) (continued) | |||||||||||||||
| Oil, Gas & Consumable Fuels - (0.24%) | |||||||||||||||
| Cheniere Energy, Inc.G | (1,633 | ) | $ | (78,906 | ) | ||||||||||
| SFL Corp. Ltd. | (27,461 | ) | (255,113 | ) | |||||||||||
|
| ||||||||||||||
| (334,019 | ) | ||||||||||||||
|
| ||||||||||||||
Total Energy | (696,907 | ) | |||||||||||||
|
| ||||||||||||||
| Financials - (1.55%) | |||||||||||||||
| Banks - (0.06%) | |||||||||||||||
| Hope Bancorp, Inc. | (8,735 | ) | (80,537 | ) | |||||||||||
|
| ||||||||||||||
| Capital Markets - (0.68%) | |||||||||||||||
| Affiliated Managers Group, Inc. | (3,594 | ) | (267,968 | ) | |||||||||||
| Cowen, Inc., Class A | (36,738 | ) | (595,523 | ) | |||||||||||
| WisdomTree Investments, Inc. | (26,093 | ) | (90,543 | ) | |||||||||||
|
| ||||||||||||||
| (954,034 | ) | ||||||||||||||
|
| ||||||||||||||
| Consumer Finance - (0.68%) | |||||||||||||||
| Encore Capital Group, Inc.G | (14,536 | ) | (496,840 | ) | |||||||||||
| PRA Group, Inc.G | (12,104 | ) | (467,941 | ) | |||||||||||
|
| ||||||||||||||
| (964,781 | ) | ||||||||||||||
|
| ||||||||||||||
| Mortgage Real Estate Investment Trusts (REITs) - (0.13%) | |||||||||||||||
| Apollo Commercial Real Estate Finance, Inc. | (5,220 | ) | (51,208 | ) | |||||||||||
| KKR Real Estate Finance Trust, Inc. | (3,304 | ) | (54,780 | ) | |||||||||||
| PennyMac Mortgage Investment Trust | (4,328 | ) | (75,870 | ) | |||||||||||
|
| ||||||||||||||
| (181,858 | ) | ||||||||||||||
|
| ||||||||||||||
Total Financials | (2,181,210 | ) | |||||||||||||
|
| ||||||||||||||
| Health Care - (5.32%) | |||||||||||||||
| Biotechnology - (3.25%) | |||||||||||||||
| Apellis Pharmaceuticals, Inc.G | (13,039 | ) | (425,854 | ) | |||||||||||
| Coherus Biosciences, Inc.G | (17,996 | ) | (321,408 | ) | |||||||||||
| Exact Sciences Corp.G | (7,140 | ) | (620,752 | ) | |||||||||||
| Gossamer Bio, Inc.G | (22,607 | ) | (293,891 | ) | |||||||||||
| Halozyme Therapeutics, Inc.G | (35,161 | ) | (942,666 | ) | |||||||||||
| Insmed, Inc.G | (12,454 | ) | (342,983 | ) | |||||||||||
| Invitae Corp.G | (21,637 | ) | (655,385 | ) | |||||||||||
| Ionis Pharmaceuticals, Inc.G | (8,435 | ) | (497,328 | ) | |||||||||||
| Ligand Pharmaceuticals, Inc.G | (1,325 | ) | (148,201 | ) | |||||||||||
| Radius Health, Inc.G | (8,376 | ) | (114,165 | ) | |||||||||||
| Retrophin, Inc.G | (9,790 | ) | (199,814 | ) | |||||||||||
|
| ||||||||||||||
| (4,562,447 | ) | ||||||||||||||
|
| ||||||||||||||
| Health Care Equipment & Supplies - (0.05%) | |||||||||||||||
| Varex Imaging Corp.G | (4,781 | ) | (72,432 | ) | |||||||||||
|
| ||||||||||||||
| Health Care Technology - (0.91%) | |||||||||||||||
| Allscripts Healthcare Solutions, Inc.G | (58,574 | ) | (396,546 | ) | |||||||||||
| Health Catalyst, Inc. | (7,409 | ) | (216,120 | ) | |||||||||||
| Tabula Rasa HealthCare, Inc.G | (12,227 | ) | (669,184 | ) | |||||||||||
|
| ||||||||||||||
| (1,281,850 | ) | ||||||||||||||
|
| ||||||||||||||
| Life Sciences Tools & Services - (0.18%) | |||||||||||||||
| NanoString Technologies, Inc.G | (8,529 | ) | (250,326 | ) | |||||||||||
|
| ||||||||||||||
| Pharmaceuticals - (0.93%) | |||||||||||||||
| Aerie Pharmaceuticals, Inc.G | (24,600 | ) | (363,096 | ) | |||||||||||
| Innoviva, Inc.G | (28,245 | ) | (394,865 | ) | |||||||||||
| Jazz Pharmaceuticals PLCG | (2,837 | ) | (313,035 | ) | |||||||||||
| Theravance Biopharma, Inc.G | (11,439 | ) | (240,105 | ) | |||||||||||
|
| ||||||||||||||
| (1,311,101 | ) | ||||||||||||||
|
| ||||||||||||||
Total Health Care | (7,478,156 | ) | |||||||||||||
|
| ||||||||||||||
See accompanying notes
25
American Beacon SSI Alternative Income FundSM
Schedule of Investments
June 30, 2020
| Shares | Fair Value | ||||||||||||||
| COMMON STOCKS - (29.06%) (continued) | |||||||||||||||
| Industrials - (2.07%) | |||||||||||||||
| Aerospace & Defense - (0.11%) | |||||||||||||||
| Kaman Corp. | (3,856 | ) | $ | (160,409 | ) | ||||||||||
|
| ||||||||||||||
| Air Freight & Logistics - (0.27%) | |||||||||||||||
| Air Transport Services Group, Inc.G | (16,781 | ) | (373,713 | ) | |||||||||||
|
| ||||||||||||||
| Airlines - (0.81%) | |||||||||||||||
| Copa Holdings S.A., Class A | (10,028 | ) | (507,016 | ) | |||||||||||
| Southwest Airlines Co. | (18,439 | ) | (630,245 | ) | |||||||||||
|
| ||||||||||||||
| (1,137,261 | ) | ||||||||||||||
|
| ||||||||||||||
| Construction & Engineering - (0.29%) | |||||||||||||||
| Granite Construction, Inc. | (21,419 | ) | (409,960 | ) | |||||||||||
|
| ||||||||||||||
| Machinery - (0.12%) | |||||||||||||||
| Meritor, Inc.G | (8,505 | ) | (168,399 | ) | |||||||||||
|
| ||||||||||||||
| Professional Services - (0.47%) | |||||||||||||||
| FTI Consulting, Inc.G | (5,713 | ) | (654,424 | ) | |||||||||||
|
| ||||||||||||||
Total Industrials | (2,904,166 | ) | |||||||||||||
|
| ||||||||||||||
| Information Technology - (7.96%) | |||||||||||||||
| Communications Equipment - (0.91%) | |||||||||||||||
| Infinera Corp.G | (31,636 | ) | (187,285 | ) | |||||||||||
| Lumentum Holdings, Inc.G | (9,337 | ) | (760,312 | ) | |||||||||||
| Motorola Solutions, Inc. | (2,396 | ) | (335,752 | ) | |||||||||||
|
| ||||||||||||||
| (1,283,349 | ) | ||||||||||||||
|
| ||||||||||||||
| Electronic Equipment, Instruments & Components - (1.09%) | |||||||||||||||
| II-VI, Inc.G | (15,311 | ) | (722,985 | ) | |||||||||||
| Knowles Corp.G | (19,807 | ) | (302,255 | ) | |||||||||||
| OSI Systems, Inc.G | (4,794 | ) | (357,824 | ) | |||||||||||
| Vishay Intertechnology, Inc. | (9,515 | ) | (145,294 | ) | |||||||||||
|
| ||||||||||||||
| (1,528,358 | ) | ||||||||||||||
|
| ||||||||||||||
| IT Services - (1.09%) | |||||||||||||||
| I3 Verticals, Inc., Class AG | (12,015 | ) | (363,454 | ) | |||||||||||
| Perficient, Inc.G | (15,522 | ) | (555,377 | ) | |||||||||||
| Sabre Corp. | (76,017 | ) | (612,697 | ) | |||||||||||
|
| ||||||||||||||
| (1,531,528 | ) | ||||||||||||||
|
| ||||||||||||||
| Semiconductors & Semiconductor Equipment - (0.38%) | |||||||||||||||
| Cree, Inc.G | (2,402 | ) | (142,174 | ) | |||||||||||
| Enphase Energy, Inc.G | (7,007 | ) | (333,323 | ) | |||||||||||
| SunPower Corp.G | (7,390 | ) | (56,608 | ) | |||||||||||
|
| ||||||||||||||
| (532,105 | ) | ||||||||||||||
|
| ||||||||||||||
| Software - (4.26%) | |||||||||||||||
| 2U, Inc.G | (13,199 | ) | (501,034 | ) | |||||||||||
| Cerence, Inc.G | (5,581 | ) | (227,928 | ) | |||||||||||
| Envestnet, Inc.G | (6,520 | ) | (479,481 | ) | |||||||||||
| Everbridge, Inc.G | (3,768 | ) | (521,340 | ) | |||||||||||
| J2 Global, Inc. | (5,274 | ) | (333,370 | ) | |||||||||||
| New Relic, Inc.G | (5,214 | ) | (359,245 | ) | |||||||||||
| Nuance Communications, Inc.G | (18,171 | ) | (459,817 | ) | |||||||||||
| Palo Alto Networks, Inc.G | (2,464 | ) | (565,907 | ) | |||||||||||
See accompanying notes
26
American Beacon SSI Alternative Income FundSM
Schedule of Investments
June 30, 2020
| Shares | Fair Value | ||||||||||||||
| COMMON STOCKS - (29.06%) (continued) | |||||||||||||||
| Information Technology - (7.96%) (continued) | |||||||||||||||
| Software - (4.26%) (continued) | |||||||||||||||
| Q2 Holdings, Inc.G | (7,966 | ) | $ | (683,403 | ) | ||||||||||
| SailPoint Technologies Holding, Inc.G | (29,666 | ) | (785,259 | ) | |||||||||||
| Splunk, Inc.G | (666 | ) | (132,334 | ) | |||||||||||
| Workday, Inc., Class AG | (2,958 | ) | (554,211 | ) | |||||||||||
| Workiva, Inc.G | (7,329 | ) | (392,028 | ) | |||||||||||
|
| ||||||||||||||
| (5,995,357 | ) | ||||||||||||||
|
| ||||||||||||||
| Technology Hardware, Storage & Peripherals - (0.23%) | |||||||||||||||
| NCR Corp.G | (18,595 | ) | (322,065 | ) | |||||||||||
|
| ||||||||||||||
Total Information Technology | (11,192,762 | ) | |||||||||||||
|
| ||||||||||||||
| Materials - (0.20%) | |||||||||||||||
| Metals & Mining - (0.20%) | |||||||||||||||
| First Majestic Silver Corp.G | (28,317 | ) | (281,754 | ) | |||||||||||
|
| ||||||||||||||
| Real Estate - (0.95%) | |||||||||||||||
| Equity Real Estate Investment Trusts (REITs) - (0.95%) | |||||||||||||||
| iStar, Inc. | (26,714 | ) | (329,116 | ) | |||||||||||
| QTS Realty Trust, Inc., Class A | (15,754 | ) | (1,009,674 | ) | |||||||||||
|
| ||||||||||||||
| (1,338,790 | ) | ||||||||||||||
|
| ||||||||||||||
Total Real Estate | (1,338,790 | ) | |||||||||||||
|
| ||||||||||||||
| Utilities - (0.29%) | |||||||||||||||
| Electric Utilities - (0.29%) | |||||||||||||||
| NRG Energy, Inc. | (12,680 | ) | (412,861 | ) | |||||||||||
|
| ||||||||||||||
TOTAL COMMON STOCKS (Proceeds $(36,785,277)) | (40,847,067 | ) | |||||||||||||
|
| ||||||||||||||
TOTAL SECURITIES SOLD SHORT (Proceeds $(36,785,277)) | (40,847,067 | ) | |||||||||||||
|
| ||||||||||||||
TOTAL INVESTMENTS IN SECURITIES (EXCLUDES SECURITIES SOLD SHORT) - 99.51% (Cost $136,630,722) | 139,876,564 | ||||||||||||||
TOTAL WRITTEN OPTIONS CONTRACTS - (0.29%) (Premiums Received $(319,574)) | (407,839 | ) | |||||||||||||
TOTAL SECURITIES SOLD SHORT - (29.06%) (Proceeds $(36,785,277)) | (40,847,067 | ) | |||||||||||||
OTHER ASSETS, NET OF LIABILITIES - 29.84% | 41,949,436 | ||||||||||||||
|
| ||||||||||||||
NET ASSETS - 100.00% | $ | 140,571,094 | |||||||||||||
|
| ||||||||||||||
| Percentages are stated as a percent of net assets. | |||||||||||||||
A A type of Preferred Stock that has no maturity date.
B This security or a piece thereof is held as segregated collateral. At period end, the value of these securities amounted to $107,982,161 or 76.82% of net assets.
C Callable security.
D Security exempt from registration under the Securities Act of 1933. These securities may be resold to qualified institutional buyers pursuant to Rule 144A. At the period end, the value of these securities amounted to $53,556,228 or 38.10% of net assets. The Fund has no right to demand registration of these securities.
E The Fund is affiliated by having the same investment advisor.
F 7-day yield.
G Non-income producing security.
ADR - American Depositary Receipt.
LLC - Limited Liability Company.
PIK - Payment in Kind.
PLC - Public Limited Company.
See accompanying notes
27
American Beacon SSI Alternative Income FundSM
Schedule of Investments
June 30, 2020
| Written Options Contracts Open on June 30, 2020: |
| |||||||||||||||||||||||||||
| Equity Options | ||||||||||||||||||||||||||||
| Description | Counter- party | Exercise Price | Expiration Date | Currency | Number of Contracts | Notional Amount | Premiums Received | Fair Value | Unrealized Appreciation (Depreciation) | |||||||||||||||||||
| Call - Farfetch Ltd. | CCP | 17.00 | 7/17/2020 | USD | 65 | 6,500 | $ | (8,317 | ) | $ | (7,540 | ) | $ | 777 | ||||||||||||||
| Call - Live Nation Entertainment, Inc. | CCP | 47.50 | 7/17/2020 | USD | 43 | 4,300 | (23,154 | ) | (5,160 | ) | 17,994 | |||||||||||||||||
| Call - Winnebago Industries, Inc. | CCP | 60.00 | 7/17/2020 | USD | 16 | 1,600 | (7,007 | ) | (12,800 | ) | (5,793 | ) | ||||||||||||||||
| Call - American Eagle Outfitters, Inc. | CCP | 9.00 | 8/21/2020 | USD | 360 | 36,000 | (46,065 | ) | (85,500 | ) | (39,435 | ) | ||||||||||||||||
| Call - Callaway Golf Co. | CCP | 18.00 | 8/21/2020 | USD | 74 | 7,400 | (11,689 | ) | (11,100 | ) | 589 | |||||||||||||||||
| Call - Enphase Energy, Inc. | CCP | 45.00 | 8/21/2020 | USD | 31 | 3,100 | (21,636 | ) | (25,110 | ) | (3,474 | ) | ||||||||||||||||
| Call - First Majestic Silver Corp. | CCP | 10.00 | 8/21/2020 | USD | 131 | 13,100 | (13,488 | ) | (13,755 | ) | (267 | ) | ||||||||||||||||
| Call - II-VI, Inc. | CCP | 45.00 | 8/21/2020 | USD | 62 | 6,200 | (31,880 | ) | (33,790 | ) | (1,910 | ) | ||||||||||||||||
| Call - Invitae Corp. | CCP | 30.00 | 9/18/2020 | USD | 74 | 7,400 | (30,929 | ) | (32,560 | ) | (1,631 | ) | ||||||||||||||||
| Call - Norwegian Cruise Line Holdings Ltd. | CCP | 15.00 | 9/18/2020 | USD | 238 | 23,800 | (78,053 | ) | (94,724 | ) | (16,671 | ) | ||||||||||||||||
| Call - Snap, Inc. | CCP | 17.00 | 1/15/2021 | USD | 110 | 11,000 | (47,356 | ) | (85,800 | ) | (38,444 | ) | ||||||||||||||||
|
|
|
|
|
| |||||||||||||||||||||||
| $ | (319,574 | ) | $ | (407,839 | ) | $ | (88,265 | ) | ||||||||||||||||||||
|
|
|
|
|
| |||||||||||||||||||||||
| Currency Abbreviations: | ||
| USD | United States Dollar. | |
| Other Abbreviations: | ||
| CCP | Central Counterparty Clearing House. | |
The Fund’s investments are summarized by level based on the inputs used to determine their values. As of June 30, 2020, the investments were classified as described below:
SSI Alternative Income Fund | Level 1 | Level 2 | Level 3 | Total | ||||||||||||||||||||||||
Assets |
| |||||||||||||||||||||||||||
Convertible Preferred Stocks | $ | - | $ | 9,169,822 | $ | - | $ | 9,169,822 | ||||||||||||||||||||
Convertible Obligations | - | 108,381,467 | - | 108,381,467 | ||||||||||||||||||||||||
Foreign Convertible Obligations | - | 10,319,821 | - | 10,319,821 | ||||||||||||||||||||||||
Short-Term Investments | 12,005,454 | - | - | 12,005,454 | ||||||||||||||||||||||||
|
|
|
|
|
|
|
| |||||||||||||||||||||
Total Investments in Securities - Assets | $ | 12,005,454 | $ | 127,871,110 | $ | - | $ | 139,876,564 | ||||||||||||||||||||
|
|
|
|
|
|
|
| |||||||||||||||||||||
Liabilities |
| |||||||||||||||||||||||||||
Common Stocks (Sold Short) | $ | (40,847,067 | ) | $ | - | $ | - | $ | (40,847,067 | ) | ||||||||||||||||||
|
|
|
|
|
|
|
| |||||||||||||||||||||
Total Investments in Securities - Liabilities | (40,847,067 | ) | - | - | (40,847,067 | ) | ||||||||||||||||||||||
|
|
|
|
|
|
|
| |||||||||||||||||||||
Total Investments in Securities | $ | (28,841,613 | ) | $ | 127,871,110 | $ | - | $ | 99,029,497 | |||||||||||||||||||
|
|
|
|
|
|
|
| |||||||||||||||||||||
Financial Derivative Instruments - Liabilities |
| |||||||||||||||||||||||||||
Written Options | $ | (407,839 | ) | $ | - | $ | - | $ | (407,839 | ) | ||||||||||||||||||
|
|
|
|
|
|
|
| |||||||||||||||||||||
Total Financial Derivative Instruments - Liabilities | $ | (407,839 | ) | $ | - | $ | - | $ | (407,839 | ) | ||||||||||||||||||
|
|
|
|
|
|
|
| |||||||||||||||||||||
U.S. GAAP requires transfers between all levels to/from level 3 be disclosed. During the year ended June 30, 2020, there were no transfers into or out of Level 3.
See accompanying notes
28
American Beacon TwentyFour Short Term Bond FundSM
Schedule of Investments
June 30, 2020
| Principal Amount* | Fair Value | ||||||||||||||
| CORPORATE OBLIGATIONS - 9.35% | |||||||||||||||
| Consumer, Non-Cyclical - 1.00% | |||||||||||||||
| Beverages - 1.00% | |||||||||||||||
| Keurig Dr Pepper, Inc., 3.551%, Due 5/25/2021 | $ | 100,000 | $ | 102,779 | |||||||||||
|
| ||||||||||||||
| Financial - 5.49% | |||||||||||||||
| Banks - 2.62% | |||||||||||||||
Bank of America Corp., 5.500%, Due 11/22/2021A | GBP | 100,000 | 130,908 | ||||||||||||
Wells Fargo Bank, N.A., 5.250%, Due 8/1/2023A | GBP | 100,000 | 137,571 | ||||||||||||
|
| ||||||||||||||
| 268,479 | |||||||||||||||
|
| ||||||||||||||
| REITS - 2.87% | |||||||||||||||
American Tower Corp., 2.250%, Due 1/15/2022 | 100,000 | 102,492 | |||||||||||||
Digital Stout Holding LLC, 4.750%, Due 10/13/2023A | GBP | 140,000 | 191,957 | ||||||||||||
|
| ||||||||||||||
| 294,449 | |||||||||||||||
|
| ||||||||||||||
Total Financial | 562,928 | ||||||||||||||
|
| ||||||||||||||
| Industrial - 1.02% | |||||||||||||||
| Machinery - Diversified - 1.02% | |||||||||||||||
| CNH Industrial Capital LLC, 4.375%, Due 4/5/2022 | 100,000 | 104,520 | |||||||||||||
|
| ||||||||||||||
| Technology - 1.84% | |||||||||||||||
| Software - 1.84% | |||||||||||||||
| Fidelity National Information Services, Inc., 1.700%, Due 6/30/2022 | GBP | 150,000 | 188,269 | ||||||||||||
|
| ||||||||||||||
Total Corporate Obligations (Cost $984,837) | 958,496 | ||||||||||||||
|
| ||||||||||||||
| FOREIGN CORPORATE OBLIGATIONS - 74.48% | |||||||||||||||
| Communications - 7.30% | |||||||||||||||
| Media - 1.10% | |||||||||||||||
| Pearson Funding PLC, 1.875%, Due 5/19/2021A | EUR | 100,000 | 113,456 | ||||||||||||
|
| ||||||||||||||
| Telecommunications - 6.20% | |||||||||||||||
America Movil S.A.B. de C.V., 6.375%, Due 9/6/2073, Series C, (5-Yr. GBP Swap + 4.100%)A B | GBP | 100,000 | 124,014 | ||||||||||||
Deutsche Telekom International Finance B.V., 6.500%, Due 4/8/2022A | GBP | 90,000 | 122,629 | ||||||||||||
Global Switch Holdings Ltd., 4.375%, Due 12/13/2022A | GBP | 143,000 | 187,451 | ||||||||||||
Orange S.A., 5.750%, Due 4/1/2023, (5-Yr. GBP Swap + 3.353%)A B | GBP | 150,000 | 201,199 | ||||||||||||
|
| ||||||||||||||
| 635,293 | |||||||||||||||
|
| ||||||||||||||
Total Communications | 748,749 | ||||||||||||||
|
| ||||||||||||||
| Consumer, Cyclical - 2.61% | |||||||||||||||
| Auto Parts & Equipment - 1.26% | |||||||||||||||
| GKN Holdings Ltd., 5.375%, Due 9/19/2022A | GBP | 100,000 | 128,881 | ||||||||||||
|
| ||||||||||||||
| Entertainment - 1.35% | |||||||||||||||
| CPUK Finance Ltd., 7.239%, Due 2/28/2024A | GBP | 100,000 | 138,898 | ||||||||||||
|
| ||||||||||||||
Total Consumer, Cyclical | 267,779 | ||||||||||||||
|
| ||||||||||||||
| Consumer, Non-Cyclical - 4.09% | |||||||||||||||
| Commercial Services - 1.24% | |||||||||||||||
| Experian Finance PLC, 3.500%, Due 10/15/2021A | GBP | 100,000 | 127,153 | ||||||||||||
|
| ||||||||||||||
| Food - 1.57% | |||||||||||||||
| Tesco PLC, 6.125%, Due 2/24/2022 | GBP | 120,000 | 160,469 | ||||||||||||
|
| ||||||||||||||
| Health Care - Services - 1.28% | |||||||||||||||
| BUPA Finance PLC, 5.000%, Due 4/25/2023A | GBP | 100,000 | 131,139 | ||||||||||||
|
| ||||||||||||||
Total Consumer, Non-Cyclical | 418,761 | ||||||||||||||
|
| ||||||||||||||
See accompanying notes
29
American Beacon TwentyFour Short Term Bond FundSM
Schedule of Investments
June 30, 2020
| Principal Amount* | Fair Value | ||||||||||||||
| FOREIGN CORPORATE OBLIGATIONS - 74.48% (continued) | |||||||||||||||
| Financial - 47.76% | |||||||||||||||
| Banks - 18.59% | |||||||||||||||
| Argenta Spaarbank N.V., 3.875%, Due 5/24/2026, (5-Yr. Annual EUR Swap + 3.950%)A B | EUR | 200,000 | $ | 226,840 | |||||||||||
| Barclays Bank PLC, 10.000%, Due 5/21/2021A | GBP | 185,000 | 245,190 | ||||||||||||
| Close Brothers Finance PLC, 3.875%, Due 6/27/2021A | GBP | 100,000 | 127,398 | ||||||||||||
| Credit Agricole S.A., 7.375%, Due 12/18/2023 | GBP | 150,000 | 219,460 | ||||||||||||
| HBOS PLC, 5.374%, Due 6/30/2021 | EUR | 100,000 | 114,437 | ||||||||||||
| ING Bank N.V., 3.625%, Due 2/25/2026, (5-Yr. Annual EUR Swap + 2.250%)A B | EUR | 100,000 | 114,003 | ||||||||||||
| Investec Bank PLC, 9.625%, Due 2/17/2022A | GBP | 100,000 | 135,531 | ||||||||||||
| Investec PLC, 4.500%, Due 5/5/2022A | GBP | 100,000 | 127,954 | ||||||||||||
| Lloyds Bank PLC, 9.625%, Due 4/6/2023A | GBP | 100,000 | 148,262 | ||||||||||||
| TSB Banking Group PLC, 5.750%, Due 5/6/2026, (3-mo. GBP LIBOR + 3.430%)B | GBP | 100,000 | 123,697 | ||||||||||||
| UBS Group AG, 6.875%, Due 3/22/2021, (5-Yr. USD ICE Swap + 5.497%)A B | $ | 200,000 | 202,250 | ||||||||||||
| Virgin Money UK PLC, 5.000%, Due 2/9/2026, (5-Yr. GBP Swap + 3.516%)A B | GBP | 100,000 | 120,060 | ||||||||||||
|
| ||||||||||||||
| 1,905,082 | |||||||||||||||
|
| ||||||||||||||
| Diversified Financial Services - 2.84% | |||||||||||||||
| Aareal Bank AG, 4.250%, Due 3/18/2026, (5-Yr. Annual EUR Swap + 2.900%)B | EUR | 36,000 | 37,693 | ||||||||||||
| Close Brothers Group PLC, 4.250%, Due 1/24/2027, (3-mo. GBP LIBOR + 3.650%)A | GBP | 100,000 | 126,549 | ||||||||||||
| Telereal Securitisation PLC, 4.090%, Due 12/10/2033, Series B2, (3-mo. GBP LIBOR + 4.320%)B | GBP | 100,000 | 126,672 | ||||||||||||
|
| ||||||||||||||
| 290,914 | |||||||||||||||
|
| ||||||||||||||
| Insurance - 22.69% | |||||||||||||||
| Admiral Group PLC, 5.500%, Due 7/25/2024A | GBP | 100,000 | 139,137 | ||||||||||||
| Aviva PLC, 6.625%, Due 6/3/2041, (6-mo. GBP LIBOR + 4.136%)A B | GBP | 100,000 | 128,702 | ||||||||||||
| CNP Assurances, 7.375%, Due 9/30/2041, (12-mo. GBP LIBOR + 4.482%)A B | GBP | 100,000 | 131,647 | ||||||||||||
| Direct Line Insurance Group PLC, 9.250%, Due 4/27/2042, (6-mo. GBP LIBOR + 7.910%)A B | GBP | 130,000 | 182,332 | ||||||||||||
| Legal & General Group PLC, 10.000%, Due 7/23/2041, (5-Yr. UK Government Bond + 9.325%)A B | GBP | 110,000 | 147,890 | ||||||||||||
| Liverpool Victoria Friendly Society Ltd., 6.500%, Due 5/22/2043, (5-Yr. UK Government Bond + 5.630%)A B | GBP | 100,000 | 133,779 | ||||||||||||
| Pension Insurance Corp. PLC, 6.500%, Due 7/3/2024A | GBP | 140,000 | 198,212 | ||||||||||||
| Phoenix Group Holdings PLC, | |||||||||||||||
4.125%, Due 7/20/2022A | GBP | 100,000 | 127,817 | ||||||||||||
6.625%, Due 12/18/2025A | GBP | 150,000 | 213,618 | ||||||||||||
| QBE Insurance Group Ltd., 6.115%, Due 5/24/2042, (5-Yr. GBP Swap + 5.000%)A B | GBP | 100,000 | 131,118 | ||||||||||||
| RL Finance Bonds PLC, 6.125%, Due 11/30/2043, (5-Yr. UK Government Bond + 4.321%)A B | GBP | 100,000 | 136,224 | ||||||||||||
| Rothesay Life PLC, 8.000%, Due 10/30/2025A | GBP | 190,000 | 276,894 | ||||||||||||
| Scottish Widows Ltd., 5.500%, Due 6/16/2023A | GBP | 100,000 | 134,247 | ||||||||||||
| Storebrand Livsforsikring A/S, 6.875%, Due 4/4/2043, (6-mo. EUR EURIBOR + 6.194%)A B | EUR | 100,000 | 123,229 | ||||||||||||
| Zurich Finance UK PLC, 6.625%, Due 10/2/2022, (5-Yr. UK Government Bond + 2.850%)A B | GBP | 90,000 | 120,213 | ||||||||||||
|
| ||||||||||||||
| 2,325,059 | |||||||||||||||
|
| ||||||||||||||
| Real Estate - 2.42% | |||||||||||||||
| Aroundtown S.A., 4.750%, Due 6/25/2024, (5-Yr. GBP Swap + 4.377%)A B | GBP | 100,000 | 122,828 | ||||||||||||
| Student Finance PLC, 2.666%, Due 9/30/2029A | GBP | 100,000 | 125,063 | ||||||||||||
|
| ||||||||||||||
| 247,891 | |||||||||||||||
|
| ||||||||||||||
| Savings & Loans - 1.22% | |||||||||||||||
| Skipton Building Society, 1.750%, Due 6/30/2022A | GBP | 100,000 | 125,690 | ||||||||||||
|
| ||||||||||||||
Total Financial | 4,894,636 | ||||||||||||||
|
| ||||||||||||||
| Industrial - 5.51% | |||||||||||||||
| Transportation - 2.46% | |||||||||||||||
| Eversholt Funding PLC, 5.831%, Due 12/2/2020A | GBP | 100,000 | 126,117 | ||||||||||||
| Firstgroup PLC, 5.250%, Due 11/29/2022A | GBP | 100,000 | 125,583 | ||||||||||||
|
| ||||||||||||||
| 251,700 | |||||||||||||||
|
| ||||||||||||||
| Trucking & Leasing - 3.05% | |||||||||||||||
| Great Rolling Stock Co., Ltd., 6.250%, Due 7/27/2020A | GBP | 100,000 | 124,282 | ||||||||||||
| Porterbrook Rail Finance Ltd., 6.500%, Due 10/20/2020A | GBP | 150,000 | 188,411 | ||||||||||||
|
| ||||||||||||||
| 312,693 | |||||||||||||||
|
| ||||||||||||||
Total Industrial | 564,393 | ||||||||||||||
|
| ||||||||||||||
See accompanying notes
30
American Beacon TwentyFour Short Term Bond FundSM
Schedule of Investments
June 30, 2020
| Principal Amount* | Fair Value | ||||||||||||||
| FOREIGN CORPORATE OBLIGATIONS - 74.48% (continued) | |||||||||||||||
| Utilities - 7.21% | |||||||||||||||
| Electric - 3.68% | |||||||||||||||
| Cadent Finance PLC, 1.125%, Due 9/22/2021A | GBP | 100,000 | $ | 124,196 | |||||||||||
| EnBW Energie Baden-Wuerttemberg AG, 3.625%, Due 4/2/2076, (5-Yr. Annual EUR Swap + 2.338%)A B | EUR | 45,000 | 51,087 | ||||||||||||
| SSE PLC, 4.750%, Due 9/16/2077, (5-Yr. Semi-Annual USD Swap + 2.574%)A B | $ | 200,000 | 201,950 | ||||||||||||
|
| ||||||||||||||
| 377,233 | |||||||||||||||
|
| ||||||||||||||
| Gas - 2.32% | |||||||||||||||
| Centrica PLC, 3.000%, Due 4/10/2076, (5-Yr. Annual EUR Swap + 2.687%)A B | EUR | 100,000 | 110,296 | ||||||||||||
| SGSP Australia Assets Pty Ltd., 5.125%, Due 2/11/2021A | GBP | 100,000 | 126,841 | ||||||||||||
|
| ||||||||||||||
| 237,137 | |||||||||||||||
|
| ||||||||||||||
| Water - 1.21% | |||||||||||||||
| Severn Trent Utilities Finance PLC, 1.125%, Due 9/7/2021A | GBP | 100,000 | 124,248 | ||||||||||||
|
| ||||||||||||||
Total Utilities | 738,618 | ||||||||||||||
|
| ||||||||||||||
Total Foreign Corporate Obligations (Cost $7,887,602) | 7,632,936 | ||||||||||||||
|
| ||||||||||||||
| COLLATERALIZED MORTGAGE OBLIGATIONS - 4.98% | |||||||||||||||
| Ripon Mortgages PLC, 1.756%, Due 8/20/2056, 1X C1, (3-mo. GBP LIBOR + 1.500%)A B | GBP | 350,000 | 428,465 | ||||||||||||
| Tower Bridge Funding PLC, 1.082%, Due 3/20/2056, 2 A, (3-mo. GBP LIBOR + 0.900%)A B | GBP | 66,281 | 81,844 | ||||||||||||
|
| ||||||||||||||
Total Collateralized Mortgage Obligations (Cost $543,975) | 510,309 | ||||||||||||||
|
| ||||||||||||||
| U.S. TREASURY OBLIGATIONS - 2.73% (Cost $279,689) | |||||||||||||||
| U.S. Treasury Notes/Bonds, 1.750%, Due 7/31/2021 | 275,000 | 279,683 | |||||||||||||
|
| ||||||||||||||
TOTAL INVESTMENTS - 91.54% (Cost $9,696,103) | 9,381,424 | ||||||||||||||
OTHER ASSETS, NET OF LIABILITIES - 8.46% | 866,796 | ||||||||||||||
|
| ||||||||||||||
TOTAL NET ASSETS - 100.00% | $ | 10,248,220 | |||||||||||||
|
| ||||||||||||||
Percentages are stated as a percent of net assets. *In U.S. Dollars unless otherwise noted. | |||||||||||||||
A Reg S - Security purchased under the Securities Act of 1933, which exempts from registration securities offered and sold outside of the United States. Such a security cannot be sold in the United States without either an effective registration statement filed pursuant to the Securities Act of 1933, or pursuant to an exemption from registration.
B Variable, floating, or adjustable rate securities with an interest rate that changes periodically. Rates are periodically reset with rates that are based on a predetermined benchmark such as a widely followed interest rate such as T-bills, LIBOR or PRIME plus a fixed spread. The interest rate disclosed reflects the rate in effect on June 30, 2020.
EURIBOR - Euro Interbank Offered Rate.
ICE - Intercontinental Exchange.
LIBOR - London Interbank Offered Rate.
LLC - Limited Liability Company.
PLC - Public Limited Company.
PRIME - A rate, charged by banks, based on the U.S. Federal Funds rate.
Pty Ltd. - Proprietary Limited.
See accompanying notes
31
American Beacon TwentyFour Short Term Bond FundSM
Schedule of Investments
June 30, 2020
| Forward Foreign Currency Contracts Open on June 30, 2020: |
| |||||||||||||||||||||||||||
| Currency Purchased* | Currency Sold* | Settlement Date | Counterparty | Unrealized Appreciation | Unrealized (Depreciation) | Net Unrealized Appreciation (Depreciation) | ||||||||||||||||||||||
| GBP | 78,854 | USD | 81,105 | 7/10/2020 | SSB | $ | - | $ | (2,251 | ) | $ | (2,251 | ) | |||||||||||||||
| USD | 8,218,842 | GBP | 8,033,868 | 7/10/2020 | SSB | 184,974 | - | 184,974 | ||||||||||||||||||||
| USD | 916,019 | EUR | 906,732 | 7/10/2020 | SSB | 9,287 | - | 9,287 | ||||||||||||||||||||
|
|
|
|
|
| |||||||||||||||||||||||
| $ | 194,261 | $ | (2,251 | ) | $ | 192,010 | ||||||||||||||||||||||
|
|
|
|
|
| |||||||||||||||||||||||
| * | All values denominated in USD. |
| Glossary: | ||
| Counterparty Abbreviations: | ||
| SSB | State Street Bank & Trust Co. | |
| Currency Abbreviations: | ||
| EUR | Euro. | |
| GBP | Pound Sterling. | |
| USD | United States Dollar. | |
The Fund’s investments are summarized by level based on the inputs used to determine their values. As of June 30, 2020, the investments were classified as described below:
TwentyFour Short Term Bond Fund | Level 1 | Level 2 | Level 3 | Total | ||||||||||||||||||||||||
Assets | ||||||||||||||||||||||||||||
Corporate Obligations | $ | - | $ | 958,496 | $ | - | $ | 958,496 | ||||||||||||||||||||
Foreign Corporate Obligations | - | 7,632,936 | - | 7,632,936 | ||||||||||||||||||||||||
Collateralized Mortgage Obligations | - | 510,309 | - | 510,309 | ||||||||||||||||||||||||
U.S. Treasury Obligations | - | 279,683 | - | 279,683 | ||||||||||||||||||||||||
|
|
|
|
|
|
|
| |||||||||||||||||||||
Total Investments in Securities – Assets | $ | - | $ | 9,381,424 | $ | - | $ | 9,381,424 | ||||||||||||||||||||
|
|
|
|
|
|
|
| |||||||||||||||||||||
Financial Derivative Instruments - Assets |
| |||||||||||||||||||||||||||
Forward Foreign Currency Contracts | $ | - | $ | 194,261 | $ | - | $ | 194,261 | ||||||||||||||||||||
|
|
|
|
|
|
|
| |||||||||||||||||||||
Total Financial Derivative Instruments - Assets | $ | - | $ | 194,261 | $ | - | $ | 194,261 | ||||||||||||||||||||
|
|
|
|
|
|
|
| |||||||||||||||||||||
Financial Derivative Instruments - Liabilities |
| |||||||||||||||||||||||||||
Forward Foreign Currency Contracts | $ | - | $ | (2,251 | ) | $ | - | $ | (2,251 | ) | ||||||||||||||||||
|
|
|
|
|
|
|
| |||||||||||||||||||||
Total Financial Derivative Instruments - Liabilities | $ | - | $ | (2,251 | ) | $ | - | $ | (2,251 | ) | ||||||||||||||||||
|
|
|
|
|
|
|
| |||||||||||||||||||||
U.S. GAAP requires transfers between all levels to/from level 3 be disclosed. During the year ended June 30, 2020, there were no transfers into or out of Level 3.
See accompanying notes
32
American Beacon TwentyFour Strategic Income FundSM
Schedule of Investments
June 30, 2020
| Principal Amount* | Fair Value | ||||||||||||||
| CORPORATE OBLIGATIONS - 8.55% | |||||||||||||||
| Communications - 0.74% | |||||||||||||||
| Media - 0.41% | |||||||||||||||
| Diamond Sports Group LLC / Diamond Sports Finance Co., 5.375%, Due 8/15/2026A | $ | 336,000 | $ | 243,180 | |||||||||||
| Nexstar Broadcasting, Inc., 5.625%, Due 7/15/2027A | 262,000 | 260,050 | |||||||||||||
|
| ||||||||||||||
| 503,230 | |||||||||||||||
|
| ||||||||||||||
| Telecommunications - 0.33% | |||||||||||||||
| AT&T, Inc., | |||||||||||||||
2.300%, Due 6/1/2027 | 100,000 | 103,527 | |||||||||||||
2.750%, Due 6/1/2031 | 300,000 | 312,357 | |||||||||||||
|
| ||||||||||||||
| 415,884 | |||||||||||||||
|
| ||||||||||||||
Total Communications | 919,114 | ||||||||||||||
|
| ||||||||||||||
| Consumer, Cyclical - 0.62% | |||||||||||||||
| Auto Parts & Equipment - 0.15% | |||||||||||||||
| Clarios Global LP / Clarios US Finance Co, 6.250%, Due 5/15/2026A | 184,000 | 189,750 | |||||||||||||
|
| ||||||||||||||
| Home Builders - 0.22% | |||||||||||||||
| Shea Homes LP / Shea Homes Funding Corp., 4.750%, Due 2/15/2028A | 280,000 | 266,000 | |||||||||||||
|
| ||||||||||||||
| Household Products/Wares - 0.25% | |||||||||||||||
| Newell Brands, Inc., 4.875%, Due 6/1/2025 | 300,000 | 314,187 | |||||||||||||
|
| ||||||||||||||
Total Consumer, Cyclical | 769,937 | ||||||||||||||
|
| ||||||||||||||
| Consumer, Non-Cyclical - 2.25% | |||||||||||||||
| Commercial Services - 0.48% | |||||||||||||||
| ASGN, Inc., 4.625%, Due 5/15/2028A | 266,000 | 259,781 | |||||||||||||
| Korn Ferry, 4.625%, Due 12/15/2027A | 347,000 | 336,590 | |||||||||||||
|
| ||||||||||||||
| 596,371 | |||||||||||||||
|
| ||||||||||||||
| Cosemetics/Personal Care - 0.26% | |||||||||||||||
| Edgewell Personal Care Co., 5.500%, Due 6/1/2028A | 312,000 | 320,580 | |||||||||||||
|
| ||||||||||||||
| Food - 0.55% | |||||||||||||||
| B&G Foods, Inc., 5.250%, Due 9/15/2027 | 244,000 | 244,610 | |||||||||||||
| Kraft Heinz Foods Co., | |||||||||||||||
4.625%, Due 1/30/2029 | 100,000 | 107,800 | |||||||||||||
3.750%, Due 4/1/2030A | 100,000 | 103,257 | |||||||||||||
4.250%, Due 3/1/2031A | 217,000 | 230,084 | |||||||||||||
|
| ||||||||||||||
| 685,751 | |||||||||||||||
|
| ||||||||||||||
| Health Care - Services - 0.32% | |||||||||||||||
| Select Medical Corp., 6.250%, Due 8/15/2026A | 398,000 | 402,358 | |||||||||||||
|
| ||||||||||||||
| Household Products/Wares - 0.36% | |||||||||||||||
| Prestige Brands, Inc., 5.125%, Due 1/15/2028A | 450,000 | 443,250 | |||||||||||||
|
| ||||||||||||||
| Pharmaceuticals - 0.28% | |||||||||||||||
| Bausch Health Cos., Inc., | |||||||||||||||
9.000%, Due 12/15/2025A | 233,000 | 250,990 | |||||||||||||
5.000%, Due 1/30/2028A | 100,000 | 94,149 | |||||||||||||
|
| ||||||||||||||
| 345,139 | |||||||||||||||
|
| ||||||||||||||
Total Consumer, Non-Cyclical | 2,793,449 | ||||||||||||||
|
| ||||||||||||||
| Financial - 0.83% | |||||||||||||||
| Insurance - 0.11% | |||||||||||||||
| Liberty Mutual Group, Inc., 3.625%, Due 5/23/2059, (5-Yr. Annual EUR Swap + 3.700%)B C | EUR | 130,000 | 140,242 | ||||||||||||
|
| ||||||||||||||
See accompanying notes
33
American Beacon TwentyFour Strategic Income FundSM
Schedule of Investments
June 30, 2020
| Principal Amount* | Fair Value | ||||||||||||||
| CORPORATE OBLIGATIONS - 8.55% (continued) | |||||||||||||||
| Financial - 0.83% (continued) | |||||||||||||||
| REITS - 0.72% | |||||||||||||||
| Brookfield Property REIT, Inc. / BPR Cumulus LLC / BPR Nimbus LLC / GGSI Sellco LLC, 5.750%, Due 5/15/2026A | $ | 540,000 | $ | 456,300 | |||||||||||
| VICI Properties LP / VICI Note Co., Inc., | |||||||||||||||
4.250%, Due 12/1/2026A | 200,000 | 191,500 | |||||||||||||
3.750%, Due 2/15/2027A | 159,000 | 149,460 | |||||||||||||
4.125%, Due 8/15/2030A | 100,000 | 95,375 | |||||||||||||
|
| ||||||||||||||
| 892,635 | |||||||||||||||
|
| ||||||||||||||
Total Financial | 1,032,877 | ||||||||||||||
|
| ||||||||||||||
| Industrial - 2.65% | |||||||||||||||
| Building Materials - 0.75% | |||||||||||||||
| Builders FirstSource, Inc., | |||||||||||||||
6.750%, Due 6/1/2027A | 332,000 | 339,885 | |||||||||||||
5.000%, Due 3/1/2030A | 157,000 | 147,580 | |||||||||||||
| Standard Industries, Inc., 4.375%, Due 7/15/2030A | 437,000 | 435,907 | |||||||||||||
|
| ||||||||||||||
| 923,372 | |||||||||||||||
|
| ||||||||||||||
| Electronics - 0.13% | |||||||||||||||
| Flex Ltd., 3.750%, Due 2/1/2026 | 151,000 | 159,937 | |||||||||||||
|
| ||||||||||||||
| Environmental Control - 0.20% | |||||||||||||||
| Stericycle, Inc., 5.375%, Due 7/15/2024A | 240,000 | 246,000 | |||||||||||||
|
| ||||||||||||||
| Miscellaneous Manufacturing - 0.71% | |||||||||||||||
| Amsted Industries, Inc., 4.625%, Due 5/15/2030A | 393,000 | 388,626 | |||||||||||||
| Hillenbrand, Inc., 5.750%, Due 6/15/2025 | 478,000 | 494,730 | |||||||||||||
|
| ||||||||||||||
| 883,356 | |||||||||||||||
|
| ||||||||||||||
| Packaging & Containers - 0.86% | |||||||||||||||
| Ardagh Packaging Finance PLC / Ardagh Holdings USA, Inc., 4.125%, Due 8/15/2026A | 600,000 | 590,310 | |||||||||||||
| Graphic Packaging International LLC, 3.500%, Due 3/15/2028A | 183,000 | 181,573 | |||||||||||||
| Sealed Air Corp., 4.000%, Due 12/1/2027A | 298,000 | 298,000 | |||||||||||||
|
| ||||||||||||||
| 1,069,883 | |||||||||||||||
|
| ||||||||||||||
Total Industrial | 3,282,548 | ||||||||||||||
|
| ||||||||||||||
| Technology - 1.46% | |||||||||||||||
| Computers - 0.49% | |||||||||||||||
| Leidos, Inc., 4.375%, Due 5/15/2030A | 543,000 | 611,663 | |||||||||||||
|
| ||||||||||||||
| Semiconductors - 0.53% | |||||||||||||||
| Broadcom, Inc., | |||||||||||||||
4.700%, Due 4/15/2025A | 221,000 | 249,017 | |||||||||||||
3.150%, Due 11/15/2025A | 225,000 | 239,472 | |||||||||||||
4.150%, Due 11/15/2030A | 149,000 | 161,916 | |||||||||||||
|
| ||||||||||||||
| 650,405 | |||||||||||||||
|
| ||||||||||||||
| Software - 0.44% | |||||||||||||||
| PTC, Inc., 4.000%, Due 2/15/2028A | 550,000 | 544,566 | |||||||||||||
|
| ||||||||||||||
Total Technology | 1,806,634 | ||||||||||||||
|
| ||||||||||||||
Total Corporate Obligations (Cost $10,750,628) | 10,604,559 | ||||||||||||||
|
| ||||||||||||||
| FOREIGN CONVERTIBLE OBLIGATIONS - 0.16% (Cost $233,647) | |||||||||||||||
| Financial - 0.16% | |||||||||||||||
| Insurance - 0.16% | |||||||||||||||
| BNP Paribas Fortis S.A., 1.604%, Due 12/31/2049B C | 250,000 | 203,617 | |||||||||||||
|
| ||||||||||||||
See accompanying notes
34
American Beacon TwentyFour Strategic Income FundSM
Schedule of Investments
June 30, 2020
| Principal Amount* | Fair Value | ||||||||||||||
| FOREIGN CORPORATE OBLIGATIONS - 56.26% | |||||||||||||||
| Basic Materials - 0.66% | |||||||||||||||
| Chemicals - 0.09% | |||||||||||||||
| Arkema S.A., 2.750%, Due 6/17/2024, (5-Yr. Annual EUR Swap + 2.865%)B C | EUR | 100,000 | $ | 112,144 | |||||||||||
|
| ||||||||||||||
| Forest Products & Paper - 0.03% | |||||||||||||||
| Paper Industries Intermediate Financing SARL, 6.000%, Due 3/1/2025, (3-mo. EUR EURIBOR + 6.000%)A C | EUR | 40,000 | 34,117 | ||||||||||||
|
| ||||||||||||||
| Mining - 0.54% | |||||||||||||||
| Corp. Nacional del Cobre de Chile, | |||||||||||||||
4.250%, Due 7/17/2042B | $ | 200,000 | 219,249 | ||||||||||||
4.375%, Due 2/5/2049B | 400,000 | 455,660 | |||||||||||||
|
| ||||||||||||||
| 674,909 | |||||||||||||||
|
| ||||||||||||||
Total Basic Materials | 821,170 | ||||||||||||||
|
| ||||||||||||||
| Communications - 4.56% | |||||||||||||||
| Media - 1.54% | |||||||||||||||
| Cable Onda S.A., 4.500%, Due 1/30/2030B | 400,000 | 406,600 | |||||||||||||
| RCS & RDS S.A., 3.250%, Due 2/5/2028A | EUR | 600,000 | 632,117 | ||||||||||||
| Virgin Media Secured Finance PLC, 5.250%, Due 5/15/2029B | GBP | 675,000 | 873,612 | ||||||||||||
|
| ||||||||||||||
| 1,912,329 | |||||||||||||||
|
| ||||||||||||||
| Telecommunications - 3.02% | |||||||||||||||
| Altice France S.A., 5.500%, Due 1/15/2028A | 200,000 | 202,000 | |||||||||||||
| America Movil S.A.B. de C.V., 6.375%, Due 9/6/2073, Series C, (5-Yr. GBP Swap + 4.100%)B C | GBP | 300,000 | 372,043 | ||||||||||||
| Kenbourne Invest S.A., | |||||||||||||||
6.875%, Due 11/26/2024A | 200,000 | 202,000 | |||||||||||||
6.875%, Due 11/26/2024B | 600,000 | 606,000 | |||||||||||||
| Sable International Finance Ltd., 5.750%, Due 9/7/2027A | 291,000 | 296,203 | |||||||||||||
| TalkTalk Telecom Group PLC, 3.875%, Due 2/20/2025B | GBP | 426,000 | 508,854 | ||||||||||||
| Telefonica Europe B.V., | |||||||||||||||
2.625%, Due 3/7/2023, (5-Yr. Annual EUR Swap + 2.327%)B C | EUR | 200,000 | 218,128 | ||||||||||||
2.875%, Due 6/24/2027, (8-Yr. Annual EUR Swap + 3.071%)B C | EUR | 300,000 | 320,113 | ||||||||||||
| Telesat Canada / Telesat LLC, 6.500%, Due 10/15/2027A | 216,000 | 211,749 | |||||||||||||
| Vodafone Group PLC, 7.000%, Due 4/4/2079, (5-Yr. Semi-Annual USD Swap + 4.873%)C | 510,000 | 597,493 | |||||||||||||
| VTR Comunicaciones SpA, 5.125%, Due 1/15/2028A | 200,000 | 204,100 | |||||||||||||
|
| ||||||||||||||
| 3,738,683 | |||||||||||||||
|
| ||||||||||||||
Total Communications | 5,651,012 | ||||||||||||||
|
| ||||||||||||||
| Consumer, Cyclical - 1.79% | |||||||||||||||
| Auto Manufacturers - 0.51% | |||||||||||||||
| Volkswagen International Finance N.V., | |||||||||||||||
4.625%, Due 3/24/2026, (12-Yr. Annual EUR Swap + 2.967%)B C | EUR | 250,000 | 292,391 | ||||||||||||
3.875%, Due 6/14/2027, (10-Yr. Annual EUR Swap + 3.370%)B C | EUR | 100,000 | 111,796 | ||||||||||||
4.625%, Due 6/27/2028, (10-Yr. Annual EUR Swap + 3.982%)B C | EUR | 200,000 | 233,057 | ||||||||||||
|
| ||||||||||||||
| 637,244 | |||||||||||||||
|
| ||||||||||||||
| Auto Parts & Equipment - 0.10% | |||||||||||||||
| Clarios Global LP / Clarios US Finance Co, 4.375%, Due 5/15/2026A | EUR | 110,000 | 121,789 | ||||||||||||
|
| ||||||||||||||
| Home Builders - 0.22% | |||||||||||||||
| Brookfield Residential Properties, Inc. / Brookfield Residential US Corp., 6.250%, Due 9/15/2027A | 283,000 | 270,636 | |||||||||||||
|
| ||||||||||||||
| Lodging - 0.48% | |||||||||||||||
| Fortune Star BVI Ltd., | |||||||||||||||
5.250%, Due 3/23/2022B | 300,000 | 296,617 | |||||||||||||
5.950%, Due 1/29/2023B | 200,000 | 198,985 | |||||||||||||
4.350%, Due 5/6/2023B | EUR | 100,000 | 106,803 | ||||||||||||
|
| ||||||||||||||
| 602,405 | |||||||||||||||
|
| ||||||||||||||
See accompanying notes
35
American Beacon TwentyFour Strategic Income FundSM
Schedule of Investments
June 30, 2020
| Principal Amount* | Fair Value | ||||||||||||||
| FOREIGN CORPORATE OBLIGATIONS - 56.26% (continued) | |||||||||||||||
| Consumer, Cyclical - 1.79% (continued) | |||||||||||||||
| Retail - 0.48% | |||||||||||||||
| B.C. ULC / New Red Finance, Inc., | |||||||||||||||
5.750%, Due 4/15/2025A | $300,000 | $ | 315,000 | ||||||||||||
4.375%, Due 1/15/2028A | 284,000 | 278,374 | |||||||||||||
|
| ||||||||||||||
| 593,374 | |||||||||||||||
|
| ||||||||||||||
Total Consumer, Cyclical | 2,225,448 | ||||||||||||||
|
| ||||||||||||||
| Consumer, Non-Cyclical - 1.51% | |||||||||||||||
| Agriculture - 0.75% | |||||||||||||||
| Kernel Holding S.A., 8.750%, Due 1/31/2022B | 600,000 | 618,432 | |||||||||||||
| MHP SE, 7.750%, Due 5/10/2024B | 300,000 | 313,560 | |||||||||||||
|
| ||||||||||||||
| 931,992 | |||||||||||||||
|
| ||||||||||||||
| Commercial Services - 0.49% | |||||||||||||||
| Ashtead Capital, Inc., 4.000%, Due 5/1/2028A | 497,000 | 494,515 | |||||||||||||
| Intertrust Group B.V., 3.375%, Due 11/15/2025B | EUR | 100,000 | 111,617 | ||||||||||||
|
| ||||||||||||||
| 606,132 | |||||||||||||||
|
| ||||||||||||||
| Food - 0.27% | |||||||||||||||
| Co-Operative Group Ltd., 5.125%, Due 5/17/2024B | GBP | 100,000 | 131,086 | ||||||||||||
| MARB BondCo PLC, 6.875%, Due 1/19/2025B | 200,000 | 199,252 | |||||||||||||
|
| ||||||||||||||
| 330,338 | |||||||||||||||
|
| ||||||||||||||
Total Consumer, Non-Cyclical | 1,868,462 | ||||||||||||||
|
| ||||||||||||||
| Energy - 2.35% | |||||||||||||||
| Energy - Alternate Sources - 0.47% | |||||||||||||||
| Empresa Electrica Cochrane SpA, | |||||||||||||||
5.500%, Due 5/14/2027A | 383,120 | 393,273 | |||||||||||||
5.500%, Due 5/14/2027B | 191,560 | 196,636 | |||||||||||||
|
| ||||||||||||||
| 589,909 | |||||||||||||||
|
| ||||||||||||||
| Oil & Gas - 1.88% | |||||||||||||||
| BP Capital Markets PLC, | |||||||||||||||
4.375%, Due 6/22/2025, (5-Yr. CMT + 4.036%)C | 145,000 | 147,175 | |||||||||||||
4.875%, Due 3/22/2030, (5-Yr. CMT + 4.398%)C | 470,000 | 485,275 | |||||||||||||
| Petroleos Mexicanos, | |||||||||||||||
5.125%, Due 3/15/2023B | EUR | 200,000 | 219,954 | ||||||||||||
6.840%, Due 1/23/2030B | 460,000 | 404,915 | |||||||||||||
6.625%, Due 6/15/2035 | 222,000 | 180,641 | |||||||||||||
| Saudi Arabian Oil Co., 4.250%, Due 4/16/2039B | 800,000 | 889,953 | |||||||||||||
|
| ||||||||||||||
| 2,327,913 | |||||||||||||||
|
| ||||||||||||||
Total Energy | 2,917,822 | ||||||||||||||
|
| ||||||||||||||
| Financial - 44.24% | |||||||||||||||
| Banks - 22.27% | |||||||||||||||
| ABN AMRO Bank N.V., 5.750%, Due 9/22/2020, (5-Yr. Annual EUR Swap + 5.452%)B C | EUR | 600,000 | 670,988 | ||||||||||||
| Aldermore Group PLC, 8.500%, Due 10/28/2026, (5-Yr. GBP Swap + 7.784%)B C | GBP | 550,000 | 736,775 | ||||||||||||
| Banco Bilbao Vizcaya Argentaria S.A., | |||||||||||||||
8.875%, Due 4/14/2021, (5-Yr. Annual EUR Swap + 9.177%)B C | EUR | 200,000 | 231,722 | ||||||||||||
5.875%, Due 9/24/2023, Series, (5-Yr. Annual EUR Swap + 5.660%)B C | EUR | 400,000 | 435,952 | ||||||||||||
| Banco de Sabadell S.A., | |||||||||||||||
6.500%, Due 5/18/2022, (5-Yr. Annual EUR Swap + 6.414%)B C | EUR | 400,000 | 367,205 | ||||||||||||
6.125%, Due 11/23/2022, (5-Yr. Annual EUR Swap + 6.051%)B C | EUR | 600,000 | 540,965 | ||||||||||||
2.000%, Due 1/17/2030, (5-Yr. Annual EUR Swap + 2.200%)B C | EUR | 400,000 | 375,414 | ||||||||||||
| Banco Santander S.A., 6.750%, Due 4/25/2022, (5-Yr. Annual EUR Swap + 6.803%)B C | EUR | 600,000 | 690,534 | ||||||||||||
See accompanying notes
36
American Beacon TwentyFour Strategic Income FundSM
Schedule of Investments
June 30, 2020
| Principal Amount* | Fair Value | ||||||||||||||
| FOREIGN CORPORATE OBLIGATIONS - 56.26% (continued) | |||||||||||||||
| Financial - 44.24% (continued) | |||||||||||||||
| Banks - 22.27% (continued) | |||||||||||||||
| Bancolombia S.A., 4.625%, Due 12/18/2029, (5-Yr. CMT + 2.944%)C | $ 200,000 | $ | 188,500 | ||||||||||||
| Bank Leumi Le-Israel BM, 3.275%, Due 1/29/2031, (5-Yr. CMT + 1.631%)A B C | 800,000 | 777,142 | |||||||||||||
| Bank of East Asia Ltd., 4.000%, Due 11/3/2026, (5-Yr. CMT + 2.700%)B C | 550,000 | 553,917 | |||||||||||||
| Barclays PLC, 7.875%, Due 9/15/2022, (5-Yr. GBP Swap + 6.099%)B C | GBP | 1,000,000 | 1,239,200 | ||||||||||||
| BBVA Bancomer S.A., 5.875%, Due 9/13/2034, (5-Yr. CMT + 4.308%)B C | 600,000 | 583,500 | |||||||||||||
| BNP Paribas S.A., | |||||||||||||||
6.500%, Due 9/6/2020 | 430,000 | 434,816 | |||||||||||||
6.625%, Due 3/25/2024, (5-Yr. USD ICE Swap + 4.149%)B C | 700,000 | 714,000 | |||||||||||||
| CaixaBank S.A., 6.750%, Due 6/13/2024, (5-Yr. Annual EUR Swap + 6.498%)B C | EUR | 400,000 | 449,400 | ||||||||||||
| Credit Agricole S.A., 7.500%, Due 6/23/2026, Series ., (5-Yr. GBP Swap + 4.535%)B C | GBP | 300,000 | 403,168 | ||||||||||||
| Credit Suisse Group AG, | |||||||||||||||
7.500%, Due 7/17/2023, (5-Yr. Semi-Annual USD Swap + 4.600%)B C | 1,200,000 | 1,246,692 | |||||||||||||
7.500%, Due 12/11/2023, (5-Yr. Semi-Annual USD Swap + 4.598%)B C | 200,000 | 215,000 | |||||||||||||
| Deutsche Pfandbriefbank AG, | |||||||||||||||
5.750%, Due 4/28/2023, (5-Yr. EUR Swap + 5.383%)B C | EUR | 600,000 | 587,006 | ||||||||||||
2.875%, Due 6/28/2027, (5-Yr. Annual EUR Swap + 2.750%)B C | EUR | 600,000 | 643,591 | ||||||||||||
| HBOS Capital Funding LP, 6.850%, Due 9/23/2020B | 600,000 | 606,540 | |||||||||||||
| HSBC Holdings PLC, | |||||||||||||||
6.875%, Due 6/1/2021, (5-Yr. USD ICE Swap + 5.514%)C | 280,000 | 284,099 | |||||||||||||
5.250%, Due 9/16/2022, (5-Yr. Annual EUR Swap + 4.383%)B C | EUR | 500,000 | 557,537 | ||||||||||||
5.875%, Due 9/28/2026, (5-Yr. GBP Swap + 4.276%)C | GBP | 200,000 | 242,275 | ||||||||||||
| Intesa Sanpaolo SpA, | |||||||||||||||
7.000%, Due 1/19/2021, (5-Yr. Annual EUR Swap + 6.884%)B C | EUR | 350,000 | 390,614 | ||||||||||||
6.250%, Due 5/16/2024, (5-Yr. Annual EUR Swap + 5.856%)B C | EUR | 730,000 | 818,967 | ||||||||||||
| Investec PLC, 6.750%, Due 12/5/2024, (5-Yr. GBP Swap + 5.749%)B C | GBP | 200,000 | 203,919 | ||||||||||||
| Lloyds Bank PLC, 13.000%, Due 1/22/2029, (5-Yr. UK Government Bond + 13.400%)C | GBP | 550,000 | 1,164,911 | ||||||||||||
| Macquarie Bank Ltd., 3.624%, Due 6/3/2030A | 600,000 | 629,108 | |||||||||||||
| Nordea Bank Abp, 6.625%, Due 3/26/2026, (5-Yr. CMT + 4.110%)B C | 260,000 | 277,524 | |||||||||||||
| Oaknorth Bank PLC, 7.750%, Due 6/1/2028, (5-Yr. UK Government Bond + 6.851%)B C | GBP | 250,000 | 278,798 | ||||||||||||
| Paragon Banking Group PLC, 7.250%, Due 9/9/2026, (5-Yr. GBP Swap + 6.731%)B C | GBP | 490,000 | 613,534 | ||||||||||||
| Royal Bank of Scotland Group PLC, | |||||||||||||||
7.648%, Due 9/30/2031, (3-mo. USD LIBOR + 2.500%)C | 100,000 | 144,650 | |||||||||||||
2.628%, Due 9/30/2027, Series U, (3-mo. USD LIBOR + 2.320%)C | 400,000 | 364,708 | |||||||||||||
| Shawbrook Group PLC, | |||||||||||||||
7.875%, Due 12/8/2022, (5-Yr. GBP Swap + 6.752%)B C | GBP | 200,000 | 174,625 | ||||||||||||
8.500%, Due 10/28/2025, (6-mo. GBP LIBOR + 7.079%)B C | GBP | 200,000 | 250,884 | ||||||||||||
| Skandinaviska Enskilda Banken AB, 5.625%, Due 5/13/2022, Series ., (5-Yr. Semi-Annual USD Swap + 3.493%)B C | 800,000 | 796,000 | |||||||||||||
| Societe Generale S.A., | |||||||||||||||
6.750%, Due 4/7/2021, (5-Yr. Annual EUR Swap + 5.538%)B C | EUR | 150,000 | 166,907 | ||||||||||||
7.375%, Due 9/13/2021, (5-Yr. Semi-Annual USD Swap + 6.238%)B C | 710,000 | 716,177 | |||||||||||||
| Standard Chartered PLC, | |||||||||||||||
7.750%, Due 4/2/2023, (5-Yr. Semi-Annual USD Swap + 5.723%)B C | 476,000 | 496,825 | |||||||||||||
4.000%, Due 10/21/2025, (5-Yr. Annual EUR Swap + 2.300%)B C | EUR | 1,000,000 | 1,129,059 | ||||||||||||
| Svenska Handelsbanken AB, 5.250%, Due 3/1/2021, (5-Yr. Semi-Annual USD Swap + 3.335%)B C | 1,100,000 | 1,094,500 | |||||||||||||
| UBS Group AG, | |||||||||||||||
6.875%, Due 3/22/2021, (5-Yr. USD ICE Swap + 5.497%)B C | 200,000 | 202,250 | |||||||||||||
7.000%, Due 1/31/2024, (5-Yr. Semi-Annual USD Swap + 4.344%)A C | 700,000 | 727,125 | |||||||||||||
7.000%, Due 1/31/2024, (5-Yr. Semi-Annual USD Swap + 4.344%)B C | 400,000 | 415,500 | |||||||||||||
| UniCredit SpA, 8.000%, Due 6/3/2024, (5-Yr. Semi-Annual USD Swap + 5.180%)B C | 600,000 | 600,000 | |||||||||||||
| Virgin Money UK PLC, | |||||||||||||||
8.750%, Due 11/10/2021, (5-Yr. GBP Swap + 7.930%)B C | GBP | 700,000 | 848,356 | ||||||||||||
9.250%, Due 6/8/2024, (5-Yr. UK Government Bond + 8.307%)B C | GBP | 200,000 | 239,023 | ||||||||||||
5.000%, Due 2/9/2026, (5-Yr. GBP Swap + 3.516%)B C | GBP | 300,000 | 360,180 | ||||||||||||
| Volksbank Wien AG, 2.750%, Due 10/6/2027, (5-Yr. Annual EUR Swap + 2.550%)B C | EUR | 700,000 | 747,127 | ||||||||||||
|
| ||||||||||||||
| 27,627,209 | |||||||||||||||
|
| ||||||||||||||
| Diversified Financial Services - 4.40% | |||||||||||||||
| Aareal Bank AG, | |||||||||||||||
6.849%, Due 4/30/2021, (1-Yr. Annual EUR Swap + 7.180%)B C | EUR | 800,000 | 838,131 | ||||||||||||
4.250%, Due 3/18/2026, (5-Yr. Annual EUR Swap + 2.900%)C | EUR | 600,000 | 628,227 | ||||||||||||
| Arrow Global Finance PLC, 5.125%, Due 9/15/2024B | GBP | 350,000 | 397,622 | ||||||||||||
| Bracken MidCo1 PLC, 8.875%, Due 10/15/2023, Cash (8.875%) or PIK (in-kind rate 9.648%)A | GBP | 610,088 | 631,227 | ||||||||||||
| Burford Capital PLC, 6.125%, Due 10/26/2024B | GBP | 310,000 | 326,503 | ||||||||||||
| Cabot Financial Luxembourg S.A., 7.500%, Due 10/1/2023B | GBP | 251,000 | 310,997 | ||||||||||||
| Garfunkelux Holdco S.A., 8.500%, Due 11/1/2022B | GBP | 200,000 | 232,951 | ||||||||||||
See accompanying notes
37
American Beacon TwentyFour Strategic Income FundSM
Schedule of Investments
June 30, 2020
| Principal Amount* | Fair Value | ||||||||||||||
| FOREIGN CORPORATE OBLIGATIONS - 56.26% (continued) | |||||||||||||||
| Financial - 44.24% (continued) | |||||||||||||||
| Diversified Financial Services - 4.40% (continued) | |||||||||||||||
| Intrum AB, 3.125%, Due 7/15/2024B | EUR | 200,000 | $ | 202,234 | |||||||||||
| Jerrold Finco PLC, | |||||||||||||||
6.125%, Due 1/15/2024B | GBP | 300,000 | 355,825 | ||||||||||||
4.875%, Due 1/15/2026A | GBP | 250,000 | 281,988 | ||||||||||||
| OneSavings Bank PLC, 9.125%, Due 5/25/2022, (5-Yr. GBP ICE Swap + 8.359%)B C | GBP | 400,000 | 458,467 | ||||||||||||
| Unifin Financiera S.A.B. de C.V., | |||||||||||||||
7.250%, Due 9/27/2023B | $ | 800,000 | 644,800 | ||||||||||||
8.375%, Due 1/27/2028A | 200,000 | 147,000 | |||||||||||||
|
| ||||||||||||||
| 5,455,972 | |||||||||||||||
|
| ||||||||||||||
| Insurance - 10.56% | |||||||||||||||
| Achmea B.V., | |||||||||||||||
4.625%, Due 3/24/2029, (5-Yr. EUR Swap + 4.780%)B C | EUR | 300,000 | 325,961 | ||||||||||||
6.000%, Due 4/4/2043, (3-mo. EUR EURIBOR + 5.330%)B C | EUR | 430,000 | 527,918 | ||||||||||||
| Aegon N.V., | |||||||||||||||
5.625%, Due 4/15/2029, (5-Yr. Annual EUR Swap + 5.207%)B C | EUR | 400,000 | 484,116 | ||||||||||||
4.000%, Due 4/25/2044, (3-mo. EUR EURIBOR + 3.350%)B C | EUR | 200,000 | 235,663 | ||||||||||||
| Assicurazioni Generali SpA, | |||||||||||||||
6.416%, Due 2/8/2022, (3-mo. GBP LIBOR + 2.200%)B C | GBP | 350,000 | 456,497 | ||||||||||||
4.596%, Due 11/21/2025, (3-mo. EUR EURIBOR + 4.500%)B C | EUR | 200,000 | 233,457 | ||||||||||||
| CNP Assurances, 4.750%, Due 6/27/2028, Series ., (5-Yr. Annual EUR Swap + 3.914%)B C | EUR | 500,000 | 583,152 | ||||||||||||
| Direct Line Insurance Group PLC, 4.750%, Due 12/7/2027, (5-Yr. GBP Swap + 3.394%)B C | GBP | 200,000 | 225,526 | ||||||||||||
| Intesa Sanpaolo Vita SpA, 4.750%, Due 12/17/2024, (6-mo. EUR EURIBOR + 4.817%)B C | EUR | 200,000 | 228,093 | ||||||||||||
| La Mondiale SAM, 4.375%, Due 4/24/2029, (5-Yr. Annual EUR Swap + 4.411%)B C | EUR | 1,100,000 | 1,204,953 | ||||||||||||
| Liverpool Victoria Friendly Society Ltd., 6.500%, Due 5/22/2043, (5-Yr. UK Government Bond + 5.630%)B C | GBP | 200,000 | 267,558 | ||||||||||||
| NN Group N.V., 4.375%, Due 6/13/2024, (3-mo. EUR EURIBOR + 3.900%)B C | EUR | 500,000 | 600,849 | ||||||||||||
| Pension Insurance Corp. PLC, | |||||||||||||||
6.500%, Due 7/3/2024B | GBP | 400,000 | 566,319 | ||||||||||||
7.375%, Due 7/25/2029, (5-Yr. UK Government Bond + 6.658%)C | GBP | 1,000,000 | 1,276,569 | ||||||||||||
| Phoenix Group Holdings PLC, | |||||||||||||||
6.625%, Due 12/18/2025 | GBP | 250,000 | 356,031 | ||||||||||||
5.375%, Due 7/6/2027 | 200,000 | 210,508 | |||||||||||||
5.750%, Due 12/31/2049 | GBP | 700,000 | 795,812 | ||||||||||||
| QBE Insurance Group Ltd., 6.115%, Due 5/24/2042, (5-Yr. GBP Swap + 5.000%)B C | GBP | 200,000 | 262,237 | ||||||||||||
| Rl Finance Bonds PLC, 6.125%, Due 11/13/2028B | GBP | 270,000 | 393,623 | ||||||||||||
| Rothesay Life PLC, | |||||||||||||||
8.000%, Due 10/30/2025B | GBP | 400,000 | 582,935 | ||||||||||||
6.875%, Due 9/12/2028, (5-Yr. UK Government Bond + 5.419%)B C | GBP | 1,000,000 | 1,209,969 | ||||||||||||
| RSA Insurance Group PLC, 5.125%, Due 10/10/2045, (5-Yr. UK Government Bond + 3.852%)B C | GBP | 280,000 | 381,714 | ||||||||||||
| UnipolSai Assicurazioni SpA, 5.750%, Due 6/18/2024, (3-mo. EUR EURIBOR + 5.180%)B C | EUR | 550,000 | 624,778 | ||||||||||||
| UNIQA Insurance Group AG, 6.875%, Due 7/31/2043, (3-mo. EUR EURIBOR + 5.986%)B C | EUR | 300,000 | 375,396 | ||||||||||||
| VIVAT N.V., 7.000%, Due 6/19/2025, (5-Yr. Annual EUR Swap + 6.463%)B C | EUR | 600,000 | 684,211 | ||||||||||||
|
| ||||||||||||||
| 13,093,845 | |||||||||||||||
|
| ||||||||||||||
| Real Estate - 3.02% | |||||||||||||||
| ATF Netherlands B.V., 3.750%, Due 1/20/2023, (5-Yr. Annual EUR Swap + 4.375%)B C | EUR | 300,000 | 333,342 | ||||||||||||
| Country Garden Holdings Co., Ltd., | |||||||||||||||
4.750%, Due 1/17/2023B | 200,000 | 203,000 | |||||||||||||
4.750%, Due 9/28/2023B | 400,000 | 404,482 | |||||||||||||
7.250%, Due 4/8/2026B | 200,000 | 217,452 | |||||||||||||
5.625%, Due 1/14/2030B | 400,000 | 410,867 | |||||||||||||
| CPI Property Group S.A., | |||||||||||||||
4.375%, Due 8/9/2023, (5-Yr. Annual EUR Swap + 4.148%)B C | EUR | 100,000 | 109,283 | ||||||||||||
4.875%, Due 7/16/2025, (5-Yr. Annual EUR Swap + 4.944%)B C | EUR | 100,000 | 109,538 | ||||||||||||
| Dar Al-Arkan Sukuk Co., Ltd., | |||||||||||||||
6.875%, Due 3/21/2023B | 400,000 | 376,600 | |||||||||||||
6.750%, Due 2/15/2025B | 200,000 | 177,964 | |||||||||||||
| MAF Global Securities Ltd., | |||||||||||||||
5.500%, Due 9/7/2022, (5-Yr. Semi-Annual USD Swap + 3.476%)B C | 400,000 | 380,032 | |||||||||||||
6.375%, Due 3/20/2026, (5-Yr. CMT + 3.539%)B C | 200,000 | 192,154 | |||||||||||||
| Samhallsbyggnadsbolaget i Norden AB, 2.624%, Due 1/30/2025, (5-Yr. Annual EUR Swap + 2.814%)B C | EUR | 300,000 | 307,052 | ||||||||||||
| TLG Finance SARL, 3.375%, Due 9/23/2024, (5-Yr. Annual EUR Swap + 3.980%)B C | EUR | 500,000 | 530,854 | ||||||||||||
|
| ||||||||||||||
| 3,752,620 | |||||||||||||||
|
| ||||||||||||||
See accompanying notes
38
American Beacon TwentyFour Strategic Income FundSM
Schedule of Investments
June 30, 2020
| Principal Amount* | Fair Value | ||||||||||||||
| FOREIGN CORPORATE OBLIGATIONS - 56.26% (continued) | |||||||||||||||
| Financial - 44.24% (continued) | |||||||||||||||
| Savings & Loans - 3.99% | |||||||||||||||
| Coventry Building Society, 6.875%, Due 9/18/2024, (5-Yr. UK Government Bond + 6.111%)B C | GBP | 1,925,000 | $ | 2,396,832 | |||||||||||
| Nationwide Building Society, | |||||||||||||||
5.875%, Due 12/20/2024, (5-Yr. UK Government Bond + 5.390%)B C | GBP | 800,000 | 990,041 | ||||||||||||
10.250%, Due 12/31/2049, Series CCDSB D | GBP | 806,700 | 1,564,347 | ||||||||||||
|
| ||||||||||||||
| 4,951,220 | |||||||||||||||
|
| ||||||||||||||
Total Financial | 54,880,866 | ||||||||||||||
|
| ||||||||||||||
| Industrial - 0.27% | |||||||||||||||
| Building Materials - 0.17% | |||||||||||||||
| Victoria PLC, 5.250%, Due 7/15/2024A | EUR | 200,000 | 208,701 | ||||||||||||
|
| ||||||||||||||
| Engineering & Construction - 0.10% | |||||||||||||||
| Rutas 2 and 7 Finance Ltd., Due 9/30/2036A E | $ | 200,000 | 129,000 | ||||||||||||
|
| ||||||||||||||
Total Industrial | 337,701 | ||||||||||||||
|
| ||||||||||||||
| Utilities - 0.88% | |||||||||||||||
| Electric - 0.88% | |||||||||||||||
| Enel SpA, 3.500%, Due 5/24/2080, (5-Yr. Annual EUR Swap + 3.564%)B C | EUR | 600,000 | 696,857 | ||||||||||||
| SSE PLC, | |||||||||||||||
2.375%, Due 4/1/2021, (5-Yr. Annual EUR Swap + 1.989%)B C | EUR | 165,000 | 184,284 | ||||||||||||
4.750%, Due 9/16/2077, (5-Yr. Semi-Annual USD Swap + 2.574%)B C | 205,000 | 206,999 | |||||||||||||
|
| ||||||||||||||
| 1,088,140 | |||||||||||||||
|
| ||||||||||||||
Total Utilities | 1,088,140 | ||||||||||||||
|
| ||||||||||||||
Total Foreign Corporate Obligations (Cost $71,792,760) | 69,790,621 | ||||||||||||||
|
| ||||||||||||||
| FOREIGN SOVEREIGN OBLIGATIONS - 0.93% | |||||||||||||||
| Paraguay Government International Bond, 5.400%, Due 3/30/2050B | 600,000 | 694,500 | |||||||||||||
| Qatar Government International Bond, 3.750%, Due 4/16/2030, Series 144AA | 400,000 | 455,477 | |||||||||||||
|
| ||||||||||||||
Total Foreign Sovereign Obligations (Cost $1,087,783) | 1,149,977 | ||||||||||||||
|
| ||||||||||||||
| ASSET-BACKED OBLIGATIONS - 8.02% | |||||||||||||||
| Ares European CLO B.V., 5.260%, Due 10/15/2030, (3-mo. EUR EURIBOR + 5.260%)B C | EUR | 1,250,000 | 1,259,123 | ||||||||||||
| BNPP AM Euro CLO B.V., 4.700%, Due 10/15/2031, 2017-1X E, (3-mo. EUR EURIBOR + 4.700%)B C | EUR | 500,000 | 514,155 | ||||||||||||
| Carlyle Euro CLO DAC, 5.230%, Due 8/28/2031, 2018-2A D, (3-mo. EUR EURIBOR + 5.230%)A C | EUR | 500,000 | 497,056 | ||||||||||||
| Carlyle Global Market Strategies Euro CLO DAC, 4.770%, Due 5/17/2031, 2016-1A DR, (3-mo. EUR EURIBOR + 4.770%)A C | EUR | 500,000 | 468,500 | ||||||||||||
| Contego CLO DAC, 5.280%, Due 1/15/2032, 6X E, (3-mo. EUR EURIBOR + 5.280%)B C | EUR | 300,000 | 312,350 | ||||||||||||
| Dryden 39 Euro CLO B.V., 4.970%, Due 10/15/2031, 2015-39X ER, (3-mo. EUR EURIBOR + 4.970%)B C | EUR | 1,000,000 | 1,001,940 | ||||||||||||
| Halcyon Loan Advisors European Funding, 5.130%, Due 10/18/2031, (3-mo. EUR EURIBOR + 5.130%)A C | EUR | 1,190,000 | 1,191,051 | ||||||||||||
| Hayfin Emerald CLO DAC, 5.470%, Due 9/6/2031, 1X E, (3-mo. EUR EURIBOR + 5.470%)B C | EUR | 300,000 | 304,185 | ||||||||||||
| Jubilee CLO B.V., 6.000%, Due 4/15/2031, 2013-X ER, (3-mo. EUR EURIBOR + 6.000%)B C | EUR | 500,000 | 522,766 | ||||||||||||
| Madison Park Euro Funding DAC, 3.100%, Due 7/15/2030, (3-mo. EUR EURIBOR + 3.100%)B C | EUR | 2,120,000 | 2,171,507 | ||||||||||||
| Man GLG Euro CLO DAC, 8.750%, Due 1/15/2030, 2X F, (3-mo. EUR EURIBOR + 8.750%)B C | EUR | 200,000 | 184,804 | ||||||||||||
| Milltown Park CLO DAC, 4.820%, Due 1/15/2031, 1X D, (3-mo. EUR EURIBOR + 4.820%)B C | EUR | 1,000,000 | 995,817 | ||||||||||||
| Tikehau CLO B.V., 6.250%, Due 12/7/2029, 2X E, (3-mo. EUR EURIBOR + 6.250%)B C | EUR | 500,000 | 519,779 | ||||||||||||
|
| ||||||||||||||
Total Asset-Backed Obligations (Cost $10,346,169) | 9,943,033 | ||||||||||||||
|
| ||||||||||||||
| COLLATERALIZED MORTGAGE OBLIGATIONS - 5.84% | |||||||||||||||
| Durham Mortgages B PLC, 1.456%, Due 3/31/2054, 2018-BX C, (3-mo. GBP LIBOR + 1.200%)B C | GBP | 1,631,000 | 1,973,009 | ||||||||||||
| Hawksmoor Mortgage Funding PLC, | |||||||||||||||
1.987%, Due 5/25/2053, 2019-1X B, (3-mo. SONIA + 1.750%)B C | GBP | 1,000,000 | 1,227,031 | ||||||||||||
2.337%, Due 5/25/2053, 2019-1X C, (3-mo. SONIA + 2.100%)B C | GBP | 500,000 | 613,539 | ||||||||||||
| Residential Mortgage Securities PLC, 2.673%, Due 6/15/2046, 28 B, (3-mo. GBP LIBOR + 1.650%)B C | GBP | 500,000 | 619,239 | ||||||||||||
See accompanying notes
39
American Beacon TwentyFour Strategic Income FundSM
Schedule of Investments
June 30, 2020
| Principal Amount* | Fair Value | ||||||||||||||
| COLLATERALIZED MORTGAGE OBLIGATIONS - 5.84% (continued) | |||||||||||||||
| Ripon Mortgages PLC, | |||||||||||||||
1.756%, Due 8/20/2056, 1X C2, (3-mo. GBP LIBOR + 1.500%)B C | GBP | 500,000 | $ | 612,093 | |||||||||||
2.056%, Due 8/20/2056, 1X D1, (3-mo. GBP LIBOR + 1.800%)B C | GBP | 290,000 | 353,412 | ||||||||||||
| Towd Point Mortgage Funding-Granite4 PLC, 2.402%, Due 10/20/2051, 2019-GR4X C, (3-mo. GBP LIBOR + 1.750%)B C | GBP | 500,000 | 610,230 | ||||||||||||
| Warwick Finance Residential Mortgages No. One PLC, 4.732%, Due 9/21/2049, 1 F, (3-mo. GBP LIBOR + 4.550%)B C | GBP | 1,000,000 | 1,239,080 | ||||||||||||
|
| ||||||||||||||
Total Collateralized Mortgage Obligations (Cost $7,437,627) | 7,247,633 | ||||||||||||||
|
| ||||||||||||||
| U.S. TREASURY OBLIGATIONS - 14.92% | |||||||||||||||
| U.S. Treasury Notes/Bonds, | |||||||||||||||
0.375%, Due 3/31/2022 | $ | 9,920,000 | 9,955,263 | ||||||||||||
0.125%, Due 4/30/2022 | 8,555,000 | 8,548,316 | |||||||||||||
|
| ||||||||||||||
Total U.S. Treasury Obligations (Cost $18,499,685) | 18,503,579 | ||||||||||||||
|
| ||||||||||||||
| Shares | |||||||||||||||
| SHORT-TERM INVESTMENTS - 3.04% (Cost $3,772,150) | |||||||||||||||
| Investment Companies - 3.04% | |||||||||||||||
| American Beacon U.S. Government Money Market Select Fund, Select Class, 0.07%F G | 3,772,150 | 3,772,150 | |||||||||||||
|
| ||||||||||||||
TOTAL INVESTMENTS - 97.72% (Cost $123,920,449) | 121,215,169 | ||||||||||||||
OTHER ASSETS, NET OF LIABILITIES - 2.28% | 2,830,038 | ||||||||||||||
|
| ||||||||||||||
TOTAL NET ASSETS - 100.00% | $ | 124,045,207 | |||||||||||||
|
| ||||||||||||||
Percentages are stated as a percent of net assets. *In U.S. Dollars unless otherwise noted. | |||||||||||||||
A Security exempt from registration under the Securities Act of 1933. These securities may be resold to qualified institutional buyers pursuant to Rule 144A. At the period end, the value of these securities amounted to $18,526,417 or 14.94% of net assets. The Fund has no right to demand registration of these securities.
B Reg S - Security purchased under the Securities Act of 1933, which exempts from registration securities offered and sold outside of the United States. Such a security cannot be sold in the United States without either an effective registration statement filed pursuant to the Securities Act of 1933, or pursuant to an exemption from registration.
C Variable, floating, or adjustable rate securities with an interest rate that changes periodically. Rates are periodically reset with rates that are based on a predetermined benchmark such as a widely followed interest rate such as T-bills, LIBOR or PRIME plus a fixed spread. The interest rate disclosed reflects the rate in effect on June 30, 2020.
D Coupon rate may change based on changes of the underlying collateral or prepayments of principal. The coupon rate shown represents the rate at period end.
E Zero coupon bond.
F The Fund is affiliated by having the same investment advisor.
G 7-day yield.
CLO - Collateralized Loan Obligation.
CMT - Constant Maturity Treasury.
DAC - Designated Activity Company.
EURIBOR - Euro Interbank Offered Rate.
ICE - Intercontinental Exchange.
LIBOR - London Interbank Offered Rate.
LLC - Limited Liability Company.
LP - Limited Partnership.
PIK - Payment in Kind.
PLC - Public Limited Company.
PRIME - A rate, charged by banks, based on the U.S. Federal Funds rate.
REIT - Real Estate Investment Trust.
SONIA - Sterling Overnight Index Average.
ULC - Unlimited Liability Company.
See accompanying notes
40
American Beacon TwentyFour Strategic Income FundSM
Schedule of Investments
June 30, 2020
| Forward Foreign Currency Contracts Open on June 30, 2020: |
| |||||||||||||||||||||||||||||
| Currency Purchased* | Currency Sold* | Settlement Date | Counterparty | Unrealized Appreciation | Unrealized (Depreciation) | Net Unrealized Appreciation (Depreciation) | ||||||||||||||||||||||||
| EUR | 230,017 | USD | 231,860 | 7/9/2020 | SSB | $ | - | $ | (1,843 | ) | $ | (1,843 | ) | |||||||||||||||||
| GBP | 252,389 | USD | 256,851 | 7/9/2020 | SSB | - | (4,462 | ) | (4,462 | ) | ||||||||||||||||||||
| EUR | 551,446 | USD | 558,710 | 7/9/2020 | SSB | - | (7,264 | ) | (7,264 | ) | ||||||||||||||||||||
| EUR | 713,182 | USD | 717,810 | 7/9/2020 | SSB | - | (4,628 | ) | (4,628 | ) | ||||||||||||||||||||
| GBP | 734,747 | USD | 749,291 | 7/9/2020 | SSB | - | (14,544 | ) | (14,544 | ) | ||||||||||||||||||||
| GBP | 1,122,868 | USD | 1,130,109 | 7/9/2020 | SSB | - | (7,241 | ) | (7,241 | ) | ||||||||||||||||||||
| USD | 34,590,311 | EUR | 34,456,313 | 7/9/2020 | SSB | 133,998 | - | 133,998 | ||||||||||||||||||||||
| USD | 32,568,822 | GBP | 31,895,617 | 7/9/2020 | SSB | 673,205 | - | 673,205 | ||||||||||||||||||||||
| USD | 1,251,460 | GBP | 1,249,106 | 7/9/2020 | SSB | 2,354 | - | 2,354 | ||||||||||||||||||||||
| USD | 508,087 | GBP | 502,162 | 7/9/2020 | SSB | 5,925 | - | 5,925 | ||||||||||||||||||||||
| USD | 75,142 | GBP | 74,309 | 7/9/2020 | SSB | 833 | - | 833 | ||||||||||||||||||||||
|
|
|
|
|
| |||||||||||||||||||||||||
| $ | 816,315 | $ | (39,982 | ) | $ | 776,333 | ||||||||||||||||||||||||
|
|
|
|
|
| |||||||||||||||||||||||||
| * | All values denominated in USD. |
| Glossary: | ||
| Counterparty Abbreviations: | ||
| SSB | State Street Bank & Trust Co. | |
| Currency Abbreviations: | ||
| EUR | Euro. | |
| GBP | Pound Sterling. | |
| USD | United States Dollar. | |
The Fund’s investments are summarized by level based on the inputs used to determine their values. As of June 30, 2020, the investments were classified as described below:
TwentyFour Strategic Income Fund | Level 1 | Level 2 | Level 3 | Total | ||||||||||||||||||||||||
Assets | ||||||||||||||||||||||||||||
Corporate Obligations | $ | - | $ | 10,604,559 | $ | - | $ | 10,604,559 | ||||||||||||||||||||
Foreign Convertible Obligations | - | 203,617 | - | 203,617 | ||||||||||||||||||||||||
Foreign Corporate Obligations | - | 69,790,621 | - | 69,790,621 | ||||||||||||||||||||||||
Foreign Sovereign Obligations | - | 1,149,977 | - | 1,149,977 | ||||||||||||||||||||||||
Asset-Backed Obligations | - | 9,943,033 | - | 9,943,033 | ||||||||||||||||||||||||
Collateralized Mortgage Obligations | - | 7,247,633 | - | 7,247,633 | ||||||||||||||||||||||||
U.S. Treasury Obligations | - | 18,503,579 | - | 18,503,579 | ||||||||||||||||||||||||
Short-Term Investments | 3,772,150 | — | - | 3,772,150 | ||||||||||||||||||||||||
|
|
|
|
|
|
|
| |||||||||||||||||||||
Total Investments in Securities - Assets | $ | 3,772,150 | $ | 117,443,019 | $ | - | $ | 121,215,169 | ||||||||||||||||||||
|
|
|
|
|
|
|
| |||||||||||||||||||||
Financial Derivative Instruments - Assets |
| |||||||||||||||||||||||||||
Forward Foreign Currency Contracts | $ | - | $ | 816,315 | $ | - | $ | 816,315 | ||||||||||||||||||||
|
|
|
|
|
|
|
| |||||||||||||||||||||
Total Financial Derivative Instruments - Assets | $ | - | $ | 816,315 | $ | - | $ | 816,315 | ||||||||||||||||||||
|
|
|
|
|
|
|
| |||||||||||||||||||||
Financial Derivative Instruments - Liabilities |
| |||||||||||||||||||||||||||
Forward Foreign Currency Contracts | $ | - | $ | (39,982 | ) | $ | - | $ | (39,982 | ) | ||||||||||||||||||
|
|
|
|
|
|
|
| |||||||||||||||||||||
Total Financial Derivative Instruments - Liabilities | $ | - | $ | (39,982 | ) | $ | - | $ | (39,982 | ) | ||||||||||||||||||
|
|
|
|
|
|
|
| |||||||||||||||||||||
U.S. GAAP requires transfers between all levels to/from level 3 be disclosed. During the year ended June 30, 2020, there were no transfers into or out of Level 3.
See accompanying notes
41
Statements of Assets and Liabilities
June 30, 2020
| SSI Alternative Income Fund | TwentyFour Short Term Bond Fund | TwentyFour Strategic Income Fund | ||||||||||||||||||
Assets: |
| |||||||||||||||||||
Investments in unaffiliated securities, at fair value† | $ | 127,871,110 | $ | 9,381,424 | $ | 117,443,019 | ||||||||||||||
Investments in affiliated securities, at fair value‡ | 12,005,454 | – | 3,772,150 | |||||||||||||||||
Foreign currency, at fair value^ | – | 221,738 | 408,594 | |||||||||||||||||
Cash | 685,006 | 147,598 | – | |||||||||||||||||
Cash with brokers | 41,053,163 | – | – | |||||||||||||||||
Dividends and interest receivable | 873,661 | 188,881 | 1,334,059 | |||||||||||||||||
Receivable for investments sold | 3,855,745 | 138,779 | 907,139 | |||||||||||||||||
Receivable for fund shares sold | 22,690 | – | 199,757 | |||||||||||||||||
Receivable for tax reclaims | – | 50 | 769 | |||||||||||||||||
Receivable for expense reimbursement (Note 2) | 13,982 | 38,215 | 10,742 | |||||||||||||||||
Unrealized appreciation from forward foreign currency contracts | – | 194,261 | 816,315 | |||||||||||||||||
Deferred offering costs | – | 80,758 | – | |||||||||||||||||
Other assets | 5,066 | – | – | |||||||||||||||||
Prepaid expenses | 87,424 | 49,862 | 48,287 | |||||||||||||||||
|
|
|
|
|
| |||||||||||||||
Total assets | 186,473,301 | 10,441,566 | 124,940,831 | |||||||||||||||||
|
|
|
|
|
| |||||||||||||||
Liabilities: |
| |||||||||||||||||||
Payable for investments purchased | 2,291,726 | 63,754 | 411,897 | |||||||||||||||||
Payable for fund shares redeemed | 2,019,789 | – | 76,343 | |||||||||||||||||
Securities sold short, at fair value± | 40,847,067 | – | – | |||||||||||||||||
Written options and swaptions contracts, at fair value (premiums received $319,574) | 407,839 | – | – | |||||||||||||||||
Dividends and interest expense payable | 16,766 | – | – | |||||||||||||||||
Management and sub-advisory fees payable (Note 2) | 154,542 | 2,917 | 66,597 | |||||||||||||||||
Service fees payable (Note 2) | – | 386 | 9,612 | |||||||||||||||||
Transfer agent fees payable (Note 2) | 45,516 | 3,152 | 6,939 | |||||||||||||||||
Custody and fund accounting fees payable | 8,880 | 3,146 | 32,258 | |||||||||||||||||
Professional fees payable | 91,637 | 88,115 | 239,129 | |||||||||||||||||
Trustee fees payable (Note 2) | 17 | – | 9 | |||||||||||||||||
Payable for prospectus and shareholder reports | 18,138 | 29,184 | 9,614 | |||||||||||||||||
Unrealized depreciation from forward foreign currency contracts | – | 2,251 | 39,982 | |||||||||||||||||
Other liabilities | 290 | 441 | 3,244 | |||||||||||||||||
|
|
|
|
|
| |||||||||||||||
Total liabilities | 45,902,207 | 193,346 | 895,624 | |||||||||||||||||
|
|
|
|
|
| |||||||||||||||
Net assets | $ | 140,571,094 | $ | 10,248,220 | $ | 124,045,207 | ||||||||||||||
|
|
|
|
|
| |||||||||||||||
Analysis of net assets: |
| |||||||||||||||||||
Paid-in-capital | $ | 143,745,254 | $ | 10,323,896 | $ | 141,035,963 | ||||||||||||||
Total distributable earnings (deficits)A | (3,174,160 | ) | (75,676 | ) | (16,990,756 | ) | ||||||||||||||
|
|
|
|
|
| |||||||||||||||
Net assets | $ | 140,571,094 | $ | 10,248,220 | $ | 124,045,207 | ||||||||||||||
|
|
|
|
|
| |||||||||||||||
See accompanying notes
42
American Beacon FundsSM
Statements of Assets and Liabilities
June 30, 2020
| SSI Alternative Income Fund | TwentyFour Short Term Bond Fund | TwentyFour Strategic Income Fund | ||||||||||||||||||
Shares outstanding at no par value (unlimited shares authorized): |
| |||||||||||||||||||
R5 ClassC | 9,833 | N/A | 956,501 | |||||||||||||||||
|
|
|
|
|
| |||||||||||||||
Y Class | 13,764,372 | 15,071 | 8,731,460 | |||||||||||||||||
|
|
|
|
|
| |||||||||||||||
Investor Class | 85,073 | N/A | 1,448,545 | |||||||||||||||||
|
|
|
|
|
| |||||||||||||||
A Class | N/A | 20,820 | 513,441 | |||||||||||||||||
|
|
|
|
|
| |||||||||||||||
C Class | N/A | 25,772 | 467,377 | |||||||||||||||||
|
|
|
|
|
| |||||||||||||||
Ultra Class | N/A | N/A | 9,600 | |||||||||||||||||
|
|
|
|
|
| |||||||||||||||
R6 Class | N/A | 971,501 | N/A | |||||||||||||||||
|
|
|
|
|
| |||||||||||||||
Net assets: |
| |||||||||||||||||||
R5 ClassC | $ | 99,760 | N/A | $ | 9,824,323 | |||||||||||||||
|
|
|
|
|
| |||||||||||||||
Y Class | $ | 139,609,314 | $ | 149,445 | $ | 89,459,856 | ||||||||||||||
|
|
|
|
|
| |||||||||||||||
Investor Class | $ | 862,020 | N/A | $ | 14,710,345 | |||||||||||||||
|
|
|
|
|
| |||||||||||||||
A Class | N/A | $ | 206,227 | $ | 5,216,325 | |||||||||||||||
|
|
|
|
|
| |||||||||||||||
C Class | N/A | $ | 254,319 | $ | 4,735,447 | |||||||||||||||
|
|
|
|
|
| |||||||||||||||
Ultra Class | N/A | N/A | $ | 98,911 | ||||||||||||||||
|
|
|
|
|
| |||||||||||||||
R6 Class | N/A | $ | 9,638,229 | N/A | ||||||||||||||||
|
|
|
|
|
| |||||||||||||||
Net asset value, offering and redemption price per share: |
| |||||||||||||||||||
R5 ClassC | $ | 10.15 | N/A | $ | 10.27 | |||||||||||||||
|
|
|
|
|
| |||||||||||||||
Y Class | $ | 10.14 | $ | 9.92 | $ | 10.25 | ||||||||||||||
|
|
|
|
|
| |||||||||||||||
Investor Class | $ | 10.13 | N/A | $ | 10.16 | |||||||||||||||
|
|
|
|
|
| |||||||||||||||
A Class | N/A | $ | 9.91 | $ | 10.16 | |||||||||||||||
|
|
|
|
|
| |||||||||||||||
A Class (offering price) | N/A | $ | 10.16 | $ | 10.56 | |||||||||||||||
|
|
|
|
|
| |||||||||||||||
C Class | N/A | $ | 9.87 | $ | 10.13 | |||||||||||||||
|
|
|
|
|
| |||||||||||||||
Ultra Class | N/A | N/A | $ | 10.30 | ||||||||||||||||
|
|
|
|
|
| |||||||||||||||
R6 Class | N/A | $ | 9.92 | N/A | ||||||||||||||||
|
|
|
|
|
| |||||||||||||||
† Cost of investments in unaffiliated securities | $ | 124,625,268 | $ | 9,696,103 | $ | 120,148,299 | ||||||||||||||
‡ Cost of investments in affiliated securities | $ | 12,005,454 | $ | – | $ | 3,772,150 | ||||||||||||||
^ Cost of foreign currency | $ | – | $ | 224,651 | $ | 409,849 | ||||||||||||||
± Proceeds of securities sold short | $ | 36,785,277 | $ | – | $ | – | ||||||||||||||
| A The Fund’s investments in affiliated securities did not have unrealized appreciation (depreciation) at year end. |
| |||||||||||||||||||
| C Formerly known as Institutional Class. |
| |||||||||||||||||||
See accompanying notes
43
American Beacon FundsSM
Statements of Operations
For the year ended June 30, 2020
| SSI Alternative Income Fund | TwentyFour Short Term Bond FundA | TwentyFour Strategic Income Fund | ||||||||||||||||||
Investment income: |
| |||||||||||||||||||
Dividend income from unaffiliated securities | $ | 1,233,465 | $ | – | $ | – | ||||||||||||||
Dividend income from affiliated securities (Note 2) | 157,028 | – | 47,582 | |||||||||||||||||
Interest income (net of foreign taxes)† | 4,326,491 | 59,131 | 3,340,956 | |||||||||||||||||
Interest income from short securities held at broker | 1,341,077 | – | – | |||||||||||||||||
|
|
|
|
|
| |||||||||||||||
Total investment income | 7,058,061 | 59,131 | 3,388,538 | |||||||||||||||||
|
|
|
|
|
| |||||||||||||||
Expenses: |
| |||||||||||||||||||
Management and sub-advisory fees (Note 2) | 2,221,343 | 19,924 | 614,703 | |||||||||||||||||
Transfer agent fees: | ||||||||||||||||||||
R5 Class (Note 2)B | 2,535 | – | 460 | |||||||||||||||||
Y Class (Note 2) | 91,161 | 1,897 | 49,077 | |||||||||||||||||
Investor Class | 3,167 | – | 1,820 | |||||||||||||||||
A Class | – | 1,932 | 186 | |||||||||||||||||
C Class | – | 1,897 | 42 | |||||||||||||||||
Ultra Class | – | – | 92 | |||||||||||||||||
R6 Class | – | 2,055 | – | |||||||||||||||||
Custody and fund accounting fees | 50,561 | 8,604 | 53,616 | |||||||||||||||||
Professional fees | 242,620 | 156,489 | 95,414 | |||||||||||||||||
Registration fees and expenses | 57,321 | 26,453 | 79,152 | |||||||||||||||||
Service fees (Note 2): | ||||||||||||||||||||
Investor Class | 2,400 | – | 30,315 | |||||||||||||||||
A Class | – | 138 | 1,853 | |||||||||||||||||
C Class | – | 162 | 3,048 | |||||||||||||||||
Distribution fees (Note 2): | ||||||||||||||||||||
A Class | – | 138 | 15,706 | |||||||||||||||||
C Class | – | 646 | 25,290 | |||||||||||||||||
Prospectus and shareholder report expenses | 25,297 | 29,467 | 31,657 | |||||||||||||||||
Trustee fees (Note 2) | 13,903 | 439 | 7,421 | |||||||||||||||||
Prime broker fees | 711,969 | – | – | |||||||||||||||||
Dividends and interest on securities sold short | 505,716 | – | – | |||||||||||||||||
Other expenses | 52,498 | 3,046 | 58,001 | |||||||||||||||||
|
|
|
|
|
| |||||||||||||||
Total expenses | 3,980,491 | 253,287 | 1,067,853 | |||||||||||||||||
|
|
|
|
|
| |||||||||||||||
Net fees waived and expenses (reimbursed) (Note 2) | (93,556 | ) | (228,003 | ) | (255,373 | ) | ||||||||||||||
Net sub-advisory fees waived (Note 2) | - | (7,245 | ) | - | ||||||||||||||||
|
|
|
|
|
| |||||||||||||||
Net expenses | 3,886,935 | 18,039 | 812,480 | |||||||||||||||||
|
|
|
|
|
| |||||||||||||||
Net investment income | 3,171,126 | 41,092 | 2,576,058 | |||||||||||||||||
|
|
|
|
|
| |||||||||||||||
Realized and unrealized gain (loss) from investments: |
| |||||||||||||||||||
Net realized gain (loss) from: | ||||||||||||||||||||
Investments in unaffiliated securitiesC | 11,305,907 | (37,762 | ) | (215,066 | ) | |||||||||||||||
Foreign currency transactions | – | 295,465 | 1,199,886 | |||||||||||||||||
Forward foreign currency contracts | – | (174,114 | ) | 578,441 | ||||||||||||||||
Written options contracts | 1,759,192 | – | – | |||||||||||||||||
Short sales | (9,065,118 | ) | – | – | ||||||||||||||||
Change in net unrealized appreciation (depreciation) of: | ||||||||||||||||||||
Investments in unaffiliated securitiesD | (11,428,525 | ) | (314,679 | ) | (2,710,361 | ) | ||||||||||||||
Foreign currency transactions | – | (6,659 | ) | 5,702 | ||||||||||||||||
Forward foreign currency contracts | – | 192,010 | 1,199,998 | |||||||||||||||||
Written options contracts | 55,188 | – | – | |||||||||||||||||
Short sales | 8,163,052 | – | – | |||||||||||||||||
|
|
|
|
|
| |||||||||||||||
Net gain (loss) from investments | 789,696 | (45,739 | ) | 58,600 | ||||||||||||||||
|
|
|
|
|
| |||||||||||||||
Net increase (decrease) in net assets resulting from operations | $ | 3,960,822 | $ | (4,647 | ) | $ | 2,634,658 | |||||||||||||
|
|
|
|
|
| |||||||||||||||
† Foreign taxes | $ | – | $ | – | $ | 110 | ||||||||||||||
A Commencement of operations, February 18, 2020 through June 30, 2020. |
| |||||||||||||||||||
B Formerly known as Institutional Class. |
| |||||||||||||||||||
C The Fund did not recognize net realized gains (losses) from the sale of investments in affiliated securities. |
| |||||||||||||||||||
D The Fund’s investments in affiliated securities did not have a change in unrealized appreciation (depreciation) at year end. |
| |||||||||||||||||||
See accompanying notes
44
American Beacon FundsSM
Statements of Changes in Net Assets
| SSI Alternative Income FundG | TwentyFour Short Term Bond Fund | |||||||||||||||||||||||||||
| Year Ended June 30, 2020 | Period from 4/1/2019 through 6/30/2019# | Year Ended March 31, 2019 | February 18, 2020A to June 30, 2020 | |||||||||||||||||||||||||
Increase (decrease) in net assets: |
| |||||||||||||||||||||||||||
Operations: |
| |||||||||||||||||||||||||||
Net investment income | $ | 3,171,126 | $ | 1,426,359 | $ | 5,700,239 | $ | 41,092 | ||||||||||||||||||||
Net realized gain (loss) from investments in unaffiliated securities, foreign currency transactions, forward foreign currency contracts, written options contracts, and short sales | 3,999,981 | 888,504 | 5,421,515 | 83,589 | ||||||||||||||||||||||||
Change in net unrealized appreciation of investments in unaffiliated securities, foreign currency transactions, forward foreign currency contracts, written options contracts, and short sales | (3,210,285 | ) | 1,272,754 | (3,020,231 | ) | (129,328 | ) | |||||||||||||||||||||
|
|
|
|
|
|
|
| |||||||||||||||||||||
Net increase (decrease) in net assets resulting from operations | 3,960,822 | 3,587,617 | 8,101,523 | (4,647 | ) | |||||||||||||||||||||||
|
|
|
|
|
|
|
| |||||||||||||||||||||
Distributions to shareholders: |
| |||||||||||||||||||||||||||
Total retained earnings:* † | ||||||||||||||||||||||||||||
R5 ClassB C | (3,660 | ) | – | – | – | |||||||||||||||||||||||
Y Class | (6,924,234 | ) | – | D | (5,245,637 | ) | (703 | ) | ||||||||||||||||||||
Investor Class | (31,372 | ) | – | E | (33,530 | ) | – | |||||||||||||||||||||
A Class | – | – | – | (885 | ) | |||||||||||||||||||||||
C Class | – | – | – | (1,265 | ) | |||||||||||||||||||||||
Ultra Class | – | – | – | – | ||||||||||||||||||||||||
| – | (68,176 | ) | ||||||||||||||||||||||||||
|
|
|
|
|
|
|
| |||||||||||||||||||||
Net distributions to shareholders | (6,959,266 | ) | – | (5,279,167 | ) | (71,029 | ) | |||||||||||||||||||||
|
|
|
|
|
|
|
| |||||||||||||||||||||
Capital share transactions (Note 10): |
| |||||||||||||||||||||||||||
Proceeds from sales of shares | 17,830,637 | 7,412,899 | 79,669,135 | 507,237 | ||||||||||||||||||||||||
Reinvestment of dividends and distributions | 5,192,445 | – | 4,621,235 | 15,992 | ||||||||||||||||||||||||
Cost of shares redeemed | (107,780,922 | ) | (62,959,198 | ) | (89,455,597 | ) | (199,333 | ) | ||||||||||||||||||||
|
|
|
|
|
|
|
| |||||||||||||||||||||
Net increase (decrease) in net assets from capital share transactions | (84,757,840 | ) | (55,546,299 | ) | (5,165,227 | ) | 323,896 | |||||||||||||||||||||
|
|
|
|
|
|
|
| |||||||||||||||||||||
Net increase (decrease) in net assets | (87,756,284 | ) | (51,958,682 | ) | (2,342,871 | ) | 248,220 | |||||||||||||||||||||
|
|
|
|
|
|
|
| |||||||||||||||||||||
Net assets: |
| |||||||||||||||||||||||||||
Beginning of period | 228,327,378 | 280,286,060 | 282,628,931 | 10,000,000 | F | |||||||||||||||||||||||
|
|
|
|
|
|
|
| |||||||||||||||||||||
End of period | $ | 140,571,094 | $ | 228,327,378 | $ | 280,286,060 | $ | 10,248,220 | ||||||||||||||||||||
|
|
|
|
|
|
|
| |||||||||||||||||||||
# Fiscal year end changed from March 31 to June 30. |
| |||||||||||||||||||||||||||
* Distributions from net investment income and net realized capital gains are combined for the year ended March 31, 2019 for the SSI Alternative Income Fund. |
| |||||||||||||||||||||||||||
† Distributions from net investment income and net realized capital gains are combined for the year ended June 30, 2019. |
| |||||||||||||||||||||||||||
A Commencement of operations. |
| |||||||||||||||||||||||||||
B Class commenced operations May 20, 2019 in the SSI Alternative Income Fund. |
| |||||||||||||||||||||||||||
C Formerly known as Institutional Class. |
| |||||||||||||||||||||||||||
D Formerly known as Class I. |
| |||||||||||||||||||||||||||
| E Formerly known as Class A. |
| |||||||||||||||||||||||||||
| F Seed capital. |
| |||||||||||||||||||||||||||
| G Formerly know as Palmer Square SSI Alternative Income Fund. |
| |||||||||||||||||||||||||||
See accompanying notes
45
American Beacon FundsSM
Statements of Changes in Net Assets
| TwentyFour Strategic Income Fund | ||||||||||||
| Year Ended June 30, 2020 | Year Ended June 30, 2019 | |||||||||||
Increase (decrease) in net assets: |
| |||||||||||
Operations: |
| |||||||||||
Net investment income | $ | 2,576,058 | $ | 2,786,491 | ||||||||
Net realized gain from investments in unaffiliated securities, foreign currency transactions, and forward foreign currency contracts | 1,563,261 | 1,220,427 | ||||||||||
Change in net unrealized appreciation (depreciation) of investments in unaffiliated securities, foreign currency transactions, and forward foreign currency contracts | (1,504,661 | ) | 1,116,681 | |||||||||
|
|
|
| |||||||||
Net increase in net assets resulting from operations | 2,634,658 | 5,123,599 | ||||||||||
|
|
|
| |||||||||
Distributions to shareholders: |
| |||||||||||
Total retained earnings: | ||||||||||||
R5 ClassA | (310,611 | ) | (1,441,555 | ) | ||||||||
Y Class | (2,103,651 | ) | (1,666,141 | ) | ||||||||
Investor Class | (268,231 | ) | (76,834 | ) | ||||||||
A Class | (213,981 | ) | (136,279 | ) | ||||||||
C Class | (64,645 | ) | (45,547 | ) | ||||||||
Ultra Class | (76,048 | ) | (492,467 | ) | ||||||||
|
|
|
| |||||||||
Net distributions to shareholders | (3,037,167 | ) | (3,858,823 | ) | ||||||||
|
|
|
| |||||||||
Capital share transactions (Note 10): |
| |||||||||||
Proceeds from sales of shares | 106,705,169 | 23,533,149 | ||||||||||
Reinvestment of dividends and distributions | 2,946,921 | 3,843,791 | ||||||||||
Issued in reorganization | – | 55,815,668 | ||||||||||
Cost of shares redeemed | (51,975,326 | ) | (56,810,990 | ) | ||||||||
|
|
|
| |||||||||
Net increase in net assets from capital share transactions | 57,676,764 | 26,381,618 | ||||||||||
|
|
|
| |||||||||
Net increase in net assets | 57,274,255 | 27,646,394 | ||||||||||
|
|
|
| |||||||||
Net assets: |
| |||||||||||
Beginning of period | 66,770,952 | 39,124,558 | ||||||||||
|
|
|
| |||||||||
End of period | $ | 124,045,207 | $ | 66,770,952 | ||||||||
|
|
|
| |||||||||
A Formerly known as Institutional Class. |
| |||||||||||
See accompanying notes
46
American Beacon FundsSM
June 30, 2020
1. Organization and Significant Accounting Policies
American Beacon Funds (the “Trust”) is organized as a Massachusetts business trust. The Funds, each a series within the Trust, are registered under the Investment Company Act of 1940, as amended (the “Act”), as non-diversified, open-end management investment companies. As of June 30, 2020, the Trust consists of twenty-seven active series, three of which are presented in this filing: American Beacon SSI Alternative Income Fund, American Beacon TwentyFour Short Term Bond Fund and American Beacon TwentyFour Strategic Income Fund (collectively, the “Funds” and each individually a “Fund”). The remaining twenty-four active series are reported in separate filings.
American Beacon Advisors, Inc. (the “Manager”) is a Delaware corporation and a wholly-owned subsidiary of Resolute Investment Managers, Inc. (“RIM”) organized in 1986 to provide business management, advisory, administrative, and asset management consulting services to the Trust and other investors. The Manager is registered as an investment advisor under the Investment Advisers Act of 1940, as amended (the “Advisers Act”). RIM is, in turn, a wholly-owned subsidiary of Resolute Acquisition, Inc., which is a wholly-owned subsidiary of Resolute Topco, Inc., a wholly-owned subsidiary of Resolute Investment Holdings, LLC (“RIH”). RIH is owned primarily by Kelso Investment Associates VIII, L.P., KEP VI, LLC and Estancia Capital Partners L.P., investment funds affiliated with Kelso & Company, L.P. (“Kelso”) or Estancia Capital Management, LLC (“Estancia”), which are private equity firms.
The American Beacon TwentyFour Short Term Bond Fund commenced operations on February 18, 2020 and is a separate series of the Trust. The Fund constitutes a separate investment portfolio with a distinct investment objective and distinct purpose and strategy.
Recently Adopted Accounting Pronouncements
In August 2018, the Financial Accounting Standards Board (“FASB”) issued Accounting Standards Update (“ASU”) 2018-13, Fair Value Measurement (“Topic 820”). The amendments in the ASU impact disclosure requirements for fair value measurement. It is anticipated that this change will enhance the effectiveness of disclosures in the notes to the financial statements. This ASU is effective for fiscal years beginning after December 15, 2019. Early adoption is permitted and can include the entire standard or certain provisions that exclude or amend disclosures. For the year ended June 30, 2020, the Funds have chosen to adopt the standard. The adoption of this ASU guidance did not have a material impact on the financial statements and other disclosures.
In March 2020, the FASB issued ASU 2020-04, which provides optional expedients and exceptions for contracts, hedging relationships and other transactions affected by the transitioning away from the London Interbank Offered Rate (LIBOR) and other reference rates that are expected to be discontinued. The ASU is effective immediately upon release of the update on March 12, 2020 through December 31, 2022. At this time, management is evaluating the implications of these changes on the financial statements.
Class Disclosure
February 18, 2020 is the commencement date of the A, C, Y and R6 Classes of the TwentyFour Short Term Bond Fund made available for sale pursuant to the Fund’s registration statement filed with the Securities and Exchange Commission (“SEC”). Refer to the Fund’s Prospectus for more details.
Effective February 28, 2020, the name of the Institutional Class changed to R5 Class.
47
American Beacon FundsSM
Notes to Financial Statements
June 30, 2020
Each Fund has multiple classes of shares designed to meet the needs of different groups of investors; however, not all of the Funds offer all classes. The following table sets forth the differences amongst the classes:
Class | Eligible Investors | Minimum Initial Investments | ||||
| R5 Class | Large institutional investors - sold directly through intermediary channels. | $ | 250,000 | |||
| Y Class | Large institutional retirement plan investors - sold directly or through intermediary channels. | $ | 100,000 | |||
| Investor Class | All investors using intermediary organizations, such as broker-dealers or retirement plan sponsors. | $ | 2,500 | |||
| A Class | All investors who invest through intermediary organizations, such as broker-dealers or third-party administrator. Retail investors who invest directly through a financial intermediary such as a broker, bank, or registered investment advisor which may include a front-end sales charge and a contingent deferred sales charge (“CDSC”). | $ | 2,500 | |||
| C Class | Retail investors who invest directly through a financial intermediary such as a broker or through employee directed benefit plans with applicable sales charges which may include CDSC. | $ | 1,000 | |||
| Ultra Class | Large institutional investors - sold directly or through intermediary channels. | $ | 350,000,000 | |||
| R6 Class | Large institutional retirement plan investors - sold through retirement plan sponsors. | None | ||||
Each class offered by the Trust has equal rights as to assets and voting privileges. Income and non-class specific expenses are allocated daily to each class based on the relative net assets. Realized and unrealized capital gains and losses of each class are allocated daily based on the relative net assets of each class of the respective Fund. Class specific expenses, where applicable, currently include service, distribution, transfer agent fees, and sub-transfer agent fees that vary amongst the classes as described more fully in Note 2.
Significant Accounting Policies
The following is a summary of significant accounting policies, consistently followed by the Funds in preparation of the financial statements. The Funds are considered investment companies and accordingly, follow the investment company accounting and reporting guidance of the FASB Accounting Standards Codification Topic 946, Financial Services – Investment Companies, a part of Generally Accepted Accounting Principles (“U.S. GAAP”).
Security Transactions and Investment Income
Security transactions are recorded as of the trade date for financial reporting purposes. Securities purchased or sold on a when-issued or delayed-delivery basis may be settled beyond a standard settlement period for the security after the trade date.
Dividend income, net of foreign taxes, is recorded on the ex-dividend date, except certain dividends from foreign securities which are recorded as soon as the information is available to the Funds. Interest income, net of foreign taxes, is earned from settlement date, recorded on the accrual basis, and adjusted, if necessary, for accretion of discounts and amortization of premiums. Realized gains (losses) from securities sold are determined based on specific lot identification.
Currency Translation
All assets and liabilities initially expressed in foreign currency values are converted into U.S. dollar values at the mean of the bid and ask prices of such currencies against U.S. dollars as last quoted by a recognized dealer. Income, expenses, and purchases and sales of investments are translated into U.S. dollars at the rate of the exchange prevailing on the respective dates of such transactions. The effect of changes in foreign currency exchange rates on investments is separately identified from the fluctuations arising from changes in market values of securities held and is reported with all other foreign currency gains and losses on the Funds’ Statements of Operations.
48
American Beacon FundsSM
Notes to Financial Statements
June 30, 2020
Distributions to Shareholders
The SSI Alternative Income Fund distributes most or all of its net earning and realized gains, if any, each taxable year in the form of dividends from net investment income on a semi-annual basis and distributions of realized net capital gains and net gains from foreign currency transactions on an annual basis. The TwentyFour Short Term Bond Fund and TwentyFour Strategic Income Fund distributes most or all of their net earnings and realized gains, if any, each taxable year in the form of dividends from net investment income on a monthly basis and distributions of realized net capital gains and net gains from foreign currency transactions on an annual basis. The Funds do not have a fixed dividend rate and do not guarantee that they will pay any distributions in any particular period. Dividends to shareholders are determined in accordance with federal income tax regulations, which may differ in amount and character from net investment income and realized gains recognized for purposes of U.S. GAAP. To the extent necessary to fully distribute capital gains, the Funds may designate earnings and profits distributed to shareholders on the redemption of shares.
Allocation of Income, Trust Expenses, Gains, and Losses
Investment income, realized and unrealized gains and losses from investments of the Funds are allocated daily to each class of shares based upon the relative proportion of net assets of each class to the total net assets of the Funds. Expenses directly charged or attributable to the Fund will be paid from the assets of the Fund. Generally, expenses of the Trust will be allocated among and charged to the assets of the Funds on a basis that the Trust’s Board of Trustees (the “Board”) deems fair and equitable, which may be based on the relative net assets of the Funds or nature of the services performed and relative applicability to the Funds.
Organization and Offering Costs
Organizational costs consist of the costs of forming the TwentyFour Short Term Bond Fund, drafting the bylaws, administration, custody and transfer agency agreements, and legal services in connection with the initial meeting of trustees, and were expensed immediately as incurred. Offering costs consist of the costs of preparation, review and filing with the SEC the Fund’s registration statement (including the Prospectus and the Statement of Additional Information (“SAI”)), the costs of preparation, the costs associated with the printing, mailing or other distribution of the Prospectus, SAI and the amounts of associated filing fees and legal fees associated with the offering. Organizational costs and offering costs are subject to the Fund’s expense limitation agreement discussed in Note 2 and offering costs require amortization over twelve months on a straight-line basis from the commencement of operations. For the period ended June 30, 2020, the Fund recorded $93,677 of organization costs and $46,297 of amortized offering costs.
Use of Estimates
The preparation of financial statements in conformity with U.S. GAAP requires management to make estimates and assumptions that affect the amounts reported in the financial statements and accompanying notes. Actual results may differ from those estimated.
Other
Under the Trust’s organizational documents, its officers and trustees are indemnified against certain liabilities arising out of the performance of their duties to the Trust. In the normal course of business, the Trust enters into contracts that provide indemnification to the other party or parties against potential costs or liabilities. The Trust’s maximum exposure under these arrangements is dependent on claims that may be made in the future and, therefore, cannot be estimated. The Trust has had no prior claims or losses pursuant to any such agreement.
49
American Beacon FundsSM
Notes to Financial Statements
June 30, 2020
2. Transactions with Affiliates
Management and Investment Sub-Advisory Agreements
The Funds and the Manager are parties to a Management Agreement that obligates the Manager to provide the Funds with investment advisory and administrative services. As compensation for performing the duties under the Management Agreement, the Manager will receive an annualized management fee based on a percentage of each Fund’s average daily net assets that is calculated and accrued daily according to the following schedule:
First $5 billion | 0.35 | % | ||
Next $5 billion | 0.325 | % | ||
Next $10 billion | 0.30 | % | ||
Over $20 billion | 0.275 | % |
The Trust, on behalf of the Funds, and the Manager have entered into an Investment Advisory Agreements with SSI Investment Management LLC and TwentyFour Asset Management (US) LP (the “Sub-Advisors”) pursuant to which the Funds has agreed to pay an annualized sub-advisory fees that are calculated and accrued daily based on the Funds’ average daily net assets according to the following schedule:
SSI Alternative Income Fund
First $300 million | 0.95 | % | ||
Over $300 million | 0.85 | % |
TwentyFour Short Term Bond Fund
First $200 million | 0.20 | % | ||
Next $200 million | 0.185 | % | ||
Next $700 million | 0.175 | % | ||
Over $1.1 billion | 0.17 | % |
TwentyFour Strategic Income Fund
First $1 billion | 0.32 | % | ||
Over $1 billion | 0.27 | % |
The Management and Sub-Advisory Fees paid by the Fund for the year ended June 30, 2020 were as follows:
SSI Alternative Income Fund
| Effective Fee Rate | Amount of Fees Paid | |||||||||||
Management Fees | 0.35 | % | $ | 598,387 | ||||||||
Sub-Advisor Fees | 0.95 | % | 1,622,956 | |||||||||
|
|
|
| |||||||||
Total | 1.30 | % | $ | 2,221,343 | ||||||||
|
|
|
| |||||||||
TwentyFour Short Term Bond Fund
| Effective Fee Rate | Amount of Fees Paid | |||||||||||
Management Fees | 0.35 | % | $ | 12,679 | ||||||||
Sub-Advisor Fees | 0.20 | % | 7,245 | |||||||||
|
|
|
| |||||||||
Total | 0.55 | % | $ | 19,924 | ||||||||
|
|
|
| |||||||||
TwentyFour Strategic Income Fund
| Effective Fee Rate | Amount of Fees Paid | |||||||||||
Management Fees | 0.35 | % | $ | 322,410 | ||||||||
Sub-Advisor Fees | 0.32 | % | 292,293 | |||||||||
|
|
|
| |||||||||
Total | 0.67 | % | $ | 614,703 | ||||||||
|
|
|
| |||||||||
50
American Beacon FundsSM
Notes to Financial Statements
June 30, 2020
From the date of the TwentyFour Short Term Bond Fund’s commencement of operations until December 31, 2020, the Sub-Advisor of the Fund, TwentyFour Asset Management (US) LP agreed to share a portion of the fee waivers with the Manager by waiving 100% of its sub-advisory fee. For the period ended June 30, 2020, $7,245 of sub-advisory fees were waived by TwentyFour Asset Management (US) LP.
Distribution Plans
The Funds, except for the A and C Classes of the TwentyFour Short Term Bond Fund and TwentyFour Strategic Income Fund, have adopted a “defensive” Distribution Plan (the “Plan”) in accordance with Rule 12b-1 under the Act, pursuant to which no separate fees may be charged to the Funds for distribution purposes. However, the Plan authorizes the management fee received by the Manager and the investment advisors hired by the Manager to be used for distribution purposes. Under this Plan, the Funds do not intend to compensate the Manager or any other party, either directly or indirectly, for the distribution of Fund shares.
Separate Distribution Plans (the “Distribution Plans”) have been adopted pursuant to Rule 12b-1 under the Act for the A, and C Classes of the Funds. Under the Distribution Plans, as compensation for distribution and shareholder servicing assistance, the Manager receives an annual fee of 0.25% of the average daily net assets of the A Class, and 1.00% of the average daily net assets of the C Class. The fee will be payable without regard to whether the amount of the fee is more or less than the actual expenses incurred in a particular month by the Manager for distribution assistance.
Service Plans
The Manager and the Trust entered into a Service Plan that obligates the Manager to oversee additional shareholder servicing of the Investor Class of the Funds. As compensation for performing the duties required under the Service Plan, the Manager receives an annualized fee up to 0.375% of the average daily net assets attributable to the Investor Class of the Funds.
Sub-Transfer Agent Fees
The Manager has entered into agreements, which include servicing agreements, with financial intermediaries that provide recordkeeping, processing, shareholder communications and other services to customers of the intermediaries that hold positions in the R5 and Y Classes of the Funds and has agreed to compensate the intermediaries for providing these services. Intermediaries transact with the Funds primarily through the use of omnibus accounts on behalf of their customers who hold positions in the Funds. Certain services would have been provided by the Funds’ transfer agent and other service providers if the shareholders’ accounts were maintained directly by the Funds’ transfer agent. Accordingly, the Funds, pursuant to Board approval, have agreed to reimburse the Manager for certain non-distribution shareholder services provided by financial intermediaries for the R5 and Y Classes. The reimbursement amounts (sub-transfer agent fees) paid to the Manager are subject to a fee limit of up to 0.10% of an intermediary’s average net assets in the R5 and Y Classes on an annual basis. During the year ended June 30, 2020, the sub-transfer agent fees, as reflected in “Transfer agent fees” on the Statements of Operations, were as follows:
Fund | Sub-Transfer Agent Fees | |||
SSI Alternative Income Fund | $ | 91,161 | ||
TwentyFour Strategic Income | 46,670 | |||
As of June 30, 2020, the Funds owed the Fund the following reimbursement of sub-transfer agent fees, as reflected in “Transfer agent fees payable” on the Statements of Assets and Liabilities:
Fund | Reimbursement Sub-Transfer Agent Fees | |||
SSI Alternative Income Fund | $ | 63 | * | |
TwentyFour Strategic Income | 5,949 | |||
* This balance is presented as a contra liability as of June 30, 2020.
51
American Beacon FundsSM
Notes to Financial Statements
June 30, 2020
Investments in Affiliated Funds
The Funds may invest in the American Beacon U.S. Government Money Market Select Fund (the “USG Select Fund”). The Funds listed below held the following shares with a June 30, 2020 fair value and dividend income earned from the investment in the USG Select Fund:
Affiliated Security | Type of Transaction | Fund | June 30, 2020 Shares/ Principal | Change in Unrealized Gain (Loss) | Realized Gain (Loss) | Dividend Income | June 30, 2020 Fair Value | |||||||||||||||||||||||||||||||||||||||||
| U.S. Government Money Market Select Fund | Direct | SSI Alternative Income | 12,005,454 | $ | - | $ | - | $ | 157,028 | $ | 12,005,454 | |||||||||||||||||||||||||||||||||||||
| U.S. Government Money Market Select Fund | Direct | TwentyFour Strategic Income | 3,772,150 | - | - | 47,582 | 3,772,150 | |||||||||||||||||||||||||||||||||||||||||
The Funds and the USG Select Fund have the same investment advisor and therefore, are considered to be affiliated. The Manager serves as investment advisor to the USG Select Fund and receives management fees and administrative fees totaling 0.10% of the average daily net assets of the USG Select Fund. During the year ended June 30, 2020, the Manager earned fees on the Funds’ direct investments in the USG Select Fund as shown below:
Fund | Direct Investments in USG Select Fund | |||
SSI Alternative Income | $ | 10,912 | ||
TwentyFour Strategic Income | 4,320 | |||
Interfund Credit Facility
Pursuant to an exemptive order issued by the U.S. Securities and Exchange Commission (“SEC”), the Funds, along with other registered investment companies having management contracts with the Manager, may participate in a credit facility whereby each fund, under certain conditions, is permitted to lend money directly to and borrow directly from other participating funds for temporary purposes. The interfund credit facility is advantageous to the funds because it provides added liquidity and eliminates the need to maintain higher cash balances to meet redemptions. This situation could arise when shareholder redemptions exceed anticipated volumes and certain funds have insufficient cash on hand to satisfy such redemptions or when sales of securities do not settle as expected, resulting in a cash shortfall for a fund. When a fund liquidates portfolio securities to meet redemption requests, they often do not receive payment in settlement for up to two days (or longer for certain foreign transactions). Redemption requests normally are satisfied on the next business day. The credit facility provides a source of immediate, short-term liquidity pending settlement of the sale of portfolio securities. The credit facility is administered by a credit facility team consisting of professionals from the Manager’s asset management, compliance, and accounting areas who report the activities of the credit facility to the Board. During the year ended June 30, 2020, the TwentyFour Strategic Income Fund borrowed $110,044 for 1 day at an interest rate of 2.24% with interest charges of $7. These amounts are recorded as “Other expenses” in the Statements of Operations. For the year ended June 30, 2020, the SSI Alternative Income Fund and TwentyFour Short Term Bond Fund did not utilize the credit facility.
Expense Reimbursement Plan
The Manager contractually agreed to reduce fees and/or reimburse expenses for the classes of the Funds to the extent that total operating expenses exceed the Funds’ expense cap. During the year ended June 30, 2020, the Manager waived and/or reimbursed expenses as follows:
| Expense Cap | ||||||||||||||||||
Fund | Class | 7/1/2019 - 6/30/2020 | Reimbursed Expenses | (Recouped) Expenses | Expiration of Reimbursed Expenses | |||||||||||||
SSI Alternative Income Fund | R5* | 1.49 | % | $ | 3,035 | $ | (113 | )** | 2022-2023 | |||||||||
SSI Alternative Income Fund | Y | 1.56 | % | 86,825 | (40,656 | )** | 2022-2023 | |||||||||||
SSI Alternative Income Fund | Investor | 1.81 | % | 4,083 | (933 | )** | 2022-2023 | |||||||||||
TwentyFour Short Term Bond Fund | Y | 0.57 | % | 3,598 | – | 2022-2023 | ||||||||||||
52
American Beacon FundsSM
Notes to Financial Statements
June 30, 2020
| Expense Cap | ||||||||||||||||||
Fund | Class | 7/1/2019 - 6/30/2020 | Reimbursed Expenses | (Recouped) Expenses | Expiration of Reimbursed Expenses | |||||||||||||
TwentyFour Short Term Bond Fund | A | 0.87 | % | $ | 4,767 | $ | – | 2022-2023 | ||||||||||
TwentyFour Short Term Bond Fund | C | 1.62 | % | 5,202 | – | 2022-2023 | ||||||||||||
TwentyFour Short Term Bond Fund | R6 | 0.47 | % | 214,436 | – | 2022-2023 | ||||||||||||
TwentyFour Strategic Income | R5* | 0.72 | % | 26,569 | (2,556 | )** | 2022-2023 | |||||||||||
TwentyFour Strategic Income | Y | 0.82 | % | 170,949 | (19,107 | )** | 2022-2023 | |||||||||||
TwentyFour Strategic Income | Investor | 1.09 | % | 28,609 | (5,951 | )** | 2022-2023 | |||||||||||
TwentyFour Strategic Income | A | 1.12 | % | 13,900 | (4,863 | )** | 2022-2023 | |||||||||||
TwentyFour Strategic Income | C | 1.87 | % | 6,947 | (1,064 | )** | 2022-2023 | |||||||||||
TwentyFour Strategic Income | Ultra | 0.67 | % | 8,399 | (2,789 | )** | 2022-2023 | |||||||||||
* Formerly Institutional Class.
** These amounts represent Recouped Expenses from prior fiscal years and are reflected in Total Expenses on the Statements of Operations.
Of these amounts, $13,982, $38,215 and $10,742 were disclosed as a receivable from the Manager on the Statements of Assets and Liabilities at June 30, 2020 for the SSI Alternative Income Fund, TwentyFour Short Term Bond Fund and TwentyFour Strategic Income Fund, respectively.
The Funds have adopted an Expense Reimbursement Plan whereby the Manager may seek repayment of such fee or voluntary reductions and expense reimbursements. Under the policy, the Manager can be reimbursed by the Funds for any contractual or voluntary fee reductions or expense reimbursements if reimbursement to the Manager (a) occurs within three years from the date of the Manager’s waiver/reimbursement and (b) does not cause the Funds’ annual operating expenses to exceed the lesser of the contractual percentage limit in effect at the time of the waiver/reimbursement or time of recoupment. The reimbursed expenses listed above will expire in 2022-2023. The Fund did not record a liability for potential reimbursement due to the current assessment that a reimbursement is uncertain. The carryover of excess expenses potentially reimbursable to the Manager, but not recorded as a liability are as follows:
Fund | Recouped Expenses | Excess Expense Carryover | Expired Expense Carryover | Expiration of Reimbursed Expenses | ||||||||||||
SSI Alternative Income Fund | $ | 41,702 | $ | 13,939 | $ | – | 2021-2022 | |||||||||
TwentyFour Strategic Income | 30,404 | 241,473 | – | 2020-2021 | ||||||||||||
TwentyFour Strategic Income | 5,926 | 375,688 | – | 2021-2022 | ||||||||||||
Concentration of Ownership
From time to time, the Funds may have a concentration of one or more accounts constituting a significant percentage of shares outstanding. Investment activities by holders of accounts that represent a significant ownership of more than 5% of the Funds’ outstanding shares could have a material impact on the Funds. As of June 30, 2020, based on management’s evaluation of the shareholder account base, one account has been identified as representing an unaffiliated significant ownership of approximately 39% for the SSI Alternative Income Fund and one account has been identified as representing an affiliated significant ownership of approximately 94% for the TwentyFour Short Term Bond Fund.
Sales Commissions
The Funds’ Distributor, Resolute Investment Distributors, Inc. (“RID” or “Distributor”), may receive a portion of Class A sales charges from broker dealers which may be used to offset distribution related expenses. During the year ended June 30, 2020, RID collected $7,439 for TwentyFour Strategic Income Fund from the sale of Class A Shares. During the year ended June 30, 2020 there were no Class A Shares sales charges collected from TwentyFour Short Term Bond Fund.
53
American Beacon FundsSM
Notes to Financial Statements
June 30, 2020
A CDSC of 0.50% will be deducted with respect to Class A Shares on certain purchases of $1,000,000 or more that are redeemed in whole or part within 18 months of purchase, unless waived as discussed in the Funds’ Prospectus. Any applicable CDSC will be 0.50% of the lesser of the original purchase price or the value of the redemption of the Class A Shares redeemed. During the year ended June 30, 2020, CDSC fees of $8,557 were collected for the Class A Shares of TwentyFour Strategic Income Fund. During the year ended June 30, 2020 there were no CDSC fees for Class A Shares collected for TwentyFour Short Term Bond Fund.
A CDSC of 1.00% will be deducted with respect to Class C Shares redeemed within 12 months of purchase, unless waived as discussed in the Funds’ Prospectus. Any applicable CDSC will be 1.00% of the lesser of the original purchase price or the value of the redemption of the Class C Shares redeemed. During the year ended June 30, 2020, CDSC fees of $878 were collected for the Class C Shares of TwentyFour Strategic Income Fund. During the year ended June 30, 2020 there were no CDSC fees for Class C Shares collected for TwentyFour Short Term Bond Fund.
Trustee Fees and Expenses
Effective January 1, 2020, as compensation for their service to the American Beacon Funds Complex, including the Trust (collectively, the “Trusts”), each Trustee is compensated from the Trusts as follows: (1) an annual retainer of $120,000; (2) meeting attendance fee (for attendance in person or via teleconference) of (a) $12,000 for in person attendance, or $5,000 for telephonic attendance, by Board members for each regularly scheduled or special Board meeting, (b) $2,500 for attendance by Committee members at meetings of the Audit Committee and the Investment Committee, (c) $1,500 for attendance by Committee members at meetings of the Nominating and Governance Committee; and (d) $2,500 for attendance by Board members for each special telephonic Board meeting; and (3) reimbursement of reasonable expenses incurred in attending Board meetings, Committee meetings, and relevant educational seminars. The Trustees also may be compensated for attendance at special Board and/or Committee meetings from time to time. For her service as Board Chair, Ms. Cline receives an additional annual retainer of $50,000. Although she attends several committee meetings at each quarterly Board meeting, she receives only a single $2,500 fee each quarter for her attendance at those meetings. The chairpersons of the Audit Committee and the Investment Committee each receive an additional annual retainer of $25,000 and the Chair of the Nominating and Governance Committee receives an additional annual retainer of $15,000.
3. Security Valuation and Fair Value Measurements
The price of the Fund’s shares is based on its net asset value (“NAV”) per share. The Fund’s NAV is computed by adding total assets, subtracting all the Fund’s liabilities, and dividing the result by the total number of shares outstanding.
The NAV of each class of the Fund’s shares is determined based on a pro rata allocation of the Fund’s investment income, expenses and total capital gains and losses. The Fund’s NAV per share is determined each business day as of the regular close of trading on the New York Stock Exchange (“NYSE” or “Exchange”), which is typically 4:00 p.m. Eastern Time (“ET”). However, if trading on the NYSE closes at a time other than 4:00 p.m. ET, the Fund’s NAV per share typically would still be determined as of the regular close of trading on the NYSE. The Fund does not price its shares on days that the NYSE is closed. Foreign exchanges may permit trading in foreign securities on days when the Fund is not open for business, which may result in the value of the Fund’s portfolio investments being affected at a time when you are unable to buy or sell shares.
Equity securities, including shares of closed-end funds and exchange-traded funds (“ETFs”), are valued at the last sale price or official closing price taken from the primary exchange in which each security trades. Investments in other mutual funds are valued at the closing NAV per share on the day of valuation. Debt securities are valued at bid quotes from broker/dealers or evaluated bid prices from pricing services, who may consider a number of inputs and factors, such as prices of comparable securities, yield curves, spreads, credit ratings, coupon rates, maturity, default rates, and underlying collateral. Futures are valued based on their daily settlement prices. Exchange-traded and over-the-counter (“OTC”) options are valued at the last sale price. Options with no last sale for the day are priced at mid quote. Swaps are valued at evaluated mid prices from pricing services.
54
American Beacon FundsSM
Notes to Financial Statements
June 30, 2020
The valuation of securities traded on foreign markets and certain fixed-income securities will generally be based on prices determined as of the earlier closing time of the markets on which they primarily trade unless a significant event has occurred. When the Fund holds securities or other assets that are denominated in a foreign currency, the Fund will normally use the currency exchange rates as of 4:00 p.m. ET.
Securities may be valued at fair value, as determined in good faith and pursuant to procedures approved by the Board, under certain limited circumstances. For example, fair value pricing will be used when market quotations are not readily available or reliable, as determined by the Manager, such as when (i) trading for a security is restricted or stopped; (ii) a security’s trading market is closed (other than customary closings); or (iii) a security has been de-listed from a national exchange. A security with limited market liquidity may require fair value pricing if the Manager determines that the available price does not reflect the security’s true market value. In addition, if a significant event that the Manager determines to affect the value of one or more securities held by the Fund occurs after the close of a related exchange but before the determination of the Fund’s NAV, fair value pricing may be used on the affected security or securities. Securities of small-capitalization companies are also more likely to require a fair value determination using these procedures because they are more thinly traded and less liquid than the securities of larger-capitalization companies. The Fund may fair value securities as a result of significant events occurring after the close of the foreign markets in which the Fund invests as described below. In addition, the Fund may invest in illiquid securities requiring these procedures.
The Fund may use fair value pricing for securities primarily traded in non-U.S. markets because most foreign markets close well before the Fund’s pricing time of 4:00 p.m. ET. The earlier close of these foreign markets gives rise to the possibility that significant events, including broad market moves, may have occurred in the interim and may materially affect the value of those securities. If the Manager determines that the last quoted prices of non-U.S. securities will, in its judgment, materially affect the value of some or all its portfolio securities, the Manager can adjust the previous closing prices to reflect what it believes to be the fair value of the securities as of the close of the Exchange. In deciding whether it is necessary to adjust closing prices to reflect fair value, the Manager reviews a variety of factors, including developments in foreign markets, the performance of U.S. securities markets, and the performance of instruments trading in U.S. markets that represent foreign securities and baskets of foreign securities. These securities are fair valued using a pricing service, using methods approved by the Board, that considers the correlation of the trading patterns of the foreign security to intraday trading in the U.S. markets, based on indices of domestic securities and other appropriate indicators such as prices of relevant American Depositary Receipts (“ADRs”) and futures contracts. The Valuation Committee, established by the Board, may also fair value securities in other situations, such as when a particular foreign market is closed but the Fund is open. The Fund uses outside pricing services to provide closing prices and information to evaluate and/or adjust those prices. As a means of evaluating its security valuation process, the Valuation Committee routinely compares closing prices, the next day’s opening prices in the same markets and adjusted prices.
Attempts to determine the fair value of securities introduce an element of subjectivity to the pricing of securities. As a result, the price of a security determined through fair valuation techniques may differ from the price quoted or published by other sources and may not accurately reflect the market value of the security when trading resumes. If a reliable market quotation becomes available for a security formerly valued through fair valuation techniques, the Manager compares the new market quotation to the fair value price to evaluate the effectiveness of the Fund’s fair valuation procedures. If any significant discrepancies are found, the Manager may adjust the Fund’s fair valuation procedures.
Investments in open-end mutual funds are valued at the closing NAV per share of the mutual fund on the day of valuation.
Securities for which the market prices are not readily available or are not reflective of the fair value of the security, as determined by the Manager, will be priced at fair value following procedures approved by the Board.
Other investments for which the above valuation procedures are inappropriate or are deemed not to reflect fair value, are stated at fair value as determined in good faith by the Manager’s Valuation Committee, pursuant to procedures established by the Board.
55
American Beacon FundsSM
Notes to Financial Statements
June 30, 2020
Valuation Inputs
Various inputs may be used to determine the fair value of the Funds’ investments. These inputs are summarized in three broad levels for financial statement purposes. The inputs or methodologies used to value securities are not necessarily an indication of the risk associated with investing in those securities.
| Level 1 | - | Quoted prices in active markets for identical securities. | ||
| Level 2 | - | Prices determined using other significant observable inputs. These may include quoted prices for similar securities, interest rates, prepayment speeds, credit risk, and others. | ||
| Level 3 | - | Prices determined using other significant unobservable inputs. Unobservable inputs reflect the Fund’s own assumptions about the factors market participants would use in pricing an investment. | ||
Level 1 and Level 2 trading assets and trading liabilities, at fair value
Fixed-income securities including corporate, convertible and municipal bonds and notes, U.S. government agencies, U.S. Treasury obligations, sovereign issues, bank loans, convertible preferred securities, and non-U.S. bonds are normally valued by pricing service providers that use broker dealer quotations, reported trades or valuation estimates from their internal pricing models. The service providers’ internal models use inputs that are observable such as issuer details, interest rates, yield curves, prepayment speeds, credit risks/spreads, default rates, and quoted prices for similar assets. Securities that use similar valuation techniques and inputs as described above are categorized as Level 2 of the fair value hierarchy. Fixed-income securities purchased on a delayed-delivery basis are marked-to- market daily until settlement at the forward settlement date and are categorized as Level 2 of the fair value hierarchy.
Mortgage-related and asset-backed securities (“ABS”) are usually issued as separate tranches, or classes, of securities within each deal. These securities are also normally valued by pricing service providers that use broker-dealer quotations or valuation estimates from their internal pricing models. The pricing models for these securities usually consider tranche-level attributes, current market data, estimated cash flows, and market-based yield spreads for each tranche, and incorporates deal collateral performance, as available. Mortgage-related and ABS that use similar valuation techniques and inputs as described above are categorized as Level 2 of the fair value hierarchy.
Common stocks, ETFs, preferred securities, and financial derivative instruments, such as futures contracts or options that are traded on a national securities exchange, are stated at the last reported sale or settlement price on the day of valuation. To the extent these securities are actively traded and valuation adjustments are not applied, they are categorized as Level 1 of the fair value hierarchy. Preferred securities and other equities traded on inactive markets or valued by reference to similar instruments are generally categorized as Level 2 of the fair value hierarchy. Valuation adjustments may be applied to certain securities that are solely traded on a foreign exchange to account for the market movement between the close of the foreign market and the close of the Exchange. These securities are valued using pricing service providers that consider the correlation of the trading patterns of the foreign security to the intraday trading in the U.S. markets for investments. Securities using these valuation adjustments are categorized as Level 2 of the fair value hierarchy.
Investments in registered open-end investment management companies will be valued based upon the NAVs of such investments and are categorized as Level 1 of the fair value hierarchy.
OTC financial derivative instruments, such as forward foreign currency contracts derive their value from underlying asset prices, indices, reference rates, and other inputs or a combination of these factors. These contracts are normally valued on the basis of broker dealer quotations or pricing service providers. Depending on the product and the terms of the transaction, the fair value of the financial derivative contracts can be estimated by a pricing service provider using a series of techniques, including simulation pricing models. The pricing models use inputs that are observed from actively quoted markets such as issuer details, indices, spreads, interest rates, curves, dividends, and exchange rates. Financial derivatives that use similar valuation techniques and inputs as described above are categorized as Level 2 of the fair value hierarchy.
56
American Beacon FundsSM
Notes to Financial Statements
June 30, 2020
4. Securities and Other Investments
Asset-Backed Securities
ABS are securities issued by trusts and special purpose entities that are backed by pools of assets, such as automobile and credit-card receivables and home equity loans, which pass through the payments on the underlying obligations to the security holders (less servicing fees paid to the originator or fees for any credit enhancement). Typically, loans or accounts receivable paper are transferred from the originator to a specially created trust, which repackages the trust’s interests as securities with a minimum denomination and a specific term. The securities are then privately placed or publicly offered. Examples include certificates for automobile receivables and so-called plastic bonds, backed by credit card receivables. The Funds are permitted to invest in ABS, subject to the Funds’ rating and quality requirements.
The value of an ABS is affected by, among other things, changes in the market’s perception of the asset backing the security, the creditworthiness of the servicing agent for the loan pool, the originator of the loans and the financial institution providing any credit enhancement. Payments of principal and interest passed through to holders of ABS are frequently supported by some form of credit enhancement, such as a letter of credit, surety bond, limited guarantee by another entity or by having a priority to certain of the borrower’s other assets. The degree of credit enhancement varies, and generally applies to only a portion of the ABS’s par value. Value is also affected if any credit enhancement has been exhausted.
Collateralized Loan Obligations
The Funds may invest in collateralized loan obligations (“CLOs”) and other similarly structured securities. CLOs are types of ABS. A CLO is a trust typically collateralized by a pool of loans, which may include, among others, domestic and foreign senior secured loans, senior unsecured loans, and subordinate corporate loans, including loans that may be rated below investment grade or equivalent unrated loans. CLOs may charge management fees and administrative expenses.
For CLOs, the cash flows from the trust are split into two or more portions, called tranches, varying in risk and yield. The riskiest portion is the “equity” tranche which bears the bulk of defaults from the bonds or loans in the trust and serves to protect the other, more senior tranches from default in all but the most severe circumstances. Since they are partially protected from defaults, senior tranches from a CLO trust typically have higher ratings and lower yields than their underlying securities, and can be rated investment grade. Despite the protection from the equity tranche, CLO tranches can experience substantial losses due to actual defaults, increased sensitivity to defaults due to collateral default and disappearance of protecting tranches, market anticipation of defaults, as well as aversion to CLO securities as a class.
Common Stock.
Common stock generally takes the form of shares in a corporation which represent an ownership interest. It ranks below preferred stock and debt securities in claims for dividends and for assets of the company in a liquidation or bankruptcy. Common stock may be traded via an exchange or over-the-counter. Over-the-counter stock may be less liquid than exchange-traded stock.
Convertible Securities
Convertible securities include corporate bonds, notes, preferred stock or other securities that may be converted into or exchanged for a prescribed amount of common stock of the same or a different issuer within a particular period of time at a specified price or formula. A convertible security entitles the holder to receive interest paid or accrued on debt or dividends paid on preferred stock until the convertible security matures or is redeemed, converted or exchanged. While no securities investment is without some risk, investments in
57
American Beacon FundsSM
Notes to Financial Statements
June 30, 2020
convertible securities generally entail less risk than the issuer’s common stock, although the extent to which such risk is reduced depends in large measure upon the degree to which the convertible security sells above its value as a fixed income security. The market value of convertible securities tends to decline as interest rates increase and, conversely, to increase as interest rates decline. While convertible securities generally offer lower interest or dividend yields than non-convertible debt securities of similar quality, they do enable the investor to benefit from increases in the market price of the underlying common stock. Holders of convertible securities have a claim on the assets of the issuer prior to the common stockholders, but may be subordinated to holders of similar non-convertible securities of the same issuer. Because of the conversion feature, certain convertible securities may be considered equity equivalents.
Floating Rate Securities
The coupons on certain fixed income securities in which the Funds may invest are not fixed and may fluctuate based upon changes in market rates. The coupon on a floating rate security is generally based on an interest rate such as a money market index, LIBOR or a Treasury bill rate. Floating rate obligations are less effective than fixed rate obligations at locking in a particular yield. Nevertheless, such obligations are subject to interest rate risk and may fluctuate in value in response to interest rate changes if there is a delay between changes in market interest rates and the interest reset date for the obligation, or for other reasons.
As short-term interest rates decline, the coupons on floating rate securities typically should decrease. Alternatively, during periods of increasing interest rates, changes in the coupons of floating rate securities may lag behind changes in market rates or may have limits on the maximum increases in the coupon rates. The value of floating rate securities may decline if their coupons do not rise as much, or as quickly, as interest rates in general. Floating rate securities will not generally increase in value if interest rates decline.
Foreign Debt Securities
The Funds may invest in foreign fixed and floating rate income securities (including emerging market securities) all or a portion of which may be non-U.S. dollar denominated and which include: (a) debt obligations issued or guaranteed by foreign national, provincial, state, municipal or other governments with taxing authority or by their agencies or instrumentalities, including Brady Bonds; (b) debt obligations of supranational entities; (c) debt obligations of the U.S. Government issued in non-dollar securities; (d) debt obligations and other fixed income securities of foreign corporate issuers (both dollar and non-dollar denominated); and (e) U.S. corporate issuers (both Eurodollar and non-dollar denominated). There is no minimum rating criteria for the Funds’ investments in such securities. Investing in the securities of foreign issuers involves special considerations that are not typically associated with investing in the securities of U.S. issuers. In addition, emerging markets are markets that have risks that are different and higher than those in more developed markets.
High-Yield Bonds
High-yield, non-investment-grade bonds (also known as “junk bonds”) are low-quality, high-risk corporate bonds that generally offer a high level of current income. These bonds are considered speculative by rating organizations. For example, Moody’s, S&P Global Ratings (“S&P Global”) and Fitch, Inc. rate them below Baa and BBB, respectively. High-yield bonds are often issued as a result of corporate restructurings, such as leveraged buyouts, mergers, acquisitions, or other similar events. They may also be issued by smaller, less creditworthy companies or by highly leveraged firms, which are generally less able to make scheduled payments of interest and principal than more financially stable firms. Because of their low credit quality, high-yield bonds must pay higher interest to compensate investors for the substantial credit risk they assume. In order to minimize credit risk, the Funds intend to diversify their holdings among multiple issuers.
58
American Beacon FundsSM
Notes to Financial Statements
June 30, 2020
Illiquid and Restricted Securities
Generally, an illiquid asset is an asset that the Funds reasonably expect cannot be sold or disposed of in current market conditions in seven calendar days or less without the sale or disposition significantly changing the market value of the investment, as determined pursuant to Rule 22e-4 under the Investment Company Act or as otherwise permitted or required by SEC rules and interpretations. Historically, illiquid securities have included securities that have not been registered under the Securities Act, securities that are otherwise not readily marketable, and repurchase agreements having a remaining maturity of longer than seven calendar days. Securities that have not been registered under the Securities Act are referred to as private placements or restricted securities and are purchased directly from the issuer or in the secondary market. These securities may be sold only in a privately negotiated transaction or pursuant to an exemption from registration. A large institutional market exists for certain securities that are not registered under the Securities Act, including repurchase agreements, commercial paper, foreign securities, municipal securities and corporate bonds and notes. Institutional investors depend on an efficient institutional market in which the unregistered security can be readily resold or on an issuer’s ability to honor a demand for repayment. However, the fact that there are contractual or legal restrictions on resale of such investments to the general public or to certain institutions may not be indicative of their liquidity.
Limitations on resale may have an adverse effect on the marketability of portfolio securities, and the Fund might be unable to dispose of restricted or other illiquid securities promptly or at reasonable prices and might thereby experience difficulty satisfying redemptions within seven calendar days. In addition, the Fund may get only limited information about an issuer, so it may be less able to predict a loss. The Fund also might have to register such restricted securities in order to dispose of them resulting in additional expense and delay. Adverse market conditions could impede such a public offering of securities. In recognition of the increased size and liquidity of the institutional market for unregistered securities and the importance of institutional investors in the formation of capital, the SEC adopted Rule 144A under the Securities Act. Rule 144A is designed to facilitate efficient trading among institutional investors by permitting the sale of certain unregistered securities to qualified institutional buyers. To the extent privately placed securities held by the Fund qualify under Rule 144A and an institutional market develops for those securities, the Fund likely will be able to dispose of the securities without registering them under the Securities Act. To the extent that institutional buyers become, for a time, uninterested in purchasing these securities, investing in Rule 144A securities could increase the level of the Fund’s illiquidity. The Manager or the sub-advisor, as applicable, may determine that certain securities qualified for trading under Rule 144A are liquid. Regulation S under the Securities Act permits the sale abroad of securities that are not registered for sale in the United States and includes a provision for U.S. investors, such as the Fund, to purchase such unregistered securities if certain conditions are met.
Securities sold in private placement offerings made in reliance on the “private placement” exemption from registration afforded by Section 4(a)(2) of the Securities Act and resold to qualified institutional buyers under Rule 144A under the Securities Act (“Section 4(a)(2) securities”) are restricted as to disposition under the federal securities laws, and generally are sold to institutional investors, such as the Fund, that agree they are purchasing the securities for investment and not with an intention to distribute to the public. Any resale by the purchaser must be pursuant to an exempt transaction and may be accomplished in accordance with Rule 144A. Section 4(a)(2) securities normally are resold to other institutional investors through or with the assistance of the issuer or dealers that make a market in the Section 4(a)(2) securities, thus providing liquidity. Restricted securities outstanding during the year ended June 30, 2020 are disclosed in the Notes to the Schedules of Investments.
Mortgage-Related and Other Asset-Backed Securities
The TwentyFour Short Term Bond Fund and TwentyFour Strategic Income Funds may invest in mortgage or other ABS. These securities may include mortgage instruments issued by U.S. government agencies (“agency mortgages”) or those issued by private entities (“non-agency mortgages”). Specific types of instruments may include mortgage pass-through securities, collateralized mortgage obligations (“CMOs”), commercial mortgage-backed securities, mortgage dollar rolls, CMO residuals, stripped mortgage-backed securities and other securities
59
American Beacon FundsSM
Notes to Financial Statements
June 30, 2020
that directly or indirectly represent a participation in, or are secured by a payable from, mortgage loans on real property. The value of the Funds’ MBS may be affected by, among other things, changes or perceived changes in interest rates, factors concerning the interests in and structure of the issuer or the originator of the mortgage, or the quality of the underlying assets. The mortgages underlying the securities may default or decline in quality or value. Through its investments in MBS, a Fund has exposure to subprime loans, Alt-A loans and non-conforming loans as well as to the mortgage and credit markets generally. Underlying collateral related to subprime, Alt-A and non-conforming mortgage loans has become increasingly susceptible to defaults and declines in quality or value, especially in a declining residential real estate market. In addition, regulatory or tax changes may adversely affect the mortgage securities markets as a whole.
Other Investment Company Securities and Other Exchange-Traded Products
The Funds may invest in shares of other investment companies, including open-end funds, closed-end funds, business development companies (“BDCs”), ETFs, unit investment trusts, and other investment companies of the Trust. The Funds may invest in securities of an investment company advised by the Manager or a sub-advisor. Investments in the securities of other investment companies may involve duplication of advisory fees and certain other expenses. By investing in another investment company, the Funds become a shareholder of that investment company. As a result, the Funds’ shareholders indirectly will bear the Funds’ proportionate share of the fees and expenses paid by shareholders of the other investment company, in addition to the fees and expenses the Funds’ shareholders directly bear in connection with the Funds’ own operations. These other fees and expenses are reflected as Acquired Fund Fees and Expenses and are included in the Fees and Expenses Table for the Funds in their Prospectus, if applicable. Investments in other investment companies may involve the payment of substantial premiums above the value of such issuer’s portfolio securities.
Payment-In-Kind Securities
The Funds may invest in payment-in-kind securities (“PIKs”). PIKs give the issuer the option at each interest payment date of making interest payments in either cash or additional debt securities. Those additional debt securities usually have the same terms, including maturity dates and interest rates, and associated risks as the original bonds. The daily market quotations of the original bonds may include the accrued interest (referred to as a dirty price) and require a pro-rata adjustment from the “Unrealized appreciation (depreciation) of investments” to “Dividend and interest receivable” in the Statements of Assets and Liabilities.
Short Sales
The SSI Alternative Income Fund may enter into short sale transactions. A short sale is a transaction in which a Fund sells a security it does not own in anticipation of a decline in the market price of the security. Securities sold in short sale transactions and the dividends and interest payable on such securities, if any, are reflected as a liability. The Fund is obligated to deliver the security at the market price at the time the short position is closed. The risk of loss on a short sale transaction is theoretically unlimited, because there is no limit to the cost of replacing the security sold short, whereas losses from purchase transactions cannot exceed the total amount invested. As of June 30, 2020, short positions were held by the Fund and are disclosed in the Schedule of Investments. For the same period herein, securities pledged as collateral for short sales are disclosed in the Fund’s Schedule of Investments, and cash collateral for short sales are reflected as “Cash with brokers” on the Statements of Assets and Liabilities.
5. Financial Derivative Instruments
The Funds may utilize derivative instruments to enhance return, hedge risk, gain efficient exposure to an asset class or to manage liquidity. When considering the Funds’ use of derivatives, it is important to note that the Funds do not use derivatives for the purpose of creating financial leverage.
60
American Beacon FundsSM
Notes to Financial Statements
June 30, 2020
Options Contracts
The Funds may write (1) call and put options on futures, swaps (“swaptions”), securities, commodities or currencies it owns or in which it may invest and (2) inflation-capped options. Writing put options tends to increase the Funds’ exposure to unfavorable movements of the underlying instrument in exchange for an upfront premium. Writing call options tends to decrease the Funds’ exposure to favorable movements of the underlying instrument in exchange for an upfront premium. When the Funds writes a call, put, or inflation-capped option, an amount equal to the premium received is recorded as a liability and subsequently marked to market to reflect the current value of the option written. The purpose of inflation-capped options is to protect the buyer from inflation erosion above a certain rate on a given notional exposure. A floor can be used to give downside protection to investments in inflation-linked products. These liabilities are reflected as written options outstanding on the Statement of Assets and Liabilities. Certain options may be written with premiums to be determined on a future date. Premiums received from writing options which expire are treated as realized gains. Premiums received from writing options which are exercised or closed are added to the proceeds or offset against amounts paid on the underlying futures, swap, security or currency transaction to determine the realized gain or loss when the underlying transaction is sold. The Funds, as a writer of an option has no control over whether the underlying instrument may be sold (call) or purchased (put) and as a result bears the market risk of an unfavorable change in the price of the instrument underlying the written option. There is the risk the Funds may not be able to enter into a closing transaction because of an illiquid market.
The Funds may also purchase put and call options. Purchasing call options tends to increase the Funds’ exposure to favorable movements of the underlying instrument in exchange for paying an upfront premium. Purchasing put options tends to decrease the Funds’ exposure to unfavorable movements of the underlying instrument. The Funds pay a premium which is included on the Funds’ Statements of Assets and Liabilities as an investment and subsequently marked to market to reflect the current value of the option. Premiums paid for purchasing options which expire are treated as realized losses. Certain options may be purchased with premiums to be determined on a future date. The premiums for these options are based upon implied volatility parameters at specified terms. The risk associated with purchasing put and call options is limited to the premium paid. Premiums paid for purchasing options which are exercised or closed are added to the amounts paid or offset against the proceeds on the underlying investment transaction to determine the realized gain or loss when the underlying transaction is sold.
During the year ended June 30, 2020, the SSI Alternative Income Fund purchased/sold options primarily for hedging.
Average Option Notional Amounts Outstanding | ||||||||||||
Fund | Purchased Contracts | Written Contracts | ||||||||||
SSI Alternative Income | $ | - | $ | 82,525 | ||||||||
Straddle Options
The Funds may enter into differing forms of straddle options. A straddle is an investment strategy that uses combinations of options that allow a Fund to profit based on the future price movements of the underlying security, regardless of the direction of those movements. A written straddle involves simultaneously writing a call option and a put option on the same security with the same strike price and expiration date. The written straddle increases in value when the underlying security price has little volatility before the expiration date. A purchased straddle involves simultaneously purchasing a call option and a put option on the same security with the same strike price and expiration date. The purchased straddle increases in value when the underlying security price has high volatility, regardless of direction, before the expiration date.
61
American Beacon FundsSM
Notes to Financial Statements
June 30, 2020
Forward Foreign Currency Contracts
The Funds may enter into forward foreign currency contracts to hedge the exchange rate risk on investment transactions or to hedge the value of the Funds’ securities denominated in foreign currencies. Forward foreign currency contracts are valued at the forward exchange rate prevailing on the day of valuation. The Funds may also use currency contracts to increase exposure to a foreign currency or to shift exposure to foreign currency fluctuations from one country to another. The Funds bear the market risk that arises from changes in foreign exchange rates, and accordingly, the unrealized gain (loss) on these contracts is reflected in the accompanying financial statements. The Funds also bear the credit risk if the counterparty fails to perform under the contract.
During the year ended June 30, 2020, the TwentyFour Short Term Bond Fund and TwentyFour Strategic Income Funds entered into forward foreign currency contracts primarily for return enhancement and hedging.
The Funds’ forward foreign currency contract notional dollar values outstanding fluctuate throughout the operating year as required to meet strategic requirements. The following table illustrates the average quarterly volume of forward foreign currency contracts. For the purpose of this disclosure, volume is measured by the amounts bought and sold in USD at each quarter end.
Average Forward Foreign Currency Notional Amounts Outstanding | ||||||||||||
Fund | Purchased Contracts | Sold Contracts | ||||||||||
TwentyFour Short Term Bond Fund | $ | 201,394 | $ | 8,851,412 | ||||||||
TwentyFour Strategic Income | 5,901,290 | 54,315,220 | ||||||||||
The following is a summary of the fair valuations of the Funds’ derivative instruments categorized by risk exposure(1):
SSI Alternative Income Fund
| Fair values of financial instruments on the Statements of Assets and Liabilities as of June 30, 2020: |
| ||||||||||||||||||||||||||||||||||||||||||||||||||||||
| Derivatives not accounted for as hedging instruments | |||||||||||||||||||||||||||||||||||||||||||||||||||||||
Liabilities: | Credit contracts | Foreign exchange contracts | Commodity contracts | Interest rate contracts | Equity contracts | Total | |||||||||||||||||||||||||||||||||||||||||||||||||
| Written options and contracts outstanding | $ | – | $ | – | $ | – | $ | – | $ | (407,839 | ) | $ | (407,839 | ) | |||||||||||||||||||||||||||||||||||||||||
| The effect of financial derivative instruments on the Statements of Operations as of June 30, 2020: |
| ||||||||||||||||||||||||||||||||||||||||||||||||||||||
| Derivatives not accounted for as hedging instruments | |||||||||||||||||||||||||||||||||||||||||||||||||||||||
Realized gain (loss) from derivatives | Credit contracts | Foreign exchange contracts | Commodity contracts | Interest rate contracts | Equity contracts | Total | |||||||||||||||||||||||||||||||||||||||||||||||||
| Written options contracts | $ | – | $ | – | $ | – | $ | – | $ | 1,759,192 | $ | 1,759,192 | |||||||||||||||||||||||||||||||||||||||||||
Net change in unrealized appreciation | Credit contracts | Foreign exchange contracts | Commodity contracts | Interest rate contracts | Equity contracts | Total | |||||||||||||||||||||||||||||||||||||||||||||||||
| Written options contracts | $ | – | $ | – | $ | – | $ | – | $ | 55,188 | $ | 55,188 | |||||||||||||||||||||||||||||||||||||||||||
62
American Beacon FundsSM
Notes to Financial Statements
June 30, 2020
TwentyFour Short Term Bond Fund
| Fair values of financial instruments on the Statements of Assets and Liabilities as of June 30, 2020: |
| ||||||||||||||||||||||||||||||||||||||||||||||||||||||
| Derivatives not accounted for as hedging instruments | |||||||||||||||||||||||||||||||||||||||||||||||||||||||
Assets: | Credit contracts | Foreign exchange contracts | Commodity contracts | Interest rate contracts | Equity contracts | Total | |||||||||||||||||||||||||||||||||||||||||||||||||
| Unrealized appreciation of forward foreign currency contracts | $ | – | $ | 194,261 | $ | – | $ | – | $ | – | $ | 194,261 | |||||||||||||||||||||||||||||||||||||||||||
Liabilities: | Credit contracts | Foreign exchange contracts | Commodity contracts | Interest rate contracts | Equity contracts | Total | |||||||||||||||||||||||||||||||||||||||||||||||||
| Unrealized depreciation of forward foreign currency contracts | $ | – | $ | (2,251 | ) | $ | – | $ | – | $ | – | $ | (2,251 | ) | |||||||||||||||||||||||||||||||||||||||||
| The effect of financial derivative instruments on the Statements of Operations as of June 30, 2020: |
| ||||||||||||||||||||||||||||||||||||||||||||||||||||||
| Derivatives not accounted for as hedging instruments | |||||||||||||||||||||||||||||||||||||||||||||||||||||||
Realized gain (loss) from derivatives | Credit contracts | Foreign exchange contracts | Commodity contracts | Interest rate contracts | Equity contracts | Total | |||||||||||||||||||||||||||||||||||||||||||||||||
| Forward foreign currency contracts | $ | – | $ | (174,114 | ) | $ | – | $ | – | $ | – | $ | (174,114 | ) | |||||||||||||||||||||||||||||||||||||||||
Net change in unrealized appreciation | Credit contracts | Foreign exchange contracts | Commodity contracts | Interest rate contracts | Equity contracts | Total | |||||||||||||||||||||||||||||||||||||||||||||||||
| Forward foreign currency contracts | $ | – | $ | 192,010 | $ | – | $ | – | $ | – | $ | 192,010 | |||||||||||||||||||||||||||||||||||||||||||
TwentyFour Strategic Income Fund
| Fair values of financial instruments on the Statements of Assets and Liabilities as of June 30, 2020: |
| ||||||||||||||||||||||||||||||||||||||||||||||||||||||
| Derivatives not accounted for as hedging instruments | |||||||||||||||||||||||||||||||||||||||||||||||||||||||
Assets: | Credit contracts | Foreign exchange contracts | Commodity contracts | Interest rate contracts | Equity contracts | Total | |||||||||||||||||||||||||||||||||||||||||||||||||
| Unrealized appreciation of forward foreign currency contracts | $ | – | $ | 816,315 | $ | – | $ | – | $ | – | $ | 816,315 | |||||||||||||||||||||||||||||||||||||||||||
Liabilities: | Credit contracts | Foreign exchange contracts | Commodity contracts | Interest rate contracts | Equity contracts | Total | |||||||||||||||||||||||||||||||||||||||||||||||||
| Unrealized depreciation of forward foreign currency contracts | $ | – | $ | (39,982 | ) | $ | – | $ | – | $ | – | $ | (39,982 | ) | |||||||||||||||||||||||||||||||||||||||||
| The effect of financial derivative instruments on the Statements of Operations as of June 30, 2020: |
| ||||||||||||||||||||||||||||||||||||||||||||||||||||||
| Derivatives not accounted for as hedging instruments | |||||||||||||||||||||||||||||||||||||||||||||||||||||||
Realized gain (loss) from derivatives | Credit contracts | Foreign exchange contracts | Commodity contracts | Interest rate contracts | Equity contracts | Total | |||||||||||||||||||||||||||||||||||||||||||||||||
| Forward foreign currency contracts | $ | – | $ | 578,441 | $ | – | $ | – | $ | – | $ | 578,441 | |||||||||||||||||||||||||||||||||||||||||||
Net change in unrealized appreciation | Credit contracts | Foreign exchange contracts | Commodity contracts | Interest rate contracts | Equity contracts | Total | |||||||||||||||||||||||||||||||||||||||||||||||||
| Forward foreign currency contracts | $ | – | $ | 1,199,998 | $ | – | $ | – | $ | – | $ | 1,199,998 | |||||||||||||||||||||||||||||||||||||||||||
(1) See Note 3 in the Notes to Financial Statements for additional information.
63
American Beacon FundsSM
Notes to Financial Statements
June 30, 2020
Master Agreements
Master Securities Forward Transaction Agreements (“Master Forward Agreements”) govern the considerations and factors surrounding the settlement of certain forward settling transactions, such as delayed delivery or sale-buyback financing transactions by and between a Fund and select counterparties. The Master Forward Agreements maintain provisions for, among other things, initiation and confirmation, payment and transfer, events of default, termination, and maintenance of collateral.
Offsetting Assets and Liabilities
The Funds are parties to enforceable master netting agreements between brokers and counterparties which provide for the right to offset under certain circumstances. The Funds employ multiple money managers and counterparties and have elected not to offset qualifying financial and derivative instruments on the Statements of Assets and Liabilities, as such all financial and derivative instruments are presented on a gross basis. The impacts of netting arrangements that provide the right to offset are detailed below. The net amount represents the net receivable or payable that would be due from or to the counterparty in the event of default. Exposure from borrowings and other financing agreements such as repurchase agreements can only be netted across transactions governed by the same Master Agreement with the same legal entity. All amounts reported below represent the balance as of the report date, June 30, 2020.
SSI Alternative Income Fund
| Offsetting of Financial and Derivative Assets as of June 30, 2020: |
| |||||||||||
| Assets | Liabilities | |||||||||||
| Written Options Contracts | $ | - | $ | 407,839 | ||||||||
|
|
|
| |||||||||
| Total derivative assets and liabilities in the Statement of Assets and Liabilities | $ | - | $ | 407,839 | ||||||||
|
|
|
| |||||||||
| Derivatives not subject to a Master Netting Agreement or similar agreement (“MNA”) | $ | - | $ | (407,839 | ) | |||||||
|
|
|
| |||||||||
TwentyFour Short Term Bond Fund
| Offsetting of Financial and Derivative Assets as of June 30, 2020: |
| |||||||||||
| Assets | Liabilities | |||||||||||
| Forward Foreign Currency Contracts | $ | 194,261 | $ | 2,251 | ||||||||
|
|
|
| |||||||||
| Total derivative assets and liabilities in the Statement of Assets and Liabilities | $ | 194,261 | $ | 2,251 | ||||||||
|
|
|
| |||||||||
| Total derivative assets and liabilities subject to an MNA | $ | 194,261 | $ | 2,251 | ||||||||
|
|
|
| |||||||||
| Financial Assets, Derivatives, and Collateral Received/(Pledged) by Counterparty as of June 30, 2020: |
| |||||||||||||||||||||||||||||||||||
| Gross Amounts Not Offset in the Statement of Assets and Liabilities | ||||||||||||||||||||||||||||||||||||
Counterparty | Gross Amounts of Assets Presented in the Statement of Assets and Liabilities | Derivatives Available for Offset | Non-Cash Collateral Pledged | Cash Collateral Pledged | Net Amount | |||||||||||||||||||||||||||||||
| State Street Bank & Trust Co. | $ | 194,261 | $ | (2,251 | ) | $ | - | $ | - | $ | 192,010 | |||||||||||||||||||||||||
| Gross Amounts Not Offset in the Statement of Assets and Liabilities | ||||||||||||||||||||||||||||||||||||
Counterparty | Gross Amounts of Liabilities Presented in the Statement of Assets and Liabilities | Derivatives Available for Offset | Non-Cash Collateral Received | Cash Collateral Received | Net Amount | |||||||||||||||||||||||||||||||
| State Street Bank & Trust Co. | $ | 2,251 | $ | (2,251 | ) | $ | - | $ | - | $ | - | |||||||||||||||||||||||||
64
American Beacon FundsSM
Notes to Financial Statements
June 30, 2020
TwentyFour Strategic Income Fund
| Offsetting of Financial and Derivative Assets as of June 30, 2020: |
| |||||||||||
| Assets | Liabilities | |||||||||||
| Forward Foreign Currency Contracts | $ | 816,315 | $ | 39,982 | ||||||||
|
|
|
| |||||||||
| Total derivative assets and liabilities in the Statement of Assets and Liabilities | $ | 816,315 | $ | 39,982 | ||||||||
|
|
|
| |||||||||
| Total derivative assets and liabilities subject to an MNA | $ | 816,315 | $ | 39,982 | ||||||||
|
|
|
| |||||||||
| Financial Assets, Derivatives, and Collateral Received/(Pledged) by Counterparty as of June 30, 2020: |
| |||||||||||||||||||||||||||||||||||
| Gross Amounts Not Offset in the Statement of Assets and Liabilities | ||||||||||||||||||||||||||||||||||||
Counterparty | Gross Amounts of Assets Presented in the Statement of Assets and Liabilities | Derivatives Available for Offset | Non-Cash Collateral Pledged | Cash Collateral Pledged | Net Amount | |||||||||||||||||||||||||||||||
| State Street Bank & Trust Co. | $ | 816,315 | $ | (39,982 | ) | $ | - | $ | - | $ | 776,333 | |||||||||||||||||||||||||
| Gross Amounts Not Offset in the Statement of Assets and Liabilities | ||||||||||||||||||||||||||||||||||||
Counterparty | Gross Amounts of Liabilities Presented in the Statement of Assets and Liabilities | Derivatives Available for Offset | Non-Cash Collateral Received | Cash Collateral Received | Net Amount | |||||||||||||||||||||||||||||||
| State Street Bank & Trust Co. | $ | 39,982 | $ | (39,982 | ) | $ | - | $ | - | $ | - | |||||||||||||||||||||||||
6. Principal Risks
Investing in the Funds may involve certain risks including, but not limited to, those described below.
Asset-Backed and Mortgage Related Securities Risk
Investments in asset-backed and mortgage related securities are subject to market risks for fixed-income securities which include, but are not limited to, interest rate risk, prepayment risk and extension risk. Small movements in interest rates (both increases and decreases) may quickly and significantly reduce the value of certain MBS and ABS securities. If interest rates fall, the rate of prepayments tends to increase as borrowers are motivated to pay off debt and refinance at new lower rates. When mortgages and other obligations are prepaid and when securities are called, a Fund may have to reinvest in securities with a lower yield or fail to recover additional amounts (i.e., premiums) paid for securities with higher interest rates, resulting in an unexpected capital loss and/or a decrease in the amount of dividends and yield. Because prepayments increase when interest rates fall, the prices of MBS and ABS do not increase as much as other fixed income securities when interest rates fall. When interest rates rise, borrowers are less likely to prepay their mortgage and other loans. A decreased rate of prepayments lengthens the expected maturity of MBS and ABS. Therefore, the prices of MBS and ABS may decrease more than prices of other fixed-income securities when interest rates rise. Rising interest rates tend to extend the duration of these securities, making them more sensitive to changes in interest rates. Rising interest rates also may increase the risk of default by borrowers. As a result, in a period of rising interest rates, a Fund that holds these types of securities, may experience additional volatility and losses. A decline in the credit quality of and defaults by the issuers of asset-backed and mortgage related securities or instability in the markets for such securities may affect the value and liquidity of such securities, which could result in losses to a Fund. In addition, certain asset-backed and mortgage related securities may include securities backed by pools of loans made to “subprime” borrowers or borrowers with blemished credit histories; the risk of defaults is generally higher in the case of mortgage pools that include such subprime mortgages.
Callable Securities Risk
The SSI Alternative Income Fund may invest in fixed-income securities with call features. A call feature allows the issuer of the security to redeem or call the security prior to its stated maturity date. In periods of falling interest rates, issuers may be more likely to call in securities that are paying higher coupon rates than prevailing
65
American Beacon FundsSM
Notes to Financial Statements
June 30, 2020
interest rates. In the event of a call, the Fund would lose the income that would have been earned to maturity on that security, and the proceeds received by the Fund may be invested in securities paying lower coupon rates. Thus, the Fund’s income could be reduced as a result of a call. In addition, the market value of a callable security may decrease if it is perceived by the market as likely to be called, which could have a negative impact on the Fund’s total return.
Convertible Securities Risk
The value of a convertible security typically increases or decreases with the price of the underlying common stock. In general, a convertible security is subject to the risks of stocks, and its price may be as volatile as that of the underlying stock, when the underlying stock’s price is high relative to the conversion price and a convertible security is subject to the risks of debt securities, and is particularly sensitive to changes in interest rates, when the underlying stock’s price is low relative to the conversion price. Convertible securities generally have less potential for gain or loss than common stocks. Securities that are convertible other than at the option of the holder generally do not limit the potential for loss to the same extent as securities that are convertible at the option of the holder. Many convertible securities have credit ratings that are below investment grade and are subject to the same risks as an investment in lower-rated debt securities. The credit rating of a company’s convertible securities is generally lower than that of its non-convertible debt securities. Convertible securities are normally considered “junior” securities — that is, the company usually must pay interest on its non-convertible debt securities before it can make payments on its convertible securities. If the issuer stops paying interest or principal, convertible securities may become worthless and the Fund could lose its entire investment. In addition, because companies that issue convertible securities may be small- or mid-cap companies, to the extent the Fund invests in convertible securities issued by small- or mid-cap companies, it will be subject to the risks of investing in such companies.
Counterparty Risk
The Funds are subject to the risk that a party or participant to a transaction, such as a broker or derivative counterparty, will be unwilling or unable to satisfy its obligation to make timely principal, interest or settlement payments or to otherwise honor its obligations to the Funds. As a result the Fund may obtain no recovery of its investment or may only obtain a limited recovery, and any recovery may be delayed. Not all derivative transactions require a counterparty to post collateral, which may expose the Fund to greater losses in the event of a default by a counterparty.
Some of the markets in which the Funds may effect derivative transactions are OTC or “interdealer” markets. The participants in such markets are typically not subject to credit evaluation and regulatory oversight to the same extent as are members of “exchange-based” markets. This exposes the Funds to the risk that a counterparty will not settle a transaction in accordance with its terms and conditions because of a credit or liquidity problem with the counterparty and the recent turbulence in the financial markets highlights the importance of being aware of counterparty risk resulting from OTC derivative transactions. The Funds are subject to the risk that a party or participant to a transaction, such as a broker or derivative counterparty, will be unwilling or unable to satisfy its obligation to make timely principal, interest or settlement payments or to otherwise honor its obligations to the Funds. As a result, the Funds may obtain no recovery of its investment or may only obtain a limited recovery, and any recovery may be delayed. Not all derivative transactions require a counterparty to post collateral, which may expose the Funds to greater losses in the event of a default by a counterparty.
Credit Risk
The Funds are subject to the risk that the issuer or guarantor of a debt security, or the counterparty to a derivatives contract or a loan, may fail, or become less able, to make timely payment of interest or principal or otherwise honor its obligations or default completely. A decline in the credit rating of an individual security held by the Funds may have an adverse impact on its price and may make it difficult for the Fund to sell it. Ratings
66
American Beacon FundsSM
Notes to Financial Statements
June 30, 2020
represent a rating agency’s opinion regarding the quality of the security and are not a guarantee of quality. Rating agencies might not always change their credit rating on an issuer or security in a timely manner to reflect events that could affect the issuer’s ability to make timely payments on its obligations. Credit risk is typically greater for securities with ratings that are below investment grade (commonly referred to as “junk bonds”). Changes in the actual or perceived creditworthiness of an issuer, or a downgrade or default affecting any of the Funds’ securities, could affect the Funds’ performance.
Currency Risk
The Funds may have exposure to foreign currencies by making direct investments in non-U.S. currencies or in securities denominated in non-U.S. currencies, or by purchasing or selling forward currency exchange contracts in non-U.S. currencies. Foreign currencies may decline in value relative to the U.S. dollar, or, in the case of hedging positions, the U.S. dollar may decline in value relative to the currency being hedged, and thereby affect a Fund’s investments in foreign (non-U.S.) currencies or in securities that trade in, and receive revenues in, or in derivatives that provide exposure to, foreign (non-U.S.) currencies. Currency exchange rates may fluctuate significantly over short periods of time for a number of reasons, including changes in interest rates, intervention (or the failure to intervene) by U.S. or foreign governments, central banks or supranational entities such as the International Monetary Fund, or by the imposition of currency controls or other political developments in the United States or abroad. As a result, the Funds’ investments in foreign currency denominated securities may reduce the returns of the Funds. Currency futures, forwards, options or swaps may not always work as intended, and in specific cases, the Funds may be worse off than if it had not used such instrument(s). There may not always be suitable hedging instruments available. Even where suitable hedging instruments are available, the Funds may choose to not hedge its currency risks.
Derivatives Risk
Derivatives may involve significant risk. The use of derivative instruments may expose the Funds to additional risks that they would not be subject to if they invested directly in the securities or other instruments underlying those derivatives, including the high degree of leverage often embedded in such instruments, and potential material and prolonged deviations between the theoretical value and realizable value of a derivative. Some derivatives have the potential for unlimited loss, regardless of the size of the Funds’ initial investment. Derivatives may be illiquid and may be more volatile than other types of investments. The Funds may buy or sell derivatives not traded on an exchange and which may be subject to heightened liquidity and valuation risk. Derivative investments can increase portfolio turnover and transaction costs. Derivatives also are subject to counterparty risk and credit risk. As a result, the Funds may obtain no recovery of their investment or may only obtain a limited recovery, and any recovery may be delayed. Not all derivative transactions require a counterparty to post collateral, which may expose the Funds to greater losses in the event of a default by a counterparty.
Foreign Investing and Emerging Markets Risk
Non-U.S. investments carry potential risks not associated with U.S. investments. Such risks include, but are not limited to: (1) currency exchange rate fluctuations, (2) political and financial instability, (3) less liquidity, (4) lack of uniform accounting, auditing and financial reporting standards, (5) increased price volatility, (6) less government regulation and supervision of foreign stock exchanges, brokers and listed companies, and (7) delays in transaction settlement in some foreign markets. To the extent the Funds invests a significant portion of its assets in securities of a single country or region, it is more likely to be affected by events or conditions of that country or region. In addition, the economies and political environments of emerging market countries tend to be more unstable than those of developed countries, resulting in more volatile rates of return than the developed markets and substantially greater risk to investors. There may be very limited oversight of certain foreign banks or securities depositories that hold foreign securities and currency and the laws of certain countries may limit the ability to recover such assets if a foreign bank or depository or their agents goes bankrupt. When investing in emerging markets, the risks of investing in foreign securities are heightened. Emerging markets have unique risks
67
American Beacon FundsSM
Notes to Financial Statements
June 30, 2020
that are greater than, or in addition to, investing in developed markets because emerging markets are generally smaller, less developed, less liquid and more volatile than the securities markets of the U.S. and other developed markets. There are also risks of: greater political uncertainties; an economy’s dependence on revenues from particular commodities or on international aid or development assistance; currency transfer restrictions; a limited number of potential buyers for such securities, resulting in increased volatility and limited liquidity for emerging market securities; trading suspensions; and delays and disruptions in securities settlement procedures. In addition, there may be less information available to make investment decisions and more volatile rates of return.
Forward Foreign Currency Contracts Risk
Forward foreign currency contracts, including non-deliverable forwards, are derivative instruments pursuant to a contract with a counterparty to pay a fixed price for an agreed amount of securities or other underlying assets at an agreed date or to buy or sell a specific currency at a future date at a price set at the time of the contract. The use of forward foreign currency contracts may expose the Funds to additional risks that it would not be subject to if it invested directly in the securities or currencies underlying the forward foreign currency contract.
High Portfolio Turnover Risk
Portfolio turnover is a measure of the Fund’s trading activity over a one-year period. A portfolio turnover rate of 100% would indicate that the Fund sold and replaced the entire value of its securities holdings during the period. High portfolio turnover could increase the Fund’s transaction costs because of increased broker commissions resulting from such transactions. These costs are not reflected in the Fund’s annual operating expenses or in the expense example, but they can have a negative impact on performance. Frequent trading by the Fund could also result in increased realized net capital gains, distributions of which are taxable to the Fund’s shareholders (including net short-term capital gain distributions, which are taxable to them as ordinary income).
High-Yield Bond Risk
Lower-rated securities are subject to certain risks that may not be present with investments in higher-grade securities. Investors should consider carefully their ability to assume the risks associated with lower-rated securities before investing in the Fund. The lower rating of certain high yielding corporate income securities reflects a greater possibility that the financial condition of the issuer or adverse changes in general economic conditions may impair the ability of the issuer to pay income and principal. Changes by rating agencies in their ratings of a fixed income security also may affect the value of these investments. However, allocating investments in the Fund among securities of different issuers should reduce the risks of owning any such securities separately. The prices of these high yielding securities tend to be less sensitive to interest rate changes than higher-rated investments, but more sensitive to adverse economic changes or individual corporate developments. During economic downturns or periods of rising interest rates, highly leveraged issuers may experience financial stress that adversely affects their ability to service principal and interest payment obligations, to meet projected business goals or to obtain additional financing, and the markets for their securities may be more volatile. If an issuer defaults, the Fund may incur additional expenses to seek recovery. Additionally, accruals of interest income for the Fund may have to be adjusted in the event of default. In the event of an issuer’s default, the Fund may write off prior income accruals for that issuer, resulting in a reduction in the Fund’s current dividend payment. Frequently, the higher yields of high-yielding securities may not reflect the value of the income stream that holders of such securities may expect, but rather the risk that such securities may lose a substantial portion of their value as a result of their issuer’s financial restructuring or default. Additionally, an economic downturn or an increase in interest rates could have a negative effect on the high-yield securities market and on the market value of the high-yield securities held by the Fund, as well as on the ability of the issuers of such securities to repay principal and interest on their borrowings.
68
American Beacon FundsSM
Notes to Financial Statements
June 30, 2020
Interest Rate Risk
Investments in fixed-income securities or derivatives that are influenced by interest rates are subject to interest rate risk. The value of the Funds’ fixed-income investments typically will fall when interest rates rise. The Funds may be particularly sensitive to changes in interest rates if it invests in debt securities with intermediate and long terms to maturity. Debt securities with longer durations tend to be more sensitive to changes in interest rates, usually making them more volatile than debt securities with shorter durations. For example, if a bond has a duration of four years, a 1% increase in interest rates could be expected to result in a 4% decrease in the value of the bond. Yields of debt securities will fluctuate over time. Following the financial crisis that started in 2008, the Federal Reserve has attempted to stabilize the economy and support the economic recovery by keeping the federal funds rate (the interest rate at which depository institutions lend reserve balances to each other overnight) at or near zero percent. The Federal Reserve has raised the federal funds rate several times since December 2015 and may continue to increase or decrease rates in the future. Interest rates may rise significantly and/or rapidly, potentially resulting in substantial losses to the Funds. During periods of very low or negative interest rates, the Funds may be unable to maintain positive returns. Certain European countries and Japan have recently experienced negative interest rates on deposits and debt securities have traded at negative yields. Negative interest rates may become more prevalent among non-U.S. issuers, and potentially within the United States. Changing interest rates, including rates that fall below zero, may have unpredictable effects on markets, may result in heightened market volatility and may detract from Fund performance to the extent the Funds are exposed to such interest rates.
LIBOR Risk
Certain of the instruments identified in a Fund’s principal investment strategies have variable or floating coupon rates that are based on LIBOR, Euro Interbank Offered Rate and other similar types of reference rates (each, a “Reference Rate”). In June 2017, the Alternative Reference Rates Committee, a group of large U.S. banks working with the Federal Reserve, announced its selection of a new SOFR, which is intended to be a broad measure of overnight U.S. Treasury repurchase agreement rates, as an appropriate replacement for U.S. dollar LIBOR. The Federal Reserve Bank of New York began publishing the SOFR in 2018, with the expectation that it could be used on a voluntary basis in new instruments and transactions. Bank working groups and regulators in other countries have suggested other alternatives for their markets to replace sterling LIBOR. On July 27, 2017, the Chief Executive of the FCA, which regulates LIBOR, announced that the FCA will no longer persuade nor require banks to submit rates for the calculation of LIBOR and certain other Reference Rates after 2021. Such announcement indicates that the continuation of LIBOR and other Reference Rates on the current basis cannot and will not be guaranteed after 2021. This announcement and any additional regulatory or market changes may have an adverse impact on a Fund or its investments, including increased volatility or illiquidity in markets for instruments that rely on LIBOR.
In advance of 2021, regulators and market participants are working together to identify or develop successor Reference Rates. Additionally, prior to 2021, it is expected that market participants will focus on the transition mechanisms by which the Reference Rates in existing contracts or instruments may be amended, whether through marketwide protocols, fallback contractual provisions, bespoke negotiations or amendments or otherwise. Nonetheless, the termination of certain Reference Rates presents risks to a Fund. At this time, it is not possible to completely identify or predict the effect of any such changes, any establishment of alternative Reference Rates or any other reforms to Reference Rates that may be enacted in the UK or elsewhere. The elimination of a Reference Rate or any other changes or reforms to the determination or supervision of Reference Rates could have an adverse impact on the market for or value of any securities or payments linked to those Reference Rates and other financial obligations held by a Fund or on its overall financial condition or results of operations. In addition, any substitute Reference Rate and any pricing adjustments imposed by a regulator or by counterparties or otherwise may adversely affect the Fund’s performance and/or NAV.
69
American Beacon FundsSM
Notes to Financial Statements
June 30, 2020
Liquidity Risk
When there is little or no active trading market for a specific type of security, it can become more difficult to purchase or sell the securities at or near their perceived value. During such periods, certain investments held by the Funds may be difficult to sell or other investments may be difficult to purchase at favorable times or prices. As a result, the Funds may have to lower the price on certain securities that it is trying to sell, sell other securities instead or forgo an investment opportunity, any of which could have a negative effect on Fund management or performance. Redemptions by a few large investors in the Funds at such times may have a significant adverse effect on the Fund’s NAV per share and remaining Fund shareholders. In addition, the market-making capacity of dealers in certain types of securities has been reduced in recent years, in part as a result of structural and regulatory changes, such as fewer proprietary trading desks and increased regulatory capital requirements for broker-dealers. Further, many broker-dealers have reduced their inventory of certain debt securities. This could negatively affect the Fund’s ability to buy or sell debt securities and increase the related volatility and trading costs. The Fund may lose money if it is forced to sell certain investments at unfavorable prices to meet redemption requests or other cash needs.
Market Disruption Risk
Geopolitical and other events, including war, terrorism, economic uncertainty, trade disputes, pandemics, public health crises and related geopolitical events have led, and in the future may continue to lead, to instability in world economies and markets generally. This instability has disrupted, and may continue to disrupt, U.S. and world economies and markets and adversely affect the value of your investment. Events that have led to market disruptions include the recent pandemic spread of the novel coronavirus known as COVID-19, the duration and full effects of which are still uncertain. Market disruptions have caused, and may continue to cause, broad changes in market value, negative public perceptions concerning these developments, and adverse investor sentiment or publicity. Changes in value may be temporary or may last for extended periods.
Market Risk
Conditions in the U.S. and many foreign economies have resulted, and may continue to result, in certain instruments experiencing unusual liquidity issues, increased price volatility and, in some cases, credit downgrades and increased likelihood of default. These events have reduced the willingness and ability of some lenders to extend credit, and have made it more difficult for some borrowers to obtain financing on attractive terms, if at all. In some cases, traditional market participants have been less willing to make a market in some types of debt instruments, which has affected the liquidity of those instruments. During times of market turmoil, investors tend to look to the safety of securities issued or backed by the U.S. Treasury, causing the prices of these securities to rise and the yields to decline. Reduced liquidity in fixed income and credit markets may negatively affect many issuers worldwide. In addition, global economies and financial markets are becoming increasingly interconnected, which increases the possibilities that conditions in one country or region might adversely impact issuers in a different country or region. A rise in protectionist trade policies, and the possibility of changes to some international trade agreements, could affect the economies of many nations in ways that cannot necessarily be foreseen at the present time.
In response to the financial crisis, the U.S. and other governments and the Federal Reserve and certain foreign central banks have taken steps to support financial markets. In some countries where economic conditions are recovering, they are nevertheless perceived as still fragile. Withdrawal of government support, failure of efforts in response to the crisis, or investor perception that such efforts are not succeeding, could adversely impact the value and liquidity of certain securities. The severity or duration of adverse economic conditions may also be affected by policy changes made by governments or quasi-governmental organizations, including changes in tax laws. The impact of new financial regulation legislation on the markets and the practical implications for market participants may not be fully known for some time. Regulatory changes are causing some financial services companies to exit long-standing lines of business, resulting in dislocations for other market participants.
70
American Beacon FundsSM
Notes to Financial Statements
June 30, 2020
In addition, political and governmental events within the U.S. and abroad, such as the U.S. government’s inability at times to agree on a long-term budget and deficit reduction plan, the threat of a federal government shutdown and threats not to increase the federal government’s debt limit, may affect investor and consumer confidence and may adversely impact financial markets and the broader economy, perhaps suddenly and to a significant degree. The U.S. government has recently reduced the federal corporate income tax rates, and future legislative, regulatory and policy changes may result in more restrictions on international trade, less stringent prudential regulation of certain players in the financial markets, and significant new investments in infrastructure and national defense. Markets may react strongly to expectations about the changes in these policies, which could increase volatility, especially if the markets’ expectations for changes in government policies are not borne out.
Changes in market conditions will not have the same impact on all types of securities. Interest rates have been unusually low in recent years in the U.S. and abroad. Because there is little precedent for this situation, it is difficult to predict the impact of a significant rate increase on various markets. For example, because investors may buy securities or other investments with borrowed money, a significant increase in interest rates may cause a decline in the markets for those investments. Because of the sharp decline in the worldwide price of oil, there is a concern that oil producing nations may withdraw significant assets now held in U.S. Treasuries, which could force a substantial increase in interest rates. Regulators have expressed concern that rate increases may cause investors to sell fixed income securities faster than the market can absorb them, contributing to price volatility. In addition, there is a risk that the prices of goods and services in the U.S. and many foreign economies may decline over time, known as deflation (the opposite of inflation). Deflation may have an adverse effect on stock prices and creditworthiness and may make defaults on debt more likely. If a country’s economy slips into a deflationary pattern, it could last for a prolonged period and may be difficult to reverse.
The impact of the United Kingdom’s departure from the EU, which occurred on January 31, 2020, commonly known as Brexit, is not yet known. The effect on the United Kingdom’s economy will likely depend on the nature of trade relations with the EU and other major economies following its exit, which are matters to be negotiated. The outcomes may cause increased volatility and have a significant adverse impact on world financial markets, other international trade agreements, and the United Kingdom and European economies, as well as the broader global economy for some time, which could significantly adversely affect the value of a Fund’s investments in the United Kingdom and Europe.
Market Timing Risk
Because the Funds invest in foreign securities, it is particularly subject to the risk of market timing activities. Frequent trading by Fund shareholders poses risks to other shareholders in the Funds, including (i) the dilution of the Funds’ NAV, (ii) an increase in the Funds’ expenses, and (iii) interference with the portfolio manager’s ability to execute efficient investment strategies. Because of specific securities in which the Funds may invest, it could be subject to the risk of market timing activities by shareholders. Some examples of these types of securities are high-yield and foreign securities. The limited trading activity of some high-yield securities may result in market prices that do not reflect the true market value of these securities. The Funds generally prices foreign securities using their closing prices from the foreign markets in which they trade, typically prior to the Funds’ calculation of its NAV. These prices may be affected by events that occur after the close of a foreign market but before the Funds price its shares. In such instances, the Funds may fair value high yield and foreign securities. However, some investors may engage in frequent short-term trading in the Funds to take advantage of any price differentials that may be reflected in the NAV of the Funds’ shares. While the Manager monitors trading in the Funds, there is no guarantee that it can detect all market timing activities.
Other Investment Companies Risk
The Funds may invest in shares of other registered investment companies, including money market funds, ETFs and business development companies (“BDCs”). To the extent that the Funds invest in shares of other registered investment companies, the Funds will indirectly bear the fees and expenses, including for example, advisory and
71
American Beacon FundsSM
Notes to Financial Statements
June 30, 2020
administrative fees, charged by those investment companies in addition to the Funds’ direct fees and expenses and will be subject to the risks associated with investments in those companies. For example, the Funds’ investments in money market funds are subject to interest rate risk, credit risk, and market risk. The Funds must rely on the investment company in which it invests to achieve its investment objective. If the investment company fails to achieve its investment objective, the value of the Funds’ investment may decline, adversely affecting the Funds’ performance. ETFs are subject to the following risks that do not apply to conventional funds: (1) the market price of an ETF’s shares may trade at a discount or premium to its NAV; (2) an active trading market for an ETF’s shares may not develop or be maintained; or (3) trading of an ETF’s shares may be halted if the listing exchange’s officials deem such action appropriate, the shares are delisted from the exchange, or the activation of market-wide “circuit breakers” (which are tied to large decreases in stock prices) halts stock trading generally. An ETF that tracks an index may not precisely replicate the returns of its benchmark index. To the extent the Funds invest in other investment companies that invest in equity securities, fixed-income securities and/or foreign securities, or that track an index, the Funds are subject to the risks associated with the underlying investments held by the investment company or the index fluctuations to which the investment company is subject. ETFs have expenses associated with their operation, typically including advisory fees. BDCs generally invest in small developing companies, private companies, and thinly traded securities of public companies, and many debt instruments in which a BDC may invest may not be rated by a credit rating agency and may be below investment grade quality. The Funds’ investments in BDCs may be subject to certain additional risks, including competition for limited investment opportunities, the liquidity of a BDC’s investments, uncertainty as to the value of a BDC’s investments, risks associated with access to capital and leverage, and reliance on the management of a BDC.
Non-Diversification Risk
The Funds are non-diversified, which means the Funds may focus their investments in the securities of a comparatively small number of issuers. Investments in securities of a limited number of issuers exposes the Funds to greater market risk and potential losses than if assets were diversified among the securities of a greater number of issuers.
Illiquid and Restricted Securities Risk
Securities not registered in the U.S. under the Securities Act, including Rule 144A securities, are restricted as to their resale. Such securities may not be listed on an exchange and may have no active trading market. They may be more difficult to purchase or sell at an advantageous time or price because such securities may not be readily marketable in broad public markets. The Funds may not be able to sell a restricted security when the sub-advisor considers it desirable to do so and/or may have to sell the security at a lower price than the Funds believe is its fair market value. In addition, transaction costs may be higher for restricted securities and the Funds may receive only limited information regarding the issuer of a restricted security. The Funds may have to bear the expense of registering restricted securities for resale and the risk of substantial delays in effecting the registration.
Sector Risk
When the Fund focuses its investments in certain sectors of the economy, its performance may be driven largely by sector performance and could fluctuate more widely than if the Fund were invested more evenly across sectors. Individual sectors may be more volatile, and may perform differently, than the broader market. As the Fund’s portfolio changes over time, the Fund’s exposure to a particular sector may become higher or lower.
Short Position Risk
The SSI Alternative Income Fund’s short positions are subject to special risks. A short sale is effected by selling a security that the Fund does not own, or selling a security that the Fund owns but that it does not deliver upon consummation of the sale. In order to make delivery to the buyer of a security sold short, the Fund must borrow the security. In so doing, it incurs the obligation to replace that security, whatever its price may be, at the time it is
72
American Beacon FundsSM
Notes to Financial Statements
June 30, 2020
required to deliver it to the lender. The Fund must also pay to the lender of the security any dividends or interest payable on the security during the borrowing period and may have to pay a premium to borrow the security. This obligation must, unless the Fund then owns or has the right to obtain, without payment, securities identical to those sold short, be collateralized by a deposit of cash or marketable securities with the lender. Short selling is subject to a theoretically unlimited risk of loss because there is no limit on how much the price of a security may appreciate before the short position is closed out. There can be no assurance that the securities necessary to cover the short position will be available for purchase by the Fund. In addition, purchasing securities to close out the short position can itself cause the price of the relevant securities to rise further, thereby increasing any loss incurred by the Fund. Furthermore, the Fund may be forced to close out a short position prematurely if a counterparty from which the Fund borrowed securities demands their return, resulting in a loss on what might otherwise have been a profitable position. The Fund may also enter into a short position through a forward commitment or via an option, futures contract or swap agreement. If the price of the security or derivative has increased during the time the Fund holds the short position, then the Fund will incur a loss equal to the increase in price from the time that the short position was entered into plus any premiums and interest paid to the third party. Therefore, short positions involve the risk that losses may be exaggerated, potentially losing more money than the actual cost of the investment. The Fund’s losses are potentially unlimited in a short position because the price appreciation of the security that the Fund is required to purchase is unlimited. In addition, because the Fund may invest the proceeds of a short sale, the Fund may be subject to the effect of leverage, in that it amplifies changes in the Fund’s NAV since it increases the exposure of the Fund to the market. If such instruments are traded OTC, the Fund is subject to the risk that the counterparty may fail to honor its contract terms, causing a loss to the Fund.
Sovereign and Quasi Sovereign Debt Risk
An investment in sovereign and quasi-sovereign debt obligations involves special risks not present in corporate debt obligations. Sovereign and quasi-sovereign debt securities are issued or guaranteed by a sovereign government or entity affiliated with or backed by a sovereign government. The issuer of the sovereign or quasi-sovereign debt that controls the repayment of the debt may be unable or unwilling to repay principal or interest when due, and the Fund may have limited recourse in the event of a default. In addition, these investments are subject to risk of payment delays or defaults due to (1) country cash flow problems, (2) insufficient foreign currency reserves, (3) political considerations, (4) large debt positions relative to the country’s economy, (5) policies toward foreign lenders or investors, (6) the failure to implement economic reforms required by the International Monetary Fund or other multilateral agencies, or (7) an inability or unwillingness to repay debts. It may be particularly difficult to enforce the rights of debt holders in frontier and emerging markets. A governmental entity that defaults on an obligation may request additional time in which to pay or receive further loans or may seek to restructure its obligations to reduce interest rates or outstanding principal. There is no legal process for collecting sovereign and quasi-sovereign debt that a government does not pay nor are there bankruptcy proceedings through which all or part of the sovereign debt that a governmental entity has not repaid may be collected. Sovereign and quasi-sovereign debt risk is increased for emerging and frontier markets issuers, which are among the largest debtors to commercial banks and foreign governments. At times, certain emerging market countries have declared moratoria on the payment of principal and interest on external debt. Certain emerging market countries have experienced difficulty in servicing their sovereign debt on a timely basis, which has led to defaults and the restructuring of certain indebtedness.
U.S. Government Securities and Government-Sponsored Enterprises Risk
A security backed by the U.S. Treasury or the full faith and credit of the United States is guaranteed only as to the timely payment of interest and principal when held to maturity. The market prices for such securities are not guaranteed and will fluctuate. Additionally, circumstances could arise that would prevent the payment of interest or principal. This could result in losses to the Fund. Investments in government-sponsored enterprises are debt obligations issued by agencies and instrumentalities of the U.S. Government. These obligations vary in the level of support they receive from the U.S. Government. They may be: (i) supported by the full faith and credit of the U.S. Treasury, such as those of the Government National Mortgage Association (“Ginni Mae”); (ii) supported by
73
American Beacon FundsSM
Notes to Financial Statements
June 30, 2020
the right of the issuer to borrow from the U.S. Treasury, such as those of the Federal Home Loan Bank and the Federal Farm Credit Banks; (iii) supported by the discretionary authority of the U.S. Government to purchase the agency obligations, such as those of Fannie Mae and Freddie Mac or (iv) supported only by the credit of the issuer, such as those of the Federal Farm Credit Bureau. The U.S. Government may choose not to provide financial support to U.S. Government-sponsored agencies or instrumentalities if it is not legally obligated to do so, in which case, if the issuer defaulted, to the extent the Fund holds securities of such issuer, it might not be able to recover its investment from the U.S. Government.
Valuation Risk
This is the risk that a Fund has valued a security at a price different from the price at which it can be sold. This risk may be especially pronounced for investments, such as derivatives, which may be illiquid or which may become illiquid and for securities that trade in relatively thin markets and/or markets that experience extreme volatility. If market conditions make it difficult to value certain investments, a Fund may value these investments using more subjective methods, such as fair-value methodologies. Investors who purchase or redeem Fund shares on days when a Fund is holding fair-valued securities may receive fewer or more shares, or lower or higher redemption proceeds, than they would have received if the Fund had not fair-valued the securities or had used a different valuation methodology. The value of foreign securities, certain fixed-income securities and currencies, as applicable, may be materially affected by events after the close of the markets on which they are traded, but before a Fund determines its NAV. A Fund’s ability to value its investments in an accurate and timely manner may be impacted by technological issues and/or errors by third-party service providers, such as pricing services or accounting agents.
Variable and Floating Rate Securities Risk
The coupons on certain fixed income securities in which a Fund may invest are not fixed and may fluctuate based upon changes in market rates. The coupon on a floating rate security is generally based on an interest rate such as a money-market index, LIBOR or a Treasury bill rate. Such securities are subject to interest rate risk and may fluctuate in value in response to interest rate changes if there is a delay between changes in market interest rates and the interest reset date for the obligation, or for other reasons. As short-term interest rates decline, the coupons on variable and floating rate securities typically decrease. Alternatively, during periods of rising interest rates, changes in the coupons of variable and floating rate securities may lag behind changes in market rates or may have limits on the maximum increases in the coupon rates. The value of variable and floating rate securities may decline if their coupons do not rise as much, or as quickly, as interest rates in general. Conversely, variable and floating rate securities will not generally increase in value if interest rates decline. Variable and floating rate securities are less effective at locking in a particular yield and are subject to credit risk.
7. Federal Income and Excise Taxes
It is the policy of each Fund to qualify as a regulated investment company (“RIC”), by complying with all applicable provisions of Subchapter M of the Internal Revenue Code, as amended, and to make distributions of taxable income sufficient to relieve it from substantially all federal income and excise taxes. For federal income tax purposes, each Fund is treated as a single entity for the purpose of determining such qualification.
The Funds do not have any unrecorded tax liabilities in the accompanying financial statements. Each of the tax years in the four year period ended June 30, 2020 for SSI Alternative Income and TwentyFour Strategic Income and the tax year ended June 30, 2020 for TwentyFour Short Term Bond remain subject to examination by the Internal Revenue Service. If applicable, the Funds recognize interest accrued related to unrecognized tax benefits in interest expense and penalties in “Other expenses” on the Statements of Operations.
The Funds may be subject to taxes imposed by countries in which it invests. Such taxes are generally based on returns of income earned or gains realized or repatriated. Taxes are accrued and applied to net investment income, net realized capital gains and net unrealized appreciation (depreciation), as applicable, as the income is earned or capital gains are recorded.
74
American Beacon FundsSM
Notes to Financial Statements
June 30, 2020
Dividends are categorized in accordance with income tax regulations which may treat certain transactions differently than U.S. GAAP. Accordingly, the character of distributions and composition of net assets for tax purposes may differ from those reflected in the accompanying financial statements.
The tax character of distributions paid were as follows:
| SSI Alternative Income Fund | TwentyFour Short Term Bond Fund | TwentyFour Strategic Income Fund | ||||||||||||||||||||||||||||||||||||||||||
| Year Ended June 30, 2020 | Period Ended April 1, 2019 to June 30, 2019 |
| Year Ended March 31, 2019 | Period from February 18, 2020A to June 30, 2020 | Year Ended June 30, 2020 | Year Ended June 30, 2019 | ||||||||||||||||||||||||||||||||||||||
Distributions paid from: |
| |||||||||||||||||||||||||||||||||||||||||||
Ordinary income* |
| |||||||||||||||||||||||||||||||||||||||||||
R5 Class | $ | 3,660 | $ | – | $ | – | $ | – | $ | 310,611 | $ | 1,433,690 | ||||||||||||||||||||||||||||||||
Y Class | 6,924,234 | – | 5,245,637 | 703 | 2,103,651 | 1,660,225 | ||||||||||||||||||||||||||||||||||||||
Investor Class | 31,372 | – | 33,530 | – | 268,231 | 76,563 | ||||||||||||||||||||||||||||||||||||||
A Class | – | – | – | 885 | 213,981 | 135,761 | ||||||||||||||||||||||||||||||||||||||
C Class | – | – | – | 1,265 | 64,645 | 45,304 | ||||||||||||||||||||||||||||||||||||||
Ultra Class | – | – | – | – | 76,048 | 490,949 | ||||||||||||||||||||||||||||||||||||||
R6 Class | – | – | – | 68,176 | – | – | ||||||||||||||||||||||||||||||||||||||
Long-term capital gains |
| |||||||||||||||||||||||||||||||||||||||||||
R5 Class | – | – | – | – | – | 7,865 | ||||||||||||||||||||||||||||||||||||||
Y Class | – | – | – | – | – | 5,916 | ||||||||||||||||||||||||||||||||||||||
Investor Class | – | – | – | – | – | 271 | ||||||||||||||||||||||||||||||||||||||
A Class | – | – | – | – | – | 518 | ||||||||||||||||||||||||||||||||||||||
C Class | – | – | – | – | – | 243 | ||||||||||||||||||||||||||||||||||||||
Ultra Class | – | – | – | – | – | 1,518 | ||||||||||||||||||||||||||||||||||||||
|
|
|
|
|
|
|
|
|
|
|
| |||||||||||||||||||||||||||||||||
Total distributions paid | $ | 6,959,266 | $ | – | $ | 5,279,167 | $ | 71,029 | $ | 3,037,167 | $ | 3,858,823 | ||||||||||||||||||||||||||||||||
|
|
|
|
|
|
|
|
|
|
|
| |||||||||||||||||||||||||||||||||
| * For tax purposes, short-term capital gains are considered ordinary income distributions. |
| |||||||||||||||||||||||||||||||||||||||||||
| A Commencement of operations. |
| |||||||||||||||||||||||||||||||||||||||||||
As of June 30, 2020, the components of distributable earnings (deficits) on a tax basis were as follows:
Fund | Tax Cost | Unrealized Appreciation | Unrealized (Depreciation) | Net Unrealized Appreciation (Depreciation) | ||||||||||||||||||||||||
| SSI Alternative Income Fund | $ | 138,774,081 | $ | 12,870,376 | $ | (15,917,948 | ) | $ | (3,047,572 | ) | ||||||||||||||||||
TwentyFour Short Term Bond Fund | 9,734,731 | 274,177 | (634,143 | ) | (359,966 | ) | ||||||||||||||||||||||
| TwentyFour Strategic Income | 124,471,481 | 2,676,843 | (5,930,311 | ) | (3,253,468 | ) | ||||||||||||||||||||||
Fund | Net Unrealized Appreciation (Depreciation) | Undistributed Ordinary Income | Undistributed Long-Term Capital Gains | Accumulated Capital and Other (Losses) | Other Temporary Differences | Distributable Earnings | ||||||||||||||||||||||||||||||||||||||
| SSI Alternative Income Fund | $ | (3,047,572 | ) | $ | 1,279,248 | $ | – | $ | (1,405,836 | ) | $ | – | $ | (3,174,160 | ) | |||||||||||||||||||||||||||||
| TwentyFour Short Term Bond Fund | (359,966 | ) | 301,987 | – | (17,697 | ) | – | (75,676 | ) | |||||||||||||||||||||||||||||||||||
| TwentyFour Strategic Income | (3,253,468 | ) | 2,596,943 | – | (16,334,231 | ) | – | (16,990,756 | ) | |||||||||||||||||||||||||||||||||||
Financial reporting records are adjusted for permanent book/tax differences to reflect tax character. Financial records are not adjusted for temporary differences. The temporary differences between financial reporting and tax-basis reporting of unrealized appreciation (depreciation) are attributable primarily to the tax deferral of losses from wash sales, income realized for tax purposes from contingent payment debt instruments, the tax deferral of losses from straddles, deemed distributions from convertible obligations, unused capital losses, and the realization for tax purposes of unrealized gains (losses) on certain derivative instruments.
75
American Beacon FundsSM
Notes to Financial Statements
June 30, 2020
Due to inherent differences in the recognition of income, expenses, and realized gains (losses) under U.S. GAAP and federal income tax regulations, permanent differences between book and tax reporting have been identified and appropriately reclassified on the Statements of Assets and Liabilities.
Accordingly, the following amounts represent current year permanent differences derived from organizational costs as of June 30, 2020.
Fund | Paid-In-Capital | Distributable Earnings/(Deficits) | ||||||
SSI Alternative Income Fund | $ | 4,619 | $ | (4,619 | ) | |||
TwentyFour Short Term Bond Fund | – | – | ||||||
TwentyFour Strategic Income | – | – | ||||||
Under the Regulated Investment Company Modernization Act of 2010 (“RIC MOD”), net capital losses recognized by the Funds in taxable years beginning after December 22, 2010 are carried forward indefinitely and retain their character as short-term and/or long-term losses.
As of June 30, 2020, the Funds had the following post RIC MOD capital loss carryforwards:
Fund | Short-Term Capital Loss Carryforwards | Long-Term Capital Loss Carryforwards | ||||||
SSI Alternative Income Fund | $ | - | $ | 1,405,836 | ||||
TwentyFour Short Term Bond Fund | 17,697 | – | ||||||
TwentyFour Strategic Income | 6,161,472 | 10,172,759 | ||||||
SSI Alternative Income utilized $1,996,147 in short-term capital loss carryforwards and TwentyFour Strategic Income utilized $1,041,009 in short-term capital loss carryforwards during the year ending June 30, 2020. The ability to utilize capital loss carryforwards in the future may be limited under the Internal Revenue Code and related regulations based on the results of future transactions.
8. Investment Transactions
The aggregate cost of purchases and proceeds from sales and maturities of investments, other than short-term obligations, for the period ended June 30, 2020 were as follows:
Fund | Purchases (non-U.S. Government Securities) | Purchases of U.S. Government Securities | Sales (non-U.S. Government Securities) | Sales of U.S. Government Securities | ||||||||||||
SSI Alternative Income Fund | $ | 232,803,292 | $ | – | $ | 268,815,349 | $ | – | ||||||||
TwentyFour Short Term Bond Fund | 9,370,107 | 280,081 | 576,530 | – | ||||||||||||
TwentyFour Strategic Income | 110,239,941 | 111,531,162 | 53,921,268 | 105,016,935 | ||||||||||||
A summary of the Funds’ transactions in the USG Select Fund for the period ended June 30, 2020 were as follows:
Fund | Type of Transaction | June 30, 2019 Shares/Fair Value | Purchases | Sales | June 30, 2020 Shares/Fair Value | |||||||||||||||||||||||||||||
| SSI Alternative Income | Direct | $ | 23,145,110 | $ | 120,710,902 | $ | 131,850,558 | $ | 12,005,454 | |||||||||||||||||||||||||
| TwentyFour Strategic Income | Direct | $ | 1,319,812 | $ | 110,823,653 | $ | 108,371,315 | $ | 3,772,150 | |||||||||||||||||||||||||
76
American Beacon FundsSM
Notes to Financial Statements
June 30, 2020
9. Borrowing Arrangements
Effective November 14, 2019 (the “Effective Date”), the Funds, along with certain other funds managed by the Manager (“Participating Funds”), entered into a committed revolving line of credit (the “Committed Line”) agreement with State Street Bank and Trust Company (the “Bank”) to be used to facilitate portfolio liquidity. The maximum borrowing amount under the Committed Line is $250 million with interest at a rate equal to the higher of (a) one-month London Inter-Bank Offered Rate (“LIBOR”) plus 1.25% per annum or (b) the Federal Funds rate plus 1.25% per annum on amounts borrowed. Each of the Participating Funds paid a closing fee of $100,000 on the Effective Date and a quarterly commitment fee at a rate of 0.25% per annum on the unused portion of the Committed Line amount. Effective August 6, 2020, the Committed Line was reduced from $250 million to $150 million. The Committed Line expires November 12, 2020, unless extended by the Bank or terminated by the Participating Funds in accordance with the agreement.
On the Effective Date, the Funds, along with certain other Participating Funds managed by the Manager, also entered into an uncommitted discretionary demand revolving line of credit (the “Uncommitted Line”) agreement with the Bank to be used to facilitate portfolio liquidity. The maximum borrowing amount under the Uncommitted Line is $50 million with interest at a rate equal to the higher of (a) one-month LIBOR plus 1.25% per annum or (b) the Federal Funds rate plus 1.25% per annum on each outstanding loan. Each of the Participating Funds paid a closing fee of $35,000 on the Effective Date. The Uncommitted Line expires November 12, 2020 unless extended by the Bank or terminated by the Participating Funds in accordance with the agreement.
The Participating Funds paid administration, legal and arrangement fees, which are recognized as a component of “Other expenses” on the Statements of Operations, along with commitment fees, that have been allocated among the Participating Funds based on average daily net assets.
During the year ended June 30, 2020, the Funds did not utilize this facility.
10. Capital Share Transactions
The tables below summarize the activity in capital shares for each Class of the Funds:
| R5 ClassA | ||||||||||||||||||||||||||||||||||||||||||||
| Year Ended June 30, 2020 | May 20, 2019B - June 30, 2019 | |||||||||||||||||||||||||||||||||||||||||||
SSI Alternative Income Fund | Shares | Amount | Shares | Amount | ||||||||||||||||||||||||||||||||||||||||
| Shares sold | – | $ | – | 9,833 | $ | 100,000 | ||||||||||||||||||||||||||||||||||||||
| Reinvestment of dividends | – | – | – | – | ||||||||||||||||||||||||||||||||||||||||
| Shares redeemed | – | – | – | – | ||||||||||||||||||||||||||||||||||||||||
|
|
|
|
|
|
|
| |||||||||||||||||||||||||||||||||||||
| Net increase in shares outstanding | – | $ | – | 9,833 | $ | 100,000 | ||||||||||||||||||||||||||||||||||||||
|
|
|
|
|
|
|
| |||||||||||||||||||||||||||||||||||||
| Y Class | ||||||||||||||||||||||||||||||||||||||||||||
| Year Ended June 30, 2020 | Period Ended June 30, 2019 | Year Ended March 31, 2019 | ||||||||||||||||||||||||||||||||||||||||||
SSI Alternative Income Fund | Shares | Amount | Shares | Amount | ||||||||||||||||||||||||||||||||||||||||
| Shares sold | 1,730,048 | $ | 17,578,607 | 701,747 | $ | 7,117,392 | 7,957,248 | $ | 79,355,790 | |||||||||||||||||||||||||||||||||||
| Reinvestment of dividends | 509,524 | 5,161,481 | – | – | 462,665 | 4,588,864 | ||||||||||||||||||||||||||||||||||||||
| Shares redeemed | (10,610,031 | ) | (107,430,017 | ) | (6,172,159 | ) | (62,841,558 | ) | (8,630,606 | ) | (86,477,727 | ) | ||||||||||||||||||||||||||||||||
|
|
|
|
|
|
|
|
|
|
|
| |||||||||||||||||||||||||||||||||
| Net (decrease) in shares outstanding | (8,370,459 | ) | $ | (84,689,929 | ) | (5,470,412 | ) | $ | (55,724,166 | ) | (210,693 | ) | $ | (2,533,073 | ) | |||||||||||||||||||||||||||||
|
|
|
|
|
|
|
|
|
|
|
| |||||||||||||||||||||||||||||||||
| Investor Class | ||||||||||||||||||||||||||||||||||||||||||||
| Year Ended June 30, 2020 | Period Ended June 30, 2019 | Year Ended March 31, 2019 | ||||||||||||||||||||||||||||||||||||||||||
SSI Alternative Income Fund | Shares | Amount | Shares | Amount | ||||||||||||||||||||||||||||||||||||||||
| Shares sold | 24,671 | $ | 252,030 | 19,211 | $ | 195,507 | 31,207 | $ | 313,345 | |||||||||||||||||||||||||||||||||||
| Reinvestment of dividends | 3,056 | 30,964 | – | – | 3,246 | 32,371 | ||||||||||||||||||||||||||||||||||||||
| Shares redeemed | (34,864 | ) | (350,905 | ) | (11,550 | ) | (117,640 | ) | (297,247 | ) | (2,977,870 | ) | ||||||||||||||||||||||||||||||||
|
|
|
|
|
|
|
|
|
|
|
| |||||||||||||||||||||||||||||||||
| Net increase (decrease) in shares outstanding | (7,137 | ) | $ | (67,911 | ) | 7,661 | $ | 77,867 | (262,794 | ) | $ | (2,632,154 | ) | |||||||||||||||||||||||||||||||
|
|
|
|
|
|
|
|
|
|
|
| |||||||||||||||||||||||||||||||||
77
American Beacon FundsSM
Notes to Financial Statements
June 30, 2020
| Y Class | ||||||||||||||||||||||||||||||||||||||||||||
| February 18, 2020B to June 30, 2020 | ||||||||||||||||||||||||||||||||||||||||||||
TwentyFour Short Term Bond Fund | Shares | Amount | ||||||||||||||||||||||||||||||||||||||||||
| Shares sold | 5,056 | C | $ | 50,000 | C | |||||||||||||||||||||||||||||||||||||||
| Shares redeemed | – | – | ||||||||||||||||||||||||||||||||||||||||||
| Reinvestment of dividends | 15 | 154 | ||||||||||||||||||||||||||||||||||||||||||
|
|
|
| |||||||||||||||||||||||||||||||||||||||||
| Net increase in shares outstanding | 5,071 | $ | 50,154 | |||||||||||||||||||||||||||||||||||||||||
|
|
|
| |||||||||||||||||||||||||||||||||||||||||
| A Class | ||||||||||||||||||||||||||||||||||||||||||||
| February 18, 2020B to June 30, 2020 | ||||||||||||||||||||||||||||||||||||||||||||
TwentyFour Short Term Bond Fund | Shares | Amount | ||||||||||||||||||||||||||||||||||||||||||
| Shares sold | 31,146 | C | $ | 304,331 | C | |||||||||||||||||||||||||||||||||||||||
| Reinvestment of dividends | 19 | 183 | ||||||||||||||||||||||||||||||||||||||||||
| Shares redeemed | (20,345 | ) | (198,770 | ) | ||||||||||||||||||||||||||||||||||||||||
|
|
|
| |||||||||||||||||||||||||||||||||||||||||
| Net increase in shares outstanding | 10,820 | $ | 105,744 | |||||||||||||||||||||||||||||||||||||||||
|
|
|
| |||||||||||||||||||||||||||||||||||||||||
| C Class | ||||||||||||||||||||||||||||||||||||||||||||
| February 18, 2020B to June 30, 2020 | ||||||||||||||||||||||||||||||||||||||||||||
TwentyFour Short Term Bond Fund | Shares | Amount | ||||||||||||||||||||||||||||||||||||||||||
| Shares sold | 15,757 | C | $ | 152,906 | C | |||||||||||||||||||||||||||||||||||||||
| Reinvestment of dividends | 73 | 717 | ||||||||||||||||||||||||||||||||||||||||||
| Shares redeemed | (58 | ) | (563 | ) | ||||||||||||||||||||||||||||||||||||||||
|
|
|
| |||||||||||||||||||||||||||||||||||||||||
| Net increase in shares outstanding | 15,772 | $ | 153,060 | |||||||||||||||||||||||||||||||||||||||||
|
|
|
| |||||||||||||||||||||||||||||||||||||||||
| R6 Class | ||||||||||||||||||||||||||||||||||||||||||||
| February 18, 2020B to June 30, 2020 | ||||||||||||||||||||||||||||||||||||||||||||
TwentyFour Short Term Bond Fund | Shares | Amount |
|
| ||||||||||||||||||||||||||||||||||||||||
| Shares sold | – | C | $ | – | C | |||||||||||||||||||||||||||||||||||||||
| Reinvestment of dividends | 1,501 | 14,938 | ||||||||||||||||||||||||||||||||||||||||||
| Shares redeemed | – | – | ||||||||||||||||||||||||||||||||||||||||||
|
|
|
| |||||||||||||||||||||||||||||||||||||||||
| Net increase in shares outstanding | 1,501 | $ | 14,938 | |||||||||||||||||||||||||||||||||||||||||
|
|
|
| |||||||||||||||||||||||||||||||||||||||||
| R5 ClassA | ||||||||||||||||||||||||||||||||||||||||||||
| Year Ended June 30, 2020 | Year Ended June 30, 2019 | |||||||||||||||||||||||||||||||||||||||||||
TwentyFour Strategic Income Fund | Shares | Amount | Shares | Amount | ||||||||||||||||||||||||||||||||||||||||
| Shares sold | 241,527 | $ | 2,457,747 | 127,229 | $ | 1,275,666 | ||||||||||||||||||||||||||||||||||||||
| Reinvestment of dividends | 30,305 | 309,065 | 146,814 | 1,440,934 | ||||||||||||||||||||||||||||||||||||||||
| Issued in Reorganization | – | – | 4,054,363 | 40,388,350 | ||||||||||||||||||||||||||||||||||||||||
| Shares redeemed | (191,620 | ) | (1,923,831 | ) | (4,093,529 | ) | (40,753,632 | ) | ||||||||||||||||||||||||||||||||||||
|
|
|
|
|
|
|
| |||||||||||||||||||||||||||||||||||||
| Net increase in shares outstanding | 80,212 | $ | 842,981 | 234,877 | $ | 2,351,318 | ||||||||||||||||||||||||||||||||||||||
|
|
|
|
|
|
|
| |||||||||||||||||||||||||||||||||||||
| Y Class | ||||||||||||||||||||||||||||||||||||||||||||
| Year Ended June 30, 2020 | Year Ended June 30, 2019 | |||||||||||||||||||||||||||||||||||||||||||
TwentyFour Strategic Income Fund | Shares | Amount | Shares | Amount | ||||||||||||||||||||||||||||||||||||||||
| Shares sold | 7,952,007 | $ | 80,935,936 | 1,691,016 | $ | 16,773,603 | ||||||||||||||||||||||||||||||||||||||
| Reinvestment of dividends | 206,610 | 2,097,842 | 167,939 | 1,658,061 | ||||||||||||||||||||||||||||||||||||||||
| Issued in Reorganization | – | – | 925,963 | 9,207,495 | ||||||||||||||||||||||||||||||||||||||||
| Shares redeemed | (3,210,211 | ) | (31,881,783 | ) | (1,216,828 | ) | (11,983,051 | ) | ||||||||||||||||||||||||||||||||||||
|
|
|
|
|
|
|
| |||||||||||||||||||||||||||||||||||||
| Net increase in shares outstanding | 4,948,406 | $ | 51,151,995 | 1,568,090 | $ | 15,656,108 | ||||||||||||||||||||||||||||||||||||||
|
|
|
|
|
|
|
| |||||||||||||||||||||||||||||||||||||
| Investor Class | ||||||||||||||||||||||||||||||||||||||||||||
| Year Ended June 30, 2020 | Year Ended June 30, 2019 | |||||||||||||||||||||||||||||||||||||||||||
TwentyFour Strategic Income Fund | Shares | Amount | Shares | Amount | ||||||||||||||||||||||||||||||||||||||||
| Shares sold | 1,587,564 | $ | 16,094,764 | 41,921 | $ | 417,210 | ||||||||||||||||||||||||||||||||||||||
| Reinvestment of dividends | 26,607 | 266,794 | 7,825 | 76,834 | ||||||||||||||||||||||||||||||||||||||||
| Issued in Reorganization | – | – | 310,870 | 3,077,148 | ||||||||||||||||||||||||||||||||||||||||
| Shares redeemed | (305,771 | ) | (2,965,629 | ) | (347,339 | ) | (3,410,547 | ) | ||||||||||||||||||||||||||||||||||||
|
|
|
|
|
|
|
| |||||||||||||||||||||||||||||||||||||
| Net increase in shares outstanding | 1,308,400 | $ | 13,395,929 | 13,277 | $ | 160,645 | ||||||||||||||||||||||||||||||||||||||
|
|
|
|
|
|
|
| |||||||||||||||||||||||||||||||||||||
78
American Beacon FundsSM
Notes to Financial Statements
June 30, 2020
| A Class | ||||||||||||||||||||||||||||||||||||||||||||
| Year Ended June 30, 2020 | October 29, 2018B to June 30, 2019 | |||||||||||||||||||||||||||||||||||||||||||
TwentyFour Strategic Income Fund | Shares | Amount | Shares | Amount | ||||||||||||||||||||||||||||||||||||||||
| Shares sold | 365,466 | $ | 3,656,302 | 471,100 | $ | 4,648,441 | ||||||||||||||||||||||||||||||||||||||
| Reinvestment of dividends | 20,869 | 211,883 | 13,532 | 132,650 | ||||||||||||||||||||||||||||||||||||||||
| Issued in Reorganization | – | – | 165,011 | 1,633,201 | ||||||||||||||||||||||||||||||||||||||||
| Shares redeemed | (490,246 | ) | (4,832,032 | ) | (32,291 | ) | (317,909 | ) | ||||||||||||||||||||||||||||||||||||
|
|
|
|
|
|
|
| |||||||||||||||||||||||||||||||||||||
| Net increase (decrease) in shares outstanding | (103,911 | ) | $ | (963,847 | ) | 617,352 | $ | 6,096,383 | ||||||||||||||||||||||||||||||||||||
|
|
|
|
|
|
|
| |||||||||||||||||||||||||||||||||||||
| C Class | ||||||||||||||||||||||||||||||||||||||||||||
| Year Ended June 30, 2020 | October 29, 2018B to June��30, 2019 | |||||||||||||||||||||||||||||||||||||||||||
TwentyFour Strategic Income Fund | Shares | Amount | Shares | Amount | ||||||||||||||||||||||||||||||||||||||||
| Shares sold | 360,007 | $ | 3,560,420 | 41,748 | $ | 418,229 | ||||||||||||||||||||||||||||||||||||||
| Reinvestment of dividends | 6,105 | 61,337 | 4,390 | 42,846 | ||||||||||||||||||||||||||||||||||||||||
| Issued in Reorganization | – | – | 152,546 | 1,509,474 | ||||||||||||||||||||||||||||||||||||||||
| Shares redeemed | (62,359 | ) | (624,051 | ) | (35,060 | ) | (345,851 | ) | ||||||||||||||||||||||||||||||||||||
|
|
|
|
|
|
|
| |||||||||||||||||||||||||||||||||||||
| Net increase in shares outstanding | 303,753 | $ | 2,997,706 | 163,624 | $ | 1,624,698 | ||||||||||||||||||||||||||||||||||||||
|
|
|
|
|
|
|
| |||||||||||||||||||||||||||||||||||||
| Ultra Class | ||||||||||||||||||||||||||||||||||||||||||||
| Year Ended June 30, 2020 | Year Ended June 30, 2019 | |||||||||||||||||||||||||||||||||||||||||||
TwentyFour Strategic Income Fund | Shares | Amount | Shares | Amount | ||||||||||||||||||||||||||||||||||||||||
| Shares sold | – | $ | – | – | $ | – | ||||||||||||||||||||||||||||||||||||||
| Reinvestment of dividends | – | – | 49,657 | 492,466 | ||||||||||||||||||||||||||||||||||||||||
| Shares redeemed | (944,583 | ) | (9,748,000 | ) | – | – | ||||||||||||||||||||||||||||||||||||||
|
|
|
|
|
|
|
| |||||||||||||||||||||||||||||||||||||
| Net increase (decrease) in shares outstanding | (944,583 | ) | $ | (9,748,000 | ) | 49,657 | $ | 492,466 | ||||||||||||||||||||||||||||||||||||
|
|
|
|
|
|
|
| |||||||||||||||||||||||||||||||||||||
A Formerly known as Institutional Class.
B Commencement of operations.
C Seed capital was received on February 18, 2020 in the amount of $100,000 for the Y Class, $100,000 for the A Class, $100,000 for the C class and $9,700,000 for the R6 Class. As a result, shares were issued in the amount of 10,000 for the Y Class, 10,000 for the A Class, 10,000 for the C class and 970,000 for the R6 Class.
11. Subsequent Events
Management has evaluated subsequent events for possible recognition or disclosure in the financial statements through the date the financial statements are issued. Management has determined that there are no material events that would require disclosure in the Funds’ financial statements through this date.
79
American Beacon SSI Alternative Income FundSM
Financial Highlights
(For a share outstanding throughout the period)
| R5 ClassA | ||||||||||||
Year Ended June 30, | May 20, 2019B to June 30, 2019# | |||||||||||
|
| |||||||||||
Net asset value, beginning of period | $ | 10.27 | $ | 10.17 | ||||||||
|
|
|
| |||||||||
Income (loss) from investment operations: | ||||||||||||
Net investment income | 0.19 | 0.03 | ||||||||||
Net gains on investments (both realized and unrealized) | 0.06 | 0.07 | ||||||||||
|
|
|
| |||||||||
Total income (loss) from investment operations | 0.25 | 0.10 | ||||||||||
|
|
|
| |||||||||
Less distributions: | ||||||||||||
Dividends from net investment income | (0.37 | ) | – | |||||||||
|
|
|
| |||||||||
Net asset value, end of period | $ | 10.15 | $ | 10.27 | ||||||||
|
|
|
| |||||||||
Total returnC | 2.49 | % | 0.98 | %D | ||||||||
|
|
|
| |||||||||
Ratios and supplemental data: | ||||||||||||
Net assets, end of period | $ | 99,760 | $ | 100,976 | ||||||||
Ratios to average net assets: | ||||||||||||
Expenses, before reimbursements | 4.90 | % | 2.76 | %E | ||||||||
Expenses, net of reimbursements | 2.19 | %F | 1.83 | %E F | ||||||||
Net investment income (loss), before expense reimbursements | (0.81 | )% | 1.41 | %E | ||||||||
Net investment income, net of reimbursements | 1.90 | % | 2.34 | %E | ||||||||
Portfolio turnover rate | 242 | % | 20 | %D | ||||||||
| # | Fiscal year end changed from March 31 to June 30. |
| A | Prior to February 28, 2020, the R5 Class was known as Institutional Class. |
| B | Commencement of operations. |
| C | Based on net asset value, which does not reflect the sales charge, redemption fee, or contingent deferred sales charge, if applicable. May include adjustments in accordance with U.S. GAAP and as such, the net asset value for reporting purposes and the returns based upon those net asset values may differ from the net asset value and returns for shareholder transactions. |
| D | Not annualized. |
| E | Annualized. |
| F | Includes non-operating expenses consisting of prime broker fees, dividends and interest expense from securities sold short. The Expenses, net of reimbursements, excluding non-operating expenses is 1.49% and 1.49% for the year ended June 30, 2020 and period ended June 30, 2019, respectively. |
See accompanying notes
80
American Beacon SSI Alternative Income FundSM
Financial Highlights
(For a share outstanding throughout the period)
| Y ClassA | ||||||||||||||||||||||||||||||||||||||||||||
Year Ended 2020 | April 1, 2019 to June 30, 2019# | Year Ended March 31, | ||||||||||||||||||||||||||||||||||||||||||
| 2019 | 2018 | 2017 | 2016 | |||||||||||||||||||||||||||||||||||||||||
|
| |||||||||||||||||||||||||||||||||||||||||||
Net asset value, beginning of period | $ | 10.27 | $ | 10.12 | $ | 10.04 | $ | 9.90 | $ | 9.33 | $ | 9.94 | ||||||||||||||||||||||||||||||||
|
|
|
|
|
|
|
|
|
|
|
| |||||||||||||||||||||||||||||||||
Income (loss) from investment operations: | ||||||||||||||||||||||||||||||||||||||||||||
Net investment income | 0.19 | 0.08 | 0.20 | B | 0.19 | B | 0.21 | B | 0.20 | B | ||||||||||||||||||||||||||||||||||
Net gains (losses) on investments (both realized and unrealized) | 0.05 | 0.07 | 0.07 | 0.13 | 0.49 | (0.51 | ) | |||||||||||||||||||||||||||||||||||||
|
|
|
|
|
|
|
|
|
|
|
| |||||||||||||||||||||||||||||||||
Total income (loss) from investment operations | 0.24 | 0.15 | 0.27 | 0.32 | 0.70 | (0.31 | ) | |||||||||||||||||||||||||||||||||||||
|
|
|
|
|
|
|
|
|
|
|
| |||||||||||||||||||||||||||||||||
Less distributions: | ||||||||||||||||||||||||||||||||||||||||||||
Dividends from net investment income | (0.37 | ) | – | (0.19 | ) | (0.18 | ) | (0.13 | ) | (0.30 | ) | |||||||||||||||||||||||||||||||||
Distributions from net realized gains | – | – | – | – | – | – | ||||||||||||||||||||||||||||||||||||||
|
|
|
|
|
|
|
|
|
|
|
| |||||||||||||||||||||||||||||||||
Total distributions | (0.37 | ) | – | (0.19 | ) | (0.18 | ) | (0.13 | ) | (0.30 | ) | |||||||||||||||||||||||||||||||||
|
|
|
|
|
|
|
|
|
|
|
| |||||||||||||||||||||||||||||||||
Net asset value, end of period | $ | 10.14 | $ | 10.27 | $ | 10.12 | $ | 10.04 | $ | 9.90 | $ | 9.33 | ||||||||||||||||||||||||||||||||
|
|
|
|
|
|
|
|
|
|
|
| |||||||||||||||||||||||||||||||||
Total return | 2.35 | % | 1.48 | %C D | 2.71 | %E | 3.28 | %E | 7.54 | %E | (3.19 | )%E | ||||||||||||||||||||||||||||||||
|
|
|
|
|
|
|
|
|
|
|
| |||||||||||||||||||||||||||||||||
Ratios and supplemental data: |
| |||||||||||||||||||||||||||||||||||||||||||
Net assets, end of period | $ | 139,609,314 | $ | 227,279,618 | $ | 279,429,760 | $ | 281,239,955 | $ | 295,950,357 | $ | 263,248,666 | ||||||||||||||||||||||||||||||||
Ratios to average net assets: | ||||||||||||||||||||||||||||||||||||||||||||
Expenses, before reimbursements | 2.32 | % | 2.14 | %G | 1.79 | %F | 1.76 | %F | 2.06 | %F | 2.10 | %F | ||||||||||||||||||||||||||||||||
Expenses, net of reimbursements | 2.27 | %H | 1.71 | %G H | 1.79 | %F | 1.76 | %F | 2.06 | %F | 2.09 | %F | ||||||||||||||||||||||||||||||||
Net investment income, before expense reimbursements | 1.81 | % | 1.81 | %G | 1.99 | % | 1.85 | % | 2.12 | % | 2.04 | % | ||||||||||||||||||||||||||||||||
Net investment income, net of reimbursements | 1.86 | % | 2.24 | %G | 1.99 | % | 1.85 | % | 2.12 | % | 2.05 | % | ||||||||||||||||||||||||||||||||
Portfolio turnover rate | 242 | % | 20 | %D | 76 | % | 52 | % | 54 | % | 66 | % | ||||||||||||||||||||||||||||||||
| # | Fiscal year end changed from March 31 to June 30. |
| A | On May 17, 2019, Class I was re-designated as Y Class. |
| B | Based on average shares outstanding for the period. |
| C | Based on net asset value, which does not reflect the sales charge, redemption fee, or contingent deferred sales charge, if applicable. May include adjustments in accordance with U.S. GAAP and as such, the net asset value for reporting purposes and the returns based upon those net asset values may differ from the net asset value and returns for shareholder transactions. |
| D | Not annualized. |
| E | Total returns would have been lower/higher had expenses not been waived/recovered by the Advisor. Returns shown do not reflect the deduction of taxes that shareholder would pay on Fund distributions or the redemption of Fund shares. |
| F | If interest expense, dividends on securities sold short and shareholder servicing fees had been excluded, the expense ratios would have been lowered by 0.30%, 0.27%, 0.57%, 0.60%, and 0.62% for the periods ended March 31, respectively. |
| G | Annualized. |
| H | Includes non-operating expenses consisting of prime broker fees, dividends and interest expense from securities sold short. The Expenses, net of reimbursements, excluding non-operating expenses is 1.56% and 1.54% for the year ended June 30, 2020 and period ended June 30, 2019, respectively. |
See accompanying notes
81
American Beacon SSI Alternative Income FundSM
Financial Highlights
(For a share outstanding throughout the period)
| Investor ClassA | ||||||||||||||||||||||||||||||||||||||||||||
| Year Ended June 30, 2020 | April 1, 2019 to June 30, 2019# | Year Ended March 31, | ||||||||||||||||||||||||||||||||||||||||||
| 2019 | Y2018 | 2017 | 2016 | |||||||||||||||||||||||||||||||||||||||||
|
| |||||||||||||||||||||||||||||||||||||||||||
Net asset value, beginning of period | $ | 10.27 | $ | 10.13 | $ | 10.04 | $ | 9.90 | $ | 9.32 | $ | 9.93 | ||||||||||||||||||||||||||||||||
|
|
|
|
|
|
|
|
|
|
|
| |||||||||||||||||||||||||||||||||
Income (loss) from investment operations: | ||||||||||||||||||||||||||||||||||||||||||||
Net investment income | 0.17 | 0.03 | 0.17 | B | 0.16 | B | 0.18 | B | 0.17 | B | ||||||||||||||||||||||||||||||||||
Net gains (losses) on investments (both realized and unrealized) | 0.04 | 0.11 | 0.07 | 0.13 | 0.50 | (0.51 | ) | |||||||||||||||||||||||||||||||||||||
|
|
|
|
|
|
|
|
|
|
|
| |||||||||||||||||||||||||||||||||
Total income (loss) from investment operations | 0.21 | 0.14 | 0.24 | 0.29 | 0.68 | (0.34 | ) | |||||||||||||||||||||||||||||||||||||
|
|
|
|
|
|
|
|
|
|
|
| |||||||||||||||||||||||||||||||||
Less distributions: | ||||||||||||||||||||||||||||||||||||||||||||
Dividends from net investment income | (0.35 | ) | – | (0.15 | ) | (0.15 | ) | (0.10 | ) | (0.27 | ) | |||||||||||||||||||||||||||||||||
|
|
|
|
|
|
|
|
|
|
|
| |||||||||||||||||||||||||||||||||
Net asset value, end of period | $ | 10.13 | $ | 10.27 | $ | 10.13 | $ | 10.04 | $ | 9.90 | $ | 9.32 | ||||||||||||||||||||||||||||||||
|
|
|
|
|
|
|
|
|
|
|
| |||||||||||||||||||||||||||||||||
Total return | 2.07 | % | 1.38 | %C D | 2.47 | %E | 2.99 | %E | 7.33 | %E | (3.51 | )%E | ||||||||||||||||||||||||||||||||
|
|
|
|
|
|
|
|
|
|
|
| |||||||||||||||||||||||||||||||||
Ratios and supplemental data: |
| |||||||||||||||||||||||||||||||||||||||||||
Net assets, end of period | $ | 862,020 | $ | 946,784 | $ | 856,300 | $ | 1,256,917 | $ | 4,639,463 | $ | 6,669,496 | ||||||||||||||||||||||||||||||||
Ratios to average net assets: | ||||||||||||||||||||||||||||||||||||||||||||
Expenses, before reimbursements | 2.97 | % | 2.39 | %G | 2.04 | %F | 2.01 | %F | 2.31 | %F | 2.35 | %F | ||||||||||||||||||||||||||||||||
Expenses, net of reimbursements | 2.52 | %H | 1.98 | %G H | 2.04 | %F | 2.01 | %F | 2.31 | %F | 2.34 | %F | ||||||||||||||||||||||||||||||||
Net investment income, before expense reimbursements | 1.13 | % | 1.62 | %G | 1.74 | % | 1.60 | % | 1.87 | % | 1.79 | % | ||||||||||||||||||||||||||||||||
Net investment income, net of reimbursements | 1.58 | % | 2.04 | %G | 1.74 | % | 1.60 | % | 1.87 | % | 1.80 | % | ||||||||||||||||||||||||||||||||
Portfolio turnover rate | 242 | % | 20 | %D | 76 | % | 52 | % | 54 | % | 66 | % | ||||||||||||||||||||||||||||||||
| # | Fiscal year end changed from March 31 to June 30. |
| A | On May 17, 2019, Class A was re-designated as Investor Class. |
| B | Based on average shares outstanding for the period. |
| C | Based on net asset value, which does not reflect the sales charge, redemption fee, or contingent deferred sales charge, if applicable. May include adjustments in accordance with U.S. GAAP and as such, the net asset value for reporting purposes and the returns based upon those net asset values may differ from the net asset value and returns for shareholder transactions. |
| D | Not annualized. |
| E | Total returns would have been lower/higher had expenses not been waived/recovered by the Advisor. Returns shown do not include payment of sales load of 5.75% of offering price which is reduced on sales of $50,000 or more. These returns include Rule 12b-1 fees of up to 0.25% and do not reflect the deduction of taxes that a shareholder would pay on Fund distributions or the redemption of Fund shares. |
| F | If interest expense, dividends on securities sold short and shareholder servicing fees had been excluded, the expense ratios would have been lowered by 0.30%, 0.27%, 0.57%, 0.60%, and 0.62% for the periods ended March 31, respectively. |
| G | Annualized. |
| H | Includes non-operating expenses consisting of prime broker, dividends and interest expense from securities sold short. The Expenses, net of reimbursements, excluding non-operating expenses is 1.81% and 1.81% for the year ended June 30, 2020 and period ended June 30, 2019, respectively. |
See accompanying notes
82
American Beacon TwentyFour Short Term Bond FundSM
Financial Highlights
(For a share outstanding throughout the period)
| Y Class | ||||
| February 18, 2020A to June 30, 2020 | ||||
|
| |||
Net asset value, beginning of period | $ | 10.00 | ||
|
| |||
Income (loss) from investment operations: | ||||
Net investment income | 0.05 | |||
Net (losses) on investments (both realized and unrealized) | (0.06 | ) | ||
|
| |||
Total income (loss) from investment operations | (0.01 | ) | ||
|
| |||
Less distributions: | ||||
Dividends from net investment income | (0.07 | ) | ||
|
| |||
Net asset value, end of period | $ | 9.92 | ||
|
| |||
Total returnB | (0.09 | )%C | ||
|
| |||
Ratios and supplemental data: | ||||
Net assets, end of period | $ | 149,445 | ||
Ratios to average net assets: | ||||
Expenses, before reimbursements | 11.60 | %D E | ||
Expenses, net of reimbursements | 0.57 | %D | ||
Net investment (loss), before expense reimbursements | (9.96 | )%D E | ||
Net investment income, net of reimbursements | 1.07 | %D | ||
Portfolio turnover rate | 7 | %C | ||
| A | Commencement of operations. |
| B | Based on net asset value, which does not reflect the sales charge, redemption fee, or contingent deferred sales charge, if applicable. May include adjustments in accordance with U.S. GAAP and as such, the net asset value for reporting purposes and the returns based upon those net asset values may differ from the net asset value and returns for shareholder transactions. |
| C | Not annualized. |
| D | Annualized. |
| E | Includes non-recurring organization and offering costs. |
See accompanying notes
83
American Beacon TwentyFour Short Term Bond FundSM
Financial Highlights
(For a share outstanding throughout the period)
| A Class | ||||
| February 18, 2020A to June 30, 2020 | ||||
|
| |||
Net asset value, beginning of period | $ | 10.00 | ||
|
| |||
Income (loss) from investment operations: | ||||
Net investment income | 0.05 | |||
Net (losses) on investments (both realized and unrealized) | (0.07 | ) | ||
|
| |||
Total income (loss) from investment operations | (0.02 | ) | ||
|
| |||
Less distributions: | ||||
Dividends from net investment income | (0.07 | ) | ||
|
| |||
Net asset value, end of period | $ | 9.91 | ||
|
| |||
Total returnB | (0.19 | )%C | ||
|
| |||
Ratios and supplemental data: | ||||
Net assets, end of period | $ | 206,227 | ||
Ratios to average net assets: | ||||
Expenses, before reimbursements | 10.25 | %D E | ||
Expenses, net of reimbursements | 0.87 | %D | ||
Net investment (loss), before expense reimbursements | (8.59 | )%D E | ||
Net investment income, net of reimbursements | 0.79 | %D | ||
Portfolio turnover rate | 7 | %C | ||
| A | Commencement of operations. |
| B | Based on net asset value, which does not reflect the sales charge, redemption fee, or contingent deferred sales charge, if applicable. May include adjustments in accordance with U.S. GAAP and as such, the net asset value for reporting purposes and the returns based upon those net asset values may differ from the net asset value and returns for shareholder transactions. |
| C | Not annualized. |
| D | Annualized. |
| E | Includes non-recurring organization and offering costs. |
See accompanying notes
84
American Beacon TwentyFour Short Term Bond FundSM
Financial Highlights
(For a share outstanding throughout the period)
| C Class | ||||
| February 18, 2020A to June 30, 2020 | ||||
|
| |||
Net asset value, beginning of period | $ | 10.00 | ||
|
| |||
Income (loss) from investment operations: | ||||
Net investment income | 0.02 | |||
Net (losses) on investments (both realized and unrealized) | (0.08 | ) | ||
|
| |||
Total income (loss) from investment operations | (0.06 | ) | ||
|
| |||
Less distributions: | ||||
Dividends from net investment income | (0.07 | ) | ||
|
| |||
Net asset value, end of period | $ | 9.87 | ||
|
| |||
Total returnB | (0.59 | )%C | ||
|
| |||
Ratios and supplemental data: | ||||
Net assets, end of period | $ | 254,319 | ||
Ratios to average net assets: | ||||
Expenses, before reimbursements | 10.34 | %D E | ||
Expenses, net of reimbursements | 1.62 | %D | ||
Net investment (loss), before expense reimbursements | (8.62 | )%D E | ||
Net investment income, net of reimbursements | 0.10 | %D | ||
Portfolio turnover rate | 7 | %C | ||
| A | Commencement of operations. |
| B | Based on net asset value, which does not reflect the sales charge, redemption fee, or contingent deferred sales charge, if applicable. May include adjustments in accordance with U.S. GAAP and as such, the net asset value for reporting purposes and the returns based upon those net asset values may differ from the net asset value and returns for shareholder transactions. |
| C | Not annualized. |
| D | Annualized. |
| E | Includes non-recurring organization and offering costs. |
See accompanying notes
85
American Beacon TwentyFour Short Term Bond FundSM
Financial Highlights
(For a share outstanding throughout the period)
| R6 Class | ||||
| February 18, 2020A to June 30, 2020 | ||||
Net asset value, beginning of period | $ | 10.00 | ||
|
| |||
Income from investment operations: | ||||
Net investment income | 0.04 | |||
Net (losses) on investments (both realized and unrealized) | (0.05 | ) | ||
|
| |||
Total (loss) from investment operations | (0.01 | ) | ||
|
| |||
Less distributions: | ||||
Dividends from net investment income | (0.07 | ) | ||
|
| |||
Net asset value, end of period | $ | 9.92 | ||
|
| |||
Total returnB | (0.09 | )%C | ||
|
| |||
Ratios and supplemental data: |
| |||
Net assets, end of period | $ | 9,638,229 | ||
Ratios to average net assets: | ||||
Expenses, before reimbursements | 6.83 | %D E | ||
Expenses, net of reimbursements | 0.47 | %D | ||
Net investment (loss), before expense reimbursements | (5.20 | )%D E | ||
Net investment income, net of reimbursements | 1.16 | %D | ||
Portfolio turnover rate | 7 | %C | ||
| A | Commencement of operations. |
| B | Based on net asset value, which does not reflect the sales charge, redemption fee, or contingent deferred sales charge, if applicable. May include adjustments in accordance with U.S. GAAP and as such, the net asset value for reporting purposes and the returns based upon those net asset values may differ from the net asset value and returns for shareholder transactions. |
| C | Not annualized. |
| D | Annualized. |
| E | Includes non-recurring organization and offering costs. |
See accompanying notes
86
American Beacon TwentyFour Strategic Income FundSM
Financial Highlights
(For a share outstanding throughout the period)
| R5 ClassA | ||||||||||||||||||||||||||||
| Year Ended June 30, | April 3, 2017B to | |||||||||||||||||||||||||||
| 2020 | 2019 | 2018 | 2017 | |||||||||||||||||||||||||
|
|
|
| |||||||||||||||||||||||||
Net asset value, beginning of period | $ | 10.24 | $ | 10.07 | $ | 10.17 | $ | 10.00 | ||||||||||||||||||||
|
|
|
|
|
|
|
| |||||||||||||||||||||
Income (loss) from investment operations: | ||||||||||||||||||||||||||||
Net investment income | 0.35 | 0.43 | C | 0.44 | 0.20 | |||||||||||||||||||||||
Net gains (losses) on investments (both realized and unrealized) | 0.03 | 0.27 | (0.09 | ) | 0.06 | |||||||||||||||||||||||
|
|
|
|
|
|
|
| |||||||||||||||||||||
Total income (loss) from investment operations | 0.38 | 0.70 | 0.35 | 0.26 | ||||||||||||||||||||||||
|
|
|
|
|
|
|
| |||||||||||||||||||||
Less distributions: | ||||||||||||||||||||||||||||
Dividends from net investment income | (0.35 | ) | (0.52 | ) | (0.45 | ) | – | |||||||||||||||||||||
Distributions from net realized gains | – | (0.01 | ) | – | – | |||||||||||||||||||||||
Tax return of capitalD | – | – | – | (0.09 | ) | |||||||||||||||||||||||
|
|
|
|
|
|
|
| |||||||||||||||||||||
Total distributions | (0.35 | ) | (0.53 | ) | (0.45 | ) | (0.09 | ) | ||||||||||||||||||||
|
|
|
|
|
|
|
| |||||||||||||||||||||
Net asset value, end of period | $ | 10.27 | $ | 10.24 | $ | 10.07 | $ | 10.17 | ||||||||||||||||||||
|
|
|
|
|
|
|
| |||||||||||||||||||||
Total returnE | 3.81 | % | 7.27 | % | 3.49 | % | 2.58 | %F | ||||||||||||||||||||
|
|
|
|
|
|
|
| |||||||||||||||||||||
Ratios and supplemental data: |
| |||||||||||||||||||||||||||
Net assets, end of period | $ | 9,824,323 | $ | 8,968,940 | $ | 6,460,768 | $ | 102,562 | ||||||||||||||||||||
Ratios to average net assets: | ||||||||||||||||||||||||||||
Expenses, before reimbursements | 1.01 | % | 1.22 | % | 1.74 | % | 9.14 | %G | ||||||||||||||||||||
Expenses, net of reimbursements | 0.72 | % | 0.72 | % | 0.72 | % | 0.72 | %G | ||||||||||||||||||||
Net investment income (loss), before expense reimbursements | 2.69 | % | 3.81 | % | 3.22 | % | (3.68 | )%G | ||||||||||||||||||||
Net investment income, net of reimbursements | 2.98 | % | 4.31 | % | 4.24 | % | 4.74 | %G | ||||||||||||||||||||
Portfolio turnover rate | 185 | % | 198 | % | 135 | % | 27 | %F | ||||||||||||||||||||
| A | Prior to February 28, 2020, the R5 Class was known as Institutional Class. |
| B | Commencement of operations. |
| C | Per share amounts have been calculated using the average shares method. |
| D | Tax return of capital is calculated based on shares outstanding at the time of distribution. |
| E | Based on net asset value, which does not reflect the sales charge, redemption fee, or contingent deferred sales charge, if applicable. May include adjustments in accordance with U.S. GAAP and as such, the net asset value for reporting purposes and the returns based upon those net asset values may differ from the net asset value and returns for shareholder transactions. |
| F | Not annualized. |
| G | Annualized. |
See accompanying notes
87
American Beacon TwentyFour Strategic Income FundSM
Financial Highlights
(For a share outstanding throughout the period)
| Y Class | ||||||||||||||||||||||||||||
| Year Ended June 30, | April 3, 2017A to | |||||||||||||||||||||||||||
| 2020 | 2019 | 2018 | 2017 | |||||||||||||||||||||||||
|
|
|
| |||||||||||||||||||||||||
Net asset value, beginning of period | $ | 10.22 | $ | 10.06 | $ | 10.16 | $ | 10.00 | ||||||||||||||||||||
|
|
|
|
|
|
|
| |||||||||||||||||||||
Income (loss) from investment operations: | ||||||||||||||||||||||||||||
Net investment income | 0.37 | 0.42 | 0.46 | 0.11 | ||||||||||||||||||||||||
Net gains (losses) on investments (both realized and unrealized) | 0.01 | 0.27 | (0.11 | ) | 0.14 | |||||||||||||||||||||||
|
|
|
|
|
|
|
| |||||||||||||||||||||
Total income (loss) from investment operations | 0.38 | 0.69 | 0.35 | 0.25 | ||||||||||||||||||||||||
|
|
|
|
|
|
|
| |||||||||||||||||||||
Less distributions: | ||||||||||||||||||||||||||||
Dividends from net investment income | (0.35 | ) | (0.52 | ) | (0.45 | ) | - | |||||||||||||||||||||
Distributions from net realized gains | - | (0.01 | ) | - | - | |||||||||||||||||||||||
Tax return of capitalB | - | - | - | (0.09 | ) | |||||||||||||||||||||||
|
|
|
|
|
|
|
| |||||||||||||||||||||
Total distributions | (0.35 | ) | (0.53 | ) | (0.45 | ) | (0.09 | ) | ||||||||||||||||||||
|
|
|
|
|
|
|
| |||||||||||||||||||||
Net asset value, end of period | $ | 10.25 | $ | 10.22 | $ | 10.06 | $ | 10.16 | ||||||||||||||||||||
|
|
|
|
|
|
|
| |||||||||||||||||||||
Total returnC | 3.82 | % | 7.18 | % | 3.49 | % | 2.48 | %D | ||||||||||||||||||||
|
|
|
|
|
|
|
| |||||||||||||||||||||
Ratios and supplemental data: | ||||||||||||||||||||||||||||
Net assets, end of period | $ | 89,459,856 | $ | 38,664,428 | $ | 22,277,957 | $ | 657,411 | ||||||||||||||||||||
Ratios to average net assets: | ||||||||||||||||||||||||||||
Expenses, before reimbursements | 1.09 | % | 1.42 | % | 1.78 | % | 7.64 | %E | ||||||||||||||||||||
Expenses, net of reimbursements | 0.82 | % | 0.82 | % | 0.82 | % | 0.82 | %E | ||||||||||||||||||||
Net investment income (loss), before expense reimbursements | 2.58 | % | 3.60 | % | 3.25 | % | (2.94 | )%E | ||||||||||||||||||||
Net investment income, net of reimbursements | 2.85 | % | 4.20 | % | 4.21 | % | 3.88 | %E | ||||||||||||||||||||
Portfolio turnover rate | 185 | % | 198 | % | 135 | % | 27 | %D | ||||||||||||||||||||
| A | Commencement of operations. |
| B | Tax return of capital is calculated based on shares outstanding at the time of distribution. |
| C | Based on net asset value, which does not reflect the sales charge, redemption fee, or contingent deferred sales charge, if applicable. May include adjustments in accordance with U.S. GAAP and as such, the net asset value for reporting purposes and the returns based upon those net asset values may differ from the net asset value and returns for shareholder transactions. |
| D | Not annualized. |
| E | Annualized. |
See accompanying notes
88
American Beacon TwentyFour Strategic Income FundSM
Financial Highlights
(For a share outstanding throughout the period)
| Investor Class | ||||||||||||||||||||||||||||
| Year Ended June 30, | April 3, 2017A to | |||||||||||||||||||||||||||
| 2020 | 2019 | 2018 | 2017 | |||||||||||||||||||||||||
|
| |||||||||||||||||||||||||||
Net asset value, beginning of period | $ | 10.15 | $ | 10.02 | $ | 10.16 | $ | 10.00 | ||||||||||||||||||||
|
|
|
|
|
|
|
| |||||||||||||||||||||
Income (loss) from investment operations: | ||||||||||||||||||||||||||||
Net investment income | 0.44 | 0.38 | 0.43 | 0.14 | ||||||||||||||||||||||||
Net gains (losses) on investments (both realized and unrealized) | (0.08 | ) | 0.27 | (0.12 | ) | 0.11 | ||||||||||||||||||||||
|
|
|
|
|
|
|
| |||||||||||||||||||||
Total income (loss) from investment operations | 0.36 | 0.65 | 0.31 | 0.25 | ||||||||||||||||||||||||
|
|
|
|
|
|
|
| |||||||||||||||||||||
Less distributions: | ||||||||||||||||||||||||||||
Dividends from net investment income | (0.35 | ) | (0.51 | ) | (0.45 | ) | - | |||||||||||||||||||||
Distributions from net realized gains | - | (0.01 | ) | - | - | |||||||||||||||||||||||
Tax return of capitalB | - | - | - | (0.09 | ) | |||||||||||||||||||||||
|
|
|
|
|
|
|
| |||||||||||||||||||||
Total distributions | (0.35 | ) | (0.52 | ) | (0.45 | ) | (0.09 | ) | ||||||||||||||||||||
|
|
|
|
|
|
|
| |||||||||||||||||||||
Net asset value, end of period | $ | 10.16 | $ | 10.15 | $ | 10.02 | $ | 10.16 | ||||||||||||||||||||
|
|
|
|
|
|
|
| |||||||||||||||||||||
Total returnC | 3.58 | % | 6.84 | % | 3.09 | % | 2.48 | %D | ||||||||||||||||||||
|
|
|
|
|
|
|
| |||||||||||||||||||||
Ratios and supplemental data: | ||||||||||||||||||||||||||||
Net assets, end of period | $ | 14,710,345 | $ | 1,422,906 | $ | 1,271,611 | $ | 240,201 | ||||||||||||||||||||
Ratios to average net assets: | ||||||||||||||||||||||||||||
Expenses, before reimbursements | 1.42 | % | 1.69 | % | 2.16 | % | 10.00 | %E | ||||||||||||||||||||
Expenses, net of reimbursements | 1.09 | % | 1.09 | % | 1.09 | % | 1.09 | %E | ||||||||||||||||||||
Net investment income (loss), before expense reimbursements | 2.23 | % | 3.30 | % | 2.89 | % | (4.86 | )%E | ||||||||||||||||||||
Net investment income, net of reimbursements | 2.56 | % | 3.90 | % | 3.96 | % | 4.06 | %E | ||||||||||||||||||||
Portfolio turnover rate | 185 | % | 198 | % | 135 | % | 27 | %D | ||||||||||||||||||||
| A | Commencement of operations. |
| B | Tax return of capital is calculated based on shares outstanding at the time of distribution. |
| C | Based on net asset value, which does not reflect the sales charge, redemption fee, or contingent deferred sales charge, if applicable. May include adjustments in accordance with U.S. GAAP and as such, the net asset value for reporting purposes and the returns based upon those net asset values may differ from the net asset value and returns for shareholder transactions. |
| D | Not annualized. |
| E | Annualized. |
See accompanying notes
89
American Beacon TwentyFour Strategic Income FundSM
Financial Highlights
(For a share outstanding throughout the period)
| A Class | ||||||||||||
| Year Ended June 30, 2020 | October 29, 2018A to 2019 | |||||||||||
|
| |||||||||||
Net asset value, beginning of period | $ | 10.16 | $ | 9.95 | ||||||||
|
|
|
| |||||||||
Income (loss) from investment operations: | ||||||||||||
Net investment income | 0.23 | 0.33 | ||||||||||
Net gains on investments (both realized and unrealized) | 0.11 | 0.26 | ||||||||||
|
|
|
| |||||||||
Total income (loss) from investment operations | 0.34 | 0.59 | ||||||||||
|
|
|
| |||||||||
Less distributions: | ||||||||||||
Dividends from net investment income | (0.34 | ) | (0.37 | ) | ||||||||
Distributions from net realized gains | - | (0.01 | ) | |||||||||
|
|
|
| |||||||||
Total distributions | (0.34 | ) | (0.38 | ) | ||||||||
|
|
|
| |||||||||
Net asset value, end of period | $ | 10.16 | $ | 10.16 | ||||||||
|
|
|
| |||||||||
Total returnB | 3.44 | % | 6.18 | %C | ||||||||
|
|
|
| |||||||||
Ratios and supplemental data: | ||||||||||||
Net assets, end of period | $ | 5,216,325 | $ | 6,270,835 | ||||||||
Ratios to average net assets: | ||||||||||||
Expenses, before reimbursements | 1.34 | % | 1.78 | %D | ||||||||
Expenses, net of reimbursements | 1.12 | % | 1.12 | %D | ||||||||
Net investment income, before expense reimbursements | 2.35 | % | 3.30 | %D | ||||||||
Net investment income, net of reimbursements | 2.57 | % | 3.96 | %D | ||||||||
Portfolio turnover rate | 185 | % | 198 | %C | ||||||||
| A | Commencement of operations. |
| B | Based on net asset value, which does not reflect the sales charge, redemption fee, or contingent deferred sales charge, if applicable. May include adjustments in accordance with U.S. GAAP and as such, the net asset value for reporting purposes and the returns based upon those net asset values may differ from the net asset value and returns for shareholder transactions. |
| C | Not annualized. |
| D | Annualized. |
See accompanying notes
90
American Beacon TwentyFour Strategic Income FundSM
Financial Highlights
(For a share outstanding throughout the period)
| C Class | ||||||||||||
| Year Ended June 30, 2020 | October 29, 2018A to 2019 | |||||||||||
|
| |||||||||||
Net asset value, beginning of period | $ | 10.14 | $ | 9.95 | ||||||||
|
|
|
| |||||||||
Income (loss) from investment operations: | ||||||||||||
Net investment income | 0.30 | 0.24 | ||||||||||
Net gains (losses) on investments (both realized and unrealized) | (0.03 | ) | 0.30 | |||||||||
|
|
|
| |||||||||
Total income (loss) from investment operations | 0.27 | 0.54 | ||||||||||
|
|
|
| |||||||||
Less distributions: | ||||||||||||
Dividends from net investment income | (0.28 | ) | (0.34 | ) | ||||||||
Distributions from net realized gains | - | (0.01 | ) | |||||||||
|
|
|
| |||||||||
Total distributions | (0.28 | ) | (0.35 | ) | ||||||||
|
|
|
| |||||||||
Net asset value, end of period | $ | 10.13 | $ | 10.14 | ||||||||
|
|
|
| |||||||||
Total returnB | 2.72 | % | 5.63 | %C | ||||||||
|
|
|
| |||||||||
Ratios and supplemental data: | ||||||||||||
Net assets, end of period | $ | 4,735,447 | $ | 1,659,229 | ||||||||
Ratios to average net assets: | ||||||||||||
Expenses, before reimbursements | 2.14 | % | 2.58 | %D | ||||||||
Expenses, net of reimbursements | 1.87 | % | 1.87 | %D | ||||||||
Net investment income, before expense reimbursements | 1.57 | % | 2.50 | %D | ||||||||
Net investment income, net of reimbursements | 1.84 | % | 3.20 | %D | ||||||||
Portfolio turnover rate | 185 | % | 198 | %C | ||||||||
| A | Commencement of operations. |
| B | Based on net asset value, which does not reflect the sales charge, redemption fee, or contingent deferred sales charge, if applicable. May include adjustments in accordance with U.S. GAAP and as such, the net asset value for reporting purposes and the returns based upon those net asset values may differ from the net asset value and returns for shareholder transactions. |
| C | Not annualized. |
| D | Annualized. |
See accompanying notes
91
American Beacon TwentyFour Strategic Income FundSM
Financial Highlights
(For a share outstanding throughout the period)
| Ultra Class | ||||||||||||||||||||||||||||
| Year Ended June 30, | April 3, 2017A to June 30, 2017 | |||||||||||||||||||||||||||
| 2020 | 2019 | 2018 | ||||||||||||||||||||||||||
|
| |||||||||||||||||||||||||||
Net asset value, beginning of period | $ | 10.25 | $ | 10.08 | $ | 10.17 | $ | 10.00 | ||||||||||||||||||||
|
|
|
|
|
|
|
| |||||||||||||||||||||
Income from investment operations: | ||||||||||||||||||||||||||||
Net investment income | 0.35 | B | 0.44 | 0.47 | 0.21 | |||||||||||||||||||||||
Net gains (losses) on investments (both realized and unrealized) | 0.05 | 0.26 | (0.11 | ) | 0.05 | |||||||||||||||||||||||
|
|
|
|
|
|
|
| |||||||||||||||||||||
Total income (loss) from investment operations | 0.40 | 0.70 | 0.36 | 0.26 | ||||||||||||||||||||||||
|
|
|
|
|
|
|
| |||||||||||||||||||||
Less distributions: | ||||||||||||||||||||||||||||
Dividends from net investment income | (0.35 | ) | (0.52 | ) | (0.45 | ) | - | |||||||||||||||||||||
Distributions from net realized gains | - | (0.01 | ) | - | - | |||||||||||||||||||||||
Tax return of capitalC | - | - | - | (0.09 | ) | |||||||||||||||||||||||
|
|
|
|
|
|
|
| |||||||||||||||||||||
Total distributions | (0.35 | ) | (0.53 | ) | (0.45 | ) | (0.09 | ) | ||||||||||||||||||||
|
|
|
|
|
|
|
| |||||||||||||||||||||
Net asset value, end of period | $ | 10.30 | $ | 10.25 | $ | 10.08 | $ | 10.17 | ||||||||||||||||||||
|
|
|
|
|
|
|
| |||||||||||||||||||||
Total returnE | 3.99 | % | 7.27 | % | 3.59 | % | 2.58 | %D | ||||||||||||||||||||
|
|
|
|
|
|
|
| |||||||||||||||||||||
Ratios and supplemental data: |
| |||||||||||||||||||||||||||
Net assets, end of period | $ | 98,911 | $ | 9,784,614 | $ | 9,114,222 | $ | 15,077,638 | ||||||||||||||||||||
Ratios to average net assets: | ||||||||||||||||||||||||||||
Expenses, before reimbursements | 1.15 | % | 1.32 | % | 1.73 | % | 4.61 | %F | ||||||||||||||||||||
Expenses, net of reimbursements | 0.67 | % | 0.67 | % | 0.67 | % | 0.69 | %F | ||||||||||||||||||||
Net investment income, before expense reimbursements | 2.80 | % | 3.69 | % | 3.41 | % | 0.84 | %F | ||||||||||||||||||||
Net investment income, net of reimbursements | 3.28 | % | 4.33 | % | 4.48 | % | 4.77 | %F | ||||||||||||||||||||
Portfolio turnover rate | 185 | % | 198 | % | 135 | % | 27 | %D | ||||||||||||||||||||
| A | Commencement of operations. |
| B | Per share amounts have been calculated using the average shares method. |
| C | Return of capital is calculated based on shares outstanding at the time of distribution. |
| D | Not annualized. |
| E | Based on net asset value, which does not reflect the sales charge, redemption fee, or contingent deferred sales charge, if applicable. May include adjustments in accordance with U.S. GAAP and as such, the net asset value for reporting purposes and the returns based upon those net asset values may differ from the net asset value and returns for shareholder transactions. |
| F | Annualized. |
See accompanying notes
92
American Beacon FundSM
June 30, 2020 (Unaudited)
Certain tax information regarding the Funds are required to be provided to shareholders based upon the Fund’s income and distributions for the taxable year ended June 30, 2020. The information and distributions reported herein may differ from information and distributions taxable to the shareholders for the calendar year ended December 31, 2019.
The Fund designated the following items with regard to distributions paid during the fiscal year ended June 30, 2020. All designations are based on financial information available as of this annual report and, accordingly, are subject to change. For each item, it is the intention of the Funds to designate the maximum amount permitted under the Internal Revenue Code of 1986, as amended, and the regulations there under.
Corporate Dividends-Received Deduction:
SSI Alternative Income Fund | 29.56 | % | ||
TwentyFour Short Term Bond Fund | n/a | |||
TwentyFour Strategic Income Fund | 0.00 | % |
Qualified Dividend Income:
SSI Alternative Income Fund | 29.80 | % | ||
TwentyFour Short Term Bond Fund | n/a | |||
TwentyFour Strategic Income Fund | 0.00 | % |
Long-Term Capital Gain Distributions:
SSI Alternative Income Fund | – | |||
TwentyFour Short Term Bond Fund | – | |||
TwentyFour Strategic Income Fund | – |
Short-Term Capital Gain Distributions:
SSI Alternative Income Fund | – | |||
TwentyFour Short Term Bond Fund | – | |||
TwentyFour Strategic Income Fund | – |
Shareholders will receive notification in January 2021 of the applicable tax information necessary to prepare their 2020 income tax returns.
93
Disclosure Regarding Approvals of the Management and Investment Advisory Agreement (Unaudited)
At meetings held on May 14, 2020 and June 3-4, 2020 (collectively, the “Meetings”) via videoconference, the Board of Trustees (“Board” or “Trustees”) considered and then, at its June 4, 2020 meeting, approved the renewal of:
(1) the Management Agreement between American Beacon Advisors, Inc. (“Manager”) and the American Beacon Funds (“Trust”), on behalf of the American Beacon SSI Alternative Income Fund (“SSI Fund”) and the American Beacon TwentyFour Strategic Income Fund (“Strategic Income Fund”) (each, a “Fund” and collectively, the “Funds”);
(2) the Investment Advisory Agreement among the Manager, SSI Investment Management LLC (“SSI”), and the Trust, on behalf of the SSI Fund; and
(3) the Investment Advisory Agreement among the Manager, TwentyFour Asset Management (US), LP (“TwentyFour” and together with SSI, the “subadvisors”), and the Trust, on behalf of the Strategic Income Fund.
The Management Agreement and the Investment Advisory Agreements are referred to herein individually as an “Agreement” and collectively as the “Agreements.” In preparation for its consideration of the renewal of the Agreements, the Board undertook steps to gather and consider information furnished by the Manager, the subadvisors, Broadridge, Inc. (“Broadridge”) and Morningstar, Inc. (“Morningstar”). The Board, with the assistance of independent legal counsel, requested and received certain relevant information from the Manager and each subadvisor.
In advance of the Meetings, the Board’s Investment Committee and/or the Manager coordinated the production of information from Broadridge and Morningstar regarding the performance, fees and expenses of the Funds as well as information from the Manager and the subadvisors. At the Meetings, the Board considered the information provided in connection with the renewal process, as well as information furnished to the Board throughout the year at regular meetings of the Board and its committees. In connection with the Board’s consideration of the Agreements, the Board received and evaluated such information as they deemed necessary. This information is described below in the section summarizing the factors the Board considered in connection with its renewal and approval of the Agreements, as well as the section describing additional Board considerations with respect to each Fund.
The Board noted that the Manager provides management and administrative services to the Funds pursuant to the Management Agreement. The Board considered that many mutual funds have separate contracts governing each type of service and observed that, with respect to such mutual funds, the actual management fee rates provided by Broadridge for peer group funds reflect the combined advisory and administrative expenses, reduced by any fee waivers and/or reimbursements.
A firm may not have been able to, or opted not to, provide information in response to certain information requests, in which case the Board conducted its evaluation of the firm based on information that was provided. In such cases, the Board determined that the omission of any such information was not material to its considerations. For each Fund, the class of shares used for comparative performance purposes was the share class with the lowest expenses available for purchase by the general public, which was the R5 Class. The Board also considered that the use of R5 Class performance generally facilitates a meaningful comparison for expense and performance purposes.
Provided below is an overview of certain factors the Board considered in connection with its decision to approve the renewal of the Agreements. The Board did not identify any particular information that was most relevant to its consideration of whether to approve the renewal of each Agreement, and each Trustee may have afforded different weight to the various factors. Legal counsel to the independent Trustees provided the Board with a memorandum regarding its responsibilities pertaining to the renewal of investment advisory contracts, such as the Agreements, and related regulatory guidelines. Based on its evaluation, the Board unanimously concluded that the terms of each Agreement were reasonable and fair and that the approval of the renewal of each Agreement was in the best interests of the Funds and their shareholders.
94
Disclosure Regarding Approvals of the Management and Investment Advisory Agreement (Unaudited)
Considerations With Respect to the Renewal of the Management Agreements and the Investment Advisory Agreements
In determining whether to approve the renewal of the Agreements, the Board considered each Fund’s investment management and subadvisory relationships separately. In each instance, the Board considered, among other things, the following factors: (1) the nature, extent and quality of the services provided; (2) the investment performance of the Funds and the subadvisor for each Fund; (3) the costs incurred by the Manager and SSI in rendering services to each Fund and its resulting profits or losses; (4) comparisons of services and fee rates with contracts entered into by the Manager or the subadvisors or their affiliates with other clients (such as pension funds and other institutional clients); (5) the extent to which economies of scale, if any, have been taken into account in setting each fee rate schedule; (6) whether fee rate levels reflect economies of scale, if any, for the benefit of Fund investors; and (7) any other benefits derived or anticipated to be derived by the Manager or the subadvisors from their relationships with each Fund.
Nature, Extent and Quality of Services. With respect to the renewal of the Management Agreement, the Board considered, among other factors: the SSI Fund’s long-term performance and the Strategic Income Fund’s performance since its inception in 2017; the length of service of key investment personnel at the Manager; the cost structure of the Funds; the Manager’s culture of compliance and support that reduce risks to the Funds; the Manager’s quality of services; the Manager’s active role in monitoring and, as appropriate, recommending additional or replacement subadvisors; and the Manager’s efforts to retain key employees and maintain staffing levels.
With respect to the renewal of each Investment Advisory Agreement, the Board considered, among other factors: the level of staffing and the size of the subadvisor; the adequacy of the resources committed to the Fund by the subadvisor; the financial stability of the subadvisor; and representations made by the subadvisor regarding its compliance program. Based on the foregoing information, the Board concluded that the nature, extent and quality of the management and advisory services provided by the Manager and each subadvisor were appropriate for each Fund.
Investment Performance. The Board evaluated the comparative information provided by Broadridge and the Manager regarding the performance of each Fund relative to its Broadridge performance universe, Morningstar Category, and/or benchmark index, as well as the Fund’s Morningstar rating. The Board considered the information provided by Broadridge regarding its independent methodology for selecting each Fund’s Broadridge performance universe. The Board also considered that the performance universes selected by Broadridge may not provide appropriate comparisons for a Fund due to its unique investment strategies. In addition, the Board considered the performance reports and discussions with management at Board and Committee meetings throughout the year. The Board also evaluated the comparative information provided by each subadvisor regarding the performance of each Fund relative to the performance of other comparable investment accounts managed by the subadvisor and each Fund’s benchmark index and/or an appropriate peer group for the Fund. In addition, the Board considered the Manager’s recommendation to continue to retain each subadvisor. A summary of the Board’s considerations with respect to each Fund’s performance appears below under “Additional Considerations and Conclusions with Respect to Each Fund.”
Costs of the Services Provided to the Funds and the Profits Realized by the Manager from its Relationship with the Funds. In analyzing the cost of services and profitability of the Manager, the Board considered the revenues earned and the expenses incurred by the Manager, before and after the payment of distribution-related expenses by the Manager. The profits or losses were noted at both an aggregate level for all funds within the group of mutual funds sponsored by the Manager (the “Fund Complex”) and at an individual Fund level, with the Manager sustaining a profit before payment of distribution-related expenses by the Manager and a loss after the payment of distribution-related expenses by the Manager with respect to the SSI Fund and loss before and after the payment of distribution-related expenses by the Manager with respect to the Strategic Income Fund. The Board also considered comparative information provided by the Manager regarding the Manager’s overall profitability with respect to the Fund Complex relative to the overall profitability of other firms in the mutual fund industry, as disclosed in publicly
95
Disclosure Regarding Approvals of the Management and Investment Advisory Agreement (Unaudited)
available sources. Although the Board noted that, in certain cases, the fee rates paid by other clients of the Manager are lower than the fee rates paid by the Funds, the Manager represented that, among other matters, the difference is attributable to the fact that the Manager does not perform administrative services for non-investment company clients and reflects the greater level of responsibility and regulatory requirements associated with managing the Funds.
The Board also noted that the Manager proposed to continue the expense waivers and reimbursements for the Funds that were in place during the last fiscal year. The Board further considered that, with respect to each Fund, the Management Agreement provides for the Manager to receive a management fee comprised of an annualized fee that is retained by the Manager. The Board also noted that certain share classes of the Funds maintain higher expense ratios in order to compensate third-party financial intermediaries.
In analyzing the fee rates charged by each subadvisor in connection with its investment advisory services to a Fund, the Board considered representations made by the subadvisors that each Fund’s subadvisory fee rate schedule generally was favorable compared to other comparable client accounts. The Board requested profitability data from SSI, an affiliate of the Manager, but did not request profitability data from TwentyFour because the Board did not view this data as imperative to its deliberations given the arm’s-length nature of the relationship between the Manager and TwentyFour with respect to the negotiation of subadvisory fee rates. In addition, the Board noted that TwentyFour may not account for its profits on an account-by-account basis and that different firms likely employ different methodologies in connection with these calculations. The Board considered the cost of services and profitability of SSI.
Based on the foregoing information, the Board concluded that the profitability levels of the Manager were reasonable in light of the services performed by the Manager and the profitability levels of SSI were reasonable in light of the services performed by SSI. A discussion regarding the Board’s considerations with respect to each Fund’s fee rates is set forth below under “Additional Considerations and Conclusions with Respect to Each Fund.”
Economies of Scale. In considering the reasonableness of the management and investment advisory fees rates, the Board considered whether economies of scale will be realized as each Fund grows and whether fee rate levels reflect these economies of scale for the benefit of Fund shareholders. In this regard, the Board considered that the Manager has negotiated breakpoints for the subadvisory fee rate for each Fund. The Board considered that no Fund’s current assets exceeded the threshold necessary to reach the first subadvisory fee rate breakpoint.
In addition, the Board noted the Manager’s representation that the Management Agreements contain fee schedule breakpoints at higher asset levels with respect to each Fund. In this regard, the Board considered the Manager’s representation that no Fund’s current assets exceeded the threshold necessary to reach the first management fee breakpoint. Based on the foregoing information, the Board concluded that the Manager and subadvisor fee rate schedules for each Fund provide for a reasonable sharing of benefits from any economies of scale with each Fund.
Benefits Derived from the Relationship with the Funds. The Board considered the “fall-out” or ancillary benefits that accrue to the Manager and/or the subadvisors as a result of the advisory relationships with the Funds, including greater exposure in the marketplace with respect to the Manager’s or a subadvisor’s investment process and expanding the level of assets under management by the Manager and the subadvisors. The Board also considered that the Manager may invest the Funds’ cash balances in the American Beacon U.S. Government Money Market Select Fund, which the Manager manages directly. In addition, the Board noted that SSI may benefit from soft-dollar arrangements for proprietary and/or third-party research. Based on the foregoing information, the Board concluded that the potential benefits accruing to the Manager and the subadvisors by virtue of their relationships with the Funds appear to be fair and reasonable.
96
Disclosure Regarding Approvals of the Management and Investment Advisory Agreement (Unaudited)
Additional Considerations and Conclusions with Respect to Each Fund
The performance comparisons below were made for each Fund’s R5 Class shares in comparison to the Fund’s Broadridge performance universe and Morningstar Category. With respect to the Broadridge performance universe, the 1st Quintile represents the top 20 percent of the universe based on performance and the 5th Quintile represents the bottom 20 percent of the universe based on performance. References below to each Fund’s Broadridge performance universe are to the universe of mutual funds with a comparable investment classification/objective included in the analysis provided by Broadridge. In reviewing the performance of the SSI Fund, the Board viewed longer-term performance over a full market cycle, typically five years or longer, as the most important consideration because relative performance over shorter periods may be significantly impacted by market or economic events and not necessarily reflective of manager skill.
The expense comparisons below were made for each Fund’s R5 Class shares in comparison to the Fund’s Broadridge expense universe and Broadridge expense group, with the 1st Quintile representing the lowest 20 percent of the universe or group based on lowest total expense and the 5th Quintile representing the highest 20 percent of the universe or group based on highest total expense. References below to each Fund’s expense group and expense universe are to the respective group or universe of comparable mutual funds included in the analysis by Broadridge. A Broadridge expense group consists of the Fund and a representative sample of funds with similar operating structures and asset sizes, as selected by Broadridge. A Broadridge expense universe includes all funds with a comparable investment classification/objective and a similar operating structure as the share class of the Fund included in the Broadridge comparative information, including the expense group, and provides a broader view of expenses across the Fund’s investment classification/objective. The Board also considered each Fund’s Morningstar fee level category with the 1st Quintile representing the lowest 20 percent of the category constituents and the 5th Quintile representing the highest 20 percent of the category in terms of total expense. In reviewing expenses, the Board considered the positive impact of fee waivers and the Manager’s agreement to continue the fee waivers. In addition, information regarding each subadvisor’s use of soft dollars was requested from the Manager and was considered by the Board.
Additional Considerations and Conclusions with Respect to the American Beacon SSI Alternative Income Fund
In considering the renewal of the Agreements for the SSI Fund, the Board considered the following additional factors:
Broadridge Total Expenses Excluding 12b-1 Fees and Morningstar Fee Level Ranking
| Compared to Broadridge Expense Group | 4th Quintile | |
| Compared to Broadridge Expense Universe | 5th Quintile | |
| Morningstar Fee Level Ranking | 3rd Quintile | |
Broadridge and Morningstar Performance Analysis (five-year period ended December 31, 2019)
| Compared to Broadridge Performance Universe | 1st Quintile | |
| Compared to Morningstar Category | 1st Quintile | |
The Board also considered: (1) the SSI Fund’s expenses are higher than the median of its Broadridge expense group and expense universe, but that the SSI Fund, on a net-of-fee basis, ranked in the first quintile of its Broadridge performance universe and Morningstar category for the 5-year period ended December 31, 2019; (2) the SSI Fund employs a limited-capacity strategy, as the subadvisor invests primarily in convertible bonds; (3) information provided by the subadvisor regarding fee rates charged for managing assets in the same or a similar strategy as the subadvisor manages the SSI Fund; (4) that the subadvisor is an affiliate of the Manager; (5) the subadvisor’s representation that it had earned a profit with respect to the services that it provides to the SSI Fund; (6) the SSI Fund acquired all of the assets of the Palmer Square SSI Alternative Income Fund (“Acquired Fund”), on
97
Disclosure Regarding Approvals of the Management and Investment Advisory Agreement (Unaudited)
May 17, 2019, and that the SSI Fund’s performance prior to that date is that of the Acquired Fund; and (7) the Manager’s recommendation to continue to retain the subadvisor based upon, among other factors, the relatively brief period since this SSI Fund was acquired.
Based on these and other considerations, the Board: (1) concluded that the fees paid to the Manager and subadvisor under the Management and Investment Advisory Agreements are fair and reasonable; and (2) determined that the SSI Fund and its shareholders would benefit from the Manager’s and subadvisor’s continued management of the SSI Fund.
Additional Considerations and Conclusions with Respect to the American Beacon TwentyFour Strategic Income Fund
In considering the renewal of the Agreements for the Strategic Income Fund, the Board considered the following additional factors:
Broadridge Total Expense Analysis Excluding 12b-1 Fees and Morningstar Fee Level Ranking
| Compared to Broadridge Expense Group | 4th Quintile | |
| Compared to Broadridge Expense Universe | 4th Quintile | |
| Morningstar Fee Level Ranking | 4th Quintile | |
Broadridge and Morningstar Performance Analysis (one-year period ended December 31, 2019)
| Compared to Broadridge Performance Universe | 2nd Quintile | |
| Compared to Morningstar Category | 1st Quintile | |
The Board also considered: (1) information provided by the subadvisor regarding fee rates charged for managing assets in the same or a similar strategy as the subadvisor manages the Strategic Income Fund; (2) that the Strategic Income Fund invests more significantly in non-U.S. issuers than the funds in its Broadridge performance universe and Morningstar category, which causes the Fund to incur higher overall expenses; (3) that the Strategic Income Fund acquired all of the assets of the American Beacon Flexible Bond Fund, a series of the Trust, on November 16, 2018; and (4) the Manager’s recommendation to continue to retain the subadvisor based upon, among other factors, the relatively brief period that the Strategic Income Fund has been in operation.
Based on these and other considerations, the Board: (1) concluded that the fees paid to the Manager and the subadvisor under the Management and Investment Advisory Agreements are fair and reasonable; and (2) determined that the Fund and its shareholders would benefit from the Manager’s and subadvisor’s continued management of the Strategic Income Fund.
Initial Approval of Management Agreement and Investment Advisory Agreement
At its November 11-12, 2019 meetings, the Board considered:
(1) the approval of the Management Agreement between the Manager and the Trust, on behalf of the American Beacon TwentyFour Short Term Bond Fund (“Bond Fund”), a newly created series of the Trust; and
(2) the approval of the Investment Advisory Agreement among the Manager, the Trust, on behalf of the Fund, and TwentyFour, the Fund’s proposed subadviser.
Approval of the Management Agreement
Prior to the meeting, information was provided to the Board by the Manager in response to requests from the Board in connection with the Board’s consideration of the Management Agreement for the Bond Fund. The
98
Disclosure Regarding Approvals of the Management and Investment Advisory Agreement (Unaudited)
Investment Committee of the Board also met with representatives of the Manager. The Board also considered information that had been provided by the Manager to the Board at the May 9, 2019 and June 4-5, 2019 Board meetings in connection with the review of the then-current Management Agreement between the Manager and the Trust as it related to the existing series of the Trust (“Existing Funds”).
Provided below is an overview of the primary factors the Board considered at its November 11-12, 2019 meetings at which the Board considered the approval of the Management Agreement with respect to the Bond Fund. In determining whether to approve the Management Agreement, the Board considered, among other things, the following factors with respect to the Bond Fund: (1) the nature and quality of the services to be provided; (2) the estimated costs to be incurred by the Manager in rendering its services to the Bond Fund and the resulting profits or losses; (3) the extent to which economies of scale, if any, have been taken into account in setting the fee schedule; (4) whether fee levels reflect economies of scale, if any, for the benefit of investors; (5) comparisons of services and fees with contracts entered into by the Manager with the Existing Funds; and (6) any other benefits derived or anticipated to be derived by the Manager from its relationship with the Bond Fund.
The Board did not identify any particular information that was most relevant to its consideration of the Management Agreement, and each Trustee may have afforded different weight to the various factors. Legal counsel to the Independent Trustees provided the Board with a memorandum regarding its responsibilities pertaining to the approval of investment advisory contracts, such as the Management Agreement. The memorandum explained the regulatory requirements surrounding the Trustees’ process for evaluating investment advisors and the terms of investment advisory contracts. Based on its evaluation, the Board unanimously concluded that the terms of the Management Agreement were reasonable and fair and that the approval of the Management Agreement was in the best interests of the Bond Fund.
Nature, Extent and Quality of Services. The Board considered that it had reviewed the Management Agreement between the Manager and the Trust as it relates to the Existing Funds at its May 9, 2019 and June 4-5, 2019 meetings. At those meetings, the Board received detailed information regarding the Manager, including information with respect to the scope of services provided by the Manager to the Existing Funds and the background and experience of the Manager’s key investment personnel. The Board also considered representations made by the Manager at the Board’s May 9, 2019 and June 4-5, 2019 meetings. At those meetings, the Manager described its disciplined investment approach and goal to provide above average long-term performance on behalf of the Existing Funds and detailed the culture of compliance and support that reduces risks to the Existing Funds. The Board considered the Manager’s representation that the advisory, administrative and related services proposed to be provided to the Bond Fund will be consistent with the services provided to the Existing Funds that have a single investment subadviser. In addition, the Board considered the background and experience of key investment personnel who will have primary responsibility for the day-to-day oversight of the Bond Fund. Based on the foregoing information, the Board concluded that the nature, extent and quality of the services to be provided by the Manager were appropriate for the Bond Fund.
Investment Performance. The Board considered that the Bond Fund is new and, therefore, had no historical performance for the Board to review with respect to the Manager. The Board also considered that it would review the historical investment performance record relevant to the Fund’s investment professionals in connection with its consideration of the Advisory Agreement.
Costs of the Services Provided to the Fund and the Profits or Losses to be Realized by the Manager from its Relationship with the Fund. In analyzing the cost of services and profitability of the Manager, the Board considered the estimated revenues to be earned and the expenses to be incurred by the Manager with respect to the Bond Fund.
The Board then considered that, at assumed estimated initial asset levels, the Manager was projected to incur a pre-tax loss before and after distribution revenues and expenses from its first year of rendering services to the Bond Fund. The Board also considered the amounts of those projected losses. The Board considered the Manager’s explanation regarding its cost allocation methodology in calculating these projections.
Comparisons of the amounts to be paid to the Manager under the Management Agreement and other funds in the Select Peer Group. In evaluating the Management Agreement, the Board reviewed the Manager’s proposed
99
Disclosure Regarding Approvals of the Management and Investment Advisory Agreement (Unaudited)
management fee schedule. The Board considered a comparison of the management fee rate to be charged by the Manager under the Management Agreement versus the fee rates charged by the Manager to other single-subadviser funds in the Trust. The Board considered the Manager’s representation that the contractual management fee rate proposed by the Manager for the Bond Fund, when combined with the proposed contractual advisory fee rate to be paid to TwentyFour, is higher than the average advisory fee rate paid by peer group funds in the Fund’s potential Morningstar category (the “Select Peer Group”). The Board considered that the Manager had contractually agreed to limit the Bond Fund’s total expenses through at least October 31, 2021, at competitive market levels, which are slightly below or above the Select Peer Group averages depending on the share class. This information assisted the Board in concluding that the management fee rate appeared to be within a reasonable range for the services to be provided to the Bond Fund, in light of all the factors considered.
Economies of Scale. The Board considered the Manager’s representation that the proposed management fee rate for the Bond Fund contains breakpoints, which the Manager believes properly reflect economies of scale for the benefit of the Bond Fund’s shareholders.
Benefits Derived from the Relationship with the Fund. The Board considered the Manager’s representation that it has not identified any material indirect “fall-out” benefits that may accrue to it or its affiliates because of its proposed relationship with the Bond Fund. Based on the foregoing information, the Board concluded that the potential benefits accruing to the Manager by virtue of its relationship with the Bond Fund appear to be fair and reasonable.
Board’s Conclusion. Based on the various considerations described above, the Board, including a majority of Trustees who are not “interested persons” of the Bond Fund or the Manager, as that term is defined in the Investment Company Act of 1940, as amended (“1940 Act”): (1) concluded that the proposed management fee is fair and reasonable with respect to the Fund; (2) determined that the Bond Fund and its shareholders were expected to benefit from the Manager’s management of the Bond Fund; and (3) approved the Management Agreement on behalf of the Bond Fund.
Approval of the Investment Advisory Agreement
Prior to the November 11-12, 2019 meetings, information was provided to the Board by the TwentyFour in response to requests from the Board and/or the Manager in connection with the Board’s consideration of the Investment Advisory Agreement. The Investment Committee of the Board also met with representatives of TwentyFour. Information regarding TwentyFour was also provided to the Board by TwentyFour in response to requests from the Board and/or Manager prior to the Board’s May 9, 2019 and June 4-5, 2019 meetings at which the Board considered the existing investment advisory agreement among the Manager, TwentyFour and the Trust, on behalf of the Strategic Income Fund for which TwentyFour serves as subadviser.
Provided below is an overview of the primary factors the Board considered at its November 11-12, 2019 meetings at which the Board considered the approval of the Investment Advisory Agreement. In determining whether to approve the Investment Advisory Agreement, the Board considered, among other things, the following factors: (1) the nature and quality of the services to be provided; (2) the investment performance of a comparable client account managed by TwentyFour; (3) the extent to which economies of scale, if any, have been taken into account in setting the fee schedule; (4) whether fee levels reflect these economies of scale, if any, for the benefit of investors; (5) comparisons of services and fees with contracts entered into by TwentyFour with other clients; and (6) any other benefits anticipated to be derived by the TwentyFour from its relationship with the Bond Fund.
The Board did not identify any particular information that was most relevant to its consideration of the Investment Advisory Agreement, and each Trustee may have afforded different weight to the various factors. Legal counsel to the Independent Trustees provided the Board with a memorandum regarding its responsibilities pertaining to the approval of investment advisory contracts, such as the Investment Advisory Agreement. The memorandum explained the regulatory requirements surrounding the Trustees’ process for evaluating investment advisors and the terms of investment advisory contracts. Based on its evaluation, the Board unanimously concluded that the terms of the Investment Advisory Agreement were reasonable and fair and that the approval of the Investment Advisory Agreement was in the best interests of the Fund.
100
Disclosure Regarding Approvals of the Management and Investment Advisory Agreement (Unaudited)
Nature, extent and quality of the services to be provided by the Subadviser. The Board considered that it had reviewed an investment advisory agreement among the Manager, the Trust, on behalf of the Strategic Income Fund, and TwentyFour at its May 9, 2019 and June 4-5, 2019 meetings. At those meetings, the Board received information regarding TwentyFour, including information regarding TwentyFour’s principal business activities, financial condition and overall capabilities to perform the services under the Investment Advisory Agreement. The Board also considered information provided at those meetings with respect to TwentyFour’s investment resources, infrastructure and the adequacy of its compliance program and TwentyFour’s representation regarding the strength of its financial condition. In addition, the Board considered the background and experience of the personnel who will be assigned responsibility for managing the Bond Fund. The Board also took into consideration the Manager’s recommendation of TwentyFour. The Board considered TwentyFour’s representation that its current staffing levels were adequate to service the Fund. Based on this information, the Board concluded that the nature, extent and quality of the advisory services to be provided by TwentyFour were appropriate for the Bond Fund in light of its investment objective, and, thus, supported a decision to approve the Investment Advisory Agreement.
Performance of the Subadviser. The Board evaluated the information provided by the TwentyFour and the Manager regarding the performance of a comparable client account managed by TwentyFour relative to the performance of an appropriate benchmark index and the funds included in the Select Peer Group. The Board considered representations made by TwentyFour and the Manager that, for various periods ended June 30, 2019, the comparable client account’s relative performance was favorable. Based on the foregoing information, the Board concluded that the historical investment performance record of TwentyFour supported approval of the Investment Advisory Agreement.
Comparisons of the amounts to be paid under the Investment Advisory Agreement with those under contracts between the Subadviser and its other clients. In evaluating the Investment Advisory Agreement, the Board reviewed the proposed advisory fee rate for services to be performed by TwentyFour on behalf of the Bond Fund. The Board considered that TwentyFour’s investment advisory fee rate under the Investment Advisory Agreement would be paid to TwentyFour by the Bond Fund. The Board considered TwentyFour’s representation that the advisory fee rate proposed for the Bond Fund is favorable compared to other comparable client accounts. After evaluating this information, the Board concluded that TwentyFour’s advisory fee rate under the Investment Advisory Agreement was reasonable in light of the services to be provided to the Bond Fund.
Costs of the services to be provided and profits to be realized by the Subadviser and its affiliates from its relationship with the Fund. The Board did not consider the costs of the services to be provided and any profits to be realized by the Subadviser from its relationship with the Bond Fund, noting instead the arm’s-length nature of the relationship between the Manager and TwentyFour with respect to the negotiation of the advisory fee rate on behalf of the Bond Fund.
Economies of Scale. The Board considered the TwentyFour’s representation that it believes that the proposed advisory fee schedule for the Bond Fund, which includes breakpoints, reflects economies of scale for the benefit of the Fund’s investors.
Benefits to be derived by the Subadviser from its relationship with the Fund. The Board considered TwentyFour’s representation that it is not aware of any “fall-out” benefits that may accrue to it or its affiliates because of TwentyFour’s relationship with the Bond Fund. Based on the foregoing information, the Board concluded that the potential benefits accruing to TwentyFour by virtue of its relationship with the Bond Fund appear to be fair and reasonable.
Board’s Conclusion. Based on the various considerations described above, the Board, including a majority of Trustees who are not “interested persons” of the Bond Fund, the Manager or TwentyFour, as that term is defined in the 1940 Act, concluded that the proposed investment advisory fee rate is fair and reasonable and the approval of the Investment Advisory Agreement is in the best interests of the Bond Fund and approved the Investment Advisory Agreement.
101
Disclosure Regarding Liquidity Risk Management Program (Unaudited)
Disclosure Regarding Liquidity Risk Management Program
Rule 22e-4 under the Investment Company Act of 1940, as amended (“Rule 22e-4”), requires open-end registered investment companies (other than money market funds) to adopt and implement a written liquidity risk management program that is reasonably designed to assess and manage liquidity risk. Each Fund has adopted a Liquidity Risk Management Program (the “Program”) that is designed to assess and manage liquidity risk, which is the risk that the Fund could not meet requests to redeem its shares without significant dilution of the remaining shareholders’ interests in the Fund. The Program was effective on December 1, 2018 and was approved by each Fund’s Board of Trustees (the “Board”) on March 6, 2019, in accordance with applicable Securities and Exchange Commission (“SEC”) guidance.
Pursuant to Rule 22e-4, the Program includes the following elements:
| • | Assessment, management, and periodic review of liquidity risk; |
| • | Classification of each of the Fund’s portfolio investments into one of four liquidity categories: highly liquid, moderately liquid, less liquid, and illiquid; |
| • | Determination and review of a highly liquid investment minimum for any Fund that does not primarily hold assets that are highly liquid investments; |
| • | Policies and procedures to respond to a shortfall in the highly liquid investment minimum, including associated reports to the Board and the SEC; |
| • | A prohibition against a Fund acquiring an illiquid investment if immediately after the acquisition the Fund would have more than 15% of its net assets invested in illiquid investments that are assets; |
| • | Reporting of breaches of the illiquid investment prohibition to the Board and the SEC; and |
| • | Policies and procedures regarding how and when a Fund will satisfy redemption requests by distributing portfolio securities or other assets. |
The Board has approved the designation of the Manager’s Liquidity Committee as the Program administrator with responsibility for administering the Program. Since the implementation of the Program, the Liquidity Committee has provided written reports to the Board on a quarterly basis regarding each Fund’s liquidity risk. In addition, at the Board’s March 3-4, 2020 meetings, the Board reviewed the Liquidity Committee’s written report (“Report”) that addressed the operation of the Program and assessed the adequacy and effectiveness of its implementation from the Program’s inception on December 1, 2018 through December 31, 2019 (the “review period”).
Key conclusions that the Liquidity Committee included in the Report are listed below:
| • | The Program is reasonably designed to assess and manage each Fund’s liquidity risk. |
| • | The operation of the Program was adequate during the review period. |
| • | Each Fund included in this shareholder report was deemed to primarily hold assets that are highly liquid, and no highly liquid investment minimum was recommended. |
| • | The Program was effectively implemented by the Liquidity Committee during the review period. |
| • | Administration of the Program by the Liquidity Committee continues to be appropriate. |
102
Trustees and Officers of the American Beacon FundsSM (Unaudited)
The Trustees and officers of the American Beacon Funds (the “Trust”) are listed below, together with their principal occupations during the past five years. The address of each person listed below is 220 Las Colinas Boulevard East, Suite 1200, Irving, Texas 75039. Each Trustee oversees twenty-seven funds in the fund complex that includes the Trust, the American Beacon Select Funds, the American Beacon Institutional Funds Trust, the American Beacon Sound Point Enhanced Income Fund, and the American Beacon Apollo Total Return Fund. The Trust’s Statement of Additional Information contains additional information about the Trustees and is available without charge by calling 1-800-658-5811.
Name, Age | Position, Term of Office and Length of Time Served with the Trust | Principal Occupation(s) During Past 5 Years and Current Directorships | ||
| NON-INTERESTED TRUSTEES | Term | |||
| Lifetime of Trust until removal, resignation or retirement* | ||||
| Gilbert G. Alvarado (50) | Trustee since 2015 | President, SJVIIF, LLC, Impact Investment Fund (2018-Present); Director, Kura MD, Inc. (local telehealth organization) (2015-2017); Senior Vice President & CFO, Sierra Health Foundation (health conversion private foundation) (2006-Present); Senior Vice President & CFO, Sierra Health Foundation: Center for Health Program Management (California public benefit corporation) (2012-Present); Director, Innovative North State (2012-2015); Director, Sacramento Regional Technology Alliance (2011-2016); Director, Valley Healthcare Staffing (2017–2018); Trustee, American Beacon Select Funds (2015-Present); Trustee, American Beacon Institutional Funds Trust (2017-Present); Trustee, American Beacon Sound Point Enhanced Income Fund (2018–Present); Trustee, American Beacon Apollo Total Return Fund (2018–Present). | ||
| Joseph B. Armes (58) | Trustee since 2015 | Director, Switchback Energy Acquisition (2019-Present); Chairman & CEO, CSW Industrials f/k/a Capital Southwest Corporation (investment company) (2015-Present); Chairman of the Board of Capital Southwest Corporation, predecessor to CSW Industrials, Inc. (2014-2017) (investment company); CEO, Capital Southwest Corporation (2013-2015); President & CEO, JBA Investment Partners (family investment vehicle) (2010-Present); Director and Chair of Audit Committee, RSP Permian (oil and gas producer) (2013-2018); Trustee, American Beacon Select Funds (2015-Present); Trustee, American Beacon Institutional Funds Trust (2017-Present); Trustee, American Beacon Sound Point Enhanced Income Fund (2018–Present); Trustee, American Beacon Apollo Total Return Fund (2018–Present). | ||
| Gerard J. Arpey (61) | Trustee since 2012 | Director, The Home Depot, Inc. (2015-Present); Partner, Emerald Creek Group (private equity firm) (2011-Present); Director, S.C. Johnson & Son, Inc. (privately held company) (2008-present); Trustee, American Beacon Select Funds (2012-Present); Trustee, American Beacon Institutional Funds Trust (2017-Present); Trustee, American Beacon Sound Point Enhanced Income Fund (2018–Present); Trustee, American Beacon Apollo Total Return Fund (2018–Present). | ||
| Brenda A. Cline (59) | Trustee since 2004 Chair since 2019 Vice Chair 2018 | Chief Financial Officer, Treasurer and Secretary, Kimbell Art Foundation (1993-Present); Director, Tyler Technologies, Inc. (public sector software solutions company) (2014-Present); Director, Range Resources Corporation (oil and natural gas company) (2015-Present); Trustee, Cushing Closed-End and Open-End Funds (2017-Present); Trustee, American Beacon Select Funds (2004-Present); Trustee, American Beacon Institutional Funds Trust (2017-Present); Trustee, American Beacon Sound Point Enhanced Income Fund (2018–Present); Trustee, American Beacon Apollo Total Return Fund (2018–Present). | ||
103
Trustees and Officers of the American Beacon FundsSM (Unaudited)
Name, Age | Position, Term of Office and Length of Time Served with the Trust | Principal Occupation(s) During Past 5 Years and Current Directorships | ||
| NON-INTERESTED TRUSTEES (CONT.) | Term | |||
| Lifetime of Trust until removal, resignation or retirement* | ||||
| Eugene J. Duffy (65) | Trustee since 2008 | Managing Director, Global Investment Management Distribution, Mesirow Financial (2016-Present); Managing Director, Institutional Services, Intercontinental Real Estate Corporation (2014-Present); Trustee, American Beacon Select Funds (2008-Present); Trustee, American Beacon Institutional Funds Trust (2017-Present); Trustee, American Beacon Sound Point Enhanced Income Fund (2018–Present); Trustee, American Beacon Apollo Total Return Fund (2018–Present). | ||
| Claudia A. Holz (62) | Trustee since 2018 | Partner, KPMG LLP (1990 – 2017); Trustee, American Beacon Select Funds (2018-Present); Trustee, American Beacon Institutional Funds Trust (2018-Present); Trustee, American Beacon Sound Point Enhanced Income Fund (2018–Present); Trustee, American Beacon Apollo Total Return Fund (2018–Present). | ||
| Douglas A. Lindgren (58) | Trustee since 2018 | CEO North America, Carne Global Financial Services (2016-2017); Consultant, Carne Financial Services (2017-2019); Managing Director, IPS Investment Management and Global Head, Content Management, UBS Wealth Management (2010-2016); Trustee, American Beacon Select Funds (2018-Present); Trustee, American Beacon Institutional Funds Trust (2018-Present); Trustee, American Beacon Sound Point Enhanced Income Fund (2018–Present); Trustee, American Beacon Apollo Total Return Fund (2018–Present). | ||
| Barbara J. McKenna, CFA (57) | Trustee since 2012 | President/Managing Principal, Longfellow Investment Management Company (2005-Present); Trustee, American Beacon Select Funds (2012-Present); Trustee, American Beacon Institutional Funds Trust (2017-Present); Trustee, American Beacon Sound Point Enhanced Income Fund (2018–Present); Trustee, American Beacon Apollo Total Return Fund (2018–Present). | ||
| R. Gerald Turner (74) | Trustee since 2001 | President, Southern Methodist University (1995-Present); Director, J.C. Penney Company, Inc. (1996-2019); Director, Kronus Worldwide Inc. (chemical manufacturing) (2003-Present); Trustee, American Beacon Select Funds (2001-Present); Trustee, American Beacon Institutional Funds Trust (2017-Present); Trustee, American Beacon Sound Point Enhanced Income Fund (2018 – Present); Trustee, American Beacon Apollo Total Return Fund (2018–Present). | ||
104
Trustees and Officers of the American Beacon FundsSM (Unaudited)
Name, Age | Position, Term of Office and Length of Time Served with the Trust | Principal Occupation(s) During Past 5 Years and Current Directorships | ||
| OFFICERS | Term | |||
| One Year | ||||
| Gene L. Needles, Jr. (65) | President since 2009 | President (2009-2018), CEO and Director (2009–Present), and Chairman (2018-Present), American Beacon Advisors, Inc., President (2015-2018), Director and CEO (2015–Present), and Chairman (2018-Present), Resolute Investment Holdings, LLC; President (2015-2018), Director and CEO (2015-Present), and Chairman (2018-Present), Resolute Topco, Inc.; President (2015-2018); Director, and CEO (2015-Present), and Chairman (2018-Present), Resolute Acquisition, Inc.; President (2015-2018), Director and CEO (2015-Present), Chairman (2018-Present), Resolute Investment Managers, Inc.; Director, Chairman, President and CEO, Resolute Investment Distributors (2017-Present); Director, Chairman, President and CEO; Resolute Investment Services, Inc. (2017-Present); President and CEO, Lighthouse Holdings Parent, Inc. (2009-2015); President, CEO and Director, Lighthouse Holdings, Inc. (2009-2015); Manager, President and CEO, American Private Equity Management, LLC (2012-Present); Director, Chairman, President and CEO, Alpha Quant Advisors, LLC (2016-2020); Director, ARK Investment Management LLC (2016-Present); Director, Shapiro Capital Management LLC (2017-Present); Director, Chairman and CEO, Continuous Capital, LLC (2018-Present); Director, Green Harvest Asset Management (2019-Present); Director, National Investment Services of America, LLC (2019 – Present); President, American Beacon Cayman Managed Futures Strategy Fund, Ltd. (2014-Present); Director and President, American Beacon Cayman Transformational Innovation Company, LTD., (2017-2018); President, American Beacon Delaware Transformational Innovation Corporation (2017-2018); President American Beacon Cayman TargetRisk Company, Ltd. (2018-Present); Member, Investment Advisory Committee, Employees Retirement System of Texas (2017-Present); Trustee, American Beacon NextShares Trust (2015-Present); President, American Beacon Select Funds (2009-Present); President, American Beacon Institutional Funds Trust (2017-Present); President, American Beacon Sound Point Enhanced Income Fund (2018-Present); President, American Beacon Apollo Total Return Fund (2018-Present); Director, RSW Investments Holdings LLC, (2019-Present); Manager, SSI Investment Management, LLC (2019-Present). | ||
| Rosemary K. Behan (61) | VP, Secretary and Chief Legal Officer since 2006 | Vice President, Secretary and General Counsel, American Beacon Advisors, Inc. (2006-Present); Secretary, Resolute Investment Holdings, LLC (2015-Present); Secretary, Resolute Topco, Inc. (2015-Present); Secretary, Resolute Acquisition, Inc. (2015–Present); Vice President, Secretary and General Counsel, Resolute Investment Managers, Inc. (2015-Present); Secretary, Resolute Investment Distributors, Inc. (2017-Present); Vice President, Secretary and General Counsel, Resolute Investment Services, Inc. (2017-Present); Vice President and Secretary, Lighthouse Holdings Parent, Inc. (2008-2015); Vice President and Secretary, Lighthouse Holdings, Inc. (2008-2015); Secretary, American Private Equity Management, LLC (2008-Present); Secretary and General Counsel, Alpha Quant Advisors, LLC (2016-2020); Vice President and Secretary, Continuous Capital, LLC (2018-Present); Secretary, Green Harvest Asset Management (2019-Present); Secretary, American Beacon Delaware Transformational Innovation Corporation (2017-2018); Secretary, American Beacon Cayman Transformational Innovation Company, Ltd. (2017-2018); Secretary, American Beacon Cayman Managed Futures Strategy Fund, Ltd. (2014-Present); Secretary, American Beacon Cayman TargetRisk Company, Ltd (2018-Present); Chief Legal Officer, Vice President and Secretary, American Beacon Select Funds (2006-Present); Chief Legal Officer, Vice President and Secretary, American Beacon Institutional Funds Trust (2017-Present); Chief Legal Officer, Vice President and Secretary, American Beacon Sound Point Enhanced Income Fund (2018-Present); Chief Legal Officer, Vice President and Secretary American Beacon Apollo Total Return Fund (2018-Present). | ||
105
Trustees and Officers of the American Beacon FundsSM (Unaudited)
Name, Age | Position, Term of Office and Length of Time Served with the Trust | Principal Occupation(s) During Past 5 Years and Current Directorships | ||
| OFFICERS (CONT.) | Term | |||
| One Year | ||||
| Brian E. Brett (60) | VP since 2004 | Senior Vice President, Head of Distribution (2012-Present), Vice President, Director of Sales (2004-2012), American Beacon Advisors, Inc.; Senior Vice President, Resolute Investment Managers, Inc. (2017-Present); Senior Vice President, Resolute Investment Distributors, Inc. (2018-Present), Senior Vice President, Resolute Investment Services, Inc. (2018-Present); Senior Vice President, Lighthouse Holdings Parent, Inc. (2008-2015); Senior Vice President, Lighthouse Holdings, Inc. (2008-2015); Vice President, American Beacon Select Funds (2004-Present); Vice President, American Beacon Institutional Funds Trust (2017-Present); Vice President American Beacon Sound Point Enhanced Income Fund (2018-Present); Vice President American Beacon Apollo Total Return Fund (2018-Present). | ||
| Paul B. Cavazos (51) | VP since 2016 | Chief Investment Officer and Senior Vice President, American Beacon Advisors, Inc. (2016-Present); Chief Investment Officer, DTE Energy (2007-2016); Vice President, American Private Equity Management, L.L.C. (2017–Present); Vice President, American Beacon Select Funds (2016-Present); Vice President, American Beacon Institutional Funds Trust (2017-Present); Vice President American Beacon Sound Point Enhanced Income Fund (2018-Present);Vice President American Beacon Apollo Total Return Fund (2018-Present). | ||
| Erica Duncan (49) | VP Since 2011 | Vice President, American Beacon Advisors, Inc. (2011-Present); Vice President, Resolute Investment Managers (2018-Present); Vice President, Resolute Investment Services, Inc. (2018-Present); Vice President, American Beacon Select Funds (2011-Present); Vice President, American Beacon Institutional Funds Trust (2017-Present); Vice President American Beacon Sound Point Enhanced Income Fund (2018-Present); Vice President American Beacon Apollo Total Return Fund (2018-Present). | ||
| Melinda G. Heika (59) | Principal Accounting Officer since 2017 and Treasurer since 2010 | Treasurer and CFO (2010-Present), American Beacon Advisors, Inc.; Treasurer, Resolute Topco, Inc. (2015-Present); Treasurer, Resolute Investment Holdings, LLC. (2015-Present); Treasurer, Resolute Acquisition, Inc. (2015-Present); Treasurer and CFO, Resolute Investment Managers, Inc. (2017-Present); Treasurer, Resolute Investment Distributors, Inc. (2017-2017); Treasurer and CFO, Resolute Investment Services, Inc. (2015-Present); Treasurer, Lighthouse Holdings Parent Inc., (2010-2015); Treasurer, Lighthouse Holdings, Inc. (2010-2015); Treasurer, American Private Equity Management, LLC (2012-Present); Treasurer and CFO, Alpha Quant Advisors, LLC (2016-2020); Treasurer and CFO, Continuous Capital, LLC (2018-Present); Treasurer, Green Harvest Asset Management (2019-Present); Treasurer, American Beacon Cayman Transformational Innovation, Ltd. (2017-2018); Treasurer, American Beacon Delaware Transformational Innovation Corporation (2017-2018); Director and Treasurer, American Beacon Cayman Managed Futures Strategy Fund, Ltd. (2014-Present); Treasurer, American Beacon Cayman TargetRisk Company, Ltd. (2018-Present); Principal Accounting Officer (2017-Present) and Treasurer, American Beacon Select Funds (2010-Present); Principal Accounting Officer and Treasurer, American Beacon Institutional Funds Trust (2017-Present); Principal Accounting Officer and Treasurer, American Beacon Sound Point Enhanced Income Fund (2018-Present); Principal Accounting Officer and Treasurer, American Beacon Apollo Total Return Fund (2018-Present). | ||
106
Trustees and Officers of the American Beacon FundsSM (Unaudited)
Name, Age | Position, Term of Office and Length of Time Served with the Trust | Principal Occupation(s) During Past 5 Years and Current Directorships | ||
| OFFICERS (CONT.) | Term | |||
| One Year | ||||
| Terri L. McKinney (56) | VP since 2010 | Vice President (2009-Present), Managing Director (2003-2009), American Beacon Advisors, Inc.; Vice President, Resolute Investment Managers, Inc. (2017-Present); Vice President, Resolute Investment Services, Inc (2018-Present); Vice President, Alpha Quant Advisors, LLC (2016-Present); Vice President, Continuous Capital, LLC (2018-Present); Vice President, American Beacon Select Funds (2010-Present); Vice President, American Beacon Institutional Funds Trust (2017-Present); Vice President, American Beacon Sound Point Enhanced Income Fund (2018-Present); Vice President, American Beacon Apollo Total Return Fund (2018-Present). | ||
| Jeffrey K. Ringdahl (45) | VP since 2010 | Director (2015-Present), President (2018-Present), Chief Operating Officer (2010-Present), Senior Vice President (2013-2018), Vice President (2010-2013), American Beacon Advisors, Inc.; Director (2015-Present), President (2018-Present), Senior Vice Present (2015-2018), Resolute Investment Holdings, LLC; Director (2015-Present), President (2018-Present), Senior Vice President (2015-2018), Resolute Topco, Inc.; Director (2015-Present), President (2018-Present), Senior Vice President (2015-2018), Resolute Acquisition, Inc.; Director (2015-Present), President & COO (2018-Present), Senior Vice President (2015-2018), Resolute Investment Managers, Inc.; Director and Executive Vice President (2017-Present), Resolute Investment Distributors, Inc.; Director (2017-Present), President & COO (2018-Present), Executive Vice President (2017-2018), Resolute Investment Services, Inc.; Senior Vice President (2017-Present), Vice President (2012-2017), Manager (2015-Present), American Private Equity Management, LLC; Senior Vice President, Lighthouse Holdings Parent, Inc. (2013-2015); Senior Vice President, Lighthouse Holdings, Inc. (2013-2015); Trustee, American Beacon NextShares Trust (2015-Present); Director, Executive Vice President & COO, Alpha Quant Advisors, LLC (2016-2020); Director, Shapiro Capital Management, LLC (2017-Present); Director, Executive Vice President & COO, Continuous Capital, LLC (2018-Present); Director, RSW Investments Holdings LLC, (2019-Present); Manager, SSI Investment Management, LLC (2019-Present); Director, National Investment Services of America, LLC (2019-Present); Director and Vice President, American Beacon Cayman Transformational Innovation Company, Ltd., (2017-Present); Vice President, American Beacon Delaware Transformational Innovation Corporation (2017-2018); Director and Vice President, American Beacon Cayman Managed Futures Strategy Fund, Ltd. (2014-Present); Vice President, American Beacon Cayman TargetRisk Company, Ltd (2018-Present); Vice President, American Beacon Select Funds (2010-2018); Vice President, American Beacon Institutional Funds Trust (2017-Present); Vice President, American Beacon Sound Point Enhanced Income Fund (2018-Present); Vice President, American Beacon Apollo Total Return Fund (2018-Present). | ||
| Samuel J. Silver (57) | VP Since 2011 | Vice President (2011-Present), Chief Fixed Income Officer (2016-Present), American Beacon Advisors, Inc. (2011-Present); Vice President, American Beacon Select Funds (2011-Present); Vice President, American Beacon Institutional Funds Trust (2017-Present); Vice President, American Beacon Sound Point Enhanced Income Fund (2018-Present); Vice President, American Beacon Apollo Total Return Fund (2018-Present). | ||
107
Trustees and Officers of the American Beacon FundsSM (Unaudited)
Name, Age | Position, Term of Office and Length of Time Served with the Trust | Principal Occupation(s) During Past 5 Years and Current Directorships | ||
| OFFICERS (CONT.) | Term | |||
| One Year | ||||
| Christina E. Sears (48) | Chief Compliance Officer since 2004 and Asst. Secretary since 1999 | Vice President, American Beacon Advisors, Inc. (2019-Present); Chief Compliance Officer, American Beacon Advisors, Inc. (2004-Present); Vice President, Resolute Investment Managers, Inc. (2017-Present); Vice President, Resolute Investment Distributors (2017-Present); Vice President, Resolute Investment Services, Inc. (2019-Present); Chief Compliance Officer, American Private Equity Management, LLC (2012-Present); Chief Compliance Officer (2016-2019) and Vice President, Alpha Quant Advisors, LLC (2016-2020); Vice President, Continuous Capital, LLC (2018-Present); Chief Compliance Officer (2004-Present) and Assistant Secretary (1999-Present), American Beacon Select Funds; Chief Compliance Officer and Assistant Secretary, American Beacon Institutional Funds Trust (2017-Present); Chief Compliance Officer and Assistant Secretary, American Beacon Sound Point Enhanced Income Fund (2018-Present); Chief Compliance Officer and Assistant Secretary, American Beacon Apollo Total Return Fund (2018-Present). | ||
| Sonia L. Bates (63) | Asst. Treasurer since 2011 | Assistant Treasurer, American Beacon Advisors, Inc. (2011-2018); Assistant Treasurer, Lighthouse Holdings Parent Inc. (2011-2015); Assistant Treasurer, Lighthouse Holdings, Inc. (2011-2015); Assistant Treasurer, American Private Equity Management, LLC (2012-Present); Assistant Treasurer, American Beacon Cayman Transformational Innovation Company, Ltd. (2017-Present); Assistant Treasurer, American Beacon Cayman TargetRisk Company, Ltd. (2018-Present); Assistant Treasurer, American Beacon Select Funds (2011-Present); Assistant Treasurer, American Beacon Institutional Funds Trust (2017-Present); Assistant Treasurer, American Beacon Sound Point Enhanced Income Fund (2018-Present); Assistant Treasurer, American Beacon Apollo Total Return Fund (2018-Present). | ||
| Shelley D. Abrahams (45) | Assistant Secretary since 2008 | Assistant Secretary, American Beacon Select Funds (2008-Present); Assistant Secretary, American Beacon Institutional Funds Trust (2017-Present); Assistant Secretary, American Beacon Sound Point Enhanced Income Fund (2018-Present); Assistant Secretary, American Beacon Apollo Total Return Fund (2018-Present); | ||
| Rebecca L. Harris (53) | Assistant Secretary since 2010 | Vice President, American Beacon Advisors, Inc. (2011-Present); Vice President, Resolute Investment Managers, Inc. (2017-Present); Vice President, Resolute Investment Services (2015-Present); Vice President, Alpha Quant Advisors, LLC (2016-2020); Vice President, Continuous Capital, LLC (2018-Present); Assistant Secretary, American Beacon Select Funds (2010-Present); Assistant Secretary, American Beacon Institutional Funds Trust (2017-Present); Assistant Secretary, American Beacon Sound Point Enhanced Income Fund (2018-Present); Assistant Secretary, American Beacon Apollo Total Return Fund (2018-Present). | ||
| Teresa A. Oxford (61) | Assistant Secretary since 2015 | Assistant Secretary, American Beacon Advisors, Inc. (2015-Present); Assistant Secretary, Resolute Investment Distributors (2018-Present); Assistant Secretary, Resolute Investment Services (2018-Present); Assistant Secretary, Alpha Quant Advisors, LLC (2016-2020); Assistant Secretary, American Beacon Select Funds (2015-Present); Assistant Secretary, American Beacon Institutional Funds Trust (2017-Present); Assistant Secretary, American Beacon Sound Point Enhanced Income Fund (2018-Present); Assistant Secretary, American Beacon Apollo Total Return Fund (2018-Present); . | ||
| Peter A. Davidson (47)** | Assistant Secretary Since 2020 | Assistant Secretary, American Beacon Select Funds (2020-Present); Assistant Secretary, American Beacon Institutional Funds Trust (2020-Present); Assistant Secretary, American Beacon Sound Point Enhanced Income Fund (2020-Present); Assistant Secretary, American Beacon Apollo Total Return Fund (2020-Present). | ||
* As of 11/12/2014, the Board adopted a retirement plan that requires Trustees to retire no later than the last day of the calendar year in which they reach the age of 75.
** Mr. Davidson resigned as of July 31, 2020.
108
American Beacon FundsSM
June 30, 2020 (Unaudited)
The American Beacon Funds recognize and respect the privacy of our shareholders. We are providing this notice to you so you will understand how shareholder information may be collected and used.
We may collect nonpublic personal information about you from one or more of the following sources:
| • | information we receive from you on applications or other forms; |
| • | information about your transactions with us or our service providers; and |
| • | information we receive from third parties. |
We do not disclose any nonpublic personal information about our customers or former customers to anyone, except as permitted by law.
We restrict access to your nonpublic personal information to those employees or service providers who need to know that information to provide products or services to you. To ensure the confidentiality of your nonpublic personal information, we maintain safeguards that comply with federal standards.
109
This page intentionally left blank.
110
This page intentionally left blank.
111
This page intentionally left blank.
112

Delivery of Documents
eDelivery is NOW AVAILABLE - Stop traditional mail delivery and receive your
shareholder reports and summary prospectus on-line. Sign up at
www.americanbeaconfunds.com
If you invest in the Fund through a financial institution, you may be able to receive the Fund’s regulatory mailings, such as the Prospectus, Annual Report and Semi-Annual Report, by e-mail. If you are interested in this option, please go to www.icsdelivery.com and search for your financial institution’s name or contact your financial institution directly.
To obtain more information about the Fund:
 |  | |
| By E-mail: | On the Internet: | |
| american_beacon.funds@ambeacon.com | Visit our website at www.americanbeaconfunds.com | |
By Telephone: Call (800) 658-5811 |
By Mail: American Beacon Funds P.O. Box 219643 Kansas City, MO 64121-9643 | |
| Availability of Quarterly Portfolio Schedules | Availability of Proxy Voting Policy and Records | |
| In addition to the Schedule of Investments provided in each semi-annual and annual report, the Fund files a complete schedule of its portfolio holdings with the Securities and Exchange Commission (“SEC”) on Form N-PORT as of the end of each fiscal quarter. The Fund’s Forms N-PORT are available on the SEC’s website at www.sec.gov. The Forms N-PORT may also be reviewed and copied at the SEC’s Public Reference Section, 100 F Street, NE, Washington, D.C. 20549-2736. Information regarding the operation of the SEC’s Public Reference Room may be obtained by calling (800)-SEC-0330. A complete schedule of the Fund’s portfolio holdings is also available at www.americanbeaconfunds.com approximately sixty days after the end of each calendar quarter. | A description of the policies and procedures the Fund uses to determine how to vote proxies relating to portfolio securities is available in the Fund’s Statement of Additional Information, is available free of charge on the Fund’s website www.americanbeaconfunds.com and by calling 1-800-967-9009 or by accessing the SEC’s website at www.sec.gov. The Fund’s proxy voting record for the most recent year ended June 30 is filed annually with the SEC on Form N-PX. The Fund’s Forms N-PX are available on the SEC’s website at www.sec.gov. The Fund’s proxy voting record may also be obtained by calling 1-800-967-9009. | |


Fund Service Providers:
CUSTODIAN State Street Bank and Trust Company Boston, Massachusetts | TRANSFER AGENT DST Asset Manager Solutions, Inc. Quincy, Massachusetts | INDEPENDENT REGISTERED PUBLIC ACCOUNTING FIRM PricewaterhouseCoopers Boston, Massachusetts | DISTRIBUTOR Resolute Investment Distributors, Inc. Irving, Texas |
This report is prepared for shareholders of the American Beacon Funds and may be distributed to others only if preceded or accompanied by a current Prospectus or Summary Prospectus.
American Beacon Funds, American Beacon SSI Alternative Income Fund, American Beacon TwentyFour Short Term Bond Fund and TwentyFour Strategic Income Fund are service marks of American Beacon Advisors, Inc.
AR 6/20
ITEM 2. CODE OF ETHICS.
The Trust adopted a code of ethics that applies to its principal executive and financial officers (the “Code”). The Trust amended its code July 6, 2020 to disclose the removal of the American Beacon Sound Point Alternative Lending Fund. The Trust did not grant any waivers to the provisions of the Code during the period covered by the shareholder reports presented in Item 1. The Code is filed herewith as Exhibit 99.CODE ETH.
ITEM 3. AUDIT COMMITTEE FINANCIAL EXPERT.
The Trust’s Board of Trustees has determined that Gilbert G. Alvarado and Claudia Holz, members of the Trust’s Audit and Compliance Committee, are “audit committee financial experts” as defined in Form N-CSR. Mr. Gilbert Alvarado and Ms. Claudia Holz are “independent” as defined in Form N-CSR.
ITEM 4. PRINCIPAL ACCOUNTANT FEES AND SERVICES.
| (a) | ||
Audit Fees | Fiscal Year Ended | |
$326,537 | 6/30/2019 | |
$259,414 | 6/30/2020 |
| (b) | ||
Audit-Related Fees | Fiscal Year Ended | |
| $0 | 6/30/2019 | |
| $0 | 1/30/2020 |
| (c) | ||
Tax Fees | Fiscal Year Ended | |
| $117,829 | 6/30/2019 | |
| $48,985 | 6/30/2020 |
| (d) | ||
All Other Fees | Fiscal Year Ended | |
$0 | 6/30/2019 | |
$0 | 6/30/2020 |
(e)(1) Pursuant to its charter, the Trust’s Audit and Compliance Committee shall have the following duties and powers pertaining to pre-approval of audit and non-audit services provided by the Trust’s principal accountant:
- to approve, prior to appointment, the engagement of auditors to annually audit and provide their opinion on the Trusts’ financial statements, and, in connection therewith, reviewing and evaluating matters potentially affecting the independence and capabilities of the auditors;
- to approve, prior to appointment, the engagement of the auditors to provide non-audit services to the Trusts, an investment adviser to any series of the Trusts or any entity controlling, controlled by, or under common control with an investment adviser (“adviser affiliate”) that provides ongoing services to the Trusts, if the engagement relates directly to the operations and financial reporting of the Trusts;
- to consider whether the non-audit services provided by a Trust’s auditor to an investment adviser or any adviser affiliate that provides ongoing services to a series of the Trusts, which services were not pre-approved by the Committee, are compatible with maintaining the auditor’s independence;
- to review the arrangements for and scope of the annual audit and any special audits; and
- to review and approving the fees proposed to be charged to the Trusts by the auditors for each audit and non-audit service.
The Audit and Compliance Committee may delegate any portion of its authority, including the authority to grant pre-approvals of audit and permitted non-audit services, to a subcommittee of one or more members. Any decisions of the subcommittee to grant pre-approvals shall be presented to the full audit committee at its next regularly scheduled meeting.
(e)(2) None of the fees disclosed in paragraphs (b) through (d) above were approved by the audit committee pursuant to paragraph (c)(7)(i)(C) of Rule 2-01 of Regulation S-X.
(f) Not applicable.
(g) Aggregate Non-Audit Fees for Services Rendered to the:
Registrant | Adviser | Adviser’s Affiliates Providing Ongoing Services to Registrant | Fiscal Year Ended | |||||||||
| $ | 117,829 | N/A | N/A | 6/30/2019 | ||||||||
| $ | 48,985 | N/A | N/A | 6/30/2020 | ||||||||
(h) Not applicable.
ITEM 5. AUDIT COMMITTEE OF LISTED REGISTRANTS.
Not applicable.
ITEM 6. SCHEDULE OF INVESTMENTS.
The schedules of investments for each series of the Trust are included in the shareholder reports presented in Item 1.
ITEM 7. DISCLOSURE OF PROXY VOTING POLICIES AND PROCEDURES FOR CLOSED-END MANAGEMENT INVESTMENT COMPANIES.
Not applicable.
ITEM 8. PORTFOLIO MANAGERS OF CLOSED-END MANAGEMENT INVESTMENT COMPANIES.
Not applicable.
ITEM 9. PURCHASES OF EQUITY SECURITIES BY CLOSED-END MANAGEMENT INVESTMENT COMPANY AND AFFILIATED PURCHASERS.
Not applicable.
ITEM 10. SUBMISSION OF MATTERS TO A VOTE OF SECURITY HOLDERS.
The Trust has made no material changes to the procedures by which shareholders may recommend nominees to the Trust’s Board of Trustees since the Trust last disclosed such procedures in Schedule 14A.
ITEM 11. CONTROLS AND PROCEDURES.
| (a) | Evaluation of Disclosure Controls and Procedures. American Beacon Funds (the “Registrant”) maintains disclosure controls and procedures that are designed to provide reasonable assurance that information required to be disclosed in the Registrant’s filings under the Investment Company Act of 1940, as amended (the “1940 Act”), is recorded, processed, summarized, and reported within the periods specified in the rules and forms of the Securities and Exchange Commission, and that such information is accumulated and communicated to the Registrant’s management, including the Registrant’s President (“Principal Executive Officer”) and Treasurer (“Principal Financial Officer”), as appropriate, to allow timely decisions regarding required disclosure. The Registrant’s management recognizes that any set of controls and procedures, no matter how well designed and operated, can provide only reasonable assurance of achieving the desired control objectives. |
In accordance with Rule 30a-3 under the 1940 Act, within 90 days prior to the filing date of this report on Form N-CSR, management evaluated the effectiveness of the disclosure controls and procedures of the Registrant. Based on its evaluation, the Principal Executive Officer and the Principal Financial Officer of the Registrant have determined that, as of June 30, 2020, the Registrant’s disclosure controls and procedures were not effective due to a material weakness in internal control over financial reporting with respect to the American Beacon TwentyFour Short Term Bond Fund (the “Fund”) relating to the recording and review of the Fund’s expenses associated with its initial registration fees and expenses. Specifically, controls in place to record and review the accuracy of the Fund’s initial registration fees and expenses, professional fees and reimbursements thereof did not operate effectively. A material weakness is a deficiency, or a combination of deficiencies, in internal control over financial reporting, such that there is a reasonable possibility that a material misstatement of the company’s annual or interim financial statements will not be prevented or detected on a timely basis. This material weakness resulted in audit adjustments to the Fund’s registration fees and expenses, professional fees, registration fees payable, prepaid expenses, net fees waived and expenses (reimbursed), and receivable for expense reimbursement as of and for the year ended June 30, 2020. Additionally, this material weakness could result in misstatements of the aforementioned account balances or disclosures that would result in a material misstatement to the annual or interim consolidated financial statements that would not be prevented or detected.
Management of the Registrant has identified – and intends to implement – enhancements to the Registrant’s existing controls in order to remediate the material weakness described above.
| (b) | Changes in Internal Controls. There was no change in the Registrant’s internal control over financial reporting (as defined in Rule 30a-3(d) under 1940 Act (17 CFR 270.30a-3(d)) that occurred during the period covered by this report that has materially affected, or is reasonably likely to materially affect, the registrant’s internal control over financial reporting. |
ITEM 12 DISCLOSURE OF SECURITIES LENDING ACTIVITIES FOR CLOSED-END MANAGMENT INVESTMENT COMPANIES.
Not Applicable.
ITEM 13. EXHIBITS.
(a)(1) Filed herewith as EX-99.CODE ETH.
(a)(3) Not applicable.
SIGNATURES
Pursuant to the requirements of the Securities Exchange Act of 1934 and the Investment Company Act of 1940, the registrant has duly caused this report to be signed on its behalf by the undersigned, thereunto duly authorized.
(Registrant): American Beacon Funds
By /s/ Gene L. Needles, Jr. |
| Gene L. Needles, Jr. |
| President |
| American Beacon Funds |
Date: September 9, 2020
Pursuant to the requirements of the Securities Exchange Act of 1934 and the Investment Company Act of 1940, this report has been signed below by the following persons on behalf of the registrant and in the capacities and on the dates indicated.
By /s/ Gene L. Needles, Jr. |
| Gene L. Needles, Jr. |
| President |
| American Beacon Funds |
Date: September 9, 2020
By /s/ Melinda G. Heika |
| Melinda G. Heika |
| Treasurer |
| American Beacon Funds |
Date: September 9, 2020