UNITED STATES
SECURITIES AND EXCHANGE COMMISSION
Washington, D.C. 20549
FORM N-CSR
CERTIFIED SHAREHOLDER REPORT OF REGISTERED
MANAGEMENT INVESTMENT COMPANIES
Investment Company Act file number: 811-4984
AMERICAN BEACON FUNDS
(Exact name of registrant as specified in charter)
220 East Las Colinas Boulevard, Suite 1200
Irving, Texas 75039
(Address of principal executive offices)-(Zip code)
GENE L. NEEDLES, JR., PRESIDENT
220 East Las Colinas Boulevard, Suite 1200
Irving, Texas 75039
(Name and address of agent for service)
Registrant’s telephone number, including area code: (817) 391-6100
Date of fiscal year end: August 31, 2020
Date of reporting period: August 31, 2020
Form N-CSR is to be used by management investment companies to file reports with the Commission not later than 10 days after the transmission to stockholders of any report that is required to be transmitted to stockholders under Rule 30e-1 under the Investment Company Act of 1940 (17 CFR 270.30e-1). The Commission may use the information provided on Form N-CSR in its regulatory, disclosure review, inspection, and policymaking roles.
A registrant is required to disclose the information specified by Form N-CSR, and the Commission will make this information public. A registrant is not required to respond to the collection of information contained in Form N-CSR unless the Form displays a currently valid Office of Management and Budget (“OMB”) control number. Please direct comments concerning the accuracy of the information collection burden estimate and any suggestions for reducing the burden to Secretary, Securities and Exchange Commission, 450 Fifth Street, NW, Washington, DC 20549-0609. The OMB has reviewed this collection of information under the clearance requirements of 44 U.S.C. § 3507.
| ITEM 1. | REPORTS TO STOCKHOLDERS. |
About American Beacon Advisors, Inc.
Since 1986, American Beacon Advisors, Inc. has offered a variety of products and investment advisory services to numerous institutional and retail clients, including a variety of mutual funds, corporate cash management, and separate account management.
Our clients include defined benefit plans, defined contribution plans, foundations, endowments, corporations, financial planners, and other institutional investors. With American Beacon Advisors, Inc., you can put the experience of a multi-billion dollar asset management firm to work for your company.
THE LONDON COMPANY INCOME EQUITY FUND
Investing in small- and medium-capitalization stocks may involve greater volatility and lower liquidity than larger company stocks. Investing in foreign securities may involve heightened risk due to currency fluctuations and economic and political risks. Investing in dividend-paying stocks may result in less earnings growth or capital appreciation than investing in non-dividend paying stocks. The use of fixed-income securities entails interest rate and credit risks. Because the Fund may invest in fewer issuers than a more diversified portfolio, the fluctuating value of a single holding may have a greater effect on the value of the Fund. The use of futures contracts for cash management may subject the Fund to losing more money than invested. The Fund participates in a securities lending program.
ZEBRA SMALL CAP EQUITY FUND
Investing in small-capitalization stocks may involve greater volatility and lower liquidity than larger company stocks. Investing in foreign securities may involve heightened risk due to currency fluctuations and economic and political risks. At times, certain securities may have limited marketability and may be difficult to sell. The use of futures contracts for cash management may subject the Fund to losing more money than invested. The Fund participates in a securities lending program.
Please see the prospectus for a complete discussion of the Funds’ risks. There can be no assurances that the investment objectives of these Funds will be met.
Any opinions herein, including forecasts, reflect our judgment as of the end of the reporting period and are subject to change. Each advisor’s strategies and the Fund’s portfolio composition will change depending on economic and market conditions. This report is not a complete analysis of market conditions and therefore, should not be relied upon as investment advice. Although economic and market information has been compiled from reliable sources, American Beacon Advisors, Inc. makes no representation as to the completeness or accuracy of the statements contained herein.
American Beacon Funds | August 31, 2020 |
| 1 | ||||
| 4 | ||||
| 9 | ||||
| 10 | ||||
Schedules of Investments: | ||||
| 11 | ||||
| 14 | ||||
| 23 | ||||
| 27 | ||||
Financial Highlights: | ||||
| 48 | ||||
| 54 | ||||
| 59 | ||||
Disclosures Regarding the Approval of the Management and Investment Advisory Agreements | 60 | |||
| 65 | ||||
| 66 | ||||
| 72 | ||||
Additional Fund Information | Back Cover |
 | Dear Shareholders,
Unlike anything we’ve experienced in our lifetimes, the COVID-19 pandemic continues to have an overwhelming effect on the world’s population, economies and markets. While news reports in the first half of this reporting period highlighted the many headwinds affecting the global economy and contributing to market volatility – including the U.S. trade war with China, Brexit, disruptions in the Middle East and protests in Hong Kong – the second half of this reporting period has been dominated by headlines related to the virus:
u On March 15, the Federal Reserve cut the federal funds rate by 100 basis points (1%) to a range of 0% to 0.25%, and announced quantitative easing would be unlimited. |
| u | Also in March, the U.S. government passed a stimulus package in three phases: phase one for approximately $8.3 billion, phase two for approximately $100 billion, and phase three for approximately $2 trillion. |
| u | On April 20, the price of U.S. oil turned negative for the first time in history, closing at -$37.60 per barrel for oil deliveries in May. However, by the end of August, the average crude oil spot price – which calculates an equally weighted price for West Texas Intermediate, Brent and Dubai crude oils – was $43.44 per barrel. |
| u | Although equity markets around the world have rebounded since the lows experienced earlier this year, uncertainty and volatility remain while economies continue to feel the effects of the pandemic. In the U.S., real gross domestic product had an annualized decline of 31.7% for the second quarter – reflecting the sharpest economic contraction in modern history, although slightly less than the 32.9% initially estimated. |
| u | As of August 30, the virus had infected more than 24.8 million individuals around the world, resulting in more than 838,000 deaths. The U.S. alone accounted for more than 5.8 million confirmed cases and more than 180,000 deaths. |
Now more than ever, we recognize that fear of loss can be a powerful emotion, leading many investors to make short-term decisions subject to a variety of potential error-leading biases. Unfortunately, short-term investment decisions may derail future plans. We encourage investors to maintain focus on their long-term financial goals, working with financial professionals to make thoughtful adjustments to their changing needs.
The three Ds – direction, discipline and diversification – may help frame this conversation.
| u | Direction: Achieving your long-term financial goals requires an individualized plan of action. You may want your plan to provide some measure of protection against periods of geopolitical turmoil, economic uncertainty, market volatility and job insecurity. Your plan should be reviewed annually and be adjusted in the event your long-range needs change. |
| u | Discipline: Long-term, systematic participation in an investment portfolio requires your resolution to stay the course. Spending time in the market – rather than trying to time the market – may place you in a better position to reach your long-term financial goals. |
| u | Diversification: By investing in different investment styles and asset classes, you may be able to help mitigate financial risks across your investment portfolio. By allocating your investment portfolio according to your risk-tolerance level, you may be better positioned to weather storms and achieve your long-term financial goals. |
1
President’s Message
American Beacon has endeavored to provide investors with a disciplined approach to realizing long-term financial goals since 1986. As a manager of managers, we strive to provide investment products that may enable investors to participate during market upswings while potentially insulating against market downswings. The investment teams behind our mutual funds seek to produce consistent, long-term results rather than focus only on short-term movements in the markets. In managing our investment products, we emphasize identifying opportunities that offer the potential for long-term rewards.
Thank you for staying the course with American Beacon. For additional information about our investment products or to access your account information, please visit our website at www.americanbeaconfunds.com.
Best Regards,

Gene L. Needles, Jr.
President
American Beacon Funds
2
Domestic Equity Market Overview
August 31, 2020 (Unaudited)
U.S. equities posted strong returns during the event-filled 12-month period ended August 31, 2020 – which included a global pandemic and significant monetary and fiscal stimulus during a domestic recession. The broader market, as measured by the Russell 3000 Index, rose 21.4%.
The period started with modest monthly gains from September through December 2019, driven by solid economic data and an accommodative Federal Reserve. Concerns about a slowing global economy led the Fed to reduce the federal funds rate a total of three times in 2019 – in August, September and October.
As we entered 2020, volatility in share prices picked up, reflecting concerns about the novel coronavirus. As COVID-19 began to spread around the world, share prices weakened. U.S. stocks declined in each of the first three months of the calendar year and at an accelerated pace each month. By March, many businesses across the country were shut down in an attempt to limit the spread of COVID-19. In February, the National Bureau of Economic Research declared a recession in the U.S.
In response to the recession, the Fed was very active and quickly reduced the federal funds rate to a range of 0% to 0.25%, announced unlimited quantitative easing and created an alphabet soup of facilities designed to improve liquidity across the economy. At the same time, the federal government passed fiscal stimulus bills to put more cash in the hands of consumers, including generous unemployment benefits for multiple months.
The fiscal and monetary stimulus helped the economy and improved investor sentiment for stocks. Beginning in April, stocks traded higher for the next five months. Signs of an improving economy, declining unemployment following a peak in April, a slowing in the growth rate of the virus, and hopes for a vaccine led to higher stock prices.
Over the period, large-cap stocks posted the strongest returns. The Russell 1000 Index rose 22.5%. In comparison, small-cap stocks lagged the broader market; the Russell 2000 Index rose 6.0%. Growth significantly outperformed Value across the market-cap spectrum. The Russell 3000 Growth Index rose more than 42% versus a roughly flat return for the Russell 3000 Value Index. The Value indexes posted negative one-year returns in the small- and mid-cap spaces. Cyclical sectors outperformed the more defensive sectors.
3
American Beacon The London Company Income Equity FundSM
August 31, 2020 (Unaudited)
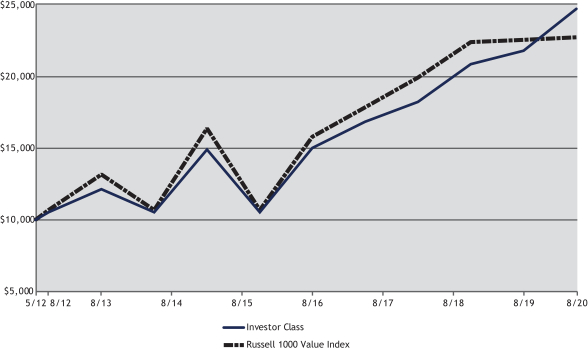
The Investor Class of the American Beacon The London Company Income Equity Fund (the “Fund”) returned 13.38% for the twelve-month period ended August 31, 2020, compared to the Russell 1000® Value Index (the “Index”) return of 0.84% for the same period.
Comparison of Change in Value of a $10,000 Investment for the Period from 5/29/2012 through 8/31/2020
| Total Returns for the Period ended August 31, 2020 |
| |||||||||||||||||||||||||||||||
Ticker | 1 Year | 3 Years | 5 Years | Since Inception | Value of $10,000 | |||||||||||||||||||||||||||
R5 Class** (1,2,4) | ABCIX | 13.81 | % | 11.02 | % | 10.85 | % | 11.92 | % | $ | 25,346 | |||||||||||||||||||||
Y Class (1,2,4) | ABCYX | 13.70 | % | 10.93 | % | 10.76 | % | 11.84 | % | $ | 25,189 | |||||||||||||||||||||
Investor Class (1,2,4) | ABCVX | 13.38 | % | 10.65 | % | 10.47 | % | 11.55 | % | $ | 24,657 | |||||||||||||||||||||
A Class with sales Charge (1,2,4) | ABCAX | 6.94 | % | 8.52 | % | 9.16 | % | 10.69 | % | $ | 23,137 | |||||||||||||||||||||
A Class without sales charge (1,2,4) | ABCAX | 13.44 | % | 10.67 | % | 10.47 | % | 11.49 | % | $ | 24,548 | |||||||||||||||||||||
C Class with sales charge (1,2,4) | ABECX | 11.59 | % | 9.83 | % | 9.63 | % | 10.65 | % | $ | 23,071 | |||||||||||||||||||||
C Class without sales charge (1,2,4) | ABECX | 12.59 | % | 9.83 | % | 9.63 | % | 10.65 | % | $ | 23,071 | |||||||||||||||||||||
R6 Class (1,4,5) | ABCRX | 13.75 | % | 11.00 | % | 10.84 | % | 11.91 | % | $ | 25,333 | |||||||||||||||||||||
Russell 1000® Value Index (3) | 0.84 | % | 4.50 | % | 7.53 | % | 10.42 | % | $ | 22,685 | ||||||||||||||||||||||
| ** | Prior to February 28, 2020, the R5 Class was known as Institutional Class. |
| 1. | Performance shown is historical and is not indicative of future returns. Investment returns and principal value will vary, and shares may be worth more or less at redemption than at original purchase. Performance shown is calculated based on the published end of day net asset values as of date indicated, and current performance may be lower or higher than the performance data quoted. To obtain performance as of the most recent month end, please visit www.americanbeaconfunds.com or call 1-800- 967-9009. Fund performance in the table above does not reflect the deduction of taxes a shareholder would pay on distributions or the redemption of shares. Generally accepted accounting principles require adjustments to be made to the net assets of the Fund at period end for financial reporting purposes only, and as such, the total return based on the unadjusted net asset value per share may differ from the total return reported in the financial highlights. A Class shares have a maximum sales charge of 5.75%. The maximum contingent deferred sales charge for the C Class is 1.00% for shares redeemed within one year of the date of purchase. |
| 2. | A portion of the fees charged to the R5 Class of the Fund was waived from 2012 through 2014, partially recovered in 2015 and fully recovered in 2016. Performance prior to waiving fees was lower than actual returns shown for 2012 through 2014. A portion of the fees charged to the Investor Class of |
4
American Beacon The London Company Income Equity FundSM
Performance Overview
August 31, 2020 (Unaudited)
| the Fund was waived in 2012 and 2013 and fully recovered in 2014 and 2015. Performance prior to waiving fees was lower than actual returns shown in 2012 and 2013. A portion of the fees charged to the Y, A, and C Classes of the Fund was waived from 2012 through 2014 and fully recovered in 2015. Performance prior to waiving fees was lower than actual returns shown for 2012 through 2014. |
| 3. | The Russell 1000 Value Index is an unmanaged index of those stocks in the Russell 1000 Index with lower price-to-book ratios and lower forecasted growth values. The Russell 1000 Value Index and the Russell 1000 Index (each an “Index”) are trademarks of Frank Russell Company (“Russell”) and have been licensed for use by American Beacon Funds. The American Beacon The London Company Income Equity Fund is not in any way sponsored, endorsed, sold or promoted by Russell or the London Stock Exchange Group companies (“LSEG”) (together the “Licensor Parties”) and none of the Licensor Parties make any claim, prediction, warranty or representation whatsoever, expressly or impliedly, either as to (i) the results to be obtained from the use of the Index (upon which a fund is based), (ii) the figure at which the Index is said to stand at any particular time on any particular day or otherwise, or (iii) the suitability of the Index for the purpose to which it is being put in connection with a Fund. None of the Licensor Parties have provided or will provide any financial or investment advice or recommendation in relation to the Index to any fund or to its clients. The Index is calculated by Russell or its agent. None of the Licensor Parties shall be (a) liable (whether in negligence or otherwise) to any person for any error in the Index or (b) under any obligation to advise any person of any error therein. |
| 4. | The Total Annual Fund Operating Expense ratios set forth in the most recent Fund prospectus for the R5, Y, Investor, A, C, and R6 Class shares were 0.73%, 0.80%, 1.06%, 1.05%, 1.82%, and 0.83%, respectively. The expense ratios above may vary from the expense ratios presented in other sections of this report that are based on expenses incurred during the period covered by this report. |
| 5. | Fund performance for the periods shown represents the returns achieved by the R5 Class from 5/29/12 up to 8/25/20, the inception date of the R6 Class, and the returns of the R6 Class since its inception. Expenses of the R6 Class are lower than those of the R5 Class. Therefore, total returns shown may be lower than they would have been had the R6 Class been in existence since 5/29/12. |
The Fund outperformed the Index due to stock selection and sector allocation during the period.
From a security selection standpoint, the Fund’s holdings in the Information Technology and Industrials sectors were the largest contributors to the Fund’s outperformance relative to the Index. In the Information Technology sector, positions in Apple, Inc. (up 152.3%) and Microsoft Corp. (up 64.9%) contributed to relative returns. Companies contributing to performance in the Industrials sector included Fastenal Co. (up 62.1%) and United Parcel Service, Inc., Class B (up 42.1%). The aforementioned strong performance was somewhat offset by security selection in the Consumer Staples and Health Care sectors. In the Consumer Staples sector, a position in Diageo PLC, Sponsored ADR (down 19.9%) detracted, and an absence from index-position Danaher Corp. (up 46.0%) in the Health Care sector also hurt relative returns.
From a sector allocation perspective, the Fund’s overweight position in the Information Technology sector (up 13.9%), and underweight positions in the Energy sector (down 33.2%) and Financials sector (down 8.7%) helped relative performance. This performance was somewhat offset by an underweight position in the Health Care sector (up 19.1%).
5
American Beacon The London Company Income Equity FundSM
Performance Overview
August 31, 2020 (Unaudited)
The sub-advisor’s investment process focuses on downside protection, current income and total return appreciation.
| Top Ten Holdings (% Net Assets) | ||||||||
| Apple, Inc. | 5.7 | |||||||
| Berkshire Hathaway, Inc., Class B | 4.9 | |||||||
| Lowe’s Cos., Inc. | 4.5 | |||||||
| Microsoft Corp. | 4.5 | |||||||
| BlackRock, Inc. | 3.9 | |||||||
| Johnson & Johnson | 3.9 | |||||||
| United Parcel Service, Inc., Class B | 3.8 | |||||||
| Norfolk Southern Corp. | 3.7 | |||||||
| Texas Instruments, Inc. | 3.7 | |||||||
| Air Products and Chemicals, Inc. | 3.5 | |||||||
| Total Fund Holdings | 30 | |||||||
| Sector Allocation (% Equities) | ||||||||
| Information Technology | 23.4 | |||||||
| Financials | 14.2 | |||||||
| Consumer Staples | 12.3 | |||||||
| Industrials | 11.2 | |||||||
| Health Care | 11.1 | |||||||
| Consumer Discretionary | 8.1 | |||||||
| Communication Services | 6.4 | |||||||
| Materials | 3.8 | |||||||
| Real Estate | 3.7 | |||||||
| Utilities | 3.3 | |||||||
| Energy | 2.5 | |||||||
6
American Beacon Zebra Small Cap Equity FundSM
Performance Overview
August 31, 2020 (Unaudited)
The Investor Class of the American Beacon Zebra Small Cap Equity Fund (the “Fund”) returned -3.05% for the twelve months ended August 31, 2020, which was less than the Russell 2000® Index (the “Index”) return of 6.02%. The Fund underperformed the Index due to stock selection and, to a lesser extent, sector allocation.
Comparison of Change in Value of a $10,000 Investment for the Period from 8/31/2010 through 8/31/2020

| Total Returns for the Period ended August 31, 2020 |
| |||||||||||||||||||||||||||||||
Ticker | 1 Year | 3 Years | 5 Years | 10 Years | Value of $10,000 8/31/2010- 8/31/2020 | |||||||||||||||||||||||||||
R5 Class** (1,2,4) | AZSIX | (2.70 | )% | 1.37 | % | 5.81 | % | 10.49 | % | $ | 27,122 | |||||||||||||||||||||
Y Class (1,2,4) | AZSYX | (2.75 | )% | 1.27 | % | 5.71 | % | 10.40 | % | $ | 26,884 | |||||||||||||||||||||
Investor Class (1,2,4) | AZSPX | (3.05 | )% | 0.99 | % | 5.40 | % | 10.07 | % | $ | 26,104 | |||||||||||||||||||||
A Class with sales Charge (1,2,4) | AZSAX | (8.69 | )% | (1.01 | )% | 4.14 | % | 9.37 | % | $ | 24,493 | |||||||||||||||||||||
A Class without sales charge (1,2,4) | AZSAX | (3.10 | )% | 0.96 | % | 5.38 | % | 10.03 | % | $ | 25,997 | |||||||||||||||||||||
C Class with sales charge (1,2,4) | AZSCX | (4.78 | )% | 0.20 | % | 4.59 | % | 9.18 | % | $ | 24,077 | |||||||||||||||||||||
C Class without sales charge (1,2,4) | AZSCX | (3.78 | )% | 0.20 | % | 4.59 | % | 9.18 | % | $ | 24,077 | |||||||||||||||||||||
Russell 2000® Index (3) | 6.02 | % | 5.03 | % | 7.65 | % | 11.53 | % | $ | 29,775 | ||||||||||||||||||||||
Russell 2000® Value Index (3) | (6.14 | )% | (1.39 | )% | 4.37 | % | 8.71 | % | $ | 23,050 | ||||||||||||||||||||||
| ** | Prior to February 28, 2020, the R5 Class was known as Institutional Class. |
| 1. | Performance shown is historical and is not indicative of future returns. Investment returns and principal value will vary, and shares may be worth more or less at redemption than at original purchase. Performance shown is calculated based on the published end of day net asset values as of date indicated, and current performance may be lower or higher than the performance data quoted. To obtain performance as of the most recent month end, please visit www.americanbeaconfunds.com or call 1-800-967-9009. Fund performance in the table above does not reflect the deduction of taxes a shareholder would pay on distributions or the redemption of shares. Generally accepted accounting principles require adjustments to be made to the net assets of the Fund at period end for financial reporting purposes only, and as such, the total return based on the unadjusted net asset value per share may differ from the total return reported in the financial highlights. A Class shares have a maximum sales charge of 5.75%. The maximum contingent deferred sales charge is 1.00% for C Class shares redeemed within one year of the date of purchase. |
7
American Beacon Zebra Small Cap Equity FundSM
Performance Overview
August 31, 2020 (Unaudited)
| 2. | A portion of the fees charged to each Class of the Fund has been waived since Fund inception. Performance prior to waiving fees was lower than the actual returns shown since inception. |
| 3. | The Russell 2000 Value Index is an unmanaged index of those stocks in the Russell 2000 Index with lower price-to-book ratios and lower forecasted growth values. The Russell 2000 Value Index and the Russell 2000 Index (each an “Index”) are trademarks of Frank Russell Company (“Russell”) and have been licensed for use by American Beacon Funds. The American Beacon Zebra Small Cap Equity Fund is not in any way sponsored, endorsed, sold or promoted by Russell or the London Stock Exchange Group companies (“LSEG”) (together the “Licensor Parties”) and none of the Licensor Parties make any claim, prediction, warranty or representation whatsoever, expressly or impliedly, either as to (i) the results to be obtained from the use of the Index (upon which a fund is based), (ii) the figure at which the Index is said to stand at any particular time on any particular day or otherwise, or (iii) the suitability of the Index for the purpose to which it is being put in connection with a Fund. None of the Licensor Parties have provided or will provide any financial or investment advice or recommendation in relation to the Index to any fund or to its clients. The Index is calculated by Russell or its agent. None of the Licensor Parties shall be (a) liable (whether in negligence or otherwise) to any person for any error in the Index or (b) under any obligation to advise any person of any error therein. |
| 4. | The Total Annual Fund Operating Expense ratios set forth in the most recent Fund prospectus for the R5, Y, Investor, A, and C Class shares were 1.22%, 1.24%, 1.50%, 1.53%, and 2.29%, respectively. The expense ratios above may vary from the expense ratios presented in other sections of this report that are based on expenses incurred during the period covered by this report. |
Stock selection in the Consumer Discretionary, Health Care and Industrials sectors detracted the most from relative performance. In the Consumer Discretionary sector, Denny’s Corp. (down 42.5%) negatively impacted performance, while positions in Orthofix Medical, Inc., (down 42.5%) and Herman Miller, Inc. (down 41.6%) in the Health Care and Industrials sectors, respectively, detracted from relative returns.
This was offset somewhat by positive stock selection in the Utilities sector, where the Fund was absent from Index-positions Portland General Electric (down 30.8%) and Allete, Inc. (down 34.6%).
From a sector allocation perspective, the Fund was hurt by an overweight allocation to Financials (down 15.9%). Underweighting Energy (down 42.1%), the worst performing sector in the Index, was positive for the Fund’s relative performance during the period.
The sub-advisor continues to focus on uncovering opportunities by investing in a portfolio of securities that are generally less popular with investors but nevertheless have strong fundamental characteristics. At the same time the portfolio will be underweight stocks that are heavily followed but have weak fundamentals. This contrarian style has tended to result in a portfolio with very good risk-adjusted returns over time.
| Top Ten Holdings (% Net Assets) | ||||||||
| WD-40 Co. | 1.7 | |||||||
| Sykes Enterprises, Inc. | 1.6 | |||||||
| Insight Enterprises, Inc. | 1.4 | |||||||
| Innospec, Inc. | 1.3 | |||||||
| Orthofix Medical, Inc. | 1.3 | |||||||
| Franklin Electric Co., Inc. | 1.2 | |||||||
| Getty Realty Corp. | 1.2 | |||||||
| McGrath RentCorp | 1.2 | |||||||
| OSI Systems, Inc. | 1.2 | |||||||
| PS Business Parks, Inc. | 1.2 | |||||||
| Total Fund Holdings | 284 | |||||||
| Sector Allocation (% Equities) | ||||||||
| Health Care | 16.3 | |||||||
| Industrials | 15.5 | |||||||
| Information Technology | 15.5 | |||||||
| Financials | 15.0 | |||||||
| Consumer Discretionary | 13.0 | |||||||
| Real Estate | 9.4 | |||||||
| Consumer Staples | 5.6 | |||||||
| Materials | 4.7 | |||||||
| Communication Services | 3.1 | |||||||
| Energy | 1.0 | |||||||
| Utilities | 0.9 | |||||||
8
American Beacon FundsSM
August 31, 2020 (Unaudited)
| American Beacon The London Company Income Equity Fund |
| ||||||||||||||
| Beginning Account Value 3/1/2020 | Ending Account Value 8/31/2020 | Expenses Paid During Period 3/1/2020-8/31/2020* | |||||||||||||
| R5 Class** | |||||||||||||||
| Actual | $1,000.00 | $1,160.20 | $4.13 | ||||||||||||
| Hypothetical*** | $1,000.00 | $1,021.32 | $3.86 | ||||||||||||
| Y Class | |||||||||||||||
| Actual | $1,000.00 | $1,159.60 | $4.45 | ||||||||||||
| Hypothetical*** | $1,000.00 | $1,021.01 | $4.17 | ||||||||||||
| Investor Class | |||||||||||||||
| Actual | $1,000.00 | $1,157.90 | $5.80 | ||||||||||||
| Hypothetical*** | $1,000.00 | $1,019.76 | $5.43 | ||||||||||||
| A Class | |||||||||||||||
| Actual | $1,000.00 | $1,158.50 | $5.75 | ||||||||||||
| Hypothetical*** | $1,000.00 | $1,019.81 | $5.38 | ||||||||||||
| C Class | |||||||||||||||
| Actual | $1,000.00 | $1,153.60 | $9.85 | ||||||||||||
| Hypothetical*** | $1,000.00 | $1,015.99 | $9.22 | ||||||||||||
| R6 Class**** | |||||||||||||||
| Actual | $1,000.00 | $1,007.40 | $0.12 | ||||||||||||
| Hypothetical | $1,000.00 | $1,021.47 | $3.71 | ||||||||||||
| * | Expenses are equal to the Fund’s annualized expense ratios for the six-month period of 0.76%, 0.82%, 1.07%, 1.06%, 1.82%, and 0.71% for the R5, Y, Investor, A, C, and R6 Classes, respectively, multiplied by the average account value over the period, multiplied by the number derived by dividing the number of days in the most recent fiscal half-year (184) by days in the year (366) to reflect the half-year period. |
| ** | Formerly known as Institutional Class. |
| *** | 5% return before expenses. |
| **** | American Beacon The London Company Income Equity Fund’s R6 Class commenced operations on August 26, 2020. Expenses are equal to the fund’s annualized expense ratio for the period, multiplied by the average account value over the period, multiplied by the number of days since inception (6), then divided by the number of days in the year (366) to reflect the period. The Ending Account Value is derived from the fund’s share class actual return since inception. The Hypothetical 5% Annual Return information reflects the (184) day period for the six months ended August 31, 2020 to allow for comparability. |
| American Beacon Zebra Small Cap Equity Fund |
| ||||||||||||||
| Beginning Account Value 3/1/2020 | Ending Account Value 8/31/2020 | Expenses Paid During Period 3/1/2020-8/31/2020* | |||||||||||||
| R5 Class** | |||||||||||||||
| Actual | $1,000.00 | $1,013.20 | $4.50 | ||||||||||||
| Hypothetical*** | $1,000.00 | $1,020.66 | $4.52 | ||||||||||||
| Y Class | |||||||||||||||
| Actual | $1,000.00 | $1,012.40 | $5.01 | ||||||||||||
| Hypothetical*** | $1,000.00 | $1,020.16 | $5.03 | ||||||||||||
| Investor Class | |||||||||||||||
| Actual | $1,000.00 | $1,011.20 | $6.42 | ||||||||||||
| Hypothetical*** | $1,000.00 | $1,018.75 | $6.44 | ||||||||||||
| A Class | |||||||||||||||
| Actual | $1,000.00 | $1,011.20 | $6.52 | ||||||||||||
| Hypothetical*** | $1,000.00 | $1,018.65 | $6.55 | ||||||||||||
| C Class | |||||||||||||||
| Actual | $1,000.00 | $1,007.90 | $10.30 | ||||||||||||
| Hypothetical*** | $1,000.00 | $1,014.88 | $10.33 | ||||||||||||
| * | Expenses are equal to the Fund’s annualized expense ratios for the six-month period of 0.89%, 0.99%, 1.27%, 1.29%, and 2.04% for the R5, Y, Investor, A, and C Classes, respectively, multiplied by the average account value over the period, multiplied by the number derived by dividing the number of days in the most recent fiscal half-year (184) by days in the year (366) to reflect the half-year period. |
| ** | Formerly known as Institutional Class. |
| *** | 5% return before expenses. |
9
American Beacon FundsSM
Report of Independent Registered Public Accounting Firm
To the Shareholders of American Beacon The London Company Income Equity Fund and American Beacon Zebra Small Cap Equity Fund and the Board of Trustees of American Beacon Funds
Opinion on the Financial Statements
We have audited the accompanying statements of assets and liabilities of American Beacon The London Company Income Equity Fund and American Beacon Zebra Small Cap Equity Fund (collectively referred to as the “Funds”), (two of the funds constituting American Beacon Funds (the “Trust”)), including the schedules of investments, as of August 31, 2020, and the related statements of operations for the year then ended, the statements of changes in net assets for each of the two years in the period then ended, the financial highlights for each of the five years in the period then ended and the related notes (collectively referred to as the “financial statements”). In our opinion, the financial statements present fairly, in all material respects, the financial position of each of the Funds (two of the funds constituting American Beacon Funds) at August 31, 2020, the results of their operations for the year then ended, the changes in their net assets for each of the two years in the period then ended and their financial highlights for each of the five years in the period then ended, in conformity with U.S. generally accepted accounting principles.
Basis for Opinion
These financial statements are the responsibility of the Trust’s management. Our responsibility is to express an opinion on each of the Funds’ financial statements based on our audits. We are a public accounting firm registered with the Public Company Accounting Oversight Board (United States) (“PCAOB”) and are required to be independent with respect to the Trust in accordance with the U.S. federal securities laws and the applicable rules and regulations of the Securities and Exchange Commission and the PCAOB.
We conducted our audits in accordance with the standards of the PCAOB. Those standards require that we plan and perform the audit to obtain reasonable assurance about whether the financial statements are free of material misstatement, whether due to error or fraud. The Trust is not required to have, nor were we engaged to perform, an audit of the Trust’s internal control over financial reporting. As part of our audits we are required to obtain an understanding of internal control over financial reporting, but not for the purpose of expressing an opinion on the effectiveness of the Trust’s internal control over financial reporting. Accordingly, we express no such opinion.
Our audits included performing procedures to assess the risks of material misstatement of the financial statements, whether due to error or fraud, and performing procedures that respond to those risks. Such procedures included examining, on a test basis, evidence regarding the amounts and disclosures in the financial statements. Our procedures included confirmation of securities owned as of August 31, 2020, by correspondence with the custodian and brokers or by other appropriate auditing procedures where replies from brokers were not received. Our audits also included evaluating the accounting principles used and significant estimates made by management, as well as evaluating the overall presentation of the financial statements. We believe that our audits provide a reasonable basis for our opinion.

We have served as the auditor of one or more American Beacon investment companies since 1987.
Dallas, Texas
October 28, 2020
10
American Beacon The London Company Income Equity FundSM
Schedule of Investments
August 31, 2020
| Shares | Fair Value | ||||||||||||||
| COMMON STOCKS - 93.51% | |||||||||||||||
| Communication Services - 5.98% | |||||||||||||||
| Diversified Telecommunication Services - 3.12% | |||||||||||||||
| Verizon Communications, Inc. | 695,649 | $ | 41,231,116 | ||||||||||||
|
| ||||||||||||||
| Entertainment - 2.86% | |||||||||||||||
| Nintendo Co., Ltd., ADRA | 560,386 | 37,753,205 | |||||||||||||
|
| ||||||||||||||
Total Communication Services | 78,984,321 | ||||||||||||||
|
| ||||||||||||||
| Consumer Discretionary - 7.57% | |||||||||||||||
| Multiline Retail - 3.07% | |||||||||||||||
| Target Corp. | 268,071 | 40,535,016 | |||||||||||||
|
| ||||||||||||||
| Specialty Retail - 4.50% | |||||||||||||||
| Lowe’s Cos., Inc. | 360,927 | 59,441,067 | |||||||||||||
|
| ||||||||||||||
Total Consumer Discretionary | 99,976,083 | ||||||||||||||
|
| ||||||||||||||
| Consumer Staples - 11.54% | |||||||||||||||
| Beverages - 4.05% | |||||||||||||||
| Coca-Cola Co. | 412,149 | 20,413,740 | |||||||||||||
| Diageo PLC, Sponsored ADRA | 246,290 | 33,101,376 | |||||||||||||
|
| ||||||||||||||
| 53,515,116 | |||||||||||||||
|
| ||||||||||||||
| Food Products - 2.71% | |||||||||||||||
| Nestle S.A., Sponsored ADR | 297,578 | 35,829,879 | |||||||||||||
|
| ||||||||||||||
| Tobacco - 4.78% | |||||||||||||||
| Altria Group, Inc. | 792,817 | 34,677,816 | |||||||||||||
| Philip Morris International, Inc. | 355,795 | 28,388,883 | |||||||||||||
|
| ||||||||||||||
| 63,066,699 | |||||||||||||||
|
| ||||||||||||||
Total Consumer Staples | 152,411,694 | ||||||||||||||
|
| ||||||||||||||
| Energy - 2.37% | |||||||||||||||
| Oil, Gas & Consumable Fuels - 2.37% | |||||||||||||||
| Chevron Corp. | 372,178 | 31,236,900 | |||||||||||||
|
| ||||||||||||||
| Financials - 13.26% | |||||||||||||||
| Banks - 1.61% | |||||||||||||||
| Wells Fargo & Co. | 879,821 | 21,247,677 | |||||||||||||
|
| ||||||||||||||
| Capital Markets - 4.90% | |||||||||||||||
| BlackRock, Inc. | 85,818 | 50,992,197 | |||||||||||||
| Franklin Resources, Inc. | 654,326 | 13,780,106 | |||||||||||||
|
| ||||||||||||||
| 64,772,303 | |||||||||||||||
|
| ||||||||||||||
| Diversified Financial Services - 4.91% | |||||||||||||||
| Berkshire Hathaway, Inc., Class BB | 297,517 | 64,870,607 | |||||||||||||
|
| ||||||||||||||
| Insurance - 1.84% | |||||||||||||||
| Cincinnati Financial Corp. | 305,226 | 24,237,996 | |||||||||||||
|
| ||||||||||||||
Total Financials | 175,128,583 | ||||||||||||||
|
| ||||||||||||||
| Health Care - 10.37% | |||||||||||||||
| Pharmaceuticals - 10.37% | |||||||||||||||
| Johnson & Johnson | 338,026 | 51,856,569 | |||||||||||||
| Merck & Co., Inc. | 529,335 | 45,136,395 | |||||||||||||
| Pfizer, Inc. | 1,056,332 | 39,918,786 | |||||||||||||
|
| ||||||||||||||
| 136,911,750 | |||||||||||||||
|
| ||||||||||||||
Total Health Care | 136,911,750 | ||||||||||||||
|
| ||||||||||||||
See accompanying notes
11
American Beacon The London Company Income Equity FundSM
Schedule of Investments
August 31, 2020
| Shares | Fair Value | ||||||||||||||
| COMMON STOCKS - 93.51% (continued) | |||||||||||||||
| Industrials - 10.43% | |||||||||||||||
| Air Freight & Logistics - 3.83% | |||||||||||||||
| United Parcel Service, Inc., Class B | 309,184 | $ | 50,588,686 | ||||||||||||
|
| ||||||||||||||
| Road & Rail - 3.72% | |||||||||||||||
| Norfolk Southern Corp. | 231,037 | 49,102,294 | |||||||||||||
|
| ||||||||||||||
| Trading Companies & Distributors - 2.88% | |||||||||||||||
| Fastenal Co. | 779,515 | 38,087,103 | |||||||||||||
|
| ||||||||||||||
Total Industrials | 137,778,083 | ||||||||||||||
|
| ||||||||||||||
| Information Technology - 21.91% | |||||||||||||||
| Communications Equipment - 2.86% | |||||||||||||||
| Cisco Systems, Inc. | 894,275 | 37,756,290 | |||||||||||||
|
| ||||||||||||||
| IT Services - 2.29% | |||||||||||||||
| Paychex, Inc. | 395,489 | 30,243,044 | |||||||||||||
|
| ||||||||||||||
| Semiconductors & Semiconductor Equipment - 6.57% | |||||||||||||||
| Intel Corp. | 749,288 | 38,176,224 | |||||||||||||
| Texas Instruments, Inc. | 342,349 | 48,664,910 | |||||||||||||
|
| ||||||||||||||
| 86,841,134 | |||||||||||||||
|
| ||||||||||||||
| Software - 4.49% | |||||||||||||||
| Microsoft Corp. | 262,850 | 59,280,560 | |||||||||||||
|
| ||||||||||||||
| Technology Hardware, Storage & Peripherals - 5.70% | |||||||||||||||
| Apple, Inc. | 583,116 | 75,245,289 | |||||||||||||
|
| ||||||||||||||
Total Information Technology | 289,366,317 | ||||||||||||||
|
| ||||||||||||||
| Materials - 3.54% | |||||||||||||||
| Chemicals - 3.54% | |||||||||||||||
| Air Products and Chemicals, Inc. | 159,696 | 46,672,753 | |||||||||||||
|
| ||||||||||||||
| Real Estate - 3.49% | |||||||||||||||
| Equity Real Estate Investment Trusts (REITs) - 3.49% | |||||||||||||||
| Crown Castle International Corp. | 282,159 | 46,062,457 | |||||||||||||
|
| ||||||||||||||
| Utilities - 3.05% | |||||||||||||||
| Multi-Utilities - 3.05% | |||||||||||||||
| Dominion Energy, Inc. | 513,363 | 40,268,194 | |||||||||||||
|
| ||||||||||||||
Total Common Stocks (Cost $878,983,117) | 1,234,797,135 | ||||||||||||||
|
| ||||||||||||||
| SHORT-TERM INVESTMENTS - 5.75% (Cost $75,939,009) | |||||||||||||||
| Investment Companies - 5.75% | |||||||||||||||
| American Beacon U.S. Government Money Market Select Fund, 0.01%C D | 75,939,009 | 75,939,009 | |||||||||||||
|
| ||||||||||||||
TOTAL INVESTMENTS - 99.26% (Cost $954,922,126) | 1,310,736,144 | ||||||||||||||
OTHER ASSETS, NET OF LIABILITIES - 0.74% | 9,831,862 | ||||||||||||||
|
| ||||||||||||||
TOTAL NET ASSETS - 100.00% | $ | 1,320,568,006 | |||||||||||||
|
| ||||||||||||||
| Percentages are stated as a percent of net assets. |
| ||||||||||||||
A All or a portion of this security is on loan, collateralized by either cash and/or U.S. Treasuries, at August 31, 2020 (Note 8).
B Non-income producing security.
C The Fund is affiliated by having the same investment advisor.
D 7-day yield.
See accompanying notes
12
American Beacon The London Company Income Equity FundSM
Schedule of Investments
August 31, 2020
ADR - American Depositary Receipt.
PLC - Public Limited Company.
| Long Futures Contracts Open on August 31, 2020: |
| |||||||||||||
| Equity Futures Contracts | ||||||||||||||
| Description | Number of Contracts | Expiration Date | Notional Amount | Contract Value | Unrealized Appreciation (Depreciation) | |||||||||
| S&P 500 E-Mini Index Futures | 437 | September 2020 | $71,058,295 | $ | 76,450,965 | $ | 5,392,670 | |||||||
|
|
|
|
| ||||||||||
| $71,058,295 | $ | 76,450,965 | $ | 5,392,670 | ||||||||||
|
|
|
|
| ||||||||||
| Index Abbreviations: | ||
| S&P 500 | S&P 500 Index - U.S. Equity Large-Cap Index. | |
The Fund’s investments are summarized by level based on the inputs used to determine their values. As of August 31, 2020, the investments were classified as described below:
The London Company Income Equity Fund | Level 1 | Level 2 | Level 3 | Total | ||||||||||||||||||||||||
Assets |
| |||||||||||||||||||||||||||
Common Stocks | $ | 1,234,797,135 | $ | – | $ | – | $ | 1,234,797,135 | ||||||||||||||||||||
Short-Term Investments | 75,939,009 | – | – | 75,939,009 | ||||||||||||||||||||||||
|
|
|
|
|
|
|
| |||||||||||||||||||||
Total Investments in Securities – Assets | $ | 1,310,736,144 | $ | – | $ | – | $ | 1,310,736,144 | ||||||||||||||||||||
|
|
|
|
|
|
|
| |||||||||||||||||||||
Financial Derivative Instruments – Assets |
| |||||||||||||||||||||||||||
Futures Contracts | $ | 5,392,670 | $ | – | $ | – | $ | 5,392,670 | ||||||||||||||||||||
|
|
|
|
|
|
|
| |||||||||||||||||||||
Total Financial Derivative Instruments – Assets | $ | 5,392,670 | $ | – | $ | – | $ | 5,392,670 | ||||||||||||||||||||
|
|
|
|
|
|
|
| |||||||||||||||||||||
U.S. GAAP requires transfers between all levels to/from level 3 be disclosed. During the year ended August 31, 2020, there were no transfers into or out of Level 3.
See accompanying notes
13
American Beacon Zebra Small Cap Equity FundSM
Schedule of Investments
August 31, 2020
| Shares | Fair Value | ||||||||||||||
| COMMON STOCKS - 98.39% | |||||||||||||||
| Communication Services - 3.01% | |||||||||||||||
| Diversified Telecommunication Services - 0.48% | |||||||||||||||
| Alaska Communications Systems Group, Inc. | 22,958 | $ | 51,426 | ||||||||||||
| IDT Corp., Class BA | 8,312 | 54,194 | |||||||||||||
| Ooma, Inc.A | 16,325 | 222,673 | |||||||||||||
|
| ||||||||||||||
| 328,293 | |||||||||||||||
|
| ||||||||||||||
| Interactive Media & Services - 1.99% | |||||||||||||||
| Cargurus, Inc.A | 13,489 | 328,862 | |||||||||||||
| DHI Group, Inc.A | 21,087 | 51,241 | |||||||||||||
| EverQuote, Inc., Class AA | 8,570 | 304,235 | |||||||||||||
| TrueCar, Inc.A | 50,877 | 240,648 | |||||||||||||
| Yelp, Inc.A | 19,005 | 439,396 | |||||||||||||
|
| ||||||||||||||
| 1,364,382 | |||||||||||||||
|
| ||||||||||||||
| Media - 0.54% | |||||||||||||||
| MSG Networks, Inc., Class AA B | 8,677 | 84,514 | |||||||||||||
| Saga Communications, Inc., Class A | 1,793 | 40,343 | |||||||||||||
| Tribune Publishing Co. | 9,843 | 111,718 | |||||||||||||
| WideOpenWest, Inc.A | 24,018 | 138,103 | |||||||||||||
|
| ||||||||||||||
| 374,678 | |||||||||||||||
|
| ||||||||||||||
Total Communication Services | 2,067,353 | ||||||||||||||
|
| ||||||||||||||
| Consumer Discretionary - 12.79% | |||||||||||||||
| Auto Components - 0.50% | |||||||||||||||
| Standard Motor Products, Inc. | 1,118 | 50,802 | |||||||||||||
| XPEL, Inc. | 11,589 | 288,566 | |||||||||||||
|
| ||||||||||||||
| 339,368 | |||||||||||||||
|
| ||||||||||||||
| Distributors - 1.10% | |||||||||||||||
| Core-Mark Holding Co., Inc. | 20,337 | 679,662 | |||||||||||||
| Weyco Group, Inc. | 4,162 | 74,916 | |||||||||||||
|
| ||||||||||||||
| 754,578 | |||||||||||||||
|
| ||||||||||||||
| Diversified Consumer Services - 0.53% | |||||||||||||||
| American Public Education, Inc.A | 3,602 | 113,247 | |||||||||||||
| Collectors Universe, Inc. | 5,683 | 252,837 | |||||||||||||
|
| ||||||||||||||
| 366,084 | |||||||||||||||
|
| ||||||||||||||
| Hotels, Restaurants & Leisure - 0.13% | |||||||||||||||
| Bluegreen Vacations Corp. | 9,738 | 54,143 | |||||||||||||
| Nathan’s Famous, Inc. | 707 | 37,082 | |||||||||||||
|
| ||||||||||||||
| 91,225 | |||||||||||||||
|
| ||||||||||||||
| Household Durables - 4.33% | |||||||||||||||
| GoPro, Inc., Class AA | 88,639 | 406,853 | |||||||||||||
| Green Brick Partners, Inc.A | 14,728 | 209,727 | |||||||||||||
| Hamilton Beach Brands Holding Co., Class A | 4,073 | 88,995 | |||||||||||||
| Hooker Furniture Corp. | 9,180 | 226,287 | |||||||||||||
| iRobot Corp.A | 7,179 | 531,461 | |||||||||||||
| Legacy Housing Corp.A | 9,830 | 150,104 | |||||||||||||
| Lovesac Co.A | 12,163 | 321,955 | |||||||||||||
| Sonos, Inc.A | 34,587 | 486,639 | |||||||||||||
| Turtle Beach Corp.A | 19,018 | 372,182 | |||||||||||||
| Universal Electronics, Inc.A | 4,344 | 178,452 | |||||||||||||
|
| ||||||||||||||
| 2,972,655 | |||||||||||||||
|
| ||||||||||||||
See accompanying notes
14
American Beacon Zebra Small Cap Equity FundSM
Schedule of Investments
August 31, 2020
| Shares | Fair Value | ||||||||||||||
| COMMON STOCKS - 98.39% (continued) | |||||||||||||||
| Consumer Discretionary - 12.79% (continued) | |||||||||||||||
| Internet & Direct Marketing Retail - 2.04% | |||||||||||||||
| 1-800-Flowers.com, Inc., Class AA | 17,656 | $ | 528,444 | ||||||||||||
| Overstock.com, Inc.A | 1,929 | 168,788 | |||||||||||||
| Shutterstock, Inc. | 5,120 | 257,638 | |||||||||||||
| Stitch Fix, Inc., Class AA | 18,291 | 441,728 | |||||||||||||
|
| ||||||||||||||
| 1,396,598 | |||||||||||||||
|
| ||||||||||||||
| Leisure Products - 1.77% | |||||||||||||||
| Clarus Corp. | 39,695 | 499,760 | |||||||||||||
| Escalade, Inc. | 284 | 5,149 | |||||||||||||
| Johnson Outdoors, Inc., Class A | 1,623 | 139,108 | |||||||||||||
| Marine Products Corp. | 5,725 | 82,726 | |||||||||||||
| YETI Holdings, Inc.A | 9,514 | 488,829 | |||||||||||||
|
| ||||||||||||||
| 1,215,572 | |||||||||||||||
|
| ||||||||||||||
| Multiline Retail - 0.53% | |||||||||||||||
| Big Lots, Inc. | 7,662 | 361,263 | |||||||||||||
|
| ||||||||||||||
| Specialty Retail - 1.01% | |||||||||||||||
| Lumber Liquidators Holdings, Inc.A | 12,030 | 288,600 | |||||||||||||
| RHA | 1,224 | 404,593 | |||||||||||||
|
| ||||||||||||||
| 693,193 | |||||||||||||||
|
| ||||||||||||||
| Textiles, Apparel & Luxury Goods - 0.85% | |||||||||||||||
| Deckers Outdoor Corp.A | 2,819 | 574,710 | |||||||||||||
| Superior Group of Cos., Inc. | 352 | 8,145 | |||||||||||||
|
| ||||||||||||||
| 582,855 | |||||||||||||||
|
| ||||||||||||||
Total Consumer Discretionary | 8,773,391 | ||||||||||||||
|
| ||||||||||||||
| Consumer Staples - 5.51% | |||||||||||||||
| Beverages - 0.46% | |||||||||||||||
| National Beverage Corp.A | 3,861 | 313,976 | |||||||||||||
|
| ||||||||||||||
| Food & Staples Retailing - 2.31% | |||||||||||||||
| Ingles Markets, Inc., Class A | 10,364 | 418,706 | |||||||||||||
| SpartanNash Co. | 11,310 | 225,974 | |||||||||||||
| Village Super Market, Inc., Class A | 10,089 | 256,664 | |||||||||||||
| Weis Markets, Inc. | 13,862 | 682,426 | |||||||||||||
|
| ||||||||||||||
| 1,583,770 | |||||||||||||||
|
| ||||||||||||||
| Food Products - 0.12% | |||||||||||||||
| Bridgford Foods Corp.A | 2,732 | 45,324 | |||||||||||||
| Seneca Foods Corp., Class AA | 767 | �� | 36,325 | ||||||||||||
|
| ||||||||||||||
| 81,649 | |||||||||||||||
|
| ||||||||||||||
| Household Products - 1.79% | |||||||||||||||
| Oil-Dri Corp. of America | 1,693 | 59,289 | |||||||||||||
| WD-40 Co. | 5,740 | 1,173,141 | |||||||||||||
|
| ||||||||||||||
| 1,232,430 | |||||||||||||||
|
| ||||||||||||||
| Personal Products - 0.83% | |||||||||||||||
| Lifevantage Corp.A | 4,298 | 64,556 | |||||||||||||
| Medifast, Inc. | 1,410 | 229,435 | |||||||||||||
| USANA Health Sciences, Inc.A | 3,484 | 273,181 | |||||||||||||
| �� | ||||||||||||||
| 567,172 | |||||||||||||||
|
| ||||||||||||||
Total Consumer Staples | 3,778,997 | ||||||||||||||
|
| ||||||||||||||
See accompanying notes
15
American Beacon Zebra Small Cap Equity FundSM
Schedule of Investments
August 31, 2020
| Shares | Fair Value | ||||||||||||||
| COMMON STOCKS - 98.39% (continued) | |||||||||||||||
| Energy - 0.96% | |||||||||||||||
| Energy Equipment & Services - 0.57% | |||||||||||||||
| Matrix Service Co.A | 34,975 | $ | 323,169 | ||||||||||||
| Smart Sand, Inc.A | 49,903 | 68,866 | |||||||||||||
|
| ||||||||||||||
| 392,035 | |||||||||||||||
|
| ||||||||||||||
| Oil, Gas & Consumable Fuels - 0.39% | |||||||||||||||
| Evolution Petroleum Corp. | 28,073 | 76,640 | |||||||||||||
| Falcon Minerals Corp. | 11,336 | 31,854 | |||||||||||||
| Hallador Energy Co. | 50,429 | 38,931 | |||||||||||||
| NACCO Industries, Inc., Class A | 3,300 | 67,650 | |||||||||||||
| Panhandle Oil and Gas, Inc., Class A | 7,034 | 13,294 | |||||||||||||
| PrimeEnergy Resources Corp.A | 529 | 35,570 | |||||||||||||
|
| ||||||||||||||
| 263,939 | |||||||||||||||
|
| ||||||||||||||
Total Energy | 655,974 | ||||||||||||||
|
| ||||||||||||||
| Financials - 14.78% | |||||||||||||||
| Banks - 10.04% | |||||||||||||||
| 1st Constitution Bancorp | 12,003 | 146,077 | |||||||||||||
| Bank of Commerce Holdings | 28,727 | 211,143 | |||||||||||||
| Bank of Princeton | 905 | 17,629 | |||||||||||||
| BCB Bancorp, Inc. | 31,690 | 258,115 | |||||||||||||
| C&F Financial Corp. | 1,744 | 55,756 | |||||||||||||
| Capital Bancorp, Inc.A | 9,423 | 98,093 | |||||||||||||
| CB Financial Services, Inc. | 879 | 16,349 | |||||||||||||
| Central Valley Community Bancorp | 7,096 | 85,365 | |||||||||||||
| Civista Bancshares, Inc. | 2,388 | 31,880 | |||||||||||||
| CNB Financial Corp. | 28,402 | 453,012 | |||||||||||||
| Codorus Valley Bancorp, Inc. | 3,543 | 45,705 | |||||||||||||
| Colony Bankcorp, Inc. | 4,240 | 46,640 | |||||||||||||
| Community Financial Corp. | 2,006 | 44,613 | |||||||||||||
| Community Trust Bancorp, Inc. | 5,425 | 175,065 | |||||||||||||
| Enterprise Bancorp, Inc. | 7,359 | 159,911 | |||||||||||||
| Evans Bancorp, Inc. | 1,376 | 31,373 | |||||||||||||
| Farmers National Banc Corp. | 11,338 | 132,201 | |||||||||||||
| Financial Institutions, Inc. | 10,389 | 179,002 | |||||||||||||
| First Bancorp, Inc. | 1,578 | 33,580 | |||||||||||||
| First Bank/Hamilton | 8,608 | 56,124 | |||||||||||||
| First Business Financial Services, Inc. | 2,108 | 32,674 | |||||||||||||
| First Choice Bancorp | 4,295 | 60,774 | |||||||||||||
| First Guaranty Bancshares, Inc. | 3,565 | 45,739 | |||||||||||||
| First Mid Bancshares, Inc. | 3,971 | 103,405 | |||||||||||||
| Franklin Financial Services Corp. | 1,906 | 45,439 | |||||||||||||
| Great Southern Bancorp, Inc. | 860 | 33,144 | |||||||||||||
| Horizon Bancorp, Inc. | 20,211 | 225,959 | |||||||||||||
| LCNB Corp. | 16,347 | 239,647 | |||||||||||||
| Macatawa Bank Corp. | 71,351 | 522,289 | |||||||||||||
| Mackinac Financial Corp. | 12,519 | 125,440 | |||||||||||||
| Midland States Bancorp, Inc. | 3,903 | 57,023 | |||||||||||||
| Northrim BanCorp, Inc. | 2,089 | 56,215 | |||||||||||||
| Oak Valley BancorpB | 4,944 | 66,744 | |||||||||||||
| Old Second Bancorp, Inc. | 3,288 | 26,863 | |||||||||||||
| Orrstown Financial Services, Inc. | 2,003 | 27,581 | |||||||||||||
| Parke Bancorp, Inc. | 13,719 | 168,744 | |||||||||||||
| PCB Bancorp | 43,111 | 411,710 | |||||||||||||
| Penns Woods Bancorp, Inc. | 7,746 | 160,730 | |||||||||||||
| Peoples Bancorp of North Carolina, Inc. | 2,768 | 47,056 | |||||||||||||
| Peoples Bancorp, Inc. | 9,777 | 206,686 | |||||||||||||
See accompanying notes
16
American Beacon Zebra Small Cap Equity FundSM
Schedule of Investments
August 31, 2020
| Shares | Fair Value | ||||||||||||||
| COMMON STOCKS - 98.39% (continued) | |||||||||||||||
| Financials - 14.78% (continued) | |||||||||||||||
| Banks - 10.04% (continued) | |||||||||||||||
| Plumas Bancorp | 733 | $ | 14,484 | ||||||||||||
| Premier Financial Bancorp, Inc. | 13,651 | 175,006 | |||||||||||||
| RBB Bancorp | 8,599 | 111,529 | |||||||||||||
| Republic Bancorp, Inc., Class A | 12,360 | 380,194 | |||||||||||||
| Shore Bancshares, Inc. | 16,628 | 162,123 | |||||||||||||
| Sierra Bancorp | 3,273 | 58,489 | |||||||||||||
| South Plains Financial, Inc. | 2,507 | 35,800 | |||||||||||||
| Southern National Bancorp of Virginia, Inc. | 29,178 | 249,472 | |||||||||||||
| Summit Financial Group, Inc. | 6,686 | 98,619 | |||||||||||||
| TriCo Bancshares | 6,651 | 184,166 | |||||||||||||
| United Security Bancshares | 48,892 | 297,752 | |||||||||||||
| Unity Bancorp, Inc. | 13,388 | 177,793 | |||||||||||||
|
| ||||||||||||||
| 6,886,922 | |||||||||||||||
|
| ||||||||||||||
| Capital Markets - 1.29% | |||||||||||||||
| B. Riley Financial, Inc. | 1,359 | 36,394 | |||||||||||||
| Cohen & Steers, Inc. | 5,797 | 350,718 | |||||||||||||
| Diamond Hill Investment Group, Inc. | 1,201 | 148,816 | |||||||||||||
| GAMCO Investors, Inc., Class A | 21,408 | 270,169 | |||||||||||||
| Pzena Investment Management, Inc., Class A | 7,246 | 35,868 | |||||||||||||
| Silvercrest Asset Management Group, Inc., Class A | 3,310 | 41,507 | |||||||||||||
|
| ||||||||||||||
| 883,472 | |||||||||||||||
|
| ||||||||||||||
| Diversified Financial Services - 0.13% | |||||||||||||||
| Alerus Financial Corp. | 3,562 | 73,342 | |||||||||||||
| Marlin Business Services Corp. | 2,720 | 18,224 | |||||||||||||
|
| ||||||||||||||
| 91,566 | |||||||||||||||
|
| ||||||||||||||
| Insurance - 1.21% | |||||||||||||||
| Crawford & Co., Class A | 24,858 | 170,526 | |||||||||||||
| Donegal Group, Inc., Class A | 11,925 | 172,078 | |||||||||||||
| Independence Holding Co. | 2,979 | 104,265 | |||||||||||||
| NI Holdings, Inc.A | 11,416 | 186,309 | |||||||||||||
| ProSight Global, Inc.A | 20,732 | 196,539 | |||||||||||||
|
| ||||||||||||||
| 829,717 | |||||||||||||||
|
| ||||||||||||||
| Thrifts & Mortgage Finance - 2.11% | |||||||||||||||
| ESSA Bancorp, Inc. | 5,453 | 69,798 | |||||||||||||
| FS Bancorp, Inc. | 3,131 | 124,050 | |||||||||||||
| Home Bancorp, Inc. | 2,980 | 71,997 | |||||||||||||
| Merchants Bancorp | 13,177 | 268,547 | |||||||||||||
| OP Bancorp | 12,440 | 75,884 | |||||||||||||
| Riverview Bancorp, Inc. | 126,853 | 523,903 | |||||||||||||
| Southern Missouri Bancorp, Inc. | 5,967 | 141,299 | |||||||||||||
| Sterling Bancorp, Inc. | 18,935 | 56,237 | |||||||||||||
| Timberland Bancorp, Inc. | 6,650 | 116,308 | |||||||||||||
|
| ||||||||||||||
| 1,448,023 | |||||||||||||||
|
| ||||||||||||||
Total Financials | 10,139,700 | ||||||||||||||
|
| ||||||||||||||
| Health Care - 16.05% | |||||||||||||||
| Biotechnology - 4.75% | |||||||||||||||
| Avid Bioservices, Inc.A | 30,631 | 256,994 | |||||||||||||
| BioSpecifics Technologies Corp.A | 4,979 | 321,146 | |||||||||||||
| Castle Biosciences, Inc.A | 7,851 | 359,026 | |||||||||||||
| Celcuity, Inc.A | 10,887 | 60,423 | |||||||||||||
| Natera, Inc.A | 11,410 | 726,931 | |||||||||||||
See accompanying notes
17
American Beacon Zebra Small Cap Equity FundSM
Schedule of Investments
August 31, 2020
| Shares | Fair Value | ||||||||||||||
| COMMON STOCKS - 98.39% (continued) | |||||||||||||||
| Health Care - 16.05% (continued) | |||||||||||||||
| Biotechnology - 4.75% (continued) | |||||||||||||||
| Retrophin, Inc.A | 39,800 | $ | 779,682 | ||||||||||||
| Veracyte, Inc.A | 22,719 | 756,770 | |||||||||||||
|
| ||||||||||||||
| 3,260,972 | |||||||||||||||
|
| ||||||||||||||
| Health Care Equipment & Supplies - 4.87% | |||||||||||||||
| Antares Pharma, Inc.A | 136,922 | 387,489 | |||||||||||||
| Atrion Corp. | 6 | 3,790 | |||||||||||||
| Cardiovascular Systems, Inc.A | 15,266 | 498,740 | |||||||||||||
| Electromed, Inc.A | 5,952 | 73,686 | |||||||||||||
| iRadimed Corp.A | 1,709 | 36,231 | |||||||||||||
| iRhythm Technologies, Inc.A | 1,416 | 311,775 | |||||||||||||
| Orthofix Medical, Inc.A | 29,271 | 888,082 | |||||||||||||
| Stereotaxis, Inc.A | 15,767 | 55,500 | |||||||||||||
| Surmodics, Inc.A | 6,928 | 313,492 | |||||||||||||
| Tactile Systems Technology, Inc.A | 8,774 | 337,185 | |||||||||||||
| Utah Medical Products, Inc. | 379 | 31,135 | |||||||||||||
| Zynex, Inc.A | 27,467 | 406,511 | |||||||||||||
|
| ||||||||||||||
| 3,343,616 | |||||||||||||||
|
| ||||||||||||||
| Health Care Providers & Services - 2.06% | |||||||||||||||
| Apollo Medical Holdings, Inc.A B | 10,251 | 193,641 | |||||||||||||
| CorVel Corp.A | 834 | 69,239 | |||||||||||||
| Cross Country Healthcare, Inc.A | 62,310 | 398,161 | |||||||||||||
| InfuSystem Holdings, Inc.A | 3,595 | 52,307 | |||||||||||||
| National HealthCare Corp. | 1,048 | 66,758 | |||||||||||||
| National Research Corp. | 9,217 | 516,152 | |||||||||||||
| RadNet, Inc.A | 2,641 | 38,083 | |||||||||||||
| Viemed Healthcare, Inc.A | 7,139 | 77,601 | |||||||||||||
|
| ||||||||||||||
| 1,411,942 | |||||||||||||||
|
| ||||||||||||||
| Health Care Technology - 1.49% | |||||||||||||||
| Computer Programs & Systems, Inc. | 6,463 | 176,828 | |||||||||||||
| HealthStream, Inc.A | 4,788 | 99,184 | |||||||||||||
| iCAD, Inc.A | 7,527 | 81,517 | |||||||||||||
| Simulations Plus, Inc. | 11,092 | 660,861 | |||||||||||||
|
| ||||||||||||||
| 1,018,390 | |||||||||||||||
|
| ||||||||||||||
| Life Sciences Tools & Services - 0.36% | |||||||||||||||
| Champions Oncology, Inc.A | 3,023 | 25,030 | |||||||||||||
| ChromaDex Corp.A B | 44,341 | 219,488 | |||||||||||||
|
| ||||||||||||||
| 244,518 | |||||||||||||||
|
| ||||||||||||||
| Pharmaceuticals - 2.52% | |||||||||||||||
| BioDelivery Sciences International, Inc.A | 94,316 | 368,775 | |||||||||||||
| Corcept Therapeutics, Inc.A | 51,978 | 660,121 | |||||||||||||
| Harrow Health, Inc. | 13,512 | 93,098 | |||||||||||||
| SIGA Technologies, Inc.A | 87,264 | 606,485 | |||||||||||||
|
| ||||||||||||||
| 1,728,479 | |||||||||||||||
|
| ||||||||||||||
Total Health Care | 11,007,917 | ||||||||||||||
|
| ||||||||||||||
| Industrials - 15.24% | |||||||||||||||
| Aerospace & Defense - 0.48% | |||||||||||||||
| Moog, Inc., Class A | 5,513 | 332,379 | |||||||||||||
|
| ||||||||||||||
| Air Freight & Logistics - 0.15% | |||||||||||||||
| Radiant Logistics, Inc.A | 19,179 | 101,265 | |||||||||||||
|
| ||||||||||||||
See accompanying notes
18
American Beacon Zebra Small Cap Equity FundSM
Schedule of Investments
August 31, 2020
| Shares | Fair Value | ||||||||||||||
| COMMON STOCKS - 98.39% (continued) | |||||||||||||||
| Industrials - 15.24% (continued) | |||||||||||||||
| Building Products - 0.46% | |||||||||||||||
| CSW Industrials, Inc. | 4,361 | $ | 315,082 | ||||||||||||
|
| ||||||||||||||
| Commercial Services & Supplies - 3.63% | |||||||||||||||
| CompX International, Inc. | 2,314 | 31,702 | |||||||||||||
| Deluxe Corp. | 17,461 | 495,892 | |||||||||||||
| Ennis, Inc. | 37,388 | 685,322 | |||||||||||||
| Kimball International, Inc., Class B | 32,953 | 369,403 | |||||||||||||
| McGrath RentCorp | 11,988 | 795,524 | |||||||||||||
| VSE Corp. | 3,870 | 112,346 | |||||||||||||
|
| ||||||||||||||
| 2,490,189 | |||||||||||||||
|
| ||||||||||||||
| Construction & Engineering - 2.43% | |||||||||||||||
| Aegion Corp.A | 8,458 | 136,893 | |||||||||||||
| IES Holdings, Inc.A | 3,657 | 105,431 | |||||||||||||
| MasTec, Inc.A | 12,536 | 579,289 | |||||||||||||
| MYR Group, Inc.A | 6,387 | 247,879 | |||||||||||||
| Primoris Services Corp. | 31,246 | 595,549 | |||||||||||||
|
| ||||||||||||||
| 1,665,041 | |||||||||||||||
|
| ||||||||||||||
| Electrical Equipment - 0.03% | |||||||||||||||
| LSI Industries, Inc. | 3,328 | 22,830 | |||||||||||||
|
| ||||||||||||||
| Machinery - 3.58% | |||||||||||||||
| Astec Industries, Inc. | 5,542 | 292,174 | |||||||||||||
| Columbus McKinnon Corp. | 964 | 35,066 | |||||||||||||
| Eastern Co. | 3,947 | 86,439 | |||||||||||||
| Franklin Electric Co., Inc. | 13,513 | 802,132 | |||||||||||||
| Gencor Industries, Inc.A | 3,314 | 41,790 | |||||||||||||
| Gorman-Rupp Co. | 35 | 1,118 | |||||||||||||
| Hurco Cos., Inc. | 2,926 | 82,747 | |||||||||||||
| Miller Industries, Inc. | 9,779 | 306,767 | |||||||||||||
| Mueller Industries, Inc. | 14,101 | 418,800 | |||||||||||||
| Omega Flex, Inc. | 2,300 | 303,002 | |||||||||||||
| Park-Ohio Holdings Corp. | 5,537 | 87,595 | |||||||||||||
|
| ||||||||||||||
| 2,457,630 | |||||||||||||||
|
| ||||||||||||||
| Professional Services - 2.23% | |||||||||||||||
| CRA International, Inc. | 3,211 | 136,500 | |||||||||||||
| Franklin Covey Co.A | 8,555 | 168,876 | |||||||||||||
| Kelly Services, Inc., Class A | 4,814 | 91,418 | |||||||||||||
| Kforce, Inc. | 12,459 | 427,842 | |||||||||||||
| Mastech Digital, Inc.A | 1,088 | 20,128 | |||||||||||||
| Resources Connection, Inc. | 24,396 | 299,827 | |||||||||||||
| TrueBlue, Inc.A | 22,870 | 386,960 | |||||||||||||
|
| ||||||||||||||
| 1,531,551 | |||||||||||||||
|
| ||||||||||||||
| Road & Rail - 0.16% | |||||||||||||||
| Universal Logistics Holdings, Inc. | 4,949 | 106,404 | |||||||||||||
|
| ||||||||||||||
| Trading Companies & Distributors - 2.09% | |||||||||||||||
| Lawson Products, Inc.A | 3,247 | 116,567 | |||||||||||||
| Rush Enterprises, Inc., Class A | 14,101 | 681,360 | |||||||||||||
| Systemax, Inc. | 23,674 | 525,326 | |||||||||||||
| Transcat, Inc.A | 2,336 | 68,702 | |||||||||||||
| Willis Lease Finance Corp.A | 1,863 | 39,831 | |||||||||||||
|
| ||||||||||||||
| 1,431,786 | |||||||||||||||
|
| ||||||||||||||
Total Industrials | 10,454,157 | ||||||||||||||
|
| ||||||||||||||
See accompanying notes
19
American Beacon Zebra Small Cap Equity FundSM
Schedule of Investments
August 31, 2020
| Shares | Fair Value | ||||||||||||||
| COMMON STOCKS - 98.39% (continued) | |||||||||||||||
| Information Technology - 15.24% | |||||||||||||||
| Communications Equipment - 0.63% | |||||||||||||||
| Calix, Inc.A | 9,231 | $ | 179,543 | ||||||||||||
| DZX, Inc. | 22,932 | 238,952 | |||||||||||||
| TESSCO Technologies, Inc. | 2,595 | 16,011 | |||||||||||||
|
| ||||||||||||||
| 434,506 | |||||||||||||||
|
| ||||||||||||||
| Electronic Equipment, Instruments & Components - 3.36% | |||||||||||||||
| Daktronics, Inc. | 15,894 | 70,251 | |||||||||||||
| Insight Enterprises, Inc.A | 15,576 | 931,523 | |||||||||||||
| Kimball Electronics, Inc.A | 9,097 | 122,673 | |||||||||||||
| OSI Systems, Inc.A | 10,194 | 802,778 | |||||||||||||
| PC Connection, Inc. | 5,197 | 230,175 | |||||||||||||
| ScanSource, Inc.A | 5,818 | 143,646 | |||||||||||||
| Vishay Precision Group, Inc.A | 13 | 324 | |||||||||||||
|
| ||||||||||||||
| 2,301,370 | |||||||||||||||
|
| ||||||||||||||
| IT Services - 2.46% | |||||||||||||||
| Brightcove, Inc.A | 39,222 | 436,148 | |||||||||||||
| Hackett Group, Inc. | 9,941 | 125,356 | |||||||||||||
| Information Services Group, Inc.A | 15,394 | 31,635 | |||||||||||||
| PRGX Global, Inc.A | 5,361 | 29,593 | |||||||||||||
| Sykes Enterprises, Inc.A | 32,061 | 1,061,379 | |||||||||||||
|
| ||||||||||||||
| 1,684,111 | |||||||||||||||
|
| ||||||||||||||
| Semiconductors & Semiconductor Equipment - 0.04% | |||||||||||||||
| GSI Technology, Inc.A | 4,501 | 28,626 | |||||||||||||
|
| ||||||||||||||
| Software - 8.20% | |||||||||||||||
| A10 Networks, Inc.A | 64,377 | 550,423 | |||||||||||||
| Alarm.com Holdings, Inc.A | 7,118 | 426,155 | |||||||||||||
| American Software, Inc., Class A | 4,962 | 70,262 | |||||||||||||
| Appfolio, Inc., Class AA | 1,525 | 256,246 | |||||||||||||
| Box, Inc., Class AA | 33,217 | 652,050 | |||||||||||||
| ChannelAdvisor Corp.A | 19,762 | 332,397 | |||||||||||||
| CommVault Systems, Inc.A | 16,216 | 701,018 | |||||||||||||
| Mitek Systems, Inc.A | 41,445 | 525,937 | |||||||||||||
| MobileIron, Inc.A | 39,978 | 261,056 | |||||||||||||
| QAD, Inc., Class A | 7,831 | 356,154 | |||||||||||||
| Rimini Street, Inc.A | 69,101 | 302,662 | |||||||||||||
| Rosetta Stone, Inc.A | 15,988 | 485,715 | |||||||||||||
| ShotSpotter, Inc.A | 6,383 | 191,235 | |||||||||||||
| Smith Micro Software, Inc.A | 18,425 | 70,752 | |||||||||||||
| Tenable Holdings, Inc.A | 11,806 | 444,378 | |||||||||||||
|
| ||||||||||||||
| 5,626,440 | |||||||||||||||
|
| ||||||||||||||
| Technology Hardware, Storage & Peripherals - 0.55% | |||||||||||||||
| AstroNova, Inc. | 4,189 | 28,695 | |||||||||||||
| Avid Technology, Inc.A | 43,386 | 351,426 | |||||||||||||
|
| ||||||||||||||
| 380,121 | |||||||||||||||
|
| ||||||||||||||
Total Information Technology | 10,455,174 | ||||||||||||||
|
| ||||||||||||||
| Materials - 4.66% | |||||||||||||||
| Chemicals - 3.63% | |||||||||||||||
| Chase Corp. | 2,023 | 197,384 | |||||||||||||
| Hawkins, Inc. | 5,862 | 294,390 | |||||||||||||
| Innospec, Inc. | 11,527 | 860,951 | |||||||||||||
See accompanying notes
20
American Beacon Zebra Small Cap Equity FundSM
Schedule of Investments
August 31, 2020
| Shares | Fair Value | ||||||||||||||
| COMMON STOCKS - 98.39% (continued) | |||||||||||||||
| Materials - 4.66% (continued) | |||||||||||||||
| Chemicals - 3.63% (continued) | |||||||||||||||
| Kronos Worldwide, Inc. | 46,571 | $ | 581,672 | ||||||||||||
| Tredegar Corp. | 32,970 | 558,182 | |||||||||||||
|
| ||||||||||||||
| 2,492,579 | |||||||||||||||
|
| ||||||||||||||
| Construction Materials - 0.32% | |||||||||||||||
| United States Lime & Minerals, Inc. | 2,417 | 222,678 | |||||||||||||
|
| ||||||||||||||
| Containers & Packaging - 0.61% | |||||||||||||||
| UFP Technologies, Inc.A | 10,147 | 418,158 | |||||||||||||
|
| ||||||||||||||
| Paper & Forest Products - 0.10% | |||||||||||||||
| Boise Cascade Co. | 1,446 | 66,227 | |||||||||||||
|
| ||||||||||||||
Total Materials | 3,199,642 | ||||||||||||||
|
| ||||||||||||||
| Real Estate - 9.22% | |||||||||||||||
| Equity Real Estate Investment Trusts (REITs) - 6.47% | |||||||||||||||
| Alexander’s, Inc. | 1,461 | 372,657 | |||||||||||||
| BRT Apartments Corp. | 5,737 | 76,589 | |||||||||||||
| CIM Commercial Trust Corp. | 6,691 | 69,118 | |||||||||||||
| Clipper Realty, Inc. | 12,326 | 82,214 | |||||||||||||
| Franklin Street Properties Corp. | 34,480 | 152,746 | |||||||||||||
| Getty Realty Corp. | 27,305 | 799,764 | |||||||||||||
| Gladstone Land Corp. | 12,233 | 192,548 | |||||||||||||
| Industrial Logistics Properties Trust | 17,646 | 380,624 | |||||||||||||
| Monmouth Real Estate Investment Corp. | 43,809 | 635,669 | |||||||||||||
| Office Properties Income Trust | 9,823 | 234,180 | |||||||||||||
| One Liberty Properties, Inc. | 14,237 | 272,781 | |||||||||||||
| PotlatchDeltic Corp. | 6,820 | 313,993 | |||||||||||||
| PS Business Parks, Inc. | 6,240 | 787,488 | |||||||||||||
| Universal Health Realty Income Trust | 1,030 | 68,722 | |||||||||||||
|
| ||||||||||||||
| 4,439,093 | |||||||||||||||
|
| ||||||||||||||
| Real Estate Management & Development - 2.75% | |||||||||||||||
| CTO Realty Growth, Inc. | 752 | 31,712 | |||||||||||||
| eXp World Holdings, Inc.A | 7,087 | 315,230 | |||||||||||||
| Forestar Group, Inc.A | 5,659 | 100,561 | |||||||||||||
| Kennedy-Wilson Holdings, Inc. | 52,756 | 753,883 | |||||||||||||
| Marcus & Millichap, Inc.A | 14,581 | 411,330 | |||||||||||||
| Maui Land & Pineapple Co., Inc.A | 3,873 | 45,159 | |||||||||||||
| RMR Group, Inc., Class A | 4,183 | 118,044 | |||||||||||||
| St Joe Co.A | 4,619 | 107,207 | |||||||||||||
| Stratus Properties, Inc.A | 194 | 3,802 | |||||||||||||
|
| ||||||||||||||
| 1,886,928 | |||||||||||||||
|
| ||||||||||||||
Total Real Estate | 6,326,021 | ||||||||||||||
|
| ||||||||||||||
| Utilities - 0.93% | |||||||||||||||
| Electric Utilities - 0.04% | |||||||||||||||
| Otter Tail Corp. | 703 | 27,312 | |||||||||||||
|
| ||||||||||||||
| Gas Utilities - 0.03% | |||||||||||||||
| RGC Resources, Inc. | 937 | 21,851 | |||||||||||||
|
| ||||||||||||||
| Independent Power & Renewable Electricity Producers - 0.19% | |||||||||||||||
| Atlantic Power Corp.A B | 63,360 | 131,156 | |||||||||||||
|
| ||||||||||||||
See accompanying notes
21
American Beacon Zebra Small Cap Equity FundSM
Schedule of Investments
August 31, 2020
| Shares | Fair Value | ||||||||||||||
| COMMON STOCKS - 98.39% (continued) | |||||||||||||||
| Utilities - 0.93% (continued) | |||||||||||||||
| Water Utilities - 0.67% | |||||||||||||||
| Artesian Resources Corp., Class A | 8,383 | $ | 294,998 | ||||||||||||
| Pure Cycle Corp.A | 6,545 | 63,879 | |||||||||||||
| York Water Co. | 2,135 | 97,377 | |||||||||||||
|
| ||||||||||||||
| 456,254 | |||||||||||||||
|
| ||||||||||||||
Total Utilities | 636,573 | ||||||||||||||
|
| ||||||||||||||
Total Common Stocks (Cost $70,608,636) | 67,494,899 | ||||||||||||||
|
| ||||||||||||||
| SHORT-TERM INVESTMENTS - 1.93% (Cost $1,323,905) | |||||||||||||||
| Investment Companies - 1.93% | |||||||||||||||
American Beacon U.S. Government Money Market Select Fund, 0.01%C D | 1,323,905 | 1,323,905 | |||||||||||||
|
| ||||||||||||||
| SECURITIES LENDING COLLATERAL - 0.35% (Cost $241,564) | |||||||||||||||
| Investment Companies - 0.35% | |||||||||||||||
American Beacon U.S. Government Money Market Select Fund, 0.01%C D | 241,564 | 241,564 | |||||||||||||
|
| ||||||||||||||
TOTAL INVESTMENTS - 100.67% (Cost $72,174,105) | 69,060,368 | ||||||||||||||
LIABILITIES, NET OF OTHER ASSETS - (0.67%) | (459,978 | ) | |||||||||||||
|
| ||||||||||||||
TOTAL NET ASSETS - 100.00% | $ | 68,600,390 | |||||||||||||
|
| ||||||||||||||
| Percentages are stated as a percent of net assets. | |||||||||||||||
A Non-income producing security.
B All or a portion of this security is on loan, collateralized by either cash and/or U.S. Treasuries, at August 31, 2020 (Note 8).
C The Fund is affiliated by having the same investment advisor.
D 7-day yield.
| Long Futures Contracts Open on August 31, 2020: |
| |||||||||||||
| Equity Futures Contracts | ||||||||||||||
| Description | Number of Contracts | Expiration Date | Notional Amount | Contract Value | Unrealized Appreciation (Depreciation) | |||||||||
| Russell 2000 E-Mini Index Futures | 17 | September 2020 | $1,323,802 | $ | 1,327,105 | $ | 3,303 | |||||||
|
|
|
|
| ||||||||||
| $1,323,802 | $ | 1,327,105 | $ | 3,303 | ||||||||||
|
|
|
|
| ||||||||||
The Fund’s investments are summarized by level based on the inputs used to determine their values. As of August 31, 2020, the investments were classified as described below:
Zebra Small Cap Equity Fund | Level 1 | Level 2 | Level 3 | Total | ||||||||||||||||||||||||
Assets |
| |||||||||||||||||||||||||||
Common Stocks | $ | 67,494,899 | $ | – | $ | – | $ | 67,494,899 | ||||||||||||||||||||
Short-Term Investments | 1,323,905 | – | – | 1,323,905 | ||||||||||||||||||||||||
Securities Lending Collateral | 241,564 | – | – | 241,564 | ||||||||||||||||||||||||
|
|
|
|
|
|
|
| |||||||||||||||||||||
Total Investments in Securities – Assets | $ | 69,060,368 | $ | – | $ | – | $ | 69,060,368 | ||||||||||||||||||||
|
|
|
|
|
|
|
| |||||||||||||||||||||
Financial Derivative Instruments – Assets |
| |||||||||||||||||||||||||||
Futures Contracts | $ | 3,303 | $ | – | $ | – | $ | 3,303 | ||||||||||||||||||||
|
|
|
|
|
|
|
| |||||||||||||||||||||
Total Financial Derivative Instruments – Assets | $ | 3,303 | $ | – | $ | – | $ | 3,303 | ||||||||||||||||||||
|
|
|
|
|
|
|
| |||||||||||||||||||||
U.S. GAAP requires transfers between all levels to/from level 3 be disclosed. During the year ended August 31, 2020, there were no transfers into or out of Level 3.
See accompanying notes
22
American Beacon FundsSM
Statements of Assets and Liabilities
August 31, 2020
| The London Company Income Equity Fund | Zebra Small Cap Equity Fund | |||||||||||
Assets: |
| |||||||||||
Investments in unaffiliated securities, at fair value†§ | $ | 1,234,797,135 | $ | 67,494,899 | ||||||||
Investments in affiliated securities, at fair value‡ | 75,939,009 | 1,565,469 | ||||||||||
Cash collateral held at broker for futures contracts | 6,057,000 | 94,000 | ||||||||||
Dividends and interest receivable | 2,928,908 | 52,032 | ||||||||||
Receivable for investments sold | - | 11,736,575 | ||||||||||
Receivable for fund shares sold | 5,750,752 | 68,092 | ||||||||||
Receivable for tax reclaims | 110,114 | - | ||||||||||
Receivable for expense reimbursement (Note 2) | 2 | 17,411 | ||||||||||
Receivable for variation margin on open futures contracts (Note 5) | 5,393,628 | 3,343 | ||||||||||
Prepaid expenses | 73,116 | 36,791 | ||||||||||
|
|
|
| |||||||||
Total assets | 1,331,049,664 | 81,068,612 | ||||||||||
|
|
|
| |||||||||
Liabilities: |
| |||||||||||
Payable for investments purchased | - | 11,817,142 | ||||||||||
Payable for fund shares redeemed | 3,898,671 | 256,602 | ||||||||||
Cash due to broker for futures contracts | 5,513,803 | 12,884 | ||||||||||
Cash due to custodian | - | 14,179 | ||||||||||
Management and sub-advisory fees payable (Note 2) | 738,201 | 54,367 | ||||||||||
Service fees payable (Note 2) | 114,541 | 5,323 | ||||||||||
Transfer agent fees payable (Note 2) | 67,817 | 4,444 | ||||||||||
Payable upon return of securities loaned (Note 9)§ | - | 241,564 | ||||||||||
Custody and fund accounting fees payable | 23,684 | 6,517 | ||||||||||
Professional fees payable | 50,411 | 47,707 | ||||||||||
Payable for prospectus and shareholder reports | 31,186 | 6,200 | ||||||||||
Other liabilities | 43,344 | 1,293 | ||||||||||
|
|
|
| |||||||||
Total liabilities | 10,481,658 | 12,468,222 | ||||||||||
|
|
|
| |||||||||
Net assets | $ | 1,320,568,006 | $ | 68,600,390 | ||||||||
|
|
|
| |||||||||
Analysis of net assets: |
| |||||||||||
Paid-in-capital | $ | 955,580,986 | $ | 75,211,076 | ||||||||
Total distributable earnings (deficits)A | 364,987,020 | (6,610,686 | ) | |||||||||
|
|
|
| |||||||||
Net assets | $ | 1,320,568,006 | $ | 68,600,390 | ||||||||
|
|
|
| |||||||||
See accompanying notes
23
American Beacon FundsSM
Statements of Assets and Liabilities
August 31, 2020
| The London Company Income Equity Fund | Zebra Small Cap Equity Fund | |||||||||||
Shares outstanding at no par value (unlimited shares authorized): |
| |||||||||||
R5 ClassB | 16,084,952 | 1,374,912 | ||||||||||
|
|
|
| |||||||||
Y Class | 41,166,961 | 2,547,316 | ||||||||||
|
|
|
| |||||||||
Investor Class | 2,199,161 | 863,086 | ||||||||||
|
|
|
| |||||||||
A Class | 4,886,376 | 87,494 | ||||||||||
|
|
|
| |||||||||
C Class | 5,064,375 | 118,648 | ||||||||||
|
|
|
| |||||||||
R6 ClassC | 5,266 | N/A | ||||||||||
|
|
|
| |||||||||
Net assets: |
| |||||||||||
R5 ClassB | $ | 307,794,240 | $ | 18,929,000 | ||||||||
|
|
|
| |||||||||
Y Class | $ | 783,186,967 | $ | 35,283,932 | ||||||||
|
|
|
| |||||||||
Investor Class | $ | 41,904,048 | $ | 11,690,371 | ||||||||
|
|
|
| |||||||||
A Class | $ | 92,490,860 | $ | 1,187,137 | ||||||||
|
|
|
| |||||||||
C Class | $ | 95,091,128 | $ | 1,509,950 | ||||||||
|
|
|
| |||||||||
R6 ClassC | $ | 100,763 | $ | N/A | ||||||||
|
|
|
| |||||||||
Net asset value, offering and redemption price per share: |
| |||||||||||
R5 ClassB | $ | 19.14 | $ | 13.77 | ||||||||
|
|
|
| |||||||||
Y Class | $ | 19.02 | $ | 13.85 | ||||||||
|
|
|
| |||||||||
Investor Class | $ | 19.05 | $ | 13.54 | ||||||||
|
|
|
| |||||||||
A Class | $ | 18.93 | $ | 13.57 | ||||||||
|
|
|
| |||||||||
A Class (offering price) | $ | 20.08 | $ | 14.40 | ||||||||
|
|
|
| |||||||||
C Class | $ | 18.78 | $ | 12.73 | ||||||||
|
|
|
| |||||||||
R6 ClassC | $ | 19.13 | $ | N/A | ||||||||
|
|
|
| |||||||||
† Cost of investments in unaffiliated securities | $ | 878,983,117 | $ | 70,608,636 | ||||||||
‡ Cost of investments in affiliated securities | $ | 75,939,009 | $ | 1,565,469 | ||||||||
§ Fair value of securities on loan | $ | 5,502,672 | $ | 665,279 | ||||||||
| A The Fund’s investments in affiliated securities did not have unrealized appreciation (depreciation) at year end. |
| |||||||||||
| B Formerly known as Institutional Class. |
| |||||||||||
| C The R6 Class became effective on August 25, 2020 and commenced operations on August 26, 2020 in The London Company Income Equity Fund (Note 1). |
| |||||||||||
See accompanying notes
24
American Beacon FundsSM
Statements of Operations
For the year ended August 31, 2020
| The London Company Income Equity Fund | Zebra Small Cap Equity Fund | |||||||||||
Investment income: |
| |||||||||||
Dividend income from unaffiliated securities (net of foreign taxes)† | $ | 30,641,824 | $ | 1,302,317 | ||||||||
Dividend income from affiliated securities (Note 2) | 470,382 | 14,634 | ||||||||||
Interest income | 37,166 | 76 | ||||||||||
Income derived from securities lending (Note 9) | 13,467 | 9,986 | ||||||||||
|
|
|
| |||||||||
Total investment income | 31,162,839 | 1,327,013 | ||||||||||
|
|
|
| |||||||||
Expenses: |
| |||||||||||
Management and sub-advisory fees (Note 2) | 7,462,612 | 693,543 | ||||||||||
Transfer agent fees: | ||||||||||||
R5 Class (Note 2)A | 66,798 | 4,324 | ||||||||||
Y Class (Note 2) | 631,252 | 42,423 | ||||||||||
Investor Class | 2,780 | 2,007 | ||||||||||
A Class | 3,013 | 318 | ||||||||||
C Class | 7,027 | 766 | ||||||||||
R6 ClassB | 1 | - | ||||||||||
Custody and fund accounting fees | 138,015 | 40,357 | ||||||||||
Professional fees | 111,618 | 55,069 | ||||||||||
Registration fees and expenses | 108,025 | 66,380 | ||||||||||
Service fees (Note 2): | ||||||||||||
Investor Class | 95,325 | 53,368 | ||||||||||
A Class | 44,519 | 1,052 | ||||||||||
C Class | 103,906 | 2,032 | ||||||||||
Distribution fees (Note 2): | ||||||||||||
A Class | 155,547 | 4,926 | ||||||||||
C Class | 1,213,055 | 21,312 | ||||||||||
Prospectus and shareholder report expenses | 82,238 | 20,475 | ||||||||||
Trustee fees (Note 2) | 95,600 | 6,383 | ||||||||||
Other expenses | 150,026 | 12,335 | ||||||||||
|
|
|
| |||||||||
Total expenses | 10,471,357 | 1,027,070 | ||||||||||
|
|
|
| |||||||||
Net fees waived and expenses (reimbursed) (Note 2) | (2 | ) | (216,267 | ) | ||||||||
|
|
|
| |||||||||
Net expenses | 10,471,355 | 810,803 | ||||||||||
|
|
|
| |||||||||
Net investment income | 20,691,484 | 516,210 | ||||||||||
|
|
|
| |||||||||
Realized and unrealized gain (loss) from investments: |
| |||||||||||
Net realized gain (loss) from: | ||||||||||||
Investments in unaffiliated securitiesC | 2,015,848 | (2,375,816 | ) | |||||||||
Futures contracts | 13,553,927 | (221,161 | ) | |||||||||
Change in net unrealized appreciation (depreciation) of: | ||||||||||||
Investments in unaffiliated securitiesD | 118,963,582 | (273,502 | ) | |||||||||
Futures contracts | 4,973,368 | 20,842 | ||||||||||
|
|
|
| |||||||||
Net gain (loss) from investments | 139,506,725 | (2,849,637 | ) | |||||||||
|
|
|
| |||||||||
Net increase (decrease) in net assets resulting from operations | $ | 160,198,209 | $ | (2,333,427 | ) | |||||||
|
|
|
| |||||||||
† Foreign taxes | $ | 264,140 | $ | - | ||||||||
A Formerly known as Institutional Class. | ||||||||||||
B The R6 Class became effective on August 25, 2020 and commenced operations on August 26, 2020 in The London Company Income Equity Fund (Note 1). |
| |||||||||||
C The Fund did not recognize net realized gains (losses) from the sale of investments in affiliated securities. |
| |||||||||||
D The Fund’s investments in affiliated securities did not have a change in unrealized appreciation (depreciation) at year end. |
| |||||||||||
See accompanying notes
25
American Beacon FundsSM
Statements of Changes in Net Assets
| The London Company Income Equity Fund | Zebra Small Cap Equity Fund | |||||||||||||||||||||||||||
| Year Ended August 31, 2020 | Year Ended August 31, 2019 | Year Ended August 31, 2020 | Year Ended August 31, 2019 | |||||||||||||||||||||||||
Increase (decrease) in net assets: |
| |||||||||||||||||||||||||||
Operations: |
| |||||||||||||||||||||||||||
Net investment income | $ | 20,691,484 | $ | 19,583,835 | $ | 516,210 | $ | 529,705 | ||||||||||||||||||||
Net realized gain (loss) from investments in unaffiliated securities and futures contracts | 15,569,775 | 64,773,149 | (2,596,977 | ) | (1,069,693 | ) | ||||||||||||||||||||||
Change in net unrealized appreciation (depreciation) of investments in unaffiliated securities and futures contracts | 123,936,950 | (35,055,067 | ) | (252,660 | ) | (10,651,081 | ) | |||||||||||||||||||||
|
|
|
|
|
|
|
| |||||||||||||||||||||
Net increase (decrease) in net assets resulting from operations | 160,198,209 | 49,301,917 | (2,333,427 | ) | (11,191,069 | ) | ||||||||||||||||||||||
|
|
|
|
|
|
|
| |||||||||||||||||||||
Distributions to shareholders: |
| |||||||||||||||||||||||||||
Total retained earnings: | ||||||||||||||||||||||||||||
R5 ClassA | (18,717,129 | ) | (8,464,738 | ) | (117,316 | ) | (1,075,441 | ) | ||||||||||||||||||||
Y Class | (58,089,151 | ) | (21,511,810 | ) | (222,655 | ) | (3,866,854 | ) | ||||||||||||||||||||
Investor Class | (2,076,499 | ) | (857,390 | ) | (55,339 | ) | (847,910 | ) | ||||||||||||||||||||
A Class | (5,017,368 | ) | (1,935,522 | ) | (8,941 | ) | (345,372 | ) | ||||||||||||||||||||
C Class | (9,593,710 | ) | (3,493,331 | ) | - | (277,583 | ) | |||||||||||||||||||||
|
|
|
|
|
|
|
| |||||||||||||||||||||
Net distributions to shareholders | (93,493,857 | ) | (36,262,791 | ) | (404,251 | ) | (6,413,160 | ) | ||||||||||||||||||||
|
|
|
|
|
|
|
| |||||||||||||||||||||
Capital share transactions (Note 11): |
| |||||||||||||||||||||||||||
Proceeds from sales of shares | 450,264,962 | 287,772,196 | 28,960,578 | 53,661,919 | ||||||||||||||||||||||||
Reinvestment of dividends and distributions | 58,392,218 | 21,003,121 | 325,552 | 6,373,935 | ||||||||||||||||||||||||
Cost of shares redeemed | (369,772,519 | ) | (240,716,133 | ) | (41,063,368 | ) | (37,619,306 | ) | ||||||||||||||||||||
|
|
|
|
|
|
|
| |||||||||||||||||||||
Net increase (decrease) in net assets from capital share transactions | 138,884,661 | 68,059,184 | (11,777,238 | ) | 22,416,548 | |||||||||||||||||||||||
|
|
|
|
|
|
|
| |||||||||||||||||||||
Net increase (decrease) in net assets | 205,589,013 | 81,098,310 | (14,514,916 | ) | 4,812,319 | |||||||||||||||||||||||
|
|
|
|
|
|
|
| |||||||||||||||||||||
Net assets: |
| |||||||||||||||||||||||||||
Beginning of period | 1,114,978,993 | 1,033,880,683 | 83,115,306 | 78,302,987 | ||||||||||||||||||||||||
|
|
|
|
|
|
|
| |||||||||||||||||||||
End of period | $ | 1,320,568,006 | $ | 1,114,978,993 | $ | 68,600,390 | $ | 83,115,306 | ||||||||||||||||||||
|
|
|
|
|
|
|
| |||||||||||||||||||||
| A Formerly known as Institutional Class. |
| |||||||||||||||||||||||||||
See accompanying notes
26
American Beacon FundsSM
August 31, 2020
1. Organization and Significant Accounting Policies
American Beacon Funds (the “Trust”) is organized as a Massachusetts business trust. The Funds, each a series within the Trust, are registered under the Investment Company Act of 1940, as amended (the “Act”), as diversified, open-end management investment companies. As of August 31, 2020, the Trust consists of twenty-seven active series, two of which are presented in this filing: American Beacon The London Company Income Equity Fund and American Beacon Zebra Small Cap Equity Fund (collectively, the “Funds” and each individually a “Fund”). The remaining twenty-five active series are reported in separate filings.
American Beacon Advisors, Inc. (the “Manager”) is a Delaware corporation and a wholly-owned subsidiary of Resolute Investment Managers, Inc. (“RIM”) organized in 1986 to provide business management, advisory, administrative, and asset management consulting services to the Trust and other investors. The Manager is registered as an investment advisor under the Investment Advisers Act of 1940, as amended (the “Advisers Act”). RIM is, in turn, a wholly-owned subsidiary of Resolute Acquisition, Inc., which is a wholly-owned subsidiary of Resolute Topco, Inc., a wholly-owned subsidiary of Resolute Investment Holdings, LLC (“RIH”). RIH is owned primarily by Kelso Investment Associates VIII, L.P., KEP VI, LLC and Estancia Capital Partners L.P., investment funds affiliated with Kelso & Company, L.P. (“Kelso”) or Estancia Capital Management, LLC (“Estancia”), which are private equity firms.
Recently Adopted Accounting Pronouncements
In March 2020, the Financial Accounting Standards Board (“FASB”) issued Accounting Standards Update (“ASU”) 2020-04, which provides optional expedients and exceptions for contracts, hedging relationships and other transactions affected by the transitioning away from the London Interbank Offered Rate (LIBOR) and other reference rates that are expected to be discontinued. The amendments in this Update are effective for all entities as of March 12, 2020 through December 31, 2022. At this time, management is evaluating the implications of these changes on the financial statements.
Class Disclosure
Prior to February 28, 2020, the R5 Class was known as the Institutional Class.
On August 25, 2020, The London Company Income Equity Fund created the R6 Class, a new class made available for sale to provide third party intermediaries an investment option for the large 401(K) plans that does not charge 12b-1 or sub-transfer agency fees pursuant to the Fund’s registration statement filed with the United States Securities and Exchange Commission (“SEC”).
Each Fund has multiple classes of shares designed to meet the needs of different groups of investors. The following table sets forth the differences amongst the classes:
Class | Eligible Investors | Minimum Initial Investments | ||||
| R5 Class | Large institutional investors - sold directly or through intermediary channels. | $ | 250,000 | |||
| Y Class | Large institutional retirement plan investors - sold directly or through intermediary channels. | $ | 100,000 | |||
| Investor Class | All investors using intermediary organizations, such as broker-dealers or retirement plan sponsors. | $ | 2,500 | |||
| A Class | All investors who invest through intermediary organizations, such as broker-dealers or third party administrator. Retail investors who invest directly through a financial intermediary such as a broker, bank, or registered investment advisor which may include a front-end sales charge and a contingent deferred sales charge (“CDSC”). | $ | 2,500 | |||
27
American Beacon FundsSM
Notes to Financial Statements
August 31, 2020
Class | Eligible Investors | Minimum Initial Investments | ||||
| C Class | Retail investors who invest directly through a financial intermediary such as a broker or through employee directed benefit plans with applicable sales charges which may include CDSC. | $ | 1,000 | |||
| R6 Class | Large institutional retirement plan investors - sold through retirement plan sponsors. | None | ||||
Each class offered by the Trust has equal rights as to assets and voting privileges. Income and non-class specific expenses are allocated daily to each class based on the relative net assets. Realized and unrealized capital gains and losses of each class are allocated daily based on the relative net assets of each class of the respective Fund. Class specific expenses, where applicable, currently include service, distribution, transfer agent fees, and sub-transfer agent fees that vary amongst the classes as described more fully in Note 2.
Significant Accounting Policies
The following is a summary of significant accounting policies, consistently followed by the Funds in preparation of the financial statements. The Funds are considered investment companies and accordingly, follow the investment company accounting and reporting guidance of the FASB Accounting Standards Codification Topic 946, Financial Services – Investment Companies, a part of Generally Accepted Accounting Principles (“U.S. GAAP”).
Security Transactions and Investment Income
Security transactions are recorded as of the trade date for financial reporting purposes. Securities purchased or sold on a when-issued or delayed-delivery basis may be settled beyond a standard settlement period for the security after the trade date.
Dividend income, net of foreign taxes, is recorded on the ex-dividend date, except certain dividends from foreign securities which are recorded as soon as the information is available to the Funds. Interest income, net of foreign taxes, is earned from settlement date, recorded on the accrual basis, and adjusted, if necessary, for accretion of discounts and amortization of premiums. Realized gains (losses) from securities sold are determined based on specific lot identification.
Distributions to Shareholders
The London Company Income Equity Fund distributes most or all of its net earning and realized gains, if any, each taxable year in the form of dividends from net investment income on a monthly basis and distributions of realized net capital gains and net gains or losses from foreign currency transactions on an annual basis. The Zebra Small Cap Equity Fund distributes most or all of its net earning and realized gains, if any, each taxable year in the form of dividends from net investment income and distributions of realized net capital gains and net gains or losses from foreign currency transactions on an annual basis. The Funds do not have a fixed dividend rate and do not guarantee that they will pay any distributions in any particular year. Dividends to shareholders are determined in accordance with federal income tax regulation, which may differ in amount and character from net investment income and realized gains recognized for purposes of U.S. GAAP. To the extent necessary to fully distribute capital gains, the Funds may designate earning and profits distributed to shareholders on the redemption of shares.
Commission Recapture
The Funds have established brokerage commission recapture arrangements with certain brokers or dealers. If the Funds’ investment advisor chooses to execute a transaction through a participating broker, the broker rebates a portion of the commission back to the Funds. Any collateral benefit received through participation in the commission recapture program is directed exclusively to the Funds. This amount is reported with the net realized gain (loss) in the Funds’ Statements of Operations, if applicable.
28
American Beacon FundsSM
Notes to Financial Statements
August 31, 2020
Allocation of Income, Trust Expenses, Gains, and Losses
Investment income, realized and unrealized gains and losses from investments of the Funds are allocated daily to each class of shares based upon the relative proportion of net assets of each class to the total net assets of the Funds. Expenses directly charged or attributable to the Fund will be paid from the assets of the Fund. Generally, expenses of the Trust will be allocated among and charged to the assets of the Funds on a basis that the Trust’s Board of Trustees (the “Board”) deems fair and equitable, which may be based on the relative net assets of the Funds or nature of the services performed and relative applicability to the Funds.
Use of Estimates
The preparation of financial statements in conformity with U.S. GAAP requires management to make estimates and assumptions that affect the amounts reported in the financial statements and accompanying notes. Actual results may differ from those estimated.
Other
Under the Trust’s organizational documents, its officers and trustees are indemnified against certain liabilities arising out of the performance of their duties to the Trust. In the normal course of business, the Trust enters into contracts that provide indemnification to the other party or parties against potential costs or liabilities. The Trust’s maximum exposure under these arrangements is dependent on claims that may be made in the future and, therefore, cannot be estimated. The Trust has had no prior claims or losses pursuant to any such agreement.
2. Transactions with Affiliates
Management and Investment Sub-Advisory Agreements
The Funds and the Manager are parties to a Management Agreement that obligates the Manager to provide the Funds with investment advisory and administrative services. As compensation for performing the duties under the Management Agreement, the Manager will receive an annualized management fee based on a percentage of the Funds’ average daily net assets that is calculated and accrued daily according to the following schedule:
First $5 billion | 0.35 | % | ||
Next $5 billion | 0.325 | % | ||
Next $10 billion | 0.30 | % | ||
Over $20 billion | 0.275 | % |
The Trust, on behalf of the Funds, and the Manager have entered into an Investment Advisory Agreement with the following Sub-Advisors pursuant to which each Fund has agreed to pay an annualized sub-advisory fee that is calculated and accrued daily based on the Funds’ average daily net assets according to the following schedules:
The London Company of Virginia, LLC
First $25 million | 0.40 | % | ||
Next $225 million | 0.35 | % | ||
Over $250 million | 0.30 | % |
Zebra Capital Management, LLC
��
First $350 million | 0.55 | % | ||
Next $400 million | 0.50 | % | ||
Over $750 million | 0.45 | % |
29
American Beacon FundsSM
Notes to Financial Statements
August 31, 2020
The Management and Sub-Advisory Fees paid by the Funds for the year ended August 31, 2020 were as follows:
The London Company Income Equity Fund
| Effective Fee Rate | Amount of Fees Paid | |||||||||||
Management Fees | 0.35 | % | $ | 3,974,736 | ||||||||
Sub-Advisor Fees | 0.31 | % | 3,487,876 | |||||||||
|
|
|
| |||||||||
Total | 0.66 | % | $ | 7,462,612 | ||||||||
|
|
|
| |||||||||
Zebra Small Cap Equity Fund
| Effective Fee Rate | Amount of Fees Paid | |||||||||||
Management Fees | 0.35 | % | $ | 272,979 | ||||||||
Sub-Advisor Fees | 0.54 | % | 420,564 | |||||||||
|
|
|
| |||||||||
Total | 0.89 | % | $ | 693,543 | ||||||||
|
|
|
| |||||||||
As compensation for services provided by the Manager in connection with securities lending activities conducted by the Funds, the lending Fund pays to the Manager, with respect to cash collateral posted by borrowers, a fee of 10% of the net monthly interest income (the gross interest income earned by the investment of cash collateral, less the amount paid to borrowers and related expenses) from such activities and, with respect to loan fees paid by borrowers, a fee of 10% of such loan fees. Securities lending income is generated from the demand premium (if any) paid by the borrower to borrow a specific security and from the return on investment of cash collateral, reduced by negotiated rebate fees paid to the borrower and transaction costs. To the extent that a loan is secured by non-cash collateral, securities lending income is generated as a demand premium reduced by transaction costs. These fees are included in “Income derived from securities lending” and “Management and investment advisory fees” on the Statements of Operations. During the year ended August 31, 2020, the Manager received securities lending fees of $1,730 and $1,129 for the securities lending activities of The London Company Income Equity Fund and Zebra Small Cap Equity Fund, respectively.
Distribution Plans
Separate Distribution Plans (the “Distribution Plans”) have been adopted pursuant to Rule 12b-1 under the Act for the A and C Classes of the Funds. Under the Distribution Plans, as compensation for distribution and shareholder servicing assistance, the Fund’s Distributor, Resolute Investment Distributors, Inc. (“RID” or “Distributor”), receives an annual fee of 0.25% of the average daily net assets of the A Class and 1.00% of the average daily net assets of the C Class. The fee will be payable without regard to whether the amount of the fee is more or less than the actual expenses incurred in a particular month by the Distributor for distribution assistance.
For all other share classes, the Funds have utilized a “defensive” distribution plan (the “Plan”) pursuant to which no separate fees may be charged to the Funds for distribution purposes. However, the Plan authorizes the use of management fees received by the Manager and/or the investment advisors hired by the Manager for distribution purposes. Under this Plan, the Funds do not intend to compensate the Manager or any other party, either directly or indirectly for the distribution of Fund shares from these fees.
Service Plans
The Investor, A and C Classes have each adopted a Service Plan (collectively, the “Plans”). The Plans authorize the payment to the Manager an annual fee up to 0.375% of the average daily net assets of the Investor Class, up to 0.25% of the average daily net assets of the A Class and up to 0.25% of the average daily net assets of the C Class. In addition, the Funds may reimburse the Manager for certain non-distribution shareholder services provided by financial intermediaries attributable to Y Class and R5 Class. The Manager or other approved entities
30
American Beacon FundsSM
Notes to Financial Statements
August 31, 2020
may spend such amounts on any activities or expenses primarily intended to result in or relate to the servicing of A Class, C Class, Y Class, R5 Class and Investor Class including, but not limited to, payment of shareholder service fees and transfer agency or sub-transfer agency expenses. The fees will be payable monthly in arrears. The primary expenses expected to be incurred under the Plans are shareholder servicing, record keeping fees and servicing fees paid to financial intermediaries such as plan sponsors and broker-dealers.
Sub-Transfer Agent Fees
The Manager has entered into agreements, which include servicing agreements, with financial intermediaries that provide recordkeeping, processing, shareholder communications and other services to customers of the intermediaries that hold positions in the R5 and Y Classes of the Funds and has agreed to compensate the intermediaries for providing these services. Intermediaries transact with the Funds primarily through the use of omnibus accounts on behalf of their customers who hold positions in the Funds. Certain services would have been provided by the Funds’ transfer agent and other service providers if the shareholders’ accounts were maintained directly by the Funds’ transfer agent. Accordingly, the Funds, pursuant to Board approval, have agreed to reimburse the Manager for certain non-distribution shareholder services provided by financial intermediaries for the R5 and Y Classes. The reimbursement amounts (sub-transfer agent fees) paid to the Manager are subject to a fee limit of up to 0.10% of an intermediary’s average net assets in the R5 and Y Classes on an annual basis. During the year ended August 31, 2020, the sub-transfer agent fees, as reflected in “Transfer agent fees” on the Statements of Operations, were as follows:
Fund | Sub-Transfer Agent Fees | |||
The London Company Income Equity | $ | 658,697 | ||
Zebra Small Cap Equity | 41,507 | |||
As of August 31, 2020, the Funds owed the Manager the following reimbursement of sub-transfer agent fees, as reflected in “Transfer agent fees payable” on the Statements of Assets and Liabilities:
Fund | Reimbursement Sub-Transfer Agent Fees | |||
The London Company Income Equity | $ | 61,272 | ||
Zebra Small Cap Equity | 3,357 | |||
Investments in Affiliated Funds
The Funds may invest in the American Beacon U.S. Government Money Market Select Fund (the “USG Select Fund”). Cash collateral received by the Funds in connection with securities lending may also be invested in the USG Select Fund. The Funds listed below held the following shares with an August 31, 2020 fair value and dividend income earned from the investment in the USG Select Fund.
Affiliated Security | Type of Transaction | Fund | August 31, 2020 Shares/ Principal | Change in Unrealized Gain (Loss) | Realized Gain (Loss) | Dividend Income | August 31, 2020 Fair Value | |||||||||||||||||
U.S. Government Money Market Select Fund | Direct | The London Company Income Equity | $ | 75,939,009 | $ | - | $ | - | $ | 470,382 | $ | 75,939,009 | ||||||||||||
U.S. Government Money Market Select Fund | Direct | Zebra Small Cap Equity | 1,323,905 | - | - | 14,634 | 1,323,905 | |||||||||||||||||
U.S. Government Money Market Select Fund | Securities Lending | Zebra Small Cap Equity | 241,564 | - | - | - | 241,564 | |||||||||||||||||
The Funds and the USG Select Fund have the same investment advisor and therefore, are considered to be affiliated. The Manager serves as investment advisor to the USG Select Fund and receives management fees and administrative fees totaling 0.10% of the average daily net assets of the USG Select Fund. During the year ended
31
American Beacon FundsSM
Notes to Financial Statements
August 31, 2020
August 31, 2020, the Manager earned fees on the Funds’ direct investments and securities lending collateral investments in the USG Select Fund as shown below:
Fund | Direct Investments in USG Select Fund | Securities Lending Collateral Investments in USG Select Fund | Total | |||||||||
The London Company Income Equity | $ | 58,107 | $ | 749 | $ | 58,856 | ||||||
Zebra Small Cap Equity | 1,274 | 402 | 1,676 | |||||||||
Interfund Credit Facility
Pursuant to an exemptive order issued by the SEC, the Funds, along with other registered investment companies having management contracts with the Manager, may participate in a credit facility whereby each fund, under certain conditions, is permitted to lend money directly to and borrow directly from other participating funds for temporary purposes. The interfund credit facility is advantageous to the funds because it provides added liquidity and eliminates the need to maintain higher cash balances to meet redemptions. This situation could arise when shareholder redemptions exceed anticipated volumes and certain funds have insufficient cash on hand to satisfy such redemptions or when sales of securities do not settle as expected, resulting in a cash shortfall for a fund. When a fund liquidates portfolio securities to meet redemption requests, they often do not receive payment in settlement for up to two days (or longer for certain foreign transactions). Redemption requests normally are satisfied on the next business day. The credit facility provides a source of immediate, short-term liquidity pending settlement of the sale of portfolio securities. The credit facility is administered by a credit facility team consisting of professionals from the Manager’s asset management, compliance, and accounting areas who report the activities of the credit facility to the Board. During the year ended August 31, 2020, the Zebra Small Cap Equity Fund borrowed on average $1,230,603 for 9 days at an average interest rate of 1.74% with interest charges of $369. The interest charges are recorded as “Other expenses” in the Statements of Operations. During the year ended August 31, 2020, The London Company Income Equity Fund did not utilize the credit facility.
Expense Reimbursement Plan
The Manager contractually agreed to reduce fees and/or reimburse expenses for the classes of the Funds to the extent that total operating expenses exceed the Funds’ expense cap. During the year ended August 31, 2020, the Manager waived and/or reimbursed expenses as follows:
| Expense Cap | Expiration of Reimbursed Expenses | |||||||||||||||||
Fund | Class | 9/1/2019 - 8/31/2020 | Reimbursed Expenses | (Recouped) Expenses | ||||||||||||||
The London Company Income Equity | R6 | 0.71 | % | $ | 2 | $ | – | 2022-2023 | ||||||||||
Zebra Small Cap Equity | R5* | 0.89 | % | 61,285 | – | 2022-2023 | ||||||||||||
Zebra Small Cap Equity | Y | 0.99 | % | 105,570 | – | 2022-2023 | ||||||||||||
Zebra Small Cap Equity | Investor | 1.27 | % | 40,825 | – | 2022-2023 | ||||||||||||
Zebra Small Cap Equity | A | 1.29 | % | 3,463 | – | 2022-2023 | ||||||||||||
Zebra Small Cap Equity | C | 2.04 | % | 5,124 | – | 2022-2023 | ||||||||||||
* Formerly Institutional Class
Of these amounts, $2 and $17,411 were disclosed as a receivable from the Manager on the Statements of Assets and Liabilities at August 31, 2020 for The London Company Income Equity Fund and the Zebra Small Cap Equity Fund, respectively.
The Funds have adopted an Expense Reimbursement Plan whereby the Manager may seek repayment of such fee or voluntary reductions and expense reimbursements. Under the policy, the Manager can be reimbursed by the Funds for any contractual or voluntary fee reductions or expense reimbursements if reimbursement to the Manager (a) occurs within three years from the date of the Manager’s waiver/reimbursement and (b) does not cause the Funds’ annual operating expenses to exceed the lesser of the contractual percentage limit in effect at
32
American Beacon FundsSM
Notes to Financial Statements
August 31, 2020
the time of the waiver/reimbursement or time of recoupment. The reimbursed expenses listed above will expire in 2022 and 2023. The Funds did not record a liability for potential reimbursements due to the current assessment that reimbursements are uncertain. The carryover of excess expenses potentially reimbursable to the Manager, but not recorded as a liability are as follows:
Fund | Recouped Expenses | Excess Expense Carryover | Expired Expense Carryover | Expiration of Reimbursed Expenses | ||||||||||||
Zebra Small Cap Equity | $ | – | $ | – | $ | 144,028 | 2019-2020 | |||||||||
Zebra Small Cap Equity | – | 166,144 | – | 2020-2021 | ||||||||||||
Zebra Small Cap Equity | – | 190,897 | – | 2021-2022 | ||||||||||||
Sales Commissions
The Funds’ Distributor, Resolute Investment Distributors, Inc. (“RID” or “Distributor”), may receive a portion of Class A sales charges from broker dealers which may be used to offset distribution related expenses. During the year ended August 31, 2020, RID collected $6,617 for The London Company Income Equity Fund from the sale of Class A Shares. There were no Class A sales charges collected by RID for the Zebra Small Cap Equity Fund.
A CDSC of 0.50% will be deducted with respect to Class A Shares on certain purchases of $1,000,000 or more that are redeemed in whole or part within 18 months of purchase, unless waived as discussed in the Funds’ Prospectus. Any applicable CDSC will be 0.50% of the lesser of the original purchase price or the value of the redemption of the Class A Shares redeemed. During the year ended August 31, 2020, CDSC fees of $3 were collected for the Class A Shares of The London Company Income Equity Fund. There were no CDSC fees collected for the Class A Shares of the Zebra Small Cap Equity Fund.
A CDSC of 1.00% will be deducted with respect to Class C Shares redeemed within 12 months of purchase, unless waived as discussed in the Funds’ Prospectus. Any applicable CDSC will be 1.00% of the lesser of the original purchase price or the value of the redemption of the Class C Shares redeemed. During the year ended August 31, 2020, CDSC fees of $7,362 and $990 were collected for the Class C Shares of The London Company Income Equity Fund and Zebra Small Cap Equity Fund, respectively.
Trustee Fees and Expenses
Effective January 1, 2020, as compensation for their service to the American Beacon Funds Complex, including the Trust (collectively, the “Trusts”), each Trustee is compensated from the Trusts as follows: (1) an annual retainer of $120,000; (2) meeting attendance fee (for attendance in person or via teleconference) of (a) $12,000 for in person attendance, or $5,000 for telephonic attendance, by Board members for each regularly scheduled or special Board meeting, (b) $2,500 for attendance by Committee members at meetings of the Audit Committee and the Investment Committee, (c) $1,500 for attendance by Committee members at meetings of the Nominating and Governance Committee; and (d) $2,500 for attendance by Board members for each special telephonic Board meeting; and (3) reimbursement of reasonable expenses incurred in attending Board meetings, Committee meetings, and relevant educational seminars. The Trustees also may be compensated for attendance at special Board and/or Committee meetings from time to time. For her service as Board Chair, Ms. Cline receives an additional annual retainer of $50,000. Although she attends several committee meetings at each quarterly Board meeting, she receives only a single $2,500 fee each quarter for her attendance at those meetings. The chairpersons of the Audit Committee and the Investment Committee each receive an additional annual retainer of $25,000 and the Chair of the Nominating and Governance Committee receives an additional annual retainer of $15,000.
3. Security Valuation and Fair Value Measurements
The price of the Fund’s shares is based on its net asset value (“NAV”) per share. The Fund’s NAV is computed by adding total assets, subtracting all the Fund’s liabilities, and dividing the result by the total number of shares outstanding.
33
American Beacon FundsSM
Notes to Financial Statements
August 31, 2020
The NAV of each class of the Fund’s shares is determined based on a pro rata allocation of the Fund’s investment income, expenses and total capital gains and losses. The Fund’s NAV per share is determined each business day as of the regular close of trading on the New York Stock Exchange (“NYSE” or “Exchange”), which is typically 4:00 p.m. Eastern Time (“ET”). However, if trading on the NYSE closes at a time other than 4:00 p.m. ET, the Fund’s NAV per share typically would still be determined as of the regular close of trading on the NYSE. The Fund does not price its shares on days that the NYSE is closed. Foreign exchanges may permit trading in foreign securities on days when the Fund is not open for business, which may result in the value of the Fund’s portfolio investments being affected at a time when you are unable to buy or sell shares.
Equity securities, including shares of closed-end funds and exchange-traded funds (“ETFs”), are valued at the last sale price or official closing price taken from the primary exchange in which each security trades. Investments in other mutual funds are valued at the closing NAV per share on the day of valuation. Debt securities are valued at bid quotes from broker/dealers or evaluated bid prices from pricing services, who may consider a number of inputs and factors, such as prices of comparable securities, yield curves, spreads, credit ratings, coupon rates, maturity, default rates, and underlying collateral. Futures are valued based on their daily settlement prices. Exchange-traded and over-the-counter (“OTC”) options are valued at the last sale price. Options with no last sale for the day are priced at mid quote. Swaps are valued at evaluated mid prices from pricing services.
The valuation of securities traded on foreign markets and certain fixed-income securities will generally be based on prices determined as of the earlier closing time of the markets on which they primarily trade unless a significant event has occurred. When the Fund holds securities or other assets that are denominated in a foreign currency, the Fund will normally use the currency exchange rates as of 4:00 p.m. ET.
Securities may be valued at fair value, as determined in good faith and pursuant to procedures approved by the Board, under certain limited circumstances. For example, fair value pricing will be used when market quotations are not readily available or reliable, as determined by the Manager, such as when (i) trading for a security is restricted or stopped; (ii) a security’s trading market is closed (other than customary closings); or (iii) a security has been de-listed from a national exchange. A security with limited market liquidity may require fair value pricing if the Manager determines that the available price does not reflect the security’s true market value. In addition, if a significant event that the Manager determines to affect the value of one or more securities held by the Fund occurs after the close of a related exchange but before the determination of the Fund’s NAV, fair value pricing may be used on the affected security or securities. Securities of small-capitalization companies are also more likely to require a fair value determination using these procedures because they are more thinly traded and less liquid than the securities of larger-capitalization companies. The Fund may fair value securities as a result of significant events occurring after the close of the foreign markets in which the Fund invests as described below. In addition, the Fund may invest in illiquid securities requiring these procedures.
The Fund may use fair value pricing for securities primarily traded in non-U.S. markets because most foreign markets close well before the Fund’s pricing time of 4:00 p.m. ET. The earlier close of these foreign markets gives rise to the possibility that significant events, including broad market moves, may have occurred in the interim and may materially affect the value of those securities. If the Manager determines that the last quoted prices of non-U.S. securities will, in its judgment, materially affect the value of some or all its portfolio securities, the Manager can adjust the previous closing prices to reflect what it believes to be the fair value of the securities as of the close of the Exchange. In deciding whether it is necessary to adjust closing prices to reflect fair value, the Manager reviews a variety of factors, including developments in foreign markets, the performance of U.S. securities markets, and the performance of instruments trading in U.S. markets that represent foreign securities and baskets of foreign securities. These securities are fair valued using a pricing service, using methods approved by the Board, that considers the correlation of the trading patterns of the foreign security to intraday trading in the U.S. markets, based on indices of domestic securities and other appropriate indicators such as prices of relevant American Depositary Receipts (“ADRs”) and futures contracts. The Valuation Committee, established by the Board, may also fair value securities in other situations, such as when a particular foreign market is closed but the Fund is open. The Fund uses outside pricing services to provide closing prices and information to evaluate
34
American Beacon FundsSM
Notes to Financial Statements
August 31, 2020
and/or adjust those prices. As a means of evaluating its security valuation process, the Valuation Committee routinely compares closing prices, the next day’s opening prices in the same markets and adjusted prices.
Attempts to determine the fair value of securities introduce an element of subjectivity to the pricing of securities. As a result, the price of a security determined through fair valuation techniques may differ from the price quoted or published by other sources and may not accurately reflect the market value of the security when trading resumes. If a reliable market quotation becomes available for a security formerly valued through fair valuation techniques, the Manager compares the new market quotation to the fair value price to evaluate the effectiveness of the Fund’s fair valuation procedures. If any significant discrepancies are found, the Manager may adjust the Fund’s fair valuation procedures.
Valuation Inputs
Various inputs may be used to determine the fair value of the Funds’ investments. These inputs are summarized in three broad levels for financial statement purposes. The inputs or methodologies used to value securities are not necessarily an indication of the risk associated with investing in those securities.
| Level 1 | - | Quoted prices in active markets for identical securities. | ||
| Level 2 | - | Prices determined using other significant observable inputs. These may include quoted prices for similar securities, interest rates, prepayment speeds, credit risk, and others. | ||
| Level 3 | - | Prices determined using other significant unobservable inputs. Unobservable inputs reflect the Fund’s own assumptions about the factors market participants would use in pricing an investment. | ||
Level 1 and Level 2 trading assets and trading liabilities, at fair value
Common stocks, ETFs and financial derivative instruments, such as futures contracts that are traded on a national securities exchange, are stated at the last reported sale or settlement price on the day of valuation. To the extent these securities are actively traded and valuation adjustments are not applied, they are categorized as Level 1 of the fair value hierarchy. Preferred securities and other equities traded on inactive markets or valued by reference to similar instruments are generally categorized as Level 2 of the fair value hierarchy.
Investments in registered open-end investment management companies will be valued based upon the NAVs of such investments and are categorized as Level 1 of the fair value hierarchy.
4. Securities and Other Investments
American Depositary Receipts
ADRs are depositary receipts for foreign issuers in registered form traded in U.S. securities markets. Depositary receipts may not be denominated in the same currency as the securities into which they may be converted. Investing in depositary receipts entails substantially the same risks as direct investment in foreign securities. There is generally less publicly available information about foreign companies and there may be less governmental regulation and supervision of foreign stock exchanges, brokers, and listed companies. In addition, such companies may use different accounting and financial standards (and certain currencies may become unavailable for transfer from a foreign currency), resulting in the Funds’ possible inability to convert immediately into U.S. currency proceeds realized upon the sale of portfolio securities of the affected foreign companies. In addition, the Funds may invest in unsponsored depositary receipts, the issuers of which are not obligated to disclose material information about the underlying securities to investors in the United States. Ownership of unsponsored depositary receipts may not entitle the Funds to the same benefits and rights as ownership of a sponsored depositary receipt or the underlying security.
35
American Beacon FundsSM
Notes to Financial Statements
August 31, 2020
Common Stock
Common stock generally takes the form of shares in a corporation which represent an ownership interest. It ranks below preferred stock and debt securities in claims for dividends and for assets of the company in a liquidation or bankruptcy. The value of a company’s common stock may fall as a result of factors directly relating to that company, such as decisions made by its management or decreased demand for the company’s products or services. A stock’s value may also decline because of factors affecting not just the company, but also companies in the same industry or sector. The price of a company’s stock may also be affected by changes in financial markets that are relatively unrelated to the company, such as changes in interest rates, currency exchange rates or industry regulation. Companies that elect to pay dividends on their common stock generally only do so after they invest in their own business and make required payments to bondholders and on other debt and preferred stock. Therefore, the value of a company’s common stock will usually be more volatile than its bonds, other debt and preferred stock. Common stock may be exchange-traded or OTC. OTC stock may be less liquid than exchange-traded stock.
Other Investment Company Securities and Other Exchange-Traded Products
The Funds may invest in shares of other investment companies, including open-end funds, closed-end funds, business development companies (“BDCs”), ETFs, unit investment trusts, and other investment companies of the Trust. The Funds may invest in securities of an investment company advised by the Manager or a sub-advisor. Investments in the securities of other investment companies may involve duplication of advisory fees and certain other expenses. By investing in another investment company, the Funds become a shareholder of that investment company. As a result, the Funds’ shareholders indirectly will bear the Funds’ proportionate share of the fees and expenses paid by shareholders of the other investment company, in addition to the fees and expenses the Funds’ shareholders directly bear in connection with the Funds’ own operations. These other fees and expenses are reflected as Acquired Fund Fees and Expenses and are included in the Fees and Expenses Table for the Funds in their Prospectus, if applicable. Investments in other investment companies may involve the payment of substantial premiums above the value of such issuer’s portfolio securities.
Real Estate Investment Trusts
The Funds may own shares of real estate investment trusts (“REITs”) which report information on the source of their distributions annually. The Funds re-characterize distributions received from REIT investments based on information provided by the REITs into the following categories: ordinary income, long-term capital gains, and return of capital. If information is not available on a timely basis from the REITs, the re-characterization will be estimated based on available information, which may include the previous year allocation. If new or additional information becomes available from the REITs at a later date, a re-characterization will be made the following year.
5. Financial Derivative Instruments
The Funds may utilize derivative instruments to gain market exposure on cash balances or reduce market exposure in anticipation of liquidity needs. When considering the Funds’ use of derivatives, it is important to note that the Funds do not use derivatives for the purpose of creating financial leverage.
Futures Contracts
Futures contracts are contracts to buy or sell a standard quantity of securities at a specified price on a future date. The Funds may enter into financial futures contracts as a method for keeping assets readily convertible to cash if needed to meet shareholder redemptions or for other needs while maintaining exposure to the stock or bond market, as applicable. The primary risks associated with the use of futures contracts are the possibility of illiquid markets or imperfect correlation between the values of the contracts and the underlying securities or that the counterparty will fail to perform its obligations.
36
American Beacon FundsSM
Notes to Financial Statements
August 31, 2020
Upon entering into a futures contract, the Funds are required to set aside or deposit with a broker an amount, termed the initial margin, which typically represents a portion of the face value of the futures contract. The Funds usually reflects this amount on the Schedules of Investments as a U.S. Treasury Bill held as collateral for futures contracts or as cash deposited with broker on the Statements of Assets and Liabilities. Payments to and from the broker, known as variation margin, are required to be made on a daily basis as the price of the futures contract fluctuates. Changes in initial settlement values are accounted for as unrealized appreciation (depreciation) until the contracts are terminated, at which time realized gains and losses are recognized. Futures contracts are valued at the most recent settlement price established each day by the exchange on which they are traded.
During the year ended August 31, 2020, the Funds entered into futures contracts primarily for exposing cash to markets.
The Funds’ average futures contracts outstanding fluctuate throughout the operating year as required to meet strategic requirements. The following table illustrates the average quarterly volume of futures contracts. For the purpose of this disclosure, volume is measured by contracts outstanding at each quarter end.
Average Futures Contracts Outstanding | ||||
Fund | Year Ended August 31, 2020 | |||
The London Company Income Equity | 389 | |||
Zebra Small Cap Equity | 19 | |||
The following is a summary of the fair valuations of the Funds’ derivative instruments categorized by risk exposure(1):
The London Company Income Equity Fund
| Fair values of financial instruments on the Statements of Assets and Liabilities as of August 31, 2020: |
| ||||||||||||||||||||||||||||||||||||||||||||||||||||||
| Derivatives not accounted for as hedging instruments |
|
| |||||||||||||||||||||||||||||||||||||||||||||||||||||
Assets: | Credit contracts | Foreign exchange contracts | Commodity contracts | Interest rate contracts | Equity contracts | Total | |||||||||||||||||||||||||||||||||||||||||||||||||
| Receivable for variation margin from open futures contracts(2) | $ | – | $ | – | $ | – | $ | – | $ | 5,392,670 | $ | 5,392,670 | |||||||||||||||||||||||||||||||||||||||||||
| The effect of financial derivative instruments on the Statements of Operations as of August 31, 2020: |
| ||||||||||||||||||||||||||||||||||||||||||||||||||||||
| Derivatives not accounted for as hedging instruments |
|
| |||||||||||||||||||||||||||||||||||||||||||||||||||||
Realized gain (loss) from derivatives | Credit contracts | Foreign exchange contracts | Commodity contracts | Interest rate contracts | Equity contracts | Total | |||||||||||||||||||||||||||||||||||||||||||||||||
| Futures contracts | $ | – | $ | – | $ | – | $ | – | $ | 13,553,927 | $ | 13,553,927 | |||||||||||||||||||||||||||||||||||||||||||
Net change in unrealized appreciation | Credit contracts | Foreign exchange contracts | Commodity contracts | Interest rate contracts | Equity contracts | Total | |||||||||||||||||||||||||||||||||||||||||||||||||
| Futures contracts | $ | – | $ | – | $ | – | $ | – | $ | 4,973,368 | $ | 4,973,368 | |||||||||||||||||||||||||||||||||||||||||||
37
American Beacon FundsSM
Notes to Financial Statements
August 31, 2020
Zebra Small Cap Equity Fund
| Fair values of financial instruments on the Statements of Assets and Liabilities as of August 31, 2020: |
| ||||||||||||||||||||||||||||||||||||||||||||||||||||||
| Derivatives not accounted for as hedging instruments |
|
| |||||||||||||||||||||||||||||||||||||||||||||||||||||
Assets: | Credit contracts | Foreign exchange contracts | Commodity contracts | Interest rate contracts | Equity contracts | Total | |||||||||||||||||||||||||||||||||||||||||||||||||
| Receivable for variation margin from open futures contracts(2) | $ | – | $ | – | $ | – | $ | – | $ | 3,303 | $ | 3,303 | |||||||||||||||||||||||||||||||||||||||||||
| The effect of financial derivative instruments on the Statements of Operations as of August 31, 2020: |
| ||||||||||||||||||||||||||||||||||||||||||||||||||||||
| Derivatives not accounted for as hedging instruments |
|
| |||||||||||||||||||||||||||||||||||||||||||||||||||||
Realized gain (loss) from derivatives | Credit contracts | Foreign exchange contracts | Commodity contracts | Interest rate contracts | Equity contracts | Total | |||||||||||||||||||||||||||||||||||||||||||||||||
| Futures contracts | $ | – | $ | – | $ | – | $ | – | $ | (221,161 | ) | $ | (221,161 | ) | |||||||||||||||||||||||||||||||||||||||||
Net change in unrealized appreciation | Credit contracts | Foreign exchange contracts | Commodity contracts | Interest rate contracts | Equity contracts | Total | |||||||||||||||||||||||||||||||||||||||||||||||||
| Futures contracts | $ | – | $ | – | $ | – | $ | – | $ | 20,842 | $ | 20,842 | |||||||||||||||||||||||||||||||||||||||||||
(1) See Note 3 in the Notes to Financial Statements for additional information.
(2) Includes cumulative appreciation (depreciation) of futures contracts as reported in the Fund’s Schedule of Investments footnotes. Only current day’s variation margin is reported within the Statements of Assets and Liabilities.
Offsetting Assets and Liabilities
The Funds are parties to enforceable master netting agreements between brokers and counterparties which provide for the right to offset under certain circumstances. The Funds employ multiple money managers and counterparties and have elected not to offset qualifying financial and derivative instruments on the Statements of Assets and Liabilities, as such all financial and derivative instruments are presented on a gross basis. The impacts of netting arrangements that provide the right to offset are detailed below, if applicable. The net amount represents the net receivable or payable that would be due from or to the counterparty in the event of default. Exposure from borrowings and other financing agreements such as repurchase agreements can only be netted across transactions governed by the same Master Agreement with the same legal entity. All amounts reported below represent the balance as of the report date, August 31, 2020.
The London Company Income Equity Fund
| Offsetting of Financial and Derivative Assets as of August 31, 2020: |
| |||||||||||
| Assets | Liabilities | |||||||||||
| Futures Contracts(1) | $ | 5,392,670 | $ | - | ||||||||
|
|
|
| |||||||||
| Total derivative assets and liabilities in the Statement of Assets and Liabilities | $ | 5,392,670 | $ | - | ||||||||
|
|
|
| |||||||||
| Derivatives not subject to a Master Netting Agreement or similar agreement (“MNA”) | $ | (5,392,670 | ) | $ | - | |||||||
|
|
|
| |||||||||
Zebra Small Cap Equity Fund
| Offsetting of Financial and Derivative Assets as of August 31, 2020: |
| |||||||||||
| Assets | Liabilities | |||||||||||
| Futures Contracts(1) | $ | 3,303 | $ | - | ||||||||
|
|
|
| |||||||||
| Total derivative assets and liabilities in the Statement of Assets and Liabilities | $ | 3,303 | $ | - | ||||||||
|
|
|
| |||||||||
| Derivatives not subject to a Master Netting Agreement or similar agreement (“MNA”) | $ | (3,303 | ) | $ | - | |||||||
|
|
|
| |||||||||
38
American Beacon FundsSM
Notes to Financial Statements
August 31, 2020
| Remaining Contractual Maturity of the Agreements As of August 31, 2020 | ||||||||||||||||||||||||||||||||||||
| Overnight and Continuous | <30 days | Between 30 & 90 days | >90 days | Total | ||||||||||||||||||||||||||||||||
Securities Lending Transactions |
| |||||||||||||||||||||||||||||||||||
Common Stocks | $ | 241,564 | $ | - | $ | - | $ | - | $ | 241,564 | ||||||||||||||||||||||||||
|
|
|
|
|
|
|
|
|
| |||||||||||||||||||||||||||
Total Borrowings | $ | 241,564 | $ | - | $ | - | $ | - | $ | 241,564 | ||||||||||||||||||||||||||
|
|
|
|
|
|
|
|
|
| |||||||||||||||||||||||||||
Gross amount of recognized liabilities for securities lending transactions |
| $ | 241,564 | |||||||||||||||||||||||||||||||||
|
| |||||||||||||||||||||||||||||||||||
(1) Includes cumulative appreciation or (depreciation) of futures contracts as reported in the Schedule of Investments footnotes. Only current day’s variation margin is reported within the Statements of Assets and Liabilities.
6. Principal Risks
Investing in the Funds may involve certain risks including, but not limited to, those described below.
Credit Risk
The Funds are subject to the risk that the issuer or guarantor of a debt security, or the counterparty to a derivatives contract or a loan, may fail, or become less able, to make timely payment of interest or principal or otherwise honor its obligations or default completely. Changes in the actual or perceived creditworthiness of an issuer, or a downgrade or default affecting any of the Funds’ securities, could affect the Funds’ performance.
Derivatives Risk
Derivatives are financial instruments that have a value which depends upon, or is derived from, a reference asset, such as one or more underlying securities, pools of securities, options, futures, indexes or currencies. A Fund may use derivatives to enhance total return of its portfolio, to hedge against fluctuations in interest rates or currency exchange rates, to change the effective duration of its portfolio, to manage certain investment risks or as a substitute for the purchase or sale of the underlying currencies or securities. A Fund may also hold derivative instruments to obtain economic exposure to an issuer without directly holding its securities.
Derivatives can be highly complex and their use within a management strategy can require specialized skills. There can be no assurance that any strategy used will succeed. If a sub-advisor incorrectly forecasts stock market values, or the direction of interest rates or currency exchange rates in utilizing a specific derivatives strategy for a Fund, a Fund could lose money. In addition, leverage embedded in a derivative instrument can expose a Fund to greater risk and increase its costs. Gains or losses in the value of a derivative instrument may be magnified and be much greater than the derivative’s original cost (generally the initial margin deposit).
Dividend Risk
A Fund’s focus on dividend-paying stocks could cause a Fund to underperform funds that invest without consideration of a company’s track record of paying dividends. An issuer of stock held by a Fund may choose not to declare a dividend or the dividend rate might not remain at current levels. Dividend paying stocks might not experience the same level of earnings growth or capital appreciation as non-dividend paying stocks. In addition, stocks of companies with a history of paying dividends may not participate in a broad market advance to the same degree as most other stocks, and a sharp rise in interest rates or an economic downturn could cause a company to unexpectedly reduce or eliminate its dividend. Securities that pay dividends may be sensitive to changes in interest rates, and as interest rates rise, the prices of such securities may fall. At times, a Fund may not be able to identify dividend-paying stocks that are attractive investments. The income received by a Fund will also fluctuate due to the amount of dividends that companies elect to pay.
39
American Beacon FundsSM
Notes to Financial Statements
August 31, 2020
Foreign Investing Risk
Non-U.S. investments carry potential risks not associated with U.S. investments. Such risks include, but are not limited to: (1) currency exchange rate fluctuations, (2) political and financial instability, (3) less liquidity, (4) lack of uniform accounting, auditing and financial reporting standards, (5) increased price volatility, (6) less government regulation and supervision of foreign stock exchanges, brokers and listed companies, and (7) delays in transaction settlement in some foreign markets.
Futures Contracts Risk
Futures contracts are derivative instruments where one party pays a fixed price for an agreed amount of securities or other underlying assets at an agreed date. The use of such derivative instruments may expose the Funds to additional risks that they would not be subject to if they invested directly in the securities underlying those derivatives. There may at times be an imperfect correlation between the movement in the prices of futures contracts and the value of their underlying instruments or indexes. There can be no assurance that any strategy used will succeed. There also can be no assurance that, at all times, a liquid market will exist for offsetting a futures contract that a Fund has previously bought or sold and this may result in the inability to close a futures contract when desired. Futures contracts may experience potentially dramatic price changes, which will increase the volatility of a Fund and may involve a small investment of cash (the amount of initial and variation margin) relative to the magnitude of the risk assumed (the potential increase or decrease in the price of the futures contract).
Liquidity Risk
The Funds are susceptible to the risk that certain investments held by a Fund may have limited marketability or be subject to restrictions on sale, and may be difficult or impossible to purchase or sell at favorable times or prices. An inability to sell a portfolio position can adversely affect a Fund’s value or prevent the Fund from being able to take advantage of other investment opportunities. The Funds could lose money if it is unable to dispose of an investment at a time that is most beneficial to the Fund. The Funds may be required to dispose of investments at unfavorable times or prices to satisfy obligations, which may result in losses or may be costly to the Fund. For example, a Fund may be forced to sell certain investments at unfavorable prices to meet redemption requests or other cash needs. Judgment plays a greater role in pricing illiquid investments than in investments with more active markets.
Market Risk
The Fund is subject to the risk that the securities markets will move down, sometimes rapidly and unpredictably, based on overall economic conditions and other factors, which may negatively affect the Fund’s performance. Equity securities generally have greater price volatility than fixed income securities, although under certain market conditions fixed income securities may have comparable or greater price volatility. During a general downturn in the securities markets, multiple assets may decline in value simultaneously. Prices in many financial markets have increased significantly over the last decade, but there have also been periods of adverse market and financial developments and cyclical change during that timeframe, which have resulted in unusually high levels of volatility in domestic and foreign financial markets that has caused losses for investors and may occur again in the future. The value of a security may decline due to adverse issuer-specific conditions, general market conditions unrelated to a particular issuer, or factors that affect a particular industry or industries. Changes in the financial condition of a single issuer or market segment also can impact the market as a whole. Geopolitical and other events, including war, terrorism, economic uncertainty, trade disputes, pandemics, public health crises, natural disasters and related events have led, and in the future may continue to lead, to instability in world economies and markets generally and reduced liquidity in equity, credit and fixed-income markets, which may disrupt economies and markets and adversely affect the value of your investment. Changes in value may be temporary or may last for extended periods. Policy changes by the U.S. government and/or Federal Reserve and political events within the U.S. and abroad, including the U.S. presidential election, may affect investor and consumer confidence and may adversely impact financial markets and the broader economy, perhaps suddenly and to a significant degree.
40
American Beacon FundsSM
Notes to Financial Statements
August 31, 2020
Markets and market participants are increasingly reliant upon both publicly available and proprietary information data systems. Data imprecision, software or other technology malfunctions, programming inaccuracies, unauthorized use or access, and similar circumstances may impair the performance of these systems and may have an adverse impact upon a single issuer, a group of issuers, or the market at large. The financial markets generally move in cycles, with periods of rising prices followed by periods of declining prices. The value of your investment may reflect these fluctuations.
Other Investment Companies Risk
The Funds may invest in shares of other registered investment companies, including money market funds and ETFs. To the extent that the Funds invest in shares of other registered investment companies, the Funds will indirectly bear the fees and expenses, including for example, advisory and administrative fees, charged by those investment companies in addition to the Funds’ direct fees and expenses and will be subject to the risks associated with investments in those companies. For example, the Funds’ investments in money market funds are subject to interest rate risk, credit risk, and market risk. The Funds must rely on the investment company in which it invests to achieve its investment objective. If the investment company fails to achieve its investment objective, the value of the Funds’ investment may decline, adversely affecting the Funds’ performance. ETFs are subject to the following risks that do not apply to conventional funds: (1) the market price of an ETF’s shares may trade at a discount or premium to its NAV; (2) an active trading market for an ETF’s shares may not develop or be maintained; or (3) trading of an ETF’s shares may be halted if the listing exchange’s officials deem such action appropriate, the shares are delisted from the exchange, or the activation of market-wide “circuit breakers” (which are tied to large decreases in stock prices) halts stock trading generally. An ETF that tracks an index may not precisely replicate the returns of its benchmark index. To the extent the Funds invest in other investment companies that invest in equity securities, fixed-income securities and/or foreign securities, or that track an index, the Funds are subject to the risks associated with the underlying investments held by the investment company or the index fluctuations to which the investment company is subject. ETFs have expenses associated with their operation, typically including advisory fees.
Recent Market Events Risk
An outbreak of infectious respiratory illness caused by a novel coronavirus, known as COVID-19, was first detected in China in December 2019 and has subsequently spread globally. The transmission of COVID-19 and efforts to contain its spread have resulted, and may continue to result, in significant disruptions to business operations, widespread business closures and layoffs, travel restrictions and closed borders, prolonged quarantines and stay-at-home orders, disruption of and delays in healthcare service preparation and delivery, service and event changes, and lower consumer demand, as well as general concern and uncertainty that has negatively affected the global economy. The impact of the COVID-19 pandemic may last for an extended period of time and may result in a sustained economic downturn or recession. The U.S. Federal Reserve and the U.S. federal government have taken numerous measures to address the economic impact of the COVID-19 pandemic and stimulate the U.S. economy. The ultimate effects of these and other efforts that may be taken may not be known for some time. The Federal Reserve has spent hundreds of billions of dollars to keep credit flowing through short-term money markets and has signaled that it plans to maintain its interventions at an elevated level. Amid these ongoing efforts, concerns about the markets’ dependence on the Federal Reserve’s provision of liquidity have grown. The U.S. government has reduced the federal corporate income tax rate, and future legislative, regulatory and policy changes may result in more restrictions on international trade, less stringent prudential regulation of certain players in the financial markets, and significant new investments in infrastructure and national defense. High public debt in the U.S. and other countries creates ongoing systemic and market risks and policymaking uncertainty. A rise in protectionist trade policies, slowing global economic growth, risks associated with the United Kingdom’s departure from the European Union on January 31, 2020, commonly referred to as “Brexit,” and trade agreement negotiations during the transition period, the risks associated with ongoing trade negotiations with China, the possibility of changes to some international trade agreements, tensions or open conflict between nations, or political or economic dysfunction within some nations that are major producers of oil could affect the economies of many nations,
41
American Beacon FundsSM
Notes to Financial Statements
August 31, 2020
including the United States, in ways that cannot necessarily be foreseen at the present time. Economists and others have expressed increasing concern about the potential effects of global climate change on property and security values. Certain issuers, industries and regions may be adversely affected by the impacts of climate change, including on the demand for and the development of goods and services and related production costs, and the impacts of legislation, regulation and international accords related to climate change, as well as any indirect consequences of regulation or business trends driven by climate change.
Securities Lending Risk
A Fund may lend its portfolio securities to brokers, dealers and financial institutions to seek income. There is a risk that a borrower may default on its obligations to return loaned securities; however, a Fund’s securities lending agent indemnifies the Fund against that risk. There is a risk that the assets of a Fund’s securities lending agent may be insufficient to satisfy any contractual indemnification requirements to the Fund. Borrowers of a Fund’s securities typically provide collateral in the form of cash that is reinvested in securities. A Fund will be responsible for the risks associated with the investment of cash collateral, including any collateral invested in an affiliated money market fund. A Fund may lose money on its investment of cash collateral or may fail to earn sufficient income on its investment to meet obligations to the borrower. In addition, delays may occur in the recovery of securities from borrowers, which could interfere with a Fund’s ability to vote proxies or to settle transactions and there is the risk of possible loss of rights in the collateral should the borrower fail financially. In any case in which the loaned securities are not returned to the Fund before an ex-dividend date, the payment in lieu of the dividend that the Fund receives from the securities’ borrower would not be treated as a dividend for federal income tax purposes and thus would not qualify for treatment as “qualified dividend income”.
7. Federal Income and Excise Taxes
It is the policy of each Fund to qualify as a regulated investment company (“RIC”), by complying with all applicable provisions of Subchapter M of the Internal Revenue Code, as amended, and to make distributions of taxable income sufficient to relieve it from substantially all federal income and excise taxes. For federal income tax purposes, each Fund is treated as a single entity for the purpose of determining such qualification.
The Funds do not have any unrecorded tax liabilities in the accompanying financial statements. Each of the tax years in the four year period ended August 31, 2020 remain subject to examination by the Internal Revenue Service. If applicable, the Funds recognize interest accrued related to unrecognized tax benefits in interest expense and penalties in “Other expenses” on the Statements of Operations.
The Funds may be subject to taxes imposed by countries in which it invests. Such taxes are generally based on returns of income earned or gains realized or repatriated. Taxes are accrued and applied to net investment income, net realized capital gains and net unrealized appreciation (depreciation), as applicable, as the income is earned or capital gains are recorded.
Dividends are categorized in accordance with income tax regulations which may treat certain transactions differently than U.S. GAAP. Accordingly, the character of distributions and composition of net assets for tax purposes may differ from those reflected in the accompanying financial statements.
42
American Beacon FundsSM
Notes to Financial Statements
August 31, 2020
The tax character of distributions paid were as follows:
| The London Company Income Equity Fund | Zebra Small Cap Equity Fund | |||||||||||||||||||||||||||
| Year Ended August 31, 2020 | Year Ended August 31, 2019 | Year Ended August 31, 2020 | Year Ended August 31, 2019 | |||||||||||||||||||||||||
Distributions paid from: |
| |||||||||||||||||||||||||||
Ordinary income* |
| |||||||||||||||||||||||||||
R5 Class** | $ | 5,368,368 | $ | 5,405,598 | $ | 117,316 | $ | 430,179 | ||||||||||||||||||||
Y Class | 15,315,987 | 13,620,124 | 222,655 | 1,546,753 | ||||||||||||||||||||||||
Investor Class | 540,869 | 508,198 | 55,339 | 333,333 | ||||||||||||||||||||||||
A Class | 1,241,233 | 1,169,266 | 8,941 | 134,292 | ||||||||||||||||||||||||
C Class | 1,563,441 | 1,698,853 | – | 101,109 | ||||||||||||||||||||||||
Long-term capital gains |
| |||||||||||||||||||||||||||
R5 Class** | 13,348,761 | 3,059,140 | – | 645,262 | ||||||||||||||||||||||||
Y Class | 42,773,164 | 7,891,686 | – | 2,320,101 | ||||||||||||||||||||||||
Investor Class | 1,535,630 | 349,192 | – | 514,577 | ||||||||||||||||||||||||
A Class | 3,776,135 | 766,256 | – | 211,080 | ||||||||||||||||||||||||
C Class | 8,030,269 | 1,794,478 | – | 176,474 | ||||||||||||||||||||||||
|
|
|
|
|
|
|
| |||||||||||||||||||||
Total distributions paid | $ | 93,493,857 | $ | 36,262,791 | $ | 404,251 | $ | 6,413,160 | ||||||||||||||||||||
|
|
|
|
|
|
|
| |||||||||||||||||||||
*For tax purposes, short-term capital gains are considered ordinary income distributions.
**Formerly known as Institutional Class.
As of August 31, 2020, the components of distributable earnings (deficits) on a tax basis were as follows:
Fund | Tax Cost | Unrealized Appreciation | Unrealized (Depreciation) | Net Unrealized Appreciation (Depreciation) | ||||||||||||||||||||||||
| The London Company Income Equity | $ | 960,390,391 | $ | 378,915,981 | $ | (28,570,228 | ) | $ | 350,345,753 | |||||||||||||||||||
| Zebra Small Cap Equity | 72,694,040 | 3,035,543 | �� | (6,669,215 | ) | (3,633,672 | ) | |||||||||||||||||||||
Fund | Net Unrealized Appreciation (Depreciation) | Undistributed Ordinary Income | Undistributed Long-Term Capital Gains | Accumulated Capital and Other (Losses) | Other Temporary Differences | Distributable Earnings | ||||||||||||||||||||||||||||||||||||||
| The London Company Income Equity | $ | 350,345,753 | $ | 3,846,051 | $ | 10,795,216 | $ | - | $ | - | $ | 364,987,020 | ||||||||||||||||||||||||||||||||
| Zebra Small Cap Equity | (3,633,672 | ) | 510,602 | - | (3,487,616 | ) | - | (6,610,686 | ) | |||||||||||||||||||||||||||||||||||
Financial reporting records are adjusted for permanent book/tax differences to reflect tax character. Financial records are not adjusted for temporary differences. The temporary differences between financial reporting and tax-basis reporting of unrealized appreciation (depreciation) are attributable primarily to the tax deferral of losses from wash sales and the realization for tax purposes of unrealized gains (losses) on certain derivative instruments.
Due to inherent differences in the recognition of income, expenses, and realized gains (losses) under U.S. GAAP and federal income tax regulations, permanent differences between book and tax reporting have been identified and appropriately reclassified on the Statements of Assets and Liabilities.
The Funds had no permanent differences as of August 31, 2020.
Under the Regulated Investment Company Modernization Act of 2010 (“RIC MOD”), net capital losses recognized by the Funds in taxable years beginning after December 22, 2010 are carried forward indefinitely and retain their character as short-term and/or long-term losses.
43
American Beacon FundsSM
Notes to Financial Statements
August 31, 2020
As of August 31, 2020, the Funds had the following post RIC MOD capital loss carryforwards:
Fund | Short-Term Capital Loss Carryforwards | Long-Term Capital Loss Carryforwards | ||||||||||
| The London Company Income Equity | $ | – | $ | – | ||||||||
| Zebra Small Cap Equity | 3,142,239 | 345,377 | ||||||||||
8. Investment Transactions
The aggregate cost of purchases and proceeds from sales of investments, other than short-term obligations, for the year ended August 31, 2020 were as follows:
Fund | Purchases (non-U.S. Government Securities) | Sales (non-U.S. Government Securities) | ||||||||||
| The London Company Income Equity | $ | 295,048,403 | $ | 224,278,468 | ||||||||
| Zebra Small Cap Equity | 80,595,933 | 90,716,483 | ||||||||||
A summary of the Funds’ transactions in the USG Select Fund for the year ended August 31, 2020 were as follows:
Fund | Type of Transaction | August 31, 2019 Shares/Fair Value | Purchases | Sales | August 31, 2020 Shares/Fair Value | |||||||||||||||||||||||||||||
| The London Company Income Equity | Direct | $ | 64,835,851 | $ | 487,116,505 | $ | 476,013,347 | $ | 75,939,009 | |||||||||||||||||||||||||
| Zebra Small Cap Equity | Direct | 2,647,579 | 27,996,491 | 29,320,165 | 1,323,905 | |||||||||||||||||||||||||||||
| Zebra Small Cap Equity | Securities Lending | 255,970 | 5,868,593 | 5,882,999 | 241,564 | |||||||||||||||||||||||||||||
9. Securities Lending
The Funds may lend their securities to qualified financial institutions, such as certain broker-dealers, to earn additional income. The borrowers are required to secure their loans continuously with collateral in an amount at least equal to the fair value of the securities loaned, initially in an amount at least equal to 102% of the fair value of domestic securities loaned and 105% of the fair value of international securities loaned. Collateral is monitored and marked-to-market daily. Daily mark-to-market amounts are required to be paid to the borrower or received from the borrower by the end of the following business day. This one day settlement for mark-to-market amounts may result in the collateral being temporarily less than the value of the securities on loan or temporarily more than the required minimum collateral.
To the extent that a loan is collateralized by cash, such cash collateral shall be invested by the securities lending agent (the “Agent”) in money market mutual funds and other short-term investments, provided the investments meet certain quality and diversification requirements. Securities purchased with cash collateral proceeds are listed in the Funds’ Schedule of Investments and the collateral is shown on the Statements of Assets and Liabilities as a payable.
Securities lending income is generated from the demand premium (if any) paid by the borrower to borrow a specific security and from the return on investment of cash collateral, reduced by negotiated rebate fees paid to the borrower and transaction costs. To the extent that a loan is secured by non-cash collateral, securities lending income is generated as a demand premium reduced by transaction costs. The Funds, the Agent, and the Manager retained 80%, 10%, and 10%, respectively, of the income generated from securities lending.
While securities are on loan, the Funds continue to receive certain income associated with that security and any gain or loss in the market price that may occur during the term of the loan. In the case of domestic equities, the value of any dividend is received in the form of a substitute payment approximately equal to the dividend. In the case of foreign securities, a negotiated amount is received that is less than the actual dividend, but higher than the dividend amount minus the foreign tax that the Funds would be subject to on the dividend.
44
American Beacon FundsSM
Notes to Financial Statements
August 31, 2020
Securities lending transactions pose certain risks to the Funds, including that the borrower may not provide additional collateral when required or return the securities when due, that the value of the short-term investments will be less than the amount of cash collateral required to be returned to the borrower, that non-cash collateral may be subject to legal constraints in the event of a borrower bankruptcy, and that the cash collateral investments could become illiquid and unable to be used to return collateral to the borrower. The Funds could also experience delays and costs in gaining access to the collateral. The Funds bear the risk of any deficiency in the amount of the cash collateral available for return to the borrower and any action which impairs its ability to liquidate non-cash collateral to satisfy a borrower default.
As of August 31, 2020, the value of outstanding securities on loan and the value of collateral were as follows:
Fund | Market Value of Securities on Loan | Cash Collateral Received | Non-Cash Collateral Received | Total Collateral Received | ||||||||||||||||||||||||
| The London Company Income Equity | $ | 5,502,672 | $ | – | $ | 5,653,875 | $ | 5,653,875 | ||||||||||||||||||||
| Zebra Small Cap Equity | 665,279 | 241,564 | 449,714 | 691,278 | ||||||||||||||||||||||||
Cash collateral is listed on the Funds’ Schedules of Investments and is shown on the Statements of Assets and Liabilities. Income earned on these investments is included in “Income derived from securities lending” on the Statements of Operations.
Non-cash collateral received by the Funds may not be sold or re-pledged except to satisfy a borrower default. Therefore, non-cash collateral is not included on the Funds’ Schedules of Investments or Statements of Assets and Liabilities.
10. Borrowing Arrangements
Effective November 14, 2019 (the “Effective Date”), the Funds, along with certain other funds managed by the Manager (“Participating Funds”), entered into a committed revolving line of credit (the “Committed Line”) agreement with State Street Bank and Trust Company (the “Bank”) to be used to facilitate portfolio liquidity. The maximum borrowing amount under the Committed Line is $250 million with interest at a rate equal to the higher of (a) one-month London Inter-Bank Offered Rate (“LIBOR”) plus 1.25% per annum or (b) the Federal Funds rate plus 1.25% per annum on amounts borrowed. Each of the Participating Funds paid a closing fee of $100,000 on the Effective Date and a quarterly commitment fee at a rate of 0.25% per annum on the unused portion of the Committed Line amount. Effective August 6, 2020, the Committed Line was reduced from $250 million to $150 million. The Committed Line expires November 12, 2020, unless extended by the Bank or terminated by the Participating Funds in accordance with the agreement.
On the Effective Date, the Funds, along with certain other Participating Funds managed by the Manager, also entered into an uncommitted discretionary demand revolving line of credit (the “Uncommitted Line”) agreement with the Bank to be used to facilitate portfolio liquidity. The maximum borrowing amount under the Uncommitted Line is $50 million with interest at a rate equal to the higher of (a) one-month LIBOR plus 1.25% per annum or (b) the Federal Funds rate plus 1.25% per annum on each outstanding loan. Each of the Participating Funds paid a closing fee of $35,000 on the Effective Date. The Uncommitted Line expires November 12, 2020 unless extended by the Bank or terminated by the Participating Funds in accordance with the agreement.
The Participating Funds paid administration, legal and arrangement fees, which are recognized as a component of “Other expenses” on the Statements of Operations, along with commitment fees, that have been allocated among the Participating Funds based on average daily net assets.
During the year ended August 31, 2020, the Funds did not utilize this facility.
45
American Beacon FundsSM
Notes to Financial Statements
August 31, 2020
11. Capital Share Transactions
The tables below summarize the activity in capital shares for each Class of the Funds:
| R5 ClassA | ||||||||||||||||||||||||||||
| Year Ended August 31, | ||||||||||||||||||||||||||||
| 2020 | 2019 | |||||||||||||||||||||||||||
The London Company Income Equity Fund | Shares | Amount | Shares | Amount | ||||||||||||||||||||||||
| Shares sold | 6,748,271 | $ | 108,960,986 | 2,518,742 | $ | 43,633,426 | ||||||||||||||||||||||
| Reinvestment of dividends | 864,050 | 15,922,758 | 425,107 | 7,144,672 | ||||||||||||||||||||||||
| Shares redeemed | (4,485,388 | ) | (78,972,840 | ) | (3,237,855 | ) | (57,349,793 | ) | ||||||||||||||||||||
|
|
|
|
|
|
|
| |||||||||||||||||||||
| Net increase (decrease) in shares outstanding | 3,126,933 | $ | 45,910,904 | (294,006 | ) | $ | (6,571,695 | ) | ||||||||||||||||||||
|
|
|
|
|
|
|
| |||||||||||||||||||||
| Y Class | ||||||||||||||||||||||||||||
| Year Ended August 31, | ||||||||||||||||||||||||||||
The London Company Income Equity Fund | Shares | Amount | Shares | Amount | ||||||||||||||||||||||||
| Shares sold | 15,471,519 | $ | 264,156,843 | 12,116,030 | $ | 211,185,262 | ||||||||||||||||||||||
| Reinvestment of dividends | 1,811,450 | 33,289,109 | 620,492 | 10,389,027 | ||||||||||||||||||||||||
| Shares redeemed | (12,830,260 | ) | (214,092,117 | ) | (7,753,635 | ) | (135,683,233 | ) | ||||||||||||||||||||
|
|
|
|
|
|
|
| |||||||||||||||||||||
| Net increase in shares outstanding | 4,452,709 | $ | 83,353,835 | 4,982,887 | $ | 85,891,056 | ||||||||||||||||||||||
|
|
|
|
|
|
|
| |||||||||||||||||||||
| Investor Class | ||||||||||||||||||||||||||||
| Year Ended August 31, | ||||||||||||||||||||||||||||
| 2020 | 2019 | |||||||||||||||||||||||||||
The London Company Income Equity Fund | Shares | Amount | Shares | Amount | ||||||||||||||||||||||||
| Shares sold | 1,114,699 | $ | 19,606,789 | 272,412 | $ | 4,809,718 | ||||||||||||||||||||||
| Reinvestment of dividends | 107,887 | 1,983,373 | 49,189 | 818,629 | ||||||||||||||||||||||||
| Shares redeemed | (397,563 | ) | (6,849,866 | ) | (516,690 | ) | (8,965,908 | ) | ||||||||||||||||||||
|
|
|
|
|
|
|
| |||||||||||||||||||||
| Net increase (decrease) in shares outstanding | 825,023 | $ | 14,740,296 | (195,089 | ) | $ | (3,337,561 | ) | ||||||||||||||||||||
|
|
|
|
|
|
|
| |||||||||||||||||||||
| A Class | ||||||||||||||||||||||||||||
| Year Ended August 31, | ||||||||||||||||||||||||||||
| 2020 | 2019 | |||||||||||||||||||||||||||
The London Company Income Equity Fund | Shares | Amount | Shares | Amount | ||||||||||||||||||||||||
| Shares sold | 2,443,255 | $ | 43,347,039 | 809,388 | $ | 14,040,523 | ||||||||||||||||||||||
| Reinvestment of dividends | 167,989 | 3,078,006 | 71,296 | 1,182,853 | ||||||||||||||||||||||||
| Shares redeemed | (1,051,750 | ) | (17,920,731 | ) | (921,006 | ) | (16,225,970 | ) | ||||||||||||||||||||
|
|
|
|
|
|
|
| |||||||||||||||||||||
| Net increase (decrease) in shares outstanding | 1,559,494 | $ | 28,504,314 | (40,322 | ) | $ | (1,002,594 | ) | ||||||||||||||||||||
|
|
|
|
|
|
|
| |||||||||||||||||||||
| C Class | ||||||||||||||||||||||||||||
| Year Ended August 31, | ||||||||||||||||||||||||||||
| 2020 | 2019 | |||||||||||||||||||||||||||
The London Company Income Equity Fund | Shares | Amount | Shares | Amount | ||||||||||||||||||||||||
| Shares sold | 788,277 | $ | 14,093,305 | 816,853 | $ | 14,103,267 | ||||||||||||||||||||||
| Reinvestment of dividends | 225,489 | 4,118,972 | 90,711 | 1,467,940 | ||||||||||||||||||||||||
| Shares redeemed | (2,998,004 | ) | (51,936,965 | ) | (1,292,308 | ) | (22,491,229 | ) | ||||||||||||||||||||
|
|
|
|
|
|
|
| |||||||||||||||||||||
| Net (decrease) in shares outstanding | (1,984,238 | ) | $ | (33,724,688 | ) | (384,744 | ) | $ | (6,920,022 | ) | ||||||||||||||||||
|
|
|
|
|
|
|
| |||||||||||||||||||||
| R6 Class | ||||||||||||||||||||||||||||
| Period Ended August 31, 2020B | ||||||||||||||||||||||||||||
The London Company Income Equity Fund | Shares | Amount | ||||||||||||||||||||||||||
| Shares sold | 5,266 | $ | 100,000 | |||||||||||||||||||||||||
| Reinvestment of dividends | - | - | ||||||||||||||||||||||||||
| Shares redeemed | - | - | ||||||||||||||||||||||||||
|
|
|
| |||||||||||||||||||||||||
| Net increase in shares outstanding | 5,266 | $ | 100,000 | |||||||||||||||||||||||||
|
|
|
| |||||||||||||||||||||||||
46
American Beacon FundsSM
Notes to Financial Statements
August 31, 2020
| R5 ClassA | ||||||||||||||||||||||||||||
| Year Ended August 31, | ||||||||||||||||||||||||||||
| 2020 | 2019 | |||||||||||||||||||||||||||
Zebra Small Cap Equity Fund | Shares | Amount | Shares | Amount | ||||||||||||||||||||||||
| Shares sold | 480,148 | $ | 6,355,330 | 1,321,850 | $ | 19,634,000 | ||||||||||||||||||||||
| Reinvestment of dividends | 2,813 | 45,232 | 83,251 | 1,074,766 | ||||||||||||||||||||||||
| Shares redeemed | (865,695 | ) | (12,004,712 | ) | (287,446 | ) | (4,257,983 | ) | ||||||||||||||||||||
|
|
|
|
|
|
|
| |||||||||||||||||||||
| Net increase (decrease) in shares outstanding | (382,734 | ) | $ | (5,604,150 | ) | 1,117,655 | $ | 16,450,783 | ||||||||||||||||||||
|
|
|
|
|
|
|
| |||||||||||||||||||||
| Y Class | ||||||||||||||||||||||||||||
| Year Ended August 31, | ||||||||||||||||||||||||||||
| 2020 | 2019 | |||||||||||||||||||||||||||
Zebra Small Cap Equity Fund | Shares | Amount | Shares | Amount | ||||||||||||||||||||||||
| Shares sold | 1,281,560 | $ | 17,753,486 | 1,628,097 | $ | 24,662,254 | ||||||||||||||||||||||
| Reinvestment of dividends | 13,365 | 216,372 | 294,871 | 3,836,268 | ||||||||||||||||||||||||
| Shares redeemed | (1,581,234 | ) | (22,066,453 | ) | (1,681,599 | ) | (25,552,002 | ) | ||||||||||||||||||||
|
|
|
|
|
|
|
| |||||||||||||||||||||
| Net increase (decrease) in shares outstanding | (286,309 | ) | $ | (4,096,595 | ) | 241,369 | $ | 2,946,520 | ||||||||||||||||||||
|
|
|
|
|
|
|
| |||||||||||||||||||||
| Investor Class | ||||||||||||||||||||||||||||
| Year Ended August 31, | ||||||||||||||||||||||||||||
| 2020 | 2019 | |||||||||||||||||||||||||||
Zebra Small Cap Equity Fund | Shares | Amount | Shares | Amount | ||||||||||||||||||||||||
| Shares sold | 284,253 | $ | 3,972,917 | 533,302 | $ | 7,962,838 | ||||||||||||||||||||||
| Reinvestment of dividends | 3,481 | 55,244 | 66,208 | 845,481 | ||||||||||||||||||||||||
| Shares redeemed | (314,723 | ) | (4,196,241 | ) | (282,635 | ) | (4,283,203 | ) | ||||||||||||||||||||
|
|
|
|
|
|
|
| |||||||||||||||||||||
| Net increase (decrease) in shares outstanding | (26,989 | ) | $ | (168,080 | ) | 316,875 | $ | 4,525,116 | ||||||||||||||||||||
|
|
|
|
|
|
|
| |||||||||||||||||||||
| A Class | ||||||||||||||||||||||||||||
| Year Ended August 31, | ||||||||||||||||||||||||||||
| 2020 | 2019 | |||||||||||||||||||||||||||
Zebra Small Cap Equity Fund | Shares | Amount | Shares | Amount | ||||||||||||||||||||||||
| Shares sold | 25,222 | $ | 381,152 | 54,021 | $ | 852,036 | ||||||||||||||||||||||
| Reinvestment of dividends | 547 | 8,704 | 26,599 | 340,204 | ||||||||||||||||||||||||
| Shares redeemed | (129,985 | ) | (1,638,008 | ) | (167,805 | ) | (2,534,363 | ) | ||||||||||||||||||||
|
|
|
|
|
|
|
| |||||||||||||||||||||
| Net (decrease) in shares outstanding | (104,216 | ) | $ | (1,248,152 | ) | (87,185 | ) | $ | (1,342,123 | ) | ||||||||||||||||||
|
|
|
|
|
|
|
| |||||||||||||||||||||
| C Class | ||||||||||||||||||||||||||||
| Year Ended August 31, | ||||||||||||||||||||||||||||
| 2020 | 2019 | |||||||||||||||||||||||||||
Zebra Small Cap Equity Fund | Shares | Amount | Shares | Amount | ||||||||||||||||||||||||
| Shares sold | 34,457 | $ | 497,693 | 36,599 | $ | 550,791 | ||||||||||||||||||||||
| Reinvestment of dividends | - | - | 22,891 | 277,216 | ||||||||||||||||||||||||
| Shares redeemed | (94,922 | ) | (1,157,954 | ) | (70,825 | ) | (991,755 | ) | ||||||||||||||||||||
|
|
|
|
|
|
|
| |||||||||||||||||||||
| Net (decrease) in shares outstanding | (60,465 | ) | $ | (660,261 | ) | (11,335 | ) | $ | (163,748 | ) | ||||||||||||||||||
|
|
|
|
|
|
|
| |||||||||||||||||||||
A Formerly known as Institutional Class.
B Class launched on August 25, 2020 and commenced operations on August 26, 2020 (Note 1).
12. Subsequent Events
Management has evaluated subsequent events for possible recognition or disclosure in the financial statements through the date the financial statements are issued. Management has determined that there are no material events that would require disclosure in the Funds’ financial statements through this date.
47
American Beacon The London Company Income Equity FundSM
Financial Highlights
(For a share outstanding throughout the period)
| R5 ClassA | ||||||||||||||||||||||||||||||||||||
| Year Ended August 31, | ||||||||||||||||||||||||||||||||||||
| 2020 | 2019 | 2018 | 2017 | 2016 | ||||||||||||||||||||||||||||||||
|
| |||||||||||||||||||||||||||||||||||
Net asset value, beginning of period | $ | 18.26 | $ | 18.13 | $ | 16.13 | $ | 15.25 | $ | 13.85 | ||||||||||||||||||||||||||
|
|
|
|
|
|
|
|
|
| |||||||||||||||||||||||||||
Income from investment operations: | ||||||||||||||||||||||||||||||||||||
Net investment income | 0.36 | 0.37 | 0.35 | 0.33 | 0.32 | |||||||||||||||||||||||||||||||
Net gains on investments (both realized and unrealized) | 2.07 | 0.42 | 2.00 | 0.97 | 1.40 | |||||||||||||||||||||||||||||||
|
|
|
|
|
|
|
|
|
| |||||||||||||||||||||||||||
Total income from investment operations | 2.43 | 0.79 | 2.35 | 1.30 | 1.72 | |||||||||||||||||||||||||||||||
|
|
|
|
|
|
|
|
|
| |||||||||||||||||||||||||||
Less distributions: | ||||||||||||||||||||||||||||||||||||
Dividends from net investment income | (0.38 | ) | (0.39 | ) | (0.35 | ) | (0.32 | ) | (0.32 | ) | ||||||||||||||||||||||||||
Distributions from net realized gains | (1.17 | ) | (0.27 | ) | – | (0.10 | ) | – | ||||||||||||||||||||||||||||
|
|
|
|
|
|
|
|
|
| |||||||||||||||||||||||||||
Total distributions | (1.55 | ) | (0.66 | ) | (0.35 | ) | (0.42 | ) | (0.32 | ) | ||||||||||||||||||||||||||
|
|
|
|
|
|
|
|
|
| |||||||||||||||||||||||||||
Net asset value, end of period | $ | 19.14 | $ | 18.26 | $ | 18.13 | $ | 16.13 | $ | 15.25 | ||||||||||||||||||||||||||
|
|
|
|
|
|
|
|
|
| |||||||||||||||||||||||||||
Total returnB | 13.81 | % | 4.78 | % | 14.75 | % | 8.64 | % | 12.57 | % | ||||||||||||||||||||||||||
|
|
|
|
|
|
|
|
|
| |||||||||||||||||||||||||||
Ratios and supplemental data: |
| |||||||||||||||||||||||||||||||||||
Net assets, end of period | $ | 307,794,240 | $ | 236,601,692 | $ | 240,244,700 | $ | 222,730,033 | $ | 194,708,612 | ||||||||||||||||||||||||||
Ratios to average net assets: | ||||||||||||||||||||||||||||||||||||
Expenses, before reimbursements or recoupments | 0.75 | % | 0.73 | % | 0.73 | % | 0.74 | % | 0.75 | % | ||||||||||||||||||||||||||
Expenses, net of reimbursements or recoupments | 0.75 | % | 0.73 | % | 0.73 | % | 0.74 | % | 0.77 | % | ||||||||||||||||||||||||||
Net investment income, before expense reimbursements or recoupments | 1.99 | % | 2.09 | % | 2.08 | % | 2.12 | % | 2.32 | % | ||||||||||||||||||||||||||
Net investment income, net of reimbursements or recoupments | 1.99 | % | 2.09 | % | 2.08 | % | 2.12 | % | 2.30 | % | ||||||||||||||||||||||||||
Portfolio turnover rate | 21 | % | 23 | % | 16 | % | 14 | % | 20 | % | ||||||||||||||||||||||||||
| A | Prior to February 28, 2020, the R5 Class was known as Institutional Class. |
| B | Based on net asset value, which does not reflect the sales charge, redemption fee, or contingent deferred sales charge, if applicable. May include adjustments in accordance with U.S. GAAP and as such, the net asset value for reporting purposes and the returns based upon those net asset values may differ from the net asset value and returns for shareholder transactions. |
See accompanying notes
48
American Beacon The London Company Income Equity FundSM
Financial Highlights
(For a share outstanding throughout the period)
| Y Class | ||||||||||||||||||||||||||||||||||||
| Year Ended August 31, | ||||||||||||||||||||||||||||||||||||
| 2020 | 2019 | 2018 | 2017 | 2016 | ||||||||||||||||||||||||||||||||
|
| |||||||||||||||||||||||||||||||||||
Net asset value, beginning of period | $ | 18.16 | $ | 18.04 | $ | 16.05 | $ | 15.17 | $ | 13.79 | ||||||||||||||||||||||||||
|
|
|
|
|
|
|
|
|
| |||||||||||||||||||||||||||
Income from investment operations: | ||||||||||||||||||||||||||||||||||||
Net investment income | 0.34 | 0.36 | 0.34 | 0.32 | 0.32 | |||||||||||||||||||||||||||||||
Net gains on investments (both realized and unrealized) | 2.06 | 0.41 | 1.99 | 0.97 | 1.37 | |||||||||||||||||||||||||||||||
|
|
|
|
|
|
|
|
|
| |||||||||||||||||||||||||||
Total income from investment operations | 2.40 | 0.77 | 2.33 | 1.29 | 1.69 | |||||||||||||||||||||||||||||||
|
|
|
|
|
|
|
|
|
| |||||||||||||||||||||||||||
Less distributions: | ||||||||||||||||||||||||||||||||||||
Dividends from net investment income | (0.37 | ) | (0.38 | ) | (0.34 | ) | (0.31 | ) | (0.31 | ) | ||||||||||||||||||||||||||
Distributions from net realized gains | (1.17 | ) | (0.27 | ) | – | (0.10 | ) | – | ||||||||||||||||||||||||||||
|
|
|
|
|
|
|
|
|
| |||||||||||||||||||||||||||
Total distributions | (1.54 | ) | (0.65 | ) | (0.34 | ) | (0.41 | ) | (0.31 | ) | ||||||||||||||||||||||||||
|
|
|
|
|
|
|
|
|
| |||||||||||||||||||||||||||
Net asset value, end of period | $ | 19.02 | $ | 18.16 | $ | 18.04 | $ | 16.05 | $ | 15.17 | ||||||||||||||||||||||||||
|
|
|
|
|
|
|
|
|
| |||||||||||||||||||||||||||
Total returnA | 13.70 | % | 4.68 | % | 14.69 | % | 8.60 | % | 12.42 | % | ||||||||||||||||||||||||||
|
|
|
|
|
|
|
|
|
| |||||||||||||||||||||||||||
Ratios and supplemental data: | ||||||||||||||||||||||||||||||||||||
Net assets, end of period | $ | 783,186,967 | $ | 666,792,661 | $ | 572,315,652 | $ | 663,588,078 | $ | 582,952,334 | ||||||||||||||||||||||||||
Ratios to average net assets: | ||||||||||||||||||||||||||||||||||||
Expenses, before reimbursements | 0.81 | % | 0.80 | % | 0.79 | % | 0.81 | % | 0.82 | % | ||||||||||||||||||||||||||
Expenses, net of reimbursements | 0.81 | % | 0.80 | % | 0.79 | % | 0.81 | % | 0.82 | % | ||||||||||||||||||||||||||
Net investment income, before expense reimbursements | 1.94 | % | 2.03 | % | 2.00 | % | 2.04 | % | 2.24 | % | ||||||||||||||||||||||||||
Net investment income, net of reimbursements | 1.94 | % | 2.03 | % | 2.00 | % | 2.04 | % | 2.24 | % | ||||||||||||||||||||||||||
Portfolio turnover rate | 21 | % | 23 | % | 16 | % | 14 | % | 20 | % | ||||||||||||||||||||||||||
| A | Based on net asset value, which does not reflect the sales charge, redemption fee, or contingent deferred sales charge, if applicable. May include adjustments in accordance with U.S. GAAP and as such, the net asset value for reporting purposes and the returns based upon those net asset values may differ from the net asset value and returns for shareholder transactions. |
See accompanying notes
49
American Beacon The London Company Income Equity FundSM
Financial Highlights
(For a share outstanding throughout the period)
| Investor Class | ||||||||||||||||||||||||||||||||||||
| Year Ended August 31, | ||||||||||||||||||||||||||||||||||||
| 2020 | 2019 | 2018 | 2017 | 2016 | ||||||||||||||||||||||||||||||||
|
| |||||||||||||||||||||||||||||||||||
Net asset value, beginning of period | $ | 18.19 | $ | 18.06 | $ | 16.07 | $ | 15.19 | $ | 13.81 | ||||||||||||||||||||||||||
|
|
|
|
|
|
|
|
|
| |||||||||||||||||||||||||||
Income from investment operations: | ||||||||||||||||||||||||||||||||||||
Net investment income | 0.30 | 0.31 | 0.30 | 0.28 | 0.28 | |||||||||||||||||||||||||||||||
Net gains on investments (both realized and unrealized) | 2.06 | 0.43 | 1.98 | 0.97 | 1.37 | |||||||||||||||||||||||||||||||
|
|
|
|
|
|
|
|
|
| |||||||||||||||||||||||||||
Total income from investment operations | 2.36 | 0.74 | 2.28 | 1.25 | 1.65 | |||||||||||||||||||||||||||||||
|
|
|
|
|
|
|
|
|
| |||||||||||||||||||||||||||
Less distributions: | ||||||||||||||||||||||||||||||||||||
Dividends from net investment income | (0.33 | ) | (0.34 | ) | (0.29 | ) | (0.27 | ) | (0.27 | ) | ||||||||||||||||||||||||||
Distributions from net realized gains | (1.17 | ) | (0.27 | ) | – | (0.10 | ) | – | ||||||||||||||||||||||||||||
|
|
|
|
|
|
|
|
|
| |||||||||||||||||||||||||||
Total distributions | (1.50 | ) | (0.61 | ) | (0.29 | ) | (0.37 | ) | (0.27 | ) | ||||||||||||||||||||||||||
|
|
|
|
|
|
|
|
|
| |||||||||||||||||||||||||||
Net asset value, end of period | $ | 19.05 | $ | 18.19 | $ | 18.06 | $ | 16.07 | $ | 15.19 | ||||||||||||||||||||||||||
|
|
|
|
|
|
|
|
|
| |||||||||||||||||||||||||||
Total returnA | 13.38 | % | 4.45 | % | 14.37 | % | 8.33 | % | 12.13 | % | ||||||||||||||||||||||||||
|
|
|
|
|
|
|
|
|
| |||||||||||||||||||||||||||
Ratios and supplemental data: | ||||||||||||||||||||||||||||||||||||
Net assets, end of period | $ | 41,904,048 | $ | 24,993,208 | $ | 28,343,428 | $ | 31,897,528 | $ | 29,208,149 | ||||||||||||||||||||||||||
Ratios to average net assets: | ||||||||||||||||||||||||||||||||||||
Expenses, before reimbursements | 1.07 | % | 1.06 | % | 1.05 | % | 1.05 | % | 1.06 | % | ||||||||||||||||||||||||||
Expenses, net of reimbursements | 1.07 | % | 1.06 | % | 1.05 | % | 1.05 | % | 1.06 | % | ||||||||||||||||||||||||||
Net investment income, before expense reimbursements | 1.67 | % | 1.75 | % | 1.75 | % | 1.79 | % | 2.01 | % | ||||||||||||||||||||||||||
Net investment income, net of reimbursements | 1.67 | % | 1.75 | % | 1.75 | % | 1.79 | % | 2.01 | % | ||||||||||||||||||||||||||
Portfolio turnover rate | 21 | % | 23 | % | 16 | % | 14 | % | 20 | % | ||||||||||||||||||||||||||
| A | Based on net asset value, which does not reflect the sales charge, redemption fee, or contingent deferred sales charge, if applicable. May include adjustments in accordance with U.S. GAAP and as such, the net asset value for reporting purposes and the returns based upon those net asset values may differ from the net asset value and returns for shareholder transactions. |
See accompanying notes
50
American Beacon The London Company Income Equity FundSM
Financial Highlights
(For a share outstanding throughout the period)
| A Class | ||||||||||||||||||||||||||||||||||||
| Year Ended August 31, | ||||||||||||||||||||||||||||||||||||
| 2020 | 2019 | 2018 | 2017 | 2016 | ||||||||||||||||||||||||||||||||
|
| |||||||||||||||||||||||||||||||||||
Net asset value, beginning of period | $ | 18.08 | $ | 17.96 | $ | 15.98 | $ | 15.11 | $ | 13.73 | ||||||||||||||||||||||||||
|
|
|
|
|
|
|
|
|
| |||||||||||||||||||||||||||
Income from investment operations: | ||||||||||||||||||||||||||||||||||||
Net investment income | 0.30 | 0.31 | 0.31 | 0.27 | 0.27 | |||||||||||||||||||||||||||||||
Net gains on investments (both realized and unrealized) | 2.05 | 0.42 | 1.96 | 0.96 | 1.38 | |||||||||||||||||||||||||||||||
|
|
|
|
|
|
|
|
|
| |||||||||||||||||||||||||||
Total income from investment operations | 2.35 | 0.73 | 2.27 | 1.23 | 1.65 | |||||||||||||||||||||||||||||||
|
|
|
|
|
|
|
|
|
| |||||||||||||||||||||||||||
Less distributions: | ||||||||||||||||||||||||||||||||||||
Dividends from net investment income | (0.33 | ) | (0.34 | ) | (0.29 | ) | (0.26 | ) | (0.27 | ) | ||||||||||||||||||||||||||
Distributions from net realized gains | (1.17 | ) | (0.27 | ) | – | (0.10 | ) | – | ||||||||||||||||||||||||||||
|
|
|
|
|
|
|
|
|
| |||||||||||||||||||||||||||
Total distributions | (1.50 | ) | (0.61 | ) | (0.29 | ) | (0.36 | ) | (0.27 | ) | ||||||||||||||||||||||||||
|
|
|
|
|
|
|
|
|
| |||||||||||||||||||||||||||
Net asset value, end of period | $ | 18.93 | $ | 18.08 | $ | 17.96 | $ | 15.98 | $ | 15.11 | ||||||||||||||||||||||||||
|
|
|
|
|
|
|
|
|
| |||||||||||||||||||||||||||
Total returnA | 13.44 | % | 4.43 | % | 14.41 | % | 8.24 | % | 12.14 | % | ||||||||||||||||||||||||||
|
|
|
|
|
|
|
|
|
| |||||||||||||||||||||||||||
Ratios and supplemental data: | ||||||||||||||||||||||||||||||||||||
Net assets, end of period | $ | 92,490,860 | $ | 60,146,845 | $ | 60,465,593 | $ | 95,206,378 | $ | 94,705,221 | ||||||||||||||||||||||||||
Ratios to average net assets: | ||||||||||||||||||||||||||||||||||||
Expenses, before reimbursements | 1.04 | % | 1.05 | % | 1.03 | % | 1.12 | % | 1.13 | % | ||||||||||||||||||||||||||
Expenses, net of reimbursements | 1.04 | % | 1.05 | % | 1.03 | % | 1.12 | % | 1.13 | % | ||||||||||||||||||||||||||
Net investment income, before expense reimbursements | 1.71 | % | 1.77 | % | 1.75 | % | 1.73 | % | 1.94 | % | ||||||||||||||||||||||||||
Net investment income, net of reimbursements | 1.71 | % | 1.77 | % | 1.75 | % | 1.73 | % | 1.94 | % | ||||||||||||||||||||||||||
Portfolio turnover rate | 21 | % | 23 | % | 16 | % | 14 | % | 20 | % | ||||||||||||||||||||||||||
| A | Based on net asset value, which does not reflect the sales charge, redemption fee, or contingent deferred sales charge, if applicable. May include adjustments in accordance with U.S. GAAP and as such, the net asset value for reporting purposes and the returns based upon those net asset values may differ from the net asset value and returns for shareholder transactions. |
See accompanying notes
51
American Beacon The London Company Income Equity FundSM
Financial Highlights
(For a share outstanding throughout the period)
| C Class | ||||||||||||||||||||||||||||||||||||
| Year Ended August 31, | ||||||||||||||||||||||||||||||||||||
| 2020 | 2019 | 2018 | 2017 | 2016 | ||||||||||||||||||||||||||||||||
|
| |||||||||||||||||||||||||||||||||||
Net asset value, beginning of period | $ | 17.94 | $ | 17.83 | $ | 15.87 | $ | 15.01 | $ | 13.65 | ||||||||||||||||||||||||||
|
|
|
|
|
|
|
|
|
| |||||||||||||||||||||||||||
Income from investment operations: | ||||||||||||||||||||||||||||||||||||
Net investment income | 0.14 | 0.17 | 0.16 | 0.15 | 0.17 | |||||||||||||||||||||||||||||||
Net gains on investments (both realized and unrealized) | 2.06 | 0.42 | 1.97 | 0.96 | 1.36 | |||||||||||||||||||||||||||||||
|
|
|
|
|
|
|
|
|
| |||||||||||||||||||||||||||
Total income from investment operations | 2.20 | 0.59 | 2.13 | 1.11 | 1.53 | |||||||||||||||||||||||||||||||
|
|
|
|
|
|
|
|
|
| |||||||||||||||||||||||||||
Less distributions: | ||||||||||||||||||||||||||||||||||||
Dividends from net investment income | (0.19 | ) | (0.21 | ) | (0.17 | ) | (0.15 | ) | (0.17 | ) | ||||||||||||||||||||||||||
Distributions from net realized gains | (1.17 | ) | (0.27 | ) | – | (0.10 | ) | – | ||||||||||||||||||||||||||||
|
|
|
|
|
|
|
|
|
| |||||||||||||||||||||||||||
Total distributions | (1.36 | ) | (0.48 | ) | (0.17 | ) | (0.25 | ) | (0.17 | ) | ||||||||||||||||||||||||||
|
|
|
|
|
|
|
|
|
| |||||||||||||||||||||||||||
Net asset value, end of period | $ | 18.78 | $ | 17.94 | $ | 17.83 | $ | 15.87 | $ | 15.01 | ||||||||||||||||||||||||||
|
|
|
|
|
|
|
|
|
| |||||||||||||||||||||||||||
Total returnA | 12.59 | % | 3.64 | % | 13.53 | % | 7.42 | % | 11.28 | % | ||||||||||||||||||||||||||
|
|
|
|
|
|
|
|
|
| |||||||||||||||||||||||||||
Ratios and supplemental data: | ||||||||||||||||||||||||||||||||||||
Net assets, end of period | $ | 95,091,128 | $ | 126,444,587 | $ | 132,511,310 | $ | 149,848,432 | $ | 185,308,648 | ||||||||||||||||||||||||||
Ratios to average net assets: | ||||||||||||||||||||||||||||||||||||
Expenses, before reimbursements | 1.81 | % | 1.82 | % | 1.81 | % | 1.86 | % | 1.87 | % | ||||||||||||||||||||||||||
Expenses, net of reimbursements | 1.81 | % | 1.82 | % | 1.81 | % | 1.86 | % | 1.87 | % | ||||||||||||||||||||||||||
Net investment income, before expense reimbursements | 0.94 | % | 1.01 | % | 0.98 | % | 0.97 | % | 1.20 | % | ||||||||||||||||||||||||||
Net investment income, net of reimbursements | 0.94 | % | 1.01 | % | 0.98 | % | 0.97 | % | 1.20 | % | ||||||||||||||||||||||||||
Portfolio turnover rate | 21 | % | 23 | % | 16 | % | 14 | % | 20 | % | ||||||||||||||||||||||||||
| A | Based on net asset value, which does not reflect the sales charge, redemption fee, or contingent deferred sales charge, if applicable. May include adjustments in accordance with U.S. GAAP and as such, the net asset value for reporting purposes and the returns based upon those net asset values may differ from the net asset value and returns for shareholder transactions. |
See accompanying notes
52
American Beacon The London Company Income Equity FundSM
Financial Highlights
(For a share outstanding throughout the period)
| R6 Class | ||||
| August 25, 2020A to August 31, 2020 | ||||
Net asset value, beginning of period | $ | 18.99 | ||
|
| |||
Income from investment (loss) operations: | ||||
Net investment income (loss) | (0.01 | ) | ||
Net gains on investments (both realized and unrealized) | 0.15 | |||
|
| |||
Total income (loss) from investment operations | 0.14 | |||
|
| |||
Less distributions: | ||||
Dividends from net investment income | – | |||
|
| |||
Net asset value, end of period | $ | 19.13 | ||
|
| |||
Total returnB | 0.74 | %C | ||
|
| |||
Ratios and supplemental data: |
| |||
Net assets, end of period | $ | 100,763 | ||
Ratios to average net assets: | ||||
Expenses, before reimbursements | 0.85 | %D | ||
Expenses, net of reimbursements | 0.71 | %D | ||
Net investment (loss), before expense reimbursements | (3.83 | )%D | ||
Net investment (loss), net of reimbursements | (3.69 | )%D | ||
Portfolio turnover rate | 21 | %C | ||
| A | Effective date of class. |
| B | Based on net asset value, which does not reflect the sales charge, redemption fee, or contingent deferred sales charge, if applicable. May include adjustments in accordance with U.S. GAAP and as such, the net asset value for reporting purposes and the returns based upon those net asset values may differ from the net asset value and returns for shareholder transactions. |
| C | Not annualized. |
| D | Annualized. |
See accompanying notes
53
American Beacon Zebra Small Cap Equity FundSM
Financial Highlights
(For a share outstanding throughout the period)
| R5 ClassA | ||||||||||||||||||||||||||||||||||||
| Year Ended August 31, | ||||||||||||||||||||||||||||||||||||
| 2020 | 2019 | 2018 | 2017 | 2016 | ||||||||||||||||||||||||||||||||
|
| |||||||||||||||||||||||||||||||||||
Net asset value, beginning of period | $ | 14.22 | $ | 18.32 | $ | 16.04 | $ | 14.07 | $ | 14.21 | ||||||||||||||||||||||||||
|
|
|
|
|
|
|
|
|
| |||||||||||||||||||||||||||
Income (loss) from investment operations: | ||||||||||||||||||||||||||||||||||||
Net investment income | 0.14 | 0.09 | 0.11 | 0.24 | 0.18 | |||||||||||||||||||||||||||||||
Net gains (losses) on investments (both realized and unrealized) | (0.51 | ) | (2.62 | ) | 3.44 | 1.90 | 1.15 | |||||||||||||||||||||||||||||
|
|
|
|
|
|
|
|
|
| |||||||||||||||||||||||||||
Total income (loss) from investment operations | (0.37 | ) | (2.53 | ) | 3.55 | 2.14 | 1.33 | |||||||||||||||||||||||||||||
|
|
|
|
|
|
|
|
|
| |||||||||||||||||||||||||||
Less distributions: | ||||||||||||||||||||||||||||||||||||
Dividends from net investment income | (0.08 | ) | (0.09 | ) | (0.03 | ) | (0.17 | ) | (0.06 | ) | ||||||||||||||||||||||||||
Distributions from net realized gains | – | (1.48 | ) | (1.24 | ) | – | (1.41 | ) | ||||||||||||||||||||||||||||
|
|
|
|
|
|
|
|
|
| |||||||||||||||||||||||||||
Total distributions | (0.08 | ) | (1.57 | ) | (1.27 | ) | (0.17 | ) | (1.47 | ) | ||||||||||||||||||||||||||
|
|
|
|
|
|
|
|
|
| |||||||||||||||||||||||||||
Net asset value, end of period | $ | 13.77 | $ | 14.22 | $ | 18.32 | $ | 16.04 | $ | 14.07 | ||||||||||||||||||||||||||
|
|
|
|
|
|
|
|
|
| |||||||||||||||||||||||||||
Total returnB | (2.70 | )% | (12.94 | )% | 22.98 | % | 15.25 | % | 10.46 | % | ||||||||||||||||||||||||||
|
|
|
|
|
|
|
|
|
| |||||||||||||||||||||||||||
Ratios and supplemental data: | ||||||||||||||||||||||||||||||||||||
Net assets, end of period | $ | 18,929,000 | $ | 24,989,951 | $ | 11,722,213 | $ | 4,122,461 | $ | 2,305,284 | ||||||||||||||||||||||||||
Ratios to average net assets: | ||||||||||||||||||||||||||||||||||||
Expenses, before reimbursements | 1.17 | % | 1.22 | % | 1.23 | % | 1.36 | % | 1.53 | % | ||||||||||||||||||||||||||
Expenses, net of reimbursementsC | 0.89 | % | 0.89 | % | 0.90 | % | 0.89 | % | 0.89 | % | ||||||||||||||||||||||||||
Net investment income, before expense reimbursements | 0.54 | % | 0.57 | % | 0.30 | % | 0.80 | % | 0.34 | % | ||||||||||||||||||||||||||
Net investment income, net of reimbursements | 0.82 | % | 0.90 | % | 0.64 | % | 1.26 | % | 0.97 | % | ||||||||||||||||||||||||||
Portfolio turnover rate | 106 | % | 93 | % | 74 | % | 77 | % | 50 | % | ||||||||||||||||||||||||||
| A | Prior to February 28, 2020, the R5 Class was known as Institutional Class. |
| B | Based on net asset value, which does not reflect the sales charge, redemption fee, or contingent deferred sales charge, if applicable. May include adjustments in accordance with U.S. GAAP and as such, the net asset value for reporting purposes and the returns based upon those net asset values may differ from the net asset value and returns for shareholder transactions. |
| C | Expense ratios may exceed stated expense caps in Note 2 due to security lending expenses, which are not reimbursable under the agreement with the Manager. |
See accompanying notes
54
American Beacon Zebra Small Cap Equity FundSM
Financial Highlights
(For a share outstanding throughout the period)
| Y Class | ||||||||||||||||||||||||||||||||||||
| Year Ended August 31, | ||||||||||||||||||||||||||||||||||||
| 2020 | 2019 | 2018 | 2017 | 2016 | ||||||||||||||||||||||||||||||||
|
| |||||||||||||||||||||||||||||||||||
Net asset value, beginning of period | $ | 14.32 | $ | 18.45 | $ | 16.17 | $ | 14.20 | $ | 14.33 | ||||||||||||||||||||||||||
|
|
|
|
|
|
|
|
|
| |||||||||||||||||||||||||||
Income (loss) from investment operations: | ||||||||||||||||||||||||||||||||||||
Net investment income | 0.11 | 0.13 | 0.08 | 0.15 | 0.12 | |||||||||||||||||||||||||||||||
Net gains (losses) on investments (both realized and unrealized) | (0.50 | ) | (2.69 | ) | 3.47 | 1.99 | 1.22 | |||||||||||||||||||||||||||||
|
|
|
|
|
|
|
|
|
| |||||||||||||||||||||||||||
Total income (loss) from investment operations | (0.39 | ) | (2.56 | ) | 3.55 | 2.14 | 1.34 | |||||||||||||||||||||||||||||
|
|
|
|
|
|
|
|
|
| |||||||||||||||||||||||||||
Less distributions: | ||||||||||||||||||||||||||||||||||||
Dividends from net investment income | (0.08 | ) | (0.09 | ) | (0.03 | ) | (0.17 | ) | (0.06 | ) | ||||||||||||||||||||||||||
Distributions from net realized gains | – | (1.48 | ) | (1.24 | ) | – | (1.41 | ) | ||||||||||||||||||||||||||||
|
|
|
|
|
|
|
|
|
| |||||||||||||||||||||||||||
Total distributions | (0.08 | ) | (1.57 | ) | (1.27 | ) | (0.17 | ) | (1.47 | ) | ||||||||||||||||||||||||||
|
|
|
|
|
|
|
|
|
| |||||||||||||||||||||||||||
Net asset value, end of period | $ | 13.85 | $ | 14.32 | $ | 18.45 | $ | 16.17 | $ | 14.20 | ||||||||||||||||||||||||||
|
|
|
|
|
|
|
|
|
| |||||||||||||||||||||||||||
Total returnA | (2.82 | )% | (13.02 | )% | 22.79 | % | 15.11 | % | 10.44 | % | ||||||||||||||||||||||||||
|
|
|
|
|
|
|
|
|
| |||||||||||||||||||||||||||
Ratios and supplemental data: | ||||||||||||||||||||||||||||||||||||
Net assets, end of period | $ | 35,283,932 | $ | 40,575,598 | $ | 47,832,660 | $ | 18,631,514 | $ | 10,988,456 | ||||||||||||||||||||||||||
Ratios to average net assets: | ||||||||||||||||||||||||||||||||||||
Expenses, before reimbursements | 1.26 | % | 1.24 | % | 1.27 | % | 1.41 | % | 1.58 | % | ||||||||||||||||||||||||||
Expenses, net of reimbursementsB | 0.99 | % | 0.99 | % | 1.00 | % | 0.99 | % | 0.99 | % | ||||||||||||||||||||||||||
Net investment income, before expense reimbursements | 0.45 | % | 0.55 | % | 0.26 | % | 0.54 | % | 0.28 | % | ||||||||||||||||||||||||||
Net investment income, net of reimbursements | 0.72 | % | 0.80 | % | 0.54 | % | 0.96 | % | 0.87 | % | ||||||||||||||||||||||||||
Portfolio turnover rate | 106 | % | 93 | % | 74 | % | 77 | % | 50 | % | ||||||||||||||||||||||||||
| A | Based on net asset value, which does not reflect the sales charge, redemption fee, or contingent deferred sales charge, if applicable. May include adjustments in accordance with U.S. GAAP and as such, the net asset value for reporting purposes and the returns based upon those net asset values may differ from the net asset value and returns for shareholder transactions. |
| B | Expense ratios may exceed stated expense caps in Note 2 due to security lending expenses, which are not reimbursable under the agreement with the Manager. |
See accompanying notes
55
American Beacon Zebra Small Cap Equity FundSM
Financial Highlights
(For a share outstanding throughout the period)
| Investor Class | ||||||||||||||||||||||||||||||||||||
| Year Ended August 31, | ||||||||||||||||||||||||||||||||||||
| 2020 | 2019 | 2018 | 2017 | 2016 | ||||||||||||||||||||||||||||||||
|
| |||||||||||||||||||||||||||||||||||
Net asset value, beginning of period | $ | 14.03 | $ | 18.14 | $ | 15.95 | $ | 14.05 | $ | 14.22 | ||||||||||||||||||||||||||
|
|
|
|
|
|
|
|
|
| |||||||||||||||||||||||||||
Income (loss) from investment operations: | ||||||||||||||||||||||||||||||||||||
Net investment income | 0.06 | 0.12 | 0.02 | 0.14 | 0.28 | |||||||||||||||||||||||||||||||
Net gains (losses) on investments (both realized and unrealized) | (0.49 | ) | (2.68 | ) | 3.43 | 1.93 | 1.00 | |||||||||||||||||||||||||||||
|
|
|
|
|
|
|
|
|
| |||||||||||||||||||||||||||
Total income (loss) from investment operations | (0.43 | ) | (2.56 | ) | 3.45 | 2.07 | 1.28 | |||||||||||||||||||||||||||||
|
|
|
|
|
|
|
|
|
| |||||||||||||||||||||||||||
Less distributions: | ||||||||||||||||||||||||||||||||||||
Dividends from net investment income | (0.06 | ) | (0.07 | ) | (0.02 | ) | (0.17 | ) | (0.04 | ) | ||||||||||||||||||||||||||
Distributions from net realized gains | – | (1.48 | ) | (1.24 | ) | – | (1.41 | ) | ||||||||||||||||||||||||||||
|
|
|
|
|
|
|
|
|
| |||||||||||||||||||||||||||
Total distributions | (0.06 | ) | (1.55 | ) | (1.26 | ) | (0.17 | ) | (1.45 | ) | ||||||||||||||||||||||||||
|
|
|
|
|
|
|
|
|
| |||||||||||||||||||||||||||
Net asset value, end of period | $ | 13.54 | $ | 14.03 | $ | 18.14 | $ | 15.95 | $ | 14.05 | ||||||||||||||||||||||||||
|
|
|
|
|
|
|
|
|
| |||||||||||||||||||||||||||
Total returnA | (3.12 | )% | (13.26 | )% | 22.47 | % | 14.77 | % | 10.07 | % | ||||||||||||||||||||||||||
|
|
|
|
|
|
|
|
|
| |||||||||||||||||||||||||||
Ratios and supplemental data: | ||||||||||||||||||||||||||||||||||||
Net assets, end of period | $ | 11,690,371 | $ | 12,486,352 | $ | 10,398,506 | $ | 10,766,976 | $ | 7,620,538 | ||||||||||||||||||||||||||
Ratios to average net assets: | ||||||||||||||||||||||||||||||||||||
Expenses, before reimbursements | 1.60 | % | 1.50 | % | 1.44 | % | 1.58 | % | 1.74 | % | ||||||||||||||||||||||||||
Expenses, net of reimbursementsB | 1.27 | % | 1.27 | % | 1.28 | % | 1.27 | % | 1.27 | % | ||||||||||||||||||||||||||
Net investment income, before expense reimbursements | 0.11 | % | 0.27 | % | 0.08 | % | 0.41 | % | 0.09 | % | ||||||||||||||||||||||||||
Net investment income, net of reimbursements | 0.44 | % | 0.50 | % | 0.24 | % | 0.72 | % | 0.56 | % | ||||||||||||||||||||||||||
Portfolio turnover rate | 106 | % | 93 | % | 74 | % | 77 | % | 50 | % | ||||||||||||||||||||||||||
| A | Based on net asset value, which does not reflect the sales charge, redemption fee, or contingent deferred sales charge, if applicable. May include adjustments in accordance with U.S. GAAP and as such, the net asset value for reporting purposes and the returns based upon those net asset values may differ from the net asset value and returns for shareholder transactions. |
| B | Expense ratios may exceed stated expense caps in Note 2 due to security lending expenses, which are not reimbursable under the agreement with the Manager. |
See accompanying notes
56
American Beacon Zebra Small Cap Equity FundSM
Financial Highlights
(For a share outstanding throughout the period)
| A Class | ||||||||||||||||||||||||||||||||||||
| Year Ended August 31, | ||||||||||||||||||||||||||||||||||||
| 2020 | 2019 | 2018 | 2017 | 2016 | ||||||||||||||||||||||||||||||||
|
| |||||||||||||||||||||||||||||||||||
Net asset value, beginning of period | $ | 14.05 | $ | 18.15 | $ | 15.96 | $ | 14.06 | $ | 14.22 | ||||||||||||||||||||||||||
|
|
|
|
|
|
|
|
|
| |||||||||||||||||||||||||||
Income (loss) from investment operations: | ||||||||||||||||||||||||||||||||||||
Net investment income | 0.06 | A | 0.08 | A | 0.03 | A | 0.16 | 0.10 | ||||||||||||||||||||||||||||
Net gains (losses) on investments (both realized and unrealized) | (0.49 | ) | (2.64 | ) | 3.42 | 1.91 | 1.18 | |||||||||||||||||||||||||||||
|
|
|
|
|
|
|
|
|
| |||||||||||||||||||||||||||
Total income (loss) from investment operations | (0.43 | ) | (2.56 | ) | 3.45 | 2.07 | 1.28 | |||||||||||||||||||||||||||||
|
|
|
|
|
|
|
|
|
| |||||||||||||||||||||||||||
Less distributions: | ||||||||||||||||||||||||||||||||||||
Dividends from net investment income | (0.05 | ) | (0.06 | ) | (0.02 | ) | (0.17 | ) | (0.03 | ) | ||||||||||||||||||||||||||
Distributions from net realized gains | – | (1.48 | ) | (1.24 | ) | – | (1.41 | ) | ||||||||||||||||||||||||||||
|
|
|
|
|
|
|
|
|
| |||||||||||||||||||||||||||
Total distributions | (0.05 | ) | (1.54 | ) | (1.26 | ) | (0.17 | ) | (1.44 | ) | ||||||||||||||||||||||||||
|
|
|
|
|
|
|
|
|
| |||||||||||||||||||||||||||
Net asset value, end of period | $ | 13.57 | $ | 14.05 | $ | 18.15 | $ | 15.96 | $ | 14.06 | ||||||||||||||||||||||||||
|
|
|
|
|
|
|
|
|
| |||||||||||||||||||||||||||
Total returnB | (3.10 | )% | (13.26 | )% | 22.43 | % | 14.76 | % | 10.04 | % | ||||||||||||||||||||||||||
|
|
|
|
|
|
|
|
|
| |||||||||||||||||||||||||||
Ratios and supplemental data: | ||||||||||||||||||||||||||||||||||||
Net assets, end of period | $ | 1,187,137 | $ | 2,693,316 | $ | 5,063,046 | $ | 6,801,568 | $ | 5,212,114 | ||||||||||||||||||||||||||
Ratios to average net assets: | ||||||||||||||||||||||||||||||||||||
Expenses, before reimbursements | 1.47 | % | 1.53 | % | 1.54 | % | 1.73 | % | 1.90 | % | ||||||||||||||||||||||||||
Expenses, net of reimbursementsC | 1.29 | % | 1.29 | % | 1.29 | % | 1.29 | % | 1.29 | % | ||||||||||||||||||||||||||
Net investment income (loss), before expense reimbursements | 0.23 | % | 0.27 | % | (0.04 | )% | 0.28 | % | (0.04 | )% | ||||||||||||||||||||||||||
Net investment income, net of reimbursements | 0.41 | % | 0.51 | % | 0.20 | % | 0.71 | % | 0.57 | % | ||||||||||||||||||||||||||
Portfolio turnover rate | 106 | % | 93 | % | 74 | % | 77 | % | 50 | % | ||||||||||||||||||||||||||
| A | Per share amounts have been calculated using the average shares method. |
| B | Based on net asset value, which does not reflect the sales charge, redemption fee, or contingent deferred sales charge, if applicable. May include adjustments in accordance with U.S. GAAP and as such, the net asset value for reporting purposes and the returns based upon those net asset values may differ from the net asset value and returns for shareholder transactions. |
| C | Expense ratios may exceed stated expense caps in Note 2 due to security lending expenses, which are not reimbursable under the agreement with the Manager. |
See accompanying notes
57
American Beacon Zebra Small Cap Equity FundSM
Financial Highlights
(For a share outstanding throughout the period)
| C Class | ||||||||||||||||||||||||||||||||||||
| Year Ended August 31, | ||||||||||||||||||||||||||||||||||||
| 2020 | 2019 | 2018 | 2017 | 2016 | ||||||||||||||||||||||||||||||||
|
| |||||||||||||||||||||||||||||||||||
Net asset value, beginning of period | $ | 13.23 | $ | 17.26 | $ | 15.32 | $ | 13.53 | $ | 13.81 | ||||||||||||||||||||||||||
|
|
|
|
|
|
|
|
|
| |||||||||||||||||||||||||||
Income (loss) from investment operations: | ||||||||||||||||||||||||||||||||||||
Net investment income (loss) | (0.30 | ) | (0.06 | ) | (0.09 | )A | 0.03 | 0.10 | ||||||||||||||||||||||||||||
Net gains (losses) on investments (both realized and unrealized) | (0.20 | ) | (2.49 | ) | 3.27 | 1.86 | 1.03 | |||||||||||||||||||||||||||||
|
|
|
|
|
|
|
|
|
| |||||||||||||||||||||||||||
Total income (loss) from investment operations | (0.50 | ) | (2.55 | ) | 3.18 | 1.89 | 1.13 | |||||||||||||||||||||||||||||
|
|
|
|
|
|
|
|
|
| |||||||||||||||||||||||||||
Less distributions: | ||||||||||||||||||||||||||||||||||||
Dividends from net investment income | – | – | – | (0.10 | ) | – | ||||||||||||||||||||||||||||||
Distributions from net realized gains | – | (1.48 | ) | (1.24 | ) | – | (1.41 | ) | ||||||||||||||||||||||||||||
|
|
|
|
|
|
|
|
|
| |||||||||||||||||||||||||||
Total distributions | – | (1.48 | ) | (1.24 | ) | (0.10 | ) | (1.41 | ) | |||||||||||||||||||||||||||
|
|
|
|
|
|
|
|
|
| |||||||||||||||||||||||||||
Net asset value, end of period | $ | 12.73 | $ | 13.23 | $ | 17.26 | $ | 15.32 | $ | 13.53 | ||||||||||||||||||||||||||
|
|
|
|
|
|
|
|
|
| |||||||||||||||||||||||||||
Total returnB | (3.78 | )% | (13.97 | )% | 21.55 | % | 13.97 | % | 9.17 | % | ||||||||||||||||||||||||||
|
|
|
|
|
|
|
|
|
| |||||||||||||||||||||||||||
Ratios and supplemental data: | ||||||||||||||||||||||||||||||||||||
Net assets, end of period | $ | 1,509,950 | $ | 2,370,089 | $ | 3,286,562 | $ | 2,207,090 | $ | 1,838,434 | ||||||||||||||||||||||||||
Ratios to average net assets: | ||||||||||||||||||||||||||||||||||||
Expenses, before reimbursements | 2.28 | % | 2.29 | % | 2.29 | % | 2.47 | % | 2.65 | % | ||||||||||||||||||||||||||
Expenses, net of reimbursementsC | 2.04 | % | 2.04 | % | 2.05 | % | 2.04 | % | 2.04 | % | ||||||||||||||||||||||||||
Net investment (loss), before expense reimbursements | (0.57 | )% | (0.49 | )% | (0.78 | )% | (0.42 | )% | (0.78 | )% | ||||||||||||||||||||||||||
Net investment income (loss), net of reimbursements | (0.33 | )% | (0.24 | )% | (0.53 | )% | 0.01 | % | (0.18 | )% | ||||||||||||||||||||||||||
Portfolio turnover rate | 106 | % | 93 | % | 74 | % | 77 | % | 50 | % | ||||||||||||||||||||||||||
| A | Per share amounts have been calculated using the average shares method. |
| B | Based on net asset value, which does not reflect the sales charge, redemption fee, or contingent deferred sales charge, if applicable. May include adjustments in accordance with U.S. GAAP and as such, the net asset value for reporting purposes and the returns based upon those net asset values may differ from the net asset value and returns for shareholder transactions. |
| C | Expense ratios may exceed stated expense caps in Note 2 due to security lending expenses, which are not reimbursable under the agreement with the Manager. |
See accompanying notes
58
American Beacon FundsSM
August 31, 2020 (Unaudited)
Certain tax information regarding the Funds are required to be provided to shareholders based upon the Funds’ income and distributions for the taxable year ended August 31, 2020. The information and distributions reported herein may differ from information and distributions taxable to the shareholders for the calendar year ended December 31, 2020.
The Funds designated the following items with regard to distributions paid during the fiscal year ended August 31, 2020. All designations are based on financial information available as of this annual report and, accordingly, are subject to change. For each item, it is the intention of the Funds to designate the maximum amount permitted under the Internal Revenue Code of 1986, as amended, and the regulations there under.
Corporate Dividends-Received Deduction:
The London Company Income Equity | 100.00 | % | ||
Zebra Small Cap Equity | 100.00 | % |
Qualified Dividend Income:
The London Company Income Equity | 100.00 | % | ||
Zebra Small Cap Equity | 100.00 | % |
Long-Term Capital Gain Distributions:
The London Company Income Equity | $ | 69,463,959 | ||
Zebra Small Cap Equity | - |
Short-Term Capital Gain Distributions:
The London Company Income Equity | $ | 2,512,349 | ||
Zebra Small Cap Equity | - |
Shareholders will receive notification in January 2021 of the applicable tax information necessary to prepare their 2020 income tax returns.
59
Disclosures Regarding the Approval of the Management and Investment Advisory Agreements
August 31, 2020 (Unaudited)
Renewal and Approval of Management Agreement and Investment Advisory Agreements
At meetings held on May 14, 2020 and June 3-4, 2020 (collectively, the “Meetings”) via Zoom videoconference, the Board of Trustees (“Board” or “Trustees”) considered and then, at its June 4, 2020 meeting, approved the renewal of:
(1) the Management Agreement between American Beacon Advisors, Inc. (“Manager”) and the American Beacon Funds (“Trust”), on behalf of the American Beacon The London Company Income Equity Fund (“TLC Fund”) and the American Beacon Zebra Small Cap Equity Fund (“Zebra Fund”) (each, a “Fund” and collectively, the “Funds”);
(2) the Investment Advisory Agreement among the Manager, The London Company of Virginia, LLC (“TLC”), and the Trust, on behalf of the TLC Fund; and
(3) the Investment Advisory Agreement among the Manager, Zebra Capital Management, LLC (“Zebra”), and the Trust, on behalf of the Zebra Fund.
TLC and Zebra are hereinafter each referred to as a “subadvisor” and collectively as the “subadvisors.” The Management Agreement and the Investment Advisory Agreements are referred to herein individually as an “Agreement” and collectively as the “Agreements.” In preparation for its consideration of the renewal of the Agreements, the Board undertook steps to gather and consider information furnished by the Manager, the subadvisors, Broadridge, Inc. (“Broadridge”) and Morningstar, Inc. (“Morningstar”). The Board, with the assistance of independent legal counsel, requested and received certain relevant information from the Manager and each subadvisor.
In advance of the Meetings, the Board’s Investment Committee and/or the Manager coordinated the production of information from Broadridge and Morningstar regarding the performance, fees and expenses of the Funds as well as information from the Manager and the subadvisors. At the Meetings, the Board considered the information provided in connection with the renewal process, as well as information furnished to the Board throughout the year at regular meetings of the Board and its committees. In connection with the Board’s consideration of the Agreements, the Board received and evaluated such information as they deemed necessary. This information is described below in the section summarizing the factors the Board considered in connection with its renewal and approval of the Agreements, as well as the section describing additional Board considerations with respect to each Fund.
The Board noted that the Manager provides management and administrative services to the Funds pursuant to the Management Agreement. The Board considered that many mutual funds have separate contracts governing each type of service and observed that, with respect to such mutual funds, the actual management fee rates provided by Broadridge for peer group funds reflect the combined advisory and administrative expenses, reduced by any fee waivers and/or reimbursements.
A firm may not have been able to, or opted not to, provide information in response to certain information requests, in which case the Board conducted its evaluation of the firm based on information that was provided. In such cases, the Board determined that the omission of any such information was not material to its considerations. For each Fund, the class of shares used for comparative performance purposes was the share class with the lowest expenses available for purchase by the general public, which was the R5 Class. The Board also considered that the use of R5 Class performance generally facilitates a meaningful comparison for expense and performance purposes.
Provided below is an overview of certain factors the Board considered in connection with its decision to approve the renewal of the Agreements. The Board did not identify any particular information that was most relevant to its consideration of whether to approve the renewal of each Agreement, and each Trustee may have afforded different weight to the various factors. Legal counsel to the independent Trustees provided the Board
60
Disclosures Regarding the Approval of the Management and Investment Advisory Agreements
August 31, 2020 (Unaudited)
with a memorandum regarding its responsibilities pertaining to the renewal of investment advisory contracts, such as the Agreements, and related regulatory guidelines. Based on its evaluation, the Board unanimously concluded that the terms of each Agreement were reasonable and fair and that the approval of the renewal of each Agreement was in the best interests of the Funds and their shareholders.
Considerations With Respect to the Renewal of the Management Agreement and the Investment Advisory Agreements
In determining whether to approve the renewal of the Agreements, the Board considered each Fund’s investment management and subadvisory relationships separately. In each instance, the Board considered, among other things, the following factors: (1) the nature, extent and quality of the services provided; (2) the investment performance of the Funds and the subadvisors for the Funds; (3) the costs incurred by the Manager in rendering services to the Funds and its resulting profits or losses; (4) comparisons of services and fee rates with contracts entered into by the Manager or a subadvisor or their affiliates with other clients (such as pension funds and other institutional clients); (5) the extent to which economies of scale, if any, have been taken into account in setting each fee rate schedule; (6) whether fee rate levels reflect economies of scale, if any, for the benefit of Fund investors; and (7) any other benefits derived or anticipated to be derived by the Manager or a subadvisor from its relationship with the Funds.
Nature, Extent and Quality of Services. With respect to the renewal of the Management Agreement, the Board considered, among other factors: each Fund’s long-term performance; the length of service of key investment personnel at the Manager; the cost structure of the Funds; the Manager’s culture of compliance and support that reduce risks to the Funds; the Manager’s quality of services; the Manager’s active role in monitoring and, as appropriate, recommending additional or replacement subadvisors; and the Manager’s efforts to retain key employees and maintain staffing levels.
With respect to the renewal of each Investment Advisory Agreement, the Board considered, among other factors: the level of staffing and the size of the subadvisor; the adequacy of the resources committed to the Funds by each subadvisor; the financial stability of each subadvisor; and each subadvisor’s representations regarding its compliance program. Based on the foregoing information, the Board concluded that the nature, extent and quality of the management and advisory services provided by the Manager and each subadvisor were appropriate for each Fund.
Investment Performance. The Board evaluated the comparative information provided by Broadridge and the Manager regarding the performance of each Fund relative to its Broadridge performance universe, Morningstar Category, and benchmark index, as well as the Fund’s Morningstar rating. The Board considered the information provided by Broadridge regarding its independent methodology for selecting each Fund’s Broadridge performance universe. The Board also considered that the performance universes selected by Broadridge may not provide appropriate comparisons for a Fund. In addition, the Board considered the performance reports and discussions with management at Board and Committee meetings throughout the year. The Board also evaluated the comparative information provided by each subadvisor regarding the performance of the relevant Fund relative to the performance of the Fund’s benchmark index and, with respect to the TLC Fund, a composite of similar accounts. In addition, the Board considered the Manager’s recommendation to continue to retain each subadvisor. A summary of the Board’s considerations with respect to each Fund’s performance appears below under “Additional Considerations and Conclusions with Respect to Each Fund.”
Costs of the Services Provided to the Funds and the Profits Realized by the Manager from its Relationship with the Funds. In analyzing the cost of services and profitability of the Manager, the Board considered the revenues earned and the expenses incurred by the Manager, before and after the payment of distribution-related expenses by the Manager. The profits or losses were noted at both an aggregate level for all funds within the group of mutual funds sponsored by the Manager (the “Fund Complex”) and at an individual Fund level, with the Manager earning a profit with respect to the TLC Fund and sustaining a loss with respect to the Zebra Fund before and after
61
Disclosures Regarding the Approval of the Management and Investment Advisory Agreements
August 31, 2020 (Unaudited)
the payment of distribution-related expenses by the Manager for each Fund. The Board also considered comparative information provided by the Manager regarding the Manager’s overall profitability with respect to the Fund Complex relative to the overall profitability of other firms in the mutual fund industry, as disclosed in publicly available sources. Although the Board noted that, in certain cases, the fee rates paid by other clients of the Manager are lower than the fee rates paid by the Funds, the Manager represented that, among other matters, the difference is attributable to the fact that the Manager does not perform administrative services for non-investment company clients and reflects the greater level of responsibility and regulatory requirements associated with managing the Funds.
The Board also noted that the Manager proposed to continue the expense waivers and reimbursements for the Funds that were in place during the last fiscal year. The Board further considered that, with respect to each Fund, the Management Agreement provides for the Manager to receive a management fee comprised of an annualized fee that is retained by the Manager. In addition, the Board considered that the Manager receives fees for administering and overseeing the securities lending program on behalf of each Fund. The Board also noted that certain share classes of the Funds maintain higher expense ratios in order to compensate third-party financial intermediaries.
In analyzing the fee rates charged by each subadvisor in connection with its investment advisory services to a Fund, the Board considered representations made by TLC that the TLC Fund’s subadvisory fee rate schedule generally was favorable compared to other comparable accounts, and considered representations made by Zebra that, for fee comparison purposes, Zebra does not manage any comparable client accounts and therefore could not provide fee schedules for comparable investment accounts managed by Zebra. The Board did not request profitability data from the subadvisors because the Board did not view this data as imperative to its deliberations given the arm’s-length nature of the relationship between the Manager and the subadvisors with respect to the negotiation of subadvisory fee rates. In addition, the Board noted that subadvisors may not account for their profits on an account-by-account basis and that different firms likely employ different methodologies in connection with these calculations.
Based on the foregoing information, the Board concluded that the profitability levels of the Manager were reasonable in light of the services performed by the Manager. A summary of the Board’s considerations with respect to each Fund’s fee rates is set forth below under “Additional Considerations and Conclusions with Respect to Each Fund.”
Economies of Scale. In considering the reasonableness of the management and investment advisory fees rates, the Board considered whether economies of scale will be realized as each Fund grows and whether fee rate levels reflect these economies of scale for the benefit of Fund shareholders. In this regard, the Board considered that the Manager has negotiated breakpoints with respect to each Fund’s subadvisory fee rate.
In addition, the Board noted the Manager’s representation that the Management Agreement contains fee schedule breakpoints at higher asset levels with respect to each Fund. In this regard the Board considered the Manager’s representation that no Fund’s current assets exceeded the threshold necessary to reach the first management fee breakpoint. Based on the foregoing information, the Board concluded that the Manager and subadvisor fee rate schedules for each Fund provide for a reasonable sharing of benefits from any economies of scale with each Fund.
Benefits Derived from the Relationship with the Funds. The Board considered the “fall-out” or ancillary benefits that accrue to the Manager and/or the subadvisors as a result of the advisory relationships with the Funds, including greater exposure in the marketplace with respect to the Manager’s or the subadvisors’ investment process and expanding the level of assets under management by the Manager and the subadvisors. The Board also considered that the Manager may invest the Funds’ cash balances and cash collateral provided by the borrowers of the Funds’ securities in the American Beacon U.S. Government Money Market Select Fund, which the Manager manages directly. In addition, the Board noted that TLC and Zebra benefit from soft dollar arrangements for
62
Disclosures Regarding the Approval of the Management and Investment Advisory Agreements
August 31, 2020 (Unaudited)
proprietary and/or third-party research. Based on the foregoing information, the Board concluded that the potential benefits accruing to the Manager and the subadvisors by virtue of their relationships with the Funds appear to be fair and reasonable.
Additional Considerations and Conclusions with Respect to Each Fund
The performance comparisons below were made for each Fund’s R5 Class shares in comparison to each Fund’s Broadridge performance universe and Morningstar Category. With respect to the Broadridge performance universe, the 1st Quintile represents the top 20 percent of the universe based on performance and the 5th Quintile represents the bottom 20 percent of the universe based on performance. References below to each Fund’s Broadridge performance universe are to the universe of mutual funds with a comparable investment classification/objective included in the analysis provided by Broadridge. In reviewing the performance, the Board viewed longer-term performance over a full market cycle, typically five years or longer, as the most important consideration because relative performance over shorter periods may be significantly impacted by market or economic events and not necessarily reflective of manager skill.
The expense comparisons below were made for each Fund’s R5 Class shares in comparison to each Fund’s Broadridge expense universe and Broadridge expense group, with the 1st Quintile representing the lowest 20 percent of the universe or group based on lowest total expense and the 5th Quintile representing the highest 20 percent of the universe or group based on highest total expense. References below to each Fund’s expense group and expense universe are to the respective group or universe of comparable mutual funds included in the analysis by Broadridge. A Broadridge expense group consists of the Fund and a representative sample of funds with similar operating structures and asset sizes, as selected by Broadridge. A Broadridge expense universe includes all funds with a comparable investment classification/objective and a similar operating structure as the share class of the Fund included in the Broadridge comparative information, including the expense group, and provides a broader view of expenses across the Fund’s investment classification/objective. The Board also considered each Fund’s Morningstar fee level category with the 1st Quintile representing the lowest 20 percent of the category constituents and the 5th Quintile representing the highest 20 percent of the category in terms of total expense. In reviewing expenses, the Board considered the positive impact of fee waivers and the Manager’s agreement to continue the fee waivers. In addition, information regarding the subadvisors’ use of soft dollars was requested from the Manager and was considered by the Board.
Additional Considerations and Conclusions with Respect to the American Beacon The London Company Income Equity Fund
In considering the renewal of the Agreements, the Board considered the following additional factors:
Broadridge Total Expense Analysis Excluding 12b-1 Fees and Morningstar Fee Level Ranking
Compared to Broadridge Expense Group | 1st Quintile | |
Compared to Broadridge Expense Universe | 3rd Quintile | |
Morningstar Fee Level Ranking | 3rd Quintile |
Broadridge and Morningstar Performance Analysis (five-year period ended December 31, 2019)
Compared to Broadridge Performance Universe | 2nd Quintile | |
Compared to Morningstar Category | 2nd Quintile |
The Board also considered: (1) TLC’s representation that no other clients for which TLC provides comparable services receive a lower fee; and (2) the Manager’s recommendation to continue to retain TLC.
Based on these and other considerations, the Board: (1) concluded that the fees paid to the Manager and TLC under the Agreements are fair and reasonable; and (2) determined that the TLC Fund and its shareholders would benefit from the Manager’s and TLC’s continued management of the TLC Fund.
63
Disclosures Regarding the Approval of the Management and Investment Advisory Agreements
August 31, 2020 (Unaudited)
Additional Considerations and Conclusions with Respect to the American Beacon Zebra Small Cap Equity Fund
In considering the renewal of the Agreements for the Zebra Fund, the Board considered the following additional factors:
Broadridge Total Expenses Excluding 12b-1 Fees and Morningstar Fee Level Ranking
Compared to Broadridge Expense Group | 1st Quintile | |
Compared to Broadridge Expense Universe | 2nd Quintile | |
Morningstar Fee Level Ranking – Institutional Class | 2nd Quintile |
Broadridge and Morningstar Performance Analysis (five-year period ended December 31, 2019)
Compared to Broadridge Performance Universe | 2nd Quintile | |
Compared to Morningstar Category | 2nd Quintile |
The Board also considered: (1) Zebra’s representation that it does not manage comparable accounts in the same strategy as Zebra manages the Zebra Fund; and (2) the Manager’s recommendation to continue to retain Zebra.
Based on these and other considerations, the Board: (1) concluded that the fees paid to the Manager and Zebra under the Agreements are fair and reasonable; and (2) determined that the Zebra Fund and its shareholders would benefit from the Manager’s and Zebra’s continued management of the Zebra Fund.
64
Disclosure Regarding Liquidity Risk Management Program (Unaudited)
Rule 22e-4 under the Investment Company Act of 1940, as amended (“Rule 22e-4”), requires open-end registered investment companies (other than money market funds) to adopt and implement a written liquidity risk management program that is reasonably designed to assess and manage liquidity risk. Each Fund has adopted a Liquidity Risk Management Program (the “Program”) that is designed to assess and manage liquidity risk, which is the risk that the Fund could not meet requests to redeem its shares without significant dilution of the remaining shareholders’ interests in the Fund. The Program was effective on December 1, 2018 and was approved by each Fund’s Board of Trustees (the “Board”) on March 6, 2019, in accordance with applicable Securities and Exchange Commission (“SEC”) guidance.
Pursuant to Rule 22e-4, the Program includes the following elements:
| • | Assessment, management, and periodic review of liquidity risk; |
| • | Classification of each of the Fund’s portfolio investments into one of four liquidity categories: highly liquid, moderately liquid, less liquid, and illiquid; |
| • | Determination and review of a highly liquid investment minimum for any Fund that does not primarily hold assets that are highly liquid investments; |
| ○ | Policies and procedures to respond to a shortfall in the highly liquid investment minimum, including associated reports to the Board and the SEC; |
| • | A prohibition against a Fund acquiring an illiquid investment if immediately after the acquisition the Fund would have more than 15% of its net assets invested in illiquid investments that are assets; |
| ○ | Reporting of breaches of the illiquid investment prohibition to the Board and the SEC; and |
| • | Policies and procedures regarding how and when a Fund will satisfy redemption requests by distributing portfolio securities or other assets. |
The Board has approved the designation of the Manager’s Liquidity Committee as the Program administrator with responsibility for administering the Program. Since the implementation of the Program, the Liquidity Committee has provided written reports to the Board on a quarterly basis regarding each Fund’s liquidity risk. In addition, at the Board’s March 3-4, 2020 meetings, the Board reviewed the Liquidity Committee’s written report (“Report”) that addressed the operation of the Program and assessed the adequacy and effectiveness of its implementation from the Program’s inception on December 1, 2018 through December 31, 2019 (the “review period”).
Key conclusions that the Liquidity Committee included in the Report are listed below:
| • | The Program is reasonably designed to assess and manage the Fund’s liquidity risk. |
| • | The operation of the Program was adequate during the review period. |
| • | Each Fund included in this shareholder report was deemed to primarily hold assets that are highly liquid, and no highly liquid investment minimum was recommended. |
| • | The Program was effectively implemented by the Liquidity Committee during the review period. |
| • | Administration of the Program by the Liquidity Committee continues to be appropriate. |
65
Trustees and Officers of the American Beacon FundsSM (Unaudited)
The Trustees and officers of the American Beacon Funds (the “Trust”) are listed below, together with their principal occupations during the past five years. The address of each person listed below is 220 Las Colinas Boulevard East, Suite 1200, Irving, Texas 75039. Each Trustee oversees thirty-one funds in the fund complex that includes the Trust, the American Beacon Select Funds, the American Beacon Institutional Funds Trust, the American Beacon Sound Point Enhanced Income Fund, and the American Beacon Apollo Total Return Fund. The Trust’s Statement of Additional Information contains additional information about the Trustees and is available without charge by calling 1-800-658-5811.
Name, Age | Position, Term of Office and Length of Time Served with the Trust | Principal Occupation(s) During Past 5 Years and Current Directorships | ||
| NON-INTERESTED TRUSTEES | Term | |||
Lifetime of Trust until removal, resignation or retirement* | ||||
| Gilbert G. Alvarado (50) | Trustee since 2015 | President, SJVIIF, LLC, Impact Investment Fund (2018-Present); Director, Kura MD, Inc. (local telehealth organization) (2015-2017); Senior Vice President & CFO, Sierra Health Foundation (health conversion private foundation) (2006-Present); Senior Vice President & CFO, Sierra Health Foundation: Center for Health Program Management (California public benefit corporation) (2012-Present); Director, Innovative North State (2012-2015); Director, Sacramento Regional Technology Alliance (2011-2016); Director, Valley Healthcare Staffing (2017-2018); Trustee, American Beacon Select Funds (2015-Present); Trustee, American Beacon Institutional Funds Trust (2017-Present); Trustee, American Beacon Sound Point Enhanced Income Fund (2018-Present); Trustee, American Beacon Apollo Total Return Fund (2018-Present). | ||
| Joseph B. Armes (58) | Trustee since 2015 | Director, Switchback Energy Acquisition (2019-Present); Chairman & CEO, CSW Industrials f/k/a Capital Southwest Corporation (investment company) (2015-Present); Chairman of the Board of Capital Southwest Corporation, predecessor to CSW Industrials, Inc. (2014-2017) (investment company); CEO, Capital Southwest Corporation (2013-2015); President & CEO, JBA Investment Partners (family investment vehicle) (2010-Present); Director and Chair of Audit Committee, RSP Permian (oil and gas producer) (2013-2018); Trustee, American Beacon Select Funds (2015-Present); Trustee, American Beacon Institutional Funds Trust (2017-Present); Trustee, American Beacon Sound Point Enhanced Income Fund (2018-Present); Trustee, American Beacon Apollo Total Return Fund (2018-Present). | ||
| Gerard J. Arpey (62) | Trustee since 2012 | Director, The Home Depot, Inc. (2015-Present); Partner, Emerald Creek Group (private equity firm) (2011-Present); Director, S.C. Johnson & Son, Inc. (privately held company) (2008-present); Trustee, American Beacon Select Funds (2012-Present); Trustee, American Beacon Institutional Funds Trust (2017-Present); Trustee, American Beacon Sound Point Enhanced Income Fund (2018-Present); Trustee, American Beacon Apollo Total Return Fund (2018-Present). | ||
| Brenda A. Cline (59) | Trustee since 2004 Chair since 2019 Vice Chair 2018 | Chief Financial Officer, Treasurer and Secretary, Kimbell Art Foundation (1993-Present); Director, Tyler Technologies, Inc. (public sector software solutions company) (2014-Present); Director, Range Resources Corporation (oil and natural gas company) (2015-Present); Trustee, Cushing Closed-End and Open-End Funds (2017-Present); Trustee, American Beacon Select Funds (2004-Present); ; Trustee, American Beacon Institutional Funds Trust (2017-Present); Trustee, American Beacon Sound Point Enhanced Income Fund (2018-Present); Trustee, American Beacon Apollo Total Return Fund (2018-Present). | ||
66
Trustees and Officers of the American Beacon FundsSM (Unaudited)
Name, Age | Position, Term of Office and Length of Time Served with the Trust | Principal Occupation(s) During Past 5 Years and Current Directorships | ||
| NON-INTERESTED TRUSTEES (CONT.) | Term | |||
Lifetime of Trust until removal, resignation or retirement* | ||||
| Eugene J. Duffy (66) | Trustee since 2008 | Managing Director, Global Investment Management Distribution, Mesirow Financial (2016-Present); Managing Director, Institutional Services, Intercontinental Real Estate Corporation (2014-Present); Trustee, American Beacon Select Funds (2008-Present); Trustee, American Beacon Institutional Funds Trust (2017-Present); Trustee, American Beacon Sound Point Enhanced Income Fund (2018-Present); Trustee, American Beacon Apollo Total Return Fund (2018-Present). | ||
| Claudia A. Holz (62) | Trustee since 2018 | Partner, KPMG LLP (1990-2017); Trustee, American Beacon Select Funds (2018-Present); Trustee, American Beacon Institutional Funds Trust (2018-Present); Trustee, American Beacon Sound Point Enhanced Income Fund (2018-Present); Trustee, American Beacon Apollo Total Return Fund (2018-Present). | ||
| Douglas A. Lindgren (58) | Trustee since 2018 | CEO North America, Carne Global Financial Services (2016-2017); Consultant, Carne Financial Services (2017-2019); Managing Director, IPS Investment Management and Global Head, Content Management, UBS Wealth Management (2010-2016); Trustee, American Beacon Select Funds (2018-Present); Trustee, American Beacon Institutional Funds Trust (2018-Present); Trustee, American Beacon Sound Point Enhanced Income Fund (2018-Present); Trustee, American Beacon Apollo Total Return Fund (2018-Present). | ||
| Barbara J. McKenna, CFA (57) | Trustee since 2012 | President/Managing Principal, Longfellow Investment Management Company (2005-Present); Trustee, American Beacon Select Funds (2012-Present); Trustee, American Beacon Institutional Funds Trust (2017-Present); Trustee, American Beacon Sound Point Enhanced Income Fund (2018-Present); Trustee, American Beacon Apollo Total Return Fund (2018-Present). | ||
| R. Gerald Turner (74) | Trustee since 2001 | President, Southern Methodist University (1995-Present); Director, J.C. Penney Company, Inc. (1996-2019); Director, Kronus Worldwide Inc. (chemical manufacturing) (2003-Present); Trustee, American Beacon Select Funds (2001-Present); Trustee, American Beacon Institutional Funds Trust (2017-Present); Trustee, American Beacon Sound Point Enhanced Income Fund (2018-Present); Trustee, American Beacon Apollo Total Return Fund (2018-Present). | ||
67
Trustees and Officers of the American Beacon FundsSM (Unaudited)
Name, Age | Position, Term of Office and Length of Time Served with the Trust | Principal Occupation(s) During Past 5 Years and Current Directorships | ||
| OFFICERS | Term | |||
| One Year | ||||
| Gene L. Needles, Jr. (65) | President since 2009 | President (2009-2018), CEO and Director (2009-Present), and Chairman (2018-Present), American Beacon Advisors, Inc., President (2015-2018), Director and CEO (2015-Present), and Chairman (2018-Present), Resolute Investment Holdings, LLC; President (2015-2018), Director and CEO (2015-Present), and Chairman (2018-Present),Resolute Topco, Inc.; President (2015-2018); Director, and CEO (2015-Present), and Chairman (2018-Present), Resolute Acquisition, Inc.; President (2015-2018), Director and CEO (2015-Present), Chairman (2018-Present), Resolute Investment Managers, Inc.; Director, Chairman, President and CEO, Resolute Investment Distributors (2017-Present); Director, Chairman, President and CEO; Resolute Investment Services, Inc. (2017-Present); President and CEO, Lighthouse Holdings Parent, Inc. (2009-2015); President, CEO and Director, Lighthouse Holdings, Inc. (2009-2015); Manager, President and CEO, American Private Equity Management, LLC (2012-Present); Director, Chairman, President and CEO, Alpha Quant Advisors, LLC (2016-2020); Director, ARK Investment Management LLC (2016-Present); Director, Shapiro Capital Management LLC (2017-Present); Director, Chairman and CEO, Continuous Capital, LLC (2018-Present); Director, Green Harvest Asset Management (2019-Present); Director, National Investment Services of America, LLC (2019-Present); President, American Beacon Cayman Managed Futures Strategy Fund, Ltd. (2014-Present); Director and President, American Beacon Cayman Transformational Innovation Company, LTD., (2017-2018); President, American Beacon Delaware Transformational Innovation Corporation (2017-2018); President American Beacon Cayman TargetRisk Company, Ltd. (2018-Present);Member, Investment Advisory Committee, Employees Retirement System of Texas (2017-Present); Trustee, American Beacon NextShares Trust (2015-Present); President, American Beacon Select Funds (2009-Present); President, American Beacon Institutional Funds Trust (2017-Present); President, American Beacon Sound Point Enhanced Income Fund (2018-Present); President, American Beacon Apollo Total Return Fund (2018-Present); Director, RSW Investments Holdings LLC, (2019-Present); Manager, SSI Investment Management, LLC (2019-Present). | ||
| Rosemary K. Behan (61) | VP, Secretary and Chief Legal Officer since 2006 | Vice President, Secretary and General Counsel, American Beacon Advisors, Inc. (2006-Present); Secretary, Resolute Investment Holdings, LLC (2015-Present); Secretary, Resolute Topco, Inc. (2015-Present); Secretary, Resolute Acquisition, Inc. (2015-Present); Vice President, Secretary and General Counsel, Resolute Investment Managers, Inc. (2015-Present); Secretary, Resolute Investment Distributors, Inc. (2017-Present); Vice President, Secretary and General Counsel, Resolute Investment Services, Inc. (2017-Present); Vice President and Secretary, Lighthouse Holdings Parent, Inc. (2008-2015); Vice President and Secretary, Lighthouse Holdings, Inc. (2008-2015); Secretary, American Private Equity Management, LLC (2008-Present); Secretary and General Counsel, Alpha Quant Advisors, LLC (2016-2020); Vice President and Secretary, Continuous Capital, LLC (2018-Present); Secretary, Green Harvest Asset Management (2019-Present); Secretary, American Beacon Delaware Transformational Innovation Corporation (2017-2018); Secretary, American Beacon Cayman Transformational Innovation Company, Ltd. (2017-2018); Secretary, American Beacon Cayman Managed Futures Strategy Fund, Ltd. (2014-Present); Secretary, American Beacon Cayman TargetRisk Company, Ltd (2018-Present); Chief Legal Officer, Vice President and Secretary, American Beacon Select Funds (2006-Present); Chief Legal Officer, Vice President and Secretary, American Beacon Institutional Funds Trust (2017-Present); Chief Legal Officer, Vice President and Secretary, American Beacon Sound Point Enhanced Income Fund (2018-Present); Chief Legal Officer, Vice President and Secretary American Beacon Apollo Total Return Fund (2018-Present). | ||
68
Trustees and Officers of the American Beacon FundsSM (Unaudited)
Name, Age | Position, Term of Office and Length of Time Served with the Trust | Principal Occupation(s) During Past 5 Years and Current Directorships | ||
| OFFICERS (CONT.) | Term | |||
| One Year | ||||
| Brian E. Brett (60) | VP since 2004 | Senior Vice President, Head of Distribution (2012-Present), Vice President, Director of Sales (2004-2012), American Beacon Advisors, Inc.; Senior Vice President, Resolute Investment Managers, Inc. (2017-Present); Senior Vice President, Resolute Investment Distributors, Inc. (2018-Present), Senior Vice President, Resolute Investment Services, Inc. (2018-Present); Senior Vice President, Lighthouse Holdings Parent, Inc. (2008-2015); Senior Vice President, Lighthouse Holdings, Inc. (2008-2015); Vice President, American Beacon Select Funds (2004-Present); Vice President, American Beacon Institutional Funds Trust (2017-Present); Vice President American Beacon Sound Point Enhanced Income Fund (2018-Present); Vice President American Beacon Apollo Total Return Fund (2018-Present). | ||
| Paul B. Cavazos (51) | VP since 2016 | Chief Investment Officer and Senior Vice President, American Beacon Advisors, Inc. (2016-Present); Chief Investment Officer, DTE Energy (2007-2016); Vice President, American Private Equity Management, L.L.C. (2017-Present); Vice President, American Beacon Select Funds (2016-Present); Vice President, American Beacon Institutional Funds Trust (2017-Present); Vice President American Beacon Sound Point Enhanced Income Fund (2018-Present);Vice President American Beacon Apollo Total Return Fund (2018-Present). | ||
| Erica Duncan (49) | VP Since 2011 | Vice President, American Beacon Advisors, Inc. (2011-Present); Vice President, Resolute Investment Managers (2018-Present); Vice President, Resolute Investment Services, Inc. (2018-Present); Vice President, American Beacon Select Funds (2011-Present); Vice President, American Beacon Institutional Funds Trust (2017-Present); Vice President American Beacon Sound Point Enhanced Income Fund (2018-Present); Vice President American Beacon Apollo Total Return Fund (2018-Present). | ||
| Melinda G. Heika (59) | Principal Accounting Officer since 2017 and Treasurer since 2010 | Treasurer and CFO (2010-Present), American Beacon Advisors, Inc.; Treasurer, Resolute Topco, Inc. (2015-Present); Treasurer, Resolute Investment Holdings, LLC. (2015-Present); Treasurer, Resolute Acquisition, Inc. (2015-Present); Treasurer and CFO, Resolute Investment Managers, Inc. (2017-Present); Treasurer, Resolute Investment Distributors, Inc. (2017-2017); Treasurer and CFO, Resolute Investment Services, Inc. (2015-Present); Treasurer, Lighthouse Holdings Parent Inc., (2010-2015); Treasurer, Lighthouse Holdings, Inc. (2010-2015); Treasurer, American Private Equity Management, LLC (2012-Present); Treasurer and CFO, Alpha Quant Advisors, LLC (2016-2020); Treasurer and CFO, Continuous Capital, LLC (2018-Present); Treasurer, Green Harvest Asset Management (2019-Present); Treasurer, American Beacon Cayman Transformational Innovation, Ltd. (2017-2018); Treasurer, American Beacon Delaware Transformational Innovation Corporation (2017-2018); Director and Treasurer, American Beacon Cayman Managed Futures Strategy Fund, Ltd. (2014-Present); Treasurer, American Beacon Cayman TargetRisk Company, Ltd. (2018-Present); Principal Accounting Officer (2017-Present) and Treasurer, American Beacon Select Funds (2010-Present); Principal Accounting Officer and Treasurer, American Beacon Institutional Funds Trust (2017-Present); Principal Accounting Officer and Treasurer, American Beacon Sound Point Enhanced Income Fund (2018-Present); Principal Accounting Officer and Treasurer, American Beacon Apollo Total Return Fund (2018-Present). | ||
69
Trustees and Officers of the American Beacon FundsSM (Unaudited)
Name, Age | Position, Term of Office and Length of Time Served with the Trust | Principal Occupation(s) During Past 5 Years and Current Directorships | ||
| OFFICERS (CONT.) | Term | |||
| One Year | ||||
| Terri L. McKinney (56) | VP since 2010 | Vice President (2009-Present), Managing Director (2003-2009), American Beacon Advisors, Inc.; Vice President, Resolute Investment Managers, Inc. (2017-Present); Vice President, Resolute Investment Services, Inc (2018-Present); Vice President, Alpha Quant Advisors, LLC (2016-Present); Vice President, Continuous Capital, LLC (2018-Present); Vice President, American Beacon Select Funds (2010-Present); Vice President, American Beacon Institutional Funds Trust (2017-Present); Vice President, American Beacon Sound Point Enhanced Income Fund (2018-Present); Vice President, American Beacon Apollo Total Return Fund (2018-Present). | ||
| Jeffrey K. Ringdahl (45) | VP since 2010 | Director (2015-Present), President (2018-Present), Chief Operating Officer (2010-Present), Senior Vice President (2013-2018), Vice President (2010-2013), American Beacon Advisors, Inc.; Director (2015-Present), President (2018-Present), Senior Vice Present (2015-2018), Resolute Investment Holdings, LLC; Director (2015-Present), President (2018-Present), Senior Vice President (2015-2018), Resolute Topco, Inc.; Director (2015-Present), President (2018-Present), Senior Vice President (2015-2018), Resolute Acquisition, Inc.; Director (2015-Present), President & COO (2018-Present), Senior Vice President (2015-2018), Resolute Investment Managers, Inc.; Director and Executive Vice President (2017-Present), Resolute Investment Distributors, Inc.; Director (2017-Present), President & COO (2018-Present), Executive Vice President (2017-2018), Resolute Investment Services, Inc.; Senior Vice President (2017-Present), Vice President (2012-2017), Manager (2015-Present), American Private Equity Management, LLC; Senior Vice President, Lighthouse Holdings Parent, Inc. (2013-2015); Senior Vice President, Lighthouse Holdings, Inc. (2013-2015); Trustee, American Beacon NextShares Trust (2015-Present); Director, Executive Vice President & COO, Alpha Quant Advisors, LLC (2016-2020); Director, Shapiro Capital Management, LLC (2017-Present); Director, Executive Vice President & COO, Continuous Capital, LLC (2018-Present); Director, RSW Investments Holdings LLC, (2019-Present); Manager, SSI Investment Management, LLC (2019-Present); Director, National Investment Services of America, LLC (2019-Present); Director and Vice President, American Beacon Cayman Transformational Innovation Company, Ltd., (2017-Present); Vice President, American Beacon Delaware Transformational Innovation Corporation (2017-2018); Director and Vice President, American Beacon Cayman Managed Futures Strategy Fund, Ltd. (2014-Present); Vice President, American Beacon Cayman TargetRisk Company, Ltd (2018-Present); Vice President, American Beacon Select Funds (2010-2018); Vice President, American Beacon Institutional Funds Trust (2017-Present); Vice President, American Beacon Sound Point Enhanced Income Fund (2018-Present); Vice President, American Beacon Apollo Total Return Fund (2018-Present). | ||
| Samuel J. Silver (57) | VP Since 2011 | Vice President (2011-Present), Chief Fixed Income Officer (2016-Present), American Beacon Advisors, Inc. (2011-Present); Vice President, American Beacon Select Funds (2011-Present); Vice President, American Beacon Institutional Funds Trust (2017-Present); Vice President, American Beacon Sound Point Enhanced Income Fund (2018-Present); Vice President, American Beacon Apollo Total Return Fund (2018-Present). | ||
70
Trustees and Officers of the American Beacon FundsSM (Unaudited)
Name, Age | Position, Term of Office and Length of Time Served with the Trust | Principal Occupation(s) During Past 5 Years and Current Directorships | ||
| OFFICERS (CONT.) | Term | |||
| One Year | ||||
| Christina E. Sears (48) | Chief Compliance Officer since 2004 and Asst. Secretary since 1999 | Vice President, American Beacon Advisors, Inc. (2019-Present); Chief Compliance Officer, American Beacon Advisors, Inc. (2004-Present); Vice President, Resolute Investment Managers, Inc. (2017-Present); Vice President, Resolute Investment Distributors (2017-Present); Vice President, Resolute Investment Services, Inc. (2019-Present); Chief Compliance Officer, American Private Equity Management, LLC (2012-Present); Chief Compliance Officer (2016-2019) and Vice President, Alpha Quant Advisors, LLC (2016-2020); Vice President, Continuous Capital, LLC (2018-Present); Chief Compliance Officer (2004-Present) and Assistant Secretary (1999-Present), American Beacon Select Funds; Chief Compliance Officer and Assistant Secretary, American Beacon Institutional Funds Trust (2017-Present); Chief Compliance Officer and Assistant Secretary, American Beacon Sound Point Enhanced Income Fund (2018-Present); Chief Compliance Officer and Assistant Secretary, American Beacon Apollo Total Return Fund (2018-Present). | ||
| Sonia L. Bates (63) | Asst. Treasurer since 2011 | Assistant Treasurer, American Beacon Advisors, Inc. (2011-2018); Assistant Treasurer, Lighthouse Holdings Parent Inc. (2011-2015); Assistant Treasurer, Lighthouse Holdings, Inc. (2011-2015); Assistant Treasurer, American Private Equity Management, LLC (2012-Present); Assistant Treasurer, American Beacon Cayman Transformational Innovation Company, Ltd. (2017-Present); Assistant Treasurer, American Beacon Cayman TargetRisk Company, Ltd. (2018-Present); Assistant Treasurer, American Beacon Select Funds (2011-Present); Assistant Treasurer, American Beacon Institutional Funds Trust (2017-Present); Assistant Treasurer, American Beacon Sound Point Enhanced Income Fund (2018-Present); Assistant Treasurer, American Beacon Apollo Total Return Fund (2018-Present). | ||
| Shelley D. Abrahams (45) | Assistant Secretary since 2008 | Assistant Secretary, American Beacon Select Funds (2008-Present); Assistant Secretary, American Beacon Institutional Funds Trust (2017-Present); Assistant Secretary, American Beacon Sound Point Enhanced Income Fund (2018-Present); Assistant Secretary, American Beacon Apollo Total Return Fund (2018-Present); | ||
| Rebecca L. Harris (53) | Assistant Secretary since 2010 | Vice President, American Beacon Advisors, Inc. (2011-Present); Vice President, Resolute Investment Managers, Inc. (2017-Present); Vice President, Resolute Investment Services (2015-Present); Vice President, Alpha Quant Advisors, LLC (2016-2020); Vice President, Continuous Capital, LLC (2018-Present); Assistant Secretary, American Beacon Select Funds (2010-Present); Assistant Secretary, American Beacon Institutional Funds Trust (2017-Present); Assistant Secretary, American Beacon Sound Point Enhanced Income Fund (2018-Present); Assistant Secretary, American Beacon Apollo Total Return Fund (2018-Present). | ||
| Teresa A. Oxford (62) | Assistant Secretary since 2015 | Assistant Secretary, American Beacon Advisors, Inc. (2015-Present); Assistant Secretary, Resolute Investment Distributors (2018-Present); Assistant Secretary, Resolute Investment Services (2018-Present); Assistant Secretary, Alpha Quant Advisors, LLC (2016-2020); Assistant Secretary, American Beacon Select Funds (2015-Present); Assistant Secretary, American Beacon Institutional Funds Trust (2017-Present); Assistant Secretary, American Beacon Sound Point Enhanced Income Fund (2018-Present); Assistant Secretary, American Beacon Apollo Total Return Fund (2018-Present);. | ||
* As of 11/12/2014, the Board adopted a retirement plan that requires Trustees to retire no later than the last day of the calendar year in which they reach the age of 75.
71
Privacy Policy
August 31, 2020 (Unaudited)
The American Beacon Funds recognize and respect the privacy of our shareholders. We are providing this notice to you so you will understand how shareholder information may be collected and used.
We may collect nonpublic personal information about you from one or more of the following sources:
| • | information we receive from you on applications or other forms; |
| • | information about your transactions with us or our service providers; and |
| • | information we receive from third parties. |
We do not disclose any nonpublic personal information about our customers or former customers to anyone, except as permitted by law.
We restrict access to your nonpublic personal information to those employees or service providers who need to know that information to provide products or services to you. To ensure the confidentiality of your nonpublic personal information, we maintain safeguards that comply with federal standards.
72

Delivery of Documents
eDelivery is NOW AVAILABLE - Stop traditional mail delivery and receive your shareholder reports and summary prospectus on-line. Sign up at
www.americanbeaconfunds.com
If you invest in the Fund through a financial institution, you may be able to receive the Fund’s regulatory mailings, such as the Prospectus, Annual Report and Semi-Annual Report, by e-mail. If you are interested in this option, please go to www.icsdelivery.com and search for your financial institution’s name or contact your financial institution directly.
To obtain more information about the Fund:
 |  | |
| By E-mail: | On the Internet: | |
| american_beacon.funds@ambeacon.com | Visit our website at www.americanbeaconfunds.com | |
By Telephone: Call (800) 658-5811 |
By Mail: American Beacon Funds P.O. Box 219643 Kansas City, MO 64121-9643 | |
| Availability of Quarterly Portfolio Schedules | Availability of Proxy Voting Policy and Records | |
| In addition to the Schedule of Investments provided in each semi-annual and annual report, the Fund files a complete schedule of its portfolio holdings with the Securities and Exchange Commission (“SEC”) on Form N-PORT as of the end of each fiscal quarter. The Fund’s Forms N-PORT are available on the SEC’s website at | A description of the policies and procedures the Fund uses to determine how to vote proxies relating to portfolio securities is available in the Fund’s Statement of Additional Information, which is available free of charge on the Fund’s website at | |


Fund Service Providers:
CUSTODIAN State Street Bank and Trust Company Boston, Massachusetts | TRANSFER AGENT DST Asset Manager Solutions, Inc. Quincy, Massachusetts | INDEPENDENT REGISTERED PUBLIC ACCOUNTING FIRM Ernst & Young LLP Dallas, Texas | DISTRIBUTOR Resolute Investment Distributors, Inc. Irving, Texas |
This report is prepared for shareholders of the American Beacon Funds and may be distributed to others only if preceded or accompanied by a current Prospectus or Summary Prospectus.
American Beacon Funds, American Beacon The London Company Income Equity Fund and American Beacon Zebra Small Cap Equity Fund are service marks of American Beacon Advisors, Inc.
AR 8/20

About American Beacon Advisors, Inc.
Since 1986, American Beacon Advisors, Inc. has offered a variety of products and investment advisory services to numerous institutional and retail clients, including a variety of mutual funds, corporate cash management, and separate account management.
Our clients include defined benefit plans, defined contribution plans, foundations, endowments, corporations, financial planners, and other institutional investors. With American Beacon Advisors, Inc., you can put the experience of a multi-billion dollar asset management firm to work for your company.
FUND
Investing in high-yield securities (commonly referred to as “junk bonds”), including loans, restricted securities and floating rate securities, is subject to greater levels of credit, interest rate, market and liquidity risks than investment-grade securities. Investing in foreign and emerging market securities may involve heightened risk due to currency fluctuations and economic and political risks. Investing in derivative instruments involves liquidity, credit, interest rate and market risks. Geopolitical and other events have led to market disruptions causing adverse changes in the value of investments broadly. Changes in value may be temporary or may last for extended periods. Please see the prospectus for a complete discussion of the Fund’s risks. There can be no assurances that the investment objectives of this Fund will be met.
SOUND POINT FLOATING RATE INCOME FUND
Investing in high-yield securities (commonly referred to as “junk bonds”), including loans, CLOs, restricted securities and floating rate securities, is subject to greater levels of credit, interest rate, market and liquidity risks than investment-grade securities. In addition, loans are subject to the risk that the Fund may not be able to obtain the collateral securing the loan in a timely manner, and the value of the collateral may not cover the amount owed on the loan. Geopolitical and other events have led to market disruptions causing adverse changes in the value of investments broadly. Changes in value may be temporary or may last for extended periods. Please see the prospectus for a complete discussion of the Fund’s risks. There can be no assurances that the investment objectives of this Fund will be met.
Any opinions herein, including forecasts, reflect our judgment as of the end of the reporting period and are subject to change. Each advisor’s strategies and the Fund’s portfolio composition will change depending on economic and market conditions. This report is not a complete analysis of market conditions and therefore, should not be relied upon as investment advice. Although economic and market information has been compiled from reliable sources, American Beacon Advisors, Inc. makes no representation as to the completeness or accuracy of the statements contained herein.
American Beacon Advisors | August 31, 2020 |
Contents
| 1 | ||||
| 4 | ||||
| 10 | ||||
| 11 | ||||
| 12 | ||||
| 19 | ||||
| 30 | ||||
| 33 | ||||
| 60 | ||||
| 65 | ||||
| 71 | ||||
Disclosures Regarding the Approval of the Management and Investment Advisory Agreements | 72 | |||
| 77 | ||||
| 78 | ||||
| 84 | ||||
| Back Cover | ||||
 | Dear Shareholders,
Unlike anything we’ve experienced in our lifetimes, the COVID-19 pandemic continues to have an overwhelming effect on the world’s population, economies and markets. While news reports in the first half of this reporting period highlighted the many headwinds affecting the global economy and contributing to market volatility – including the U.S. trade war with China, Brexit, disruptions in the Middle East and protests in Hong Kong – the second half of this reporting period has been dominated by headlines related to the virus:
u On March 15, the Federal Reserve cut the federal funds rate by 100 basis points (1%) to a range of 0% to 0.25%, and announced quantitative easing would be unlimited. |
| u | Also in March, the U.S. government passed a stimulus package in three phases: phase one for approximately $8.3 billion, phase two for approximately $100 billion, and phase three for approximately $2 trillion. |
| u | On April 20, the price of U.S. oil turned negative for the first time in history, closing at -$37.60 per barrel for oil deliveries in May. However, by the end of August, the average crude oil spot price – which calculates an equally weighted price for West Texas Intermediate, Brent and Dubai crude oils – was $43.44 per barrel. |
| u | Although equity markets around the world have rebounded since the lows experienced earlier this year, uncertainty and volatility remain while economies continue to feel the effects of the pandemic. In the U.S., real gross domestic product had an annualized decline of 31.7% for the second quarter – reflecting the sharpest economic contraction in modern history, although slightly less than the 32.9% initially estimated. |
| u | As of August 30, the virus had infected more than 24.8 million individuals around the world, resulting in more than 838,000 deaths. The U.S. alone accounted for more than 5.8 million confirmed cases and more than 180,000 deaths. |
Now more than ever, we recognize that fear of loss can be a powerful emotion, leading many investors to make short-term decisions subject to a variety of potential error-leading biases. Unfortunately, short-term investment decisions may derail future plans. We encourage investors to maintain focus on their long-term financial goals, working with financial professionals to make thoughtful adjustments to their changing needs.
The three Ds – direction, discipline and diversification – may help frame this conversation.
| u | Direction: Achieving your long-term financial goals requires an individualized plan of action. You may want your plan to provide some measure of protection against periods of geopolitical turmoil, economic uncertainty, market volatility and job insecurity. Your plan should be reviewed annually and be adjusted in the event your long-range needs change. |
| u | Discipline: Long-term, systematic participation in an investment portfolio requires your resolution to stay the course. Spending time in the market – rather than trying to time the market – may place you in a better position to reach your long-term financial goals. |
| u | Diversification: By investing in different investment styles and asset classes, you may be able to help mitigate financial risks across your investment portfolio. By allocating your investment portfolio according to your risk-tolerance level, you may be better positioned to weather storms and achieve your long-term financial goals. |
1
President’s Message
American Beacon has endeavored to provide investors with a disciplined approach to realizing long-term financial goals since 1986. As a manager of managers, we strive to provide investment products that may enable investors to participate during market upswings while potentially insulating against market downswings. The investment teams behind our mutual funds seek to produce consistent, long-term results rather than focus only on short-term movements in the markets. In managing our investment products, we emphasize identifying opportunities that offer the potential for long-term rewards.
Thank you for staying the course with American Beacon. For additional information about our investment products or to access your account information, please visit our website at www.americanbeaconfunds.com.
Best Regards,

Gene L. Needles, Jr.
President
American Beacon Funds
2
Global Bond Market Overview
August 31, 2020 (Unaudited)
The period began with the credit markets grinding steadily tighter through the end of calendar year 2019. U.S. investment-grade and high-yield bonds fared particularly well as the Federal Reserve’s concerns around potentially slower global growth, low inflation and lingering trade uncertainty resulted in three interest rate cuts in 2019 and provided a meaningful tailwind for risk assets. From August 31, 2019 through December 31, 2019, the ICE BofA U.S. Corporate Index (“Investment Grade”) returned 0.5%, the ICE BofA U.S. High Yield Index (“High Yield”) returned 2.9%, the S&P/LSTA Leveraged Loan Index (“Loans”) returned 2.2% and the JP Morgan Emerging Market Bond Global Diversified Index (“Emerging Market Debt”) returned 1.4%. By comparison, the ICE BofA U.S. Treasury Index (“Treasuries”) returned -1.8%.
Markets entered 2020 with a flurry of tense global headlines, which muted gains in various credit sectors. Escalating tensions between the U.S. and Iran, the initial outbreak of COVID-19 and a ramp up of U.S. presidential election rhetoric caused investors to look for the sidelines as concerns mounted. By mid-March, virus lockdowns were in place in many countries around the world, and the stampede into safe-haven assets had begun. Unlike the slow-building correction during the 2008 financial crisis, this crisis took place seemingly overnight.
In February 2020, the S&P 500 Index closed at an all-time high. However, by the end of March, it was down nearly 20% year to date and had officially entered bear-market territory. March registered declines across the board: the CBOE Volatility Index registered the highest reading since 2009; oil markets had their worst month since futures started trading in 1983 and West Texas Intermediate (“WTI”) crude oil benchmark fell 55%; the 10-year Treasury briefly traded at a record low 0.32%; Investment Grade fell 7.5%, its worst monthly performance in history; and High Yield declined nearly 12%. Spreads and yields in the high-yield and loan markets reached their widest levels since the financial crisis in 2008.
In response, the Fed implemented a far-reaching set of programs measuring in the trillions of dollars that dwarfed all previous policy accommodations. The huge wave of money led to a rapid turnaround in investor sentiment and a rebound in the markets. Congress also did its part by expanding unemployment benefits and providing financing to cash-starved companies, among other programs.
In the second quarter of 2020, High Yield was up 9.6%, Investment Grade returned 9.3% and the S&P 500 Index gained 20.5%. Several countries made progress re-opening their economies, and the corporate bond market opened with immense volume allowing issuers to raise large amounts of liquidity. Despite investors’ initial concern about the economic impact of the virus, the sheer volume of money injected into the system by the U.S. government brought risk markets back to life. Unfortunately, not all companies could be saved from the economic fallout. By period end, markets began to witness an uptick in distressed credit. As such, caution remained as periodic episodes of volatility were expected to surface in the foreseeable future.
For the 12-month period ended August 31, 2020, Investment Grade returned 7.4%, High Yield returned 3.7%, Loans returned 0.9% and Emerging Market Debt returned 2.7%. Given the record-low interest rates, Treasuries also performed well with a 7.0% return.
3
American Beacon SiM High Yield Opportunities FundSM
August 31, 2020 (Unaudited)
The Investor Class of the American Beacon SiM High Yield Opportunities Fund (the “Fund”) returned 1.91% for the 12-month period ending August 31, 2020. The Fund underperformed the ICE BofA US High Yield Index (the “Index”) which returned 3.71% during the same period.
Comparison of Change in Value of a $10,000 Investment for the Period from 2/14/2011 through 8/31/2020
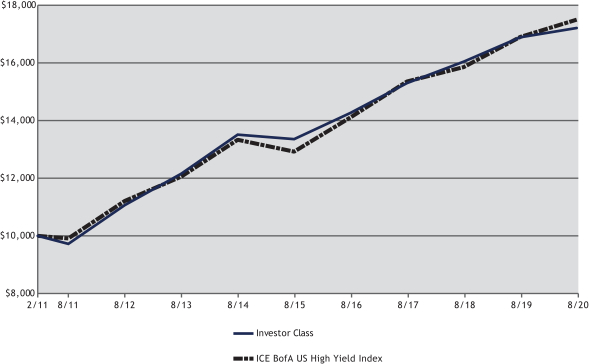
| Total Returns for the Period ended August 31, 2020 |
| |||||||||||||||||||||||||||||||
Ticker | 1 Year | 3 Years | 5 Years | Since Inception 2/14/2011 | Value of $10,000 2/14/2011- 8/31/2020 | |||||||||||||||||||||||||||
R5 Class** (1,2,4) | SHOIX | 2.39 | % | 4.38 | % | 5.58 | % | 6.25 | % | $ | 17,838 | |||||||||||||||||||||
Y Class (1,2,4) | SHOYX | 2.33 | % | 4.32 | % | 5.52 | % | 6.16 | % | $ | 17,683 | |||||||||||||||||||||
Investor Class (1,2,4) | SHYPX | 1.91 | % | 4.00 | % | 5.22 | % | 5.85 | % | $ | 17,210 | |||||||||||||||||||||
A Class with sales Charge (1,2,4) | SHOAX | (2.91 | )% | 2.25 | % | 4.12 | % | 5.23 | % | $ | 16,267 | |||||||||||||||||||||
A Class without sales charge (1,2,4) | SHOAX | 1.94 | % | 3.92 | % | 5.14 | % | 5.77 | % | $ | 17,080 | |||||||||||||||||||||
C Class with sales charge (1,2,4) | SHOCX | 0.22 | % | 3.27 | % | 4.44 | % | 5.05 | % | $ | 15,996 | |||||||||||||||||||||
C Class without sales charge (1,2,4) | SHOCX | 1.22 | % | 3.27 | % | 4.44 | % | 5.05 | % | $ | 15,996 | |||||||||||||||||||||
ICE BofA US High Yield Index (3) | 3.71 | % | 4.51 | % | 6.28 | % | 6.05 | % | $ | 17,498 | ||||||||||||||||||||||
| ** | Prior to February 28, 2020, the R5 Class was known as Institutional Class. |
| 1. | Performance shown is historical and is not indicative of future returns. Investment returns and principal value will vary, and shares may be worth more or less at redemption than at original purchase. Performance shown is calculated based on the published end of day net asset values as of date indicated, and current performance may be lower or higher than the performance data quoted. To obtain performance as of the most recent month end, please visit www.americanbeaconfunds.com or call 1-800-967-9009. Fund performance in the table above does not reflect the deduction of taxes a shareholder would pay on distributions or the redemption of shares. Generally accepted accounting principles require adjustments to be made to the net assets of the Fund at period end for financial reporting purposes only, and as such, the total return based on the unadjusted net asset value per share may differ from the total return reported in the financial highlights. A Class shares have a maximum sales charge of 4.75%. The maximum contingent deferred sales charge for the C Class is 1.00% for shares redeemed within one year of the date of purchase. |
| 2. | A portion of fees charged to the R5 Class of the Fund was waived from Fund inception through 2018 and partially recovered in 2019. Performance prior to waiving fees was lower than actual returns shown for inception through 2018. A portion of fees charged to the Investor Class of the Fund was waived in |
4
American Beacon SiM High Yield Opportunities FundSM
Performance Overview
August 31, 2020 (Unaudited)
| 2011 and 2012, partially recovered in 2013 and fully recovered in 2016. Performance prior to waiving fees was lower than actual returns shown for 2011 and 2012. A portion of fees charged to the Y Class of the Fund was waived from 2011 through 2013, fully recovered in 2015 and waived in 2016. Performance prior to waiving fees was lower than actual returns shown for 2011 through 2013 and for 2016. A portion of fees charged to the A and C Classes of the Fund was waived from 2011 through 2014, partially recovered in 2015 and fully recovered in 2016. Performance prior to waiving fees was lower than actual returns shown for 2011 through 2014. |
| 3. | The ICE BofA US High Yield Index tracks the performance of U.S. dollar denominated, below-investment-grade corporate debt publicly issued in the U.S. domestic market. Qualifying securities must have a below-investment-grade rating and an investment-grade rated country of risk. In addition, qualifying securities must have at least one year remaining term to final maturity, a fixed coupon schedule and a minimum amount outstanding of $100 million. Defaulted securities and securities eligible for the dividends-received deduction are excluded from the Index. One cannot directly invest in an index. |
| 4. | The Total Annual Fund Operating Expense ratios set forth in the most recent Fund prospectus for the R5, Y, Investor, A, and C Class shares were 0.84%, 0.91%, 1.15%, 1.17%, 1.89%, respectively. The expense ratios above may vary from the expense ratios presented in other sections of this report that are based on expenses incurred during the period covered by this report. |
From a sector allocation perspective, the Fund’s overweight to the Transportation sector and underweight to the Manufacturing sector detracted from relative performance. On the other hand, a significant overweight to the Consumer sector added to the Fund’s relative returns.
Issue selection within the Fund’s Transportation and Service sectors contributed positively to relative returns. Conversely, the Fund’s issue selection within the Manufacturing sector detracted from relative performance.
From a credit quality allocation perspective, the Fund’s underweight to the BB-rated credit category and overweight to the CC-rated credit category detracted from the Fund’s relative performance. On the other hand, an overweight to the BBB-rated and an underweight to the CCC-rated credit categories contributed positively to the Fund’s relative returns.
From a credit quality issue selection standpoint, issue selection within the BBB-rated and CC-rated credit categories contributed positively to relative performance. Security selection within the B-rated credit category somewhat offset this performance by negatively impacting the Fund’s returns.
The sub-advisor’s investment process of identifying long-term secular themes and seeking out-of-favor sectors through bottom-up fundamental research remains in place.
| Top Ten Holdings (% Net Assets) | ||||||||
| Berry Petroleum Co. LLC, 7.000%, Due 2/15/2026 | 2.5 | |||||||
| Cenovus Energy, Inc., 6.750%, Due 11/15/2039 | 2.1 | |||||||
| CES Energy Solutions Corp., 6.375%, Due 10/21/2024 | 1.7 | |||||||
| MEDNAX, Inc., 6.250%, Due 1/15/2027 | 1.7 | |||||||
| Churchill Downs, Inc., 4.750%, Due 1/15/2028 | 1.6 | |||||||
| Select Medical Corp., 6.250%, Due 8/15/2026 | 1.6 | |||||||
| William Hill PLC, 4.750%, Due 5/1/2026 | 1.5 | |||||||
| Pilgrim’s Pride Corp., 5.875%, Due 9/30/2027 | 1.5 | |||||||
| Kratos Defense & Security Solutions, Inc., 6.500%, Due 11/30/2025 | 1.5 | |||||||
| Boyd Gaming Corp., 4.750%, Due 12/1/2027 | 1.5 | |||||||
| Total Fund Holdings | 102 | |||||||
| Sector Allocation (% Investments) | ||||||||
| Consumer, Non-Cyclical | 30.2 | |||||||
| Energy | 20.6 | |||||||
| Consumer, Cyclical | 18.8 | |||||||
| Industrial | 16.3 | |||||||
| Technology | 5.6 | |||||||
| Communications | 5.5 | |||||||
| Financial | 1.5 | |||||||
| Basic Materials | 1.5 | |||||||
5
American Beacon SiM High Yield Opportunities FundSM
Performance Overview
August 31, 2020 (Unaudited)
| Country Allocation (% Fixed Income) | ||||||||
| United States | 71.5 | |||||||
| Canada | 17.5 | |||||||
| United Kingdom | 3.0 | |||||||
| Norway | 2.1 | |||||||
| Monaco | 1.4 | |||||||
| Netherlands | 1.2 | |||||||
| Brazil | 1.1 | |||||||
| Chile | 1.1 | |||||||
| Greece | 1.1 |
6
American Beacon Sound Point Floating Rate Income FundSM
Performance Overview
August 31, 2020 (Unaudited)
The Investor Class of the American Beacon Sound Point Floating Rate Income Fund (the “Fund”) returned -4.53% for the one-year period ended August 31, 2020. The Fund underperformed the Credit Suisse Leveraged Loan Index (the “Index”) return of 0.57% for the same period. For further comparison, the Fund has returned 3.84%, annualized, since inception compared to the Index return of 3.86% for the same period.
Comparison of Change in Value of a $10,000 Investment for the Period from 12/3/2012 through 8/31/2020
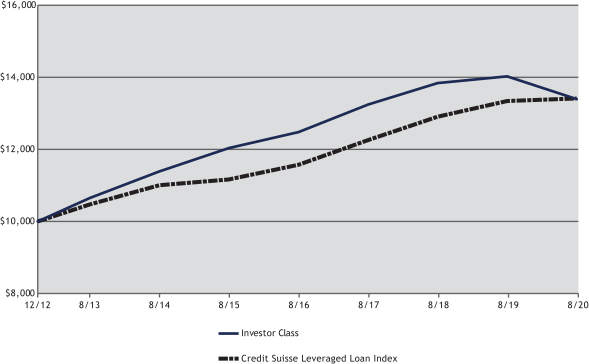
| Total Returns for the Period ended August 31, 2020 |
| |||||||||||||||||||||||||||||||
Ticker | 1 Year | 3 Years | 5 Years | Since Inception 12/3/2012 | Value of $10,000 12/3/2012- 8/31/2020 | |||||||||||||||||||||||||||
R5 Class** (1,2,6) | SPFLX | (4.08 | )% | 0.74 | % | 2.51 | % | 4.08 | % | $ | 13,626 | |||||||||||||||||||||
Y Class (1,2,3,6) | SPFYX | (4.24 | )% | 0.64 | % | 2.38 | % | 3.99 | % | $ | 13,540 | |||||||||||||||||||||
Investor Class (1,2,3,6) | SPFPX | (4.53 | )% | 0.38 | % | 2.16 | % | 3.84 | % | $ | 13,392 | |||||||||||||||||||||
A Class with sales Charge (1,2,3,6) | SOUAX | (6.90 | )% | (0.47 | )% | 1.60 | % | 3.48 | % | $ | 13,028 | |||||||||||||||||||||
A Class without sales charge (1,2,3,6) | SOUAX | (4.53 | )% | 0.39 | % | 2.12 | % | 3.82 | % | $ | 13,367 | |||||||||||||||||||||
C Class with sales charge (1,2,3,6) | SOUCX | (6.25 | )% | (0.38 | )% | 1.40 | % | 3.35 | % | $ | 12,904 | |||||||||||||||||||||
C Class without sales charge (1,2,3,6) | SOUCX | (5.25 | )% | (0.38 | )% | 1.40 | % | 3.35 | % | $ | 12,904 | |||||||||||||||||||||
SP Class (1,2,4,6) | SPFRX | (4.51 | )% | 0.39 | % | 2.18 | % | 3.82 | % | $ | 13,372 | |||||||||||||||||||||
Credit Suisse Leveraged Loan Index (5) | 0.57 | % | 3.06 | % | 3.75 | % | 3.86 | % | $ | 13,411 | ||||||||||||||||||||||
| ** | Prior to February 28, 2020, the R5 Class was known as Institutional Class. |
| 1. | Performance shown is historical and is not indicative of future returns. Investment returns and principal value will vary, and shares may be worth more or less at redemption than at original purchase. Performance shown is calculated based on the published end of day net asset values as of the date indicated, and current performance may be lower or higher than the performance data quoted. To obtain performance as of the most recent month end, please visit www.americanbeaconfunds.com or call 1-800-967-9009. Fund performance in the table above does not reflect the deduction of taxes a shareholder would pay on distributions or the redemption of shares. Generally accepted accounting principles require adjustments to be made to the net assets of the Fund at period end for financial reporting purposes only, and as such, the total return based on the unadjusted net asset value per share may differ from the total return reported in the financial highlights. A Class shares have a maximum sales charge of 2.50%. The maximum contingent deferred sales charge for the C Class is 1.00% for shares redeemed within one year of the date of purchase. |
7
American Beacon Sound Point Floating Rate Income FundSM
Performance Overview
August 31, 2020 (Unaudited)
| 2. | A portion of the fees charged to the R5 Class of the Fund was waived from Fund inception through 2017 and partially recovered in 2018 and 2019. Performance prior to waiving fees was lower than actual returns shown for Fund inception through 2017. A portion of the fees charged to the Investor Class of the Fund was waived from Fund inception through 2016 and fully recovered in 2017. Performance prior to waiving fees was lower than returns shown for inception through 2016. A portion of the fees charged to the Y Class of the Fund was waived from Fund inception through 2016 and fully recovered in 2017. Performance prior to waiving was lower than actual returns shown for inception through 2016. A portion of the fees charged to A and C Classes was waived from Fund inception through 2016, and partially recovered in 2017 and 2018. Performance prior to waiving fees was lower than actual returns shown for inception through 2016. A portion of fees charged to the SP Class of the Fund was waived from Fund inception through 2016 and partially recovered from 2017 through 2019. Performance prior to waiving fees was lower than actual returns shown for inception through 2016. |
| 3. | Fund performance represents the returns achieved by the R5 Class from 12/3/12 up to 12/11/15, the inception date of the Y, Investor, A, and C Classes and the returns of each Class since its inception. Expenses of the R5 Class are lower than the other Classes. Therefore, total returns shown may be higher than they would have been had the Y, Investor, A, and C Classes been in existence since 12/3/12. |
| 4. | Fund performance represents the returns achieved by the R5 Class from 12/3/12 up to 5/30/14, the inception date of the SP Class, and the returns of the SP Class since its inception. Expenses of the R5 Class are lower than the SP Class. Therefore, total returns shown may be higher than they would have been had the SP Class been in existence since 12/3/12. |
| 5. | The Credit Suisse Leveraged Loan Index is an index designed to mirror the investable universe of the U.S. dollar-denominated leveraged loan market. One cannot directly invest in an index. |
| 6. | The Total Annual Fund Operating Expense ratios set forth in the most recent Fund prospectus for the R5, Y, Investor, A, C and SP Class shares were 0.85%, 0.91%, 1.23%, 1.14%, 1.91% and 1.16%, respectively. The expense ratios above may vary from the expense ratios presented in other sections of this report that are based on expenses incurred during the period covered by this report. |
The Fund’s overweight positions in smaller and lower-rated issuers were the primary causes of its underperformance during the period. Within the Index, low-rated issuers were the most severely impacted by the coronavirus as industries shuttered and unemployment surged. In particular, the Fund’s overweight position in triple-C rated issues was the most adversely affected.
The Fund did, however, benefit from its traditional underweight position in the energy, commodity, and retail sectors as they were severely impacted by the virus shutdowns. Conversely, the Fund also typically avoids segments within the health care industry given their low relative value; however, they performed well during this period given the focus on healthcare services and vaccine development.
The Fund experienced certain credit events which weighed on performance. Disruptions in company transactions, such as selling or merging business segments, and contractions in consumer activity led issuers to engage in debt restructurings or negotiate with creditors for financial flexibility. While the Fund’s holdings are generally well secured by collateral of the issuer, the process of restructuring can lead to volatility, especially in unsettled markets.
The Fund’s exposure to smaller issuers also hindered performance as such companies generally have less financial flexibility during periods of market stress. While they may offer attractive risk-adjusted returns and are overlooked by investors in calm markets, they tend to lag during periods of volatility. Investors gravitated toward the largest and most-liquid issues in the Index, and relative value considerations were temporarily put on hold during the period.
The U.S. Government’s extraordinary support for the economy helped to mitigate the impact of the virus and produced a rapid recovery by period end. The large issues that investors sold for liquidity when the crisis hit were the first to recover as markets stabilized. Additionally, the new-issue market surged as markets opened for companies to raise much-needed cash at very attractive levels for investors. The Fund sought to take advantage of opportunities in the new-issue market as cash flows and trading allowed. By period end, the largest issuers had produced the highest total returns in the Index.
While the period was unusual, the Fund maintained its focus on generating higher yield and lower volatility than the Index over a market cycle. The sub-advisor continued to build a defensive portfolio with attractive risk/reward opportunities in issuers that they believe were oversold, well-capitalized and less correlated to the pandemic.
8
American Beacon Sound Point Floating Rate Income FundSM
Performance Overview
August 31, 2020 (Unaudited)
| Top Ten Holdings (% Net Assets) | ||||||||
| Mileage Plus Holdings LLC, 6.250%, Due 6/25/2027, 2020 Term Loan B, (3-mo. LIBOR + 5.250%) | 1.4 | |||||||
| VFH Parent LLC, 3.164%, Due 3/1/2026, 2019 Term Loan B, (1-mo. LIBOR + 3.000%) | 1.4 | |||||||
| LogMeIn, Inc., Due 8/14/2027, Term Loan B | 1.2 | |||||||
| ABG Intermediate Holdings LLC, 4.500%, Due 9/27/2024, 2017 1st Lien Add-On Term Loan, (3-mo. LIBOR + 3.500%) | 1.1 | |||||||
| TEN-X LLC, 5.000%, Due 9/27/2024, 1st Lien Term Loan, (1-mo. LIBOR + 4.000%) | 1.0 | |||||||
| Blount International, Inc., 4.750%, Due 4/12/2023, 2018 Term Loan B, (1-mo. LIBOR + 3.750%) | 1.0 | |||||||
| William Morris Endeavor Entertainment LLC, 9.500%, Due 5/18/2025, 2020 Term Loan B2, (1-mo. LIBOR + 8.500%) | 1.0 | |||||||
| SMB Shipping Logistics LLC, 5.000%, Due 2/2/2024, 1st Lien Term Loan, (3-mo. LIBOR + 4.000%) | 0.9 | |||||||
| Alphabet Holding Co., Inc., 3.656%, Due 9/26/2024, 2017 1st Lien Term Loan, (1-mo. LIBOR + 3.500%) | 0.9 | |||||||
| APX Group, Inc., 5.156%, Due 12/31/2025, 2020 Term Loan, (1-mo. LIBOR + 5.000%, 3-mo. PRIME + 4.000%) | 0.9 | |||||||
| Total Fund Holdings | 250 | |||||||
| Sector Allocation (% Investments) | ||||||||
| Consumer, Non-Cyclical | 18.2 | |||||||
| Consumer, Cyclical | 17.2 | |||||||
| Communications | 17.2 | |||||||
| Technology | 15.6 | |||||||
| Industrial | 13.4 | |||||||
| Financial | 10.5 | |||||||
| Basic Materials | 3.5 | |||||||
| Utilities | 1.8 | |||||||
| Energy | 1.7 | |||||||
| Diversified | 0.8 | |||||||
| Information Technology | 0.1 | |||||||
9
American Beacon FundsSM
August 31, 2020 (Unaudited)
| American Beacon SiM High Yield Opportunities Fund |
| ||||||||||||||
| Beginning Account Value 3/1/2020 | Ending Account Value 8/31/2020 | Expenses Paid During Period 3/1/2020-8/31/2020* | |||||||||||||
| R5 Class** | |||||||||||||||
| Actual | $1,000.00 | $1,020.40 | $4.32 | ||||||||||||
| Hypothetical*** | $1,000.00 | $1,020.86 | $4.32 | ||||||||||||
| Y Class | |||||||||||||||
| Actual | $1,000.00 | $1,018.90 | $4.72 | ||||||||||||
| Hypothetical*** | $1,000.00 | $1,020.46 | $4.72 | ||||||||||||
| Investor Class | |||||||||||||||
| Actual | $1,000.00 | $1,017.30 | $6.19 | ||||||||||||
| Hypothetical*** | $1,000.00 | $1,019.00 | $6.19 | ||||||||||||
| A Class | |||||||||||||||
| Actual | $1,000.00 | $1,017.60 | $5.88 | ||||||||||||
| Hypothetical*** | $1,000.00 | $1,019.31 | $5.89 | ||||||||||||
| C Class | |||||||||||||||
| Actual | $1,000.00 | $1,013.90 | $9.67 | ||||||||||||
| Hypothetical*** | $1,000.00 | $1,015.53 | $9.68 | ||||||||||||
| * | Expenses are equal to the Fund’s annualized expense ratios for the six-month period of 0.85%, 0.93%, 1.22%, 1.16%, and 1.91% for the R5, Y, Investor, A, and C Classes, respectively, multiplied by the average account value over the period, multiplied by the number derived by dividing the number of days in the most recent fiscal half-year (184) by days in the year (366) to reflect the half-year period. |
| ** | Formerly known as Institutional Class. |
| *** | 5% return before expenses. |
| American Beacon Sound Point Floating Rate Income Fund |
| ||||||||||||||
| Beginning Account Value 3/1/2020 | Ending Account Value 8/31/2020 | Expenses Paid During Period 3/1/2020-8/31/2020* | |||||||||||||
| R5 Class** | |||||||||||||||
| Actual | $1,000.00 | $954.50 | $4.32 | ||||||||||||
| Hypothetical*** | $1,000.00 | $1,020.71 | $4.47 | ||||||||||||
| Y Class | |||||||||||||||
| Actual | $1,000.00 | $953.20 | $4.71 | ||||||||||||
| Hypothetical*** | $1,000.00 | $1,020.31 | $4.88 | ||||||||||||
| Investor Class | |||||||||||||||
| Actual | $1,000.00 | $951.70 | $6.18 | ||||||||||||
| Hypothetical*** | $1,000.00 | $1,018.80 | $6.39 | ||||||||||||
| A Class | |||||||||||||||
| Actual | $1,000.00 | $951.30 | $5.69 | ||||||||||||
| Hypothetical*** | $1,000.00 | $1,019.31 | $5.89 | ||||||||||||
| C Class | |||||||||||||||
| Actual | $1,000.00 | $947.70 | $9.50 | ||||||||||||
| Hypothetical*** | $1,000.00 | $1,015.38 | $9.83 | ||||||||||||
| SP Class | |||||||||||||||
| Actual | $1,000.00 | $952.40 | $5.69 | ||||||||||||
| Hypothetical*** | $1,000.00 | $1,019.31 | $5.89 | ||||||||||||
| * | Expenses are equal to the Fund’s annualized expense ratios for the six-month period of 0.88%, 0.96%, 1.26%, 1.16%, 1.94%, and 1.16% for the R5, Y, Investor, A, C, and SP Classes, respectively, multiplied by the average account value over the period, multiplied by the number derived by dividing the number of days in the most recent fiscal half-year (184) by days in the year (366) to reflect the half-year period. |
| ** | Formerly known as Institutional Class. |
| *** | 5% return before expenses. |
10
American Beacon FundsSM
Report of Independent Registered Public Accounting Firm
To the Shareholders of American Beacon SiM High Yield Opportunities Fund and American Beacon Sound Point Floating Rate Income Fund and the Board of Trustees of American Beacon Funds
Opinion on the Financial Statements
We have audited the accompanying statements of assets and liabilities of American Beacon SiM High Yield Opportunities Fund and American Beacon Sound Point Floating Rate Income Fund (collectively referred to as the “Funds”), (two of the funds constituting American Beacon Funds (the “Trust”)), including the schedules of investments, as of August 31, 2020, and the related statements of operations for the year then ended, the statements of changes in net assets for each of the two years in the period then ended, the financial highlights for each of the five years in the period then ended and the related notes (collectively referred to as the “financial statements”). In our opinion, the financial statements present fairly, in all material respects, the financial position of each of the Funds (two of the funds constituting American Beacon Funds) at August 31, 2020, the results of their operations for the year then ended, the changes in net assets for each of the two years in the period then ended and their financial highlights for each of the five years in the period then ended, in conformity with U.S. generally accepted accounting principles.
Basis for Opinion
These financial statements are the responsibility of the Trust’s management. Our responsibility is to express an opinion on each of the Funds’ financial statements based on our audits. We are a public accounting firm registered with the Public Company Accounting Oversight Board (United States) (“PCAOB”) and are required to be independent with respect to the Trust in accordance with the U.S. federal securities laws and the applicable rules and regulations of the Securities and Exchange Commission and the PCAOB.
We conducted our audits in accordance with the standards of the PCAOB. Those standards require that we plan and perform the audit to obtain reasonable assurance about whether the financial statements are free of material misstatement, whether due to error or fraud. The Trust is not required to have, nor were we engaged to perform, an audit of the Trust’s internal control over financial reporting. As part of our audits we are required to obtain an understanding of internal control over financial reporting, but not for the purpose of expressing an opinion on the effectiveness of the Trust’s internal control over financial reporting. Accordingly, we express no such opinion.
Our audits included performing procedures to assess the risks of material misstatement of the financial statements, whether due to error or fraud, and performing procedures that respond to those risks. Such procedures included examining, on a test basis, evidence regarding the amounts and disclosures in the financial statements. Our procedures included confirmation of securities owned as of August 31, 2020, by correspondence with the custodian, brokers and agent banks or by other appropriate auditing procedures where replies from brokers or agent banks were not received. Our audits also included evaluating the accounting principles used and significant estimates made by management, as well as evaluating the overall presentation of the financial statements. We believe that our audits provide a reasonable basis for our opinion.

We have served as the auditor of one or more American Beacon investment companies since 1987.
Dallas, Texas
October 28, 2020
11
American Beacon SiM High Yield Opportunities FundSM
August 31, 2020
| Shares | Fair Value | ||||||||||||||
| COMMON STOCKS - 0.69% | |||||||||||||||
| Energy - 0.44% | |||||||||||||||
| Oil, Gas & Consumable Fuels - 0.44% | |||||||||||||||
| KNOT Offshore Partners LP | 375,592 | $ | 4,642,317 | ||||||||||||
| Pioneer Energy Services Corp.A B F | 75,602 | 821,794 | |||||||||||||
|
| ||||||||||||||
| 5,464,111 | |||||||||||||||
|
| ||||||||||||||
Total Energy | 5,464,111 | ||||||||||||||
|
| ||||||||||||||
| Financials - 0.21% | |||||||||||||||
| Mortgage Real Estate Investment Trusts (REITs) - 0.21% | |||||||||||||||
| Annaly Capital Management, Inc. | 359,000 | 2,638,650 | |||||||||||||
|
| ||||||||||||||
| Materials - 0.04% | |||||||||||||||
| Chemicals - 0.04% | |||||||||||||||
| CVR Partners LP | 566,971 | 521,556 | |||||||||||||
|
| ||||||||||||||
Total Common Stocks (Cost $12,412,533) | 8,624,317 | ||||||||||||||
|
| ||||||||||||||
| Principal Amount* | |||||||||||||||
| BANK LOAN OBLIGATIONSC - 0.24% | |||||||||||||||
| Energy - 0.24% | |||||||||||||||
| Oil & Gas - 0.24% | |||||||||||||||
| California Resources Corp., | |||||||||||||||
11.375%, Due 12/31/2021, Second Out Term Loan, (3-mo. LIBOR + 10.375%) | $ | 16,590,000 | 380,243 | ||||||||||||
5.750%, Due 12/31/2022, 2017 1st Lien Term Loan, (3-mo. LIBOR + 4.750%) | 7,100,000 | 2,565,869 | |||||||||||||
|
| ||||||||||||||
| 2,946,112 | |||||||||||||||
|
| ||||||||||||||
Total Energy | 2,946,112 | ||||||||||||||
|
| ||||||||||||||
Total Bank Loan Obligations (Cost $13,953,335) | 2,946,112 | ||||||||||||||
|
| ||||||||||||||
| CORPORATE OBLIGATIONS - 64.29% | |||||||||||||||
| Basic Materials - 1.28% | |||||||||||||||
| Chemicals - 1.28% | |||||||||||||||
| CVR Partners LP / CVR Nitrogen Finance Corp., 9.250%, Due 6/15/2023D | 16,245,000 | 15,960,713 | |||||||||||||
|
| ||||||||||||||
| Communications - 3.86% | |||||||||||||||
| Internet - 2.70% | |||||||||||||||
| Go Daddy Operating Co. LLC / GD Finance Co., Inc., 5.250%, Due 12/1/2027D | 15,760,000 | 16,745,000 | |||||||||||||
| VeriSign, Inc., 4.750%, Due 7/15/2027 | 15,940,000 | 16,976,100 | |||||||||||||
|
| ||||||||||||||
| 33,721,100 | |||||||||||||||
|
| ||||||||||||||
| Media - 0.89% | |||||||||||||||
| Diamond Sports Group LLC / Diamond Sports Finance Co., | |||||||||||||||
5.375%, Due 8/15/2026D | 3,600,000 | 2,808,000 | |||||||||||||
6.625%, Due 8/15/2027D | 14,740,000 | 8,291,250 | |||||||||||||
|
| ||||||||||||||
| 11,099,250 | |||||||||||||||
|
| ||||||||||||||
| Telecommunications - 0.27% | |||||||||||||||
| Gogo Intermediate Holdings LLC / Gogo Finance Co., Inc., 9.875%, Due 5/1/2024D | 3,189,000 | 3,316,560 | |||||||||||||
|
| ||||||||||||||
Total Communications | 48,136,910 | ||||||||||||||
|
| ||||||||||||||
| Consumer, Cyclical - 15.05% | |||||||||||||||
| Entertainment - 7.54% | |||||||||||||||
| Buena Vista Gaming Authority, 13.000%, Due 4/1/2023D | 4,654,000 | 4,467,840 | |||||||||||||
| Caesars Resort Collection LLC / CRC Finco, Inc., 5.250%, Due 10/15/2025D | 13,390,000 | 12,819,184 | |||||||||||||
See accompanying notes
12
American Beacon SiM High Yield Opportunities FundSM
Schedule of Investments
August 31, 2020
| Principal Amount* | Fair Value | ||||||||||||||
| CORPORATE OBLIGATIONS - 64.29% (continued) | |||||||||||||||
| Consumer, Cyclical - 15.05% (continued) | |||||||||||||||
| Entertainment - 7.54% (continued) | |||||||||||||||
| Churchill Downs, Inc., 4.750%, Due 1/15/2028D | $ | 19,277,000 | $ | 19,662,540 | |||||||||||
| Cinemark USA, Inc., | |||||||||||||||
5.125%, Due 12/15/2022 | 2,670,000 | 2,503,125 | |||||||||||||
4.875%, Due 6/1/2023 | 17,119,000 | 15,749,480 | |||||||||||||
| Downstream Development Authority of the Quapaw Tribe of Oklahoma, 10.500%, Due 2/15/2023D | 14,586,000 | 13,273,260 | |||||||||||||
| Live Nation Entertainment, Inc., 4.750%, Due 10/15/2027D | 13,660,000 | 12,900,094 | |||||||||||||
| Six Flags Entertainment Corp., 5.500%, Due 4/15/2027D | 12,910,000 | 12,587,250 | |||||||||||||
|
| ||||||||||||||
| 93,962,773 | |||||||||||||||
|
| ||||||||||||||
| Household Products/Wares - 1.00% | |||||||||||||||
| CD&R Smokey Buyer, Inc., 6.750%, Due 7/15/2025D | 11,669,000 | 12,485,830 | |||||||||||||
|
| ||||||||||||||
| Lodging - 3.70% | |||||||||||||||
| Boyd Gaming Corp., 4.750%, Due 12/1/2027 | 18,769,000 | 18,677,595 | |||||||||||||
| Marriott Ownership Resorts, Inc., 4.750%, Due 1/15/2028 | 6,945,000 | 6,528,300 | |||||||||||||
| Marriott Ownership Resorts, Inc. / ILG LLC, 6.500%, Due 9/15/2026 | 5,330,000 | 5,536,537 | |||||||||||||
| Station Casinos LLC, 5.000%, Due 10/1/2025D | 15,505,000 | 15,320,956 | |||||||||||||
|
| ||||||||||||||
| 46,063,388 | |||||||||||||||
|
| ||||||||||||||
| Retail - 2.81% | |||||||||||||||
| Brinker International, Inc., | |||||||||||||||
3.875%, Due 5/15/2023 | 11,135,000 | 10,856,625 | |||||||||||||
5.000%, Due 10/1/2024D | 2,420,000 | 2,407,900 | |||||||||||||
| QVC, Inc., | |||||||||||||||
5.450%, Due 8/15/2034 | 10,070,000 | 10,019,650 | |||||||||||||
5.950%, Due 3/15/2043 | 5,530,000 | 5,281,150 | |||||||||||||
| Sonic Automotive, Inc., 6.125%, Due 3/15/2027 | 6,190,000 | 6,476,288 | |||||||||||||
|
| ||||||||||||||
| 35,041,613 | |||||||||||||||
|
| ||||||||||||||
Total Consumer, Cyclical | 187,553,604 | ||||||||||||||
|
| ||||||||||||||
| Consumer, Non-Cyclical - 22.69% | |||||||||||||||
| Agriculture - 0.99% | |||||||||||||||
| Darling Ingredients, Inc., 5.250%, Due 4/15/2027D | 11,640,000 | 12,352,950 | |||||||||||||
|
| ||||||||||||||
| Commercial Services - 2.65% | |||||||||||||||
| AMN Healthcare, Inc., 4.625%, Due 10/1/2027D | 17,185,000 | 17,947,670 | |||||||||||||
| Gartner, Inc., 5.125%, Due 4/1/2025D | 14,445,000 | 15,018,467 | |||||||||||||
|
| ||||||||||||||
| 32,966,137 | |||||||||||||||
|
| ||||||||||||||
| Food - 5.23% | |||||||||||||||
| JBS USA LUX S.A. / JBS USA Food Co. / JBS USA Finance, Inc., 5.500%, Due 1/15/2030D | 16,574,000 | 18,412,391 | |||||||||||||
| Pilgrim’s Pride Corp., 5.875%, Due 9/30/2027D | 17,731,000 | 18,839,187 | |||||||||||||
| Simmons Foods, Inc., 5.750%, Due 11/1/2024D | 12,050,000 | 12,291,000 | |||||||||||||
| TreeHouse Foods, Inc., 4.000%, Due 9/1/2028 | 15,400,000 | 15,672,426 | |||||||||||||
|
| ||||||||||||||
| 65,215,004 | |||||||||||||||
|
| ||||||||||||||
| Health Care - Products - 2.21% | |||||||||||||||
| Avantor Funding, Inc., 4.625%, Due 7/15/2028D | 11,640,000 | 12,311,628 | |||||||||||||
| Teleflex, Inc., 4.625%, Due 11/15/2027 | 14,370,000 | 15,268,125 | |||||||||||||
|
| ||||||||||||||
| 27,579,753 | |||||||||||||||
|
| ||||||||||||||
| Health Care - Services - 10.24% | |||||||||||||||
| Acadia Healthcare Co., Inc., 5.500%, Due 7/1/2028D | 12,028,000 | 12,479,050 | |||||||||||||
| Charles River Laboratories International, Inc., 5.500%, Due 4/1/2026D | 14,191,000 | 14,900,550 | |||||||||||||
| HCA, Inc., 4.500%, Due 2/15/2027 | 12,596,000 | 14,393,643 | |||||||||||||
| IQVIA, Inc., 5.000%, Due 5/15/2027D | 14,710,000 | 15,483,819 | |||||||||||||
See accompanying notes
13
American Beacon SiM High Yield Opportunities FundSM
Schedule of Investments
August 31, 2020
| Principal Amount* | Fair Value | ||||||||||||||
| CORPORATE OBLIGATIONS - 64.29% (continued) | |||||||||||||||
| Consumer, Non-Cyclical - 22.69% (continued) | |||||||||||||||
| Health Care - Services - 10.24% (continued) | |||||||||||||||
| MEDNAX, Inc., 6.250%, Due 1/15/2027D | $ | 19,730,000 | $ | 20,913,800 | |||||||||||
| Select Medical Corp., 6.250%, Due 8/15/2026D | 17,985,000 | 19,320,746 | |||||||||||||
| Tenet Healthcare Corp., 4.875%, Due 1/1/2026D | 15,930,000 | 16,567,200 | |||||||||||||
| Universal Health Services, Inc., 5.000%, Due 6/1/2026D | 13,016,000 | 13,471,560 | |||||||||||||
|
| ||||||||||||||
| 127,530,368 | |||||||||||||||
|
| ||||||||||||||
| Pharmaceuticals - 1.37% | |||||||||||||||
| Elanco Animal Health, Inc., 5.900%, Due 8/28/2028 | 14,430,000 | 17,063,691 | |||||||||||||
|
| ||||||||||||||
Total Consumer, Non-Cyclical | 282,707,903 | ||||||||||||||
|
| ||||||||||||||
| Energy - 4.40% | |||||||||||||||
| Oil & Gas - 4.40% | |||||||||||||||
| Berry Petroleum Co. LLC, 7.000%, Due 2/15/2026D | 37,425,000 | 30,688,500 | |||||||||||||
| Denbury Resources, Inc., 7.750%, Due 2/15/2024D E | 12,820,000 | 6,410,000 | |||||||||||||
| Murphy Oil Corp., | |||||||||||||||
5.875%, Due 12/1/2027 | 13,100,000 | 12,584,122 | |||||||||||||
6.375%, Due 12/1/2042 | 5,975,000 | 5,108,625 | |||||||||||||
|
| ||||||||||||||
| 54,791,247 | |||||||||||||||
|
| ||||||||||||||
Total Energy | 54,791,247 | ||||||||||||||
|
| ||||||||||||||
| Financial - 1.23% | |||||||||||||||
| REITS - 1.23% | |||||||||||||||
| MPT Operating Partnership LP / MPT Finance Corp., 4.625%, Due 8/1/2029 | 14,290,000 | 15,254,003 | |||||||||||||
|
| ||||||||||||||
| Industrial - 10.31% | |||||||||||||||
| Aerospace/Defense - 1.50% | |||||||||||||||
| Kratos Defense & Security Solutions, Inc., 6.500%, Due 11/30/2025D | 17,815,000 | 18,705,750 | |||||||||||||
|
| ||||||||||||||
| Engineering & Construction - 1.05% | |||||||||||||||
| AECOM, 5.875%, Due 10/15/2024 | 11,759,000 | 13,096,586 | |||||||||||||
|
| ||||||||||||||
| Machinery - Construction & Mining - 1.29% | |||||||||||||||
| BWX Technologies, Inc., 5.375%, Due 7/15/2026D | 15,381,000 | 16,111,598 | |||||||||||||
|
| ||||||||||||||
| Machinery - Diversified - 1.40% | |||||||||||||||
| JPW Industries Holding Corp., 9.000%, Due 10/1/2024C | 18,410,000 | 17,466,250 | |||||||||||||
|
| ||||||||||||||
| Transportation - 5.07% | |||||||||||||||
| Borealis Finance LLC, 7.500%, Due 11/16/2023D | 14,410,000 | 11,528,000 | |||||||||||||
| Eagle Bulk Shipco LLC, 8.250%, Due 11/28/2022 | 16,996,697 | 16,019,387 | |||||||||||||
| Navios Maritime Acquisition Corp. / Navios Acquisition Finance US, Inc., 8.125%, Due 11/15/2021D | 23,540,000 | 15,301,000 | |||||||||||||
| Navios Maritime Holdings, Inc. / Navios Maritime Finance II US, Inc., 11.250%, Due 8/15/2022D | 17,840,000 | 13,558,400 | |||||||||||||
| Navios South American Logistics, Inc. / Navios Logistics Finance US, Inc., 10.750%, Due 7/1/2025D | 6,225,000 | 6,738,562 | |||||||||||||
|
| ||||||||||||||
| 63,145,349 | |||||||||||||||
|
| ||||||||||||||
Total Industrial | 128,525,533 | ||||||||||||||
|
| ||||||||||||||
| Technology - 5.47% | |||||||||||||||
| Computers - 3.34% | |||||||||||||||
| Booz Allen Hamilton, Inc., 3.875%, Due 9/1/2028D | 15,365,000 | 15,936,578 | |||||||||||||
| Leidos, Inc., | |||||||||||||||
7.125%, Due 7/1/2032 | 11,875,000 | 15,615,625 | |||||||||||||
5.500%, Due 7/1/2033 | 8,771,000 | 10,086,650 | |||||||||||||
|
| ||||||||||||||
| 41,638,853 | |||||||||||||||
|
| ||||||||||||||
See accompanying notes
14
American Beacon SiM High Yield Opportunities FundSM
Schedule of Investments
August 31, 2020
| Principal Amount* | Fair Value | ||||||||||||||
| CORPORATE OBLIGATIONS - 64.29% (continued) | |||||||||||||||
| Technology - 5.47% (continued) | |||||||||||||||
| Semiconductors - 2.13% | |||||||||||||||
| Entegris, Inc., 4.625%, Due 2/10/2026D | $ | 14,596,000 | $ | 15,074,895 | |||||||||||
| Qorvo, Inc., 5.500%, Due 7/15/2026 | 10,775,000 | 11,430,659 | |||||||||||||
|
| ||||||||||||||
| 26,505,554 | |||||||||||||||
|
| ||||||||||||||
Total Technology | 68,144,407 | ||||||||||||||
|
| ||||||||||||||
Total Corporate Obligations (Cost $792,661,855) | 801,074,320 | ||||||||||||||
|
| ||||||||||||||
| CONVERTIBLE OBLIGATIONS - 4.52% | |||||||||||||||
| Communications - 1.47% | |||||||||||||||
| Internet - 0.48% | |||||||||||||||
| Perficient, Inc., 1.250%, Due 08/1/2025D | 5,555,000 | 5,963,178 | |||||||||||||
|
| ||||||||||||||
| Telecommunications - 0.99% | |||||||||||||||
| Gogo, Inc., 6.000%, Due 05/15/2022 | 12,048,000 | 12,409,440 | |||||||||||||
|
| ||||||||||||||
Total Communications | 18,372,618 | ||||||||||||||
|
| ||||||||||||||
| Consumer, Cyclical - 0.33% | |||||||||||||||
| Entertainment - 0.33% | |||||||||||||||
| Cinemark Holdings, Inc., 4.500%, Due 08/15/2025D | 3,230,000 | 4,144,571 | |||||||||||||
|
| ||||||||||||||
| Consumer, Non-Cyclical - 1.06% | |||||||||||||||
| Food - 1.06% | |||||||||||||||
| Chefs’ Warehouse, Inc., 1.875%, Due 12/1/2024D | 17,830,000 | 13,183,280 | |||||||||||||
|
| ||||||||||||||
| Energy - 1.13% | |||||||||||||||
| Oil & Gas - 1.13% | |||||||||||||||
| Denbury Resources, Inc., 6.375%, Due 12/31/2024D E | 10,487,000 | 1,625,485 | |||||||||||||
| Pioneer Energy Services Corp., PIK (in-kind rate 5.000%), 5.000%, Due 11/15/2025A D F | 12,395,000 | 12,412,725 | |||||||||||||
|
| ||||||||||||||
Total Oil & Gas | 14,038,210 | ||||||||||||||
|
| ||||||||||||||
Total Energy | 14,038,210 | ||||||||||||||
|
| ||||||||||||||
| Industrial - 0.53% | |||||||||||||||
| Aerospace/Defense - 0.53% | |||||||||||||||
| Kaman Corp., 3.250%, Due 05/1/2024 | 6,485,000 | 6,615,741 | |||||||||||||
|
| ||||||||||||||
Total Convertible Obligations (Cost $63,063,064) | 56,354,420 | ||||||||||||||
|
| ||||||||||||||
| FOREIGN CONVERTIBLE OBLIGATIONS - 1.31% (Cost $16,867,143) | |||||||||||||||
| Industrial - 1.31% | |||||||||||||||
| Transportation - 1.31% | |||||||||||||||
| Scorpio Tankers, Inc., 3.000%, Due 05/15/2022 | 18,191,000 | 16,322,687 | |||||||||||||
|
| ||||||||||||||
| FOREIGN CORPORATE OBLIGATIONS - 26.17% | |||||||||||||||
| Consumer, Cyclical - 2.93% | |||||||||||||||
| Entertainment - 2.93% | |||||||||||||||
| Ladbrokes Group Finance PLC, 5.125%, Due 9/8/2023G | GBP 12,800,000 | 17,555,271 | |||||||||||||
| William Hill PLC, 4.750%, Due 5/1/2026G | GBP 14,012,000 | 18,983,779 | |||||||||||||
|
| ||||||||||||||
| 36,539,050 | |||||||||||||||
|
| ||||||||||||||
Total Consumer, Cyclical | 36,539,050 | ||||||||||||||
|
| ||||||||||||||
| Consumer, Non-Cyclical - 5.63% | |||||||||||||||
| Agriculture - 1.18% | |||||||||||||||
| Cooke Omega Investments, Inc. / Alpha VesselCo Holdings, Inc., 8.500%, Due 12/15/2022D | 14,300,000 | 14,729,000 | |||||||||||||
|
| ||||||||||||||
See accompanying notes
15
American Beacon SiM High Yield Opportunities FundSM
Schedule of Investments
August 31, 2020
| Principal Amount* | Fair Value | ||||||||||||||
| FOREIGN CORPORATE OBLIGATIONS - 26.17% (continued) | |||||||||||||||
| Consumer, Non-Cyclical - 5.63% (continued) | |||||||||||||||
| Commercial Services - 0.97% | |||||||||||||||
| Ritchie Bros Auctioneers, Inc., 5.375%, Due 1/15/2025D | $ | 11,740,000 | $ | 12,121,550 | |||||||||||
|
| ||||||||||||||
| Food - 3.48% | |||||||||||||||
| Clearwater Seafoods, Inc., 6.875%, Due 5/1/2025D | 16,285,000 | 16,488,563 | |||||||||||||
| Minerva Luxembourg S.A., 6.500%, Due 9/20/2026D | 12,725,000 | 13,456,815 | |||||||||||||
| Nova Austral S.A., 8.250%, Due 5/26/2021D G | 29,700,000 | 13,365,000 | |||||||||||||
|
| ||||||||||||||
| 43,310,378 | |||||||||||||||
|
| ||||||||||||||
Total Consumer, Non-Cyclical | 70,160,928 | ||||||||||||||
|
| ||||||||||||||
| Energy - 14.22% | |||||||||||||||
| Oil & Gas - 14.22% | |||||||||||||||
| Athabasca Oil Corp., 9.875%, Due 2/24/2022D | 34,996,000 | 13,210,990 | |||||||||||||
| Baytex Energy Corp., 8.750%, Due 4/1/2027D | 23,115,000 | 11,326,350 | |||||||||||||
| Canadian Natural Resources Ltd., | |||||||||||||||
6.450%, Due 6/30/2033 | 5,330,000 | 6,735,078 | |||||||||||||
6.250%, Due 3/15/2038 | 8,630,000 | 10,833,306 | |||||||||||||
6.750%, Due 2/1/2039 | 8,610,000 | 11,160,457 | |||||||||||||
| Cenovus Energy, Inc., | |||||||||||||||
4.250%, Due 4/15/2027 | 7,110,000 | 6,760,935 | |||||||||||||
6.750%, Due 11/15/2039 | 24,734,000 | 25,770,779 | |||||||||||||
| CES Energy Solutions Corp., 6.375%, Due 10/21/2024D | CAD 30,647,000 | 21,792,535 | |||||||||||||
| MEG Energy Corp., | |||||||||||||||
7.000%, Due 3/31/2024D | 16,330,000 | 16,207,525 | |||||||||||||
6.500%, Due 1/15/2025D | 4,150,000 | 4,233,000 | |||||||||||||
7.125%, Due 2/1/2027D | 12,005,000 | 11,486,024 | |||||||||||||
| OKEA ASA, | |||||||||||||||
6.806%, Due 6/28/2023, (3-mo. USD LIBOR + 6.500%)G H | 16,600,000 | 15,355,000 | |||||||||||||
8.750%, Due 12/11/2024 | 11,100,000 | 9,607,356 | |||||||||||||
Vermilion Energy, Inc., 5.625%, Due 3/15/2025D | 15,095,000 | 12,679,800 | |||||||||||||
|
| ||||||||||||||
| 177,159,135 | |||||||||||||||
|
| ||||||||||||||
Total Energy | 177,159,135 | ||||||||||||||
|
| ||||||||||||||
| Industrial - 3.39% | |||||||||||||||
| Machinery - Diversified - 1.20% | |||||||||||||||
| ATS Automation Tooling Systems, Inc., 6.500%, Due 6/15/2023D | 14,844,000 | 15,014,112 | |||||||||||||
|
| ||||||||||||||
| Transportation - 2.19% | |||||||||||||||
| Diana Shipping, Inc., 9.500%, Due 9/27/2023 | 14,100,000 | 13,077,750 | |||||||||||||
| MPC Container Ships Invest B.V., 5.056%, Due 9/22/2022, (3-mo. USD LIBOR + 4.750%)G H | 17,700,000 | 14,204,250 | |||||||||||||
|
| ||||||||||||||
| 27,282,000 | |||||||||||||||
|
| ||||||||||||||
Total Industrial | 42,296,112 | ||||||||||||||
|
| ||||||||||||||
Total Foreign Corporate Obligations (Cost $333,066,110) | 326,155,225 | ||||||||||||||
|
| ||||||||||||||
| Shares | |||||||||||||||
| SHORT-TERM INVESTMENTS - 1.54% (Cost $19,195,338) | |||||||||||||||
| Investment Companies - 1.54% | |||||||||||||||
| American Beacon U.S. Government Money Market Select Fund, 0.01%I J | 19,195,338 | 19,195,338 | |||||||||||||
|
| ||||||||||||||
TOTAL INVESTMENTS - 98.76% (Cost $1,251,219,378) | 1,230,672,419 | ||||||||||||||
OTHER ASSETS, NET OF LIABILITIES - 1.24% | 15,451,082 | ||||||||||||||
|
| ||||||||||||||
TOTAL NET ASSETS - 100.00% | $ | 1,246,123,501 | |||||||||||||
|
| ||||||||||||||
Percentages are stated as a percent of net assets. *In U.S. Dollars unless otherwise noted. | |||||||||||||||
A Fair valued pursuant to procedures approved by the Board of Trustees. At period end, the value of these securities amounted to $13,234,519 or 1.06% of net assets.
B Non-income producing security.
See accompanying notes
16
American Beacon SiM High Yield Opportunities FundSM
Schedule of Investments
August 31, 2020
C Bank loan obligations, unless otherwise stated, carry a floating rate of interest. The coupon rate shown on floating or adjustable rate securities represents the rate at period end.
D Security exempt from registration under the Securities Act of 1933. These securities may be resold to qualified institutional buyers pursuant to Rule 144A. At the period end, the value of these securities amounted to $754,316,431 or 60.53% of net assets. The Fund has no right to demand registration of these securities.
E Default Security. At period end, the amount of securities in default was $8,035,485 or 0.64% of net assets.
F Value was determined using significant unobservable inputs.
G Reg S - Security purchased under the Securities Act of 1933, which exempts from registration securities offered and sold outside of the United States. Such a security cannot be sold in the United States without either an effective registration statement filed pursuant to the Securities Act of 1933, or pursuant to an exemption from registration.
H Variable, floating, or adjustable rate securities with an interest rate that changes periodically. Rates are periodically reset with rates that are based on a predetermined benchmark such as a widely followed interest rate such as T-bills, LIBOR or PRIME plus a fixed spread. The interest rate disclosed reflects the rate in effect on August 31, 2020.
I The Fund is affiliated by having the same investment advisor.
J 7-day yield.
LIBOR - London Interbank Offered Rate.
LLC - Limited Liability Company.
LP - Limited Partnership.
PIK - Payment in Kind.
PLC - Public Limited Company.
PRIME - A rate, charged by banks, based on the U.S. Federal Funds rate.
REIT - Real Estate Investment Trust.
| Short Futures Contracts Open on August 31, 2020: |
| |||||||||||||
| Currency Futures Contracts | ||||||||||||||
| Description | Number of Contracts | Expiration Date | Notional Amount | Contract Value | Unrealized Appreciation (Depreciation) | |||||||||
| British Pound Currency Futures | 442 | September 2020 | $(35,158,178) | $ | (36,959,488 | ) | $ | (1,801,310 | ) | |||||
| Canadian Dollar Currency Futures | 281 | September 2020 | (21,001,674) | (21,572,370 | ) | (570,696 | ) | |||||||
|
|
|
|
| ||||||||||
| $(56,159,852) | $ | (58,531,858 | ) | $ | (2,372,006 | ) | ||||||||
|
|
|
|
| ||||||||||
| Glossary: | ||
| Currency Abbreviations: | ||
| CAD | Canadian Dollar | |
| GBP | Pound Sterling | |
| USD | United States Dollar | |
The Fund’s investments are summarized by level based on the inputs used to determine their values. As of August 31, 2020, the investments were classified as described below:
SiM High Yield Opportunities Fund | Level 1 | Level 2 | Level 3 | Total | ||||||||||||||||||||||||
| Assets | ||||||||||||||||||||||||||||
Common Stocks | $ | 7,802,523 | $ | - | $ | 821,794 | $ | 8,624,317 | ||||||||||||||||||||
Bank Loan Obligations | - | 2,946,112 | - | 2,946,112 | ||||||||||||||||||||||||
Corporate Obligations | - | 801,074,320 | - | 801,074,320 | ||||||||||||||||||||||||
Convertible Obligations | - | 43,941,695 | 12,412,725 | 56,354,420 | ||||||||||||||||||||||||
Foreign Convertible Obligations | - | 16,322,687 | - | 16,322,687 | ||||||||||||||||||||||||
Foreign Corporate Obligations | - | 326,155,225 | - | 326,155,225 | ||||||||||||||||||||||||
Short-Term Investments | 19,195,338 | - | - | 19,195,338 | ||||||||||||||||||||||||
|
|
|
|
|
|
|
| |||||||||||||||||||||
Total Investments in Securities – Assets | $ | 26,997,861 | $ | 1,190,440,039 | $ | 13,234,519 | $ | 1,230,672,419 | ||||||||||||||||||||
|
|
|
|
|
|
|
| |||||||||||||||||||||
Financial Derivative Instruments - Liabilities |
| |||||||||||||||||||||||||||
Futures Contracts | $ | (2,372,006 | ) | $ | - | $ | - | $ | (2,372,006 | ) | ||||||||||||||||||
|
|
|
|
|
|
|
| |||||||||||||||||||||
Total Financial Derivative Instruments - Liabilities | $ | (2,372,006 | ) | $ | - | $ | - | $ | (2,372,006 | ) | ||||||||||||||||||
|
|
|
|
|
|
|
| |||||||||||||||||||||
See accompanying notes
17
American Beacon SiM High Yield Opportunities FundSM
Schedule of Investments
August 31, 2020
U.S. GAAP requires transfers between all levels to/from level 3 be disclosed. During the year ended August 31, 2020, there were no transfers into or out of Level 3.
The following table is a reconciliation of Level 3 assets within the Fund for which significant unobservable inputs were used to determine fair value. Transfers in or out of Level 3 represent the ending value of any security or instrument where a change in the level has occurred from the beginning to the end of the period:
Security Type | Balance as | Purchases | Sales | Accrued | Realized | Change in | Transfer | Transfer | Balance as | Unrealized | ||||||||||||||||||||||||||||||
Common Stock | $ | - | $ | 782,481 | $ | - | $ | - | $ | - | $ | 39,313 | $ | - | $ | - | $ | 821,794 | $ | 39,313 | ||||||||||||||||||||
| Convertible Obligations | - | 11,477,000 | - | 35,602 | - | 900,123 | - | - | 12,412,725 | 900,123 | ||||||||||||||||||||||||||||||
|
|
|
|
|
|
|
|
|
|
|
|
|
|
|
|
|
|
|
| |||||||||||||||||||||
| $ | - | $ | 12,259,481 | $ | - | $ | 35,602 | $ | - | $ | 939,436 | $ | - | $ | - | $ | 13,234,519 | $ | 939,436 | |||||||||||||||||||||
|
|
|
|
|
|
|
|
|
|
|
|
|
|
|
|
|
|
|
| |||||||||||||||||||||
| ** | Change in unrealized appreciation (depreciation) attributable to Level 3 securities held at year end. This balance is included in the change in unrealized appreciation (depreciation) on the Statements of Operations. |
The following is a summary of significant unobservable inputs used in the fair valuation of the asset categorized within Level 3 of the fair value hierarchy:
| Security Type | Fair Value At 8/31/2020 | Valuation Technique | Unobservable Inputs | Input Assumptions | Fair Value at | |||||||||
Common Stock | $ | 821,794 | Enterprise Value Method | EBITDA Estimate, EBITDA Comparable, Illiquidity Discount | EBITDA Estimate, EBITDA Comparable, Illiquidity Discount(1) | 10.87 USD | ||||||||
Convertible Obligations | $ | 12,412,725 | Black Scholes Model | Common Stock Valuation Estimate, Index Derived Implied Credit Spread, Equity Volatility | Common Stock Valuation Estimate, Index Derived Implied Credit Spread, Equity Volatility(2) | 100.143 USD | ||||||||
| (1) | An EBITDA estimate for 2020 / 2021 for Pioneer was used at period end, however the EV / EBITDA multiple was revised from the prior multiple of 16.1x to 14.4x as a result of downward revisions to the enterprise values of the two comparable companies and decrease in net debt position of Pioneer. A 20% illiquidity discount has been applied to the enterprise value. An increase in EBITDA Estimates or comparables would result in an increase in the valuation and conversely a decrease in either of these unobservable inputs would result in a decrease to the valuation. An increase to the illiquidity discount would result in a decrease to the valuation and conversely a decrease in the illiquidity discount would result in a valuation increase. |
| (2) | The common stock valuation for Pioneer was estimated based on documents filed with the Chapter 11 bankruptcy court. An implied credit spread of 2250 bp was used. This credit spread corresponds to the OAS (Option Adjusted Spread) of the ICE BofA High Yield Energy Equipment & Services Index (Ticker HESN). The high yield sector spreads tightened from June to August 2020. Equity volatility of 45% was also used. An increase in the common stock valuation estimate would result in an increase in the valuation and conversely a decrease in the unobservable input would result in a decrease to the valuation. An increase in the credit spread would result in a decrease in the valuation and conversely a decrease in this unobservable input would result in an increase to the valuation. An increase in the equity volatility would result in an increase in the valuation and conversely a decrease in the unobservable input would result in a decrease in the valuation. |
See accompanying notes
18
American Beacon Sound Point Floating Rate Income FundSM
Schedule of Investments
August 31, 2020
| Shares | Fair Value | ||||||||||||||
| COMMON STOCKS - 0.04% | |||||||||||||||
| Consumer Discretionary - 0.02% | |||||||||||||||
| Commercial Services & Supplies - 0.01% | |||||||||||||||
| Constellis Holdings LLCA | 69,609 | $ | 52,207 | ||||||||||||
|
| ||||||||||||||
| Diversified Consumer Services - 0.00% | |||||||||||||||
| Tweddle Group, Inc.A B C | 2,722 | 4,137 | |||||||||||||
|
| ||||||||||||||
| Entertainment - 0.01% | |||||||||||||||
| Deluxe EntertainmentA | 102,794 | 43,687 | |||||||||||||
|
| ||||||||||||||
Total Consumer Discretionary | 100,031 | ||||||||||||||
|
| ||||||||||||||
| Energy - 0.01% | |||||||||||||||
| Oil, Gas & Consumable Fuels - 0.01% | |||||||||||||||
| Southcross Energy Partners LPA | 336,500 | 33,650 | |||||||||||||
|
| ||||||||||||||
| Financials - 0.00% | |||||||||||||||
| Diversified Financial Services - 0.00% | |||||||||||||||
| RCS 2L EscrowA B C | 667 | - | |||||||||||||
|
| ||||||||||||||
| Information Technology - 0.01% | |||||||||||||||
| Communications Equipment - 0.01% | |||||||||||||||
| 4L Technologies, Inc.A | 140,935 | 70,467 | |||||||||||||
| Internap Corp.A | 87,247 | 873 | |||||||||||||
|
| ||||||||||||||
| 71,340 | |||||||||||||||
|
| ||||||||||||||
Total Information Technology | 71,340 | ||||||||||||||
|
| ||||||||||||||
Total Common Stocks (Cost $1,894,741) | 205,021 | ||||||||||||||
|
| ||||||||||||||
| WARRANTS - 0.00% (Cost $-) | |||||||||||||||
| Materials - 0.00% | |||||||||||||||
| Euramax Holdings, Inc.A B C | 20 | - | |||||||||||||
|
| ||||||||||||||
| PREFERRED STOCKS - 0.46% | |||||||||||||||
| Energy - 0.37% | |||||||||||||||
| Oil, Gas & Consumable Fuels - 0.37% | |||||||||||||||
| Southcross Energy Partners LPA | 2,686,976 | 2,256,247 | |||||||||||||
|
| ||||||||||||||
| Information Technology - 0.09% | |||||||||||||||
| Communications Equipment - 0.09% | |||||||||||||||
| 4L Technologies, Inc.A B C | 5,113 | 511,321 | |||||||||||||
|
| ||||||||||||||
Total Preferred Stocks (Cost $2,581,476) | 2,767,568 | ||||||||||||||
|
| ||||||||||||||
| Principal Amount | |||||||||||||||
| BANK LOAN OBLIGATIONSD - 85.84% | |||||||||||||||
| Basic Materials - 3.28% | |||||||||||||||
| Chemicals - 1.95% | |||||||||||||||
| Archroma Finance SARL, 4.558%, Due 8/12/2024, USD 2017 Term Loan B2, (3-mo. LIBOR + 4.250%, 6-mo. LIBOR + 4.250%) | $ | 1,617,300 | 1,504,089 | ||||||||||||
| Ascend Performance Materials Operations LLC, 6.250%, Due 8/27/2026, 2019 Term Loan B, (3-mo. LIBOR + 5.250%) | 1,489,743 | 1,477,333 | |||||||||||||
| ASP Unifrax Holdings, Inc., 8.813%, Due 12/14/2026, 2nd Lien Term Loan, (3-mo. LIBOR + 8.500%) | 2,287,000 | 1,835,317 | |||||||||||||
| Illuminate Buyer, LLC, 4.308%, Due 6/16/2027, Term Loan, (3-mo. LIBOR + 4.000%) | 2,542,000 | 2,526,748 | |||||||||||||
See accompanying notes
19
American Beacon Sound Point Floating Rate Income FundSM
Schedule of Investments
August 31, 2020
| Principal Amount | Fair Value | ||||||||||||||
| BANK LOAN OBLIGATIONSD - 85.84% (continued) | |||||||||||||||
| Basic Materials - 3.28% (continued) | |||||||||||||||
| Chemicals - 1.95% (continued) | |||||||||||||||
| New Arclin US Holding Corp., 9.750%, Due 2/14/2025, 2nd Lien Term Loan, (1-mo. LIBOR + 8.750%) | $ | 2,720,000 | $ | 2,366,400 | |||||||||||
| Starfruit Finco B.V., 3.164%, Due 10/1/2025, 2018 USD Term Loan B, (1-mo. LIBOR + 3.000%) | 1,110,116 | 1,076,290 | |||||||||||||
| Tronox Finance LLC, 3.156%, Due 9/23/2024, Term Loan B, (1-mo. LIBOR + 3.000%) | 1,003,000 | 981,526 | |||||||||||||
|
| ||||||||||||||
| 11,767,703 | |||||||||||||||
|
| ||||||||||||||
| Forest Products & Paper - 0.42% | |||||||||||||||
| Asplundh Tree Expert, LLC, Due 8/18/2027, Term Loan BE | 2,500,000 | 2,500,775 | |||||||||||||
|
| ||||||||||||||
| Iron/Steel - 0.91% | |||||||||||||||
| Phoenix Services International LLC, 4.750%, Due 3/1/2025, Term Loan, (1-mo. LIBOR + 3.750%) | 5,825,102 | 5,479,266 | |||||||||||||
|
| ||||||||||||||
Total Basic Materials | 19,747,744 | ||||||||||||||
|
| ||||||||||||||
| Communications - 13.35% | |||||||||||||||
| Advertising - 2.00% | |||||||||||||||
| ABG Intermediate Holdings LLC, 4.500%, Due 9/27/2024, 2017 1st Lien Add-On Term Loan, (3-mo. LIBOR + 3.500%) | 7,040,029 | 6,890,428 | |||||||||||||
| Polyconcept Investments B.V., 5.500%, Due 8/16/2023, USD 2016 Term Loan B, (3-mo. LIBOR + 4.500%) | 2,681,098 | 2,111,365 | |||||||||||||
| Vestcom Parent Holdings, Inc., 5.072%, Due 12/19/2023, 2016 1st Lien Term Loan, (3-mo. LIBOR + 4.000%, 3-mo. PRIME + 3.000%) | 3,208,142 | 3,059,766 | |||||||||||||
|
| ||||||||||||||
| 12,061,559 | |||||||||||||||
|
| ||||||||||||||
| Internet - 3.17% | |||||||||||||||
| Airbnb, Inc., 8.500%, Due 4/17/2025, Term Loan, (1-mo. LIBOR + 7.500%, 3-mo. LIBOR + 7.500%) | 2,000,000 | 2,110,000 | |||||||||||||
| Ancestry.com Operations, Inc., 4.410%, Due 8/27/2026, 2019 Extended Term Loan B, (1-mo. LIBOR + 4.250%) | 2,600,681 | 2,595,479 | |||||||||||||
| EIG Investors Corp., 4.750%, Due 2/9/2023, 2018 1st Lien Term Loan, (1-mo. LIBOR + 3.750%, 3-mo. LIBOR + 3.750%) | 1,150,722 | 1,143,530 | |||||||||||||
| Internap Corp., | |||||||||||||||
11.000%, Due 5/8/2023, 2020 First Out Term Loan, (3-mo. LIBOR + 10.000%) | 130,048 | 124,846 | |||||||||||||
4.000%, Due 5/8/2025, 2020 Second Out Term Loan, PIK (in-kind rate 3.500%) | 396,210 | 217,916 | |||||||||||||
| ION Trading Technologies SARL, 5.072%, Due 11/21/2024, USD Incremental Term Loan B, (3-mo. LIBOR + 4.000%) | 1,994,801 | 1,946,706 | |||||||||||||
| ProQuest LLC, 3.656%, Due 10/23/2026, 2019 Term Loan, (1-mo. LIBOR + 3.500%) | 3,258,625 | 3,214,829 | |||||||||||||
| TEN-X LLC, 5.000%, Due 9/27/2024, 1st Lien Term Loan, (1-mo. LIBOR + 4.000%) | 6,280,289 | 5,903,472 | |||||||||||||
| Web.com Group, Inc., 3.933%, Due 10/10/2025, 2018 Term Loan B, (1-mo. LIBOR + 3.750%) | 1,931,000 | 1,862,932 | |||||||||||||
|
| ||||||||||||||
| 19,119,710 | |||||||||||||||
|
| ||||||||||||||
| Media - 3.21% | |||||||||||||||
| Cengage Learning, Inc., 5.250%, Due 6/7/2023, 2016 Term Loan B, (3-mo. LIBOR + 4.250%) | 3,490,602 | 2,866,657 | |||||||||||||
| Diamond Sports Group LLC, Due 8/24/2026, Term LoanE | 546,000 | 460,687 | |||||||||||||
| Global Eagle Entertainment, Inc., | |||||||||||||||
11.250%, Due 1/22/2021, 2020 DIP Term Loan, (1-mo. LIBOR + 10.000%) | 1,488,688 | 1,444,028 | |||||||||||||
8.725%, Due 1/6/2023, 1st Lien Term Loan, (6-mo. LIBOR + 7.500%)E | 5,605,669 | 3,613,639 | |||||||||||||
| Gray Television, Inc., 2.656%, Due 1/2/2026, 2018 Term Loan C, (1-mo. LIBOR + 2.500%) | 2,028,282 | 1,984,613 | |||||||||||||
| McGraw-Hill Global Education Holdings LLC, 5.000%, Due 5/4/2022, 2016 Term Loan B, (3-mo. LIBOR + 4.000%) | 2,492,547 | 2,145,659 | |||||||||||||
| Nexstar Broadcasting, Inc., 2.905%, Due 9/18/2026, 2019 Term Loan B4, (1-mo. LIBOR + 2.750%) | 565,000 | 553,779 | |||||||||||||
| Sinclair Television Group, Inc., 2.660%, Due 9/30/2026, Term Loan B2B, (1-mo. LIBOR + 2.500%) | 1,000,000 | 972,000 | |||||||||||||
| Springer Nature Deutschland GmbH, Due 8/14/2024, USD Term Loan B16E | 2,000,000 | 1,982,500 | |||||||||||||
| Univision Communications, Inc., Due 3/13/2026, 2020 Replacement Term LoanE | 2,000,000 | 1,952,500 | |||||||||||||
| UPC Broadband Holding B.V., | |||||||||||||||
Due 1/31/2029, 2020 USD Term Loan B1E | 684,500 | 677,826 | |||||||||||||
Due 1/31/2029, 2020 USD Term Loan B2E | 684,500 | 677,826 | |||||||||||||
|
| ||||||||||||||
| 19,331,714 | |||||||||||||||
|
| ||||||||||||||
See accompanying notes
20
American Beacon Sound Point Floating Rate Income FundSM
Schedule of Investments
August 31, 2020
| Principal Amount | Fair Value | ||||||||||||||
| BANK LOAN OBLIGATIONSD - 85.84% (continued) | |||||||||||||||
| Communications - 13.35% (continued) | |||||||||||||||
| Telecommunications - 4.97% | |||||||||||||||
| Connect Finco SARL, Due 12/11/2026, Term Loan BE | $ | 1,500,000 | $ | 1,457,820 | |||||||||||
| Global Tel*Link Corp., | |||||||||||||||
4.406%, Due 11/29/2025, 2018 1st Lien Term Loan, (1-mo. LIBOR + 4.250%) | 469,078 | 407,056 | |||||||||||||
8.406%, Due 11/29/2026, 2018 2nd Lien Term Loan, (1-mo. LIBOR + 8.250%) | 2,555,000 | 1,749,255 | |||||||||||||
| Intelsat Jackson Holdings S.A., | |||||||||||||||
6.500%, Due 7/13/2022, 2020 DIP Term Loan, (3-mo. LIBOR + 5.500%)E F | 193,218 | 196,439 | |||||||||||||
8.625%, Due 1/2/2024, 2017 Term Loan B5G | 514,000 | 518,981 | |||||||||||||
8.750%, Due 1/2/2024, 2017 Term Loan B4, (2-mo. PRIME + 5.500%) | 771,000 | 777,076 | |||||||||||||
| Iridium Satellite LLC, 4.750%, Due 11/4/2026, Term Loan, (1-mo. LIBOR + 3.750%) | 2,000,000 | 2,003,760 | |||||||||||||
| LogMeIn, Inc., Due 8/14/2027, Term Loan BE | 7,212,000 | 7,028,671 | |||||||||||||
| Maxar Technologies Ltd., 2.906%, Due 10/4/2024, Term Loan B, (1-mo. LIBOR + 2.750%) | 3,258,111 | 3,141,373 | |||||||||||||
| MLN US HoldCo LLC, | |||||||||||||||
4.656%, Due 11/30/2025, 2018 1st Lien Term Loan, (1-mo. LIBOR + 4.500%) | 1,644,740 | 1,390,841 | |||||||||||||
8.906%, Due 11/30/2026, 2018 2nd Lien Term Loan, (1-mo. LIBOR + 8.750%) | 3,985,000 | 2,011,588 | |||||||||||||
| Telesat Canada, 2.910%, Due 12/7/2026, 2019 Term Loan B5, (1-mo. LIBOR + 2.750%) | 1,660,827 | 1,604,077 | |||||||||||||
| US Telepacific Corp., 6.572%, Due 5/2/2023, 2017 Term Loan B, (3-mo. LIBOR + 5.500%) | 6,075,039 | 5,072,657 | |||||||||||||
| West Corp., | |||||||||||||||
4.500%, Due 10/10/2024, 2018 Term Loan B1, (3-mo. LIBOR + 3.500%) | 542,000 | 480,196 | |||||||||||||
5.000%, Due 10/10/2024, 2017 Term Loan, (3-mo. LIBOR + 4.000%)E | 2,313,000 | 2,064,121 | |||||||||||||
|
| ||||||||||||||
| 29,903,911 | |||||||||||||||
|
| ||||||||||||||
Total Communications | 80,416,894 | ||||||||||||||
|
| ||||||||||||||
| Consumer, Cyclical - 14.58% | |||||||||||||||
| Airlines - 1.95% | |||||||||||||||
| Delta Air Lines, Inc., 5.750%, Due 4/29/2023, 2020 Term Loan B, (3-mo. LIBOR + 4.750%) | 1,500,000 | 1,493,835 | |||||||||||||
| JetBlue Airways Corp., 6.250%, Due 6/17/2024, Term Loan, (3-mo. LIBOR + 5.250%) | 1,720,000 | 1,712,690 | |||||||||||||
| Mileage Plus Holdings LLC, 6.250%, Due 6/25/2027, 2020 Term Loan B, (3-mo. LIBOR + 5.250%) | 8,432,000 | 8,521,632 | |||||||||||||
|
| ||||||||||||||
| 11,728,157 | |||||||||||||||
|
| ||||||||||||||
| Auto Manufacturers - 0.50% | |||||||||||||||
| CTOS LLC, 4.433%, Due 4/18/2025, 2020 Term Loan B, (1-mo. LIBOR + 4.250%) | 2,878,843 | 2,844,671 | |||||||||||||
| OEConnection LLC, | |||||||||||||||
Due 9/25/2026, 2019 Delayed Draw Term LoanE F | 10,482 | 10,063 | |||||||||||||
5.072%, Due 9/25/2026, 2019 Term Loan B, (3-mo. LIBOR + 4.000%) | 166,017 | 159,376 | |||||||||||||
|
| ||||||||||||||
| 3,014,110 | |||||||||||||||
|
| ||||||||||||||
| Auto Parts & Equipment - 0.31% | |||||||||||||||
| IXS Holdings, Inc., 6.000%, Due 3/5/2027, 2020 Term Loan B, (6-mo. LIBOR + 5.000%) | 1,440,299 | 1,400,691 | |||||||||||||
| Trico Group LLC, 8.500%, Due 2/2/2024, 2020 Term Loan B, (2-mo. LIBOR + 7.500%) | 483,654 | 473,981 | |||||||||||||
|
| ||||||||||||||
| 1,874,672 | |||||||||||||||
|
| ||||||||||||||
| Distribution/Wholesale - 0.41% | |||||||||||||||
| BCPE Empire Holdings, Inc., | |||||||||||||||
4.156%, Due 6/11/2026, 2019 Delayed Draw Term Loan, (3-mo. LIBOR + 4.000%)E F | 424,533 | 410,205 | |||||||||||||
4.156%, Due 6/11/2026, 2019 Term Loan B, (1-mo. LIBOR + 4.000%) | 2,148,375 | 2,075,867 | |||||||||||||
|
| ||||||||||||||
| 2,486,072 | |||||||||||||||
|
| ||||||||||||||
| Entertainment - 3.58% | |||||||||||||||
| Allen Media LLC, 5.808%, Due 2/10/2027, 2020 Term Loan B, (3-mo. LIBOR + 5.500%) | 1,995,682 | 1,918,349 | |||||||||||||
| CDS US Intermediate Holdings, Inc., | |||||||||||||||
5.000%, Due 6/4/2021, 2020 Term Loan, (1-mo. LIBOR + 4.000%) | 481,049 | 505,102 | |||||||||||||
6.500%, Due 7/8/2022, 2017 1st Lien Term Loan, (3-mo. LIBOR + 5.500%) | 5,475,949 | 2,648,333 | |||||||||||||
9.250%, Due 7/10/2023, 2nd Lien Term Loan, (1-mo. LIBOR + 8.250%) | 5,095,796 | 764,369 | |||||||||||||
| Deluxe Entertainment Services Group, Inc., | |||||||||||||||
6.000%, Due 3/25/2024, 2019 1st Lien Term Loan, PIK (in-kind rate 1.500%)B C | 488,373 | 439,536 | |||||||||||||
7.000%, Due 9/25/2024, 2019 2nd Lien Term Loan, PIK (in-kind rate 2.500%)B C | 1,024,252 | 768,189 | |||||||||||||
| DHX Media Ltd., 5.250%, Due 12/29/2023, Term Loan B, (1-mo. LIBOR + 4.250%) | 4,093,784 | 3,868,626 | |||||||||||||
| Mohegan Tribal Gaming Authority, 7.375%, Due 10/13/2023, 2016 Term Loan B, (1-mo. LIBOR + 6.375%, 3-mo. LIBOR + 6.375%) | 5,385,499 | 4,857,397 | |||||||||||||
| William Morris Endeavor Entertainment LLC, 9.500%, Due 5/18/2025, 2020 Term Loan B2, (1-mo. LIBOR + 8.500%) | 5,969,040 | 5,789,969 | |||||||||||||
|
| ||||||||||||||
| 21,559,870 | |||||||||||||||
|
| ||||||||||||||
See accompanying notes
21
American Beacon Sound Point Floating Rate Income FundSM
Schedule of Investments
August 31, 2020
| Principal Amount | Fair Value | ||||||||||||||
| BANK LOAN OBLIGATIONSD - 85.84% (continued) | |||||||||||||||
| Consumer, Cyclical - 14.58% (continued) | |||||||||||||||
| Food Service - 0.73% | |||||||||||||||
| TKC Holdings, Inc., 4.750%, Due 2/1/2023, 2017 1st Lien Term Loan, (2-mo. LIBOR + 3.750%, 6-mo. LIBOR + 3.750%) | $ | 4,720,391 | $ | 4,419,466 | |||||||||||
|
| ||||||||||||||
| Home Furnishings - 0.73% | |||||||||||||||
| TGP Holdings LLC, 5.250%, Due 9/25/2024, 2018 1st Lien Term Loan, (3-mo. LIBOR + 4.250%) | 4,571,635 | 4,395,902 | |||||||||||||
|
| ||||||||||||||
| Leisure Time - 2.23% | |||||||||||||||
| Bombardier Recreational Products, Inc., 6.000%, Due 5/24/2027, 2020 Incremental Term Loan B2, (3-mo. LIBOR + 5.000%) | 1,612,000 | 1,638,195 | |||||||||||||
| Bulldog Purchaser, Inc., 4.822%, Due 9/5/2025, 2018 Term Loan, (6-mo. LIBOR + 3.750%) | 3,302,097 | 2,723,570 | |||||||||||||
| Callaway Golf Co., 4.662%, Due 1/2/2026, Term Loan B, (1-mo. LIBOR + 4.500%) | 1,290,512 | 1,288,099 | |||||||||||||
| Carnival Corp., 8.500%, Due 6/30/2025, USD Term Loan B, (1-mo. LIBOR + 7.500%) | 728,000 | 713,287 | |||||||||||||
| TopGolf International, Inc., 5.808%, Due 2/8/2026, Term Loan B, (3-mo. LIBOR + 5.500%) | 3,950,000 | 3,728,642 | |||||||||||||
| United PF Holdings LLC, 4.308%, Due 12/30/2026, 2019 1st Lien Term Loan, (3-mo. LIBOR + 4.000%) | 2,253,496 | 1,802,797 | |||||||||||||
| Varsity Brands, Inc., 4.500%, Due 12/15/2024, 2017 Term Loan B, (1-mo. LIBOR + 3.500%) | 1,869,212 | 1,525,744 | |||||||||||||
|
| ||||||||||||||
| 13,420,334 | |||||||||||||||
|
| ||||||||||||||
| Lodging - 0.56% | |||||||||||||||
| Caesars Resort Collection LLC, 4.703%, Due 7/21/2025, 2020 Term Loan B1, (3-mo. LIBOR + 4.500%) | 3,457,000 | 3,346,825 | |||||||||||||
|
| ||||||||||||||
| Office Furnishings - 0.06% | |||||||||||||||
| VIP Cinema Holdings, Inc., | |||||||||||||||
10.250%, Due 6/26/2020, 2020 New Money Term Loan, (3-mo. LIBOR + 8.000%)B C | 1,233,511 | 183,423 | |||||||||||||
10.250%, Due 2/24/2021, 2020 DIP Exit Term Loan, (3-mo. LIBOR + 8.000%)B C | 35,238 | 35,238 | |||||||||||||
10.250%, Due 3/1/2023, USD Term Loan B, (3-mo. PRIME + 7.000%) | 3,171,265 | 126,851 | |||||||||||||
|
| ||||||||||||||
| 345,512 | |||||||||||||||
|
| ||||||||||||||
| Retail - 3.52% | |||||||||||||||
| Bass Pro Group LLC, 6.072%, Due 9/25/2024, Term Loan B, (3-mo. LIBOR + 5.000%)E | 2,947,564 | 2,935,597 | |||||||||||||
| Fogo De Chao, Inc., 5.250%, Due 4/7/2025, 2018 Add On Term Loan, (3-mo. LIBOR + 4.250%) | 2,009,031 | 1,639,871 | |||||||||||||
| Leslie’s Poolmart, Inc., 3.656%, Due 8/16/2023, 2016 Term Loan, (1-mo. LIBOR + 3.500%) | 3,033,086 | 2,976,215 | |||||||||||||
| NPC International, Inc. | |||||||||||||||
3.000%, Due 1/21/2021, 2020 Incremental Priority Term Loan, (1-mo. LIBOR + 1.500%)E F | 1,541,883 | 1,534,174 | |||||||||||||
4.500%, Due 4/19/2024, 1st Lien Term Loan, (3-mo. LIBOR + 3.500%) | 6,798,675 | 4,767,571 | |||||||||||||
| PS HoldCo LLC, 5.750%, Due 3/13/2025, Term Loan, (1-mo. LIBOR + 4.750%) | 4,421,250 | 4,067,550 | |||||||||||||
| SP PF Buyer LLC, 4.656%, Due 12/22/2025, Term Loan, (1-mo. LIBOR + 4.500%) | 1,915,441 | 1,717,518 | |||||||||||||
| Staples, Inc., 5.251%, Due 4/16/2026, 7 Year Term Loan, (3-mo. LIBOR + 5.000%) | 1,848,640 | 1,565,188 | |||||||||||||
|
| ||||||||||||||
| 21,203,684 | |||||||||||||||
|
| ||||||||||||||
Total Consumer, Cyclical | 87,794,604 | ||||||||||||||
|
| ||||||||||||||
| Consumer, Non-Cyclical - 15.48% | |||||||||||||||
| Commercial Services - 6.86% | |||||||||||||||
| Amentum Government Services Holdings LLC, 4.156%, Due 2/1/2027, Term Loan B, (1-mo. LIBOR + 4.000%) | 2,648,000 | 2,638,070 | |||||||||||||
| APX Group, Inc., 5.156%, Due 12/31/2025, 2020 Term Loan, (1-mo. LIBOR + 5.000%, 3-mo. PRIME + 4.000%) | 5,600,888 | 5,522,139 | |||||||||||||
| Comet Bidco Ltd., 6.000%, Due 9/30/2024, 2018 USD Term Loan B, (6-mo. LIBOR + 5.000%) | 3,640,293 | 2,793,925 | |||||||||||||
| Employbridge LLC, 5.500%, Due 4/18/2025, Term Loan B, (6-mo. LIBOR + 4.500%) | 4,861,150 | 4,330,458 | |||||||||||||
| Inmar Holdings, Inc., 5.072%, Due 5/1/2024, 2017 1st Lien Term Loan, (3-mo. LIBOR + 4.000%) | 1,500,000 | 1,400,355 | |||||||||||||
| Kingpin Intermediate Holdings LLC, 4.500%, Due 7/3/2024, 2018 Term Loan B, (1-mo. LIBOR + 3.500%) | 2,093,407 | 1,725,324 | |||||||||||||
| KUEHG Corp., 4.750%, Due 2/21/2025, 2018 Incremental Term Loan, (1-mo. LIBOR + 3.750%) | 1,500,000 | 1,382,340 | |||||||||||||
| Lineage Logistics Holdings LLC, 4.000%, Due 2/27/2025, 2018 Term Loan, (1-mo. LIBOR + 3.000%) | 1,000,000 | 990,630 | |||||||||||||
| Mavis Tire Express Services Corp., 3.558%, Due 3/20/2025, 2018 1st Lien Term Loan, (3-mo. LIBOR + 3.250%) | 3,597,437 | 3,448,143 | |||||||||||||
| MRO Holdings, Inc., 5.308%, Due 6/4/2026, 2019 Term Loan B, (3-mo. LIBOR + 5.000%) | 2,450,731 | 1,789,034 | |||||||||||||
| New Constellis Borrower LLC, | |||||||||||||||
11.000%, Due 6/30/2021, 2020 Priority Term Loan, (1-mo. LIBOR + 10.000%) | 1,753,430 | 1,718,361 | |||||||||||||
8.500%, Due 3/27/2024, 2020 Term Loan, (1-mo. LIBOR + 7.500%) | 1,316,330 | 1,151,789 | |||||||||||||
12.000%, Due 3/27/2025, 2020 2nd Lien Term Loan, (1-mo. LIBOR + 11.000%) | 911,135 | 460,123 | |||||||||||||
| PAE Holding Corp., 6.500%, Due 10/20/2022, 1st Lien Term Loan, (1-mo. LIBOR + 5.500%) | 4,465,887 | 4,428,686 | |||||||||||||
See accompanying notes
22
American Beacon Sound Point Floating Rate Income FundSM
Schedule of Investments
August 31, 2020
| Principal Amount | Fair Value | ||||||||||||||
| BANK LOAN OBLIGATIONSD - 85.84% (continued) | |||||||||||||||
| Consumer, Non-Cyclical - 15.48% (continued) | |||||||||||||||
| Commercial Services - 6.86% (continued) | |||||||||||||||
| Prime Security Services Borrower LLC, 4.250%, Due 9/23/2026, 2019 Term Loan B1, (1-mo. LIBOR + 3.250%, 3-mo. LIBOR + 3.250%, 12-mo. LIBOR + 3.250%) | $ | 2,000,000 | $ | 1,991,500 | |||||||||||
| PSC Industrial Holdings Corp., 4.976%, Due 10/11/2024, 2017 1st Lien Term Loan, (3-mo. LIBOR + 3.750%) | 2,773,605 | 2,616,425 | |||||||||||||
| Sabre GLBL, Inc., 2.156%, Due 2/22/2024, 2018 Term Loan B, (1-mo. LIBOR + 2.000%)E | 1,497,955 | 1,389,623 | |||||||||||||
| Travelport Finance SARL, 10.072%, Due 5/28/2027, 2019 2nd Lien Term Loan, (3-mo. LIBOR + 9.000%) | 4,537,000 | 1,293,045 | |||||||||||||
| Tweddle Group, Inc., 5.500%, Due 9/17/2023, 2016 Term Loan, (1-mo. LIBOR + 4.500%)B C | 288,748 | 230,825 | |||||||||||||
|
| ||||||||||||||
| 41,300,795 | |||||||||||||||
|
| ||||||||||||||
| Food - 2.09% | |||||||||||||||
| Dhanani Group, Inc., 3.906%, Due 7/20/2025, 2018 Term Loan B, (1-mo. LIBOR + 3.750%) | 2,824,085 | 2,678,164 | |||||||||||||
| Froneri International PLC, 5.906%, Due 1/31/2028, 2020 USD 2nd Lien Term Loan, (1-mo. LIBOR + 5.750%) | 668,000 | 657,980 | |||||||||||||
| Hearthside Food Solutions LLC, 3.844%, Due 5/23/2025, 2018 Term Loan B, (1-mo. LIBOR + 3.688%) | 5,107,694 | 4,960,848 | |||||||||||||
| Snacking Investments Bidco Pty Ltd., 5.000%, Due 12/18/2026, Term Loan, (1-mo. LIBOR + 4.000%) | 2,854,655 | 2,816,603 | |||||||||||||
| United Natural Foods, Inc., 4.406%, Due 10/22/2025, Term Loan B, (1-mo. LIBOR + 4.250%) | 1,500,000 | 1,460,625 | |||||||||||||
|
| ||||||||||||||
| 12,574,220 | |||||||||||||||
|
| ||||||||||||||
| Health Care - Products - 0.51% | |||||||||||||||
| Athenahealth, Inc., 4.818%, Due 2/11/2026, 2019 Term Loan B, (3-mo. LIBOR + 4.500%) | 3,138,520 | 3,109,112 | |||||||||||||
|
| ||||||||||||||
| Health Care - Services - 4.68% | |||||||||||||||
| Compassus Intermediate, Inc., 6.072%, Due 12/31/2026, Term Loan B, (3-mo. LIBOR + 5.000%) | 1,231,810 | 1,216,412 | |||||||||||||
| Da Vinci Purchaser Corp., 5.238%, Due 1/8/2027, 2019 Term Loan, (3-mo. LIBOR + 4.000%) | 2,563,000 | 2,544,854 | |||||||||||||
| Envision Healthcare Corp., 3.906%, Due 10/10/2025, 2018 1st Lien Term Loan, (1-mo. LIBOR + 3.750%) | 1,737,682 | 1,254,085 | |||||||||||||
| Global Medical Response, Inc., | |||||||||||||||
4.250%, Due 4/28/2022, 2018 Term Loan B1, (3-mo. LIBOR + 3.250%) | 1,000,000 | 989,640 | |||||||||||||
5.250%, Due 3/14/2025, 2017 Term Loan B2, (3-mo. LIBOR + 4.250%) | 1,967,954 | 1,936,959 | |||||||||||||
| Keystone Acquisition Corp., 6.250%, Due 5/1/2024, 1st Lien Term Loan, (3-mo. LIBOR + 5.250%) | 2,118,729 | 1,875,075 | |||||||||||||
| Matrix Medical Network of Arizona LLC, 5.750%, Due 2/17/2025, 2018 Term Loan B, (1-mo. LIBOR + 4.750%) | 4,065,754 | 3,842,137 | |||||||||||||
| National Mentor Holdings, Inc., | |||||||||||||||
4.410%, Due 3/9/2026, 2019 Term Loan B, (1-mo. LIBOR + 4.250%) | 2,835,362 | 2,805,591 | |||||||||||||
4.410%, Due 3/9/2026, 2019 Term Loan C, (1-mo. LIBOR + 4.250%) | 129,097 | 127,742 | |||||||||||||
| Onex TSG Intermediate Corp., 5.000%, Due 7/31/2022, 1st Lien Term Loan, (3-mo. LIBOR + 4.000%) | 2,336,386 | 2,202,044 | |||||||||||||
| Phoenix Guarantor, Inc., 3.412%, Due 3/5/2026, 2020 Term Loan B, (1-mo. LIBOR + 3.250%) | 1,136,146 | 1,115,695 | |||||||||||||
| RegionalCare Hospital Partners Holdings, Inc., 3.906%, Due 11/17/2025, 2018 Term Loan B, (1-mo. LIBOR + 3.750%) | 4,518,000 | 4,424,432 | |||||||||||||
| US Renal Care, Inc., 5.188%, Due 6/26/2026, 2019 Term Loan B, (1-mo. LIBOR + 5.000%) | 2,223,400 | 2,166,881 | |||||||||||||
| WP CityMD Bidco LLC, 5.500%, Due 8/13/2026, 2019 Term Loan B, (3-mo. LIBOR + 4.500%, 6-mo. LIBOR + 4.500%) | 1,687,520 | 1,674,594 | |||||||||||||
|
| ||||||||||||||
| 28,176,141 | |||||||||||||||
|
| ||||||||||||||
| Pharmaceuticals - 1.34% | |||||||||||||||
| Alphabet Holding Co., Inc., 3.656%, Due 9/26/2024, 2017 1st Lien Term Loan, (1-mo. LIBOR + 3.500%) | 5,680,323 | 5,524,114 | |||||||||||||
| HC Group Holdings, Inc., 4.656%, Due 8/6/2026, Term Loan B, (1-mo. LIBOR + 4.500%) | 737,000 | 733,927 | |||||||||||||
| Milano Acquisition Corp, Due 8/13/2027, Term LoanE | 1,836,000 | 1,819,935 | |||||||||||||
|
| ||||||||||||||
| 8,077,976 | |||||||||||||||
|
| ||||||||||||||
Total Consumer, Non-Cyclical | 93,238,244 | ||||||||||||||
|
| ||||||||||||||
| Diversified - 0.79% | |||||||||||||||
| Holding Companies - Diversified - 0.79% | |||||||||||||||
| Emerald Expositions Holding, Inc., 2.656%, Due 5/22/2024, 2017 Term Loan B, (1-mo. LIBOR + 2.500%) | 1,500,000 | 1,353,000 | |||||||||||||
| Genesis Specialist Care Finance Ltd., 6.000%, Due 5/14/2027, 2020 USD Term Loan B, (3-mo. LIBOR + 5.000%) | 1,240,890 | 1,175,743 | |||||||||||||
See accompanying notes
23
American Beacon Sound Point Floating Rate Income FundSM
Schedule of Investments
August 31, 2020
| Principal Amount | Fair Value | ||||||||||||||
| BANK LOAN OBLIGATIONSD - 85.84% (continued) | |||||||||||||||
| Diversified - 0.79% (continued) | |||||||||||||||
| Holding Companies - Diversified - 0.79% (continued) | |||||||||||||||
| GI Revelation Acquisition LLC, 5.156%, Due 4/16/2025, 2018 1st Lien Term Loan, (1-mo. LIBOR + 5.000%) | $ | 2,368,745 | $ | 2,238,464 | |||||||||||
|
| ||||||||||||||
| 4,767,207 | |||||||||||||||
|
| ||||||||||||||
Total Diversified | 4,767,207 | ||||||||||||||
|
| ||||||||||||||
| Energy - 1.16% | |||||||||||||||
| Oil & Gas - 0.39% | |||||||||||||||
| Apergy Corp., 6.000%, Due 5/28/2027, 2020 Term Loan, (3-mo. LIBOR + 5.000%)E | 2,257,000 | 2,251,358 | |||||||||||||
| McDermott Technology Americas, Inc., 3.156%, Due 6/30/2024, 2020 Make Whole Term Loan, (1-mo. LIBOR + 3.000%) | 142,892 | 127,174 | |||||||||||||
|
| ||||||||||||||
| 2,378,532 | |||||||||||||||
|
| ||||||||||||||
| Pipelines - 0.77% | |||||||||||||||
| BCP Renaissance Parent LLC, 4.500%, Due 10/31/2024, 2017 Term Loan B, (3-mo. LIBOR + 3.500%) | 2,721,923 | 2,542,738 | |||||||||||||
| Blackstone CQP Holdco LP, 3.806%, Due 9/30/2024, Term Loan B, (3-mo. LIBOR + 3.500%) | 1,570,070 | 1,539,972 | |||||||||||||
| Southcross Energy Partners LP, Due 1/31/2025, 2020 Term LoanB C E F | 573,708 | 548,608 | |||||||||||||
|
| ||||||||||||||
| 4,631,318 | |||||||||||||||
|
| ||||||||||||||
Total Energy | 7,009,850 | ||||||||||||||
|
| ||||||||||||||
| Financial - 9.75% | |||||||||||||||
| Diversified Financial Services - 5.38% | |||||||||||||||
| 4L Holdings Corp., 8.500%, Due 2/5/2024, Takeback Term Loan, (3-mo. LIBOR + 7.500%) | 1,156,228 | 1,002,068 | |||||||||||||
| Advisor Group, Inc., 5.156%, Due 7/31/2026, 2019 Term Loan B, (1-mo. LIBOR + 5.000%) | 829,830 | 801,823 | |||||||||||||
| AqGen Ascensus, Inc., 4.000%, Due 12/3/2022, 2017 Repriced Term Loan, (3-mo. LIBOR + 4.000%) | 2,357,976 | 2,356,514 | |||||||||||||
| Citadel Securities LP, 2.906%, Due 2/27/2026, 2020 Term Loan B, (1-mo. LIBOR + 2.750%) | 3,059,991 | 3,033,216 | |||||||||||||
| Hudson River Trading LLC, 3.156%, Due 2/18/2027, 2020 Term Loan B, (1-mo. LIBOR + 3.000%)E | 2,791,318 | 2,759,916 | |||||||||||||
| IG Investment Holdings LLC, 5.000%, Due 5/23/2025, 2018 1st Lien Term Loan, (3-mo. LIBOR + 4.000%) | 2,068,751 | 2,009,274 | |||||||||||||
| Jane Street Group LLC, 3.156%, Due 1/31/2025, 2020 Term Loan, (1-mo. LIBOR + 3.000%) | 3,185,801 | 3,138,014 | |||||||||||||
| Kestra Advisor Services Holdings, Inc., 4.410%, Due 6/3/2026, 2019 Term Loan, (1-mo. LIBOR + 4.250%) | 2,420,813 | 2,357,267 | |||||||||||||
| LifeMiles Ltd., 6.500%, Due 8/18/2022, Term Loan B, (3-mo. LIBOR + 5.500%) | 1,445,116 | 1,307,830 | |||||||||||||
| Minotaur Acquisition, Inc., 5.156%, Due 3/27/2026, Term Loan B, (1-mo. LIBOR + 5.000%) | 2,388,136 | 2,274,699 | |||||||||||||
| Russell Investments US Institutional Holdco, Inc., 3.822%, Due 6/1/2023, Term Loan B, (6-mo. LIBOR + 2.750%)E | 3,000,000 | 2,972,250 | |||||||||||||
| VFH Parent LLC, 3.164%, Due 3/1/2026, 2019 Term Loan B, (1-mo. LIBOR + 3.000%)E | 8,479,703 | 8,371,078 | |||||||||||||
|
| ||||||||||||||
| 32,383,949 | |||||||||||||||
|
| ||||||||||||||
| Insurance - 2.90% | |||||||||||||||
| Amynta Agency Borrower, Inc., 4.656%, Due 2/28/2025, 2018 1st Lien Term Loan, (1-mo. LIBOR + 4.500%) | 5,989,810 | 5,385,199 | |||||||||||||
| Hyperion Insurance Group Ltd., 4.500%, Due 12/20/2024, 2017 Repriced Term Loan, (1-mo. LIBOR + 3.500%) | 3,000,000 | 2,967,090 | |||||||||||||
| Ryan Specialty Group LLC, Due 6/29/2027, Term LoanE | 1,611,000 | 1,603,960 | |||||||||||||
| Sedgwick Claims Management Services, Inc., 5.250%, Due 9/3/2026, 2020 Term Loan B3, (1-mo. LIBOR + 4.250%) | 4,138,000 | 4,119,917 | |||||||||||||
| USI, Inc., 4.308%, Due 12/2/2026, 2019 Incremental Term Loan B, (3-mo. LIBOR + 4.000%) | 3,457,625 | 3,400,712 | |||||||||||||
|
| ||||||||||||||
| 17,476,878 | |||||||||||||||
|
| ||||||||||||||
| Investment Companies - 0.24% | |||||||||||||||
| LSF9 Atlantis Holdings LLC, 7.000%, Due 5/1/2023, 2017 Term Loan, (1-mo. LIBOR + 6.000%) | 1,538,890 | 1,446,942 | |||||||||||||
|
| ||||||||||||||
| Real Estate - 0.59% | |||||||||||||||
| Cushman & Wakefield US Borrower LLC, 2.906%, Due 8/21/2025, 2020 Term Loan B, (1-mo. LIBOR + 2.750%) | 3,713,453 | 3,549,429 | |||||||||||||
|
| ||||||||||||||
| REITS - 0.64% | |||||||||||||||
| Forest City Enterprises LP, 3.656%, Due 12/8/2025, 2019 Term Loan B, (1-mo. LIBOR + 3.500%) | 3,940,000 | 3,826,725 | |||||||||||||
|
| ||||||||||||||
Total Financial | 58,683,923 | ||||||||||||||
|
| ||||||||||||||
See accompanying notes
24
American Beacon Sound Point Floating Rate Income FundSM
Schedule of Investments
August 31, 2020
| Principal Amount | Fair Value | ||||||||||||||
| BANK LOAN OBLIGATIONSD - 85.84% (continued) | |||||||||||||||
| Industrial - 11.84% | |||||||||||||||
| Aerospace/Defense - 0.54% | |||||||||||||||
| AI Convoy SARL, 4.650%, Due 1/17/2027, USD Term Loan B, (6-mo. LIBOR + 3.500%) | $ | 2,184,525 | $ | 2,129,912 | |||||||||||
| TransDigm, Inc., 2.406%, Due 8/22/2024, 2020 Term Loan G, (1-mo. LIBOR + 2.250%) | 1,197,000 | 1,134,983 | |||||||||||||
|
| ||||||||||||||
| 3,264,895 | |||||||||||||||
|
| ||||||||||||||
| Building Materials - 1.59% | |||||||||||||||
| ACProducts, Inc., 7.500%, Due 8/18/2025, 2020 Term Loan B, (3-mo. LIBOR + 6.500%) | 3,862,706 | 3,865,140 | |||||||||||||
| Airxcel, Inc., 4.688%, Due 4/28/2025, 2018 1st Lien Term Loan, (2-mo. LIBOR + 4.500%) | 2,855,781 | 2,577,342 | |||||||||||||
| NCI Building Systems, Inc., 3.918%, Due 4/12/2025, 2018 Term Loan, (1-mo. LIBOR + 3.750%) | 2,178,405 | 2,134,837 | |||||||||||||
| Quikrete Holdings, Inc., 2.656%, Due 2/1/2027, 2016 1st Lien Term Loan, (1-mo. LIBOR + 2.500%) | 1,000,000 | 973,210 | |||||||||||||
|
| ||||||||||||||
| 9,550,529 | |||||||||||||||
|
| ||||||||||||||
| Electronics - 1.43% | |||||||||||||||
| Deliver Buyer, Inc., 6.000%, Due 5/1/2024, Term Loan B, (3-mo. LIBOR + 5.000%) | 2,915,248 | 2,856,943 | |||||||||||||
| NorthPole Newco SARL, 7.308%, Due 3/18/2025, Term Loan, (3-mo. LIBOR + 7.000%) | 5,612,622 | 5,065,391 | |||||||||||||
| Tech Data Corp., 3.656%, Due 6/30/2025, ABL Term Loan, (1-mo. LIBOR + 3.500%) | 669,000 | 669,669 | |||||||||||||
|
| ||||||||||||||
| 8,592,003 | |||||||||||||||
|
| ||||||||||||||
| Engineering & Construction - 1.75% | |||||||||||||||
| Atlantic Aviation FBO, Inc., 3.910%, Due 12/6/2025, 2018 Term Loan B, (1-mo. LIBOR + 3.750%) | 2,000,000 | 1,957,500 | |||||||||||||
| Brand Energy & Infrastructure Services, Inc., 5.250%, Due 6/21/2024, 2017 Term Loan, (2-mo. LIBOR + 4.250%) | 1,472,000 | 1,354,240 | |||||||||||||
| PowerTeam Services LLC, Due 3/6/2025, 2018 1st Lien Term LoanE | 2,424,000 | 2,339,911 | |||||||||||||
| Q Holding Co., 6.000%, Due 12/31/2023, 2019 Term Loan B, (3-mo. LIBOR + 5.000%) | 4,650,994 | 4,092,875 | |||||||||||||
| Tutor Perini Corp., Due 8/13/2027, Term Loan BE | 769,000 | 756,504 | |||||||||||||
|
| ||||||||||||||
| 10,501,030 | |||||||||||||||
|
| ||||||||||||||
| Machinery - Construction & Mining - 0.16% | |||||||||||||||
| Brookfield WEC Holdings, Inc., Due 8/1/2025, 2020 Term LoanE | 1,000,000 | 982,140 | |||||||||||||
|
| ||||||||||||||
| Machinery - Diversified - 1.75% | |||||||||||||||
| Blount International, Inc., 4.750%, Due 4/12/2023, 2018 Term Loan B, (1-mo. LIBOR + 3.750%) | 5,865,525 | 5,825,933 | |||||||||||||
| NN, Inc., | |||||||||||||||
5.906%, Due 10/19/2022, New 2017 Incremental Term Loan, (1-mo. LIBOR + 5.750%) | 509,341 | 498,731 | |||||||||||||
6.500%, Due 10/19/2022, 2016 Term Loan B, (1-mo. LIBOR + 5.750%) | 3,220,865 | 3,153,775 | |||||||||||||
| Vertical Midco GmbH, Due 7/30/2027, USD Term Loan BE | 1,085,000 | 1,074,833 | |||||||||||||
|
| ||||||||||||||
| 10,553,272 | |||||||||||||||
|
| ||||||||||||||
| �� | |||||||||||||||
| Metal Fabricate/Hardware - 0.34% | |||||||||||||||
| Atkore International, Inc., Due 12/22/2023, 2016 1st Lien Term LoanE | 2,036,157 | 2,026,403 | |||||||||||||
|
| ||||||||||||||
| Miscellaneous Manufacturing - 1.05% | |||||||||||||||
| International Textile Group, Inc., | |||||||||||||||
5.296%, Due 5/1/2024, 1st Lien Term Loan, (6-mo. LIBOR + 5.000%) | 3,337,350 | 2,436,266 | |||||||||||||
9.367%, Due 5/1/2025, 2nd Lien Term Loan, (6-mo. LIBOR + 9.000%) | 4,347,000 | 1,956,150 | |||||||||||||
| MB Aerospace Holdings, Inc., 4.500%, Due 1/22/2025, 2017 Term Loan, (3-mo. LIBOR + 3.500%) | 2,410,900 | 1,912,157 | |||||||||||||
|
| ||||||||||||||
| 6,304,573 | |||||||||||||||
|
| ||||||||||||||
| Packaging & Containers - 0.14% | |||||||||||||||
| Graham Packaging Company, Inc., 4.500%, Due 8/4/2027, Term Loan, (1-mo. LIBOR + 3.750%) | 867,000 | 865,266 | |||||||||||||
|
| ||||||||||||||
| Transportation - 3.09% | |||||||||||||||
| Daseke, Inc., 6.000%, Due 2/27/2024, 2017 Term Loan B, (1-mo. LIBOR + 5.000%) | 4,259,891 | 4,124,128 | |||||||||||||
| Gruden Acquisition, Inc., 6.500%, Due 8/18/2022, 2017 Term Loan, (3-mo. LIBOR + 5.500%) | 3,789,237 | 3,604,512 | |||||||||||||
| Savage Enterprises LLC, 3.190%, Due 8/1/2025, 2020 Term Loan B, (1-mo. LIBOR + 3.000%) | 1,796,904 | 1,772,951 | |||||||||||||
| SMB Shipping Logistics LLC, 5.000%, Due 2/2/2024, 1st Lien Term Loan, (3-mo. LIBOR + 4.000%) | 5,867,471 | 5,552,095 | |||||||||||||
| United Road Services, Inc., 6.750%, Due 9/1/2024, 2017 Term Loan B, (6-mo. LIBOR + 5.750%) | 4,397,239 | 3,571,393 | |||||||||||||
|
| ||||||||||||||
| 18,625,079 | |||||||||||||||
|
| ||||||||||||||
Total Industrial | 71,265,190 | ||||||||||||||
|
| ||||||||||||||
See accompanying notes
25
American Beacon Sound Point Floating Rate Income FundSM
Schedule of Investments
August 31, 2020
| Principal Amount | Fair Value | ||||||||||||||
| BANK LOAN OBLIGATIONSD - 85.84% (continued) | |||||||||||||||
| Technology - 13.98% | |||||||||||||||
| Computers - 3.41% | |||||||||||||||
| 24-7 Intouch, Inc., 4.906%, Due 8/25/2025, 2018 Term Loan, (1-mo. LIBOR + 4.750%) | $ | 3,070,667 | $ | 2,794,307 | |||||||||||
| ConvergeOne Holdings, Inc., 5.156%, Due 1/4/2026, 2019 Term Loan, (1-mo. LIBOR + 5.000%) | 3,941,199 | 3,547,079 | |||||||||||||
| Corsair Components, Inc., 4.750%, Due 8/28/2024, 2017 1st Lien Term Loan B, (1-mo. LIBOR + 3.750%) | 1,877,512 | 1,863,431 | |||||||||||||
| Dell International LLC, 2.750%, Due 9/19/2025, 2019 Term Loan B, (1-mo. LIBOR + 2.000%) | 1,000,000 | 992,500 | |||||||||||||
| Electronics for Imaging, Inc., 5.155%, Due 7/23/2026, Term Loan, (1-mo. LIBOR + 5.000%) | 2,994,950 | 2,366,010 | |||||||||||||
| NeuStar, Inc., 4.572%, Due 8/8/2024, 2018 Term Loan B4, (3-mo. LIBOR + 3.500%) | 2,024,519 | 1,893,776 | |||||||||||||
| Perforce Software, Inc., 3.906%, Due 7/1/2026, 2020 Term Loan B, (1-mo. LIBOR + 3.750%) | 2,373,599 | 2,304,622 | |||||||||||||
| Redstone Buyer LLC, Due 6/29/2027, Term LoanE | 2,060,000 | 2,054,850 | |||||||||||||
| SonicWall US Holdings, Inc., 3.753%, Due 5/16/2025, 1st Lien Term Loan, (3-mo. LIBOR + 3.500%) | 2,811,302 | 2,694,155 | |||||||||||||
|
| ||||||||||||||
| 20,510,730 | |||||||||||||||
|
| ||||||||||||||
| Semiconductors - 0.22% | |||||||||||||||
| Natel Engineering Co., Inc., 6.072%, Due 4/30/2026, 2019 Term Loan B, (6-mo. LIBOR + 5.000%) | 1,616,055 | 1,357,486 | |||||||||||||
|
| ||||||||||||||
| Software - 10.35% | |||||||||||||||
| Aptean, Inc., 4.406%, Due 4/23/2026, 2019 Term Loan, (1-mo. LIBOR + 4.250%) | 2,459,344 | 2,399,410 | |||||||||||||
| ASG Technologies Group, Inc., 4.500%, Due 7/31/2024, 2018 Term Loan, (1-mo. LIBOR + 3.500%) | 4,568,267 | 4,250,773 | |||||||||||||
| Chloe OX Parent LLC, 5.500%, Due 12/23/2024, 1st Lien Term Loan, (3-mo. LIBOR + 4.500%) | 4,887,500 | 4,667,562 | |||||||||||||
| Cvent, Inc., 3.906%, Due 11/29/2024, 1st Lien Term Loan, (1-mo. LIBOR + 3.750%) | 2,094,771 | 1,808,060 | |||||||||||||
| DCert Buyer, Inc., 4.156%, Due 10/16/2026, 2019 Term Loan B, (1-mo. LIBOR + 4.000%) | 4,530,645 | 4,471,203 | |||||||||||||
| DTI Holdco, Inc., 5.750%, Due 9/30/2023, 2018 Term Loan B, (2-mo. LIBOR + 4.750%, 3-mo. LIBOR + 4.750%) | 3,969,366 | 3,270,599 | |||||||||||||
| Dun & Bradstreet Corp., 3.920%, Due 2/6/2026, Term Loan, (1-mo. LIBOR + 3.750%) | 1,149,120 | 1,145,673 | |||||||||||||
| Finastra USA, Inc., 4.500%, Due 6/13/2024, USD 1st Lien Term Loan, (6-mo. LIBOR + 3.500%) | 3,813,299 | 3,585,226 | |||||||||||||
| GlobalLogic Holdings, Inc., Due 8/13/2027, 2020 Incremental Term Loan B2E | 1,427,000 | 1,419,865 | |||||||||||||
| Informatica LLC, 3.406%, Due 2/25/2027, 2020 USD Term Loan B, (1-mo. LIBOR + 3.250%) | 1,938,875 | 1,895,250 | |||||||||||||
| Ivanti Software, Inc., 5.250%, Due 1/20/2024, 2017 Term Loan B, (1-mo. LIBOR + 4.250%) | 4,950,475 | 4,789,585 | |||||||||||||
| MA FinanceCo. LLC, 5.250%, Due 6/5/2025, 2020 USD Term Loan B, (3-mo. LIBOR + 4.250%) | 2,000,000 | 1,992,500 | |||||||||||||
| Mitchell International, Inc., 4.750%, Due 11/29/2024, 2020 Add-On Term Loan, (1-mo. LIBOR + 4.250%) | 1,599,000 | 1,559,025 | |||||||||||||
| Navicure, Inc., 4.156%, Due 10/22/2026, 2019 Term Loan B, (1-mo. LIBOR + 4.000%) | 3,114,195 | 3,024,662 | |||||||||||||
| Netsmart, Inc., 4.750%, Due 4/19/2023, Term Loan D1, (3-mo. LIBOR + 3.750%) | 4,871,561 | 4,774,130 | |||||||||||||
| Particle Investments SARL, 5.750%, Due 5/14/2027, Term Loan, (1 Week LIBOR + 5.250%) | 3,417,000 | 3,323,032 | |||||||||||||
| Project Alpha Intermediate Holding, Inc., | |||||||||||||||
4.500%, Due 4/26/2024, 2017 Term Loan B, (3-mo. LIBOR + 3.500%) | 1,979,487 | 1,964,641 | |||||||||||||
4.520%, Due 4/26/2024, 2019 Incremental Term Loan B, (3-mo. LIBOR + 4.250%) | 1,911,490 | 1,892,375 | |||||||||||||
| Riverbed Technology, Inc., 4.250%, Due 4/24/2022, 2016 Term Loan, (2-mo. LIBOR + 3.250%, 3-mo. LIBOR + 3.250%) | 3,086,726 | 2,725,579 | |||||||||||||
| Sirius Computer Solutions, Inc., 3.656%, Due 7/1/2026, 2020 Term Loan, (1-mo. LIBOR + 3.500%)E | 2,125,609 | 2,076,464 | |||||||||||||
| Ultimate Software Group, Inc., 4.750%, Due 5/4/2026, 2020 Incremental Term Loan B, (3-mo. LIBOR + 4.000%)E | 3,667,000 | 3,660,143 | |||||||||||||
| Zelis Healthcare Corp., 4.906%, Due 9/30/2026, Term Loan B, (1-mo. LIBOR + 4.750%) | 1,627,820 | 1,626,127 | |||||||||||||
|
| ||||||||||||||
| 62,321,884 | |||||||||||||||
|
| ||||||||||||||
Total Technology | 84,190,100 | ||||||||||||||
|
| ||||||||||||||
| Utilities - 1.63% | |||||||||||||||
| Electric - 1.63% | |||||||||||||||
| EFS Cogen Holdings LLC, 4.250%, Due 6/28/2023, 2016 Term Loan B, (1-mo. LIBOR + 3.250%, 3-mo. LIBOR + 3.250%) | 1,984,127 | 1,969,603 | |||||||||||||
| Frontera Generation Holdings LLC, 5.250%, Due 5/2/2025, 2018 Term Loan B, (3-mo. LIBOR + 4.250%) | 9,740,422 | 4,090,977 | |||||||||||||
| Granite Generation LLC, 4.750%, Due 11/9/2026, Term Loan B, (1-mo. LIBOR + 3.750%, 3-mo. LIBOR + 3.750%, 3-mo. PRIME + 2.750%) | 1,088,811 | 1,074,526 | |||||||||||||
See accompanying notes
26
American Beacon Sound Point Floating Rate Income FundSM
Schedule of Investments
August 31, 2020
| Principal Amount | Fair Value | ||||||||||||||
| BANK LOAN OBLIGATIONSD - 85.84% (continued) | |||||||||||||||
| Utilities - 1.63% (continued) | |||||||||||||||
| Electric - 1.63% (continued) | |||||||||||||||
| Hamilton Projects Acquiror LLC, 5.750%, Due 6/17/2027, Term Loan B, (3-mo. LIBOR + 4.750%) | $ | 1,000,000 | $ | 997,500 | |||||||||||
| Nautilus Power LLC, 5.250%, Due 5/16/2024, Term Loan B, (1-mo. LIBOR + 4.250%) | 668,883 | 658,153 | |||||||||||||
| Pacific Gas & Electric Co., 5.500%, Due 6/23/2025, 2020 Exit Term Loan B, (3-mo. LIBOR + 4.500%) | 1,045,000 | 1,027,371 | |||||||||||||
|
| ||||||||||||||
| 9,818,130 | |||||||||||||||
|
| ||||||||||||||
Total Utilities | 9,818,130 | ||||||||||||||
|
| ||||||||||||||
Total Bank Loan Obligations (Cost $564,573,213) | 516,931,886 | ||||||||||||||
|
| ||||||||||||||
| CORPORATE OBLIGATIONS - 6.44% | |||||||||||||||
| Communications - 2.57% | |||||||||||||||
| Advertising - 0.47% | |||||||||||||||
| Terrier Media Buyer, Inc., 8.875%, Due 12/15/2027H | 2,718,000 | 2,813,945 | |||||||||||||
|
| ||||||||||||||
| Internet - 0.82% | |||||||||||||||
| EIG Investors Corp., 10.875%, Due 2/1/2024 | 4,761,000 | 4,927,635 | |||||||||||||
|
| ||||||||||||||
| Media - 0.99% | |||||||||||||||
| Diamond Sports Group LLC / Diamond Sports Finance Co., 5.375%, Due 8/15/2026H | 2,665,000 | 2,078,700 | |||||||||||||
| Univision Communications, Inc., 6.625%, Due 6/1/2027H | 3,897,000 | 3,906,743 | |||||||||||||
|
| ||||||||||||||
| 5,985,443 | |||||||||||||||
|
| ||||||||||||||
| Telecommunications - 0.29% | |||||||||||||||
| Plantronics, Inc., 5.500%, Due 5/31/2023H | 1,862,000 | 1,757,728 | |||||||||||||
|
| ||||||||||||||
Total Communications | 15,484,751 | ||||||||||||||
|
| ||||||||||||||
| Consumer, Cyclical - 1.35% | |||||||||||||||
| Airlines - 0.32% | |||||||||||||||
| Mileage Plus Holdings LLC / Mileage Plus Intellectual Property Assets Ltd., 6.500%, Due 6/20/2027H | 1,839,365 | 1,912,939 | |||||||||||||
|
| ||||||||||||||
| Auto Parts & Equipment - 0.56% | |||||||||||||||
| Clarios Global LP / Clarios US Finance Co, 8.500%, Due 5/15/2027H | 3,159,000 | 3,354,187 | |||||||||||||
|
| ||||||||||||||
| Distribution/Wholesale - 0.35% | |||||||||||||||
| G-III Apparel Group Ltd., 7.875%, Due 8/15/2025H | 2,101,000 | 2,087,869 | |||||||||||||
|
| ||||||||||||||
| Home Builders - 0.12% | |||||||||||||||
| Beazer Homes USA, Inc., 5.875%, Due 10/15/2027 | 743,000 | 754,145 | |||||||||||||
|
| ||||||||||||||
Total Consumer, Cyclical | 8,109,140 | ||||||||||||||
|
| ||||||||||||||
| Consumer, Non-Cyclical - 1.43% | |||||||||||||||
| Commercial Services - 0.58% | |||||||||||||||
| Allied Universal Holdco LLC / Allied Universal Finance Corp., | |||||||||||||||
6.625%, Due 7/15/2026H | 2,022,000 | 2,168,595 | |||||||||||||
9.750%, Due 7/15/2027H | 1,224,000 | 1,355,580 | |||||||||||||
|
| ||||||||||||||
| 3,524,175 | |||||||||||||||
|
| ||||||||||||||
| Health Care - Services - 0.85% | |||||||||||||||
| Air Medical Group Holdings, Inc., 6.375%, Due 5/15/2023H | 1,807,000 | 1,788,930 | |||||||||||||
| Hadrian Merger Sub, Inc., 8.500%, Due 5/1/2026H | 3,442,000 | 3,306,489 | |||||||||||||
|
| ||||||||||||||
| 5,095,419 | |||||||||||||||
|
| ||||||||||||||
Total Consumer, Non-Cyclical | 8,619,594 | ||||||||||||||
|
| ||||||||||||||
See accompanying notes
27
American Beacon Sound Point Floating Rate Income FundSM
Schedule of Investments
August 31, 2020
| Principal Amount | Fair Value | ||||||||||||||
| CORPORATE OBLIGATIONS - 6.44% (continued) | |||||||||||||||
| Industrial - 0.57% | |||||||||||||||
| Aerospace/Defense - 0.31% | |||||||||||||||
| SSL Robotics LLC, 9.750%, Due 12/31/2023H | $ | 1,641,000 | $ | 1,854,330 | |||||||||||
|
| ||||||||||||||
| Engineering & Construction - 0.26% | |||||||||||||||
| PowerTeam Services LLC, 9.033%, Due 12/4/2025H | 1,478,583 | 1,569,146 | |||||||||||||
|
| ||||||||||||||
Total Industrial | 3,423,476 | ||||||||||||||
|
| ||||||||||||||
| Technology - 0.52% | |||||||||||||||
| Software - 0.52% | |||||||||||||||
| Granite Merger Sub 2, Inc., 11.000%, Due 7/15/2027H | 3,000,000 | 3,139,890 | |||||||||||||
|
| ||||||||||||||
Total Corporate Obligations (Cost $37,902,342) | 38,776,851 | ||||||||||||||
|
| ||||||||||||||
| Shares | |||||||||||||||
| SHORT-TERM INVESTMENTS - 10.75% (Cost $64,749,576) | |||||||||||||||
| Investment Companies - 10.75% | |||||||||||||||
| American Beacon U.S. Government Money Market Select Fund, 0.01%I J | 64,749,576 | 64,749,576 | |||||||||||||
|
| ||||||||||||||
TOTAL INVESTMENTS - 103.53% (Cost $671,701,348) | 623,430,902 | ||||||||||||||
LIABILITIES, NET OF OTHER ASSETS - (3.53%) | (21,228,529 | ) | |||||||||||||
|
| ||||||||||||||
TOTAL NET ASSETS - 100.00% | $ | 602,202,373 | |||||||||||||
|
| ||||||||||||||
| Percentages are stated as a percent of net assets. | |||||||||||||||
A Non-income producing security.
B Fair valued pursuant to procedures approved by the Board of Trustees. At period end, the value of these securities amounted to $2,721,277 or 0.45% of net assets.
C Value was determined using significant unobservable inputs.
D Bank loan obligations, unless otherwise stated, carry a floating rate of interest. The coupon rate shown on floating or adjustable rate securities represents the rate at period end.
E Coupon rates may not be available for all or a portion of bank loans that are unsettled and/or unfunded as of August 31, 2020.
F All or a portion of the security is an Unfunded Loan Commitment. At period end, the amount of unfunded loan commitments was $1,534,033 or 0.25% of net assets. Of this amount, $86,912, $96,609, $10,482, $766,322 and $573,708 relate to BCPE Empire Holdings, Inc., Intelsat Jackson Holdings S.A., OEConnection LLC, NPC International, Inc., and Southcross Energy Partners LP, respectively.
G Fixed Rate.
H Security exempt from registration under the Securities Act of 1933. These securities may be resold to qualified institutional buyers pursuant to Rule 144A. At the period end, the value of these securities amounted to $33,095,071 or 5.50% of net assets. The Fund has no right to demand registration of these securities.
I 7-day yield.
J The Fund is affiliated by having the same investment advisor.
DIP - Debtor-in-possession.
LIBOR - London Interbank Offered Rate.
LLC - Limited Liability Company.
LP - Limited Partnership.
PIK - Payment in Kind.
PLC - Public Limited Company.
PRIME - A rate, charged by banks, based on the U.S. Federal Funds rate.
Pty Ltd. - Proprietary Ltd.
USD - United States Dollar.
See accompanying notes
28
American Beacon Sound Point Floating Rate Income FundSM
Schedule of Investments
August 31, 2020
The Fund’s investments are summarized by level based on the inputs used to determine their values. As of August 31, 2020, the investments were classified as described below:
Sound Point Floating Rate Income Fund | Level 1 | Level 2 | Level 3 | Total | ||||||||||||||||||||||||
Assets | ||||||||||||||||||||||||||||
Common Stocks | $ | 200,884 | $ | - | $ | 4,137 | (1) | $ | 205,021 | |||||||||||||||||||
Warrants | - | - | 0 | (1) | - | |||||||||||||||||||||||
Preferred Stocks | - | 2,256,247 | 511,321 | 2,767,568 | ||||||||||||||||||||||||
Bank Loan Obligations(2) | - | 514,726,067 | 2,205,819 | 516,931,886 | ||||||||||||||||||||||||
Corporate Obligations | - | 38,776,851 | - | 38,776,851 | ||||||||||||||||||||||||
Short-Term Investments | 64,749,576 | - | - | 64,749,576 | ||||||||||||||||||||||||
|
|
|
|
|
|
|
| |||||||||||||||||||||
Total Investments in Securities - Assets | $ | 64,950,460 | $ | 555,759,165 | $ | 2,721,277 | $ | 623,430,902 | ||||||||||||||||||||
|
|
|
|
|
|
|
| |||||||||||||||||||||
| (1) | Includes investments held in the Fund’s portfolio with $0 fair value. |
| (2) | Unfunded loan commitments represent $1,534,033 at year end. |
U.S. GAAP requires transfers between all levels to/from level 3 be disclosed. During the year ended August 31, 2020, there were no transfers into or out of Level 3.
The following table is a reconciliation of Level 3 assets within the Fund for which significant unobservable inputs were used to determine fair value. Transfers in or out of Level 3 represent the ending value of any security or instrument where a change in the level has occurred from the beginning to the end of the year:
| Security Type | Balance as of 8/31/2019 | Purchases | Sales | Accrued Discounts (Premiums) | Realized Gain (Loss) | Change in Unrealized Appreciation (Depreciation) | Transfer into Level 3 | Transfer out of Level 3 | Balance as of 8/31/2020 | Unrealized Appreciation (Depreciation) at Year end** | ||||||||||||||||||||||||||||||||||||||||||||||||||||||||||||||||||
| Common Stocks | $ | 44,777 | (1) | $ | - | $ | - | $ | - | $ | - | $ | (40,640 | ) | $ | - | $ | - | $ | 4,137 | (1) | $ | (144,107 | ) | ||||||||||||||||||||||||||||||||||||||||||||||||||||
| Warrants | 0 | (1) | - | - | - | - | - | - | - | 0 | (1) | - | ||||||||||||||||||||||||||||||||||||||||||||||||||||||||||||||||
| Preferred Stocks | - | 511,321 | - | - | - | - | - | - | 511,321 | - | ||||||||||||||||||||||||||||||||||||||||||||||||||||||||||||||||||
| Bank Loan Obligations | 9,791,506 | 3,962,960 | 7,204,760 | 243,354 | (4,501,956 | ) | (85,285 | ) | - | - | 2,205,819 | (1,182,911 | ) | |||||||||||||||||||||||||||||||||||||||||||||||||||||||||||||||
|
|
|
|
|
|
|
|
|
|
|
|
|
|
|
|
|
|
|
| |||||||||||||||||||||||||||||||||||||||||||||||||||||||||
| $ | 9,836,283 | $ | 4,474,281 | $ | 7,204,760 | $ | 243,354 | $ | (4,501,956 | ) | $ | (125,925 | ) | $ | - | $ | - | $ | 2,721,277 | $ | (1,327,018 | ) | ||||||||||||||||||||||||||||||||||||||||||||||||||||||
|
|
|
|
|
|
|
|
|
|
|
|
|
|
|
|
|
|
|
| |||||||||||||||||||||||||||||||||||||||||||||||||||||||||
| ** | Change in unrealized appreciation (depreciation) attributable to Level 3 securities held at year end. This balance is included in the change in unrealized appreciation (depreciation) on the Statements of Operations. |
| (1) | Investments held in the Fund’s portfolio with $0 fair value. |
For the year ended August 31, 2020, one common stock and a warrant have been fair valued at $0 by the Valuation Committee. The remaining common stocks valued at $4,137, preferred stocks valued at $511,321 and bank loan obligations valued at $2,205,819 have been classified as Level 3 due to the use of significant unobservable inputs.
See accompanying notes
29
American Beacon FundsSM
Statements of Assets and Liabilities
August 31, 2020
| SiM High Yield Opportunities Fund | Sound Point Floating Rate Income Fund | |||||||||||
Assets: |
| |||||||||||
Investments in unaffiliated securities, at fair value† | $ | 1,211,477,081 | $ | 558,681,326 | ||||||||
Investments in affiliated securities, at fair value‡ | 19,195,338 | 64,749,576 | ||||||||||
Cash | 14,078,666 | 668,501 | ||||||||||
Dividends and interest receivable | 19,149,282 | 4,119,294 | ||||||||||
Deposits with broker for futures contracts | 3,880,710 | – | ||||||||||
Receivable from broker | 845,927 | – | ||||||||||
Receivable for investments sold | – | 31,652,087 | ||||||||||
Receivable for fund shares sold | 2,454,215 | 845,440 | ||||||||||
Prepaid expenses | 57,088 | 60,476 | ||||||||||
|
|
|
| |||||||||
Total assets | 1,271,138,307 | 660,776,700 | ||||||||||
|
|
|
| |||||||||
Liabilities: |
| |||||||||||
Payable for investments purchased | 18,261,603 | 54,520,764 | ||||||||||
Payable for fund shares redeemed | 2,692,404 | 1,709,160 | ||||||||||
Payable for expense reimbursement (Note 2) | 5,050 | 42 | ||||||||||
Dividends payable | 604,664 | 155,603 | ||||||||||
Unfunded loan commitments | – | 1,534,033 | ||||||||||
Management and sub-advisory fees payable (Note 2) | 748,557 | 372,872 | ||||||||||
Service fees payable (Note 2) | 48,426 | 53,917 | ||||||||||
Transfer agent fees payable (Note 2) | 78,994 | 32,840 | ||||||||||
Custody and fund accounting fees payable | 39,230 | 44,300 | ||||||||||
Professional fees payable | 74,271 | 80,235 | ||||||||||
Trustee fees payable (Note 2) | – | 313 | ||||||||||
Payable for prospectus and shareholder reports | 89,149 | 44,397 | ||||||||||
Payable for variation margin from open futures contracts (Note 5) | 2,368,394 | – | ||||||||||
Other liabilities | 4,064 | 25,851 | ||||||||||
|
|
|
| |||||||||
Total liabilities | 25,014,806 | 58,574,327 | ||||||||||
|
|
|
| |||||||||
Net assets | $ | 1,246,123,501 | $ | 602,202,373 | ||||||||
|
|
|
| |||||||||
Analysis of net assets: |
| |||||||||||
Paid-in-capital | $ | 1,329,959,028 | $ | 832,924,690 | ||||||||
Total distributable earnings (deficits)A | (83,835,527 | ) | (230,722,317 | ) | ||||||||
|
|
|
| |||||||||
Net assets | $ | 1,246,123,501 | $ | 602,202,373 | ||||||||
|
|
|
| |||||||||
Shares outstanding at no par value (unlimited shares authorized): |
| |||||||||||
R5 ClassB | 44,086,541 | 18,234,521 | ||||||||||
|
|
|
| |||||||||
Y Class | 81,833,676 | 36,630,694 | ||||||||||
|
|
|
| |||||||||
Investor Class | 4,464,341 | 6,491,794 | ||||||||||
|
|
|
| |||||||||
A Class | 2,655,935 | 3,369,566 | ||||||||||
|
|
|
| |||||||||
C Class | 4,618,360 | 3,535,260 | ||||||||||
|
|
|
| |||||||||
SP Class | N/A | 12,760 | ||||||||||
|
|
|
| |||||||||
Net assets: |
| |||||||||||
R5 ClassB | $ | 399,310,742 | $ | 160,767,886 | ||||||||
|
|
|
| |||||||||
Y Class | $ | 740,616,507 | $ | 323,133,710 | ||||||||
|
|
|
| |||||||||
Investor Class | $ | 40,259,060 | $ | 57,117,869 | ||||||||
|
|
|
| |||||||||
A Class | $ | 23,945,109 | $ | 29,739,876 | ||||||||
|
|
|
| |||||||||
C Class | $ | 41,992,083 | $ | 31,330,022 | ||||||||
|
|
|
| |||||||||
SP Class | $ | N/A | $ | 113,010 | ||||||||
|
|
|
| |||||||||
Net asset value, offering and redemption price per share: |
| |||||||||||
R5 ClassB | $ | 9.06 | $ | 8.82 | ||||||||
|
|
|
| |||||||||
Y Class | $ | 9.05 | $ | 8.82 | ||||||||
|
|
|
| |||||||||
Investor Class | $ | 9.02 | $ | 8.80 | ||||||||
|
|
|
| |||||||||
A Class | $ | 9.02 | $ | 8.83 | ||||||||
|
|
|
| |||||||||
A Class (offering price) | $ | 9.47 | $ | 9.06 | ||||||||
|
|
|
| |||||||||
C Class | $ | 9.09 | $ | 8.86 | ||||||||
|
|
|
| |||||||||
SP Class | $ | N/A | $ | 8.86 | ||||||||
|
|
|
| |||||||||
† Cost of investments in unaffiliated securities | $ | 1,232,024,040 | $ | 606,951,772 | ||||||||
‡ Cost of investments in affiliated securities | $ | 19,195,338 | $ | 64,749,576 | ||||||||
A The Fund’s investments in affiliated securities did not have unrealized appreciation (depreciation) at year end. |
| |||||||||||
B Formerly known as Institutional Class. |
| |||||||||||
See accompanying notes
30
American Beacon FundsSM
Statements of Operations
For the year ended August 31, 2020
| SiM High Yield Opportunities Fund | Sound Point Floating Rate Income Fund | |||||||||||
Investment income: |
| |||||||||||
Dividend income from unaffiliated securities (net of foreign taxes)† | $ | 1,020,575 | $ | – | ||||||||
Dividend income from affiliated securities (Note 2) | 208,945 | 459,302 | ||||||||||
Interest income | 86,491,111 | 65,966,675 | ||||||||||
|
|
|
| |||||||||
Total investment income | 87,720,631 | 66,425,977 | ||||||||||
|
|
|
| |||||||||
Expenses: |
| |||||||||||
Management and sub-advisory fees (Note 2) | 8,812,701 | 6,463,319 | ||||||||||
Transfer agent fees: | ||||||||||||
R5 Class (Note 2)A | 135,725 | 67,165 | ||||||||||
Y Class (Note 2) | 749,443 | 478,625 | ||||||||||
Investor Class | 4,110 | 5,645 | ||||||||||
A Class | 1,569 | 2,322 | ||||||||||
C Class | 3,901 | 3,973 | ||||||||||
SP Class | – | 40 | ||||||||||
Custody and fund accounting fees | 226,522 | 320,687 | ||||||||||
Professional fees | 158,513 | 122,380 | ||||||||||
Registration fees and expenses | 134,173 | 170,726 | ||||||||||
Service fees (Note 2): | ||||||||||||
Investor Class | 220,222 | 408,484 | ||||||||||
A Class | 20,510 | 18,348 | ||||||||||
C Class | 41,649 | 28,916 | ||||||||||
Distribution fees (Note 2): | ||||||||||||
A Class | 53,877 | 92,373 | ||||||||||
C Class | 491,558 | 408,635 | ||||||||||
SP Class | – | 502 | ||||||||||
Prospectus and shareholder report expenses | 260,555 | 81,616 | ||||||||||
Trustee fees (Note 2) | 102,463 | 63,057 | ||||||||||
Loan expense (Note 9) | – | 634,068 | ||||||||||
Line of credit interest expense | – | 65,538 | ||||||||||
Other expenses | 142,831 | 101,062 | ||||||||||
|
|
|
| |||||||||
Total expenses | 11,560,322 | 9,537,481 | ||||||||||
|
|
|
| |||||||||
Net fees waived and expenses (reimbursed) (Note 2) | (43,974 | ) | – | |||||||||
|
|
|
| |||||||||
Net expenses | 11,516,348 | 9,537,481 | ||||||||||
|
|
|
| |||||||||
Net investment income | 76,204,283 | 56,888,496 | ||||||||||
|
|
|
| |||||||||
Realized and unrealized gain (loss) from investments: |
| |||||||||||
Net realized gain (loss) from: | ||||||||||||
Investments in unaffiliated securitiesB | (55,770,176 | ) | (138,895,739 | ) | ||||||||
Foreign currency transactions | (206,136 | ) | – | |||||||||
Futures contracts | 1,239,695 | – | ||||||||||
Change in net unrealized appreciation (depreciation) of: | ||||||||||||
Investments in unaffiliated securitiesC | 12,419,131 | 18,846,979 | ||||||||||
Foreign currency transactions | 107,558 | – | ||||||||||
Futures contracts | (3,223,953 | ) | – | |||||||||
|
|
|
| |||||||||
Net (loss) from investments | (45,433,881 | ) | (120,048,760 | ) | ||||||||
|
|
|
| |||||||||
Net increase (decrease) in net assets resulting from operations | $ | 30,770,402 | $ | (63,160,264 | ) | |||||||
|
|
|
| |||||||||
† Foreign taxes | $ | 23,876 | $ | – | ||||||||
A Formerly known as Institutional Class. | ||||||||||||
B The Fund did not recognize net realized gains (losses) from the sale of investments in affiliated securities. |
| |||||||||||
C The Fund’s investments in affiliated securities did not have a change in unrealized appreciation (depreciation) at year end. |
| |||||||||||
See accompanying notes
31
American Beacon FundsSM
Statements of Changes in Net Assets
| SiM High Yield Opportunities Fund | Sound Point Floating Rate Income Fund | |||||||||||||||||||||||||||
| Year Ended August 31, 2020 | Year Ended August 31, 2019 | Year Ended August 31, 2020 | Year Ended August 31, 2019 | |||||||||||||||||||||||||
Increase (decrease) in net assets: | ||||||||||||||||||||||||||||
Operations: | ||||||||||||||||||||||||||||
Net investment income | $ | 76,204,283 | $ | 71,478,685 | $ | 56,888,496 | $ | 115,743,353 | ||||||||||||||||||||
Net realized gain (loss) from investments in unaffiliated securities, foreign currency transactions, and futures contracts | (54,736,617 | ) | 9,426,476 | (138,895,739 | ) | (30,797,997 | ) | |||||||||||||||||||||
Change in net unrealized appreciation (depreciation) of investments in unaffiliated securities, foreign currency transactions, and futures contracts | 9,302,736 | (20,278,760 | ) | 18,846,979 | (59,949,986 | ) | ||||||||||||||||||||||
|
|
|
|
|
|
|
| |||||||||||||||||||||
Net increase (decrease) in net assets resulting from operations | 30,770,402 | 60,626,401 | (63,160,264 | ) | 24,995,370 | |||||||||||||||||||||||
|
|
|
|
|
|
|
| |||||||||||||||||||||
Distributions to shareholders: |
| |||||||||||||||||||||||||||
Total retained earnings: | ||||||||||||||||||||||||||||
R5 ClassA | (24,656,231 | ) | (25,158,278 | ) | (15,651,271 | ) | (25,168,717 | ) | ||||||||||||||||||||
Y Class | (45,283,091 | ) | (37,145,789 | ) | (31,011,790 | ) | (69,601,964 | ) | ||||||||||||||||||||
Investor Class | (3,545,239 | ) | (5,006,310 | ) | (6,712,557 | ) | (23,917,366 | ) | ||||||||||||||||||||
A Class | (1,316,760 | ) | (1,586,624 | ) | (2,232,615 | ) | (3,256,554 | ) | ||||||||||||||||||||
C Class | (2,633,449 | ) | (3,025,464 | ) | (2,160,406 | ) | (3,309,136 | ) | ||||||||||||||||||||
SP Class | – | – | (12,119 | ) | (34,122 | ) | ||||||||||||||||||||||
|
|
|
|
|
|
|
| |||||||||||||||||||||
Net distributions to shareholders | (77,434,770 | ) | (71,922,465 | ) | (57,780,758 | ) | (125,287,859 | ) | ||||||||||||||||||||
|
|
|
|
|
|
|
| |||||||||||||||||||||
Capital share transactions (Note 10): |
| |||||||||||||||||||||||||||
Proceeds from sales of shares | 626,185,003 | 615,061,422 | 340,219,054 | 1,129,880,930 | ||||||||||||||||||||||||
Reinvestment of dividends and distributions | 69,380,780 | 63,566,129 | 54,176,789 | 118,529,259 | ||||||||||||||||||||||||
Cost of shares redeemed | (619,275,694 | ) | (613,008,694 | ) | (1,121,048,159 | ) | (2,008,708,410 | ) | ||||||||||||||||||||
|
|
|
|
|
|
|
| |||||||||||||||||||||
Net increase (decrease) in net assets from capital share transactions | 76,290,089 | 65,618,857 | (726,652,316 | ) | (760,298,221 | ) | ||||||||||||||||||||||
|
|
|
|
|
|
|
| |||||||||||||||||||||
Net increase (decrease) in net assets | 29,625,721 | 54,322,793 | (847,593,338 | ) | (860,590,710 | ) | ||||||||||||||||||||||
|
|
|
|
|
|
|
| |||||||||||||||||||||
Net assets: |
| |||||||||||||||||||||||||||
Beginning of period | 1,216,497,780 | 1,162,174,987 | 1,449,795,711 | 2,310,386,421 | ||||||||||||||||||||||||
|
|
|
|
|
|
|
| |||||||||||||||||||||
End of period | $ | 1,246,123,501 | $ | 1,216,497,780 | $ | 602,202,373 | $ | 1,449,795,711 | ||||||||||||||||||||
|
|
|
|
|
|
|
| |||||||||||||||||||||
A Formerly known as Institutional Class. |
| |||||||||||||||||||||||||||
See accompanying notes
32
American Beacon FundsSM
August 31, 2020
1. Organization and Significant Accounting Policies
American Beacon Funds (the “Trust”) is organized as a Massachusetts business trust. The Funds, each a series within the Trust, are registered under the Investment Company Act of 1940, as amended (the “Act”), as diversified, open-end management investment companies. As of August 31, 2020, the Trust consists of twenty-seven active series, two of which are presented in this filing: American Beacon SiM High Yield Opportunities Fund and American Beacon Sound Point Floating Rate Income Fund (collectively, the “Funds” and each individually a “Fund”). The remaining twenty-five active series are reported in separate filings.
American Beacon Advisors, Inc. (the “Manager”) is a Delaware corporation and a wholly-owned subsidiary of Resolute Investment Managers, Inc. (“RIM”) organized in 1986 to provide business management, advisory, administrative, and asset management consulting services to the Trust and other investors. The Manager is registered as an investment advisor under the Investment Advisers Act of 1940, as amended (the “Advisers Act”). RIM is, in turn, a wholly-owned subsidiary of Resolute Acquisition, Inc., which is a wholly-owned subsidiary of Resolute Topco, Inc., a wholly-owned subsidiary of Resolute Investment Holdings, LLC (“RIH”). RIH is owned primarily by Kelso Investment Associates VIII, L.P., KEP VI, LLC and Estancia Capital Partners L.P., investment funds affiliated with Kelso & Company, L.P. (“Kelso”) or Estancia Capital Management, LLC (“Estancia”), which are private equity firms.
Recently Adopted Accounting Pronouncements
In March 2020, the Financial Accounting Standards Board (“FASB”) issued Accounting Standards Update (“ASU”) 2020-04, which provides optional expedients and exceptions for contracts, hedging relationships and other transactions affected by the transitioning away from the London Interbank Offered Rate (LIBOR) and other reference rates that are expected to be discontinued. The amendments in this Update are effective for all entities as of March 12, 2020 through December 31, 2022. At this time, management is evaluating the implications of these changes on the financial statements.
Class Disclosure
Prior to February 28, 2020, the R5 Class was known as the Institutional Class.
Each Fund has multiple classes of shares designed to meet the needs of different groups of investors; however, not all of the Funds offer all classes. The following table sets forth the differences amongst the classes:
Class | Eligible Investors | Minimum Initial Investments | ||||
| R5 Class | Large Institutional investors - sold directly or through intermediary channels. | $ | 250,000 | |||
| Y Class | Large institutional retirement plan investors - sold directly or through intermediary channels. | $ | 100,000 | |||
| Investor Class | All investors using intermediary organizations, such as broker-dealers or retirement plan sponsors - sold directly through intermediary channels. | $ | 2,500 | |||
| A Class | All investors who invest through intermediary organizations, such as broker-dealers or third party administrator. Retail investors who invest directly through a financial intermediary, such as a broker, bank, or registered investment advisor which may include a front-end sales charge and a contingent deferred sales charge (“CDSC”). | $ | 2,500 | |||
| C Class | Retail investors who invest directly through a financial intermediary, such as a broker or through employee directed benefit plans with applicable sales charges which may include CDSC. | $ | 1,000 | |||
| SP Class | Retail investors who invest directly through a financial intermediary, such as a broker, or through employee directed benefit plans and were formerly shareholders of the Investor Class Shares of the Sound Point Floating Rate Income Fund prior to its reorganization. | $ | 1,000 | |||
33
American Beacon FundsSM
Notes to Financial Statements
August 31, 2020
Each class offered by the Trust has equal rights as to assets and voting privileges. Income and non-class specific expenses are allocated daily to each class based on the relative net assets. Realized and unrealized capital gains and losses of each class are allocated daily based on the relative net assets of each class of the respective Fund. Class specific expenses, where applicable, currently include service, distribution, transfer agent fees, and sub-transfer agent fees that vary amongst the classes as described more fully in Note 2.
Significant Accounting Policies
The following is a summary of significant accounting policies, consistently followed by the Funds in preparation of the financial statements. The Funds are considered investment companies and accordingly, follow the investment company accounting and reporting guidance of the FASB Accounting Standards Codification Topic 946, Financial Services – Investment Companies, a part of Generally Accepted Accounting Principles (“U.S. GAAP”).
Security Transactions and Investment Income
Security transactions are recorded as of the trade date for financial reporting purposes. Securities purchased or sold on a when-issued or delayed-delivery basis may be settled beyond a standard settlement period for the security after the trade date.
Dividend income, net of foreign taxes, is recorded on the ex-dividend date, except certain dividends from foreign securities which are recorded as soon as the information is available to the Funds. Interest income, net of foreign taxes, is earned from settlement date, recorded on the accrual basis, and adjusted, if necessary, for accretion of discounts and amortization of premiums. For convertible securities, premiums attributable to the conversion feature are not amortized. Realized gains (losses) from securities sold are determined on the basis of specific lot identification. Estimated tax liabilities on certain foreign securities are recorded on an accrual basis and are reflected as components of interest income or net change in unrealized appreciation (depreciation) on investments on the Statements of Operations, as appropriate. Tax liabilities realized as a result of such security sales are reflected as a component of net realized gain (loss) on investments on the Statements of Operations. Paydown gains (losses) on mortgage-related and other asset-backed securities, if any, are recorded as components of interest income on the Statements of Operations. Income or short-term capital gain distributions received from registered investment companies, if any, are recorded as dividend income. Long-term gain distributions received from registered investment companies, if any, are recorded as realized gains.
Debt obligations may be placed on a non-accrual status and related interest income may be reduced by ceasing current accruals and writing off interest receivable when the collection of all or a portion of interest has become doubtful based on consistently applied procedures. A debt obligation is removed for non-accrual when the issuer resumes interest payments or when collectability of interest is probable. Realized gains (losses) from securities sold are determined on the basis of specific lot identification.
Currency Translation
All assets and liabilities initially expressed in foreign currency values are converted into U.S. dollar values at the mean of the bid and ask prices of such currencies against U.S. dollars as last quoted by a recognized dealer. Income, expenses, and purchases and sales of investments are translated into U.S. dollars at the rate of the exchange prevailing on the respective dates of such transactions. The effect of changes in foreign currency exchange rates on investments is separately identified from the fluctuations arising from changes in market values of securities held and is reported with all other foreign currency gains and losses on the Funds’ Statements of Operations.
Distributions to Shareholders
The Funds distribute most or all of its net earnings and realized gains, if any, each taxable year in the form of dividends from net investment income and distributions of realized net capital gains and net gains from foreign
34
American Beacon FundsSM
Notes to Financial Statements
August 31, 2020
currency transactions on an annual basis. The Funds do not have a fixed dividend rate and do not guarantee that it will pay any distributions in any particular period. Dividends to shareholders are determined in accordance with federal income tax regulations, which may differ in amount and character from net investment income and realized gains recognized for purposes of U.S. GAAP. To the extent necessary to fully distribute capital gains, the Funds may designate earnings and profits distributed to shareholders on the redemption of shares.
Allocation of Income, Trust Expenses, Gains, and Losses
Investment income, realized and unrealized gains and losses from investments of the Funds are allocated daily to each class of shares based upon the relative proportion of net assets of each class to the total net assets of the Funds. Expenses directly charged or attributable to the Fund will be paid from the assets of the Fund. Generally, expenses of the Trust will be allocated among and charged to the assets of the Funds on a basis that the Trust’s Board of Trustees (the “Board”) deems fair and equitable, which may be based on the relative net assets of the Funds or nature of the services performed and relative applicability to the Funds.
Use of Estimates
The preparation of financial statements in conformity with U.S. GAAP requires management to make estimates and assumptions that affect the amounts reported in the financial statements and accompanying notes. Actual results may differ from those estimated.
Other
Under the Trust’s organizational documents, its officers and trustees are indemnified against certain liabilities arising out of the performance of their duties to the Trust. In the normal course of business, the Trust enters into contracts that provide indemnification to the other party or parties against potential costs or liabilities. The Trust’s maximum exposure under these arrangements is dependent on claims that may be made in the future and, therefore, cannot be estimated. The Trust has had no prior claims or losses pursuant to any such agreement.
2. Transactions with Affiliates
Management and Investment Sub-Advisory Agreements
The Funds and the Manager are parties to a Management Agreement that obligates the Manager to provide the Funds with investment advisory and administrative services. As compensation for performing the duties under the Management Agreement, the Manager will receive an annualized management fee based on a percentage of the Funds’ average daily net assets that is calculated and accrued daily according to the following schedule:
First $5 billion | 0.35 | % | ||
Next $5 billion | 0.325 | % | ||
Next $10 billion | 0.30 | % | ||
Over $20 billion | 0.275 | % |
The Trust, on behalf of the Funds, and the Manager have entered into an Investment Advisory Agreement with the following Sub-Advisors pursuant to which each Fund has agreed to pay an annualized sub-advisory fee that is calculated and accrued daily based on the applicable Fund’s average daily net assets according to the following schedules:
Strategic Income Management, LLC
First $250 million | 0.45 | % | ||
Next $250 million | 0.40 | % | ||
Next $500 million | 0.35 | % | ||
Over $1 billion | 0.30 | % |
35
American Beacon FundsSM
Notes to Financial Statements
August 31, 2020
Sound Point Capital Management, LP
All Assets | 0.35 | % |
The Management and Sub-Advisory Fees paid by the Funds for the year ended August 31, 2020 were as follows:
SiM High Yield Opportunities Fund
| Effective Fee Rate | Amount of Fees Paid | |||||||||||
Management Fees | 0.35 | % | $ | 4,273,611 | ||||||||
Sub-Advisor Fees | 0.37 | % | 4,539,090 | |||||||||
|
|
|
| |||||||||
Total | 0.72 | % | $ | 8,812,701 | ||||||||
|
|
|
| |||||||||
Sound Point Floating Rate Income Fund
| Effective Fee Rate | Amount of Fees Paid | |||||||||||
Management Fees | 0.35 | % | $ | 3,237,835 | ||||||||
Sub-Advisor Fees | 0.35 | % | 3,225,484 | |||||||||
|
|
|
| |||||||||
Total | 0.70 | % | $ | 6,463,319 | ||||||||
|
|
|
| |||||||||
Distribution Plans
Separate Distribution Plans (the “Distribution Plans”) have been adopted pursuant to Rule 12b-1 under the Act for the A, C and SP Classes of the Funds. Under the Distribution Plans, as compensation for distribution and shareholder servicing assistance, the Funds’ Distributor, Resolute Investment Distributors, Inc. (“RID” or “Distributor”), receives an annual fee of 0.25% of the average daily net assets of the A and SP Classes and 1.00% of the average daily net assets of the C Class. The fee will be payable without regard to whether the amount of the fee is more or less than the actual expenses incurred in a particular month by the Distributor for distribution assistance.
For all other share classes, the Funds have utilized a “defensive” distribution plan (the “Plan”) pursuant to which no separate fees may be charged to the Funds for distribution purposes. However, the Plan authorizes the use of management fees received by the Manager and/or the investment advisors hired by the Manager for distribution purposes. Under this Plan, the Funds do not intend to compensate the Manager or any other party, either directly or indirectly, for the distribution of Fund shares from these fees.
Service Plans
The Investor, A and C Classes have each adopted a Service Plan (collectively, the “Plans”). The Plans authorize the payment to the Manager an annual fee up to 0.375% of the average daily net assets of the Investor Class, up to 0.25% of the average daily net assets of the A Class and up to 0.25% of the average daily net assets of the C Class. In addition, the Funds may reimburse the Manager for certain non-distribution shareholder services provided by financial intermediaries attributable to Y Class and R5 Class. The Manager or other approved entities may spend such amounts on any activities or expenses primarily intended to result in or relate to the servicing of A Class, C Class, Y Class, R5 Class and Investor Class including, but not limited to, payment of shareholder service fees and transfer agency or sub-transfer agency expenses. The fees will be payable monthly in arrears. The primary expenses expected to be incurred under the Plans are shareholder servicing, record keeping fees and servicing fees paid to financial intermediaries such as plan sponsors and broker-dealers.
36
American Beacon FundsSM
Notes to Financial Statements
August 31, 2020
Sub-Transfer Agent Fees
The Manager has entered into agreements, which include servicing agreements, with financial intermediaries that provide recordkeeping, processing, shareholder communications and other services to customers of the intermediaries that hold positions in the R5 and Y Classes of the Funds and has agreed to compensate the intermediaries for providing these services. Intermediaries transact with the Funds primarily through the use of omnibus accounts on behalf of their customers who hold positions in the Funds. Certain services would have been provided by the Funds’ transfer agent and other service providers if the shareholders’ accounts were maintained directly by the Funds’ transfer agent. Accordingly, the Funds, pursuant to Board approval, have agreed to reimburse the Manager for certain non-distribution shareholder services provided by financial intermediaries for the R5 and Y Classes. The reimbursement amounts (sub-transfer agent fees) paid to the Manager are subject to a fee limit of up to 0.10% of an intermediary’s average net assets in the R5 and Y Classes on an annual basis. During the year ended August 31, 2020, the sub-transfer agent fees, as reflected in “Transfer agent fees” on the Statements of Operations, were as follows:
Fund | Sub-Transfer Agent Fees | |||
SiM High Yield Opportunities | $ | 821,472 | ||
Sound Point Floating Rate Income | 503,769 | |||
As of August 31, 2020, the Funds owed the Manager the following reimbursement of sub-transfer agent fees, as reflected in “Transfer agent fees payable” on the Statements of Assets and Liabilities:
Fund | Reimbursement Sub-Transfer Agent Fees | |||
SiM High Yield Opportunities | $ | 69,604 | ||
Sound Point Floating Rate Income | 27,173 | |||
Investments in Affiliated Funds
The Funds may invest in the American Beacon U.S. Government Money Market Select Fund (the “USG Select Fund”). The Funds listed below held the following shares with an August 31, 2020 fair value and dividend income earned from the investment in the USG Select Fund.
Affiliated Security | Type of Transaction | Fund | August 31, 2020 Shares/Principal | Change in Unrealized Gain (Loss) | Realized Gain (Loss) | Dividend Income | August 31, 2020 Fair Value | |||||||||||||||||
U.S. Government Money Market Select Fund | Direct | SiM High Yield Opportunities | $ | 19,195,338 | $ | - | $ | - | $ | 208,945 | $ | 19,195,338 | ||||||||||||
U.S. Government Money Market Select Fund | Direct | Sound Point Floating Rate Income | 64,749,576 | - | - | 459,302 | 64,749,576 | |||||||||||||||||
The Funds and the USG Select Fund have the same investment advisor and therefore, are considered to be affiliated. The Manager serves as investment advisor to the USG Select Fund and receives management fees and administrative fees totaling 0.10% of the average daily net assets of the USG Select Fund. During the year ended August 31, 2020, the Manager earned fees on the Funds’ direct investments in the USG Select Fund as shown below:
Fund | Direct Investments in USG Select Fund | |||
SiM High Yield Opportunities | $ | 19,860 | ||
Sound Point Floating Rate Income | 46,986 | |||
Interfund Credit Facility
Pursuant to an exemptive order issued by the U.S. Securities and Exchange Commission (“SEC”), the Funds, along with other registered investment companies having management contracts with the Manager, may
37
American Beacon FundsSM
Notes to Financial Statements
August 31, 2020
participate in a credit facility whereby each fund, under certain conditions, is permitted to lend money directly to and borrow directly from other participating funds for temporary purposes. The interfund credit facility is advantageous to the funds because it provides added liquidity and eliminates the need to maintain higher cash balances to meet redemptions. This situation could arise when shareholder redemptions exceed anticipated volumes and certain funds have insufficient cash on hand to satisfy such redemptions or when sales of securities do not settle as expected, resulting in a cash shortfall for a fund. When a fund liquidates portfolio securities to meet redemption requests, they often do not receive payment in settlement for up to two days (or longer for certain foreign transactions). Redemption requests normally are satisfied on the next business day. The credit facility provides a source of immediate, short-term liquidity pending settlement of the sale of portfolio securities. The credit facility is administered by a credit facility team consisting of professionals from the Manager’s asset management, compliance, and accounting areas who report the activities of the credit facility to the Board. During the year ended August 31, 2020, the SiM High Yield Opportunities Fund borrowed $2,493,640 for 1 day at an interest rate of 2.16% with interest charges of $148 and the Sound Point Floating Rate Income Fund borrowed on average $19,302,633 for 14 days at an average interest rate of 1.41% with interest charges of $10,751. These amounts are recorded as “Other expenses” in the Statements of Operations.
Expense Reimbursement Plan
The Manager contractually agreed to reduce fees and/or reimburse expenses for the classes of the Funds to the extent that total operating expenses exceed the Funds’ expense cap. During the year ended August 31, 2020, the Manager waived and/or reimbursed expenses as follows:
| Expense Cap | Expiration of Reimbursed Expenses | |||||||||||||||||||||
Fund | Class | 9/1/2019 - 12/31/2019 | 1/1/2020 - 8/31/2020 | Reimbursed Expenses | (Recouped) Expenses | |||||||||||||||||
SiM High Yield Opportunities | R5* | 0.84 | % | - | $ | 43,974 | $ | (88,767 | )** | 2022-2023 | ||||||||||||
* Formerly Institutional Class.
** This amount represents Recouped Expenses from prior fiscal years and is reflected in Total Expenses on the Statements of Operations.
Of these amounts, $5,050 and $42 were disclosed as a payable to the Manager on the Statements of Assets and Liabilities at August 31, 2020 for the SiM High Yield Opportunities Fund and Sound Point Floating Rate Income Fund, respectively.
The Funds have adopted an Expense Reimbursement Plan whereby the Manager may seek repayment of such fee or voluntary reductions and expense reimbursements. Under the policy, the Manager can be reimbursed by the Funds for any contractual or voluntary fee reductions or expense reimbursements if reimbursement to the Manager (a) occurs within three years from the date of the Manager’s waiver/reimbursement and (b) does not cause the Funds’ annual operating expenses to exceed the lesser of the contractual percentage limit in effect at the time of the waiver/reimbursement or time of recoupment. The reimbursed expenses listed above will expire in 2022 and 2023. The carryover of excess expenses potentially reimbursable to the Manager, but not recorded as a liability are as follows:
Fund | Recouped Expenses | Excess Expense Carryover | Expired Expense Carryover | Expiration of Reimbursed Expenses | ||||||||||||
SiM High Yield Opportunities | $ | 12,941 | $ | - | $ | - | 2019-2020 | |||||||||
SiM High Yield Opportunities | 75,826 | 32,682 | - | 2020-2021 | ||||||||||||
SiM High Yield Opportunities | - | 53,922 | - | 2021-2022 | ||||||||||||
Sound Point Floating Rate Income | - | - | 18,867 | 2019-2020 | ||||||||||||
Sound Point Floating Rate Income | - | 25,680 | - | 2020-2021 | ||||||||||||
Sound Point Floating Rate Income | - | 62,727 | - | 2021-2022 | ||||||||||||
38
American Beacon FundsSM
Notes to Financial Statements
August 31, 2020
Sales Commissions
The Funds’ Distributor, Resolute Investment Distributors, Inc. (“RID” or “Distributor”), may receive a portion of Class A sales charges from broker dealers which may be used to offset distribution related expenses. During the year ended August 31, 2020, RID collected $1,399 and $1,744 for SiM High Yield Opportunities Fund and Sound Point Floating Rate Income Fund, respectively, from the sale of Class A Shares.
A CDSC of 0.50% will be deducted with respect to Class A Shares on certain purchases of $1,000,000 or more that are redeemed in whole or part within 18 months of purchase, unless waived as discussed in the Funds’ Prospectus. Any applicable CDSC will be 0.50% of the lesser of the original purchase price or the value of the redemption of the Class A Shares redeemed. During the year ended August 31, 2020, CDSC fees of $8,519 were collected for the Class A Shares of Sound Point Floating Rate Income Fund, There were no CDSC fees collected for the Class A Shares of SiM High Yield Opportunities Fund.
A CDSC of 1.00% will be deducted with respect to Class C Shares redeemed within 12 months of purchase, unless waived as discussed in the Funds’ Prospectus. Any applicable CDSC will be 1.00% of the lesser of the original purchase price or the value of the redemption of the Class C Shares redeemed. During the year ended August 31, 2020, CDSC fees of $6,503 and $12,066 were collected for the Class C Shares of SiM High Yield Opportunities Fund and Sound Point Floating Rate Income Fund, respectively.
Trustee Fees and Expenses
Effective January 1, 2020, as compensation for their service to the American Beacon Funds Complex, including the Trust (collectively, the “Trusts”), each Trustee is compensated from the Trusts as follows: (1) an annual retainer of $120,000; (2) meeting attendance fee (for attendance in person or via teleconference) of (a) $12,000 for in person attendance, or $5,000 for telephonic attendance, by Board members for each regularly scheduled or special Board meeting, (b) $2,500 for attendance by Committee members at meetings of the Audit Committee and the Investment Committee, (c) $1,500 for attendance by Committee members at meetings of the Nominating and Governance Committee; and (d) $2,500 for attendance by Board members for each special telephonic Board meeting; and (3) reimbursement of reasonable expenses incurred in attending Board meetings, Committee meetings, and relevant educational seminars. The Trustees also may be compensated for attendance at special Board and/or Committee meetings from time to time. For her service as Board Chair, Ms. Cline receives an additional annual retainer of $50,000. Although she attends several committee meetings at each quarterly Board meeting, she receives only a single $2,500 fee each quarter for her attendance at those meetings. The chairpersons of the Audit Committee and the Investment Committee each receive an additional annual retainer of $25,000 and the Chair of the Nominating and Governance Committee receives an additional annual retainer of $15,000.
3. Security Valuation and Fair Value Measurements
The price of the Fund’s shares is based on its net asset value (“NAV”) per share. The Fund’s NAV is computed by adding total assets, subtracting all the Fund’s liabilities, and dividing the result by the total number of shares outstanding.
The NAV of each class of the Fund’s shares is determined based on a pro rata allocation of the Fund’s investment income, expenses and total capital gains and losses. The Fund’s NAV per share is determined each business day as of the regular close of trading on the New York Stock Exchange (“NYSE” or “Exchange”), which is typically 4:00 p.m. Eastern Time (“ET”). However, if trading on the NYSE closes at a time other than 4:00 p.m. ET, the Fund’s NAV per share typically would still be determined as of the regular close of trading on the NYSE. The Fund does not price its shares on days that the NYSE is closed. Foreign exchanges may permit trading in foreign securities on days when the Fund is not open for business, which may result in the value of the Fund’s portfolio investments being affected at a time when you are unable to buy or sell shares.
39
American Beacon FundsSM
Notes to Financial Statements
August 31, 2020
Equity securities, including shares of closed-end funds and exchange-traded funds (“ETFs”), are valued at the last sale price or official closing price taken from the primary exchange in which each security trades. Investments in other mutual funds are valued at the closing NAV per share on the day of valuation. Debt securities are valued at bid quotes from broker/dealers or evaluated bid prices from pricing services, who may consider a number of inputs and factors, such as prices of comparable securities, yield curves, spreads, credit ratings, coupon rates, maturity, default rates, and underlying collateral. Futures are valued based on their daily settlement prices. Exchange-traded and over-the-counter (“OTC”) options are valued at the last sale price. Options with no last sale for the day are priced at mid quote. Swaps are valued at evaluated mid prices from pricing services.
The valuation of securities traded on foreign markets and certain fixed-income securities will generally be based on prices determined as of the earlier closing time of the markets on which they primarily trade unless a significant event has occurred. When the Fund holds securities or other assets that are denominated in a foreign currency, the Fund will normally use the currency exchange rates as of 4:00 p.m. ET.
Securities may be valued at fair value, as determined in good faith and pursuant to procedures approved by the Board, under certain limited circumstances. For example, fair value pricing will be used when market quotations are not readily available or reliable, as determined by the Manager, such as when (i) trading for a security is restricted or stopped; (ii) a security’s trading market is closed (other than customary closings); or (iii) a security has been de-listed from a national exchange. A security with limited market liquidity may require fair value pricing if the Manager determines that the available price does not reflect the security’s true market value. In addition, if a significant event that the Manager determines to affect the value of one or more securities held by the Fund occurs after the close of a related exchange but before the determination of the Fund’s NAV, fair value pricing may be used on the affected security or securities. Securities of small-capitalization companies are also more likely to require a fair value determination using these procedures because they are more thinly traded and less liquid than the securities of larger-capitalization companies. The Fund may fair value securities as a result of significant events occurring after the close of the foreign markets in which the Fund invests as described below. In addition, the Fund may invest in illiquid securities requiring these procedures.
The Fund may use fair value pricing for securities primarily traded in non-U.S. markets because most foreign markets close well before the Fund’s pricing time of 4:00 p.m. ET. The earlier close of these foreign markets gives rise to the possibility that significant events, including broad market moves, may have occurred in the interim and may materially affect the value of those securities. If the Manager determines that the last quoted prices of non-U.S. securities will, in its judgment, materially affect the value of some or all its portfolio securities, the Manager can adjust the previous closing prices to reflect what it believes to be the fair value of the securities as of the close of the Exchange. In deciding whether it is necessary to adjust closing prices to reflect fair value, the Manager reviews a variety of factors, including developments in foreign markets, the performance of U.S. securities markets, and the performance of instruments trading in U.S. markets that represent foreign securities and baskets of foreign securities. These securities are fair valued using a pricing service, using methods approved by the Board, that considers the correlation of the trading patterns of the foreign security to intraday trading in the U.S. markets, based on indices of domestic securities and other appropriate indicators such as prices of relevant American Depositary Receipts (“ADRs”) and futures contracts. The Valuation Committee, established by the Board, may also fair value securities in other situations, such as when a particular foreign market is closed but the Fund is open. The Fund uses outside pricing services to provide closing prices and information to evaluate and/or adjust those prices. As a means of evaluating its security valuation process, the Valuation Committee routinely compares closing prices, the next day’s opening prices in the same markets and adjusted prices.
Attempts to determine the fair value of securities introduce an element of subjectivity to the pricing of securities. As a result, the price of a security determined through fair valuation techniques may differ from the price quoted or published by other sources and may not accurately reflect the market value of the security when trading resumes. If a reliable market quotation becomes available for a security formerly valued through fair valuation techniques, the Manager compares the new market quotation to the fair value price to evaluate the effectiveness of the Fund’s fair valuation procedures. If any significant discrepancies are found, the Manager may adjust the Fund’s fair valuation procedures.
40
American Beacon FundsSM
Notes to Financial Statements
August 31, 2020
Valuation Inputs
Various inputs may be used to determine the fair value of the Funds’ investments. These inputs are summarized in three broad levels for financial statement purposes. The inputs or methodologies used to value securities are not necessarily an indication of the risk associated with investing in those securities.
| Level 1 | - | Quoted prices in active markets for identical securities. | ||
| Level 2 | - | Prices determined using other significant observable inputs. These may include quoted prices for similar securities, interest rates, prepayment speeds, credit risk, and others. | ||
| Level 3 | - | Prices determined using other significant unobservable inputs. Unobservable inputs reflect the Fund’s own assumptions about the factors market participants would use in pricing an investment. | ||
Level 1 and Level 2 trading assets and trading liabilities, at fair value
Common stocks, preferred securities, ETFs, and financial derivative instruments, such as futures contracts that are traded on a national securities exchange, are stated at the last reported sale or settlement price on the day of valuation. To the extent these securities are actively traded and valuation adjustments are not applied, they are categorized as Level 1 of the fair value hierarchy. Preferred securities and other equities traded on inactive markets or valued by reference to similar instruments are generally categorized as Level 2 of the fair value hierarchy.
Fixed-income securities including corporate, convertible and municipal bonds and notes, U.S. government agencies, U.S. Treasury obligations, sovereign issues, bank loans, convertible preferred securities, and non-U.S. bonds are normally valued by pricing service providers that use broker dealer quotations, reported trades or valuation estimates from their internal pricing models. The service providers’ internal models use inputs that are observable such as issuer details, interest rates, yield curves, prepayment speeds, credit risks/spreads, default rates, and quoted prices for similar assets. Securities that use similar valuation techniques and inputs as described above are categorized as Level 2 of the fair value hierarchy. Fixed-income securities purchased on a delayed-delivery basis are marked-to-market daily until settlement at the forward settlement date and are categorized as Level 2 of the fair value hierarchy.
Investments in registered open-end investment management companies will be valued based upon the NAVs of such investments and are categorized as Level 1 of the fair value hierarchy.
Level 3 trading assets and trading liabilities, at fair value
The valuation techniques and significant inputs used in determining the fair values of financial instruments classified as Level 3 of the fair value hierarchy are as follows.
Securities and other assets for which market quotes are not readily available are valued at fair value as determined in good faith by the Board or persons acting at their direction and may be categorized as Level 3 of the fair value hierarchy.
Market quotes are considered not readily available in circumstances where there is an absence of current or reliable market-based data (e.g., trade information or broker quotes), including where events occur after the close of the relevant market, but prior to the Exchange close, that materially affect the values of the Fund’s securities or assets. In addition, market quotes are considered not readily available when, due to extraordinary circumstances, the exchanges or markets on which the securities trade, do not open for trading for the entire day and no other market prices are available. The Board has delegated to the Manager the responsibility for monitoring significant events that may materially affect the fair values of a Fund’s securities or assets and for determining whether the value of the applicable securities or assets should be re-evaluated in light of such significant events.
41
American Beacon FundsSM
Notes to Financial Statements
August 31, 2020
The Board has adopted methods for valuing securities and other assets in circumstances where market quotes are not readily available, and has delegated the responsibility for applying the valuation methods to the Manager. For instances in which daily market quotes are not readily available, investments may be valued pursuant to guidelines established by the Board. In the event that the security or asset cannot be valued, pursuant to one of the valuation methods established by the Board, the fair value of the security or asset will be determined in good faith by the Valuation Committee, generally based upon recommendations provided by the Manager.
When a Fund uses fair valuation methods applied by the Manager that use significant unobservable inputs to determine its NAV, the securities priced using this methodology are categorized as Level 3 of the fair value hierarchy. These methods may require subjective determinations about the value of a security. While the Trust’s policy is intended to result in a calculation of the Fund’s NAV that fairly reflects security values as of the time of pricing, the Trust cannot guarantee that values determined by the Board or persons acting at their direction would accurately reflect the price that a Fund could obtain for a security if it were to dispose of that security as of the time of pricing (for instance, in a forced or distressed sale). The prices used by a Fund may differ from the value that would be realized if the securities were sold.
4. Securities and Other Investments
Bank Loans and Senior Loans
Bank loans are fixed and floating rate loans arranged through private negotiations between a company or a non-U.S. government and one or more financial institutions (lenders). The Funds may invest in senior loans, which are floating rate loans, sometimes referred to as adjustable rate loans that hold a senior position in the capital structure of U.S. and foreign corporations, partnerships or other business entities. Under normal circumstances, senior loans have priority of claim ahead of other obligations of a borrower in the event of liquidation. Bank loans and senior loans may be collateralized or uncollateralized. They pay interest at rates that float above, or are adjusted periodically based on, a benchmark that reflects current interest rates. The Funds may invest in such loans in the form of participations in loans and assignments of all or a portion of loans from third parties. The purchaser of an assignment typically succeeds to all the rights and obligations of the assigning institution and becomes a lender under the credit agreement with respect to the debt obligation; however, the purchaser’s rights can be more restricted than those of the assigning institution, and, in any event, the Funds may not be able to unilaterally enforce all rights and remedies under the loan and with regard to any associated collateral. A participation typically results in a contractual relationship only with the institution participating out the interest, not with the borrower. In purchasing participations, the Funds generally will have no right to enforce compliance by the borrower with the terms of the loan agreement, nor any rights of set-off against the borrower, and the Funds may not benefit directly from any collateral supporting the loan in which it has purchased the participation. As a result, the Fund will be exposed to the credit risk of both the borrower and the institution selling the participation. When the Fund purchases assignments from lenders, it will acquire direct rights against the borrower on the loan.
Common Stock
Common stock generally takes the form of shares in a corporation which represent an ownership interest. It ranks below preferred stock and debt securities in claims for dividends and for assets of the company in a liquidation or bankruptcy. The value of a company’s common stock may fall as a result of factors directly relating to that company, such as decisions made by its management or decreased demand for the company’s products or services. A stock’s value may also decline because of factors affecting not just the company, but also companies in the same industry or sector. The price of a company’s stock may also be affected by changes in financial markets that are relatively unrelated to the company, such as changes in interest rates, currency exchange rates or industry regulation. Companies that elect to pay dividends on their common stock generally only do so after they invest in their own business and make required payments to bondholders and on other debt and preferred stock. Therefore, the value of a company’s common stock will usually be more volatile than its bonds, other debt and preferred stock. Common stock may be exchange-traded or OTC. OTC stock may be less liquid than exchange-traded stock.
42
American Beacon FundsSM
Notes to Financial Statements
August 31, 2020
Convertible Securities
Convertible securities are hybrid securities that combine the investment characteristics of bonds and common stocks. Convertible securities include corporate bonds, notes, preferred stock or other securities that may be converted into or exchanged for a prescribed amount of common stock of the same or a different issuer within a particular period of time at a specified price or formula. A convertible security entitles the holder to receive interest paid or accrued on debt or dividends paid on preferred stock until the convertible security matures or is redeemed, converted or exchanged. While no securities investment is without some risk, investments in convertible securities generally entail less risk than the issuer’s common stock, although the extent to which such risk is reduced depends in large measure upon the degree to which the convertible security sells above its value as a fixed income security. The market value of convertible securities tends to decline as interest rates increase and, conversely, to increase as interest rates decline. While convertible securities generally offer lower interest or dividend yields than non-convertible debt securities of similar quality, they do enable the investor to benefit from increases in the market price of the underlying common stock. Holders of convertible securities have a claim on the assets of the issuer prior to the common stockholders, but may be subordinated to holders of similar non-convertible securities of the same issuer. Because of the conversion feature, certain convertible securities may be considered equity equivalents.
Corporate Debt and Other Fixed-Income Securities
The Funds may hold debt, including government and corporate debt, and other fixed-income securities. The investment return of corporate debt securities reflects interest earning and changes in the market value of the security. Typically, the values of fixed-income securities change inversely with prevailing interest rates. Therefore, a fundamental risk of fixed-income securities is interest rate risk, which is the risk that their value will generally decline as prevailing interest rates rise, which may cause a Fund’s NAV to likewise decrease, and vice versa. How specific fixed-income securities may react to changes in interest rates will depend on specific characteristics of each security. Fixed-income securities are also subject to credit risk, which is the risk that the credit strength of an issuer of a fixed-income security will weaken and/or that the issuer will be unable to make timely principal and interest payments and that the security may go into default.
Delayed Funding Loans and Revolving Credit Facilities
The Funds may enter into delayed funding loans and revolving credit facilities. Delayed funding loans and revolving credit facilities are borrowing arrangements in which the lender agrees to make loans up to a maximum amount upon demand by the borrower during a specific term. A revolving credit facility differs from a delayed funding loan in that as the borrower repays the loan, an amount equal to the repayment may be borrowed again during the term of the revolving credit facility. Delayed funding loans and revolving credit facilities usually provide for floating or variable rates of interest. These commitments may have the effect of requiring a Fund to increase its investment in a company at a time when it might not otherwise decide to do so (including at a time when the company’s financial condition makes it unlikely that such amounts will be repaid). To the extent that a Fund is committed to advance additional funds, it will at all times segregate or “earmark” assets, determined to be liquid in accordance with procedures established by the Board, in an amount sufficient to meet such commitments.
The Funds may invest in delayed funding loans and revolving credit facilities with credit quality comparable to that of issuers of its securities investments. Delayed funding loans and revolving credit facilities may be subject to restrictions on transfer, and only limited opportunities may exist to resell such instruments. As a result, a Fund may be unable to sell such investments at an opportune time or may have to resell them at less than fair market value.
The Funds earn a commitment fee, typically set as a percentage of the commitment amount. Such fee income, which is included in “Interest income” on the Statements of Operations, is recognized ratably over the commitment period. Unfunded floating rate loan interests are marked-to-market daily, and any unrealized appreciation (depreciation) is included on the Statements of Assets and Liabilities and Statements of Operations.
43
American Beacon FundsSM
Notes to Financial Statements
August 31, 2020
Floating Rate Securities
The coupons on certain fixed income securities in which the Funds may invest are not fixed and may fluctuate based upon changes in market rates. The coupon on a floating rate security is generally based on an interest rate such as a money market index, LIBOR or a Treasury bill rate. Floating rate obligations are less effective than fixed rate obligations at locking in a particular yield. Nevertheless, such obligations are subject to interest rate risk and may fluctuate in value in response to interest rate changes if there is a delay between changes in market interest rates and the interest reset date for the obligation, or for other reasons.
As short-term interest rates decline, the coupons on floating rate securities typically should decrease. Alternatively, during periods of increasing interest rates, changes in the coupons of floating rate securities may lag behind changes in market rates or may have limits on the maximum increases in the coupon rates. The value of floating rate securities may decline if their coupons do not rise as much, or as quickly, as interest rates in general. Floating rate securities will not generally increase in value if interest rates decline.
In connection with floating rate loan interests, the Funds may also enter into unfunded floating rate loan interests (“commitments”). In connection with these commitments, the Funds earn a commitment fee, typically set as a percentage of the commitment amount. Such fee income, which is included in “Interest income” on the Statements of Operations, is recognized ratably over the commitment period. Unfunded floating rate loan interests are marked-to-market daily, and any unrealized appreciation (depreciation) is included on the Statements of Assets and Liabilities and Statements of Operations.
Foreign Debt Securities
The Funds may invest in foreign fixed and floating rate income securities (including emerging market securities) all or a portion of which may be non-U.S. dollar denominated and which include: (a) debt obligations issued or guaranteed by foreign national, provincial, state, municipal or other governments with taxing authority or by their agencies or instrumentalities, including Brady Bonds; (b) debt obligations of supranational entities; (c) debt obligations of the U.S. Government issued in non-dollar securities; (d) debt obligations and other fixed income securities of foreign corporate issuers (both dollar and non-dollar denominated); and (e) U.S. corporate issuers (both Eurodollar and non-dollar denominated). There is no minimum rating criteria for the Funds’ investments in such securities. Investing in the securities of foreign issuers involves special considerations that are not typically associated with investing in the securities of U.S. issuers. In addition, emerging markets are markets that have risks that are different and higher than those in more developed markets.
Foreign Securities
The Funds may invest in U.S. dollar-denominated and non-U.S. dollar denominated equity and debt securities of foreign issuers and foreign branches of U.S. banks, including negotiable certificates of deposit (“CDs”), bankers’ acceptances, and commercial paper. Foreign issuers are issuers organized and doing business principally outside the United States and include corporations, banks, non-U.S. governments, and quasi-governmental organizations. While investments in foreign securities may be intended to reduce risk by providing further diversification, such investments involve sovereign and other risks, in addition to the credit and market risks normally associated with domestic securities. These additional risks include the possibility of adverse political and economic developments (including political or social instability, nationalization, expropriation, or confiscatory taxation); the potentially adverse effects of unavailability of public information regarding issuers, different governmental supervision and regulation of financial markets, reduced liquidity of certain financial markets, and the lack of uniform accounting, auditing, and financial reporting standards or the application of standards that are different or less stringent than those applied in the United States; different laws and customs governing securities tracking; and possibly limited access to the courts to enforce the Funds’ rights as an investor.
44
American Beacon FundsSM
Notes to Financial Statements
August 31, 2020
High-Yield Securities
High yield, non-investment grade bonds (also known as “junk bonds”) are low-quality, high-risk corporate bonds that generally offer a high level of current income. These bonds are considered speculative by rating organizations. High yield bonds are often issued as a result of corporate restructurings, such as leveraged buyouts, mergers, acquisitions, or other similar events. They may also be issued by smaller, less creditworthy companies or by highly leveraged firms, which are generally less able to make scheduled payments of interest and principal than more financially stable firms. Because of their low credit quality, high-yield bonds must pay higher interest to compensate investors for the substantial credit risk they assume.
Lower-rated securities are subject to certain risks that may not be present with investments in higher-grade securities. Investors should consider carefully their ability to assume the risks associated with lower-rated securities before investing in the Fund. The lower rating of certain high yielding corporate income securities reflects a greater possibility that the financial condition of the issuer or adverse changes in general economic conditions may impair the ability of the issuer to pay income and principal. Changes by rating agencies in their ratings of a fixed income security also may affect the value of these investments. However, allocating investments in the Fund among securities of different issuers should reduce the risks of owning any such securities separately. The prices of these high yielding securities tend to be less sensitive to interest rate changes than higher-rated investments, but more sensitive to adverse economic changes or individual corporate developments. During economic downturns or periods of rising interest rates, highly leveraged issuers may experience financial stress that adversely affects their ability to service principal and interest payment obligations, to meet projected business goals or to obtain additional financing, and the markets for their securities may be more volatile. If an issuer defaults, the Fund may incur additional expenses to seek recovery. Additionally, accruals of interest income for the Fund may have to be adjusted in the event of default. In the event of an issuer’s default, the Fund may write off prior income accruals for that issuer, resulting in a reduction in the Fund’s current dividend payment. Frequently, the higher yields of high-yielding securities may not reflect the value of the income stream that holders of such securities may expect, but rather the risk that such securities may lose a substantial portion of their value as a result of their issuer’s financial restructuring or default. Additionally, an economic downturn or an increase in interest rates could have a negative effect on the high-yield securities market and on the market value of the high-yield securities held by the Fund, as well as on the ability of the issuers of such securities to repay principal and interest on their borrowings.
Illiquid and Restricted Securities
Generally, an illiquid asset is an asset that the Funds reasonably expect cannot be sold or disposed of in current market conditions in seven calendar days or less without the sale or disposition significantly changing the market value of the investment, as determined pursuant to Rule 22e-4 under the Investment Company Act or as otherwise permitted or required by SEC rules and interpretations. Historically, illiquid securities have included securities that have not been registered under the Securities Act, securities that are otherwise not readily marketable, and repurchase agreements having a remaining maturity of longer than seven calendar days. Securities that have not been registered under the Securities Act are referred to as private placements or restricted securities and are purchased directly from the issuer or in the secondary market. These securities may be sold only in a privately negotiated transaction or pursuant to an exemption from registration. A large institutional market exists for certain securities that are not registered under the Securities Act, including repurchase agreements, commercial paper, foreign securities, municipal securities and corporate bonds and notes. Institutional investors depend on an efficient institutional market in which the unregistered security can be readily resold or on an issuer’s ability to honor a demand for repayment. However, the fact that there are contractual or legal restrictions on resale of such investments to the general public or to certain institutions may not be indicative of their liquidity.
Limitations on resale may have an adverse effect on the marketability of portfolio securities, and the Fund might be unable to dispose of restricted or other illiquid securities promptly or at reasonable prices and might
45
American Beacon FundsSM
Notes to Financial Statements
August 31, 2020
thereby experience difficulty satisfying redemptions within seven calendar days. In addition, the Fund may get only limited information about an issuer, so it may be less able to predict a loss. The Fund also might have to register such restricted securities in order to dispose of them resulting in additional expense and delay. Adverse market conditions could impede such a public offering of securities.
In recognition of the increased size and liquidity of the institutional market for unregistered securities and the importance of institutional investors in the formation of capital, the SEC adopted Rule 144A under the Securities Act. Rule 144A is designed to facilitate efficient trading among institutional investors by permitting the sale of certain unregistered securities to qualified institutional buyers. To the extent privately placed securities held by the Fund qualify under Rule 144A and an institutional market develops for those securities, the Fund likely will be able to dispose of the securities without registering them under the Securities Act. To the extent that institutional buyers become, for a time, uninterested in purchasing these securities, investing in Rule 144A securities could increase the level of the Fund’s illiquidity. The Manager or the Sub-Advisor, as applicable, may determine that certain securities qualified for trading under Rule 144A are liquid. Regulation S under the Securities Act permits the sale abroad of securities that are not registered for sale in the United States and includes a provision for U.S. investors, such as the Fund, to purchase such unregistered securities if certain conditions are met.
Securities sold in private placement offerings made in reliance on the “private placement” exemption from registration afforded by Section 4(a)(2) of the Securities Act and resold to qualified institutional buyers under Rule 144A under the Securities Act (“Section 4(a)(2) securities”) are restricted as to disposition under the federal securities laws, and generally are sold to institutional investors, such as the Fund, that agree they are purchasing the securities for investment and not with an intention to distribute to the public. Any resale by the purchaser must be pursuant to an exempt transaction and may be accomplished in accordance with Rule 144A. Section 4(a)(2) securities normally are resold to other institutional investors through or with the assistance of the issuer or dealers that make a market in the Section 4(a)(2) securities, thus providing liquidity.
Restricted securities outstanding during the year ended August 31, 2020 are disclosed in the Notes to the Schedules of Investments.
Inflation-Indexed Bonds
Inflation-indexed securities, also known as “inflation-protected securities,” are fixed income instruments structured such that their interest payments and principal amounts are adjusted to keep up with inflation. In periods of deflation when the inflation rate is declining, the principal value of an inflation-indexed security will be adjusted downward. This will result in a decrease in the interest payments thereon. The U.S. Treasury is obligated to repay at least the original principal value at maturity for inflation-indexed securities issued directly by the U.S. Government. However, inflation-indexed securities of other issuers may or may not have the same principal guarantee and may repay an amount less than the original principal value at maturity. Any increase in the principal amount of an inflation-indexed debt security will be considered ordinary income, even though a Fund will not receive the principal until maturity.
There can be no assurance that the inflation index used will accurately measure the real rate of inflation in the prices of goods and services. A Fund’s investments in inflation-indexed securities may lose value in the event that the actual rate of inflation is different than the rate of the inflation index. In addition, inflation-indexed securities are subject to the risk that the Consumer Price Index for All Urban Consumers (the index used for U.S. Treasury inflation-indexed securities) or other relevant pricing index (such as LIBOR) may be discontinued, fundamentally altered in a manner materially adverse to the interests of an investor in the securities, altered by legislation or Executive Order in a materially adverse manner to the interests of an investor in the securities or substituted with an alternative index.
Other Investment Company Securities and Other Exchange-Traded Products
The Funds may invest in shares of other investment companies, including open-end funds, closed-end funds, business development companies (“BDCs”), ETFs, unit investment trusts, and other investment companies of the
46
American Beacon FundsSM
Notes to Financial Statements
August 31, 2020
Trust. The Funds may invest in securities of an investment company advised by the Manager or a sub-advisor. Investments in the securities of other investment companies may involve duplication of advisory fees and certain other expenses. By investing in another investment company, the Funds become a shareholder of that investment company. As a result, the Funds’ shareholders indirectly will bear the Funds’ proportionate share of the fees and expenses paid by shareholders of the other investment company, in addition to the fees and expenses the Funds’ shareholders directly bear in connection with the Funds’ own operations. These other fees and expenses are reflected as Acquired Fund Fees and Expenses and are included in the Fees and Expenses Table for the Funds in their Prospectus, if applicable. Investments in other investment companies may involve the payment of substantial premiums above the value of such issuer’s portfolio securities.
Payment-In-Kind Securities
The Funds may invest in payment-in-kind securities (“PIKs”). PIKs give the issuer the option at each interest payment date of making interest payments in either cash or additional debt securities. Those additional debt securities usually have the same terms, including maturity dates and interest rates, and associated risks as the original bonds. The daily market quotations of the original bonds may include the accrued interest (referred to as a dirty price) and require a pro-rata adjustment from the “Unrealized appreciation (depreciation) of investments” to “Dividend and interest receivable” in the Statements of Assets and Liabilities.
Real Estate Investment Trusts
The Funds may own shares of real estate investment trusts (“REITs”) which report information on the source of their distributions annually. The Funds re-characterize distributions received from REIT investments based on information provided by the REITs into the following categories: ordinary income, long-term capital gains, and return of capital. If information is not available on a timely basis from the REITs, the re-characterization will be estimated based on available information, which may include the previous year allocation. If new or additional information becomes available from the REITs at a later date, a re-characterization will be made the following year.
5. Financial Derivative Instruments
The Funds may utilize derivative instruments to gain market exposure on cash balances to hedge foreign currency exposure or reduce market exposure in anticipation of liquidity needs. When considering the Funds’ use of derivatives, it is important to note that the Funds do not use derivatives for the purpose of creating financial leverage.
Futures Contracts
Futures contracts are contracts to buy or sell a standard quantity of securities at a specified price on a future date. The Funds may enter into financial futures contracts as a method for keeping assets readily convertible to cash if needed to meet shareholder redemptions or for other needs while maintaining exposure to the stock or bond market, as applicable. The primary risks associated with the use of futures contracts are the possibility of illiquid markets or imperfect correlation between the values of the contracts and the underlying securities or that the counterparty will fail to perform its obligations.
Upon entering into a futures contract, the Funds are required to set aside or deposit with a broker an amount, termed the initial margin, which typically represents a portion of the face value of the futures contract. The Funds usually reflects this amount on the Schedules of Investments as a U.S. Treasury Bill held as collateral for futures contracts or as cash deposited with broker on the Statements of Assets and Liabilities. Payments to and from the broker, known as variation margin, are required to be made on a daily basis as the price of the futures contract fluctuates. Changes in initial settlement values are accounted for as unrealized appreciation (depreciation) until the contracts are terminated, at which time realized gains and losses are recognized. Futures contracts are valued at the most recent settlement price established each day by the exchange on which they are traded.
47
American Beacon FundsSM
Notes to Financial Statements
August 31, 2020
During the year ended August 31, 2020, the SiM High Yield Opportunities Fund entered into futures contracts primarily for hedging and exposing cash to markets.
The Funds’ average futures contracts outstanding fluctuate throughout the operating year as required to meet strategic requirements. The following table illustrates the average quarterly volume of futures contracts. For the purpose of this disclosure, volume is measured by contracts outstanding at each quarter end.
Average Futures Contracts Outstanding | ||||
Fund | Year Ended August 31, 2020 | |||
SiM High Yield Opportunities | 663 | |||
The following is a summary of the fair valuations of the Funds’ derivative instruments categorized by risk
exposure(1):
SiM High Yield Opportunities Fund
| Fair values of financial instruments on the Statements of Assets and Liabilities as of August 31, 2020: |
| ||||||||||||||||||||||||||||||||||||||||||||||||||||||
| Derivatives not accounted for as hedging instruments |
|
| |||||||||||||||||||||||||||||||||||||||||||||||||||||
Liabilities: | Credit contracts | Foreign exchange contracts | Commodity contracts | Interest rate contracts | Equity contracts | Total | |||||||||||||||||||||||||||||||||||||||||||||||||
| Payable for variation margin from open futures contracts(2) | $ | – | $ | (2,372,006 | ) | $ | – | $ | – | $ | – | $ | (2,372,006 | ) | |||||||||||||||||||||||||||||||||||||||||
| The effect of financial derivative instruments on the Statements of Operations as of August 31, 2020: |
| ||||||||||||||||||||||||||||||||||||||||||||||||||||||
| Derivatives not accounted for as hedging instruments |
|
| |||||||||||||||||||||||||||||||||||||||||||||||||||||
Realized gain (loss) from derivatives | Credit contracts | Foreign exchange contracts | Commodity contracts | Interest rate contracts | Equity contracts | Total | |||||||||||||||||||||||||||||||||||||||||||||||||
| Futures contracts | $ | – | $ | 1,239,695 | $ | – | $ | – | $ | – | $ | 1,239,695 | |||||||||||||||||||||||||||||||||||||||||||
Net change in unrealized appreciation | Credit contracts | Foreign exchange contracts | Commodity contracts | Interest rate contracts | Equity contracts | Total | |||||||||||||||||||||||||||||||||||||||||||||||||
| Futures contracts | $ | – | $ | (3,223,953 | ) | $ | – | $ | – | $ | – | $ | (3,223,953 | ) | |||||||||||||||||||||||||||||||||||||||||
(1) See Note 3 in the Notes to Financial Statements for additional information.
(2) Includes cumulative appreciation (depreciation) of futures contracts as reported in the Fund’s Schedule of Investments footnotes. Only current day’s variation margin is reported within the Statements of Assets and Liabilities.
Offsetting Assets and Liabilities
The Funds are parties to enforceable master netting agreements between brokers and counterparties which provide for the right to offset under certain circumstances. The Funds employ multiple money managers and counterparties and have elected not to offset qualifying financial and derivative instruments on the Statements of Assets and Liabilities, as such all financial and derivative instruments are presented on a gross basis. The impacts of netting arrangements that provide the right to offset are detailed below, if applicable. The net amount represents the net receivable or payable that would be due from or to the counterparty in the event of default. Exposure from borrowings and other financing agreements such as repurchase agreements can only be netted across transactions governed by the same Master Agreement with the same legal entity. All amounts reported below represent the balance as of the report date, August 31, 2020.
48
American Beacon FundsSM
Notes to Financial Statements
August 31, 2020
SiM High Yield Opportunities Fund
| Offsetting of Financial and Derivative Assets as of August 31, 2020: | ||||||||||||
| Assets | Liabilities | ||||||||||
| Futures Contracts | $ | – | $ | 2,372,006 | ||||||||
|
|
|
| |||||||||
| Total derivative assets and liabilities in the Statement of Assets and Liabilities | $ | – | $ | 2,372,006 | ||||||||
|
|
|
| |||||||||
| Derivatives not subject to a Master Netting Agreement or similar agreement (“MNA”) | $ | – | $ | (2,372,006 | ) | |||||||
|
|
|
| |||||||||
6. Principal Risks
Investing in the Funds may involve certain risks including, but not limited to, those described below.
Convertible Securities Risk
The value of a convertible security typically increases or decreases with the price of the underlying common stock. In general, a convertible security is subject to the risks of stocks when the underlying stock’s price is high relative to the conversion price and is subject to the risks of debt securities when the underlying stock’s price is low relative to the conversion price. The general market risks of debt securities that are common to convertible securities include, but are not limited to, interest rate risk and credit risk. Many convertible securities have credit ratings that are below investment grade and are subject to the same risks as an investment in below investment grade debt securities (commonly known as “junk bonds”). Lower-rated debt securities may fluctuate more widely in price and yield than investment grade debt securities and may fall in price during times when the economy is weak or is expected to become weak. Convertible securities are subject to the risk that the credit standing of the issuer may have an effect on the convertible security’s investment value. In addition, to the extent the Fund invests in convertible securities issued by small- or mid-cap companies, it will be subject to the risks of investing in such companies. The stocks of small- and mid-cap companies may fluctuate more widely in price than the market as a whole and there may also be less trading in small- or mid-cap stocks. Convertible securities are sensitive to movement in interest rates.
Covenant-Lite Obligations Risk
Certain investments, such as loans in which the Funds may invest directly or have exposure to through its investments in structured securities, may be “covenant-lite.” Covenant-lite obligations contain fewer maintenance covenants than other obligations, or no maintenance covenants at all, and may not include terms which allow the lender to monitor the performance of the borrower and declare a default if certain criteria are breached. The Fund’s exposure to losses on such investments may be increased, especially during a downturn in the credit cycle.
Credit Risk
The Funds are subject to the risk that the issuer or guarantor of a debt security, or the counterparty to a derivatives contract or a loan will fail to make timely payment of interest or principal or otherwise honor its obligations or default completely. A decline in the credit rating of an individual security held by the Funds may have an adverse impact on its price and make it difficult for the Funds to sell it. Ratings represent a rating agency’s opinion regarding the quality of the security and are not a guarantee of quality. Rating agencies might not always change their credit rating on an issuer or security in a timely manner to reflect events that could affect the issuer’s ability to make timely payments on its obligations. Credit risk is typically greater for securities with ratings that are below investment grade. Since the Funds can invest significantly in high-yield investments considered speculative in nature, this risk may be substantial.
Currency Risk
The Funds may have exposure to foreign currencies by making direct investments in non-U.S. currencies or in securities denominated in non-U.S. currencies, or by purchasing or selling forward currency exchange contracts
49
American Beacon FundsSM
Notes to Financial Statements
August 31, 2020
in non-U.S. currencies. Foreign currencies may decline in value relative to the U.S. dollar, or, in the case of hedging positions, the U.S. dollar may decline in value relative to the currency being hedged, and thereby affect a Fund’s investments in foreign (non-U.S.) currencies or in securities that trade in, and receive revenues in, or in derivatives that provide exposure to, foreign (non-U.S.) currencies. Currency exchange rates may fluctuate significantly over short periods of time for a number of reasons, including changes in interest rates, intervention (or the failure to intervene) by U.S. or foreign governments, central banks or supranational entities such as the International Monetary Fund, or by the imposition of currency controls or other political developments in the United States or abroad. As a result, the Funds’ investments in foreign currency denominated securities may reduce the returns of the Funds. Currency futures, forwards, options or swaps may not always work as intended, and in specific cases, the Funds may be worse off than if it had not used such instrument(s). There may not always be suitable hedging instruments available. Even where suitable hedging instruments are available, the Funds may choose to not hedge its currency risks.
Equity Investments Risk
Equity securities are subject to market risk. The Funds’ investments in equity securities may include common stocks, preferred stocks, securities convertible into or exchangeable for common stocks, REITs, depositary receipts, and U.S. dollar-denominated foreign stocks traded on U.S. exchanges. Such investments may expose the Funds to additional risk. The value of a company’s common stock may fall as a result of factors affecting the company, companies in the same industry or sector, or the financial markets overall. Common stock generally is subordinate to preferred stock upon the liquidation or bankruptcy of the issuing company. Preferred stocks and convertible securities are sensitive to movements in interest rates. Preferred stocks may be less liquid than common stocks and, unlike common stocks, participation in the growth of an issuer may be limited. Distributions on preferred stocks generally are payable at the discretion of an issuer and after required payments to bond holders. Convertible securities are subject to the risk that the credit standing of the issuer may have an effect on the convertible securities’ investment value. Investments in REITs are subject to the risks associated with investing in the real estate industry such as adverse developments affecting the real estate industry and real property values. Depositary receipts and U.S. dollar-denominated foreign stocks traded on U.S. exchanges are subject to certain of the risks associated with investing directly in foreign securities, including, but not limited to, currency exchange rate fluctuations, political and financial instability in the home country of a particular depositary receipt, less liquidity and more volatility, less government regulation and supervision and delays in transaction settlement.
Floating Rate Securities Risk
The coupons on certain fixed income securities in which the Funds may invest are not fixed and may fluctuate based upon changes in market rates. The coupon on a floating rate security is generally based on an interest rate such as a money-market index, London Interbank Offered Rate (“LIBOR”) or a Treasury bill rate. Such securities are subject to interest rate risk and may fluctuate in value in response to interest rate changes if there is a delay between changes in market interest rates and the interest reset date for the obligation, or for other reasons. As short-term interest rates decline, the coupons on floating rate securities typically decrease. Alternatively, during periods of rising interest rates, changes in the coupons of floating rate securities may lag behind changes in market rates or may have limits on the maximum increases in the coupon rates. The value of floating rate securities may decline if their coupons do not rise as much, or as quickly, as interest rates in general. Conversely, floating rate securities will not generally increase in value if interest rates decline. Floating rate obligations are less effective than fixed rate obligations at locking in a particular yield and are subject to credit risk.
Futures Contracts Risk
Futures contracts are derivative instruments where one party pays a fixed price for an agreed amount of securities or other underlying assets at an agreed date. The use of such derivative instruments may expose the Funds to additional risks that they would not be subject to if they invested directly in the securities underlying
50
American Beacon FundsSM
Notes to Financial Statements
August 31, 2020
those derivatives. There may at times be an imperfect correlation between the movement in the prices of futures contracts and the value of their underlying instruments or indexes. There can be no assurance that any strategy used will succeed. There also can be no assurance that, at all times, a liquid market will exist for offsetting a futures contract that a Fund has previously bought or sold and this may result in the inability to close a futures contract when desired. Futures contracts may experience potentially dramatic price changes, which will increase the volatility of a Fund and may involve a small investment of cash (the amount of initial and variation margin) relative to the magnitude of the risk assumed (the potential increase or decrease in the price of the futures contract).
High-Yield Securities Risk
Investing in high-yield, below investment-grade securities (commonly referred to as “junk bonds”) generally involves significantly greater risks of loss of your money than an investment in investment grade securities. High-yield debt securities may fluctuate more widely in price and yield and may fall in price when the economy is weak or expected to become weak. High-yield securities are considered to be speculative with respect to an issuer’s ability to pay interest and principal and carry a greater risk that the issuers of lower-rated securities will default on the timely payment of principal and interest. Below investment grade securities may experience greater price volatility and less liquidity than investment grade securities.
Illiquid and Restricted Securities Risk
Securities not registered in the U.S. under the Securities Act, including Rule 144A securities, are restricted as to their resale. Such securities may not be listed on an exchange and may have no active trading market. They may be more difficult to purchase or sell at an advantageous time or price because such securities may not be readily marketable in broad public markets. The Funds may not be able to sell a restricted security when the sub-advisor considers it desirable to do so and/or may have to sell the security at a lower price than the Funds believe is its fair market value. In addition, transaction costs may be higher for restricted securities and the Funds may receive only limited information regarding the issuer of a restricted security. The Funds may have to bear the expense of registering restricted securities for resale and the risk of substantial delays in effecting the registration.
Interest Rate Risk
The Fund is subject to the risk that the market value of fixed-income securities or derivatives it holds will decline due to rising interest rates. Generally, the value of investments with interest rate risk, such as fixed income securities, will move in the opposite direction to movements in interest rates. As of the date of this Annual Report, interest rates are historically low. In the future, interest rates may rise, perhaps significantly and/or rapidly, potentially resulting in substantial losses to the Fund. During periods of very low or negative interest rates, the Fund may be unable to maintain positive returns. Changing interest rates, including rates that fall below zero, may have unpredictable effects on markets, may result in heightened market volatility and may detract from Fund performance to the extent the Fund is exposed to such interest rates. The prices of fixed income securities and derivatives are also affected by their maturities. Fixed-income securities and derivatives with longer maturities generally have greater sensitivity to changes in interest rates. For example, if a bond has a duration of three years, a 1% increase in interest rates could be expected to result in a 3% decrease in the value of the bond, whereas if a bond has a duration of one year, a 1% increase in interest rates could be expected to result in a 1% decline in value. An increase in interest rates can impact markets broadly as well. Some investors buy securities and derivatives with borrowed money; an increase in interest rates can cause a decline in those markets. To the extent the Fund holds an investment with a negative interest rate to maturity, the Fund would generate a negative return on that investment.
LIBOR Risk
The Fund’s investments, payment obligations and financing terms may be based on floating rates, such as London Interbank Offer Rate (“LIBOR”), Euro Interbank Offered Rate and other similar types of reference rates
51
American Beacon FundsSM
Notes to Financial Statements
August 31, 2020
(each, a “Reference Rate”). These Reference Rates are generally intended to represent the rate at which contributing banks may obtain short-term borrowings from each other within certain financial markets. Arrangements are underway to phase out the use of LIBOR by the end of 2021. These arrangements and any additional regulatory or market changes may have an adverse impact on the Fund or its investments, including increased volatility or illiquidity in markets for instruments that rely on LIBOR.
There remains uncertainty regarding the nature of any replacement rate and the impact of the transition from LIBOR on the Fund and the financial markets generally. The transition process, or the failure of an industry to transition, could lead to increased volatility and illiquidity in markets for instruments that currently rely on LIBOR to determine interest rates and a reduction in the values of some LIBOR-based investments, all of which would impact the Fund. At this time, it is not possible to completely identify or predict the effect of any transition, establishment of alternative Reference Rates or other reforms to Reference Rates that may be enacted in the UK or elsewhere. In addition, any substitute Reference Rate and any pricing adjustments imposed by a regulator or by counterparties or otherwise may adversely affect the Fund’s performance and/or NAV.
Liquidity Risk
When there is little or no active trading market for a specific type of security, it can become more difficult to purchase or sell the securities at or near their perceived value. During such periods, certain investments held by the Funds may be difficult to sell or other investments may be difficult to purchase at favorable times or prices. As a result, the Fund may have to lower the price on certain securities that it is trying to sell, sell other securities instead or forgo an investment opportunity, any of which could have a negative effect on Fund management or performance. Additionally, the market for certain investments may become illiquid under adverse market or economic conditions independent of any specific adverse changes in the conditions of a particular issuer.
Loan Interests Risk
In making investments in bank loans or senior loans, the Funds will depend primarily on the creditworthiness of the borrower for payment of principal and interest, and will also rely on the financial institution to make principal and interest payments to the Funds once it receives payment on the underlying loan. The Funds will also rely on the financial institution to pursue appropriate remedies against a borrower in the event that the borrower defaults. As such, the Funds may be exposed to the credit risk of both the financial institution that made the loan and the underlying borrower. Unlike publicly traded common stocks, which trade on national exchanges, there is no central place or exchange for loans, including bank loans and senior loans, to trade. There is a risk that the value of any collateral securing a loan in which the Funds have an interest may decline and that the collateral may not be sufficient to cover the amount owed on the loan. In the event the borrower defaults, the Funds’ access to the collateral may be limited or delayed by bankruptcy or other insolvency laws. Loans trade in an over-the-counter market, and confirmation and settlement, which are effected through standardized procedures and documentation, may take significantly longer than seven days to complete. Extended trade settlement periods may, in unusual market conditions with a high volume of shareholder redemptions, present a risk to shareholders regarding the Funds’ ability to pay redemption proceeds within the allowable time periods stated in its prospectus. The secondary market for floating rate loans also may be subject to irregular trading activity and wide bid/ask spreads. The lack of an active trading market for certain loans may impair the ability of the Funds to sell its loan interests at a time when it may otherwise be desirable to do so or may require the Funds to sell them at prices that are less than what the Funds regards as their fair market value and may make it difficult to value such loans. Accordingly, loan interests may at times be illiquid. Interests in loans made to finance highly leveraged companies or transactions, such as corporate acquisitions, may be especially vulnerable to adverse changes in economic or market conditions. The Funds may acquire a loan interest by obtaining an assignment of all or a portion of the interests in a particular loan that are held by an original lender or a prior assignee. As an assignee, the Funds normally will succeed to all rights and obligations of its assignor with respect to the portion of the loan that is being assigned. However, the rights and obligations acquired by the purchaser of a loan assignment may differ from, and be more limited than, those held by the original lenders or the assignor. Alternatively, the Funds may
52
American Beacon FundsSM
Notes to Financial Statements
August 31, 2020
acquire a participation in a loan interest that is held by another party. When the Funds’ loan interest is a participation, the Funds are subject to the risk that the party selling the participation interest will not remit the Funds’ pro rata share of loan payments to the Funds, and the Funds may have less control over the exercise of remedies than the party selling the participation interest.
Market Risk
The Fund is subject to the risk that the securities markets will move down, sometimes rapidly and unpredictably, based on overall economic conditions and other factors, which may negatively affect the Fund’s performance. Equity securities generally have greater price volatility than fixed income securities, although under certain market conditions fixed income securities may have comparable or greater price volatility. During a general downturn in the securities markets, multiple assets may decline in value simultaneously. Prices in many financial markets have increased significantly over the last decade, but there have also been periods of adverse market and financial developments and cyclical change during that timeframe, which have resulted in unusually high levels of volatility in domestic and foreign financial markets that has caused losses for investors and may occur again in the future. The value of a security may decline due to adverse issuer-specific conditions, general market conditions unrelated to a particular issuer, or factors that affect a particular industry or industries. Changes in the financial condition of a single issuer or market segment also can impact the market as a whole. Geopolitical and other events, including war, terrorism, economic uncertainty, trade disputes, pandemics, public health crises, natural disasters and related events have led, and in the future may continue to lead, to instability in world economies and markets generally and reduced liquidity in equity, credit and fixed-income markets, which may disrupt economies and markets and adversely affect the value of your investment. Changes in value may be temporary or may last for extended periods. Policy changes by the U.S. government and/or Federal Reserve and political events within the U.S. and abroad, including the U.S. presidential election, may affect investor and consumer confidence and may adversely impact financial markets and the broader economy, perhaps suddenly and to a significant degree.
Markets and market participants are increasingly reliant upon both publicly available and proprietary information data systems. Data imprecision, software or other technology malfunctions, programming inaccuracies, unauthorized use or access, and similar circumstances may impair the performance of these systems and may have an adverse impact upon a single issuer, a group of issuers, or the market at large. The financial markets generally move in cycles, with periods of rising prices followed by periods of declining prices. The value of your investment may reflect these fluctuations.
Other Investment Companies Risk
The Funds may invest in shares of other registered investment companies, including money market funds that are advised by the Manager. To the extent that the Funds invest in shares of other registered investment companies, the Funds will indirectly bear the fees and expenses, including for example advisory and administrative fees, charged by those investment companies in addition to the Fund’s direct fees and expenses and will be subject to the risks associated with investments in those companies. For example, the Fund’s investments in money market funds are subject to interest rate risk, credit risk, and market risk. The Funds must rely on the investment company in which it invests to achieve its investment objective. If the investment company fails to achieve its investment objective, the value of the Fund’s investment will decline, adversely affecting the Fund’s performance. To the extent the Funds invest in other investment companies that invest in equity securities, fixed-income securities and/or foreign securities, or that track an index, the Funds are subject to the risks associated with the underlying investments held by the investment company or the index fluctuations to which the investment company is subject.
Prepayment and Extension Risk
Prepayment risk is the risk that the principal amount of a bond may be repaid prior to the bond’s maturity date. Due to a decline in interest rates or excess cash flow, a debt security may be called or otherwise prepaid
53
American Beacon FundsSM
Notes to Financial Statements
August 31, 2020
before maturity. If this occurs, no additional interest will be paid on the investment and the Funds may have to invest at a lower rate, may not benefit from an increase in value that may result from declining interest rates, and may lose any premium it paid to acquire the security. Variable and floating rate securities may be less sensitive to prepayment risk. Extension risk is the risk that a decrease in prepayments may, as a result of higher interest rates or other factors, result in the extension of a security’s effective maturity, heighten interest rate risk and increase the potential for a decline in its price.
Recent Market Events Risk
An outbreak of infectious respiratory illness caused by a novel coronavirus, known as COVID-19, was first detected in China in December 2019 and has subsequently spread globally. The transmission of COVID-19 and efforts to contain its spread have resulted, and may continue to result, in significant disruptions to business operations, widespread business closures and layoffs, travel restrictions and closed borders, prolonged quarantines and stay-at-home orders, disruption of and delays in healthcare service preparation and delivery, service and event changes, and lower consumer demand, as well as general concern and uncertainty that has negatively affected the global economy. The impact of the COVID-19 pandemic may last for an extended period of time and may result in a sustained economic downturn or recession. The U.S. Federal Reserve and the U.S. federal government have taken numerous measures to address the economic impact of the COVID-19 pandemic and stimulate the U.S. economy. The ultimate effects of these and other efforts that may be taken may not be known for some time. The Federal Reserve has spent hundreds of billions of dollars to keep credit flowing through short-term money markets and has signaled that it plans to maintain its interventions at an elevated level. Amid these ongoing efforts, concerns about the markets’ dependence on the Federal Reserve’s provision of liquidity have grown. The U.S. government has reduced the federal corporate income tax rate, and future legislative, regulatory and policy changes may result in more restrictions on international trade, less stringent prudential regulation of certain players in the financial markets, and significant new investments in infrastructure and national defense. High public debt in the U.S. and other countries creates ongoing systemic and market risks and policymaking uncertainty. A rise in protectionist trade policies, slowing global economic growth, risks associated with the United Kingdom’s departure from the European Union on January 31, 2020, commonly referred to as “Brexit,” and trade agreement negotiations during the transition period, the risks associated with ongoing trade negotiations with China, the possibility of changes to some international trade agreements, tensions or open conflict between nations, or political or economic dysfunction within some nations that are major producers of oil could affect the economies of many nations, including the United States, in ways that cannot necessarily be foreseen at the present time. Economists and others have expressed increasing concern about the potential effects of global climate change on property and security values. Certain issuers, industries and regions may be adversely affected by the impacts of climate change, including on the demand for and the development of goods and services and related production costs, and the impacts of legislation, regulation and international accords related to climate change, as well as any indirect consequences of regulation or business trends driven by climate change.
Redemption Risk
The Funds may experience periods of heavy redemptions that could cause the Funds to sell assets at inopportune times or at a loss or depressed value. Redemption risk is greater to the extent that one or more investors or intermediaries control a large percentage of investments in the Funds, have short investment horizons, or have unpredictable cash flow needs. A general rise in interest rates has the potential to cause investors to move out of fixed-income securities on a large scale, which may increase redemptions from mutual funds that hold large amounts of fixed-income securities. This, coupled with a reduction in the ability or willingness of dealers and other institutional investors to buy or hold fixed-income securities, may result in decreased liquidity and increased volatility in the fixed-income markets, and heightened redemption risk. Heavy redemptions, whether by a few large investors or many smaller investors, could hurt the Funds’ performance. This risk is heightened if the Fund invests in emerging market securities, which are generally less liquid than the securities of U.S. and other developed markets. The sale of assets to meet redemption requests may create net capital gains or losses, which could cause the Funds to have to distribute substantial capital gains.
54
American Beacon FundsSM
Notes to Financial Statements
August 31, 2020
Unrated Securities Risk
Because the Fund may purchase securities that are not rated by any rating organization, the Sub-Advisor, after assessing their credit quality, may internally assign ratings to certain of those securities in categories of those similar to those of rating organizations. Investing in unrated securities involves the risk that the Sub-Advisor may not accurately evaluate the security’s comparative credit rating. Analysis of the creditworthiness of issuers of unrated securities may be more complex than for issuers of higher-quality debt obligations. To the extent that the Fund invests in unrated securities, the Fund’s success in achieving its investment objectives may depend more heavily on the Sub-Advisor’s credit analysis than if the Fund invested exclusively in rated securities. Some unrated securities may not have an active trading market or may be difficult to value, which means the Fund might have difficulty selling them promptly at an acceptable price. Unrated securities may also be subject to greater liquidity risk and price volatility.
Variable and Floating Rate Securities Risk
The coupons on certain fixed income securities in which a Fund may invest are not fixed and may fluctuate based upon changes in market rates. The coupon on a floating rate security is generally based on an interest rate such as a money-market index, LIBOR or a Treasury bill rate. Such securities are subject to interest rate risk and may fluctuate in value in response to interest rate changes if there is a delay between changes in market interest rates and the interest reset date for the obligation, or for other reasons. As short-term interest rates decline, the coupons on variable and floating rate securities typically decrease. Alternatively, during periods of rising interest rates, changes in the coupons of variable and floating rate securities may lag behind changes in market rates or may have limits on the maximum increases in the coupon rates. The value of variable and floating rate securities may decline if their coupons do not rise as much, or as quickly, as interest rates in general. Conversely, variable and floating rate securities will not generally increase in value if interest rates decline. Variable and floating rate securities are less effective at locking in a particular yield and are subject to credit risk.
7. Federal Income and Excise Taxes
It is the policy of each Fund to qualify as a regulated investment company (“RIC”), by complying with all applicable provisions of Subchapter M of the Internal Revenue Code, as amended, and to make distributions of taxable income sufficient to relieve it from substantially all federal income and excise taxes. For federal income tax purposes, each Fund is treated as a single entity for the purpose of determining such qualification.
The Funds do not have any unrecorded tax liabilities in the accompanying financial statements. Each of the tax years in the four year period ended August 31, 2020 remain subject to examination by the Internal Revenue Service. If applicable, the Funds recognize interest accrued related to unrecognized tax benefits in interest expense and penalties in “Other expenses” on the Statements of Operations.
The Funds may be subject to taxes imposed by countries in which it invests. Such taxes are generally based on returns of income earned or gains realized or repatriated. Taxes are accrued and applied to net investment income, net realized capital gains and net unrealized appreciation (depreciation), as applicable, as the income is earned or capital gains are recorded.
Dividends are categorized in accordance with income tax regulations which may treat certain transactions differently than U.S. GAAP. Accordingly, the character of distributions and composition of net assets for tax purposes may differ from those reflected in the accompanying financial statements.
55
American Beacon FundsSM
Notes to Financial Statements
August 31, 2020
The tax character of distributions paid were as follows:
| SiM High Yield Opportunities Fund | Sound Point Floating Rate Income Fund | |||||||||||||||||||||||||||
| Year Ended August 31, 2020 | Year Ended August 31, 2019 | Year Ended August 31, 2020 | Year Ended August 31, 2019 | |||||||||||||||||||||||||
Distributions paid from: |
| |||||||||||||||||||||||||||
Ordinary income* |
| |||||||||||||||||||||||||||
R5 ClassA | $ | 24,656,231 | $ | 25,158,278 | $ | 15,651,271 | $ | 25,168,717 | ||||||||||||||||||||
Y Class | 45,283,091 | 37,145,789 | 31,011,790 | 69,601,964 | ||||||||||||||||||||||||
Investor Class | 3,545,239 | 5,006,310 | 6,712,557 | 23,917,366 | ||||||||||||||||||||||||
A Class | 1,316,760 | 1,586,624 | 2,232,615 | 3,256,554 | ||||||||||||||||||||||||
C Class | 2,633,449 | 3,025,464 | 2,160,406 | 3,309,136 | ||||||||||||||||||||||||
SP Class | – | – | 12,119 | 34,122 | ||||||||||||||||||||||||
|
|
|
|
|
|
|
| |||||||||||||||||||||
Total distributions paid | $ | 77,434,770 | $ | 71,922,465 | $ | 57,780,758 | $ | 125,287,859 | ||||||||||||||||||||
|
|
|
|
|
|
|
| |||||||||||||||||||||
* For tax purposes, short-term capital gains are considered ordinary income distributions.
A Formerly known as Institutional Class.
As of August 31, 2020, the components of distributable earnings (deficits) on a tax basis were as follows:
Fund | Tax Cost | Unrealized Appreciation | Unrealized (Depreciation) | Net Unrealized Appreciation (Depreciation) | ||||||||||||||||||||||||
| SiM High Yield Opportunities | $ | 1,252,127,346 | $ | 68,717,404 | $ | (90,108,369 | ) | $ | (21,390,965 | ) | ||||||||||||||||||
| Sound Point Floating Rate Income | 673,308,310 | 5,695,926 | (55,573,334 | ) | (49,877,408 | ) | ||||||||||||||||||||||
Fund | Net Unrealized Appreciation (Depreciation) | Undistributed Ordinary Income | Undistributed Long-Term Capital Gains | Accumulated Capital and Other (Losses) | Other Temporary Differences | Distributable Earnings | ||||||||||||||||||||||||||||||||||||||
| SiM High Yield Opportunities | $ | (21,390,965 | ) | $ | - | $ | - | $ | (61,839,898 | ) | $ | (604,664 | ) | $ | (83,835,527 | ) | ||||||||||||||||||||||||||||
| Sound Point Floating Rate Income | (49,877,408 | ) | 2,182,803 | - | (182,872,109 | ) | (155,603 | ) | (230,722,317 | ) | ||||||||||||||||||||||||||||||||||
Financial reporting records are adjusted for permanent book/tax differences to reflect tax character. Financial records are not adjusted for temporary differences. The temporary differences between financial reporting and tax-basis reporting of unrealized appreciation (depreciation) are attributable primarily to the tax deferral of losses from wash sales, unused capital loss carryforwards, the realization for tax purposes of unrealized gains (losses) on certain derivative instruments, dividends payable at the end of period, premium amortization, and the reclassification of income from real estate investment securities and publicly traded partnerships.
Due to inherent differences in the recognition of income, expenses, and realized gains (losses) under U.S. GAAP and federal income tax regulations, permanent differences between book and tax reporting have been identified and appropriately reclassified on the Statements of Assets and Liabilities.
Accordingly, the following amounts represent current year permanent differences derived from reclassifications of income from publicly traded partnerships as of August 31, 2020:
Fund | Paid-In-Capital | Distributable Earnings/(Deficits) | ||||||||||||||
| SiM High Yield Opportunities | $ | (2,012 | ) | $ | 2,012 | |||||||||||
| Sound Point Floating Rate Income | - | - | ||||||||||||||
Under the Regulated Investment Company Modernization Act of 2010 (“RIC MOD”), net capital losses recognized by the Funds in taxable years beginning after December 22, 2010 are carried forward indefinitely and retain their character as short-term and/or long-term losses.
56
American Beacon FundsSM
Notes to Financial Statements
August 31, 2020
During the year ended August 31, 2020, the Funds had the following post RIC MOD capital loss carryforwards:
Fund | Short-Term Capital Loss Carryforwards | Long-Term Capital Loss Carryforwards | ||||||||||
| SiM High Yield Opportunities | $ | 5,876,166 | $ | 54,924,303 | ||||||||
| Sound Point Floating Rate Income | 52,205,015 | 130,667,094 | ||||||||||
The Funds are permitted for tax purposes to defer into the next fiscal year qualified late year losses. Qualified late year capital losses are net losses incurred after October 31 through the Fund’s fiscal year end, August 31, 2020. Qualified late year ordinary losses are specified losses generally incurred after October 31 through the end of the Fund’s fiscal year end, August 31, 2020. For the period ending August 31, 2020, SiM High Yield Opportunities deferred $1,039,429 ordinary loss to September 1, 2020.
8. Investment Transactions
The aggregate cost of purchases and proceeds from sales and maturities of investments, other than short-term obligations, for the year ended August 31, 2020 were as follows:
Fund | Purchases (non-U.S. Government Securities) | Sales (non-U.S. Government Securities) | ||||||||||
| SiM High Yield Opportunities | $ | 746,462,389 | $ | 670,624,692 | ||||||||
| Sound Point Floating Rate Income | 488,709,356 | 1,097,363,672 | ||||||||||
A summary of the Funds’ transactions in the USG Select Fund for the year ended August 31, 2020 were as follows:
Fund | Type of Transaction | August 31, 2019 Shares/Fair Value | Purchases | Sales |
| August 31, 2020 Shares/Fair Value | ||||||||||||||||||||||||||||||
| SiM High Yield Opportunities | Direct | $ | 22,977,485 | $ | 593,685,147 | $ | 597,467,294 | $ | 19,195,338 | |||||||||||||||||||||||||||
| Sound Point Floating Rate Income | Direct | 56,313,566 | 574,110,340 | 565,674,330 | 64,749,576 | |||||||||||||||||||||||||||||||
9. Borrowing Arrangements
Effective November 14, 2019 (the “Effective Date”), the Funds, along with certain other funds managed by the Manager (“Participating Funds”), entered into a committed revolving line of credit (the “Committed Line”) agreement with State Street Bank and Trust Company (the “Bank”) to be used to facilitate portfolio liquidity. The maximum borrowing amount under the Committed Line is $250 million with interest at a rate equal to the higher of (a) one-month London Inter-Bank Offered Rate (“LIBOR”) plus 1.25% per annum or (b) the Federal Funds rate plus 1.25% per annum on amounts borrowed. Each of the Participating Funds paid a closing fee of $100,000 on the Effective Date and a quarterly commitment fee at a rate of 0.25% per annum on the unused portion of the Committed Line amount. Effective August 6, 2020, the Committed Line was reduced from $250 million to $150 million. The Committed Line expires November 12, 2020, unless extended by the Bank or terminated by the Participating Funds in accordance with the agreement.
On the Effective Date, the Funds, along with certain other Participating Funds managed by the Manager, also entered into an uncommitted discretionary demand revolving line of credit (the “Uncommitted Line”) agreement with the Bank to be used to facilitate portfolio liquidity. The maximum borrowing amount under the Uncommitted Line is $50 million with interest at a rate equal to the higher of (a) one-month LIBOR plus 1.25% per annum or (b) the Federal Funds rate plus 1.25% per annum on each outstanding loan. Each of the Participating Funds paid a closing fee of $35,000 on the Effective Date. The Uncommitted Line expires November 12, 2020 unless extended by the Bank or terminated by the Participating Funds in accordance with the agreement.
57
American Beacon FundsSM
Notes to Financial Statements
August 31, 2020
The Participating Funds paid administration, legal and arrangement fees, which are recognized as a component of “Loan expense” on the Statements of Operations, along with commitment fees, that have been allocated among the Participating Funds based on average daily net assets.
During the year ended August 31, 2020, the Sound Point Floating Rate Income Fund borrowed a total of $88,000,000 from the Committed Line for a total of 24 days with interest charges of $65,538 in order to facilitate portfolio liquidity. The amount is recorded as “Line of credit interest expense” in the Statements of Operations. At August 31, 2020, the Fund did not have an outstanding balance with either facility.
10. Capital Share Transactions
The tables below summarize the activity in capital shares for each Class of the Funds:
| R5 ClassA | ||||||||||||||||||||||||||||
| Year Ended August 31, 2020 | Year Ended August 31, 2019 | |||||||||||||||||||||||||||
SiM High Yield Opportunities Fund | Shares | Amount | Shares | Amount | ||||||||||||||||||||||||
| Shares sold | 17,504,959 | $ | 149,703,776 | 15,437,106 | $ | 145,112,330 | ||||||||||||||||||||||
| Reinvestment of dividends | 2,371,512 | 21,005,242 | 2,289,005 | 21,522,945 | ||||||||||||||||||||||||
| Shares redeemed | (17,829,769 | ) | (155,861,200 | ) | (15,814,162 | ) | (148,162,950 | ) | ||||||||||||||||||||
|
|
|
|
|
|
|
| |||||||||||||||||||||
| Net increase in shares outstanding | 2,046,702 | $ | 14,847,818 | 1,911,949 | $ | 18,472,325 | ||||||||||||||||||||||
|
|
|
|
|
|
|
| |||||||||||||||||||||
| Y Class | ||||||||||||||||||||||||||||
| Year Ended August 31, 2020 | Year Ended August 31, 2019 | |||||||||||||||||||||||||||
SiM High Yield Opportunities Fund | Shares | Amount | Shares | Amount | ||||||||||||||||||||||||
| Shares sold | 50,494,683 | $ | 439,436,786 | 45,133,600 | $ | 424,531,252 | ||||||||||||||||||||||
| Reinvestment of dividends | 4,703,522 | 41,683,769 | 3,538,614 | 33,244,349 | ||||||||||||||||||||||||
| Shares redeemed | (43,475,282 | ) | (376,792,567 | ) | (40,780,186 | ) | (382,696,915 | ) | ||||||||||||||||||||
|
|
|
|
|
|
|
| |||||||||||||||||||||
| Net increase in shares outstanding | 11,722,923 | $ | 104,327,988 | 7,892,028 | $ | 75,078,686 | ||||||||||||||||||||||
|
|
|
|
|
|
|
| |||||||||||||||||||||
| Investor Class | ||||||||||||||||||||||||||||
| Year Ended August 31, 2020 | Year Ended August 31, 2019 | |||||||||||||||||||||||||||
SiM High Yield Opportunities Fund | Shares | Amount | Shares | Amount | ||||||||||||||||||||||||
| Shares sold | 2,496,097 | $ | 21,846,413 | 3,414,989 | $ | 32,164,610 | ||||||||||||||||||||||
| Reinvestment of dividends | 367,583 | 3,271,009 | 505,270 | 4,734,555 | ||||||||||||||||||||||||
| Shares redeemed | (6,765,414 | ) | (58,335,121 | ) | (4,983,054 | ) | (46,728,940 | ) | ||||||||||||||||||||
|
|
|
|
|
|
|
| |||||||||||||||||||||
| Net (decrease) in shares outstanding | (3,901,734 | ) | $ | (33,217,699 | ) | (1,062,795 | ) | $ | (9,829,775 | ) | ||||||||||||||||||
|
|
|
|
|
|
|
| |||||||||||||||||||||
| A Class | ||||||||||||||||||||||||||||
| Year Ended August 31, 2020 | Year Ended August 31, 2019 | |||||||||||||||||||||||||||
SiM High Yield Opportunities Fund | Shares | Amount | Shares | Amount | ||||||||||||||||||||||||
| Shares sold | 1,085,127 | $ | 9,561,268 | 577,283 | $ | 5,426,672 | ||||||||||||||||||||||
| Reinvestment of dividends | 129,538 | 1,147,893 | 152,758 | 1,433,137 | ||||||||||||||||||||||||
| Shares redeemed | (1,076,150 | ) | (9,442,477 | ) | (2,201,657 | ) | (20,442,401 | ) | ||||||||||||||||||||
|
|
|
|
|
|
|
| |||||||||||||||||||||
| Net increase (decrease) in shares outstanding | 138,515 | $ | 1,266,684 | (1,471,616 | ) | $ | (13,582,592 | ) | ||||||||||||||||||||
|
|
|
|
|
|
|
| |||||||||||||||||||||
| C Class | ||||||||||||||||||||||||||||
| Year Ended August 31, 2020 | Year Ended August 31, 2019 | |||||||||||||||||||||||||||
SiM High Yield Opportunities Fund | Shares | Amount | Shares | Amount | ||||||||||||||||||||||||
| Shares sold | 628,934 | $ | 5,636,760 | 828,996 | $ | 7,826,558 | ||||||||||||||||||||||
| Reinvestment of dividends | 254,828 | 2,272,867 | 278,665 | 2,631,143 | ||||||||||||||||||||||||
| Shares redeemed | (2,140,359 | ) | (18,844,329 | ) | (1,591,180 | ) | (14,977,488 | ) | ||||||||||||||||||||
|
|
|
|
|
|
|
| |||||||||||||||||||||
| Net (decrease) in shares outstanding | (1,256,597 | ) | $ | (10,934,702 | ) | (483,519 | ) | $ | (4,519,787 | ) | ||||||||||||||||||
|
|
|
|
|
|
|
| |||||||||||||||||||||
58
American Beacon FundsSM
Notes to Financial Statements
August 31, 2020
| R5 ClassA | ||||||||||||||||||||||||||||
| Year Ended August 31, 2020 | Year Ended August 31, 2019 | |||||||||||||||||||||||||||
Sound Point Floating Rate Income Fund | Shares | Amount | Shares | Amount | ||||||||||||||||||||||||
| Shares sold | 10,544,402 | $ | 99,086,583 | 22,285,559 | $ | 225,372,595 | ||||||||||||||||||||||
| Reinvestment of dividends | 1,486,306 | 13,605,713 | 2,152,580 | 21,541,216 | ||||||||||||||||||||||||
| Shares redeemed | (28,908,466 | ) | (263,675,597 | ) | (27,402,192 | ) | (275,051,558 | ) | ||||||||||||||||||||
|
|
|
|
|
|
|
| |||||||||||||||||||||
| Net (decrease) in shares outstanding | (16,877,758 | ) | $ | (150,983,301 | ) | (2,964,053 | ) | $ | (28,137,747 | ) | ||||||||||||||||||
|
|
|
|
|
|
|
| |||||||||||||||||||||
| Y Class | ||||||||||||||||||||||||||||
| Year Ended August 31, 2020 | Year Ended August 31, 2019 | |||||||||||||||||||||||||||
Sound Point Floating Rate Income Fund | Shares | Amount | Shares | Amount | ||||||||||||||||||||||||
| Shares sold | 22,766,403 | $ | 206,582,764 | 65,000,408 | $ | 656,251,877 | ||||||||||||||||||||||
| Reinvestment of dividends | 3,268,352 | 29,930,283 | 6,690,163 | 67,046,668 | ||||||||||||||||||||||||
| Shares redeemed | (69,646,779 | ) | (634,592,790 | ) | (113,976,435 | ) | (1,143,163,263 | ) | ||||||||||||||||||||
|
|
|
|
|
|
|
| |||||||||||||||||||||
| Net (decrease) in shares outstanding | (43,612,024 | ) | $ | (398,079,743 | ) | (42,285,864 | ) | $ | (419,864,718 | ) | ||||||||||||||||||
|
|
|
|
|
|
|
| |||||||||||||||||||||
| Investor Class | ||||||||||||||||||||||||||||
| Year Ended August 31, 2020 | Year Ended August 31, 2019 | |||||||||||||||||||||||||||
Sound Point Floating Rate Income Fund | Shares | Amount | Shares | Amount | ||||||||||||||||||||||||
| Shares sold | 2,253,017 | $ | 20,615,546 | 20,578,393 | $ | 208,421,538 | ||||||||||||||||||||||
| Reinvestment of dividends | 719,119 | 6,620,546 | 2,368,717 | 23,719,523 | ||||||||||||||||||||||||
| Shares redeemed | (18,434,171 | ) | (170,404,180 | ) | (53,493,144 | ) | (534,924,169 | ) | ||||||||||||||||||||
|
|
|
|
|
|
|
| |||||||||||||||||||||
| Net (decrease) in shares outstanding | (15,462,035 | ) | $ | (143,168,088 | ) | (30,546,034 | ) | $ | (302,783,108 | ) | ||||||||||||||||||
|
|
|
|
|
|
|
| |||||||||||||||||||||
| A Class | ||||||||||||||||||||||||||||
| Year Ended August 31, 2020 | Year Ended August 31, 2019 | |||||||||||||||||||||||||||
Sound Point Floating Rate Income Fund | Shares | Amount | Shares | Amount | ||||||||||||||||||||||||
| Shares sold | 1,213,758 | $ | 11,069,016 | 1,602,405 | $ | 16,254,026 | ||||||||||||||||||||||
| Reinvestment of dividends | 241,973 | 2,202,955 | 321,531 | 3,225,741 | ||||||||||||||||||||||||
| Shares redeemed | (2,730,177 | ) | (25,016,775 | ) | (3,016,027 | ) | (30,303,854 | ) | ||||||||||||||||||||
|
|
|
|
|
|
|
| |||||||||||||||||||||
| Net (decrease) in shares outstanding | (1,274,446 | ) | $ | (11,744,804 | ) | (1,092,091 | ) | $ | (10,824,087 | ) | ||||||||||||||||||
|
|
|
|
|
|
|
| |||||||||||||||||||||
| C Class | ||||||||||||||||||||||||||||
| Year Ended August 31, 2020 | Year Ended August 31, 2019 | |||||||||||||||||||||||||||
Sound Point Floating Rate Income Fund | Shares | Amount | Shares | Amount | ||||||||||||||||||||||||
| Shares sold | 307,244 | $ | 2,865,145 | 2,315,641 | $ | 23,536,919 | ||||||||||||||||||||||
| Reinvestment of dividends | 196,727 | 1,805,678 | 294,618 | 2,962,557 | ||||||||||||||||||||||||
| Shares redeemed | (2,922,921 | ) | (27,208,734 | ) | (2,468,948 | ) | (24,791,033 | ) | ||||||||||||||||||||
|
|
|
|
|
|
|
| |||||||||||||||||||||
| Net increase (decrease) in shares outstanding | (2,418,950 | ) | $ | (22,537,911 | ) | 141,311 | $ | 1,708,443 | ||||||||||||||||||||
|
|
|
|
|
|
|
| |||||||||||||||||||||
| SP Class | ||||||||||||||||||||||||||||
| Year Ended August 31, 2020 | Year Ended August 31, 2019 | |||||||||||||||||||||||||||
Sound Point Floating Rate Income Fund | Shares | Amount | Shares | Amount | ||||||||||||||||||||||||
| Shares sold | – | $ | – | 4,327 | $ | 43,975 | ||||||||||||||||||||||
| Reinvestment of dividends | 1,266 | 11,614 | 3,335 | 33,554 | ||||||||||||||||||||||||
| Shares redeemed | (17,247 | ) | (150,083 | ) | (47,492 | ) | (474,533 | ) | ||||||||||||||||||||
|
|
|
|
|
|
|
| |||||||||||||||||||||
| Net (decrease) in shares outstanding | (15,981 | ) | $ | (138,469 | ) | (39,830 | ) | $ | (397,004 | ) | ||||||||||||||||||
|
|
|
|
|
|
|
| |||||||||||||||||||||
A Formerly known as Institutional Class.
11. Subsequent Events
Management has evaluated subsequent events for possible recognition or disclosure in the financial statements through the date the financial statements are issued. Management has determined that there are no material events that would require disclosure in the Funds’ financial statements through this date.
59
American Beacon SiM High Yield Opportunities FundSM
(For a share outstanding throughout the period)
| R5 ClassA | ||||||||||||||||||||||||||||||||||||
| Year Ended August 31, | ||||||||||||||||||||||||||||||||||||
| 2020 | 2019 | 2018 | 2017 | 2016 | ||||||||||||||||||||||||||||||||
|
| |||||||||||||||||||||||||||||||||||
Net asset value, beginning of period | $ | 9.44 | $ | 9.52 | $ | 9.61 | $ | 9.49 | $ | 9.43 | ||||||||||||||||||||||||||
|
|
|
|
|
|
|
|
|
| |||||||||||||||||||||||||||
Income (loss) from investment operations: | ||||||||||||||||||||||||||||||||||||
Net investment income | 0.57 | 0.59 | 0.59 | 0.57 | 0.59 | |||||||||||||||||||||||||||||||
Net gains (losses) on investments (both realized and unrealized) | (0.37 | ) | (0.07 | ) | (0.11 | ) | 0.13 | 0.05 | ||||||||||||||||||||||||||||
|
|
|
|
|
|
|
|
|
| |||||||||||||||||||||||||||
Total income from investment operations | 0.20 | 0.52 | 0.48 | 0.70 | 0.64 | |||||||||||||||||||||||||||||||
|
|
|
|
|
|
|
|
|
| |||||||||||||||||||||||||||
Less distributions: | ||||||||||||||||||||||||||||||||||||
Dividends from net investment income | (0.58 | ) | (0.60 | ) | (0.55 | ) | (0.53 | ) | (0.52 | ) | ||||||||||||||||||||||||||
Tax return of capital | - | - | (0.02 | )B | (0.05 | )B | (0.06 | )B | ||||||||||||||||||||||||||||
|
|
|
|
|
|
|
|
|
| |||||||||||||||||||||||||||
Total distributions | (0.58 | ) | (0.60 | ) | (0.57 | ) | (0.58 | ) | (0.58 | ) | ||||||||||||||||||||||||||
|
|
|
|
|
|
|
|
|
| |||||||||||||||||||||||||||
Redemption fees added to beneficial interests | - | - | - | - | 0.00 | C | ||||||||||||||||||||||||||||||
|
|
|
|
|
|
|
|
|
| |||||||||||||||||||||||||||
Net asset value, end of period | $ | 9.06 | $ | 9.44 | $ | 9.52 | $ | 9.61 | $ | 9.49 | ||||||||||||||||||||||||||
|
|
|
|
|
|
|
|
|
| |||||||||||||||||||||||||||
Total returnD | 2.39 | % | 5.65 | % | 5.13 | % | 7.51 | % | 7.28 | % | ||||||||||||||||||||||||||
|
|
|
|
|
|
|
|
|
| |||||||||||||||||||||||||||
Ratios and supplemental data: |
| |||||||||||||||||||||||||||||||||||
Net assets, end of period | $ | 399,310,742 | $ | 396,916,950 | $ | 382,074,042 | $ | 355,492,590 | $ | 419,036,240 | ||||||||||||||||||||||||||
Ratios to average net assets: | ||||||||||||||||||||||||||||||||||||
Expenses, before reimbursements or recoupments | 0.86 | % | 0.83 | % | 0.87 | % | 0.85 | % | 0.91 | % | ||||||||||||||||||||||||||
Expenses, net of reimbursements or recoupments | 0.85 | % | 0.84 | % | 0.84 | % | 0.84 | % | 0.84 | % | ||||||||||||||||||||||||||
Net investment income, before expense reimbursements or recoupments | 6.33 | % | 6.31 | % | 5.91 | % | 6.00 | % | 6.30 | % | ||||||||||||||||||||||||||
Net investment income, net of reimbursements or recoupments | 6.34 | % | 6.30 | % | 5.94 | % | 6.01 | % | 6.37 | % | ||||||||||||||||||||||||||
Portfolio turnover rate | 57 | % | 44 | % | 51 | % | 50 | % | 57 | % | ||||||||||||||||||||||||||
| A | Prior to February 28, 2020, the R5 Class was known as Institutional Class. |
| B | Tax return of capital is calculated based on outstanding shares at the time of distribution. |
| C | Amount represents less than $0.01 per share. Effective December 29, 2016, the redemption fee was terminated by the Trust’s Board of Trustees. |
| D | Based on net asset value, which does not reflect the sales charge, redemption fee, or contingent deferred sales charge, if applicable. May include adjustments in accordance with U.S. GAAP and as such, the net asset value for reporting purposes and the returns based upon those net asset values may differ from the net asset value and returns for shareholder transactions. |
See accompanying notes
60
American Beacon SiM High Yield Opportunities FundSM
Financial Highlights
(For a share outstanding throughout the period)
| Y Class | ||||||||||||||||||||||||||||||||||||
| Year Ended August 31, | ||||||||||||||||||||||||||||||||||||
| 2020 | 2019 | 2018 | 2017 | 2016 | ||||||||||||||||||||||||||||||||
|
| |||||||||||||||||||||||||||||||||||
Net asset value, beginning of period | $ | 9.43 | $ | 9.51 | $ | 9.60 | $ | 9.48 | $ | 9.42 | ||||||||||||||||||||||||||
|
|
|
|
|
|
|
|
|
| |||||||||||||||||||||||||||
Income (loss) from investment operations: | ||||||||||||||||||||||||||||||||||||
Net investment income | 0.56 | 0.59 | 0.59 | 0.58 | 0.59 | |||||||||||||||||||||||||||||||
Net gains (losses) on investments (both realized and unrealized) | (0.37 | ) | (0.08 | ) | (0.11 | ) | 0.11 | 0.05 | ||||||||||||||||||||||||||||
|
|
|
|
|
|
|
|
|
| |||||||||||||||||||||||||||
Total income from investment operations | 0.19 | 0.51 | 0.48 | 0.69 | 0.64 | |||||||||||||||||||||||||||||||
|
|
|
|
|
|
|
|
|
| |||||||||||||||||||||||||||
Less distributions: | ||||||||||||||||||||||||||||||||||||
Dividends from net investment income | (0.57 | ) | (0.59 | ) | (0.55 | ) | (0.52 | ) | (0.52 | ) | ||||||||||||||||||||||||||
Tax return of capital | - | - | (0.02 | )A | (0.05 | )A | (0.06 | )A | ||||||||||||||||||||||||||||
|
|
|
|
|
|
|
|
|
| |||||||||||||||||||||||||||
Total distributions | (0.57 | ) | (0.59 | ) | (0.57 | ) | (0.57 | ) | (0.58 | ) | ||||||||||||||||||||||||||
|
|
|
|
|
|
|
|
|
| |||||||||||||||||||||||||||
Redemption fees added to beneficial interests | - | - | - | - | 0.00 | B | ||||||||||||||||||||||||||||||
|
|
|
|
|
|
|
|
|
| |||||||||||||||||||||||||||
Net asset value, end of period | $ | 9.05 | $ | 9.43 | $ | 9.51 | $ | 9.60 | $ | 9.48 | ||||||||||||||||||||||||||
|
|
|
|
|
|
|
|
|
| |||||||||||||||||||||||||||
Total returnC | 2.33 | % | 5.58 | % | 5.09 | % | 7.46 | % | 7.21 | % | ||||||||||||||||||||||||||
|
|
|
|
|
|
|
|
|
| |||||||||||||||||||||||||||
Ratios and supplemental data: |
| |||||||||||||||||||||||||||||||||||
Net assets, end of period | $ | 740,616,507 | $ | 661,486,121 | $ | 591,845,939 | $ | 577,349,417 | $ | 446,395,255 | ||||||||||||||||||||||||||
Ratios to average net assets: | ||||||||||||||||||||||||||||||||||||
Expenses, before reimbursements or recoupments | 0.90 | % | 0.91 | % | 0.88 | % | 0.89 | % | 0.91 | % | ||||||||||||||||||||||||||
Expenses, net of reimbursements or recoupments | 0.90 | % | 0.91 | % | 0.88 | % | 0.89 | % | 0.91 | % | ||||||||||||||||||||||||||
Net investment income, before expense reimbursements or recoupments | 6.29 | % | 6.23 | % | 5.90 | % | 5.93 | % | 6.28 | % | ||||||||||||||||||||||||||
Net investment income, net of reimbursements or recoupments | 6.29 | % | 6.23 | % | 5.90 | % | 5.93 | % | 6.29 | % | ||||||||||||||||||||||||||
Portfolio turnover rate | 57 | % | 44 | % | 51 | % | 50 | % | 57 | % | ||||||||||||||||||||||||||
| A | Tax return of capital is calculated based on outstanding shares at the time of distribution. |
| B | Amount represents less than $0.01 per share. Effective December 29, 2016, the redemption fee was terminated by the Trust’s Board of Trustees. |
| C | Based on net asset value, which does not reflect the sales charge, redemption fee, or contingent deferred sales charge, if applicable. May include adjustments in accordance with U.S. GAAP and as such, the net asset value for reporting purposes and the returns based upon those net asset values may differ from the net asset value and returns for shareholder transactions. |
See accompanying notes
61
American Beacon SiM High Yield Opportunities FundSM
Financial Highlights
(For a share outstanding throughout the period)
| Investor Class | ||||||||||||||||||||||||||||||||||||
| Year Ended August 31, | ||||||||||||||||||||||||||||||||||||
| 2020 | 2019 | 2018 | 2017 | 2016 | ||||||||||||||||||||||||||||||||
|
| |||||||||||||||||||||||||||||||||||
Net asset value, beginning of period | $ | 9.41 | $ | 9.49 | $ | 9.58 | $ | 9.45 | $ | 9.40 | ||||||||||||||||||||||||||
|
|
|
|
|
|
|
|
|
| |||||||||||||||||||||||||||
Income (loss) from investment operations: | ||||||||||||||||||||||||||||||||||||
Net investment income | 0.32 | 0.54 | 0.51 | 0.53 | 0.50 | |||||||||||||||||||||||||||||||
Net gains (losses) on investments (both realized and unrealized) | (0.17 | ) | (0.05 | ) | (0.06 | ) | 0.15 | 0.10 | ||||||||||||||||||||||||||||
|
|
|
|
|
|
|
|
|
| |||||||||||||||||||||||||||
Total income from investment operations | 0.15 | 0.49 | 0.45 | 0.68 | 0.60 | |||||||||||||||||||||||||||||||
|
|
|
|
|
|
|
|
|
| |||||||||||||||||||||||||||
Less distributions: | ||||||||||||||||||||||||||||||||||||
Dividends from net investment income | (0.54 | ) | (0.57 | ) | (0.52 | ) | (0.51 | ) | (0.49 | ) | ||||||||||||||||||||||||||
Tax return of capital | - | - | (0.02 | )A | (0.04 | )A | (0.06 | )A | ||||||||||||||||||||||||||||
|
|
|
|
|
|
|
|
|
| |||||||||||||||||||||||||||
Total distributions | (0.54 | ) | (0.57 | ) | (0.54 | ) | (0.55 | ) | (0.55 | ) | ||||||||||||||||||||||||||
|
|
|
|
|
|
|
|
|
| |||||||||||||||||||||||||||
Redemption fees added to beneficial interests | - | - | - | - | 0.00 | B | ||||||||||||||||||||||||||||||
|
|
|
|
|
|
|
|
|
| |||||||||||||||||||||||||||
Net asset value, end of period | $ | 9.02 | $ | 9.41 | $ | 9.49 | $ | 9.58 | $ | 9.45 | ||||||||||||||||||||||||||
|
|
|
|
|
|
|
|
|
| |||||||||||||||||||||||||||
Total returnC | 1.91 | % | 5.32 | % | 4.81 | % | 7.31 | % | 6.82 | % | ||||||||||||||||||||||||||
|
|
|
|
|
|
|
|
|
| |||||||||||||||||||||||||||
Ratios and supplemental data: |
| |||||||||||||||||||||||||||||||||||
Net assets, end of period | $ | 40,259,060 | $ | 78,700,798 | $ | 89,459,142 | $ | 115,679,739 | $ | 129,503,495 | ||||||||||||||||||||||||||
Ratios to average net assets: | ||||||||||||||||||||||||||||||||||||
Expenses, before reimbursements or recoupments | 1.18 | % | 1.15 | % | 1.14 | % | 1.13 | % | 1.17 | % | ||||||||||||||||||||||||||
Expenses, net of reimbursements or recoupments | 1.18 | % | 1.15 | % | 1.14 | % | 1.13 | % | 1.18 | % | ||||||||||||||||||||||||||
Net investment income, before expense reimbursements or recoupments | 5.91 | % | 5.98 | % | 5.62 | % | 5.70 | % | 5.97 | % | ||||||||||||||||||||||||||
Net investment income, net of reimbursements or recoupments | 5.91 | % | 5.98 | % | 5.62 | % | 5.70 | % | 5.96 | % | ||||||||||||||||||||||||||
Portfolio turnover rate | 57 | % | 44 | % | 51 | % | 50 | % | 57 | % | ||||||||||||||||||||||||||
| A | Tax return of capital is calculated based on outstanding shares at the time of distribution. |
| B | Amount represents less than $0.01 per share. Effective December 29, 2016, the redemption fee was terminated by the Trust’s Board of Trustees. |
| C | Based on net asset value, which does not reflect the sales charge, redemption fee, or contingent deferred sales charge, if applicable. May include adjustments in accordance with U.S. GAAP and as such, the net asset value for reporting purposes and the returns based upon those net asset values may differ from the net asset value and returns for shareholder transactions. |
See accompanying notes
62
American Beacon SiM High Yield Opportunities FundSM
Financial Highlights
(For a share outstanding throughout the period)
| A Class | ||||||||||||||||||||||||||||||||||||
| Year Ended August 31, | ||||||||||||||||||||||||||||||||||||
| 2020 | 2019 | 2018 | 2017 | 2016 | ||||||||||||||||||||||||||||||||
|
| |||||||||||||||||||||||||||||||||||
Net asset value, beginning of period | $ | 9.41 | $ | 9.53 | $ | 9.61 | $ | 9.49 | $ | 9.43 | ||||||||||||||||||||||||||
|
|
|
|
|
|
|
|
|
| |||||||||||||||||||||||||||
Income (loss) from investment operations: | ||||||||||||||||||||||||||||||||||||
Net investment income | 0.55 | 0.47 | 0.48 | 0.55 | 0.54 | |||||||||||||||||||||||||||||||
Net gains (losses) on investments (both realized and unrealized) | (0.39 | ) | (0.02 | ) | (0.01 | ) | 0.11 | 0.07 | ||||||||||||||||||||||||||||
|
|
|
|
|
|
|
|
|
| |||||||||||||||||||||||||||
Total income from investment operations | 0.16 | 0.45 | 0.47 | 0.66 | 0.61 | |||||||||||||||||||||||||||||||
|
|
|
|
|
|
|
|
|
| |||||||||||||||||||||||||||
Less distributions: | ||||||||||||||||||||||||||||||||||||
Dividends from net investment income | (0.55 | ) | (0.57 | ) | (0.53 | ) | (0.50 | ) | (0.49 | ) | ||||||||||||||||||||||||||
Tax return of capital | - | - | (0.02 | )A | (0.04 | )A | (0.06 | )A | ||||||||||||||||||||||||||||
|
|
|
|
|
|
|
|
|
| |||||||||||||||||||||||||||
Total distributions | (0.55 | ) | (0.57 | ) | (0.55 | ) | (0.54 | ) | (0.55 | ) | ||||||||||||||||||||||||||
|
|
|
|
|
|
|
|
|
| |||||||||||||||||||||||||||
Redemption fees added to beneficial interests | - | - | - | - | 0.00 | B | ||||||||||||||||||||||||||||||
|
|
|
|
|
|
|
|
|
| |||||||||||||||||||||||||||
Net asset value, end of period | $ | 9.02 | $ | 9.41 | $ | 9.53 | $ | 9.61 | $ | 9.49 | ||||||||||||||||||||||||||
|
|
|
|
|
|
|
|
|
| |||||||||||||||||||||||||||
Total returnC | 1.94 | % | 4.85 | % | 5.00 | % | 7.12 | % | 6.87 | % | ||||||||||||||||||||||||||
|
|
|
|
|
|
|
|
|
| |||||||||||||||||||||||||||
Ratios and supplemental data: |
| |||||||||||||||||||||||||||||||||||
Net assets, end of period | $ | 23,945,109 | $ | 23,694,436 | $ | 37,998,012 | $ | 84,955,157 | $ | 79,917,424 | ||||||||||||||||||||||||||
Ratios to average net assets: | ||||||||||||||||||||||||||||||||||||
Expenses, before reimbursements or recoupments | 1.15 | % | 1.17 | % | 1.07 | % | 1.20 | % | 1.23 | % | ||||||||||||||||||||||||||
Expenses, net of reimbursements or recoupments | 1.15 | % | 1.17 | % | 1.07 | % | 1.20 | % | 1.24 | % | ||||||||||||||||||||||||||
Net investment income, before expense reimbursements or recoupments | 6.01 | % | 5.94 | % | 5.65 | % | 5.62 | % | 5.99 | % | ||||||||||||||||||||||||||
Net investment income, net of reimbursements or recoupments | 6.01 | % | 5.94 | % | 5.65 | % | 5.62 | % | 5.98 | % | ||||||||||||||||||||||||||
Portfolio turnover rate | 57 | % | 44 | % | 51 | % | 50 | % | 57 | % | ||||||||||||||||||||||||||
| A | Tax return of capital is calculated based on outstanding shares at the time of distribution. |
| B | Amount represents less than $0.01 per share. Effective December 29, 2016, the redemption fee was terminated by the Trust’s Board of Trustees. |
| C | Based on net asset value, which does not reflect the sales charge, redemption fee, or contingent deferred sales charge, if applicable. May include adjustments in accordance with U.S. GAAP and as such, the net asset value for reporting purposes and the returns based upon those net asset values may differ from the net asset value and returns for shareholder transactions. |
See accompanying notes
63
American Beacon SiM High Yield Opportunities FundSM
Financial Highlights
(For a share outstanding throughout the period)
| C Class | ||||||||||||||||||||||||||||||||||||
| Year Ended August 31, | ||||||||||||||||||||||||||||||||||||
| 2020 | 2019 | 2018 | 2017 | 2016 | ||||||||||||||||||||||||||||||||
|
| |||||||||||||||||||||||||||||||||||
Net asset value, beginning of period | $ | 9.48 | $ | 9.56 | $ | 9.65 | $ | 9.53 | $ | 9.47 | ||||||||||||||||||||||||||
|
|
|
|
|
|
|
|
|
| |||||||||||||||||||||||||||
Income (loss) from investment operations: | ||||||||||||||||||||||||||||||||||||
Net investment income | 0.46 | 0.49 | 0.48 | 0.47 | 0.48 | |||||||||||||||||||||||||||||||
Net gains (losses) on investments (both realized and unrealized) | (0.37 | ) | (0.07 | ) | (0.09 | ) | 0.12 | 0.06 | ||||||||||||||||||||||||||||
|
|
|
|
|
|
|
|
|
| |||||||||||||||||||||||||||
Total income from investment operations | 0.09 | 0.42 | 0.39 | 0.59 | 0.54 | |||||||||||||||||||||||||||||||
|
|
|
|
|
|
|
|
|
| |||||||||||||||||||||||||||
Less distributions: | ||||||||||||||||||||||||||||||||||||
Dividends from net investment income | (0.48 | ) | (0.50 | ) | (0.47 | ) | (0.43 | ) | (0.43 | ) | ||||||||||||||||||||||||||
Tax return of capital | - | - | (0.01 | )A | (0.04 | )A | (0.05 | )A | ||||||||||||||||||||||||||||
|
|
|
|
|
|
|
|
|
| |||||||||||||||||||||||||||
Total distributions | (0.48 | ) | (0.50 | ) | (0.48 | ) | (0.47 | ) | (0.48 | ) | ||||||||||||||||||||||||||
|
|
|
|
|
|
|
|
|
| |||||||||||||||||||||||||||
Redemption fees added to beneficial interests | - | - | - | - | 0.00 | B | ||||||||||||||||||||||||||||||
|
|
|
|
|
|
|
|
|
| |||||||||||||||||||||||||||
Net asset value, end of period | $ | 9.09 | $ | 9.48 | $ | 9.56 | $ | 9.65 | $ | 9.53 | ||||||||||||||||||||||||||
|
|
|
|
|
|
|
|
|
| |||||||||||||||||||||||||||
Total returnC | 1.22 | % | 4.54 | % | 4.08 | % | 6.33 | % | 6.08 | % | ||||||||||||||||||||||||||
|
|
|
|
|
|
|
|
|
| |||||||||||||||||||||||||||
Ratios and supplemental data: |
| |||||||||||||||||||||||||||||||||||
Net assets, end of period | $ | 41,992,083 | $ | 55,699,475 | $ | 60,797,852 | $ | 69,698,961 | $ | 73,668,689 | ||||||||||||||||||||||||||
Ratios to average net assets: | ||||||||||||||||||||||||||||||||||||
Expenses, before reimbursements or recoupments | 1.89 | % | 1.89 | % | 1.85 | % | 1.94 | % | 1.97 | % | ||||||||||||||||||||||||||
Expenses, net of reimbursements or recoupments | 1.89 | % | 1.89 | % | 1.85 | % | 1.94 | % | 1.99 | % | ||||||||||||||||||||||||||
Net investment income, before expense reimbursements or recoupments | 5.26 | % | 5.24 | % | 4.93 | % | 4.90 | % | 5.26 | % | ||||||||||||||||||||||||||
Net investment income, net of reimbursements or recoupments | 5.26 | % | 5.24 | % | 4.93 | % | 4.90 | % | 5.25 | % | ||||||||||||||||||||||||||
Portfolio turnover rate | 57 | % | 44 | % | 51 | % | 50 | % | 57 | % | ||||||||||||||||||||||||||
| A | Tax return of capital is calculated based on outstanding shares at the time of distribution. |
| B | Amount represents less than $0.01 per share. Effective December 29, 2016, the redemption fee was terminated by the Trust’s Board of Trustees. |
| C | Based on net asset value, which does not reflect the sales charge, redemption fee, or contingent deferred sales charge, if applicable. May include adjustments in accordance with U.S. GAAP and as such, the net asset value for reporting purposes and the returns based upon those net asset values may differ from the net asset value and returns for shareholder transactions. |
See accompanying notes
64
American Beacon Sound Point Floating Rate Income FundSM
Financial Highlights
(For a share outstanding throughout the period)
| R5 ClassA | ||||||||||||||||||||||||||||||||||||
| Year Ended August 31, | ||||||||||||||||||||||||||||||||||||
| 2020 | 2019 | 2018 | 2017 | 2016 | ||||||||||||||||||||||||||||||||
|
| |||||||||||||||||||||||||||||||||||
Net asset value, beginning of period | $ | 9.79 | $ | 10.28 | $ | 10.35 | $ | 10.20 | $ | 10.38 | ||||||||||||||||||||||||||
|
|
|
|
|
|
|
|
|
| |||||||||||||||||||||||||||
Income (loss) from investment operations: | ||||||||||||||||||||||||||||||||||||
Net investment income | 0.50 | 0.56 | 0.53 | 0.46 | 0.51 | |||||||||||||||||||||||||||||||
Net gains (losses) on investments (both realized and unrealized) | (0.92 | ) | (0.44 | ) | (0.05 | ) | 0.18 | (0.10 | ) | |||||||||||||||||||||||||||
|
|
|
|
|
|
|
|
|
| |||||||||||||||||||||||||||
Total income (loss) from investment operations | (0.42 | ) | 0.12 | 0.48 | 0.64 | 0.41 | ||||||||||||||||||||||||||||||
|
|
|
|
|
|
|
|
|
| |||||||||||||||||||||||||||
Less distributions: | ||||||||||||||||||||||||||||||||||||
Dividends from net investment income | (0.55 | ) | (0.61 | ) | (0.52 | ) | (0.47 | ) | (0.55 | ) | ||||||||||||||||||||||||||
Distributions from net realized gains | - | - | (0.03 | ) | (0.02 | ) | (0.04 | ) | ||||||||||||||||||||||||||||
|
|
|
|
|
|
|
|
|
| |||||||||||||||||||||||||||
Total distributions | (0.55 | ) | (0.61 | ) | (0.55 | ) | (0.49 | ) | (0.59 | ) | ||||||||||||||||||||||||||
|
|
|
|
|
|
|
|
|
| |||||||||||||||||||||||||||
Net asset value, end of period | $ | 8.82 | $ | 9.79 | $ | 10.28 | $ | 10.35 | $ | 10.20 | ||||||||||||||||||||||||||
|
|
|
|
|
|
|
|
|
| |||||||||||||||||||||||||||
Total returnB | (4.08 | )% | 1.77 | % | 4.71 | % | 6.37 | % | 4.12 | % | ||||||||||||||||||||||||||
|
|
|
|
|
|
|
|
|
| |||||||||||||||||||||||||||
Ratios and supplemental data: | ||||||||||||||||||||||||||||||||||||
Net assets, end of period | $ | 160,767,886 | $ | 343,916,230 | $ | 391,526,212 | $ | 231,445,512 | $ | 63,147,618 | ||||||||||||||||||||||||||
Ratios to average net assets: |
| |||||||||||||||||||||||||||||||||||
Expenses, before reimbursements or recoupments | 0.90 | % | 0.84 | % | 0.82 | % | 0.85 | % | 1.26 | % | ||||||||||||||||||||||||||
Expenses, net of reimbursements or recoupments | 0.90 | % | 0.84 | % | 0.84 | % | 0.84 | % | 0.92 | %C | ||||||||||||||||||||||||||
Net investment income, before expense reimbursements or recoupments | 6.29 | % | 6.10 | % | 5.16 | % | 4.51 | % | 4.78 | % | ||||||||||||||||||||||||||
Net investment income, net of reimbursements or recoupments | 6.29 | % | 6.10 | % | 5.14 | % | 4.52 | % | 5.12 | % | ||||||||||||||||||||||||||
Portfolio turnover rate | 56 | % | 58 | % | 69 | % | 86 | % | 168 | % | ||||||||||||||||||||||||||
| A | Prior to February 28, 2020, the R5 Class was known as Institutional Class. |
| B | Based on net asset value, which does not reflect the sales charge, redemption fee, or contingent deferred sales charge, if applicable. May include adjustments in accordance with U.S. GAAP and as such, the net asset value for reporting purposes and the returns based upon those net asset values may differ from the net asset value and returns for shareholder transactions. |
| C | Expense ratios may exceed stated expense caps in Note 2 due to pre-adoption expenses. |
See accompanying notes
65
American Beacon Sound Point Floating Rate Income FundSM
Financial Highlights
(For a share outstanding throughout the period)
| Y Class | ||||||||||||||||||||||||||||||||||||
| Year Ended August 31, | December 11, 2015A to August 31, 2016 | |||||||||||||||||||||||||||||||||||
| 2020 | 2019 | 2018 | 2017 | |||||||||||||||||||||||||||||||||
|
| |||||||||||||||||||||||||||||||||||
Net asset value, beginning of period | $ | 9.80 | $ | 10.29 | $ | 10.36 | $ | 10.21 | $ | 10.34 | ||||||||||||||||||||||||||
|
|
|
|
|
|
|
|
|
| |||||||||||||||||||||||||||
Income (loss) from investment operations: | ||||||||||||||||||||||||||||||||||||
Net investment income | 0.46 | 0.54 | 0.52 | 0.46 | 0.53 | |||||||||||||||||||||||||||||||
Net gains (losses) on investments (both realized and unrealized) | (0.89 | ) | (0.42 | ) | (0.04 | ) | 0.17 | (0.09 | ) | |||||||||||||||||||||||||||
|
|
|
|
|
|
|
|
|
| |||||||||||||||||||||||||||
Total income (loss) from investment operations | (0.43 | ) | 0.12 | 0.48 | 0.63 | 0.44 | ||||||||||||||||||||||||||||||
|
|
|
|
|
|
|
|
|
| |||||||||||||||||||||||||||
Less distributions: | ||||||||||||||||||||||||||||||||||||
Dividends from net investment income | (0.55 | ) | (0.61 | ) | (0.52 | ) | (0.46 | ) | (0.53 | ) | ||||||||||||||||||||||||||
Distributions from net realized gains | - | - | (0.03 | ) | (0.02 | ) | (0.04 | ) | ||||||||||||||||||||||||||||
|
|
|
|
|
|
|
|
|
| |||||||||||||||||||||||||||
Total distributions | (0.55 | ) | (0.61 | ) | (0.55 | ) | (0.48 | ) | (0.57 | ) | ||||||||||||||||||||||||||
|
|
|
|
|
|
|
|
|
| |||||||||||||||||||||||||||
Net asset value, end of period | $ | 8.82 | $ | 9.80 | $ | 10.29 | $ | 10.36 | $ | 10.21 | ||||||||||||||||||||||||||
|
|
|
|
|
|
|
|
|
| |||||||||||||||||||||||||||
Total returnB | (4.24 | )% | 1.68 | % | 4.68 | % | 6.27 | % | 4.37 | %C | ||||||||||||||||||||||||||
|
|
|
|
|
|
|
|
|
| |||||||||||||||||||||||||||
Ratios and supplemental data: | ||||||||||||||||||||||||||||||||||||
Net assets, end of period | $ | 323,133,710 | $ | 786,638,267 | $ | 1,260,705,246 | $ | 507,077,617 | $ | 22,952,034 | ||||||||||||||||||||||||||
Ratios to average net assets: |
| |||||||||||||||||||||||||||||||||||
Expenses, before reimbursements or recoupments | 0.96 | % | 0.90 | % | 0.88 | % | 0.92 | % | 1.42 | %D | ||||||||||||||||||||||||||
Expenses, net of reimbursements or recoupments | 0.96 | % | 0.90 | % | 0.88 | % | 0.93 | % | 0.94 | %D | ||||||||||||||||||||||||||
Net investment income, before expense reimbursements or recoupments | 6.21 | % | 5.99 | % | 5.13 | % | 4.43 | % | 4.64 | %D | ||||||||||||||||||||||||||
Net investment income, net of reimbursements or recoupments | 6.21 | % | 5.99 | % | 5.13 | % | 4.42 | % | 5.11 | %D | ||||||||||||||||||||||||||
Portfolio turnover rate | 56 | % | 58 | % | 69 | % | 86 | % | 168 | %E | ||||||||||||||||||||||||||
| A | Commencement of operations. |
| B | Based on net asset value, which does not reflect the sales charge, redemption fee, or contingent deferred sales charge, if applicable. May include adjustments in accordance with U.S. GAAP and as such, the net asset value for reporting purposes and the returns based upon those net asset values may differ from the net asset value and returns for shareholder transactions. |
| C | Not annualized. |
| D | Annualized. |
| E | Portfolio turnover rate is for the period from December 11, 2015 through August 31, 2016 and is not annualized. |
See accompanying notes
66
American Beacon Sound Point Floating Rate Income FundSM
Financial Highlights
(For a share outstanding throughout the period)
| Investor Class | ||||||||||||||||||||||||||||||||||||
| Year Ended August 31, | December 11, 2015A to August 31, 2016 | |||||||||||||||||||||||||||||||||||
| 2020 | 2019 | 2018 | 2017 | |||||||||||||||||||||||||||||||||
|
| |||||||||||||||||||||||||||||||||||
Net asset value, beginning of period | $ | 9.78 | $ | 10.26 | $ | 10.33 | $ | 10.18 | $ | 10.33 | ||||||||||||||||||||||||||
|
|
|
|
|
|
|
|
|
| |||||||||||||||||||||||||||
Income (loss) from investment operations: | ||||||||||||||||||||||||||||||||||||
Net investment income | 0.30 | 0.49 | 0.50 | 0.46 | 0.50 | |||||||||||||||||||||||||||||||
Net gains (losses) on investments (both realized and unrealized) | (0.76 | ) | (0.40 | ) | (0.04 | ) | 0.15 | (0.09 | ) | |||||||||||||||||||||||||||
|
|
|
|
|
|
|
|
|
| |||||||||||||||||||||||||||
Total income (loss) from investment operations | (0.46 | ) | 0.09 | 0.46 | 0.61 | 0.41 | ||||||||||||||||||||||||||||||
|
|
|
|
|
|
|
|
|
| |||||||||||||||||||||||||||
Less distributions: | ||||||||||||||||||||||||||||||||||||
Dividends from net investment income | (0.52 | ) | (0.57 | ) | (0.50 | ) | (0.44 | ) | (0.52 | ) | ||||||||||||||||||||||||||
Distributions from net realized gains | – | – | (0.03 | ) | (0.02 | ) | (0.04 | ) | ||||||||||||||||||||||||||||
|
|
|
|
|
|
|
|
|
| |||||||||||||||||||||||||||
Total distributions | (0.52 | ) | (0.57 | ) | (0.53 | ) | (0.46 | ) | (0.56 | ) | ||||||||||||||||||||||||||
|
|
|
|
|
|
|
|
|
| |||||||||||||||||||||||||||
Net asset value, end of period | $ | 8.80 | $ | 9.78 | $ | 10.26 | $ | 10.33 | $ | 10.18 | ||||||||||||||||||||||||||
|
|
|
|
|
|
|
|
|
| |||||||||||||||||||||||||||
Total returnB | (4.53 | )% | 1.38 | % | 4.51 | % | 6.12 | % | 4.16 | %C | ||||||||||||||||||||||||||
|
|
|
|
|
|
|
|
|
| |||||||||||||||||||||||||||
Ratios and supplemental data: | ||||||||||||||||||||||||||||||||||||
Net assets, end of period | $ | 57,117,869 | $ | 214,702,538 | $ | 538,668,514 | $ | 129,817,379 | $ | 3,641,581 | ||||||||||||||||||||||||||
Ratios to average net assets: | ||||||||||||||||||||||||||||||||||||
Expenses, before reimbursements or recoupments | 1.24 | % | 1.22 | % | 1.04 | % | 1.07 | % | 1.31 | %D | ||||||||||||||||||||||||||
Expenses, net of reimbursements or recoupments | 1.24 | % | 1.22 | % | 1.04 | % | 1.09 | % | 1.22 | %D | ||||||||||||||||||||||||||
Net investment income, before expense reimbursements or recoupments | 5.99 | % | 5.60 | % | 5.02 | % | 4.24 | % | 4.26 | %D | ||||||||||||||||||||||||||
Net investment income, net of reimbursements or recoupments | 5.99 | % | 5.60 | % | 5.02 | % | 4.22 | % | 4.35 | %D | ||||||||||||||||||||||||||
Portfolio turnover rate | 56 | % | 58 | % | 69 | % | 86 | % | 168 | %E | ||||||||||||||||||||||||||
| A | Commencement of operations. |
| B | Based on net asset value, which does not reflect the sales charge, redemption fee, or contingent deferred sales charge, if applicable. May include adjustments in accordance with U.S. GAAP and as such, the net asset value for reporting purposes and the returns based upon those net asset values may differ from the net asset value and returns for shareholder transactions. |
| C | Not annualized. |
| D | Annualized. |
| E | Portfolio turnover rate is for the period from December 11, 2015 through August 31, 2016 and is not annualized. |
See accompanying notes
67
American Beacon Sound Point Floating Rate Income FundSM
Financial Highlights
(For a share outstanding throughout the period)
| A Class | ||||||||||||||||||||||||||||||||||||
| Year Ended August 31, | December 11, 2015A to August 31, 2016 | |||||||||||||||||||||||||||||||||||
| 2020 | 2019 | 2018 | 2017 | |||||||||||||||||||||||||||||||||
|
| |||||||||||||||||||||||||||||||||||
Net asset value, beginning of period | $ | 9.82 | $ | 10.28 | $ | 10.35 | $ | 10.20 | $ | 10.33 | ||||||||||||||||||||||||||
|
|
|
|
|
|
|
|
|
|
|
| |||||||||||||||||||||||||
Income (loss) from investment operations: | ||||||||||||||||||||||||||||||||||||
Net investment income | 0.51 | 0.56 | 0.49 | 0.42 | 0.51 | |||||||||||||||||||||||||||||||
Net gains (losses) on investments (both realized and unrealized) | (0.97 | ) | (0.44 | ) | (0.04 | ) | 0.17 | (0.10 | ) | |||||||||||||||||||||||||||
|
|
|
|
|
|
|
|
|
| |||||||||||||||||||||||||||
Total income (loss) from investment operations | (0.46 | ) | 0.12 | 0.45 | 0.59 | 0.41 | ||||||||||||||||||||||||||||||
|
|
|
|
|
|
|
|
|
| |||||||||||||||||||||||||||
Less distributions: | ||||||||||||||||||||||||||||||||||||
Dividends from net investment income | (0.53 | ) | (0.58 | ) | (0.49 | ) | (0.42 | ) | (0.50 | ) | ||||||||||||||||||||||||||
Distributions from net realized gains | – | – | (0.03 | ) | (0.02 | ) | (0.04 | ) | ||||||||||||||||||||||||||||
|
|
|
|
|
|
|
|
|
| |||||||||||||||||||||||||||
Total distributions | (0.53 | ) | (0.58 | ) | (0.52 | ) | (0.44 | ) | (0.54 | ) | ||||||||||||||||||||||||||
|
|
|
|
|
|
|
|
|
| |||||||||||||||||||||||||||
Net asset value, end of period | $ | 8.83 | $ | 9.82 | $ | 10.28 | $ | 10.35 | $ | 10.20 | ||||||||||||||||||||||||||
|
|
|
|
|
|
|
|
|
| |||||||||||||||||||||||||||
Total returnB | (4.53 | )% | 1.53 | % | 4.39 | % | 5.92 | % | 4.13 | %C | ||||||||||||||||||||||||||
|
|
|
|
|
|
|
|
|
| |||||||||||||||||||||||||||
Ratios and supplemental data: | ||||||||||||||||||||||||||||||||||||
Net assets, end of period | $ | 29,739,876 | $ | 45,602,098 | $ | 58,987,550 | $ | 32,450,342 | $ | 6,849,306 | ||||||||||||||||||||||||||
Ratios to average net assets: | ||||||||||||||||||||||||||||||||||||
Expenses, before reimbursements or recoupments | 1.17 | % | 1.13 | % | 1.13 | % | 1.22 | % | 1.67 | %D | ||||||||||||||||||||||||||
Expenses, net of reimbursements or recoupments | 1.17 | % | 1.13 | % | 1.14 | % | 1.24 | % | 1.24 | %D | ||||||||||||||||||||||||||
Net investment income, before expense reimbursements or recoupments | 5.95 | % | 5.80 | % | 4.85 | % | 4.07 | % | 4.51 | %D | ||||||||||||||||||||||||||
Net investment income, net of reimbursements or recoupments | 5.95 | % | 5.80 | % | 4.84 | % | 4.04 | % | 4.93 | %D | ||||||||||||||||||||||||||
Portfolio turnover rate | 56 | % | 58 | % | 69 | % | 86 | % | 168 | %E | ||||||||||||||||||||||||||
| A | Commencement of operations. |
| B | Based on net asset value, which does not reflect the sales charge, redemption fee, or contingent deferred sales charge, if applicable. May include adjustments in accordance with U.S. GAAP and as such, the net asset value for reporting purposes and the returns based upon those net asset values may differ from the net asset value and returns for shareholder transactions. |
| C | Not annualized. |
| D | Annualized. |
| E | Portfolio turnover rate is for the period from December 11, 2015 through August 31, 2016 and is not annualized. |
See accompanying notes
68
American Beacon Sound Point Floating Rate Income FundSM
Financial Highlights
(For a share outstanding throughout the period)
| C Class | ||||||||||||||||||||||||||||||||||||
| Year Ended August 31, | December 11, 2015A to August 31, 2016 | |||||||||||||||||||||||||||||||||||
| 2020 | 2019 | 2018 | 2017 | |||||||||||||||||||||||||||||||||
|
| |||||||||||||||||||||||||||||||||||
Net asset value, beginning of period | $ | 9.85 | $ | 10.29 | $ | 10.35 | $ | 10.21 | $ | 10.33 | ||||||||||||||||||||||||||
|
|
|
|
|
|
|
|
|
| |||||||||||||||||||||||||||
Income (loss) from investment operations: | ||||||||||||||||||||||||||||||||||||
Net investment income | 0.45 | 0.51 | 0.42 | 0.35 | 0.45 | |||||||||||||||||||||||||||||||
Net gains (losses) on investments (both realized and unrealized) | (0.98 | ) | (0.44 | ) | (0.04 | ) | 0.16 | (0.08 | ) | |||||||||||||||||||||||||||
|
|
|
|
|
|
|
|
|
| |||||||||||||||||||||||||||
Total income (loss) from investment operations | (0.53 | ) | 0.07 | 0.38 | 0.51 | 0.37 | ||||||||||||||||||||||||||||||
|
|
|
|
|
|
|
|
|
| |||||||||||||||||||||||||||
Less distributions: | ||||||||||||||||||||||||||||||||||||
Dividends from net investment income | (0.46 | ) | (0.51 | ) | (0.41 | ) | (0.35 | ) | (0.45 | ) | ||||||||||||||||||||||||||
Distributions from net realized gains | – | – | (0.03 | ) | (0.02 | ) | (0.04 | ) | ||||||||||||||||||||||||||||
|
|
|
|
|
|
|
|
|
| |||||||||||||||||||||||||||
Total distributions | (0.46 | ) | (0.51 | ) | (0.44 | ) | (0.37 | ) | (0.49 | ) | ||||||||||||||||||||||||||
|
|
|
|
|
|
|
|
|
| |||||||||||||||||||||||||||
Net asset value, end of period | $ | 8.86 | $ | 9.85 | $ | 10.29 | $ | 10.35 | $ | 10.21 | ||||||||||||||||||||||||||
|
|
|
|
|
|
|
|
|
| |||||||||||||||||||||||||||
Total returnB | (5.25 | )% | 0.67 | % | 3.73 | % | 5.03 | % | 3.67 | %C | ||||||||||||||||||||||||||
|
|
|
|
|
|
|
|
|
| |||||||||||||||||||||||||||
Ratios and supplemental data: | ||||||||||||||||||||||||||||||||||||
Net assets, end of period | $ | 31,330,022 | $ | 58,653,731 | $ | 59,792,915 | $ | 31,434,098 | $ | 3,040,244 | ||||||||||||||||||||||||||
Ratios to average net assets: | ||||||||||||||||||||||||||||||||||||
Expenses, before reimbursements or recoupments | 1.94 | % | 1.90 | % | 1.88 | % | 1.97 | % | 2.55 | %D | ||||||||||||||||||||||||||
Expenses, net of reimbursements or recoupments | 1.94 | % | 1.90 | % | 1.88 | % | 1.99 | % | 1.99 | %D | ||||||||||||||||||||||||||
Net investment income, before expense reimbursements or recoupments | 5.19 | % | 5.07 | % | 4.10 | % | 3.31 | % | 3.50 | %D | ||||||||||||||||||||||||||
Net investment income, net of reimbursements or recoupments | 5.19 | % | 5.07 | % | 4.10 | % | 3.29 | % | 4.06 | %D | ||||||||||||||||||||||||||
Portfolio turnover rate | 56 | % | 58 | % | 69 | % | 86 | % | 168 | %E | ||||||||||||||||||||||||||
| A | Commencement of operations. |
| B | Based on net asset value, which does not reflect the sales charge, redemption fee, or contingent deferred sales charge, if applicable. May include adjustments in accordance with U.S. GAAP and as such, the net asset value for reporting purposes and the returns based upon those net asset values may differ from the net asset value and returns for shareholder transactions. |
| C | Not annualized. |
| D | Annualized. |
| E | Portfolio turnover rate is for the period from December 11, 2015 through August 31, 2016 and is not annualized. |
See accompanying notes
69
American Beacon Sound Point Floating Rate Income FundSM
Financial Highlights
(For a share outstanding throughout the period)
| SP ClassA | ||||||||||||||||||||||||||||||||||||
| Year Ended August 31, | ||||||||||||||||||||||||||||||||||||
| 2020 | 2019 | 2018 | 2017 | 2016 | ||||||||||||||||||||||||||||||||
|
| |||||||||||||||||||||||||||||||||||
Net asset value, beginning of period | $ | 9.84 | $ | 10.30 | $ | 10.36 | $ | 10.19 | $ | 10.38 | ||||||||||||||||||||||||||
|
|
|
|
|
|
|
|
|
| |||||||||||||||||||||||||||
Income from investment operations: | ||||||||||||||||||||||||||||||||||||
Net investment income | 0.56 | B | 0.58 | B | 0.49 | 0.25 | B | 0.30 | ||||||||||||||||||||||||||||
Net gains (losses) on investments (both realized and unrealized) | (1.02 | ) | (0.46 | ) | (0.03 | ) | 0.37 | 0.07 | ||||||||||||||||||||||||||||
|
|
|
|
|
|
|
|
|
| |||||||||||||||||||||||||||
Total income (loss) from investment operations | (0.46 | ) | 0.12 | 0.46 | 0.62 | 0.37 | ||||||||||||||||||||||||||||||
|
|
|
|
|
|
|
|
|
| |||||||||||||||||||||||||||
Less distributions: | ||||||||||||||||||||||||||||||||||||
Dividends from net investment income | (0.52 | ) | (0.58 | ) | (0.49 | ) | (0.43 | ) | (0.52 | ) | ||||||||||||||||||||||||||
Distributions from net realized gains | – | – | (0.03 | ) | (0.02 | ) | (0.04 | ) | ||||||||||||||||||||||||||||
|
|
|
|
|
|
|
|
|
| |||||||||||||||||||||||||||
Total distributions | (0.52 | ) | (0.58 | ) | (0.52 | ) | (0.45 | ) | (0.56 | ) | ||||||||||||||||||||||||||
|
|
|
|
|
|
|
|
|
| |||||||||||||||||||||||||||
Net asset value, end of period | $ | 8.86 | $ | 9.84 | $ | 10.30 | $ | 10.36 | $ | 10.19 | ||||||||||||||||||||||||||
|
|
|
|
|
|
|
|
|
| |||||||||||||||||||||||||||
Total returnC | (4.51 | )% | 1.40 | % | 4.49 | % | 6.13 | % | 3.70 | % | ||||||||||||||||||||||||||
|
|
|
|
|
|
|
|
|
| |||||||||||||||||||||||||||
Ratios and supplemental data: | ||||||||||||||||||||||||||||||||||||
Net assets, end of period | $ | 113,010 | $ | 282,847 | $ | 705,984 | $ | 785,649 | $ | 11,651,032 | ||||||||||||||||||||||||||
Ratios to average net assets: | ||||||||||||||||||||||||||||||||||||
Expenses, before reimbursements or recoupments | 1.16 | % | 1.06 | % | 1.04 | % | 1.08 | % | 1.49 | % | ||||||||||||||||||||||||||
Expenses, net of reimbursements or recoupments | 1.16 | % | 1.15 | % | 1.15 | % | 1.12 | % | 1.19 | %D | ||||||||||||||||||||||||||
Net investment income, before expense reimbursements or recoupments | 6.08 | % | 5.83 | % | 4.86 | % | 4.25 | % | 4.01 | % | ||||||||||||||||||||||||||
Net investment income, net of reimbursements or recoupments | 6.08 | % | 5.74 | % | 4.75 | % | 4.21 | % | 4.30 | % | ||||||||||||||||||||||||||
Portfolio turnover rate | 56 | % | 58 | % | 69 | % | 86 | % | 168 | % | ||||||||||||||||||||||||||
| A | Prior to the reorganization on December 11, 2015, the SP Class was known as the Investor Class. |
| B | Per share amounts have been calculated using the average shares method. |
| C | Based on net asset value, which does not reflect the sales charge, redemption fee, or contingent deferred sales charge, if applicable. May include adjustments in accordance with U.S. GAAP and as such, the net asset value for reporting purposes and the returns based upon those net asset values may differ from the net asset value and returns for shareholder transactions. |
| D | Expense ratios may exceed stated expense caps in Note 2 due to pre-adoption expenses. |
See accompanying notes
70
American Beacon FundsSM
August 31, 2020 (Unaudited)
Certain tax information regarding the Funds are required to be provided to shareholders based upon the Fund’s income and distributions for the taxable year ended August 31, 2020. The information and distributions reported herein may differ from information and distributions taxable to the shareholders for the calendar year ended December 31, 2020.
The Funds designated the following items with regard to distributions paid during the fiscal year ended August 31, 2020. All designations are based on financial information available as of this annual report and, accordingly, are subject to change. For each item, it is the intention of the Funds to designate the maximum amount permitted under the Internal Revenue Code of 1986, as amended, and the regulations there under.
Corporate Dividends-Received Deduction:
SiM High Yield Opportunities | 0.08 | % | ||
Sound Point Floating Rate Income | N/A |
Qualified Dividend Income:
SiM High Yield Opportunities | 0.49 | % | ||
Sound Point Floating Rate Income | N/A |
Long-Term Capital Gain Distributions:
SiM High Yield Opportunities | $ | - | ||
Sound Point Floating Rate Income | - |
Short-Term Capital Gain Distributions:
SiM High Yield Opportunities | $ | - | ||
Sound Point Floating Rate Income | - |
Shareholders will receive notification in January 2021 of the applicable tax information necessary to prepare their 2020 income tax returns.
71
Disclosures Regarding the Approval of the Management and Investment Advisory Agreements
August 31, 2020 (Unaudited)
Renewal and Approval of Management Agreement and Investment Advisory Agreements
At meetings held on May 14, 2020 and June 3-4, 2020 (collectively, the “Meetings”) via Zoom videoconference, the Board of Trustees (“Board” or “Trustees”) considered and then, at its June 4, 2020 meeting, approved the renewal of:
(1) the Management Agreement between American Beacon Advisors, Inc. (“Manager”) and the American Beacon Funds (“Trust”), on behalf of the American Beacon Sound Point Floating Rate Income Fund (“Sound Point Fund”) and American Beacon SiM High Yield Opportunities Fund (“SiM Fund”) (each, a “Fund” and collectively, the “Funds”);
(2) the Investment Advisory Agreement among the Manager, Sound Point Capital Management, LP (“Sound Point”), and the Trust, on behalf of the Sound Point Fund; and
(3) the Investment Advisory Agreement among the Manager, Strategic Income Management, LLC (“SiM”), and the Trust, on behalf of the SiM Fund.
Sound Point and SiM are hereinafter each referred to as a “subadvisor” and collectively as the “subadvisors.” The Management Agreement and the Investment Advisory Agreements are referred to herein individually as an “Agreement” and collectively as the “Agreements.” In preparation for its consideration of the renewal of the Agreements, the Board undertook steps to gather and consider information furnished by the Manager, the subadvisors, Broadridge, Inc. (“Broadridge”) and Morningstar, Inc. (“Morningstar”). The Board, with the assistance of independent legal counsel, requested and received certain relevant information from the Manager and each subadvisor.
In advance of the Meetings, the Board’s Investment Committee and/or the Manager coordinated the production of information from Broadridge and Morningstar regarding the performance, fees and expenses of the Funds as well as information from the Manager and the subadvisors. At the Meetings, the Board considered the information provided in connection with the renewal process, as well as information furnished to the Board throughout the year at regular meetings of the Board and its committees. In connection with the Board’s consideration of the Agreements, the Board received and evaluated such information as they deemed necessary. This information is described below in the section summarizing the factors the Board considered in connection with its renewal and approval of the Agreements, as well as the section describing additional Board considerations with respect to each Fund.
The Board noted that the Manager provides management and administrative services to the Funds pursuant to the Management Agreement. The Board considered that many mutual funds have separate contracts governing each type of service and observed that, with respect to such mutual funds, the actual management fee rates provided by Broadridge for peer group funds reflect the combined advisory and administrative expenses, reduced by any fee waivers and/or reimbursements.
A firm may not have been able to, or opted not to, provide information in response to certain information requests, in which case the Board conducted its evaluation of the firm based on information that was provided. In such cases, the Board determined that the omission of any such information was not material to its considerations. For each Fund, the class of shares used for comparative performance purposes was the share class with the lowest expenses available for purchase by the general public, which was the R5 Class. The Board also considered that the use of R5 Class performance generally facilitates a meaningful comparison for expense and performance purposes.
Provided below is an overview of certain factors the Board considered in connection with its decision to approve the renewal of the Agreements. The Board did not identify any particular information that was most relevant to its consideration of whether to approve the renewal of each Agreement, and each Trustee may have afforded different weight to the various factors. Legal counsel to the independent Trustees provided the Board
72
Disclosures Regarding the Approval of the Management and Investment Advisory Agreements
August 31, 2020 (Unaudited)
with a memorandum regarding its responsibilities pertaining to the renewal of investment advisory contracts, such as the Agreements, and related regulatory guidelines. Based on its evaluation, the Board unanimously concluded that the terms of each Agreement were reasonable and fair and that the approval of the renewal of each Agreement was in the best interests of the Funds and their shareholders.
Considerations With Respect to the Renewal of the Management Agreement and the Investment Advisory Agreements
In determining whether to approve the renewal of the Agreements, the Board considered each Fund’s investment management and subadvisory relationships separately. In each instance, the Board considered, among other things, the following factors: (1) the nature, extent and quality of the services provided; (2) the investment performance of the Funds and the subadvisors for the Funds; (3) the costs incurred by the Manager in rendering services to the Funds and its resulting profits or losses; (4) comparisons of services and fee rates with contracts entered into by the Manager or a subadvisor or their affiliates with other clients (such as pension funds and other institutional clients); (5) the extent to which economies of scale, if any, have been taken into account in setting each fee rate schedule; (6) whether fee rate levels reflect economies of scale, if any, for the benefit of Fund investors; and (7) any other benefits derived or anticipated to be derived by the Manager or a subadvisor from its relationship with the Funds.
Nature, Extent and Quality of Services. With respect to the renewal of the Management Agreement, the Board considered, among other factors: each Fund’s long-term performance; the length of service of key investment personnel at the Manager; the cost structure of the Funds; the Manager’s culture of compliance and support that reduce risks to the Funds; the Manager’s quality of services; the Manager’s active role in monitoring and, as appropriate, recommending additional or replacement subadvisors; and the Manager’s efforts to retain key employees and maintain staffing levels.
With respect to the renewal of each Investment Advisory Agreement, the Board considered, among other factors: the level of staffing and the size of the subadvisor; the adequacy of the resources committed to the Funds by each subadvisor; the financial stability of each subadvisor; and each subadvisor’s representations regarding its compliance program. Based on the foregoing information, the Board concluded that the nature, extent and quality of the management and advisory services provided by the Manager and each subadvisor were appropriate for each Fund.
Investment Performance. The Board evaluated the comparative information provided by Broadridge and the Manager regarding the performance of each Fund relative to its Broadridge performance universe, Morningstar Category, and benchmark index, as well as the Fund’s Morningstar rating. The Board considered the information provided by Broadridge regarding its independent methodology for selecting each Fund’s Broadridge performance universe. The Board also considered that the performance universes selected by Broadridge may not provide appropriate comparisons for a Fund. In addition, the Board considered the performance reports and discussions with management at Board and Committee meetings throughout the year. The Board also evaluated the comparative information provided by each subadvisor regarding the performance of the relevant Fund relative to the performance of other comparable investment accounts managed by the subadvisor and the Fund’s benchmark index. In addition, the Board considered the Manager’s recommendation to continue to retain each subadvisor. A summary of the Board’s considerations with respect to each Fund’s performance appears below under “Additional Considerations and Conclusions with Respect to Each Fund.”
Costs of the Services Provided to the Funds and the Profits Realized by the Manager from its Relationship with the Funds. In analyzing the cost of services and profitability of the Manager, the Board considered the revenues earned and the expenses incurred by the Manager, before and after the payment of distribution-related expenses by the Manager. The profits or losses were noted at both an aggregate level for all funds within the group of mutual funds sponsored by the Manager (the “Fund Complex”) and at an individual Fund level, with the Manager earning a profit before and after the payment of distribution-related expenses by the Manager for each Fund. The
73
Disclosures Regarding the Approval of the Management and Investment Advisory Agreements
August 31, 2020 (Unaudited)
Board also considered comparative information provided by the Manager regarding the Manager’s overall profitability with respect to the Fund Complex relative to the overall profitability of other firms in the mutual fund industry, as disclosed in publicly available sources. Although the Board noted that, in certain cases, the fee rates paid by other clients of the Manager are lower than the fee rates paid by the Funds, the Manager represented that, among other matters, the difference is attributable to the fact that the Manager does not perform administrative services for non-investment company clients and reflects the greater level of responsibility and regulatory requirements associated with managing the Funds.
The Board also noted that the Manager proposed to continue the expense waivers and reimbursements for each Fund that were in place during the last fiscal year. The Board further considered that, with respect to each Fund, the Management Agreement provides for the Manager to receive a management fee comprised of an annualized fee that is retained by the Manager. The Board also noted that certain share classes of the Funds maintain higher expense ratios in order to compensate third-party financial intermediaries.
In analyzing the fee rates charged by each subadvisor in connection with its investment advisory services to a Fund, the Board considered representations made by each subadvisor that each Fund’s subadvisory fee rate schedule generally was favorable compared to other comparable client accounts. The Board did not request profitability data from the subadvisors because the Board did not view this data as imperative to its deliberations given the arm’s-length nature of the relationship between the Manager and the subadvisors with respect to the negotiation of subadvisory fee rates. In addition, the Board noted that subadvisors may not account for their profits on an account-by-account basis and that different firms likely employ different methodologies in connection with these calculations.
Based on the foregoing information, the Board concluded that the profitability levels of the Manager were reasonable in light of the services performed by the Manager. A discussion regarding the Board’s considerations with respect to each Fund’s fee rates is set forth below under “Additional Considerations and Conclusions with Respect to Each Fund.”
Economies of Scale. In considering the reasonableness of the management and investment advisory fees rates, the Board considered whether economies of scale will be realized as each Fund grows and whether fee rate levels reflect these economies of scale for the benefit of Fund shareholders. In this regard, the Board considered that the Manager has negotiated breakpoints in the subadvisory fee schedule for the SiM Fund and, with respect to the Sound Point Fund, Sound Point has represented that the Sound Point Fund’s subadvisory fee rate reflects economies of scale for the benefit of the Sound Point Fund’s shareholders.
In addition, the Board noted the Manager’s representation that the Management Agreement contains fee schedule breakpoints at higher asset levels with respect to each Fund. In this regard the Board considered the Manager’s representation that neither Fund’s current assets exceeded the threshold necessary to reach the first management fee breakpoint. Based on the foregoing information, the Board concluded that the Manager and subadvisor fee rate schedules for each Fund provide for a reasonable sharing of benefits from any economies of scale with each Fund.
Benefits Derived from the Relationship with the Funds. The Board considered the “fall-out” or ancillary benefits that accrue to the Manager and/or the subadvisors as a result of the advisory relationships with the Funds, including greater exposure in the marketplace with respect to the Manager’s or the subadvisors’ investment process and expanding the level of assets under management by the Manager and the subadvisors. The Board also considered that the Manager may invest the Funds’ cash balances and cash collateral provided by the borrowers of the Funds’ securities in the American Beacon U.S. Government Money Market Select Fund, which the Manager manages directly. Based on the foregoing information, the Board concluded that the potential benefits accruing to the Manager and the subadvisors by virtue of their relationships with the Funds appear to be fair and reasonable.
74
Disclosures Regarding the Approval of the Management and Investment Advisory Agreements
August 31, 2020 (Unaudited)
Additional Considerations and Conclusions with Respect to Each Fund
The performance comparisons below were made for each Fund’s R5 Class shares in comparison to each Fund’s Broadridge performance universe and Morningstar Category. With respect to the Broadridge performance universe, the 1st Quintile represents the top 20 percent of the universe based on performance and the 5th Quintile represents the bottom 20 percent of the universe based on performance. References below to each Fund’s Broadridge performance universe are to the universe of mutual funds with a comparable investment classification/objective included in the analysis provided by Broadridge. In reviewing the performance, the Board viewed longer-term performance over a full market cycle, typically five years or longer, as the most important consideration, because relative performance over shorter periods may be significantly impacted by market or economic events and not necessarily reflective of manager skill.
The expense comparisons below were made for each Fund’s R5 Class shares in comparison to each Fund’s Broadridge expense universe and Broadridge expense group, with the 1st Quintile representing the lowest 20 percent of the universe or group based on lowest total expense and the 5th Quintile representing the highest 20 percent of the universe or group based on highest total expense. References below to each Fund’s expense group and expense universe are to the respective group or universe of comparable mutual funds included in the analysis by Broadridge. A Broadridge expense group consists of the Fund and a representative sample of funds with similar operating structures and asset sizes, as selected by Broadridge. A Broadridge expense universe includes all funds with a comparable investment classification/objective and a similar operating structure as the share class of the Fund included in the Broadridge comparative information, including the expense group, and provides a broader view of expenses across the Fund’s investment classification/objective. The Board also considered each Fund’s Morningstar fee level category with the 1st Quintile representing the lowest 20 percent of the category constituents and the 5th Quintile representing the highest 20 percent of the category in terms of total expense. In reviewing expenses, the Board considered the positive impact of fee waivers where applicable and the Manager’s agreement to continue the fee waivers. In addition, information regarding the subadvisors’ use of soft dollars was requested from the Manager and was considered by the Board.
Additional Considerations and Conclusions with Respect to the American Beacon Sound Point Floating Rate Income Fund
In considering the renewal of the Agreements for the Sound Point Fund, the Board considered the following additional factors:
Broadridge Total Expenses Excluding 12b-1 Fees and Morningstar Fee Level Ranking
Compared to Broadridge Expense Group | 5 | th Quintile | ||
Compared to Broadridge Expense Universe | 5 | th Quintile | ||
Morningstar Fee Level Ranking | 5 | th Quintile |
Broadridge and Morningstar Performance Analysis (five-year period ended December 31, 2019)
Compared to Broadridge Performance Universe | 1 | st Quintile | ||
Compared to Morningstar Category | 1 | st Quintile |
The Board also considered: (1) the Sound Point Fund’s expenses are higher than the median of its Broadridge expense group and expense universe, but that the Sound Point Fund, on a net-of-fee basis, ranked in the first quintile of its Broadridge performance universe and Morningstar category for the 5-year period ended December 31, 2019; (2) the higher expenses associated with the subadvisor’s analysis of the small- and mid-capitalization issuers in which the fund invests, which may have less information publicly available; (3) information provided by the subadvisor regarding fee rates charged for managing assets in the same or a similar strategy as the subadvisor manages the Fund; and (4) the Manager’s recommendation to continue to retain the subadvisor.
75
Disclosures Regarding the Approval of the Management and Investment Advisory Agreements
August 31, 2020 (Unaudited)
Based on these and other considerations, the Board: (1) concluded that the fees paid to the Manager and Sound Point under the Management and Investment Advisory Agreements are fair and reasonable; and (2) determined that the Sound Point Fund and its shareholders would benefit from the Manager’s and Sound Point’s continued management of the Sound Point Fund.
Additional Considerations and Conclusions with Respect to the American Beacon SiM High Yield Opportunities Fund
In considering the renewal of the Agreements for the SiM Fund, the Board considered the following additional factors:
Broadridge Total Expenses Excluding 12b-1 Fees and Morningstar Fee Level Ranking
Compared to Broadridge Expense Group | 5 | th Quintile | ||
Compared to Broadridge Expense Universe | 5 | th Quintile | ||
Morningstar Fee Level Ranking – Institutional Class | 4 | th Quintile |
Broadridge and Morningstar Performance Analysis (five-year period ended December 31, 2019)
Compared to Broadridge Performance Universe | 1 | st Quintile | ||
Compared to Morningstar Category | 1 | st Quintile |
The Board also considered: (1) that the SiM Fund’s expenses are higher than the median of its Broadridge expense group and expense universe, but that the SiM Fund, on a net-of-fee basis, ranked in the first quintile of its Broadridge performance universe and Morningstar category for the 5-year period ended December 31, 2019; (2) that the SiM Fund employs a limited-capacity strategy, as the subadvisor invests significantly in the below investment grade debt securities of small capitalization issuers; (3) information provided by SiM regarding fee rates charged for managing assets in the same or a similar strategy as the subadvisor manages the Fund; and (4) the Manager’s recommendation to continue to retain the subadvisor.
Based on these and other considerations, the Board: (1) concluded that the fees paid to the Manager and SiM under the Management and Investment Advisory Agreements are fair and reasonable; and (2) determined that the SiM Fund and its shareholders would benefit from the Manager’s and SiM’s continued management of the SiM Fund.
76
Disclosure Regarding Liquidity Risk Management Program (Unaudited)
Rule 22e-4 under the Investment Company Act of 1940, as amended (“Rule 22e-4”), requires open-end registered investment companies (other than money market funds) to adopt and implement a written liquidity risk management program that is reasonably designed to assess and manage liquidity risk. Each Fund has adopted a Liquidity Risk Management Program (the “Program”) that is designed to assess and manage liquidity risk, which is the risk that the Fund could not meet requests to redeem its shares without significant dilution of the remaining shareholders’ interests in the Fund. The Program was effective on December 1, 2018 and was approved by each Fund’s Board of Trustees (the “Board”) on March 6, 2019, in accordance with applicable Securities and Exchange Commission (“SEC”) guidance.
Pursuant to Rule 22e-4, the Program includes the following elements:
| • | Assessment, management, and periodic review of liquidity risk; |
| • | Classification of each of the Fund’s portfolio investments into one of four liquidity categories: highly liquid, moderately liquid, less liquid, and illiquid; |
| • | Determination and review of a highly liquid investment minimum for any Fund that does not primarily hold assets that are highly liquid investments; |
| ○ | Policies and procedures to respond to a shortfall in the highly liquid investment minimum, including associated reports to the Board and the SEC; |
| • | A prohibition against a Fund acquiring an illiquid investment if immediately after the acquisition the Fund would have more than 15% of its net assets invested in illiquid investments that are assets; |
| ○ | Reporting of breaches of the illiquid investment prohibition to the Board and the SEC; and |
| • | Policies and procedures regarding how and when a Fund will satisfy redemption requests by distributing portfolio securities or other assets. |
The Board has approved the designation of the Manager’s Liquidity Committee as the Program administrator with responsibility for administering the Program. Since the implementation of the Program, the Liquidity Committee has provided written reports to the Board on a quarterly basis regarding each Fund’s liquidity risk. In addition, at the Board’s March 3-4, 2020 meetings, the Board reviewed the Liquidity Committee’s written report (“Report”) that addressed the operation of the Program and assessed the adequacy and effectiveness of its implementation from the Program’s inception on December 1, 2018 through December 31, 2019 (the “review period”).
Key conclusions that the Liquidity Committee included in the Report are listed below:
| • | The Program is reasonably designed to assess and manage each Fund’s liquidity risk. |
| • | The operation of the Program was adequate during the review period. |
| • | The SiM High Yield Opportunities Fund was deemed to primarily hold assets that are highly liquid, and no highly liquid investment minimum was recommended. |
| • | The Sound Point Floating Rate Income Fund had a highly liquid investment minimum during the review period. The Liquidity Committee determined to maintain the highly liquid investment minimum. |
| • | The Program was effectively implemented by the Liquidity Committee during the review period. |
| • | Administration of the Program by the Liquidity Committee continues to be appropriate. |
77
Trustees and Officers of the American Beacon FundsSM (Unaudited)
The Trustees and officers of the American Beacon Funds (the “Trust”) are listed below, together with their principal occupations during the past five years. The address of each person listed below is 220 Las Colinas Boulevard East, Suite 1200, Irving, Texas 75039. Each Trustee oversees thirty-one funds in the fund complex that includes the Trust, the American Beacon Select Funds, the American Beacon Institutional Funds Trust, the American Beacon Sound Point Enhanced Income Fund, and the American Beacon Apollo Total Return Fund. The Trust’s Statement of Additional Information contains additional information about the Trustees and is available without charge by calling 1-800-658-5811.
Name, Age | Position, Term of Office and Length of Time Served with the Trust | Principal Occupation(s) During Past 5 Years and Current Directorships | ||
| NON-INTERESTED TRUSTEES | Term | |||
Lifetime of Trust until removal, resignation or retirement* | ||||
| Gilbert G. Alvarado (50) | Trustee since 2015 | President, SJVIIF, LLC, Impact Investment Fund (2018-Present); Director, Kura MD, Inc. (local telehealth organization) (2015-2017); Senior Vice President & CFO, Sierra Health Foundation (health conversion private foundation) (2006-Present); Senior Vice President & CFO, Sierra Health Foundation: Center for Health Program Management (California public benefit corporation) (2012-Present); Director, Innovative North State (2012-2015); Director, Sacramento Regional Technology Alliance (2011-2016); Director, Valley Healthcare Staffing (2017-2018); Trustee, American Beacon Select Funds (2015-Present); Trustee, American Beacon Institutional Funds Trust (2017-Present); Trustee, American Beacon Sound Point Enhanced Income Fund (2018-Present); Trustee, American Beacon Apollo Total Return Fund (2018-Present). | ||
| Joseph B. Armes (58) | Trustee since 2015 | Director, Switchback Energy Acquisition (2019-Present); Chairman & CEO, CSW Industrials f/k/a Capital Southwest Corporation (investment company) (2015-Present); Chairman of the Board of Capital Southwest Corporation, predecessor to CSW Industrials, Inc. (2014-2017) (investment company); CEO, Capital Southwest Corporation (2013-2015); President & CEO, JBA Investment Partners (family investment vehicle) (2010-Present); Director and Chair of Audit Committee, RSP Permian (oil and gas producer) (2013-2018); Trustee, American Beacon Select Funds (2015-Present); Trustee, American Beacon Institutional Funds Trust (2017-Present); Trustee, American Beacon Sound Point Enhanced Income Fund (2018-Present); Trustee, American Beacon Apollo Total Return Fund (2018-Present). | ||
| Gerard J. Arpey (62) | Trustee since 2012 | Director, The Home Depot, Inc. (2015-Present); Partner, Emerald Creek Group (private equity firm) (2011-Present); Director, S.C. Johnson & Son, Inc. (privately held company) (2008-present); Trustee, American Beacon Select Funds (2012-Present); Trustee, American Beacon Institutional Funds Trust (2017-Present); Trustee, American Beacon Sound Point Enhanced Income Fund (2018-Present); Trustee, American Beacon Apollo Total Return Fund (2018-Present). | ||
| Brenda A. Cline (59) | Trustee since 2004 Chair since 2019 Vice Chair 2018 | Chief Financial Officer, Treasurer and Secretary, Kimbell Art Foundation (1993-Present); Director, Tyler Technologies, Inc. (public sector software solutions company) (2014-Present); Director, Range Resources Corporation (oil and natural gas company) (2015-Present); Trustee, Cushing Closed-End and Open-End Funds (2017-Present); Trustee, American Beacon Select Funds (2004-Present); ; Trustee, American Beacon Institutional Funds Trust (2017-Present); Trustee, American Beacon Sound Point Enhanced Income Fund (2018-Present); Trustee, American Beacon Apollo Total Return Fund (2018-Present). | ||
78
Trustees and Officers of the American Beacon FundsSM (Unaudited)
Name, Age | Position, Term of Office and Length of Time Served with the Trust | Principal Occupation(s) During Past 5 Years and Current Directorships | ||
| NON-INTERESTED TRUSTEES (CONT.) | Term | |||
Lifetime of Trust until removal, resignation or retirement* | ||||
| Eugene J. Duffy (66) | Trustee since 2008 | Managing Director, Global Investment Management Distribution, Mesirow Financial (2016-Present); Managing Director, Institutional Services, Intercontinental Real Estate Corporation (2014-Present); Trustee, American Beacon Select Funds (2008-Present); Trustee, American Beacon Institutional Funds Trust (2017-Present); Trustee, American Beacon Sound Point Enhanced Income Fund (2018-Present); Trustee, American Beacon Apollo Total Return Fund (2018-Present). | ||
| Claudia A. Holz (62) | Trustee since 2018 | Partner, KPMG LLP (1990-2017); Trustee, American Beacon Select Funds (2018-Present); Trustee, American Beacon Institutional Funds Trust (2018-Present); Trustee, American Beacon Sound Point Enhanced Income Fund (2018-Present); Trustee, American Beacon Apollo Total Return Fund (2018-Present). | ||
| Douglas A. Lindgren (58) | Trustee since 2018 | CEO North America, Carne Global Financial Services (2016-2017); Consultant, Carne Financial Services (2017-2019); Managing Director, IPS Investment Management and Global Head, Content Management, UBS Wealth Management (2010-2016); Trustee, American Beacon Select Funds (2018-Present); Trustee, American Beacon Institutional Funds Trust (2018-Present); Trustee, American Beacon Sound Point Enhanced Income Fund (2018-Present); Trustee, American Beacon Apollo Total Return Fund (2018-Present). | ||
| Barbara J. McKenna, CFA (57) | Trustee since 2012 | President/Managing Principal, Longfellow Investment Management Company (2005-Present); Trustee, American Beacon Select Funds (2012-Present); Trustee, American Beacon Institutional Funds Trust (2017-Present); Trustee, American Beacon Sound Point Enhanced Income Fund (2018-Present); Trustee, American Beacon Apollo Total Return Fund (2018-Present). | ||
| R. Gerald Turner (74) | Trustee since 2001 | President, Southern Methodist University (1995-Present); Director, J.C. Penney Company, Inc. (1996-2019); Director, Kronus Worldwide Inc. (chemical manufacturing) (2003-Present); Trustee, American Beacon Select Funds (2001-Present); Trustee, American Beacon Institutional Funds Trust (2017-Present); Trustee, American Beacon Sound Point Enhanced Income Fund (2018-Present); Trustee, American Beacon Apollo Total Return Fund (2018-Present). | ||
79
Trustees and Officers of the American Beacon FundsSM (Unaudited)
Name, Age | Position, Term of Office and Length of Time Served with the Trust | Principal Occupation(s) During Past 5 Years and Current Directorships | ||
| OFFICERS | Term | |||
| One Year | ||||
| Gene L. Needles, Jr. (65) | President since 2009 | President (2009-2018), CEO and Director (2009-Present), and Chairman (2018-Present), American Beacon Advisors, Inc., President (2015-2018), Director and CEO (2015-Present), and Chairman (2018-Present), Resolute Investment Holdings, LLC; President (2015-2018), Director and CEO (2015-Present), and Chairman (2018-Present), Resolute Topco, Inc.; President (2015-2018); Director, and CEO (2015-Present), and Chairman (2018-Present), Resolute Acquisition, Inc.; President (2015-2018), Director and CEO (2015-Present), Chairman (2018-Present), Resolute Investment Managers, Inc.; Director, Chairman, President and CEO, Resolute Investment Distributors (2017-Present); Director, Chairman, President and CEO; Resolute Investment Services, Inc. (2017-Present); President and CEO, Lighthouse Holdings Parent, Inc. (2009-2015); President, CEO and Director, Lighthouse Holdings, Inc. (2009-2015); Manager, President and CEO, American Private Equity Management, LLC (2012-Present); Director, Chairman, President and CEO, Alpha Quant Advisors, LLC (2016-2020); Director, ARK Investment Management LLC (2016-Present); Director, Shapiro Capital Management LLC (2017-Present); Director, Chairman and CEO, Continuous Capital, LLC (2018-Present); Director, Green Harvest Asset Management (2019-Present); Director, National Investment Services of America, LLC (2019 - Present); President, American Beacon Cayman Managed Futures Strategy Fund, Ltd. (2014-Present); Director and President, American Beacon Cayman Transformational Innovation Company, LTD., (2017-2018); President, American Beacon Delaware Transformational Innovation Corporation (2017-2018); President American Beacon Cayman TargetRisk Company, Ltd. (2018-Present); Member, Investment Advisory Committee, Employees Retirement System of Texas (2017-Present); Trustee, American Beacon NextShares Trust (2015-Present); President, American Beacon Select Funds (2009-Present); President, American Beacon Institutional Funds Trust (2017-Present); President, American Beacon Sound Point Enhanced Income Fund (2018-Present); President, American Beacon Apollo Total Return Fund (2018-Present); Director, RSW Investments Holdings LLC, (2019-Present); Manager, SSI Investment Management, LLC (2019-Present). | ||
| Rosemary K. Behan (61) | VP, Secretary and Chief Legal Officer since 2006 | Vice President, Secretary and General Counsel, American Beacon Advisors, Inc. (2006-Present); Secretary, Resolute Investment Holdings, LLC (2015-Present); Secretary, Resolute Topco, Inc. (2015-Present); Secretary, Resolute Acquisition, Inc. (2015-Present); Vice President, Secretary and General Counsel, Resolute Investment Managers, Inc. (2015-Present); Secretary, Resolute Investment Distributors, Inc. (2017-Present); Vice President, Secretary and General Counsel, Resolute Investment Services, Inc. (2017-Present); Vice President and Secretary, Lighthouse Holdings Parent, Inc. (2008-2015); Vice President and Secretary, Lighthouse Holdings, Inc. (2008-2015); Secretary, American Private Equity Management, LLC (2008-Present); Secretary and General Counsel, Alpha Quant Advisors, LLC (2016-2020); Vice President and Secretary, Continuous Capital, LLC (2018-Present); Secretary, Green Harvest Asset Management (2019-Present); Secretary, American Beacon Delaware Transformational Innovation Corporation (2017-2018); Secretary, American Beacon Cayman Transformational Innovation Company, Ltd. (2017-2018); Secretary, American Beacon Cayman Managed Futures Strategy Fund, Ltd. (2014-Present); Secretary, American Beacon Cayman TargetRisk Company, Ltd (2018-Present); Chief Legal Officer, Vice President and Secretary, American Beacon Select Funds (2006-Present); Chief Legal Officer, Vice President and Secretary, American Beacon Institutional Funds Trust (2017-Present); Chief Legal Officer, Vice President and Secretary, American Beacon Sound Point Enhanced Income Fund (2018-Present); Chief Legal Officer, Vice President and Secretary American Beacon Apollo Total Return Fund (2018-Present). | ||
80
Trustees and Officers of the American Beacon FundsSM (Unaudited)
Name, Age | Position, Term of Office and Length of Time Served with the Trust | Principal Occupation(s) During Past 5 Years and Current Directorships | ||
| OFFICERS (CONT.) | Term | |||
| One Year | ||||
| Brian E. Brett (60) | VP since 2004 | Senior Vice President, Head of Distribution (2012-Present), Vice President, Director of Sales (2004-2012), American Beacon Advisors, Inc.; Senior Vice President, Resolute Investment Managers, Inc. (2017-Present); Senior Vice President, Resolute Investment Distributors, Inc. (2018-Present), Senior Vice President, Resolute Investment Services, Inc. (2018-Present); Senior Vice President, Lighthouse Holdings Parent, Inc. (2008-2015); Senior Vice President, Lighthouse Holdings, Inc. (2008-2015); Vice President, American Beacon Select Funds (2004-Present); Vice President, American Beacon Institutional Funds Trust (2017-Present); Vice President American Beacon Sound Point Enhanced Income Fund (2018-Present); Vice President American Beacon Apollo Total Return Fund (2018-Present). | ||
| Paul B. Cavazos (51) | VP since 2016 | Chief Investment Officer and Senior Vice President, American Beacon Advisors, Inc. (2016-Present); Chief Investment Officer, DTE Energy (2007-2016); Vice President, American Private Equity Management, L.L.C. (2017-Present); Vice President, American Beacon Select Funds (2016-Present); Vice President, American Beacon Institutional Funds Trust (2017-Present); Vice President American Beacon Sound Point Enhanced Income Fund (2018-Present); Vice President American Beacon Apollo Total Return Fund (2018-Present). | ||
| Erica Duncan (49) | VP Since 2011 | Vice President, American Beacon Advisors, Inc. (2011-Present); Vice President, Resolute Investment Managers (2018-Present); Vice President, Resolute Investment Services, Inc. (2018-Present); Vice President, American Beacon Select Funds (2011-Present); Vice President, American Beacon Institutional Funds Trust (2017-Present); Vice President American Beacon Sound Point Enhanced Income Fund (2018-Present); Vice President American Beacon Apollo Total Return Fund (2018-Present). | ||
| Melinda G. Heika (59) | Principal Accounting Officer since 2017 and Treasurer since 2010 | Treasurer and CFO (2010-Present), American Beacon Advisors, Inc.; Treasurer, Resolute Topco, Inc. (2015-Present); Treasurer, Resolute Investment Holdings, LLC. (2015-Present); Treasurer, Resolute Acquisition, Inc. (2015-Present); Treasurer and CFO, Resolute Investment Managers, Inc. (2017-Present); Treasurer, Resolute Investment Distributors, Inc. (2017-2017); Treasurer and CFO, Resolute Investment Services, Inc. (2015-Present); Treasurer, Lighthouse Holdings Parent Inc., (2010-2015); Treasurer, Lighthouse Holdings, Inc. (2010-2015); Treasurer, American Private Equity Management, LLC (2012-Present); Treasurer and CFO, Alpha Quant Advisors, LLC (2016-2020); Treasurer and CFO, Continuous Capital, LLC (2018-Present); Treasurer, Green Harvest Asset Management (2019-Present); Treasurer, American Beacon Cayman Transformational Innovation, Ltd. (2017-2018); Treasurer, American Beacon Delaware Transformational Innovation Corporation (2017-2018); Director and Treasurer, American Beacon Cayman Managed Futures Strategy Fund, Ltd. (2014-Present); Treasurer, American Beacon Cayman TargetRisk Company, Ltd. (2018-Present); Principal Accounting Officer (2017-Present) and Treasurer, American Beacon Select Funds (2010-Present); Principal Accounting Officer and Treasurer, American Beacon Institutional Funds Trust (2017-Present); Principal Accounting Officer and Treasurer, American Beacon Sound Point Enhanced Income Fund (2018-Present); Principal Accounting Officer and Treasurer, American Beacon Apollo Total Return Fund (2018-Present). | ||
81
Trustees and Officers of the American Beacon FundsSM (Unaudited)
Name, Age | Position, Term of Office and Length of Time Served with the Trust | Principal Occupation(s) During Past 5 Years and Current Directorships | ||
| OFFICERS (CONT.) | Term | |||
| One Year | ||||
| Terri L. McKinney (56) | VP since 2010 | Vice President (2009-Present), Managing Director (2003-2009), American Beacon Advisors, Inc.; Vice President, Resolute Investment Managers, Inc. (2017-Present); Vice President, Resolute Investment Services, Inc (2018-Present); Vice President, Alpha Quant Advisors, LLC (2016-Present); Vice President, Continuous Capital, LLC (2018-Present); Vice President, American Beacon Select Funds (2010-Present); Vice President, American Beacon Institutional Funds Trust (2017-Present); Vice President, American Beacon Sound Point Enhanced Income Fund (2018-Present); Vice President, American Beacon Apollo Total Return Fund (2018-Present). | ||
| Jeffrey K. Ringdahl (45) | VP since 2010 | Director (2015-Present), President (2018-Present), Chief Operating Officer (2010-Present), Senior Vice President (2013-2018), Vice President (2010-2013), American Beacon Advisors, Inc.; Director (2015-Present), President (2018-Present), Senior Vice Present (2015-2018), Resolute Investment Holdings, LLC; Director (2015-Present), President (2018-Present), Senior Vice President (2015-2018), Resolute Topco, Inc.; Director (2015-Present), President (2018-Present), Senior Vice President (2015-2018), Resolute Acquisition, Inc.; Director (2015-Present), President & COO (2018-Present), Senior Vice President (2015-2018), Resolute Investment Managers, Inc.; Director and Executive Vice President (2017-Present), Resolute Investment Distributors, Inc.; Director (2017-Present), President & COO (2018-Present), Executive Vice President (2017-2018), Resolute Investment Services, Inc.; Senior Vice President (2017-Present), Vice President (2012-2017), Manager (2015-Present), American Private Equity Management, LLC; Senior Vice President, Lighthouse Holdings Parent, Inc. (2013-2015); Senior Vice President, Lighthouse Holdings, Inc. (2013-2015); Trustee, American Beacon NextShares Trust (2015-Present); Director, Executive Vice President & COO, Alpha Quant Advisors, LLC (2016-2020); Director, Shapiro Capital Management, LLC (2017-Present); Director, Executive Vice President & COO, Continuous Capital, LLC (2018-Present); Director, RSW Investments Holdings LLC, (2019-Present); Manager, SSI Investment Management, LLC (2019-Present); Director, National Investment Services of America, LLC (2019-Present); Director and Vice President, American Beacon Cayman Transformational Innovation Company, Ltd., (2017-Present); Vice President, American Beacon Delaware Transformational Innovation Corporation (2017-2018); Director and Vice President, American Beacon Cayman Managed Futures Strategy Fund, Ltd. (2014-Present); Vice President, American Beacon Cayman TargetRisk Company, Ltd (2018-Present); Vice President, American Beacon Select Funds (2010-2018); Vice President, American Beacon Institutional Funds Trust (2017-Present); Vice President, American Beacon Sound Point Enhanced Income Fund (2018-Present); Vice President, American Beacon Apollo Total Return Fund (2018-Present). | ||
| Samuel J. Silver (57) | VP Since 2011 | Vice President (2011-Present), Chief Fixed Income Officer (2016-Present), American Beacon Advisors, Inc. (2011-Present); Vice President, American Beacon Select Funds (2011-Present); Vice President, American Beacon Institutional Funds Trust (2017-Present); Vice President, American Beacon Sound Point Enhanced Income Fund (2018-Present); Vice President, American Beacon Apollo Total Return Fund (2018-Present). | ||
82
Trustees and Officers of the American Beacon FundsSM (Unaudited)
Name, Age | Position, Term of Office and Length of Time Served with the Trust | Principal Occupation(s) During Past 5 Years and Current Directorships | ||
| OFFICERS (CONT.) | Term | |||
| One Year | ||||
| Christina E. Sears (48) | Chief Compliance Officer since 2004 and Asst. Secretary since 1999 | Vice President, American Beacon Advisors, Inc. (2019-Present); Chief Compliance Officer, American Beacon Advisors, Inc. (2004-Present); Vice President, Resolute Investment Managers, Inc. (2017-Present); Vice President, Resolute Investment Distributors (2017-Present); Vice President, Resolute Investment Services, Inc. (2019-Present); Chief Compliance Officer, American Private Equity Management, LLC (2012-Present); Chief Compliance Officer (2016-2019) and Vice President, Alpha Quant Advisors, LLC (2016-2020); Vice President, Continuous Capital, LLC (2018-Present); Chief Compliance Officer (2004-Present) and Assistant Secretary (1999-Present), American Beacon Select Funds; Chief Compliance Officer and Assistant Secretary, American Beacon Institutional Funds Trust (2017-Present); Chief Compliance Officer and Assistant Secretary, American Beacon Sound Point Enhanced Income Fund (2018-Present); Chief Compliance Officer and Assistant Secretary, American Beacon Apollo Total Return Fund (2018-Present). | ||
| Sonia L. Bates (63) | Asst. Treasurer since 2011 | Assistant Treasurer, American Beacon Advisors, Inc. (2011-2018); Assistant Treasurer, Lighthouse Holdings Parent Inc. (2011-2015); Assistant Treasurer, Lighthouse Holdings, Inc. (2011-2015); Assistant Treasurer, American Private Equity Management, LLC (2012-Present); Assistant Treasurer, American Beacon Cayman Transformational Innovation Company, Ltd. (2017-Present); Assistant Treasurer, American Beacon Cayman TargetRisk Company, Ltd. (2018-Present); Assistant Treasurer, American Beacon Select Funds (2011-Present); Assistant Treasurer, American Beacon Institutional Funds Trust (2017-Present); Assistant Treasurer, American Beacon Sound Point Enhanced Income Fund (2018-Present); Assistant Treasurer, American Beacon Apollo Total Return Fund (2018-Present). | ||
| Shelley D. Abrahams (45) | Assistant Secretary since 2008 | Assistant Secretary, American Beacon Select Funds (2008-Present); Assistant Secretary, American Beacon Institutional Funds Trust (2017-Present); Assistant Secretary, American Beacon Sound Point Enhanced Income Fund (2018-Present); Assistant Secretary, American Beacon Apollo Total Return Fund (2018-Present); | ||
| Rebecca L. Harris (53) | Assistant Secretary since 2010 | Vice President, American Beacon Advisors, Inc. (2011-Present); Vice President, Resolute Investment Managers, Inc. (2017-Present); Vice President, Resolute Investment Services (2015-Present); Vice President, Alpha Quant Advisors, LLC (2016-2020); Vice President, Continuous Capital, LLC (2018-Present); Assistant Secretary, American Beacon Select Funds (2010-Present); Assistant Secretary, American Beacon Institutional Funds Trust (2017-Present); Assistant Secretary, American Beacon Sound Point Enhanced Income Fund (2018-Present); Assistant Secretary, American Beacon Apollo Total Return Fund (2018-Present). | ||
| Teresa A. Oxford (62) | Assistant Secretary since 2015 | Assistant Secretary, American Beacon Advisors, Inc. (2015-Present); Assistant Secretary, Resolute Investment Distributors (2018-Present); Assistant Secretary, Resolute Investment Services (2018-Present); Assistant Secretary, Alpha Quant Advisors, LLC (2016-2020); Assistant Secretary, American Beacon Select Funds (2015-Present); Assistant Secretary, American Beacon Institutional Funds Trust (2017-Present); Assistant Secretary, American Beacon Sound Point Enhanced Income Fund (2018-Present); Assistant Secretary, American Beacon Apollo Total Return Fund (2018-Present);. | ||
* As of 11/12/2014, the Board adopted a retirement plan that requires Trustees to retire no later than the last day of the calendar year in which they reach the age of 75.
83
American Beacon FundsSM
August 31, 2020 (Unaudited)
The American Beacon Funds recognize and respect the privacy of our shareholders. We are providing this notice to you so you will understand how shareholder information may be collected and used.
We may collect nonpublic personal information about you from one or more of the following sources:
| • | information we receive from you on applications or other forms; |
| • | information about your transactions with us or our service providers; and |
| • | information we receive from third parties. |
We do not disclose any nonpublic personal information about our customers or former customers to anyone, except as permitted by law.
We restrict access to your nonpublic personal information to those employees or service providers who need to know that information to provide products or services to you. To ensure the confidentiality of your nonpublic personal information, we maintain safeguards that comply with federal standards.
84

eDelivery is NOW AVAILABLE - Stop traditional mail delivery and receive your
shareholder reports and summary prospectus on-line. Sign up at
www.americanbeaconfunds.com
If you invest in the Fund through a financial institution, you may be able to receive the Fund’s regulatory mailings, such as the Prospectus, Annual Report and Semi-Annual Report, by e-mail. If you are interested in this option, please go to www.icsdelivery.com and search for your financial institution’s name or contact your financial institution directly.
To obtain more information about the Fund:
 |  | |
| By E-mail: | On the Internet: | |
| american_beacon.funds@ambeacon.com | Visit our website at www.americanbeaconfunds.com | |
By Telephone: Call (800) 658-5811 |
By Mail: American Beacon Funds P.O. Box 219643 Kansas City, MO 64121-9643 | |
| Availability of Quarterly Portfolio Schedules | Availability of Proxy Voting Policy and Records | |
| In addition to the Schedule of Investments provided in each semi-annual and annual report, the Fund files a complete schedule of its portfolio holdings with the Securities and Exchange Commission (“SEC”) on Form N-PORT as of the end of each fiscal quarter. The Fund’s Forms N-PORT are available on the SEC’s website at www.sec.gov. The Forms N-PORT may also be reviewed and copied at the SEC’s Public Reference Section, 100 F Street, NE, Washington, D.C. 20549-2736. Information regarding the operation of the SEC’s Public Reference Room may be obtained by calling 1-800-SEC-0330. A complete schedule of each Fund’s portfolio holdings is also made available on the Funds’ website at www.americanbeaconfunds.com, approximately sixty days after the end of each quarter for the Sound Point Floating Rate Income Fund and twenty days after the end of each month for the SiM High Yield Opportunities Fund. | A description of the policies and procedures the Fund uses to determine how to vote proxies relating to portfolio securities is available in the Fund’s Statement of Additional Information, which is available free of charge on the Fund’s website at www.americanbeaconfunds.com and by calling 1-800-967-9009 or by accessing the SEC’s website at www.sec.gov. The Fund’s proxy voting record for the most recent year ended June 30 is filed annually with the SEC on Form N-PX. The Fund’s Forms N-PX are available on the SEC’s website at www.sec.gov. The Fund’s proxy voting record may also be obtained by calling 1-800-967-9009. | |


Fund Service Providers:
CUSTODIAN State Street Bank and Trust Company Boston, Massachusetts | TRANSFER AGENT DST Asset Manager Solutions, Inc. Quincy, Massachusetts | INDEPENDENT REGISTERED PUBLIC ACCOUNTING FIRM Ernst & Young LLP Dallas, Texas | DISTRIBUTOR Resolute Investment Distributors, Inc. Irving, Texas |
This report is prepared for shareholders of the American Beacon Funds and may be distributed to others only if preceded or accompanied by a current Prospectus or Summary Prospectus.
American Beacon Funds, American Beacon SiM High Yield Opportunities Fund and American Beacon Sound Point Floating Rate Income Fund are service marks of American Beacon Advisors, Inc.
AR 8/20
| ITEM 2. | CODE OF ETHICS. |
The Trust adopted a code of ethics that applies to its principal executive and financial officers (the “Code”). The Trust amended its code July 6, 2020 to disclose the removal of the American Beacon Sound Point Alternative Lending Fund. The Trust did not grant any waivers to the provisions of the Code during the period covered by the shareholder reports presented in Item 1. The Code is filed herewith as Exhibit 99.CODE ETH.
| ITEM 3. | AUDIT COMMITTEE FINANCIAL EXPERT. |
The Trust’s Board of Trustees has determined that Gilbert G. Alvarado and Claudia Holz, members of the Trust’s Audit and Compliance Committee, are “audit committee financial experts” as defined in Form N-CSR. Mr. Gilbert Alvarado and Ms. Claudia Holz are “independent” as defined in Form N-CSR.
| ITEM 4. | PRINCIPAL ACCOUNTANT FEES AND SERVICES. |
| (a) | ||||
Audit Fees | Fiscal Year Ended | |||
$166,897 | 8/31/2019 | |||
$164,171 | 8/31/2020 | |||
| (b) | ||||
Audit Related Fees | Fiscal Year Ended | |||
$5,000 | 8/31/2019 | |||
$0 | 8/31/2020 | |||
| (c) | ||||
Tax Fees | Fiscal Year Ended | |||
$40,742 | 8/31/2019 | |||
$40,432 | 8/31/2020 | |||
| (d) | ||||
All Other Fees | Fiscal Year Ended | |||
$0 | 8/31/2019 | |||
$0 | 8/31/2020 | |||
(e)(1) Pursuant to its charter, the Trust’s Audit and Compliance Committee shall have the following duties and powers pertaining to pre-approval of audit and non-audit services provided by the Trust’s principal accountant:
| • | to approve, prior to appointment, the engagement of auditors to annually audit and provide their opinion on the Trusts’ financial statements, and, in connection therewith, reviewing and evaluating matters potentially affecting the independence and capabilities of the auditors; |
| • | to approve, prior to appointment, the engagement of the auditors to provide non-audit services to the Trusts, an investment adviser to any series of the Trusts or any entity controlling, controlled by, or under common control with an investment adviser (“adviser affiliate”) that provides ongoing services to the Trusts, if the engagement relates directly to the operations and financial reporting of the Trusts; |
| • | to consider whether the non-audit services provided by a Trust’s auditor to an investment adviser or any adviser affiliate that provides ongoing services to a series of the Trusts, which services were not pre-approved by the Committee, are compatible with maintaining the auditor’s independence; |
| • | to review the arrangements for and scope of the annual audit and any special audits; and |
| • | to review and approving the fees proposed to be charged to the Trusts by the auditors for each audit and non-audit service. |
The Audit and Compliance Committee may delegate any portion of its authority, including the authority to grant pre-approvals of audit and permitted non-audit services, to a subcommittee of one or more members. Any decisions of the subcommittee to grant pre-approvals shall be presented to the full audit committee at its next regularly scheduled meeting.
(e)(2) None of the fees disclosed in paragraphs (b) through (d) above were approved by the audit committee pursuant to paragraph (c)(7)(i)(C) of Rule 2-01 of Regulation S-X.
(f) Not applicable.
(g) Aggregate Non-Audit Fees for Services Rendered to the:
Registrant | Adviser | Adviser’s Affiliates Providing Ongoing Services to Registrant | Fiscal Year Ended | |||||
$40,742 | $807,829 | N/A | 8/31/2019 | |||||
$40,432 | $77,205 | N/A | 8/31/2020 | |||||
(h) Not applicable.
| ITEM 5. | AUDIT COMMITTEE OF LISTED REGISTRANTS. |
Not applicable.
| ITEM 6. | SCHEDULE OF INVESTMENTS. |
The schedules of investments for each series of the Trust are included in the shareholder reports presented in Item 1.
| ITEM 7. | DISCLOSURE OF PROXY VOTING POLICIES AND PROCEDURES FOR CLOSED-END MANAGEMENT INVESTMENT COMPANIES. |
Not applicable.
| ITEM 8. | PORTFOLIO MANAGERS OF CLOSED-END MANAGEMENT INVESTMENT COMPANIES. |
Not applicable.
| ITEM 9. | PURCHASES OF EQUITY SECURITIES BY CLOSED-END MANAGEMENT INVESTMENT COMPANY AND AFFILIATED PURCHASERS. |
Not applicable.
| ITEM 10. | SUBMISSION OF MATTERS TO A VOTE OF SECURITY HOLDERS. |
The Trust has made no material changes to the procedures by which shareholders may recommend nominees to the Trust’s Board of Trustees since the Trust last disclosed such procedures in Schedule 14A.
| ITEM 11. | CONTROLS AND PROCEDURES. |
(a) Based upon an evaluation within 90 days of the filing date of this report, the principal executive and financial officers concluded that the disclosure controls and procedures of the Trust are effective.
(b) There were no changes in the Trust’s internal control over financial reporting during the second fiscal quarter of the period covered by this report that has materially affected, or is reasonably likely to materially affect, the Trust’s internal control over financial reporting.
| ITEM 12 | DISCLOSURE OF SECURITIES LENDING ACTIVITIES FOR CLOSED-END MANAGMENT INVESTMENT COMPANIES. |
Not Applicable.
| ITEM 13. | EXHIBITS. |
(a)(1) Filed herewith as EX-99.CODE ETH.
(a)(2) A separate certification for each principal executive officer and principal financial officer of the Trust as required by Rule 30a-2(a) under the Investment Company Act of 1940 is attached hereto as EX-99.CERT.
(a)(3) Not applicable.
(b) The certifications required by Rule 30a-2(b) under the Investment Company Act of 1940 are attached hereto as EX-99.906CERT.
SIGNATURES
Pursuant to the requirements of the Securities Exchange Act of 1934 and the Investment Company Act of 1940, the registrant has duly caused this report to be signed on its behalf by the undersigned, thereunto duly authorized.
(Registrant): American Beacon Funds
By /s/ Gene L. Needles, Jr. |
| Gene L. Needles, Jr. |
| President |
| American Beacon Funds |
Date: November 5, 2020
Pursuant to the requirements of the Securities Exchange Act of 1934 and the Investment Company Act of 1940, this report has been signed below by the following persons on behalf of the registrant and in the capacities and on the dates indicated.
By /s/ Gene L. Needles, Jr. |
| Gene L. Needles, Jr. |
| President |
| American Beacon Funds |
Date: November 5, 2020
By /s/ Melinda G. Heika |
| Melinda G. Heika |
| Treasurer |
| American Beacon Funds |
Date: November 5, 2020