UNITED STATES
SECURITIES AND EXCHANGE COMMISSION
Washington, D.C. 20549
FORM N-CSR
CERTIFIED SHAREHOLDER REPORT OF REGISTERED
MANAGEMENT INVESTMENT COMPANIES
Investment Company Act file number: 811-4984
AMERICAN BEACON FUNDS
(Exact name of registrant as specified in charter)
220 East Las Colinas Boulevard, Suite 1200
Irving, Texas 75039
(Address of principal executive offices)-(Zip code)
GENE L. NEEDLES, JR., PRESIDENT
220 East Las Colinas Boulevard, Suite 1200
Irving, Texas 75039
(Name and address of agent for service)
Registrant’s telephone number, including area code: (817) 391-6100
Date of fiscal year end: October 31, 2021
Date of reporting period: October 31, 2021
Form N-CSR is to be used by management investment companies to file reports with the Commission not later than 10 days after the transmission to stockholders of any report that is required to be transmitted to stockholders under Rule 30e-1 under the Investment Company Act of 1940 (17 CFR 270.30e-1). The Commission may use the information provided on Form N-CSR in its regulatory, disclosure review, inspection, and policymaking roles.
A registrant is required to disclose the information specified by Form N-CSR, and the Commission will make this information public. A registrant is not required to respond to the collection of information contained in Form N-CSR unless the Form displays a currently valid Office of Management and Budget (“OMB”) control number. Please direct comments concerning the accuracy of the information collection burden estimate and any suggestions for reducing the burden to Secretary, Securities and Exchange Commission, 450 Fifth Street, NW, Washington, DC 20549-0609. The OMB has reviewed this collection of information under the clearance requirements of 44 U.S.C. § 3507.
| ITEM 1. | REPORTS TO STOCKHOLDERS. |

About American Beacon Advisors
Since 1986, American Beacon Advisors, Inc. has offered a variety of products and investment advisory services to numerous institutional and retail clients, including a variety of mutual funds, corporate cash management, and separate account management.
Our clients include defined benefit plans, defined contribution plans, foundations, endowments, corporations, financial planners, and other institutional investors. With American Beacon Advisors, you can put the experience of a multi-billion dollar asset management firm to work for your company.
BALANCED FUND RISKS
The use of fixed-income securities entails interest rate and credit risks. Investing in foreign securities may involve heightened risk due to currency fluctuations and economic and political risks. Investing in value stocks may limit downside risk over time; however, the Fund may produce more modest gains than riskier stock funds as a trade-off for this potentially lower risk. The use of futures contracts for cash management may subject the Fund to losing more money than invested. The Fund participates in a securities lending program. Please see the prospectus for a complete discussion of the Fund’s risks. There can be no assurances that the investment objectives of this Fund will be met.
MID-CAP VALUE FUND RISKS
Investing in medium-capitalization stocks may involve greater volatility and lower liquidity than larger company stocks. Investing in value stocks may limit downside risk over time; however, the Fund may produce more modest gains than riskier stock funds as a trade-off for this potentially lower risk. Investing in foreign securities may involve heightened risk due to currency fluctuations and economic and political risks. The use of futures contracts for cash management may subject the Fund to losing more money than invested. The Fund participates in a securities lending program. Please see the prospectus for a complete discussion of the Fund’s risks. There can be no assurances that the investment objectives of this Fund will be met.
Any opinions herein, including forecasts, reflect our judgment as of the end of the reporting period and are subject to change. Each advisor’s strategies and each Fund’s portfolio composition will change depending on economic and market conditions. This report is not a complete analysis of market conditions, and, therefore, should not be relied upon as investment advice. Although economic and market information has been compiled from reliable sources, American Beacon Advisors, Inc. makes no representation as to the completeness or accuracy of the statements contained herein.
American Beacon Funds | October 31, 2021 |
| 1 | ||||
| 2 | ||||
| 10 | ||||
| 12 | ||||
Schedules of Investments: | ||||
| 13 | ||||
| 29 | ||||
| 35 | ||||
| 39 | ||||
Financial Highlights: | ||||
| 69 | ||||
| 75 | ||||
| 82 | ||||
Disclosure Regarding Approval of the Management and Investment Advisory Agreements | 83 | |||
| 89 | ||||
| 96 | ||||
| Back Cover | ||||
 | Dear Shareholders,
As Warren E. Buffett, the “Oracle of Omaha” and billionaire chairman and CEO of Berkshire Hathaway, once said, “Someone’s sitting in the shade today because someone planted a tree a long time ago.”
That is to say, before we can enjoy the fruits of our labor, we must first devote our attention to the careful planning and cultivation of our estates. To achieve a strong yield requires time, diligence and patience – and there are no guarantees the seeds we plant today will thrive or result in a plentiful harvest. This can be said not only about the actions we undertake in our gardening or landscaping, but also those we initiate in our investment portfolios – especially as we take into account the potential for harm caused by natural disasters and other catastrophes, such as the COVID-19 pandemic. |
Because none of us – not even the Oracle of Omaha – has a crystal ball, to help give your investment portfolio the greatest chance for success over the long term, we encourage you to work with financial professionals to develop your personal savings plan, conduct annual plan reviews, and make thoughtful, purposeful plan adjustments to help manage your evolving financial needs and goals. By investing in different investment styles and asset classes, you may be able to help mitigate financial risks across your portfolio. By allocating your portfolio according to your risk-tolerance level, you may be better positioned to withstand short-term crises. With continuous nurturing, you will be better positioned to achieve enduring financial success.
Since 1986, American Beacon has endeavored to provide investors with a disciplined approach to realizing long-term financial goals. As a manager of managers, we strive to provide investment products that may enable investors to participate during market upswings while potentially insulating against market downswings. The investment teams behind our mutual funds seek to produce consistent, long-term results rather than focus only on short-term movements in the markets. In managing our investment products, we emphasize identifying opportunities that offer the potential for long-term financial rewards.
Thank you for entrusting your financial success with American Beacon. For additional information about our investment products or to access your account information, please visit our website at www.americanbeaconfunds.com.
Best Regards,

Gene L. Needles, Jr.
President
American Beacon Funds
1
Domestic Bond and Domestic Equity Market Overviews
October 31, 2021 (Unaudited)
Domestic Bond Market Overview
In the U.S. fixed-income markets, the investment-grade Bloomberg U.S. Aggregate Bond Index (the “Index”) declined, returning -0.48% for the 12-month period ended October 31, 2021. Within the Index, the credit component returned 1.90%, agency-backed mortgages returned -0.58% and U.S. Treasuries returned -2.45%. Returns in the credit sectors outperformed during the period as spreads continued to narrow following the economic recovery. Treasury yields were higher by period end, causing negative total returns, as investors began to see through the pandemic to more normalized interest rate levels.
Lower quality outperformed with triple-B-rated corporate bonds returning 3.52%, single-A up 0.59% and double-A up 1.22%, according to the Index. The highest-returning sectors included: Energy, up 7.92%; Transportation, up 3.61%; and Capital Goods, up 3.26%. The lowest-returning sectors included: Technology, up 0.45%; Financials, up 1.38%; and Utilities, up 1.40%.
Economic news throughout the year was mostly positive, despite periodic disruptions due to the COVID-19 pandemic. In late 2020, the earlier-than-expected arrival of vaccines led to business reopenings and expectations for strong economic growth. By late 2021, consumer spending was solid, driven primarily by spending on housing and retail sales. The labor market steadily added new jobs, and generous unemployment benefits aided those temporarily out of work.
Following the rebounding economy, inflation also picked up during the period, reflecting supply chain disruptions and pent-up consumer demand. While inflation concerns mounted, the Federal Reserve viewed the price increases as transitory and argued that slack in the labor market, low manufacturing capacity utilization rates and an economy still running below potential would keep inflation muted. The 10-year U.S. Treasury yield ended the period at 1.60% (up from 0.9% at the beginning of the period), suggesting that investors were not particularly worried about long-term inflation either.
With regard to monetary policy, the Federal Reserve maintained the federal funds rate in a 0% to 0.25% range during the period and continued to purchase $80 billion in Treasuries and $40 billion in agency mortgage-backed securities each month. As Federal Open Market Committee members began to feel better about the economy, they discussed plans for tapering quantitative easing. At period end, markets were anticipating that the reduction in quantitative easing would likely begin in late 2021 and that the federal funds rate increases would arrive in late 2022 or early 2023.
Domestic Equity Market Overview
U.S. equities posted strong returns for the 12-month period ended October 31, 2021. The broader market, as measured by the Russell 3000 Index, posted a 43.89% gain. Smaller companies led the way with the Russell 2000 Index rising 50.80%. Mid- and large-cap companies also participated in the rally, with 45.40% and 43.51% returns for the Russell Midcap and Russell 1000 Indexes, respectively. The rally was consistent for most of the period, reflecting an improving economy, accommodative monetary policy and fiscal stimulus.
The prospect of full-scale COVID-19 vaccinations prompted a major shift in investor preference to under-owned Value stocks in the fourth quarter of 2020. Value’s outperformance continued into 2021 as the vaccine rollout accelerated, while massive fiscal and monetary stimulus set the stage for a powerful rebound in consumer spending. In June 2021 investor preference moved in favor of Growth-style stocks as the Federal Reserve spoke about potential tapering, while the spread of the COVID-19 delta variant in both Asia and the U.S. raised concerns about the economic impact. Stocks then rebounded strongly in October 2021 as macro concerns abated; both the Value and Growth cohorts benefited, with Growth outpacing Value. For the full 12-month period, Value stocks outpaced Growth as measured by the Russell 3000 Value Index return of 44.97% and the Russell 3000 Growth Index return of 42.81%.
Inflation picked up steam during 2021, reflecting supply chain disruptions and pent-up demand due to the pandemic. In its latest comments, the Federal Reserve acknowledged higher-than-expected inflation but continued
2
Domestic Bond and Domestic Equity Market Overviews
October 31, 2021 (Unaudited)
to point to overall deceleration in the rate with the expectation that core inflation (measured by the personal consumption expenditures deflator) could rise between 2% and 2.5% in 2022 and 2023 compared to a roughly 4% increase in 2021. Rising inflation has persisted longer than the Federal Reserve initially expected, but supply chain disruptions from the pandemic have contributed meaningfully to inflation in certain segments of the economy.
With regard to monetary policy, the Federal Reserve maintained the federal funds rate at 0% to 0.25% over the year and announced plans to begin tapering quantitative easing. The Federal Reserve will reduce asset purchases by $10 billion for U.S. Treasuries and $5 billion for agency mortgage-backed securities. The dot plots from Federal Open Market Committee members suggest rate increases could begin in late 2022.
3
American Beacon Balanced FundSM
Performance Overview
October 31, 2021 (Unaudited)
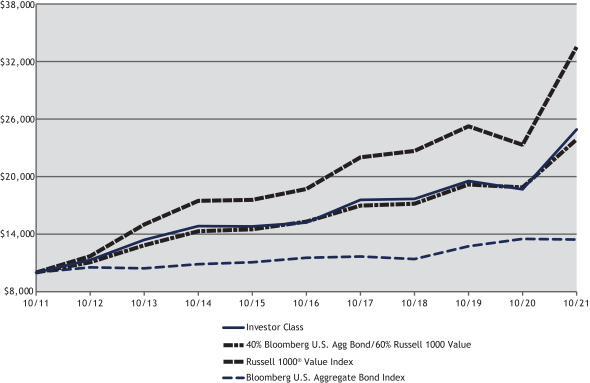
The Investor Class of the American Beacon Balanced Fund (the “Fund”) returned 33.32% for the twelve months ended October 31, 2021, outperforming the 60% Russell 1000® Value Index/40% Bloomberg U.S. Aggregate Bond Index return of 24.54% for the same period.
Comparison of Changes in Value of a $10,000 Investment for the period 10/31/2011 through 10/31/2021
| Total Returns for the Period ended October 31, 2021 |
| |||||||||||||||||||||||||||||||
Ticker | 1 Year | 3 Years | 5 Years | 10 Years | Value of $10,000 10/31/2021 | |||||||||||||||||||||||||||
R5 Class (1,7) | AADBX | 33.80 | % | 12.46 | % | 10.68 | % | 9.89 | % | $ | 25,688 | |||||||||||||||||||||
Y Class (1,2,7) | ACBYX | 33.66 | % | 12.36 | % | 10.68 | % | 9.82 | % | $ | 25,521 | |||||||||||||||||||||
Investor Class (1,7) | AABPX | 33.32 | % | 12.09 | % | 10.36 | % | 9.54 | % | $ | 24,880 | |||||||||||||||||||||
Advisor Class (1,7) | ABLSX | 33.17 | % | 11.89 | % | 10.18 | % | 9.36 | % | $ | 24,468 | |||||||||||||||||||||
A Class without sales charge (1,3,7) | ABFAX | 33.39 | % | 12.09 | % | 10.35 | % | 9.48 | % | $ | 24,732 | |||||||||||||||||||||
A Class with sales Charge (1,3,7) | ABFAX | 25.68 | % | 9.89 | % | 9.05 | % | 8.83 | % | $ | 23,302 | |||||||||||||||||||||
C Class without sales charge (1,4,7) | ABCCX | 32.32 | % | 11.25 | % | 9.54 | % | 8.67 | % | $ | 22,956 | |||||||||||||||||||||
C Class with sales charge (1,4,7) | ABCCX | 31.32 | % | 11.25 | % | 9.54 | % | 8.67 | % | $ | 22,956 | |||||||||||||||||||||
40% Bloomberg U.S. Agg Bond/60% Russell 1000 Value (5) | 24.54 | % | 11.10 | % | 8.97 | % | 9.08 | % | $ | 23,844 | ||||||||||||||||||||||
Russell 1000® Value Index (6) | 43.76 | % | 13.90 | % | 12.39 | % | 12.85 | % | $ | 33,491 | ||||||||||||||||||||||
Bloomberg U.S. Aggregate Bond Index (6) | -0.48 | % | 5.63 | % | 3.10 | % | 3.00 | % | $ | 13,437 | ||||||||||||||||||||||
| * | Not Annualized. |
| 1. | Performance shown is historical and is not indicative of future returns. Investment returns and principal value will vary, and shares may be worth more or less at redemption than at original purchase. Performance shown is calculated based on the published end of day net asset values as of date indicated, and current performance may be lower or higher than the performance data quoted. To obtain performance as of the most recent month end, please visit www.americanbeaconfunds.com or call 1-800-967-9009. Fund performance in the table above does not reflect the deduction of taxes a shareholder would pay on distributions or the redemption of shares. Generally accepted accounting principles require adjustments to be made to the net assets of the Fund at |
4
American Beacon Balanced FundSM
Performance Overview
October 31, 2021 (Unaudited)
| period end for financial reporting purposes only; and as such, the total return based on the unadjusted net asset value per share may differ from the total return reported in the financial highlights. Please note that the recent performance of the securities market has helped produce short-term returns that are not typical and may not continue in the future. |
| 2. | A portion of the fees charged to the Y Class of the Fund was waived in 2011, partially recovered in 2013 and fully recovered in 2014. Performance prior to waiving fees was lower than the actual returns shown for 2011. |
| 3. | A portion of the fees charged to the A Class of the Fund was waived in 2011 and 2012, partially recovered in 2013, fully recovered in 2014 and waived in 2018. Performance prior to waiving fees was lower than the actual returns shown for 2011, 2012 and 2018. A Class has a maximum sales charge of 5.75%. |
| 4. | A portion of the fees charged to the C Class of the Fund was waived from 2010 through 2012, partially recovered in 2013, fully recovered in 2014 and waived in 2018. Performance prior to waiving fees was lower than the actual returns shown for 2010 through 2012 and for 2018. The maximum contingent deferred sales charge for C Class is 1% for shares redeemed within one year of the date of purchase. |
| 5. | To reflect the Fund’s allocation of its assets between investment-grade fixed-income securities and equity securities, the returns of the Russell 1000 Value Index and the Bloomberg U.S. Aggregate Bond Index have been combined in a 60% / 40% proportion, respectively. |
| 6. | The Russell 1000® Value Index is an unmanaged index of those stocks in the Russell 1000 Index with lower price-to-book ratios and lower forecasted growth values. Russell 1000 Value Index and Russell 1000 Index are registered trademarks of Frank Russell Company. American Beacon Funds is not promoted, sponsored or endorsed by, nor in any way affiliated with the London Stock Exchange Group plc and its group undertakings (collectively, the “LSE Group”). FTSE Russell is a trading name of certain of the LSE Group companies. LSE Group is not responsible for and has not reviewed the American Beacon Balanced Fund nor any associated literature or publications and LSE Group makes no representation or warranty, express or implied, as to their accuracy, or completeness, or otherwise. All rights in the Russell 1000 Value Index (the “Index”) vest in the relevant LSE Group company which owns the Index. Russell 1000® is a trademark of the relevant LSE Group company and is used by any other LSE Group company under license. The Index is calculated by or on behalf of FTSE International Limited or its affiliate, agent or partner. The LSE Group does not accept any liability whatsoever to any person arising out of (a) the use of, reliance on or any error in the Index or (b) investment in or operation of the Fund. The LSE Group makes no claim, prediction, warranty or representation either as to the results to be obtained from the Fund or the suitability of the Index for the purpose to which it is being put by the Manager. The Bloomberg U.S. Aggregate Bond Index is a broad-based benchmark that measures the investment grade, U.S. dollar-denominated, fixed-rate taxable bond market. BLOOMBERG® is a trademark and service mark of Bloomberg Finance L.P. and its affiliates (collectively, “Bloomberg”). Bloomberg or Bloomberg’s licensors, own all proprietary rights in the Bloomberg Indices. Bloomberg does not approve or endorse this material, or guarantee the accuracy or completeness of any information herein, or make any warranty, express or implied, as to the results to be obtained therefrom and, to the maximum extent allowed by law, shall not have any liability or responsibility for injury or damages arising in connection therewith. |
| 7. | The Total Annual Fund Operating Expense ratios set forth in the most recent Fund prospectus for the R5, Y, Investor, Advisor, A, and C Class shares were 0.69%, 0.77%, 1.01%, 1.17%, 1.02%, and 1.76%, respectively. The expense ratios above may vary from the expense ratios presented in other sections of this report that are based on expenses incurred during the period covered by this report. |
As of October 31, 2021, the Fund’s asset allocation was 60% in equities (including equitized cash) and 40% in fixed-income securities.
The equity portion of the Fund (excluding equitized cash) returned 64.11% for the period, outperforming the Russell 1000 Value Index (the “Index”) return of 43.76%. The Fund outperformed the Index as both sector allocation and stock selection contributed to outperformance relative to the Index.
Stock selection in the Financials and Health Care sectors contributed most of the relative outperformance during the twelve-month period. In the Financials sector, the Fund’s position in Wells Fargo & Co. (up 145.4%) and American International Group, Inc. (up 97.6%) were the biggest contributors. In the Health Care sector, Anthem, Inc. (up 61.8%) and CVS Health Corp. (up 64.0%) performed well. Conversely, positions in International Flavors & Fragrances, Inc. (up 6.8%) and Corteva, Inc. (up 33.2%) detracted from performance within the Materials sector.
The Fund’s overweight allocations to both Energy (up 112.4%) and Financials (up 74.2%) helped performance the most with respect to sector allocation. On the other hand, an underweight allocation to Real Estate (up 52.3%) detracted from the Fund’s relative outperformance.
5
American Beacon Balanced FundSM
Performance Overview
October 31, 2021 (Unaudited)
The fixed-income portion of the Fund returned -0.48% for the twelve-month period, matching the Bloomberg U.S. Aggregate Bond Index (the “Index”) return of -0.48%. The Fund’s fixed-income performance relative to the Index was hampered by security selection but helped by contributions from sector allocation. The Fund’s selections in Service and Finance, both within Corporates, (down 0.2% and flat at 0.0%, respectively) detracted relative value. However, an underweight allocation to U.S. Treasuries (down 2.4%) and an overweight allocation to Manufacturing (up 1.9%), within Corporates, benefited the Fund. From a duration perspective, the portfolio’s return was hurt most by an underweight allocation to both the 1 to 3 year maturity and the 10 to 30 year maturity range (down 0.1% and up 0.1%, respectively), while security selection in the 10 to 30 year maturity range (up 1.8%) contributed to performance.
The sub-advisors continue to focus on the disciplined selection of attractive securities that should allow the Fund to benefit long-term.
| Top Ten Holdings (% Net Assets) | ||||||||
| Wells Fargo & Co. | 2.6 | |||||||
| Anthem, Inc. | 2.1 | |||||||
| American International Group, Inc. | 2.1 | |||||||
| Citigroup, Inc. | 1.8 | |||||||
| Hess Corp. | 1.6 | |||||||
| General Electric Co. | 1.4 | |||||||
| U.S. Treasury Notes/Bonds, 1.500%, Due 2/15/2030 | 1.4 | |||||||
| U.S. Treasury Notes/Bonds, 1.125%, Due 2/28/2025 | 1.2 | |||||||
| Goldman Sachs Group, Inc. | 1.2 | |||||||
| U.S. Treasury Notes/Bonds, 1.500%, Due 1/31/2027 | 1.2 | |||||||
| Total Fund Holdings | 483 | |||||||
| Sector Allocation (% Equities) | ||||||||
| Financials | 24.8 | |||||||
| Health Care | 13.7 | |||||||
| Industrials | 13.7 | |||||||
| Energy | 11.2 | |||||||
| Consumer Discretionary | 10.4 | |||||||
| Information Technology | 9.8 | |||||||
| Communication Services | 6.7 | |||||||
| Materials | 3.7 | |||||||
| Consumer Staples | 2.5 | |||||||
| Utilities | 2.0 | |||||||
| Real Estate | 1.5 | |||||||
| Sector Allocation (% Fixed Income) | ||||||||
| U.S. Treasury Obligations | 32.6 | |||||||
| U.S. Agency Mortgage-Backed Obligations | 17.0 | |||||||
| Financial | 13.4 | |||||||
| Consumer, Non-Cyclical | 7.6 | |||||||
| Communications | 5.5 | |||||||
| Technology | 5.1 | |||||||
| Industrial | 4.6 | |||||||
| Consumer, Cyclical | 3.7 | |||||||
| Energy | 3.5 | |||||||
| Utilities | 3.2 | |||||||
| Asset-Backed Obligations | 2.6 | |||||||
| Basic Materials | 0.6 | |||||||
| Commercial Mortgage-Backed Obligations | 0.5 | |||||||
| Foreign Sovereign Obligations | 0.1 | |||||||
6
American Beacon Mid-Cap Value FundSM
Performance Overview
October 31, 2021 (Unaudited)
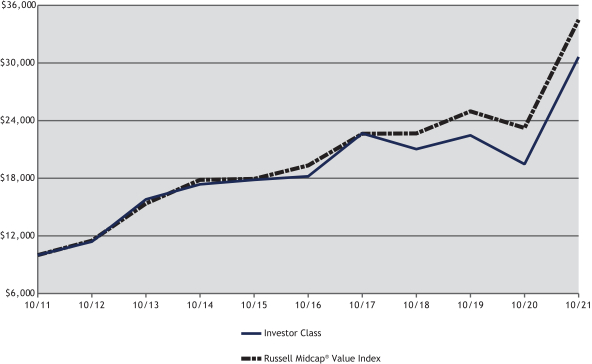
The Investor Class of the American Beacon Mid-Cap Value Fund (the “Fund”) returned 57.34% for the twelve months ended October 31, 2021, outperforming the Russell Midcap® Value Index (the “Index”) return of 48.60% for the same period.
Comparison of Changes in Value of a $10,000 Investment for the period 10/31/2011 through 10/31/2021
| Total Returns for the Period ended October 31, 2021 |
| |||||||||||||||||||||||||||||||
Ticker | 1 Year | 3 Years | 5 Years | 10 Years | Value of $10,000 10/31/2021 | |||||||||||||||||||||||||||
R5 Class (1,3,10) | AACIX | 57.68 | % | 13.66 | % | 11.26 | % | 12.11 | % | $ | 31,376 | |||||||||||||||||||||
Y Class (1,4,10) | ACMYX | 57.60 | % | 13.58 | % | 11.18 | % | 12.04 | % | $ | 31,157 | |||||||||||||||||||||
Investor Class (1,2,10) | AMPAX | 57.34 | % | 13.36 | % | 10.99 | % | 11.84 | % | $ | 30,627 | |||||||||||||||||||||
Advisor Class (1,5,10) | AMCSX | 56.71 | % | 13.02 | % | 10.66 | % | 11.51 | % | $ | 29,726 | |||||||||||||||||||||
A Class without sales charge (1,6,10) | ABMAX | 57.15 | % | 13.24 | % | 10.83 | % | 11.65 | % | $ | 30,110 | |||||||||||||||||||||
A Class with sales Charge (1,6,10) | ABMAX | 48.09 | % | 11.03 | % | 9.52 | % | 10.99 | % | $ | 28,368 | |||||||||||||||||||||
C Class without sales charge (1,7,10) | AMCCX | 55.99 | % | 12.43 | % | 10.06 | % | 10.84 | % | $ | 27,996 | |||||||||||||||||||||
C Class with sales charge (1,7,10) | AMCCX | 54.99 | % | 12.43 | % | 10.06 | % | 10.84 | % | $ | 27,996 | |||||||||||||||||||||
R6 Class (1,8,10) | AMDRX | 57.80 | % | 13.76 | % | 11.32 | % | 12.14 | % | $ | 31,460 | |||||||||||||||||||||
Russell Midcap® Value Index (9) | 48.60 | % | 15.03 | % | 12.30 | % | 13.18 | % | $ | 34,491 | ||||||||||||||||||||||
| * | Not Annualized. |
| 1. | Performance shown is historical and is not indicative of future returns. Investment returns and principal value will vary, and shares may be worth more or less at redemption than at original purchase. Performance shown is calculated based on the published end of day net asset values as of date indicated, and current performance may be lower or higher than the performance data quoted. To obtain performance as of the most recent month end, please visit www.americanbeaconfunds.com or call 1-800-967-9009. Fund performance in the table above does not reflect the deduction of taxes a shareholder would pay on distributions or the redemption of shares. Generally accepted accounting principles require adjustments to be made to the net assets of the Fund at period end for financial reporting purposes only; and as such, the total return based on the unadjusted net asset value per share may differ from the total return reported in the financial highlights. Please note that the recent performance of the securities market has helped produce short-term returns that are not typical and may not continue in the future. |
7
American Beacon Mid-Cap Value FundSM
Performance Overview
October 31, 2021 (Unaudited)
| 2. | A portion of the fees charged to the Investor Class of the Fund was waived from 2006 through 2013, fully recovered in 2014 and waived in 2021. Performance prior to waiving fees was lower than actual returns shown for periods when waivers were in effect. |
| 3. | A portion of the fees charged to the R5 Class of the Fund was waived from 2005 through 2013, fully recovered in 2014 and waived in 2021. Performance prior to waiving fees was lower than actual returns shown for periods when waivers were in effect. |
| 4. | A portion of the fees charged to the Y Class of the Fund was waived from 2010 through 2013 and in 2021. Performance prior to waiving fees was lower than the actual returns shown for periods when waivers were in effect. |
| 5. | A portion of the fees charged to the Advisor Class of the Fund was waived from 2007 through 2013, fully recovered in 2014 and waived in 2021. Performance prior to waiving fees was lower than the actual returns shown for periods when waivers were in effect. |
| 6. | A portion of the fees charged to the A Class of the Fund was waived for 2010 through 2012, fully recovered in 2013 and waived in 2021. Performance prior to waiving fees was lower than the actual returns shown for periods when waivers were in effect. A Class shares have a maximum sales charge of 5.75%. |
| 7. | A portion of the fees charged to the C Class of the Fund was waived from 2010 through 2013, fully recovered in 2014 and waived in 2021. Performance prior to waiving fees was lower than the actual returns shown for periods when waivers were in effect. The maximum contingent deferred sales charge for C Class is 1.00% for shares redeemed within one year of the date of purchase. |
| 8. | Fund performance for the five-year and ten-year periods represents the returns achieved by the R5 Class from 10/31/11 through 2/28/18, the inception date of the R6 Class, and the returns of the R6 Class since its inception. Expenses of the R6 Class are lower than those of the R5 Class. As a result, total returns shown may be lower than they would have been had the R6 Class been in existence since 10/31/11. A portion of fees charged to the R6 Class of the Fund has been waived since Class inception. Performance prior to waiving fees was lower than actual returns shown since inception. |
| 9. | The Russell Midcap® Value Index is an unmanaged index of those stocks in the Russell Midcap Index with lower price-to-book ratios and lower forecasted growth values. The Russell Midcap Index measures the performance of the 800 smallest companies in the Russell 1000 Index. Russell Midcap Value Index, Russell Midcap Index and Russell 1000 Index are registered trademarks of Frank Russell Company. American Beacon Funds is not promoted, sponsored or endorsed by, nor in any way affiliated with the London Stock Exchange Group plc and its group undertakings (collectively, the “LSE Group”). FTSE Russell is a trading name of certain of the LSE Group companies. LSE Group is not responsible for and has not reviewed the American Beacon Mid-Cap Value Fund nor any associated literature or publications and LSE Group makes no representation or warranty, express or implied, as to their accuracy, or completeness, or otherwise. All rights in the Russell Midcap Value Index (the “Index”) vest in the relevant LSE Group company which owns the Index. Russell 1000® is a trademark of the relevant LSE Group company and is used by any other LSE Group company under license. The Index is calculated by or on behalf of FTSE International Limited or its affiliate, agent or partner. The LSE Group does not accept any liability whatsoever to any person arising out of (a) the use of, reliance on or any error in the Index or (b) investment in or operation of the Fund. The LSE Group makes no claim, prediction, warranty or representation either as to the results to be obtained from the Fund or the suitability of the Index for the purpose to which it is being put by the Manager. One cannot directly invest in an index. |
| 10. | The Total Annual Fund Operating Expense ratios set forth in the most recent Fund prospectus for the R5, Y, Investor, Advisor, A, C, and R6 Class shares were 0.96%, 1.04%, 1.22%, 1.54%, 1.31%, 2.06% and 0.97%, respectively. The expense ratios above may vary from the expense ratios presented in other sections of this report that are based on expenses incurred during the period covered by this report. |
The Fund’s outperformance of the Index was due to both positive security selection and sector allocation.
From a security selection perspective, the Fund’s relative outperformance was driven by security selection in the Consumer Discretionary, Industrials, Information Technology and Materials sectors. In the Consumer Discretionary sector, contributors included SeaWorld Entertainment, Inc. (up 194.7%) and Gildan Activewear, Inc. (up 84.2%). Within the Industrials sector, AerCap Holdings NV (up 95.6%) and Avis Budget Group Inc. (up 104.9%) contributed to relative performance. Alliance Data Systems Corp. (up 115.4%) contributed within the Information Technology sector. Contributors in the Materials sector included Olin Corp. (up 279.1%) and Element Solutions, Inc. (up 106.1%). Partially offsetting this outperformance was security selection in the Communication Services sector; detractors included Altice USA, Inc., Class A (down 42.2%).
From a sector allocation perspective, a significant overweight allocation to the Financials sector and underweight allocations to the Utilities and Consumer Staples sectors contributed positively to relative performance. Partially offsetting this performance was an underweight allocation to the Real Estate sector.
The sub-advisors’ philosophy of investing in undervalued companies that exhibit improving profitability and earnings growth potential should allow the Fund to benefit longer term.
8
American Beacon Mid-Cap Value FundsSM
Performance Overview
October 31, 2021 (Unaudited)
| Top Ten Holdings (% Net Assets) | ||||||||
| Axis Capital Holdings Ltd. | 2.5 | |||||||
| American International Group, Inc. | 1.6 | |||||||
| PROG Holdings, Inc. | 1.5 | |||||||
| Element Solutions, Inc. | 1.5 | |||||||
| MGM Growth Properties LLC, Class A | 1.5 | |||||||
| AerCap Holdings NV | 1.4 | |||||||
| Equitable Holdings, Inc. | 1.4 | |||||||
| Ally Financial, Inc. | 1.3 | |||||||
| Pioneer Natural Resources Co. | 1.3 | |||||||
| Fidelity National Financial, Inc. | 1.2 | |||||||
| Total Fund Holdings | 122 | |||||||
| Sector Allocation (% Equities) | ||||||||
| Financials | 26.4 | |||||||
| Industrials | 17.2 | |||||||
| Consumer Discretionary | 16.1 | |||||||
| Materials | 8.2 | |||||||
| Energy | 7.5 | |||||||
| Health Care | 7.1 | |||||||
| Utilities | 5.9 | |||||||
| Real Estate | 4.6 | |||||||
| Information Technology | 3.6 | |||||||
| Communication Services | 1.7 | |||||||
| Consumer Staples | 1.7 | |||||||
9
Expense Examples
October 31, 2021 (Unaudited)
Fund Expense Example
As a shareholder of a Fund, you incur two types of costs: (1) transaction costs, including sales charges (loads) on purchase payments and redemption fees, if applicable, and (2) ongoing costs, including management fees, distribution (12b-1) fees, sub-transfer agent fees, and other Fund expenses. The Examples are intended to help you understand the ongoing cost (in dollars) of investing in the Funds and to compare these costs with the ongoing costs of investing in other mutual funds. The Examples are based on an investment of $1,000 invested at the beginning of the period in each Class and held for the entire period from May 1, 2021 through October 31, 2021.
Actual Expenses
The “Actual” lines of the tables provide information about actual account values and actual expenses. You may use the information on this page, together with the amount you invested, to estimate the expenses that you paid over the period. Simply divide your account value by $1,000 (for example, an $8,600 account value divided by $1,000 = $8.60), then multiply the result by the “Expenses Paid During Period” to estimate the expenses you paid on your account during this period. Shareholders of the Investor and R5 Classes that invest in the Funds through an IRA or Roth IRA may be subject to a custodial IRA fee of $15 that is typically deducted each December. If your account was subject to a custodial IRA fee during the period, your costs would have been $15 higher.
Hypothetical Example for Comparison Purposes
The “Hypothetical” lines of the tables provide information about hypothetical account values and hypothetical expenses based on the Funds’ actual expense ratio and an assumed 5% per year rate of return before expenses (not the Funds’ actual return). You may compare the ongoing costs of investing in the Funds with other funds by contrasting this 5% hypothetical example and the 5% hypothetical examples that appear in the shareholder reports of the other funds. The hypothetical account values and expenses may not be used to estimate the actual ending account balance or expenses you paid for the period. Shareholders of the Investor and R5 Classes that invest in the Funds through an IRA or Roth IRA may be subject to a custodial IRA fee of $15 that is typically deducted each December. If your account was subject to a custodial IRA fee during the period, your costs would have been $15 higher.
You should also be aware that the expenses shown in the table highlight only your ongoing costs and do not reflect any transaction costs charged by the Funds, such as sales charges (loads) or redemption fees, as applicable. Similarly, the expense examples for other funds do not reflect any transaction costs charged by those funds, such as sales charges (loads), redemption fees or exchange fees. Therefore, the “Hypothetical” lines of the tables are useful in comparing ongoing costs only and will not help you determine the relative total costs of owning different funds. If you were subject to any transaction costs during the period, your costs would have been higher.
10
American Beacon FundsSM
Expense Examples
October 31, 2021 (Unaudited)
| American Beacon Balanced Fund |
| ||||||||||||||
| Beginning Account Value 5/1/2021 | Ending Account Value 10/31/2021 | Expenses Paid During Period 5/1/2021-10/31/2021* | |||||||||||||
| R5 Class | |||||||||||||||
| Actual | $1,000.00 | $1,038.40 | $3.70 | ||||||||||||
| Hypothetical** | $1,000.00 | $1,021.58 | $3.67 | ||||||||||||
| Y Class | |||||||||||||||
| Actual | $1,000.00 | $1,037.70 | $4.11 | ||||||||||||
| Hypothetical** | $1,000.00 | $1,021.17 | $4.08 | ||||||||||||
| Investor Class | |||||||||||||||
| Actual | $1,000.00 | $1,036.50 | $5.18 | ||||||||||||
| Hypothetical** | $1,000.00 | $1,020.11 | $5.14 | ||||||||||||
| Advisor Class | |||||||||||||||
| Actual | $1,000.00 | $1,035.90 | $6.06 | ||||||||||||
| Hypothetical** | $1,000.00 | $1,019.26 | $6.01 | ||||||||||||
| A Class | |||||||||||||||
| Actual | $1,000.00 | $1,036.50 | $5.39 | ||||||||||||
| Hypothetical** | $1,000.00 | $1,019.91 | $5.35 | ||||||||||||
| C Class | |||||||||||||||
| Actual | $1,000.00 | $1,032.60 | $9.07 | ||||||||||||
| Hypothetical** | $1,000.00 | $1,016.28 | $9.00 | ||||||||||||
| * | Expenses are equal to the Fund’s annualized expense ratios for the six-month period of 0.72%, 0.80%, 1.01%, 1.18%, 1.05%, and 1.77% for the R5, Y, Investor, Advisor, A, and C Classes, respectively, multiplied by the average account value over the period, multiplied by the number derived by dividing the number of days in the most recent fiscal half-year (184) by days in the year (365) to reflect the half-year period. |
| ** | 5% return before expenses. |
| American Beacon Mid-Cap Value Fund |
| ||||||||||||||
| Beginning Account Value 5/1/2021 | Ending Account Value 10/31/2021 | Expenses Paid During Period 5/1/2021-10/31/2021* | |||||||||||||
| R5 Class | |||||||||||||||
| Actual | $1,000.00 | $1,023.10 | $4.64 | ||||||||||||
| Hypothetical** | $1,000.00 | $1,020.62 | $4.63 | ||||||||||||
| Y Class | |||||||||||||||
| Actual | $1,000.00 | $1,022.80 | $5.05 | ||||||||||||
| Hypothetical** | $1,000.00 | $1,020.22 | $5.04 | ||||||||||||
| Investor Class | |||||||||||||||
| Actual | $1,000.00 | $1,021.70 | $5.96 | ||||||||||||
| Hypothetical** | $1,000.00 | $1,019.31 | $5.96 | ||||||||||||
| Advisor Class | |||||||||||||||
| Actual | $1,000.00 | $1,020.00 | $7.59 | ||||||||||||
| Hypothetical** | $1,000.00 | $1,017.69 | $7.58 | ||||||||||||
| A Class | |||||||||||||||
| Actual | $1,000.00 | $1,021.50 | $6.42 | ||||||||||||
| Hypothetical** | $1,000.00 | $1,018.85 | $6.41 | ||||||||||||
| C Class | |||||||||||||||
| Actual | $1,000.00 | $1,017.50 | $10.22 | ||||||||||||
| Hypothetical** | $1,000.00 | $1,015.07 | $10.21 | ||||||||||||
| R6 Class | |||||||||||||||
| Actual | $1,000.00 | $1,023.00 | $4.59 | ||||||||||||
| Hypothetical** | $1,000.00 | $1,020.67 | $4.58 | ||||||||||||
| * | Expenses are equal to the Fund’s annualized expense ratios for the six-month period of 0.91%, 0.99%, 1.17%, 1.49%, 1.26%, 2.01%, and 0.90% for the R5, Y, Investor, Advisor, A, C, and R6 Classes, respectively, multiplied by the average account value over the period, multiplied by the number derived by dividing the number of days in the most recent fiscal half-year (184) by days in the year (365) to reflect the half-year period. |
| ** | 5% return before expenses. |
11
Report of Independent Registered Public Accounting Firm
To the Shareholders of American Beacon Balanced Fund and American Beacon Mid-Cap Value Fund and the Board of Trustees of American Beacon Funds
Opinion on the Financial Statements
We have audited the accompanying statements of assets and liabilities of American Beacon Balanced Fund and American Beacon Mid-Cap Value Fund (collectively referred to as the “Funds”), (two of the funds constituting American Beacon Funds (the “Trust”)), including the schedules of investments, as of October 31, 2021, and the related statements of operations for the year then ended, the statements of changes in net assets for each of the two years in the period then ended, the financial highlights for each of the five years in the period then ended and the related notes (collectively referred to as the “financial statements”). In our opinion, the financial statements present fairly, in all material respects, the financial position of each of the Funds (two of the funds constituting American Beacon Funds) at October 31, 2021, the results of their operations for the year then ended, the changes in their net assets for each of the two years in the period then ended and their financial highlights for each of the five years in the period then ended, in conformity with U.S. generally accepted accounting principles.
Basis for Opinion
These financial statements are the responsibility of the Trust’s management. Our responsibility is to express an opinion on each of the Funds’ financial statements based on our audits. We are a public accounting firm registered with the Public Company Accounting Oversight Board (United States) (“PCAOB”) and are required to be independent with respect to the Trust in accordance with the U.S. federal securities laws and the applicable rules and regulations of the Securities and Exchange Commission and the PCAOB.
We conducted our audits in accordance with the standards of the PCAOB. Those standards require that we plan and perform the audit to obtain reasonable assurance about whether the financial statements are free of material misstatement, whether due to error or fraud. The Trust is not required to have, nor were we engaged to perform, an audit of the Trust’s internal control over financial reporting. As part of our audits we are required to obtain an understanding of internal control over financial reporting, but not for the purpose of expressing an opinion on the effectiveness of the Trust’s internal control over financial reporting. Accordingly, we express no such opinion.
Our audits included performing procedures to assess the risks of material misstatement of the financial statements, whether due to error or fraud, and performing procedures that respond to those risks. Such procedures included examining, on a test basis, evidence regarding the amounts and disclosures in the financial statements. Our procedures included confirmation of securities owned as of October 31, 2021, by correspondence with the custodian and brokers or by other appropriate auditing procedures where replies from brokers were not received. Our audits also included evaluating the accounting principles used and significant estimates made by management, as well as evaluating the overall presentation of the financial statements. We believe that our audits provide a reasonable basis for our opinion.

We have served as the auditor of one or more American Beacon investment companies since 1987.
Dallas, Texas
December 30, 2021
12
American Beacon Balanced FundSM
Schedule of Investments
October 31, 2021
| Shares | Fair Value | ||||||||||||||
| COMMON STOCKS - 60.44% | |||||||||||||||
| Communication Services - 4.05% | |||||||||||||||
| Interactive Media & Services - 0.90% | |||||||||||||||
| Alphabet, Inc., Class AA | 570 | $ | 1,687,724 | ||||||||||||
|
| ||||||||||||||
| Media - 2.38% | |||||||||||||||
| Altice USA, Inc., Class AA | 41,828 | 681,796 | |||||||||||||
| Comcast Corp., Class A | 34,606 | 1,779,787 | |||||||||||||
| Discovery, Inc., Class CA | 43,599 | 983,593 | |||||||||||||
| News Corp., Class A | 34,200 | 783,180 | |||||||||||||
| Omnicom Group, Inc. | 3,886 | 264,559 | |||||||||||||
|
| ||||||||||||||
| 4,492,915 | |||||||||||||||
|
| ||||||||||||||
| Wireless Telecommunication Services - 0.77% | |||||||||||||||
| T-Mobile US, Inc.A | 6,238 | 717,557 | |||||||||||||
| Vodafone Group PLC, ADR | 49,632 | 741,999 | |||||||||||||
|
| ||||||||||||||
| 1,459,556 | |||||||||||||||
|
| ||||||||||||||
Total Communication Services | 7,640,195 | ||||||||||||||
|
| ||||||||||||||
| Consumer Discretionary - 6.25% | |||||||||||||||
| Auto Components - 0.95% | |||||||||||||||
| Adient PLCA | 5,232 | 217,756 | |||||||||||||
| Goodyear Tire & Rubber Co.A | 17,659 | 337,640 | |||||||||||||
| Magna International, Inc.B | 15,304 | 1,244,215 | |||||||||||||
|
| ||||||||||||||
| 1,799,611 | |||||||||||||||
|
| ||||||||||||||
| Automobiles - 0.98% | |||||||||||||||
| General Motors Co.A | 29,242 | 1,591,642 | |||||||||||||
| Harley-Davidson, Inc. | 7,041 | 256,926 | |||||||||||||
|
| ||||||||||||||
| 1,848,568 | |||||||||||||||
|
| ||||||||||||||
| Hotels, Restaurants & Leisure - 1.23% | |||||||||||||||
| Aramark | 14,589 | 532,207 | |||||||||||||
| Booking Holdings, Inc.A | 200 | 484,156 | |||||||||||||
| Las Vegas Sands Corp.A | 33,429 | 1,297,379 | |||||||||||||
|
| ||||||||||||||
| 2,313,742 | |||||||||||||||
|
| ||||||||||||||
| Household Durables - 0.31% | |||||||||||||||
| Lennar Corp., Class A | 5,881 | 587,688 | |||||||||||||
|
| ||||||||||||||
| Multiline Retail - 0.85% | |||||||||||||||
| Dollar General Corp. | 7,287 | 1,614,216 | |||||||||||||
|
| ||||||||||||||
| Specialty Retail - 1.31% | |||||||||||||||
| Advance Auto Parts, Inc. | 6,109 | 1,377,702 | |||||||||||||
| Lowe’s Cos., Inc. | 4,654 | 1,088,198 | |||||||||||||
|
| ||||||||||||||
| 2,465,900 | |||||||||||||||
|
| ||||||||||||||
| Textiles, Apparel & Luxury Goods - 0.62% | |||||||||||||||
| Ralph Lauren Corp. | 9,161 | 1,165,005 | |||||||||||||
|
| ||||||||||||||
Total Consumer Discretionary | 11,794,730 | ||||||||||||||
|
| ||||||||||||||
| Consumer Staples - 1.51% | |||||||||||||||
| Beverages - 0.77% | |||||||||||||||
| Coca-Cola Europacific Partners PLC | 27,397 | 1,442,452 | |||||||||||||
|
| ||||||||||||||
| Food Products - 0.26% | |||||||||||||||
| Mondelez International, Inc., Class A | 8,200 | 498,068 | |||||||||||||
|
| ||||||||||||||
| Personal Products - 0.48% | |||||||||||||||
| Unilever PLC, ADR | 17,000 | 910,860 | |||||||||||||
|
| ||||||||||||||
Total Consumer Staples | 2,851,380 | ||||||||||||||
|
| ||||||||||||||
See accompanying notes
13
American Beacon Balanced FundSM
Schedule of Investments
October 31, 2021
| Shares | Fair Value | ||||||||||||||
| COMMON STOCKS - 60.44% (continued) | |||||||||||||||
| Energy - 6.77% | |||||||||||||||
| Energy Equipment & Services - 1.14% | |||||||||||||||
| Baker Hughes Co. | 15,800 | $ | 396,264 | ||||||||||||
| Halliburton Co. | 27,000 | 674,730 | |||||||||||||
| NOV, Inc.A | 48,900 | 685,578 | |||||||||||||
| Schlumberger NV | 12,500 | 403,250 | |||||||||||||
|
| ||||||||||||||
| 2,159,822 | |||||||||||||||
|
| ||||||||||||||
| Oil, Gas & Consumable Fuels - 5.63% | |||||||||||||||
| APA Corp. | 44,614 | 1,169,333 | |||||||||||||
| Hess Corp. | 36,311 | 2,998,199 | |||||||||||||
| Marathon Oil Corp. | 112,331 | 1,833,242 | |||||||||||||
| Marathon Petroleum Corp. | 7,631 | 503,112 | |||||||||||||
| Murphy Oil Corp. | 7,000 | 194,810 | |||||||||||||
| Phillips 66 | 24,878 | 1,860,377 | |||||||||||||
| Pioneer Natural Resources Co. | 5,798 | 1,084,110 | |||||||||||||
| Royal Dutch Shell PLC, Class A, ADR | 21,135 | 970,519 | |||||||||||||
|
| ||||||||||||||
| 10,613,702 | |||||||||||||||
|
| ||||||||||||||
Total Energy | 12,773,524 | ||||||||||||||
|
| ||||||||||||||
| Financials - 14.99% | |||||||||||||||
| Banks - 6.64% | |||||||||||||||
| Bank of America Corp. | 9,498 | 453,814 | |||||||||||||
| CIT Group, Inc. | 8,750 | 433,387 | |||||||||||||
| Citigroup, Inc. | 48,617 | 3,362,352 | |||||||||||||
| Citizens Financial Group, Inc. | 14,868 | 704,446 | |||||||||||||
| JPMorgan Chase & Co. | 6,836 | 1,161,368 | |||||||||||||
| US Bancorp | 23,461 | 1,416,341 | |||||||||||||
| Wells Fargo & Co. | 97,443 | 4,985,184 | |||||||||||||
|
| ||||||||||||||
| 12,516,892 | |||||||||||||||
|
| ||||||||||||||
| Capital Markets - 3.01% | |||||||||||||||
| Bank of New York Mellon Corp. | 17,615 | 1,042,808 | |||||||||||||
| Credit Suisse Group AG, ADRB | 56,100 | 578,391 | |||||||||||||
| Goldman Sachs Group, Inc. | 5,525 | 2,283,759 | |||||||||||||
| Northern Trust Corp. | 8,963 | 1,102,808 | |||||||||||||
| State Street Corp. | 6,806 | 670,731 | |||||||||||||
|
| ||||||||||||||
| 5,678,497 | |||||||||||||||
|
| ||||||||||||||
| Consumer Finance - 0.91% | |||||||||||||||
| American Express Co. | 5,976 | 1,038,509 | |||||||||||||
| SLM Corp. | 36,863 | 676,436 | |||||||||||||
|
| ||||||||||||||
| 1,714,945 | |||||||||||||||
|
| ||||||||||||||
| Diversified Financial Services - 0.63% | |||||||||||||||
| Berkshire Hathaway, Inc., Class BA | 3,100 | 889,731 | |||||||||||||
| Equitable Holdings, Inc. | 8,900 | 298,150 | |||||||||||||
|
| ||||||||||||||
| 1,187,881 | |||||||||||||||
|
| ||||||||||||||
| Insurance - 3.80% | |||||||||||||||
| American International Group, Inc. | 65,791 | 3,887,590 | |||||||||||||
| Chubb Ltd. | 2,370 | 463,051 | |||||||||||||
| Hartford Financial Services Group, Inc. | 10,200 | 743,886 | |||||||||||||
| Travelers Cos., Inc. | 5,657 | 910,098 | |||||||||||||
| Willis Towers Watson PLC | 4,799 | 1,162,702 | |||||||||||||
|
| ||||||||||||||
| 7,167,327 | |||||||||||||||
|
| ||||||||||||||
Total Financials | 28,265,542 | ||||||||||||||
|
| ||||||||||||||
| Health Care - 8.30% | |||||||||||||||
| Health Care Equipment & Supplies - 0.93% | |||||||||||||||
| Boston Scientific Corp.A | 6,900 | 297,597 | |||||||||||||
See accompanying notes
14
American Beacon Balanced FundSM
Schedule of Investments
October 31, 2021
| Shares | Fair Value | ||||||||||||||
| COMMON STOCKS - 60.44% (continued) | |||||||||||||||
| Health Care - 8.30% (continued) | |||||||||||||||
| Health Care Equipment & Supplies - 0.93% (continued) | |||||||||||||||
| Medtronic PLC | 9,580 | $ | 1,148,259 | ||||||||||||
| Zimmer Biomet Holdings, Inc. | 2,132 | 305,132 | |||||||||||||
|
| ||||||||||||||
| 1,750,988 | |||||||||||||||
|
| ||||||||||||||
| Health Care Providers & Services - 4.90% | |||||||||||||||
| Anthem, Inc. | 8,986 | 3,910,078 | |||||||||||||
| Centene Corp.A | 10,200 | 726,648 | |||||||||||||
| CVS Health Corp. | 17,772 | 1,586,684 | |||||||||||||
| HCA Healthcare, Inc. | 1,400 | 350,644 | |||||||||||||
| Humana, Inc. | 1,000 | 463,160 | |||||||||||||
| UnitedHealth Group, Inc. | 4,784 | 2,202,889 | |||||||||||||
|
| ||||||||||||||
| 9,240,103 | |||||||||||||||
|
| ||||||||||||||
| Pharmaceuticals - 2.47% | |||||||||||||||
| Bristol-Myers Squibb Co. | 5,500 | 321,200 | |||||||||||||
| GlaxoSmithKline PLC, ADRB | 18,743 | 793,391 | |||||||||||||
| Merck & Co., Inc. | 18,687 | 1,645,391 | |||||||||||||
| Perrigo Co. PLC | 31,849 | 1,437,982 | |||||||||||||
| Sanofi, ADR | 9,203 | 464,107 | |||||||||||||
|
| ||||||||||||||
| 4,662,071 | |||||||||||||||
|
| ||||||||||||||
Total Health Care | 15,653,162 | ||||||||||||||
|
| ||||||||||||||
| Industrials - 8.27% | |||||||||||||||
| Aerospace & Defense - 1.65% | |||||||||||||||
| General Dynamics Corp. | 6,313 | 1,279,961 | |||||||||||||
| Raytheon Technologies Corp. | 20,584 | 1,829,094 | |||||||||||||
|
| ||||||||||||||
| 3,109,055 | |||||||||||||||
|
| ||||||||||||||
| Air Freight & Logistics - 0.62% | |||||||||||||||
| FedEx Corp. | 5,000 | 1,177,650 | |||||||||||||
|
| ||||||||||||||
| Construction & Engineering - 0.88% | |||||||||||||||
| AECOMA | 21,364 | 1,460,657 | |||||||||||||
| Fluor Corp.A | 9,800 | 190,512 | |||||||||||||
|
| ||||||||||||||
| 1,651,169 | |||||||||||||||
|
| ||||||||||||||
| Electrical Equipment - 0.59% | |||||||||||||||
| Emerson Electric Co. | 5,131 | 497,758 | |||||||||||||
| Vertiv Holdings Co. | 24,099 | 618,863 | |||||||||||||
|
| ||||||||||||||
| 1,116,621 | |||||||||||||||
|
| ||||||||||||||
| Industrial Conglomerates - 1.40% | |||||||||||||||
| General Electric Co. | 25,262 | 2,649,226 | |||||||||||||
|
| ||||||||||||||
| Machinery - 2.54% | |||||||||||||||
| CNH Industrial NVB | 58,580 | 1,002,304 | |||||||||||||
| Cummins, Inc. | 3,472 | 832,724 | |||||||||||||
| Deere & Co. | 2,915 | 997,834 | |||||||||||||
| PACCAR, Inc. | 6,739 | 603,949 | |||||||||||||
| Stanley Black & Decker, Inc. | 7,525 | 1,352,468 | |||||||||||||
|
| ||||||||||||||
| 4,789,279 | |||||||||||||||
|
| ||||||||||||||
| Road & Rail - 0.59% | |||||||||||||||
| JB Hunt Transport Services, Inc. | 5,622 | 1,108,602 | |||||||||||||
|
| ||||||||||||||
Total Industrials | 15,601,602 | ||||||||||||||
|
| ||||||||||||||
See accompanying notes
15
American Beacon Balanced FundSM
Schedule of Investments
October 31, 2021
| Shares | Fair Value | ||||||||||||||
| COMMON STOCKS - 60.44% (continued) | |||||||||||||||
| Information Technology - 5.94% | |||||||||||||||
| Communications Equipment - 0.93% | |||||||||||||||
| F5 Networks, Inc.A | 5,700 | $ | 1,203,555 | ||||||||||||
| Telefonaktiebolaget LM Ericsson, ADRB | 50,020 | 543,717 | |||||||||||||
|
| ||||||||||||||
| 1,747,272 | |||||||||||||||
|
| ||||||||||||||
| Electronic Equipment, Instruments & Components - 0.74% | |||||||||||||||
| Corning, Inc. | 19,495 | 693,437 | |||||||||||||
| TE Connectivity Ltd. | 4,758 | 694,668 | |||||||||||||
|
| ||||||||||||||
| 1,388,105 | |||||||||||||||
|
| ||||||||||||||
| IT Services - 0.83% | |||||||||||||||
| Cognizant Technology Solutions Corp., Class A | 19,976 | 1,559,926 | |||||||||||||
|
| ||||||||||||||
| Semiconductors & Semiconductor Equipment - 1.30% | |||||||||||||||
| Broadcom, Inc. | 2,784 | 1,480,169 | |||||||||||||
| QUALCOMM, Inc. | 5,301 | 705,245 | |||||||||||||
| Texas Instruments, Inc. | 1,431 | 268,284 | |||||||||||||
|
| ||||||||||||||
| 2,453,698 | |||||||||||||||
|
| ||||||||||||||
| Software - 1.81% | |||||||||||||||
| Microsoft Corp. | 4,545 | 1,507,213 | |||||||||||||
| Oracle Corp. | 19,958 | 1,914,771 | |||||||||||||
|
| ||||||||||||||
| 3,421,984 | |||||||||||||||
|
| ||||||||||||||
| Technology Hardware, Storage & Peripherals - 0.33% | |||||||||||||||
| Hewlett Packard Enterprise Co. | 43,008 | 630,067 | |||||||||||||
|
| ||||||||||||||
Total Information Technology | 11,201,052 | ||||||||||||||
|
| ||||||||||||||
| Materials - 2.24% | |||||||||||||||
| Chemicals - 2.11% | |||||||||||||||
| Air Products and Chemicals, Inc. | 2,207 | 661,681 | |||||||||||||
| Axalta Coating Systems Ltd.A | 18,256 | 569,404 | |||||||||||||
| Corteva, Inc. | 23,128 | 997,973 | |||||||||||||
| International Flavors & Fragrances, Inc. | 11,862 | 1,749,052 | |||||||||||||
|
| ||||||||||||||
| 3,978,110 | |||||||||||||||
|
| ||||||||||||||
| Containers & Packaging - 0.13% | |||||||||||||||
| International Paper Co. | 4,825 | 239,658 | |||||||||||||
|
| ||||||||||||||
Total Materials | 4,217,768 | ||||||||||||||
|
| ||||||||||||||
| Real Estate - 0.88% | |||||||||||||||
| Equity Real Estate Investment Trusts (REITs) - 0.88% | |||||||||||||||
| MGM Growth Properties LLC, Class A | 41,893 | 1,649,746 | |||||||||||||
|
| ||||||||||||||
| Utilities - 1.24% | |||||||||||||||
| Electric Utilities - 1.24% | |||||||||||||||
| Exelon Corp. | 12,044 | 640,620 | |||||||||||||
| PPL Corp. | 49,347 | 1,421,194 | |||||||||||||
| Southern Co. | 4,343 | 270,656 | |||||||||||||
|
| ||||||||||||||
| 2,332,470 | |||||||||||||||
|
| ||||||||||||||
Total Utilities | 2,332,470 | ||||||||||||||
|
| ||||||||||||||
Total Common Stocks (Cost $79,884,628) | 113,981,171 | ||||||||||||||
|
| ||||||||||||||
See accompanying notes
16
American Beacon Balanced FundSM
Schedule of Investments
October 31, 2021
| Principal Amount | Fair Value | ||||||||||||||
| CORPORATE OBLIGATIONS - 15.04% | |||||||||||||||
| Basic Materials - 0.13% | |||||||||||||||
| Chemicals - 0.07% | |||||||||||||||
| EI du Pont de Nemours and Co., 1.700%, Due 7/15/2025 | $ | 70,000 | $ | 70,939 | |||||||||||
| LYB International Finance LLC, 2.250%, Due 10/1/2030 | 60,000 | 59,772 | |||||||||||||
|
| ||||||||||||||
| 130,711 | |||||||||||||||
|
| ||||||||||||||
| Forest Products & Paper - 0.03% | |||||||||||||||
| International Paper Co., 6.000%, Due 11/15/2041 | 40,000 | 56,543 | |||||||||||||
|
| ||||||||||||||
| Iron/Steel - 0.03% | |||||||||||||||
| Nucor Corp., 4.000%, Due 8/1/2023 | 55,000 | 57,795 | |||||||||||||
|
| ||||||||||||||
Total Basic Materials | 245,049 | ||||||||||||||
|
| ||||||||||||||
| Communications - 1.45% | |||||||||||||||
| Internet - 0.39% | |||||||||||||||
| Amazon.com, Inc., | |||||||||||||||
0.800%, Due 6/3/2025 | 350,000 | 346,587 | |||||||||||||
1.200%, Due 6/3/2027 | 250,000 | 245,878 | |||||||||||||
3.875%, Due 8/22/2037 | 120,000 | 140,971 | |||||||||||||
|
| ||||||||||||||
| 733,436 | |||||||||||||||
|
| ||||||||||||||
| Media - 0.42% | |||||||||||||||
| Charter Communications Operating LLC / Charter Communications Operating Capital, | |||||||||||||||
2.800%, Due 4/1/2031 | 50,000 | 49,804 | |||||||||||||
3.500%, Due 3/1/2042 | 70,000 | 68,387 | |||||||||||||
3.700%, Due 4/1/2051 | 60,000 | 58,852 | |||||||||||||
| Comcast Corp., | |||||||||||||||
3.150%, Due 3/1/2026 | 59,000 | 63,173 | |||||||||||||
3.400%, Due 4/1/2030 | 80,000 | 87,268 | |||||||||||||
1.950%, Due 1/15/2031 | 75,000 | 73,211 | |||||||||||||
6.550%, Due 7/1/2039 | 217,000 | 325,579 | |||||||||||||
2.887%, Due 11/1/2051C | 64,000 | 62,174 | |||||||||||||
|
| ||||||||||||||
| 788,448 | |||||||||||||||
|
| ||||||||||||||
| Telecommunications - 0.64% | |||||||||||||||
| AT&T, Inc., | |||||||||||||||
0.900%, Due 3/25/2024 | 110,000 | 110,008 | |||||||||||||
3.400%, Due 5/15/2025 | 169,000 | 180,585 | |||||||||||||
2.250%, Due 2/1/2032 | 65,000 | 62,707 | |||||||||||||
5.350%, Due 9/1/2040 | 65,000 | 82,578 | |||||||||||||
T-Mobile USA, Inc., 3.875%, Due 4/15/2030 | 270,000 | 295,366 | |||||||||||||
| Verizon Communications, Inc., | |||||||||||||||
2.100%, Due 3/22/2028 | 90,000 | 90,287 | |||||||||||||
4.329%, Due 9/21/2028 | 180,000 | 205,558 | |||||||||||||
4.500%, Due 8/10/2033 | 50,000 | 59,067 | |||||||||||||
2.850%, Due 9/3/2041 | 65,000 | 63,348 | |||||||||||||
3.550%, Due 3/22/2051 | 55,000 | 59,209 | |||||||||||||
|
| ||||||||||||||
| 1,208,713 | |||||||||||||||
|
| ||||||||||||||
Total Communications | 2,730,597 | ||||||||||||||
|
| ||||||||||||||
| Consumer, Cyclical - 1.36% | |||||||||||||||
| Airlines - 0.04% | |||||||||||||||
| American Airlines Pass Through Trust, 3.150%, Due 8/15/2033, Series AA | 78,091 | 80,124 | |||||||||||||
|
| ||||||||||||||
See accompanying notes
17
American Beacon Balanced FundSM
Schedule of Investments
October 31, 2021
| Principal Amount | Fair Value | ||||||||||||||
| CORPORATE OBLIGATIONS - 15.04% (continued) | |||||||||||||||
| Consumer, Cyclical - 1.36% (continued) | |||||||||||||||
| Auto Manufacturers - 0.39% | |||||||||||||||
| American Honda Finance Corp., 2.000%, Due 3/24/2028 | $ | 55,000 | $ | 55,564 | |||||||||||
| Cummins, Inc., 0.750%, Due 9/1/2025 | 65,000 | 64,108 | |||||||||||||
| General Motors Financial Co., Inc., | |||||||||||||||
1.250%, Due 1/8/2026 | 45,000 | 44,125 | |||||||||||||
1.500%, Due 6/10/2026 | 60,000 | 59,117 | |||||||||||||
| Toyota Motor Credit Corp., 1.800%, Due 2/13/2025 | 500,000 | 510,444 | |||||||||||||
|
| ||||||||||||||
| 733,358 | |||||||||||||||
|
| ||||||||||||||
| Home Furnishings - 0.03% | |||||||||||||||
| Whirlpool Corp., 4.600%, Due 5/15/2050 | 50,000 | 62,466 | |||||||||||||
|
| ||||||||||||||
| Leisure Time - 0.06% | |||||||||||||||
| Brunswick Corp., 0.850%, Due 8/18/2024 | 110,000 | 108,961 | |||||||||||||
|
| ||||||||||||||
| Lodging - 0.03% | |||||||||||||||
| Marriott International, Inc., 2.850%, Due 4/15/2031, Series HH | 55,000 | 55,422 | |||||||||||||
|
| ||||||||||||||
| Retail - 0.81% | |||||||||||||||
| Dollar General Corp., 4.125%, Due 5/1/2028 | 40,000 | 45,258 | |||||||||||||
| Home Depot, Inc., | |||||||||||||||
2.950%, Due 6/15/2029 | 500,000 | 537,177 | |||||||||||||
1.375%, Due 3/15/2031 | 350,000 | 329,013 | |||||||||||||
| O’Reilly Automotive, Inc., 4.350%, Due 6/1/2028 | 80,000 | 91,432 | |||||||||||||
| Starbucks Corp., 2.550%, Due 11/15/2030 | 60,000 | 61,403 | |||||||||||||
| Tractor Supply Co., 1.750%, Due 11/1/2030 | 60,000 | 57,182 | |||||||||||||
| Walmart, Inc., | |||||||||||||||
2.375%, Due 9/24/2029 | 150,000 | 156,736 | |||||||||||||
7.550%, Due 2/15/2030 | 169,000 | 243,122 | |||||||||||||
|
| ||||||||||||||
| 1,521,323 | |||||||||||||||
|
| ||||||||||||||
Total Consumer, Cyclical | 2,561,654 | ||||||||||||||
|
| ||||||||||||||
| Consumer, Non-Cyclical - 2.29% | |||||||||||||||
| Agriculture - 0.03% | |||||||||||||||
| Cargill, Inc., 1.375%, Due 7/23/2023C | 50,000 | 50,640 | |||||||||||||
|
| ||||||||||||||
| Beverages - 0.04% | |||||||||||||||
| Keurig Dr Pepper, Inc., 0.750%, Due 3/15/2024 | 85,000 | 84,681 | |||||||||||||
|
| ||||||||||||||
| Biotechnology - 0.32% | |||||||||||||||
| Amgen, Inc., | |||||||||||||||
3.200%, Due 11/2/2027 | 500,000 | 536,500 | |||||||||||||
4.400%, Due 5/1/2045 | 55,000 | 66,168 | |||||||||||||
|
| ||||||||||||||
| 602,668 | |||||||||||||||
|
| ||||||||||||||
| Commercial Services - 0.11% | |||||||||||||||
| Moody’s Corp., 2.550%, Due 8/18/2060 | 50,000 | 45,016 | |||||||||||||
| Quanta Services, Inc., | |||||||||||||||
2.900%, Due 10/1/2030 | 100,000 | 103,348 | |||||||||||||
3.050%, Due 10/1/2041 | 70,000 | 68,792 | |||||||||||||
|
| ||||||||||||||
| 217,156 | |||||||||||||||
|
| ||||||||||||||
See accompanying notes
18
American Beacon Balanced FundSM
Schedule of Investments
October 31, 2021
| Principal Amount | Fair Value | ||||||||||||||
| CORPORATE OBLIGATIONS - 15.04% (continued) | |||||||||||||||
| Consumer, Non-Cyclical - 2.29% (continued) | |||||||||||||||
| Food - 0.29% | |||||||||||||||
| Mondelez International, Inc., 1.500%, Due 2/4/2031 | $ | 65,000 | $ | 60,961 | |||||||||||
| Nestle Holdings, Inc., 1.150%, Due 1/14/2027C | 500,000 | 491,023 | |||||||||||||
|
| ||||||||||||||
| 551,984 | |||||||||||||||
|
| ||||||||||||||
| Health Care - Products - 0.16% | |||||||||||||||
| Medtronic, Inc., 3.500%, Due 3/15/2025 | 219,000 | 236,063 | |||||||||||||
| Zimmer Biomet Holdings, Inc., 3.550%, Due 4/1/2025 | 60,000 | 63,862 | |||||||||||||
|
| ||||||||||||||
| 299,925 | |||||||||||||||
|
| ||||||||||||||
| Health Care - Services - 0.52% | |||||||||||||||
| Baylor Scott & White Holdings, 2.839%, Due 11/15/2050, Series 2021 | 60,000 | 61,150 | |||||||||||||
| Children’s Health System of Texas, 2.511%, Due 8/15/2050 | 65,000 | 61,761 | |||||||||||||
| Community Health Network, Inc., 3.099%, Due 5/1/2050, Series 20-A | 80,000 | 81,899 | |||||||||||||
| Health Care Service Corp., 3.200%, Due 6/1/2050C | 40,000 | 42,112 | |||||||||||||
| Kaiser Foundation Hospitals, 3.002%, Due 6/1/2051, Series 2021 | 100,000 | 103,808 | |||||||||||||
| Sutter Health, 2.294%, Due 8/15/2030, Series 20A | 95,000 | 95,468 | |||||||||||||
| UnitedHealth Group, Inc., | |||||||||||||||
0.550%, Due 5/15/2024 | 350,000 | 347,484 | |||||||||||||
3.875%, Due 12/15/2028 | 160,000 | 181,134 | |||||||||||||
|
| ||||||||||||||
| 974,816 | |||||||||||||||
|
| ||||||||||||||
| Pharmaceuticals - 0.82% | |||||||||||||||
| AbbVie, Inc., | |||||||||||||||
4.450%, Due 5/14/2046 | 60,000 | 73,156 | |||||||||||||
4.250%, Due 11/21/2049 | 85,000 | 102,113 | |||||||||||||
| Bristol-Myers Squibb Co., | |||||||||||||||
0.750%, Due 11/13/2025 | 350,000 | 343,545 | |||||||||||||
3.400%, Due 7/26/2029 | 650,000 | 715,170 | |||||||||||||
2.350%, Due 11/13/2040 | 60,000 | 57,288 | |||||||||||||
| Cigna Corp., 4.125%, Due 11/15/2025 | 50,000 | 55,002 | |||||||||||||
| CVS Health Corp., | |||||||||||||||
4.300%, Due 3/25/2028 | 39,000 | 44,171 | |||||||||||||
5.050%, Due 3/25/2048 | 30,000 | 39,421 | |||||||||||||
| Viatris, Inc., 3.850%, Due 6/22/2040 | 45,000 | 44,911 | |||||||||||||
| Zoetis, Inc., 3.000%, Due 9/12/2027 | 60,000 | 64,077 | |||||||||||||
|
| ||||||||||||||
| 1,538,854 | |||||||||||||||
|
| ||||||||||||||
Total Consumer, Non-Cyclical | 4,320,724 | ||||||||||||||
|
| ||||||||||||||
| Energy - 0.77% | |||||||||||||||
| Oil & Gas - 0.26% | |||||||||||||||
| Chevron USA, Inc., 2.343%, Due 8/12/2050 | 65,000 | 60,925 | |||||||||||||
| ConocoPhillips, 4.300%, Due 8/15/2028C | 60,000 | 68,848 | |||||||||||||
| Diamondback Energy, Inc. | |||||||||||||||
2.875%, Due 12/1/2024 | 70,000 | 72,840 | |||||||||||||
3.125%, Due 3/24/2031 | 35,000 | 36,163 | |||||||||||||
| EOG Resources, Inc., 4.375%, Due 4/15/2030 | 40,000 | 46,552 | |||||||||||||
| Marathon Petroleum Corp., | |||||||||||||||
4.500%, Due 5/1/2023 | 65,000 | 68,283 | |||||||||||||
5.125%, Due 12/15/2026 | 60,000 | 69,042 | |||||||||||||
| Pioneer Natural Resources Co., | |||||||||||||||
1.900%, Due 8/15/2030 | 45,000 | 42,745 | |||||||||||||
2.150%, Due 1/15/2031 | 25,000 | 24,118 | |||||||||||||
|
| ||||||||||||||
| 489,516 | |||||||||||||||
|
| ||||||||||||||
| Pipelines - 0.51% | |||||||||||||||
| Cheniere Corpus Christi Holdings LLC, 2.742%, Due 12/31/2039C | 65,000 | 63,448 | |||||||||||||
| Columbia Pipeline Group, Inc., 4.500%, Due 6/1/2025 | 61,000 | 67,153 | |||||||||||||
| Energy Transfer LP, 4.250%, Due 4/1/2024 | 38,000 | 40,345 | |||||||||||||
| Enterprise Products Operating LLC, 6.125%, Due 10/15/2039 | 35,000 | 47,991 | |||||||||||||
See accompanying notes
19
American Beacon Balanced FundSM
Schedule of Investments
October 31, 2021
| Principal Amount | Fair Value | ||||||||||||||
| CORPORATE OBLIGATIONS - 15.04% (continued) | |||||||||||||||
| Energy - 0.77% (continued) | |||||||||||||||
| Pipelines - 0.51% (continued) | |||||||||||||||
| MPLX LP, | |||||||||||||||
1.750%, Due 3/1/2026 | $ | 85,000 | $ | 84,680 | |||||||||||
4.125%, Due 3/1/2027 | 45,000 | 49,630 | |||||||||||||
5.200%, Due 3/1/2047 | 31,000 | 38,227 | |||||||||||||
| ONEOK, Inc., 4.550%, Due 7/15/2028 | 65,000 | 73,224 | |||||||||||||
| Phillips 66 Partners LP, | |||||||||||||||
3.550%, Due 10/1/2026 | 33,000 | 35,349 | |||||||||||||
3.750%, Due 3/1/2028 | 40,000 | 43,712 | |||||||||||||
| Sabine Pass Liquefaction LLC, | |||||||||||||||
5.875%, Due 6/30/2026 | 150,000 | 174,116 | |||||||||||||
4.200%, Due 3/15/2028 | 50,000 | 55,461 | |||||||||||||
| Williams Cos., Inc., | |||||||||||||||
2.600%, Due 3/15/2031 | 120,000 | 120,307 | |||||||||||||
5.400%, Due 3/4/2044 | 60,000 | 75,566 | |||||||||||||
|
| ||||||||||||||
| 969,209 | |||||||||||||||
|
| ||||||||||||||
Total Energy | 1,458,725 | ||||||||||||||
|
| ||||||||||||||
| Financial - 4.39% | |||||||||||||||
| Banks - 3.13% | |||||||||||||||
| Bank of America Corp., | |||||||||||||||
4.125%, Due 1/22/2024 | 193,000 | 206,796 | |||||||||||||
1.734%, Due 7/22/2027, (SOFR + 0.960%)D | 350,000 | 347,799 | |||||||||||||
2.087%, Due 6/14/2029, (SOFR + 1.060%)D | 50,000 | 49,463 | |||||||||||||
2.299%, Due 7/21/2032, (SOFR + 1.220%)D | 160,000 | 156,624 | |||||||||||||
6.110%, Due 1/29/2037 | 176,000 | 237,798 | |||||||||||||
5.000%, Due 1/21/2044 | 145,000 | 190,156 | |||||||||||||
| Citigroup, Inc., | |||||||||||||||
1.281%, Due 11/3/2025, (SOFR + 0.528%)D | 40,000 | 40,041 | |||||||||||||
3.400%, Due 5/1/2026 | 350,000 | 376,708 | |||||||||||||
4.412%, Due 3/31/2031, (SOFR + 3.914%)D | 245,000 | 280,900 | |||||||||||||
5.875%, Due 1/30/2042 | 145,000 | 206,818 | |||||||||||||
| Fifth Third Bank NA, 2.250%, Due 2/1/2027 | 500,000 | 514,401 | |||||||||||||
| Goldman Sachs Group, Inc., | |||||||||||||||
5.750%, Due 1/24/2022 | 385,000 | 389,752 | |||||||||||||
1.431%, Due 3/9/2027, (SOFR + 0.798%)D | 125,000 | 123,095 | |||||||||||||
1.542%, Due 9/10/2027, (SOFR + 0.818%)D | 100,000 | 98,342 | |||||||||||||
2.615%, Due 4/22/2032, (SOFR + 1.281%)D | 55,000 | 55,258 | |||||||||||||
| JPMorgan Chase & Co., | |||||||||||||||
3.625%, Due 5/13/2024 | 434,000 | 463,683 | |||||||||||||
2.301%, Due 10/15/2025, (SOFR + 1.160%)D | 180,000 | 185,270 | |||||||||||||
3.782%, Due 2/1/2028, (3-mo. USD LIBOR + 1.337%)D | 105,000 | 114,462 | |||||||||||||
3.882%, Due 7/24/2038, (3-mo. USD LIBOR + 1.360%)D | 90,000 | 102,790 | |||||||||||||
5.500%, Due 10/15/2040 | 313,000 | 425,088 | |||||||||||||
| Morgan Stanley, | |||||||||||||||
3.591%, Due 7/22/2028, (3-mo. USD LIBOR + 1.340%)D | 90,000 | 97,325 | |||||||||||||
1.794%, Due 2/13/2032, (SOFR + 1.034%)D | 115,000 | 108,396 | |||||||||||||
0.864%, Due 10/21/2025, Series I, (SOFR + 0.745%)D | 35,000 | 34,634 | |||||||||||||
| PNC Financial Services Group, Inc., | |||||||||||||||
3.500%, Due 1/23/2024 | 80,000 | 84,451 | |||||||||||||
2.550%, Due 1/22/2030 | 500,000 | 516,614 | |||||||||||||
3.400%, Due 9/15/2026, Series T, (5-Yr. CMT + 2.595%)D | 80,000 | 78,900 | |||||||||||||
| State Street Corp., | |||||||||||||||
2.354%, Due 11/1/2025, (SOFR + 0.940%)D | 65,000 | 67,468 | |||||||||||||
2.200%, Due 3/3/2031 | 55,000 | 54,647 | |||||||||||||
| Truist Financial Corp., 1.267%, Due 3/2/2027, (SOFR + 0.609%)D | 55,000 | 54,211 | |||||||||||||
| Wells Fargo & Co., | |||||||||||||||
2.572%, Due 2/11/2031, (SOFR + 1.262%)D | 160,000 | 161,915 | |||||||||||||
4.750%, Due 12/7/2046 | 60,000 | 75,968 | |||||||||||||
|
| ||||||||||||||
| 5,899,773 | |||||||||||||||
|
| ||||||||||||||
| Diversified Financial Services - 0.17% | |||||||||||||||
| American Express Co., 4.200%, Due 11/6/2025 | 60,000 | 66,685 | |||||||||||||
| CBOE Global Markets, Inc., 3.650%, Due 1/12/2027 | 60,000 | 65,753 | |||||||||||||
| Charles Schwab Corp., | |||||||||||||||
0.750%, Due 3/18/2024 | 45,000 | 44,930 | |||||||||||||
3.250%, Due 5/22/2029 | 65,000 | 70,673 | |||||||||||||
| Visa, Inc., 3.150%, Due 12/14/2025 | 60,000 | 64,477 | |||||||||||||
|
| ||||||||||||||
| 312,518 | |||||||||||||||
|
| ||||||||||||||
See accompanying notes
20
American Beacon Balanced FundSM
Schedule of Investments
October 31, 2021
| Principal Amount | Fair Value | ||||||||||||||
| CORPORATE OBLIGATIONS - 15.04% (continued) | |||||||||||||||
| Financial - 4.39% (continued) | |||||||||||||||
| Insurance - 0.56% | |||||||||||||||
| Chubb INA Holdings, Inc., 3.350%, Due 5/3/2026 | $ | 65,000 | $ | 70,289 | |||||||||||
| CNA Financial Corp., 2.050%, Due 8/15/2030 | 55,000 | 53,699 | |||||||||||||
| Fidelity National Financial, Inc., 3.200%, Due 9/17/2051 | 65,000 | 63,214 | |||||||||||||
| MetLife, Inc., | |||||||||||||||
6.375%, Due 6/15/2034 | 169,000 | 238,062 | |||||||||||||
4.721%, Due 12/15/2044 | 193,000 | 247,180 | |||||||||||||
| Prudential Financial, Inc., 4.600%, Due 5/15/2044 | 313,000 | 394,303 | |||||||||||||
|
| ||||||||||||||
| 1,066,747 | |||||||||||||||
|
| ||||||||||||||
| REITS - 0.53% | |||||||||||||||
| Alexandria Real Estate Equities, Inc., 1.875%, Due 2/1/2033 | 65,000 | 61,011 | |||||||||||||
| American Tower Corp., 2.300%, Due 9/15/2031 | 90,000 | 88,011 | |||||||||||||
| Camden Property Trust, 3.150%, Due 7/1/2029 | 60,000 | 64,532 | |||||||||||||
| Crown Castle International Corp., | |||||||||||||||
3.800%, Due 2/15/2028 | 60,000 | 65,817 | |||||||||||||
2.900%, Due 4/1/2041 | 55,000 | 53,029 | |||||||||||||
| Digital Realty Trust LP, 3.700%, Due 8/15/2027 | 55,000 | 60,252 | |||||||||||||
| ERP Operating LP, 1.850%, Due 8/1/2031 | 75,000 | 72,479 | |||||||||||||
| Healthpeak Properties, Inc., 3.250%, Due 7/15/2026 | 35,000 | 37,449 | |||||||||||||
| National Retail Properties, Inc., 3.500%, Due 4/15/2051 | 45,000 | 47,905 | |||||||||||||
| Omega Healthcare Investors, Inc., 3.250%, Due 4/15/2033 | 80,000 | 78,933 | |||||||||||||
| Prologis LP, 1.250%, Due 10/15/2030 | 50,000 | 46,624 | |||||||||||||
| Simon Property Group LP, 3.375%, Due 10/1/2024 | 313,000 | 332,545 | |||||||||||||
|
| ||||||||||||||
| 1,008,587 | |||||||||||||||
|
| ||||||||||||||
Total Financial | 8,287,625 | ||||||||||||||
|
| ||||||||||||||
| Industrial - 1.54% | |||||||||||||||
| Aerospace/Defense - 0.33% | |||||||||||||||
| Boeing Co., 2.750%, Due 2/1/2026 | 75,000 | 77,594 | |||||||||||||
| General Dynamics Corp., 3.500%, Due 5/15/2025 | 75,000 | 80,662 | |||||||||||||
| Northrop Grumman Corp., 3.850%, Due 4/15/2045 | 55,000 | 63,834 | |||||||||||||
| Raytheon Technologies Corp., 6.125%, Due 7/15/2038 | 282,000 | 398,732 | |||||||||||||
|
| ||||||||||||||
| 620,822 | |||||||||||||||
|
| ||||||||||||||
| Building Materials - 0.11% | |||||||||||||||
| Carrier Global Corp., 2.242%, Due 2/15/2025 | 50,000 | 51,336 | |||||||||||||
| Martin Marietta Materials, Inc., 0.650%, Due 7/15/2023 | 55,000 | 54,992 | |||||||||||||
| Vulcan Materials Co., 3.500%, Due 6/1/2030 | 95,000 | 103,686 | |||||||||||||
|
| ||||||||||||||
| 210,014 | |||||||||||||||
|
| ||||||||||||||
| Environmental Control - 0.03% | |||||||||||||||
| Waste Connections, Inc., 2.200%, Due 1/15/2032 | 65,000 | 63,847 | |||||||||||||
|
| ||||||||||||||
| Machinery - Construction & Mining - 0.23% | |||||||||||||||
| Caterpillar Financial Services Corp., 1.150%, Due 9/14/2026 | 440,000 | 434,293 | |||||||||||||
|
| ||||||||||||||
| Machinery - Diversified - 0.28% | |||||||||||||||
| John Deere Capital Corp., 2.450%, Due 1/9/2030 | 500,000 | 518,753 | |||||||||||||
|
| ||||||||||||||
| Metal Fabricate/Hardware - 0.03% | |||||||||||||||
| Precision Castparts Corp., 3.250%, Due 6/15/2025 | 60,000 | 64,247 | |||||||||||||
|
| ||||||||||||||
| Miscellaneous Manufacturing - 0.11% | |||||||||||||||
| Carlisle Cos., Inc., 2.200%, Due 3/1/2032 | 65,000 | 62,783 | |||||||||||||
| General Electric Co., | |||||||||||||||
3.450%, Due 5/15/2024 | 65,000 | 68,631 | |||||||||||||
3.450%, Due 5/1/2027 | 65,000 | 70,892 | |||||||||||||
|
| ||||||||||||||
| 202,306 | |||||||||||||||
|
| ||||||||||||||
| Packaging & Containers - 0.09% | |||||||||||||||
| Amcor Flexibles North America, Inc., 2.690%, Due 5/25/2031 | 55,000 | 55,874 | |||||||||||||
| Berry Global, Inc., 1.650%, Due 1/15/2027 | 110,000 | 107,600 | |||||||||||||
|
| ||||||||||||||
| 163,474 | |||||||||||||||
|
| ||||||||||||||
See accompanying notes
21
American Beacon Balanced FundSM
Schedule of Investments
October 31, 2021
| Principal Amount | Fair Value | ||||||||||||||
| CORPORATE OBLIGATIONS - 15.04% (continued) | |||||||||||||||
| Industrial - 1.54% (continued) | |||||||||||||||
| Transportation - 0.33% | |||||||||||||||
| Burlington Northern Santa Fe LLC, 5.750%, Due 5/1/2040 | $ | 202,000 | $ | 283,065 | |||||||||||
| CSX Corp., 5.500%, Due 4/15/2041 | 157,000 | 212,172 | |||||||||||||
| FedEx Corp., 3.250%, Due 5/15/2041 | 55,000 | 55,877 | |||||||||||||
| Union Pacific Corp., 4.100%, Due 9/15/2067 | 55,000 | 67,571 | |||||||||||||
|
| ||||||||||||||
| 618,685 | |||||||||||||||
|
| ||||||||||||||
Total Industrial | 2,896,441 | ||||||||||||||
|
| ||||||||||||||
| Technology - 1.91% | |||||||||||||||
| Computers - 1.14% | |||||||||||||||
| Apple, Inc., | |||||||||||||||
1.400%, Due 8/5/2028 | 200,000 | 195,071 | |||||||||||||
2.200%, Due 9/11/2029 | 300,000 | 306,937 | |||||||||||||
| Dell International LLC / EMC Corp., 5.300%, Due 10/1/2029 | 160,000 | 192,543 | |||||||||||||
| Hewlett Packard Enterprise Co., 6.350%, Due 10/15/2045 | 500,000 | 685,286 | |||||||||||||
| HP, Inc., 4.050%, Due 9/15/2022 | 145,000 | 149,034 | |||||||||||||
| International Business Machines Corp., 4.250%, Due 5/15/2049 | 500,000 | 613,634 | |||||||||||||
|
| ||||||||||||||
| 2,142,505 | |||||||||||||||
|
| ||||||||||||||
| Semiconductors - 0.63% | |||||||||||||||
| Intel Corp., 1.600%, Due 8/12/2028 | 500,000 | 492,670 | |||||||||||||
| Lam Research Corp., | |||||||||||||||
3.750%, Due 3/15/2026 | 35,000 | 38,435 | |||||||||||||
1.900%, Due 6/15/2030 | 75,000 | 74,273 | |||||||||||||
| Microchip Technology, Inc., 0.983%, Due 9/1/2024C | 40,000 | 39,585 | |||||||||||||
| NVIDIA Corp., 1.550%, Due 6/15/2028 | 500,000 | 493,922 | |||||||||||||
| QUALCOMM, Inc., 1.650%, Due 5/20/2032 | 59,000 | 55,834 | |||||||||||||
|
| ||||||||||||||
| 1,194,719 | |||||||||||||||
|
| ||||||||||||||
| Software - 0.14% | |||||||||||||||
| Fiserv, Inc., 3.500%, Due 7/1/2029 | 75,000 | 80,989 | |||||||||||||
| Oracle Corp., 4.300%, Due 7/8/2034 | 92,000 | 104,143 | |||||||||||||
| VMware, Inc., 2.200%, Due 8/15/2031 | 80,000 | 77,899 | |||||||||||||
|
| ||||||||||||||
| 263,031 | |||||||||||||||
|
| ||||||||||||||
Total Technology | 3,600,255 | ||||||||||||||
|
| ||||||||||||||
| Utilities - 1.20% | |||||||||||||||
| Electric - 1.07% | |||||||||||||||
| Appalachian Power Co., 4.500%, Due 3/1/2049, Series Y | 25,000 | 31,013 | |||||||||||||
| Berkshire Hathaway Energy Co., 6.125%, Due 4/1/2036 | 277,000 | 381,071 | |||||||||||||
| Consolidated Edison Co. of New York, Inc., 5.500%, Due 12/1/2039, Series 09-C | 169,000 | 222,817 | |||||||||||||
| Consumers Energy Co., 2.500%, Due 5/1/2060 | 80,000 | 73,238 | |||||||||||||
| Dominion Energy, Inc., 3.375%, Due 4/1/2030, Series C | 55,000 | 59,184 | |||||||||||||
| DTE Energy Co., 1.050%, Due 6/1/2025, Series F | 115,000 | 113,576 | |||||||||||||
| Duke Energy Corp., 3.750%, Due 4/15/2024 | 45,000 | 47,681 | |||||||||||||
| Duke Energy Progress LLC, 4.150%, Due 12/1/2044 | 100,000 | 118,671 | |||||||||||||
| Entergy Arkansas LLC, 3.350%, Due 6/15/2052 | 55,000 | 59,443 | |||||||||||||
| Entergy Corp., 2.800%, Due 6/15/2030 | 45,000 | 46,101 | |||||||||||||
| Entergy Louisiana LLC, 4.000%, Due 3/15/2033 | 47,000 | 53,955 | |||||||||||||
| Exelon Corp., 4.050%, Due 4/15/2030 | 60,000 | 67,576 | |||||||||||||
| Florida Power & Light Co., 3.950%, Due 3/1/2048 | 50,000 | 61,249 | |||||||||||||
| Kentucky Utilities Co., 3.300%, Due 6/1/2050 | 60,000 | 64,685 | |||||||||||||
| National Rural Utilities Cooperative Finance Corp., | |||||||||||||||
4.300%, Due 3/15/2049 | 40,000 | 50,223 | |||||||||||||
1.000%, Due 10/18/2024, Series D | 65,000 | 64,851 | |||||||||||||
| Northern States Power Co., 2.600%, Due 6/1/2051 | 70,000 | 68,140 | |||||||||||||
| Ohio Power Co., 2.600%, Due 4/1/2030, Series P | 60,000 | 61,987 | |||||||||||||
See accompanying notes
22
American Beacon Balanced FundSM
Schedule of Investments
October 31, 2021
| Principal Amount | Fair Value | ||||||||||||||
| CORPORATE OBLIGATIONS - 15.04% (continued) | |||||||||||||||
| Utilities - 1.20% (continued) | |||||||||||||||
| Electric - 1.07% (continued) | |||||||||||||||
| Oklahoma Gas and Electric Co., 0.553%, Due 5/26/2023 | $ | 85,000 | $ | 84,744 | |||||||||||
| Southwestern Electric Power Co., 3.550%, Due 2/15/2022 | 289,000 | 289,669 | |||||||||||||
|
| ||||||||||||||
| 2,019,874 | |||||||||||||||
|
| ||||||||||||||
| Gas - 0.13% | |||||||||||||||
| National Fuel Gas Co., 3.950%, Due 9/15/2027 | 80,000 | 85,466 | |||||||||||||
| NiSource, Inc., | |||||||||||||||
3.490%, Due 5/15/2027 | 45,000 | 48,674 | |||||||||||||
3.950%, Due 3/30/2048 | 55,000 | 63,247 | |||||||||||||
| Southern California Gas Co., 2.550%, Due 2/1/2030 | 40,000 | 41,065 | |||||||||||||
|
| ||||||||||||||
| 238,452 | |||||||||||||||
|
| ||||||||||||||
Total Utilities | 2,258,326 | ||||||||||||||
|
| ||||||||||||||
Total Corporate Obligations (Cost $26,602,074) | 28,359,396 | ||||||||||||||
|
| ||||||||||||||
| FOREIGN CORPORATE OBLIGATIONS - 2.55% | |||||||||||||||
| Basic Materials - 0.10% | |||||||||||||||
| Chemicals - 0.03% | |||||||||||||||
| Nutrien Ltd., 4.000%, Due 12/15/2026 | 44,000 | 48,712 | |||||||||||||
|
| ||||||||||||||
| Mining - 0.07% | |||||||||||||||
| Glencore Funding LLC, 2.625%, Due 9/23/2031C | 60,000 | 58,481 | |||||||||||||
| Teck Resources Ltd., 6.000%, Due 8/15/2040 | 65,000 | 84,073 | |||||||||||||
|
| ||||||||||||||
| 142,554 | |||||||||||||||
|
| ||||||||||||||
Total Basic Materials | 191,266 | ||||||||||||||
|
| ||||||||||||||
| Communications - 0.61% | |||||||||||||||
| Internet - 0.18% | |||||||||||||||
| Alibaba Group Holding Ltd., 3.600%, Due 11/28/2024 | 313,000 | 332,912 | |||||||||||||
|
| ||||||||||||||
| Media - 0.19% | |||||||||||||||
| Thomson Reuters Corp., | |||||||||||||||
4.300%, Due 11/23/2023 | 145,000 | 154,248 | |||||||||||||
3.850%, Due 9/29/2024 | 193,000 | 206,450 | |||||||||||||
|
| ||||||||||||||
| 360,698 | |||||||||||||||
|
| ||||||||||||||
| Telecommunications - 0.24% | |||||||||||||||
| America Movil SAB de CV, 6.375%, Due 3/1/2035 | 169,000 | 234,241 | |||||||||||||
| Bell Canada, Inc., 4.464%, Due 4/1/2048 | 25,000 | 31,121 | |||||||||||||
| Deutsche Telekom International Finance BV, 4.875%, Due 3/6/2042C | 150,000 | 186,640 | |||||||||||||
|
| ||||||||||||||
| 452,002 | |||||||||||||||
|
| ||||||||||||||
Total Communications | 1,145,612 | ||||||||||||||
|
| ||||||||||||||
| Consumer, Non-Cyclical - 0.53% | |||||||||||||||
| Agriculture - 0.09% | |||||||||||||||
| BAT Capital Corp., 2.259%, Due 3/25/2028 | 105,000 | 103,128 | |||||||||||||
| Reynolds American, Inc., 5.700%, Due 8/15/2035 | 65,000 | 77,126 | |||||||||||||
|
| ||||||||||||||
| 180,254 | |||||||||||||||
|
| ||||||||||||||
| Beverages - 0.44% | |||||||||||||||
| Anheuser-Busch Cos. LLC / Anheuser-Busch InBev Worldwide, Inc., 4.900%, Due 2/1/2046 | 35,000 | 44,486 | |||||||||||||
| Anheuser-Busch InBev Worldwide, Inc., | |||||||||||||||
5.450%, Due 1/23/2039 | 500,000 | 656,061 | |||||||||||||
5.550%, Due 1/23/2049 | 35,000 | 49,042 | |||||||||||||
See accompanying notes
23
American Beacon Balanced FundSM
Schedule of Investments
October 31, 2021
| Principal Amount | Fair Value | ||||||||||||||
| FOREIGN CORPORATE OBLIGATIONS - 2.55% (continued) | |||||||||||||||
| Consumer, Non-Cyclical - 0.53% (continued) | |||||||||||||||
| Beverages - 0.44% (continued) | |||||||||||||||
| Coca-Cola Femsa SAB de CV, 2.750%, Due 1/22/2030 | $ | 70,000 | $ | 72,450 | |||||||||||
|
| ||||||||||||||
| 822,039 | |||||||||||||||
|
| ||||||||||||||
Total Consumer, Non-Cyclical | 1,002,293 | ||||||||||||||
|
| ||||||||||||||
| Energy - 0.53% | |||||||||||||||
| Oil & Gas - 0.35% | |||||||||||||||
| Saudi Arabian Oil Co., 4.375%, Due 4/16/2049C | 500,000 | 573,950 | |||||||||||||
| TotalEnergies Capital International SA, 3.127%, Due 5/29/2050 | 70,000 | 73,369 | |||||||||||||
|
| ||||||||||||||
| 647,319 | |||||||||||||||
|
| ||||||||||||||
| Pipelines - 0.18% | |||||||||||||||
| TransCanada PipeLines Ltd., | |||||||||||||||
3.750%, Due 10/16/2023 | 145,000 | 152,226 | |||||||||||||
1.000%, Due 10/12/2024 | 80,000 | 79,671 | |||||||||||||
6.100%, Due 6/1/2040 | 82,000 | 112,135 | |||||||||||||
|
| ||||||||||||||
| 344,032 | |||||||||||||||
|
| ||||||||||||||
Total Energy | 991,351 | ||||||||||||||
|
| ||||||||||||||
| Financial - 0.60% | |||||||||||||||
| Banks - 0.52% | |||||||||||||||
| Bank of Montreal, 3.300%, Due 2/5/2024, Series E | 75,000 | 79,099 | |||||||||||||
| Mitsubishi UFJ Financial Group, Inc., 2.193%, Due 2/25/2025 | 75,000 | 77,020 | |||||||||||||
| Royal Bank of Canada, | |||||||||||||||
2.250%, Due 11/1/2024 | 115,000 | 119,213 | |||||||||||||
1.200%, Due 4/27/2026 | 500,000 | 492,866 | |||||||||||||
| Toronto-Dominion Bank, 3.250%, Due 3/11/2024 | 160,000 | 168,744 | |||||||||||||
| Westpac Banking Corp., 1.150%, Due 6/3/2026 | 50,000 | 49,395 | |||||||||||||
|
| ||||||||||||||
| 986,337 | |||||||||||||||
|
| ||||||||||||||
| Financial Services - 0.08% | |||||||||||||||
| AerCap Ireland Capital DAC / AerCap Global Aviation Trust, 3.000%, Due 10/29/2028 | 150,000 | 152,264 | |||||||||||||
|
| ||||||||||||||
Total Financial | 1,138,601 | ||||||||||||||
|
| ||||||||||||||
| Industrial - 0.18% | |||||||||||||||
| Aerospace/Defense - 0.18% | |||||||||||||||
| BAE Systems Holdings, Inc., 3.800%, Due 10/7/2024C | 313,000 | 335,396 | |||||||||||||
|
| ||||||||||||||
Total Foreign Corporate Obligations (Cost $4,321,850) | 4,804,519 | ||||||||||||||
|
| ||||||||||||||
| FOREIGN SOVEREIGN OBLIGATIONS - 0.04% (Cost $70,062) | |||||||||||||||
| Mexico Government International Bond, 4.600%, Due 1/23/2046 | 65,000 | 69,375 | |||||||||||||
|
| ||||||||||||||
| ASSET-BACKED OBLIGATIONS - 0.96% | |||||||||||||||
| AmeriCredit Automobile Receivables Trust, | |||||||||||||||
0.370%, Due 8/18/2025, 2021-1 A3 | 85,000 | 84,823 | |||||||||||||
0.340%, Due 12/18/2026, 2021-2 A3 | 70,000 | 69,594 | |||||||||||||
| Capital One Multi-Asset Execution Trust, 0.550%, Due 7/15/2026, 2021-A1 A1 | 115,000 | 113,911 | |||||||||||||
| CNH Equipment Trust, | |||||||||||||||
1.160%, Due 6/16/2025, 2020-A A3 | 105,000 | 105,656 | |||||||||||||
0.400%, Due 12/15/2025, 2021-A A3 | 95,000 | 94,321 | |||||||||||||
| GM Financial Consumer Automobile Receivables Trust, | |||||||||||||||
1.840%, Due 9/16/2024, 2020-1 A3 | 97,455 | 98,348 | |||||||||||||
1.490%, Due 12/16/2024, 2020-2 A3 | 42,880 | 43,200 | |||||||||||||
| GM Financial Revolving Receivables Trust, 1.170%, Due 6/12/2034, 2021-1 AC | 90,000 | 88,930 | |||||||||||||
| Mercedes-Benz Auto Lease Trust, 0.400%, Due 11/15/2024, 2021-B A3 | 150,000 | 149,180 | |||||||||||||
| New Economy Assets Phase 1 Sponsor LLC, 1.910%, Due 10/20/2061, 2021 1 A1C | 125,000 | 124,419 | |||||||||||||
See accompanying notes
24
American Beacon Balanced FundSM
Schedule of Investments
October 31, 2021
| Principal Amount | Fair Value | ||||||||||||||
| ASSET-BACKED OBLIGATIONS - 0.96% (continued) | |||||||||||||||
| PSNH Funding LLC, 3.094%, Due 2/1/2026, 2018-1 A1 | $ | 53,537 | $ | 55,138 | |||||||||||
| Taco Bell Funding LLC, 2.294%, Due 8/25/2051, 2021-1A A2IIC | 100,000 | 99,751 | |||||||||||||
| Toyota Auto Loan Extended Note Trust, 1.350%, Due 5/25/2033, 2020-1A AC | 135,000 | 135,462 | |||||||||||||
| Toyota Auto Receivables Owner Trust, 1.360%, Due 8/15/2024, 2020-B A3 | 145,000 | 146,061 | |||||||||||||
| Verizon Master Trust, 0.500%, Due 5/20/2027, 2021-1 A | 200,000 | 197,942 | |||||||||||||
| Verizon Owner Trust, 1.850%, Due 7/22/2024, 2020-A A1A | 210,000 | 212,271 | |||||||||||||
|
| ||||||||||||||
Total Asset-Backed Obligations (Cost $1,817,020) | 1,819,007 | ||||||||||||||
|
| ||||||||||||||
| COMMERCIAL MORTGAGE-BACKED OBLIGATIONS - 0.17% | |||||||||||||||
| BX Commercial Mortgage Trust, 0.790%, Due 9/15/2036, 2021-VOLT A, (1-mo. USD LIBOR + 0.700%)C D | 140,000 | 140,043 | |||||||||||||
| Cold Storage Trust, 0.990%, Due 11/15/2037, 2020-ICE5 A, (1-mo. USD LIBOR + 0.900%)C D | 113,044 | 113,010 | |||||||||||||
| JPMBB Commercial Mortgage Securities Trust, 3.157%, Due 7/15/2045, 2013-C12 ASB | 58,861 | 59,324 | |||||||||||||
|
| ||||||||||||||
Total Commercial Mortgage-Backed Obligations (Cost $312,803) | 312,377 | ||||||||||||||
|
| ||||||||||||||
| U.S. AGENCY MORTGAGE-BACKED OBLIGATIONS - 6.30% | |||||||||||||||
| Federal Home Loan Mortgage Corp., | |||||||||||||||
3.500%, Due 9/1/2028 | 21,057 | 22,574 | |||||||||||||
3.000%, Due 11/1/2032 | 71,218 | 75,742 | |||||||||||||
5.000%, Due 8/1/2033 | 23,714 | 27,036 | |||||||||||||
5.500%, Due 2/1/2034 | 23,139 | 26,770 | |||||||||||||
2.500%, Due 6/1/2035 | 94,819 | 98,640 | |||||||||||||
1.500%, Due 3/1/2036 | 149,128 | 150,093 | |||||||||||||
2.000%, Due 3/1/2036 | 263,621 | 270,682 | |||||||||||||
2.000%, Due 10/1/2040 | 95,408 | 95,445 | |||||||||||||
2.000%, Due 1/1/2041 | 220,663 | 224,845 | |||||||||||||
4.000%, Due 1/1/2041 | 66,020 | 72,738 | |||||||||||||
4.500%, Due 2/1/2041 | 45,541 | 50,744 | |||||||||||||
2.500%, Due 9/1/2041 | 341,022 | 352,445 | |||||||||||||
2.500%, Due 11/1/2041 | 345,000 | 357,706 | |||||||||||||
3.500%, Due 6/1/2042 | 200,057 | 216,329 | |||||||||||||
3.000%, Due 4/1/2047 | 204,821 | 218,380 | |||||||||||||
3.500%, Due 1/1/2048 | 212,930 | 228,122 | |||||||||||||
4.000%, Due 4/1/2048 | 101,738 | 109,783 | |||||||||||||
3.000%, Due 8/1/2048 | 148,504 | 157,112 | |||||||||||||
3.000%, Due 11/1/2049 | 310,232 | 325,378 | |||||||||||||
|
| ||||||||||||||
| 3,080,564 | |||||||||||||||
|
| ||||||||||||||
| Federal National Mortgage Association, | |||||||||||||||
3.500%, Due 1/1/2028 | 18,228 | 19,429 | |||||||||||||
5.000%, Due 3/1/2034 | 25,983 | 29,054 | |||||||||||||
4.500%, Due 4/1/2034 | 47,299 | 51,900 | |||||||||||||
3.000%, Due 10/1/2034 | 6,545 | 6,917 | |||||||||||||
2.000%, Due 11/1/2035 | 204,035 | 210,488 | |||||||||||||
2.000%, Due 12/1/2035 | 79,929 | 82,416 | |||||||||||||
2.000%, Due 1/1/2036 | 144,700 | 148,576 | |||||||||||||
2.000%, Due 5/1/2036 | 70,583 | 72,474 | |||||||||||||
2.000%, Due 6/1/2036 | 100,580 | 103,274 | |||||||||||||
3.500%, Due 6/1/2037 | 121,530 | 130,952 | |||||||||||||
5.500%, Due 6/1/2038 | 5,246 | 6,129 | |||||||||||||
4.500%, Due 1/1/2040 | 47,487 | 52,877 | |||||||||||||
5.000%, Due 5/1/2040 | 81,422 | 93,010 | |||||||||||||
5.000%, Due 6/1/2040 | 61,041 | 69,627 | |||||||||||||
4.000%, Due 9/1/2040 | 39,774 | 43,749 | |||||||||||||
4.000%, Due 1/1/2041 | 89,164 | 98,231 | |||||||||||||
2.500%, Due 11/1/2041 | 140,000 | 144,434 | |||||||||||||
3.000%, Due 6/1/2043 | 376,360 | 402,176 | |||||||||||||
3.500%, Due 7/1/2043 | 78,635 | 84,919 | |||||||||||||
3.000%, Due 8/1/2043 | 343,759 | 365,755 | |||||||||||||
4.000%, Due 11/1/2044 | 54,554 | 60,140 | |||||||||||||
4.000%, Due 7/1/2045 | 240,190 | 264,808 | |||||||||||||
3.500%, Due 8/1/2045 | 44,890 | 48,154 | |||||||||||||
3.500%, Due 11/1/2045 | 399,920 | 428,865 | |||||||||||||
3.500%, Due 5/1/2046 | 52,605 | 56,247 | |||||||||||||
4.000%, Due 7/1/2046 | 85,091 | 93,553 | |||||||||||||
See accompanying notes
25
American Beacon Balanced FundSM
Schedule of Investments
October 31, 2021
| Principal Amount | Fair Value | ||||||||||||||
| U.S. AGENCY MORTGAGE-BACKED OBLIGATIONS - 6.30% (continued) | |||||||||||||||
| Federal National Mortgage Association, (continued) | |||||||||||||||
3.000%, Due 10/1/2046 | $ | 30,357 | $ | 32,084 | |||||||||||
3.000%, Due 11/1/2046 | 177,523 | 188,231 | |||||||||||||
3.000%, Due 12/1/2046 | 112,724 | 119,417 | |||||||||||||
3.500%, Due 3/1/2047 | 43,016 | 46,153 | |||||||||||||
4.500%, Due 7/1/2047 | 30,541 | 33,240 | |||||||||||||
4.500%, Due 8/1/2047 | 44,195 | 48,168 | |||||||||||||
3.500%, Due 9/1/2047 | 51,289 | 54,653 | |||||||||||||
4.000%, Due 3/1/2048 | 70,438 | 75,598 | |||||||||||||
4.500%, Due 4/1/2048 | 23,410 | 25,231 | |||||||||||||
4.500%, Due 7/1/2048 | 128,365 | 139,378 | |||||||||||||
4.000%, Due 10/1/2049 | 100,475 | 107,539 | |||||||||||||
4.500%, Due 10/1/2049 | 170,723 | 184,717 | |||||||||||||
4.000%, Due 11/1/2049 | 236,412 | 255,601 | |||||||||||||
2.500%, Due 8/1/2050 | 430,999 | 443,619 | |||||||||||||
3.000%, Due 8/1/2050 | 123,210 | 129,680 | |||||||||||||
2.500%, Due 9/1/2050 | 141,584 | 145,913 | |||||||||||||
2.500%, Due 10/1/2050 | 73,571 | 75,658 | |||||||||||||
3.000%, Due 10/1/2050 | 301,359 | 318,009 | |||||||||||||
2.000%, Due 3/1/2051 | 505,769 | 508,839 | |||||||||||||
2.000%, Due 4/1/2051 | 290,065 | 292,414 | |||||||||||||
3.000%, Due 5/1/2051 | 146,425 | 155,186 | |||||||||||||
3.000%, Due 6/1/2051 | 168,492 | 178,001 | |||||||||||||
3.500%, Due 6/1/2051 | 363,077 | 387,517 | |||||||||||||
|
| ||||||||||||||
| 7,113,000 | |||||||||||||||
|
| ||||||||||||||
| Government National Mortgage Association, | |||||||||||||||
6.500%, Due 8/15/2027 | 16,821 | 18,800 | |||||||||||||
6.500%, Due 11/15/2027 | 20,432 | 22,836 | |||||||||||||
7.500%, Due 12/15/2028 | 18,524 | 20,865 | |||||||||||||
5.500%, Due 7/15/2033 | 24,384 | 28,418 | |||||||||||||
6.000%, Due 12/15/2033 | 34,256 | 40,494 | |||||||||||||
5.500%, Due 2/20/2034 | 33,673 | 39,545 | |||||||||||||
5.000%, Due 10/15/2039 | 58,472 | 68,278 | |||||||||||||
3.500%, Due 9/15/2041 | 117,848 | 126,516 | |||||||||||||
3.500%, Due 8/20/2047 | 24,630 | 25,987 | |||||||||||||
3.500%, Due 10/20/2047 | 23,030 | 24,413 | |||||||||||||
4.000%, Due 1/20/2048 | 119,991 | 128,700 | |||||||||||||
5.000%, Due 1/20/2050 | 64,474 | 69,618 | |||||||||||||
4.500%, Due 2/20/2050 | 59,776 | 63,875 | |||||||||||||
5.000%, Due 2/20/2050 | 32,327 | 35,177 | |||||||||||||
4.000%, Due 5/20/2051 | 195,361 | 207,967 | |||||||||||||
2.500%, Due 6/20/2051 | 191,104 | 196,544 | |||||||||||||
3.000%, Due 6/20/2051 | 92,138 | 95,882 | |||||||||||||
2.500%, Due 7/20/2051 | 291,118 | 299,424 | |||||||||||||
3.000%, Due 8/20/2051 | 169,436 | 177,930 | |||||||||||||
|
| ||||||||||||||
| 1,691,269 | |||||||||||||||
|
| ||||||||||||||
Total U.S. Agency Mortgage-Backed Obligations (Cost $11,625,755) | 11,884,833 | ||||||||||||||
|
| ||||||||||||||
| U.S. TREASURY OBLIGATIONS - 12.11% | |||||||||||||||
| U.S. Treasury Notes/Bonds, | |||||||||||||||
2.000%, Due 2/15/2022 | 664,000 | 667,678 | |||||||||||||
1.750%, Due 9/30/2022 | 500,000 | 507,344 | |||||||||||||
1.625%, Due 11/15/2022 | 964,000 | 978,611 | |||||||||||||
2.000%, Due 2/15/2023 | 500,000 | 511,074 | |||||||||||||
2.750%, Due 7/31/2023 | 500,000 | 520,098 | |||||||||||||
2.500%, Due 8/15/2023 | 964,000 | 999,171 | |||||||||||||
2.125%, Due 7/31/2024 | 250,000 | 259,668 | |||||||||||||
1.250%, Due 8/31/2024 | 560,000 | 568,159 | |||||||||||||
1.750%, Due 12/31/2024 | 700,000 | 720,590 | |||||||||||||
See accompanying notes
26
American Beacon Balanced FundSM
Schedule of Investments
October 31, 2021
| Principal Amount | Fair Value | ||||||||||||||
| U.S. TREASURY OBLIGATIONS - 12.11% (continued) | |||||||||||||||
| U.S. Treasury Notes/Bonds, (continued) | |||||||||||||||
1.125%, Due 2/28/2025 | $ | 2,295,000 | $ | 2,314,274 | |||||||||||
2.875%, Due 7/31/2025 | 500,000 | 535,117 | |||||||||||||
6.875%, Due 8/15/2025 | 279,000 | 340,620 | |||||||||||||
0.625%, Due 7/31/2026 | 500,000 | 487,461 | |||||||||||||
1.625%, Due 10/31/2026 | 500,000 | 510,801 | |||||||||||||
2.000%, Due 11/15/2026 | 500,000 | 519,668 | |||||||||||||
1.750%, Due 12/31/2026 | 650,000 | 667,723 | |||||||||||||
1.500%, Due 1/31/2027 | 2,205,000 | 2,236,438 | |||||||||||||
2.875%, Due 5/15/2028 | 200,000 | 218,398 | |||||||||||||
2.875%, Due 8/15/2028 | 100,000 | 109,402 | |||||||||||||
5.250%, Due 11/15/2028 | 217,000 | 272,581 | |||||||||||||
2.625%, Due 2/15/2029 | 450,000 | 486,352 | |||||||||||||
2.375%, Due 5/15/2029 | 450,000 | 479,057 | |||||||||||||
1.625%, Due 8/15/2029 | 350,000 | 354,197 | |||||||||||||
1.750%, Due 11/15/2029 | 1,700,000 | 1,737,520 | |||||||||||||
1.500%, Due 2/15/2030 | 2,565,000 | 2,568,908 | |||||||||||||
4.750%, Due 2/15/2037 | 304,000 | 431,419 | |||||||||||||
4.500%, Due 8/15/2039 | 241,000 | 338,812 | |||||||||||||
2.250%, Due 5/15/2041 | 465,000 | 484,472 | |||||||||||||
2.750%, Due 8/15/2042 | 250,000 | 282,187 | |||||||||||||
2.875%, Due 5/15/2049 | 500,000 | 599,648 | |||||||||||||
1.375%, Due 8/15/2050 | 1,295,000 | 1,127,561 | |||||||||||||
|
| ||||||||||||||
| 22,835,009 | |||||||||||||||
|
| ||||||||||||||
Total U.S. Treasury Obligations (Cost $22,452,168) | 22,835,009 | ||||||||||||||
|
| ||||||||||||||
| Shares | |||||||||||||||
| SHORT-TERM INVESTMENTS - 2.15% (Cost $4,053,731) | |||||||||||||||
| Investment Companies - 2.15% | |||||||||||||||
| American Beacon U.S. Government Money Market Select Fund, 0.01%E F | 4,053,731 | 4,053,731 | |||||||||||||
|
| ||||||||||||||
| SECURITIES LENDING COLLATERAL - 0.30% (Cost $572,921) | |||||||||||||||
| Investment Companies - 0.30% | |||||||||||||||
| American Beacon U.S. Government Money Market Select Fund, 0.01%E F | 572,921 | 572,921 | |||||||||||||
|
| ||||||||||||||
TOTAL INVESTMENTS - 100.06% (Cost $151,713,012) | 188,692,339 | ||||||||||||||
LIABILITIES, NET OF OTHER ASSETS - (0.06%) | (113,900 | ) | |||||||||||||
|
| ||||||||||||||
TOTAL NET ASSETS - 100.00% | $ | 188,578,439 | |||||||||||||
|
| ||||||||||||||
| Percentages are stated as a percent of net assets. | |||||||||||||||
A Non-income producing security.
B All or a portion of this security is on loan, collateralized by either cash and/or U.S. Treasuries, at October 31, 2021 (Note 9).
C Security exempt from registration under the Securities Act of 1933. These securities may be resold to qualified institutional buyers pursuant to Rule 144A. At the period end, the value of these securities amounted to $2,673,912 or 1.42% of net assets. The Fund has no right to demand registration of these securities.
D Variable, floating, or adjustable rate securities with an interest rate that changes periodically. Rates are periodically reset with rates that are based on a predetermined benchmark such as a widely followed interest rate such as T-bills, SOFR, LIBOR or PRIME plus a fixed spread. The interest rate disclosed reflects the rate in effect on October 31, 2021.
E The Fund is affiliated by having the same investment advisor.
F 7-day yield.
ADR - American Depositary Receipt.
CMT - Constant Maturity Treasury.
DAC - Designated Activity Company.
LIBOR - London Interbank Offered Rate.
LLC - Limited Liability Company.
LP - Limited Partnership.
PLC - Public Limited Company.
PRIME - A rate, charged by banks, based on the U.S. Federal Funds rate.
SOFR - Secured Overnight Financing Rate.
See accompanying notes
27
American Beacon Balanced FundSM
Schedule of Investments
October 31, 2021
| Long Futures Contracts Open on October 31, 2021: |
| |||||||||||||||
| Equity Futures Contracts | ||||||||||||||||
| Description | Number of Contracts | Expiration Date | Notional Amount | Contract Value | Unrealized Appreciation (Depreciation) | |||||||||||
| S&P 500 E-Mini Index | 15 | December 2021 | $ | 3,275,126 | $ | 3,447,750 | $ | 172,624 | ||||||||
|
|
|
|
|
| |||||||||||
| $ | 3,275,126 | $ | 3,447,750 | $ | 172,624 | |||||||||||
|
|
|
|
|
| |||||||||||
| Index Abbreviations: | ||
| S&P 500 | S&P 500 Index - U.S. Equity Large-Cap Index. | |
The Fund’s investments are summarized by level based on the inputs used to determine their values. As of October 31, 2021, the investments were classified as described below:
Balanced Fund | Level 1 | Level 2 | Level 3 | Total | ||||||||||||||||||||||||
Assets | ||||||||||||||||||||||||||||
Common Stocks | $ | 113,981,171 | $ | - | $ | - | $ | 113,981,171 | ||||||||||||||||||||
Corporate Obligations | - | 28,359,396 | - | 28,359,396 | ||||||||||||||||||||||||
Foreign Corporate Obligations | - | 4,804,519 | - | 4,804,519 | ||||||||||||||||||||||||
Foreign Sovereign Obligations | - | 69,375 | - | 69,375 | ||||||||||||||||||||||||
Asset-Backed Obligations | - | 1,819,007 | - | 1,819,007 | ||||||||||||||||||||||||
Commercial Mortgage-Backed Obligations | - | 312,377 | - | 312,377 | ||||||||||||||||||||||||
U.S. Agency Mortgage-Backed Obligations | - | 11,884,833 | - | 11,884,833 | ||||||||||||||||||||||||
U.S. Treasury Obligations | - | 22,835,009 | - | 22,835,009 | ||||||||||||||||||||||||
Short-Term Investments | 4,053,731 | - | - | 4,053,731 | ||||||||||||||||||||||||
Securities Lending Collateral | 572,921 | - | - | 572,921 | ||||||||||||||||||||||||
|
|
|
|
|
|
|
| |||||||||||||||||||||
Total Investments in Securities - Assets | $ | 118,607,823 | $ | 70,084,516 | $ | - | $ | 188,692,339 | ||||||||||||||||||||
|
|
|
|
|
|
|
| |||||||||||||||||||||
Financial Derivative Instruments - Assets |
| |||||||||||||||||||||||||||
Futures Contracts | $ | 172,624 | $ | - | $ | - | $ | 172,624 | ||||||||||||||||||||
|
|
|
|
|
|
|
| |||||||||||||||||||||
Total Financial Derivative Instruments - Assets | $ | 172,624 | $ | - | $ | - | $ | 172,624 | ||||||||||||||||||||
|
|
|
|
|
|
|
| |||||||||||||||||||||
U.S. GAAP requires transfers between all levels to/from level 3 be disclosed. During the year ended October 31, 2021, there were no transfers into or out of Level 3.
See accompanying notes
28
American Beacon Mid-Cap Value FundSM
Schedule of Investments
October 31, 2021
| Shares | Fair Value | ||||||||||||||
| COMMON STOCKS - 98.01% | |||||||||||||||
| Communication Services - 1.68% | |||||||||||||||
| Entertainment - 0.58% | |||||||||||||||
| Cinemark Holdings, Inc.A B | 62,664 | $ | 1,178,083 | ||||||||||||
|
| ||||||||||||||
| Media - 1.10% | |||||||||||||||
| Altice USA, Inc., Class AB | 62,705 | 1,022,092 | |||||||||||||
| Liberty Broadband Corp., Class CB | 7,493 | 1,217,238 | |||||||||||||
|
| ||||||||||||||
| 2,239,330 | |||||||||||||||
|
| ||||||||||||||
Total Communication Services | 3,417,413 | ||||||||||||||
|
| ||||||||||||||
| Consumer Discretionary - 15.82% | |||||||||||||||
| Auto Components - 2.09% | |||||||||||||||
| Dana, Inc. | 85,431 | 1,895,714 | |||||||||||||
| Lear Corp. | 13,769 | 2,366,203 | |||||||||||||
|
| ||||||||||||||
| 4,261,917 | |||||||||||||||
|
| ||||||||||||||
| Automobiles - 0.55% | |||||||||||||||
| Ford Motor Co.B | 65,519 | 1,119,064 | |||||||||||||
|
| ||||||||||||||
| Diversified Consumer Services - 0.68% | |||||||||||||||
| Adtalem Global Education, Inc.B | 37,222 | 1,374,608 | |||||||||||||
|
| ||||||||||||||
| Hotels, Restaurants & Leisure - 4.89% | |||||||||||||||
| Aramark | 29,937 | 1,092,102 | |||||||||||||
| Marriott Vacations Worldwide Corp. | 13,802 | 2,169,950 | |||||||||||||
| MGM Resorts International | 24,888 | 1,173,718 | |||||||||||||
| SeaWorld Entertainment, Inc.B | 34,781 | 2,208,594 | |||||||||||||
| Travel + Leisure Co. | 33,436 | 1,816,912 | |||||||||||||
| Wyndham Hotels & Resorts, Inc. | 17,855 | 1,508,212 | |||||||||||||
|
| ||||||||||||||
| 9,969,488 | |||||||||||||||
|
| ||||||||||||||
| Household Durables - 1.96% | |||||||||||||||
| Lennar Corp., Class A | 6,833 | 682,822 | |||||||||||||
| Mohawk Industries, Inc.B | �� | 6,828 | 1,209,990 | ||||||||||||
| Newell Brands, Inc. | 92,077 | 2,107,642 | |||||||||||||
|
| ||||||||||||||
| 4,000,454 | |||||||||||||||
|
| ||||||||||||||
| Internet & Direct Marketing Retail - 0.79% | |||||||||||||||
| Qurate Retail, Inc., Series A | 154,120 | 1,609,013 | |||||||||||||
|
| ||||||||||||||
| Specialty Retail - 1.99% | |||||||||||||||
| Advance Auto Parts, Inc. | 7,687 | 1,733,572 | |||||||||||||
| CarMax, Inc.B | 10,010 | 1,370,569 | |||||||||||||
| Gap, Inc. | 22,830 | 518,013 | |||||||||||||
| Lithia Motors, Inc. | 1,345 | 429,351 | |||||||||||||
|
| ||||||||||||||
| 4,051,505 | |||||||||||||||
|
| ||||||||||||||
| Textiles, Apparel & Luxury Goods - 2.87% | |||||||||||||||
| Gildan Activewear, Inc. | 37,678 | 1,383,536 | |||||||||||||
| PVH Corp.B | 15,196 | 1,661,379 | |||||||||||||
| Ralph Lauren Corp. | 12,133 | 1,542,953 | |||||||||||||
| Skechers USA, Inc., Class AB | 27,237 | 1,258,622 | |||||||||||||
|
| ||||||||||||||
| 5,846,490 | |||||||||||||||
|
| ||||||||||||||
Total Consumer Discretionary | 32,232,539 | ||||||||||||||
|
| ||||||||||||||
See accompanying notes
29
American Beacon Mid-Cap Value FundSM
Schedule of Investments
October 31, 2021
| Shares | Fair Value | ||||||||||||||
| COMMON STOCKS - 98.01% (continued) | |||||||||||||||
| Consumer Staples - 1.68% | |||||||||||||||
| Beverages - 0.71% | |||||||||||||||
| Coca-Cola Europacific Partners PLC | 27,283 | $ | 1,436,450 | ||||||||||||
|
| ||||||||||||||
| Food & Staples Retailing - 0.97% | |||||||||||||||
| US Foods Holding Corp.B | 56,978 | 1,975,427 | |||||||||||||
|
| ||||||||||||||
Total Consumer Staples | 3,411,877 | ||||||||||||||
|
| ||||||||||||||
| Energy - 7.37% | |||||||||||||||
| Energy Equipment & Services - 3.04% | |||||||||||||||
| Baker Hughes Co. | 81,387 | 2,041,186 | |||||||||||||
| Halliburton Co. | 91,922 | 2,297,131 | |||||||||||||
| NOV, Inc.B | 91,557 | 1,283,629 | |||||||||||||
| TechnipFMC PLCB | 76,588 | 564,453 | |||||||||||||
|
| ||||||||||||||
| 6,186,399 | |||||||||||||||
|
| ||||||||||||||
| Oil, Gas & Consumable Fuels - 4.33% | |||||||||||||||
| APA Corp. | 58,198 | 1,525,370 | |||||||||||||
| Cenovus Energy, Inc. | 58,667 | 702,831 | |||||||||||||
| Cheniere Energy, Inc.B | 10,220 | 1,056,748 | |||||||||||||
| EQT Corp.B | 31,347 | 624,119 | |||||||||||||
| Hess Corp. | 28,208 | 2,329,134 | |||||||||||||
| Pioneer Natural Resources Co. | 13,889 | 2,596,965 | |||||||||||||
|
| ||||||||||||||
| 8,835,167 | |||||||||||||||
|
| ||||||||||||||
Total Energy | 15,021,566 | ||||||||||||||
|
| ||||||||||||||
| Financials - 25.88% | |||||||||||||||
| Banks - 4.69% | |||||||||||||||
| Fifth Third Bancorp | 52,657 | 2,292,159 | |||||||||||||
| KeyCorp | 96,907 | 2,255,026 | |||||||||||||
| Pinnacle Financial Partners, Inc. | 7,079 | 683,619 | |||||||||||||
| Regions Financial Corp. | 99,159 | 2,348,085 | |||||||||||||
| Signature Bank | 6,644 | 1,978,716 | |||||||||||||
|
| ||||||||||||||
| 9,557,605 | |||||||||||||||
|
| ||||||||||||||
| Capital Markets - 3.22% | |||||||||||||||
| Evercore, Inc., Class A | 4,693 | 712,585 | |||||||||||||
| Invesco Ltd. | 54,411 | 1,382,584 | |||||||||||||
| Jefferies Financial Group, Inc. | 56,961 | 2,449,323 | |||||||||||||
| Northern Trust Corp. | 16,371 | 2,014,288 | |||||||||||||
|
| ||||||||||||||
| 6,558,780 | |||||||||||||||
|
| ||||||||||||||
| Consumer Finance - 5.23% | |||||||||||||||
| Ally Financial, Inc. | 55,696 | 2,658,927 | |||||||||||||
| Discover Financial Services | 16,301 | 1,847,229 | |||||||||||||
| OneMain Holdings, Inc. | 30,539 | 1,612,765 | |||||||||||||
| PROG Holdings, Inc. | 75,984 | 3,073,553 | |||||||||||||
| SLM Corp. | 80,040 | 1,468,734 | |||||||||||||
|
| ||||||||||||||
| 10,661,208 | |||||||||||||||
|
| ||||||||||||||
| Diversified Financial Services - 2.40% | |||||||||||||||
| Equitable Holdings, Inc. | 82,290 | 2,756,715 | |||||||||||||
| Voya Financial, Inc. | 30,668 | 2,139,706 | |||||||||||||
|
| ||||||||||||||
| 4,896,421 | |||||||||||||||
|
| ||||||||||||||
See accompanying notes
30
American Beacon Mid-Cap Value FundSM
Schedule of Investments
October 31, 2021
| Shares | Fair Value | ||||||||||||||
| COMMON STOCKS - 98.01% (continued) | |||||||||||||||
| Financials - 25.88% (continued) | |||||||||||||||
| Insurance - 10.34% | |||||||||||||||
| American Financial Group, Inc. | 6,771 | $ | 921,127 | ||||||||||||
| American International Group, Inc. | 53,650 | 3,170,178 | |||||||||||||
| Arch Capital Group Ltd.B | 33,721 | 1,410,212 | |||||||||||||
| Assurant, Inc. | 8,433 | 1,360,327 | |||||||||||||
| Axis Capital Holdings Ltd. | 98,230 | 5,114,836 | |||||||||||||
| CNO Financial Group, Inc. | 85,013 | 2,052,214 | |||||||||||||
| Fidelity National Financial, Inc. | 52,471 | 2,513,886 | |||||||||||||
| Markel Corp.B | 804 | 1,055,757 | |||||||||||||
| Reinsurance Group of America, Inc. | 14,746 | 1,741,208 | |||||||||||||
| Willis Towers Watson PLC | 7,098 | 1,719,703 | |||||||||||||
|
| ||||||||||||||
| 21,059,448 | |||||||||||||||
|
| ||||||||||||||
Total Financials | 52,733,462 | ||||||||||||||
|
| ||||||||||||||
| Health Care - 6.95% | |||||||||||||||
| Health Care Equipment & Supplies - 2.68% | |||||||||||||||
| Envista Holdings Corp.B | 23,509 | 919,202 | |||||||||||||
| Hologic, Inc.B | 18,856 | 1,382,333 | |||||||||||||
| LivaNova PLCB | 17,952 | 1,377,277 | |||||||||||||
| Zimmer Biomet Holdings, Inc. | 12,515 | 1,791,147 | |||||||||||||
|
| ||||||||||||||
| 5,469,959 | |||||||||||||||
|
| ||||||||||||||
| Health Care Providers & Services - 3.44% | |||||||||||||||
| Cardinal Health, Inc. | 16,729 | 799,814 | |||||||||||||
| Encompass Health Corp. | 20,812 | 1,322,811 | |||||||||||||
| Fresenius Medical Care AG & Co. KGaA, ADR | 36,600 | 1,216,218 | |||||||||||||
| McKesson Corp. | 8,159 | 1,696,093 | |||||||||||||
| Universal Health Services, Inc., Class B | 15,964 | 1,981,132 | |||||||||||||
|
| ||||||||||||||
| 7,016,068 | |||||||||||||||
|
| ||||||||||||||
| Pharmaceuticals - 0.83% | |||||||||||||||
| Perrigo Co. PLC | 37,286 | 1,683,463 | |||||||||||||
|
| ||||||||||||||
Total Health Care | 14,169,490 | ||||||||||||||
|
| ||||||||||||||
| Industrials - 16.86% | |||||||||||||||
| Aerospace & Defense - 2.26% | |||||||||||||||
| BWX Technologies, Inc. | 35,876 | 2,035,604 | |||||||||||||
| L3Harris Technologies, Inc. | 7,280 | 1,678,331 | |||||||||||||
| TransDigm Group, Inc.B | 1,447 | 902,668 | |||||||||||||
|
| ||||||||||||||
| 4,616,603 | |||||||||||||||
|
| ||||||||||||||
| Airlines - 0.24% | |||||||||||||||
| Alaska Air Group, Inc.B | 9,105 | 480,744 | |||||||||||||
|
| ||||||||||||||
| Building Products - 2.33% | |||||||||||||||
| Carlisle Cos., Inc. | 8,372 | 1,866,286 | |||||||||||||
| JELD-WEN Holding, Inc.B | 79,999 | 2,192,773 | |||||||||||||
| Owens Corning | 7,455 | 696,371 | |||||||||||||
|
| ||||||||||||||
| 4,755,430 | |||||||||||||||
|
| ||||||||||||||
| Commercial Services & Supplies - 0.98% | |||||||||||||||
| Republic Services, Inc. | 14,824 | 1,995,310 | |||||||||||||
|
| ||||||||||||||
See accompanying notes
31
American Beacon Mid-Cap Value FundSM
Schedule of Investments
October 31, 2021
| Shares | Fair Value | ||||||||||||||
| COMMON STOCKS - 98.01% (continued) | |||||||||||||||
| Industrials - 16.86% (continued) | |||||||||||||||
| Construction & Engineering - 1.45% | |||||||||||||||
| AECOMB | 26,530 | $ | 1,813,856 | ||||||||||||
| MasTec, Inc.A B | 12,780 | 1,139,082 | |||||||||||||
|
| ||||||||||||||
| 2,952,938 | |||||||||||||||
|
| ||||||||||||||
| Electrical Equipment - 1.83% | |||||||||||||||
| Mirion Technologies, Inc.A B | 165,377 | 1,751,342 | |||||||||||||
| Vertiv Holdings Co. | 76,717 | 1,970,093 | |||||||||||||
|
| ||||||||||||||
| 3,721,435 | |||||||||||||||
|
| ||||||||||||||
| Machinery - 4.46% | |||||||||||||||
| Dover Corp. | 12,109 | 2,047,390 | |||||||||||||
| Fortive Corp. | 13,650 | 1,033,442 | |||||||||||||
| Stanley Black & Decker, Inc. | 9,610 | 1,727,205 | |||||||||||||
| Terex Corp. | 41,810 | 1,873,088 | |||||||||||||
| Westinghouse Air Brake Technologies Corp. | 26,467 | 2,401,351 | |||||||||||||
|
| ||||||||||||||
| 9,082,476 | |||||||||||||||
|
| ||||||||||||||
| Professional Services - 0.68% | |||||||||||||||
| Alight, Inc., Class AB | 63,166 | 687,246 | |||||||||||||
| Jacobs Engineering Group, Inc. | 5,034 | 706,874 | |||||||||||||
|
| ||||||||||||||
| 1,394,120 | |||||||||||||||
|
| ||||||||||||||
| Road & Rail - 1.20% | |||||||||||||||
| JB Hunt Transport Services, Inc. | 9,130 | 1,800,345 | |||||||||||||
| Ryder System, Inc. | 7,548 | 641,202 | |||||||||||||
|
| ||||||||||||||
| 2,441,547 | |||||||||||||||
|
| ||||||||||||||
| Trading Companies & Distributors - 1.43% | |||||||||||||||
| AerCap Holdings NVB | 49,411 | 2,917,226 | |||||||||||||
|
| ||||||||||||||
Total Industrials | 34,357,829 | ||||||||||||||
|
| ||||||||||||||
| Information Technology - 3.55% | |||||||||||||||
| Electronic Equipment, Instruments & Components - 1.12% | |||||||||||||||
| Avnet, Inc. | 59,920 | 2,283,551 | |||||||||||||
|
| ||||||||||||||
| IT Services - 0.81% | |||||||||||||||
| Cognizant Technology Solutions Corp., Class A | 21,092 | 1,647,074 | |||||||||||||
|
| ||||||||||||||
| Semiconductors & Semiconductor Equipment - 0.80% | |||||||||||||||
| Microchip Technology, Inc. | 22,018 | 1,631,314 | |||||||||||||
|
| ||||||||||||||
| Software - 0.18% | |||||||||||||||
| SS&C Technologies Holdings, Inc. | 4,526 | 359,681 | |||||||||||||
|
| ||||||||||||||
| Technology Hardware, Storage & Peripherals - 0.64% | |||||||||||||||
| Hewlett Packard Enterprise Co. | 89,655 | 1,313,446 | |||||||||||||
|
| ||||||||||||||
Total Information Technology | 7,235,066 | ||||||||||||||
|
| ||||||||||||||
| Materials - 8.03% | |||||||||||||||
| Chemicals - 6.51% | |||||||||||||||
| Axalta Coating Systems Ltd.B | 68,889 | 2,148,648 | |||||||||||||
| Corteva, Inc. | 23,995 | 1,035,384 | |||||||||||||
| Dow, Inc. | 29,456 | 1,648,652 | |||||||||||||
See accompanying notes
32
American Beacon Mid-Cap Value FundSM
Schedule of Investments
October 31, 2021
| Shares | Fair Value | ||||||||||||||
| COMMON STOCKS - 98.01% (continued) | |||||||||||||||
| Materials - 8.03% (continued) | |||||||||||||||
| Chemicals - 6.51% (continued) | |||||||||||||||
| Eastman Chemical Co. | 10,194 | $ | 1,060,482 | ||||||||||||
| Element Solutions, Inc. | 135,261 | 3,071,777 | |||||||||||||
| International Flavors & Fragrances, Inc. | 13,811 | 2,036,432 | |||||||||||||
| Olin Corp. | 39,880 | 2,272,363 | |||||||||||||
|
| ||||||||||||||
| 13,273,738 | |||||||||||||||
|
| ||||||||||||||
| Containers & Packaging - 0.92% | |||||||||||||||
| Sealed Air Corp. | 31,461 | 1,866,267 | |||||||||||||
|
| ||||||||||||||
| Metals & Mining - 0.60% | |||||||||||||||
| Arconic Corp.B | 41,667 | 1,225,843 | |||||||||||||
|
| ||||||||||||||
Total Materials | 16,365,848 | ||||||||||||||
|
| ||||||||||||||
| Real Estate - 4.45% | |||||||||||||||
| Equity Real Estate Investment Trusts (REITs) - 4.05% | |||||||||||||||
| American Campus Communities, Inc. | 19,724 | 1,059,573 | |||||||||||||
| AvalonBay Communities, Inc. | 4,332 | 1,025,298 | |||||||||||||
| Lamar Advertising Co., Class A | 10,141 | 1,147,961 | |||||||||||||
| MGM Growth Properties LLC, Class A | 75,512 | 2,973,663 | |||||||||||||
| STAG Industrial, Inc. | 23,899 | 1,040,324 | |||||||||||||
| VICI Properties, Inc.A | 34,627 | 1,016,302 | |||||||||||||
|
| ||||||||||||||
| 8,263,121 | |||||||||||||||
|
| ||||||||||||||
| Real Estate Management & Development - 0.40% | |||||||||||||||
| Howard Hughes Corp.B | 9,290 | 809,437 | |||||||||||||
|
| ||||||||||||||
Total Real Estate | 9,072,558 | ||||||||||||||
|
| ||||||||||||||
| Utilities - 5.74% | |||||||||||||||
| Electric Utilities - 4.25% | |||||||||||||||
| Edison International | 39,645 | 2,494,860 | |||||||||||||
| Entergy Corp. | 19,539 | 2,012,908 | |||||||||||||
| Evergy, Inc. | 27,903 | 1,778,816 | |||||||||||||
| NRG Energy, Inc. | 59,414 | 2,370,025 | |||||||||||||
|
| ||||||||||||||
| 8,656,609 | |||||||||||||||
|
| ||||||||||||||
| Gas Utilities - 0.55% | |||||||||||||||
| UGI Corp. | 25,932 | 1,125,708 | |||||||||||||
|
| ||||||||||||||
| Multi-Utilities - 0.94% | |||||||||||||||
| CenterPoint Energy, Inc. | 73,608 | 1,916,752 | |||||||||||||
|
| ||||||||||||||
Total Utilities | 11,699,069 | ||||||||||||||
|
| ||||||||||||||
Total Common Stocks (Cost $137,941,340) | 199,716,717 | ||||||||||||||
|
| ||||||||||||||
| SHORT-TERM INVESTMENTS - 2.61% (Cost $5,317,283) | |||||||||||||||
| Investment Companies - 2.61% | |||||||||||||||
| American Beacon U.S. Government Money Market Select Fund, 0.01%C D | 5,317,283 | 5,317,283 | |||||||||||||
|
| ||||||||||||||
| SECURITIES LENDING COLLATERAL - 0.33% (Cost $671,946) | |||||||||||||||
| Investment Companies - 0.33% | |||||||||||||||
| American Beacon U.S. Government Money Market Select Fund, 0.01%C D | 671,946 | 671,946 | |||||||||||||
|
| ||||||||||||||
TOTAL INVESTMENTS - 100.95% (Cost $143,930,569) | 205,705,946 | ||||||||||||||
LIABILITIES, NET OF OTHER ASSETS - (0.95%) | (1,928,850 | ) | |||||||||||||
|
| ||||||||||||||
TOTAL NET ASSETS - 100.00% | $ | 203,777,096 | |||||||||||||
|
| ||||||||||||||
| Percentages are stated as a percent of net assets. | |||||||||||||||
See accompanying notes
33
American Beacon Mid-Cap Value FundSM
Schedule of Investments
October 31, 2021
A All or a portion of this security is on loan, collateralized by either cash and/or U.S. Treasuries, at October 31, 2021 (Note 9).
B Non-income producing security.
C The Fund is affiliated by having the same investment advisor.
D 7-day yield.
ADR - American Depositary Receipt.
LLC - Limited Liability Company.
PLC - Public Limited Company.
| Long Futures Contracts Open on October 31, 2021: |
| |||||||||||||||
| Equity Futures Contracts | ||||||||||||||||
| Description | Number of Contracts | Expiration Date | Notional Amount | Contract Value | Unrealized Appreciation (Depreciation) | |||||||||||
| S&P MidCap 400 E-Mini Index | 18 | December 2021 | $ | 4,939,572 | $ | 5,020,920 | $ | 81,348 | ||||||||
|
|
|
|
|
| |||||||||||
| $ | 4,939,572 | $ | 5,020,920 | $ | 81,348 | |||||||||||
|
|
|
|
|
| |||||||||||
| Index Abbreviations: | ||
| S&P MidCap 400 | Standard & Poor’s Midcap 400 Index. | |
The Fund’s investments are summarized by level based on the inputs used to determine their values. As of October 31, 2021, the investments were classified as described below:
Mid-Cap Value Fund | Level 1 | Level 2 | Level 3 | Total | ||||||||||||||||||||||||
Assets | ||||||||||||||||||||||||||||
Common Stocks | $ | 199,716,717 | $ | - | $ | - | $ | 199,716,717 | ||||||||||||||||||||
Short-Term Investments | 5,317,283 | - | - | 5,317,283 | ||||||||||||||||||||||||
Securities Lending Collateral | 671,946 | - | - | 671,946 | ||||||||||||||||||||||||
|
|
|
|
|
|
|
| |||||||||||||||||||||
Total Investments in Securities - Assets | $ | 205,705,946 | $ | - | $ | - | $ | 205,705,946 | ||||||||||||||||||||
|
|
|
|
|
|
|
| |||||||||||||||||||||
Financial Derivative Instruments - Assets |
| |||||||||||||||||||||||||||
Futures Contracts | $ | 81,348 | $ | - | $ | - | $ | 81,348 | ||||||||||||||||||||
|
|
|
|
|
|
|
| |||||||||||||||||||||
Total Financial Derivative Instruments - Assets | $ | 81,348 | $ | - | $ | - | $ | 81,348 | ||||||||||||||||||||
|
|
|
|
|
|
|
| |||||||||||||||||||||
U.S. GAAP requires transfers between all levels to/from level 3 be disclosed. During the year ended October 31, 2021, there were no transfers into or out of Level 3.
See accompanying notes
34
Statements of Assets and Liabilities
October 31, 2021
| Balanced Fund | Mid-Cap Value Fund | |||||||||||
Assets: | ||||||||||||
Investments in unaffiliated securities, at fair value† § | $ | 184,065,687 | $ | 199,716,717 | ||||||||
Investments in affiliated securities, at fair value‡ | 4,626,652 | 5,989,229 | ||||||||||
Cash collateral held at broker for futures contracts | 213,000 | 203,000 | ||||||||||
Dividends and interest receivable | 481,884 | 71,240 | ||||||||||
Receivable for investments sold | 1,102,103 | 1,418,946 | ||||||||||
Receivable for fund shares sold | 16,301 | 152,601 | ||||||||||
Receivable for tax reclaims | 1,969 | – | ||||||||||
Receivable for expense reimbursement (Note 2) | – | 86,760 | ||||||||||
Receivable for variation margin on open futures contracts (Note 5) | 172,622 | 81,359 | ||||||||||
Prepaid expenses | 33,065 | 31,046 | ||||||||||
|
|
|
| |||||||||
Total assets | 190,713,283 | 207,750,898 | ||||||||||
|
|
|
| |||||||||
Liabilities: | ||||||||||||
Payable for investments purchased | 1,004,236 | 1,339,416 | ||||||||||
Payable for fund shares redeemed | 105,344 | 1,592,415 | ||||||||||
Cash due to broker for futures contracts | 165,532 | 80,718 | ||||||||||
Management and sub-advisory fees payable (Note 2) | 143,677 | 143,073 | ||||||||||
Service fees payable (Note 2) | 33,178 | 21,540 | ||||||||||
Transfer agent fees payable (Note 2) | 7,267 | 8,086 | ||||||||||
Payable upon return of securities loaned (Note 9)§ | 572,921 | 671,946 | ||||||||||
Custody and fund accounting fees payable | 29,820 | 28,019 | ||||||||||
Professional fees payable | 55,942 | 58,797 | ||||||||||
Trustee fees payable (Note 2) | 993 | 1,084 | ||||||||||
Payable for prospectus and shareholder reports | 11,876 | 17,524 | ||||||||||
Other liabilities | 4,058 | 11,184 | ||||||||||
|
|
|
| |||||||||
Total liabilities | 2,134,844 | 3,973,802 | ||||||||||
|
|
|
| |||||||||
Net assets | $ | 188,578,439 | $ | 203,777,096 | ||||||||
|
|
|
| |||||||||
Analysis of net assets: | ||||||||||||
Paid-in-capital | $ | 137,968,229 | $ | 127,782,959 | ||||||||
Total distributable earnings (deficits)A | 50,610,210 | 75,994,137 | ||||||||||
|
|
|
| |||||||||
Net assets | $ | 188,578,439 | $ | 203,777,096 | ||||||||
|
|
|
| |||||||||
See accompanying notes
35
American Beacon FundsSM
Statements of Assets and Liabilities
October 31, 2021
| Balanced Fund | Mid-Cap Value Fund | |||||||||||
Shares outstanding at no par value (unlimited shares authorized): | ||||||||||||
R5 Class | 1,340,278 | 3,652,514 | ||||||||||
|
|
|
| |||||||||
Y Class | 2,393,389 | 2,470,355 | ||||||||||
|
|
|
| |||||||||
Investor Class | 5,939,068 | 2,894,308 | ||||||||||
|
|
|
| |||||||||
Advisor Class | 135,987 | 32,960 | ||||||||||
|
|
|
| |||||||||
A Class | 973,076 | 182,431 | ||||||||||
|
|
|
| |||||||||
C Class | 1,638,042 | 126,185 | ||||||||||
|
|
|
| |||||||||
R6 Class | N/A | 613,140 | ||||||||||
|
|
|
| |||||||||
Net assets: | ||||||||||||
R5 Class | $ | 22,687,613 | $ | 74,512,300 | ||||||||
|
|
|
| |||||||||
Y Class | $ | 40,858,765 | $ | 49,952,999 | ||||||||
|
|
|
| |||||||||
Investor Class | $ | 85,251,213 | $ | 60,065,449 | ||||||||
|
|
|
| |||||||||
Advisor Class | $ | 2,120,450 | $ | 656,892 | ||||||||
|
|
|
| |||||||||
A Class | $ | 13,922,687 | $ | 3,639,123 | ||||||||
|
|
|
| |||||||||
C Class | $ | 23,737,711 | $ | 2,417,639 | ||||||||
|
|
|
| |||||||||
R6 Class | N/A | $ | 12,532,694 | |||||||||
|
|
|
| |||||||||
Net asset value, offering and redemption price per share: | ||||||||||||
R5 Class | $ | 16.93 | $ | 20.40 | ||||||||
|
|
|
| |||||||||
Y Class | $ | 17.07 | $ | 20.22 | ||||||||
|
|
|
| |||||||||
Investor Class | $ | 14.35 | $ | 20.75 | ||||||||
|
|
|
| |||||||||
Advisor Class | $ | 15.59 | $ | 19.93 | ||||||||
|
|
|
| |||||||||
A Class | $ | 14.31 | $ | 19.95 | ||||||||
|
|
|
| |||||||||
A Class (offering price) | $ | 15.18 | $ | 21.17 | ||||||||
|
|
|
| |||||||||
C Class | $ | 14.49 | $ | 19.16 | ||||||||
|
|
|
| |||||||||
R6 Class | N/A | $ | 20.44 | |||||||||
|
|
|
| |||||||||
† Cost of investments in unaffiliated securities | $ | 147,086,360 | $ | 137,941,340 | ||||||||
‡ Cost of investments in affiliated securities | $ | 4,626,652 | $ | 5,989,229 | ||||||||
§ Fair value of securities on loan | $ | 3,900,043 | $ | 2,899,350 | ||||||||
A The Fund’s investments in affiliated securities did not have unrealized appreciation (depreciation) at year end. |
| |||||||||||
See accompanying notes
36
American Beacon FundsSM
Statements of Operations
For the year ended October 31, 2021
| Balanced Fund | Mid-Cap Value Fund | |||||||||||
Investment income: | ||||||||||||
Dividend income from unaffiliated securities (net of foreign taxes)† | $ | 2,227,140 | $ | 4,320,572 | A | |||||||
Dividend income from affiliated securities (Note 2) | 467 | 746 | ||||||||||
Interest income (net of foreign taxes) | 1,639,998 | – | ||||||||||
Income derived from securities lending (Note 9) | 20,294 | 7,501 | ||||||||||
|
|
|
| |||||||||
Total investment income | 3,887,899 | 4,328,819 | ||||||||||
|
|
|
| |||||||||
Expenses: | ||||||||||||
Management and sub-advisory fees (Note 2) | 960,603 | 1,891,184 | ||||||||||
Transfer agent fees: | ||||||||||||
R5 Class (Note 2) | 5,575 | 24,069 | ||||||||||
Y Class (Note 2) | 39,369 | 52,338 | ||||||||||
Investor Class | 7,091 | 4,602 | ||||||||||
Advisor Class | 216 | 1,467 | ||||||||||
A Class | 669 | 561 | ||||||||||
C Class | 1,487 | 954 | ||||||||||
R6 Class | – | 455 | ||||||||||
Custody and fund accounting fees | 59,623 | 57,934 | ||||||||||
Professional fees | 93,499 | 192,218 | ||||||||||
Registration fees and expenses | 81,537 | 94,407 | ||||||||||
Service fees (Note 2): | ||||||||||||
Investor Class | 255,866 | 233,730 | ||||||||||
Advisor Class | 4,618 | 1,996 | ||||||||||
A Class | 11,684 | 5,274 | ||||||||||
C Class | 18,636 | 2,963 | ||||||||||
Distribution fees (Note 2): | ||||||||||||
Advisor Class | 5,173 | 2,141 | ||||||||||
A Class | 31,913 | 9,570 | ||||||||||
C Class | 259,316 | 29,688 | ||||||||||
Prospectus and shareholder report expenses | 29,984 | 37,275 | ||||||||||
Trustee fees (Note 2) | 12,591 | 15,061 | ||||||||||
Loan expense (Note 10) | 927 | 1,856 | ||||||||||
Other expenses | 31,848 | 45,548 | ||||||||||
|
|
|
| |||||||||
Total expenses | 1,912,225 | 2,705,291 | ||||||||||
|
|
|
| |||||||||
Net fees waived and expenses (reimbursed) / recouped (Note 2) | – | (342,190 | ) | |||||||||
|
|
|
| |||||||||
Net expenses | 1,912,225 | 2,363,101 | ||||||||||
|
|
|
| |||||||||
Net investment income | 1,975,674 | 1,965,718 | ||||||||||
|
|
|
| |||||||||
Realized and unrealized gain (loss) from investments: | ||||||||||||
Net realized gain (loss) from: | ||||||||||||
Investments in unaffiliated securitiesB | 13,253,473 | 47,545,654 | ||||||||||
Commission recapture (Note 1) | – | 16,284 | ||||||||||
Foreign currency transactions | – | (8 | ) | |||||||||
Futures contracts | 1,298,422 | 3,580,590 | ||||||||||
Change in net unrealized appreciation of: | ||||||||||||
Investments in unaffiliated securitiesC | 36,225,712 | 64,223,874 | ||||||||||
Futures contracts | 299,343 | 76,327 | ||||||||||
|
|
|
| |||||||||
Net gain from investments | 51,076,950 | 115,442,721 | ||||||||||
|
|
|
| |||||||||
Net increase in net assets resulting from operations | $ | 53,052,624 | $ | 117,408,439 | ||||||||
|
|
|
| |||||||||
† Foreign taxes | $ | 15,296 | $ | 3,405 | ||||||||
A Includes significant dividends from one issuer of $453,636. |
| |||||||||||
B The Fund did not recognize net realized gains (losses) from the sale of investments in affiliated securities. |
| |||||||||||
C The Fund’s investments in affiliated securities did not have a change in unrealized appreciation (depreciation) at year end. |
| |||||||||||
See accompanying notes
37
American Beacon FundsSM
Statements of Changes in Net Assets
| Balanced Fund | Mid-Cap Value Fund | |||||||||||||||||||||||||||
| Year Ended October 31, 2021 | Year Ended October 31, 2020 | Year Ended October 31, 2021 | Year Ended October 31, 2020 | |||||||||||||||||||||||||
Increase (decrease) in net assets: | ||||||||||||||||||||||||||||
Operations: | ||||||||||||||||||||||||||||
Net investment income | $ | 1,975,674 | $ | 3,018,158 | $ | 1,965,718 | $ | 4,721,907 | ||||||||||||||||||||
Net realized gain (loss) from investments in unaffiliated securities, commission recapture, foreign currency transactions and futures contracts | 14,551,895 | 20,492,813 | 51,142,520 | (10,993,331 | ) | |||||||||||||||||||||||
Change in net unrealized appreciation (depreciation) of investments in unaffiliated securities and futures contracts | 36,525,055 | (33,734,462 | ) | 64,300,201 | (54,393,925 | ) | ||||||||||||||||||||||
|
|
|
|
|
|
|
| |||||||||||||||||||||
Net increase (decrease) in net assets resulting from operations | 53,052,624 | (10,223,491 | ) | 117,408,439 | (60,665,349 | ) | ||||||||||||||||||||||
|
|
|
|
|
|
|
| |||||||||||||||||||||
Distributions to shareholders: |
| |||||||||||||||||||||||||||
Total retained earnings: | ||||||||||||||||||||||||||||
R5 Class | (2,868,929 | ) | (3,590,716 | ) | (1,595,645 | ) | (2,382,518 | ) | ||||||||||||||||||||
Y Class | (5,530,045 | ) | (5,090,722 | ) | (883,163 | ) | (1,359,606 | ) | ||||||||||||||||||||
Investor Class | (10,889,450 | ) | (8,793,706 | ) | (515,548 | ) | (3,045,660 | ) | ||||||||||||||||||||
Advisor Class | (246,705 | ) | (184,147 | ) | (19,048 | ) | (37,713 | ) | ||||||||||||||||||||
A Class | (1,705,799 | ) | (1,532,023 | ) | (60,706 | ) | (36,488 | ) | ||||||||||||||||||||
C Class | (3,318,336 | ) | (2,715,840 | ) | (26,795 | ) | (26,609 | ) | ||||||||||||||||||||
R6 Class | – | – | (218,896 | ) | (57,137 | ) | ||||||||||||||||||||||
|
|
|
|
|
|
|
| |||||||||||||||||||||
Net distributions to shareholders | (24,559,264 | ) | (21,907,154 | ) | (3,319,801 | ) | (6,945,731 | ) | ||||||||||||||||||||
|
|
|
|
|
|
|
| |||||||||||||||||||||
Capital share transactions (Note 11): | ||||||||||||||||||||||||||||
Proceeds from sales of shares | 41,247,243 | 38,024,184 | 55,028,276 | 73,144,682 | ||||||||||||||||||||||||
Reinvestment of dividends and distributions | 23,515,594 | 21,072,153 | 3,286,217 | 6,914,103 | ||||||||||||||||||||||||
Cost of shares redeemed | (77,566,519 | ) | (112,808,124 | ) | (257,462,469 | ) | (219,732,201 | ) | ||||||||||||||||||||
|
|
|
|
|
|
|
| |||||||||||||||||||||
Net (decrease) in net assets from capital share transactions | (12,803,682 | ) | (53,711,787 | ) | (199,147,976 | ) | (139,673,416 | ) | ||||||||||||||||||||
|
|
|
|
|
|
|
| |||||||||||||||||||||
Net increase (decrease) in net assets | 15,689,678 | (85,842,432 | ) | (85,059,338 | ) | (207,284,496 | ) | |||||||||||||||||||||
|
|
|
|
|
|
|
| |||||||||||||||||||||
Net assets: | ||||||||||||||||||||||||||||
Beginning of year | 172,888,761 | 258,731,193 | 288,836,434 | 496,120,930 | ||||||||||||||||||||||||
|
|
|
|
|
|
|
| |||||||||||||||||||||
End of year | $ | 188,578,439 | $ | 172,888,761 | $ | 203,777,096 | $ | 288,836,434 | ||||||||||||||||||||
|
|
|
|
|
|
|
| |||||||||||||||||||||
See accompanying notes
38
Notes to Financial Statements
October 31, 2021
1. Organization and Significant Accounting Policies
American Beacon Funds (the “Trust”) is organized as a Massachusetts business trust. The Funds, each a series within the Trust, are registered under the Investment Company Act of 1940, as amended (the “Act”), as diversified, open-end management investment companies. As of October 31, 2021, the Trust consists of twenty-eight active series, two of which are presented in this filing: American Beacon Balanced Fund and American Beacon Mid-Cap Value Fund (collectively, the “Funds” and each individually a “Fund”). The remaining twenty-six active series are reported in separate filings.
American Beacon Advisors, Inc. (the “Manager”) is a Delaware corporation and a wholly-owned subsidiary of Resolute Investment Managers, Inc. (“RIM”) organized in 1986 to provide business management, advisory, administrative, and asset management consulting services to the Trust and other investors. The Manager is registered as an investment advisor under the Investment Advisers Act of 1940, as amended (the “Advisers Act”). RIM is, in turn, a wholly-owned subsidiary of Resolute Acquisition, Inc., which is a wholly-owned subsidiary of Resolute Topco, Inc., a wholly-owned subsidiary of Resolute Investment Holdings, LLC (“RIH”). RIH is owned primarily by Kelso Investment Associates VIII, L.P., KEP VI, LLC and Estancia Capital Partners L.P., investment funds affiliated with Kelso & Company, L.P. (“Kelso”) or Estancia Capital Management, LLC (“Estancia”), which are private equity firms.
Recently Adopted Accounting Pronouncements
In March 2020, the Financial Accounting Standards Board (“FASB”) issued Accounting Standards Update (“ASU”) 2020-04, which provides optional expedients and exceptions for contracts, hedging relationships and other transactions affected by the transitioning away from the London Interbank Offered Rate (“LIBOR”) and other reference rates that are expected to be discontinued. The amendments in this ASU are effective for all entities as of March 12, 2020 through December 31, 2022. At this time, management is evaluating the implications of these changes on the financial statements.
In October 2020, the U.S. Securities and Exchange Commission (“SEC”) adopted new regulations governing the use of derivatives by registered investment companies. Rule 18f-4 will impose limits on the amount of derivatives a fund could enter into, eliminate the asset segregation framework currently used by funds to comply with Section 18 of the Act, and require funds whose use of derivatives is more than a limited specified exposure to establish and maintain a derivatives risk management program and appoint a derivatives risk manager. While the new rule became effective February 19, 2021, funds will not be required to fully comply with the new rule until August 19, 2022. It is not currently clear what impact, if any, the new rule will have on the availability, liquidity or performance of derivatives. When fully implemented, the new rule may require changes in how a fund will use derivatives, may adversely affect a fund’s performance and may increase costs related to a fund’s use of derivatives.
39
American Beacon FundsSM
Notes to Financial Statements
October 31, 2021
Class Disclosure
Each Fund has multiple classes of shares designed to meet the needs of different groups of investors; however, not all of the Funds offer all classes. The following table sets forth the differences amongst the classes:
Class | Eligible Investors | Minimum Initial Investments | ||||
| R5 Class | Large institutional investors - sold directly or through intermediary channels. | $ | 250,000 | |||
| Y Class | Large institutional retirement plan investors - sold directly or through intermediary channels. | $ | 100,000 | |||
| Investor Class | All investors using intermediary organizations, such as broker-dealers or retirement plan sponsors. | $ | 2,500 | |||
| Advisor Class | All investors who invest through intermediary organizations, such as broker-dealers or third party administrators. | $ | 2,500 | |||
| A Class | All investors who invest through intermediary organizations, such as broker-dealers or third party administrator. Retail investors who invest directly through a financial intermediary such as a broker, bank, or registered investment advisor which may include a front-end sales charge and a contingent deferred sales charge (“CDSC”). | $ | 2,500 | |||
| C Class | Retail investors who invest directly through a financial intermediary such as a broker or through employee directed benefit plans with applicable sales charges which may include CDSC. | $ | 1,000 | |||
| R6 Class | Large institutional retirement plan investors - sold through retirement plan sponsors. | None | ||||
Each class offered by the Trust has equal rights as to assets and voting privileges. Income and non-class specific expenses are allocated daily to each class based on the relative net assets. Realized and unrealized capital gains and losses of each class are allocated daily based on the relative net assets of each class of the respective Fund. Class specific expenses, where applicable, currently include service, distribution, transfer agent fees, and sub-transfer agent fees that vary amongst the classes as described more fully in Note 2.
Significant Accounting Policies
The following is a summary of significant accounting policies, consistently followed by the Funds in preparation of the financial statements. The Funds are considered investment companies and accordingly, follow the investment company accounting and reporting guidance of the FASB Accounting Standards Codification Topic 946, Financial Services – Investment Companies, a part of Generally Accepted Accounting Principles (“U.S. GAAP”).
Security Transactions and Investment Income
Security transactions are recorded as of the trade date for financial reporting purposes. Securities purchased or sold on a when-issued or delayed-delivery basis may be settled beyond a standard settlement period for the security after the trade date.
Dividend income, net of foreign taxes, is recorded on the ex-dividend date, except certain dividends from foreign securities which are recorded as soon as the information is available to the Funds. Tax reclaim accruals are automatically generated on accounting and custody systems at the time of the income event based on the tax databases maintained by the Funds’ custodian. Reconciliations are performed between custody and accounting systems to help ensure reclaim accruals are in line. Interest income, net of foreign taxes, is earned from settlement date, recorded on the accrual basis, and adjusted, if necessary, for accretion of discounts and amortization of premiums. For convertible securities, premiums attributable to the conversion feature are not amortized. Realized gains (losses) from securities sold are determined on the basis of specific lot identification.
40
American Beacon FundsSM
Notes to Financial Statements
October 31, 2021
Estimated tax liabilities on certain foreign securities are recorded on an accrual basis and are reflected as components of interest income or net change in unrealized appreciation (depreciation) on investments on the Statements of Operations, as appropriate. Tax liabilities realized as a result of such security sales are reflected as a component of net realized gain (loss) on investments on the Statements of Operations. Paydown gains (losses) on mortgage-related and other asset-backed securities, if any, are recorded as components of interest income on the Statements of Operations. Income or short-term capital gain distributions received from registered investment companies, if any, are recorded as dividend income. Long-term gain distributions received from registered investment companies, if any, are recorded as realized gains.
Debt obligations may be placed on a non-accrual status and related interest income may be reduced by ceasing current accruals and writing off interest receivable when the collection of all or a portion of interest has become doubtful based on consistently applied procedures. A debt obligation is removed for non-accrual when the issuer resumes interest payments or when collectability of interest is probable. Realized gains (losses) from securities sold are determined on the basis of specific lot identification.
Distributions to Shareholders
The Balanced Fund distributes most or all of its net earnings and realized gains, if any, each taxable year in the form of dividends from net investment income on a quarterly basis and distributions of realized net capital gains and net gains or losses from foreign currency transactions on an annual basis. The Mid-Cap Value Fund distributes most or all of its net earnings and realized gains, if any, each taxable year in the form of dividends from net investment income and distributions of realized net capital gains and net gains or losses from foreign currency transactions on an annual basis. The Funds do not have a fixed dividend rate and do not guarantee that they will pay any distributions in any particular period. Dividends to shareholders are determined in accordance with federal income tax regulations, which may differ in amount and character from net investment income and realized gains recognized for purposes of U.S. GAAP. To the extent necessary to fully distribute capital gains, the Funds may designate earnings and profits distributed to shareholders on the redemption of shares.
Commission Recapture
The Funds have established brokerage commission recapture arrangements with certain brokers or dealers. If the Funds’ investment advisor chooses to execute a transaction through a participating broker, the broker rebates a portion of the commission back to the Funds. Any collateral benefit received through participation in the commission recapture program is directed exclusively to the Funds. This amount is reported with the net realized gain (loss) in the Funds’ Statements of Operations, if applicable.
Allocation of Income, Trust Expenses, Gains, and Losses
Investment income, realized and unrealized gains and losses from investments of the Funds are allocated daily to each class of shares based upon the relative proportion of net assets of each class to the total net assets of the Funds. Expenses directly charged or attributable to a Fund will be paid from the assets of a Fund. Generally, expenses of the Trust will be allocated among and charged to the assets of the Funds on a basis that the Trust’s Board of Trustees (the “Board”) deems fair and equitable, which may be based on the relative net assets of the Funds or nature of the services performed and relative applicability to the Funds.
Use of Estimates
The preparation of financial statements in conformity with U.S. GAAP requires management to make estimates and assumptions that affect the amounts reported in the financial statements and accompanying notes. Actual results may differ from those estimated.
41
American Beacon FundsSM
Notes to Financial Statements
October 31, 2021
Other
Under the Trust’s organizational documents, its officers and trustees are indemnified against certain liabilities arising out of the performance of their duties to the Trust. In the normal course of business, the Trust enters into contracts that provide indemnification to the other party or parties against potential costs or liabilities. The Trust’s maximum exposure under these arrangements is dependent on claims that may be made in the future and, therefore, cannot be estimated. The Trust has had no prior claims or losses pursuant to any such agreement.
2. Transactions with Affiliates
Management and Investment Sub-Advisory Agreements
The Funds and the Manager are parties to a Management Agreement that obligates the Manager to provide the Funds with investment advisory and administrative services. As compensation for performing the duties under the Management Agreement, the Manager will receive an annualized management fee based on a percentage of each Fund’s average daily net assets that is calculated and accrued daily according to the following schedule:
First $15 billion | 0.35 | % | ||
Next $15 billion | 0.325 | % | ||
Over $30 billion | 0.30 | % |
The Trust, on behalf of the Funds, and the Manager have entered into Investment Advisory Agreements with Barrow, Hanley, Mewhinney & Strauss, LLC and Hotchkis and Wiley Capital Management, LLC for the Balanced Fund. In addition, the Manager manages a portion of the Balanced Fund pursuant to the Management Agreement. The Trust, on behalf of the Funds, and the Manager have entered into Investment Advisory Agreements with Barrow, Hanley, Mewhinney & Strauss, LLC; Pzena Investment Management, LLC; and WEDGE Capital Management, LLP for the Mid-Cap Value Fund. Pursuant to the Investment Advisory Agreements, the Funds have agreed to pay an annualized sub-advisory fee that is calculated and accrued daily based on the Funds’ average daily net assets.
The Management and Sub-Advisory Fees paid by the Funds for the year ended October 31, 2021 were as follows:
Balanced Fund
| Effective Fee Rate | Amount of Fees Paid | |||||||||||
Management Fees | 0.35 | % | $ | 659,962 | ||||||||
Sub-Advisor Fees | 0.17 | % | 300,641 | |||||||||
|
|
|
| |||||||||
Total | 0.52 | % | $ | 960,603 | ||||||||
|
|
|
| |||||||||
Mid-Cap Value Fund
| Effective Fee Rate | Amount of Fees Paid | |||||||||||
Management Fees | 0.35 | % | $ | 783,446 | ||||||||
Sub-Advisor Fees | 0.48 | % | 1,107,738 | |||||||||
|
|
|
| |||||||||
Total | 0.83 | % | $ | 1,891,184 | ||||||||
|
|
|
| |||||||||
As compensation for services provided by the Manager in connection with securities lending activities conducted by the Funds, the lending Fund pays to the Manager, with respect to cash collateral posted by borrowers, a fee of 10% of the net monthly interest income (the gross interest income earned by the investment of cash collateral, less the amount paid to borrowers and related expenses) from such activities and, with respect to loan fees paid by borrowers, a fee of 10% of such loan fees. Securities lending income is generated from the
42
American Beacon FundsSM
Notes to Financial Statements
October 31, 2021
demand premium (if any) paid by the borrower to borrow a specific security and from the return on investment of cash collateral, reduced by negotiated rebate fees paid to the borrower and transaction costs. To the extent that a loan is secured by non-cash collateral, securities lending income is generated as a demand premium reduced by transaction costs. These fees are included in “Income derived from securities lending” and “Management and investment advisory fees” on the Statements of Operations. During the year ended October 31, 2021, the Manager received securities lending fees of $2,237 and $930 for the securities lending activities of Balanced Fund and Mid-Cap Value Fund, respectively.
Distribution Plans
Separate Distribution Plans (the “Distribution Plans”) have been adopted pursuant to Rule 12b-1 under the Act for the Advisor, A and C Classes of the Funds. Under the Distribution Plans, as compensation for distribution and shareholder servicing assistance, the Manager receives an annual fee of 0.25% of the average daily net assets of the Advisor and A Classes, and 1.00% of the average daily net assets of the C Class. The fee will be payable without regard to whether the amount of the fee is more or less than the actual expenses incurred in a particular month by the Manager for distribution assistance.
Service Plans
The Manager and the Trust entered into Service Plans that obligate the Manager to oversee additional shareholder servicing of the Investor, Advisor, A and C Classes of the Funds. As compensation for performing the duties required under the Service Plans, the Manager receives an annualized fee up to 0.25% of the average daily net assets of the A and C Classes, up to 0.25% of the average daily net assets of the Advisor Class, and up to 0.375% of the average daily net assets of the Investor Class of the Funds.
Sub-Transfer Agent Fees
The Manager has entered into agreements, which include servicing agreements, with financial intermediaries that provide recordkeeping, processing, shareholder communications and other services to customers of the intermediaries that hold positions in the R5 and Y Classes of the Funds and has agreed to compensate the intermediaries for providing these services. Intermediaries transact with the Funds primarily through the use of omnibus accounts on behalf of their customers who hold positions in the Funds. Certain services would have been provided by the Funds’ transfer agent and other service providers if the shareholders’ accounts were maintained directly by the Funds’ transfer agent. Accordingly, the Funds, pursuant to Board approval, have agreed to reimburse the Manager for certain non-distribution shareholder services provided by financial intermediaries for the R5 and Y Classes. The reimbursement amounts (sub-transfer agent fees) paid to the Manager are subject to a fee limit of up to 0.10% of an intermediary’s average net assets in the R5 and Y Classes on an annual basis. During the year ended October 31, 2021, the sub-transfer agent fees, as reflected in “Transfer agent fees” on the Statements of Operations, were as follows:
Fund | Sub-Transfer Agent Fees | |||
Balanced | $ | 42,229 | ||
Mid-Cap Value | 66,929 | |||
As of October 31, 2021, the Funds owed the Manager the following reimbursement of sub-transfer agent fees, as reflected in “Transfer agent fees payable” on the Statements of Assets and Liabilities:
Fund | Reimbursement Sub-Transfer Agent Fees | |||
Balanced | $ | 5,202 | ||
Mid-Cap Value | 5,329 | |||
43
American Beacon FundsSM
Notes to Financial Statements
October 31, 2021
Investments in Affiliated Funds
The Funds may invest in the American Beacon U.S. Government Money Market Select Fund (the “USG Select Fund”). Cash collateral received by the Funds in connection with securities lending may also be invested in the USG Select Fund. The Funds listed below held the following shares with an October 31, 2021 fair value and dividend income earned from the investment in the USG Select Fund.
Affiliated Security | Type of Transaction | Fund | October 31, 2021 Shares/Principal | Change in Unrealized Gain (Loss) | Realized Gain (Loss) | Dividend Income | October 31, 2021 Fair Value | |||||||||||||||||||||||||||||||||||||||||
| U.S. Government Money Market Select Fund | Direct | Balanced | $ | 4,053,731 | $ | - | $ | - | $ | 467 | $ | 4,053,731 | ||||||||||||||||||||||||||||||||||||
| U.S. Government Money Market Select Fund | Securities Lending | Balanced | 572,921 | - | - | N/A | 572,921 | |||||||||||||||||||||||||||||||||||||||||
| U.S. Government Money Market Select Fund | Direct | Mid-Cap Value | 5,317,283 | - | - | 746 | 5,317,283 | |||||||||||||||||||||||||||||||||||||||||
| U.S. Government Money Market Select Fund | Securities Lending | Mid-Cap Value | 671,946 | - | - | N/A | 671,946 | |||||||||||||||||||||||||||||||||||||||||
The Funds and the USG Select Fund have the same investment advisor and therefore, are considered to be affiliated. The Manager serves as investment advisor to the USG Select Fund and receives management fees and administrative fees totaling 0.10% of the average daily net assets of the USG Select Fund. During the year ended October 31, 2021, the Manager earned fees on the Funds’ direct investments and securities lending collateral investments in the USG Select Fund as shown below:
Fund | Direct Investments in USG Select Fund | Securities Lending Collateral Investments in USG Select Fund | Total | |||||||||
Balanced | $ | 6,053 | $ | 230 | $ | 6,283 | ||||||
Mid-Cap Value | 9,139 | 223 | 9,362 | |||||||||
Interfund Credit Facility
Pursuant to an exemptive order issued by the SEC, the Funds, along with other registered investment companies having management contracts with the Manager, may participate in a credit facility whereby each fund, under certain conditions, is permitted to lend money directly to and borrow directly from other participating funds for temporary purposes. The interfund credit facility is advantageous to the funds because it provides added liquidity and eliminates the need to maintain higher cash balances to meet redemptions. This situation could arise when shareholder redemptions exceed anticipated volumes and certain funds have insufficient cash on hand to satisfy such redemptions or when sales of securities do not settle as expected, resulting in a cash shortfall for a fund. When a fund liquidates portfolio securities to meet redemption requests, they often do not receive payment in settlement for up to two days (or longer for certain foreign transactions). Redemption requests normally are satisfied on the next business day. The credit facility provides a source of immediate, short-term liquidity pending settlement of the sale of portfolio securities. The credit facility is administered by a credit facility team consisting of professionals from the Manager’s asset management, compliance, and accounting areas who report the activities of the credit facility to the Board. During the year ended October 31, 2021, the Balanced Fund did not utilize the credit facility and the Mid-Cap Value Fund borrowed $10,232,971 for 1 day at an interest rate of 0.83% with interest charges of $233. This amount is recorded as “Other expenses” in the Statements of Operations.
44
American Beacon FundsSM
Notes to Financial Statements
October 31, 2021
Expense Reimbursement Plan
The Manager contractually agreed to reduce fees and/or reimburse expenses for the classes of the Mid-Cap Value Fund, through February 28, 2022 to the extent that total operating expenses (excluding taxes, interest, brokerage commissions, acquired fund fees and expenses, securities lending fees, expenses associated with securities sold short, litigation, and other extraordinary expenses) exceed the Funds’ expense cap. During the year ended October 31, 2021, the Manager waived and/or reimbursed expenses as follows:
| Expense Cap | ||||||||||||||||||||||
Fund | Class | 1/11/2020 - 2/28/2021 | 3/1/2021 - 10/31/2021 | Reimbursed Expenses | (Recouped) Expenses | Expiration of Reimbursed Expenses | ||||||||||||||||
Mid-Cap Value | R5 | N/A | 0.91 | % | $ | 107,368 | $ | - | 2023-2024 | |||||||||||||
Mid-Cap Value | Y | N/A | 0.99 | % | 67,180 | - | 2023-2024 | |||||||||||||||
Mid-Cap Value | Investor | N/A | 1.17 | % | 136,113 | - | 2023-2024 | |||||||||||||||
Mid-Cap Value | Advisor | N/A | 1.49 | % | 1,209 | - | 2023-2024 | |||||||||||||||
Mid-Cap Value | A | N/A | 1.26 | % | 5,704 | - | 2023-2024 | |||||||||||||||
Mid-Cap Value | C | N/A | 2.01 | % | 3,846 | - | 2023-2024 | |||||||||||||||
Mid-Cap Value | R6 | 0.87 | % | 0.90 | % | 20,770 | - | 2023-2024 | ||||||||||||||
Of the above amounts, $86,760 was disclosed as a Receivable for expense reimbursement on the Statements of Assets and Liabilities at October 31, 2021 for the Mid-Cap Value Fund.
During the year ended October 31, 2021, there were no reimbursed or recouped expenses for the Balanced Fund.
The Funds have adopted an Expense Reimbursement Plan whereby the Manager may seek repayment of such fee or voluntary reductions and expense reimbursements. Under the policy, the Manager can be reimbursed by the Funds for any contractual or voluntary fee reductions or expense reimbursements if reimbursement to the Manager (a) occurs within three years from the date of the Manager’s waiver/reimbursement and (b) does not cause the Funds’ annual operating expenses to exceed the lesser of the contractual percentage limit in effect at the time of the waiver/reimbursement or time of recoupment. The reimbursed expenses listed above will expire in 2023 and 2024. The Funds did not record a liability for potential reimbursements due to the current assessment that reimbursements are uncertain. The carryover of excess expenses potentially reimbursable to the Manager, but not recorded as a liability are as follows:
Fund | Recouped Expenses | Excess Expense Carryover | Expired Expense Carryover | Expiration of Reimbursed Expenses | ||||||||||||
Mid-Cap Value | $ | - | $ | 6,931 | * | $ | - | 2022-2023 | ||||||||
* Amount related to R6 Class
Sales Commissions
The Funds’ Distributor, Resolute Investment Distributors, Inc. (“RID” or “Distributor”), may receive a portion of Class A sales charges from broker dealers which may be used to offset distribution related expenses. During the year ended October 31, 2021, RID collected $2,699 and $74 for Balanced Fund and Mid-Cap Value Fund, respectively, from the sale of Class A Shares.
A CDSC of 0.50% will be deducted with respect to Class A Shares on certain purchases of $1,000,000 or more that are redeemed in whole or part within 18 months of purchase, unless waived as discussed in the Funds’ Prospectus. Any applicable CDSC will be 0.50% of the lesser of the original purchase price or the value of the redemption of the Class A Shares redeemed. During the year ended October 31, 2021, there were no CDSC fees collected for the Class A Shares of the Funds.
A CDSC of 1.00% will be deducted with respect to Class C Shares redeemed within 12 months of purchase, unless waived as discussed in the Funds’ Prospectus. Any applicable CDSC will be 1.00% of the lesser of the original
45
American Beacon FundsSM
Notes to Financial Statements
October 31, 2021
purchase price or the value of the redemption of the Class C Shares redeemed. During the year ended October 31, 2021, CDSC fees of $485 and $591 were collected for the Class C Shares of Balanced Fund and Mid-Cap Value Fund, respectively.
Trustee Fees and Expenses
Effective January 1, 2021, as compensation for their service to the American Beacon Funds Complex, including the Trust (collectively, the “Trusts”), each Trustee is compensated from the Trusts as follows: (1) an annual retainer of $120,000; (2) meeting attendance fee (for attendance in-person or via teleconference) of (a) $12,000 for in person attendance, or $5,000 for telephonic attendance, by Board members for each regularly scheduled or special Board meeting, (b) $2,500 for attendance by Committee members at meetings of the Audit and Compliance Committee and the Investment Committee, (c) $1,000 for attendance by Committee members at meetings of the Nominating and Governance Committee; and (d) $2,500 for attendance by Board members for each special telephonic Board meeting; and (3) reimbursement of reasonable expenses incurred in attending Board meetings, Committee meetings, and relevant educational seminars. For this purpose, the Board considers attendance at regular meetings held by video conference to constitute in-person attendance at a Board meeting. The Trustees also may be compensated for attendance at special Board and/or Committee meetings from time to time. For her service as Board Chair, Ms. Cline receives an additional annual retainer of $50,000. Although she attends several committee meetings at each quarterly Board meeting, she receives only a single $2,500 fee each quarter for her attendance at those meetings. The chairpersons of the Audit and Compliance Committee and the Investment Committee each receive an additional annual retainer of $25,000 and the Chair of the Nominating and Governance Committee receives an additional annual retainer of $10,000.
3. Security Valuation and Fair Value Measurements
The price of a Fund’s shares is based on its net asset value (“NAV”) per share. A Fund’s NAV is computed by adding total assets, subtracting all the Fund’s liabilities, and dividing the result by the total number of shares outstanding.
The NAV of each class of a Fund’s shares is determined based on a pro rata allocation of a Fund’s investment income, expenses and total capital gains and losses. A Fund’s NAV per share is determined each business day as of the regular close of trading on the New York Stock Exchange (“NYSE” or “Exchange”), which is typically 4:00 p.m. Eastern Time (“ET”). However, if trading on the NYSE closes at a time other than 4:00 p.m. ET, a Fund’s NAV per share typically would still be determined as of the regular close of trading on the NYSE. The Funds do not price their shares on days that the NYSE is closed. Foreign exchanges may permit trading in foreign securities on days when a Fund is not open for business, which may result in the value of a Fund’s portfolio investments being affected at a time when you are unable to buy or sell shares.
Equity securities, including shares of closed-end funds and exchange-traded funds (“ETFs”), are valued at the last sale price or official closing price taken from the primary exchange in which each security trades. Investments in other mutual funds are valued at the closing NAV per share on the day of valuation. Debt securities are valued at bid quotes from broker/dealers or evaluated bid prices from pricing services, who may consider a number of inputs and factors, such as prices of comparable securities, yield curves, spreads, credit ratings, coupon rates, maturity, default rates, and underlying collateral. Futures are valued based on their daily settlement prices. Exchange-traded and over-the-counter (“OTC”) options are valued at the last sale price. Options with no last sale for the day are priced at mid quote. Swaps are valued at evaluated mid prices from pricing services.
The valuation of securities traded on foreign markets and certain fixed-income securities will generally be based on prices determined as of the earlier closing time of the markets on which they primarily trade unless a significant event has occurred. When a Fund holds securities or other assets that are denominated in a foreign currency, a Fund will normally use the currency exchange rates as of 4:00 p.m. ET.
46
American Beacon FundsSM
Notes to Financial Statements
October 31, 2021
Securities may be valued at fair value, as determined in good faith and pursuant to procedures approved by the Board, under certain limited circumstances. For example, fair value pricing will be used when market quotations are not readily available or reliable, as determined by the Manager, such as when (i) trading for a security is restricted or stopped; (ii) a security’s trading market is closed (other than customary closings); or (iii) a security has been de-listed from a national exchange. A security with limited market liquidity may require fair value pricing if the Manager determines that the available price does not reflect the security’s true market value. In addition, if a significant event that the Manager determines to affect the value of one or more securities held by a Fund occurs after the close of a related exchange but before the determination of a Fund’s NAV, fair value pricing may be used on the affected security or securities. Securities of small-capitalization companies are also more likely to require a fair value determination using these procedures because they are more thinly traded and less liquid than the securities of larger-capitalization companies. The Funds may fair value securities as a result of significant events occurring after the close of the foreign markets in which a Fund invests as described below. In addition, the Funds may invest in illiquid securities requiring these procedures.
A Fund may use fair value pricing for securities primarily traded in non-U.S. markets because most foreign markets close well before a Fund’s pricing time of 4:00 p.m. ET. The earlier close of these foreign markets gives rise to the possibility that significant events, including broad market moves, may have occurred in the interim and may materially affect the value of those securities. If the Manager determines that the last quoted prices of non-U.S. securities will, in its judgment, materially affect the value of some or all its portfolio securities, the Manager can adjust the previous closing prices to reflect what it believes to be the fair value of the securities as of the close of the Exchange. In deciding whether it is necessary to adjust closing prices to reflect fair value, the Manager reviews a variety of factors, including developments in foreign markets, the performance of U.S. securities markets, and the performance of instruments trading in U.S. markets that represent foreign securities and baskets of foreign securities. These securities are fair valued using a pricing service, using methods approved by the Board, that considers the correlation of the trading patterns of the foreign security to intraday trading in the U.S. markets, based on indices of domestic securities and other appropriate indicators such as prices of relevant American Depositary Receipts (“ADRs”) and futures contracts. The Valuation Committee, established by the Board, may also fair value securities in other situations, such as when a particular foreign market is closed but a Fund is open. A Fund uses outside pricing services to provide closing prices and information to evaluate and/or adjust those prices. As a means of evaluating its security valuation process, the Valuation Committee routinely compares closing prices, the next day’s opening prices in the same markets and adjusted prices.
Attempts to determine the fair value of securities introduce an element of subjectivity to the pricing of securities. As a result, the price of a security determined through fair valuation techniques may differ from the price quoted or published by other sources and may not accurately reflect the market value of the security when trading resumes. If a reliable market quotation becomes available for a security formerly valued through fair valuation techniques, the Manager compares the new market quotation to the fair value price to evaluate the effectiveness of a Fund’s fair valuation procedures. If any significant discrepancies are found, the Manager may adjust a Fund’s fair valuation procedures.
Valuation Inputs
Various inputs may be used to determine the fair value of the Funds’ investments. These inputs are summarized in three broad levels for financial statement purposes. The inputs or methodologies used to value securities are not necessarily an indication of the risk associated with investing in those securities.
| Level 1 | - | Quoted prices in active markets for identical securities. | ||
| Level 2 | - | Prices determined using other significant observable inputs. These may include quoted prices for similar securities, interest rates, prepayment speeds, credit risk, and others. | ||
| Level 3 | - | Prices determined using other significant unobservable inputs. Unobservable inputs reflect a Fund’s own assumptions about the factors market participants would use in pricing an investment. | ||
47
American Beacon FundsSM
Notes to Financial Statements
October 31, 2021
Level 1 and Level 2 trading assets and trading liabilities, at fair value
Common stocks, preferred securities, and financial derivative instruments, such as futures contracts that are traded on a national securities exchange, are stated at the last reported sale or settlement price on the day of valuation. To the extent these securities are actively traded and valuation adjustments are not applied, they are categorized as Level 1 of the fair value hierarchy. Preferred securities and other equities traded on inactive markets or valued by reference to similar instruments are generally categorized as Level 2 of the fair value hierarchy.
Fixed-income securities including corporate, convertible and municipal bonds and notes, U.S. government agencies, U.S. Treasury obligations, sovereign issues, bank loans, convertible preferred securities, and non-U.S. bonds are normally valued by pricing service providers that use broker dealer quotations, reported trades or valuation estimates from their internal pricing models. The service providers’ internal models use inputs that are observable such as issuer details, interest rates, yield curves, prepayment speeds, credit risks/spreads, default rates, and quoted prices for similar assets. Securities that use similar valuation techniques and inputs as described above are categorized as Level 2 of the fair value hierarchy. Fixed-income securities purchased on a delayed-delivery basis are marked-to-market daily until settlement at the forward settlement date and are categorized as Level 2 of the fair value hierarchy.
Mortgage-related and asset-backed securities (“ABS”) are usually issued as separate tranches, or classes, of securities within each deal. These securities are also normally valued by pricing service providers that use broker-dealer quotations or valuation estimates from their internal pricing models. The pricing models for these securities usually consider tranche-level attributes, current market data, estimated cash flows, and market-based yield spreads for each tranche, and incorporates deal collateral performance, as available. Mortgage-related and ABS that use similar valuation techniques and inputs as described above are categorized as Level 2 of the fair value hierarchy.
Investments in registered open-end investment management companies will be valued based upon the NAVs of such investments and are categorized as Level 1 of the fair value hierarchy.
4. Securities and Other Investments
Agency Mortgage-Backed Securities
Certain mortgage-backed securities (“MBS”) may be issued or guaranteed by the U.S. government or a government sponsored entity, such as the Federal National Mortgage Association (“Fannie Mae”) or the Federal Home Loan Mortgage Corporation (“Freddie Mac”). Although these instruments may be guaranteed by the U.S. government or a government sponsored entity, many such MBS are not backed by the full faith and credit of the United States and are still exposed to the risk of non-payment.
American Depositary Receipts and Non-Voting Depositary Receipts
ADRs are depositary receipts for foreign issuers in registered form traded in U.S. securities markets. Non-Voting Depositary Receipts (“NVDRs”) represent financial interests in an issuer but the holder is not entitled to any voting rights. Depositary receipts may not be denominated in the same currency as the securities into which they may be converted. Investing in depositary receipts entails substantially the same risks as direct investment in foreign securities. There is generally less publicly available information about foreign companies and there may be less governmental regulation and supervision of foreign stock exchanges, brokers, and listed companies. In addition, such companies may use different accounting and financial standards (and certain currencies may become unavailable for transfer from a foreign currency), resulting in the Funds’ possible inability to convert immediately into U.S. currency proceeds realized upon the sale of portfolio securities of the affected foreign companies. In addition, the Funds may invest in unsponsored depositary receipts, the issuers of which are not
48
American Beacon FundsSM
Notes to Financial Statements
October 31, 2021
obligated to disclose material information about the underlying securities to investors in the United States. Ownership of unsponsored depositary receipts may not entitle the Funds to the same benefits and rights as ownership of a sponsored depositary receipt or the underlying security.
Asset-Backed Securities (“ABS”)
ABS are securities issued by trusts and special purpose entities that are backed by pools of assets, such as automobile and credit-card receivables and home equity loans, which pass through the payments on the underlying obligations to the security holders (less servicing fees paid to the originator or fees for any credit enhancement). Typically, loans or accounts receivable paper are transferred from the originator to a specially created trust, which repackages the trust’s interests as securities with a minimum denomination and a specific term. The securities are then privately placed or publicly offered. Examples include certificates for automobile receivables and so-called plastic bonds, backed by credit card receivables. The Balanced Fund is permitted to invest in ABS, subject to a Fund’s rating and quality requirements.
The value of an ABS is affected by, among other things, changes in the market’s perception of the asset backing the security, the creditworthiness of the servicing agent for the loan pool, the originator of the loans and the financial institution providing any credit enhancement. Payments of principal and interest passed through to holders of ABS are frequently supported by some form of credit enhancement, such as a letter of credit, surety bond, limited guarantee by another entity or by having a priority to certain of the borrower’s other assets. The degree of credit enhancement varies, and generally applies to only a portion of the ABS’s par value. Value is also affected if any credit enhancement has been exhausted.
Common Stock
Common stock generally takes the form of shares in a corporation which represent an ownership interest. It ranks below preferred stock and debt securities in claims for dividends and for assets of the company in a liquidation or bankruptcy. The value of a company’s common stock may fall as a result of factors directly relating to that company, such as decisions made by its management or decreased demand for the company’s products or services. A stock’s value may also decline because of factors affecting not just the company, but also companies in the same industry or sector. The price of a company’s stock may also be affected by changes in financial markets that are relatively unrelated to the company, such as changes in interest rates, currency exchange rates or industry regulation. Companies that elect to pay dividends on their common stock generally only do so after they invest in their own business and make required payments to bondholders and on other debt and preferred stock. Therefore, the value of a company’s common stock will usually be more volatile than its bonds, other debt and preferred stock. Common stock may be exchange-traded or OTC. OTC stock may be less liquid than exchange-traded stock.
Fixed-Income Investments
The Funds may hold debt, including government and corporate debt, and other fixed-income securities. Typically, the values of fixed-income securities change inversely with prevailing interest rates. Therefore, a fundamental risk of fixed-income securities is interest rate risk, which is the risk that their value will generally decline as prevailing interest rates rise, which may cause the Funds’ NAV to likewise decrease, and vice versa. How specific fixed-income securities may react to changes in interest rates will depend on the specific characteristics of each security. For example, while securities with longer maturities tend to produce higher yields, they also tend to be more sensitive to changes in prevailing interest rates and are, therefore, more volatile than shorter-term securities and are subject to greater market fluctuations as a result of changes in interest rates. Fixed-income securities are also subject to credit risk, which is the risk that the credit strength of an issuer of a fixed-income security will weaken and/or that the issuer will be unable to make timely principal and interest payments and that the security may go into default. In addition, there is prepayment risk, which is the risk that during periods of falling interest rates, certain fixed-income securities with higher interest rates, such as mortgage-backed securities (“MBS”) and ABS, may be prepaid by their issuers thereby reducing the amount of interest payments. This may
49
American Beacon FundsSM
Notes to Financial Statements
October 31, 2021
result in a Fund having to reinvest its proceeds in lower yielding securities. Securities underlying MBS and ABS, which may include subprime mortgages, also may be subject to a higher degree of credit risk, valuation risk, and liquidity risk.
High-Yield Securities
Non-investment-grade securities are rated below the four highest credit grades by at least one of the public rating agencies (or are unrated if not publicly rated). Participation in high-yielding securities transactions generally involves greater returns in the form of higher average yields. However, participation in such transactions involves greater risks, including sensitivity to economic changes, solvency, and relative liquidity in the secondary trading market. Lower ratings may reflect a greater possibility that the financial condition of the issuer, or adverse changes in general economic conditions, or both, may impair the ability of the issuer to make payments of interest and principal. The prices and yields of lower-rated securities generally fluctuate more than higher-quality securities, and such prices may decline significantly in periods of general economic difficulty or rising interest rates.
Illiquid and Restricted Securities
Generally, an illiquid asset is an asset that the Funds reasonably expect cannot be sold or disposed of in current market conditions in seven calendar days or less without the sale or disposition significantly changing the market value of the investment, as determined pursuant to Rule 22e-4 under the Investment Company Act or as otherwise permitted or required by SEC rules and interpretations. Historically, illiquid securities have included securities that have not been registered under the Securities Act, securities that are otherwise not readily marketable, and repurchase agreements having a remaining maturity of longer than seven calendar days. Securities that have not been registered under the Securities Act are referred to as private placements or restricted securities and are purchased directly from the issuer or in the secondary market. These securities may be sold only in a privately negotiated transaction or pursuant to an exemption from registration. A large institutional market exists for certain securities that are not registered under the Securities Act, including repurchase agreements, commercial paper, foreign securities, municipal securities and corporate bonds and notes. Institutional investors depend on an efficient institutional market in which the unregistered security can be readily resold or on an issuer’s ability to honor a demand for repayment. However, the fact that there are contractual or legal restrictions on resale of such investments to the general public or to certain institutions may not be indicative of their liquidity.
Limitations on resale may have an adverse effect on the marketability of portfolio securities, and a Fund might be unable to dispose of restricted or other illiquid securities promptly or at reasonable prices and might thereby experience difficulty satisfying redemptions within seven calendar days. In addition, a Fund may get only limited information about an issuer, so it may be less able to predict a loss. A Fund also might have to register such restricted securities in order to dispose of them resulting in additional expense and delay. Adverse market conditions could impede such a public offering of securities.
In recognition of the increased size and liquidity of the institutional market for unregistered securities and the importance of institutional investors in the formation of capital, the SEC adopted Rule 144A under the Securities Act. Rule 144A is designed to facilitate efficient trading among institutional investors by permitting the sale of certain unregistered securities to qualified institutional buyers. To the extent privately placed securities held by a Fund qualify under Rule 144A and an institutional market develops for those securities, a Fund likely will be able to dispose of the securities without registering them under the Securities Act. To the extent that institutional buyers become, for a time, uninterested in purchasing these securities, investing in Rule 144A securities could increase the level of a Fund’s illiquidity. The Manager or the Sub-Advisor, as applicable, may determine that certain securities qualified for trading under Rule 144A are liquid. Regulation S under the Securities Act permits the sale abroad of securities that are not registered for sale in the United States and includes a provision for U.S. investors, such as a Fund, to purchase such unregistered securities if certain conditions are met.
50
American Beacon FundsSM
Notes to Financial Statements
October 31, 2021
Securities sold in private placement offerings made in reliance on the “private placement” exemption from registration afforded by Section 4(a)(2) of the Securities Act and resold to qualified institutional buyers under Rule 144A under the Securities Act (“Section 4(a)(2) securities”) are restricted as to disposition under the federal securities laws, and generally are sold to institutional investors, such as a Fund, that agree they are purchasing the securities for investment and not with an intention to distribute to the public. Any resale by the purchaser must be pursuant to an exempt transaction and may be accomplished in accordance with Rule 144A. Section 4(a)(2) securities normally are resold to other institutional investors through or with the assistance of the issuer or dealers that make a market in the Section 4(a)(2) securities, thus providing liquidity.
Restricted securities outstanding during the year ended October 31, 2021 are disclosed in the Notes to the Schedules of Investments.
Mortgage-Backed Securities
MBS often have stated maturities of up to thirty years when they are issued, depending upon the length of the mortgages underlying the securities. In practice however, unscheduled or early payments of principal and interest on the underlying mortgages may make the securities’ effective maturity shorter than this, and the prevailing interest rates may be higher or lower than the current yield of the Funds’ portfolio at the time resulting in reinvestment risk.
Rising or high interest rates may result in slower than expected principal payments which may tend to extend the duration of MBS, making them more volatile and more sensitive to changes in interest rates. This is known as extension risk.
MBS may have less potential for capital appreciation than comparable fixed-income securities due to the likelihood of increased prepayments of mortgages resulting from foreclosures or declining interest rates. These foreclosed or refinanced mortgages are paid off at face value (par) or less, causing a loss, particularly for any investor who may have purchased the security at a premium or a price above par. In such an environment, this risk limits the potential price appreciation of these securities.
Mortgage-Related and Other Asset-Backed Securities
The Balanced Fund may invest in mortgage or other ABS. These securities may include mortgage instruments issued by U.S. government agencies (“agency mortgages”) or those issued by private entities (“non-agency mortgages”). Specific types of instruments may include mortgage pass-through securities, collateralized mortgage obligations (“CMOs”), commercial mortgage-backed securities, mortgage dollar rolls, CMO residuals, stripped mortgage-backed securities and other securities that directly or indirectly represent a participation in, or are secured by a payable from, mortgage loans on real property. The value of a Fund’s MBS may be affected by, among other things, changes or perceived changes in interest rates, factors concerning the interests in and structure of the issuer or the originator of the mortgage, or the quality of the underlying assets. The mortgages underlying the securities may default or decline in quality or value. Through its investments in MBS, a Fund has exposure to subprime loans, Alt-A loans and non-conforming loans as well as to the mortgage and credit markets generally. Underlying collateral related to subprime, Alt-A and non-conforming mortgage loans has become increasingly susceptible to defaults and declines in quality or value, especially in a declining residential real estate market. In addition, regulatory or tax changes may adversely affect the mortgage securities markets as a whole.
Other Investment Company Securities and Other Exchange-Traded Products
The Funds may invest in shares of other investment companies, including open-end funds, closed-end funds, business development companies (“BDCs”), ETFs, unit investment trusts, and other investment companies of the Trust. The Funds may invest in securities of an investment company advised by the Manager or a sub-advisor. Investments in the securities of other investment companies may involve duplication of advisory fees and certain
51
American Beacon FundsSM
Notes to Financial Statements
October 31, 2021
other expenses. By investing in another investment company, the Funds become a shareholder of that investment company. As a result, the Funds’ shareholders indirectly will bear the Funds’ proportionate share of the fees and expenses paid by shareholders of the other investment company, in addition to the fees and expenses the Funds’ shareholders directly bear in connection with the Funds’ own operations. These other fees and expenses are reflected as Acquired Fund Fees and Expenses and are included in the Fees and Expenses Table for the Funds in their Prospectus, if applicable. Investments in other investment companies may involve the payment of substantial premiums above the value of such issuer’s portfolio securities.
Privately Issued Mortgage-Backed Securities
Pools created by non-governmental issuers generally offer a higher rate of interest than government and government-related pools because there are no direct or indirect government guarantees of payments in such pools. However, timely payment of interest and principal of these pools is often partially supported by various enhancements such as over-collateralization and senior/subordination structures and by various forms of insurance or guarantees, including individual loan, title, pool and hazard insurance. The insurance and guarantees are issued by government entities, private insurers or the mortgage poolers. Although the market for such securities is becoming increasingly liquid, securities issued by certain private organizations may not be readily marketable.
Publicly Traded Partnerships/Master Limited Partnerships (“MLPs”)
The Funds may invest in publicly traded partnerships such as MLPs. MLPs issue units that are registered with the SEC and are freely tradable on a securities exchange or in the OTC market. An MLP may have one or more general partners, who conduct the business, and one or more limited partners, who contribute capital. The general partner or partners are jointly and severally responsible for the liabilities of the MLP. (An MLP also may be an entity similar to a limited partnership, such as an LLC, which has one or more managers or managing members and non-managing members (who are like limited partners)). The Funds invest in an MLP as a limited partner and normally would not be liable for the debts of an MLP beyond the amount a Fund has invested therein, but it would not be shielded to the same extent that a shareholder of a corporation would be. In certain instances, creditors of an MLP would have the right to seek a return of capital that had been distributed to a limited partner. The right of an MLP’s creditors would continue even after a Fund had sold its investment in the partnership. MLPs typically invest in real estate and oil and gas equipment leasing assets, but they also finance entertainment, research and development, and other projects.
Real Estate Investment Trusts (“REITs”)
REITs are pooled investment vehicles that own, and often operate, income producing real estate or invest in mortgages secured by loans on such real estate. REITs are susceptible to the risks associated with direct ownership of real estate, such as declines in property values, increase in property taxes, operating expenses, rising interest rates or overbuilding, zoning changes, and losses from casualty or condemnation. REITs typically are subject to management fees and other expenses that are separate from those of a fund.
U.S. Government Agency Securities
U.S. Government agency securities are issued or guaranteed by the U.S. Government or its agencies or instrumentalities. Some obligations issued by U.S. Government agencies and instrumentalities are supported by the full faith and credit of the U.S. Treasury; others by the right of the issuer to borrow from the U.S. Treasury; others by discretionary authority of the U.S. Government to purchase certain obligations of the agency or instrumentality; and others only by the credit of the agency or instrumentality. U.S. Government securities bear fixed, floating or variable rates of interest. While the U.S. Government currently provides financial support to certain U.S. Government-sponsored agencies or instrumentalities, no assurance can be given that it will always do so, since it is not so obligated by law. U.S. Government securities include U.S. Treasury bills, notes and bonds, Federal Home Loan Bank (“FHLB”) obligations, Federal Farm Credit Bank (“FFCB”) obligations, U.S. Government agency
52
American Beacon FundsSM
Notes to Financial Statements
October 31, 2021
obligations and repurchase agreements secured thereby. U.S. Government agency securities are subject to credit risk and interest rate risk.
U.S. Treasury Obligations
U.S. Treasury obligations include bills (initial maturities of one year or less), notes (initial maturities between two and ten years), and bonds (initial maturities over ten years) issued by the U.S. Treasury, Separately Traded Registered Interest and Principal component parts of such obligations (known as “STRIPS”) and inflation-indexed securities. The prices of these securities (like all debt securities) change between issuance and maturity in response to fluctuating market interest rates. U.S. Treasury obligations are subject to credit risk and interest rate risk.
Variable or Floating Rate Obligations
The interest rates payable on certain fixed-income securities in which the Balanced Fund may invest are not fixed and may fluctuate based upon changes in market rates. A variable rate obligation has an interest rate which is adjusted at predesignated periods in response to changes in the market rate of interest on which the interest rate is based. Variable and floating rate obligations are less effective than fixed rate instruments at locking in a particular yield. Nevertheless, such obligations may fluctuate in value in response to interest rate changes if there is a delay between changes in market interest rates and the interest reset date for the obligation, or for other reasons.
5. Financial Derivative Instruments
The Funds may utilize derivative instruments to gain market exposure on cash balances or reduce market exposure in anticipation of liquidity needs. When considering the Funds’ use of derivatives, it is important to note that the Funds do not use derivatives for the purpose of creating financial leverage.
Futures Contracts
A futures contract is a contract to purchase or sell a particular security, or the cash value of an asset, such as securities, indices, or currencies, at a specified future date at a price agreed upon when the contract is made. Under many such contracts, no delivery of the actual underlying asset is required. Rather, upon the expiration of the contract, settlement is made by exchanging cash in an amount equal to the difference between the contract price and the closing price of the asset (e.g., a security or an index) at expiration, net of the initial and variation margin that was previously paid. A Treasury futures contract is a contract for the future delivery of a U.S. Treasury security. An equity index futures contract is based on the value of an underlying index. A Fund may, from time to time, use futures positions to equitize cash and expose its portfolio to changes in securities prices or index prices. This can magnify gains and losses in a Fund. A Fund also may have to sell assets at inopportune times to satisfy its settlement or collateral obligations. The risks associated with the use of futures contracts also include that there may be an imperfect correlation between the changes in market value of the prices of futures contracts and the assets underlying such contracts and that there may not be a liquid secondary market for a futures contract.
During the year ended October 31, 2021, the Funds entered into futures contracts primarily for exposing cash to markets.
The Funds’ average futures contracts outstanding fluctuate throughout the operating year as required to meet strategic requirements. The following table illustrates the average quarterly volume of futures contracts. For the purpose of this disclosure, volume is measured by contracts outstanding at each quarter end.
Average Futures Contracts Outstanding | ||||
Fund | Year Ended October 31, 2021 | |||
Balanced | 21 | |||
Mid-Cap Value | 28 | |||
53
American Beacon FundsSM
Notes to Financial Statements
October 31, 2021
The following is a summary of the fair valuations of the Funds’ derivative instruments categorized by risk exposure(1):
Balanced Fund
| Fair values of financial instruments on the Statements of Assets and Liabilities as of October 31, 2021: |
| ||||||||||||||||||||||||||||||||||||||||||||||||||||||
| Derivatives not accounted for as hedging instruments |
|
| |||||||||||||||||||||||||||||||||||||||||||||||||||||
Assets: | Credit contracts | Foreign exchange contracts | Commodity contracts | Interest rate contracts | Equity contracts | Total | |||||||||||||||||||||||||||||||||||||||||||||||||
| Receivable for variation margin from open futures contracts(2) | $ | - | $ | - | $ | - | $ | - | $ | 172,624 | $ | 172,624 | |||||||||||||||||||||||||||||||||||||||||||
| The effect of financial derivative instruments on the Statements of Operations as of October 31, 2021: |
| |||||||||||||||||||||||||||||||||||||||||||
| Derivatives not accounted for as hedging instruments |
|
| ||||||||||||||||||||||||||||||||||||||||||
Realized gain (loss) from derivatives | Credit contracts | Foreign exchange contracts | Commodity contracts | Interest rate contracts | Equity contracts | Total | ||||||||||||||||||||||||||||||||||||||
| Futures contracts | $ | - | $ | - | $ | - | $ | - | $ | 1,298,422 | $ | 1,298,422 | ||||||||||||||||||||||||||||||||
Net change in unrealized appreciation | Credit contracts | Foreign exchange contracts | Commodity contracts | Interest rate contracts | Equity contracts | Total | ||||||||||||||||||||||||||||||||||||||
| Futures contracts | $ | - | $ | - | $ | - | $ | - | $ | 299,343 | $ | 299,343 | ||||||||||||||||||||||||||||||||
Mid-Cap Value Fund
| Fair values of financial instruments on the Statements of Assets and Liabilities as of October 31, 2021: |
| ||||||||||||||||||||||||||||||||||||||||||||||||||||||
| Derivatives not accounted for as hedging instruments |
|
| |||||||||||||||||||||||||||||||||||||||||||||||||||||
Assets: | Credit contracts | Foreign exchange contracts | Commodity contracts | Interest rate contracts | Equity contracts | Total | |||||||||||||||||||||||||||||||||||||||||||||||||
| Receivable for variation margin from open futures contracts(2) | $ | - | $ | - | $ | - | $ | - | $ | 81,348 | $ | 81,348 | |||||||||||||||||||||||||||||||||||||||||||
| The effect of financial derivative instruments on the Statements of Operations as of October 31, 2021: |
| ||||||||||||||||||||||||||||||||||||||||||||||||||||||
| Derivatives not accounted for as hedging instruments |
|
| |||||||||||||||||||||||||||||||||||||||||||||||||||||
Realized gain (loss) from derivatives | Credit contracts | Foreign exchange contracts | Commodity contracts | Interest rate contracts | Equity contracts | Total | |||||||||||||||||||||||||||||||||||||||||||||||||
| Futures contracts | $ | - | $ | - | $ | - | $ | - | $ | 3,580,590 | $ | 3,580,590 | |||||||||||||||||||||||||||||||||||||||||||
Net change in unrealized appreciation | Credit contracts | Foreign exchange contracts | Commodity contracts | Interest rate contracts | Equity contracts | Total | |||||||||||||||||||||||||||||||||||||||||||||||||
| Futures contracts | $ | - | $ | - | $ | - | $ | - | $ | 76,327 | $ | 76,327 | |||||||||||||||||||||||||||||||||||||||||||
(1) See Note 3 in the Notes to Financial Statements for additional information.
(2) Includes cumulative appreciation (depreciation) of futures contracts as reported in the Fund’s Schedule of Investments footnotes. Only current day’s variation margin is reported within the Statements of Assets and Liabilities.
Offsetting Assets and Liabilities
The Funds are parties to enforceable master netting agreements between brokers and counterparties which provide for the right to offset under certain circumstances. The Funds employ multiple money managers and counterparties and have elected not to offset qualifying financial and derivative instruments on the Statements of Assets and Liabilities, as such all financial and derivative instruments are presented on a gross basis. The impacts
54
American Beacon FundsSM
Notes to Financial Statements
October 31, 2021
of netting arrangements that provide the right to offset are detailed below, if applicable. The net amount represents the net receivable or payable that would be due from or to the counterparty in the event of default. Exposure from borrowings and other financing agreements such as repurchase agreements can only be netted across transactions governed by the same Master Agreement with the same legal entity. All amounts reported below represent the balance as of the report date, October 31, 2021.
Balanced Fund
| Offsetting of Financial and Derivative Assets as of October 31, 2021: | ||||||||||||
| Assets | Liabilities | ||||||||||
| Futures Contracts(1) | $ | 172,624 | $ | - | ||||||||
|
|
|
| |||||||||
| Total derivative assets and liabilities in the Statement of Assets and Liabilities | $ | 172,624 | $ | - | ||||||||
|
|
|
| |||||||||
| Derivatives not subject to a Master Netting Agreement or similar agreement (“MNA”) | $ | (172,624 | ) | $ | - | |||||||
|
|
|
| |||||||||
| Remaining Contractual Maturity of the Agreements As of October 31, 2021 | ||||||||||||||||||||||||||||||||||||
| Overnight and Continuous | <30 days | Between 30 & 90 days | >90 days | Total | ||||||||||||||||||||||||||||||||
Securities Lending Transactions | ||||||||||||||||||||||||||||||||||||
Common Stocks | $ | 572,921 | $ | - | - | $ | - | $ | 572,921 | |||||||||||||||||||||||||||
|
|
|
|
|
|
|
|
|
| |||||||||||||||||||||||||||
Total Borrowings | $ | 572,921 | $ | - | $ | - | $ | - | $ | 572,921 | ||||||||||||||||||||||||||
|
|
|
|
|
|
|
|
|
| |||||||||||||||||||||||||||
Gross amount of recognized liabilities for securities lending transactions |
| $ | 572,921 | |||||||||||||||||||||||||||||||||
|
| |||||||||||||||||||||||||||||||||||
Mid-Cap Value Fund
| Offsetting of Financial and Derivative Assets as of October 31, 2021: | ||||||||||||
| Assets | Liabilities | ||||||||||
| Futures Contracts(1) | $ | 81,348 | $ | - | ||||||||
|
|
|
| |||||||||
| Total derivative assets and liabilities in the Statement of Assets and Liabilities | $ | 81,348 | $ | - | ||||||||
|
|
|
| |||||||||
| Derivatives not subject to a Master Netting Agreement or similar agreement (“MNA”) | $ | (81,348 | ) | $ | - | |||||||
|
|
|
| |||||||||
| Remaining Contractual Maturity of the Agreements As of October 31, 2021 | ||||||||||||||||||||||||||||||||||||
| Overnight and Continuous | <30 days | Between 30 & 90 days | >90 days | Total | ||||||||||||||||||||||||||||||||
Securities Lending Transactions | ||||||||||||||||||||||||||||||||||||
Common Stocks | $ | 671,946 | $ | - | - | $ | - | $ | 671,946 | |||||||||||||||||||||||||||
|
|
|
|
|
|
|
|
|
| |||||||||||||||||||||||||||
Total Borrowings | $ | 671,946 | $ | - | $ | - | $ | - | $ | 671,946 | ||||||||||||||||||||||||||
|
|
|
|
|
|
|
|
|
| |||||||||||||||||||||||||||
Gross amount of recognized liabilities for securities lending transactions |
| $ | 671,946 | |||||||||||||||||||||||||||||||||
|
| |||||||||||||||||||||||||||||||||||
(1) Includes cumulative appreciation or (depreciation) of futures contracts as reported in the Schedules of Investments footnotes. Only current day’s variation margin is reported within the Statements of Assets and Liabilities.
6. Principal Risks
Investing in the Funds may involve certain risks including, but not limited to, those described below.
Asset-Backed and Mortgage Related Securities Risk
Investments in asset-backed and mortgage related securities are subject to market risks for fixed-income securities which include, but are not limited to, interest rate risk, prepayment risk and extension risk. Small movements in interest rates (both increases and decreases) may quickly and significantly reduce the value of certain MBS and ABS securities. If interest rates fall, the rate of prepayments tends to increase as borrowers are
55
American Beacon FundsSM
Notes to Financial Statements
October 31, 2021
motivated to pay off debt and refinance at new lower rates. When mortgages and other obligations are prepaid and when securities are called, a Fund may have to reinvest in securities with a lower yield or fail to recover additional amounts (i.e., premiums) paid for securities with higher interest rates, resulting in an unexpected capital loss and/or a decrease in the amount of dividends and yield. Because prepayments increase when interest rates fall, the prices of MBS and ABS do not increase as much as other fixed income securities when interest rates fall. When interest rates rise, borrowers are less likely to prepay their mortgage and other loans. A decreased rate of prepayments lengthens the expected maturity of MBS and ABS. Therefore, the prices of MBS and ABS may decrease more than prices of other fixed-income securities when interest rates rise. Rising interest rates tend to extend the duration of these securities, making them more sensitive to changes in interest rates. Rising interest rates also may increase the risk of default by borrowers. As a result, in a period of rising interest rates, a Fund that holds these types of securities, may experience additional volatility and losses. A decline in the credit quality of and defaults by the issuers of asset-backed and mortgage related securities or instability in the markets for such securities may affect the value and liquidity of such securities, which could result in losses to a Fund. In addition, certain asset-backed and mortgage related securities may include securities backed by pools of loans made to “subprime” borrowers or borrowers with blemished credit histories; the risk of defaults is generally higher in the case of mortgage pools that include such subprime mortgages.
Credit Risk
The Funds are subject to the risk that the issuer or guarantor of a debt security, or the counterparty to a derivatives contract or a loan will fail to make timely payment of interest or principal or otherwise honor its obligations or default completely. A decline in the credit rating of an individual security held by the Funds may have an adverse impact on its price and make it difficult for the Funds to sell it. Ratings represent a rating agency’s opinion regarding the quality of the security and are not a guarantee of quality. Rating agencies might not always change their credit rating on an issuer or security in a timely manner to reflect events that could affect the issuer’s ability to make timely payments on its obligations. Credit risk is typically greater for securities with ratings that are below investment grade.
Equity Investments Risk
Equity securities are subject to investment risk and market risk. The Funds’ investments in equity securities may include common stocks, preferred stocks, securities convertible into or exchangeable for common stocks, REITs, depositary receipts, and U.S. dollar-denominated foreign stocks traded on U.S. exchanges. Such investments may expose the Funds to additional risk. The value of a company’s common stock may fall as a result of factors affecting the company, companies in the same industry or sector, or the financial markets overall. Common stock generally is subordinate to preferred stock upon the liquidation or bankruptcy of the issuing company. Preferred stocks and convertible securities are sensitive to movements in interest rates. Preferred stocks may be less liquid than common stocks and, unlike common stocks, participation in the growth of an issuer may be limited. Distributions on preferred stocks generally are payable at the discretion of an issuer and after required payments to bond holders. Convertible securities are subject to the risk that the credit standing of the issuer may have an effect on the convertible securities’ investment value. Investments in REITs are subject to the risks associated with investing in the real estate industry such as adverse developments affecting the real estate industry and real property values. Depositary receipts and U.S. dollar-denominated foreign stocks traded on U.S. exchanges are subject to certain of the risks associated with investing directly in foreign securities, including, but not limited to, currency fluctuations and political and financial instability in the home country of a particular depositary receipt or foreign stock.
Foreign Investing and Emerging Markets Risk
Non-U.S. investments carry potential risks not associated with U.S. investments. Such risks include, but are not limited to: (1) currency exchange rate fluctuations, (2) political and financial instability, (3) less liquidity, (4) lack of uniform accounting, auditing and financial reporting standards, (5) increased price volatility, (6) less
56
American Beacon FundsSM
Notes to Financial Statements
October 31, 2021
government regulation and supervision of foreign stock exchanges, brokers and listed companies, and (7) delays in transaction settlement in some foreign markets. To the extent the Funds invest a significant portion of its assets in securities of a single country or region, it is more likely to be affected by events or conditions of that country or region. In addition, the economies and political environments of emerging market countries tend to be more unstable than those of developed countries, resulting in more volatile rates of return than the developed markets and substantially greater risk to investors. There may be very limited oversight of certain foreign banks or securities depositories that hold foreign securities and currency and the laws of certain countries may limit the ability to recover such assets if a foreign bank or depository or their agents goes bankrupt. When investing in emerging markets, the risks of investing in foreign securities are heightened. Emerging markets have unique risks that are greater than, or in addition to, investing in developed markets because emerging markets are generally smaller, less developed, less liquid and more volatile than the securities markets of the U.S. and other developed markets. There are also risks of: greater political uncertainties; an economy’s dependence on revenues from particular commodities or on international aid or development assistance; currency transfer restrictions; a limited number of potential buyers for such securities, resulting in increased volatility and limited liquidity for emerging market securities; trading suspensions; and delays and disruptions in securities settlement procedures. In addition, there may be less information available to make investment decisions and more volatile rates of return.
Futures Contracts Risk
Futures contracts are derivative instruments where one party pays a fixed price for an agreed amount of securities or other underlying assets at an agreed date. The use of such derivative instruments may expose the Funds to additional risks that they would not be subject to if they invested directly in the securities underlying those derivatives. There may at times be an imperfect correlation between the movement in the prices of futures contracts and the value of their underlying instruments or indexes. There can be no assurance that any strategy used will succeed. There also can be no assurance that, at all times, a liquid market will exist for offsetting a futures contract that a Fund has previously bought or sold and this may result in the inability to close a futures contract when desired. Futures contracts may experience potentially dramatic price changes, which will increase the volatility of a Fund and may involve a small investment of cash (the amount of initial and variation margin) relative to the magnitude of the risk assumed (the potential increase or decrease in the price of the futures contract).
Illiquid and Restricted Securities Risk
Securities not registered in the U.S. under the Securities Act, including Rule 144A securities, are restricted as to their resale. Such securities may not be listed on an exchange and may have no active trading market. They may be more difficult to purchase or sell at an advantageous time or price because such securities may not be readily marketable in broad public markets. The Funds may not be able to sell a restricted security when the sub-advisor considers it desirable to do so and/or may have to sell the security at a lower price than the Funds believe is its fair market value. In addition, transaction costs may be higher for restricted securities and the Funds may receive only limited information regarding the issuer of a restricted security. The Funds may have to bear the expense of registering restricted securities for resale and the risk of substantial delays in effecting the registration.
Interest Rate Risk
Generally, the value of investments with interest rate risk, such as fixed income securities or derivatives, will move in the opposite direction to movements in interest rates. The prices of fixed income securities or derivatives are also affected by their durations. Fixed income securities or derivatives with longer durations generally have greater sensitivity to changes in interest rates. For example, if a bond has a duration of eight years, a 1% increase in interest rates could be expected to result in an 8% decrease in the value of the bond. An increase in interest rates can impact markets broadly as well. Extremely low or negative interest rates may become more prevalent among U.S. and foreign issuers. To the extent a Fund holds an investment with a negative interest rate to maturity, a Fund may generate a negative return on that investment. Conversely, in the future, interest rates may rise, perhaps significantly and/or rapidly, potentially resulting in substantial losses to a Fund.
57
American Beacon FundsSM
Notes to Financial Statements
October 31, 2021
LIBOR Risk
These Reference Rates are generally intended to represent the rate at which contributing banks may obtain short-term borrowings from each other within certain financial markets. LIBOR is produced daily by averaging the rates reported by a number of banks and may be a significant factor in determining a Fund’s payment obligations under a derivative instrument, the cost of financing to a Fund, or an investment’s value or return to a Fund, and may be used in other ways that affect a Fund’s performance. Arrangements are underway to phrase out the use of LIBOR. These arrangements and any additional regulatory or market changes may have an adverse impact on a Fund or its investments, including increased volatility or illiquidity in markets for instruments that rely on LIBOR.
Liquidity Risk
A Fund is susceptible to the risk that certain investments held by a Fund may have limited marketability, be subject to restrictions on sale, be difficult or impossible to purchase or sell at favorable times or prices, or become less liquid in response to market developments or adverse credit events that may affect issuers or guarantors of a security. An inability to sell a portfolio position can adversely affect a Fund’s value or prevent a Fund from being able to take advantage of other investment opportunities. Market prices for such instruments may be volatile. A Fund could lose money if it is unable to dispose of an investment at a time that is most beneficial to the Fund. A Fund may be required to dispose of investments at unfavorable times or prices to satisfy obligations, which may result in losses or may be costly to a Fund. For example, liquidity risk may be magnified in rising interest rate environments due to higher than normal redemption rates. Unexpected redemptions may force a Fund to sell certain investments at unfavorable prices to meet redemption requests or other cash needs. Judgment plays a greater role in pricing illiquid investments than in investments with more active markets.
Market Risk
The Funds are subject to the risk that the securities markets will move down, sometimes rapidly and unpredictably, based on overall economic conditions and other factors, which may negatively affect the Funds’ performance. Equity securities generally have greater price volatility than fixed income securities, although under certain market conditions fixed income securities may have comparable or greater price volatility. During a general downturn in the securities markets, multiple assets may decline in value simultaneously. In some cases, traditional market participants have been less willing to make a market in some types of debt instruments, which has affected the liquidity of those instruments. During times of market turmoil, investors tend to look to the safety of securities issued or backed by the U.S. Treasury, causing the prices of these securities to rise and the yields to decline. Reduced liquidity in fixed income and credit markets may negatively affect many issuers worldwide. Prices in many financial markets have increased significantly over the last decade, but there have also been periods of adverse market and financial developments and cyclical change during that timeframe, which have resulted in unusually high levels of volatility in domestic and foreign financial markets that has caused losses for investors and may occur again in the future, particularly if markets enter a period of uncertainty or economic weakness. The value of a security may decline due to adverse issuer-specific conditions, general market conditions unrelated to a particular issuer, or factors that affect a particular industry or industries. Changes in the financial condition of a single issuer or market segment also can impact the market as a whole.
Geopolitical and other events, including war, terrorism, economic uncertainty, trade disputes, pandemics, public health crises, natural disasters and related events have led, and in the future may continue to lead, to instability in world economies and markets generally and reduced liquidity in equity, credit and fixed-income markets, which may disrupt economies and markets and adversely affect the value of your investment. Adverse market events may also lead to increased shareholder redemptions, which could cause a Fund to experience a loss or difficulty in selling investments to meet redemption requests by shareholders and may increase a Fund’s portfolio turnover, which will increase the costs that a Fund incurs and lower a Fund’s performance. Even when securities markets perform well, there is no assurance that the investments held by a Fund will increase in value along with the broader market.
58
American Beacon FundsSM
Notes to Financial Statements
October 31, 2021
Policy changes by the U.S. government and/or Federal Reserve and political events within the U.S. and abroad, including the U.S. presidential election, the U.S. government’s inability at times to agree on a long-term budget and deficit reduction plan, the threat of a federal government shutdown and threats not to increase the federal government’s debt limit, may affect investor and consumer confidence and may adversely impact financial markets and the broader economy, perhaps suddenly and to a significant degree. The severity or duration of adverse economic conditions may also be affected by policy changes made by governments or quasi-governmental organizations. Global economies and financial markets are becoming increasingly interconnected, which increases the possibility of many markets being affected by events in a single country or events affecting a single or small number of issuers.
Markets and market participants are increasingly reliant upon both publicly available and proprietary information data systems. Data imprecision, software or other technology malfunctions, programming inaccuracies, unauthorized use or access, and similar circumstances may impair the performance of these systems and may have an adverse impact upon a single issuer, a group of issuers, or the market at large. In certain cases, an exchange or market may close or issue trading halts on either specific securities or even the entire market, which may result in a Fund being, among other things, unable to buy or sell certain securities or financial instruments or accurately price its investments. These fluctuations in securities prices could be a sustained trend or a drastic movement. The financial markets generally move in cycles, with periods of rising prices followed by periods of declining prices. The value of your investment may reflect these fluctuations.
Mortgage-Backed and Mortgage Related Securities Risk
Investments in mortgage-backed and mortgage-related securities are influenced by the factors affecting the mortgages underlying the securities or the housing market. Investments in mortgage-backed and mortgage-related securities also are subject to market risks for fixed income securities, which include, but are not limited to, credit risk, interest rate risk, prepayment risk, extension risk, callable securities risk, and valuation risk. A decline in the credit quality of the issuers of mortgage-backed and mortgage-related securities or instability in the markets for such securities may affect the value and liquidity of such securities, which could result in losses to a Fund. These securities are also subject to the risk of default on the underlying mortgages, particularly during periods of market downturn, and an unexpectedly high rate of defaults on the underlying assets will adversely affect the security’s value.
Multiple Sub-Advisor Risk
The Manager may allocate the Funds’ assets among multiple sub-advisors, each of which is responsible for investing its allocated portion of the Funds’ assets. To a significant extent, the Funds’ performance will depend on the success of the Manager in allocating the Funds’ assets to sub-advisors and its selection and oversight of the sub-advisors. Because each sub-advisor manages its allocated portion of the Funds independently from another sub-advisor, the same security may be held in different portions of the Funds, or may be acquired for one portion of the Funds at a time when a sub-advisor to another portion deems it appropriate to dispose of the security from that other portion, resulting in higher expenses without accomplishing any net result in the Funds’ holdings. Similarly, under some market conditions, one sub-advisor may believe that temporary, defensive investments in short-term instruments or cash are appropriate when another sub-advisor believes continued exposure to the equity or debt markets is appropriate for its allocated portion of the Funds. Because each sub-advisor directs the trading for its own portion of the Funds, and does not aggregate its transactions with those of the other sub-advisors, the Funds may incur higher brokerage costs than would be the case if a single sub-adviser were managing the entire Fund. In addition, while the Manager seeks to allocate the Funds’ assets among the Funds’ sub-advisors in a manner that it believes is consistent with achieving the Funds’ investment objective(s), the Manager may be subject to potential conflicts of interest in allocating the Funds’ assets among sub-advisors, due to factors that could impact the Manager’s revenues and profits.
59
American Beacon FundsSM
Notes to Financial Statements
October 31, 2021
Other Investment Companies Risk
The Funds may invest in shares of other registered investment companies, including money market funds that are advised by the Manager. To the extent that the Funds invest in shares of other registered investment companies, the Funds will indirectly bear the fees and expenses, including for example advisory and administrative fees, charged by those investment companies in addition to the Funds’ direct fees and expenses and will be subject to the risks associated with investments in those companies. For example, the Funds’ investments in money market funds are subject to interest rate risk, credit risk, and market risk. The Funds must rely on the investment company in which it invests to achieve its investment objective. If the investment company fails to achieve its investment objective, the value of the Funds’ investment will decline, adversely affecting the Funds’ performance. To the extent the Funds invest in other investment companies that invest in equity securities, fixed-income securities and/or foreign securities, or that track an index, the Funds are subject to the risks associated with the underlying investments held by the investment company or the index fluctuations to which the investment company is subject.
Prepayment and Extension Risk
When interest rates fall, borrowers will generally repay the loans that underlie certain debt securities, especially mortgage-related and other types of asset-backed securities, more quickly than expected, causing the issuer of the security to repay the principal prior to the security’s expected maturity date. A Fund may need to reinvest the proceeds at a lower interest rate, reducing its income. Securities subject to prepayment risk generally offer less potential for gains when prevailing interest rates fall. If a Fund buys those securities at a premium, accelerated prepayments on those securities could cause a Fund to lose a portion of its principal investment. The impact of prepayments on the price of a security may be difficult to predict and may increase the security’s price volatility. Extension risk is the risk that a decrease in prepayments may, as a result of higher interest rates or other factors, result in the extension of a security’s effective maturity, increase the risk of default and delayed payment, heighten interest rate risk and increase the potential for a decline in its price. In addition, as a consequence of a decrease in prepayments, the amount of principal available to a Fund for investment would be reduced.
Recent Market Events Risk
An outbreak of infectious respiratory illness caused by a novel coronavirus, known as COVID-19, was first detected in China in December 2019 and has subsequently spread globally. Transmission of COVID-19 and efforts to contain its spread have resulted, and may continue to result, in significant disruptions to business operations, widespread business closures and layoffs, travel restrictions, closed international, national and local borders, prolonged quarantines and stay-at-home orders, disruption of and delays in healthcare service preparation and delivery, service and event cancellations, and lower consumer demand, as well as general concern and uncertainty that has negatively affected the global economy. The U.S. Federal Reserve and the U.S. federal government have taken numerous measures to address the economic impact of the COVID-19 pandemic and stimulate the U.S. economy. The ultimate effects of these and other efforts that may be taken may not be known for some time. The impact of the COVID-19 pandemic may last for an extended period of time and may result in a sustained economic downturn or recession.
The Federal Reserve has spent hundreds of billions of dollars to keep credit flowing through short-term money markets. Amid the Federal Reserve’s ongoing efforts, concerns about the markets’ dependence on the Federal Reserve’s provision of liquidity have grown. Future legislative, regulatory and policy changes may result in more restrictions on international trade, less stringent prudential regulation of certain players in the financial markets, and significant new investments in infrastructure and national defense. High public debt in the U.S. and other countries creates ongoing systemic and market risks and policymaking uncertainty. A rise in protectionist trade policies, slowing global economic growth, risks associated with the United Kingdom’s departure from the European Union on December 31, 2020, commonly referred to as “Brexit,” and a trade agreement between the
60
American Beacon FundsSM
Notes to Financial Statements
October 31, 2021
United Kingdom and the European Union, the risks associated with ongoing trade negotiations with China, the possibility of changes to some international trade agreements, tensions or open conflict between nations, or political or economic dysfunction within some nations that are major producers of oil could affect the economies of many nations, including the United States, in ways that cannot necessarily be foreseen at the present time.
Economists and others have expressed increasing concern about the potential effects of global climate change on property and security values. Certain issuers, industries and regions may be adversely affected by the impacts of climate change, including on the demand for and the development of goods and services and related production costs, and the impacts of legislation, regulation and international accords related to climate change, as well as any indirect consequences of regulation or business trends driven by climate change.
Redemption Risk
The Funds may experience periods of heavy redemptions that could cause the Funds to sell assets at inopportune times or at a loss or depressed value. Redemption risk is greater to the extent that one or more investors or intermediaries control a large percentage of investments in the Funds, have short investment horizons, or have unpredictable cash flow needs. A general rise in interest rates has the potential to cause investors to move out of fixed-income securities on a large scale, which may increase redemptions from mutual funds that hold large amounts of fixed-income securities. This, coupled with a reduction in the ability or willingness of dealers and other institutional investors to buy or hold fixed-income securities, may result in decreased liquidity and increased volatility in the fixed-income markets, and heightened redemption risk. Heavy redemptions, whether by a few large investors or many smaller investors, could hurt the Funds’ performance. This risk is heightened if the Funds invest in emerging market securities, which are generally less liquid than the securities of U.S. and other developed markets. The sale of assets to meet redemption requests may create net capital gains or losses, which could cause the Funds to have to distribute substantial capital gains.
Sector Risk
Sector risk is the risk associated with a Fund holding a significant amount of investments in similar businesses, which would be similarly affected by particular economic or market events, which may, in certain circumstances, cause the value of the equity and debt securities of companies in a particular sector of the market to change. To the extent a Fund has substantial holdings within a particular sector, the risks to a Fund associated with that sector increase.
In addition, when a Fund focuses its investments in certain sectors of the economy, its performance may be driven largely by sector performance and could fluctuate more widely than if a Fund were invested more evenly across sectors. Individual sectors may be more volatile, and may perform differently, than the broader market. The businesses that constitute a sector may all react the same way to economic, political or regulatory events. A Fund’s performance could also be affected if the sectors do not perform as expected. The lack of exposure to one or more sectors may adversely affect performance. As a Fund’s portfolio changes over time, a Fund’s exposure to a particular sector may become higher or lower.
Securities Lending Risk
A Fund may lend its portfolio securities to brokers, dealers and financial institutions in order to obtain additional income. Borrowers of a Fund’s securities provide collateral either in the form of cash, which a Fund reinvests in securities or in the form of non-cash collateral consisting of securities issued or guaranteed by the U.S. government or one of its agencies or instrumentalities. A Fund will be responsible for the risks associated with the investment of cash collateral, including any collateral invested in an affiliated money market fund. A Fund may lose money on its investment of cash collateral or may fail to earn sufficient income on its investment to cover its payment to the borrower of a pre-negotiated fee or “rebate” for the use of that cash collateral in connection with the loan. A Fund could also lose money due to a decline in the value of non-cash collateral. In
61
American Beacon FundsSM
Notes to Financial Statements
October 31, 2021
addition, delays may occur in the recovery of securities from borrowers, which could interfere with a Fund’s ability to vote proxies or to settle transactions or could result in increased costs. Moreover, if the borrower becomes subject to insolvency or similar proceedings, a Fund could incur delays in its ability to enforce its rights in its collateral. There also is a risk that a borrower may default on its obligation to return loaned securities at a time when the value of a Fund’s collateral is inadequate. Although a Fund’s securities lending agent may indemnify a Fund against that risk, it is also possible that the securities lending agent will be unable to satisfy its indemnification obligations. In any case in which the loaned securities are not returned to a Fund before an ex-dividend date, whether or not due to a default by the borrower, the payment in lieu of the dividend that a Fund receives from the securities’ borrower would not be treated as a dividend for federal income tax purposes and thus would not qualify for treatment as “qualified dividend income”.
U.S. Government Securities and Government-Sponsored Enterprises Risk
A security backed by the U.S. Treasury or the full faith and credit of the United States is guaranteed only as to the timely payment of interest and principal when held to maturity. The market prices for such securities are not guaranteed and will fluctuate. Additionally, circumstances could arise that would prevent the payment of interest or principal. This could result in losses to the Fund. Investments in government-sponsored enterprises are debt obligations issued by agencies and instrumentalities of the U.S. Government. These obligations vary in the level of support they receive from the U.S. Government. They may be: (i) supported by the full faith and credit of the U.S. Treasury, such as those of the Government National Mortgage Association (‘‘Ginnie Mae’’); (ii) supported by the right of the issuer to borrow from the U.S. Treasury, such as those of the Federal Home Loan Bank and the Federal Farm Credit Banks; (iii) supported by the discretionary authority of the U.S. Government to purchase the agency obligations, such as those of Fannie Mae and Freddie Mac or (iv) supported only by the credit of the issuer, such as those of the Federal Farm Credit Bureau. The U.S. Government may choose not to provide financial support to U.S. Government-sponsored agencies or instrumentalities if it is not legally obligated to do so, in which case, if the issuer defaulted, to the extent the Funds hold securities of such issuers, it might not be able to recover its investment from the U.S. Government. U.S. government securities and securities of government-sponsored entities are also subject to credit risk, interest rate risk and market risk. The rising U.S. national debt may lead to adverse impacts on the value of U.S. government securities due to potentially higher costs for the U.S. government to obtain new financing.
7. Federal Income and Excise Taxes
It is the policy of each Fund to qualify as a regulated investment company (“RIC”), by complying with all applicable provisions of Subchapter M of the Internal Revenue Code, as amended, and to make distributions of taxable income sufficient to relieve it from substantially all federal income and excise taxes. For federal income tax purposes, each Fund is treated as a single entity for the purpose of determining such qualification.
The Funds do not have any unrecorded tax liabilities in the accompanying financial statements. Each of the tax years in the four year period ended October 31, 2021 remain subject to examination by the Internal Revenue Service. If applicable, the Funds recognize interest accrued related to unrecognized tax benefits in interest expense and penalties in “Other expenses” on the Statements of Operations.
The Funds may be subject to taxes imposed by countries in which it invests. Such taxes are generally based on returns of income earned or gains realized or repatriated. Taxes are accrued and applied to net investment income, net realized capital gains and net unrealized appreciation (depreciation), as applicable, as the income is earned or capital gains are recorded.
Dividends are categorized in accordance with income tax regulations which may treat certain transactions differently than U.S. GAAP. Accordingly, the character of distributions and composition of net assets for tax purposes may differ from those reflected in the accompanying financial statements.
62
American Beacon FundsSM
Notes to Financial Statements
October 31, 2021
The tax character of distributions paid were as follows:
| Balanced Fund | Mid-Cap Value Fund | |||||||||||||||||||||||||||
| Year Ended October 31, 2021 | Year Ended October 31, 2020 | Year Ended October 31, 2021 | Year Ended October 31, 2020 | |||||||||||||||||||||||||
Distributions paid from: |
| |||||||||||||||||||||||||||
Ordinary income* |
| |||||||||||||||||||||||||||
R5 Class | $ | 407,719 | $ | 1,018,446 | $ | 1,595,645 | $ | 2,382,518 | ||||||||||||||||||||
Y Class | 708,204 | 1,571,770 | 883,163 | 1,359,606 | ||||||||||||||||||||||||
Investor Class | 1,539,331 | 2,602,441 | 515,548 | 3,045,660 | ||||||||||||||||||||||||
Advisor Class | 31,060 | 56,832 | 19,048 | 37,713 | ||||||||||||||||||||||||
A Class | 238,998 | 467,213 | 60,706 | 36,488 | ||||||||||||||||||||||||
C Class | 254,504 | 735,885 | 26,795 | 26,609 | ||||||||||||||||||||||||
R6 Class | - | - | 218,896 | 57,137 | ||||||||||||||||||||||||
Long-term capital gains |
| |||||||||||||||||||||||||||
R5 Class | 2,461,210 | 2,572,270 | - | - | ||||||||||||||||||||||||
Y Class | 4,821,841 | 3,518,952 | - | - | ||||||||||||||||||||||||
Investor Class | 9,350,119 | 6,191,265 | - | - | ||||||||||||||||||||||||
Advisor Class | 215,645 | 127,315 | - | - | ||||||||||||||||||||||||
A Class | 1,466,801 | 1,064,810 | - | - | ||||||||||||||||||||||||
C Class | 3,063,832 | 1,979,955 | - | - | ||||||||||||||||||||||||
R6 Class | - | - | - | - | ||||||||||||||||||||||||
|
|
|
|
|
|
|
| |||||||||||||||||||||
Total distributions paid | $ | 24,559,264 | $ | 21,907,154 | $ | 3,319,801 | $ | 6,945,731 | ||||||||||||||||||||
|
|
|
|
|
|
|
| |||||||||||||||||||||
* For tax purposes, short-term capital gains are considered ordinary income distributions.
As of October 31, 2021, the components of distributable earnings (deficits) on a tax basis were as follows:
Fund | Tax Cost | Unrealized Appreciation | Unrealized (Depreciation) | Net Unrealized Appreciation (Depreciation) | ||||||||||||||||||||||||
Balanced | $ | 154,623,001 | $ | 36,670,920 | $ | (2,601,582 | ) | $ | 34,069,338 | |||||||||||||||||||
Mid-Cap Value | 148,262,939 | 61,246,892 | (3,803,885 | ) | 57,443,007 | |||||||||||||||||||||||
Fund | Net Unrealized Appreciation (Depreciation) | Undistributed Ordinary Income | Undistributed Long-Term Capital Gains | Accumulated Capital and Other (Losses) | Other Temporary Differences | Distributable Earnings | ||||||||||||||||||||||||||||||||||||||||||||||
Balanced | $ | 34,069,338 | $ | 5,186,196 | $ | 11,354,676 | $ | - | $ | - | $ | 50,610,210 | ||||||||||||||||||||||||||||||||||||||||
Mid-Cap Value | 57,443,007 | 771,097 | 17,780,033 | - | - | 75,994,137 | ||||||||||||||||||||||||||||||||||||||||||||||
Financial reporting records are adjusted for permanent book/tax differences to reflect tax character. Financial records are not adjusted for temporary differences. The temporary differences between financial reporting and tax-basis reporting of unrealized appreciation (depreciation) are attributable primarily to the tax deferral of losses from wash sales, reclassifications of income from investments in real estate investment securities, book amortization of premiums, and the realization for tax purposes of unrealized gains (losses) on certain derivative instruments.
Due to inherent differences in the recognition of income, expenses, and realized gains (losses) under U.S. GAAP and federal income tax regulations, permanent differences between book and tax reporting have been identified and appropriately reclassified on the Statements of Assets and Liabilities. The Funds had no permanent differences as of October 31, 2021.
For federal income tax purposes, the Fund measures its capital loss carryforwards annually at October 31, its fiscal year end. Capital loss carryforwards retain their character as short-term and/or long-term and may be carried forward and applied against future realized capital gains with no expiration date.
The Mid-Cap Value Fund utilized $24,193,808 short-term and $4,636,872 long-term capital loss carryforwards and did not have any remaining capital loss carryforwards as of October 31, 2021.
63
American Beacon FundsSM
Notes to Financial Statements
October 31, 2021
8. Investment Transactions
The aggregate cost of purchases and proceeds from sales and maturities of investments, other than short-term obligations, for the year ended October 31, 2021 were as follows:
Fund | Purchases (non-U.S. Government Securities) | Purchases of U.S. Government Securities | Sales (non-U.S. Government Securities) | Sales of U.S. Government Securities | ||||||||||||||||||||||||
Balanced | $ | 48,674,843 | $ | 17,448,393 | $ | 84,395,462 | $ | 10,347,703 | ||||||||||||||||||||
Mid-Cap Value | 64,844,364 | - | 253,788,909 | - | ||||||||||||||||||||||||
A summary of the Funds’ transactions in the USG Select Fund for the year ended October 31, 2021 were as follows:
Fund | Type of Transaction | October 31, 2020 Shares/Fair Value | Purchases | Sales | October 31, 2021 Shares/Fair Value | |||||||||||||||||||||||||||||
| Balanced | Direct | $ | 3,476,667 | $ | 86,532,947 | $ | 85,955,883 | $ | 4,053,731 | |||||||||||||||||||||||||
| Balanced | Securities Lending | - | 6,810,317 | 6,237,396 | 572,921 | |||||||||||||||||||||||||||||
| Mid-Cap Value | Direct | 10,068,703 | 271,624,262 | 276,375,682 | 5,317,283 | |||||||||||||||||||||||||||||
| Mid-Cap Value | Securities Lending | - | 13,001,334 | 12,329,388 | 671,946 | |||||||||||||||||||||||||||||
9. Securities Lending
The Funds may lend their securities to qualified financial institutions, such as certain broker-dealers, to earn additional income. The borrowers are required to secure their loans continuously with collateral in an amount at least equal to the fair value of the securities loaned, initially in an amount at least equal to 102% of the fair value of domestic securities loaned and 105% of the fair value of international securities loaned. Collateral is monitored and marked-to-market daily. Daily mark-to-market amounts are required to be paid to the borrower or received from the borrower by the end of the following business day. This one day settlement for mark-to-market amounts may result in the collateral being temporarily less than the value of the securities on loan or temporarily more than the required minimum collateral.
To the extent that a loan is collateralized by cash, such cash collateral shall be invested by the securities lending agent (the “Agent”) in money market mutual funds and other short-term investments, provided the investments meet certain quality and diversification requirements. Securities purchased with cash collateral proceeds are listed in the Funds’ Schedule of Investments and the collateral is shown on the Statements of Assets and Liabilities as a payable.
Securities lending income is generated from the demand premium (if any) paid by the borrower to borrow a specific security and from the return on investment of cash collateral, reduced by negotiated rebate fees paid to the borrower and transaction costs. To the extent that a loan is secured by non-cash collateral, securities lending income is generated as a demand premium reduced by transaction costs. The Funds, the Agent, and the Manager retained 80%, 10%, and 10%, respectively, of the income generated from securities lending.
While securities are on loan, the Funds continue to receive certain income associated with that security and any gain or loss in the market price that may occur during the term of the loan. In the case of domestic equities, the value of any dividend is received in the form of a substitute payment approximately equal to the dividend. In the case of foreign securities, a negotiated amount is received that is less than the actual dividend, but higher than the dividend amount minus the foreign tax that the Funds would be subject to on the dividend.
Securities lending transactions pose certain risks to the Funds, including that the borrower may not provide additional collateral when required or return the securities when due, that the value of the short-term investments
64
American Beacon FundsSM
Notes to Financial Statements
October 31, 2021
will be less than the amount of cash collateral required to be returned to the borrower, that non-cash collateral may be subject to legal constraints in the event of a borrower bankruptcy, and that the cash collateral investments could become illiquid and unable to be used to return collateral to the borrower. The Funds could also experience delays and costs in gaining access to the collateral. The Funds bear the risk of any deficiency in the amount of the cash collateral available for return to the borrower and any action which impairs its ability to liquidate non-cash collateral to satisfy a borrower default.
As of October 31, 2021, the value of outstanding securities on loan and the value of collateral were as follows:
Fund | Market Value of Securities on Loan | Cash Collateral Received | Non-Cash Collateral Received | Total Collateral Received | ||||||||||||
Balanced | $ | 3,900,043 | $ | 572,921 | $ | 3,456,861 | $ | 4,029,782 | ||||||||
Mid-Cap Value | 2,899,350 | 671,946 | 2,359,975 | 3,031,921 | ||||||||||||
Cash collateral is listed on the Funds’ Schedules of Investments and is shown on the Statements of Assets and Liabilities. Income earned on these investments is included in “Income derived from securities lending” on the Statements of Operations.
Non-cash collateral received by the Funds may not be sold or re-pledged except to satisfy a borrower default. Therefore, non-cash collateral is not included on the Funds’ Schedules of Investments or Statements of Assets and Liabilities.
10. Borrowing Arrangements
Effective November 12, 2020 (the “Effective Date”), the Funds, along with certain other funds managed by the Manager (“Participating Funds”), renewed a committed revolving line of credit (the “Committed Line”) agreement with State Street Bank and Trust Company (the “Bank”) to be used to facilitate portfolio liquidity. The maximum borrowing amount under the Committed Line is $150 million with interest at a rate equal to the higher of (a) Overnight Bank Funding Rate (“OBFR”) daily fluctuating rate per annum equal to 1.25% plus the sum of 0.10% or (b) the Federal Funds daily fluctuating rate per annum on amounts borrowed. Each of the Participating Funds paid a proportional amount of a closing fee of $100,000 on the Effective Date and a quarterly commitment fee at a rate of 0.25% per annum on the unused portion of the Committed Line amount. The Committed Line expires November 11, 2021, unless extended by the Bank or terminated by the Participating Funds in accordance with the agreement. Effective November 11, 2021, the Funds’ Committed Line was changed to a maximum of $100 million with an expiration of November 10, 2022.
On the Effective Date, the Funds, along with certain other Participating Funds managed by the Manager, also renewed an uncommitted discretionary demand revolving line of credit (the “Uncommitted Line”) agreement with the Bank to be used to facilitate portfolio liquidity. The maximum borrowing amount under the Uncommitted Line is $50 million with interest at a rate equal to the higher of (a) Overnight Bank Funding Rate (”OBFR”) daily fluctuating rate per annum equal to 1.25% plus the sum of 0.10% or (b) the Federal Funds daily fluctuating rate per annum on amounts borrowed on each outstanding loan. Each of the Participating Funds paid a proportional amount of a closing fee of $35,000 on the Effective Date. The Uncommitted Line expires November 11, 2021 unless extended by the Bank or terminated by the Participating Funds in accordance with the agreement. Effective November 11, 2021, the Funds’ Uncommitted Line was changed to a maximum of $100 million with an expiration of November 10, 2022.
The Participating Funds paid administration, legal and arrangement fees, which are recognized as a component of “Loan expense” on the Statements of Operations, along with commitment fees, that have been allocated among the Participating Funds based on average daily net assets.
During the year ended October 31, 2021, the Funds did not utilize this facility.
65
American Beacon FundsSM
Notes to Financial Statements
October 31, 2021
11. Capital Share Transactions
The tables below summarize the activity in capital shares for each Class of the Funds:
| R5 Class | ||||||||||||||||||||||||||||
| Year Ended October 31, 2021 | Year Ended October 31, 2020 | |||||||||||||||||||||||||||
Balanced Fund | Shares | Amount | Shares | Amount | ||||||||||||||||||||||||
| Shares sold | 120,721 | $ | 1,931,788 | 720,836 | $ | 10,869,956 | ||||||||||||||||||||||
| Reinvestment of dividends | 193,779 | 2,855,565 | 231,222 | 3,577,398 | ||||||||||||||||||||||||
| Shares redeemed | (540,429 | ) | (8,429,094 | ) | (2,234,516 | ) | (34,374,196 | ) | ||||||||||||||||||||
|
|
|
|
|
|
|
| |||||||||||||||||||||
| Net (decrease) in shares outstanding | (225,929 | ) | $ | (3,641,741 | ) | (1,282,458 | ) | $ | (19,926,842 | ) | ||||||||||||||||||
|
|
|
|
|
|
|
| |||||||||||||||||||||
| Y Class | ||||||||||||||||||||||||||||
| Year Ended October 31, 2021 | Year Ended October 31, 2020 | |||||||||||||||||||||||||||
Balanced Fund | Shares | Amount | Shares | Amount | ||||||||||||||||||||||||
| Shares sold | 941,367 | $ | 15,550,576 | 694,721 | $ | 10,316,369 | ||||||||||||||||||||||
| Reinvestment of dividends | 332,973 | 4,939,228 | 298,946 | 4,637,904 | ||||||||||||||||||||||||
| Shares redeemed | (1,893,140 | ) | (30,069,383 | ) | (1,803,400 | ) | (25,905,317 | ) | ||||||||||||||||||||
|
|
|
|
|
|
|
| |||||||||||||||||||||
| Net (decrease) in shares outstanding | (618,800 | ) | $ | (9,579,579 | ) | (809,733 | ) | $ | (10,951,044 | ) | ||||||||||||||||||
|
|
|
|
|
|
|
| |||||||||||||||||||||
| Investor Class | ||||||||||||||||||||||||||||
| Year Ended October 31, 2021 | Year Ended October 31, 2020 | |||||||||||||||||||||||||||
Balanced Fund | Shares | Amount | Shares | Amount | ||||||||||||||||||||||||
| Shares sold | 1,413,967 | $ | 19,561,973 | 923,920 | $ | 11,824,522 | ||||||||||||||||||||||
| Reinvestment of dividends | 851,015 | 10,672,318 | 641,609 | 8,601,456 | ||||||||||||||||||||||||
| Shares redeemed | (1,820,132 | ) | (24,764,742 | ) | (2,760,850 | ) | (35,445,519 | ) | ||||||||||||||||||||
|
|
|
|
|
|
|
| |||||||||||||||||||||
| Net increase (decrease) in shares outstanding | 444,850 | $ | 5,469,549 | (1,195,321 | ) | $ | (15,019,541 | ) | ||||||||||||||||||||
|
|
|
|
|
|
|
| |||||||||||||||||||||
| Advisor Class | ||||||||||||||||||||||||||||
| Year Ended October 31, 2021 | Year Ended October 31, 2020 | |||||||||||||||||||||||||||
Balanced Fund | Shares | Amount | Shares | Amount | ||||||||||||||||||||||||
| Shares sold | 10,067 | $ | 147,698 | 22,115 | $ | 314,694 | ||||||||||||||||||||||
| Reinvestment of dividends | 18,158 | 246,705 | 12,577 | 180,473 | ||||||||||||||||||||||||
| Shares redeemed | (24,084 | ) | (357,831 | ) | (296,651 | ) | (4,511,571 | ) | ||||||||||||||||||||
|
|
|
|
|
|
|
| |||||||||||||||||||||
| Net increase (decrease) in shares outstanding | 4,141 | $ | 36,572 | (261,959 | ) | $ | (4,016,404 | ) | ||||||||||||||||||||
|
|
|
|
|
|
|
| |||||||||||||||||||||
| A Class | ||||||||||||||||||||||||||||
| Year Ended October 31, 2021 | Year Ended October 31, 2020 | |||||||||||||||||||||||||||
Balanced Fund | Shares | Amount | Shares | Amount | ||||||||||||||||||||||||
| Shares sold | 237,914 | $ | 3,301,777 | 164,986 | $ | 2,093,500 | ||||||||||||||||||||||
| Reinvestment of dividends | 122,623 | 1,533,096 | 110,056 | 1,470,053 | ||||||||||||||||||||||||
| Shares redeemed | (425,388 | ) | (5,764,728 | ) | (369,930 | ) | (4,745,607 | ) | ||||||||||||||||||||
|
|
|
|
|
|
|
| |||||||||||||||||||||
| Net (decrease) in shares outstanding | (64,851 | ) | $ | (929,855 | ) | (94,888 | ) | $ | (1,182,054 | ) | ||||||||||||||||||
|
|
|
|
|
|
|
| |||||||||||||||||||||
| C Class | ||||||||||||||||||||||||||||
| Year Ended October 31, 2021 | Year Ended October 31, 2020 | |||||||||||||||||||||||||||
Balanced Fund | Shares | Amount | Shares | Amount | ||||||||||||||||||||||||
| Shares sold | 53,546 | $ | 753,431 | 207,575 | $ | 2,605,143 | ||||||||||||||||||||||
| Reinvestment of dividends | 259,684 | 3,268,682 | 191,599 | 2,604,869 | ||||||||||||||||||||||||
| Shares redeemed | (587,209 | ) | (8,180,741 | ) | (617,259 | ) | (7,825,914 | ) | ||||||||||||||||||||
|
|
|
| �� |
|
|
|
| ||||||||||||||||||||
| Net (decrease) in shares outstanding | (273,979 | ) | $ | (4,158,628 | ) | (218,085 | ) | $ | (2,615,902 | ) | ||||||||||||||||||
|
|
|
|
|
|
|
| |||||||||||||||||||||
66
American Beacon FundsSM
Notes to Financial Statements
October 31, 2021
| R5 Class | ||||||||||||||||||||||||||||
| Year Ended October 31, 2021 | Year Ended October 31, 2020 | |||||||||||||||||||||||||||
Mid-Cap Value Fund | Shares | Amount | Shares | Amount | ||||||||||||||||||||||||
| Shares sold | 1,246,663 | $ | 23,276,443 | 1,887,260 | $ | 23,300,801 | ||||||||||||||||||||||
| Reinvestment of dividends | 98,960 | 1,574,461 | 146,744 | 2,365,592 | ||||||||||||||||||||||||
| Shares redeemed | (3,195,796 | ) | (57,118,702 | ) | (7,448,022 | ) | (100,146,293 | ) | ||||||||||||||||||||
|
|
|
|
|
|
|
| |||||||||||||||||||||
| Net (decrease) in shares outstanding | (1,850,173 | ) | $ | (32,267,798 | ) | (5,414,018 | ) | $ | (74,479,900 | ) | ||||||||||||||||||
|
|
|
|
|
|
|
| |||||||||||||||||||||
| Y Class | ||||||||||||||||||||||||||||
| Year Ended October 31, 2021 | Year Ended October 31, 2020 | |||||||||||||||||||||||||||
Mid-Cap Value Fund | Shares | Amount | Shares | Amount | ||||||||||||||||||||||||
| Shares sold | 545,635 | $ | 10,603,550 | 1,035,791 | $ | 11,573,165 | ||||||||||||||||||||||
| Reinvestment of dividends | 55,418 | 874,492 | 84,354 | 1,348,865 | ||||||||||||||||||||||||
| Shares redeemed | (1,867,296 | ) | (32,744,203 | ) | (2,933,125 | ) | (36,543,666 | ) | ||||||||||||||||||||
|
|
|
|
|
|
|
| |||||||||||||||||||||
| Net (decrease) in shares outstanding | (1,266,243 | ) | $ | (21,266,161 | ) | (1,812,980 | ) | $ | (23,621,636 | ) | ||||||||||||||||||
|
|
|
|
|
|
|
| |||||||||||||||||||||
| Investor Class | ||||||||||||||||||||||||||||
| Year Ended October 31, 2021 | Year Ended October 31, 2020 | |||||||||||||||||||||||||||
Mid-Cap Value Fund | Shares | Amount | Shares | Amount | ||||||||||||||||||||||||
| Shares sold | 606,863 | $ | 11,174,025 | 1,905,185 | $ | 23,857,782 | ||||||||||||||||||||||
| Reinvestment of dividends | 31,633 | 513,090 | 186,420 | 3,042,503 | ||||||||||||||||||||||||
| Shares redeemed | (9,173,222 | ) | (153,379,178 | ) | (5,424,561 | ) | (70,707,388 | ) | ||||||||||||||||||||
|
|
|
|
|
|
|
| |||||||||||||||||||||
| Net (decrease) in shares outstanding | (8,534,726 | ) | $ | (141,692,063 | ) | (3,332,956 | ) | $ | (43,807,103 | ) | ||||||||||||||||||
|
|
|
|
|
|
|
| |||||||||||||||||||||
| Advisor Class | ||||||||||||||||||||||||||||
| Year Ended October 31, 2021 | Year Ended October 31, 2020 | |||||||||||||||||||||||||||
Mid-Cap Value Fund | Shares | Amount | Shares | Amount | ||||||||||||||||||||||||
| Shares sold | 6,162 | $ | 106,606 | 48,344 | $ | 648,990 | ||||||||||||||||||||||
| Reinvestment of dividends | 1,219 | 19,048 | 2,384 | 37,713 | ||||||||||||||||||||||||
| Shares redeemed | (71,189 | ) | (1,204,065 | ) | (164,068 | ) | (2,191,914 | ) | ||||||||||||||||||||
|
|
|
|
|
|
|
| |||||||||||||||||||||
| Net (decrease) in shares outstanding | (63,808 | ) | $ | (1,078,411 | ) | (113,340 | ) | $ | (1,505,211 | ) | ||||||||||||||||||
|
|
|
|
|
|
|
| |||||||||||||||||||||
| A Class | ||||||||||||||||||||||||||||
| Year Ended October 31, 2021 | Year Ended October 31, 2020 | |||||||||||||||||||||||||||
Mid-Cap Value Fund | Shares | Amount | Shares | Amount | ||||||||||||||||||||||||
| Shares sold | 84,871 | $ | 1,533,868 | 64,954 | $ | 824,817 | ||||||||||||||||||||||
| Reinvestment of dividends | 3,860 | 60,258 | 2,289 | 36,239 | ||||||||||||||||||||||||
| Shares redeemed | (120,724 | ) | (2,259,422 | ) | (102,155 | ) | (1,300,626 | ) | ||||||||||||||||||||
|
|
|
|
|
|
|
| |||||||||||||||||||||
| Net (decrease) in shares outstanding | (31,993 | ) | $ | (665,296 | ) | (34,912 | ) | $ | (439,570 | ) | ||||||||||||||||||
|
|
|
|
|
|
|
| |||||||||||||||||||||
| C Class | ||||||||||||||||||||||||||||
| Year Ended October 31, 2021 | Year Ended October 31, 2020 | |||||||||||||||||||||||||||
Mid-Cap Value Fund | Shares | Amount | Shares | Amount | ||||||||||||||||||||||||
| Shares sold | 14,141 | $ | 263,317 | 13,300 | $ | 166,142 | ||||||||||||||||||||||
| Reinvestment of dividends | 1,721 | 25,972 | 1,704 | 26,053 | ||||||||||||||||||||||||
| Shares redeemed | (126,341 | ) | (2,156,797 | ) | (78,574 | ) | (923,215 | ) | ||||||||||||||||||||
|
|
|
|
|
|
|
| |||||||||||||||||||||
| Net (decrease) in shares outstanding | (110,479 | ) | $ | (1,867,508 | ) | (63,570 | ) | $ | (731,020 | ) | ||||||||||||||||||
|
|
|
|
|
|
|
| |||||||||||||||||||||
| R6 Class | ||||||||||||||||||||||||||||
| Year Ended October 31, 2021 | Year Ended October 31, 2020 | |||||||||||||||||||||||||||
Mid-Cap Value Fund | Shares | Amount | Shares | Amount | ||||||||||||||||||||||||
| Shares sold | 430,455 | $ | 8,070,467 | 1,135,634 | $ | 12,772,985 | ||||||||||||||||||||||
| Reinvestment of dividends | 13,733 | 218,896 | 3,542 | 57,138 | ||||||||||||||||||||||||
| Shares redeemed | (454,750 | ) | (8,600,102 | ) | (661,613 | ) | (7,919,099 | ) | ||||||||||||||||||||
|
|
|
|
|
|
|
| |||||||||||||||||||||
| Net increase (decrease) in shares outstanding | (10,562 | ) | $ | (310,739 | ) | 477,563 | $ | 4,911,024 | ||||||||||||||||||||
|
|
|
|
|
|
|
| |||||||||||||||||||||
67
American Beacon FundsSM
Notes to Financial Statements
October 31, 2021
12. Subsequent Events
Management has evaluated subsequent events for possible recognition or disclosure in the financial statements through the date the financial statements are issued. Management has determined that there are no material events that would require disclosure in the Funds’ financial statements through this date.
68
American Beacon Balanced FundSM
Financial Highlights
(For a share outstanding throughout the period)
| R5 ClassA | ||||||||||||||||||||||||||||||||||||
| Year Ended October 31, | ||||||||||||||||||||||||||||||||||||
| 2021 | 2020B | 2019 | 2018 | 2017 | ||||||||||||||||||||||||||||||||
|
| |||||||||||||||||||||||||||||||||||
Net asset value, beginning of period | $ | 14.35 | $ | 16.36 | $ | 16.20 | $ | 17.30 | $ | 15.26 | ||||||||||||||||||||||||||
|
|
|
|
|
|
|
|
|
| |||||||||||||||||||||||||||
Income (loss) from investment operations: | ||||||||||||||||||||||||||||||||||||
Net investment income | 0.19 | 0.20 | 0.31 | 0.28 | 0.36 | |||||||||||||||||||||||||||||||
Net gains (losses) on investments (both realized and unrealized) | 4.34 | (0.80 | ) | 1.23 | (0.10 | ) | 2.04 | |||||||||||||||||||||||||||||
|
|
|
|
|
|
|
|
|
| |||||||||||||||||||||||||||
Total income (loss) from investment operations | 4.53 | (0.60 | ) | 1.54 | 0.18 | 2.40 | ||||||||||||||||||||||||||||||
|
|
|
|
|
|
|
|
|
| |||||||||||||||||||||||||||
Less distributions: | ||||||||||||||||||||||||||||||||||||
Dividends from net investment income | (0.30 | ) | (0.24 | ) | (0.26 | ) | (0.48 | ) | (0.36 | ) | ||||||||||||||||||||||||||
Distributions from net realized gains | (1.65 | ) | (1.17 | ) | (1.12 | ) | (0.80 | ) | - | |||||||||||||||||||||||||||
|
|
|
|
|
|
|
|
|
| |||||||||||||||||||||||||||
Total distributions | (1.95 | ) | (1.41 | ) | (1.38 | ) | (1.28 | ) | (0.36 | ) | ||||||||||||||||||||||||||
|
|
|
|
|
|
|
|
|
| |||||||||||||||||||||||||||
Net asset value, end of period | $ | 16.93 | $ | 14.35 | $ | 16.36 | $ | 16.20 | $ | 17.30 | ||||||||||||||||||||||||||
|
|
|
|
|
|
|
|
|
| |||||||||||||||||||||||||||
Total returnC | 33.80 | % | (4.14 | )% | 10.89 | % | 0.84 | % | 15.82 | % | ||||||||||||||||||||||||||
|
|
|
|
|
|
|
|
|
| |||||||||||||||||||||||||||
Ratios and supplemental data: |
| |||||||||||||||||||||||||||||||||||
Net assets, end of period | $ | 22,687,613 | $ | 22,476,942 | $ | 46,593,155 | $ | 60,191,704 | $ | 88,015,702 | ||||||||||||||||||||||||||
Ratios to average net assets: | ||||||||||||||||||||||||||||||||||||
Expenses, before reimbursements and/or recoupments | 0.70 | % | 0.88 | % | 0.66 | % | 0.62 | % | 0.59 | % | ||||||||||||||||||||||||||
Expenses, net of reimbursements and/or recoupments | 0.70 | % | 0.88 | % | 0.66 | % | 0.62 | % | 0.59 | % | ||||||||||||||||||||||||||
Net investment income, before expense reimbursements and/or recoupments | 1.37 | % | 1.82 | % | 2.24 | % | 1.95 | % | 1.80 | % | ||||||||||||||||||||||||||
Net investment income, net of reimbursements and/or recoupments | 1.37 | % | 1.82 | % | 2.24 | % | 1.95 | % | 1.80 | % | ||||||||||||||||||||||||||
Portfolio turnover rate | 37 | % | 82 | % | 68 | % | 28 | % | 32 | % | ||||||||||||||||||||||||||
| A | Prior to February 28, 2020, the R5 Class was known as Institutional Class. |
| B | On January 23, 2020, Brandywine Global Investment Management, LLC was terminated and ceased managing assets of the Fund. |
| C | Based on net asset value, which does not reflect the sales charge, redemption fee, or contingent deferred sales charge, if applicable. May include adjustments in accordance with U.S. GAAP and as such, the net asset value for reporting purposes and the returns based upon those net asset values may differ from the net asset value and returns for shareholder transactions. |
See accompanying notes
69
American Beacon Balanced FundSM
Financial Highlights
(For a share outstanding throughout the period)
| Y Class | ||||||||||||||||||||||||||||||||||||
| Year Ended October 31, | ||||||||||||||||||||||||||||||||||||
| 2021 | 2020A | 2019 | 2018 | 2017 | ||||||||||||||||||||||||||||||||
|
| |||||||||||||||||||||||||||||||||||
Net asset value, beginning of period | $ | 14.46 | $ | 16.47 | $ | 16.31 | $ | 17.39 | $ | 15.30 | ||||||||||||||||||||||||||
|
|
|
|
|
|
|
|
|
| |||||||||||||||||||||||||||
Income (loss) from investment operations: | ||||||||||||||||||||||||||||||||||||
Net investment income | 0.20 | 0.25 | 0.33 | 0.35 | 0.24 | |||||||||||||||||||||||||||||||
Net gains (losses) on investments (both realized and unrealized) | 4.35 | (0.86 | ) | 1.20 | (0.16 | ) | 2.20 | |||||||||||||||||||||||||||||
|
|
|
|
|
|
|
|
|
| |||||||||||||||||||||||||||
Total income (loss) from investment operations | 4.55 | (0.61 | ) | 1.53 | 0.19 | 2.44 | ||||||||||||||||||||||||||||||
|
|
|
|
|
|
|
|
|
| |||||||||||||||||||||||||||
Less distributions: | ||||||||||||||||||||||||||||||||||||
Dividends from net investment income | (0.29 | ) | (0.23 | ) | (0.25 | ) | (0.47 | ) | (0.35 | ) | ||||||||||||||||||||||||||
Distributions from net realized gains | (1.65 | ) | (1.17 | ) | (1.12 | ) | (0.80 | ) | - | |||||||||||||||||||||||||||
|
|
|
|
|
|
|
|
|
| |||||||||||||||||||||||||||
Total distributions | (1.94 | ) | (1.40 | ) | (1.37 | ) | (1.27 | ) | (0.35 | ) | ||||||||||||||||||||||||||
|
|
|
|
|
|
|
|
|
| |||||||||||||||||||||||||||
Net asset value, end of period | $ | 17.07 | $ | 14.46 | $ | 16.47 | $ | 16.31 | $ | 17.39 | ||||||||||||||||||||||||||
|
|
|
|
|
|
|
|
|
| |||||||||||||||||||||||||||
Total returnB | 33.66 | % | (4.17 | )% | 10.75 | % | 0.88 | % | 16.05 | % | ||||||||||||||||||||||||||
|
|
|
|
|
|
|
|
|
| |||||||||||||||||||||||||||
Ratios and supplemental data: |
| |||||||||||||||||||||||||||||||||||
Net assets, end of period | $ | 40,858,765 | $ | 43,550,846 | $ | 62,956,422 | $ | 71,296,735 | $ | 64,926,394 | ||||||||||||||||||||||||||
Ratios to average net assets: | ||||||||||||||||||||||||||||||||||||
Expenses, before reimbursements and/or recoupments | 0.77 | % | 0.96 | % | 0.74 | % | 0.70 | % | 0.68 | % | ||||||||||||||||||||||||||
Expenses, net of reimbursements and/or recoupments | 0.77 | % | 0.96 | % | 0.74 | % | 0.70 | % | 0.68 | % | ||||||||||||||||||||||||||
Net investment income, before expense reimbursements and/or recoupments | 1.31 | % | 1.71 | % | 2.15 | % | 1.86 | % | 1.67 | % | ||||||||||||||||||||||||||
Net investment income, net of reimbursements and/or recoupments | 1.31 | % | 1.71 | % | 2.15 | % | 1.86 | % | 1.67 | % | ||||||||||||||||||||||||||
Portfolio turnover rate | 37 | % | 82 | % | 68 | % | 28 | % | 32 | % | ||||||||||||||||||||||||||
| A | On January 23, 2020, Brandywine Global Investment Management, LLC was terminated and ceased managing assets of the Fund. |
| B | Based on net asset value, which does not reflect the sales charge, redemption fee, or contingent deferred sales charge, if applicable. May include adjustments in accordance with U.S. GAAP and as such, the net asset value for reporting purposes and the returns based upon those net asset values may differ from the net asset value and returns for shareholder transactions. |
See accompanying notes
70
American Beacon Balanced FundSM
Financial Highlights
(For a share outstanding throughout the period)
| Investor Class | ||||||||||||||||||||||||||||||||||||
| Year Ended October 31, | ||||||||||||||||||||||||||||||||||||
| 2021 | 2020A | 2019 | 2018 | 2017 | ||||||||||||||||||||||||||||||||
|
| |||||||||||||||||||||||||||||||||||
Net asset value, beginning of period | $ | 12.43 | $ | 14.36 | $ | 14.41 | $ | 15.51 | $ | 13.71 | ||||||||||||||||||||||||||
|
|
|
|
|
|
|
|
|
| |||||||||||||||||||||||||||
Income (loss) from investment operations: | ||||||||||||||||||||||||||||||||||||
Net investment income | 0.22 | 0.03 | 0.18 | 0.20 | 0.15 | |||||||||||||||||||||||||||||||
Net gains (losses) on investments (both realized and unrealized) | 3.61 | (0.58 | ) | 1.11 | (0.07 | ) | 1.96 | |||||||||||||||||||||||||||||
|
|
|
|
|
|
|
|
|
| |||||||||||||||||||||||||||
Total income (loss) from investment operations | 3.83 | (0.55 | ) | 1.29 | 0.13 | 2.11 | ||||||||||||||||||||||||||||||
|
|
|
|
|
|
|
|
|
| |||||||||||||||||||||||||||
Less distributions: | ||||||||||||||||||||||||||||||||||||
Dividends from net investment income | (0.26 | ) | (0.21 | ) | (0.22 | ) | (0.43 | ) | (0.31 | ) | ||||||||||||||||||||||||||
Distributions from net realized gains | (1.65 | ) | (1.17 | ) | (1.12 | ) | (0.80 | ) | - | |||||||||||||||||||||||||||
|
|
|
|
|
|
|
|
|
| |||||||||||||||||||||||||||
Total distributions | (1.91 | ) | (1.38 | ) | (1.34 | ) | (1.23 | ) | (0.31 | ) | ||||||||||||||||||||||||||
|
|
|
|
|
|
|
|
|
| |||||||||||||||||||||||||||
Net asset value, end of period | $ | 14.35 | $ | 12.43 | $ | 14.36 | $ | 14.41 | $ | 15.51 | ||||||||||||||||||||||||||
|
|
|
|
|
|
|
|
|
| |||||||||||||||||||||||||||
Total returnB | 33.32 | % | (4.41 | )% | 10.50 | % | 0.62 | % | 15.52 | % | ||||||||||||||||||||||||||
|
|
|
|
|
|
|
|
|
| |||||||||||||||||||||||||||
Ratios and supplemental data: |
| |||||||||||||||||||||||||||||||||||
Net assets, end of period | $ | 85,251,213 | $ | 68,284,615 | $ | 96,065,263 | $ | 107,677,984 | $ | 124,143,894 | ||||||||||||||||||||||||||
Ratios to average net assets: | ||||||||||||||||||||||||||||||||||||
Expenses, before reimbursements and/or recoupments | 0.99 | % | 1.20 | % | 0.97 | % | 0.95 | % | 0.89 | % | ||||||||||||||||||||||||||
Expenses, net of reimbursements and/or recoupments | 0.99 | % | 1.20 | % | 0.97 | % | 0.95 | % | 0.89 | % | ||||||||||||||||||||||||||
Net investment income, before expense reimbursements and/or recoupments | 1.07 | % | 1.47 | % | 1.92 | % | 1.62 | % | 1.48 | % | ||||||||||||||||||||||||||
Net investment income, net of reimbursements and/or recoupments | 1.07 | % | 1.47 | % | 1.92 | % | 1.62 | % | 1.48 | % | ||||||||||||||||||||||||||
Portfolio turnover rate | 37 | % | 82 | % | 68 | % | 28 | % | 32 | % | ||||||||||||||||||||||||||
| A | On January 23, 2020, Brandywine Global Investment Management, LLC was terminated and ceased managing assets of the Fund. |
| B | Based on net asset value, which does not reflect the sales charge, redemption fee, or contingent deferred sales charge, if applicable. May include adjustments in accordance with U.S. GAAP and as such, the net asset value for reporting purposes and the returns based upon those net asset values may differ from the net asset value and returns for shareholder transactions. |
See accompanying notes
71
American Beacon Balanced FundSM
Financial Highlights
(For a share outstanding throughout the period)
| Advisor Class | ||||||||||||||||||||||||||||||||||||
| Year Ended October 31, | ||||||||||||||||||||||||||||||||||||
| 2021 | 2020A | 2019 | 2018 | 2017 | ||||||||||||||||||||||||||||||||
|
| |||||||||||||||||||||||||||||||||||
Net asset value, beginning of period | $ | 13.35 | $ | 15.34 | $ | 15.29 | $ | 16.38 | $ | 14.46 | ||||||||||||||||||||||||||
|
|
|
|
|
|
|
|
|
| |||||||||||||||||||||||||||
Income (loss) from investment operations: | ||||||||||||||||||||||||||||||||||||
Net investment income | 0.15 | 0.18 | B | 0.26 | 0.16 | 0.21 | ||||||||||||||||||||||||||||||
Net gains (losses) on investments (both realized and unrealized) | 3.97 | (0.81 | ) | 1.11 | (0.06 | ) | 1.99 | |||||||||||||||||||||||||||||
|
|
|
|
|
|
|
|
|
| |||||||||||||||||||||||||||
Total income (loss) from investment operations | 4.12 | (0.63 | ) | 1.37 | 0.10 | 2.20 | ||||||||||||||||||||||||||||||
|
|
|
|
|
|
|
|
|
| |||||||||||||||||||||||||||
Less distributions: | ||||||||||||||||||||||||||||||||||||
Dividends from net investment income | (0.23 | ) | (0.19 | ) | (0.20 | ) | (0.39 | ) | (0.28 | ) | ||||||||||||||||||||||||||
Distributions from net realized gains | (1.65 | ) | (1.17 | ) | (1.12 | ) | (0.80 | ) | - | |||||||||||||||||||||||||||
|
|
|
|
|
|
|
|
|
| |||||||||||||||||||||||||||
Total distributions | (1.88 | ) | (1.36 | ) | (1.32 | ) | (1.19 | ) | (0.28 | ) | ||||||||||||||||||||||||||
|
|
|
|
|
|
|
|
|
| |||||||||||||||||||||||||||
Net asset value, end of period | $ | 15.59 | $ | 13.35 | $ | 15.34 | $ | 15.29 | $ | 16.38 | ||||||||||||||||||||||||||
|
|
|
|
|
|
|
|
|
| |||||||||||||||||||||||||||
Total returnC | 33.17 | % | (4.65 | )% | 10.41 | % | 0.42 | % | 15.31 | % | ||||||||||||||||||||||||||
|
|
|
|
|
|
|
|
|
| |||||||||||||||||||||||||||
Ratios and supplemental data: |
| |||||||||||||||||||||||||||||||||||
Net assets, end of period | $ | 2,120,450 | $ | 1,760,622 | $ | 6,039,168 | $ | 6,174,284 | $ | 10,944,675 | ||||||||||||||||||||||||||
Ratios to average net assets: | ||||||||||||||||||||||||||||||||||||
Expenses, before reimbursements and/or recoupments | 1.16 | % | 1.36 | % | 1.14 | % | 1.12 | % | 1.08 | % | ||||||||||||||||||||||||||
Expenses, net of reimbursements and/or recoupments | 1.16 | % | 1.36 | % | 1.14 | % | 1.12 | % | 1.08 | % | ||||||||||||||||||||||||||
Net investment income, before expense reimbursements and/or recoupments | 0.91 | % | 1.29 | % | 1.76 | % | 1.45 | % | 1.29 | % | ||||||||||||||||||||||||||
Net investment income, net of reimbursements and/or recoupments | 0.91 | % | 1.29 | % | 1.76 | % | 1.45 | % | 1.29 | % | ||||||||||||||||||||||||||
Portfolio turnover rate | 37 | % | 82 | % | 68 | % | 28 | % | 32 | % | ||||||||||||||||||||||||||
| A | On January 23, 2020, Brandywine Global Investment Management, LLC was terminated and ceased managing assets of the Fund. |
| B | Per share amounts have been calculated using the average shares method. |
| C | Based on net asset value, which does not reflect the sales charge, redemption fee, or contingent deferred sales charge, if applicable. May include adjustments in accordance with U.S. GAAP and as such, the net asset value for reporting purposes and the returns based upon those net asset values may differ from the net asset value and returns for shareholder transactions. |
See accompanying notes
72
American Beacon Balanced FundSM
Financial Highlights
(For a share outstanding throughout the period)
| A Class | ||||||||||||||||||||||||||||||||||||
| Year Ended October 31, | ||||||||||||||||||||||||||||||||||||
| 2021 | 2020A | 2019 | 2018 | 2017 | ||||||||||||||||||||||||||||||||
|
| |||||||||||||||||||||||||||||||||||
Net asset value, beginning of period | $ | 12.39 | $ | 14.33 | $ | 14.38 | $ | 15.48 | $ | 13.69 | ||||||||||||||||||||||||||
|
|
|
|
|
|
|
|
|
| |||||||||||||||||||||||||||
Income (loss) from investment operations: | ||||||||||||||||||||||||||||||||||||
Net investment income | 0.11 | 0.15 | 0.22 | 0.22 | 0.16 | |||||||||||||||||||||||||||||||
Net gains (losses) on investments (both realized and unrealized) | 3.71 | (0.71 | ) | 1.07 | (0.07 | ) | 1.93 | |||||||||||||||||||||||||||||
|
|
|
|
|
|
|
|
|
| |||||||||||||||||||||||||||
Total income (loss) from investment operations | 3.82 | (0.56 | ) | 1.29 | 0.15 | 2.09 | ||||||||||||||||||||||||||||||
|
|
|
|
|
|
|
|
|
| |||||||||||||||||||||||||||
Less distributions: | ||||||||||||||||||||||||||||||||||||
Dividends from net investment income | (0.25 | ) | (0.21 | ) | (0.22 | ) | (0.45 | ) | (0.30 | ) | ||||||||||||||||||||||||||
Distributions from net realized gains | (1.65 | ) | (1.17 | ) | (1.12 | ) | (0.80 | ) | - | |||||||||||||||||||||||||||
|
|
|
|
|
|
|
|
|
| |||||||||||||||||||||||||||
Total distributions | (1.90 | ) | (1.38 | ) | (1.34 | ) | (1.25 | ) | (0.30 | ) | ||||||||||||||||||||||||||
|
|
|
|
|
|
|
|
|
| |||||||||||||||||||||||||||
Net asset value, end of period | $ | 14.31 | $ | 12.39 | $ | 14.33 | $ | 14.38 | $ | 15.48 | ||||||||||||||||||||||||||
|
|
|
|
|
|
|
|
|
| |||||||||||||||||||||||||||
Total returnB | 33.39 | % | (4.49 | )% | 10.54 | % | 0.73 | % | 15.36 | % | ||||||||||||||||||||||||||
|
|
|
|
|
|
|
|
|
| |||||||||||||||||||||||||||
Ratios and supplemental data: |
| |||||||||||||||||||||||||||||||||||
Net assets, end of period | $ | 13,922,687 | $ | 12,863,938 | $ | 16,228,685 | $ | 18,121,273 | $ | 21,934,880 | ||||||||||||||||||||||||||
Ratios to average net assets: | ||||||||||||||||||||||||||||||||||||
Expenses, before reimbursements and/or recoupments | 1.02 | % | 1.21 | % | 1.01 | % | 0.91 | % | 0.99 | % | ||||||||||||||||||||||||||
Expenses, net of reimbursements and/or recoupments | 1.02 | % | 1.21 | % | 1.01 | %C | 0.83 | % | 0.99 | % | ||||||||||||||||||||||||||
Net investment income, before expense reimbursements and/or recoupments | 1.04 | % | 1.46 | % | 1.88 | % | 1.66 | % | 1.39 | % | ||||||||||||||||||||||||||
Net investment income, net of reimbursements and/or recoupments | 1.04 | % | 1.46 | % | 1.88 | % | 1.74 | % | 1.39 | % | ||||||||||||||||||||||||||
Portfolio turnover rate | 37 | % | 82 | % | 68 | % | 28 | % | 32 | % | ||||||||||||||||||||||||||
| A | On January 23, 2020, Brandywine Global Investment Management, LLC was terminated and ceased managing assets of the Fund. |
| B | Based on net asset value, which does not reflect the sales charge, redemption fee, or contingent deferred sales charge, if applicable. May include adjustments in accordance with U.S. GAAP and as such, the net asset value for reporting purposes and the returns based upon those net asset values may differ from the net asset value and returns for shareholder transactions. |
| C | This ratio does not include a voluntary reimbursement of service fees as included in the prior year. |
See accompanying notes
73
American Beacon Balanced FundSM
Financial Highlights
(For a share outstanding throughout the period)
| C Class | ||||||||||||||||||||||||||||||||||||
| Year Ended October 31, | ||||||||||||||||||||||||||||||||||||
| 2021 | 2020A | 2019 | 2018 | 2017 | ||||||||||||||||||||||||||||||||
|
| |||||||||||||||||||||||||||||||||||
Net asset value, beginning of period | $ | 12.53 | $ | 14.48 | $ | 14.55 | $ | 15.64 | $ | 13.83 | ||||||||||||||||||||||||||
|
|
|
|
|
|
|
|
|
| |||||||||||||||||||||||||||
Income (loss) from investment operations: | ||||||||||||||||||||||||||||||||||||
Net investment income | 0.04 | B | 0.05 | 0.10 | 0.13 | 0.08 | ||||||||||||||||||||||||||||||
Net gains (losses) on investments (both realized and unrealized) | 3.72 | (0.70 | ) | 1.09 | (0.09 | ) | 1.92 | |||||||||||||||||||||||||||||
|
|
|
|
|
|
|
|
|
| |||||||||||||||||||||||||||
Total income (loss) from investment operations | 3.76 | (0.65 | ) | 1.19 | 0.04 | 2.00 | ||||||||||||||||||||||||||||||
|
|
|
|
|
|
|
|
|
| |||||||||||||||||||||||||||
Less distributions: | ||||||||||||||||||||||||||||||||||||
Dividends from net investment income | (0.15 | ) | (0.13 | ) | (0.14 | ) | (0.33 | ) | (0.19 | ) | ||||||||||||||||||||||||||
Distributions from net realized gains | (1.65 | ) | (1.17 | ) | (1.12 | ) | (0.80 | ) | - | |||||||||||||||||||||||||||
|
|
|
|
|
|
|
|
|
| |||||||||||||||||||||||||||
Total distributions | (1.80 | ) | (1.30 | ) | (1.26 | ) | (1.13 | ) | (0.19 | ) | ||||||||||||||||||||||||||
|
|
|
|
|
|
|
|
|
| |||||||||||||||||||||||||||
Net asset value, end of period | $ | 14.49 | $ | 12.53 | $ | 14.48 | $ | 14.55 | $ | 15.64 | ||||||||||||||||||||||||||
|
|
|
|
|
|
|
|
|
| |||||||||||||||||||||||||||
Total returnC | 32.32 | % | (5.09 | )% | 9.63 | % | 0.04 | % | 14.50 | % | ||||||||||||||||||||||||||
|
|
|
|
|
|
|
|
|
| |||||||||||||||||||||||||||
Ratios and supplemental data: |
| |||||||||||||||||||||||||||||||||||
Net assets, end of period | $ | 23,737,711 | $ | 23,951,798 | $ | 30,848,500 | $ | 36,046,543 | $ | 42,575,983 | ||||||||||||||||||||||||||
Ratios to average net assets: | ||||||||||||||||||||||||||||||||||||
Expenses, before reimbursements and/or recoupments | 1.75 | % | 1.95 | % | 1.76 | % | 1.66 | % | 1.73 | % | ||||||||||||||||||||||||||
Expenses, net of reimbursements and/or recoupments | 1.75 | % | 1.95 | % | 1.76 | %D | 1.54 | % | 1.73 | % | ||||||||||||||||||||||||||
Net investment income, before expense reimbursements and/or recoupments | 0.32 | % | 0.72 | % | 1.13 | % | 0.91 | % | 0.63 | % | ||||||||||||||||||||||||||
Net investment income, net of reimbursements and/or recoupments | 0.32 | % | 0.72 | % | 1.13 | % | 1.02 | % | 0.63 | % | ||||||||||||||||||||||||||
Portfolio turnover rate | 37 | % | 82 | % | 68 | % | 28 | % | 32 | % | ||||||||||||||||||||||||||
| A | On January 23, 2020, Brandywine Global Investment Management, LLC was terminated and ceased managing assets of the Fund. |
| B | Per share amounts have been calculated using the average shares method. |
| C | Based on net asset value, which does not reflect the sales charge, redemption fee, or contingent deferred sales charge, if applicable. May include adjustments in accordance with U.S. GAAP and as such, the net asset value for reporting purposes and the returns based upon those net asset values may differ from the net asset value and returns for shareholder transactions. |
| D | This ratio does not include a voluntary reimbursement of service fees as included in the prior year. |
See accompanying notes
74
American Beacon Mid-Cap Value FundSM
Financial Highlights
(For a share outstanding throughout the period)
| R5 ClassA | ||||||||||||||||||||||||||||||||||||
| Year Ended October 31, | ||||||||||||||||||||||||||||||||||||
| 2021 | 2020 | 2019 | 2018 | 2017 | ||||||||||||||||||||||||||||||||
|
| |||||||||||||||||||||||||||||||||||
Net asset value, beginning of period | $ | 13.19 | $ | 15.41 | $ | 15.52 | $ | 17.25 | $ | 14.03 | ||||||||||||||||||||||||||
|
|
|
|
|
|
|
|
|
| |||||||||||||||||||||||||||
Income (loss) from investment operations: | ||||||||||||||||||||||||||||||||||||
Net investment income | 0.23 | B | 0.33 | 0.25 | 0.21 | 0.16 | ||||||||||||||||||||||||||||||
Net gains (losses) on investments (both realized and unrealized) | 7.29 | (2.29 | ) | 0.65 | (1.34 | ) | 3.28 | |||||||||||||||||||||||||||||
|
|
|
|
|
|
|
|
|
| |||||||||||||||||||||||||||
Total income (loss) from investment operations | 7.52 | (1.96 | ) | 0.90 | (1.13 | ) | 3.44 | |||||||||||||||||||||||||||||
|
|
|
|
|
|
|
|
|
| |||||||||||||||||||||||||||
Less distributions: | ||||||||||||||||||||||||||||||||||||
Dividends from net investment income | (0.31 | ) | (0.26 | ) | (0.22 | ) | (0.16 | ) | (0.22 | ) | ||||||||||||||||||||||||||
Distributions from net realized gains | - | - | (0.79 | ) | (0.44 | ) | - | |||||||||||||||||||||||||||||
|
|
|
|
|
|
|
|
|
| |||||||||||||||||||||||||||
Total distributions | (0.31 | ) | (0.26 | ) | (1.01 | ) | (0.60 | ) | (0.22 | ) | ||||||||||||||||||||||||||
|
|
|
|
|
|
|
|
|
| |||||||||||||||||||||||||||
Net asset value, end of period | $ | 20.40 | $ | 13.19 | $ | 15.41 | $ | 15.52 | $ | 17.25 | ||||||||||||||||||||||||||
|
|
|
|
|
|
|
|
|
| |||||||||||||||||||||||||||
Total returnC | 57.68 | % | (13.03 | )% | 7.08 | % | (6.89 | )% | 24.71 | % | ||||||||||||||||||||||||||
|
|
|
|
|
|
|
|
|
| |||||||||||||||||||||||||||
Ratios and supplemental data: |
| |||||||||||||||||||||||||||||||||||
Net assets, end of period | $ | 74,512,300 | $ | 72,565,048 | $ | 168,201,120 | $ | 248,752,034 | $ | 265,934,589 | ||||||||||||||||||||||||||
Ratios to average net assets: | ||||||||||||||||||||||||||||||||||||
Expenses, before reimbursements and/or recoupments | 1.08 | % | 0.95 | % | 0.93 | % | 0.85 | % | 0.89 | % | ||||||||||||||||||||||||||
Expenses, net of reimbursements and/or recoupments | 0.94 | %D | 0.95 | % | 0.93 | % | 0.85 | % | 0.89 | % | ||||||||||||||||||||||||||
Net investment income, before expense reimbursements and/or recoupments | 0.78 | %B | 1.45 | % | 1.40 | % | 1.19 | % | 1.06 | % | ||||||||||||||||||||||||||
Net investment income, net of reimbursements and/or recoupments | 0.92 | %B | 1.45 | % | 1.40 | % | 1.19 | % | 1.06 | % | ||||||||||||||||||||||||||
Portfolio turnover rate | 30 | % | 35 | % | 30 | % | 34 | % | 28 | % | ||||||||||||||||||||||||||
| A | Prior to February 28, 2020, the R5 Class was known as Institutional Class. |
| B | Net investment income includes significant dividend payment from Qurate Retail Inc. amounting to $0.0381. |
| C | Based on net asset value, which does not reflect the sales charge, redemption fee, or contingent deferred sales charge, if applicable. May include adjustments in accordance with U.S. GAAP and as such, the net asset value for reporting purposes and the returns based upon those net asset values may differ from the net asset value and returns for shareholder transactions. |
| D | Expense ratios may exceed stated expense caps in Note 2 due to the change in the contractual expense caps on February 28, 2021. |
See accompanying notes
75
American Beacon Mid-Cap Value FundSM
Financial Highlights
(For a share outstanding throughout the period)
| Y Class | ||||||||||||||||||||||||||||||||||||
| Year Ended October 31, | ||||||||||||||||||||||||||||||||||||
| 2021 | 2020 | 2019 | 2018 | 2017 | ||||||||||||||||||||||||||||||||
|
| |||||||||||||||||||||||||||||||||||
Net asset value, beginning of period | $ | 13.07 | $ | 15.27 | $ | 15.39 | $ | 17.11 | $ | 13.92 | ||||||||||||||||||||||||||
|
|
|
|
|
|
|
|
|
| |||||||||||||||||||||||||||
Income (loss) from investment operations: | ||||||||||||||||||||||||||||||||||||
Net investment income | 0.17 | A | 0.19 | 0.22 | 0.19 | 0.15 | ||||||||||||||||||||||||||||||
Net gains (losses) on investments (both realized and unrealized) | 7.27 | (2.14 | ) | 0.65 | (1.32 | ) | 3.25 | |||||||||||||||||||||||||||||
|
|
|
|
|
|
|
|
|
| |||||||||||||||||||||||||||
Total income (loss) from investment operations | 7.44 | (1.95 | ) | 0.87 | (1.13 | ) | 3.40 | |||||||||||||||||||||||||||||
|
|
|
|
|
|
|
|
|
| |||||||||||||||||||||||||||
Less distributions: | ||||||||||||||||||||||||||||||||||||
Dividends from net investment income | (0.29 | ) | (0.25 | ) | (0.20 | ) | (0.15 | ) | (0.21 | ) | ||||||||||||||||||||||||||
Distributions from net realized gains | - | - | (0.79 | ) | (0.44 | ) | - | |||||||||||||||||||||||||||||
|
|
|
|
|
|
|
|
|
| |||||||||||||||||||||||||||
Total distributions | (0.29 | ) | (0.25 | ) | (0.99 | ) | (0.59 | ) | (0.21 | ) | ||||||||||||||||||||||||||
|
|
|
|
|
|
|
|
|
| |||||||||||||||||||||||||||
Net asset value, end of period | $ | 20.22 | $ | 13.07 | $ | 15.27 | $ | 15.39 | $ | 17.11 | ||||||||||||||||||||||||||
|
|
|
|
|
|
|
|
|
| |||||||||||||||||||||||||||
Total returnB | 57.60 | % | (13.08 | )% | 6.97 | % | (6.96 | )% | 24.60 | % | ||||||||||||||||||||||||||
|
|
|
|
|
|
|
|
|
| |||||||||||||||||||||||||||
Ratios and supplemental data: |
| |||||||||||||||||||||||||||||||||||
Net assets, end of period | $ | 49,952,999 | $ | 48,840,223 | $ | 84,763,978 | $ | 96,799,413 | $ | 100,190,167 | ||||||||||||||||||||||||||
Ratios to average net assets: | ||||||||||||||||||||||||||||||||||||
Expenses, before reimbursements and/or recoupments | 1.15 | % | 1.03 | % | 0.98 | % | 0.93 | % | 0.97 | % | ||||||||||||||||||||||||||
Expenses, net of reimbursements and/or recoupments | 1.02 | %C | 1.03 | % | 0.98 | % | 0.93 | % | 0.97 | % | ||||||||||||||||||||||||||
Net investment income, before expense reimbursements and/or recoupments | 0.71 | %A | 1.37 | % | 1.36 | % | 1.11 | % | 0.98 | % | ||||||||||||||||||||||||||
Net investment income, net of reimbursements and/or recoupments | 0.84 | %A | 1.37 | % | 1.36 | % | 1.11 | % | 0.98 | % | ||||||||||||||||||||||||||
Portfolio turnover rate | 30 | % | 35 | % | 30 | % | 34 | % | 28 | % | ||||||||||||||||||||||||||
| A | Net investment income includes significant dividend payment from Qurate Retail, Inc. amounting to $0.0412. |
| B | Based on net asset value, which does not reflect the sales charge, redemption fee, or contingent deferred sales charge, if applicable. May include adjustments in accordance with U.S. GAAP and as such, the net asset value for reporting purposes and the returns based upon those net asset values may differ from the net asset value and returns for shareholder transactions. |
| C | Expense ratios may exceed stated expense caps in Note 2 due to the change in the contractual expense caps on February 28, 2021. |
See accompanying notes
76
American Beacon Mid-Cap Value FundSM
Financial Highlights
(For a share outstanding throughout the period)
| Investor Class | ||||||||||||||||||||||||||||||||||||
| Year Ended October 31, | ||||||||||||||||||||||||||||||||||||
| 2021 | 2020 | 2019 | 2018 | 2017 | ||||||||||||||||||||||||||||||||
|
| |||||||||||||||||||||||||||||||||||
Net asset value, beginning of period | $ | 13.32 | $ | 15.56 | $ | 15.65 | $ | 17.40 | $ | 14.14 | ||||||||||||||||||||||||||
|
|
|
|
|
|
|
|
|
| |||||||||||||||||||||||||||
Income (loss) from investment operations: | ||||||||||||||||||||||||||||||||||||
Net investment income | 0.48 | A | 0.17 | 0.18 | 0.16 | 0.14 | ||||||||||||||||||||||||||||||
Net gains (losses) on investments (both realized and unrealized) | 7.11 | (2.20 | ) | 0.69 | (1.34 | ) | 3.31 | |||||||||||||||||||||||||||||
|
|
|
|
|
|
|
|
|
| |||||||||||||||||||||||||||
Total income (loss) from investment operations | 7.59 | (2.03 | ) | 0.87 | (1.18 | ) | 3.45 | |||||||||||||||||||||||||||||
|
|
|
|
|
|
|
|
|
| |||||||||||||||||||||||||||
Less distributions: | ||||||||||||||||||||||||||||||||||||
Dividends from net investment income | (0.16 | ) | (0.21 | ) | (0.17 | ) | (0.13 | ) | (0.19 | ) | ||||||||||||||||||||||||||
Distributions from net realized gains | - | - | (0.79 | ) | (0.44 | ) | - | |||||||||||||||||||||||||||||
|
|
|
|
|
|
|
|
|
| |||||||||||||||||||||||||||
Total distributions | (0.16 | ) | (0.21 | ) | (0.96 | ) | (0.57 | ) | (0.19 | ) | ||||||||||||||||||||||||||
|
|
|
|
|
|
|
|
|
| |||||||||||||||||||||||||||
Net asset value, end of period | $ | 20.75 | $ | 13.32 | $ | 15.56 | $ | 15.65 | $ | 17.40 | ||||||||||||||||||||||||||
|
|
|
|
|
|
|
|
|
| |||||||||||||||||||||||||||
Total returnB | 57.34 | % | (13.30 | )% | 6.79 | % | (7.13 | )% | 24.52 | % | ||||||||||||||||||||||||||
|
|
|
|
|
|
|
|
|
| |||||||||||||||||||||||||||
Ratios and supplemental data: |
| |||||||||||||||||||||||||||||||||||
Net assets, end of period | $ | 60,065,449 | $ | 152,245,804 | $ | 229,639,964 | $ | 379,123,913 | $ | 274,552,551 | ||||||||||||||||||||||||||
Ratios to average net assets: | ||||||||||||||||||||||||||||||||||||
Expenses, before reimbursements and/or recoupments | 1.37 | % | 1.21 | % | 1.18 | % | 1.12 | % | 1.09 | % | ||||||||||||||||||||||||||
Expenses, net of reimbursements and/or recoupments | 1.18 | %C | 1.21 | % | 1.18 | % | 1.12 | % | 1.09 | % | ||||||||||||||||||||||||||
Net investment income, before expense reimbursements and/or recoupments | 0.74 | %A | 1.19 | % | 1.12 | % | 0.92 | % | 0.86 | % | ||||||||||||||||||||||||||
Net investment income, net of reimbursements and/or recoupments | 0.93 | %A | 1.19 | % | 1.12 | % | 0.92 | % | 0.86 | % | ||||||||||||||||||||||||||
Portfolio turnover rate | 30 | % | 35 | % | 30 | % | 34 | % | 28 | % | ||||||||||||||||||||||||||
| A | Net investment income includes significant dividend payment from Qurate Retail, Inc. amounting to $0.0322. |
| B | Based on net asset value, which does not reflect the sales charge, redemption fee, or contingent deferred sales charge, if applicable. May include adjustments in accordance with U.S. GAAP and as such, the net asset value for reporting purposes and the returns based upon those net asset values may differ from the net asset value and returns for shareholder transactions. |
| C | Expense ratios may exceed stated expense caps in Note 2 due to the change in the contractual expense caps on February 28, 2021. |
See accompanying notes
77
American Beacon Mid-Cap Value FundSM
Financial Highlights
(For a share outstanding throughout the period)
| Advisor Class | ||||||||||||||||||||||||||||||||||||
| Year Ended October 31, | ||||||||||||||||||||||||||||||||||||
| 2021 | 2020 | 2019 | 2018 | 2017 | ||||||||||||||||||||||||||||||||
|
| |||||||||||||||||||||||||||||||||||
Net asset value, beginning of period | $ | 12.88 | $ | 15.06 | $ | 15.17 | $ | 16.83 | $ | 13.69 | ||||||||||||||||||||||||||
|
|
|
|
|
|
|
|
|
| |||||||||||||||||||||||||||
Income (loss) from investment operations: | ||||||||||||||||||||||||||||||||||||
Net investment income | 0.06 | A B | 0.16 | 0.15 | 0.10 | 0.10 | ||||||||||||||||||||||||||||||
Net gains (losses) on investments (both realized and unrealized) | 7.19 | (2.16 | ) | 0.66 | (1.29 | ) | 3.18 | |||||||||||||||||||||||||||||
|
|
|
|
|
|
|
|
|
| |||||||||||||||||||||||||||
Total income (loss) from investment operations | 7.25 | (2.00 | ) | 0.81 | (1.19 | ) | 3.28 | |||||||||||||||||||||||||||||
|
|
|
|
|
|
|
|
|
| |||||||||||||||||||||||||||
Less distributions: | ||||||||||||||||||||||||||||||||||||
Dividends from net investment income | (0.20 | ) | (0.18 | ) | (0.13 | ) | (0.03 | ) | (0.14 | ) | ||||||||||||||||||||||||||
Distributions from net realized gains | - | - | (0.79 | ) | (0.44 | ) | - | |||||||||||||||||||||||||||||
|
|
|
|
|
|
|
|
|
| |||||||||||||||||||||||||||
Total distributions | (0.20 | ) | (0.18 | ) | (0.92 | ) | (0.47 | ) | (0.14 | ) | ||||||||||||||||||||||||||
|
|
|
|
|
|
|
|
|
| |||||||||||||||||||||||||||
Net asset value, end of period | $ | 19.93 | $ | 12.88 | $ | 15.06 | $ | 15.17 | $ | 16.83 | ||||||||||||||||||||||||||
|
|
|
|
|
|
|
|
|
| |||||||||||||||||||||||||||
Total returnC | 56.71 | % | (13.51 | )% | 6.50 | % | (7.38 | )% | 24.10 | % | ||||||||||||||||||||||||||
|
|
|
|
|
|
|
|
|
| |||||||||||||||||||||||||||
Ratios and supplemental data: |
| |||||||||||||||||||||||||||||||||||
Net assets, end of period | $ | 656,892 | $ | 1,245,906 | $ | 3,163,999 | $ | 3,597,339 | $ | 3,682,231 | ||||||||||||||||||||||||||
Ratios to average net assets: | ||||||||||||||||||||||||||||||||||||
Expenses, before reimbursements and/or recoupments | 1.70 | % | 1.53 | % | 1.45 | % | 1.39 | % | 1.40 | % | ||||||||||||||||||||||||||
Expenses, net of reimbursements and/or recoupments | 1.55 | %D | 1.53 | % | 1.45 | % | 1.39 | % | 1.40 | % | ||||||||||||||||||||||||||
Net investment income, before expense reimbursements and/or recoupments | 0.21 | %A | 0.92 | % | 0.90 | % | 0.64 | % | 0.55 | % | ||||||||||||||||||||||||||
Net investment income, net of reimbursements and/or recoupments | 0.36 | %A | 0.92 | % | 0.90 | % | 0.64 | % | 0.55 | % | ||||||||||||||||||||||||||
Portfolio turnover rate | 30 | % | 35 | % | 30 | % | 34 | % | 28 | % | ||||||||||||||||||||||||||
| A | Per share amounts have been calculated using the average shares method. |
| B | Net investment income includes significant dividend payment from Qurate Retail, Inc. amounting to $0.0260. |
| C | Based on net asset value, which does not reflect the sales charge, redemption fee, or contingent deferred sales charge, if applicable. May include adjustments in accordance with U.S. GAAP and as such, the net asset value for reporting purposes and the returns based upon those net asset values may differ from the net asset value and returns for shareholder transactions. |
| D | Expense ratios may exceed stated expense caps in Note 2 due to the change in the contractual expense caps on February 28, 2021. |
See accompanying notes
78
American Beacon Mid-Cap Value FundSM
Financial Highlights
(For a share outstanding throughout the period)
| A Class | ||||||||||||||||||||||||||||||||||||
| Year Ended October 31, | ||||||||||||||||||||||||||||||||||||
| 2021 | 2020 | 2019 | 2018 | 2017 | ||||||||||||||||||||||||||||||||
|
| |||||||||||||||||||||||||||||||||||
Net asset value, beginning of period | $ | 12.91 | $ | 15.03 | $ | 15.15 | $ | 16.84 | $ | 13.70 | ||||||||||||||||||||||||||
|
|
|
|
|
|
|
|
|
| |||||||||||||||||||||||||||
Income (loss) from investment operations: | ||||||||||||||||||||||||||||||||||||
Net investment income | 0.16 | A | 0.23 | 0.49 | 0.18 | 0.13 | ||||||||||||||||||||||||||||||
Net gains (losses) on investments (both realized and unrealized) | 7.14 | (2.20 | ) | 0.32 | (1.36 | ) | 3.18 | |||||||||||||||||||||||||||||
|
|
|
|
|
|
|
|
|
| |||||||||||||||||||||||||||
Total income (loss) from investment operations | 7.30 | (1.97 | ) | 0.81 | (1.18 | ) | 3.31 | |||||||||||||||||||||||||||||
|
|
|
|
|
|
|
|
|
| |||||||||||||||||||||||||||
Less distributions: | ||||||||||||||||||||||||||||||||||||
Dividends from net investment income | (0.26 | ) | (0.15 | ) | (0.14 | ) | (0.07 | ) | (0.17 | ) | ||||||||||||||||||||||||||
Distributions from net realized gains | - | - | (0.79 | ) | (0.44 | ) | - | |||||||||||||||||||||||||||||
|
|
|
|
|
|
|
|
|
| |||||||||||||||||||||||||||
Total distributions | (0.26 | ) | (0.15 | ) | (0.93 | ) | (0.51 | ) | (0.17 | ) | ||||||||||||||||||||||||||
|
|
|
|
|
|
|
|
|
| |||||||||||||||||||||||||||
Net asset value, end of period | $ | 19.95 | $ | 12.91 | $ | 15.03 | $ | 15.15 | $ | 16.84 | ||||||||||||||||||||||||||
|
|
|
|
|
|
|
|
|
| |||||||||||||||||||||||||||
Total returnB | 57.15 | % | (13.31 | )% | 6.57 | % | (7.32 | )% | 24.26 | % | ||||||||||||||||||||||||||
|
|
|
|
|
|
|
|
|
| |||||||||||||||||||||||||||
Ratios and supplemental data: |
| |||||||||||||||||||||||||||||||||||
Net assets, end of period | $ | 3,639,123 | $ | 2,767,845 | $ | 3,748,595 | $ | 12,080,510 | $ | 18,170,218 | ||||||||||||||||||||||||||
Ratios to average net assets: | ||||||||||||||||||||||||||||||||||||
Expenses, before reimbursements and/or recoupments | 1.45 | % | 1.30 | % | 1.35 | % | 1.25 | % | 1.27 | % | ||||||||||||||||||||||||||
Expenses, net of reimbursements and/or recoupments | 1.30 | %C | 1.30 | % | 1.35 | % | 1.25 | % | 1.27 | % | ||||||||||||||||||||||||||
Net investment income, before expense reimbursements and/or recoupments | 0.36 | %A | 1.09 | % | 0.94 | % | 0.78 | % | 0.69 | % | ||||||||||||||||||||||||||
Net investment income, net of reimbursements and/or recoupments | 0.51 | %A | 1.09 | % | 0.94 | % | 0.78 | % | 0.69 | % | ||||||||||||||||||||||||||
Portfolio turnover rate | 30 | % | 35 | % | 30 | % | 34 | % | 28 | % | ||||||||||||||||||||||||||
| A | Net investment income includes significant dividend payment from Qurate Retail, Inc. amounting to $0.0380. |
| B | Based on net asset value, which does not reflect the sales charge, redemption fee, or contingent deferred sales charge, if applicable. May include adjustments in accordance with U.S. GAAP and as such, the net asset value for reporting purposes and the returns based upon those net asset values may differ from the net asset value and returns for shareholder transactions. |
| C | Expense ratios may exceed stated expense caps in Note 2 due to the change in the contractual expense caps on February 28, 2021. |
See accompanying notes
79
American Beacon Mid-Cap Value FundSM
Financial Highlights
(For a share outstanding throughout the period)
| C Class | ||||||||||||||||||||||||||||||||||||
| Year Ended October 31, | ||||||||||||||||||||||||||||||||||||
| 2021 | 2020 | 2019 | 2018 | 2017 | ||||||||||||||||||||||||||||||||
|
| |||||||||||||||||||||||||||||||||||
Net asset value, beginning of period | $ | 12.39 | $ | 14.49 | $ | 14.60 | $ | 16.27 | $ | 13.26 | ||||||||||||||||||||||||||
|
|
|
|
|
|
|
|
|
| |||||||||||||||||||||||||||
Income (loss) from investment operations: | ||||||||||||||||||||||||||||||||||||
Net investment income (loss) | (0.27 | )A | 0.01 | 0.02 | 0.03 | (0.03 | ) | |||||||||||||||||||||||||||||
Net gains (losses) on investments (both realized and unrealized) | 7.17 | (2.02 | ) | 0.69 | (1.26 | ) | 3.11 | |||||||||||||||||||||||||||||
|
|
|
|
|
|
|
|
|
| |||||||||||||||||||||||||||
Total income (loss) from investment operations | 6.90 | (2.01 | ) | 0.71 | (1.23 | ) | 3.08 | |||||||||||||||||||||||||||||
|
|
|
|
|
|
|
|
|
| |||||||||||||||||||||||||||
Less distributions: | ||||||||||||||||||||||||||||||||||||
Dividends from net investment income | (0.13 | ) | (0.09 | ) | (0.03 | ) | - | (0.07 | ) | |||||||||||||||||||||||||||
Distributions from net realized gains | - | - | (0.79 | ) | (0.44 | ) | - | |||||||||||||||||||||||||||||
|
|
|
|
|
|
|
|
|
| |||||||||||||||||||||||||||
Total distributions | (0.13 | ) | (0.09 | ) | (0.82 | ) | (0.44 | ) | (0.07 | ) | ||||||||||||||||||||||||||
|
|
|
|
|
|
|
|
|
| |||||||||||||||||||||||||||
Net asset value, end of period | $ | 19.16 | $ | 12.39 | $ | 14.49 | $ | 14.60 | $ | 16.27 | ||||||||||||||||||||||||||
|
|
|
|
|
|
|
|
|
| |||||||||||||||||||||||||||
Total returnB | 55.99 | % | (13.99 | )% | 5.94 | % | (7.85 | )% | 23.27 | % | ||||||||||||||||||||||||||
|
|
|
|
|
|
|
|
|
| |||||||||||||||||||||||||||
Ratios and supplemental data: |
| |||||||||||||||||||||||||||||||||||
Net assets, end of period | $ | 2,417,639 | $ | 2,932,329 | $ | 4,349,946 | $ | 5,840,412 | $ | 6,520,983 | ||||||||||||||||||||||||||
Ratios to average net assets: | ||||||||||||||||||||||||||||||||||||
Expenses, before reimbursements and/or recoupments | 2.17 | % | 2.05 | % | 2.02 | % | 1.87 | % | 2.04 | % | ||||||||||||||||||||||||||
Expenses, net of reimbursements and/or recoupments | 2.05 | %C | 2.05 | % | 2.02 | % | 1.87 | % | 2.04 | % | ||||||||||||||||||||||||||
Net investment income (loss), before expense reimbursements | (0.30 | )%A | 0.35 | % | 0.32 | % | 0.17 | % | (0.09 | )% | ||||||||||||||||||||||||||
Net investment income (loss), net of reimbursements | (0.18 | )%A | 0.35 | % | 0.32 | % | 0.17 | % | (0.09 | )% | ||||||||||||||||||||||||||
Portfolio turnover rate | 30 | % | 35 | % | 30 | % | 34 | % | 28 | % | ||||||||||||||||||||||||||
| A | Net investment income includes significant dividend payment from Quarte Retail, Inc. amounting to $0.0368. |
| B | Based on net asset value, which does not reflect the sales charge, redemption fee, or contingent deferred sales charge, if applicable. May include adjustments in accordance with U.S. GAAP and as such, the net asset value for reporting purposes and the returns based upon those net asset values may differ from the net asset value and returns for shareholder transactions. |
| C | Expense ratios may exceed stated expense caps in Note 2 due to the change in the contractual expense caps on February 28, 2021. |
See accompanying notes
80
American Beacon Mid-Cap Value FundSM
Financial Highlights
(For a share outstanding throughout the period)
| R6 Class | ||||||||||||||||||||||||||||
| Year Ended October 31, | February 28, 2018A to October 31, 2018 | |||||||||||||||||||||||||||
| 2021 | 2020 | 2019 | ||||||||||||||||||||||||||
|
| |||||||||||||||||||||||||||
Net asset value, beginning of period | $ | 13.21 | $ | 15.42 | $ | 15.52 | $ | 16.94 | ||||||||||||||||||||
|
|
|
|
|
|
|
| |||||||||||||||||||||
Income from investment operations: | ||||||||||||||||||||||||||||
Net investment income | 0.15 | B | 0.28 | 0.20 | 0.10 | |||||||||||||||||||||||
Net gains (losses) on investments (both realized and unrealized) | 7.40 | (2.23 | ) | 0.71 | (1.52 | ) | ||||||||||||||||||||||
|
|
|
|
|
|
|
| |||||||||||||||||||||
Total income (loss) from investment operations | 7.55 | (1.95 | ) | 0.91 | (1.42 | ) | ||||||||||||||||||||||
|
|
|
|
|
|
|
| |||||||||||||||||||||
Less distributions: | ||||||||||||||||||||||||||||
Dividends from net investment income | (0.32 | ) | (0.26 | ) | (0.22 | ) | - | |||||||||||||||||||||
Distributions from net realized gains | - | - | (0.79 | ) | - | |||||||||||||||||||||||
|
|
|
|
|
|
|
| |||||||||||||||||||||
Total distributions | (0.32 | ) | (0.26 | ) | (1.01 | ) | - | |||||||||||||||||||||
|
|
|
|
|
|
|
| |||||||||||||||||||||
Net asset value, end of period | $ | 20.44 | $ | 13.21 | $ | 15.42 | $ | 15.52 | ||||||||||||||||||||
|
|
|
|
|
|
|
| |||||||||||||||||||||
Total returnC | 57.80 | % | (12.93 | )% | 7.15 | % | (8.38 | )%D | ||||||||||||||||||||
|
|
|
|
|
|
|
| |||||||||||||||||||||
Ratios and supplemental data: |
| |||||||||||||||||||||||||||
Net assets, end of period | $ | 12,532,694 | $ | 8,239,279 | $ | 2,253,328 | $ | 191,772 | ||||||||||||||||||||
Ratios to average net assets: | ||||||||||||||||||||||||||||
Expenses, before reimbursements and/or recoupments | 1.05 | % | 0.96 | % | 0.90 | % | 3.09 | %E | ||||||||||||||||||||
Expenses, net of reimbursements and/or recoupments | 0.89 | %F | 0.87 | % | 0.83 | % | 0.88 | %E | ||||||||||||||||||||
Net investment income (loss), before expense reimbursements and/or recoupments | 0.74 | % | 1.34 | % | 1.51 | % | (0.88 | )%E | ||||||||||||||||||||
Net investment income, net of reimbursements and/or recoupments | 0.90 | % | 1.43 | % | 1.58 | % | 1.32 | %E | ||||||||||||||||||||
Portfolio turnover rate | 30 | % | 35 | % | 30 | % | 34 | %D | ||||||||||||||||||||
| A | Commencement of operations. |
| B | Net investment income includes significant dividend payment from Qurate Retail, Inc. amounting to $0.0467. |
| C | Based on net asset value, which does not reflect the sales charge, redemption fee, or contingent deferred sales charge, if applicable. May include adjustments in accordance with U.S. GAAP and as such, the net asset value for reporting purposes and the returns based upon those net asset values may differ from the net asset value and returns for shareholder transactions. |
| D | Not annualized. |
| E | Annualized. |
| F | Expense ratios may exceed stated expense caps in Note 2 due to the change in the contractual expense caps on February 28, 2021. |
See accompanying notes
81
Federal Tax Information
October 31, 2021 (Unaudited)
Certain tax information regarding the Funds is required to be provided to shareholders based upon the Funds’ income and distributions for the taxable year ended October 31, 2021. The information and distributions reported herein may differ from information and distributions taxable to the shareholders for the calendar year ended December 31, 2021.
The Funds designated the following items with regard to distributions paid during the fiscal year ended October 31, 2021. All designations are based on financial information available as of this annual report and, accordingly, are subject to change. For each item, it is the intention of the Funds to designate the maximum amount permitted under the Internal Revenue Code of 1986, as amended, and the regulations there under.
Corporate Dividends-Received Deduction:
Balanced | 69.57 | % | ||
Mid-Cap Value | 100.00 | % |
Qualified Dividend Income:
Balanced | 79.62 | % | ||
Mid-Cap Value | 100.00 | % |
Long-Term Capital Gain Distributions:
Balanced | $ | 21,379,448 | ||
Mid-Cap Value | - |
Short-Term Capital Gain Distributions:
Balanced | $ | 0 | ||
Mid-Cap Value | $ | 0 |
Shareholders will receive notification in January 2022 of the applicable tax information necessary to prepare their 2021 income tax returns.
82
Disclosure Regarding Approval of the Management and Investment Advisory Agreements (Unaudited)
Renewal and Approval of Management Agreement and Investment Advisory Agreements
At meetings held on May 17, 2021 and June 8-9, 2021 (collectively, the “Meetings”) via videoconference, the Board of Trustees (“Board” or “Trustees”) considered and then, at its June 9, 2021 meeting, approved the renewal of:
(1) the Management Agreement between American Beacon Advisors, Inc. (“Manager”) and the American Beacon Funds (“Trust”), on behalf of the American Beacon Balanced Fund (“Balanced Fund”) and the American Beacon Mid-Cap Value Fund (“Mid-Cap Fund”) (each, a “Fund” and collectively, the “Funds”);
(2) the Investment Advisory Agreements among the Manager, the Trust, on behalf of the Balanced Fund, and each of Barrow, Hanley, Mewhinney & Strauss, LLC (“Barrow”) and Hotchkis and Wiley Capital Management, LLC (“Hotchkis”); and
(3) the Investment Advisory Agreements among the Manager, the Trust, on behalf of the Mid-Cap Fund, and each of Barrow, Pzena Investment Management, LLC (“Pzena”) and WEDGE Capital Management, LLP (“WEDGE”).
Barrow, Hotchkis, Pzena and WEDGE are hereinafter each referred to as a “subadvisor” and collectively as the “subadvisors.” The Management Agreement and the Investment Advisory Agreements are referred to herein individually as an “Agreement” and collectively as the “Agreements.” In preparation for its consideration of the renewal of the Agreements, the Board undertook steps to gather and consider information furnished by the Manager, the subadvisors, Broadridge, Inc. (“Broadridge”) and Morningstar, Inc. (“Morningstar”). The Board, with the assistance of independent legal counsel, requested and received certain relevant information from the Manager and each subadvisor.
In advance of the Meetings, the Board’s Investment Committee and/or the Manager coordinated the production of information from Broadridge and Morningstar regarding the performance, fees and expenses of the Funds as well as information from the Manager and the subadvisors. At the Meetings, the Board considered the information provided in connection with the renewal process, as well as information furnished to the Board throughout the year at regular meetings of the Board and its committees. In connection with the Board’s consideration of the Agreements, the Trustees received and evaluated such information as they deemed necessary, including the impact of the COVID-19 pandemic on the operations of the Manager and the subadvisors. This information is described below in the section summarizing the factors the Board considered in connection with its renewal and approval of the Agreements, as well as the section describing additional Board considerations with respect to each Fund.
The Board noted that the Manager provides management and administrative services to the Funds pursuant to the Management Agreement. The Board considered that many mutual funds have separate contracts governing each type of service and observed that, with respect to such mutual funds, the actual management fee rates provided by Broadridge for peer group funds reflect the combined advisory and administrative fees, reduced by any fee waivers and/or reimbursements.
A firm may not have been able to, or opted not to, provide information in response to certain information requests, in which case the Board conducted its evaluation of the firm based on information that was provided. In such cases, the Board determined that the omission of any such information was not material to its considerations.
Provided below is an overview of certain factors the Board considered in connection with its decision to approve the renewal of the Agreements. The Board did not identify any particular information that was most relevant to its consideration of whether to approve the renewal of each Agreement, and each Trustee may have afforded different weight to the various factors. Legal counsel to the independent Trustees provided the Board with a memorandum regarding its responsibilities pertaining to the renewal of investment advisory contracts, such as the Agreements, and related regulatory guidelines. Based on its evaluation, the Board unanimously concluded that the terms of each Agreement were reasonable and fair and that the approval of the renewal of each Agreement was in the best interests of the Funds and their shareholders.
83
Disclosure Regarding Approval of the Management and Investment Advisory Agreements (Unaudited)
Considerations With Respect to the Renewal of the Management Agreement and the Investment Advisory Agreements
In determining whether to approve the renewal of the Agreements, the Board considered each Fund’s investment management and subadvisory relationships separately. In each instance, the Board considered, among other things, the following factors: (1) the nature, extent and quality of the services provided; (2) the investment performance of the Funds and the subadvisors for the Funds; (3) the costs incurred by the Manager in rendering services to the Funds and its resulting profits or losses; (4) comparisons of services and fee rates with contracts entered into by the Manager or the subadvisors or their affiliates with other clients (such as pension funds and other institutional clients); (5) the extent to which economies of scale, if any, have been taken into account in setting each fee rate schedule; (6) whether fee rate levels reflect economies of scale, if any, for the benefit of Fund investors; and (7) any other benefits derived or anticipated to be derived by the Manager or the subadvisors from their relationship with the Funds.
Nature, Extent and Quality of Services. With respect to the renewal of the Management Agreement, the Board considered, among other factors: each Fund’s long-term performance; the length of service of key investment personnel at the Manager; the cost structure of the Funds; the Manager’s culture of compliance and support that reduce risks to the Funds; the Manager’s quality of services; the Manager’s active role in monitoring and, as appropriate, recommending additional or replacement subadvisors; and the Manager’s efforts to retain key employees and maintain staffing levels.
With respect to the renewal of each Investment Advisory Agreement, the Board considered, among other factors: the level of staffing and the size of the subadvisor; the adequacy of the resources committed to the Funds by each subadvisor; the financial stability of each subadvisor; and representations made by each subadvisor regarding its compliance program. Based on the foregoing information, the Board concluded that the nature, extent and quality of the management and advisory services provided by the Manager and each subadvisor were appropriate for each Fund.
Investment Performance. The Board evaluated the comparative information provided by Broadridge and the Manager regarding the performance of each Fund, relative to its Broadridge Performance Universe, Morningstar Category, and benchmark index, as well as the Fund’s Morningstar rating. The Board considered the information provided by Broadridge regarding its independent methodology for selecting each Fund’s Broadridge Performance Universe. In addition, the Board considered the performance reports and discussions with management at Board and Committee meetings throughout the year. The Board also evaluated the comparative information provided by each subadvisor regarding the performance of its portion of the relevant Fund relative to the performance of a composite of comparable investment accounts managed by the subadvisor and the relevant Fund’s benchmark index. In addition, the Board considered the Manager’s recommendation to continue to retain each subadvisor. A discussion regarding the Board’s considerations with respect to each Fund’s performance appears below under “Additional Considerations and Conclusions with Respect to Each Fund.”
Costs of the Services Provided to the Funds and the Profits Realized by the Manager from its Relationship with the Funds. In analyzing the costs of services and profitability of the Manager, the Board considered the revenues earned and the expenses incurred by the Manager, before and after the payment of distribution-related expenses by the Manager. The profits or losses were noted at both an aggregate level for all funds within the group of mutual funds sponsored by the Manager (the “Fund Complex”) and at an individual Fund level, with the Manager earning a profit with respect to each Fund before and after the payment of distribution-related expenses by the Manager. The Board also considered comparative information provided by the Manager regarding the Manager’s overall profitability with respect to the Fund Complex relative to the overall profitability of other firms in the mutual fund industry, as disclosed in publicly available sources. Although the Board noted that, in certain cases, the fee rates paid by other clients of the Manager are lower than the fee rates paid by the Funds, the Manager represented that, among other matters, the difference is attributable to the fact that the Manager does not perform administrative services for non-investment company clients and reflects the greater level of responsibility
84
Disclosure Regarding Approval of the Management and Investment Advisory Agreements (Unaudited)
and regulatory requirements associated with managing the Funds. The Board also noted that, for all share classes of the Mid-Cap Fund, the Manager is waiving fees and/or reimbursing expenses
The Board further considered that, with respect to each Fund, the Management Agreement provides for the Manager to receive a management fee comprised of an annualized fee that is retained by the Manager. In addition, the Board considered that the Manager receives fees for managing the portion of the Balanced Fund with respect to which the Manager has not delegated day-to day management to a subadvisor and for administering and overseeing the securities lending program on behalf of each Fund. The Board also noted that certain share classes of the Funds maintain higher expense ratios in order to compensate third-party financial intermediaries.
In analyzing the fee rates charged by each subadvisor in connection with its investment advisory services to a Fund, the Board considered representations made by the subadvisors that each Fund’s subadvisory fee rate schedule generally was favorable compared to other comparable client accounts. The Board did not request profitability data from the subadvisors because the Board did not view this data as imperative to its deliberations given the arm’s-length nature of the relationship between the Manager and the subadvisors with respect to the negotiation of subadvisory fee rates. In addition, the Board noted that subadvisors may not account for their profits on an account-by-account basis and that different firms likely employ different methodologies in connection with these calculations.
Based on the foregoing information, the Board concluded that the profitability levels of the Manager were reasonable in light of the services performed by the Manager. A discussion regarding the Board’s considerations with respect to each Fund’s fee rates is set forth below under “Additional Considerations and Conclusions with Respect to Each Fund.”
Economies of Scale. In considering the reasonableness of the management and investment advisory fees rates, the Board considered whether economies of scale will be realized as each Fund grows and whether fee rate levels reflect these economies of scale for the benefit of Fund shareholders. In this regard, the Board considered that, with respect to each subadvisor, the Manager has negotiated breakpoints for the subadvisory fee rate schedule. The Board considered that the current assets of the Balanced Fund allocated to Barrow did not exceed the threshold necessary to reach the first subadvisory fee rate breakpoint and the current assets of the Mid-Cap Fund allocated to WEDGE and Barrow did not exceed the threshold necessary to reach the first subadvisory fee rate breakpoints.
In addition, the Board noted the Manager’s representation that the Management Agreement contains fee schedule breakpoints at higher asset levels with respect to each Fund, except for the portion of the Balanced Fund with respect to which the Manager has not delegated day-to-day management to a subadvisor. The Board considered that the Funds’ current assets did not exceed the threshold necessary to reach the first management fee breakpoint. Based on the foregoing information, the Board concluded that the Manager and subadvisor fee rate schedules for each Fund provide for a reasonable sharing of benefits from any economies of scale with each Fund.
Benefits Derived from the Relationship with the Funds. The Board considered the “fall-out” or ancillary benefits that accrue to the Manager and/or the subadvisors as a result of the advisory relationships with the Funds, including greater exposure in the marketplace with respect to the Manager’s or a subadvisor’s investment process and expanding the level of assets under management by the Manager and the subadvisors. The Board also considered that the Manager may invest the Funds’ cash balances and cash collateral provided by the borrowers of the Funds’ securities in the American Beacon U.S. Government Money Market Select Fund, which the Manager manages directly, and for which the Manager receives a fee. In addition, the Board noted that each subadvisor benefits from soft dollar arrangements for proprietary and/or third-party research. Based on the foregoing information, the Board concluded that the potential benefits accruing to the Manager and the subadvisors by virtue of their relationships with the Funds appear to be fair and reasonable.
85
Disclosure Regarding Approval of the Management and Investment Advisory Agreements (Unaudited)
Additional Considerations and Conclusions with Respect to Each Fund
The performance comparisons below were made for each Fund’s R5 Class shares relative to the Fund’s Broadridge Performance Universe and Morningstar Category. With respect to the Broadridge Performance Universe, the 1st Quintile represents the top 20 percent of the universe based on performance, and the 5th Quintile represents the bottom 20 percent of the universe based on performance. References to each Fund’s Broadridge Performance Universe are to the respective universe of mutual funds with comparable investment classifications and objectives as determined by Broadridge. The performance of individual firms was calculated by the Manager based on information provided by the Funds’ custodian.
In reviewing the performance, the Board viewed longer-term performance over a full market cycle, typically five years or longer, as the most important consideration because relative performance over shorter periods may be significantly impacted by market or economic events and not necessarily reflective of subadvisor skill.
The expense comparisons below were made for each Fund’s R5 Class shares relative to the Fund’s Broadridge Expense Universe and Broadridge Expense Group, and Y Class shares relative to the Fund’s Morningstar Fee Level universe. The 1st Quintile represents the lowest 20 percent of the universe or group based on lowest total expense, and the 5th Quintile represents the highest 20 percent of the universe or group based on highest total expense. References to each Fund’s Expense Group and Expense Universe are to the respective group or universe of comparable mutual funds as determined by Broadridge. A Broadridge Expense Group consists of the Fund and a representative sample of funds with similar operating structures and asset sizes, as selected by Broadridge. A Broadridge Expense Universe includes all funds with comparable investment classifications/objectives and similar operating structures to that of the share class under review for each Fund, including funds in the Broadridge Expense Group. The Broadridge expense comparisons are based on the most recent audited financial information publicly available for a Fund as of December 31, 2020. References to each Fund’s Morningstar Fee Level ranking are to the institutional share class of comparable mutual funds as determined by Morningstar.
The Board considered each Fund’s Morningstar fee level category with the 1st Quintile representing the lowest 20 percent of the category constituents and the 5th Quintile representing the highest 20 percent of the category in terms of total expense.
In reviewing expenses, the Board considered the positive impact of fee waivers and the Manager’s agreement to continue the fee waivers. The Board also considered that, in connection with the change in the name of the Funds’ Institutional Class shares, the share class used for the Funds’ Morningstar Fee Level comparisons had changed from the R5 Class shares to the Y Class shares, which may have resulted in a less favorable Morningstar Fee Level Ranking for the Funds than in prior years.
Additional Considerations and Conclusions with Respect to the American Beacon Balanced Fund
In considering the renewal of the Management Agreement for the Balanced Fund, the Board considered the following additional factors:
Broadridge Total Expenses Excluding 12b-1 Fees and Morningstar Fee Level Ranking
Compared to Broadridge Expense Group | 4th Quintile | |
Compared to Broadridge Expense Universe | 5th Quintile | |
Morningstar Fee Level Ranking | 3rd Quintile |
Broadridge and Morningstar Performance Analysis (five-year period ended December 31, 2020)
Compared to Broadridge Performance Universe | 4th Quintile | |
Compared to Morningstar Category | 4th Quintile |
86
Disclosure Regarding Approval of the Management and Investment Advisory Agreements (Unaudited)
The Board noted that American Beacon Advisors, Inc. (“AmBeacon”) receives an additional fee under the Management Agreement for managing an allocation of the Balanced Fund. In considering the renewal of the Management Agreement with AmBeacon and the Investment Advisory Agreements with Barrow, Hotchkis and AmBeacon, the Board considered that the diversification of investment strategies facilitated by the Balanced Fund’s multi-manager structure permits the Balanced Fund to mitigate the risks associated with a single subadvisor. The Board also considered the following additional factors:
Subadvisor Performance (compared to Broadridge Performance Universe for period indicated ended December 31, 2020)
Barrow | 5 Years | 4 | th Quintile | |||
Hotchkis* | 5 Years | 3 | rd Quintile | |||
AmBeacon** | 5 Years | 3 | rd Quintile |
* Hotchkis equity value-only return compared to the Broadridge large cap value Performance Universe
** AmBeacon bond-only return compared to Broadridge core bond Performance Universe
The Board also considered: (1) that the Funds included in the Broadridge Performance Universe are managed pursuant to a variety of investment styles, and the Balanced Fund may underperform when a value investment style is out of favor; (2) the Manager and Barrow invest the Balanced Fund’s fixed income portfolio exclusively in investment grade debt securities while the funds in the Broadridge Performance Universe may invest in high yield debt securities; (3) information provided by each subadvisor regarding fee rates charged for managing assets in the same or a similar strategy or strategies as the subadvisor manages its allocation of the Balanced Fund; (4) that the Balanced Fund’s management fee and gross expense ratio for all share classes for its prior fiscal year included expenses that were not expected to recur in future years; (5) the recent termination of a prior subadvisor, and the reallocation of assets among the Balanced Fund’s remaining subadvisors; and (6) the Manager’s recommendation to continue to retain each subadvisor.
Based on these and other considerations, the Board: (1) concluded that the fees paid to the Manager and the subadvisors under the Management and Investment Advisory Agreements are fair and reasonable; and (2) determined that the Balanced Fund and its shareholders would benefit from the Manager’s and subadvisors’ continued management of the Balanced Fund.
Additional Considerations and Conclusions with Respect to the American Beacon Mid-Cap Value Fund
In considering the renewal of the Management Agreement for the Mid-Cap Fund, the Board considered the following additional factors:
Broadridge Total Expense Analysis Excluding 12b-1 Fees and Morningstar Fee Level Ranking
Compared to Broadridge Expense Group | 4th Quintile | |
Compared to Broadridge Expense Universe | 5th Quintile | |
Morningstar Fee Level Ranking | 4th Quintile |
Broadridge and Morningstar Performance Analysis (five-year period ended December 31, 2020)
Compared to Broadridge Performance Universe | 3rd Quintile | |
Compared to Morningstar Category | 4th Quintile |
In considering the renewal of the Investment Advisory Agreements with Barrow, Pzena and WEDGE, the Board considered that the diversification of investment strategies facilitated by the Mid-Cap Fund’s multi-manager
87
Disclosure Regarding Approval of the Management and Investment Advisory Agreements (Unaudited)
structure permits the Mid-Cap Fund to mitigate the risks associated with a single subadvisor. The Board also considered the following additional factors:
Subadvisor Performance (compared to Broadridge Performance Universe for period indicated ended December 31, 2020)
Barrow | 5 Years | 3 | rd Quintile | |||
Pzena | 5 Years | 1 | st Quintile | |||
WEDGE | 5 Years | 4 | th Quintile |
The Board also considered: (1) the Manager’s representation that the Mid-Cap Fund’s Broadridge Expense Group and Expense Universe are comprised principally of single-manager funds, which typically reach breakpoints in their subadvisory fee schedules sooner than multi-manager funds that pay their subadvisors directly; (2) information provided by each subadvisor regarding fee rates charged for managing assets in the same or a similar strategy as the subadvisor manages its allocation of the Mid-Cap Fund; (3) discussions regarding potential future options for enhancing the Fund’s performance; and (4) the Manager’s recommendation to continue to retain each subadvisor.
Based on these and other considerations, the Board: (1) concluded that the fees paid to the Manager and the subadvisors under the Management and Investment Advisory Agreements are fair and reasonable; and (2) determined that the Mid-Cap Fund and its shareholders would benefit from the Manager’s and subadvisors’ continued management of the Mid-Cap Fund pending any potential changes to enhance the Fund’s performance, as noted above.
88
Trustees and Officers of the American Beacon FundsSM (Unaudited)
The Trustees and officers of the American Beacon Funds (the “Trust”) are listed below, together with their principal occupations during the past five years. The address of each person listed below is 220 Las Colinas Boulevard East, Suite 1200, Irving, Texas 75039. Each Trustee oversees thirty funds in the fund complex that includes the Trust, the American Beacon Select Funds, and the American Beacon Institutional Funds Trust. The Trust’s Statement of Additional Information contains additional information about the Trustees and is available without charge by calling 1-800-658-5811.
Name, Age | Position, Term of Office and Length of Time Served with the Trust | Principal Occupation(s) During Past 5 Years and Current Directorships | ||
| INTERESTED TRUSTEES | Term | |||
Lifetime of Trust until removal, resignation or retirement* | ||||
| Eugene J. Duffy (67)** | Trustee since 2008 | Managing Director, Global Investment Management Distribution, Mesirow Financial Administrative Corporation (2016-Present); Managing Director, Institutional Services, Intercontinental Real Estate Corporation (2014-2016); Trustee, American Beacon Select Funds (2008-Present); Trustee, American Beacon Institutional Funds Trust (2017-Present); Trustee, American Beacon Sound Point Enhanced Income Fund (2018–2021); Trustee, American Beacon Apollo Total Return Fund (2018–2021). | ||
| NON-INTERESTED TRUSTEES | Term | |||
Lifetime of Trust until removal, resignation or retirement* | ||||
| Gilbert G. Alvarado (51) | Trustee since 2015 | President, SJVIIF, LLC, Impact Investment Fund (2018-Present); Director, Kura MD, Inc. (local telehealth organization) (2015-2017); Senior Vice President & CFO, Sierra Health Foundation (health conversion private foundation) (2006-Present); Senior Vice President & CFO, Sierra Health Foundation: Center for Health Program Management (California public benefit corporation) (2012-Present); Director, Innovative North State (2012-2015); Director, Sacramento Regional Technology Alliance (2011-2016); Director, Valley Healthcare Staffing (2017–2018); Trustee, American Beacon Select Funds (2015-Present); Trustee, American Beacon Institutional Funds Trust (2017-Present); Trustee, American Beacon Sound Point Enhanced Income Fund (2018–2021); Trustee, American Beacon Apollo Total Return Fund (2018–2021). | ||
| Joseph B. Armes (59) | Trustee since 2015 | Director, Switchback Energy Acquisition (2019-2021); Chairman & CEO, CSW Industrials f/k/a Capital Southwest Corporation (investment company) (2015-Present); Chairman of the Board of Capital Southwest Corporation, predecessor to CSW Industrials, Inc. (2014-2017) (investment company); President & CEO, JBA Investment Partners (family investment vehicle) (2010-Present); Director and Chair of Audit Committee, RSP Permian (oil and gas producer) (2013-2018); Trustee, American Beacon Select Funds (2015-Present); Trustee, American Beacon Institutional Funds Trust (2017-Present); Trustee, American Beacon Sound Point Enhanced Income Fund (2018–2021); Trustee, American Beacon Apollo Total Return Fund (2018–2021). | ||
| Gerard J. Arpey (63) | Trustee since 2012 | Partner, Emerald Creek Group (private equity firm) (2011-Present); Director, S.C. Johnson & Son, Inc. (privately held company) (2008-present); Director, The Home Depot, Inc. (2015-Present); Trustee, American Beacon Select Funds (2012-Present); Trustee, American Beacon Institutional Funds Trust (2017-Present); Trustee, American Beacon Sound Point Enhanced Income Fund (2018–2021); Trustee, American Beacon Apollo Total Return Fund (2018–2021). | ||
89
Trustees and Officers of the American Beacon FundsSM (Unaudited)
Name, Age | Position, Term of Office and Length of Time Served with the Trust | Principal Occupation(s) During Past 5 Years and Current Directorships | ||
| NON-INTERESTED TRUSTEES (CONT.) | Term | |||
Lifetime of Trust until removal, resignation or retirement* | ||||
| Brenda A. Cline (60) | Trustee since 2004 Chair since 2019 Vice Chair 2018 | Chief Financial Officer, Treasurer and Secretary, Kimbell Art Foundation (1993-Present); Director, Tyler Technologies, Inc. (public sector software solutions company) (2014-Present); Director, Range Resources Corporation (oil and natural gas company) (2015-Present); Trustee, Cushing Closed-End and Open-End Funds (2017-Present); Trustee, American Beacon Select Funds (2004-Present); Trustee, American Beacon Institutional Funds Trust (2017-Present); Trustee, American Beacon Sound Point Enhanced Income Fund (2018–2021); Trustee, American Beacon Apollo Total Return Fund (2018–2021). | ||
| Claudia A. Holz (64) | Trustee since 2018 | Partner, KPMG LLP (1990–2017); Independent Director, Blue Owl Capital Inc. (2021-Present); Trustee, American Beacon Select Funds (2018-Present); Trustee, American Beacon Institutional Funds Trust (2018-Present); Trustee, American Beacon Sound Point Enhanced Income Fund (2018–2021); Trustee, American Beacon Apollo Total Return Fund (2018–2021). | ||
| Douglas A. Lindgren (59) | Trustee since 2018 | CEO North America, Carne Global Financial Services (2016-2017); Consultant, Carne Financial Services (2017-2019); Managing Director, IPS Investment Management and Global Head, Content Management, UBS Wealth Management (2010-2016); Trustee, American Beacon Select Funds (2018-Present); Trustee, American Beacon Institutional Funds Trust (2018-Present); Trustee, American Beacon Sound Point Enhanced Income Fund (2018–2021); Trustee, American Beacon Apollo Total Return Fund (2018–2021). | ||
| Barbara J. McKenna, CFA (58) | Trustee since 2012 | President/Managing Principal, Longfellow Investment Management Company (2005-Present); Trustee, American Beacon Select Funds (2012-Present); Trustee, American Beacon Institutional Funds Trust (2017-Present); Trustee, American Beacon Sound Point Enhanced Income Fund (2018–2021); Trustee, American Beacon Apollo Total Return Fund (2018–2021). | ||
90
Trustees and Officers of the American Beacon FundsSM (Unaudited)
Name, Age | Position, Term of Office and Length of Time Served with the Trust | Principal Occupation(s) During Past 5 Years and Current Directorships | ||
| OFFICERS | Term | |||
| One Year | ||||
| Gene L. Needles, Jr. (66) | President since 2009 | President (2009-2018), CEO and Director (2009–Present), and Chairman (2018-Present), American Beacon Advisors, Inc., President (2015-2018), Director and CEO (2015–Present), and Chairman (2018-Present), Resolute Investment Holdings, LLC; President (2015-2018), Director and CEO (2015-Present), and Chairman (2018-Present),Resolute Topco, Inc.; President (2015-2018); Director, and CEO (2015-Present), and Chairman (2018-Present), Resolute Acquisition, Inc.; President (2015-2018), Director and CEO (2015-Present), Chairman (2018-Present), Resolute Investment Managers, Inc.; Director, Chairman, President and CEO, Resolute Investment Distributors (2017-Present); Director, Chairman, President and CEO; Resolute Investment Services, Inc. (2017-Present); Manager, President and CEO, American Private Equity Management, LLC (2012-Present); Director, Chairman, President and CEO, Alpha Quant Advisors, LLC (2016-2020); Director, ARK Investment Management LLC (2016-2020); Director, Shapiro Capital Management LLC (2017-Present); Director, Chairman and CEO, Continuous Capital, LLC (2018-Present); Director, Green Harvest Asset Management (2019-Present); Director, National Investment Services of America, LLC (2019–Present); Director, RSW Investments Holdings LLC, (2019-Present); Manager, SSI Investment Management, LLC (2019-Present); President, American Beacon Cayman Managed Futures Strategy Fund, Ltd. (2014-Present); Director and President, American Beacon Cayman Transformational Innovation Company, LTD., (2017-2018); President, American Beacon Delaware Transformational Innovation Corporation (2017-2018); President American Beacon Cayman TargetRisk Company, Ltd. (2018-Present); Member, Investment Advisory Committee, Employees Retirement System of Texas (2017-Present); Trustee, American Beacon NextShares Trust (2015-2020); President, American Beacon Select Funds (2009-Present); President, American Beacon Institutional Funds Trust (2017-Present); President, American Beacon Sound Point Enhanced Income Fund (2018-2021); President, American Beacon Apollo Total Return Fund (2018-2021). | ||
91
Trustees and Officers of the American Beacon FundsSM (Unaudited)
Name, Age | Position, Term of Office and Length of Time Served with the Trust | Principal Occupation(s) During Past 5 Years and Current Directorships | ||
| OFFICERS (CONT.) | Term | |||
| One Year | ||||
| Rosemary K. Behan (62) | VP, Secretary and Chief Legal Officer since 2006 | Senior Vice President (2021-Present), Vice President (2006-2021), Secretary and General Counsel (2006-Present), American Beacon Advisors, Inc.; Secretary, Resolute Investment Holdings, LLC (2015-Present); Secretary, Resolute Topco, Inc. (2015-Present); Secretary, Resolute Acquisition, Inc. (2015–Present); Senior Vice President (2021-Present), Vice President (2015-2021), Secretary and General Counsel (2015-Present), Resolute Investment Managers, Inc.; Secretary, Resolute Investment Distributors, Inc. (2017-Present); Senior Vice President (2021-Present), Vice President (2017-2021), Secretary and General Counsel (2017-Present), Resolute Investment Services, Inc.; Secretary, American Private Equity Management, LLC (2008-Present); Secretary and General Counsel, Alpha Quant Advisors, LLC (2016-2020); Vice President and Secretary, Continuous Capital, LLC (2018-Present); Secretary, Green Harvest Asset Management (2019-2021); Secretary, American Beacon Delaware Transformational Innovation Corporation (2017-2018); Secretary, American Beacon Cayman Transformational Innovation Company, Ltd. (2017-2018); Secretary, American Beacon Cayman Managed Futures Strategy Fund, Ltd. (2014-Present); Secretary, American Beacon Cayman TargetRisk Company, Ltd (2018-Present); Chief Legal Officer, Vice President and Secretary, American Beacon Select Funds (2006-Present); Chief Legal Officer, Vice President and Secretary, American Beacon Institutional Funds Trust (2017-Present); Chief Legal Officer, Vice President and Secretary, American Beacon Sound Point Enhanced Income Fund (2018-2021); Chief Legal Officer, Vice President and Secretary American Beacon Apollo Total Return Fund (2018-2021). | ||
| Brian E. Brett (61) | VP since 2004 | Senior Vice President, Head of Distribution (2012-Present), American Beacon Advisors, Inc.; Senior Vice President, Resolute Investment Managers, Inc. (2017-Present); Senior Vice President, Resolute Investment Distributors, Inc. (2018-Present); Senior Vice President, Resolute Investment Services, Inc. (2018-Present); Vice President, American Beacon Select Funds (2004-Present); Vice President, American Beacon Institutional Funds Trust (2017-Present); Vice President American Beacon Sound Point Enhanced Income Fund (2018-2021); Vice President American Beacon Apollo Total Return Fund (2018-2021). | ||
| Paul B. Cavazos (52) | VP since 2016 | Chief Investment Officer and Senior Vice President, American Beacon Advisors, Inc. (2016-Present); Chief Investment Officer, DTE Energy (2007-2016); Vice President, American Private Equity Management, L.L.C. (2017–Present); Vice President, American Beacon Select Funds (2016-Present); Vice President, American Beacon Institutional Funds Trust (2017-Present); Vice President American Beacon Sound Point Enhanced Income Fund (2018-2021); Vice President American Beacon Apollo Total Return Fund (2018-2021). | ||
| Erica Duncan (51) | VP since 2011 | Vice President, American Beacon Advisors, Inc. (2011-Present); Vice President, Resolute Investment Managers (2018-Present); Vice President, Resolute Investment Services, Inc. (2018-Present); Vice President, American Beacon Select Funds (2011-Present); Vice President, American Beacon Institutional Funds Trust (2017-Present); Vice President American Beacon Sound Point Enhanced Income Fund (2018-2021); Vice President American Beacon Apollo Total Return Fund (2018-2021). | ||
92
Trustees and Officers of the American Beacon FundsSM (Unaudited)
Name, Age | Position, Term of Office and Length of Time Served with the Trust | Principal Occupation(s) During Past 5 Years and Current Directorships | ||
| OFFICERS (CONT.) | Term | |||
| One Year | ||||
| Melinda G. Heika (60) | VP since 2021 Principal Accounting Officer and Treasurer (2010-2021) | Senior Vice President (2021-Present), Treasurer and CFO (2010-Present), American Beacon Advisors, Inc.; Treasurer, Resolute Topco, Inc. (2015-Present); Treasurer, Resolute Investment Holdings, LLC. (2015-Present); Treasurer, Resolute Acquisition, Inc. (2015-Present); Senior Vice President (2021-Present), Treasurer and CFO, Resolute Investment Managers, Inc. (2017-Present); Treasurer, Resolute Investment Distributors, Inc. (2017); Senior Vice President (2021-Present); Treasurer and CFO, Resolute Investment Services, Inc. (2015-Present); Treasurer, American Private Equity Management, LLC (2012-Present); Treasurer and CFO, Alpha Quant Advisors, LLC (2016-2020); Treasurer and CFO, Continuous Capital, LLC (2018-Present); Treasurer, American Beacon Cayman Transformational Innovation, Ltd. (2017-2018); Treasurer, American Beacon Delaware Transformational Innovation Corporation (2017-2018); Director and Treasurer, American Beacon Cayman Managed Futures Strategy Fund, Ltd. (2014-Present); Treasurer, American Beacon Cayman TargetRisk Company, Ltd. (2018-Present); Vice President (2021-Present), Principal Accounting Officer (2017-2021) and Treasurer (2010-2021), American Beacon Select Funds; Vice President (2021–Present), Principal Accounting Officer and Treasurer (2017-2021), American Beacon Institutional Funds Trust; Vice President (2021), Principal Accounting Officer and Treasurer (2018-2021), American Beacon Sound Point Enhanced Income Fund; Vice President (2021), Principal Accounting Officer and Treasurer, American Beacon Apollo Total Return Fund (2018-2021). | ||
| Terri L. McKinney (57) | VP since 2010 | Senior Vice President (2021-Present), Vice President (2009-2021), American Beacon Advisors, Inc.; Senior Vice President (2021–Present); Vice President (2017-2021), Resolute Investment Managers, Inc.; Senior Vice President (2021-Present), Vice President (2018-Present), Resolute Investment Services, Inc; Vice President, Alpha Quant Advisors, LLC (2016-2020); Vice President, Continuous Capital, LLC (2018-Present); Vice President, American Beacon Select Funds (2010-Present); Vice President, American Beacon Institutional Funds Trust (2017-Present); Vice President, American Beacon Sound Point Enhanced Income Fund (2018-2021); Vice President, American Beacon Apollo Total Return Fund (2018-2021). | ||
| Jeffrey K. Ringdahl (46) | VP since 2010 | Director (2015-Present), President (2018-Present), Chief Operating Officer (2010-Present), Senior Vice President (2013-2018), American Beacon Advisors, Inc.; Director (2015-Present), President (2018-Present), Senior Vice President (2015-2018), Resolute Investment Holdings, LLC; Director (2015-Present), President (2018-Present), Senior Vice President (2015-2018), Resolute Topco, Inc.; Director (2015-Present), President (2018-Present), Senior Vice President (2015-2018), Resolute Acquisition, Inc.; Director (2015-Present), President & COO (2018-Present), Senior Vice President (2015-2018), Resolute Investment Managers, Inc.; Director and Executive Vice President (2017-Present), Resolute Investment Distributors, Inc.; Director (2017-Present), President & COO (2018-Present), Executive Vice President (2017-2018), Resolute Investment Services, Inc.; Senior Vice President (2017-Present), Vice President (2012-2017), Manager (2015-Present), American Private Equity Management, LLC; Trustee, American Beacon NextShares Trust (2015-2020); Director, Executive Vice President & COO, Alpha Quant Advisors, LLC (2016-2020); Director, Shapiro Capital Management, LLC (2017-Present); Director, Executive Vice President & COO, Continuous Capital, LLC (2018-Present); Director, RSW Investments Holdings LLC, (2019-Present); Manager, SSI Investment Management, LLC (2019-Present); Director, National Investment Services of America, LLC (2019-Present); Director and Vice President, American Beacon Cayman Transformational Innovation Company, Ltd., (2017-Present); Vice President, American Beacon Delaware Transformational Innovation Corporation (2017-2018); Director and Vice President, American Beacon Cayman Managed Futures Strategy Fund, Ltd. (2014-Present); Vice President, American Beacon Cayman TargetRisk Company, Ltd (2018-Present); Vice President, American Beacon Select Funds (2010-2018); Vice President, American Beacon Institutional Funds Trust (2017-Present); Vice President, American Beacon Sound Point Enhanced Income Fund (2018-2021); Vice President, American Beacon Apollo Total Return Fund (2018-2021). | ||
93
Trustees and Officers of the American Beacon FundsSM (Unaudited)
Name, Age | Position, Term of Office and Length of Time Served with the Trust | Principal Occupation(s) During Past 5 Years and Current Directorships | ||
| OFFICERS (CONT.) | Term | |||
| One Year | ||||
| Samuel J. Silver (58) | VP since 2011 | Vice President (2011-Present), Chief Fixed Income Officer (2016-Present), American Beacon Advisors, Inc. (2011-Present); Vice President, American Beacon Select Funds (2011-Present); Vice President, American Beacon Institutional Funds Trust (2017-Present); Vice President, American Beacon Sound Point Enhanced Income Fund (2018-2021); Vice President, American Beacon Apollo Total Return Fund (2018-2021). | ||
| Christina E. Sears (50) | Chief Compliance Officer since 2004 and Asst. Secretary since 1999 | Vice President, American Beacon Advisors, Inc. (2019-Present); Chief Compliance Officer, American Beacon Advisors, Inc. (2004-Present); Vice President, Resolute Investment Managers, Inc. (2017-Present); Vice President, Resolute Investment Distributors (2017-Present); Vice President, Resolute Investment Services, Inc. (2019-Present); Chief Compliance Officer, American Private Equity Management, LLC (2012-Present); Chief Compliance Officer, Green Harvest Asset Management, LLC (2019-Present); Chief Compliance Officer, RSW Investments Holdings, LLC (2019-Present); Chief Compliance Officer (2016-2019) and Vice President, Alpha Quant Advisors, LLC (2016-2020); Vice President, Continuous Capital, LLC (2018-Present); Chief Compliance Officer (2004-Present) and Assistant Secretary (1999-Present), American Beacon Select Funds; Chief Compliance Officer and Assistant Secretary, American Beacon Institutional Funds Trust (2017-Present); Chief Compliance Officer and Assistant Secretary, American Beacon Sound Point Enhanced Income Fund (2018-2021); Chief Compliance Officer and Assistant Secretary, American Beacon Apollo Total Return Fund (2018-2021). | ||
| Sonia L. Bates (64) | Principal Accounting Officer and Treasurer since 2021 Assistant Treasurer (2011-2021) | Assistant Treasurer, American Beacon Advisors, Inc. (2011-2018); Assistant Treasurer, American Private Equity Management, LLC (2012-Present); Assistant Treasurer, American Beacon Cayman Transformational Innovation Company, Ltd. (2017-Present); Assistant Treasurer, American Beacon Cayman TargetRisk Company, Ltd. (2018-Present); Principal Accounting Officer and Treasurer (2021-Present), Assistant Treasurer (2011-2021), American Beacon Select Funds; Principal Accounting Officer and Treasurer (2021-Present), Assistant Treasurer (2017-2021), American Beacon Institutional Funds Trust; Principal Accounting Officer and Treasurer (2021), Assistant Treasurer (2018-2021), American Beacon Sound Point Enhanced Income Fund; Principal Accounting Officer and Treasurer (2021), Assistant Treasurer (2018-2021), American Beacon Apollo Total Return Fund. | ||
| Shelley L. Dyson (51) | Assistant Treasurer since 2021 | Assistant Treasurer, American Beacon Select Funds (2021-Present); Assistant Treasurer, American Beacon Institutional Funds Trust (2021-Present); Assistant Treasurer, American Beacon Sound Point Enhanced Income Fund (2021); Assistant Treasurer, American Beacon Apollo Total Return Fund (2021). | ||
| Shelley D. Abrahams (46) | Assistant Secretary since 2008 | Assistant Secretary, American Beacon Select Funds (2008-Present); Assistant Secretary, American Beacon Institutional Funds Trust (2017-Present); Assistant Secretary, American Beacon Sound Point Enhanced Income Fund (2018-2021); Assistant Secretary, American Beacon Apollo Total Return Fund (2018-2021). | ||
| Rebecca L. Harris (54) | Assistant Secretary since 2010 | Senior Vice President (2021-Present), Vice President (2011-Present), American Beacon Advisors, Inc.; Senior Vice President (2021-Present), Vice President (2017-Present), Resolute Investment Managers, Inc.; Senior Vice President (2021-Present), Vice President (2015-Present), Resolute Investment Services; Vice President, Alpha Quant Advisors, LLC (2016-2020); Vice President, Continuous Capital, LLC (2018-Present); Assistant Secretary, American Beacon Select Funds (2010-Present); Assistant Secretary, American Beacon Institutional Funds Trust (2017-Present); Assistant Secretary, American Beacon Sound Point Enhanced Income Fund (2018-2021); Assistant Secretary, American Beacon Apollo Total Return Fund (2018-2021). | ||
94
Trustees and Officers of the American Beacon FundsSM (Unaudited)
Name, Age | Position, Term of Office and Length of Time Served with the Trust | Principal Occupation(s) During Past 5 Years and Current Directorships | ||
| OFFICERS (CONT.) | Term | |||
| One Year | ||||
| Teresa A. Oxford (63) | Assistant Secretary since 2015 | Assistant Secretary, American Beacon Advisors, Inc. (2015-Present); Assistant Secretary, Resolute Investment Distributors (2018-2021); Assistant Secretary, Resolute Investment Managers, Inc. (2017-Present); Assistant Secretary, Resolute Investment Services (2018-Present); Assistant Secretary, Alpha Quant Advisors, LLC (2016-2020); Assistant Secretary, Continuous Capital, LLC (2020-Present); Assistant Secretary, American Beacon Select Funds (2015-Present); Assistant Secretary, American Beacon Institutional Funds Trust (2017-Present); Assistant Secretary, American Beacon Sound Point Enhanced Income Fund (2018-2021); Assistant Secretary, American Beacon Apollo Total Return Fund (2018-2021). | ||
| Michael D. Jiang (36) | Assistant Secretary since 2021 | Assistant Secretary (2021-Present), Resolute Investment Distributors, Inc.; Associate General Counsel (2021-Present), Resolute Investment Services, Inc.; Vice President (2018-2021), The Northern Trust Company; Second Vice President (2015-2018), The Northern Trust Company. Assistant Secretary, American Beacon Select Funds (2021-Present); Assistant Secretary, American Beacon Institutional Funds Trust (2021-Present); Assistant Secretary, American Beacon Sound Point Enhanced Income Fund (2021); Assistant Secretary, American Beacon Apollo Total Return Fund (2021). | ||
* As of 11/12/2014, the Board adopted a retirement plan that requires Trustees to retire no later than the last day of the calendar year in which they reach the age of 75.
** Mr. Duffy is being deemed to be an “interested person” of the Trust, as defined by the Investment Company Act of 1940, as amended, by virtue of his position with Mesirow Financial, Inc., a broker-dealer.
95
Privacy Policy
October 31, 2021 (Unaudited)
The American Beacon Funds recognize and respect the privacy of our shareholders. We are providing this notice to you so you will understand how shareholder information may be collected and used.
We may collect nonpublic personal information about you from one or more of the following sources:
| • | information we receive from you on applications or other forms; |
| • | information about your transactions with us or our service providers; and |
| • | information we receive from third parties. |
We do not disclose any nonpublic personal information about our customers or former customers to anyone, except as permitted by law.
We restrict access to your nonpublic personal information to those employees or service providers who need to know that information to provide products or services to you. To ensure the confidentiality of your nonpublic personal information, we maintain safeguards that comply with federal standards.
96

Delivery of Documents
Shareholder reports are available online at www.americanbeaconfunds.com/reports. Please be advised that reports are no longer sent by mail. Instead, the reports are made available online, and you will be notified by mail each time a report is posted online. You will be provided with a website link to access the report. You may elect to receive all future reports in paper free of charge. You can request to continue receiving paper copies by calling 1-866-345-5954, or you may directly inform your financial intermediary. Detailed instructions are also included in your report notifications.
If you invest in the Fund through a financial institution, you may be able to receive the Fund’s regulatory mailings, such as the Prospectus, Annual Report and Semi-Annual Report, by e-mail. If you are interested in this option, please go to www.icsdelivery.com and search for your financial institution’s name or contact your financial institution directly.
To obtain more information about the Fund:
 |  | |
| By E-mail: | On the Internet: | |
| american_beacon.funds@ambeacon.com | Visit our website at www.americanbeaconfunds.com | |
By Telephone: Call (800) 658-5811 |
By Mail: American Beacon Funds P.O. Box 219643 Kansas City, MO 64121-9643 | |
| Availability of Quarterly Portfolio Schedules | Availability of Proxy Voting Policy and Records | |
| In addition to the Schedule of Investments provided in each semi-annual and annual report, the Fund files a complete schedule of its portfolio holdings with the Securities and Exchange Commission (“SEC”) on Form N-PORT as of the end of each fiscal quarter. The Fund’s Forms N-PORT are available on the SEC’s website at www.sec.gov. The Forms N-PORT may also be reviewed and copied at the SEC’s Public Reference Section, 100 F Street, NE, Washington, D.C. 20549-2736. Information regarding the operation of the SEC’s Public Reference Room may be obtained by calling (800)-SEC-0330. A complete schedule of the Fund’s portfolio holdings is also available at www.americanbeaconfunds.com approximately twenty days after the end of each month. | A description of the policies and procedures the Fund uses to determine how to vote proxies relating to portfolio securities is available in the Fund’s Statement of Additional Information, is available free of charge on the Fund’s website www.americanbeaconfunds.com and by calling 1-800-967-9009 or by accessing the SEC’s website at www.sec.gov. The Fund’s proxy voting record for the most recent year ended June 30 is filed annually with the SEC on Form N-PX. The Fund’s Forms N-PX are available on the SEC’s website at www.sec.gov. The Fund’s proxy voting record may also be obtained by calling 1-800-967-9009. | |


Fund Service Providers:
CUSTODIAN State Street Bank and Trust Company Boston, Massachusetts | TRANSFER AGENT DST Asset Manager Solutions, Inc. Quincy, Massachusetts | INDEPENDENT REGISTERED PUBLIC ACCOUNTING FIRM Ernst & Young LLP Dallas, Texas | DISTRIBUTOR Resolute Investment Distributors, Inc. Irving, Texas |
This report is prepared for shareholders of the American Beacon Funds and may be distributed to others only if preceded or accompanied by a current Prospectus or Summary Prospectus.
American Beacon Funds, American Beacon Balanced Fund and American Beacon Mid-Cap Value Fund are service marks of American Beacon Advisors, Inc.
AR 10/21
About American Beacon Advisors
Since 1986, American Beacon Advisors, Inc. has offered a variety of products and investment advisory services to numerous institutional and retail clients, including a variety of mutual funds, corporate cash management, and separate account management.
Our clients include defined benefit plans, defined contribution plans, foundations, endowments, corporations, financial planners, and other institutional investors. With American Beacon Advisors, you can put the experience of a multi-billion dollar asset management firm to work for your company.
GARCIA HAMILTON QUALITY BOND FUND RISKS
The use of fixed-income securities entails interest rate and credit risks. Credit risk is the risk that the issuer of a bond will fail to make timely payment of interest or principal; and the decline in an issuer’s credit rating can cause the price of its bonds to go down. The Fund’s incorporation of environmental, social and/or governance (ESG) considerations in its investment strategy may cause it to underperform funds that do not incorporate these considerations. Please see the prospectus for a complete discussion of the Fund’s risks. There can be no assurances that the investment objectives of this Fund will be met.
This may contain information obtained from third parties, including ratings from credit rating agencies such as Standard & Poor’s. Reproduction and distribution of third-party content in any form is prohibited except with the prior written permission of the related third party. Third-party content providers do not guarantee the accuracy, completeness, timeliness or availability of any information, including ratings, and are not responsible for any errors or omissions (negligent or otherwise), regardless of the cause, or for the results obtained from the use of such content. THIRD-PARTY CONTENT PROVIDERS GIVE NO EXPRESS OR IMPLIED WARRANTIES, INCLUDING, BUT NOT LIMITED TO, ANY WARRANTIES OF MERCHANTABILITY OR FITNESS FOR A PARTICULAR PURPOSE OR USE. THIRD-PARTY CONTENT PROVIDERS SHALL NOT BE LIABLE FOR ANY DIRECT, INDIRECT, INCIDENTAL, EXEMPLARY, COMPENSATORY, PUNITIVE, SPECIAL OR CONSEQUENTIAL DAMAGES, COSTS, EXPENSES, LEGAL FEES OR LOSSES (INCLUDING LOST INCOME OR PROFITS AND OPPORTUNITY COSTS OR LOSSES CAUSED BY NEGLIGENCE) IN CONNECTION WITH ANY USE OF THEIR CONTENT, INCLUDING RATINGS.
Credit ratings are statements of opinions and are not statements of fact or recommendations to purchase, hold or sell securities. They do not address the suitability of securities or the suitability of securities for investment purposes and should not be relied on as investment advice.
Any opinions herein, including forecasts, reflect our judgment as of the end of the reporting period and are subject to change. Each advisor’s strategies and the Fund’s portfolio composition will change depending on economic and market conditions. This report is not a complete analysis of market conditions and therefore, should not be relied upon as investment advice. Although economic and market information has been compiled from reliable sources, American Beacon Advisors, Inc. makes no representation as to the completeness or accuracy of the statements contained herein.
American Beacon Funds | October 31, 2021 |
| 1 | ||||
| 2 | ||||
| 6 | ||||
| 8 | ||||
| 9 | ||||
| 12 | ||||
| 15 | ||||
| 32 | ||||
| 36 | ||||
Disclosure Regarding Approval of the Management and Investment Advisory Agreements | 37 | |||
| 41 | ||||
| 48 | ||||
| Back Cover |
 | Dear Shareholders,
As Warren E. Buffett, the “Oracle of Omaha” and billionaire chairman and CEO of Berkshire Hathaway, once said, “Someone’s sitting in the shade today because someone planted a tree a long time ago.”
That is to say, before we can enjoy the fruits of our labor, we must first devote our attention to the careful planning and cultivation of our estates. To achieve a strong yield requires time, diligence and patience – and there are no guarantees the seeds we plant today will thrive or result in a plentiful harvest. This can be said not only about the actions we undertake in our gardening or landscaping, but also those we initiate in our investment portfolios – especially as we take into account the potential for harm caused by natural disasters and other catastrophes, such as the COVID-19 pandemic. |
Because none of us – not even the Oracle of Omaha – has a crystal ball, to help give your investment portfolio the greatest chance for success over the long term, we encourage you to work with financial professionals to develop your personal savings plan, conduct annual plan reviews, and make thoughtful, purposeful plan adjustments to help manage your evolving financial needs and goals. By investing in different investment styles and asset classes, you may be able to help mitigate financial risks across your portfolio. By allocating your portfolio according to your risk-tolerance level, you may be better positioned to withstand short-term crises. With continuous nurturing, you will be better positioned to achieve enduring financial success.
Since 1986, American Beacon has endeavored to provide investors with a disciplined approach to realizing long-term financial goals. As a manager of managers, we strive to provide investment products that may enable investors to participate during market upswings while potentially insulating against market downswings. The investment teams behind our mutual funds seek to produce consistent, long-term results rather than focus only on short-term movements in the markets. In managing our investment products, we emphasize identifying opportunities that offer the potential for long-term financial rewards.
Thank you for entrusting your financial success with American Beacon. For additional information about our investment products or to access your account information, please visit our website at www.americanbeaconfunds.com.
Best Regards,

Gene L. Needles, Jr.
President
American Beacon Funds
1
October 31, 2021 (Unaudited)
In the U.S. fixed-income markets, the investment-grade Bloomberg U.S. Aggregate Bond Index (the “Index”) declined, returning -0.48% for the 12-month period ended October 31, 2021. Within the Index, the credit component returned 1.90%, agency-backed mortgages returned -0.58% and U.S. Treasuries returned -2.45%. Returns in the credit sectors outperformed during the period as spreads continued to narrow following the economic recovery. Treasury yields were higher by period end, causing negative total returns, as investors began to see through the pandemic to more normalized interest rate levels.
Lower quality outperformed with triple-B-rated corporate bonds returning 3.52%, single-A up 0.59% and double-A up 1.22%, according to the Index. The highest-returning sectors included: Energy, up 7.92%; Transportation, up 3.61%; and Capital Goods, up 3.26%. The lowest-returning sectors included: Technology, up 0.45%; Financials, up 1.38%; and Utilities, up 1.40%.
Economic news throughout the year was mostly positive, despite periodic disruptions due to the COVID-19 pandemic. In late 2020, the earlier-than-expected arrival of vaccines led to business reopenings and expectations for strong economic growth. By late 2021, consumer spending was solid, driven primarily by spending on housing and retail sales. The labor market steadily added new jobs, and generous unemployment benefits aided those temporarily out of work.
Following the rebounding economy, inflation also picked up during the period, reflecting supply chain disruptions and pent-up consumer demand. While inflation concerns mounted, the Federal Reserve viewed the price increases as transitory and argued that slack in the labor market, low manufacturing capacity utilization rates and an economy still running below potential would keep inflation muted. The 10-year U.S. Treasury yield ended the period at 1.60% (up from 0.9% at the beginning of the period), suggesting that investors were not particularly worried about long-term inflation either.
With regard to monetary policy, the Federal Reserve maintained the federal funds rate in a 0% to 0.25% range during the period and continued to purchase $80 billion in Treasuries and $40 billion in agency mortgage-backed securities each month. As Federal Open Market Committee members began to feel better about the economy, they discussed plans for tapering quantitative easing. At period end, markets were anticipating that the reduction in quantitative easing would likely begin in late 2021 and that the federal funds rate increases would arrive in late 2022 or early 2023.
2
American Beacon Garcia Hamilton Quality Bond FundSM
Performance Overview
October 31, 2021 (Unaudited)
The Investor Class of the American Beacon Garcia Hamilton Quality Bond Fund (the “Fund”) returned -1.11% for the twelve months ended October 31, 2021. The Bloomberg U.S. Aggregate Bond Index (the “Index”) returned -0.48% for the same period.
Comparison of Changes in Value of a $10,000 Investment for the period 4/4/2016 through 10/31/2021
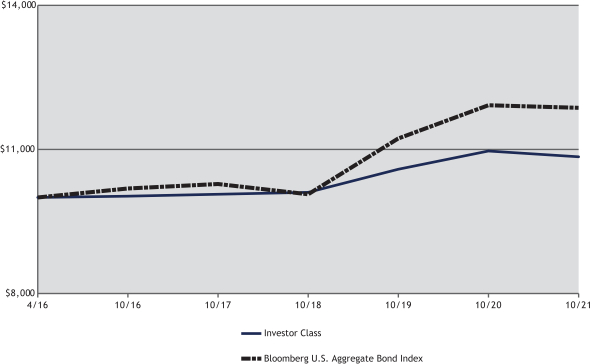
| Total Returns for the Period ended October 31, 2021 |
| |||||||||||||||||||||||||||||||
Ticker | 1 Year | 3 Year | 5 Year | Since Inception | Value of $10,000 | |||||||||||||||||||||||||||
R5 Class (1,4) | GHQIX | (0.84 | )% | 2.73 | % | 1.96 | % | 1.82 | % | $ | 11,059 | |||||||||||||||||||||
Y Class (1,4) | GHQYX | (0.81 | )% | 2.67 | % | 1.89 | % | 1.74 | % | $ | 11,012 | |||||||||||||||||||||
Investor Class (1,4) | GHQPX | (1.11 | )% | 2.38 | % | 1.58 | % | 1.46 | % | $ | 10,841 | |||||||||||||||||||||
R6 Class (1,3,4) | GHQRX | (0.70 | )% | 2.77 | % | 1.99 | % | 1.84 | % | $ | 11,071 | |||||||||||||||||||||
Bloomberg U.S. Aggregate Bond Index (2) | (0.48 | )% | 5.63 | % | 3.10 | % | 3.11 | % | $ | 11,862 | ||||||||||||||||||||||
| 1. | Performance shown is historical and is not indicative of future returns. Investment returns and principal value will vary, and shares may be worth more or less at redemption than at original purchase. Performance shown is calculated based on the published end of day net asset values as of the date indicated and current performance may be lower or higher than the performance data quoted. To obtain performance as of the most recent month end, please visit www.americanbeaconfunds.com or call 1-800-967-9009. Fund performance in the table above does not reflect the deduction of taxes a shareholder would pay on distributions or the redemption of shares. Generally accepted accounting principles require adjustments to be made to the net assets of the Fund at period end for financial reporting purposes only; and as such, the total return based on the unadjusted net asset value per share may differ from the total return reported in the financial highlights. A portion of the fees charged to each Class of the Fund has been waived since Fund inception. Performance prior to waiving fees was lower than the actual returns shown since inception. |
| 2. | The Bloomberg U.S. Aggregate Bond Index is a broad-based benchmark that measures the investment grade, U.S. dollar-denominated, fixed-rate taxable bond market. BLOOMBERG® is a trademark and service mark of Bloomberg Finance L.P. and its affiliates (collectively, “Bloomberg”). Bloomberg or Bloomberg’s licensors, own all proprietary rights in the Bloomberg Indices. Bloomberg does not approve or endorse this material, or guarantee the accuracy or completeness of any information herein, or make any warranty, express or implied, as to the results to be obtained therefrom and, to the maximum extent allowed by law, shall not have any liability or responsibility for injury or damages arising in connection therewith. One cannot directly invest in an index. |
3
American Beacon Garcia Hamilton Quality Bond FundSM
Performance Overview
October 31, 2021 (Unaudited)
| 3. | Fund performance for the three-year, five-year and since inception periods represent the returns achieved by the R5 Class from 4/4/16 through 2/28/19, the inception date of the R6 Class, and the returns of the R6 Class since its inception. Expenses of the R6 Class are lower than the R5 Class. As a result, total returns shown may be lower than they would have been had the R6 Class been in existence since 4/4/16. |
| 4. | The Total Annual Fund Operating Expense ratios set forth in the most recent Fund prospectus for the R5, Y, Investor, and R6 Class shares were 0.68%, 0.74%, 1.20%, and 0.64%, respectively. The expense ratios above may vary from the expense ratios presented in other sections of this report that are based on expenses incurred during the period covered by this report. |
The Fund underperformed due primarily to its underweight exposure to the corporate bond market, which posted the highest returns in the Index during the period as credit spreads continued to narrow. Slightly offsetting this was outperformance from the Fund’s low duration of approximately 2.5 years, as compared to over 6 years for the Index, which helped as treasury yields rose during the period.
The Fund’s underweight exposure to corporate bonds reflects its high-quality and low-volatility approach to credit investing that avoids securities with maturities over ten years and avoids triple-B rated issuers. During the period, the longest maturity and lowest quality securities in the Index significantly outperformed reflecting strong investor demand for yield in the historic-low interest rate environment. While these securities tend to outperform in strong credit markets, they typically underperform and experience reduced liquidity in volatile markets when the Fund seeks to benefit from its quality advantage.
The Fund’s short duration, however, contributed to performance as markets began to prepare for the Federal Reserve Bank’s tapering of quantitative easing and, ultimately, a rise in the Federal Funds rate. Increased vaccination rates and consumer spending led to an economic recovery and higher inflation which drove treasury yields higher during the period. The Fund’s short duration had been a detractor from performance as interest rates declined following the initial Covid outbreak; however, investors finally began to see through the pandemic and anticipate a normalization of interest rates.
The Fund’s overweight position during the period was in agency mortgage-backed securities. As with corporates, the Fund also avoids the longest maturity mortgages as they are the most volatile within their sector. Rather, the Fund invests in high-coupon, low-duration mortgages with 20-years or less to maturity. During the period, these lower-duration mortgages outperformed as they were less exposed to rising yields further out the curve. While the Fund’s overweight position in mortgages outperformed treasuries, it underperformed corporates. However, near period end, the Fund’s mortgage holdings began to benefit from a slowdown in prepayment activity as interest rates rose.
The primary components of the Fund’s strategy are to actively manage duration, sector allocation and yield-curve exposures based on top-down views of the economy. The Fund invests in high-quality, low-volatility securities to provide the benefit of fixed-income investing when investors need it most. No derivatives, leverage, foreign currency or high-yield bonds are used in the Fund’s strategy.
| Top Ten Holdings (% Net Assets) | ||||||||
| Federal National Mortgage Association, 4.500%, Due 6/1/2039 | 3.5 | |||||||
| U.S. Treasury Notes/Bonds, 2.250%, Due 4/15/2022 | 3.3 | |||||||
| American Express Co., 0.742%, Due 8/1/2022, (3-mo. USD LIBOR + 0.610%) | 3.2 | |||||||
| Federal Home Loan Mortgage Corp., 3.000%, Due 2/1/2035 | 3.2 | |||||||
| Morgan Stanley, 0.731%, Due 4/5/2024, (SOFR + 0.616%) | 2.9 | |||||||
| Federal National Mortgage Association, 4.000%, Due 2/1/2034 | 2.8 | |||||||
| Federal National Mortgage Association, 3.000%, Due 7/1/2040 | 2.8 | |||||||
| John Deere Capital Corp., 0.595%, Due 9/8/2022, (3-mo. USD LIBOR + 0.480%) | 2.8 | |||||||
| Wells Fargo & Co., 4.478%, Due 4/4/2031, (SOFR + 4.032%) | 2.8 | |||||||
| Federal Home Loan Mortgage Corp., 4.000%, Due 12/1/2034 | 2.6 | |||||||
| Total Fund Holdings | 44 | |||||||
4
American Beacon Garcia Hamilton Quality Bond FundSM
Performance Overview
October 31, 2021 (Unaudited)
| Sector Allocation (% Investments) | ||||||||
| U.S. Agency Mortgage-Backed Obligations | 57.3 | |||||||
| Financial | 20.4 | |||||||
| U.S. Treasury Obligations | 9.6 | |||||||
| Industrial | 5.2 | |||||||
| Technology | 3.7 | |||||||
| Utilities | 1.9 | |||||||
| Communications | 1.0 | |||||||
| U.S. Government Agency Obligations | 0.9 |
5
American Beacon Garcia Hamilton Quality Bond FundSM
October 31, 2021 (Unaudited)
Fund Expense Example
As a shareholder of a Fund, you incur two types of costs: (1) transaction costs, including sales charges (loads) on purchase payments and redemption fees, if applicable, and (2) ongoing costs, including management fees, distribution (12b-1) fees, sub-transfer agent fees, and other Fund expenses. The Examples are intended to help you understand the ongoing cost (in dollars) of investing in the Fund and to compare these costs with the ongoing costs of investing in other mutual funds. The Examples are based on an investment of $1,000 invested at the beginning of the period in each Class and held for the entire period from May 1, 2021 through October 31, 2021.
Actual Expenses
The “Actual” lines of the tables provide information about actual account values and actual expenses. You may use the information on this page, together with the amount you invested, to estimate the expenses that you paid over the period. Simply divide your account value by $1,000 (for example, an $8,600 account value divided by $1,000 = $8.60), then multiply the result by the “Expenses Paid During Period” to estimate the expenses you paid on your account during this period. Shareholders of the Investor and R5 Classes that invest in the Fund through an IRA or Roth IRA may be subject to a custodial IRA fee of $15 that is typically deducted each December. If your account was subject to a custodial IRA fee during the period, your costs would have been $15 higher.
Hypothetical Example for Comparison Purposes
The “Hypothetical” lines of the tables provide information about hypothetical account values and hypothetical expenses based on the Fund’s actual expense ratio and an assumed 5% per year rate of return before expenses (not the Fund’s actual return). You may compare the ongoing costs of investing in the Fund with other funds by contrasting this 5% hypothetical example and the 5% hypothetical examples that appear in the shareholder reports of the other funds. The hypothetical account values and expenses may not be used to estimate the actual ending account balance or expenses you paid for the period. Shareholders of the Investor and R5 Classes that invest in the Funds through an IRA or Roth IRA may be subject to a custodial IRA fee of $15 that is typically deducted each December. If your account was subject to a custodial IRA fee during the period, your costs would have been $15 higher.
You should also be aware that the expenses shown in the table highlight only your ongoing costs and do not reflect any transaction costs charged by the Fund, such as sales charges (loads) or redemption fees, as applicable. Similarly, the expense examples for other funds do not reflect any transaction costs charged by those funds, such as sales charges (loads), redemption fees or exchange fees. Therefore, the “Hypothetical” lines of the tables are useful in comparing ongoing costs only and will not help you determine the relative total costs of owning different funds. If you were subject to any transaction costs during the period, your costs would have been higher.
6
American Beacon Garcia Hamilton Quality Bond FundSM
Expense Examples
October 31, 2021 (Unaudited)
| American Beacon Garcia Hamilton Quality Bond Fund |
| ||||||||||||||
| Beginning Account Value 5/1/2021 | Ending Account Value 10/31/2021 | Expenses Paid During Period 5/1/2021-10/31/2021* | |||||||||||||
| R5 Class | |||||||||||||||
| Actual | $1,000.00 | $995.30 | $2.26 | ||||||||||||
| Hypothetical** | $1,000.00 | $1,022.94 | $2.29 | ||||||||||||
| Y Class | |||||||||||||||
| Actual | $1,000.00 | $996.00 | $2.57 | ||||||||||||
| Hypothetical** | $1,000.00 | $1,022.64 | $2.60 | ||||||||||||
| Investor Class | |||||||||||||||
| Actual | $1,000.00 | $994.50 | $4.17 | ||||||||||||
| Hypothetical** | $1,000.00 | $1,021.02 | $4.23 | ||||||||||||
| R6 Class | |||||||||||||||
| Actual | $1,000.00 | $995.50 | $2.06 | ||||||||||||
| Hypothetical** | $1,000.00 | $1,023.14 | $2.09 | ||||||||||||
| * | Expenses are equal to the Fund’s annualized expense ratios for the six-month period of 0.45%, 0.51%, 0.83%, and 0.41% for the R5, Y, Investor, and R6 Classes, respectively, multiplied by the average account value over the period, multiplied by the number derived by dividing the number of days in the most recent fiscal half-year (184) by days in the year (365) to reflect the half-year period. |
| ** | 5% return before expenses. |
7
American Beacon Garcia Hamilton Quality Bond FundSM
Report of Independent Registered Public Accounting Firm
To the Shareholders and the Board of Trustees of American Beacon Garcia Hamilton Quality Bond Fund
Opinion on the Financial Statements
We have audited the accompanying statement of assets and liabilities of American Beacon Garcia Hamilton Quality Bond Fund (the “Fund”) (one of the funds constituting American Beacon Funds (the “Trust”)), including the schedule of investments, as of October 31, 2021, and the related statement of operations for the year then ended, the statements of changes in net assets for each of the two years in the period then ended, the financial highlights for each of the five years in the period then ended and the related notes (collectively referred to as the “financial statements”). In our opinion, the financial statements present fairly, in all material respects, the financial position of the Fund (one of the funds constituting American Beacon Funds) at October 31, 2021, the results of its operations for the year then ended, the changes in its net assets for each of the two years in the period then ended and its financial highlights for each of the five years in the period then ended, in conformity with U.S. generally accepted accounting principles.
Basis for Opinion
These financial statements are the responsibility of the Trust’s management. Our responsibility is to express an opinion on the Fund’s financial statements based on our audits. We are a public accounting firm registered with the Public Company Accounting Oversight Board (United States) (“PCAOB”) and are required to be independent with respect to the Trust in accordance with the U.S. federal securities laws and the applicable rules and regulations of the Securities and Exchange Commission and the PCAOB.
We conducted our audits in accordance with the standards of the PCAOB. Those standards require that we plan and perform the audit to obtain reasonable assurance about whether the financial statements are free of material misstatement, whether due to error or fraud. The Trust is not required to have, nor were we engaged to perform, an audit of the Trust’s internal control over financial reporting. As part of our audits we are required to obtain an understanding of internal control over financial reporting, but not for the purpose of expressing an opinion on the effectiveness of the Trust’s internal control over financial reporting. Accordingly, we express no such opinion.
Our audits included performing procedures to assess the risks of material misstatement of the financial statements, whether due to error or fraud, and performing procedures that respond to those risks. Such procedures included examining, on a test basis, evidence regarding the amounts and disclosures in the financial statements. Our procedures included confirmation of securities owned as of October 31, 2021, by correspondence with the custodian and brokers or by other appropriate auditing procedures where replies from brokers were not received. Our audits also included evaluating the accounting principles used and significant estimates made by management, as well as evaluating the overall presentation of the financial statements. We believe that our audits provide a reasonable basis for our opinion.

We have served as the auditor of one or more American Beacon investment companies since 1987.
Dallas, Texas
December 30, 2021
8
American Beacon Garcia Hamilton Quality Bond FundSM
October 31, 2021
| Principal Amount | Fair Value | ||||||||||||||
| CORPORATE OBLIGATIONS - 31.66% | |||||||||||||||
| Communications - 1.02% | |||||||||||||||
| Media - 1.02% | |||||||||||||||
| Walt Disney Co., 7.430%, Due 10/1/2026 | $ | 3,037,000 | $ | 3,873,337 | |||||||||||
|
| ||||||||||||||
| Financial - 20.06% | |||||||||||||||
| Banks - 15.81% | |||||||||||||||
| Bank of America Corp., 3.974%, Due 2/7/2030, (3-mo. USD LIBOR + 1.210%)A | 6,113,000 | 6,796,410 | |||||||||||||
| Citigroup, Inc., 3.980%, Due 3/20/2030, (3-mo. USD LIBOR + 1.338%)A | 6,030,000 | 6,726,895 | |||||||||||||
| Goldman Sachs Group, Inc., | |||||||||||||||
1.124%, Due 7/24/2023, (3-mo. USD LIBOR + 1.000%)A | 7,840,000 | 7,878,470 | |||||||||||||
4.223%, Due 5/1/2029, (3-mo. USD LIBOR + 1.301%)A | 8,600,000 | 9,634,774 | |||||||||||||
| JPMorgan Chase & Co., 2.083%, Due 4/22/2026, (SOFR + 1.850%)A | 7,450,000 | 7,599,304 | |||||||||||||
| Morgan Stanley, 0.731%, Due 4/5/2024, (SOFR + 0.616%)A | 11,125,000 | 11,112,448 | |||||||||||||
| Wells Fargo & Co., 4.478%, Due 4/4/2031, (SOFR + 4.032%)A | 9,125,000 | 10,554,144 | |||||||||||||
|
| ||||||||||||||
| 60,302,445 | |||||||||||||||
|
| ||||||||||||||
| Diversified Financial Services - 4.25% | |||||||||||||||
| American Express Co., 0.742%, Due 8/1/2022, (3-mo. USD LIBOR + 0.610%)A | 12,120,000 | 12,168,939 | |||||||||||||
| American Express Credit Corp., 0.819%, Due 3/3/2022, (3-mo. USD LIBOR + 0.700%)A | 4,029,000 | 4,035,933 | |||||||||||||
|
| ||||||||||||||
| 16,204,872 | |||||||||||||||
|
| ||||||||||||||
Total Financial | 76,507,317 | ||||||||||||||
|
| ||||||||||||||
| Industrial - 5.08% | |||||||||||||||
| Machinery - Diversified - 2.76% | |||||||||||||||
| John Deere Capital Corp., 0.595%, Due 9/8/2022, (3-mo. USD LIBOR + 0.480%)A | 10,478,000 | 10,516,142 | |||||||||||||
|
| ||||||||||||||
| Transportation - 2.32% | |||||||||||||||
| United Parcel Service, Inc., 0.581%, Due 4/1/2023, (3-mo. USD LIBOR + 0.450%)A | 8,849,000 | 8,875,227 | |||||||||||||
|
| ||||||||||||||
Total Industrial | 19,391,369 | ||||||||||||||
|
| ||||||||||||||
| Technology - 3.60% | |||||||||||||||
| Computers - 2.20% | |||||||||||||||
| International Business Machines Corp., 7.000%, Due 10/30/2025 | 6,860,000 | 8,380,014 | |||||||||||||
|
| ||||||||||||||
| Semiconductors - 1.40% | |||||||||||||||
| Intel Corp., 3.400%, Due 3/25/2025 | 5,000,000 | 5,358,560 | |||||||||||||
|
| ||||||||||||||
Total Technology | 13,738,574 | ||||||||||||||
|
| ||||||||||||||
| Utilities - 1.90% | |||||||||||||||
| Electric - 1.90% | |||||||||||||||
| Duke Energy Progress LLC, 0.305%, Due 2/18/2022, Series A, (3-mo. USD LIBOR + 0.180%)A | 7,270,000 | 7,267,353 | |||||||||||||
|
| ||||||||||||||
Total Corporate Obligations (Cost $121,092,671) | 120,777,950 | ||||||||||||||
|
| ||||||||||||||
| U.S. AGENCY MORTGAGE-BACKED OBLIGATIONS - 56.44% | |||||||||||||||
| Federal Home Loan Mortgage Corp., | |||||||||||||||
4.000%, Due 12/1/2034 | 9,287,020 | 9,848,192 | |||||||||||||
3.000%, Due 2/1/2035 | 11,746,120 | 12,339,121 | |||||||||||||
4.000%, Due 2/1/2039 | 6,678,028 | 7,189,113 | |||||||||||||
4.000%, Due 4/1/2039 | 8,928,325 | 9,653,893 | |||||||||||||
3.500%, Due 8/1/2039 | 7,758,863 | 8,252,921 | |||||||||||||
3.500%, Due 10/1/2039 | 5,882,277 | 6,243,543 | |||||||||||||
3.000%, Due 1/1/2040 | 5,652,417 | 5,922,376 | |||||||||||||
3.500%, Due 8/1/2040 | 7,303,254 | 7,747,090 | |||||||||||||
See accompanying notes
9
American Beacon Garcia Hamilton Quality Bond FundSM
Schedule of Investments
October 31, 2021
| Principal Amount | Fair Value | ||||||||||||||
| U.S. AGENCY MORTGAGE-BACKED OBLIGATIONS - 56.44% (continued) | |||||||||||||||
| Federal National Mortgage Association, | |||||||||||||||
3.500%, Due 9/1/2033 | $ | 8,164,859 | $ | 8,670,658 | |||||||||||
4.000%, Due 2/1/2034B | 10,133,479 | 10,736,308 | |||||||||||||
4.000%, Due 6/1/2034B | 9,010,902 | 9,601,298 | |||||||||||||
3.500%, Due 5/1/2035B | 8,757,681 | 9,285,388 | |||||||||||||
3.500%, Due 3/1/2037 | 5,954,598 | 6,369,876 | |||||||||||||
3.500%, Due 4/1/2037 | 4,099,382 | 4,380,654 | |||||||||||||
3.000%, Due 10/1/2037 | 7,830,765 | 8,265,718 | |||||||||||||
3.500%, Due 5/1/2038B | 4,265,122 | 4,554,024 | |||||||||||||
4.000%, Due 5/1/2039 | 5,287,138 | 5,697,909 | |||||||||||||
4.500%, Due 6/1/2039B | 12,355,309 | 13,470,223 | |||||||||||||
4.000%, Due 9/1/2039 | 8,713,687 | 9,423,467 | |||||||||||||
3.500%, Due 10/1/2039 | 7,260,903 | 7,680,617 | |||||||||||||
3.500%, Due 11/1/2039B | 6,180,571 | 6,530,164 | |||||||||||||
3.500%, Due 3/1/2040B | 4,248,022 | 4,499,051 | |||||||||||||
3.500%, Due 4/1/2040B | 7,528,042 | 7,965,913 | |||||||||||||
3.000%, Due 7/1/2040B | 10,230,434 | 10,669,335 | |||||||||||||
3.000%, Due 8/1/2040B | 6,756,666 | 7,067,577 | |||||||||||||
4.000%, Due 8/1/2040B | 6,402,801 | 6,886,508 | |||||||||||||
4.000%, Due 6/1/2049B | 5,904,889 | 6,310,708 | |||||||||||||
|
| ||||||||||||||
Total U.S. Agency Mortgage-Backed Obligations (Cost $214,860,712) | 215,261,645 | ||||||||||||||
|
| ||||||||||||||
| U.S. GOVERNMENT AGENCY OBLIGATIONS - 0.92% (Cost $3,505,000) | |||||||||||||||
| Federal Agricultural Mortgage Corp., 0.024%, Due 1/25/2022, (3-mo. USD LIBOR - 0.100%)A | 3,505,000 | 3,505,287 | |||||||||||||
|
| ||||||||||||||
| SHORT-TERM INVESTMENTS - 9.51% | |||||||||||||||
| U.S. Treasury Obligations - 9.51% | |||||||||||||||
| U.S. Treasury Notes/Bonds, | |||||||||||||||
2.500%, Due 2/15/2022 | 8,750,000 | 8,812,204 | |||||||||||||
2.375%, Due 3/15/2022 | 5,525,000 | 5,572,692 | |||||||||||||
2.250%, Due 4/15/2022 | 12,630,000 | 12,752,846 | |||||||||||||
1.750%, Due 6/15/2022 | 9,035,000 | 9,127,468 | |||||||||||||
|
| ||||||||||||||
Total U.S. Treasury Obligations | 36,265,210 | ||||||||||||||
|
| ||||||||||||||
Total Short-Term Investments (Cost $36,273,468) | 36,265,210 | ||||||||||||||
|
| ||||||||||||||
TOTAL INVESTMENTS - 98.53% (Cost $375,731,851) | 375,810,092 | ||||||||||||||
OTHER ASSETS, NET OF LIABILITIES - 1.47% | 5,601,222 | ||||||||||||||
|
| ||||||||||||||
TOTAL NET ASSETS - 100.00% | $ | 381,411,314 | |||||||||||||
|
| ||||||||||||||
| Percentages are stated as a percent of net assets. | |||||||||||||||
A Variable, floating, or adjustable rate securities with an interest rate that changes periodically. Rates are periodically reset with rates that are based on a predetermined benchmark such as a widely followed interest rate such as T-bills, SOFR, LIBOR or PRIME plus a fixed spread. The interest rate disclosed reflects the rate in effect on October 31, 2021.
B Coupon rate may change based on changes of the underlying collateral or prepayments of principal. The coupon rate shown represents the rate at period end.
LIBOR - London Interbank Offered Rate.
LLC - Limited Liability Company.
PRIME - A rate, charged by banks, based on the U.S. Federal Funds rate.
SOFR - Secured Overnight Financing Rate.
USD - United States Dollar.
See accompanying notes
10
American Beacon Garcia Hamilton Quality Bond FundSM
Schedule of Investments
October 31, 2021
The Fund’s investments are summarized by level based on the inputs used to determine their values. As of October 31, 2021, the investments were classified as described below:
Garcia Hamilton Quality Bond Fund | Level 1 | Level 2 | Level 3 | Total | ||||||||||||||||||||||||
Assets | ||||||||||||||||||||||||||||
Corporate Obligations | $ | - | $ | 120,777,950 | $ | - | $ | 120,777,950 | ||||||||||||||||||||
U.S. Agency Mortgage-Backed Obligations | - | 215,261,645 | - | 215,261,645 | ||||||||||||||||||||||||
U.S. Government Agency Obligations | - | 3,505,287 | - | 3,505,287 | ||||||||||||||||||||||||
Short-Term Investments | - | 36,265,210 | - | 36,265,210 | ||||||||||||||||||||||||
|
|
|
|
|
|
|
| |||||||||||||||||||||
Total Investments in Securities - Assets | $ | - | $ | 375,810,092 | $ | - | $ | 375,810,092 | ||||||||||||||||||||
|
|
|
|
|
|
|
| |||||||||||||||||||||
U.S. GAAP requires transfers between all levels to/from level 3 be disclosed. During the year ended October 31, 2021, there were no transfers into or out of Level 3.
See accompanying notes
11
American Beacon Garcia Hamilton Quality Bond FundSM
Statement of Assets and Liabilities
October 31, 2021
Assets: |
| |||
Investments in unaffiliated securities, at fair value† | $ | 375,810,092 | ||
Cash | 39,404,521 | |||
Interest receivable | 1,385,127 | |||
Receivable for fund shares sold | 1,528,418 | |||
Receivable for expense reimbursement (Note 2) | 84,281 | |||
Prepaid expenses | 17,448 | |||
|
| |||
Total assets | 418,229,887 | |||
|
| |||
Liabilities: |
| |||
Payable for investments purchased | 36,411,147 | |||
Payable for fund shares redeemed | 26,199 | |||
Dividends payable | 90,863 | |||
Management and sub-advisory fees payable (Note 2) | 177,273 | |||
Service fees payable (Note 2) | 312 | |||
Transfer agent fees payable (Note 2) | 9,488 | |||
Custody and fund accounting fees payable | 36,407 | |||
Professional fees payable | 53,033 | |||
Trustee fees payable (Note 2) | 1,944 | |||
Payable for prospectus and shareholder reports | 10,053 | |||
Other liabilities | 1,854 | |||
|
| |||
Total liabilities | 36,818,573 | |||
|
| |||
Net assets | $ | 381,411,314 | ||
|
| |||
Analysis of net assets: |
| |||
Paid-in-capital | $ | 386,325,205 | ||
Total distributable earnings (deficits)A | (4,913,891 | ) | ||
|
| |||
Net assets | $ | 381,411,314 | ||
|
| |||
Shares outstanding at no par value (unlimited shares authorized): |
| |||
R5 Class | 19,562,226 | |||
|
| |||
Y Class | 2,165,066 | |||
|
| |||
Investor Class | 100,734 | |||
|
| |||
R6 Class | 16,886,809 | |||
|
| |||
Net assets: |
| |||
R5 Class | $ | 192,774,622 | ||
|
| |||
Y Class | $ | 21,340,613 | ||
|
| |||
Investor Class | $ | 991,788 | ||
|
| |||
R6 Class | $ | 166,304,291 | ||
|
| |||
Net asset value, offering and redemption price per share: |
| |||
R5 Class | $ | 9.85 | ||
|
| |||
Y Class | $ | 9.86 | ||
|
| |||
Investor Class | $ | 9.85 | ||
|
| |||
R6 Class | $ | 9.85 | ||
|
| |||
† Cost of investments in unaffiliated securities | $ | 375,731,851 | ||
A The Fund’s investments in affiliated securities did not have unrealized appreciation (depreciation) at year end. |
| |||
See accompanying notes
12
American Beacon Garcia Hamilton Quality Bond FundSM
Statement of Operations
For the year ended October 31, 2021
Investment income: |
| |||
Interest income | $ | 1,296,362 | ||
|
| |||
Total investment income | 1,296,362 | |||
|
| |||
Expenses: |
| |||
Management and sub-advisory fees (Note 2) | 2,000,160 | |||
Transfer agent fees: | ||||
R5 Class (Note 2) | 66,383 | |||
Y Class (Note 2) | 20,951 | |||
Investor Class | 1,237 | |||
R6 Class | 4,639 | |||
Custody and fund accounting fees | 63,163 | |||
Professional fees | 91,972 | |||
Registration fees and expenses | 61,186 | |||
Service fees (Note 2): | ||||
Investor Class | 1,645 | |||
Prospectus and shareholder report expenses | 21,530 | |||
Trustee fees (Note 2) | 24,340 | |||
Loan expense (Note 8) | 1,779 | |||
Other expenses | 44,393 | |||
|
| |||
Total expenses | 2,403,378 | |||
|
| |||
Net fees waived and expenses (reimbursed) (Note 2) | (814,374 | ) | ||
|
| |||
Net expenses | 1,589,004 | |||
|
| |||
Net investment (loss) | (292,642 | ) | ||
|
| |||
Realized and unrealized gain (loss) from investments: |
| |||
Net realized gain from: | ||||
Investments in unaffiliated securitiesA | 1,160,239 | |||
Change in net unrealized (depreciation) of: | ||||
Investments in unaffiliated securitiesB | (3,726,085 | ) | ||
|
| |||
Net (loss) from investments | (2,565,846 | ) | ||
|
| |||
Net (decrease) in net assets resulting from operations | $ | (2,858,488 | ) | |
|
| |||
| A The Fund did not recognize net realized gains (losses) from the sale of investments in affiliated securities. | ||||
| B The Fund’s investments in affiliated securities did not have a change in unrealized appreciation (depreciation) at year end. |
| |||
See accompanying notes
13
American Beacon Garcia Hamilton Quality Bond FundSM
Statement of Changes in Net Assets
| Year Ended October 31, 2021 | Year Ended October 31, 2020 | |||||||||||
Increase (decrease) in net assets: |
| |||||||||||
Operations: |
| |||||||||||
Net investment income (loss) | $ | (292,642 | ) | $ | 5,114,914 | |||||||
Net realized gain from investments in unaffiliated securities | 1,160,239 | 10,350,030 | ||||||||||
Change in net unrealized (depreciation) of investments in unaffiliated securities | (3,726,085 | ) | (2,386,916 | ) | ||||||||
|
|
|
| |||||||||
Net increase (decrease) in net assets resulting from operations | (2,858,488 | ) | 13,078,028 | |||||||||
|
|
|
| |||||||||
Distributions to shareholders: |
| |||||||||||
Total retained earnings: | ||||||||||||
R5 Class | (5,803,467 | ) | (3,807,202 | ) | ||||||||
Y Class | (627,250 | ) | (287,618 | ) | ||||||||
Investor Class | (11,855 | ) | (72,178 | ) | ||||||||
R6 Class | (5,233,037 | ) | (2,328,652 | ) | ||||||||
|
|
|
| |||||||||
Net distributions to shareholders | (11,675,609 | ) | (6,495,650 | ) | ||||||||
|
|
|
| |||||||||
Capital share transactions (Note 9): |
| |||||||||||
Proceeds from sales of shares | 108,964,171 | 151,802,968 | ||||||||||
Reinvestment of dividends and distributions | 10,629,729 | 5,321,824 | ||||||||||
Cost of shares redeemed | (57,610,072 | ) | (309,368,514 | ) | ||||||||
|
|
|
| |||||||||
Net increase (decrease) in net assets from capital share transactions | 61,983,828 | (152,243,722 | ) | |||||||||
|
|
|
| |||||||||
Net increase (decrease) in net assets | 47,449,731 | (145,661,344 | ) | |||||||||
|
|
|
| |||||||||
Net assets: |
| |||||||||||
Beginning of year | 333,961,583 | 479,622,927 | ||||||||||
|
|
|
| |||||||||
End of year | $ | 381,411,314 | $ | 333,961,583 | ||||||||
|
|
|
| |||||||||
See accompanying notes
14
American Beacon Garcia Hamilton Quality Bond FundSM
October 31, 2021
1. Organization and Significant Accounting Policies
American Beacon Funds (the “Trust”) is organized as a Massachusetts business trust. The Fund, a series within the Trust, is registered under the Investment Company Act of 1940, as amended (the “Act”), as a diversified, open-end management investment company. As of October 31, 2021, the Trust consists of twenty-eight active series, one of which is presented in this filing: American Beacon Garcia Hamilton Quality Bond Fund (the “Fund”). The remaining twenty-seven active series are reported in separate filings.
American Beacon Advisors, Inc. (the “Manager”) is a Delaware corporation and a wholly-owned subsidiary of Resolute Investment Managers, Inc. (“RIM”) organized in 1986 to provide business management, advisory, administrative, and asset management consulting services to the Trust and other investors. The Manager is registered as an investment advisor under the Investment Advisers Act of 1940, as amended (the “Advisers Act”). RIM is, in turn, a wholly-owned subsidiary of Resolute Acquisition, Inc., which is a wholly-owned subsidiary of Resolute Topco, Inc., a wholly-owned subsidiary of Resolute Investment Holdings, LLC (“RIH”). RIH is owned primarily by Kelso Investment Associates VIII, L.P., KEP VI, LLC and Estancia Capital Partners L.P., investment funds affiliated with Kelso & Company, L.P. (“Kelso”) or Estancia Capital Management, LLC (“Estancia”), which are private equity firms.
Recently Adopted Accounting Pronouncements
In March 2020, the Financial Accounting Standards Board (“FASB”) issued Accounting Standards Update (“ASU”) 2020-04, which provides optional expedients and exceptions for contracts, hedging relationships and other transactions affected by the transitioning away from the London Interbank Offered Rate (“LIBOR”) and other reference rates that are expected to be discontinued. The amendments in this ASU are effective for all entities as of March 12, 2020 through December 31, 2022. At this time, management is evaluating the implications of these changes on the financial statements.
In October 2020, the U.S. Securities and Exchange Commission (“SEC”) adopted new regulations governing the use of derivatives by registered investment companies. Rule 18f-4 will impose limits on the amount of derivatives the fund could enter into, eliminate the asset segregation framework currently used by funds to comply with Section 18 of the Act, and require funds whose use of derivatives is more than a limited specified exposure to establish and maintain a derivatives risk management program and appoint a derivatives risk manager. While the new rule became effective February 19, 2021, funds will not be required to fully comply with the new rule until August 19, 2022. It is not currently clear what impact, if any, the new rule will have on the availability, liquidity or performance of derivatives. When fully implemented, the new rule may require changes in how the fund will use derivatives, may adversely affect the fund’s performance and may increase costs related to the fund’s use of derivatives.
Class Disclosure
The Fund has multiple classes of shares designed to meet the needs of different groups of investors. The following table sets forth the differences amongst the classes:
Class | Eligible Investors | Minimum Initial Investments | ||||
| R5 Class | Large institutional investors - sold directly or through intermediary channels. | $ | 250,000 | |||
| Y Class | Large institutional retirement plan investors - sold directly or through intermediary channels. | $ | 100,000 | |||
| Investor Class | All investors using intermediary organizations, such as broker-dealers or retirement plan sponsors. | $ | 2,500 | |||
| R6 Class | Large institutional retirement plan investors - sold through retirement plan sponsors. | None | ||||
15
American Beacon Garcia Hamilton Quality Bond FundSM
Notes to Financial Statements
October 31, 2021
Each class offered by the Trust has equal rights as to assets and voting privileges. Income and non-class specific expenses are allocated daily to each class based on the relative net assets. Realized and unrealized capital gains and losses of each class are allocated daily based on the relative net assets of each class of the respective Fund. Class specific expenses, where applicable, currently include service, distribution, transfer agent fees, and sub-transfer agent fees that vary amongst the classes as described more fully in Note 2.
Significant Accounting Policies
The following is a summary of significant accounting policies, consistently followed by the Fund in preparation of the financial statements. The Fund is considered an investment company and accordingly, follows the investment company accounting and reporting guidance of the FASB Accounting Standards Codification Topic 946, Financial Services – Investment Companies, a part of Generally Accepted Accounting Principles (“U.S. GAAP”).
Security Transactions and Investment Income
Security transactions are recorded as of the trade date for financial reporting purposes. Securities purchased or sold on a when-issued or delayed-delivery basis may be settled beyond a standard settlement period for the security after the trade date.
Dividend income, net of foreign taxes, is recorded on the ex-dividend date, except certain dividends from foreign securities which are recorded as soon as the information is available to the Fund. Interest income, net of foreign taxes, is earned from settlement date, recorded on the accrual basis, and adjusted, if necessary, for accretion of discounts and amortization of premiums. Realized gains (losses) from securities sold are determined based on specific lot identification.
Distributions to Shareholders
The Fund distributes most or all of its net earnings and realized gains, if any, each taxable year in the form of dividends from net investment income on a monthly basis and distributions of realized net capital gains and net gains or losses from foreign currency transactions on an annual basis. The Fund does not have a fixed dividend rate and does not guarantee that it will pay any distributions in any particular period. Dividends to shareholders are determined in accordance with federal income tax regulations, which may differ in amount and character from net investment income and realized gains recognized for purposes of U.S. GAAP. To the extent necessary to fully distribute capital gains, the Fund may designate earnings and profits distributed to shareholders on the redemption of shares.
Allocation of Income, Trust Expenses, Gains, and Losses
Investment income, realized and unrealized gains and losses from investments of the Fund is allocated daily to each class of shares based upon the relative proportion of net assets of each class to the total net assets of the Fund. Expenses directly charged or attributable to the Fund will be paid from the assets of the Fund. Generally, expenses of the Trust will be allocated among and charged to the assets of the Fund on a basis that the Trust’s Board of Trustees (the “Board”) deems fair and equitable, which may be based on the relative net assets of the Fund or nature of the services performed and relative applicability to the Fund.
Use of Estimates
The preparation of financial statements in conformity with U.S. GAAP requires management to make estimates and assumptions that affect the amounts reported in the financial statements and accompanying notes. Actual results may differ from those estimated.
16
American Beacon Garcia Hamilton Quality Bond FundSM
Notes to Financial Statements
October 31, 2021
Other
Under the Trust’s organizational documents, its officers and trustees are indemnified against certain liabilities arising out of the performance of their duties to the Trust. In the normal course of business, the Trust enters into contracts that provide indemnification to the other party or parties against potential costs or liabilities. The Trust’s maximum exposure under these arrangements is dependent on claims that may be made in the future and, therefore, cannot be estimated. The Trust has had no prior claims or losses pursuant to any such agreement.
2. Transactions with Affiliates
Management and Investment Sub-Advisory Agreements
The Fund and the Manager are parties to a Management Agreement that obligates the Manager to provide the Fund with investment advisory and administrative services. As compensation for performing the duties under the Management Agreement, the Manager will receive an annualized management fee based on a percentage of the Fund’s average daily net assets that is calculated and accrued daily according to the following schedule:
First $5 billion | 0.35 | % | ||
Next $5 billion | 0.325 | % | ||
Next $10 billion | 0.30 | % | ||
Over $20 billion | 0.275 | % |
The Trust, on behalf of the Fund, and the Manager have entered into an Investment Advisory Agreement with Garcia Hamilton & Associates, L.P. (the “Sub-Advisor”) pursuant to which the Fund has agreed to pay an annualized sub-advisory fee that is calculated and accrued daily based on the Fund’s average daily net assets according to the following schedule:
First $1 billion | 0.20 | % | ||
Over $1 billion | 0.15 | % |
The Management and Sub-Advisory Fees paid by the Fund for the year ended October 31, 2021 were as follows:
| Effective Fee Rate | Amount of Fees Paid | |||||||||||
Management Fees | 0.35 | % | $ | 1,272,684 | ||||||||
Sub-Advisor Fees | 0.20 | % | 727,476 | |||||||||
|
|
|
| |||||||||
Total | 0.55 | % | $ | 2,000,160 | ||||||||
|
|
|
| |||||||||
Distribution Plans
The Fund has adopted a Distribution Plan (the “Plan”) in accordance with Rule 12b-1 under the Act, pursuant to which no separate fees may be charged to the Fund for distribution purposes. However, the Plan authorizes the management fees received by the Manager and/or the investment advisors hired by the Manager to be used for distribution purposes. Under this Plan, the Fund does not intend to compensate the Manager or any other party, either directly or indirectly, for the distribution of Fund shares.
Service Plans
The Manager and the Trust entered into a Service Plan that obligates the Manager to oversee additional shareholder servicing of the Investor Class of the Fund. As compensation for performing the duties required under the Service Plan, the Manager receives an annualized fee up to 0.375% of the average daily net assets of the Investor Class of the Fund.
17
American Beacon Garcia Hamilton Quality Bond FundSM
Notes to Financial Statements
October 31, 2021
Sub-Transfer Agent Fees
The Manager has entered into agreements, which include servicing agreements, with financial intermediaries that provide recordkeeping, processing, shareholder communications and other services to customers of the intermediaries that hold positions in the R5 and Y Classes of the Fund and has agreed to compensate the intermediaries for providing these services. Intermediaries transact with the Fund primarily through the use of omnibus accounts on behalf of its customers who hold positions in the Fund. Certain services would have been provided by the Fund’s transfer agent and other service providers if the shareholders’ accounts were maintained directly by the Fund’s transfer agent. Accordingly, the Fund, pursuant to Board approval, has agreed to reimburse the Manager for certain non-distribution shareholder services provided by financial intermediaries for the R5 and Y Classes. The reimbursement amounts (sub-transfer agent fees) paid to the Manager are subject to a fee limit of up to 0.10% of an intermediary’s average net assets in the R5 and Y Classes on an annual basis. During the year ended October 31, 2021, the sub-transfer agent fees, as reflected in “Transfer agent fees” on the Statement of Operations, were as follows:
Fund | Sub-Transfer Agent Fees | |||
Garcia Hamilton Quality Bond | $ | 81,137 | ||
As of October 31, 2021, the Fund owed the Manager the following reimbursement of sub-transfer agent fees, as reflected in “Transfer agent fees payable” on the Statement of Assets and Liabilities:
Fund | Reimbursement Sub-Transfer Agent Fees | |||
Garcia Hamilton Quality Bond | $ | 7,339 | ||
Interfund Credit Facility
Pursuant to an exemptive order issued by the SEC, the Fund, along with other registered investment companies having management contracts with the Manager, may participate in a credit facility whereby each fund, under certain conditions, is permitted to lend money directly to and borrow directly from other participating funds for temporary purposes. The interfund credit facility is advantageous to the funds because it provides added liquidity and eliminates the need to maintain higher cash balances to meet redemptions. This situation could arise when shareholder redemptions exceed anticipated volumes and certain funds have insufficient cash on hand to satisfy such redemptions or when sales of securities do not settle as expected, resulting in a cash shortfall for the fund. When the fund liquidates portfolio securities to meet redemption requests, they often do not receive payment in settlement for up to two days (or longer for certain foreign transactions). Redemption requests normally are satisfied on the next business day. The credit facility provides a source of immediate, short-term liquidity pending settlement of the sale of portfolio securities. The credit facility is administered by a credit facility team consisting of professionals from the Manager’s asset management, compliance, and accounting areas who report the activities of the credit facility to the Board. During the year ended October 31, 2021, the Fund did not utilize the credit facility.
18
American Beacon Garcia Hamilton Quality Bond FundSM
Notes to Financial Statements
October 31, 2021
Expense Reimbursement Plan
The Manager contractually agreed to reduce fees and/or reimburse expenses for the classes of the Fund, through February 28, 2022, to the extent that total operating expenses (excluding taxes, interest, brokerage commissions, acquired fund fees and expenses, securities lending fees, expenses associated with securities sold short, litigation, and other extraordinary expenses) exceed the Fund’s expense cap. During the year ended October 31, 2021, the Manager waived and/or reimbursed expenses as follows:
Fund | Class | Expense Cap | Reimbursed Expenses | (Recouped) Expenses | Expiration of Reimbursed Expenses | |||||||||||||||||
| 11/1/2020 – 2/28/2021 | 3/1/2021 – 10/31/2021 | |||||||||||||||||||||
Garcia Hamilton Quality Bond | R5 | 0.45 | % | 0.45 | % | $ | 406,052 | $ | - | 2023-2024 | ||||||||||||
Garcia Hamilton Quality Bond | Y | 0.55 | % | 0.51 | % | 43,852 | - | 2023-2024 | ||||||||||||||
Garcia Hamilton Quality Bond | Investor | 0.83 | % | 0.83 | % | 2,039 | - | 2023-2024 | ||||||||||||||
Garcia Hamilton Quality Bond | R6 | 0.41 | % | 0.41 | % | 362,431 | - | 2023-2024 | ||||||||||||||
Of the above amounts, $84,281 was disclosed as a Receivable for Expense Reimbursement on the Statement of Assets and Liabilities at October 31, 2021.
The Fund has adopted an Expense Reimbursement Plan whereby the Manager may seek repayment of such fee or voluntary reductions and expense reimbursements. Under the policy, the Manager can be reimbursed by the Fund for any contractual or voluntary fee reductions or expense reimbursements if reimbursement to the Manager (a) occurs within three years from the date of the Manager’s waiver/reimbursement and (b) does not cause the Fund’s annual operating expenses to exceed the lesser of the contractual percentage limit in effect at the time of the waiver/reimbursement or time of recoupment. The reimbursed expenses listed above will expire in 2023 and 2024. The Fund did not record a liability for potential reimbursement due to the current assessment that a reimbursement is uncertain. The carryover of excess expenses potentially reimbursable to the Manager, but not recorded as a liability are as follows:
Fund | Recouped Expenses | Excess Expense Carryover | Expired Expense Carryover | Expiration of Reimbursed Expenses | ||||||||||||
Garcia Hamilton Quality Bond | $ | - | $ | - | $ | 410,947 | 2020-2021 | |||||||||
Garcia Hamilton Quality Bond | - | 745,393 | - | 2021-2022 | ||||||||||||
Garcia Hamilton Quality Bond | - | 855,336 | - | 2022-2023 | ||||||||||||
Trustee Fees and Expenses
Effective January 1, 2021, as compensation for their service to the American Beacon Funds Complex, including the Trust (collectively, the “Trusts”), each Trustee is compensated from the Trusts as follows: (1) an annual retainer of $120,000; (2) meeting attendance fee (for attendance in-person or via teleconference) of (a) $12,000 for in person attendance, or $5,000 for telephonic attendance, by Board members for each regularly scheduled or special Board meeting, (b) $2,500 for attendance by Committee members at meetings of the Audit and Compliance Committee and the Investment Committee, (c) $1,000 for attendance by Committee members at meetings of the Nominating and Governance Committee; and (d) $2,500 for attendance by Board members for each special telephonic Board meeting; and (3) reimbursement of reasonable expenses incurred in attending Board meetings, Committee meetings, and relevant educational seminars. For this purpose, the Board considers attendance at regular meetings held by video conference to constitute in-person attendance at a Board meeting. The Trustees also may be compensated for attendance at special Board and/or Committee meetings from time to time. For her service as Board Chair, Ms. Cline receives an additional annual retainer of $50,000. Although she
19
American Beacon Garcia Hamilton Quality Bond FundSM
Notes to Financial Statements
October 31, 2021
attends several committee meetings at each quarterly Board meeting, she receives only a single $2,500 fee each quarter for her attendance at those meetings. The chairpersons of the Audit and Compliance Committee and the Investment Committee each receive an additional annual retainer of $25,000 and the Chair of the Nominating and Governance Committee receives an additional annual retainer of $10,000.
3. Security Valuation and Fair Value Measurements
The price of the Fund’s shares is based on the Fund’s Net Asset Value (“NAV”). The NAV of the Fund, or each of its share classes, as applicable, is determined by dividing the total value of portfolio investments and other assets, less any liabilities attributable to the Fund or class, by the total number of shares outstanding of the Fund or class.
Investments are valued at the close of the New York Stock Exchange (the “Exchange”), normally at 4:00 p.m. Eastern Time, each day that the Exchange is open for business.
Debt securities normally are valued on the basis of prices provided by an independent pricing service and may take into account appropriate factors such as institution-size trading in similar groups of securities, yield, quality, coupon rate, maturity, type of issue, trading characteristics, and other market data. Prices of debt securities may be determined using quotes obtained from brokers.
Investments in open-end mutual funds are valued at the closing NAV per share of the mutual fund on the day of valuation.
Securities for which the market prices are not readily available or are not reflective of the fair value of the security, as determined by the Manager, will be priced at fair value following procedures approved by the Board.
Other investments, including restricted securities and those financial instruments for which the above valuation procedures are inappropriate or are deemed not to reflect fair value, are stated at fair value, as determined in good faith by the Manager’s Valuation Committee, pursuant to procedures established by the Board.
Valuation Inputs
Various inputs may be used to determine the fair value of the Fund’s investments. These inputs are summarized in three broad levels for financial statement purposes. The inputs or methodologies used to value securities are not necessarily an indication of the risk associated with investing in those securities.
| Level 1 | - | Quoted prices in active markets for identical securities. | ||
| Level 2 | - | Prices determined using other significant observable inputs. These may include quoted prices for similar securities, interest rates, prepayment speeds, credit risk, and others. | ||
| Level 3 | - | Prices determined using other significant unobservable inputs. Unobservable inputs reflect the Fund’s own assumptions about the factors market participants would use in pricing an investment. | ||
Level 1 and Level 2 trading assets and trading liabilities, at fair value
Fixed-income securities including corporate, convertible and municipal bonds and notes, U.S. government agencies, U.S. Treasury obligations, sovereign issues, bank loans, convertible preferred securities, and non-U.S. bonds are normally valued by pricing service providers that use broker dealer quotations, reported trades or valuation estimates from their internal pricing models. The service providers’ internal models use inputs that are observable such as issuer details, interest rates, yield curves, prepayment speeds, credit risks/spreads, default rates, and quoted prices for similar assets. Securities that use similar valuation techniques and inputs as
20
American Beacon Garcia Hamilton Quality Bond FundSM
Notes to Financial Statements
October 31, 2021
described above are categorized as Level 2 of the fair value hierarchy. Fixed-income securities purchased on a delayed delivery basis are marked-to-market daily until settlement at the forward settlement date and are categorized as Level 2 of the fair value hierarchy.
Mortgage-related and asset-backed securities (“ABS”) are usually issued as separate tranches, or classes, of securities within each deal. These securities are also normally valued by pricing service providers that use broker-dealer quotations or valuation estimates from their internal pricing models. The pricing models for these securities usually consider tranche-level attributes, current market data, estimated cash flows, and market-based yield spreads for each tranche, and incorporates deal collateral performance, as available. Mortgage-related and ABS that use similar valuation techniques and inputs as described above are categorized as Level 2 of the fair value hierarchy.
Investments in registered open-end investment management companies will be valued based upon the NAVs of such investments and are categorized as Level 1 of the fair value hierarchy.
4. Securities and Other Investments
Agency Mortgage-Backed Securities
Certain mortgage-backed securities (“MBS”) may be issued or guaranteed by the U.S. government or a government sponsored entity, such as the Federal National Mortgage Association (“Fannie Mae”) or the Federal Home Loan Mortgage Corporation (“Freddie Mac”). Although these instruments may be guaranteed by the U.S. government or a government sponsored entity, many such MBS are not backed by the full faith and credit of the United States and are still exposed to the risk of non-payment.
Fixed-Income Investments
The Fund may hold debt, including government and corporate debt, and other fixed-income securities. Typically, the values of fixed-income securities change inversely with prevailing interest rates. Therefore, a fundamental risk of fixed-income securities is interest rate risk, which is the risk that their value will generally decline as prevailing interest rates rise, which may cause the Fund’s NAV to likewise decrease, and vice versa. How specific fixed-income securities may react to changes in interest rates will depend on the specific characteristics of each security. For example, while securities with longer maturities tend to produce higher yields, they also tend to be more sensitive to changes in prevailing interest rates and are, therefore, more volatile than shorter-term securities and are subject to greater market fluctuations as a result of changes in interest rates. Fixed-income securities are also subject to credit risk, which is the risk that the credit strength of an issuer of a fixed-income security will weaken and/or that the issuer will be unable to make timely principal and interest payments and that the security may go into default. In addition, there is prepayment risk, which is the risk that during periods of falling interest rates, certain fixed-income securities with higher interest rates, such as mortgage-backed securities (“MBS”) and ABS, may be prepaid by their issuers thereby reducing the amount of interest payments. This may result in the Fund having to reinvest its proceeds in lower yielding securities. Securities underlying MBS and ABS, which may include subprime mortgages, also may be subject to a higher degree of credit risk, valuation risk, and liquidity risk.
Mortgage-Backed Securities
MBS often have stated maturities of up to thirty years when they are issued, depending upon the length of the mortgages underlying the securities. In practice however, unscheduled or early payments of principal and interest on the underlying mortgages may make the securities’ effective maturity shorter than this, and the prevailing interest rates may be higher or lower than the current yield of the Fund’s portfolio at the time resulting in reinvestment risk.
21
American Beacon Garcia Hamilton Quality Bond FundSM
Notes to Financial Statements
October 31, 2021
Rising or high interest rates may result in slower than expected principal payments which may tend to extend the duration of MBS, making them more volatile and more sensitive to changes in interest rates. This is known as extension risk.
MBS may have less potential for capital appreciation than comparable fixed-income securities due to the likelihood of increased prepayments of mortgages resulting from foreclosures or declining interest rates. These foreclosed or refinanced mortgages are paid off at face value (par) or less, causing a loss, particularly for any investor who may have purchased the security at a premium or a price above par. In such an environment, this risk limits the potential price appreciation of these securities.
Mortgage-Related and Other Asset-Backed Securities
The Fund may invest in mortgage or other ABS. These securities may include mortgage instruments issued by U.S. government agencies (“agency mortgages”) or those issued by private entities (“non-agency mortgages”). Specific types of instruments may include mortgage pass-through securities, collateralized mortgage obligations (“CMOs”), commercial mortgage-backed securities, mortgage dollar rolls, CMO residuals, stripped mortgage-backed securities and other securities that directly or indirectly represent a participation in, or are secured by a payable from, mortgage loans on real property. The value of the Fund’s MBS may be affected by, among other things, changes or perceived changes in interest rates, factors concerning the interests in and structure of the issuer or the originator of the mortgage, or the quality of the underlying assets. The mortgages underlying the securities may default or decline in quality or value. Through its investments in MBS, the Fund has exposure to subprime loans, Alt-A loans and non-conforming loans as well as to the mortgage and credit markets generally. Underlying collateral related to subprime, Alt-A and non-conforming mortgage loans has become increasingly susceptible to defaults and declines in quality or value, especially in a declining residential real estate market. In addition, regulatory or tax changes may adversely affect the mortgage securities markets as a whole.
Other Investment Company Securities and Other Exchange-Traded Products
The Fund at times may invest in shares of other investment companies, including open-end funds, closed-end funds, business development companies (“BDCs”), ETFs, unit investment trusts, and other investment companies of the Trust. The Fund may invest in securities of an investment company advised by the Manager or the Sub-Advisor. Investments in the securities of other investment companies may involve duplication of advisory fees and certain other expenses. By investing in another investment company, the Fund becomes a shareholder of that investment company. As a result, Fund shareholders indirectly will bear the Fund’s proportionate share of the fees and expenses paid by shareholders of the other investment company, in addition to the fees and expenses Fund shareholders directly bear in connection with the Fund’s own operations. These other fees and expenses, if applicable, are reflected as Acquired Fund Fees and Expenses and are included in the Fees and Expenses Table for the Fund in its Prospectus. Investment in other investment companies may involve the payment of substantial premiums above the value of such issuer’s portfolio securities.
U.S. Government Agency Securities
U.S. Government agency securities are issued or guaranteed by the U.S. Government or its agencies or instrumentalities. Some obligations issued by U.S. Government agencies and instrumentalities are supported by the full faith and credit of the U.S. Treasury; others by the right of the issuer to borrow from the U.S. Treasury; others by discretionary authority of the U.S. Government to purchase certain obligations of the agency or instrumentality; and others only by the credit of the agency or instrumentality. U.S. Government securities bear fixed, floating or variable rates of interest. While the U.S. Government currently provides financial support to certain U.S. Government-sponsored agencies or instrumentalities, no assurance can be given that it will always do so, since it is not so obligated by law. U.S. Government securities include U.S. Treasury bills, notes and bonds, Federal Home Loan Bank (“FHLB”) obligations, Federal Farm Credit Bank (“FFCB”) obligations, U.S. Government agency
22
American Beacon Garcia Hamilton Quality Bond FundSM
Notes to Financial Statements
October 31, 2021
obligations and repurchase agreements secured thereby. U.S. Government agency securities are subject to credit risk and interest rate risk.
U.S. Treasury Obligations
U.S. Treasury obligations include bills (initial maturities of one year or less), notes (initial maturities between two and ten years), and bonds (initial maturities over ten years) issued by the U.S. Treasury, Separately Traded Registered Interest and Principal component parts of such obligations (known as “STRIPS”) and inflation-indexed securities. The prices of these securities (like all debt securities) change between issuance and maturity in response to fluctuating market interest rates. U.S. Treasury obligations are subject to credit risk and interest rate risk.
5. Principal Risks
Investing in the Fund may involve certain risks including, but not limited to, those described below.
Credit Risk
The Fund is subject to the risk that the issuer or guarantor of a debt security, or the counterparty to a derivatives contract or a loan will fail to make timely payment of interest or principal or otherwise honor its obligations or default completely. A decline in the credit rating of an individual security held by the Fund may have an adverse impact on its price and make it difficult for the Fund to sell it. Ratings represent a rating agency’s opinion regarding the quality of the security and are not a guarantee of quality. Rating agencies might not always change their credit rating on an issuer or security in a timely manner to reflect events that could affect the issuer’s ability to make timely payments on its obligations. Credit risk is typically greater for securities with ratings that are below investment grade. Since the Fund can invest significantly in high-yield investments considered speculative in nature, this risk may be substantial.
Floating Rate Securities Risk
The coupons on certain fixed income securities in which the Fund may invest are not fixed and may fluctuate based upon changes in market rates. The coupon on a floating rate security is generally based on an interest rate such as a money-market index, London Interbank Offered Rate (“LIBOR”), Secured Overnight Financing Rate (“SOFR”), or a Treasury bill rate. Such securities are subject to interest rate risk and may fluctuate in value in response to interest rate changes if there is a delay between changes in market interest rates and the interest reset date for the obligation, or for other reasons. As short-term interest rates decline, the coupons on floating rate securities typically decrease. Alternatively, during periods of rising interest rates, changes in the coupons of floating rate securities may lag behind changes in market rates or may have limits on the maximum increases in the coupon rates. The value of floating rate securities may decline if their coupons do not rise as much, or as quickly, as interest rates in general. Conversely, floating rate securities will not generally increase in value if interest rates decline. Floating rate obligations are less effective than fixed rate obligations at locking in a particular yield and are subject to credit risk.
Interest Rate Risk
Generally, the value of investments with interest rate risk, such as fixed income securities or derivatives, will move in the opposite direction to movements in interest rates. The prices of fixed income securities or derivatives are also affected by their durations. Fixed income securities or derivatives with longer durations generally have greater sensitivity to changes in interest rates. For example, if a bond has a duration of eight years, a 1% increase in interest rates could be expected to result in an 8% decrease in the value of the bond. An increase in interest rates can impact markets broadly as well. Extremely low or negative interest rates may become more prevalent among U.S. and foreign issuers. To the extent the Fund holds an investment with a negative interest rate
23
American Beacon Garcia Hamilton Quality Bond FundSM
Notes to Financial Statements
October 31, 2021
to maturity, the Fund may generate a negative return on that investment. Conversely, in the future, interest rates may rise, perhaps significantly and/or rapidly, potentially resulting in substantial losses to the Fund.
Investment Risk
An investment in the Fund is not a deposit with a bank and is not insured or guaranteed by the Federal Deposit Insurance Corporation or any other government agency. When you sell your shares of the Fund, they could be worth less than what you paid for them. Therefore, you may lose money by investing in the Fund.
LIBOR Risk
Certain of the instruments identified in the Fund’s principal investment strategies have variable or floating coupon rates that are based on LIBOR, Euro Interbank Offered Rate and other similar types of reference rates (each, a “Reference Rate”). These Reference Rates are generally intended to represent the rate at which contributing banks may obtain short-term borrowings from each other within certain financial markets. LIBOR is produced daily by averaging the rates reported by a number of banks and may be a significant factor in determining the Fund’s payment obligations under a derivative instrument, the cost of financing to the Fund, or an investment’s value or return to the Fund, and may be used in other ways that affect the Fund’s performance. Arrangements are underway to phase out the use of LIBOR. These arrangements and any additional regulatory or market changes may have an adverse impact on the Fund or its investments, including increased volatility or illiquidity in markets for instruments that rely on LIBOR.
Regulators and market participants are working together to identify or develop successor Reference Rates. Additionally, it is expected that market participants will focus on the transition mechanisms by which the Reference Rates in existing contracts or instruments may be amended, whether through marketwide protocols, fallback contractual provisions, bespoke negotiations or amendments or otherwise. Nonetheless, there remains uncertainty regarding the nature of any replacement rate and the impact of the transition from LIBOR on the Fund and the financial markets generally, and the termination of certain Reference Rates presents risks to the Fund. Financial industry groups have begun planning for a transition to the use of a different Reference Rate or benchmark rate, but there are obstacles to converting certain securities and transactions to a new Reference Rate or benchmark rate. The transition process, or the failure of an industry to transition, could lead to increased volatility and illiquidity in markets for instruments that currently rely on LIBOR to determine interest rates and a reduction in the values of some LIBOR-based investments, all of which would impact the Fund. While some LIBOR-based instruments may contemplate a scenario where LIBOR becomes unavailable by providing for an alternative rate-setting methodology, not all may have such provisions and there may be significant uncertainty regarding the effectiveness of any such methodologies. In addition, the alternative reference or benchmark rate may be an ineffective substitute, potentially resulting in prolonged adverse market conditions for the Fund. The elimination of a Reference Rate or any other changes or reforms to the determination or supervision of Reference Rates could have an adverse impact on the market for or value of any securities or payments linked to those Reference Rates and other financial obligations held by the Fund or on its overall financial condition or results of operations. Any substitute Reference Rate and any pricing adjustments imposed by a regulator or by counterparties or otherwise may adversely affect the Fund’s performance and/or NAV. At this time, it is not possible to completely identify or predict the effect of any such changes, any establishment of alternative Reference Rates or any other reforms to Reference Rates that may be enacted in the UK or elsewhere. Because the usefulness of LIBOR as a benchmark could deteriorate during the transition period, any of the effects described above could occur prior to the official phasing out of LIBOR.
Liquidity Risk
When there is little or no active trading market for a specific type of security it can become more difficult to purchase or sell the securities at or near their perceived value. During such periods, certain investments held by the Fund may be difficult to sell or other investments may be difficult to purchase at favorable times or prices. As
24
American Beacon Garcia Hamilton Quality Bond FundSM
Notes to Financial Statements
October 31, 2021
a result, the Fund may have to lower the price on certain securities that it is trying to sell, sell other securities instead or forgo an investment opportunity, any of which could have a negative effect on Fund management or performance. Redemptions by a few large investors in the Fund at such times may have a significant adverse effect on the Fund’s NAV per share and remaining Fund shareholders. In addition, the market-making capacity of dealers in certain types of securities has been reduced in recent years, in part as a result of structural and regulatory changes, such as fewer proprietary trading desks and increased regulatory capital requirements for broker-dealers. Further, many broker-dealers have reduced their inventory of certain debt securities. This could negatively affect the Fund’s ability to buy or sell debt securities and increase the related volatility and trading costs. The Fund may lose money if it is forced to sell certain investments at unfavorable prices to meet redemption requests or other cash needs.
Market Risk
The Fund is subject to the risk that the securities markets will move down, sometimes rapidly and unpredictably, based on overall economic conditions and other factors, which may negatively affect the Fund’s performance. Equity securities generally have greater price volatility than fixed income securities, although under certain market conditions fixed income securities may have comparable or greater price volatility. During a general downturn in the securities markets, multiple assets may decline in value simultaneously. In some cases, traditional market participants have been less willing to make a market in some types of debt instruments, which has affected the liquidity of those instruments. During times of market turmoil, investors tend to look to the safety of securities issued or backed by the U.S. Treasury, causing the prices of these securities to rise and the yields to decline. Reduced liquidity in fixed income and credit markets may negatively affect many issuers worldwide. Prices in many financial markets have increased significantly over the last decade, but there have also been periods of adverse market and financial developments and cyclical change during that timeframe, which have resulted in unusually high levels of volatility in domestic and foreign financial markets that has caused losses for investors and may occur again in the future, particularly if markets enter a period of uncertainty or economic weakness. The value of a security may decline due to adverse issuer-specific conditions, general market conditions unrelated to a particular issuer, or factors that affect a particular industry or industries. Changes in the financial condition of a single issuer or market segment also can impact the market as a whole.
Geopolitical and other events, including war, terrorism, economic uncertainty, trade disputes, pandemics, public health crises, natural disasters and related events have led, and in the future may continue to lead, to instability in world economies and markets generally and reduced liquidity in equity, credit and fixed-income markets, which may disrupt economies and markets and adversely affect the value of your investment. Adverse market events may also lead to increased shareholder redemptions, which could cause the Fund to experience a loss or difficulty in selling investments to meet redemption requests by shareholders and may increase the Fund’s portfolio turnover, which will increase the costs that the Fund incurs and lower the Fund’s performance. Even when securities markets perform well, there is no assurance that the investments held by the Fund will increase in value along with the broader market.
Policy changes by the U.S. government and/or Federal Reserve and political events within the U.S. and abroad, including the U.S. presidential election, the U.S. government’s inability at times to agree on a long-term budget and deficit reduction plan, the threat of a federal government shutdown and threats not to increase the federal government’s debt limit, may affect investor and consumer confidence and may adversely impact financial markets and the broader economy, perhaps suddenly and to a significant degree. The severity or duration of adverse economic conditions may also be affected by policy changes made by governments or quasi-governmental organizations. Global economies and financial markets are becoming increasingly interconnected, which increases the possibility of many markets being affected by events in a single country or events affecting a single or small number of issuers.
Markets and market participants are increasingly reliant upon both publicly available and proprietary information data systems. Data imprecision, software or other technology malfunctions, programming inaccuracies,
25
American Beacon Garcia Hamilton Quality Bond FundSM
Notes to Financial Statements
October 31, 2021
unauthorized use or access, and similar circumstances may impair the performance of these systems and may have an adverse impact upon a single issuer, a group of issuers, or the market at large. In certain cases, an exchange or market may close or issue trading halts on either specific securities or even the entire market, which may result in the Fund being, among other things, unable to buy or sell certain securities or financial instruments or accurately price its investments. These fluctuations in securities prices could be a sustained trend or a drastic movement. The financial markets generally move in cycles, with periods of rising prices followed by periods of declining prices. The value of your investment may reflect these fluctuations.
Mortgage-Backed and Mortgage Related Securities Risk
Investments in mortgage-backed and mortgage-related securities are influenced by the factors affecting the mortgages underlying the securities or the housing market. Investments in mortgage-backed and mortgage-related securities also are subject to market risks for fixed income securities, which include, but are not limited to, credit risk, interest rate risk, prepayment risk, extension risk, callable securities risk, and valuation risk. A decline in the credit quality of the issuers of mortgage-backed and mortgage-related securities or instability in the markets for such securities may affect the value and liquidity of such securities, which could result in losses to the Fund. These securities are also subject to the risk of default on the underlying mortgages, particularly during periods of market downturn, and an unexpectedly high rate of defaults on the underlying assets will adversely affect the security’s value.
Other Investment Companies Risk
The Fund may invest in shares of other registered investment companies, including money market funds that are advised by the Manager. To the extent that the Fund invests in shares of other registered investment companies, the Fund will indirectly bear the fees and expenses, including for example advisory and administrative fees, charged by those investment companies in addition to the Fund’s direct fees and expenses and will be subject to the risks associated with investments in those companies. For example, the Fund’s investments in money market funds are subject to interest rate risk, credit risk, and market risk. The Fund must rely on the investment company in which it invests to achieve its investment objective. If the investment company fails to achieve its investment objective, the value of the Fund’s investment will decline, adversely affecting the Fund’s performance. To the extent the Fund invests in other investment companies that invest in equity securities, fixed income securities and/or foreign securities, or that track an index, the Fund is subject to the risks associated with the underlying investments held by the investment company or the index fluctuations to which the investment company is subject.
Prepayment and Extension Risk
When interest rates fall, borrowers will generally repay the loans that underlie certain debt securities, especially mortgage-related and other types of ABS, more quickly than expected, causing the issuer of the security to repay the principal prior to the security’s expected maturity date. The Fund may need to reinvest the proceeds at a lower interest rate, reducing its income. Securities subject to prepayment risk generally offer less potential for gains when prevailing interest rates fall. If the Fund buys those securities at a premium, accelerated prepayments on those securities could cause the Fund to lose a portion of its principal investment. The impact of prepayments on the price of a security may be difficult to predict and may increase the security’s price volatility. Variable and floating rate securities may be less sensitive to prepayment risk. Extension risk is the risk that a decrease in prepayments may, as a result of higher interest rates or other factors, result in the extension of a security’s effective maturity, heighten interest rate risk and increase the potential for a decline in its price.
Recent Market Events Risk
An outbreak of infectious respiratory illness caused by a novel coronavirus, known as COVID-19, was first detected in China in December 2019 and has subsequently spread globally. Transmission of COVID-19 and efforts to
26
American Beacon Garcia Hamilton Quality Bond FundSM
Notes to Financial Statements
October 31, 2021
contain its spread have resulted, and may continue to result, in significant disruptions to business operations, widespread business closures and layoffs, travel restrictions, closed international, national and local borders, prolonged quarantines and stay-at-home orders, disruption of and delays in healthcare service preparation and delivery, service and event cancellations, and lower consumer demand, as well as general concern and uncertainty that has negatively affected the global economy. The impact of the COVID-19 pandemic may last for an extended period of time and may result in a sustained economic downturn or recession. The U.S. Federal Reserve and the U.S. federal government have taken numerous measures to address the economic impact of the COVID-19 pandemic and stimulate the U.S. economy. The ultimate effects of these and other efforts that may be taken may not be known for some time.
The Federal Reserve has spent hundreds of billions of dollars to keep credit flowing through short-term money markets. Amid the Federal Reserve’s ongoing efforts, concerns about the markets’ dependence on the Federal Reserve’s provision of liquidity have grown. Future legislative, regulatory and policy changes may result in more restrictions on international trade, less stringent prudential regulation of certain players in the financial markets, and significant new investments in infrastructure and national defense. High public debt in the U.S. and other countries creates ongoing systemic and market risks and policymaking uncertainty.
A rise in protectionist trade policies, slowing global economic growth, risks associated with the United Kingdom’s departure from the European Union on December 31, 2020, commonly referred to as “Brexit,” and a trade agreement between the United Kingdom and the European Union, the risks associated with ongoing trade negotiations with China, the possibility of changes to some international trade agreements, tensions or open conflict between nations, or political or economic dysfunction within some nations that are major producers of oil could affect the economies of many nations, including the United States, in ways that cannot necessarily be foreseen at the present time.
Economists and others have expressed increasing concern about the potential effects of global climate change on property and security values. Certain issuers, industries and regions may be adversely affected by the impacts of climate change, including on the demand for and the development of goods and services and related production costs, and the impacts of legislation, regulation and international accords related to climate change, as well as any indirect consequences of regulation or business trends driven by climate change.
Redemption Risk
The Fund may experience periods of high levels of redemptions that could cause the Fund to sell assets at inopportune times or at a loss or depressed value. The sale of assets to meet redemption requests may create net capital gains, which could cause the Fund to have to distribute substantial capital gains. Redemption risk is heightened during periods of declining or illiquid markets. During periods of heavy redemptions, the Fund may borrow funds through the interfund credit facility or from a bank line of credit, which may increase costs. A rise in interest rates or other market developments may cause investors to move out of fixed income securities on a large scale. Heavy redemptions could hurt the Fund’s performance.
Sector Risk
Sector risk is the risk associated with the Fund holding a significant amount of investments in similar businesses, which would be similarly affected by particular economic or market events, which may, in certain circumstances, cause the value of the equity and debt securities of companies in a particular sector of the market to change. To the extent the Fund has substantial holdings within a particular sector, the risks to the Fund associated with that sector increase. In addition, when the Fund focuses its investments in certain sectors of the economy, its performance may be driven largely by sector performance and could fluctuate more widely than if the Fund were invested more evenly across sectors. Individual sectors may be more volatile, and may perform differently, than the broader market. The businesses that constitute a sector may all react the same way to economic, political or regulatory events. The Fund’s performance could also be affected if the sectors do not perform as expected. The lack of exposure to one or more sectors may adversely affect performance. As the Fund’s portfolio changes over time, the Fund’s exposure to a particular sector may become higher or lower.
27
American Beacon Garcia Hamilton Quality Bond FundSM
Notes to Financial Statements
October 31, 2021
Socially Responsible Investing Risk
The Fund’s incorporation of environmental, social and/or governance considerations in its investment strategy may cause it to make different investments than funds that have a similar investment style but do not incorporate such considerations in their strategy. The Fund may under perform funds that do not incorporate these considerations. The Fund may not be able to take advantage of certain investment opportunities due to these considerations, which may adversely affect investment performance.
U.S. Government Securities and Government-Sponsored Enterprises Risk
A security backed by the U.S. Treasury or the full faith and credit of the United States is guaranteed only as to the timely payment of interest and principal when held to maturity. The market prices for such securities are not guaranteed and will fluctuate. Additionally, circumstances could arise that would prevent the payment of interest or principal. This could result in losses to the Fund. Investments in government-sponsored enterprises are debt obligations issued by agencies and instrumentalities of the U.S. Government. These obligations vary in the level of support they receive from the U.S. Government. They may be: (i) supported by the full faith and credit of the U.S. Treasury, such as those of the Government National Mortgage Association (‘‘Ginnie Mae’’); (ii) supported by the right of the issuer to borrow from the U.S. Treasury, such as those of the Federal Home Loan Bank and the Federal Farm Credit Banks; (iii) supported by the discretionary authority of the U.S. Government to purchase the agency obligations, such as those of Fannie Mae and Freddie Mac or (iv) supported only by the credit of the issuer, such as those of the Federal Farm Credit Bureau. The U.S. Government may choose not to provide financial support to U.S. Government-sponsored agencies or instrumentalities if it is not legally obligated to do so, in which case, if the issuer defaulted, to the extent the Fund held securities of such issuers, it might not be able to recover its investment from the U.S. Government. U.S. government securities and securities of government-sponsored entities are also subject to credit risk, interest rate risk and market risk. The rising U.S. national debt may lead to adverse impacts on the value of U.S. government securities due to potentially higher costs for the U.S. government to obtain new financing.
Variable and Floating Rate Securities Risk
The coupons on certain fixed income securities in which the Fund may invest are not fixed and may fluctuate based upon changes in market rates. The coupon on a floating rate security is generally based on an interest rate such as a money-market index, LIBOR, SOFR, or a Treasury bill rate. Such securities are subject to interest rate risk and may fluctuate in value in response to interest rate changes if there is a delay between changes in market interest rates and the interest reset date for the obligation, or for other reasons. As short-term interest rates decline, the coupons on variable and floating rate securities typically decrease. Alternatively, during periods of rising interest rates, changes in the coupons of variable and floating rate securities may lag behind changes in market rates or may have limits on the maximum increases in the coupon rates. The value of variable and floating rate securities may decline if their coupons do not rise as much, or as quickly, as interest rates in general. Conversely, variable and floating rate securities will not generally increase in value if interest rates decline. Variable and floating rate securities are less effective at locking in a particular yield and are subject to credit risk. Certain types of floating rate instruments may also be subject to greater liquidity risk than other debt securities.
6. Federal Income and Excise Taxes
It is the policy of the Fund to qualify as a regulated investment company (“RIC”), by complying with all applicable provisions of Subchapter M of the Internal Revenue Code, as amended, and to make distributions of taxable income sufficient to relieve it from substantially all federal income and excise taxes. For federal income tax purposes, the Fund is treated as a single entity for the purpose of determining such qualification.
The Fund does not have any unrecorded tax liabilities in the accompanying financial statements. Each of the tax years in the four year period ended October 31, 2021 remain subject to examination by the Internal Revenue Service. If applicable, the Fund recognizes interest accrued related to unrecognized tax benefits in interest expense and penalties in “Other expenses” on the Statement of Operations.
28
American Beacon Garcia Hamilton Quality Bond FundSM
Notes to Financial Statements
October 31, 2021
The Fund may be subject to taxes imposed by countries in which it invests. Such taxes are generally based on returns of income earned or gains realized or repatriated. Taxes are accrued and applied to net investment income, net realized capital gains and net unrealized appreciation (depreciation), as applicable, as the income is earned or capital gains are recorded.
Dividends are categorized in accordance with income tax regulations which may treat certain transactions differently than U.S. GAAP. Accordingly, the character of distributions and composition of net assets for tax purposes may differ from those reflected in the accompanying financial statements.
The tax character of distributions paid were as follows:
| Year Ended October 31, 2021 | Year Ended October 31, 2020 | |||||||||||
Distributions paid from: |
| |||||||||||
Ordinary income* |
| |||||||||||
R5 Class | $ | 3,607,524 | $ | 3,807,202 | ||||||||
Y Class | 385,179 | 287,618 | ||||||||||
Investor Class | 6,916 | 72,178 | ||||||||||
R6 Class | 3,234,538 | 2,328,652 | ||||||||||
Long-term capital gains |
| |||||||||||
R5 Class | 2,195,943 | – | ||||||||||
Y Class | 242,071 | – | ||||||||||
Investor Class | 4,939 | – | ||||||||||
R6 Class | 1,998,499 | – | ||||||||||
|
|
|
| |||||||||
Total distributions paid | $ | 11,675,609 | $ | 6,495,650 | ||||||||
|
|
|
| |||||||||
* For tax purposes, short-term capital gains are considered ordinary income distributions.
As of October 31, 2021, the components of distributable earnings (deficits) on a tax basis were as follows:
Fund | Tax Cost | Unrealized Appreciation | Unrealized (Depreciation) | Net Unrealized Appreciation (Depreciation) | ||||||||||||||||||||||||
Garcia Hamilton Quality Bond | $ | 376,302,907 | $ | 1,272,996 | $ | (1,765,811 | ) | $ | (492,815 | ) | ||||||||||||||||||
Fund | Net Unrealized Appreciation (Depreciation) | Undistributed Ordinary Income | Undistributed Long-Term Capital Gains | Accumulated Capital and Other (Losses) | Other Temporary Differences | Distributable Earnings | ||||||||||||||||||||||||||||||||||||||
Garcia Hamilton Quality Bond | $ | (492,815 | ) | $ | 87,691 | $ | - | $ | (4,417,904 | ) | $ | (90,863 | ) | $ | (4,913,891 | ) | ||||||||||||||||||||||||||||
Financial reporting records are adjusted for permanent book/tax differences to reflect tax character. Financial records are not adjusted for temporary differences. The temporary differences between financial reporting and tax-basis reporting of unrealized appreciation (depreciation) are attributable primarily to the tax deferral of losses from wash sales, unused capital loss carryforwards, book amortization of premiums, and dividends payable.
Due to inherent differences in the recognition of income, expenses, and realized gains (losses) under U.S. GAAP and federal income tax regulations, permanent differences between book and tax reporting have been identified and appropriately reclassified on the Statement of Assets and Liabilities.
For federal income tax purposes, the Fund measures its capital loss carryforwards annually at October 31, its fiscal year end. Capital loss carryforwards retain their character as short-term and/or long-term and may be carried forward and applied against future realized capital gains with no expiration date.
29
American Beacon Garcia Hamilton Quality Bond FundSM
Notes to Financial Statements
October 31, 2021
As of October 31, 2021, the Fund had $3,865,914 short-term and $551,990 long-term capital loss carryforwards.
7. Investment Transactions
The aggregate cost of purchases and proceeds from sales and maturities of investments, other than short-term obligations, for the year ended October 31, 2021 were as follows:
Fund | Purchases (non-U.S. Government Securities) | Purchases of U.S. Government Securities | Sales (non-U.S. Government Securities) | Sales of U.S. Government Securities | ||||||||||||||||||||||||
Garcia Hamilton Quality Bond | $ | 69,766,469 | $ | 295,111,824 | $ | 122,300,121 | $ | 119,067,409 | ||||||||||||||||||||
8. Borrowing Arrangements
Effective November 12, 2020 (the “Effective Date”), the Fund, along with certain other funds managed by the Manager (“Participating Funds”), renewed a committed revolving line of credit (the “Committed Line”) agreement with State Street Bank and Trust Company (the “Bank”) to be used to facilitate portfolio liquidity. The maximum borrowing amount under the Committed Line is $150 million with interest at a rate equal to the higher of (a) Overnight Bank Funding Rate (“OBFR”) daily fluctuating rate per annum equal to 1.25% plus the sum of 0.10% or (b) the Federal Funds daily fluctuating rate per annum on amounts borrowed. Each of the Participating Funds paid a proportional amount of a closing fee of $100,000 on the Effective Date and a quarterly commitment fee at a rate of 0.25% per annum on the unused portion of the Committed Line amount. The Committed Line expires November 11, 2021, unless extended by the Bank or terminated by the Participating Funds in accordance with the agreement. Effective November 11, 2021, the Fund’s Committed Line was changed to a maximum of $100 million with an expiration of November 10, 2022.
On the Effective Date, the Fund, along with certain other Participating Funds managed by the Manager, also renewed an uncommitted discretionary demand revolving line of credit (the “Uncommitted Line”) agreement with the Bank to be used to facilitate portfolio liquidity. The maximum borrowing amount under the Uncommitted Line is $50 million with interest at a rate equal to the higher of (a) Overnight Bank Funding Rate (“OBFR”) daily fluctuating rate per annum equal to 1.25% plus the sum of 0.10% or (b) the Federal Funds daily fluctuating rate per annum on amounts borrowed on each outstanding loan. Each of the Participating Funds paid a proportional amount of a closing fee of $35,000 on the Effective Date. The Uncommitted Line expires November 11, 2021 unless extended by the Bank or terminated by the Participating Funds in accordance with the agreement. Effective November 11, 2021, the Fund’s Uncommitted Line was changed to a maximum of $100 million with an expiration of November 10, 2022.
The Participating Funds paid administration, legal and arrangement fees, which are recognized as a component of “Loan expense” on the Statement of Operations, along with commitment fees, that have been allocated among the Participating Funds based on average daily net assets.
During the year ended October 31, 2021, the Fund did not utilize this facility.
30
American Beacon Garcia Hamilton Quality Bond FundSM
Notes to Financial Statements
October 31, 2021
9. Capital Share Transactions
The tables below summarize the activity in capital shares for each Class of the Fund:
| R5 Class | ||||||||||||||||||||||||||||
| Year Ended October 31, | ||||||||||||||||||||||||||||
| 2021 | 2020 | |||||||||||||||||||||||||||
Garcia Hamilton Quality Bond Fund | Shares | Amount | Shares | Amount | ||||||||||||||||||||||||
| Shares sold | 6,823,749 | $ | 68,605,815 | 10,920,910 | $ | 110,830,535 | ||||||||||||||||||||||
| Reinvestment of dividends | 472,898 | 4,759,799 | 260,888 | 2,639,245 | ||||||||||||||||||||||||
| Shares redeemed | (4,558,386 | ) | (46,119,650 | ) | (25,867,704 | ) | (260,818,722 | ) | ||||||||||||||||||||
|
|
|
|
|
|
|
| |||||||||||||||||||||
| Net increase (decrease) in shares outstanding | 2,738,261 | $ | 27,245,964 | (14,685,906 | ) | $ | (147,348,942 | ) | ||||||||||||||||||||
|
|
|
|
|
|
|
| |||||||||||||||||||||
| Y Class | ||||||||||||||||||||||||||||
| Year Ended October 31, | ||||||||||||||||||||||||||||
| 2021 | 2020 | |||||||||||||||||||||||||||
Garcia Hamilton Quality Bond Fund | Shares | Amount | Shares | Amount | ||||||||||||||||||||||||
| Shares sold | 1,072,363 | $ | 10,776,226 | 1,687,321 | $ | 16,967,230 | ||||||||||||||||||||||
| Reinvestment of dividends | 62,184 | 625,100 | 27,949 | 283,161 | ||||||||||||||||||||||||
| Shares redeemed | (812,784 | ) | (8,188,628 | ) | (1,656,596 | ) | (16,761,196 | ) | ||||||||||||||||||||
|
|
|
|
|
|
|
| |||||||||||||||||||||
| Net increase in shares outstanding | 321,763 | $ | 3,212,698 | 58,674 | $ | 489,195 | ||||||||||||||||||||||
|
|
|
|
|
|
|
| |||||||||||||||||||||
| Investor Class | ||||||||||||||||||||||||||||
| Year Ended October 31, | ||||||||||||||||||||||||||||
| 2021 | 2020 | |||||||||||||||||||||||||||
Garcia Hamilton Quality Bond Fund | Shares | Amount | Shares | Amount | ||||||||||||||||||||||||
| Shares sold | 70,673 | $ | 700,509 | 83,368 | $ | 837,398 | ||||||||||||||||||||||
| Reinvestment of dividends | 1,178 | 11,819 | 7,035 | 70,766 | ||||||||||||||||||||||||
| Shares redeemed | (6,723 | ) | (67,047 | ) | (1,538,154 | ) | (15,461,294 | ) | ||||||||||||||||||||
|
|
|
|
|
|
|
| |||||||||||||||||||||
| Net increase (decrease) in shares outstanding | 65,128 | $ | 645,281 | (1,447,751 | ) | $ | (14,553,130 | ) | ||||||||||||||||||||
|
|
|
|
|
|
|
| |||||||||||||||||||||
| R6 Class | ||||||||||||||||||||||||||||
| Year Ended October 31, | ||||||||||||||||||||||||||||
| 2021 | 2020 | |||||||||||||||||||||||||||
Garcia Hamilton Quality Bond Fund | Shares | Amount | Shares | Amount | ||||||||||||||||||||||||
| Shares sold | 2,863,007 | $ | 28,881,621 | 2,293,937 | $ | 23,167,805 | ||||||||||||||||||||||
| Reinvestment of dividends | 520,965 | 5,233,011 | 229,895 | 2,328,652 | ||||||||||||||||||||||||
| Shares redeemed | (324,677 | ) | (3,234,747 | ) | (1,663,069 | ) | (16,327,302 | ) | ||||||||||||||||||||
|
|
|
|
|
|
|
| |||||||||||||||||||||
| Net increase in shares outstanding | 3,059,295 | $ | 30,879,885 | 860,763 | $ | 9,169,155 | ||||||||||||||||||||||
|
|
|
|
|
|
|
| |||||||||||||||||||||
10. Subsequent Events
Management has evaluated subsequent events for possible recognition or disclosure in the financial statements through the date the financial statements are issued. Management has determined that there are no material events that would require disclosure in the Fund’s financial statements through this date.
31
American Beacon Garcia Hamilton Quality Bond FundSM
(For a share outstanding throughout the period)
| R5 ClassA | ||||||||||||||||||||||||||||||||||||
| Year Ended October 31, | ||||||||||||||||||||||||||||||||||||
| 2021 | 2020 | 2019 | 2018 | 2017 | ||||||||||||||||||||||||||||||||
|
| |||||||||||||||||||||||||||||||||||
Net asset value, beginning of period | $ | 10.27 | $ | 10.05 | $ | 9.79 | $ | 9.91 | $ | 9.98 | ||||||||||||||||||||||||||
|
|
|
|
|
|
|
|
|
| |||||||||||||||||||||||||||
Income (loss) from investment operations: | ||||||||||||||||||||||||||||||||||||
Net investment income (loss) | (0.01 | )B | 0.11 | 0.24 | 0.20 | 0.14 | ||||||||||||||||||||||||||||||
Net gains (losses) on investments (both realized and unrealized) | (0.08 | ) | 0.28 | 0.26 | (0.13 | ) | (0.05 | ) | ||||||||||||||||||||||||||||
|
|
|
|
|
|
|
|
|
| |||||||||||||||||||||||||||
Total income (loss) from investment operations | (0.09 | ) | 0.39 | 0.50 | 0.07 | 0.09 | ||||||||||||||||||||||||||||||
|
|
|
|
|
|
|
|
|
| |||||||||||||||||||||||||||
Less distributions: | ||||||||||||||||||||||||||||||||||||
Dividends from net investment income | (0.14 | ) | (0.17 | ) | (0.24 | ) | (0.19 | ) | (0.15 | ) | ||||||||||||||||||||||||||
Distributions from net realized gains | (0.19 | ) | – | – | – | (0.01 | ) | |||||||||||||||||||||||||||||
|
|
|
|
|
|
|
|
|
| |||||||||||||||||||||||||||
Total distributions | (0.33 | ) | (0.17 | ) | (0.24 | ) | (0.19 | ) | (0.16 | ) | ||||||||||||||||||||||||||
|
|
|
|
|
|
|
|
|
| |||||||||||||||||||||||||||
Net asset value, end of period | $ | 9.85 | $ | 10.27 | $ | 10.05 | $ | 9.79 | $ | 9.91 | ||||||||||||||||||||||||||
|
|
|
|
|
|
|
|
|
| |||||||||||||||||||||||||||
Total returnC | (0.84 | )% | 3.93 | % | 5.20 | % | 0.74 | % | 0.91 | % | ||||||||||||||||||||||||||
|
|
|
|
|
|
|
|
|
| |||||||||||||||||||||||||||
Ratios and supplemental data: | ||||||||||||||||||||||||||||||||||||
Net assets, end of period | $ | 192,774,622 | $ | 172,774,140 | $ | 316,582,604 | $ | 234,919,975 | $ | 132,575,412 | ||||||||||||||||||||||||||
Ratios to average net assets: | ||||||||||||||||||||||||||||||||||||
Expenses, before reimbursements and/or recoupments | 0.67 | % | 0.68 | % | 0.66 | % | 0.69 | % | 0.70 | % | ||||||||||||||||||||||||||
Expenses, net of reimbursements and/or recoupments | 0.45 | % | 0.45 | % | 0.45 | % | 0.45 | % | 0.45 | % | ||||||||||||||||||||||||||
Net investment income (loss), before expense reimbursements and/or recoupments | (0.32 | )% | 1.15 | % | 2.18 | % | 1.68 | % | 1.12 | % | ||||||||||||||||||||||||||
Net investment income (loss), net of reimbursements and/or recoupments | (0.10 | )% | 1.38 | % | 2.39 | % | 1.92 | % | 1.37 | % | ||||||||||||||||||||||||||
Portfolio turnover rate | 71 | % | 122 | % | 58 | % | 143 | % | 52 | % | ||||||||||||||||||||||||||
| A | Prior to February 28, 2020, the R5 Class was known as Institutional Class. |
| B | Based on average shares outstanding for the period. |
| C | Based on net asset value, which does not reflect the sales charge, redemption fee, or contingent deferred sales charge, if applicable. May include adjustments in accordance with U.S. GAAP and as such, the net asset value for reporting purposes and the returns based upon those net asset values may differ from the net asset value and returns for shareholder transactions. |
See accompanying notes
32
American Beacon Garcia Hamilton Quality Bond FundSM
Financial Highlights
(For a share outstanding throughout the period)
| Y Class | ||||||||||||||||||||||||||||||||||||
| Year Ended October 31, | ||||||||||||||||||||||||||||||||||||
| 2021 | 2020 | 2019 | 2018 | 2017 | ||||||||||||||||||||||||||||||||
|
| |||||||||||||||||||||||||||||||||||
Net asset value, beginning of period | $ | 10.27 | $ | 10.05 | $ | 9.79 | $ | 9.90 | $ | 9.98 | ||||||||||||||||||||||||||
|
|
|
|
|
|
|
|
|
| |||||||||||||||||||||||||||
Income (loss) from investment operations: | ||||||||||||||||||||||||||||||||||||
Net investment income | (0.00 | )A | 0.13 | 0.24 | 0.18 | 0.13 | ||||||||||||||||||||||||||||||
Net gains (losses) on investments (both realized and unrealized) | (0.08 | ) | 0.25 | 0.25 | (0.11 | ) | (0.06 | ) | ||||||||||||||||||||||||||||
|
|
|
|
|
|
|
|
|
| |||||||||||||||||||||||||||
Total income (loss) from investment operations | (0.08 | ) | 0.38 | 0.49 | 0.07 | 0.07 | ||||||||||||||||||||||||||||||
|
|
|
|
|
|
|
|
|
| |||||||||||||||||||||||||||
Less distributions: | ||||||||||||||||||||||||||||||||||||
Dividends from net investment income | (0.14 | ) | (0.16 | ) | (0.23 | ) | (0.18 | ) | (0.14 | ) | ||||||||||||||||||||||||||
Distributions from net realized gains | (0.19 | ) | – | – | – | (0.01 | ) | |||||||||||||||||||||||||||||
|
|
|
|
|
|
|
|
|
| |||||||||||||||||||||||||||
Total distributions | (0.33 | ) | (0.16 | ) | (0.23 | ) | (0.18 | ) | (0.15 | ) | ||||||||||||||||||||||||||
|
|
|
|
|
|
|
|
|
| |||||||||||||||||||||||||||
Net asset value, end of period | $ | 9.86 | $ | 10.27 | $ | 10.05 | $ | 9.79 | $ | 9.90 | ||||||||||||||||||||||||||
|
|
|
|
|
|
|
|
|
| |||||||||||||||||||||||||||
Total returnB | (0.81 | )% | 3.83 | % | 5.09 | % | 0.74 | % | 0.71 | % | ||||||||||||||||||||||||||
|
|
|
|
|
|
|
|
|
| |||||||||||||||||||||||||||
Ratios and supplemental data: | ||||||||||||||||||||||||||||||||||||
Net assets, end of period | $ | 21,340,613 | $ | 18,928,869 | $ | 17,927,537 | $ | 3,685,857 | $ | 3,133,476 | ||||||||||||||||||||||||||
Ratios to average net assets: | ||||||||||||||||||||||||||||||||||||
Expenses, before reimbursements and/or recoupments | 0.74 | % | 0.74 | % | 0.73 | % | 0.75 | % | 0.77 | % | ||||||||||||||||||||||||||
Expenses, net of reimbursements and/or recoupments | 0.52 | %C | 0.55 | % | 0.55 | % | 0.55 | % | 0.55 | % | ||||||||||||||||||||||||||
Net investment income (loss), before expense reimbursements and/or recoupments | (0.38 | )% | 1.03 | % | 2.14 | % | 1.58 | % | 1.05 | % | ||||||||||||||||||||||||||
Net investment income (loss), net of reimbursements and/or recoupments | (0.16 | )% | 1.22 | % | 2.32 | % | 1.78 | % | 1.27 | % | ||||||||||||||||||||||||||
Portfolio turnover rate | 71 | % | 122 | % | 58 | % | 143 | % | 52 | % | ||||||||||||||||||||||||||
| A | Amount represents less than $0.01 per share. |
| B | Based on net asset value, which does not reflect the sales charge, redemption fee, or contingent deferred sales charge, if applicable. May include adjustments in accordance with U.S. GAAP and as such, the net asset value for reporting purposes and the returns based upon those net asset values may differ from the net asset value and returns for shareholder transactions. |
| C | Expense ratios may exceed stated expense caps in Note 2 due to the change in the contractual expense cap on February 28, 2021. |
See accompanying notes
33
American Beacon Garcia Hamilton Quality Bond FundSM
Financial Highlights
(For a share outstanding throughout the period)
| Investor Class | ||||||||||||||||||||||||||||||||||||
| Year Ended October 31, | ||||||||||||||||||||||||||||||||||||
| 2021 | 2020 | 2019 | 2018 | 2017 | ||||||||||||||||||||||||||||||||
|
| |||||||||||||||||||||||||||||||||||
Net asset value, beginning of period | $ | 10.26 | $ | 10.05 | $ | 9.79 | $ | 9.91 | $ | 9.99 | ||||||||||||||||||||||||||
|
|
|
|
|
|
|
|
|
| |||||||||||||||||||||||||||
Income (loss) from investment operations: | ||||||||||||||||||||||||||||||||||||
Net investment income (loss) | (0.04 | )A | 0.13 | A | 0.21 | 0.15 | 0.10 | |||||||||||||||||||||||||||||
Net gains (losses) on investments (both realized and unrealized) | (0.07 | ) | 0.22 | 0.26 | (0.11 | ) | (0.06 | ) | ||||||||||||||||||||||||||||
|
|
|
|
|
|
|
|
|
| |||||||||||||||||||||||||||
Total income (loss) from investment operations | (0.11 | ) | 0.35 | 0.47 | 0.04 | 0.04 | ||||||||||||||||||||||||||||||
|
|
|
|
|
|
|
|
|
| |||||||||||||||||||||||||||
Less distributions: | ||||||||||||||||||||||||||||||||||||
Dividends from net investment income | (0.11 | ) | (0.14 | ) | (0.21 | ) | (0.16 | ) | (0.11 | ) | ||||||||||||||||||||||||||
Distributions from net realized gains | (0.19 | ) | – | – | – | (0.01 | ) | |||||||||||||||||||||||||||||
|
|
|
|
|
|
|
|
|
| |||||||||||||||||||||||||||
Total distributions | (0.30 | ) | (0.14 | ) | (0.21 | ) | (0.16 | ) | (0.12 | ) | ||||||||||||||||||||||||||
|
|
|
|
|
|
|
|
|
| |||||||||||||||||||||||||||
Net asset value, end of period | $ | 9.85 | $ | 10.26 | $ | 10.05 | $ | 9.79 | $ | 9.91 | ||||||||||||||||||||||||||
|
|
|
|
|
|
|
|
|
| |||||||||||||||||||||||||||
Total returnB | (1.11 | )% | 3.54 | % | 4.80 | % | 0.36 | % | 0.43 | % | ||||||||||||||||||||||||||
|
|
|
|
|
|
|
|
|
| |||||||||||||||||||||||||||
Ratios and supplemental data: | ||||||||||||||||||||||||||||||||||||
Net assets, end of period | $ | 991,788 | $ | 365,190 | $ | 14,904,591 | $ | 10,995,242 | $ | 9,724,030 | ||||||||||||||||||||||||||
Ratios to average net assets: | ||||||||||||||||||||||||||||||||||||
Expenses, before reimbursements and/or recoupments | 1.29 | % | 1.20 | % | 1.04 | % | 0.92 | % | 0.94 | % | ||||||||||||||||||||||||||
Expenses, net of reimbursements and/or recoupments | 0.83 | % | 0.83 | % | 0.83 | % | 0.83 | % | 0.83 | % | ||||||||||||||||||||||||||
Net investment income (loss), before expense reimbursements and/or recoupments | (0.91 | )% | 0.90 | % | 1.81 | % | 1.41 | % | 0.89 | % | ||||||||||||||||||||||||||
Net investment income (loss), net of reimbursements and/or recoupments | (0.45 | )% | 1.27 | % | 2.02 | % | 1.50 | % | 0.99 | % | ||||||||||||||||||||||||||
Portfolio turnover rate | 71 | % | 122 | % | 58 | % | 143 | % | 52 | % | ||||||||||||||||||||||||||
| A | Based on average shares outstanding for the period. |
| B | Based on net asset value, which does not reflect the sales charge, redemption fee, or contingent deferred sales charge, if applicable. May include adjustments in accordance with U.S. GAAP and as such, the net asset value for reporting purposes and the returns based upon those net asset values may differ from the net asset value and returns for shareholder transactions. |
See accompanying notes
34
American Beacon Garcia Hamilton Quality Bond FundSM
Financial Highlights
(For a share outstanding throughout the period)
| R6 Class | ||||||||||||||||||||
| Year Ended October 31, | February 28, 2019A to October 31, | |||||||||||||||||||
| 2021 | 2020 | 2019 | ||||||||||||||||||
|
| |||||||||||||||||||
Net asset value, beginning of period | $ | 10.26 | $ | 10.04 | $ | 9.87 | ||||||||||||||
|
|
|
|
|
| |||||||||||||||
Income (loss) from investment operations: | ||||||||||||||||||||
Net investment income (loss) | (0.01 | )B | 0.14 | 0.17 | ||||||||||||||||
Net gains (losses) on investments (both realized and unrealized) | (0.06 | ) | 0.25 | 0.17 | ||||||||||||||||
|
|
|
|
|
| |||||||||||||||
Total income (loss) from investment operations | (0.07 | ) | 0.39 | 0.34 | ||||||||||||||||
|
|
|
|
|
| |||||||||||||||
Less distributions: | ||||||||||||||||||||
Dividends from net investment income | (0.15 | ) | (0.17 | ) | (0.17 | ) | ||||||||||||||
Distributions from net realized gains | (0.19 | ) | – | – | ||||||||||||||||
|
|
|
|
|
| |||||||||||||||
Total distributions | (0.34 | ) | (0.17 | ) | (0.17 | ) | ||||||||||||||
|
|
|
|
|
| |||||||||||||||
Net asset value, end of period | $ | 9.85 | $ | 10.26 | $ | 10.04 | ||||||||||||||
|
|
|
|
|
| |||||||||||||||
Total returnC | (0.70 | )% | 3.97 | % | 3.44 | %D | ||||||||||||||
|
|
|
|
|
| |||||||||||||||
Ratios and supplemental data: | ||||||||||||||||||||
Net assets, end of period | $ | 166,304,291 | $ | 141,893,384 | $ | 130,208,195 | ||||||||||||||
Ratios to average net assets: | ||||||||||||||||||||
Expenses, before reimbursements and/or recoupments | 0.64 | % | 0.64 | % | 0.66 | %E | ||||||||||||||
Expenses, net of reimbursements and/or recoupments | 0.41 | % | 0.41 | % | 0.41 | %E | ||||||||||||||
Net investment income (loss), before expense reimbursements and/or recoupments | (0.28 | )% | 1.13 | % | 1.90 | %E | ||||||||||||||
Net investment income (loss), net of reimbursements and/or recoupments | (0.05 | )% | 1.36 | % | 2.15 | %E | ||||||||||||||
Portfolio turnover rate | 71 | % | 122 | % | 58 | %F | ||||||||||||||
| A | Commencement of operations. |
| B | Based on average shares outstanding for the period. |
| C | Based on net asset value, which does not reflect the sales charge, redemption fee, or contingent deferred sales charge, if applicable. May include adjustments in accordance with U.S. GAAP and as such, the net asset value for reporting purposes and the returns based upon those net asset values may differ from the net asset value and returns for shareholder transactions. |
| D | Not annualized. |
| E | Annualized. |
| F | Portfolio turnover rate is for the period from February 28, 2019 through October 31, 2019 and is not annualized. |
See accompanying notes
35
American Beacon FundsSM
October 31, 2021 (Unaudited)
Certain tax information regarding the Funds are required to be provided to shareholders based upon the Funds’ income and distributions for the taxable year ended October 31, 2021. The information and distributions reported herein may differ from information and distributions taxable to the shareholders for the calendar year ended December 31, 2021.
The Fund designated the following items with regard to distributions paid during the fiscal year ended October 31, 2021. All designations are based on financial information available as of this annual report and, accordingly, are subject to change. For each item, it is the intention of the Funds to designate the maximum amount permitted under the Internal Revenue Code of 1986, as amended, and the regulations there under.
Corporate Dividends-Received Deduction:
Garcia Hamilton Quality Bond | 0.00 | % |
Qualified Dividend Income:
Garcia Hamilton Quality Bond | 0.00 | % |
Long-Term Capital Gain Distributions:
Garcia Hamilton Quality Bond | $4,441,452 |
Short-Term Capital Gain Distributions:
Garcia Hamilton Quality Bond | $1,920,998 |
Shareholders will receive notification in January 2022 of the applicable tax information necessary to prepare their 2021 income tax returns.
36
Disclosure Regarding Approval of the Management and Investment
Advisory Agreements (Unaudited)
Renewal and Approval of Management Agreement and Investment Advisory Agreement
At meetings held on May 17, 2021 and June 8-9, 2021 (collectively, the “Meetings”) via videoconference, the Board of Trustees (“Board” or “Trustees”) considered and then, at its June 9, 2021 meeting, approved the renewal of: (1) the Management Agreement between American Beacon Advisors, Inc. (“Manager”) and the American Beacon Funds (“Trust”), on behalf of the American Beacon Garcia Hamilton Quality Bond Fund (“Fund”); and (2) the Investment Advisory Agreement among the Manager, the Trust, on behalf of the Fund, and Garcia Hamilton & Associates, LP (“subadvisor”). The Management Agreement and the Investment Advisory Agreement are referred to herein individually as an “Agreement” and collectively as the “Agreements.”
In preparation for its consideration of the renewal of the Agreements, the Board undertook steps to gather and consider information furnished by the Manager, the subadvisor, Broadridge, Inc. (“Broadridge”) and Morningstar, Inc. (“Morningstar”). The Board, with the assistance of independent legal counsel, requested and received certain relevant information from the Manager and the subadvisor.
In advance of the Meetings, the Board’s Investment Committee and/or the Manager coordinated the production of information from Broadridge and Morningstar regarding the performance, fees and expenses of the Fund as well as information from the Manager and the subadvisor. At the Meetings, the Board considered the information provided in connection with the renewal process, as well as information furnished to the Board throughout the year at regular meetings of the Board and its committees. In connection with the Board’s consideration of the Agreements, the Trustees received and evaluated such information as they deemed necessary, including the impact of the COVID-19 pandemic on the operations of the Manager and the subadvisor. This information is described below in the section summarizing the factors the Board considered in connection with its renewal and approval of the Agreements, as well as the section describing additional Board considerations with respect to the Fund.
The Board noted that the Manager provides management and administrative services to the Fund pursuant to the Management Agreement. The Board considered that many mutual funds have separate contracts governing each type of service and observed that, with respect to such mutual funds, the actual management fee rates provided by Broadridge for peer group funds reflect the combined advisory and administrative fees, reduced by any fee waivers and/or reimbursements.
A firm may not have been able to, or opted not to, provide information in response to certain information requests, in which case the Board conducted its evaluation of the firm based on information that was provided. In such cases, the Board determined that the omission of any such information was not material to its considerations.
Provided below is an overview of certain factors the Board considered in connection with its decision to approve the renewal of the Agreements. The Board did not identify any particular information that was most relevant to its consideration of whether to approve the renewal of each Agreement, and each Trustee may have afforded different weight to the various factors. Legal counsel to the independent Trustees provided the Board with a memorandum regarding its responsibilities pertaining to the renewal of investment advisory contracts, such as the Agreements, and related regulatory guidelines. Based on its evaluation, the Board unanimously concluded that the terms of each Agreement were reasonable and fair and that the approval of the renewal of each Agreement was in the best interests of the Fund and its shareholders.
Considerations With Respect to the Renewal of the Management Agreement and the Investment Advisory Agreement
In determining whether to approve the renewal of the Agreements, the Board considered the Fund’s investment management and subadvisory relationships separately. In each instance, the Board considered, among other things, the following factors: (1) the nature, extent and quality of the services provided; (2) the investment performance of the Fund and the subadvisor for the Fund; (3) the costs incurred by the Manager in rendering
37
Disclosure Regarding Approval of the Management and Investment
Advisory Agreements (Unaudited)
services to the Fund and its resulting profits or losses; (4) comparisons of services and fee rates with contracts entered into by the Manager or the subadvisor or their affiliates with other clients (such as pension funds and other institutional clients); (5) the extent to which economies of scale, if any, have been taken into account in setting each fee rate schedule; (6) whether fee rate levels reflect economies of scale, if any, for the benefit of Fund investors; and (7) any other benefits derived or anticipated to be derived by the Manager or the subadvisor from its relationships with the Fund.
Nature, Extent and Quality of Services. With respect to the renewal of the Management Agreement, the Board considered, among other factors: the Fund’s performance since its inception on April 4, 2016; the length of service of key investment personnel at the Manager; the cost structure of the Fund; the Manager’s culture of compliance and support that reduce risks to the Fund; the Manager’s quality of services; the Manager’s active role in monitoring and, as appropriate, recommending additional or replacement subadvisors; and the Manager’s efforts to retain key employees and maintain staffing levels.
With respect to the renewal of the Investment Advisory Agreement, the Board considered, among other factors: the level of staffing and the size of the subadvisor; the adequacy of the resources committed to the Fund by the subadvisor; the financial stability of the subadvisor; and representations made by the subadvisor regarding its compliance program. Based on the foregoing information, the Board concluded that the nature, extent and quality of the management and advisory services provided by the Manager and the subadvisor were appropriate for the Fund.
Investment Performance. The Board evaluated the comparative information provided by Broadridge and the Manager regarding the performance of the Fund relative to its Broadridge Performance Universe, Morningstar Category, and/or benchmark index, as well as the Fund’s Morningstar rating. The Board considered the information provided by Broadridge regarding its independent methodology for selecting the Fund’s Broadridge Performance Universe. In addition, the Board considered the performance reports and discussions with management at Board and Committee meetings throughout the year. The Board also evaluated the comparative information provided by the subadvisor regarding the performance of the Fund relative to the performance of a composite of comparable investment accounts managed by the subadvisor and the Fund’s benchmark index. In addition, the Board considered the Manager’s recommendation to continue to retain the subadvisor. A discussion regarding the Board’s considerations with respect to the Fund’s performance appears below under “Additional Considerations and Conclusions with Respect to the Fund.”
Costs of the Services Provided to the Fund and the Profits Realized by the Manager from its Relationship with the Fund. In analyzing the costs of services and profitability of the Manager, the Board considered the revenues earned and the expenses incurred by the Manager, before and after the payment of distribution-related expenses by the Manager. The profits or losses were noted at both an aggregate level for all funds within the group of mutual funds sponsored by the Manager (the “Fund Complex”) and at an individual Fund level, with the Manager earning a profit before the payment of distribution-related expenses and sustaining a loss after the payment of distribution-related expenses by the Manager for the Fund. The Board also considered comparative information provided by the Manager regarding the Manager’s overall profitability with respect to the Fund Complex relative to the overall profitability of other firms in the mutual fund industry, as disclosed in publicly available sources. Although the Board noted that, in certain cases, the fee rates paid by other clients of the Manager are lower than the fee rates paid by the Fund, the Manager represented that, among other matters, the difference is attributable to the fact that the Manager does not perform administrative services for non-investment company clients and reflects the greater level of responsibility and regulatory requirements associated with managing the Fund. The Board also noted that, for the Fund and its share classes, the Manager is waiving fees and/or reimbursing expenses.
The Board further considered that, with respect to the Fund, the Management Agreement provides for the Manager to receive a management fee comprised of an annualized fee that is retained by the Manager. The Board also noted that certain share classes of the Fund maintain higher expense ratios in order to compensate third-party financial intermediaries.
38
Disclosure Regarding Approval of the Management and Investment
Advisory Agreements (Unaudited)
In analyzing the fee rates charged by the subadvisor in connection with its investment advisory services to the Fund, the Board considered representations made by the subadvisor that the Fund’s subadvisory fee rate schedule generally was favorable compared to other comparable client accounts. The Board did not request profitability data from the subadvisor because the Board did not view this data as imperative to its deliberations given the arm’s-length nature of the relationship between the Manager and the subadvisor with respect to the negotiation of subadvisory fee rates. In addition, the Board noted that the subadvisor may not account for its profits on an account-by-account basis and that different firms likely employ different methodologies in connection with these calculations.
Based on the foregoing information, the Board concluded that the profitability levels of the Manager were reasonable in light of the services performed by the Manager. A discussion regarding the Board’s considerations with respect to the Fund’s fee rates is set forth below under “Additional Considerations and Conclusions with Respect to the Fund.”
Economies of Scale. In considering the reasonableness of the management and investment advisory fees rates, the Board considered whether economies of scale will be realized as the Fund grows and whether fee rate levels reflect these economies of scale for the benefit of Fund shareholders. In this regard, the Board considered that the Manager has negotiated breakpoints for the subadvisory fee rate. In this regard, the Board considered that the Fund’s current assets did not exceed the threshold necessary to reach the first subadvisory fee rate breakpoint.
In addition, the Board noted the Manager’s representation that the Management Agreement contains fee schedule breakpoints at higher asset levels with respect to the Fund. In this regard, the Board considered that the Fund’s current assets did not exceed the threshold necessary to reach the first management fee breakpoint. Based on the foregoing information, the Board concluded that the Manager and subadvisor fee rate schedules for the Fund provide for a reasonable sharing of benefits from any economies of scale with the Fund.
Benefits Derived from the Relationship with the Fund. The Board considered the “fall-out” or ancillary benefits that accrue to the Manager and/or the subadvisor as a result of the advisory relationships with the Fund, including greater exposure in the marketplace with respect to the Manager’s or the subadvisor’s investment process and expanding the level of assets under management by the Manager and the subadvisor. The Board also considered that the Manager may invest the Fund’s cash balances and cash collateral provided by the borrowers of the Fund’s securities in the American Beacon U.S. Government Money Market Select Fund, which the Manager manages directly, and for which the Manager receives a fee. Based on the foregoing information, the Board concluded that the potential benefits accruing to the Manager and the subadvisor by virtue of their relationships with the Fund appear to be fair and reasonable.
Additional Considerations and Conclusions with Respect to the Fund
The performance comparisons below were made for the Fund’s R5 Class shares relative to the Fund’s Broadridge Performance Universe and Morningstar Category. With respect to the Broadridge Performance Universe, the 1st Quintile represents the top 20 percent of the universe based on performance and the 5th Quintile represents the bottom 20 percent of the universe based on performance. References to the Fund’s Broadridge Performance Universe are to the respective universe of mutual funds with comparable investment classifications and objectives as determined by Broadridge.
In reviewing the performance, the Board viewed longer-term performance over a full market cycle, typically five years or longer, if available, as the most important consideration because relative performance over shorter periods may be significantly impacted by market or economic events and not necessarily reflective of subadvisor skill.
The expense comparisons below were made for the Fund’s R5 Class shares relative to the Fund’s Broadridge Expense Universe and Broadridge Expense Group and Y Class shares relative to the Fund’s Morningstar Fee Level
39
Disclosure Regarding Approval of the Management and Investment
Advisory Agreements (Unaudited)
Universe. The 1st Quintile represents the lowest 20 percent of the universe or group based on lowest total expense, and the 5th Quintile represents the highest 20 percent of the universe or group based on highest total expense. References to the Fund’s Expense Group and Expense Universe are to the respective group or universe of comparable mutual funds as determined by Broadridge. A Broadridge Expense Group consists of the Fund and a representative sample of funds with similar operating structures and asset sizes, as selected by Broadridge. A Broadridge Expense Universe includes all funds with a comparable investment classifications/objectives and similar operating structures to that of the share class under review for the Fund, including funds in the Broadridge Expense Group. The Broadridge expense comparisons are based on the most recent audited financial information publicly available for a Fund as of December 31, 2020. References to the Fund’s Morningstar Fee Level ranking are to the institutional share class of comparable mutual funds as determined by Morningstar.
The Board considered the Fund’s Morningstar fee level category with the 1st Quintile representing the lowest 20 percent of the category constituents and the 5th Quintile representing the highest 20 percent of the category in terms of total expense.
In reviewing expenses, the Board considered the positive impact of the fee waiver and/or expense reimbursement and the Manager’s agreement to continue the fee waiver and/or expense reimbursement. The Board also considered that, in connection with the change in the name of the Fund’s Institutional Class shares, the share class used for the Fund’s Morningstar Fee Level comparisons had changed from the R5 Class shares to the Y Class shares, which may have resulted in a less favorable Morningstar Fee Level Ranking for the Fund than in prior years.
In considering the renewal of the Management Agreement and the Investment Advisory Agreement with Garcia Hamilton for the Fund, the Board considered the following additional factors:
Broadridge Total Expenses Excluding 12b-1 Fees and Morningstar Fee Level Ranking
Compared to Broadridge Expense Group | 2nd Quintile | |
Compared to Broadridge Expense Universe | 3rd Quintile | |
Morningstar Fee Level Ranking | 4th Quintile |
Broadridge and Morningstar Performance Analysis (three-year period ended December 31, 2020)
Compared to Broadridge Performance Universe | 5th Quintile | |
Compared to Morningstar Category | 5th Quintile |
The Board also considered: (1) information provided by the subadvisor regarding fee rates charged for managing assets in the same or a similar strategy as the subadvisor manages the Fund; (2) that the one-year and three-year periods of underperformance were due to the subadvisor’s duration-management strategy; (3) the potential for improved future relative performance in a rising interest rate environment; and (4) the Manager’s recommendation to continue to retain the subadvisor.
Based on these and other considerations, the Board: (1) concluded that the fees paid to the Manager and subadvisor under the Management and Investment Advisory Agreements are fair and reasonable; and (2) determined that the Fund and its shareholders would benefit from the Manager’s and subadvisor’s continued management of the Fund.
40
Trustees and Officers of the American Beacon FundsSM (Unaudited)
The Trustees and officers of the American Beacon Funds (the “Trust”) are listed below, together with their principal occupations during the past five years. The address of each person listed below is 220 Las Colinas Boulevard East, Suite 1200, Irving, Texas 75039. Each Trustee oversees thirty funds in the fund complex that includes the Trust, the American Beacon Select Funds, and the American Beacon Institutional Funds Trust. The Trust’s Statement of Additional Information contains additional information about the Trustees and is available without charge by calling 1-800-658-5811.
Name, Age | Position, Term of Office and Length of Time Served with the Trust | Principal Occupation(s) During Past 5 Years and Current Directorships | ||
| INTERESTED TRUSTEES | Term | |||
Lifetime of Trust until removal, resignation or retirement* | ||||
| Eugene J. Duffy (67)** | Trustee since 2008 | Managing Director, Global Investment Management Distribution, Mesirow Financial Administrative Corporation (2016-Present); Managing Director, Institutional Services, Intercontinental Real Estate Corporation (2014-2016); Trustee, American Beacon Select Funds (2008-Present); Trustee, American Beacon Institutional Funds Trust (2017-Present); Trustee, American Beacon Sound Point Enhanced Income Fund (2018–2021); Trustee, American Beacon Apollo Total Return Fund (2018–2021). | ||
| NON-INTERESTED TRUSTEES | Term | |||
Lifetime of Trust until removal, resignation or retirement* | ||||
| Gilbert G. Alvarado (51) | Trustee since 2015 | President, SJVIIF, LLC, Impact Investment Fund (2018-Present); Director, Kura MD, Inc. (local telehealth organization) (2015-2017); Senior Vice President & CFO, Sierra Health Foundation (health conversion private foundation) (2006-Present); Senior Vice President & CFO, Sierra Health Foundation: Center for Health Program Management (California public benefit corporation) (2012-Present); Director, Innovative North State (2012-2015); Director, Sacramento Regional Technology Alliance (2011-2016); Director, Valley Healthcare Staffing (2017–2018); Trustee, American Beacon Select Funds (2015-Present); Trustee, American Beacon Institutional Funds Trust (2017-Present); Trustee, American Beacon Sound Point Enhanced Income Fund (2018–2021); Trustee, American Beacon Apollo Total Return Fund (2018–2021). | ||
| Joseph B. Armes (59) | Trustee since 2015 | Director, Switchback Energy Acquisition (2019-2021); Chairman & CEO, CSW Industrials f/k/a Capital Southwest Corporation (investment company) (2015-Present); Chairman of the Board of Capital Southwest Corporation, predecessor to CSW Industrials, Inc. (2014-2017) (investment company); President & CEO, JBA Investment Partners (family investment vehicle) (2010-Present); Director and Chair of Audit Committee, RSP Permian (oil and gas producer) (2013-2018); Trustee, American Beacon Select Funds (2015-Present); Trustee, American Beacon Institutional Funds Trust (2017-Present); Trustee, American Beacon Sound Point Enhanced Income Fund (2018–2021); Trustee, American Beacon Apollo Total Return Fund (2018–2021). | ||
| Gerard J. Arpey (63) | Trustee since 2012 | Partner, Emerald Creek Group (private equity firm) (2011-Present); Director, S.C. Johnson & Son, Inc. (privately held company) (2008-present); Director, The Home Depot, Inc. (2015-Present); Trustee, American Beacon Select Funds (2012-Present); Trustee, American Beacon Institutional Funds Trust (2017-Present); Trustee, American Beacon Sound Point Enhanced Income Fund (2018–2021); Trustee, American Beacon Apollo Total Return Fund (2018–2021). | ||
41
Trustees and Officers of the American Beacon FundsSM (Unaudited)
Name, Age | Position, Term of Office and Length of Time Served with the Trust | Principal Occupation(s) During Past 5 Years and Current Directorships | ||
| NON-INTERESTED TRUSTEES (CONT.) | Term | |||
Lifetime of Trust until removal, resignation or retirement* | ||||
| Brenda A. Cline (60) | Trustee since 2004 Chair since 2019 Vice Chair 2018 | Chief Financial Officer, Treasurer and Secretary, Kimbell Art Foundation (1993-Present); Director, Tyler Technologies, Inc. (public sector software solutions company) (2014-Present); Director, Range Resources Corporation (oil and natural gas company) (2015-Present); Trustee, Cushing Closed-End and Open-End Funds (2017-Present); Trustee, American Beacon Select Funds (2004-Present); Trustee, American Beacon Institutional Funds Trust (2017-Present); Trustee, American Beacon Sound Point Enhanced Income Fund (2018–2021); Trustee, American Beacon Apollo Total Return Fund (2018–2021). | ||
| Claudia A. Holz (64) | Trustee since 2018 | Partner, KPMG LLP (1990-2017); Independent Director, Blue Owl Capital Inc. (2021-Present); Trustee, American Beacon Select Funds (2018-Present); Trustee, American Beacon Institutional Funds Trust (2018-Present); Trustee, American Beacon Sound Point Enhanced Income Fund (2018–2021); Trustee, American Beacon Apollo Total Return Fund (2018–2021). | ||
| Douglas A. Lindgren (59) | Trustee since 2018 | CEO North America, Carne Global Financial Services (2016-2017); Consultant, Carne Financial Services (2017-2019); Managing Director, IPS Investment Management and Global Head, Content Management, UBS Wealth Management (2010-2016); Trustee, American Beacon Select Funds (2018-Present); Trustee, American Beacon Institutional Funds Trust (2018-Present); Trustee, American Beacon Sound Point Enhanced Income Fund (2018–2021); Trustee, American Beacon Apollo Total Return Fund (2018–2021). | ||
| Barbara J. McKenna, CFA (58) | Trustee since 2012 | President/Managing Principal, Longfellow Investment Management Company (2005-Present); Trustee, American Beacon Select Funds (2012-Present); Trustee, American Beacon Institutional Funds Trust (2017-Present); Trustee, American Beacon Sound Point Enhanced Income Fund (2018–2021); Trustee, American Beacon Apollo Total Return Fund (2018–2021). | ||
42
Trustees and Officers of the American Beacon FundsSM (Unaudited)
Name, Age | Position, Term of Office and Length of Time Served with the Trust | Principal Occupation(s) During Past 5 Years and Current Directorships | ||
| OFFICERS | Term | |||
| One Year | ||||
| Gene L. Needles, Jr. (66) | President since 2009 | President (2009-2018), CEO and Director (2009–Present), and Chairman (2018-Present), American Beacon Advisors, Inc., President (2015-2018), Director and CEO (2015–Present), and Chairman (2018-Present), Resolute Investment Holdings, LLC; President (2015-2018), Director and CEO (2015-Present), and Chairman (2018-Present),Resolute Topco, Inc.; President (2015-2018); Director, and CEO (2015-Present), and Chairman (2018-Present), Resolute Acquisition, Inc.; President (2015-2018), Director and CEO (2015-Present), Chairman (2018-Present), Resolute Investment Managers, Inc.; Director, Chairman, President and CEO, Resolute Investment Distributors (2017-Present); Director, Chairman, President and CEO; Resolute Investment Services, Inc. (2017-Present); Manager, President and CEO, American Private Equity Management, LLC (2012-Present); Director, Chairman, President and CEO, Alpha Quant Advisors, LLC (2016-2020); Director, ARK Investment Management LLC (2016-2020); Director, Shapiro Capital Management LLC (2017-Present); Director, Chairman and CEO, Continuous Capital, LLC (2018-Present); Director, Green Harvest Asset Management (2019-Present); Director, National Investment Services of America, LLC (2019-Present); Director, RSW Investments Holdings LLC, (2019-Present); Manager, SSI Investment Management, LLC (2019-Present); President, American Beacon Cayman Managed Futures Strategy Fund, Ltd. (2014-Present); Director and President, American Beacon Cayman Transformational Innovation Company, LTD., (2017-2018); President, American Beacon Delaware Transformational Innovation Corporation (2017-2018); President American Beacon Cayman TargetRisk Company, Ltd. (2018-Present); Member, Investment Advisory Committee, Employees Retirement System of Texas (2017-Present); Trustee, American Beacon NextShares Trust (2015-2020); President, American Beacon Select Funds (2009-Present); President, American Beacon Institutional Funds Trust (2017-Present); President, American Beacon Sound Point Enhanced Income Fund (2018-2021); President, American Beacon Apollo Total Return Fund (2018-2021). | ||
| Rosemary K. Behan (62) | VP, Secretary and Chief Legal Officer since 2006 | Senior Vice President (2021-Present), Vice President(2006-2021), Secretary and General Counsel (2006-Present), American Beacon Advisors, Inc.; Secretary, Resolute Investment Holdings, LLC (2015-Present); Secretary, Resolute Topco, Inc. (2015-Present); Secretary, Resolute Acquisition, Inc. (2015–Present); Senior Vice President (2021-Present), Vice President(2015-2021), Secretary and General Counsel (2015-Present), Resolute Investment Managers, Inc.; Secretary, Resolute Investment Distributors, Inc. (2017-Present); Senior Vice President (2021-Present), Vice President(2017-2021), Secretary and General Counsel (2017-Present), Resolute Investment Services, Inc.; Secretary, American Private Equity Management, LLC (2008-Present); Secretary and General Counsel, Alpha Quant Advisors, LLC (2016-2020); Vice President and Secretary, Continuous Capital, LLC (2018-Present); Secretary, Green Harvest Asset Management (2019-2021); Secretary, American Beacon Delaware Transformational Innovation Corporation (2017-2018); Secretary, American Beacon Cayman Transformational Innovation Company, Ltd. (2017-2018); Secretary, American Beacon Cayman Managed Futures Strategy Fund, Ltd. (2014-Present); Secretary, American Beacon Cayman TargetRisk Company, Ltd (2018-Present); Chief Legal Officer, Vice President and Secretary, American Beacon Select Funds (2006-Present); Chief Legal Officer, Vice President and Secretary, American Beacon Institutional Funds Trust (2017-Present); Chief Legal Officer, Vice President and Secretary, American Beacon Sound Point Enhanced Income Fund (2018-2021); Chief Legal Officer, Vice President and Secretary American Beacon Apollo Total Return Fund (2018-2021). | ||
43
Trustees and Officers of the American Beacon FundsSM (Unaudited)
Name, Age | Position, Term of Office and Length of Time Served with the Trust | Principal Occupation(s) During Past 5 Years and Current Directorships | ||
| OFFICERS (CONT.) | Term | |||
| One Year | ||||
| Brian E. Brett (61) | VP since 2004 | Senior Vice President, Head of Distribution (2012-Present), American Beacon Advisors, Inc.; Senior Vice President, Resolute Investment Managers, Inc. (2017-Present); Senior Vice President, Resolute Investment Distributors, Inc. (2018-Present); Senior Vice President, Resolute Investment Services, Inc. (2018-Present); Vice President, American Beacon Select Funds (2004-Present); Vice President, American Beacon Institutional Funds Trust (2017-Present); Vice President American Beacon Sound Point Enhanced Income Fund (2018-2021); Vice President American Beacon Apollo Total Return Fund (2018-2021). | ||
| Paul B. Cavazos (52) | VP since 2016 | Chief Investment Officer and Senior Vice President, American Beacon Advisors, Inc. (2016-Present); Chief Investment Officer, DTE Energy (2007-2016); Vice President, American Private Equity Management, L.L.C. (2017–Present); Vice President, American Beacon Select Funds (2016-Present); Vice President, American Beacon Institutional Funds Trust (2017-Present); Vice President American Beacon Sound Point Enhanced Income Fund (2018-2021); Vice President American Beacon Apollo Total Return Fund (2018-2021). | ||
| Erica Duncan (51) | VP since 2011 | Vice President, American Beacon Advisors, Inc. (2011-Present); Vice President, Resolute Investment Managers (2018-Present); Vice President, Resolute Investment Services, Inc. (2018-Present); Vice President, American Beacon Select Funds (2011-Present); Vice President, American Beacon Institutional Funds Trust (2017-Present); Vice President American Beacon Sound Point Enhanced Income Fund (2018-2021); Vice President American Beacon Apollo Total Return Fund (2018-2021). | ||
| Melinda G. Heika (60) | VP since 2021 Principal Accounting Officer and Treasurer (2010-2021) | Senior Vice President (2021-Present), Treasurer and CFO (2010-Present), American Beacon Advisors, Inc.; Treasurer, Resolute Topco, Inc. (2015-Present); Treasurer, Resolute Investment Holdings, LLC. (2015-Present); Treasurer, Resolute Acquisition, Inc. (2015-Present); Senior Vice President (2021-Present), Treasurer and CFO, Resolute Investment Managers, Inc. (2017-Present); Treasurer, Resolute Investment Distributors, Inc. (2017); Senior Vice President (2021-Present); Treasurer and CFO, Resolute Investment Services, Inc. (2015-Present); Treasurer, American Private Equity Management, LLC (2012-Present); Treasurer and CFO, Alpha Quant Advisors, LLC (2016-2020); Treasurer and CFO, Continuous Capital, LLC (2018-Present); Treasurer, American Beacon Cayman Transformational Innovation, Ltd. (2017-2018); Treasurer, American Beacon Delaware Transformational Innovation Corporation (2017-2018); Director and Treasurer, American Beacon Cayman Managed Futures Strategy Fund, Ltd. (2014-Present); Treasurer, American Beacon Cayman TargetRisk Company, Ltd. (2018-Present); Vice President (2021-Present), Principal Accounting Officer (2017-2021) and Treasurer (2010-2021), American Beacon Select Funds; Vice President (2021–Present), Principal Accounting Officer and Treasurer (2017-2021), American Beacon Institutional Funds Trust; Vice President (2021), Principal Accounting Officer and Treasurer (2018-2021), American Beacon Sound Point Enhanced Income Fund; Vice President (2021), Principal Accounting Officer and Treasurer, American Beacon Apollo Total Return Fund (2018-2021). | ||
44
Trustees and Officers of the American Beacon FundsSM (Unaudited)
Name, Age | Position, Term of Office and Length of Time Served with the Trust | Principal Occupation(s) During Past 5 Years and Current Directorships | ||
| OFFICERS (CONT.) | Term | |||
| One Year | ||||
| Terri L. McKinney (57) | VP since 2010 | Senior Vice President (2021-Present), Vice President (2009-2021), American Beacon Advisors, Inc.; Senior Vice President (2021–Present); Vice President (2017-2021), Resolute Investment Managers, Inc.; Senior Vice President (2021-Present), Vice President (2018-Present), Resolute Investment Services, Inc; Vice President, Alpha Quant Advisors, LLC (2016-2020); Vice President, Continuous Capital, LLC (2018-Present); Vice President, American Beacon Select Funds (2010-Present); Vice President, American Beacon Institutional Funds Trust (2017-Present); Vice President, American Beacon Sound Point Enhanced Income Fund (2018-2021); Vice President, American Beacon Apollo Total Return Fund (2018-2021). | ||
| Jeffrey K. Ringdahl (46) | VP since 2010 | Director (2015-Present), President (2018-Present), Chief Operating Officer (2010-Present), Senior Vice President (2013-2018), American Beacon Advisors, Inc.; Director (2015-Present), President (2018-Present), Senior Vice President (2015-2018), Resolute Investment Holdings, LLC; Director (2015-Present), President (2018-Present), Senior Vice President (2015-2018), Resolute Topco, Inc.; Director (2015-Present), President (2018-Present), Senior Vice President (2015-2018), Resolute Acquisition, Inc.; Director (2015-Present), President & COO (2018-Present), Senior Vice President (2015-2018), Resolute Investment Managers, Inc.; Director and Executive Vice President (2017-Present), Resolute Investment Distributors, Inc.; Director (2017-Present), President & COO (2018-Present), Executive Vice President (2017-2018), Resolute Investment Services, Inc.; Senior Vice President (2017-Present), Vice President (2012-2017), Manager (2015-Present), American Private Equity Management, LLC; Trustee, American Beacon NextShares Trust (2015-2020); Director, Executive Vice President & COO, Alpha Quant Advisors, LLC (2016-2020); Director, Shapiro Capital Management, LLC (2017-Present); Director, Executive Vice President & COO, Continuous Capital, LLC (2018-Present); Director, RSW Investments Holdings LLC, (2019-Present); Manager, SSI Investment Management, LLC (2019-Present); Director, National Investment Services of America, LLC (2019-Present); Director and Vice President, American Beacon Cayman Transformational Innovation Company, Ltd., (2017-Present); Vice President, American Beacon Delaware Transformational Innovation Corporation (2017-2018); Director and Vice President, American Beacon Cayman Managed Futures Strategy Fund, Ltd. (2014-Present); Vice President, American Beacon Cayman TargetRisk Company, Ltd (2018-Present); Vice President, American Beacon Select Funds (2010-2018); Vice President, American Beacon Institutional Funds Trust (2017-Present); Vice President, American Beacon Sound Point Enhanced Income Fund (2018-2021); Vice President, American Beacon Apollo Total Return Fund (2018-2021). | ||
| Samuel J. Silver (58) | VP since 2011 | Vice President (2011-Present), Chief Fixed Income Officer (2016-Present), American Beacon Advisors, Inc. (2011-Present); Vice President, American Beacon Select Funds (2011-Present); Vice President, American Beacon Institutional Funds Trust (2017-Present); Vice President, American Beacon Sound Point Enhanced Income Fund (2018-2021); Vice President, American Beacon Apollo Total Return Fund (2018-2021). | ||
45
Trustees and Officers of the American Beacon FundsSM (Unaudited)
Name, Age | Position, Term of Office and Length of Time Served with the Trust | Principal Occupation(s) During Past 5 Years and Current Directorships | ||
| OFFICERS (CONT.) | Term | |||
| One Year | ||||
| Christina E. Sears (50) | Chief Compliance Officer since 2004 and Asst. Secretary since 1999 | Vice President, American Beacon Advisors, Inc. (2019-Present); Chief Compliance Officer, American Beacon Advisors, Inc. (2004-Present); Vice President, Resolute Investment Managers, Inc. (2017-Present); Vice President, Resolute Investment Distributors (2017-Present); Vice President, Resolute Investment Services, Inc. (2019-Present); Chief Compliance Officer, American Private Equity Management, LLC (2012-Present); Chief Compliance Officer, Green Harvest Asset Management, LLC (2019-Present); Chief Compliance Officer, RSW Investments Holdings, LLC (2019-Present); Chief Compliance Officer (2016-2019) and Vice President, Alpha Quant Advisors, LLC (2016-2020); Vice President, Continuous Capital, LLC (2018-Present); Chief Compliance Officer (2004-Present) and Assistant Secretary (1999-Present), American Beacon Select Funds; Chief Compliance Officer and Assistant Secretary, American Beacon Institutional Funds Trust (2017-Present); Chief Compliance Officer and Assistant Secretary, American Beacon Sound Point Enhanced Income Fund (2018-2021); Chief Compliance Officer and Assistant Secretary, American Beacon Apollo Total Return Fund (2018-2021). | ||
| Sonia L. Bates (64) | Principal Accounting Officer and Treasurer since 2021 Assistant Treasurer (2011-2021) | Assistant Treasurer, American Beacon Advisors, Inc. (2011-2018); Assistant Treasurer, American Private Equity Management, LLC (2012-Present); Assistant Treasurer, American Beacon Cayman Transformational Innovation Company, Ltd. (2017-Present); Assistant Treasurer, American Beacon Cayman TargetRisk Company, Ltd. (2018-Present); Principal Accounting Officer and Treasurer (2021-Present), Assistant Treasurer (2011-2021), American Beacon Select Funds; Principal Accounting Officer and Treasurer (2021-Present), Assistant Treasurer (2017-2021), American Beacon Institutional Funds Trust; Principal Accounting Officer and Treasurer (2021), Assistant Treasurer (2018-2021), American Beacon Sound Point Enhanced Income Fund; Principal Accounting Officer and Treasurer (2021), Assistant Treasurer (2018-2021), American Beacon Apollo Total Return Fund. | ||
| Shelley L. Dyson (51) | Assistant Treasurer since 2021 | Assistant Treasurer, American Beacon Select Funds (2021-Present); Assistant Treasurer, American Beacon Institutional Funds Trust (2021-Present); Assistant Treasurer, American Beacon Sound Point Enhanced Income Fund (2021); Assistant Treasurer, American Beacon Apollo Total Return Fund (2021). | ||
| Shelley D. Abrahams (46) | Assistant Secretary since 2008 | Assistant Secretary, American Beacon Select Funds (2008-Present); Assistant Secretary, American Beacon Institutional Funds Trust (2017-Present); Assistant Secretary, American Beacon Sound Point Enhanced Income Fund (2018-2021); Assistant Secretary, American Beacon Apollo Total Return Fund (2018-2021). | ||
| Rebecca L. Harris (54) | Assistant Secretary since 2010 | Senior Vice President (2021-Present), Vice President (2011-Present), American Beacon Advisors, Inc.; Senior Vice President (2021-Present), Vice President (2017-Present), Resolute Investment Managers, Inc.; Senior Vice President (2021-Present), Vice President (2015-Present), Resolute Investment Services; Vice President, Alpha Quant Advisors, LLC (2016-2020); Vice President, Continuous Capital, LLC (2018-Present); Assistant Secretary, American Beacon Select Funds (2010-Present); Assistant Secretary, American Beacon Institutional Funds Trust (2017-Present); Assistant Secretary, American Beacon Sound Point Enhanced Income Fund (2018-2021); Assistant Secretary, American Beacon Apollo Total Return Fund (2018-2021). | ||
46
Trustees and Officers of the American Beacon FundsSM (Unaudited)
Name, Age | Position, Term of Office and Length of Time Served with the Trust | Principal Occupation(s) During Past 5 Years and Current Directorships | ||
| OFFICERS (CONT.) | Term | |||
| One Year | ||||
| Teresa A. Oxford (63) | Assistant Secretary since 2015 | Assistant Secretary, American Beacon Advisors, Inc. (2015-Present); Assistant Secretary, Resolute Investment Distributors (2018-2021); Assistant Secretary, Resolute Investment Managers, Inc. (2017-Present); Assistant Secretary, Resolute Investment Services (2018-Present); Assistant Secretary, Alpha Quant Advisors, LLC (2016-2020); Assistant Secretary, Continuous Capital, LLC (2020-Present); Assistant Secretary, American Beacon Select Funds (2015-Present); Assistant Secretary, American Beacon Institutional Funds Trust (2017-Present); Assistant Secretary, American Beacon Sound Point Enhanced Income Fund (2018-2021); Assistant Secretary, American Beacon Apollo Total Return Fund (2018-2021). | ||
| Michael D. Jiang (36) | Assistant Secretary since 2021 | Assistant Secretary (2021-Present), Resolute Investment Distributors, Inc.; Associate General Counsel (2021-Present), Resolute Investment Services, Inc.; Vice President (2018-2021), The Northern Trust Company; Second Vice President (2015-2018), The Northern Trust Company. Assistant Secretary, American Beacon Select Funds (2021-Present); Assistant Secretary, American Beacon Institutional Funds Trust (2021-Present); Assistant Secretary, American Beacon Sound Point Enhanced Income Fund (2021); Assistant Secretary, American Beacon Apollo Total Return Fund (2021). | ||
* As of 11/12/2014, the Board adopted a retirement plan that requires Trustees to retire no later than the last day of the calendar year in which they reach the age of 75.
** Mr. Duffy is being deemed to be an “interested person” of the Trust, as defined by the Investment Company Act of 1940, as amended, by virtue of his position with Mesirow Financial, Inc., a broker-dealer.
47
American Beacon Garcia Hamilton Quality Bond FundSM
October 31, 2021 (Unaudited)
The American Beacon Funds recognize and respect the privacy of our shareholders. We are providing this notice to you so you will understand how shareholder information may be collected and used.
We may collect nonpublic personal information about you from one or more of the following sources:
| • | information we receive from you on applications or other forms; |
| • | information about your transactions with us or our service providers; and |
| • | information we receive from third parties. |
We do not disclose any nonpublic personal information about our customers or former customers to anyone, except as permitted by law.
We restrict access to your nonpublic personal information to those employees or service providers who need to know that information to provide products or services to you. To ensure the confidentiality of your nonpublic personal information, we maintain safeguards that comply with federal standards.
48

Shareholder reports are available online at www.americanbeaconfunds.com/reports. Please be advised that reports are no longer sent by mail. Instead, the reports are made available online, and you will be notified by mail each time a report is posted online. You will be provided with a website link to access the report. You may elect to receive all future reports in paper free of charge. You can request to continue receiving paper copies by calling 1-866-345-5954, or you may directly inform your financial intermediary. Detailed instructions are also included in your report notifications.
If you invest in the Fund through a financial institution, you may be able to receive the Fund’s regulatory mailings, such as the Prospectus, Annual Report and Semi-Annual Report, by e-mail. If you are interested in this option, please go to www.icsdelivery.com and search for your financial institution’s name or contact your financial institution directly.
To obtain more information about the Fund:
 |  | |
| By E-mail: | On the Internet: | |
| american_beacon.funds@ambeacon.com | Visit our website at www.americanbeaconfunds.com | |
By Telephone: Call (800) 658-5811 |
By Mail: American Beacon Funds P.O. Box 219643 Kansas City, MO 64121-9643 | |
| Availability of Quarterly Portfolio Schedules | Availability of Proxy Voting Policy and Records | |
| In addition to the Schedule of Investments provided in each semi-annual and annual report, the Fund files a complete schedule of its portfolio holdings with the Securities and Exchange Commission (“SEC”) on Form N-PORT as of the end of each fiscal quarter. The Fund’s Forms N-PORT are available on the SEC’s website at www.sec.gov. The Forms N-PORT may also be reviewed and copied at the SEC’s Public Reference Section, 100 F Street, NE, Washington, D.C. 20549-2736. Information regarding the operation of the SEC’s Public Reference Room may be obtained by calling (800)-SEC-0330. A complete schedule of the Fund’s portfolio holdings is also available at www.americanbeaconfunds.com approximately twenty days after the end of each month. | A description of the policies and procedures the Fund uses to determine how to vote proxies relating to portfolio securities is available in the Fund’s Statement of Additional Information, is available free of charge on the Fund’s website www.americanbeaconfunds.com and by calling 1-800-967-9009 or by accessing the SEC’s website at www.sec.gov. The Fund’s proxy voting record for the most recent year ended June 30 is filed annually with the SEC on Form N-PX. The Fund’s Forms N-PX are available on the SEC’s website at www.sec.gov. The Fund’s proxy voting record may also be obtained by calling 1-800-967-9009. | |


Fund Service Providers:
CUSTODIAN State Street Bank and Trust Company Boston, Massachusetts | TRANSFER AGENT DST Asset Manager Solutions, Inc. Quincy, Massachusetts | INDEPENDENT REGISTERED PUBLIC ACCOUNTING FIRM Ernst & Young LLP Dallas, Texas | DISTRIBUTOR Resolute Investment Distributors, Inc. Irving, Texas |
This report is prepared for shareholders of the American Beacon Funds and may be distributed to others only if preceded or accompanied by a current Prospectus or Summary Prospectus.
American Beacon Funds and American Beacon Garcia Hamilton Quality Bond Fund are service marks of American Beacon Advisors, Inc.
AR 10/21
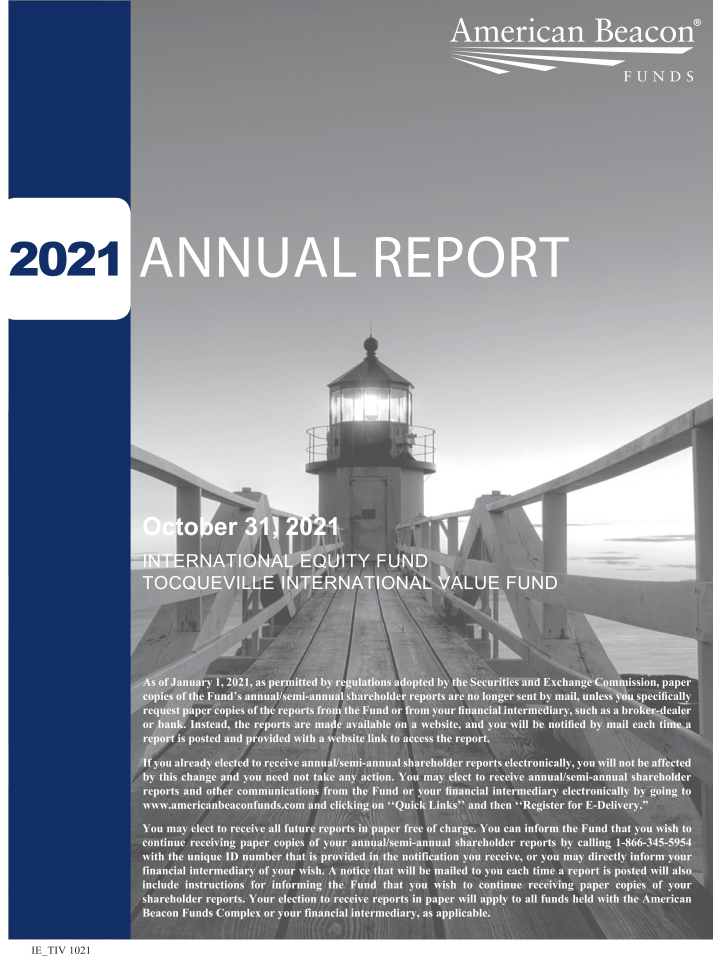
About American Beacon Advisors
Since 1986, American Beacon Advisors, Inc. has offered a variety of products and investment advisory services to numerous institutional and retail clients, including a variety of mutual funds, corporate cash management, and separate account management.
Our clients include defined benefit plans, defined contribution plans, foundations, endowments, corporations, financial planners, and other institutional investors. With American Beacon Advisors, you can put the experience of a multi-billion dollar asset management firm to work for your company.
INTERNATIONAL EQUITY FUND RISKS
Investing in foreign securities may involve heightened risk due to currency fluctuations and economic and political risks. Investing in value stocks may limit downside risk over time; however, the Fund may produce more modest gains than riskier stock funds as a trade-off for this potentially lower risk. The use of futures contracts for cash management may subject the Fund to losing more money than invested. The Fund participates in a securities lending program. Please see the prospectus for a complete discussion of the Fund’s risks. There can be no assurances that the investment objectives of this Fund will be met.
TOCQUEVILLE INTERNATIONAL VALUE FUND RISKS
Investing in foreign securities including emerging markets may involve heightened risk due to currency fluctuations and economic and political risks. Investing in value stocks may limit downside risk over time; however, the Fund may produce more modest gains than riskier stock funds as a trade-off for this potentially lower risk. The use of futures contracts for cash management may subject the Fund to losing more money than invested. The Fund participates in a securities lending program. Please see the prospectus for a complete discussion of the Fund’s risks. There can be no assurances that the investment objectives of this Fund will be met.
Any opinions herein, including forecasts, reflect our judgment as of the end of the reporting period and are subject to change. Each advisor’s strategies and each Fund’s portfolio composition will change depending on economic and market conditions. This report is not a complete analysis of market conditions, and, therefore, should not be relied upon as investment advice. Although economic and market information has been compiled from reliable sources, American Beacon Advisors, Inc. makes no representation as to the completeness or accuracy of the statements contained herein.
American Beacon Funds | October 31, 2021 |
| 1 | ||||
| 3 | ||||
| 9 | ||||
| 11 | ||||
| 12 | ||||
| 18 | ||||
| 22 | ||||
| 26 | ||||
| 52 | ||||
| 59 | ||||
| 62 | ||||
Disclosure Regarding Approval of the Management and Investment Advisory Agreements | 63 | |||
| 68 | ||||
| 75 | ||||
| Back Cover |
 | Dear Shareholders,
As Warren E. Buffett, the “Oracle of Omaha” and billionaire chairman and CEO of Berkshire Hathaway, once said, “Someone’s sitting in the shade today because someone planted a tree a long time ago.”
That is to say, before we can enjoy the fruits of our labor, we must first devote our attention to the careful planning and cultivation of our estates. To achieve a strong yield requires time, diligence and patience – and there are no guarantees the seeds we plant today will thrive or result in a plentiful harvest. This can be said not only about the actions we undertake in our gardening or landscaping, but also those we initiate in our investment portfolios – especially as we take into account the potential for harm caused by natural disasters and other catastrophes, such as the COVID-19 pandemic. |
Because none of us – not even the Oracle of Omaha – has a crystal ball, to help give your investment portfolio the greatest chance for success over the long term, we encourage you to work with financial professionals to develop your personal savings plan, conduct annual plan reviews, and make thoughtful, purposeful plan adjustments to help manage your evolving financial needs and goals. By investing in different investment styles and asset classes, you may be able to help mitigate financial risks across your portfolio. By allocating your portfolio according to your risk-tolerance level, you may be better positioned to withstand short-term crises. With continuous nurturing, you will be better positioned to achieve enduring financial success.
Since 1986, American Beacon has endeavored to provide investors with a disciplined approach to realizing long-term financial goals. As a manager of managers, we strive to provide investment products that may enable investors to participate during market upswings while potentially insulating against market downswings. The investment teams behind our mutual funds seek to produce consistent, long-term results rather than focus only on short-term movements in the markets. In managing our investment products, we emphasize identifying opportunities that offer the potential for long-term financial rewards.
Thank you for entrusting your financial success with American Beacon. For additional information about our investment products or to access your account information, please visit our website at www.americanbeaconfunds.com.
Best Regards,

Gene L. Needles, Jr.
President
American Beacon Funds
1
International Equity Market Overview
October 31, 2021 (Unaudited)
Over the 12 months ended October 31, 2021, international stocks made gains as evidenced by the MSCI ACWI ex-USA Index (up 29.66%), the MSCI EAFE Index (up 34.18%) and the MSCI Emerging Markets Index (up 16.96%).
During the summer of 2020, security prices slowly increased. In early November 2020, Pfizer and its German partner, BioNTech, announced their viable COVID-19 vaccine, which helped jump-start the markets and enabled Value factors to outperform Growth factors. By early spring of 2021, consumer demand moved from negative territory into positive.
The summer of 2021 started with optimism due to rising vaccination rates and reopening economies. However, by the end of summer, it became clear that problems were occurring as a result of the strong snap-back in consumer demand. Supply chains across many industries were having trouble keeping up – and the prices of many goods, including manufacturing inputs, were increasing and impacting profitability. The outperformance of Value versus Growth stocks that occurred in late 2020 also reversed, as Growth factors again led Value factors. Additionally, the COVID-19 delta variant spread beyond India to the developed world and Asia, which caused breakthrough infections in vaccinated people and renewed lockdowns. These developments, along with major central banks discussing how to normalize policy by tapering and potentially raising rates, made it clear that both companies and investors faced a more challenging environment going forward.
2
American Beacon International Equity FundSM
Performance Overview
October 31, 2021 (Unaudited)
The Investor Class of the American Beacon International Equity Fund (the “Fund”) returned 39.72% for the twelve months ended October 31, 2021. The Fund outperformed the MSCI EAFE Index (Net) (the “Index”) return of 34.18%.
Comparison of Changes in Value of a $10,000 Investment for the period 10/31/2011 through 10/31/2021
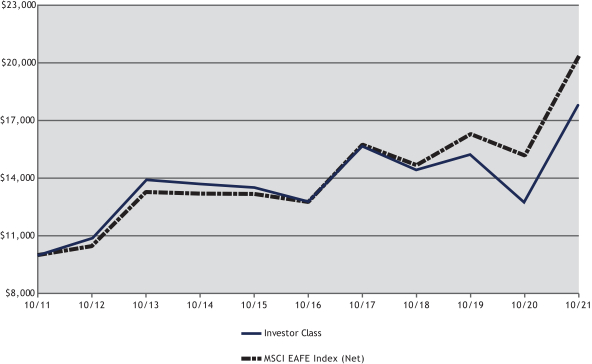
| Total Returns for the Period ended October 31, 2021 |
| |||||||||||||||||||||||||||||||
Ticker | 1 Year | 3 Years | 5 Years | 10 Years | Value of $10,000 | |||||||||||||||||||||||||||
R5 Class (1,6) | AAIEX | 40.18 | % | 7.63 | % | 7.22 | % | 6.30 | % | $ | 18,427 | |||||||||||||||||||||
Y Class (1,6) | ABEYX | 39.99 | % | 7.52 | % | 7.13 | % | 6.21 | % | $ | 18,270 | |||||||||||||||||||||
Investor Class (1,6) | AAIPX | 39.72 | % | 7.26 | % | 6.85 | % | 5.93 | % | $ | 17,797 | |||||||||||||||||||||
Advisor Class (1,6) | AAISX | 39.53 | % | 7.11 | % | 6.71 | % | 5.79 | % | $ | 17,559 | |||||||||||||||||||||
A Class without sales charge (1,2,6) | AIEAX | 39.65 | % | 7.19 | % | 6.79 | % | 5.85 | % | $ | 17,654 | |||||||||||||||||||||
A Class with sales Charge (1,2,6) | AIEAX | 31.60 | % | 5.09 | % | 5.53 | % | 5.22 | % | $ | 16,634 | |||||||||||||||||||||
C Class without sales charge (1,3,6) | AILCX | 38.56 | % | 6.39 | % | 6.00 | % | 5.07 | % | $ | 16,397 | |||||||||||||||||||||
C Class with sales charge (1,3,6) | AILCX | 37.56 | % | 6.39 | % | 6.00 | % | 5.07 | % | $ | 16,397 | |||||||||||||||||||||
R6 Class (1,4,6) | AAERX | 40.20 | % | 7.70 | % | 7.29 | % | 6.34 | % | $ | 18,485 | |||||||||||||||||||||
MSCI EAFE Index (Net) (5) | 34.18 | % | 11.54 | % | 9.79 | % | 7.37 | % | $ | 20,358 | ||||||||||||||||||||||
| 1. | Performance shown is historical and is not indicative of future returns. Investment returns and principal value will vary, and shares may be worth more or less at redemption than at original purchase. Performance shown is calculated based on the published end of day net asset values as of date indicated and current performance may be lower or higher than the performance data quoted. To obtain performance as of the most recent month end, please visit www.americanbeaconfunds.com or call 1-800-967-9009. Fund performance in the table above does not reflect the deduction of taxes a shareholder would pay on distributions or the redemption of shares. Generally accepted accounting principles require adjustments to be made to the net assets of the Fund at period end for financial reporting purposes only; and as such, the total return based on the unadjusted net asset value per share may differ from the total return reported in the financial highlights. A portion of the fees charged to the R5 Class of the Fund was waived from 2013 through 2015. Performance prior to waiving fees was lower than actual returns shown for 2013 through 2015. Please note that the recent performance of the securities market has helped produce short-term returns that are not typical and may not continue in the future. |
3
American Beacon International Equity FundSM
Performance Overview
October 31, 2021 (Unaudited)
| 2. | A portion of the fees charged to the A Class of the Fund was waived from 2010 through 2012 and fully recovered in 2013. Performance prior to waiving fees was lower than the actual returns shown for 2010 through 2012. The maximum sales charge for A Class is 5.75%. |
| 3. | A portion of the fees charged to the C Class of the Fund was waived from 2010 through 2012, partially recovered in 2013, and fully recovered in 2015. Performance prior to waiving fees was lower than the actual returns shown for 2010 through 2012. The maximum contingent deferred sales charge for C Class is 1.00% for shares redeemed within one year of the date of purchase. |
| 4. | Fund performance for the five-year and ten-year periods represents the returns achieved by the R5 Class from 10/31/11 through 2/28/17, the inception date of the R6 Class, and the returns of the R6 Class since its inception. Expenses of the R6 Class are lower than those of the R5 Class. As a result, total returns shown may be lower than they would have been had the R6 Class been in existence since 10/31/11. A portion of the fees charged to the R6 Class of the Fund has been waived since Class inception. Performance prior to waiving fees was lower than the actual returns shown since inception. |
| 5. | The MSCI EAFE Index (Net) is a market capitalization weighted index of international stock performance composed of equities from developed markets excluding the U.S. and Canada. One cannot directly invest in an index. The MSCI information contained herein: (1) is provided “as is,” (2) is proprietary to MSCI and/or its content providers, (3) may not be used to create any financial instruments or products or any indexes and (4) may not be copied or distributed without MSCI’s express written consent. MSCI disclaims all warranties with respect to the information. Neither MSCI nor its content providers are responsible for any damages or losses arising from any use of this information. |
| 6. | The Total Annual Fund Operating Expense ratios set forth in the most recent Fund prospectus for the R5, Y, Investor, Advisor, A, C, and R6 Class shares were 0.72%, 0.80%, 1.07%, 1.20%, 1.13%, 1.86%, and 0.80%, respectively. The expense ratios above may vary from the expense ratios presented in other sections of this report that are based on expenses incurred during the period covered by this report. |
The Fund outperformed the Index during the period primarily due to security selection while country allocation also boosted performance.
Security selections within United Kingdom and Germany were the primary contributors to the Fund’s relative outperformance, while security selections in Japan detracted from value. Contributing securities included Barclays PLC (up 106.5%) in the United Kingdom and Volkswagen AG Preferred (up 66.7%) within Germany. The Fund’s investments in Japan, including Takeda Pharmaceutical Co. Ltd. (down 5.5%) hurt relative performance during the prior twelve months.
From a country allocation perspective, an underweight allocation to Japan (up 20.2%) and an overweight allocation to France (up 48.1%) contributed to the Fund’s outperformance relative to the Index. However, an underweight allocation to Sweden (up 45.5%) detracted from relative value during the period.
Although economic and market conditions vary from period to period, the Fund’s primary strategy of investing in undervalued companies with above-average earnings growth expectations remains consistent.
| Top Ten Holdings (% Net Assets) | ||||||||
| Sanofi | 3.7 | |||||||
| Barclays PLC | 2.3 | |||||||
| Novartis AG | 2.2 | |||||||
| GlaxoSmithKline PLC | 1.9 | |||||||
| Takeda Pharmaceutical Co. Ltd. | 1.7 | |||||||
| Credit Suisse Group AG | 1.7 | |||||||
| AstraZeneca PLC, ADR | 1.6 | |||||||
| UniCredit SpA | 1.6 | |||||||
| Bayerische Motoren Werke AG | 1.5 | |||||||
| Rolls-Royce Holdings PLC | 1.5 | |||||||
| Total Fund Holdings | 138 | |||||||
4
American Beacon International Equity FundSM
Performance Overview
October 31, 2021 (Unaudited)
| Sector Allocation (% Equities) | ||||||||
| Financials | 21.9 | |||||||
| Health Care | 15.6 | |||||||
| Industrials | 15.6 | |||||||
| Consumer Discretionary | 14.0 | |||||||
| Information Technology | 7.4 | |||||||
| Communication Services | 6.2 | |||||||
| Consumer Staples | 5.6 | |||||||
| Energy | 4.8 | |||||||
| Materials | 4.6 | |||||||
| Utilities | 3.0 | |||||||
| Real Estate | 1.3 | |||||||
| Country Allocation (% Equities) | ||||||||
| United Kingdom | 20.0 | |||||||
| Japan | 17.2 | |||||||
| France | 15.0 | |||||||
| Germany | 10.9 | |||||||
| Switzerland | 6.7 | |||||||
| Spain | 4.5 | |||||||
| Netherlands | 4.2 | |||||||
| China/Hong Kong | 3.9 | |||||||
| Italy | 3.6 | |||||||
| Canada | 3.1 | |||||||
| Republic of Korea | 2.0 | |||||||
| United States | 1.7 | |||||||
| Denmark | 1.3 | |||||||
| Ireland | 1.2 | |||||||
| Sweden | 1.0 | |||||||
| Norway | 0.8 | |||||||
| Finland | 0.8 | |||||||
| Singapore | 0.6 | |||||||
| Israel | 0.6 | |||||||
| South Africa | 0.5 | |||||||
| Portugal | 0.4 |
5
American Beacon Tocqueville International Value FundSM
Performance Overview
October 31, 2021 (Unaudited)
The Investor Class of the American Beacon Tocqueville International Value Fund (the “Fund”) returned 26.01% for the twelve-month period ending October 31, 2021, which underperformed the MSCI EAFE Index (Net) (the “Index”) return of 34.18%.
Comparison of Changes in Value of a $10,000 Investment for the period 10/31/2011 through 10/31/2021
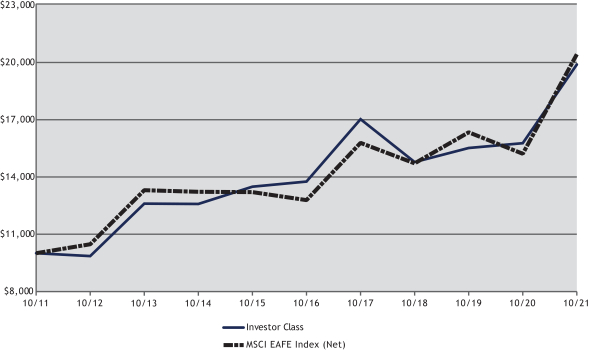
| Total Returns for the Period ended October 31, 2021 |
| |||||||||||||||||||||||||||||||
Ticker | 1 Year | 3 Years | 5 Years | 10 Years | Value of $10,000 | |||||||||||||||||||||||||||
R5 Class (1,3,5) | TOVIX | 26.38 | % | 10.70 | % | 7.80 | % | 7.17 | % | $ | 19,993 | |||||||||||||||||||||
Y Class (1,2,5) | TOVYX | 26.25 | % | 10.60 | % | 7.74 | % | 7.15 | % | $ | 19,941 | |||||||||||||||||||||
Investor Class (1,5) | TIVFX | 26.01 | % | 10.38 | % | 7.62 | % | 7.08 | % | $ | 19,824 | |||||||||||||||||||||
MSCI EAFE Index (Net) (4) | 34.18 | % | 11.54 | % | 9.79 | % | 7.37 | % | $ | 20,358 | ||||||||||||||||||||||
| 1. | Performance shown is historical and is not indicative of future returns. Investment returns and principal value will vary, and shares may be worth more or less at redemption than at original purchase. Performance shown is calculated based on the published end of day net asset values as of date indicated and current performance may be lower or higher than the performance data quoted. To obtain performance as of the most recent month end, please visit www.americanbeaconfunds.com or call 1-800-967-9009. Fund performance in the table above does not reflect the deduction of taxes a shareholder would pay on distributions or the redemption of shares. Generally accepted accounting principles require adjustments to be made to the net assets of the Fund at period end for financial reporting purposes only; and as such, the total return based on the unadjusted net asset value per share may differ from the total return reported in the financial highlights. A portion of fees charged to the Investor Class of the Fund was waived from Fund inception through 2019. Performance prior to waiving fees was lower than the actual returns shown for that period. Please note that the recent performance of the securities market has helped produce short-term returns that are not typical and may not continue in the future. |
| 2. | Fund performance for the three-year, five-year and ten-year periods represents the total returns achieved by the Investor Class from 10/31/11 up to 1/18/19, the inception date of the Y Class. Expenses of the Y Class are lower than those of the Investor Class. As a result, total returns shown may be lower than they would have been had the Y Class been in existence since 10/31/11. |
6
American Beacon Tocqueville International Value FundSM
Performance Overview
October 31, 2021 (Unaudited)
| 3. | Fund performance for the three-year, five-year and ten-year periods represents the total returns achieved by the Investor Class from 10/31/11 up to 1/18/19, the inception date of the R5 Class. Expenses of the R5 Class are lower than those of the Investor Class. As a result, total returns shown may be lower than they would have been had the R5 Class been in existence since 10/31/11. A portion of fees charged to the R5 Class has been waived since Class inception. Performance prior to waiving fees was lower than the actual returns shown since 2019. |
| 4. | The MSCI EAFE Index (Net) is a market capitalization weighted index of international stock performance composed of equities from developed markets excluding the U.S. and Canada. One cannot directly invest in an index. The MSCI information contained herein: (1) is provided “as is,” (2) is proprietary to MSCI and/or its content providers, (3) may not be used to create any financial instruments or products or any indexes and (4) may not be copied or distributed without MSCI’s express written consent. MSCI disclaims all warranties with respect to the information. Neither MSCI nor its content providers are responsible for any damages or losses arising from any use of this information. |
| 5. | The Total Annual Fund Operating Expense ratios set forth in the most recent Fund prospectus for the R5, Y and Investor Class shares were 0.91%, 0.99% and 1.18%, respectively. The expense ratios above may vary from the expense ratios presented in other sections of this report that are based on expenses incurred during the period covered by this report. |
The Fund underperformed the Index over the twelve-month period ending October 31, 2021 due to both stock selection and country allocation.
Stock selections within the Netherlands, France and Hong Kong detracted from performance during the year. Detracting securities include Unilever PLC (down 90.7%) within the Netherlands, Accor SA (down 44.9%) within France, and Tencent Holdings Ltd. (down 7.7%) in Hong Kong. Meanwhile, stock selections within the United Kingdom and Ireland added to the Fund’s relative performance, while stock selections in Netherlands, France and Hong Kong detracted value. Contributing securities within the United Kingdom include IMI PLC (up 69.3%) and BP PLC, Sponsored ADR (up 47.9%), as well as CRH PLC (up 44.5%) within Ireland all helped performance.
The Fund’s underweight allocation to the Netherlands (up 63.2%) and overweight allocation to China (down 9.2%) which is out of index detracted the most. On the flip side, the Fund’s overweight allocation to France (up 48.1%) and allocation to Canada (up 49.1%) which is out of index added the most relative value.
Although economic and market conditions vary from period to period, the Fund’s primary strategy of investing in undervalued companies with above-average earnings growth expectations remains consistent.
| Top Ten Holdings (% Net Assets) | ||||||||
| EssilorLuxottica SA | 3.3 | |||||||
| Infineon Technologies AG | 3.0 | |||||||
| Siemens AG, ADR | 2.9 | |||||||
| CRH PLC | 2.9 | |||||||
| Hitachi Ltd. | 2.9 | |||||||
| Bollore SA | 2.8 | |||||||
| Bureau Veritas SA | 2.8 | |||||||
| Sony Group Corp., ADR | 2.8 | |||||||
| Diageo PLC, ADR | 2.7 | |||||||
| Samsung Electronics Co. Ltd. | 2.7 | |||||||
| Total Fund Holdings | 53 | |||||||
7
American Beacon Tocqueville International Value FundSM
Performance Overview
October 31, 2021 (Unaudited)
| Sector Allocation (% Equities) | ||||||||
| Industrials | 23.9 | |||||||
| Consumer Discretionary | 13.1 | |||||||
| Information Technology | 12.7 | |||||||
| Health Care | 12.4 | |||||||
| Communication Services | 11.4 | |||||||
| Consumer Staples | 9.4 | |||||||
| Materials | 8.4 | |||||||
| Financials | 5.2 | |||||||
| Energy | 2.5 | |||||||
| Real Estate | 1.0 | |||||||
| Country Allocation (% Equities) | ||||||||
| Japan | 21.9 | |||||||
| Germany | 17.6 | |||||||
| France | 17.0 | |||||||
| United Kingdom | 11.9 | |||||||
| Switzerland | 7.1 | |||||||
| Canada | 3.8 | |||||||
| Mexico | 3.0 | |||||||
| Ireland | 2.9 | |||||||
| Republic of Korea | 2.7 | |||||||
| Belgium | 2.5 | |||||||
| Netherlands | 2.1 | |||||||
| China/Hong Kong | 1.8 | |||||||
| Australia | 1.7 | |||||||
| Spain | 1.2 | |||||||
| South Africa | 0.9 | |||||||
| Taiwan | 0.8 | |||||||
| United States | 0.6 | |||||||
| Austria | 0.5 |
8
American Beacon FundsSM
October 31, 2021 (Unaudited)
Fund Expense Example
As a shareholder of a Fund, you incur two types of costs: (1) transaction costs, including sales charges (loads) on purchase payments and redemption fees, if applicable, and (2) ongoing costs, including management fees, distribution (12b-1) fees, sub-transfer agent fees, and other Fund expenses. The Examples are intended to help you understand the ongoing cost (in dollars) of investing in the Fund and to compare these costs with the ongoing costs of investing in other mutual funds. The Examples are based on an investment of $1,000 invested at the beginning of the period in each Class and held for the entire period from May 1, 2021 through October 31, 2021.
Actual Expenses
The “Actual” lines of the tables provide information about actual account values and actual expenses. You may use the information on this page, together with the amount you invested, to estimate the expenses that you paid over the period. Simply divide your account value by $1,000 (for example, an $8,600 account value divided by $1,000 = $8.60), then multiply the result by the “Expenses Paid During Period” to estimate the expenses you paid on your account during this period. Shareholders of the Investor and R5 Classes that invest in the Fund through an IRA or Roth IRA may be subject to a custodial IRA fee of $15 that is typically deducted each December. If your account was subject to a custodial IRA fee during the period, your costs would have been $15 higher.
Hypothetical Example for Comparison Purposes
The “Hypothetical” lines of the tables provide information about hypothetical account values and hypothetical expenses based on the Fund’s actual expense ratio and an assumed 5% per year rate of return before expenses (not the Fund’s actual return). You may compare the ongoing costs of investing in the Fund with other funds by contrasting this 5% hypothetical example and the 5% hypothetical examples that appear in the shareholder reports of the other funds. The hypothetical account values and expenses may not be used to estimate the actual ending account balance or expenses you paid for the period. Shareholders of the Investor and R5 Classes that invest in the Funds through an IRA or Roth IRA may be subject to a custodial IRA fee of $15 that is typically deducted each December. If your account was subject to a custodial IRA fee during the period, your costs would have been $15 higher.
You should also be aware that the expenses shown in the table highlight only your ongoing costs and do not reflect any transaction costs charged by the Fund, such as sales charges (loads) or redemption fees, as applicable. Similarly, the expense examples for other funds do not reflect any transaction costs charged by those funds, such as sales charges (loads), redemption fees or exchange fees. Therefore, the “Hypothetical” lines of the tables are useful in comparing ongoing costs only and will not help you determine the relative total costs of owning different funds. If you were subject to any transaction costs during the period, your costs would have been higher.
9
American Beacon FundsSM
Expense Examples
October 31, 2021 (Unaudited)
| American Beacon International Equity Fund |
| ||||||||||||||
| Beginning Account Value 5/1/2021 | Ending Account Value 10/31/2021 | Expenses Paid During Period 5/1/2021-10/31/2021* | |||||||||||||
| R5 Class | |||||||||||||||
| Actual | $1,000.00 | $1,022.70 | $3.77 | ||||||||||||
| Hypothetical** | $1,000.00 | $1,021.48 | $3.77 | ||||||||||||
| Y Class | |||||||||||||||
| Actual | $1,000.00 | $1,021.70 | $4.08 | ||||||||||||
| Hypothetical** | $1,000.00 | $1,021.17 | $4.08 | ||||||||||||
| Investor Class | |||||||||||||||
| Actual | $1,000.00 | $1,020.80 | $5.45 | ||||||||||||
| Hypothetical** | $1,000.00 | $1,019.81 | $5.45 | ||||||||||||
| Advisor Class | |||||||||||||||
| Actual | $1,000.00 | $1,019.70 | $6.16 | ||||||||||||
| Hypothetical** | $1,000.00 | $1,019.11 | $6.16 | ||||||||||||
| A Class | |||||||||||||||
| Actual | $1,000.00 | $1,020.90 | $5.86 | ||||||||||||
| Hypothetical** | $1,000.00 | $1,019.41 | $5.85 | ||||||||||||
| C Class | |||||||||||||||
| Actual | $1,000.00 | $1,016.30 | $9.55 | ||||||||||||
| Hypothetical** | $1,000.00 | $1,015.73 | $9.55 | ||||||||||||
| R6 Class | |||||||||||||||
| Actual | $1,000.00 | $1,023.10 | $3.57 | ||||||||||||
| Hypothetical** | $1,000.00 | $1,021.68 | $3.57 | ||||||||||||
| * | Expenses are equal to the Fund’s annualized expense ratios for the six-month period of 0.74%, 0.80%, 1.07%, 1.21%, 1.15%, 1.88%, and 0.70% for the R5, Y, Investor, Advisor, A, C, and R6 Classes, respectively, multiplied by the average account value over the period, multiplied by the number derived by dividing the number of days in the most recent fiscal half-year (184) by days in the year (365) to reflect the half-year period. |
| ** | 5% return before expenses. |
| American Beacon Tocqueville International Value Fund | |||||||||||||||
| Beginning Account Value 5/1/2021 | Ending Account Value 10/31/2021 | Expenses Paid During Period 5/1/2021-10/31/2021* | |||||||||||||
| R5 Class | |||||||||||||||
| Actual | $1,000.00 | $995.90 | $4.68 | ||||||||||||
| Hypothetical** | $1,000.00 | $1,020.52 | $4.74 | ||||||||||||
| Y Class | |||||||||||||||
| Actual | $1,000.00 | $995.40 | $5.03 | ||||||||||||
| Hypothetical** | $1,000.00 | $1,020.16 | $5.09 | ||||||||||||
| Investor Class | |||||||||||||||
| Actual | $1,000.00 | $994.40 | $6.13 | ||||||||||||
| Hypothetical** | $1,000.00 | $1,019.06 | $6.21 | ||||||||||||
| * | Expenses are equal to the Fund’s annualized expense ratios for the six-month period of 0.93%, 1.00%, and 1.22% for the R5, Y, and Investor Classes, respectively, multiplied by the average account value over the period, multiplied by the number derived by dividing the number of days in the most recent fiscal half-year (184) by days in the year (365) to reflect the half-year period. |
| ** | 5% return before expenses. |
10
American Beacon FundsSM
Report of Independent Registered Public Accounting Firm
To the Shareholders of American Beacon International Equity Fund and American Beacon Tocqueville International Value Fund and the Board of Trustees of American Beacon Funds
Opinion on the Financial Statements
We have audited the accompanying statements of assets and liabilities of American Beacon International Equity Fund and American Beacon Tocqueville International Value Fund (the “Funds”), (two of the funds constituting American Beacon Funds (the “Trust”)), including the schedules of investments, as of October 31, 2021, and the related statements of operations, changes in net assets, and the financial highlights for each of the periods indicated in the table below and the related notes (collectively referred to as the “financial statements”). In our opinion, the financial statements present fairly, in all material respects, the financial position of each of the Funds (two of the funds constituting American Beacon Funds) at October 31, 2021, and the results of their operations, changes in net assets and financial highlights for each of the periods indicated in the table below, in conformity with U.S. generally accepted accounting principles.
Individual fund constituting | Statement of | Statements of | Financial highlights | |||
| American Beacon International Equity Fund | For the year ended October 31, 2021 | For each of the two years in the period ended October 31, 2021 | For each of the five years in the period ended October 31, 2021 | |||
| American Beacon Tocqueville International Value Fund | For the year ended October 31, 2021 | For each of the two years in the period ended October 31, 2021 | For each of the three years in the period ended October 31, 2021 | |||
The financial highlights for the two years in the period ended October 31, 2018 of American Beacon Tocqueville International Value Fund were audited by other auditors whose report dated December 21, 2018, expressed an unqualified opinion on those financial statements and financial highlights.
Basis for Opinion
These financial statements are the responsibility of the Trust’s management. Our responsibility is to express an opinion on each of the Funds’ financial statements based on our audits. We are a public accounting firm registered with the Public Company Accounting Oversight Board (United States) (“PCAOB”) and are required to be independent with respect to the Trust in accordance with the U.S. federal securities laws and the applicable rules and regulations of the Securities and Exchange Commission and the PCAOB.
We conducted our audits in accordance with the standards of the PCAOB. Those standards require that we plan and perform the audit to obtain reasonable assurance about whether the financial statements are free of material misstatement, whether due to error or fraud. The Trust is not required to have, nor were we engaged to perform, an audit of the Trust’s internal control over financial reporting. As part of our audits we are required to obtain an understanding of internal control over financial reporting, but not for the purpose of expressing an opinion on the effectiveness of the Trust’s internal control over financial reporting. Accordingly, we express no such opinion.
Our audits included performing procedures to assess the risks of material misstatement of the financial statements, whether due to error or fraud, and performing procedures that respond to those risks. Such procedures included examining, on a test basis, evidence regarding the amounts and disclosures in the financial statements. Our procedures included confirmation of securities owned as of October 31, 2021, by correspondence with the custodian and brokers or by other appropriate auditing procedures where replies from brokers were not received. Our audits also included evaluating the accounting principles used and significant estimates made by management, as well as evaluating the overall presentation of the financial statements. We believe that our audits provide a reasonable basis for our opinion.

We have served as the auditor of one or more American Beacon investment companies since 1987.
Dallas, Texas
December 30, 2021
11
American Beacon International Equity FundSM
October 31, 2021
| Shares | Fair Value | ||||||||||||||
| Canada - 3.01% | |||||||||||||||
| Common Stocks - 3.01% | |||||||||||||||
| Air CanadaA B | 653,500 | $ | 11,717,166 | ||||||||||||
| CAE, Inc.B | 241,461 | 7,322,262 | |||||||||||||
| Cogeco Communications, Inc. | 61,739 | 5,302,390 | |||||||||||||
| Linamar Corp. | 142,695 | 7,848,456 | |||||||||||||
| Suncor Energy, Inc. | 497,391 | 13,081,834 | |||||||||||||
| Teck Resources Ltd., Class B | 667,456 | 18,622,022 | |||||||||||||
|
| ||||||||||||||
Total Common Stocks | 63,894,130 | ||||||||||||||
|
| ||||||||||||||
Total Canada (Cost $57,276,970) | 63,894,130 | ||||||||||||||
|
| ||||||||||||||
| China/Hong Kong - 3.76% | |||||||||||||||
| Common Stocks - 3.76% | |||||||||||||||
| Alibaba Group Holding Ltd.B | 672,300 | 14,084,557 | |||||||||||||
| ArcelorMittal SA | 177,698 | 6,023,908 | |||||||||||||
| Baidu, Inc., Class AB | 824,800 | 17,173,395 | |||||||||||||
| ESR Cayman Ltd.B C | 3,641,400 | 11,817,409 | |||||||||||||
| Sands China Ltd.B | 4,049,200 | 9,253,233 | |||||||||||||
| Tencent Holdings Ltd. | 347,300 | 21,470,510 | |||||||||||||
|
| ||||||||||||||
Total Common Stocks | 79,823,012 | ||||||||||||||
|
| ||||||||||||||
Total China/Hong Kong (Cost $93,201,112) | 79,823,012 | ||||||||||||||
|
| ||||||||||||||
| Denmark - 1.20% | |||||||||||||||
| Common Stocks - 1.20% | |||||||||||||||
| Carlsberg A/S, Class B | 69,789 | 11,512,202 | |||||||||||||
| Vestas Wind Systems A/S | 320,632 | 13,866,649 | |||||||||||||
|
| ||||||||||||||
Total Common Stocks | 25,378,851 | ||||||||||||||
|
| ||||||||||||||
Total Denmark (Cost $15,879,820) | 25,378,851 | ||||||||||||||
|
| ||||||||||||||
| Finland - 0.76% | |||||||||||||||
| Common Stocks - 0.76% | |||||||||||||||
| Nordea Bank Abp | 853,507 | 10,441,249 | |||||||||||||
| Sampo OYJ, Class A | 106,651 | 5,671,273 | |||||||||||||
|
| ||||||||||||||
Total Common Stocks | 16,112,522 | ||||||||||||||
|
| ||||||||||||||
Total Finland (Cost $13,050,394) | 16,112,522 | ||||||||||||||
|
| ||||||||||||||
| France - 14.35% | |||||||||||||||
| Common Stocks - 14.35% | |||||||||||||||
| Air Liquide SA | 87,049 | 14,514,674 | |||||||||||||
| Airbus SEB | 60,168 | 7,692,694 | |||||||||||||
| Alstom SA | 370,118 | 13,169,419 | |||||||||||||
| Atos SE | 178,961 | 9,305,413 | |||||||||||||
| AXA SA | 644,881 | 18,756,336 | |||||||||||||
| BNP Paribas SA | 432,951 | 28,978,446 | |||||||||||||
| Capgemini SE | 57,311 | 13,336,429 | |||||||||||||
| Danone SA | 177,379 | 11,554,573 | |||||||||||||
| Engie SA | 1,220,658 | 17,350,646 | |||||||||||||
| Pernod Ricard SA | 32,041 | 7,359,727 | |||||||||||||
| Publicis Groupe SA | 351,205 | 23,523,231 | |||||||||||||
| Sanofi | 793,979 | 79,328,878 | |||||||||||||
| Societe Generale SA | 400,415 | 13,347,136 | |||||||||||||
| TotalEnergies SE | 614,085 | 30,787,590 | |||||||||||||
| Valeo | 222,404 | 6,512,318 | |||||||||||||
| Vinci SA | 83,165 | 8,880,334 | |||||||||||||
|
| ||||||||||||||
Total Common Stocks | 304,397,844 | ||||||||||||||
|
| ||||||||||||||
Total France (Cost $264,204,299) | 304,397,844 | ||||||||||||||
|
| ||||||||||||||
See accompanying notes
12
American Beacon International Equity FundSM
Schedule of Investments
October 31, 2021
| Shares | Fair Value | ||||||||||||||
| Germany - 10.39% | |||||||||||||||
| Common Stocks - 9.27% | |||||||||||||||
| adidas AG | 19,350 | $ | 6,337,024 | ||||||||||||
| BASF SE | 232,393 | 16,731,290 | |||||||||||||
| Bayer AG | 143,275 | 8,061,012 | |||||||||||||
| Bayerische Motoren Werke AG | 311,665 | 31,431,237 | |||||||||||||
| Continental AGB | 72,492 | 8,507,451 | |||||||||||||
| Daimler AG | 277,216 | 27,476,383 | |||||||||||||
| Infineon Technologies AG | 269,580 | 12,588,473 | |||||||||||||
| Merck KGaA | 67,959 | 16,042,073 | |||||||||||||
| MTU Aero Engines AG | 55,506 | 12,342,124 | |||||||||||||
| ProSiebenSat.1 Media SE | 474,000 | 7,936,968 | |||||||||||||
| RWE AG | 377,251 | 14,509,117 | |||||||||||||
| SAP SE | 152,204 | 22,049,779 | |||||||||||||
| Siemens AG | 77,378 | 12,547,900 | |||||||||||||
|
| ||||||||||||||
Total Common Stocks | 196,560,831 | ||||||||||||||
|
| ||||||||||||||
| Preferred Stocks - 1.12% | |||||||||||||||
| Volkswagen AGD | 106,061 | 23,763,592 | |||||||||||||
|
| ||||||||||||||
Total Germany (Cost $169,280,419) | 220,324,423 | ||||||||||||||
|
| ||||||||||||||
| Ireland - 1.17% (Cost $16,534,246) | |||||||||||||||
| Common Stocks - 1.17% | |||||||||||||||
| Ryanair Holdings PLC, ADRB | 218,727 | 24,827,702 | |||||||||||||
|
| ||||||||||||||
| Israel - 0.54% (Cost $7,262,049) | |||||||||||||||
| Common Stocks - 0.54% | |||||||||||||||
| Bank Leumi Le-Israel BM | 1,193,580 | 11,380,002 | |||||||||||||
|
| ||||||||||||||
| Italy - 3.42% | |||||||||||||||
| Common Stocks - 3.42% | |||||||||||||||
| Enel SpA | 3,596,260 | 30,082,050 | |||||||||||||
| Eni SpA | 634,403 | 9,096,719 | |||||||||||||
| UniCredit SpA | 2,527,156 | 33,373,982 | |||||||||||||
|
| ||||||||||||||
Total Common Stocks | 72,552,751 | ||||||||||||||
|
| ||||||||||||||
Total Italy (Cost $68,921,477) | 72,552,751 | ||||||||||||||
|
| ||||||||||||||
| Japan - 16.48% | |||||||||||||||
| Common Stocks - 16.48% | |||||||||||||||
| Alfresa Holdings Corp. | 686,000 | 9,630,182 | |||||||||||||
| Asics Corp. | 229,000 | 5,690,090 | |||||||||||||
| Bandai Namco Holdings, Inc. | 92,700 | 7,065,452 | |||||||||||||
| Daiwa House Industry Co. Ltd. | 425,855 | 14,015,197 | |||||||||||||
| Digital Garage, Inc. | 141,600 | 6,584,602 | |||||||||||||
| Dowa Holdings Co. Ltd. | 124,500 | 5,183,176 | |||||||||||||
| FANUC Corp. | 109,000 | 21,336,170 | |||||||||||||
| Fujitsu Ltd. | 58,384 | 10,052,959 | |||||||||||||
| Haseko Corp. | 1,013,000 | 13,163,001 | |||||||||||||
| Hazama Ando Corp. | 501,200 | 3,386,041 | |||||||||||||
| Hitachi Ltd. | 286,300 | 16,463,349 | |||||||||||||
| Makita Corp. | 248,900 | 11,493,404 | |||||||||||||
| Matsumotokiyoshi Holdings Co. Ltd.A | 196,100 | 8,654,380 | |||||||||||||
| Mitsubishi UFJ Financial Group, Inc. | 5,255,100 | 28,701,906 | |||||||||||||
| Mizuho Financial Group, Inc. | 1,215,680 | 16,052,629 | |||||||||||||
| Murata Manufacturing Co. Ltd. | 167,500 | 12,716,627 | |||||||||||||
| Nexon Co. Ltd. | 331,259 | 5,612,293 | |||||||||||||
| Nippon Television Holdings, Inc. | 118,900 | 1,283,150 | |||||||||||||
See accompanying notes
13
American Beacon International Equity FundSM
Schedule of Investments
October 31, 2021
| Shares | Fair Value | ||||||||||||||
| Japan - 16.48% (continued) | |||||||||||||||
| Common Stocks - 16.48% (continued) | |||||||||||||||
| Nissan Motor Co. Ltd.A B | 4,230,600 | $ | 21,432,318 | ||||||||||||
| Ryohin Keikaku Co. Ltd. | 349,400 | 6,860,778 | |||||||||||||
| Sompo Holdings, Inc. | 113,600 | 4,931,720 | |||||||||||||
| Sumitomo Mitsui Financial Group, Inc. | 838,400 | 27,371,673 | |||||||||||||
| Sumitomo Rubber Industries Ltd. | 730,700 | 8,981,888 | |||||||||||||
| Suzuken Co. Ltd. | 273,700 | 7,588,436 | |||||||||||||
| Suzuki Motor Corp. | 195,200 | 8,691,731 | |||||||||||||
| Taisei Corp. | 385,300 | 12,068,620 | |||||||||||||
| Takeda Pharmaceutical Co. Ltd. | 1,283,000 | 36,055,705 | |||||||||||||
| Toho Holdings Co. Ltd. | 233,500 | 3,763,453 | |||||||||||||
| Yamaha Corp. | 231,400 | 14,577,337 | |||||||||||||
|
| ||||||||||||||
Total Common Stocks | 349,408,267 | ||||||||||||||
|
| ||||||||||||||
Total Japan (Cost $357,187,571) | 349,408,267 | ||||||||||||||
|
| ||||||||||||||
| Netherlands - 4.04% | |||||||||||||||
| Common Stocks - 4.04% | |||||||||||||||
| Aegon NV | 4,260,257 | 21,595,496 | |||||||||||||
| Akzo Nobel NV | 194,108 | 22,308,737 | |||||||||||||
| ING Groep NV | 382,881 | 5,807,048 | |||||||||||||
| JDE Peet’s NV | 151,469 | 4,410,722 | |||||||||||||
| Royal Dutch Shell PLC, Class A | 383,434 | 8,850,809 | |||||||||||||
| Universal Music Group NV | 288,731 | 8,382,709 | |||||||||||||
| Wolters Kluwer NV | 136,722 | 14,325,708 | |||||||||||||
|
| ||||||||||||||
Total Common Stocks | 85,681,229 | ||||||||||||||
|
| ||||||||||||||
Total Netherlands (Cost $68,719,398) | 85,681,229 | ||||||||||||||
|
| ||||||||||||||
| Norway - 0.77% | |||||||||||||||
| Common Stocks - 0.77% | |||||||||||||||
| Equinor ASA | 250,045 | 6,326,675 | |||||||||||||
| Telenor ASA | 638,123 | 10,072,764 | |||||||||||||
|
| ||||||||||||||
Total Common Stocks | 16,399,439 | ||||||||||||||
|
| ||||||||||||||
Total Norway (Cost $14,617,884) | 16,399,439 | ||||||||||||||
|
| ||||||||||||||
| Portugal - 0.35% (Cost $7,690,515) | |||||||||||||||
| Common Stocks - 0.35% | |||||||||||||||
| Galp Energia SGPS SA | 702,840 | 7,305,847 | |||||||||||||
|
| ||||||||||||||
| Republic of Korea - 1.95% | |||||||||||||||
| Common Stocks - 1.95% | |||||||||||||||
| Hana Financial Group, Inc. | 85,396 | 3,288,537 | |||||||||||||
| Osstem Implant Co. Ltd. | 43,066 | 4,551,496 | |||||||||||||
| Samsung Electronics Co. Ltd. | 327,258 | 19,547,823 | |||||||||||||
| SK Hynix, Inc. | 159,418 | 14,051,649 | |||||||||||||
|
| ||||||||||||||
Total Common Stocks | 41,439,505 | ||||||||||||||
|
| ||||||||||||||
Total Republic of Korea (Cost $34,882,522) | 41,439,505 | ||||||||||||||
|
| ||||||||||||||
| Singapore - 0.55% (Cost $7,119,417) | |||||||||||||||
| Common Stocks - 0.55% | |||||||||||||||
| DBS Group Holdings Ltd. | 502,510 | 11,749,455 | |||||||||||||
|
| ||||||||||||||
| South Africa - 0.45% (Cost $10,253,811) | |||||||||||||||
| Common Stocks - 0.45% | |||||||||||||||
| Anglo American PLC | 252,956 | 9,632,545 | |||||||||||||
|
| ||||||||||||||
See accompanying notes
14
American Beacon International Equity FundSM
Schedule of Investments
October 31, 2021
| Shares | Fair Value | ||||||||||||||
| Spain - 4.34% | |||||||||||||||
| Common Stocks - 4.34% | |||||||||||||||
| Aena SME SAB C | 73,647 | $ | 12,059,503 | ||||||||||||
| Amadeus IT Group SAB | 324,716 | 21,711,497 | |||||||||||||
| Banco Bilbao Vizcaya Argentaria SA | 1,892,446 | 13,261,639 | |||||||||||||
| Banco Santander SA | 2,853,058 | 10,806,338 | |||||||||||||
| CaixaBank SA | 4,119,333 | 11,833,442 | |||||||||||||
| Indra Sistemas SAB | 455,059 | 5,497,203 | |||||||||||||
| Industria de Diseno Textil SA | 316,318 | 11,423,330 | |||||||||||||
| Telefonica SA | 1,260,507 | 5,485,426 | |||||||||||||
|
| ||||||||||||||
Total Common Stocks | 92,078,378 | ||||||||||||||
|
| ||||||||||||||
Total Spain (Cost $75,527,079) | 92,078,378 | ||||||||||||||
|
| ||||||||||||||
| Sweden - 0.98% | |||||||||||||||
| Common Stocks - 0.98% | |||||||||||||||
| Sandvik AB | 540,718 | 13,694,244 | |||||||||||||
| Swedbank AB, Class AA | 323,314 | 7,011,411 | |||||||||||||
|
| ||||||||||||||
Total Common Stocks | 20,705,655 | ||||||||||||||
|
| ||||||||||||||
Total Sweden (Cost $17,994,204) | 20,705,655 | ||||||||||||||
|
| ||||||||||||||
| Switzerland - 6.45% | |||||||||||||||
| Common Stocks - 6.45% | |||||||||||||||
| ABB Ltd. | 419,274 | 13,870,478 | |||||||||||||
| Cie Financiere Richemont SA, Class A | 81,197 | 10,029,905 | |||||||||||||
| Credit Suisse Group AG | 3,426,755 | 35,674,780 | |||||||||||||
| Novartis AG | 558,197 | 46,114,046 | |||||||||||||
| Roche Holding AG | 40,843 | 15,793,430 | |||||||||||||
| Zurich Insurance Group AG | 34,415 | 15,256,715 | |||||||||||||
|
| ||||||||||||||
Total Common Stocks | 136,739,354 | ||||||||||||||
|
| ||||||||||||||
Total Switzerland (Cost $127,816,871) | 136,739,354 | ||||||||||||||
|
| ||||||||||||||
| United Kingdom - 19.16% | |||||||||||||||
| Common Stocks - 19.16% | |||||||||||||||
| 3i Group PLC | 501,341 | 9,358,548 | |||||||||||||
| AstraZeneca PLC | 126,739 | 15,773,429 | |||||||||||||
| AstraZeneca PLC, ADR | 555,962 | 34,680,910 | |||||||||||||
| BAE Systems PLC | 1,647,827 | 12,443,834 | |||||||||||||
| Balfour Beatty PLC | 475,883 | 1,654,226 | |||||||||||||
| Barclays PLC | 17,559,243 | 48,602,120 | |||||||||||||
| BP PLC | 4,672,921 | 22,395,743 | |||||||||||||
| British American Tobacco PLC | 338,438 | 11,794,613 | |||||||||||||
| BT Group PLCB | 1,139,675 | 2,166,427 | |||||||||||||
| Capita PLCB | 3,019,838 | 1,956,468 | |||||||||||||
| Compass Group PLCB | 503,875 | 10,688,467 | |||||||||||||
| GlaxoSmithKline PLC | 1,960,812 | 40,482,838 | |||||||||||||
| Imperial Brands PLC | 825,502 | 17,420,611 | |||||||||||||
| Prudential PLC | 1,154,239 | 23,607,639 | |||||||||||||
| RELX PLC | 1,002,467 | 31,062,296 | |||||||||||||
| Rolls-Royce Holdings PLCB | 17,387,162 | 31,371,609 | |||||||||||||
| Standard Chartered PLC | 1,085,814 | 7,354,172 | |||||||||||||
| Taylor Wimpey PLC | 8,604,690 | 18,199,738 | |||||||||||||
| Tesco PLCA | 3,694,321 | 13,645,781 | |||||||||||||
| Unilever PLC | 510,250 | 27,317,613 | |||||||||||||
| WH Smith PLCB | 360,789 | 7,712,501 | |||||||||||||
| WPP PLC | 1,158,424 | 16,741,423 | |||||||||||||
|
| ||||||||||||||
Total Common Stocks | 406,431,006 | ||||||||||||||
|
| ||||||||||||||
Total United Kingdom (Cost $366,576,559) | 406,431,006 | ||||||||||||||
|
| ||||||||||||||
| United States - 1.65% | |||||||||||||||
| Common Stocks - 1.65% | |||||||||||||||
| Aon PLC, Class A | 62,474 | 19,986,682 | |||||||||||||
| BRP, Inc.A | 64,896 | 5,706,192 | |||||||||||||
| Ferguson PLCA | 62,112 | 9,346,126 | |||||||||||||
|
| ||||||||||||||
Total Common Stocks | 35,039,000 | ||||||||||||||
|
| ||||||||||||||
Total United States (Cost $16,063,401) | 35,039,000 | ||||||||||||||
|
| ||||||||||||||
See accompanying notes
15
American Beacon International Equity FundSM
Schedule of Investments
October 31, 2021
| Shares | Fair Value | ||||||||||||||
| SHORT-TERM INVESTMENTS - 2.79% (Cost $59,062,485) | |||||||||||||||
| Investment Companies - 2.79% | |||||||||||||||
| American Beacon U.S. Government Money Market Select Fund, 0.01%E F | 59,062,485 | $ | 59,062,485 | ||||||||||||
|
| ||||||||||||||
| SECURITIES LENDING COLLATERAL - 0.36% (Cost $7,655,136) | |||||||||||||||
| Investment Companies - 0.36% | |||||||||||||||
| American Beacon U.S. Government Money Market Select Fund, 0.01%E F | 7,655,136 | 7,655,136 | |||||||||||||
|
| ||||||||||||||
TOTAL INVESTMENTS - 98.92% (Cost $1,876,777,639) | 2,098,018,538 | ||||||||||||||
OTHER ASSETS, NET OF LIABILITIES - 1.08% | 22,806,112 | ||||||||||||||
|
| ||||||||||||||
TOTAL NET ASSETS - 100.00% | $ | 2,120,824,650 | |||||||||||||
|
| ||||||||||||||
| Percentages are stated as a percent of net assets. | |||||||||||||||
A All or a portion of this security is on loan, collateralized by either cash and/or U.S. Treasuries, at October 31, 2021 (Note 9).
B Non-income producing security.
C Security exempt from registration under the Securities Act of 1933. These securities may be resold to qualified institutional buyers pursuant to Rule 144A. At the period end, the value of these securities amounted to $23,876,912 or 1.13% of net assets. The Fund has no right to demand registration of these securities.
D A type of Preferred Stock that has no maturity date.
E 7-day yield.
F The Fund is affiliated by having the same investment advisor.
ADR - American Depositary Receipt.
PLC - Public Limited Company.
| Long Futures Contracts Open on October 31, 2021: | ||||||||||||||
| Equity Futures Contracts | ||||||||||||||
| Description | Number of Contracts | Expiration Date | Notional Amount | Contract Value | Unrealized Appreciation (Depreciation) | |||||||||
| MSCI EAFE Index | 534 | December 2021 | $ 61,255,842 | $ | 62,467,320 | $ | 1,211,478 | |||||||
|
|
|
|
| ||||||||||
| $ 61,255,842 | $ | 62,467,320 | $ | 1,211,478 | ||||||||||
|
|
|
|
| ||||||||||
| Index Abbreviations: | ||
| MSCI EAFE | Morgan Stanley Capital International – Europe, Australasia, and Far East. | |
See accompanying notes
16
American Beacon International Equity FundSM
Schedule of Investments
October 31, 2021
The Fund’s investments are summarized by level based on the inputs used to determine their values. As of October 31, 2021, the investments were classified as described below:
International Equity Fund | Level 1 | Level 2 | Level 3 | Total | ||||||||||||||||||||||||
Assets | ||||||||||||||||||||||||||||
Foreign Common Stocks | ||||||||||||||||||||||||||||
Canada | $ | 63,894,130 | $ | - | $ | - | $ | 63,894,130 | ||||||||||||||||||||
China/Hong Kong | 79,823,012 | - | - | 79,823,012 | ||||||||||||||||||||||||
Denmark | 25,378,851 | - | - | 25,378,851 | ||||||||||||||||||||||||
Finland | 16,112,522 | - | - | 16,112,522 | ||||||||||||||||||||||||
France | 304,397,844 | - | - | 304,397,844 | ||||||||||||||||||||||||
Germany | 196,560,831 | - | - | 196,560,831 | ||||||||||||||||||||||||
Ireland | 24,827,702 | - | - | 24,827,702 | ||||||||||||||||||||||||
Israel | 11,380,002 | - | - | 11,380,002 | ||||||||||||||||||||||||
Italy | 72,552,751 | - | - | 72,552,751 | ||||||||||||||||||||||||
Japan | 349,408,267 | - | - | 349,408,267 | ||||||||||||||||||||||||
Netherlands | 85,681,229 | - | - | 85,681,229 | ||||||||||||||||||||||||
Norway | 16,399,439 | - | - | 16,399,439 | ||||||||||||||||||||||||
Portugal | 7,305,847 | - | - | 7,305,847 | ||||||||||||||||||||||||
Republic of Korea | 41,439,505 | - | - | 41,439,505 | ||||||||||||||||||||||||
Singapore | 11,749,455 | - | - | 11,749,455 | ||||||||||||||||||||||||
South Africa | 9,632,545 | - | - | 9,632,545 | ||||||||||||||||||||||||
Spain | 92,078,378 | - | - | 92,078,378 | ||||||||||||||||||||||||
Sweden | 20,705,655 | - | - | 20,705,655 | ||||||||||||||||||||||||
Switzerland | 136,739,354 | - | - | 136,739,354 | ||||||||||||||||||||||||
United Kingdom | 406,431,006 | - | - | 406,431,006 | ||||||||||||||||||||||||
Foreign Preferred Stocks | ||||||||||||||||||||||||||||
Germany | 23,763,592 | - | - | 23,763,592 | ||||||||||||||||||||||||
Common Stocks | ||||||||||||||||||||||||||||
United States | 35,039,000 | - | - | 35,039,000 | ||||||||||||||||||||||||
Short-Term Investments | 59,062,485 | - | - | 59,062,485 | ||||||||||||||||||||||||
Securities Lending Collateral | 7,655,136 | - | - | 7,655,136 | ||||||||||||||||||||||||
|
|
|
|
|
|
|
| |||||||||||||||||||||
Total Investments in Securities - Assets | $ | 2,098,018,538 | $ | - | $ | - | $ | 2,098,018,538 | ||||||||||||||||||||
|
|
|
|
|
|
|
| |||||||||||||||||||||
Financial Derivative Instruments - Assets |
| |||||||||||||||||||||||||||
Futures Contracts | $ | 1,211,478 | $ | - | $ | - | $ | 1,211,478 | ||||||||||||||||||||
|
|
|
|
|
|
|
| |||||||||||||||||||||
Total Financial Derivative Instruments - Assets | $ | 1,211,478 | $ | - | $ | - | $ | 1,211,478 | ||||||||||||||||||||
|
|
|
|
|
|
|
| |||||||||||||||||||||
U.S. GAAP requires transfers between all levels to/from level 3 be disclosed. During the year ended October 31, 2021, there were no transfers into or out of Level 3.
See accompanying notes
17
American Beacon Tocqueville International Value FundSM
Schedule of Investments
October 31, 2021
| Shares | Fair Value | ||||||||||||||
| Australia - 1.68% (Cost $4,665,269) | |||||||||||||||
| Common Stocks - 1.68% | |||||||||||||||
| BHP Group Ltd., ADRA | 110,800 | $ | 6,076,272 | ||||||||||||
|
| ||||||||||||||
| Austria - 0.52% (Cost $1,947,212) | |||||||||||||||
| Common Stocks - 0.52% | |||||||||||||||
| ams AGB | 95,100 | 1,878,942 | |||||||||||||
|
| ||||||||||||||
| Belgium - 2.47% (Cost $6,495,378) | |||||||||||||||
| Common Stocks - 2.47% | |||||||||||||||
| Groupe Bruxelles Lambert SA | 77,312 | 8,959,609 | |||||||||||||
|
| ||||||||||||||
| Canada - 3.79% | |||||||||||||||
| Common Stocks - 3.79% | |||||||||||||||
| Nutrien Ltd. | 100,000 | 6,991,000 | |||||||||||||
| Restaurant Brands International, Inc. | 119,000 | 6,740,160 | |||||||||||||
|
| ||||||||||||||
Total Common Stocks | 13,731,160 | ||||||||||||||
|
| ||||||||||||||
Total Canada (Cost $11,275,813) | 13,731,160 | ||||||||||||||
|
| ||||||||||||||
| China/Hong Kong - 1.81% | |||||||||||||||
| Common Stocks - 1.81% | |||||||||||||||
| Shangri-La Asia Ltd.B | 3,709,000 | 3,022,307 | |||||||||||||
| Swire Pacific Ltd., Class A | 560,000 | 3,523,167 | |||||||||||||
|
| ||||||||||||||
Total Common Stocks | 6,545,474 | ||||||||||||||
|
| ||||||||||||||
Total China/Hong Kong (Cost $7,809,486) | 6,545,474 | ||||||||||||||
|
| ||||||||||||||
| France - 16.86% | |||||||||||||||
| Common Stocks - 16.86% | |||||||||||||||
| Accor SAB | 171,300 | 6,120,884 | |||||||||||||
| Bollore SA | 1,772,000 | 10,262,643 | |||||||||||||
| Bureau Veritas SA | 317,798 | 10,088,102 | |||||||||||||
| EssilorLuxottica SA | 58,101 | 12,015,774 | |||||||||||||
| JCDecaux SAB | 105,741 | 2,757,657 | |||||||||||||
| Orpea SA | 60,000 | 6,256,271 | |||||||||||||
| Sanofi | 78,000 | 7,793,220 | |||||||||||||
| Vivendi SE | 445,400 | 5,733,215 | |||||||||||||
|
| ||||||||||||||
Total Common Stocks | 61,027,766 | ||||||||||||||
|
| ||||||||||||||
Total France (Cost $52,521,072) | 61,027,766 | ||||||||||||||
|
| ||||||||||||||
| Germany - 17.43% | |||||||||||||||
| Common Stocks - 15.37% | |||||||||||||||
| adidas AG | 27,750 | 9,087,980 | |||||||||||||
| Duerr AG | 129,500 | 5,853,348 | |||||||||||||
| GEA Group AG | 87,064 | 4,286,512 | |||||||||||||
| Infineon Technologies AG | 236,000 | 11,020,401 | |||||||||||||
| KION Group AG | 43,200 | 4,714,260 | |||||||||||||
| Siemens AG, ADR | 130,000 | 10,619,700 | |||||||||||||
| Software AG | 154,600 | 6,355,197 | |||||||||||||
| Stroeer SE & Co. KGaA | 43,707 | 3,703,503 | |||||||||||||
|
| ||||||||||||||
Total Common Stocks | 55,640,901 | ||||||||||||||
|
| ||||||||||||||
| Preferred Stocks - 2.06% | |||||||||||||||
| Henkel AG & Co. KGaAC | 83,200 | 7,442,346 | |||||||||||||
|
| ||||||||||||||
Total Germany (Cost $43,785,202) | 63,083,247 | ||||||||||||||
|
| ||||||||||||||
See accompanying notes
18
American Beacon Tocqueville International Value FundSM
Schedule of Investments
October 31, 2021
| Shares | Fair Value | ||||||||||||||
| Ireland - 2.87% (Cost $7,042,790) | |||||||||||||||
| Common Stocks - 2.87% | |||||||||||||||
| CRH PLC | 216,400 | $ | 10,376,569 | ||||||||||||
|
| ||||||||||||||
| Japan - 21.64% | |||||||||||||||
| Common Stocks - 21.64% | |||||||||||||||
| Amano Corp. | 314,103 | 7,741,306 | |||||||||||||
| Asahi Group Holdings Ltd. | 198,300 | 8,972,433 | |||||||||||||
| FANUC Corp. | 39,700 | 7,771,064 | |||||||||||||
| Hitachi Ltd. | 179,768 | 10,337,350 | |||||||||||||
| Hoya Corp. | 55,600 | 8,158,895 | |||||||||||||
| Makita Corp. | 156,500 | 7,226,668 | |||||||||||||
| Rohm Co. Ltd. | 64,700 | 5,892,397 | |||||||||||||
| Sony Group Corp., ADRA | 86,800 | 10,050,572 | |||||||||||||
| TBS Holdings, Inc. | 373,700 | 5,901,821 | |||||||||||||
| Toyota Industries Corp. | 74,200 | 6,288,853 | |||||||||||||
|
| ||||||||||||||
Total Common Stocks | 78,341,359 | ||||||||||||||
|
| ||||||||||||||
Total Japan (Cost $54,164,394) | 78,341,359 | ||||||||||||||
|
| ||||||||||||||
| Mexico - 2.91% | |||||||||||||||
| Common Stocks - 2.91% | |||||||||||||||
| Fomento Economico Mexicano SAB de CV, ADR | 69,500 | 5,712,205 | |||||||||||||
| Grupo Televisa SAB, ADR | 477,000 | 4,827,240 | |||||||||||||
|
| ||||||||||||||
Total Common Stocks | 10,539,445 | ||||||||||||||
|
| ||||||||||||||
Total Mexico (Cost $8,771,870) | 10,539,445 | ||||||||||||||
|
| ||||||||||||||
| Netherlands - 2.09% (Cost $7,726,737) | |||||||||||||||
| Common Stocks - 2.09% | |||||||||||||||
| Universal Music Group NV | 261,000 | 7,577,597 | |||||||||||||
|
| ||||||||||||||
| Republic of Korea - 2.70% (Cost $5,361,805) | |||||||||||||||
| Preferred Stocks - 2.70% | |||||||||||||||
| Samsung Electronics Co. Ltd.C | 178,800 | 9,792,649 | |||||||||||||
|
| ||||||||||||||
| South Africa - 0.86% (Cost $3,549,353) | |||||||||||||||
| Common Stocks - 0.86% | |||||||||||||||
| Impala Platinum Holdings Ltd. | 240,900 | 3,122,474 | |||||||||||||
|
| ||||||||||||||
| Spain - 1.20% (Cost $4,739,979) | |||||||||||||||
| Common Stocks - 1.20% | |||||||||||||||
| Applus Services SA | 478,300 | 4,329,322 | |||||||||||||
|
| ||||||||||||||
| Switzerland - 6.98% | |||||||||||||||
| Common Stocks - 6.98% | |||||||||||||||
| Alcon, Inc.A | 105,000 | 8,752,800 | |||||||||||||
| Novartis AG, ADR | 83,000 | 6,869,080 | |||||||||||||
| UBS Group AGA B | 531,860 | 9,653,259 | |||||||||||||
|
| ||||||||||||||
Total Common Stocks | 25,275,139 | ||||||||||||||
|
| ||||||||||||||
Total Switzerland (Cost $18,798,905) | 25,275,139 | ||||||||||||||
|
| ||||||||||||||
| Taiwan - 0.82% (Cost $1,158,352) | |||||||||||||||
| Common Stocks - 0.82% | |||||||||||||||
| Taiwan Semiconductor Manufacturing Co. Ltd., ADR | 26,100 | 2,967,570 | |||||||||||||
|
| ||||||||||||||
See accompanying notes
19
American Beacon Tocqueville International Value FundSM
Schedule of Investments
October 31, 2021
| Shares | Fair Value | ||||||||||||||
| United Kingdom - 11.80% | |||||||||||||||
| Common Stocks - 11.80% | |||||||||||||||
| BP PLC, ADR | 309,000 | $ | 8,896,110 | ||||||||||||
| Diageo PLC, ADR | 49,600 | 9,903,632 | |||||||||||||
| IMI PLC | 222,800 | 4,982,280 | |||||||||||||
| Johnson Matthey PLC | 97,800 | 3,657,963 | |||||||||||||
| Smith & Nephew PLC | 378,200 | 6,495,703 | |||||||||||||
| Smiths Group PLC | 380,400 | 7,056,688 | |||||||||||||
| Unilever PLC, ADR | 32,000 | 1,714,560 | |||||||||||||
|
| ||||||||||||||
Total Common Stocks | 42,706,936 | ||||||||||||||
|
| ||||||||||||||
Total United Kingdom (Cost $35,341,149) | 42,706,936 | ||||||||||||||
|
| ||||||||||||||
| United States - 0.53% (Cost $1,838,391) | |||||||||||||||
| Common Stocks - 0.53% | |||||||||||||||
| Clarivate PLCB | 82,000 | 1,922,900 | |||||||||||||
|
| ||||||||||||||
| SHORT-TERM INVESTMENTS - 0.72% (Cost $2,625,986) | |||||||||||||||
| Investment Companies - 0.72% | |||||||||||||||
| American Beacon U.S. Government Money Market Select Fund, 0.01%D E | 2,625,986 | 2,625,986 | |||||||||||||
|
| ||||||||||||||
| SECURITIES LENDING COLLATERAL - 1.67% (Cost $6,038,135) | |||||||||||||||
| Investment Companies - 1.67% | |||||||||||||||
| American Beacon U.S. Government Money Market Select Fund, 0.01%D E | 6,038,135 | 6,038,135 | |||||||||||||
|
| ||||||||||||||
TOTAL INVESTMENTS - 101.35% (Cost $285,657,278) | 366,918,551 | ||||||||||||||
LIABILITIES, NET OF OTHER ASSETS - (1.35%) | (4,893,967 | ) | |||||||||||||
|
| ||||||||||||||
TOTAL NET ASSETS - 100.00% | $ | 362,024,584 | |||||||||||||
|
| ||||||||||||||
| Percentages are stated as a percent of net assets. | |||||||||||||||
A All or a portion of this security is on loan, collateralized by either cash and/or U.S. Treasuries, at October 31, 2021 (Note 9).
B Non-income producing security.
C A type of Preferred Stock that has no maturity date.
D The Fund is affiliated by having the same investment advisor.
E 7-day yield.
ADR - American Depositary Receipt.
PLC - Public Limited Company.
See accompanying notes
20
American Beacon Tocqueville International Value FundSM
Schedule of Investments
October 31, 2021
The Fund’s investments are summarized by level based on the inputs used to determine their values. As of October 31, 2021, the investments were classified as described below:
Tocqueville International Value Fund | Level 1 | Level 2 | Level 3 | Total | ||||||||||||||||||||||||
Assets | ||||||||||||||||||||||||||||
Foreign Common Stocks | ||||||||||||||||||||||||||||
Australia | $ | 6,076,272 | $ | - | $ | - | $ | 6,076,272 | ||||||||||||||||||||
Austria | 1,878,942 | - | - | 1,878,942 | ||||||||||||||||||||||||
Belgium | 8,959,609 | - | - | 8,959,609 | ||||||||||||||||||||||||
Canada | 13,731,160 | - | - | 13,731,160 | ||||||||||||||||||||||||
China/Hong Kong | 6,545,474 | - | - | 6,545,474 | ||||||||||||||||||||||||
France | 61,027,766 | - | - | 61,027,766 | ||||||||||||||||||||||||
Germany | 55,640,901 | - | - | 55,640,901 | ||||||||||||||||||||||||
Ireland | 10,376,569 | - | - | 10,376,569 | ||||||||||||||||||||||||
Japan | 78,341,359 | - | - | 78,341,359 | ||||||||||||||||||||||||
Mexico | 10,539,445 | - | - | 10,539,445 | ||||||||||||||||||||||||
Netherlands | 7,577,597 | - | - | 7,577,597 | ||||||||||||||||||||||||
South Africa | 3,122,474 | - | - | 3,122,474 | ||||||||||||||||||||||||
Spain | 4,329,322 | - | - | 4,329,322 | ||||||||||||||||||||||||
Switzerland | 25,275,139 | - | - | 25,275,139 | ||||||||||||||||||||||||
Taiwan | 2,967,570 | - | - | 2,967,570 | ||||||||||||||||||||||||
United Kingdom | 42,706,936 | - | - | 42,706,936 | ||||||||||||||||||||||||
Foreign Preferred Stocks | ||||||||||||||||||||||||||||
Germany | 7,442,346 | - | - | 7,442,346 | ||||||||||||||||||||||||
Republic of Korea | 9,792,649 | - | - | 9,792,649 | ||||||||||||||||||||||||
Common Stocks | ||||||||||||||||||||||||||||
United States | 1,922,900 | - | - | 1,922,900 | ||||||||||||||||||||||||
Short-Term Investments | 2,625,986 | - | - | 2,625,986 | ||||||||||||||||||||||||
Securities Lending Collateral | 6,038,135 | - | - | 6,038,135 | ||||||||||||||||||||||||
|
|
|
|
|
|
|
| |||||||||||||||||||||
Total Investments in Securities - Assets | $ | 366,918,551 | $ | - | $ | - | $ | 366,918,551 | ||||||||||||||||||||
|
|
|
|
|
|
|
| |||||||||||||||||||||
U.S. GAAP requires transfers between all levels to/from level 3 be disclosed. During the year ended October 31, 2021, there were no transfers into or out of Level 3.
See accompanying notes
21
American Beacon FundsSM
Statements of Assets and Liabilities
October 31, 2021
| International Equity Fund | Tocqueville International Value Fund | |||||||||||
Assets: | ||||||||||||
Investments in unaffiliated securities, at fair value†§ | $ | 2,031,300,917 | $ | 358,254,430 | ||||||||
Investments in affiliated securities, at fair value‡ | 66,717,621 | 8,664,121 | ||||||||||
Foreign currency, at fair value¤ | 46,529 | – | ||||||||||
Cash | 2,859 | – | ||||||||||
Cash collateral held at broker for futures contracts | 5,130,000 | – | ||||||||||
Dividends and interest receivable | 6,349,454 | 570,023 | ||||||||||
Receivable for investments sold | 5,852,452 | 848,644 | ||||||||||
Receivable for fund shares sold | 23,753,630 | 145,819 | ||||||||||
Receivable for tax reclaims | 5,372,386 | 1,924,136 | ||||||||||
Receivable for expense reimbursement (Note 2) | 44,240 | – | ||||||||||
Receivable for variation margin on open futures contracts (Note 5) | 1,212,658 | – | ||||||||||
Prepaid expenses | 59,836 | 16,737 | ||||||||||
|
|
|
| |||||||||
Total assets | 2,145,842,582 | 370,423,910 | ||||||||||
|
|
|
| |||||||||
Liabilities: | ||||||||||||
Payable for investments purchased | 3,270,316 | 606,221 | ||||||||||
Payable for foreign currency, at fair value^ | - | 1,080,733 | ||||||||||
Payable for fund shares redeemed | 9,282,015 | 135,728 | ||||||||||
Payable for expense recoupment (Note 2) | - | 54,732 | ||||||||||
Cash due to broker for futures contracts | 1,727,954 | – | ||||||||||
Management and sub-advisory fees payable (Note 2) | 2,196,251 | 206,328 | ||||||||||
Service fees payable (Note 2) | 50,340 | 32,831 | ||||||||||
Transfer agent fees payable (Note 2) | 83,239 | 17,354 | ||||||||||
Payable upon return of securities loaned (Note 9)§ | 7,655,136 | 6,038,135 | ||||||||||
Custody and fund accounting fees payable | 461,887 | 91,694 | ||||||||||
Professional fees payable | 81,603 | 69,442 | ||||||||||
Trustee fees payable (Note 2) | 12,789 | 1,907 | ||||||||||
Payable for prospectus and shareholder reports | 151,584 | 36,498 | ||||||||||
Other liabilities | 44,818 | 27,723 | ||||||||||
|
|
|
| |||||||||
Total liabilities | 25,017,932 | 8,399,326 | ||||||||||
|
|
|
| |||||||||
Net assets | $ | 2,120,824,650 | $ | 362,024,584 | ||||||||
|
|
|
| |||||||||
Analysis of net assets: | ||||||||||||
Paid-in-capital | $ | 1,732,646,841 | $ | 283,374,642 | ||||||||
Total distributable earnings (deficits)A | 388,177,809 | 78,649,942 | ||||||||||
|
|
|
| |||||||||
Net assets | $ | 2,120,824,650 | $ | 362,024,584 | ||||||||
|
|
|
| |||||||||
See accompanying notes
22
American Beacon FundsSM
Statements of Assets and Liabilities
October 31, 2021
| International Equity Fund | Tocqueville International Value Fund | |||||||||||
Shares outstanding at no par value (unlimited shares authorized): | ||||||||||||
R5 Class | 65,481,650 | 1,069,136 | ||||||||||
|
|
|
| |||||||||
Y Class | 11,031,379 | 8,229,178 | ||||||||||
|
|
|
| |||||||||
Investor Class | 6,300,708 | 9,204,649 | ||||||||||
|
|
|
| |||||||||
Advisor Class | 906,329 | N/A | ||||||||||
|
|
|
| |||||||||
A Class | 499,498 | N/A | ||||||||||
|
|
|
| |||||||||
C Class | 223,996 | N/A | ||||||||||
|
|
|
| |||||||||
R6 Class | 19,548,253 | N/A | ||||||||||
|
|
|
| |||||||||
Net assets: | ||||||||||||
R5 Class | $ | 1,329,626,349 | $ | 20,907,091 | ||||||||
|
|
|
| |||||||||
Y Class | $ | 233,692,916 | $ | 160,793,226 | ||||||||
|
|
|
| |||||||||
Investor Class | $ | 126,691,864 | $ | 180,324,267 | ||||||||
|
|
|
| |||||||||
Advisor Class | $ | 18,745,607 | $ | N/A | ||||||||
|
|
|
| |||||||||
A Class | $ | 10,017,801 | $ | N/A | ||||||||
|
|
|
| |||||||||
C Class | $ | 4,317,179 | $ | N/A | ||||||||
|
|
|
| |||||||||
R6 Class | $ | 397,732,934 | $ | N/A | ||||||||
|
|
|
| |||||||||
Net asset value, offering and redemption price per share: | ||||||||||||
R5 Class | $ | 20.31 | $ | 19.56 | ||||||||
|
|
|
| |||||||||
Y Class | $ | 21.18 | $ | 19.54 | ||||||||
|
|
|
| |||||||||
Investor Class | $ | 20.11 | $ | 19.59 | ||||||||
|
|
|
| |||||||||
Advisor Class | $ | 20.68 | $ | N/A | ||||||||
|
|
|
| |||||||||
A Class | $ | 20.06 | $ | N/A | ||||||||
|
|
|
| |||||||||
A Class (offering price) | $ | 21.28 | $ | N/A | ||||||||
|
|
|
| |||||||||
C Class | $ | 19.27 | $ | N/A | ||||||||
|
|
|
| |||||||||
R6 Class | $ | 20.35 | $ | N/A | ||||||||
|
|
|
| |||||||||
† Cost of investments in unaffiliated securities | $ | 1,810,060,018 | $ | 276,993,157 | ||||||||
‡ Cost of investments in affiliated securities | $ | 66,717,621 | $ | 8,664,121 | ||||||||
§ Fair value of securities on loan | $ | 33,717,931 | $ | 16,345,020 | ||||||||
¤ Cost of foreign currency | $ | 46,660 | $ | – | ||||||||
^ Cost of payable for foreign currency | $ | - | $ | (1,085,146 | ) | |||||||
A The Fund’s investments in affiliated securities did not have unrealized appreciation (depreciation) at year end. |
| |||||||||||
See accompanying notes
23
American Beacon FundsSM
Statements of Operations
For the year ended October 31, 2021
| International Equity Fund | Tocqueville International Value Fund | |||||||||||
Investment income: | ||||||||||||
Dividend income from unaffiliated securities (net of foreign taxes)† | $ | 73,804,049 | A | $ | 14,877,639 | B | ||||||
Dividend income from affiliated securities (Note 2) | 6,626 | 406 | ||||||||||
Income derived from securities lending (Note 9) | 1,065,439 | 661,760 | ||||||||||
|
|
|
| |||||||||
Total investment income | 74,876,114 | 15,539,805 | ||||||||||
|
|
|
| |||||||||
Expenses: | ||||||||||||
Management and sub-advisory fees (Note 2) | 15,494,962 | 2,879,172 | ||||||||||
Transfer agent fees: | ||||||||||||
R5 Class (Note 2) | 382,282 | 11,032 | ||||||||||
Y Class (Note 2) | 748,510 | 148,391 | ||||||||||
Investor Class | 7,165 | 10,521 | ||||||||||
Advisor Class | 1,345 | - | ||||||||||
A Class | 3,558 | - | ||||||||||
C Class | 2,797 | - | ||||||||||
R6 Class | 24,468 | - | ||||||||||
Custody and fund accounting fees | 790,217 | 98,718 | ||||||||||
Professional fees | 252,945 | 118,315 | ||||||||||
Registration fees and expenses | 146,080 | 55,451 | ||||||||||
Service fees (Note 2): | ||||||||||||
Investor Class | 404,950 | 699,268 | ||||||||||
Advisor Class | 46,182 | - | ||||||||||
A Class | 16,348 | - | ||||||||||
C Class | 4,715 | - | ||||||||||
Distribution fees (Note 2): | ||||||||||||
Advisor Class | 47,633 | - | ||||||||||
A Class | 27,232 | - | ||||||||||
C Class | 44,431 | - | ||||||||||
Prospectus and shareholder report expenses | 336,576 | - | ||||||||||
Trustee fees (Note 2) | 169,786 | 25,186 | ||||||||||
Loan expense (Note 10) | 12,522 | 3,081 | ||||||||||
Other expenses | 343,999 | 61,521 | ||||||||||
|
|
|
| |||||||||
Total expenses | 19,308,703 | 4,110,656 | ||||||||||
|
|
|
| |||||||||
Net fees waived and expenses (reimbursed) (Note 2) | (54,858 | ) | (2,785 | ) | ||||||||
|
|
|
| |||||||||
Net expenses | 19,253,845 | 4,107,871 | ||||||||||
|
|
|
| |||||||||
Net investment income | 55,622,269 | 11,431,934 | ||||||||||
|
|
|
| |||||||||
Realized and unrealized gain (loss) from investments: | ||||||||||||
Net realized gain (loss) from: | ||||||||||||
Investments in unaffiliated securitiesC | 280,867,172 | 33,490,298 | ||||||||||
Commission recapture (Note 1) | 16,186 | - | ||||||||||
Foreign currency transactions | 44,158 | (256,002 | ) | |||||||||
Futures contracts | 20,510,579 | - | ||||||||||
Change in net unrealized appreciation (depreciation) of: | ||||||||||||
Investments in unaffiliated securitiesD | 443,808,489 | 41,854,115 | ||||||||||
Foreign currency transactions | (416,214 | ) | (45,853 | ) | ||||||||
Futures contracts | 3,210,757 | - | ||||||||||
|
|
|
| |||||||||
Net gain from investments | 748,041,127 | 75,042,558 | ||||||||||
|
|
|
| |||||||||
Net increase in net assets resulting from operations | $ | 803,663,396 | $ | 86,474,492 | ||||||||
|
|
|
| |||||||||
† Foreign taxes | $ | 9,193,131 | $ | 2,055,505 | ||||||||
A Includes significant dividends from one issuer of $7,780,139. | ||||||||||||
B Includes significant dividends from one issuer of $6,570,531. | ||||||||||||
C The Fund did not recognize net realized gains (losses) from the sale of investments in affiliated securities. |
| |||||||||||
D The Fund’s investments in affiliated securities did not have a change in unrealized appreciation (depreciation) at year end. |
| |||||||||||
See accompanying notes
24
American Beacon FundsSM
Statements of Changes in Net Assets
| International Equity Fund | Tocqueville International Value Fund | |||||||||||||||||||||||||||
| Year Ended October 31, 2021 | Year Ended October 31, 2020 | Year Ended October 31, 2021 | Year Ended October 31, 2020 | |||||||||||||||||||||||||
Increase (decrease) in net assets: | ||||||||||||||||||||||||||||
Operations: | ||||||||||||||||||||||||||||
Net investment income | $ | 55,622,269 | $ | 44,031,672 | $ | 11,431,934 | $ | 3,137,388 | ||||||||||||||||||||
Net realized gain (loss) from investments in unaffiliated securities, commission recapture, foreign currency transactions and futures contracts | 301,438,095 | (109,117,617 | ) | 33,234,296 | (41,543,654 | ) | ||||||||||||||||||||||
Change in net unrealized appreciation (depreciation) of investments in unaffiliated securities, foreign currency transactions and futures contracts | 446,603,032 | (334,130,907 | ) | 41,808,262 | 27,876,142 | |||||||||||||||||||||||
|
|
|
|
|
|
|
| |||||||||||||||||||||
Net increase (decrease) in net assets resulting from operations | 803,663,396 | (399,216,852 | ) | 86,474,492 | (10,530,124 | ) | ||||||||||||||||||||||
|
|
|
|
|
|
|
| |||||||||||||||||||||
Distributions to shareholders: |
| |||||||||||||||||||||||||||
Total retained earnings: | ||||||||||||||||||||||||||||
R5 Class | (19,243,533 | ) | (43,205,283 | ) | (153,791 | ) | (913,408 | ) | ||||||||||||||||||||
Y Class | (12,813,335 | ) | (24,303,477 | ) | (658,999 | ) | (5,529,636 | ) | ||||||||||||||||||||
Investor Class | (1,252,478 | ) | (5,738,579 | ) | (746,996 | ) | (5,612,764 | ) | ||||||||||||||||||||
Advisor Class | (149,763 | ) | (1,077,549 | ) | - | - | ||||||||||||||||||||||
A Class | (146,453 | ) | (369,593 | ) | - | - | ||||||||||||||||||||||
C Class | (25,086 | ) | (117,950 | ) | - | - | ||||||||||||||||||||||
R6 Class | (6,209,328 | ) | (6,125,156 | ) | - | - | ||||||||||||||||||||||
|
|
|
|
|
|
|
| |||||||||||||||||||||
Net distributions to shareholders | (39,839,976 | ) | (80,937,587 | ) | (1,559,786 | ) | (12,055,808 | ) | ||||||||||||||||||||
|
|
|
|
|
|
|
| |||||||||||||||||||||
Capital share transactions (Note 11): | ||||||||||||||||||||||||||||
Proceeds from sales of shares | 672,415,177 | 961,004,171 | 73,601,571 | 65,256,388 | ||||||||||||||||||||||||
Reinvestment of dividends and distributions | 38,609,524 | 76,255,966 | 1,341,676 | 9,872,145 | ||||||||||||||||||||||||
Cost of shares redeemed | (1,398,901,051 | ) | (1,375,328,666 | ) | (153,630,756 | ) | (318,581,846 | ) | ||||||||||||||||||||
|
|
|
|
|
|
|
| |||||||||||||||||||||
Net (decrease) in net assets from capital share transactions | (687,876,350 | ) | (338,068,529 | ) | (78,687,509 | ) | (243,453,313 | ) | ||||||||||||||||||||
|
|
|
|
|
|
|
| |||||||||||||||||||||
Net increase (decrease) in net assets | 75,947,070 | (818,222,968 | ) | 6,227,197 | (266,039,245 | ) | ||||||||||||||||||||||
|
|
|
|
|
|
|
| |||||||||||||||||||||
Net assets: | ||||||||||||||||||||||||||||
Beginning of year | 2,044,877,580 | 2,863,100,548 | 355,797,387 | 621,836,632 | ||||||||||||||||||||||||
|
|
|
|
|
|
|
| |||||||||||||||||||||
End of year | $ | 2,120,824,650 | $ | 2,044,877,580 | $ | 362,024,584 | $ | 355,797,387 | ||||||||||||||||||||
|
|
|
|
|
|
|
| |||||||||||||||||||||
See accompanying notes
25
American Beacon FundsSM
October 31, 2021
1. Organization and Significant Accounting Policies
American Beacon Funds (the “Trust”) is organized as a Massachusetts business trust. The Funds, each a series within the Trust, are registered under the Investment Company Act of 1940, as amended (the “Act”), as diversified, open-end management investment companies. As of October 31, 2021, the Trust consists of twenty-eight active series, two of which are presented in this filing: American Beacon International Equity Fund and American Beacon Tocqueville International Value Fund (collectively, the “Funds” and each individually a “Fund”). The remaining twenty-six active series are reported in separate filings.
American Beacon Advisors, Inc. (the “Manager”) is a Delaware corporation and a wholly-owned subsidiary of Resolute Investment Managers, Inc. (“RIM”) organized in 1986 to provide business management, advisory, administrative, and asset management consulting services to the Trust and other investors. The Manager is registered as an investment advisor under the Investment Advisers Act of 1940, as amended (the “Advisers Act”). RIM is, in turn, a wholly-owned subsidiary of Resolute Acquisition, Inc., which is a wholly-owned subsidiary of Resolute Topco, Inc., a wholly-owned subsidiary of Resolute Investment Holdings, LLC (“RIH”). RIH is owned primarily by Kelso Investment Associates VIII, L.P., KEP VI, LLC and Estancia Capital Partners L.P., investment funds affiliated with Kelso & Company, L.P. (“Kelso”) or Estancia Capital Management, LLC (“Estancia”), which are private equity firms.
Recently Adopted Accounting Pronouncements
In March 2020, the Financial Accounting Standards Board (“FASB”) issued Accounting Standards Update (“ASU”) 2020-04, which provides optional expedients and exceptions for contracts, hedging relationships and other transactions affected by the transitioning away from the London Interbank Offered Rate (“LIBOR”) and other reference rates that are expected to be discontinued. The amendments in this ASU are effective for all entities as of March 12, 2020 through December 31, 2022. At this time, management is evaluating the implications of these changes on the financial statements.
In October 2020, the U.S. Securities and Exchange Commission (“SEC”) adopted new regulations governing the use of derivatives by registered investment companies. Rule 18f-4 will impose limits on the amount of derivatives a fund could enter into, eliminate the asset segregation framework currently used by funds to comply with Section 18 of the Act, and require funds whose use of derivatives is more than a limited specified exposure to establish and maintain a derivatives risk management program and appoint a derivatives risk manager. While the new rule became effective February 19, 2021, funds will not be required to fully comply with the new rule until August 19, 2022. It is not currently clear what impact, if any, the new rule will have on the availability, liquidity or performance of derivatives. When fully implemented, the new rule may require changes in how a fund will use derivatives, may adversely affect a fund’s performance and may increase costs related to a fund’s use of derivatives.
Class Disclosure
Each Fund has multiple classes of shares designed to meet the needs of different groups of investors; however, not all of the Funds offer all classes. The following table sets forth the differences amongst the classes:
Class | Eligible Investors | Minimum Initial Investments | ||||
| R5 Class | Large institutional investors - sold directly or through intermediary channels. | $ | 250,000 | |||
| Y Class | Large institutional retirement plan investors - sold directly or through intermediary channels. | $ | 100,000 | |||
| Investor Class | All investors using intermediary organizations, such as broker-dealers or retirement plan sponsors. | $ | 2,500 | |||
26
American Beacon FundsSM
Notes to Financial Statements
October 31, 2021
Class | Eligible Investors | Minimum Initial Investments | ||||
| Advisor Class | All investors who invest through intermediary organizations, such as broker-dealers or third party administrators. | $ | 2,500 | |||
| A Class | All investors who invest through intermediary organizations, such as broker-dealers or third party administrator. Retail investors who invest directly through a financial intermediary such as a broker, bank, or registered investment advisor which may include a front-end sales charge and a contingent deferred sales charge (“CDSC”). | $ | 2,500 | |||
| C Class | Retail investors who invest directly through a financial intermediary such as a broker or through employee directed benefit plans with applicable sales charges which may include CDSC. | $ | 1,000 | |||
| R6 Class | Large institutional retirement plan investors - sold through retirement plan sponsors. | None | ||||
Each class offered by the Trust has equal rights as to assets and voting privileges. Income and non-class specific expenses are allocated daily to each class based on the relative net assets. Realized and unrealized capital gains and losses of each class are allocated daily based on the relative net assets of each class of the respective Fund. Class specific expenses, where applicable, currently include service, distribution, transfer agent fees, and sub-transfer agent fees that vary amongst the classes as described more fully in Note 2.
Significant Accounting Policies
The following is a summary of significant accounting policies, consistently followed by the Funds in preparation of the financial statements. The Funds are considered investment companies and accordingly, follow the investment company accounting and reporting guidance of the FASB Accounting Standards Codification Topic 946, Financial Services – Investment Companies, a part of Generally Accepted Accounting Principles (“U.S. GAAP”).
Security Transactions and Investment Income
Security transactions are recorded as of the trade date for financial reporting purposes. Securities purchased or sold on a when-issued or delayed-delivery basis may be settled beyond a standard settlement period for the security after the trade date.
Dividend income, net of foreign taxes, is recorded on the ex-dividend date, except certain dividends from foreign securities which are recorded as soon as the information is available to the Funds. Tax reclaim accruals are automatically generated on accounting and custody systems at the time of the income event based on the tax databases maintained by the Funds’ custodian. Reconciliations are performed between custody and accounting systems to help ensure reclaim accruals are in line. Estimated tax liabilities on certain foreign securities are recorded on an accrual basis and are reflected as components of interest income or net change in unrealized appreciation (depreciation) on investments on the Statements of Operations, as appropriate. Tax liabilities realized as a result of such security sales are reflected as a component of net realized gain (loss) on investments on the Statements of Operations. Interest income, net of foreign taxes, is earned from settlement date, recorded on the accrual basis, and adjusted, if necessary, for accretion of discounts and amortization of premiums. Realized gains (losses) from securities sold are determined based on specific lot identification.
Currency Translation
All assets and liabilities initially expressed in foreign currency values are converted into U.S. dollar values at the mean of the bid and ask prices of such currencies against U.S. dollars as last quoted by a recognized dealer. Income, expenses, and purchases and sales of investments are translated into U.S. dollars at the rate of the exchange prevailing on the respective dates of such transactions. The effect of changes in foreign currency exchange rates on investments is separately identified from the fluctuations arising from changes in market values of securities held and is reported with all other foreign currency gains and losses on the Funds’ Statements of Operations.
27
American Beacon FundsSM
Notes to Financial Statements
October 31, 2021
Distributions to Shareholders
The Funds distribute most or all of their net earnings and realized gains, if any, each taxable year in the form of dividends from net investment income and distributions of realized net capital gains and net gains from foreign currency transactions on an annual basis. The Funds do not have a fixed dividend rate and do not guarantee that they will pay any distributions in any particular period. Dividends to shareholders are determined in accordance with federal income tax regulations, which may differ in amount and character from net investment income and realized gains recognized for purposes of U.S. GAAP. To the extent necessary to fully distribute capital gains, the Funds may designate earnings and profits distributed to shareholders on the redemption of shares.
Commission Recapture
The Funds have established brokerage commission recapture arrangements with certain brokers or dealers. If the Funds’ investment advisor chooses to execute a transaction through a participating broker, the broker rebates a portion of the commission back to the Funds. Any collateral benefit received through participation in the commission recapture program is directed exclusively to the Funds. This amount is reported with the net realized gain (loss) in the Funds’ Statements of Operations, if applicable.
Allocation of Income, Trust Expenses, Gains, and Losses
Investment income, realized and unrealized gains and losses from investments of the Funds are allocated daily to each class of shares based upon the relative proportion of net assets of each class to the total net assets of the Funds. Expenses directly charged or attributable to a Fund will be paid from the assets of a Fund. Generally, expenses of the Trust will be allocated among and charged to the assets of the Funds on a basis that the Trust’s Board of Trustees (the “Board”) deems fair and equitable, which may be based on the relative net assets of the Funds or nature of the services performed and relative applicability to the Funds.
Use of Estimates
The preparation of financial statements in conformity with U.S. GAAP requires management to make estimates and assumptions that affect the amounts reported in the financial statements and accompanying notes. Actual results may differ from those estimated.
Other
Under the Trust’s organizational documents, its officers and trustees are indemnified against certain liabilities arising out of the performance of their duties to the Trust. In the normal course of business, the Trust enters into contracts that provide indemnification to the other party or parties against potential costs or liabilities. The Trust’s maximum exposure under these arrangements is dependent on claims that may be made in the future and, therefore, cannot be estimated. The Trust has had no prior claims or losses pursuant to any such agreement.
2. Transactions with Affiliates
Management and Investment Sub-Advisory Agreements
The Funds and the Manager are parties to a Management Agreement that obligates the Manager to provide the Funds with investment advisory and administrative services. As compensation for performing the duties under the Management Agreement, the Manager will receive an annualized management fee based on a percentage of each Fund’s average daily net assets that is calculated and accrued daily according to the following schedules:
International Equity Fund
First $15 billion | 0.35 | % | ||
Next $15 billion | 0.325 | % | ||
Over $30 billion | 0.30 | % |
28
American Beacon FundsSM
Notes to Financial Statements
October 31, 2021
Tocqueville International Value Fund
First $5 billion | 0.35 | % | ||
Next $5 billion | 0.325 | % | ||
Next $10 billion | 0.30 | % | ||
Over $20 billion | 0.275 | % |
The Trust, on behalf of the American Beacon International Equity Fund, and the Manager have entered into Investment Advisory Agreements with Causeway Capital Management LLC; Lazard Asset Management LLC; and American Century Investment Management Inc. (“Sub-Advisors”) pursuant to which the Fund has agreed to pay an annualized sub-advisory fee that is calculated and accrued daily based on the Fund’s average daily net assets.
The Trust, on behalf of the American Beacon Tocqueville International Value Fund, and the Manager have entered into an Investment Advisory Agreement with Tocqueville Asset Management LP (“Sub-Advisor”) pursuant to which the Fund has agreed to pay an annualized sub-advisory fee that is calculated and accrued daily according to the following schedule:
First $1 billion | 0.40 | % | ||
Next $1 billion | 0.35 | % | ||
Over $2 billion | 0.325 | % |
The Management and Sub-Advisory Fees paid by the Funds for the year ended October 31, 2021 were as follows:
International Equity Fund
| Effective Fee Rate | Amount of Fees Paid | |||||||||||
Management Fees | 0.35 | % | $ | 8,961,334 | ||||||||
Sub-Advisor Fees | 0.26 | % | 6,533,628 | |||||||||
|
|
|
| |||||||||
Total | 0.61 | % | $ | 15,494,962 | ||||||||
|
|
|
| |||||||||
Tocqueville International Value Fund
| Effective Fee Rate | Amount of Fees Paid | |||||||||||
Management Fees | 0.35 | % | $ | 1,382,514 | ||||||||
Sub-Advisor Fees | 0.40 | % | 1,496,658 | |||||||||
|
|
|
| |||||||||
Total | 0.75 | % | $ | 2,879,172 | ||||||||
|
|
|
| |||||||||
As compensation for services provided by the Manager in connection with securities lending activities conducted by the Funds, the lending Fund pays to the Manager, with respect to cash collateral posted by borrowers, a fee of 10% of the net monthly interest income (the gross interest income earned by the investment of cash collateral, less the amount paid to borrowers and related expenses) from such activities and, with respect to loan fees paid by borrowers, a fee of 10% of such loan fees. Securities lending income is generated from the demand premium (if any) paid by the borrower to borrow a specific security and from the return on investment of cash collateral, reduced by negotiated rebate fees paid to the borrower and transaction costs. To the extent that a loan is secured by non-cash collateral, securities lending income is generated as a demand premium reduced by transaction costs. These fees are included in “Income derived from securities lending” and “Management and investment advisory fees” on the Statements of Operations. During the year ended October 31, 2021, the Manager received securities lending fees of $113,627 and $72,989 for the securities lending activities of International Equity Fund and Tocqueville International Value Fund, respectively.
29
American Beacon FundsSM
Notes to Financial Statements
October 31, 2021
Distribution Plans
Separate Distribution Plans (the “Distribution Plans”) have been adopted pursuant to Rule 12b-1 under the Act for the Advisor, A, and C Classes of the Funds. Under the Distribution Plans, as compensation for distribution and shareholder servicing assistance, the Manager receives an annual fee of 0.25% of the average daily net assets of the Advisor and A Classes and 1.00% of the average daily net assets of the C Class. The fee will be payable without regard to whether the amount of the fee is more or less than the actual expenses incurred in a particular month by the Manager for distribution assistance.
Service Plans
The Investor, Advisor, A, and C Classes have each adopted a Service Plan (collectively, the “Plans”). The Plans authorize the payment to the Manager an annual fee up to 0.375% of the average daily net assets of the Investor Class, up to 0.25% of the average daily net assets of the Advisor Class, up to 0.25% of the average daily net assets of the A Class, and up to 0.25% of the average daily net assets of the C Class. In addition, the Funds may reimburse the Manager for certain non-distribution shareholder services provided by financial intermediaries attributable to Y Class and R5 Class. The Manager or other approved entities may spend such amounts on any activities or expenses primarily intended to result in or relate to the servicing of A Class, C Class, Y Class, R5 Class, and Investor Class including, but not limited to, payment of shareholder service fees and transfer agency or sub-transfer agency expenses. The fees will be payable monthly in arrears. The primary expenses expected to be incurred under the Plans are shareholder servicing, record keeping fees and servicing fees paid to financial intermediaries such as plan sponsors and broker-dealers.
Sub-Transfer Agent Fees
The Manager has entered into agreements, which include servicing agreements, with financial intermediaries that provide recordkeeping, processing, shareholder communications and other services to customers of the intermediaries that hold positions in the R5 and Y Classes of the Funds and has agreed to compensate the intermediaries for providing these services. Intermediaries transact with the Funds primarily through the use of omnibus accounts on behalf of their customers who hold positions in the Funds. Certain services would have been provided by the Funds’ transfer agent and other service providers if the shareholders’ accounts were maintained directly by the Funds’ transfer agent. Accordingly, the Funds, pursuant to Board approval, have agreed to reimburse the Manager for certain non-distribution shareholder services provided by financial intermediaries for the R5 and Y Classes. The reimbursement amounts (sub-transfer agent fees) paid to the Manager are subject to a fee limit of up to 0.10% of an intermediary’s average net assets in the R5 and Y Classes on an annual basis. During the year ended October 31, 2021, the sub-transfer agent fees, as reflected in “Transfer agent fees” on the Statements of Operations, were as follows:
Fund | Sub-Transfer Agent Fees | |||
International Equity | $ | 1,053,642 | ||
Tocqueville International Value | 147,671 | |||
As of October 31, 2021, the Funds owed the Manager the following reimbursement of sub-transfer agent fees, as reflected in “Transfer agent fees payable” on the Statements of Assets and Liabilities:
Fund | Reimbursement Sub-Transfer Agent Fees | |||
International Equity | $ | 67,032 | ||
Tocqueville International Value | 14,043 | |||
Investments in Affiliated Funds
The Funds may invest in the American Beacon U.S. Government Money Market Select Fund (the “USG Select Fund”). Cash collateral received by the Funds in connection with securities lending may also be invested in the USG
30
American Beacon FundsSM
Notes to Financial Statements
October 31, 2021
Select Fund. The Funds listed below held the following shares with an October 31, 2021 fair value and dividend income earned from the investment in the USG Select Fund.
Affiliated Security | Type of Transaction | Fund | October 31, 2021 Shares/Principal | Change in Unrealized Gain (Loss) | Realized Gain (Loss) | Dividend Income |
| October 31, 2021 Fair Value | ||||||||||||||||||||||||||||||||||||||||
| U.S. Government Money Market Select Fund | Direct | International Equity | $ | 59,062,485 | $ | - | $ | - | $ | 6,626 | $ | 59,062,485 | ||||||||||||||||||||||||||||||||||||
| U.S. Government Money Market Select Fund | Securities Lending | International Equity | 7,655,136 | - | - | N/A | 7,655,136 | |||||||||||||||||||||||||||||||||||||||||
| U.S. Government Money Market Select Fund | Direct | Tocqueville International Value | 2,625,986 | - | - | 406 | 2,625,986 | |||||||||||||||||||||||||||||||||||||||||
| U.S. Government Money Market Select Fund | Securities Lending | Tocqueville International Value | 6,038,135 | - | - | N/A | 6,038,135 | |||||||||||||||||||||||||||||||||||||||||
The Funds and the USG Select Fund have the same investment advisor and therefore, are considered to be affiliated. The Manager serves as investment advisor to the USG Select Fund and receives management fees and administrative fees totaling 0.10% of the average daily net assets of the USG Select Fund. During the year ended October 31, 2021, the Manager earned fees on the Funds’ direct investments and securities lending collateral investments in the USG Select Fund as shown below:
Fund | Direct Investments in USG Select Fund | Securities Lending Collateral Investments in USG Select Fund | Total | |||||||||
International Equity | $ | 79,650 | $ | 21,048 | $ | 100,698 | ||||||
Tocqueville International Value | 4,591 | 5,936 | 10,527 | |||||||||
Interfund Credit Facility
Pursuant to an exemptive order issued by SEC, the Funds, along with other registered investment companies having management contracts with the Manager, may participate in a credit facility whereby each fund, under certain conditions, is permitted to lend money directly to and borrow directly from other participating funds for temporary purposes. The interfund credit facility is advantageous to the funds because it provides added liquidity and eliminates the need to maintain higher cash balances to meet redemptions. This situation could arise when shareholder redemptions exceed anticipated volumes and certain funds have insufficient cash on hand to satisfy such redemptions or when sales of securities do not settle as expected, resulting in a cash shortfall for a fund. When a fund liquidates portfolio securities to meet redemption requests, they often do not receive payment in settlement for up to two days (or longer for certain foreign transactions). Redemption requests normally are satisfied on the next business day. The credit facility provides a source of immediate, short-term liquidity pending settlement of the sale of portfolio securities. The credit facility is administered by a credit facility team consisting of professionals from the Manager’s asset management, compliance, and accounting areas who report the activities of the credit facility to the Board. During the year ended October 31, 2021, the International Equity Fund participated as a lender by loaning an amount of $10,651,379 for 1 day at an interest rate of 0.82% with interest charges of $239. This amount is included in “Interest income” on the Statements of Operations. The Tocqueville International Value Fund borrowed on average $1,341,485 for 27 days at an average interest rate of 0.82% with interest charges of $815. This amount is recorded as “Other expenses” in the Statements of Operations.
Expense Reimbursement Plan
The Manager contractually agreed to reduce fees and/or reimburse expenses for the R6 Class of the International Equity Fund and the R5 and Y Classes of the Tocqueville International Value Fund, through February 28, 2022, to the extent that total operating expenses (excluding taxes, interest, brokerage
31
American Beacon FundsSM
Notes to Financial Statements
October 31, 2021
commissions, acquired fund fees and expenses, securities lending fees, expenses associated with securities sold short, litigation, and other extraordinary expenses) exceed the expense cap. During the year ended October 31, 2021, the Manager waived and/or reimbursed expenses as follows:
| Expense Cap | ||||||||||||||||||||||
Fund | Class | 11/1/2020 - 2/28/2021 | 3/1/2021 - 10/31/2021 | Reimbursed Expenses | (Recouped) Expenses | Expiration of Reimbursed Expenses | ||||||||||||||||
International Equity | R6 | 0.69 | % | 0.69 | % | $ | 54,858 | $ | (27,656 | )* | 2023-2024 | |||||||||||
Tocqueville International Value | R5 | 0.89 | % | 0.89 | % | 2,785 | (1,418 | )* | 2023-2024 | |||||||||||||
Tocqueville International Value | Y | 0.99 | % | 0.99 | % | - | - | 2023-2024 | ||||||||||||||
Tocqueville International Value | Investor | 1.25 | % | N/A | - | - | 2023-2024 | |||||||||||||||
* This amount represents Recouped Expenses from prior fiscal years and is reflected in Other Expenses on the Statements of Operations.
Of the above amounts, $44,240 was disclosed as a Receivable for expense reimbursement and $54,732 was disclosed as a Payable for expense recoupment on the Statements of Assets and Liabilities at October 31, 2021 for the International Equity Fund and Tocqueville International Value Fund, respectively.
The Funds have adopted an Expense Reimbursement Plan whereby the Manager may seek repayment of such fee or voluntary reductions and expense reimbursements. Under the policy, the Manager can be reimbursed by the Funds for any contractual or voluntary fee reductions or expense reimbursements if reimbursement to the Manager (a) occurs within three years from the date of the Manager’s waiver/reimbursement and (b) does not cause the Funds’ annual operating expenses to exceed the lesser of the contractual percentage limit in effect at the time of the waiver/reimbursement or time of recoupment. The reimbursed expenses listed above will expire in 2023 and 2024. The Funds did not record a liability for potential reimbursements due to the current assessment that reimbursements are uncertain. The carryover of excess expenses potentially reimbursable to the Manager, but not recorded as a liability are as follows:
Fund | Recouped Expenses | Excess Expense Carryover | Expired Expense Carryover | Expiration of Reimbursed Expenses | ||||||||||||
International Equity | $ | 3,462 | $ | - | $ | - | 2021-2022 | |||||||||
International Equity | 24,194 | 67,213 | - | 2022-2023 | ||||||||||||
Tocqueville International Value | 1,418 | 3,057 | - | 2022-2023 | ||||||||||||
Sales Commissions
The Funds’ Distributor, Resolute Investment Distributors, Inc. (“RID” or “Distributor”), may receive a portion of Class A sales charges from broker dealers which may be used to offset distribution related expenses. During the year ended October 31, 2021, RID collected $202 for International Equity Fund from the sale of Class A Shares. The Tocqueville International Value Fund does not offer Class A Shares.
A CDSC of 0.50% will be deducted with respect to Class A Shares on certain purchases of $1,000,000 or more that are redeemed in whole or part within 18 months of purchase, unless waived as discussed in the Funds’ Prospectus. Any applicable CDSC will be 0.50% of the lesser of the original purchase price or the value of the redemption of the Class A Shares redeemed. During the year ended October 31, 2021, there were no CDSC fees collected for the Class A Shares of the International Equity Fund.
A CDSC of 1.00% will be deducted with respect to Class C of the International Equity Fund Shares redeemed within 12 months of purchase, unless waived as discussed in the Fund’s Prospectus. Any applicable CDSC will be 1.00% of the lesser of the original purchase price or the value of the redemption of the Class C Shares redeemed.
32
American Beacon FundsSM
Notes to Financial Statements
October 31, 2021
During the year ended October 31, 2021, CDSC fees of $7 were collected for the Class C Shares of International Equity Fund. The Tocqueville International Value Fund does not offer Class C Shares.
Trustee Fees and Expenses
Effective January 1, 2021, as compensation for their service to the American Beacon Funds Complex, including the Trust (collectively, the “Trusts”), each Trustee is compensated from the Trusts as follows: (1) an annual retainer of $120,000; (2) meeting attendance fee (for attendance in person or via teleconference) of (a) $12,000 for in-person attendance, or $5,000 for telephonic attendance, by Board members for each regularly scheduled or special Board meeting, (b) $2,500 for attendance by Committee members at meetings of the Audit and Compliance Committee and the Investment Committee, (c) $1,000 for attendance by Committee members at meetings of the Nominating and Governance Committee; and (d) $2,500 for attendance by Board members for each special telephonic Board meeting; and (3) reimbursement of reasonable expenses incurred in attending Board meetings, Committee meetings, and relevant educational seminars. For this purpose, the Board considers attendance at regular meetings held by video conference to constitute in-person attendance at a Board meeting. The Trustees also may be compensated for attendance at special Board and/or Committee meetings from time to time. For her service as Board Chair, Ms. Cline receives an additional annual retainer of $50,000. Although she attends several committee meetings at each quarterly Board meeting, she receives only a single $2,500 fee each quarter for her attendance at those meetings. The chairpersons of the Audit and Compliance Committee and the Investment Committee each receive an additional annual retainer of $25,000 and the Chair of the Nominating and Governance Committee receives an additional annual retainer of $10,000.
3. Security Valuation and Fair Value Measurements
The price of a Fund’s shares is based on its net asset value (“NAV”) per share. Each Fund’s NAV is computed by adding total assets, subtracting all the Fund’s liabilities, and dividing the result by the total number of shares outstanding.
The NAV of each class of a Fund’s shares is determined based on a pro rata allocation of a Fund’s investment income, expenses and total capital gains and losses. A Fund’s NAV per share is determined each business day as of the regular close of trading on the New York Stock Exchange (“NYSE” or “Exchange”), which is typically 4:00 p.m. Eastern Time (“ET”). However, if trading on the NYSE closes at a time other than 4:00 p.m. ET, a Fund’s NAV per share typically would still be determined as of the regular close of trading on the NYSE. The Funds do not price their shares on days that the NYSE is closed. Foreign exchanges may permit trading in foreign securities on days when a Fund is not open for business, which may result in the value of a Fund’s portfolio investments being affected at a time when you are unable to buy or sell shares.
Equity securities, including shares of closed-end funds and exchange-traded funds (“ETFs”), are valued at the last sale price or official closing price taken from the primary exchange in which each security trades. Investments in other mutual funds are valued at the closing NAV per share on the day of valuation. Debt securities are valued at bid quotes from broker/dealers or evaluated bid prices from pricing services, who may consider a number of inputs and factors, such as prices of comparable securities, yield curves, spreads, credit ratings, coupon rates, maturity, default rates, and underlying collateral. Futures are valued based on their daily settlement prices. Exchange-traded and over-the-counter (“OTC”) options are valued at the last sale price. Options with no last sale for the day are priced at mid quote. Swaps are valued at evaluated mid prices from pricing services.
The valuation of securities traded on foreign markets and certain fixed-income securities will generally be based on prices determined as of the earlier closing time of the markets on which they primarily trade unless a significant event has occurred. When a Fund holds securities or other assets that are denominated in a foreign currency, a Fund will normally use the currency exchange rates as of 4:00 p.m. ET.
Securities may be valued at fair value, as determined in good faith and pursuant to procedures approved by the Board, under certain limited circumstances. For example, fair value pricing will be used when market
33
American Beacon FundsSM
Notes to Financial Statements
October 31, 2021
quotations are not readily available or reliable, as determined by the Manager, such as when (i) trading for a security is restricted or stopped; (ii) a security’s trading market is closed (other than customary closings); or (iii) a security has been de-listed from a national exchange. A security with limited market liquidity may require fair value pricing if the Manager determines that the available price does not reflect the security’s true market value. In addition, if a significant event that the Manager determines to affect the value of one or more securities held by a Fund occurs after the close of a related exchange but before the determination of a Fund’s NAV, fair value pricing may be used on the affected security or securities. Securities of small-capitalization companies are also more likely to require a fair value determination using these procedures because they are more thinly traded and less liquid than the securities of larger-capitalization companies. The Funds may fair value securities as a result of significant events occurring after the close of the foreign markets in which a Fund invests as described below. In addition, the Funds may invest in illiquid securities requiring these procedures.
A Fund may use fair value pricing for securities primarily traded in non-U.S. markets because most foreign markets close well before a Fund’s pricing time of 4:00 p.m. ET. The earlier close of these foreign markets gives rise to the possibility that significant events, including broad market moves, may have occurred in the interim and may materially affect the value of those securities. If the Manager determines that the last quoted prices of non-U.S. securities will, in its judgment, materially affect the value of some or all its portfolio securities, the Manager can adjust the previous closing prices to reflect what it believes to be the fair value of the securities as of the close of the Exchange. In deciding whether it is necessary to adjust closing prices to reflect fair value, the Manager reviews a variety of factors, including developments in foreign markets, the performance of U.S. securities markets, and the performance of instruments trading in U.S. markets that represent foreign securities and baskets of foreign securities. These securities are fair valued using a pricing service, using methods approved by the Board, that considers the correlation of the trading patterns of the foreign security to intraday trading in the U.S. markets, based on indices of domestic securities and other appropriate indicators such as prices of relevant American Depositary Receipts (“ADRs”) and futures contracts. The Valuation Committee, established by the Board, may also fair value securities in other situations, such as when a particular foreign market is closed but a Fund is open. A Fund uses outside pricing services to provide closing prices and information to evaluate and/or adjust those prices. As a means of evaluating its security valuation process, the Valuation Committee routinely compares closing prices, the next day’s opening prices in the same markets and adjusted prices.
Attempts to determine the fair value of securities introduce an element of subjectivity to the pricing of securities. As a result, the price of a security determined through fair valuation techniques may differ from the price quoted or published by other sources and may not accurately reflect the market value of the security when trading resumes. If a reliable market quotation becomes available for a security formerly valued through fair valuation techniques, the Manager compares the new market quotation to the fair value price to evaluate the effectiveness of a Fund’s fair valuation procedures. If any significant discrepancies are found, the Manager may adjust a Fund’s fair valuation procedures.
Valuation Inputs
Various inputs may be used to determine the fair value of the Funds’ investments. These inputs are summarized in three broad levels for financial statement purposes. The inputs or methodologies used to value securities are not necessarily an indication of the risk associated with investing in those securities.
| Level 1 | - | Quoted prices in active markets for identical securities. | ||
| Level 2 | - | Prices determined using other significant observable inputs. These may include quoted prices for similar securities, interest rates, prepayment speeds, credit risk, and others. | ||
| Level 3 | - | Prices determined using other significant unobservable inputs. Unobservable inputs reflect a Fund’s own assumptions about the factors market participants would use in pricing an investment. | ||
34
American Beacon FundsSM
Notes to Financial Statements
October 31, 2021
Level 1 and Level 2 trading assets and trading liabilities, at fair value
Common stocks, preferred securities, and financial derivative instruments, such as futures contracts that are traded on a national securities exchange, are stated at the last reported sale or settlement price on the day of valuation. To the extent these securities are actively traded and valuation adjustments are not applied, they are categorized as Level 1 of the fair value hierarchy. Preferred securities and other equities traded on inactive markets or valued by reference to similar instruments are generally categorized as Level 2 of the fair value hierarchy. Valuation adjustments may be applied to certain securities that are solely traded on a foreign exchange to account for the market movement between the close of the foreign market and the close of the Exchange. These securities are valued using pricing service providers that consider the correlation of the trading patterns of the foreign security to the intraday trading in the U.S. markets for investments. Securities using these valuation adjustments are categorized as Level 2 of the fair value hierarchy.
Investments in registered open-end investment management companies will be valued based upon the NAVs of such investments and are categorized as Level 1 of the fair value hierarchy.
OTC financial derivative instruments, such as forward foreign currency contracts derive their value from underlying asset prices, indices, reference rates, and other inputs or a combination of these factors. These contracts are normally valued on the basis of broker dealer quotations or pricing service providers. Depending on the product and the terms of the transaction, the fair value of the financial derivative contracts can be estimated by a pricing service provider using a series of techniques, including simulation pricing models. The pricing models use inputs that are observed from actively quoted markets such as issuer details, indices, spreads, interest rates, curves, dividends, and exchange rates. Financial derivatives that use similar valuation techniques and inputs as described above are categorized as Level 2 of the fair value hierarchy.
Level 3 trading assets and trading liabilities, at fair value
The valuation techniques and significant inputs used in determining the fair values of financial instruments classified as Level 3 of the fair value hierarchy are as follows.
Securities and other assets for which market quotes are not readily available are valued at fair value as determined in good faith by the Board or persons acting at their direction and may be categorized as Level 3 of the fair value hierarchy.
Market quotes are considered not readily available in circumstances where there is an absence of current or reliable market-based data (e.g., trade information or broker quotes), including where events occur after the close of the relevant market, but prior to the Exchange close, that materially affect the values of the Fund’s securities or assets. In addition, market quotes are considered not readily available when, due to extraordinary circumstances, the exchanges or markets on which the securities trade, do not open for trading for the entire day and no other market prices are available. The Board has delegated to the Manager the responsibility for monitoring significant events that may materially affect the fair values of a Fund’s securities or assets and for determining whether the value of the applicable securities or assets should be re-evaluated in light of such significant events.
The Board has adopted methods for valuing securities and other assets in circumstances where market quotes are not readily available, and has delegated the responsibility for applying the valuation methods to the Manager. For instances in which daily market quotes are not readily available, investments may be valued pursuant to guidelines established by the Board. In the event that the security or asset cannot be valued, pursuant to one of the valuation methods established by the Board, the fair value of the security or asset will be determined in good faith by the Valuation Committee, generally based upon recommendations provided by the Manager.
When a Fund uses fair valuation methods applied by the Manager that use significant unobservable inputs to determine its NAV, the securities priced using this methodology are categorized as Level 3 of the fair value
35
American Beacon FundsSM
Notes to Financial Statements
October 31, 2021
hierarchy. These methods may require subjective determinations about the value of a security. While the Trust’s policy is intended to result in a calculation of a Fund’s NAV that fairly reflects security values as of the time of pricing, the Trust cannot guarantee that values determined by the Board or persons acting at their direction would accurately reflect the price that a Fund could obtain for a security if it were to dispose of that security as of the time of pricing (for instance, in a forced or distressed sale). The prices used by a Fund may differ from the value that would be realized if the securities were sold.
4. Securities and Other Investments
Common Stock
Common stock generally takes the form of shares in a corporation which represent an ownership interest. It ranks below preferred stock and debt securities in claims for dividends and for assets of the company in a liquidation or bankruptcy. The value of a company’s common stock may fall as a result of factors directly relating to that company, such as decisions made by its management or decreased demand for the company’s products or services. A stock’s value may also decline because of factors affecting not just the company, but also companies in the same industry or sector. The price of a company’s stock may also be affected by changes in financial markets that are relatively unrelated to the company, such as changes in interest rates, currency exchange rates or industry regulation. Companies that elect to pay dividends on their common stock generally only do so after they invest in their own business and make required payments to bondholders and on other debt and preferred stock. Therefore, the value of a company’s common stock will usually be more volatile than its bonds, other debt and preferred stock. Common stock may be exchange-traded or OTC. OTC stock may be less liquid than exchange-traded stock.
Depositary Receipts and U.S. Dollar-Denominated Foreign Stocks Traded on U.S. Exchanges
ADRs are U.S. dollar-denominated receipts issued generally by domestic banks and represent the deposit with the bank of a security of a foreign issuer. Depositary receipts may not be denominated in the same currency as the securities into which they may be converted. Investing in depositary receipts entails substantially the same risks as direct investment in foreign securities. There is generally less publicly available information about foreign companies and there may be less governmental regulation and supervision of foreign stock exchanges, brokers, and listed companies. In addition, such companies may use different accounting and financial standards (and certain currencies may become unavailable for transfer from a foreign currency), resulting in the Funds’ possible inability to convert immediately into U.S. currency proceeds realized upon the sale of portfolio securities of the affected foreign companies. In addition, the Funds may invest in unsponsored depositary receipts, the issuers of which are not obligated to disclose material information about the underlying securities to investors in the United States. Ownership of unsponsored depositary receipts may not entitle the Funds to the same benefits and rights as ownership of a sponsored depositary receipt or the underlying security.
Foreign Securities
The Funds may invest in U.S. dollar-denominated and non-U.S. dollar denominated equity and debt securities of foreign issuers and foreign branches of U.S. banks, including negotiable certificates of deposit (“CDs”), bankers’ acceptances, and commercial paper. Foreign issuers are issuers organized and doing business principally outside the United States and include corporations, banks, non-U.S. governments, and quasi-governmental organizations. While investments in foreign securities may be intended to reduce risk by providing further diversification, such investments involve sovereign and other risks, in addition to the credit and market risks normally associated with domestic securities. These additional risks include the possibility of adverse political and economic developments (including political or social instability, nationalization, expropriation, or confiscatory taxation); the potentially adverse effects of unavailability of public information regarding issuers, different governmental supervision and regulation of financial markets, reduced liquidity of certain financial markets, and the lack of uniform accounting, auditing, and financial reporting standards or the application of standards that are different or less stringent than those applied in the United States; different laws and customs governing securities tracking; and possibly limited access to the courts to enforce the Funds’ rights as an investor.
36
American Beacon FundsSM
Notes to Financial Statements
October 31, 2021
Illiquid and Restricted Securities
Generally, an illiquid asset is an asset that the Funds reasonably expect cannot be sold or disposed of in current market conditions in seven calendar days or less without the sale or disposition significantly changing the market value of the investment, as determined pursuant to Rule 22e-4 under the Investment Company Act or as otherwise permitted or required by SEC rules and interpretations. Historically, illiquid securities have included securities that have not been registered under the Securities Act, securities that are otherwise not readily marketable, and repurchase agreements having a remaining maturity of longer than seven calendar days. Securities that have not been registered under the Securities Act are referred to as private placements or restricted securities and are purchased directly from the issuer or in the secondary market. These securities may be sold only in a privately negotiated transaction or pursuant to an exemption from registration. A large institutional market exists for certain securities that are not registered under the Securities Act, including repurchase agreements, commercial paper, foreign securities, municipal securities and corporate bonds and notes. Institutional investors depend on an efficient institutional market in which the unregistered security can be readily resold or on an issuer’s ability to honor a demand for repayment. However, the fact that there are contractual or legal restrictions on resale of such investments to the general public or to certain institutions may not be indicative of their liquidity.
Limitations on resale may have an adverse effect on the marketability of portfolio securities, and a Fund might be unable to dispose of restricted or other illiquid securities promptly or at reasonable prices and might thereby experience difficulty satisfying redemptions within seven calendar days. In addition, a Fund may get only limited information about an issuer, so it may be less able to predict a loss. A Fund also might have to register such restricted securities in order to dispose of them resulting in additional expense and delay. Adverse market conditions could impede such a public offering of securities.
In recognition of the increased size and liquidity of the institutional market for unregistered securities and the importance of institutional investors in the formation of capital, the SEC adopted Rule 144A under the Securities Act. Rule 144A is designed to facilitate efficient trading among institutional investors by permitting the sale of certain unregistered securities to qualified institutional buyers. To the extent privately placed securities held by a Fund qualify under Rule 144A and an institutional market develops for those securities, a Fund likely will be able to dispose of the securities without registering them under the Securities Act. To the extent that institutional buyers become, for a time, uninterested in purchasing these securities, investing in Rule 144A securities could increase the level of a Fund’s illiquidity. The Manager or the Sub-Advisor, as applicable, may determine that certain securities qualified for trading under Rule 144A are liquid. Regulation S under the Securities Act permits the sale abroad of securities that are not registered for sale in the United States and includes a provision for U.S. investors, such as a Fund, to purchase such unregistered securities if certain conditions are met.
Securities sold in private placement offerings made in reliance on the “private placement” exemption from registration afforded by Section 4(a)(2) of the Securities Act and resold to qualified institutional buyers under Rule 144A under the Securities Act (“Section 4(a)(2) securities”) are restricted as to disposition under the federal securities laws, and generally are sold to institutional investors, such as a Fund, that agree they are purchasing the securities for investment and not with an intention to distribute to the public. Any resale by the purchaser must be pursuant to an exempt transaction and may be accomplished in accordance with Rule 144A. Section 4(a)(2) securities normally are resold to other institutional investors through or with the assistance of the issuer or dealers that make a market in the Section 4(a)(2) securities, thus providing liquidity. The Manager and the sub-advisor will carefully monitor a Fund’s investments in Section 4(a)(2) securities offered and sold under Rule 144A, focusing on such important factors, among others, as valuation, liquidity, and availability of information. Investments in Section 4(a)(2) securities could have the effect of reducing a Fund’s liquidity to the extent that qualified institutional buyers no longer wish to purchase these restricted securities.
Restricted securities outstanding during the year ended October 31, 2021 are disclosed in the Notes to the Schedules of Investments.
37
American Beacon FundsSM
Notes to Financial Statements
October 31, 2021
Other Investment Company Securities and Other Exchange-Traded Products
The Funds may invest in shares of other investment companies, including open-end funds, closed-end funds, business development companies (“BDCs���), ETFs, unit investment trusts, and other investment companies of the Trust. The Funds may invest in securities of an investment company advised by the Manager or a sub-advisor. Investments in the securities of other investment companies may involve duplication of advisory fees and certain other expenses. By investing in another investment company, the Funds become a shareholder of that investment company. As a result, the Funds’ shareholders indirectly will bear the Funds’ proportionate share of the fees and expenses paid by shareholders of the other investment company, in addition to the fees and expenses the Funds’ shareholders directly bear in connection with the Funds’ own operations. These other fees and expenses are reflected as Acquired Fund Fees and Expenses and are included in the Fees and Expenses Table for the Funds in their Prospectus, if applicable. Investments in other investment companies may involve the payment of substantial premiums above the value of such issuer’s portfolio securities.
The Funds can invest free cash balances in registered open-end investment companies regulated as money market funds under the Investment Company Act, to provide liquidity or for defensive purposes. The Funds could invest in money market funds rather than purchasing individual short-term investments. If the Funds invest in money market funds, shareholders will bear their proportionate share of the expenses, including for example, advisory and administrative fees, of the money market funds in which the Funds invest, including advisory fees charged by the Manager to any applicable money market funds advised by the Manager.
Preferred Stock
Preferred stock blends the characteristics of a bond and common stock. It can offer the higher yield of a bond and has priority over common stock in equity ownership, but does not have the seniority of a bond and its participation in the issuer’s growth may be limited. Preferred stock has preference over common stock in the receipt of dividends and in any residual assets after payment to creditors should the issuer be dissolved. Although the dividend is typically set at a fixed annual rate, in some circumstances it can be variable, changed or omitted by the issuer. Preferred stocks are subject to the risks associated with other types of equity securities, as well as additional risks, such as credit risk, interest rate risk, potentially greater volatility and risks related to deferral, non-cumulative dividends, subordination, liquidity, limited voting rights, and special redemption rights.
5. Financial Derivative Instruments
The Funds may utilize derivative instruments to gain market exposure on cash balances to hedge foreign currency exposure or reduce market exposure in anticipation of liquidity needs. When considering the Funds’ use of derivatives, it is important to note that the Funds do not use derivatives for the purpose of creating financial leverage.
Futures Contracts
A futures contract is a contract to purchase or sell a particular security, or the cash value of an asset, such as securities, indices, or currencies, at a specified future date at a price agreed upon when the contract is made. Under many such contracts, no delivery of the actual underlying asset is required. Rather, upon the expiration of the contract, settlement is made by exchanging cash in an amount equal to the difference between the contract price and the closing price of the asset (e.g., a security or an index) at expiration, net of the initial and variation margin that was previously paid. A Treasury futures contract is a contract for the future delivery of a U.S. Treasury security. An equity index futures contract is based on the value of an underlying index. A Fund may, from time to time, use futures positions to equitize cash and expose its portfolio to changes in securities prices or index prices. This can magnify gains and losses in a Fund. A Fund also may have to sell assets at inopportune times to satisfy its settlement or collateral obligations. The risks associated with the use of futures contracts also include that there may be an imperfect correlation between the changes in market value of the prices of futures contracts and the assets underlying such contracts and that there may not be a liquid secondary market for a futures contract.
38
American Beacon FundsSM
Notes to Financial Statements
October 31, 2021
During the year ended October 31, 2021, the International Equity Fund entered into futures contracts primarily for exposing cash to markets.
The Fund’s average futures contracts outstanding fluctuate throughout the operating year as required to meet strategic requirements. The following table illustrates the average quarterly volume of futures contracts. For the purpose of this disclosure, volume is measured by contracts outstanding at each quarter end.
Average Futures Contracts Outstanding | ||||
Fund | Year Ended October 31, 2021 | |||
International Equity | 643 | |||
The following is a summary of the fair valuations of the Fund’s derivative instruments categorized by risk exposure(1):
International Equity Fund
| Fair values of financial instruments on the Statements of Assets and Liabilities as of October 31, 2021: |
| ||||||||||||||||||||||||||||||||||||||||||||||||||||||
| Derivatives not accounted for as hedging instruments | |||||||||||||||||||||||||||||||||||||||||||||||||||||||
Assets: | Credit contracts | Foreign exchange contracts | Commodity contracts | Interest rate contracts | Equity contracts | Total | |||||||||||||||||||||||||||||||||||||||||||||||||
| Receivable for variation margin from open futures contracts(2) | $ | - | $ | - | $ | - | $ | - | $ | 1,211,478 | $ | 1,211,478 | |||||||||||||||||||||||||||||||||||||||||||
| The effect of financial derivative instruments on the Statements of Operations as of October 31, 2021: |
| ||||||||||||||||||||||||||||||||||||||||||||||||||||||
| Derivatives not accounted for as hedging instruments | |||||||||||||||||||||||||||||||||||||||||||||||||||||||
Realized gain (loss) from derivatives | Credit contracts | Foreign exchange contracts | Commodity contracts | Interest rate contracts | Equity contracts | Total | |||||||||||||||||||||||||||||||||||||||||||||||||
| Futures contracts | $ | - | $ | - | $ | - | $ | - | $ | 20,510,579 | $ | 20,510,579 | |||||||||||||||||||||||||||||||||||||||||||
Net change in unrealized appreciation | Credit contracts | Foreign exchange contracts | Commodity contracts | Interest rate contracts | Equity contracts | Total | |||||||||||||||||||||||||||||||||||||||||||||||||
| Futures contracts | $ | - | $ | - | $ | - | $ | - | $ | 3,210,757 | $ | 3,210,757 | |||||||||||||||||||||||||||||||||||||||||||
(1) See Note 3 in the Notes to Financial Statements for additional information.
(2) Includes cumulative appreciation (depreciation) of futures contracts as reported in the Fund’s Schedule of Investments footnotes. Only current day’s variation margin is reported within the Statements of Assets and Liabilities.
Master Agreements
Master Securities Forward Transaction Agreements (“Master Forward Agreements”) govern the considerations and factors surrounding the settlement of certain forward settling transactions, such as delayed delivery or sale-buyback financing transactions by and between the Fund and select counterparties. The Master Forward Agreements maintain provisions for, among other things, initiation and confirmation, payment and transfer, events of default, termination, and maintenance of collateral.
Offsetting Assets and Liabilities
The Funds are parties to enforceable master netting agreements between brokers and counterparties which provide for the right to offset under certain circumstances. The Funds employ multiple money managers and counterparties and have elected not to offset qualifying financial and derivative instruments on the Statements of Assets and Liabilities, as such all financial and derivative instruments are presented on a gross basis. The impacts of netting arrangements that provide the right to offset are detailed below, if applicable. The net amount
39
American Beacon FundsSM
Notes to Financial Statements
October 31, 2021
represents the net receivable or payable that would be due from or to the counterparty in the event of default. Exposure from borrowings and other financing agreements such as repurchase agreements can only be netted across transactions governed by the same Master Agreement with the same legal entity. All amounts reported below represent the balance as of the report date, October 31, 2021.
International Equity Fund
| Offsetting of Financial and Derivative Assets as of October 31, 2021: |
| |||||||||||
| Assets | Liabilities | ||||||||||
| Futures Contracts(1) | $ | 1,211,478 | $ | - | ||||||||
|
|
|
| |||||||||
| Total derivative assets and liabilities in the Statement of Assets and Liabilities | $ | 1,211,478 | $ | - | ||||||||
|
|
|
| |||||||||
| Derivatives not subject to a Master Netting Agreement or similar agreement (“MNA”) | $ | (1,211,478 | ) | $ | - | |||||||
|
|
|
| |||||||||
| Remaining Contractual Maturity of the Agreements As of October 31, 2021 | ||||||||||||||||||||||||||||||||||||
| Overnight and Continuous | <30 days | Between 30 & 90 days | >90 days | Total | ||||||||||||||||||||||||||||||||
Securities Lending Transactions | ||||||||||||||||||||||||||||||||||||
Common Stocks | $ | 7,655,136 | $ | - | $ | - | $ | - | $ | 7,655,136 | ||||||||||||||||||||||||||
|
|
|
|
|
|
|
|
|
| |||||||||||||||||||||||||||
Total Borrowings | $ | 7,655,136 | $ | - | $ | - | $ | - | $ | 7,655,136 | ||||||||||||||||||||||||||
|
|
|
|
|
|
|
|
|
| |||||||||||||||||||||||||||
Gross amount of recognized liabilities for securities lending transactions |
| $ | 7,655,136 | |||||||||||||||||||||||||||||||||
|
| |||||||||||||||||||||||||||||||||||
(1) Includes cumulative appreciation or (depreciation) of futures contracts as reported in the Schedule of Investments footnotes. Only current day’s variation margin is reported within the Statements of Assets and Liabilities.
Tocqueville International Value Fund
| Remaining Contractual Maturity of the Agreements As of October 31, 2021 | ||||||||||||||||||||||||||||||||||||
| Overnight and Continuous | <30 days | Between 30 & 90 days | >90 days | Total | ||||||||||||||||||||||||||||||||
Securities Lending Transactions | ||||||||||||||||||||||||||||||||||||
Common Stocks | $ | 6,038,135 | $ | - | $ | - | $ | - | $ | 6,038,135 | ||||||||||||||||||||||||||
|
|
|
|
|
|
|
|
|
| |||||||||||||||||||||||||||
Total Borrowings | $ | 6,038,135 | $ | - | $ | - | $ | - | $ | 6,038,135 | ||||||||||||||||||||||||||
|
|
|
|
|
|
|
|
|
| |||||||||||||||||||||||||||
Gross amount of recognized liabilities for securities lending transactions |
| $ | 6,038,135 | |||||||||||||||||||||||||||||||||
|
| |||||||||||||||||||||||||||||||||||
6. Principal Risks
Investing in the Funds may involve certain risks including, but not limited to, those described below.
Counterparty Risk
The Funds are subject to the risk that a party or participant to a transaction, such as a broker or derivative counterparty, will be unwilling or unable to satisfy its obligation to make timely principal, interest or settlement payments or to otherwise honor its obligations to the Funds. As a result the Fund may obtain no recovery of its investment or may only obtain a limited recovery, and any recovery may be delayed. Not all derivative transactions require a counterparty to post collateral, which may expose the Fund to greater losses in the event of a default by a counterparty.
Some of the markets in which the Funds may effect derivative transactions are OTC or “interdealer” markets. The participants in such markets are typically not subject to credit evaluation and regulatory oversight to the same extent as are members of “exchange-based” markets. This exposes the Funds to the risk that a counterparty will not settle a transaction in accordance with its terms and conditions because of a credit or
40
American Beacon FundsSM
Notes to Financial Statements
October 31, 2021
liquidity problem with the counterparty and the recent turbulence in the financial markets highlights the importance of being aware of counterparty risk resulting from OTC derivative transactions. The Funds are subject to the risk that a party or participant to a transaction, such as a broker or derivative counterparty, will be unwilling or unable to satisfy its obligation to make timely principal, interest or settlement payments or to otherwise honor its obligations to the Funds. As a result, the Funds may obtain no recovery of its investment or may only obtain a limited recovery, and any recovery may be delayed. Not all derivative transactions require a counterparty to post collateral, which may expose the Funds to greater losses in the event of a default by a counterparty.
Credit Risk
The Funds are subject to the risk that the issuer or guarantor of a debt security, or the counterparty to a derivatives contract or a loan will fail to make timely payment of interest or principal or otherwise honor its obligations or default completely. A decline in the credit rating of an individual security held by the Funds may have an adverse impact on its price and make it difficult for the Funds to sell it. Ratings represent a rating agency’s opinion regarding the quality of the security and are not a guarantee of quality. Rating agencies might not always change their credit rating on an issuer or security in a timely manner to reflect events that could affect the issuer’s ability to make timely payments on its obligations. Credit risk is typically greater for securities with ratings that are below investment grade. Since the Funds can invest significantly in high-yield investments considered speculative in nature, this risk may be substantial.
Currency Risk
The Funds may have exposure to foreign currencies by making direct investments in non-U.S. currencies or in securities denominated in non-U.S. currencies, or by purchasing or selling forward currency exchange contracts in non-U.S. currencies. Foreign currencies may decline in value relative to the U.S. dollar, or, in the case of hedging positions, the U.S. dollar may decline in value relative to the currency being hedged, and thereby affect a Fund’s investments in foreign (non-U.S.) currencies or in securities that trade in, and receive revenues in, or in derivatives that provide exposure to, foreign (non-U.S.) currencies. Currency exchange rates may fluctuate significantly over short periods of time for a number of reasons, including changes in interest rates, intervention (or the failure to intervene) by U.S. or foreign governments, central banks or supranational entities such as the International Monetary Fund, or by the imposition of currency controls or other political developments in the United States or abroad. As a result, the Funds’ investments in foreign currency denominated securities may reduce the returns of the Funds. Currency futures, forwards, options or swaps may not always work as intended, and in specific cases, the Funds may be worse off than if it had not used such instrument(s). There may not always be suitable hedging instruments available. Even where suitable hedging instruments are available, the Funds may choose to not hedge its currency risks.
Equity Investments Risk
Equity securities are subject to investment risk and market risk. The Funds’ investments in equity securities may include common stocks, preferred stocks, securities convertible into or exchangeable for common stocks, real estate investment trusts (“REITs”), depositary receipts, and U.S. dollar-denominated foreign stocks traded on U.S. exchanges. Such investments may expose the Funds to additional risk. The value of a company’s common stock may fall as a result of factors affecting the company, companies in the same industry or sector, or the financial markets overall. Common stock generally is subordinate to preferred stock upon the liquidation or bankruptcy of the issuing company. Preferred stocks and convertible securities are sensitive to movements in interest rates. Preferred stocks may be less liquid than common stocks and, unlike common stocks, participation in the growth of an issuer may be limited. Distributions on preferred stocks generally are payable at the discretion of an issuer and after required payments to bond holders. Convertible securities are subject to the risk that the credit standing of the issuer may have an effect on the convertible securities’ investment value. Investments in REITs are subject to the risks associated with investing in the real estate industry such as adverse developments affecting the real
41
American Beacon FundsSM
Notes to Financial Statements
October 31, 2021
estate industry and real property values. Depositary receipts and U.S. dollar-denominated foreign stocks traded on U.S. exchanges are subject to certain of the risks associated with investing directly in foreign securities, including, but not limited to, currency fluctuations and political and financial instability in the home country of a particular depositary receipt or foreign stock.
Foreign Investing and Emerging Markets Risk
Non-U.S. investments carry potential risks not associated with U.S. investments. Such risks include, but are not limited to: (1) currency exchange rate fluctuations, (2) political and financial instability, (3) less liquidity, (4) lack of uniform accounting, auditing and financial reporting standards, (5) increased price volatility, (6) less government regulation and supervision of foreign stock exchanges, brokers and listed companies, and (7) delays in transaction settlement in some foreign markets. To the extent the Funds invest a significant portion of its assets in securities of a single country or region, it is more likely to be affected by events or conditions of that country or region. In addition, the economies and political environments of emerging market countries tend to be more unstable than those of developed countries, resulting in more volatile rates of return than the developed markets and substantially greater risk to investors. There may be very limited oversight of certain foreign banks or securities depositories that hold foreign securities and currency and the laws of certain countries may limit the ability to recover such assets if a foreign bank or depository or their agents goes bankrupt. When investing in emerging markets, the risks of investing in foreign securities are heightened. Emerging markets have unique risks that are greater than, or in addition to, investing in developed markets because emerging markets are generally smaller, less developed, less liquid and more volatile than the securities markets of the U.S. and other developed markets. There are also risks of: greater political uncertainties; an economy’s dependence on revenues from particular commodities or on international aid or development assistance; currency transfer restrictions; a limited number of potential buyers for such securities, resulting in increased volatility and limited liquidity for emerging market securities; trading suspensions; and delays and disruptions in securities settlement procedures. In addition, there may be less information available to make investment decisions and more volatile rates of return.
Forward Foreign Currency Contracts Risk
Forward foreign currency contracts, including non-deliverable forwards, are derivative instruments pursuant to a contract with a counterparty to pay a fixed price for an agreed amount of securities or other underlying assets at an agreed date or to buy or sell a specific currency at a future date at a price set at the time of the contract. The use of forward foreign currency contracts may expose the Funds to additional risks that it would not be subject to if it invested directly in the securities or currencies underlying the forward foreign currency contract.
Futures Contracts Risk
Futures contracts are derivative instruments where one party pays a fixed price for an agreed amount of securities or other underlying assets at an agreed date. The use of such derivative instruments may expose the Funds to additional risks that they would not be subject to if they invested directly in the securities underlying those derivatives. There may at times be an imperfect correlation between the movement in the prices of futures contracts and the value of their underlying instruments or indexes. There can be no assurance that any strategy used will succeed. There also can be no assurance that, at all times, a liquid market will exist for offsetting a futures contract that a Fund has previously bought or sold and this may result in the inability to close a futures contract when desired. Futures contracts may experience potentially dramatic price changes, which will increase the volatility of a Fund and may involve a small investment of cash (the amount of initial and variation margin) relative to the magnitude of the risk assumed (the potential increase or decrease in the price of the futures contract).
Market Risk
The Funds are subject to the risk that the securities markets will move down, sometimes rapidly and unpredictably, based on overall economic conditions and other factors, which may negatively affect the Funds’
42
American Beacon FundsSM
Notes to Financial Statements
October 31, 2021
performance. Equity securities generally have greater price volatility than fixed income securities, although under certain market conditions fixed income securities may have comparable or greater price volatility. During a general downturn in the securities markets, multiple assets may decline in value simultaneously. In some cases, traditional market participants have been less willing to make a market in some types of debt instruments, which has affected the liquidity of those instruments. During times of market turmoil, investors tend to look to the safety of securities issued or backed by the U.S. Treasury, causing the prices of these securities to rise and the yields to decline. Reduced liquidity in fixed income and credit markets may negatively affect many issuers worldwide. Prices in many financial markets have increased significantly over the last decade, but there have also been periods of adverse market and financial developments and cyclical change during that timeframe, which have resulted in unusually high levels of volatility in domestic and foreign financial markets that has caused losses for investors and may occur again in the future, particularly if markets enter a period of uncertainty or economic weakness. The value of a security may decline due to adverse issuer-specific conditions, general market conditions unrelated to a particular issuer, or factors that affect a particular industry or industries. Changes in the financial condition of a single issuer or market segment also can impact the market as a whole.
Geopolitical and other events, including war, terrorism, economic uncertainty, trade disputes, pandemics, public health crises, natural disasters and related events have led, and in the future may continue to lead, to instability in world economies and markets generally and reduced liquidity in equity, credit and fixed-income markets, which may disrupt economies and markets and adversely affect the value of your investment. Adverse market events may also lead to increased shareholder redemptions, which could cause a Fund to experience a loss or difficulty in selling investments to meet redemption requests by shareholders and may increase a Fund’s portfolio turnover, which will increase the costs that a Fund incurs and lower a Fund’s performance. Even when securities markets perform well, there is no assurance that the investments held by a Fund will increase in value along with the broader market.
Policy changes by the U.S. government and/or Federal Reserve and political events within the U.S. and abroad, including the U.S. presidential election, the U.S. government’s inability at times to agree on a long-term budget and deficit reduction plan, the threat of a federal government shutdown and threats not to increase the federal government’s debt limit, may affect investor and consumer confidence and may adversely impact financial markets and the broader economy, perhaps suddenly and to a significant degree. The severity or duration of adverse economic conditions may also be affected by policy changes made by governments or quasi-governmental organizations. Global economies and financial markets are becoming increasingly interconnected, which increases the possibility of many markets being affected by events in a single country or events affecting a single or small number of issuers.
Markets and market participants are increasingly reliant upon both publicly available and proprietary information data systems. Data imprecision, software or other technology malfunctions, programming inaccuracies, unauthorized use or access, and similar circumstances may impair the performance of these systems and may have an adverse impact upon a single issuer, a group of issuers, or the market at large. In certain cases, an exchange or market may close or issue trading halts on either specific securities or even the entire market, which may result in a Fund being, among other things, unable to buy or sell certain securities or financial instruments or accurately price its investments. These fluctuations in securities prices could be a sustained trend or a drastic movement. The financial markets generally move in cycles, with periods of rising prices followed by periods of declining prices. The value of your investment may reflect these fluctuations.
Market Timing Risk
Because the Funds invest in foreign securities, it is particularly subject to the risk of market timing activities. Frequent trading by Fund shareholders poses risks to other shareholders in the Funds, including (i) the dilution of the Funds’ NAV, (ii) an increase in the Funds’ expenses, and (iii) interference with the portfolio manager’s ability to execute efficient investment strategies. Because of specific securities in which the Funds may invest, it could be subject to the risk of market timing activities by shareholders. Some examples of these types of
43
American Beacon FundsSM
Notes to Financial Statements
October 31, 2021
securities are high-yield and foreign securities. The limited trading activity of some high-yield securities may result in market prices that do not reflect the true market value of these securities. The Funds generally prices foreign securities using their closing prices from the foreign markets in which they trade, typically prior to the Funds’ calculation of its NAV. These prices may be affected by events that occur after the close of a foreign market but before the Funds price its shares. In such instances, the Funds may fair value high yield and foreign securities. However, some investors may engage in frequent short-term trading in the Funds to take advantage of any price differentials that may be reflected in the NAV of the Funds’ shares. While the Manager monitors trading in the Funds, there is no guarantee that it can detect all market timing activities.
Multiple Sub-Advisor Risk
The Manager may allocate the Funds’ assets among multiple sub-advisors, each of which is responsible for investing its allocated portion of the Funds’ assets. To a significant extent, the Funds’ performance will depend on the success of the Manager in allocating the Funds’ assets to sub-advisors and its selection and oversight of the sub- advisors. Because each sub-advisor manages its allocated portion of the Funds independently from another sub-advisor, the same security may be held in different portions of the Funds, or may be acquired for one portion of the Funds at a time when a sub-advisor to another portion deems it appropriate to dispose of the security from that other portion, resulting in higher expenses without accomplishing any net result in the Funds’ holdings. Similarly, under some market conditions, one sub-advisor may believe that temporary, defensive investments in short-term instruments or cash are appropriate when another sub-advisor believes continued exposure to the equity or debt markets is appropriate for its allocated portion of the Funds. Because each sub-advisor directs the trading for its own portion of the Funds, and does not aggregate its transactions with those of the other sub-advisors, the Funds may incur higher brokerage costs than would be the case if a single sub-adviser were managing the entire Fund. In addition, while the Manager seeks to allocate the Funds’ assets among the Funds’ sub-advisors in a manner that it believes is consistent with achieving the Funds’ investment objective(s), the Manager may be subject to potential conflicts of interest in allocating the Funds’ assets among sub-advisors, due to factors that could impact the Manager’s revenues and profits.
Recent Market Events Risk
An outbreak of infectious respiratory illness caused by a novel coronavirus, known as COVID-19, was first detected in China in December 2019 and has subsequently spread globally. Transmission of COVID-19 and efforts to contain its spread have resulted, and may continue to result, in significant disruptions to business operations, widespread business closures and layoffs, travel restrictions, closed international, national and local borders, prolonged quarantines and stay-at-home orders, disruption of and delays in healthcare service preparation and delivery, service and event cancellations, and lower consumer demand, as well as general concern and uncertainty that has negatively affected the global economy. The impact of the COVID-19 pandemic may last for an extended period of time and may result in a sustained economic downturn or recession. The U.S. Federal Reserve and the U.S. federal government have taken numerous measures to address the economic impact of the COVID-19 pandemic and stimulate the U.S. economy. The ultimate effects of these and other efforts that may be taken may not be known for some time.
The Federal Reserve has spent hundreds of billions of dollars to keep credit flowing through short-term money markets. Amid the Federal Reserve’s ongoing efforts, concerns about the markets’ dependence on the Federal Reserve’s provision of liquidity have grown. Future legislative, regulatory and policy changes may result in more restrictions on international trade, less stringent prudential regulation of certain players in the financial markets, and significant new investments in infrastructure and national defense. High public debt in the U.S. and other countries creates ongoing systemic and market risks and policymaking uncertainty. A rise in protectionist trade policies, slowing global economic growth, risks associated with the United Kingdom’s departure from the European Union on December 31, 2020, commonly referred to as “Brexit,” and a trade agreement between the United Kingdom and the European Union, the risks associated with ongoing trade negotiations with China, the possibility of changes to some international trade agreements, tensions or open conflict between nations, or
44
American Beacon FundsSM
Notes to Financial Statements
October 31, 2021
political or economic dysfunction within some nations that are major producers of oil could affect the economies of many nations, including the United States, in ways that cannot necessarily be foreseen at the present time.
Economists and others have expressed increasing concern about the potential effects of global climate change on property and security values. Certain issuers, industries and regions may be adversely affected by the impacts of climate change, including on the demand for and the development of goods and services and related production costs, and the impacts of legislation, regulation and international accords related to climate change, as well as any indirect consequences of regulation or business trends driven by climate change.
Other Investment Companies Risk
To the extent that the Funds invest in shares of other registered investment companies, the Funds will indirectly bear the fees and expenses, including, for example, advisory and administrative fees, charged by those investment companies in addition to the Funds, direct fees and expenses. If the Funds invest in other investment companies, the Funds may receive distributions of taxable gains from portfolio transactions by that investment company and may recognize taxable gains from transactions in shares of that investment company, which could be taxable to the Funds’ shareholders when distributed to them. The Funds must rely on the investment company in which it invests to achieve its investment objective. If the investment company fails to achieve its investment objective, the value of the Funds’ investment may decline, adversely affecting the Funds’ performance. To the extent the Funds invest in other investment companies that invest in equity securities, fixed income securities and/or foreign securities, or that track an index, the Funds are subject to the risks associated with the underlying investments held by the investment company or the index fluctuations to which the investment company is subject. The Funds will be subject to the risks associated with investments in those companies, including but not limited to interest rate risk, credit risk, and market risk.
Securities Lending Risk
A Fund may lend its portfolio securities to brokers, dealers and financial institutions in order to obtain additional income. Borrowers of a Fund’s securities provide collateral either in the form of cash, which a Fund reinvests in securities or in the form of non-cash collateral consisting of securities issued or guaranteed by the U.S. government or one of its agencies or instrumentalities. A Fund will be responsible for the risks associated with the investment of cash collateral, including any collateral invested in an affiliated money market fund. A Fund may lose money on its investment of cash collateral or may fail to earn sufficient income on its investment to cover its payment to the borrower of a pre-negotiated fee or “rebate” for the use of that cash collateral in connection with the loan. A Fund could also lose money due to a decline in the value of non-cash collateral. In addition, delays may occur in the recovery of securities from borrowers, which could interfere with a Fund’s ability to vote proxies or to settle transactions or could result in increased costs. Moreover, if the borrower becomes subject to insolvency or similar proceedings, a Fund could incur delays in its ability to enforce its rights in its collateral. There also is a risk that a borrower may default on its obligation to return loaned securities at a time when the value of a Fund’s collateral is inadequate. Although a Fund’s securities lending agent may indemnify a Fund against that risk, it is also possible that the securities lending agent will be unable to satisfy its indemnification obligations. In any case in which the loaned securities are not returned to a Fund before an ex-dividend date, whether or not due to a default by the borrower, the payment in lieu of the dividend that a Fund receives from the securities’ borrower would not be treated as a dividend for federal income tax purposes and thus would not qualify for treatment as “qualified dividend income”.
Valuation Risk
This is the risk that a Fund has valued a security at a price different from the price at which it can be sold. This risk may be especially pronounced for investments, such as derivatives, which may be illiquid or which may become illiquid and for securities that trade in relatively thin markets and/or markets that experience extreme volatility. If market conditions make it difficult to value certain investments, a Fund may value these investments
45
American Beacon FundsSM
Notes to Financial Statements
October 31, 2021
using more subjective methods, such as fair-value methodologies. Investors who purchase or redeem Fund shares on days when a Fund is holding fair-valued securities may receive fewer or more shares, or lower or higher redemption proceeds, than they would have received if the Fund had not fair-valued the securities or had used a different valuation methodology. The value of foreign securities, certain fixed-income securities and currencies, as applicable, may be materially affected by events after the close of the markets on which they are traded, but before a Fund determines its NAV. A Fund’s ability to value its investments in an accurate and timely manner may be impacted by technological issues and/or errors by third-party service providers, such as pricing services or accounting agents.
7. Federal Income and Excise Taxes
It is the policy of each Fund to qualify as a regulated investment company (“RIC”), by complying with all applicable provisions of Subchapter M of the Internal Revenue Code, as amended, and to make distributions of taxable income sufficient to relieve it from substantially all federal income and excise taxes. For federal income tax purposes, each Fund is treated as a single entity for the purpose of determining such qualification.
The Funds do not have any unrecorded tax liabilities in the accompanying financial statements. Each of the tax years in the four year period ended October 31, 2021 remain subject to examination by the Internal Revenue Service. If applicable, the Funds recognize interest accrued related to unrecognized tax benefits in interest expense and penalties in “Other expenses” on the Statements of Operations.
The Funds may be subject to taxes imposed by countries in which it invests. Such taxes are generally based on returns of income earned or gains realized or repatriated. Taxes are accrued and applied to net investment income, net realized capital gains and net unrealized appreciation (depreciation), as applicable, as the income is earned or capital gains are recorded.
Dividends are categorized in accordance with income tax regulations which may treat certain transactions differently than U.S. GAAP. Accordingly, the character of distributions and composition of net assets for tax purposes may differ from those reflected in the accompanying financial statements.
The tax character of distributions paid were as follows:
| International Equity Fund | Tocqueville International Value Fund | |||||||||||||||||||||||||||
| Year Ended October 31, 2021 | Year Ended October 31, 2020 | Year Ended October 31, 2021 | Year Ended October 31, 2020 | |||||||||||||||||||||||||
Distributions paid from: | ||||||||||||||||||||||||||||
Ordinary income* | ||||||||||||||||||||||||||||
R5 Class | $ | 19,243,533 | $ | 43,205,283 | $ | 153,791 | $ | 913,408 | ||||||||||||||||||||
Y Class | 12,813,335 | 24,303,477 | 658,999 | 5,529,636 | ||||||||||||||||||||||||
Investor Class | 1,252,478 | 5,738,579 | 746,996 | 5,612,764 | ||||||||||||||||||||||||
Advisor Class | 149,763 | 1,077,549 | - | - | ||||||||||||||||||||||||
A Class | 146,453 | 369,593 | - | - | ||||||||||||||||||||||||
C Class | 25,086 | 117,950 | - | - | ||||||||||||||||||||||||
R6 Class | 6,209,328 | 6,125,156 | - | - | ||||||||||||||||||||||||
Long-term capital gains | ||||||||||||||||||||||||||||
R5 Class | - | - | - | - | ||||||||||||||||||||||||
Y Class | - | - | - | - | ||||||||||||||||||||||||
Investor Class | - | - | - | - | ||||||||||||||||||||||||
Advisor Class | - | - | - | - | ||||||||||||||||||||||||
A Class | - | - | - | - | ||||||||||||||||||||||||
C Class | - | - | - | - | ||||||||||||||||||||||||
R6 Class | - | - | - | - | ||||||||||||||||||||||||
|
|
|
|
|
|
|
| |||||||||||||||||||||
Total distributions paid | $ | 39,839,976 | $ | 80,937,587 | $ | 1,559,786 | $ | 12,055,808 | ||||||||||||||||||||
|
|
|
|
|
|
|
| |||||||||||||||||||||
* For tax purposes, short-term capital gains are considered ordinary income distributions.
46
American Beacon FundsSM
Notes to Financial Statements
October 31, 2021
As of October 31, 2021, the tax cost for each Fund and their respective gross unrealized appreciation (depreciation) were as follows:
Fund | Tax Cost |
| Unrealized Appreciation |
| Unrealized (Depreciation) |
| Net Unrealized Appreciation (Depreciation) | |||||||||||||||||||||
International Equity | $ | 1,908,824,898 | $ | 295,383,104 | $ | (104,992,049 | ) | $ | 190,391,055 | |||||||||||||||||||
Tocqueville International Value | 289,209,411 | 86,879,939 | (9,151,233 | ) | 77,728,706 | |||||||||||||||||||||||
Fund | Net Unrealized Appreciation (Depreciation) |
| Undistributed Ordinary Income |
| Undistributed Long-Term Capital Gains |
| Accumulated Capital and Other (Losses) |
| Other Temporary Differences |
| Distributable Earnings | |||||||||||||||||||||||||||||||||
International Equity | $ | 190,391,055 | $ | 60,202,676 | $ | 137,584,079 | $ | - | $ | (1 | ) | $ | 388,177,809 | |||||||||||||||||||||||||||||||
Tocqueville International Value | 77,728,706 | 13,300,764 | - | (12,379,528 | ) | - | 78,649,942 | |||||||||||||||||||||||||||||||||||||
Financial reporting records are adjusted for permanent book/tax differences to reflect tax character. Financial records are not adjusted for temporary differences. The temporary differences between financial reporting and tax-basis reporting of unrealized appreciation (depreciation) are attributable primarily to the tax deferral of losses from wash sales, the realization for tax purposes of unrealized gains (losses) on certain derivative instruments, unused capital loss carryforwards, and the realization for tax purposes of unrealized gains from passive foreign investment companies.
Due to inherent differences in the recognition of income, expenses, and realized gains (losses) under U.S. GAAP and federal income tax regulations, permanent differences between book and tax reporting have been identified and appropriately reclassified on the Statements of Assets and Liabilities. The Funds had no permanent differences as of October 31, 2021.
For federal income tax purposes, the Fund measures its capital loss carryforwards annually at October 31, its fiscal year end. Capital loss carryforwards retain their character as short-term and/or long-term and may be carried forward and applied against future realized capital gains with no expiration date.
As of October 31, 2021, the Funds had the following capital loss carryforwards:
Fund | Short-Term Capital Loss Carryforwards |
| Long-Term Capital Loss Carryforwards | |||||||||
| International Equity | $ | - | $ | - | ||||||||
| Tocqueville International Value | - | 12,379,528 | ||||||||||
The International Equity Fund utilized $62,592,823 short-term and $89,404,879 long-term capital loss carryforwards. The Tocqueville International Value Fund utilized $6,777,051 short-term and $25,731,508 long-term capital loss carryforwards.
8. Investment Transactions
The aggregate cost of purchases and proceeds from sales and maturities of investments, other than short-term obligations, for the year ended October 31, 2021 were as follows:
Fund | Purchases (non-U.S. Government Securities) | Sales (non-U.S. Government Securities) | ||||||||||
| International Equity | $ | 973,144,670 | $ | 1,635,622,390 | ||||||||
| Tocqueville International Value | 122,030,139 | 173,132,313 | ||||||||||
47
American Beacon FundsSM
Notes to Financial Statements
October 31, 2021
A summary of the Funds’ transactions in the USG Select Fund for the year ended October 31, 2021 were as follows:
Fund | Type of Transaction | October 31, 2020 Shares/Fair Value | Purchases | Sales | October 31, 2021 Shares/Fair Value | |||||||||||||||||||||||||||||
| International Equity | Direct | $ | 55,081,499 | $ | 1,667,379,937 | $ | 1,663,398,951 | $ | 59,062,485 | |||||||||||||||||||||||||
| International Equity | Securities Lending | 5,030,543 | 378,191,575 | 375,566,982 | 7,655,136 | |||||||||||||||||||||||||||||
| Tocqueville International Value | Direct | 11,592,030 | 121,853,724 | 130,819,768 | 2,625,986 | |||||||||||||||||||||||||||||
| Tocqueville International Value | Securities Lending | 3,339,142 | 76,946,169 | 74,247,176 | 6,038,135 | |||||||||||||||||||||||||||||
Affiliated Trades:
Cross trades for the year ended October 31, 2021, if any, were executed by the Funds pursuant to procedures adopted by the Board to ensure compliance with Rule 17a-7 under the Act. Cross trading is the buying or selling of portfolio securities between funds of investment companies, or between a fund of an investment company and another entity, that are or could be considered affiliates by virtue of a common investment advisor (or affiliated investment advisors), common Trustees and/or common Officers. At its regularly scheduled meetings, the Chief Compliance Officer (“CCO”) certifies to the Board that the 17a-7 transactions entered into by the funds complied with the Rule 17a-7 Procedures adopted by the Board.
For the year ended October 31, 2021, cross trades by the Funds under Rule 17a-7 were as follows:
Portfolio | Purchases | Sales | Net Realized Gain (Loss) | |||||||||
International Equity | $ | 48,619 | $ | 1,239,758 | $ | (5,050 | ) | |||||
9. Securities Lending
The Funds may lend their securities to qualified financial institutions, such as certain broker-dealers, to earn additional income. The borrowers are required to secure their loans continuously with collateral in an amount at least equal to the fair value of the securities loaned, initially in an amount at least equal to 102% of the fair value of domestic securities loaned and 105% of the fair value of international securities loaned. Collateral is monitored and marked-to-market daily. Daily mark-to-market amounts are required to be paid to the borrower or received from the borrower by the end of the following business day. This one day settlement for mark-to-market amounts may result in the collateral being temporarily less than the value of the securities on loan or temporarily more than the required minimum collateral.
To the extent that a loan is collateralized by cash, such cash collateral shall be invested by the securities lending agent (the “Agent”) in money market mutual funds and other short-term investments, provided the investments meet certain quality and diversification requirements. Securities purchased with cash collateral proceeds are listed in the Funds’ Schedule of Investments and the collateral is shown on the Statements of Assets and Liabilities as a payable.
Securities lending income is generated from the demand premium (if any) paid by the borrower to borrow a specific security and from the return on investment of cash collateral, reduced by negotiated rebate fees paid to the borrower and transaction costs. To the extent that a loan is secured by non-cash collateral, securities lending income is generated as a demand premium reduced by transaction costs. The Funds, the Agent, and the Manager retained 80%, 10%, and 10%, respectively, of the income generated from securities lending.
While securities are on loan, the Funds continue to receive certain income associated with that security and any gain or loss in the market price that may occur during the term of the loan. In the case of domestic equities, the value of any dividend is received in the form of a substitute payment approximately equal to the dividend. In
48
American Beacon FundsSM
Notes to Financial Statements
October 31, 2021
the case of foreign securities, a negotiated amount is received that is less than the actual dividend, but higher than the dividend amount minus the foreign tax that the Funds would be subject to on the dividend.
Securities lending transactions pose certain risks to the Funds, including that the borrower may not provide additional collateral when required or return the securities when due, that the value of the short-term investments will be less than the amount of cash collateral required to be returned to the borrower, that non-cash collateral may be subject to legal constraints in the event of a borrower bankruptcy, and that the cash collateral investments could become illiquid and unable to be used to return collateral to the borrower. The Funds could also experience delays and costs in gaining access to the collateral. The Funds bear the risk of any deficiency in the amount of the cash collateral available for return to the borrower and any action which impairs its ability to liquidate non-cash collateral to satisfy a borrower default.
As of October 31, 2021, the value of outstanding securities on loan and the value of collateral were as follows:
Fund | Market Value of Securities on Loan | Cash Collateral Received | Non-Cash Collateral Received | Total Collateral Received | ||||||||||||||||||||||||
International Equity | $ | 33,717,931 | $ | 7,655,136 | $ | 28,322,230 | $ | 35,977,366 | ||||||||||||||||||||
Tocqueville International Value | 16,345,020 | 6,038,135 | 10,757,980 | 16,796,115 | ||||||||||||||||||||||||
Cash collateral is listed on the Funds’ Schedules of Investments and is shown on the Statements of Assets and Liabilities. Income earned on these investments is included in “Income derived from securities lending” on the Statements of Operations.
Non-cash collateral received by the Funds may not be sold or re-pledged except to satisfy a borrower default. Therefore, non-cash collateral is not included on the Funds’ Schedules of Investments or Statements of Assets and Liabilities.
10. Borrowing Arrangements
Effective November 12, 2020 (the “Effective Date”), the Funds, along with certain other funds managed by the Manager (“Participating Funds”), renewed a committed revolving line of credit (the “Committed Line”) agreement with State Street Bank and Trust Company (the “Bank”) to be used to facilitate portfolio liquidity. The maximum borrowing amount under the Committed Line is $150 million with interest at a rate equal to the higher of (a) Overnight Bank Funding Rate (“OBFR”) daily fluctuating rate per annum equal to 1.25% plus the sum of 0.10% or (b) the Federal Funds daily fluctuating rate per annum on amounts borrowed. Each of the Participating Funds paid a proportional amount of a closing fee of $100,000 on the Effective Date and a quarterly commitment fee at a rate of 0.25% per annum on the unused portion of the Committed Line amount. The Committed Line expires November 11, 2021, unless extended by the Bank or terminated by the Participating Funds in accordance with the agreement. Effective November 11, 2021, the Funds’ Committed Line was changed to a maximum of $100 million with an expiration of November 10, 2022.
On the Effective Date, the Funds, along with certain other Participating Funds managed by the Manager, also renewed an uncommitted discretionary demand revolving line of credit (the “Uncommitted Line”) agreement with the Bank to be used to facilitate portfolio liquidity. The maximum borrowing amount under the Uncommitted Line is $50 million with interest at a rate equal to the higher of (a) Overnight Bank Funding Rate (”OBFR”) daily fluctuating rate per annum equal to 1.25% plus the sum of 0.10% or (b) the Federal Funds daily fluctuating rate per annum on amounts borrowed on each outstanding loan. Each of the Participating Funds paid a proportional amount of a closing fee of $35,000 on the Effective Date. The Uncommitted Line expires November 11, 2021 unless extended by the Bank or terminated by the Participating Funds in accordance with the agreement. Effective November 11, 2021, the Funds’ Uncommitted Line was changed to a maximum of $100 million with an expiration of November 10, 2022.
49
American Beacon FundsSM
Notes to Financial Statements
October 31, 2021
The Participating Funds paid administration, legal and arrangement fees, which are recognized as a component of “Loan expense” on the Statements of Operations, along with commitment fees, that have been allocated among the Participating Funds based on average daily net assets.
During the year ended October 31, 2021, the Funds did not utilize this facility.
11. Capital Share Transactions
The tables below summarize the activity in capital shares for each Class of the Funds:
| R5 Class | ||||||||||||||||||||||||||||
| Year Ended October 31, 2021 | Year Ended October 31, 2020 | |||||||||||||||||||||||||||
International Equity Fund | Shares | Amount | Shares | Amount | ||||||||||||||||||||||||
| Shares sold | 15,909,693 | $ | 311,036,157 | 28,411,612 | $ | 413,054,584 | ||||||||||||||||||||||
| Reinvestment of dividends | 1,023,705 | 18,293,611 | 2,205,748 | 40,475,468 | ||||||||||||||||||||||||
| Shares redeemed | (17,231,226 | ) | (332,477,857 | ) | (47,892,354 | ) | (714,194,178 | ) | ||||||||||||||||||||
|
|
|
|
|
|
|
| |||||||||||||||||||||
| Net (decrease) in shares outstanding | (297,828 | ) | $ | (3,148,089 | ) | (17,274,994 | ) | $ | (260,664,126 | ) | ||||||||||||||||||
|
|
|
|
|
|
|
| |||||||||||||||||||||
| Y Class | ||||||||||||||||||||||||||||
| Year Ended October 31, 2021 | Year Ended October 31, 2020 | |||||||||||||||||||||||||||
International Equity Fund | Shares | Amount | Shares | Amount | ||||||||||||||||||||||||
| Shares sold | 7,224,999 | $ | 139,099,126 | 15,009,570 | $ | 226,696,600 | ||||||||||||||||||||||
| Reinvestment of dividends | 680,368 | 12,695,662 | 1,184,510 | 22,683,362 | ||||||||||||||||||||||||
| Shares redeemed | (39,792,200 | ) | (820,191,598 | ) | (20,937,732 | ) | (342,134,108 | ) | ||||||||||||||||||||
|
|
|
|
|
|
|
| |||||||||||||||||||||
| Net (decrease) in shares outstanding | (31,886,833 | ) | $ | (668,396,810 | ) | (4,743,652 | ) | $ | (92,754,146 | ) | ||||||||||||||||||
|
|
|
|
|
|
|
| |||||||||||||||||||||
| Investor Class | ||||||||||||||||||||||||||||
| Year Ended October 31, 2021 | Year Ended October 31, 2020 | |||||||||||||||||||||||||||
International Equity Fund | Shares | Amount | Shares | Amount | ||||||||||||||||||||||||
| Shares sold | 3,622,542 | $ | 70,802,228 | 1,943,992 | $ | 28,602,293 | ||||||||||||||||||||||
| Reinvestment of dividends | 68,848 | 1,222,060 | 311,501 | 5,672,429 | ||||||||||||||||||||||||
| Shares redeemed | (3,760,379 | ) | (71,763,443 | ) | (8,253,006 | ) | (123,295,754 | ) | ||||||||||||||||||||
|
|
|
|
|
|
|
| |||||||||||||||||||||
| Net increase (decrease) in shares outstanding | (68,989 | ) | $ | 260,845 | (5,997,513 | ) | $ | (89,021,032 | ) | |||||||||||||||||||
|
|
|
|
|
|
|
| |||||||||||||||||||||
| Advisor Class | ||||||||||||||||||||||||||||
| Year Ended October 31, 2021 | Year Ended October 31, 2020 | |||||||||||||||||||||||||||
International Equity Fund | Shares | Amount | Shares | Amount | ||||||||||||||||||||||||
| Shares sold | 124,326 | $ | 2,477,618 | 662,934 | $ | 9,904,449 | ||||||||||||||||||||||
| Reinvestment of dividends | 8,194 | 149,699 | 57,643 | 1,077,351 | ||||||||||||||||||||||||
| Shares redeemed | (322,694 | ) | (6,341,507 | ) | (2,124,838 | ) | (34,005,957 | ) | ||||||||||||||||||||
|
|
|
|
|
|
|
| |||||||||||||||||||||
| Net (decrease) in shares outstanding | (190,174 | ) | $ | (3,714,190 | ) | (1,404,261 | ) | $ | (23,024,157 | ) | ||||||||||||||||||
|
|
|
|
|
|
|
| |||||||||||||||||||||
| A Class | ||||||||||||||||||||||||||||
| Year Ended October 31, 2021 | Year Ended October 31, 2020 | |||||||||||||||||||||||||||
International Equity Fund | Shares | Amount | Shares | Amount | ||||||||||||||||||||||||
| Shares sold | 166,073 | $ | 3,203,132 | 248,254 | $ | 3,772,133 | ||||||||||||||||||||||
| Reinvestment of dividends | 8,158 | 144,484 | 20,020 | 364,173 | ||||||||||||||||||||||||
| Shares redeemed | (328,406 | ) | (6,319,853 | ) | (397,233 | ) | (6,125,328 | ) | ||||||||||||||||||||
|
|
|
|
|
|
|
| |||||||||||||||||||||
| Net (decrease) in shares outstanding | (154,175 | ) | $ | (2,972,237 | ) | (128,959 | ) | $ | (1,989,022 | ) | ||||||||||||||||||
|
|
|
|
|
|
|
| |||||||||||||||||||||
50
American Beacon FundsSM
Notes to Financial Statements
October 31, 2021
| C Class | ||||||||||||||||||||||||||||
| Year Ended October 31, 2021 | Year Ended October 31, 2020 | |||||||||||||||||||||||||||
International Equity Fund | Shares | Amount | Shares | Amount | ||||||||||||||||||||||||
| Shares sold | 46,799 | $ | 859,477 | 45,274 | $ | 697,918 | ||||||||||||||||||||||
| Reinvestment of dividends | 1,411 | 24,166 | 6,493 | 114,278 | ||||||||||||||||||||||||
| Shares redeemed | (69,515 | ) | (1,302,164 | ) | (165,810 | ) | (2,343,389 | ) | ||||||||||||||||||||
|
|
|
|
|
|
|
| |||||||||||||||||||||
| Net (decrease) in shares outstanding | (21,305 | ) | $ | (418,521 | ) | (114,043 | ) | $ | (1,531,193 | ) | ||||||||||||||||||
|
|
|
|
|
|
|
| |||||||||||||||||||||
| R6 Class | ||||||||||||||||||||||||||||
| Year Ended October 31, 2021 | Year Ended October 31, 2020 | |||||||||||||||||||||||||||
International Equity Fund | Shares | Amount | Shares | Amount | ||||||||||||||||||||||||
| Shares sold | 7,429,933 | $ | 144,937,439 | 19,524,226 | $ | 278,276,194 | ||||||||||||||||||||||
| Reinvestment of dividends | 339,656 | 6,079,842 | 319,483 | 5,868,905 | ||||||||||||||||||||||||
| Shares redeemed | (8,191,850 | ) | (160,504,629 | ) | (9,816,515 | ) | (153,229,952 | ) | ||||||||||||||||||||
|
|
|
|
|
|
|
| |||||||||||||||||||||
| Net increase (decrease) in shares outstanding | (422,261 | ) | $ | (9,487,348 | ) | 10,027,194 | $ | 130,915,147 | ||||||||||||||||||||
|
|
|
|
|
|
|
| |||||||||||||||||||||
| R5 Class | ||||||||||||||||||||||||||||
| Year Ended October 31, 2021 | Year Ended October 31, 2020 | |||||||||||||||||||||||||||
Tocqueville International Value Fund | Shares | Amount | Shares | Amount | ||||||||||||||||||||||||
| Shares sold | 165,473 | $ | 3,170,509 | 254,151 | $ | 3,799,313 | ||||||||||||||||||||||
| Reinvestment of dividends | 8,607 | 153,726 | 56,556 | 910,567 | ||||||||||||||||||||||||
| Shares redeemed | (409,748 | ) | (7,842,762 | ) | (1,379,136 | ) | (17,985,926 | ) | ||||||||||||||||||||
|
|
|
|
|
|
|
| |||||||||||||||||||||
| Net (decrease) in shares outstanding | (235,668 | ) | $ | (4,518,527 | ) | (1,068,429 | ) | $ | (13,276,046 | ) | ||||||||||||||||||
|
|
|
|
|
|
|
| |||||||||||||||||||||
| Y Class | ||||||||||||||||||||||||||||
| Year Ended October 31, 2021 | Year Ended October 31, 2020 | |||||||||||||||||||||||||||
Tocqueville International Value Fund | Shares | Amount | Shares | Amount | ||||||||||||||||||||||||
| Shares sold | 2,865,875 | $ | 56,537,915 | 2,542,137 | $ | 38,027,861 | ||||||||||||||||||||||
| Reinvestment of dividends | 26,969 | 481,673 | 223,999 | 3,604,138 | ||||||||||||||||||||||||
| Shares redeemed | (3,442,561 | ) | (62,946,165 | ) | (8,650,732 | ) | (124,089,686 | ) | ||||||||||||||||||||
|
|
|
|
|
|
|
| |||||||||||||||||||||
| Net (decrease) in shares outstanding | (549,717 | ) | $ | (5,926,577 | ) | (5,884,596 | ) | $ | (82,457,687 | ) | ||||||||||||||||||
|
|
|
|
|
|
|
| |||||||||||||||||||||
| Investor Class | ||||||||||||||||||||||||||||
| Year Ended October 31, 2021 | Year Ended October 31, 2020 | |||||||||||||||||||||||||||
Tocqueville International Value Fund | Shares | Amount | Shares | Amount | ||||||||||||||||||||||||
| Shares sold | 714,528 | $ | 13,893,147 | 1,585,655 | $ | 23,429,214 | ||||||||||||||||||||||
| Reinvestment of dividends | 39,369 | 706,277 | 331,320 | 5,357,440 | ||||||||||||||||||||||||
| Shares redeemed | (4,296,803 | ) | (82,841,829 | ) | (11,936,282 | ) | (176,506,234 | ) | ||||||||||||||||||||
|
|
|
|
|
|
|
| |||||||||||||||||||||
| Net (decrease) in shares outstanding | (3,542,906 | ) | $ | (68,242,405 | ) | (10,019,307 | ) | $ | (147,719,580 | ) | ||||||||||||||||||
|
|
|
|
|
|
|
| |||||||||||||||||||||
12. Subsequent Events
Management has evaluated subsequent events for possible recognition or disclosure in the financial statements through the date the financial statements are issued. Management has determined that there are no material events that would require disclosure in the Funds’ financial statements through this date.
51
American Beacon International Equity FundSM
(For a share outstanding throughout the period)
| R5 ClassA | ||||||||||||||||||||||||||||||||||||
| Year Ended October 31, | ||||||||||||||||||||||||||||||||||||
| 2021 | 2020B | 2019 | 2018 | 2017 | ||||||||||||||||||||||||||||||||
|
| |||||||||||||||||||||||||||||||||||
Net asset value, beginning of period | $ | 14.73 | $ | 18.06 | $ | 18.71 | $ | 20.88 | $ | 17.41 | ||||||||||||||||||||||||||
|
|
|
|
|
|
|
|
|
|
|
| |||||||||||||||||||||||||
Income (loss) from investment operations: | ||||||||||||||||||||||||||||||||||||
Net investment income | 0.45 | C | 0.36 | 0.55 | 0.44 | 0.39 | ||||||||||||||||||||||||||||||
Net gains (losses) on investments (both realized and unrealized) | 5.43 | (3.15 | ) | 0.34 | (1.95 | ) | 3.51 | |||||||||||||||||||||||||||||
|
|
|
|
|
|
|
|
|
| |||||||||||||||||||||||||||
Total income (loss) from investment operations | 5.88 | (2.79 | ) | 0.89 | (1.51 | ) | 3.90 | |||||||||||||||||||||||||||||
|
|
|
|
|
|
|
|
|
| |||||||||||||||||||||||||||
Less distributions: | ||||||||||||||||||||||||||||||||||||
Dividends from net investment income | (0.30 | ) | (0.54 | ) | (0.40 | ) | (0.35 | ) | (0.43 | ) | ||||||||||||||||||||||||||
Distributions from net realized gains | - | - | (1.14 | ) | (0.31 | ) | - | |||||||||||||||||||||||||||||
|
|
|
|
|
|
|
|
|
| |||||||||||||||||||||||||||
Total distributions | (0.30 | ) | (0.54 | ) | (1.54 | ) | (0.66 | ) | (0.43 | ) | ||||||||||||||||||||||||||
|
|
|
|
|
|
|
|
|
| |||||||||||||||||||||||||||
Net asset value, end of period | $ | 20.31 | $ | 14.73 | $ | 18.06 | $ | 18.71 | $ | 20.88 | ||||||||||||||||||||||||||
|
|
|
|
|
|
|
|
|
|
|
| |||||||||||||||||||||||||
Total returnD | 40.18 | % | (16.04 | )% | 5.94 | % | (7.55 | )% | 22.94 | % | ||||||||||||||||||||||||||
|
|
|
|
|
|
|
|
|
| |||||||||||||||||||||||||||
Ratios and supplemental data: | ||||||||||||||||||||||||||||||||||||
Net assets, end of period | $ | 1,329,626,349 | $ | 968,859,543 | $ | 1,499,867,401 | $ | 1,613,462,237 | $ | 1,644,165,106 | ||||||||||||||||||||||||||
Ratios to average net assets: | ||||||||||||||||||||||||||||||||||||
Expenses, before reimbursements and/or recoupments | 0.73 | % | 0.72 | % | 0.73 | % | 0.73 | % | 0.73 | % | ||||||||||||||||||||||||||
Expenses, net of reimbursements and/or recoupments | 0.73 | % | 0.72 | % | 0.73 | % | 0.73 | % | 0.73 | % | ||||||||||||||||||||||||||
Net investment income, before expense reimbursements and/or recoupments | 2.31 | %C | 1.83 | % | 2.93 | % | 2.17 | % | 2.01 | % | ||||||||||||||||||||||||||
Net investment income, net of reimbursements and/or recoupments | 2.31 | %C | 1.83 | % | 2.93 | % | 2.17 | % | 2.01 | % | ||||||||||||||||||||||||||
Portfolio turnover rate | 41 | % | 77 | % | 36 | % | 29 | % | 32 | % | ||||||||||||||||||||||||||
| A | Prior to February 28, 2020, the R5 Class was known as Institutional Class. |
| B | On January 29, 2020, Templeton Investment Counsel, LLC, was terminated and ceased managing assets of the Fund. On January 30, 2020, American Century Investment Management, Inc. began managing assets of the Fund. |
| C | Net investment income includes significant dividend payment from Vivendi SE amounting to $0.0746. |
| D | Based on net asset value, which does not reflect the sales charge, redemption fee, or contingent deferred sales charge, if applicable. May include adjustments in accordance with U.S. GAAP and as such, the net asset value for reporting purposes and the returns based upon those net asset values may differ from the net asset value and returns for shareholder transactions. |
See accompanying notes
52
American Beacon International Equity FundSM
Financial Highlights
(For a share outstanding throughout the period)
| Y Class | ||||||||||||||||||||||||||||||||||||
| Year Ended October 31, | ||||||||||||||||||||||||||||||||||||
| 2021 | 2020A | 2019 | 2018 | 2017 | ||||||||||||||||||||||||||||||||
|
| |||||||||||||||||||||||||||||||||||
Net asset value, beginning of period | $ | 15.36 | $ | 18.81 | $ | 19.42 | $ | 21.64 | $ | 18.03 | ||||||||||||||||||||||||||
|
|
|
|
|
|
|
|
|
|
|
| |||||||||||||||||||||||||
Income (loss) from investment operations: | ||||||||||||||||||||||||||||||||||||
Net investment income | 1.83 | B | 0.36 | 0.54 | 0.46 | 0.38 | ||||||||||||||||||||||||||||||
Net gains (losses) on investments (both realized and unrealized) | 4.27 | (3.28 | ) | 0.37 | (2.04 | ) | 3.65 | |||||||||||||||||||||||||||||
|
|
|
|
|
|
|
|
|
| |||||||||||||||||||||||||||
Total income (loss) from investment operations | 6.10 | (2.92 | ) | 0.91 | (1.58 | ) | 4.03 | |||||||||||||||||||||||||||||
|
|
|
|
|
|
|
|
|
| |||||||||||||||||||||||||||
Less distributions: | ||||||||||||||||||||||||||||||||||||
Dividends from net investment income | (0.28 | ) | (0.53 | ) | (0.38 | ) | (0.33 | ) | (0.42 | ) | ||||||||||||||||||||||||||
Distributions from net realized gains | - | - | (1.14 | ) | (0.31 | ) | - | |||||||||||||||||||||||||||||
|
|
|
|
|
|
|
|
|
| |||||||||||||||||||||||||||
Total distributions | (0.28 | ) | (0.53 | ) | (1.52 | ) | (0.64 | ) | (0.42 | ) | ||||||||||||||||||||||||||
|
|
|
|
|
|
|
|
|
| |||||||||||||||||||||||||||
Net asset value, end of period | $ | 21.18 | $ | 15.36 | $ | 18.81 | $ | 19.42 | $ | 21.64 | ||||||||||||||||||||||||||
|
|
|
|
|
|
|
|
|
|
|
| |||||||||||||||||||||||||
Total returnC | 39.99 | % | (16.09 | )% | 5.83 | % | (7.58 | )% | 22.84 | % | ||||||||||||||||||||||||||
|
|
|
|
|
|
|
|
|
| |||||||||||||||||||||||||||
Ratios and supplemental data: | ||||||||||||||||||||||||||||||||||||
Net assets, end of period | $ | 233,692,916 | $ | 659,159,857 | $ | 896,442,437 | $ | 904,847,058 | $ | 1,029,629,647 | ||||||||||||||||||||||||||
Ratios to average net assets: | ||||||||||||||||||||||||||||||||||||
Expenses, before reimbursements and/or recoupments | 0.79 | % | 0.80 | % | 0.80 | % | 0.80 | % | 0.80 | % | ||||||||||||||||||||||||||
Expenses, net of reimbursements and/or recoupments | 0.79 | % | 0.80 | % | 0.80 | % | 0.80 | % | 0.80 | % | ||||||||||||||||||||||||||
Net investment income, before expense reimbursements and/or recoupments | 2.01 | %B | 1.77 | % | 2.87 | % | 2.10 | % | 1.95 | % | ||||||||||||||||||||||||||
Net investment income, net of reimbursements and/or recoupments | 2.01 | %B | 1.77 | % | 2.87 | % | 2.10 | % | 1.95 | % | ||||||||||||||||||||||||||
Portfolio turnover rate | 41 | % | 77 | % | 36 | % | 29 | % | 32 | % | ||||||||||||||||||||||||||
| A | On January 29, 2020, Templeton Investment Counsel, LLC, was terminated and ceased managing assets of the Fund. On January 30, 2020, American Century Investment Management, Inc. began managing assets of the Fund. |
| B | Net investment income includes significant dividend payment from Vivendi SE amounting to $0.0243. |
| C | Based on net asset value, which does not reflect the sales charge, redemption fee, or contingent deferred sales charge, if applicable. May include adjustments in accordance with U.S. GAAP and as such, the net asset value for reporting purposes and the returns based upon those net asset values may differ from the net asset value and returns for shareholder transactions. |
See accompanying notes
53
American Beacon International Equity FundSM
Financial Highlights
(For a share outstanding throughout the period)
| Investor Class | ||||||||||||||||||||||||||||||||||||
| Year Ended October 31, | ||||||||||||||||||||||||||||||||||||
| 2021 | 2020A | 2019 | 2018 | 2017 | ||||||||||||||||||||||||||||||||
|
| |||||||||||||||||||||||||||||||||||
Net asset value, beginning of period | $ | 14.57 | $ | 17.87 | $ | 18.52 | $ | 20.67 | $ | 17.24 | ||||||||||||||||||||||||||
|
|
|
|
|
|
|
|
|
|
|
| |||||||||||||||||||||||||
Income (loss) from investment operations: | ||||||||||||||||||||||||||||||||||||
Net investment income | 0.38 | B | 0.40 | 0.49 | 0.41 | 0.35 | ||||||||||||||||||||||||||||||
Net gains (losses) on investments (both realized and unrealized) | 5.38 | (3.22 | ) | 0.33 | (1.97 | ) | 3.45 | |||||||||||||||||||||||||||||
|
|
|
|
|
|
|
|
|
| |||||||||||||||||||||||||||
Total income (loss) from investment operations | 5.76 | (2.82 | ) | 0.82 | (1.56 | ) | 3.80 | |||||||||||||||||||||||||||||
|
|
|
|
|
|
|
|
|
| |||||||||||||||||||||||||||
Less distributions: | ||||||||||||||||||||||||||||||||||||
Dividends from net investment income | (0.22 | ) | (0.48 | ) | (0.33 | ) | (0.28 | ) | (0.37 | ) | ||||||||||||||||||||||||||
Distributions from net realized gains | - | - | (1.14 | ) | (0.31 | ) | - | |||||||||||||||||||||||||||||
|
|
|
|
|
|
|
|
|
| |||||||||||||||||||||||||||
Total distributions | (0.22 | ) | (0.48 | ) | (1.47 | ) | (0.59 | ) | (0.37 | ) | ||||||||||||||||||||||||||
|
|
|
|
|
|
|
|
|
| |||||||||||||||||||||||||||
Net asset value, end of period | $ | 20.11 | $ | 14.57 | $ | 17.87 | $ | 18.52 | $ | 20.67 | ||||||||||||||||||||||||||
|
|
|
|
|
|
|
|
|
|
|
| |||||||||||||||||||||||||
Total returnC | 39.72 | % | (16.33 | )% | 5.55 | % | (7.86 | )% | 22.50 | % | ||||||||||||||||||||||||||
|
|
|
|
|
|
|
|
|
| |||||||||||||||||||||||||||
Ratios and supplemental data: | ||||||||||||||||||||||||||||||||||||
Net assets, end of period | $ | 126,691,864 | $ | 92,817,287 | $ | 221,043,036 | $ | 250,804,403 | $ | 316,589,769 | ||||||||||||||||||||||||||
Ratios to average net assets: | ||||||||||||||||||||||||||||||||||||
Expenses, before reimbursements and/or recoupments | 1.06 | % | 1.07 | % | 1.05 | % | 1.06 | % | 1.07 | % | ||||||||||||||||||||||||||
Expenses, net of reimbursements and/or recoupments | 1.06 | % | 1.07 | % | 1.05 | % | 1.06 | % | 1.07 | % | ||||||||||||||||||||||||||
Net investment income, before expense reimbursements and/or recoupments | 1.98 | %B | 1.35 | % | 2.59 | % | 1.83 | % | 1.69 | % | ||||||||||||||||||||||||||
Net investment income, net of reimbursements and/or recoupments | 1.98 | %B | 1.35 | % | 2.59 | % | 1.83 | % | 1.69 | % | ||||||||||||||||||||||||||
Portfolio turnover rate | 41 | % | 77 | % | 36 | % | 29 | % | 32 | % | ||||||||||||||||||||||||||
| A | On January 29, 2020, Templeton Investment Counsel, LLC, was terminated and ceased managing assets of the Fund. On January 30, 2020, American Century Investment Management, Inc. began managing assets of the Fund. |
| B | Net investment income includes significant dividend payment from Vivendi SE amounting to $0.0785. |
| C | Based on net asset value, which does not reflect the sales charge, redemption fee, or contingent deferred sales charge, if applicable. May include adjustments in accordance with U.S. GAAP and as such, the net asset value for reporting purposes and the returns based upon those net asset values may differ from the net asset value and returns for shareholder transactions. |
See accompanying notes
54
American Beacon International Equity FundSM
Financial Highlights
(For a share outstanding throughout the period)
| Advisor Class | ||||||||||||||||||||||||||||||||||||
| Year Ended October 31, | ||||||||||||||||||||||||||||||||||||
| 2021 | 2020A | 2019 | 2018 | 2017 | ||||||||||||||||||||||||||||||||
|
| |||||||||||||||||||||||||||||||||||
Net asset value, beginning of period | $ | 14.94 | $ | 18.31 | $ | 18.93 | $ | 21.15 | $ | 17.62 | ||||||||||||||||||||||||||
|
|
|
|
|
|
|
|
|
|
|
| |||||||||||||||||||||||||
Income (loss) from investment operations: | ||||||||||||||||||||||||||||||||||||
Net investment income | 0.41 | B | 0.37 | 0.43 | 0.36 | 0.23 | ||||||||||||||||||||||||||||||
Net gains (losses) on investments (both realized and unrealized) | 5.48 | (3.29 | ) | 0.39 | (1.99 | ) | 3.64 | |||||||||||||||||||||||||||||
|
|
|
|
|
|
|
|
|
| |||||||||||||||||||||||||||
Total income (loss) from investment operations | 5.89 | (2.92 | ) | 0.82 | (1.63 | ) | 3.87 | |||||||||||||||||||||||||||||
|
|
|
|
|
|
|
|
|
| |||||||||||||||||||||||||||
Less distributions: | ||||||||||||||||||||||||||||||||||||
Dividends from net investment income | (0.15 | ) | (0.45 | ) | (0.30 | ) | (0.28 | ) | (0.34 | ) | ||||||||||||||||||||||||||
Distributions from net realized gains | - | - | (1.14 | ) | (0.31 | ) | - | |||||||||||||||||||||||||||||
|
|
|
|
|
|
|
|
|
| |||||||||||||||||||||||||||
Total distributions | (0.15 | ) | (0.45 | ) | (1.44 | ) | (0.59 | ) | (0.34 | ) | ||||||||||||||||||||||||||
|
|
|
|
|
|
|
|
|
| |||||||||||||||||||||||||||
Net asset value, end of period | $ | 20.68 | $ | 14.94 | $ | 18.31 | $ | 18.93 | $ | 21.15 | ||||||||||||||||||||||||||
|
|
|
|
|
|
|
|
|
|
|
| |||||||||||||||||||||||||
Total returnC | 39.53 | % | (16.43 | )% | 5.38 | % | (7.99 | )% | 22.38 | % | ||||||||||||||||||||||||||
|
|
|
|
|
|
|
|
|
| |||||||||||||||||||||||||||
Ratios and supplemental data: | ||||||||||||||||||||||||||||||||||||
Net assets, end of period | $ | 18,745,607 | $ | 16,387,094 | $ | 45,797,068 | $ | 48,571,916 | $ | 55,715,606 | ||||||||||||||||||||||||||
Ratios to average net assets: | ||||||||||||||||||||||||||||||||||||
Expenses, before reimbursements and/or recoupments | 1.20 | % | 1.20 | % | 1.20 | % | 1.20 | % | 1.20 | % | ||||||||||||||||||||||||||
Expenses, net of reimbursements and/or recoupments | 1.20 | % | 1.20 | % | 1.20 | % | 1.20 | % | 1.20 | % | ||||||||||||||||||||||||||
Net investment income, before expense reimbursements and/or recoupments | 1.79 | %B | 1.34 | % | 2.40 | % | 1.70 | % | 1.51 | % | ||||||||||||||||||||||||||
Net investment income, net of reimbursements and/or recoupments | 1.79 | %B | 1.34 | % | 2.40 | % | 1.70 | % | 1.51 | % | ||||||||||||||||||||||||||
Portfolio turnover rate | 41 | % | 77 | % | 36 | % | 29 | % | 32 | % | ||||||||||||||||||||||||||
| A | On January 29, 2020, Templeton Investment Counsel, LLC, was terminated and ceased managing assets of the Fund. On January 30, 2020, American Century Investment Management, Inc. began managing assets of the Fund. |
| B | Net investment income includes significant dividend payment from Vivendi SE amounting to $0.0709. |
| C | Based on net asset value, which does not reflect the sales charge, redemption fee, or contingent deferred sales charge, if applicable. May include adjustments in accordance with U.S. GAAP and as such, the net asset value for reporting purposes and the returns based upon those net asset values may differ from the net asset value and returns for shareholder transactions. |
See accompanying notes
55
American Beacon International Equity FundSM
Financial Highlights
(For a share outstanding throughout the period)
| A Class | ||||||||||||||||||||||||||||||||||||
| Year Ended October 31, | ||||||||||||||||||||||||||||||||||||
| 2021 | 2020A | 2019 | 2018 | 2017 | ||||||||||||||||||||||||||||||||
|
| |||||||||||||||||||||||||||||||||||
Net asset value, beginning of period | $ | 14.55 | $ | 17.85 | $ | 18.50 | $ | 20.63 | $ | 17.23 | ||||||||||||||||||||||||||
|
|
|
|
|
|
|
|
|
|
|
| |||||||||||||||||||||||||
Income (loss) from investment operations: | ||||||||||||||||||||||||||||||||||||
Net investment income | 0.36 | B | 0.21 | 0.45 | 0.38 | 0.30 | ||||||||||||||||||||||||||||||
Net gains (losses) on investments (both realized and unrealized) | 5.38 | (3.04 | ) | 0.36 | (1.95 | ) | 3.48 | |||||||||||||||||||||||||||||
|
|
|
|
|
|
|
|
|
| |||||||||||||||||||||||||||
Total income (loss) from investment operations | 5.74 | (2.83 | ) | 0.81 | (1.57 | ) | 3.78 | |||||||||||||||||||||||||||||
|
|
|
|
|
|
|
|
|
| |||||||||||||||||||||||||||
Less distributions: | ||||||||||||||||||||||||||||||||||||
Dividends from net investment income | (0.23 | ) | (0.47 | ) | (0.32 | ) | (0.25 | ) | (0.38 | ) | ||||||||||||||||||||||||||
Distributions from net realized gains | - | - | (1.14 | ) | (0.31 | ) | - | |||||||||||||||||||||||||||||
|
|
|
|
|
|
|
|
|
| |||||||||||||||||||||||||||
Total distributions | (0.23 | ) | (0.47 | ) | (1.46 | ) | (0.56 | ) | (0.38 | ) | ||||||||||||||||||||||||||
|
|
|
|
|
|
|
|
|
| |||||||||||||||||||||||||||
Net asset value, end of period | $ | 20.06 | $ | 14.55 | $ | 17.85 | $ | 18.50 | $ | 20.63 | ||||||||||||||||||||||||||
|
|
|
|
|
|
|
|
|
|
|
| |||||||||||||||||||||||||
Total returnC | 39.65 | % | (16.37 | )% | 5.46 | % | (7.89 | )% | 22.43 | % | ||||||||||||||||||||||||||
|
|
|
|
|
|
|
|
|
| |||||||||||||||||||||||||||
Ratios and supplemental data: | ||||||||||||||||||||||||||||||||||||
Net assets, end of period | $ | 10,017,801 | $ | 9,512,972 | $ | 13,973,709 | $ | 14,141,551 | $ | 17,829,657 | ||||||||||||||||||||||||||
Ratios to average net assets: | ||||||||||||||||||||||||||||||||||||
Expenses, before reimbursements and/or recoupments | 1.13 | % | 1.13 | % | 1.15 | % | 1.08 | % | 1.12 | % | ||||||||||||||||||||||||||
Expenses, net of reimbursements and/or recoupments | 1.13 | % | 1.13 | % | 1.15 | % | 1.08 | % | 1.12 | % | ||||||||||||||||||||||||||
Net investment income, before expense reimbursements and/or recoupments | 1.83 | %B | 1.35 | % | 2.50 | % | 1.80 | % | 1.65 | % | ||||||||||||||||||||||||||
Net investment income, net of reimbursements and/or recoupments | 1.83 | %B | 1.35 | % | 2.50 | % | 1.80 | % | 1.65 | % | ||||||||||||||||||||||||||
Portfolio turnover rate | 41 | % | 77 | % | 36 | % | 29 | % | 32 | % | ||||||||||||||||||||||||||
| A | On January 29, 2020, Templeton Investment Counsel, LLC, was terminated and ceased managing assets of the Fund. On January 30, 2020, American Century Investment Management, Inc. began managing assets of the Fund. |
| B | Net investment income includes significant dividend payment from Vivendi SE amounting to $0.0643. |
| C | Based on net asset value, which does not reflect the sales charge, redemption fee, or contingent deferred sales charge, if applicable. May include adjustments in accordance with U.S. GAAP and as such, the net asset value for reporting purposes and the returns based upon those net asset values may differ from the net asset value and returns for shareholder transactions. |
See accompanying notes
56
American Beacon International Equity FundSM
Financial Highlights
(For a share outstanding throughout the period)
| C Class | ||||||||||||||||||||||||||||||||||||
| Year Ended October 31, | ||||||||||||||||||||||||||||||||||||
| 2021 | 2020A | 2019 | 2018 | 2017 | ||||||||||||||||||||||||||||||||
|
| |||||||||||||||||||||||||||||||||||
Net asset value, beginning of period | $ | 13.99 | $ | 17.18 | $ | 17.84 | $ | 19.93 | $ | 16.73 | ||||||||||||||||||||||||||
|
|
|
|
|
|
|
|
|
|
|
| |||||||||||||||||||||||||
Income (loss) from investment operations: | ||||||||||||||||||||||||||||||||||||
Net investment income | 0.19 | B | 0.01 | 0.29 | 0.22 | 0.17 | ||||||||||||||||||||||||||||||
Net gains (losses) on investments (both realized and unrealized) | 5.19 | (2.86 | ) | 0.37 | (1.87 | ) | 3.36 | |||||||||||||||||||||||||||||
|
|
|
|
|
|
|
|
|
| |||||||||||||||||||||||||||
Total income (loss) from investment operations | 5.38 | (2.85 | ) | 0.66 | (1.65 | ) | 3.53 | |||||||||||||||||||||||||||||
|
|
|
|
|
|
|
|
|
| |||||||||||||||||||||||||||
Less distributions: | ||||||||||||||||||||||||||||||||||||
Dividends from net investment income | (0.10 | ) | (0.34 | ) | (0.18 | ) | (0.13 | ) | (0.33 | ) | ||||||||||||||||||||||||||
Distributions from net realized gains | - | - | (1.14 | ) | (0.31 | ) | - | |||||||||||||||||||||||||||||
|
|
|
|
|
|
|
|
|
| |||||||||||||||||||||||||||
Total distributions | (0.10 | ) | (0.34 | ) | (1.32 | ) | (0.44 | ) | (0.33 | ) | ||||||||||||||||||||||||||
|
|
|
|
|
|
|
|
|
| |||||||||||||||||||||||||||
Net asset value, end of period | $ | 19.27 | $ | 13.99 | $ | 17.18 | $ | 17.84 | $ | 19.93 | ||||||||||||||||||||||||||
|
|
|
|
|
|
|
|
|
|
|
| |||||||||||||||||||||||||
Total returnC | 38.56 | % | (16.98 | )% | 4.69 | % | (8.52 | )% | 21.50 | % | ||||||||||||||||||||||||||
|
|
|
|
|
|
|
|
|
| |||||||||||||||||||||||||||
Ratios and supplemental data: | ||||||||||||||||||||||||||||||||||||
Net assets, end of period | $ | 4,317,179 | $ | 3,431,934 | $ | 6,174,460 | $ | 6,625,329 | $ | 7,622,425 | ||||||||||||||||||||||||||
Ratios to average net assets: | ||||||||||||||||||||||||||||||||||||
Expenses, before reimbursements and/or recoupments | 1.86 | % | 1.86 | % | 1.87 | % | 1.81 | % | 1.88 | % | ||||||||||||||||||||||||||
Expenses, net of reimbursements and/or recoupments | 1.86 | % | 1.86 | % | 1.87 | % | 1.81 | % | 1.88 | % | ||||||||||||||||||||||||||
Net investment income, before expense reimbursements and/or recoupments | 1.14 | %B | 0.61 | % | 1.73 | % | 1.08 | % | 0.96 | % | ||||||||||||||||||||||||||
Net investment income, net of reimbursements and/or recoupments | 1.14 | %B | 0.61 | % | 1.73 | % | 1.08 | % | 0.96 | % | ||||||||||||||||||||||||||
Portfolio turnover rate | 41 | % | 77 | % | 36 | % | 29 | % | 32 | % | ||||||||||||||||||||||||||
| A | On January 29, 2020, Templeton Investment Counsel, LLC, was terminated and ceased managing assets of the Fund. On January 30, 2020, American Century Investment Management, Inc. began managing assets of the Fund. |
| B | Net investment income includes significant dividend payment from Vivendi SE amounting to $0.0667. |
| C | Based on net asset value, which does not reflect the sales charge, redemption fee, or contingent deferred sales charge, if applicable. May include adjustments in accordance with U.S. GAAP and as such, the net asset value for reporting purposes and the returns based upon those net asset values may differ from the net asset value and returns for shareholder transactions. |
See accompanying notes
57
American Beacon International Equity FundSM
Financial Highlights
(For a share outstanding throughout the period)
| R6 Class | ||||||||||||||||||||||||||||||||||||
| Year Ended October 31, | | February 28, 2017B to October 31, 2017 | | |||||||||||||||||||||||||||||||||
| 2021 | 2020A | 2019 | 2018 | |||||||||||||||||||||||||||||||||
|
|
|
|
|
| |||||||||||||||||||||||||||||||
Net asset value, beginning of period | $ | 14.76 | $ | 18.08 | $ | 18.73 | $ | 20.89 | $ | 17.80 | ||||||||||||||||||||||||||
|
|
|
|
|
|
|
|
|
|
|
| |||||||||||||||||||||||||
Income from investment operations: | ||||||||||||||||||||||||||||||||||||
Net investment income | 0.45 | C | 0.39 | 0.51 | 0.39 | 0.08 | ||||||||||||||||||||||||||||||
Net gains (losses) on investments (both realized and unrealized) | 5.44 | (3.16 | ) | 0.39 | (1.88 | ) | 3.01 | |||||||||||||||||||||||||||||
|
|
|
|
|
|
|
|
|
| |||||||||||||||||||||||||||
Total income (loss) from investment operations | 5.89 | (2.77 | ) | 0.90 | (1.49 | ) | 3.09 | |||||||||||||||||||||||||||||
|
|
|
|
|
|
|
|
|
| |||||||||||||||||||||||||||
Less distributions: | ||||||||||||||||||||||||||||||||||||
Dividends from net investment income | (0.30 | ) | (0.55 | ) | (0.41 | ) | (0.36 | ) | - | |||||||||||||||||||||||||||
Distributions from net realized gains | - | - | (1.14 | ) | (0.31 | ) | - | |||||||||||||||||||||||||||||
|
|
|
|
|
|
|
|
|
| |||||||||||||||||||||||||||
Total distributions | (0.30 | ) | (0.55 | ) | (1.55 | ) | (0.67 | ) | - | |||||||||||||||||||||||||||
|
|
|
|
|
|
|
|
|
| |||||||||||||||||||||||||||
Net asset value, end of period | $ | 20.35 | $ | 14.76 | $ | 18.08 | $ | 18.73 | $ | 20.89 | ||||||||||||||||||||||||||
|
|
|
|
|
|
|
|
|
| |||||||||||||||||||||||||||
Total returnD | 40.20 | % | (15.93 | )% | 5.98 | % | (7.47 | )% | 17.36 | %E | ||||||||||||||||||||||||||
|
|
|
|
|
|
|
|
|
|
|
| |||||||||||||||||||||||||
Ratios and supplemental data: | ||||||||||||||||||||||||||||||||||||
Net assets, end of period | $ | 397,732,934 | $ | 294,708,893 | $ | 179,802,437 | $ | 48,725,523 | $ | 6,367,999 | ||||||||||||||||||||||||||
Ratios to average net assets: | ||||||||||||||||||||||||||||||||||||
Expenses, before reimbursements and/or recoupments | 0.71 | % | 0.72 | % | 0.70 | % | 0.70 | % | 0.89 | %F | ||||||||||||||||||||||||||
Expenses, net of reimbursements and/or recoupments | 0.70 | %G | 0.69 | % | 0.66 | % | 0.66 | % | 0.66 | %F | ||||||||||||||||||||||||||
Net investment income, before expense reimbursements and/or recoupments | 2.30 | %C | 1.88 | % | 3.09 | % | 2.11 | % | 1.63 | %F | ||||||||||||||||||||||||||
Net investment income, net of reimbursements and/or recoupments | 2.31 | %C | 1.91 | % | 3.13 | % | 2.15 | % | 1.85 | %F | ||||||||||||||||||||||||||
Portfolio turnover rate | 41 | % | 77 | % | 36 | % | 29 | % | 32 | %H | ||||||||||||||||||||||||||
| A | On January 29, 2020, Templeton Investment Counsel, LLC, was terminated and ceased managing assets of the Fund. On January 30, 2020, American Century Investment Management, Inc. began managing assets of the Fund. |
| B | Commencement of operations. |
| C | Net investment income includes significant dividend payment from Vivendi SE amounting to $0.0738. |
| D | Based on net asset value, which does not reflect the sales charge, redemption fee, or contingent deferred sales charge, if applicable. May include adjustments in accordance with U.S. GAAP and as such, the net asset value for reporting purposes and the returns based upon those net asset values may differ from the net asset value and returns for shareholder transactions. |
| E | Not annualized. |
| F | Annualized. |
| G | Expense ratios may exceed stated expense caps in Note 2 due to security lending expenses. |
| H | Portfolio turnover rate is for the period from February 28, 2017 through October 31, 2017 and is not annualized. |
See accompanying notes
58
American Beacon Tocqueville International Value FundSM
Financial Highlights
(For a share outstanding throughout the period)
| R5 ClassA | ||||||||||||||||||||
| Year Ended October 31, | January 22, | |||||||||||||||||||
| 2021 | 2020 | |||||||||||||||||||
|
|
|
|
|
|
|
|
|
| |||||||||||
Net asset value, beginning of period | $ | 15.58 | $ | 15.65 | $ | 14.78 | ||||||||||||||
|
|
|
|
|
| |||||||||||||||
Income from investment operations: | ||||||||||||||||||||
Net investment income | 0.60 | C | 0.03 | 0.21 | ||||||||||||||||
Net gains on investments (both realized and unrealized) | 3.50 | 0.29 | 0.66 | |||||||||||||||||
|
|
|
|
|
| |||||||||||||||
Total income from investment operations | 4.10 | 0.32 | 0.87 | |||||||||||||||||
|
|
|
|
|
| |||||||||||||||
Less distributions: | ||||||||||||||||||||
Dividends from net investment income | (0.12 | ) | (0.39 | ) | - | |||||||||||||||
|
|
|
|
|
| |||||||||||||||
Total distributions | (0.12 | ) | (0.39 | ) | - | |||||||||||||||
|
|
|
|
|
| |||||||||||||||
Net asset value, end of period | $ | 19.56 | $ | 15.58 | $ | 15.65 | ||||||||||||||
|
|
|
|
|
| |||||||||||||||
Total returnD | 26.38 | % | 1.94 | % | 5.89 | %E | ||||||||||||||
|
|
|
|
|
| |||||||||||||||
Ratios and supplemental data: | ||||||||||||||||||||
Net assets, end of period | $ | 20,907,091 | $ | 20,327,704 | $ | 37,138,368 | ||||||||||||||
Ratios to average net assets: | ||||||||||||||||||||
Expenses, before reimbursements and/or recoupments | 0.92 | % | 0.91 | % | 0.93 | %F | ||||||||||||||
Expenses, net of reimbursements and/or recoupments | 0.91 | %H | 0.89 | % | 0.89 | %F | ||||||||||||||
Net investment income, before expense reimbursements and/or recoupments | 3.14 | %C | 0.84 | % | 2.18 | %F | ||||||||||||||
Net investment income, net of reimbursements and/or recoupments | 3.15 | %C | 0.86 | % | 2.22 | %F | ||||||||||||||
Portfolio turnover rate | 34 | % | 28 | % | 35 | %G | ||||||||||||||
| A | Prior to February 28, 2020, the R5 Class was known as Institutional Class. |
| B | Commencement of operations. |
| C | Net investment income includes significant dividend payment from Vivendi SE amounting to $0.3366. |
| D | Based on net asset value, which does not reflect the sales charge, redemption fee, or contingent deferred sales charge, if applicable. May include adjustments in accordance with U.S. GAAP and as such, the net asset value for reporting purposes and the returns based upon those net asset values may differ from the net asset value and returns for shareholder transactions. |
| E | Not annualized. |
| F | Annualized. |
| G | Portfolio turnover is for the period from January 22, 2019 through October 31, 2019 and is not annualized. |
| H | Expense ratios may exceed stated expense caps in Note 2 due to security lending expenses. |
See accompanying notes
59
American Beacon Tocqueville International Value FundSM
Financial Highlights
(For a share outstanding throughout the period)
| Y Class | ||||||||||||||||||||
| Year Ended October 31, | January 22, | |||||||||||||||||||
| 2021 | 2020 | |||||||||||||||||||
|
|
|
|
|
|
|
|
|
| |||||||||||
Net asset value, beginning of period | $ | 15.56 | $ | 15.64 | $ | 14.78 | ||||||||||||||
|
|
|
|
|
| |||||||||||||||
Income from investment operations: | ||||||||||||||||||||
Net investment income | 0.59 | B | 0.05 | 0.23 | ||||||||||||||||
Net gains on investments (both realized and unrealized) | 3.49 | 0.25 | 0.63 | |||||||||||||||||
|
|
|
|
|
| |||||||||||||||
Total income from investment operations | 4.08 | 0.30 | 0.86 | |||||||||||||||||
|
|
|
|
|
| |||||||||||||||
Less distributions: | ||||||||||||||||||||
Dividends from net investment income | (0.10 | ) | (0.38 | ) | - | |||||||||||||||
|
|
|
|
|
| |||||||||||||||
Total distributions | (0.10 | ) | (0.38 | ) | - | |||||||||||||||
|
|
|
|
|
| |||||||||||||||
Net asset value, end of period | $ | 19.54 | $ | 15.56 | $ | 15.64 | ||||||||||||||
|
|
|
|
|
| |||||||||||||||
Total returnC | 26.25 | % | 1.84 | % | 5.82 | %D | ||||||||||||||
|
|
|
|
|
| |||||||||||||||
Ratios and supplemental data: | ||||||||||||||||||||
Net assets, end of period | $ | 160,793,226 | $ | 136,563,697 | $ | 229,275,205 | ||||||||||||||
Ratios to average net assets: | ||||||||||||||||||||
Expenses, before reimbursements and/or recoupments | 0.98 | % | 0.99 | % | 0.98 | %E | ||||||||||||||
Expenses, net of reimbursements and/or recoupments | 0.98 | % | 0.99 | % | 0.98 | %E | ||||||||||||||
Net investment income, before expense reimbursements and/or recoupments | 3.40 | %B | 0.78 | % | 2.10 | %E | ||||||||||||||
Net investment income, net of reimbursements and/or recoupments | 3.40 | %B | 0.78 | % | 2.10 | %E | ||||||||||||||
Portfolio turnover rate | 34 | % | 28 | % | 35 | %F | ||||||||||||||
| A | Commencement of operations. |
| B | Net investment income includes significant dividend payment from Vivendi SE amounting to $0.3834. |
| C | Based on net asset value, which does not reflect the sales charge, redemption fee, or contingent deferred sales charge, if applicable. May include adjustments in accordance with U.S. GAAP and as such, the net asset value for reporting purposes and the returns based upon those net asset values may differ from the net asset value and returns for shareholder transactions. |
| D | Not annualized. |
| E | Annualized. |
| F | Portfolio turnover is for the period from January 22, 2019 through October 31, 2019 and is not annualized. |
See accompanying notes
60
American Beacon Tocqueville International Value FundSM
Financial Highlights
(For a share outstanding throughout the period)
| Investor Class | ||||||||||||||||||||||||||||||||||||
| Year Ended October 31, | ||||||||||||||||||||||||||||||||||||
| 2021 | 2020 | 2019 | 2018 | 2017 | ||||||||||||||||||||||||||||||||
|
| |||||||||||||||||||||||||||||||||||
Net asset value, beginning of period | $ | 15.60 | $ | 15.61 | $ | 15.06 | $ | 17.58 | $ | 14.44 | ||||||||||||||||||||||||||
|
|
|
|
|
|
|
|
|
|
|
| |||||||||||||||||||||||||
Income (loss) from investment operations: | ||||||||||||||||||||||||||||||||||||
Net investment income | 0.76 | B | 0.25 | 0.40 | 0.24 | A | 0.14 | A | ||||||||||||||||||||||||||||
Net gains (losses) on investments (both realized and unrealized) | 3.29 | 0.01 | 0.34 | (2.53 | ) | 3.23 | ||||||||||||||||||||||||||||||
|
|
|
|
|
|
|
|
|
| |||||||||||||||||||||||||||
Total income (loss) from investment operations | 4.05 | 0.26 | 0.74 | (2.29 | ) | 3.37 | ||||||||||||||||||||||||||||||
|
|
|
|
|
|
|
|
|
| |||||||||||||||||||||||||||
Less distributions: | ||||||||||||||||||||||||||||||||||||
Dividends from net investment income | (0.06 | ) | (0.27 | ) | (0.19 | ) | (0.17 | ) | (0.15 | ) | ||||||||||||||||||||||||||
Distributions from net realized gains | - | - | - | (0.06 | ) | (0.08 | ) | |||||||||||||||||||||||||||||
|
|
|
|
|
|
|
|
|
| |||||||||||||||||||||||||||
Total distributions | (0.06 | ) | (0.27 | ) | (0.19 | ) | (0.23 | ) | (0.23 | ) | ||||||||||||||||||||||||||
|
|
|
|
|
|
|
|
|
| |||||||||||||||||||||||||||
Net asset value, end of period | $ | 19.59 | $ | 15.60 | $ | 15.61 | $ | 15.06 | $ | 17.58 | ||||||||||||||||||||||||||
|
|
|
|
|
|
|
|
|
|
|
| |||||||||||||||||||||||||
Total returnC | 26.01 | % | 1.63 | % | 5.03 | % | (13.20 | )% | 23.70 | % | ||||||||||||||||||||||||||
|
|
|
|
|
|
|
|
|
| |||||||||||||||||||||||||||
Ratios and supplemental data: | ||||||||||||||||||||||||||||||||||||
Net assets, end of period | $ | 180,324,267 | $ | 198,905,986 | $ | 355,423,059 | $ | 1,060,000,108 | $ | 1,120,993,795 | ||||||||||||||||||||||||||
Ratios to average net assets: | ||||||||||||||||||||||||||||||||||||
Expenses, before reimbursements and/or recoupments | 1.20 | % | 1.18 | % | 1.29 | % | 1.48 | % | 1.53 | % | ||||||||||||||||||||||||||
Expenses, net of reimbursements and/or recoupments | 1.20 | % | 1.18 | % | 1.18 | % | 1.25 | % | 1.25 | % | ||||||||||||||||||||||||||
Net investment income, before expense reimbursements and/or recoupments | 2.81 | %B | 0.63 | % | 1.42 | % | 1.09 | % | 0.73 | % | ||||||||||||||||||||||||||
Net investment income, net of reimbursements and/or recoupments | 2.81 | %B | 0.63 | % | 1.53 | % | 1.32 | % | 1.01 | % | ||||||||||||||||||||||||||
Portfolio turnover rate | 34 | % | 28 | % | 35 | % | 25 | % | 22 | % | ||||||||||||||||||||||||||
| A | Net investment income per share is calculated using the ending balance prior to consideration or adjustment for permanent book-to-tax differences. |
| B | Net investment income includes significant dividend payment from Vivendi SE amounting to $0.3074. |
| C | Based on net asset value, which does not reflect the sales charge, redemption fee, or contingent deferred sales charge, if applicable. May include adjustments in accordance with U.S. GAAP and as such, the net asset value for reporting purposes and the returns based upon those net asset values may differ from the net asset value and returns for shareholder transactions. |
See accompanying notes
61
American Beacon FundsSM
October 31, 2021 (Unaudited)
Certain tax information regarding the Funds is required to be provided to shareholders based upon the Funds’ income and distributions for the taxable year ended October 31, 2021. The information and distributions reported herein may differ from information and distributions taxable to the shareholders for the calendar year ended December 31, 2021.
The Funds designated the following items with regard to distributions paid during the fiscal year ended October 31, 2021. All designations are based on financial information available as of this annual report and, accordingly, are subject to change. For each item, it is the intention of the Funds to designate the maximum amount permitted under the Internal Revenue Code of 1986, as amended, and the regulations there under.
Corporate Dividends-Received Deduction:
International Equity | 0.14 | % | ||
Tocqueville International Value | 4.90 | % |
Qualified Dividend Income:
International Equity | 100.00 | % | ||
Tocqueville International Value | 100.00 | % |
Long-Term Capital Gain Distributions:
International Equity | $ | 0 | ||
Tocqueville International Value | $ | 0 |
Short-Term Capital Gain Distributions:
International Equity | $ | 0 | ||
Tocqueville International Value | $ | 0 |
Foreign tax credit:
International Equity | $ | 8,352,207 | ||
Tocqueville International Value | $ | 1,896,701 |
The foreign tax credits for International Equity and Tocqueville International Value are based on foreign source income of $83,083,804 and $16,940,075, respectively for the year ended October 31, 2021.
Shareholders will receive notification in January 2022 of the applicable tax information necessary to prepare their 2021 income tax returns.
62
Disclosure Regarding Approval of the Management and Investment Advisory Agreements (Unaudited)
Renewal and Approval of Management Agreement and Investment Advisory Agreements
At meetings held on May 17, 2021 and June 8-9, 2021 (collectively, the “Meetings”), the Board of Trustees (“Board” or “Trustees”) considered and then, at its June 9, 2021 meeting, approved the renewal of:
(1) the Management Agreement between American Beacon Advisors, Inc. (“Manager”) and the American Beacon Funds (“Trust”), on behalf of the American Beacon International Equity Fund (“International Equity Fund”) and the American Beacon Tocqueville International Value Fund (“Tocqueville Fund”) (each, a “Fund” and collectively, the “Funds”);
(2) the Investment Advisory Agreements among the Manager, the Trust, on behalf of the International Equity Fund, and each of Causeway Capital Management LLC (“Causeway”), Lazard Asset Management LLC (“Lazard”) and American Century Investments, Inc. (“ACI”); and
(3) the Investment Advisory Agreement among the Manager, the Trust, on behalf of the Tocqueville Fund and Tocqueville Asset Management LP (“Tocqueville”).
Causeway, Lazard, ACI, and Tocqueville are hereinafter each referred to as a “subadvisor” and collectively as the “subadvisors.” The Management Agreement and the Investment Advisory Agreements are referred to herein individually as an “Agreement” and collectively as the “Agreements.” In preparation for its consideration of the renewal of the Agreements, the Board undertook steps to gather and consider information furnished by the Manager, the subadvisors, Broadridge, Inc. (“Broadridge”) and Morningstar, Inc. (“Morningstar”). The Board, with the assistance of independent legal counsel, requested and received certain relevant information from the Manager and each subadvisor.
In advance of the Meetings, the Board’s Investment Committee and/or the Manager coordinated the production of information from Broadridge and Morningstar regarding the performance, fees and expenses of the Funds as well as information from the Manager and the subadvisors. At the Meetings, the Board considered the information provided in connection with the renewal process, as well as information furnished to the Board throughout the year at regular meetings of the Board and its committees. In connection with the Board’s consideration of the Agreements, the Trustees received and evaluated such information, as they deemed necessary, including the impact of the COVID-19 pandemic on the operations of the Manager and the subadvisor. This information is described below in the section summarizing the factors the Board considered in connection with its renewal and approval of the Agreements, as well as the section describing additional Board considerations with respect to each Fund.
The Board noted that the Manager provides management and administrative services to the Funds pursuant to the Management Agreement. The Board considered that many mutual funds have separate contracts governing each type of service and observed that, with respect to such mutual funds, the actual management fee rates provided by Broadridge for peer group funds reflect the combined advisory and administrative fees, reduced by any fee waivers and/or reimbursements.
A firm may not have been able to, or opted not to, provide information in response to certain information requests, in which case the Board conducted its evaluation of the firm based on information that was provided. In such cases, the Board determined that the omission of any such information was not material to its considerations.
Provided below is an overview of certain factors the Board considered in connection with its decision to approve the renewal of the Agreements. The Board did not identify any particular information that was most relevant to its consideration of whether to approve the renewal of each Agreement, and each Trustee may have afforded different weight to the various factors. Legal counsel to the independent Trustees provided the Board with a memorandum regarding its responsibilities pertaining to the renewal of investment advisory contracts, such as the Agreements, and related regulatory guidelines. Based on its evaluation, the Board unanimously concluded
63
Disclosure Regarding Approval of the Management and Investment Advisory Agreements (Unaudited)
that the terms of each Agreement were reasonable and fair and that the approval of the renewal of each Agreement was in the best interests of the Funds and their shareholders.
Considerations With Respect to the Renewal of the Management Agreement and the Investment Advisory Agreements
In determining whether to approve the renewal of the Agreements, the Board considered each Fund’s investment management and subadvisory relationships separately. In each instance, the Board considered, among other things, the following factors: (1) the nature, extent and quality of the services provided; (2) the investment performance of the Funds and the subadvisors for the Funds; (3) the costs incurred by the Manager in rendering services to the Funds and its resulting profits or losses; (4) comparisons of services and fee rates with contracts entered into by the Manager or a subadvisor or their affiliates with other clients (such as pension funds and other institutional clients); (5) the extent to which economies of scale, if any, have been taken into account in setting each fee rate schedule; (6) whether fee rate levels reflect economies of scale, if any, for the benefit of Fund investors; and (7) any other benefits derived or anticipated to be derived by the Manager or the subadvisors from their relationship with the Funds.
Nature, Extent and Quality of Services. With respect to the renewal of the Management Agreement, the Board considered, among other factors: the International Equity Fund’s long-term performance and Tocqueville Fund’s performance since its inception on January 18, 2019; the length of service of key investment personnel at the Manager; the cost structure of the Funds; the Manager’s culture of compliance and support that reduce risks to the Funds; the Manager’s quality of services; the Manager’s active role in monitoring and, as appropriate, recommending additional or replacement subadvisors; and the Manager’s efforts to retain key employees and maintain staffing levels.
With respect to the renewal of each Investment Advisory Agreement, the Board considered, among other factors: the level of staffing and the size of each subadvisor; the adequacy of the resources committed to the Funds by each subadvisor; the financial stability of each subadvisor; and representations made by each subadvisor regarding its compliance program. Based on the foregoing information, the Board concluded that the nature, extent and quality of the management and advisory services provided by the Manager and each subadvisor were appropriate for each Fund.
Investment Performance. The Board evaluated the comparative information provided by Broadridge and the Manager regarding the performance of each Fund relative to its Broadridge Performance Universe, Morningstar Category, and benchmark index, as well as the Fund’s Morningstar rating. The Board considered the information provided by Broadridge regarding its independent methodology for selecting each Fund’s Broadridge Performance Universe. In addition, the Board considered the performance reports and discussions with management at Board and Committee meetings throughout the year. The Board also evaluated the comparative information provided by: (1) each of Causeway and Lazard regarding the performance of its portion of the International Equity Fund, and Tocqueville regarding the performance of the Tocqueville Fund, relative to the performance of a composite of comparable investment accounts managed by the subadvisor; (2) each subadvisor regarding the performance of its portion of the Funds relative to the relevant Fund benchmark index; and (3) ACI regarding the performance of its portion of the International Equity Fund relative to an additional benchmark index. In addition, the Board considered the Manager’s recommendation to continue to retain each subadvisor. A discussion regarding the Board’s considerations with respect to each Fund’s performance appears below under “Additional Considerations and Conclusions with Respect to Each Fund.”
Costs of the Services Provided to the Funds and the Profits Realized by the Manager from its Relationship with the Funds. In analyzing the costs of services and profitability of the Manager, the Board considered the revenues earned and the expenses incurred by the Manager, before and after the payment of distribution-related expenses by the Manager. The profits or losses were noted at both an aggregate level for all funds within the group of mutual funds sponsored by the Manager (the “Fund Complex”) and at an individual Fund level, with the Manager
64
Disclosure Regarding Approval of the Management and Investment Advisory Agreements (Unaudited)
earning a profit with respect to each Fund before and after the payment of distribution-related expenses by the Manager. The Board also considered comparative information provided by the Manager regarding the Manager’s overall profitability with respect to the Fund Complex relative to the overall profitability of other firms in the mutual fund industry, as disclosed in publicly available sources. Although the Board noted that, in certain cases, the fee rates paid by other clients of the Manager are lower than the fee rates paid by the Funds, the Manager represented that, among other matters, the difference is attributable to the fact that the Manager does not perform administrative services for non-investment company clients and reflects the greater level of responsibility and regulatory requirements associated with managing the Funds. The Board also noted that, for the share classes of each Fund, the Manager is waiving fees and/or reimbursing expenses.
The Board further considered that, with respect to each Fund, the Management Agreement provides for the Manager to receive a management fee comprised of an annualized fee that is retained by the Manager. In addition, the Board considered that the Manager receives fees for administering and overseeing the securities lending program on behalf of each Fund. The Board also noted that certain share classes of the Funds maintain higher expense ratios in order to compensate third-party financial intermediaries.
In analyzing the fee rates charged by each subadvisor in connection with its investment advisory services to a Fund, the Board considered representations made by Causeway and Lazard that the International Equity Fund’s fee rate schedule generally was favorable compared to other comparable client accounts. The Board considered ACI’s representation that it does not manage a comparable investment account in the strategy of the International Equity Fund and Tocqueville do not manage any directly comparable client accounts. The Board did not request profitability data from the subadvisors because the Board did not view this data as imperative to its deliberations given the arm’s-length nature of the relationship between the Manager and the subadvisors with respect to the negotiation of subadvisory fee rates. In addition, the Board noted that subadvisors may not account for their profits on an account-by-account basis and that different firms likely employ different methodologies in connection with these calculations.
Based on the foregoing information, the Board concluded that the profitability levels of the Manager were reasonable in light of the services performed by the Manager. A discussion regarding the Board’s considerations with respect to each Fund’s fee rates is set forth below under “Additional Considerations and Conclusions with Respect to Each Fund.”
Economies of Scale. In considering the reasonableness of the management and investment advisory fees rates, the Board considered whether economies of scale will be realized as each Fund grows and whether fee rate levels reflect these economies of scale for the benefit of Fund shareholders. In this regard, the Board considered that, with respect to each subadvisor, the Manager has negotiated breakpoints for the subadvisory fee rate for each Fund. The Board considered that the Tocqueville Fund’s current assets did not exceed the threshold necessary to reach the first subadvisory fee breakpoint and the current assets of the International Equity Fund allocated to ACI did not exceed the threshold necessary to reach the first subadvisory fee breakpoint.
In addition, the Board noted the Manager’s representation that the Management Agreement contains fee schedule breakpoints at higher asset levels with respect to each Fund. In this regard, the Board considered that the Funds’ current assets did not exceed the threshold necessary to reach the first management fee breakpoint. Based on the foregoing information, the Board concluded that the Manager and subadvisor fee rate schedules for each Fund provide for a reasonable sharing of benefits from any economies of scale with each Fund.
Benefits Derived from the Relationship with the Funds. The Board considered the “fall-out” or ancillary benefits that accrue to the Manager and/or the subadvisors as a result of the advisory relationships with the Funds, including greater exposure in the marketplace with respect to the Manager’s or the subadvisors’ investment process and expanding the level of assets under management by the Manager and the subadvisors. The Board also considered that the Manager may invest the Funds’ cash balances and cash collateral provided by the borrowers of the Funds’ securities in the American Beacon U.S. Government Money Market Select Fund, which the Manager
65
Disclosure Regarding Approval of the Management and Investment Advisory Agreements (Unaudited)
manages directly, and for which the Manager receives a fee. In addition, the Board noted that each subadvisor benefits from soft dollar arrangements for proprietary and/or third-party research. Based on the foregoing information, the Board concluded that the potential benefits accruing to the Manager and the subadvisors by virtue of their relationships with the Funds appear to be fair and reasonable.
Additional Considerations and Conclusions with Respect to Each Fund
The performance comparisons below were made for each Fund’s R5 Class shares relative to the Fund’s Broadridge Performance Universe and Morningstar Category. With respect to the Broadridge Performance Universe, the 1st Quintile represents the top 20 percent of the universe based on performance, and the 5th Quintile represents the bottom 20 percent of the universe based on performance. References to each Fund’s Broadridge Performance Universe are to the respective universe of mutual funds with comparable investment classifications and objectives as determined by Broadridge. The performance of individual firms was calculated by the Manager based on information provided by the Funds’ custodian.
In reviewing the performance, the Board viewed longer-term performance over a full market cycle, typically five years or longer, as the most important consideration because relative performance over shorter periods may be significantly impacted by market or economic events and not necessarily reflective of subadvisor skill.
The expense comparisons below were made for each Fund’s R5 Class shares relative to the Fund’s Broadridge Expense Universe and Broadridge Expense Group, and Y Class shares relative to the Fund’s Morningstar Fee Level universe. The 1st Quintile represents the lowest 20 percent of the universe or group based on lowest total expense, and the 5th Quintile represents the highest 20 percent of the universe or group based on highest total expense. References to each Fund’s Expense Group and Expense Universe are to the respective group or universe of comparable mutual funds as determined by Broadridge. A Broadridge Expense Group consists of the Fund and a representative sample of funds with similar operating structures and asset sizes, as selected by Broadridge. A Broadridge Expense Universe includes all funds with comparable investment classifications/objectives and similar operating structures to that of the share class under review for each Fund, including funds in the Broadridge Expense Group. The Broadridge expense comparisons are based on the most recent audited financial information publicly available for a Fund as of December 31, 2020. References to each Fund’s Morningstar Fee Level ranking are to the institutional share class of comparable mutual funds as determined by Morningstar.
The Board considered each Fund’s Morningstar fee level category with the 1st Quintile representing the lowest 20 percent of the category constituents and the 5th Quintile representing the highest 20 percent of the category in terms of total expense.
In reviewing expenses, the Board considered the positive impact of fee waivers and the Manager’s agreement to continue the fee waivers. The Board also considered that, in connection with the change in the name of the Funds’ Institutional Class shares, the share class used for the Funds’ Morningstar Fee Level comparisons had changed from the R5 Class shares to the Y Class shares, which may have resulted in a less favorable Morningstar Fee Level Ranking for the Funds than in prior years.
Additional Considerations and Conclusions with Respect to the International Equity Fund
In considering the renewal of the Management Agreement for the International Equity Fund, the Board considered the following additional factors:
Broadridge Total Expenses Excluding 12b-1 Fees and Morningstar Fee Level Ranking
Compared to Broadridge Expense Group | 1st Quintile | |
Compared to Broadridge Expense Universe | 1st Quintile | |
Morningstar Fee Level Ranking | 2nd Quintile |
66
Disclosure Regarding Approval of the Management and Investment Advisory Agreements (Unaudited)
Broadridge and Morningstar Performance Analysis (five-year period ended December 31, 2020)
Compared to Broadridge Performance Universe | 3rd Quintile | |
Compared to Morningstar Category | 4th Quintile |
In considering the renewal of the Investment Advisory Agreements with Causeway, Lazard and ACI, the Board considered that the diversification of investment strategies facilitated by the International Equity Fund’s multi-manager structure permits the International Equity Fund to mitigate the risks associated with a single subadvisor. The Board also considered the following additional factors:
Subadvisor Performance (compared to Broadridge Performance Universe for period indicated ended December 31, 2020)
Causeway | 5 Years | 1 | st Quintile | |||
Lazard | 5 Years | 1 | st Quintile | |||
ACI | <1 Year |
The Board also considered: (1) the International Equity Fund’s more limited exposure to emerging market countries than the funds in its Broadridge Performance Universe and Morningstar category, and that, accordingly, the Manager expects the International Equity Fund to underperform those peer groups when emerging markets outperform developed markets; (2) information provided by each subadvisor regarding fee rates charged for managing assets in the same or a similar strategy as the subadvisor manages its allocation of the International Equity Fund; (3) the recent termination of a prior subadvisor and the addition of ACI; and (4) the Manager’s recommendation to continue to retain each subadvisor.
Based on these and other considerations, the Board: (1) concluded that the fees paid to the Manager and the subadvisors under the Management and Investment Advisory Agreements are fair and reasonable; and (2) determined that the International Equity Fund and its shareholders would benefit from the Manager’s and subadvisors’ continued management of the International Equity Fund.
Additional Considerations and Conclusions with Respect to the Tocqueville Fund
In considering the renewal of the Management Agreement and the Investment Advisory Agreement with Tocqueville for the Tocqueville Fund, the Board considered the following additional factors:
Broadridge Total Expenses Excluding 12b-1 Fees and Morningstar Fee Level Ranking
Compared to Broadridge Expense Group | 2nd Quintile | |
Compared to Broadridge Expense Universe | 3rd Quintile | |
Morningstar Fee Level Ranking | 4th Quintile |
Broadridge and Morningstar Performance Analysis (five-year period ended December 31, 2020)
Compared to Broadridge Performance Universe | 4th Quintile | |
Compared to Morningstar Category | 4th Quintile |
The Board also considered: (1) Tocqueville’s representation that it does not directly manage comparable investment accounts to the Tocqueville Fund; (2) the Tocqueville Fund acquired all of the assets of The Tocqueville International Value Fund (“Acquired Fund”), on January 18, 2019, and that the Tocqueville Fund’s performance prior to that date is that of the Acquired Fund; and (3) the Manager’s recommendation to continue to retain the subadvisor based upon, among other factors, the relatively brief period since the Tocqueville Fund was acquired.
Based on these and other considerations, the Board: (1) concluded that the fees paid to the Manager and the subadvisor under the Management and Investment Advisory Agreements are fair and reasonable; and (2) determined that the Tocqueville Fund and its shareholders would benefit from the Manager’s and subadvisor’s continued management of the Tocqueville Fund.
67
Trustees and Officers of the American Beacon FundsSM (Unaudited)
The Trustees and officers of the American Beacon Funds (the “Trust”) are listed below, together with their principal occupations during the past five years. The address of each person listed below is 220 Las Colinas Boulevard East, Suite 1200, Irving, Texas 75039. Each Trustee oversees thirty funds in the fund complex that includes the Trust, the American Beacon Select Funds, and the American Beacon Institutional Funds Trust. The Trust’s Statement of Additional Information contains additional information about the Trustees and is available without charge by calling 1-800-658-5811.
Name, Age | Position, Term of Office and Length of Time Served with the Trust | Principal Occupation(s) During Past 5 Years and Current Directorships | ||
| INTERESTED TRUSTEES | Term | |||
| Lifetime of Trust until removal, resignation or retirement* | ||||
| Eugene J. Duffy (67)** | Trustee since 2008 | Managing Director, Global Investment Management Distribution, Mesirow Financial Administrative Corporation (2016-Present); Managing Director, Institutional Services, Intercontinental Real Estate Corporation (2014-2016); Trustee, American Beacon Select Funds (2008-Present); Trustee, American Beacon Institutional Funds Trust (2017-Present); Trustee, American Beacon Sound Point Enhanced Income Fund (2018–2021); Trustee, American Beacon Apollo Total Return Fund (2018–2021). | ||
| NON-INTERESTED TRUSTEES | Term | |||
Lifetime of Trust until removal, resignation or retirement* | ||||
| Gilbert G. Alvarado (51) | Trustee since 2015 | President, SJVIIF, LLC, Impact Investment Fund (2018-Present); Director, Kura MD, Inc. (local telehealth organization) (2015-2017); Senior Vice President & CFO, Sierra Health Foundation (health conversion private foundation) (2006-Present); Senior Vice President & CFO, Sierra Health Foundation: Center for Health Program Management (California public benefit corporation) (2012-Present); Director, Innovative North State (2012-2015); Director, Sacramento Regional Technology Alliance (2011-2016); Director, Valley Healthcare Staffing (2017–2018); Trustee, American Beacon Select Funds (2015-Present); Trustee, American Beacon Institutional Funds Trust (2017-Present); Trustee, American Beacon Sound Point Enhanced Income Fund (2018–2021); Trustee, American Beacon Apollo Total Return Fund (2018–2021). | ||
| Joseph B. Armes (59) | Trustee since 2015 | Director, Switchback Energy Acquisition (2019-2021); Chairman & CEO, CSW Industrials f/k/a Capital Southwest Corporation (investment company) (2015-Present); Chairman of the Board of Capital Southwest Corporation, predecessor to CSW Industrials, Inc. (2014-2017) (investment company); President & CEO, JBA Investment Partners (family investment vehicle) (2010-Present); Director and Chair of Audit Committee, RSP Permian (oil and gas producer) (2013-2018); Trustee, American Beacon Select Funds (2015-Present); Trustee, American Beacon Institutional Funds Trust (2017-Present); Trustee, American Beacon Sound Point Enhanced Income Fund (2018–2021); Trustee, American Beacon Apollo Total Return Fund (2018–2021). | ||
| Gerard J. Arpey (63) | Trustee since 2012 | Partner, Emerald Creek Group (private equity firm) (2011-Present); Director, S.C. Johnson & Son, Inc. (privately held company) (2008-present); Director, The Home Depot, Inc. (2015-Present); Trustee, American Beacon Select Funds (2012-Present); Trustee, American Beacon Institutional Funds Trust (2017-Present); Trustee, American Beacon Sound Point Enhanced Income Fund (2018–2021); Trustee, American Beacon Apollo Total Return Fund (2018–2021). | ||
68
Trustees and Officers of the American Beacon FundsSM (Unaudited)
Name, Age | Position, Term of Office and Length of Time Served with the Trust | Principal Occupation(s) During Past 5 Years and Current Directorships | ||
| NON-INTERESTED TRUSTEES (CONT.) | Term | |||
Lifetime of Trust until removal, resignation or retirement* | ||||
| Brenda A. Cline (60) | Trustee since 2004 Chair since 2019 Vice Chair 2018 | Chief Financial Officer, Treasurer and Secretary, Kimbell Art Foundation (1993-Present); Director, Tyler Technologies, Inc. (public sector software solutions company) (2014-Present); Director, Range Resources Corporation (oil and natural gas company) (2015-Present); Trustee, Cushing Closed-End and Open-End Funds (2017-Present); Trustee, American Beacon Select Funds (2004-Present); Trustee, American Beacon Institutional Funds Trust (2017-Present); Trustee, American Beacon Sound Point Enhanced Income Fund (2018–2021); Trustee, American Beacon Apollo Total Return Fund (2018–2021). | ||
| Claudia A. Holz (64) | Trustee since 2018 | Partner, KPMG LLP (1990-2017); Independent Director, Blue Owl Capital Inc. (2021-Present); Trustee, American Beacon Select Funds (2018-Present); Trustee, American Beacon Institutional Funds Trust (2018-Present); Trustee, American Beacon Sound Point Enhanced Income Fund (2018–2021); Trustee, American Beacon Apollo Total Return Fund (2018–2021). | ||
| Douglas A. Lindgren (59) | Trustee since 2018 | CEO North America, Carne Global Financial Services (2016-2017); Consultant, Carne Financial Services (2017-2019); Managing Director, IPS Investment Management and Global Head, Content Management, UBS Wealth Management (2010-2016); Trustee, American Beacon Select Funds (2018-Present); Trustee, American Beacon Institutional Funds Trust (2018-Present); Trustee, American Beacon Sound Point Enhanced Income Fund (2018–2021); Trustee, American Beacon Apollo Total Return Fund (2018–2021). | ||
| Barbara J. McKenna, CFA (58) | Trustee since 2012 | President/Managing Principal, Longfellow Investment Management Company (2005-Present); Trustee, American Beacon Select Funds (2012-Present); Trustee, American Beacon Institutional Funds Trust (2017-Present); Trustee, American Beacon Sound Point Enhanced Income Fund (2018–2021); Trustee, American Beacon Apollo Total Return Fund (2018–2021). | ||
69
Trustees and Officers of the American Beacon FundsSM (Unaudited)
Name, Age | Position, Term of Office and Length of Time Served with the Trust | Principal Occupation(s) During Past 5 Years and Current Directorships | ||
| OFFICERS | Term | |||
| One Year | ||||
| Gene L. Needles, Jr. (66) | President since 2009 | President (2009-2018), CEO and Director (2009–Present), and Chairman (2018-Present), American Beacon Advisors, Inc., President (2015-2018), Director and CEO (2015–Present), and Chairman (2018-Present), Resolute Investment Holdings, LLC; President (2015-2018), Director and CEO (2015-Present), and Chairman (2018-Present),Resolute Topco, Inc.; President (2015-2018); Director, and CEO (2015-Present), and Chairman (2018-Present), Resolute Acquisition, Inc.; President (2015-2018), Director and CEO (2015-Present), Chairman (2018-Present), Resolute Investment Managers, Inc.; Director, Chairman, President and CEO, Resolute Investment Distributors (2017-Present); Director, Chairman, President and CEO; Resolute Investment Services, Inc. (2017-Present); Manager, President and CEO, American Private Equity Management, LLC (2012-Present); Director, Chairman, President and CEO, Alpha Quant Advisors, LLC (2016-2020); Director, ARK Investment Management LLC (2016-2020); Director, Shapiro Capital Management LLC (2017-Present); Director, Chairman and CEO, Continuous Capital, LLC (2018-Present); Director, Green Harvest Asset Management (2019-Present); Director, National Investment Services of America, LLC (2019-Present); Director, RSW Investments Holdings LLC, (2019-Present); Manager, SSI Investment Management, LLC (2019-Present); President, American Beacon Cayman Managed Futures Strategy Fund, Ltd. (2014-Present); Director and President, American Beacon Cayman Transformational Innovation Company, LTD., (2017-2018); President, American Beacon Delaware Transformational Innovation Corporation (2017-2018); President American Beacon Cayman TargetRisk Company, Ltd. (2018-Present); Member, Investment Advisory Committee, Employees Retirement System of Texas (2017-Present); Trustee, American Beacon NextShares Trust (2015-2020); President, American Beacon Select Funds (2009-Present); President, American Beacon Institutional Funds Trust (2017-Present); President, American Beacon Sound Point Enhanced Income Fund (2018-2021); President, American Beacon Apollo Total Return Fund (2018-2021). | ||
| Rosemary K. Behan (62) | VP, Secretary and Chief Legal Officer since 2006 | Senior Vice President (2021-Present), Vice President(2006-2021), Secretary and General Counsel (2006-Present), American Beacon Advisors, Inc.; Secretary, Resolute Investment Holdings, LLC (2015-Present); Secretary, Resolute Topco, Inc. (2015-Present); Secretary, Resolute Acquisition, Inc. (2015–Present); Senior Vice President (2021-Present), Vice President(2015-2021), Secretary and General Counsel (2015-Present), Resolute Investment Managers, Inc.; Secretary, Resolute Investment Distributors, Inc. (2017-Present); Senior Vice President (2021-Present), Vice President(2017-2021), Secretary and General Counsel (2017-Present), Resolute Investment Services, Inc.; Secretary, American Private Equity Management, LLC (2008-Present); Secretary and General Counsel, Alpha Quant Advisors, LLC (2016-2020); Vice President and Secretary, Continuous Capital, LLC (2018-Present); Secretary, Green Harvest Asset Management (2019-2021); Secretary, American Beacon Delaware Transformational Innovation Corporation (2017-2018); Secretary, American Beacon Cayman Transformational Innovation Company, Ltd. (2017-2018); Secretary, American Beacon Cayman Managed Futures Strategy Fund, Ltd. (2014-Present); Secretary, American Beacon Cayman TargetRisk Company, Ltd (2018-Present); Chief Legal Officer, Vice President and Secretary, American Beacon Select Funds (2006-Present); Chief Legal Officer, Vice President and Secretary, American Beacon Institutional Funds Trust (2017-Present); Chief Legal Officer, Vice President and Secretary, American Beacon Sound Point Enhanced Income Fund (2018-2021); Chief Legal Officer, Vice President and Secretary American Beacon Apollo Total Return Fund (2018-2021). | ||
70
Trustees and Officers of the American Beacon FundsSM (Unaudited)
Name, Age | Position, Term of Office and Length of Time Served with the Trust | Principal Occupation(s) During Past 5 Years and Current Directorships | ||
| OFFICERS (CONT.) | Term | |||
| One Year | ||||
| Brian E. Brett (61) | VP since 2004 | Senior Vice President, Head of Distribution (2012-Present), American Beacon Advisors, Inc.; Senior Vice President, Resolute Investment Managers, Inc. (2017-Present); Senior Vice President, Resolute Investment Distributors, Inc. (2018-Present); Senior Vice President, Resolute Investment Services, Inc. (2018-Present); Vice President, American Beacon Select Funds (2004-Present); Vice President, American Beacon Institutional Funds Trust (2017-Present); Vice President American Beacon Sound Point Enhanced Income Fund (2018-2021); Vice President American Beacon Apollo Total Return Fund (2018-2021). | ||
| Paul B. Cavazos (52) | VP since 2016 | Chief Investment Officer and Senior Vice President, American Beacon Advisors, Inc. (2016-Present); Chief Investment Officer, DTE Energy (2007-2016); Vice President, American Private Equity Management, L.L.C. (2017–Present); Vice President, American Beacon Select Funds (2016-Present); Vice President, American Beacon Institutional Funds Trust (2017-Present); Vice President American Beacon Sound Point Enhanced Income Fund (2018-2021); Vice President American Beacon Apollo Total Return Fund (2018-2021). | ||
| Erica Duncan (51) | VP since 2011 | Vice President, American Beacon Advisors, Inc. (2011-Present); Vice President, Resolute Investment Managers (2018-Present); Vice President, Resolute Investment Services, Inc. (2018-Present); Vice President, American Beacon Select Funds (2011-Present); Vice President, American Beacon Institutional Funds Trust (2017-Present); Vice President American Beacon Sound Point Enhanced Income Fund (2018-2021); Vice President American Beacon Apollo Total Return Fund (2018-2021). | ||
| Melinda G. Heika (60) | VP since 2021 Principal Accounting Officer and Treasurer (2010-2021) | Senior Vice President (2021-Present), Treasurer and CFO (2010-Present), American Beacon Advisors, Inc.; Treasurer, Resolute Topco, Inc. (2015-Present); Treasurer, Resolute Investment Holdings, LLC. (2015-Present); Treasurer, Resolute Acquisition, Inc. (2015-Present); Senior Vice President (2021-Present), Treasurer and CFO, Resolute Investment Managers, Inc. (2017-Present); Treasurer, Resolute Investment Distributors, Inc. (2017); Senior Vice President (2021-Present); Treasurer and CFO, Resolute Investment Services, Inc. (2015-Present); Treasurer, American Private Equity Management, LLC (2012-Present); Treasurer and CFO, Alpha Quant Advisors, LLC (2016-2020); Treasurer and CFO, Continuous Capital, LLC (2018-Present); Treasurer, American Beacon Cayman Transformational Innovation, Ltd. (2017-2018); Treasurer, American Beacon Delaware Transformational Innovation Corporation (2017-2018); Director and Treasurer, American Beacon Cayman Managed Futures Strategy Fund, Ltd. (2014-Present); Treasurer, American Beacon Cayman TargetRisk Company, Ltd. (2018-Present); Vice President (2021-Present), Principal Accounting Officer (2017-2021) and Treasurer (2010-2021), American Beacon Select Funds; Vice President (2021–Present), Principal Accounting Officer and Treasurer (2017-2021), American Beacon Institutional Funds Trust; Vice President (2021), Principal Accounting Officer and Treasurer (2018-2021), American Beacon Sound Point Enhanced Income Fund; Vice President (2021), Principal Accounting Officer and Treasurer, American Beacon Apollo Total Return Fund (2018-2021). | ||
71
Trustees and Officers of the American Beacon FundsSM (Unaudited)
Name, Age | Position, Term of Office and Length of Time Served with the Trust | Principal Occupation(s) During Past 5 Years and Current Directorships | ||
| OFFICERS (CONT.) | Term | |||
| One Year | ||||
| Terri L. McKinney (57) | VP since 2010 | Senior Vice President (2021-Present), Vice President (2009-2021), American Beacon Advisors, Inc.; Senior Vice President (2021–Present); Vice President (2017-2021), Resolute Investment Managers, Inc.; Senior Vice President (2021-Present), Vice President (2018-Present), Resolute Investment Services, Inc; Vice President, Alpha Quant Advisors, LLC (2016-2020); Vice President, Continuous Capital, LLC (2018-Present); Vice President, American Beacon Select Funds (2010-Present); Vice President, American Beacon Institutional Funds Trust (2017-Present); Vice President, American Beacon Sound Point Enhanced Income Fund (2018-2021); Vice President, American Beacon Apollo Total Return Fund (2018-2021). | ||
| Jeffrey K. Ringdahl (46) | VP since 2010 | Director (2015-Present), President (2018-Present), Chief Operating Officer (2010-Present), Senior Vice President (2013-2018), American Beacon Advisors, Inc.; Director (2015-Present), President (2018-Present), Senior Vice President (2015-2018), Resolute Investment Holdings, LLC; Director (2015-Present), President (2018-Present), Senior Vice President (2015-2018), Resolute Topco, Inc.; Director (2015-Present), President (2018-Present), Senior Vice President (2015-2018), Resolute Acquisition, Inc.; Director (2015-Present), President & COO (2018-Present), Senior Vice President (2015-2018), Resolute Investment Managers, Inc.; Director and Executive Vice President (2017-Present), Resolute Investment Distributors, Inc.; Director (2017-Present), President & COO (2018-Present), Executive Vice President (2017-2018), Resolute Investment Services, Inc.; Senior Vice President (2017-Present), Vice President (2012-2017), Manager (2015-Present), American Private Equity Management, LLC; Trustee, American Beacon NextShares Trust (2015-2020); Director, Executive Vice President & COO, Alpha Quant Advisors, LLC (2016-2020); Director, Shapiro Capital Management, LLC (2017-Present); Director, Executive Vice President & COO, Continuous Capital, LLC (2018-Present); Director, RSW Investments Holdings LLC, (2019-Present); Manager, SSI Investment Management, LLC (2019-Present); Director, National Investment Services of America, LLC (2019-Present); Director and Vice President, American Beacon Cayman Transformational Innovation Company, Ltd., (2017-Present); Vice President, American Beacon Delaware Transformational Innovation Corporation (2017-2018); Director and Vice President, American Beacon Cayman Managed Futures Strategy Fund, Ltd. (2014-Present); Vice President, American Beacon Cayman TargetRisk Company, Ltd (2018-Present); Vice President, American Beacon Select Funds (2010-2018); Vice President, American Beacon Institutional Funds Trust (2017-Present); Vice President, American Beacon Sound Point Enhanced Income Fund (2018-2021); Vice President, American Beacon Apollo Total Return Fund (2018-2021). | ||
| Samuel J. Silver (58) | VP since 2011 | Vice President (2011-Present), Chief Fixed Income Officer (2016-Present), American Beacon Advisors, Inc. (2011-Present); Vice President, American Beacon Select Funds (2011-Present); Vice President, American Beacon Institutional Funds Trust (2017-Present); Vice President, American Beacon Sound Point Enhanced Income Fund (2018-2021); Vice President, American Beacon Apollo Total Return Fund (2018-2021). | ||
72
Trustees and Officers of the American Beacon FundsSM (Unaudited)
Name, Age | Position, Term of Office and Length of Time Served with the Trust | Principal Occupation(s) During Past 5 Years and Current Directorships | ||
| OFFICERS (CONT.) | Term | |||
| One Year | ||||
| Christina E. Sears (50) | Chief Compliance Officer since 2004 and Asst. Secretary since 1999 | Vice President, American Beacon Advisors, Inc. (2019-Present); Chief Compliance Officer, American Beacon Advisors, Inc. (2004-Present); Vice President, Resolute Investment Managers, Inc. (2017-Present); Vice President, Resolute Investment Distributors (2017-Present); Vice President, Resolute Investment Services, Inc. (2019-Present); Chief Compliance Officer, American Private Equity Management, LLC (2012-Present); Chief Compliance Officer, Green Harvest Asset Management, LLC (2019-Present); Chief Compliance Officer, RSW Investments Holdings, LLC (2019-Present); Chief Compliance Officer (2016-2019) and Vice President, Alpha Quant Advisors, LLC (2016-2020); Vice President, Continuous Capital, LLC (2018-Present); Chief Compliance Officer (2004-Present) and Assistant Secretary (1999-Present), American Beacon Select Funds; Chief Compliance Officer and Assistant Secretary, American Beacon Institutional Funds Trust (2017-Present); Chief Compliance Officer and Assistant Secretary, American Beacon Sound Point Enhanced Income Fund (2018-2021); Chief Compliance Officer and Assistant Secretary, American Beacon Apollo Total Return Fund (2018-2021). | ||
| Sonia L. Bates (64) | Principal Accounting Officer and Treasurer since 2021 Assistant Treasurer (2011-2021) | Assistant Treasurer, American Beacon Advisors, Inc. (2011-2018); Assistant Treasurer, American Private Equity Management, LLC (2012-Present); Assistant Treasurer, American Beacon Cayman Transformational Innovation Company, Ltd. (2017-Present); Assistant Treasurer, American Beacon Cayman TargetRisk Company, Ltd. (2018-Present); Principal Accounting Officer and Treasurer (2021-Present), Assistant Treasurer (2011-2021), American Beacon Select Funds; Principal Accounting Officer and Treasurer (2021-Present), Assistant Treasurer (2017-2021), American Beacon Institutional Funds Trust; Principal Accounting Officer and Treasurer (2021), Assistant Treasurer (2018-2021), American Beacon Sound Point Enhanced Income Fund; Principal Accounting Officer and Treasurer (2021), Assistant Treasurer (2018-2021), American Beacon Apollo Total Return Fund. | ||
| Shelley L. Dyson (51) | Assistant Treasurer since 2021 | Assistant Treasurer, American Beacon Select Funds (2021-Present); Assistant Treasurer, American Beacon Institutional Funds Trust (2021-Present); Assistant Treasurer, American Beacon Sound Point Enhanced Income Fund (2021); Assistant Treasurer, American Beacon Apollo Total Return Fund (2021). | ||
| Shelley D. Abrahams (46) | Assistant Secretary since 2008 | Assistant Secretary, American Beacon Select Funds (2008-Present); Assistant Secretary, American Beacon Institutional Funds Trust (2017-Present); Assistant Secretary, American Beacon Sound Point Enhanced Income Fund (2018-2021); Assistant Secretary, American Beacon Apollo Total Return Fund (2018-2021). | ||
| Rebecca L. Harris (54) | Assistant Secretary since 2010 | Senior Vice President (2021-Present), Vice President (2011-Present), American Beacon Advisors, Inc.; Senior Vice President (2021-Present), Vice President (2017-Present), Resolute Investment Managers, Inc.; Senior Vice President (2021-Present), Vice President (2015-Present), Resolute Investment Services; Vice President, Alpha Quant Advisors, LLC (2016-2020); Vice President, Continuous Capital, LLC (2018-Present); Assistant Secretary, American Beacon Select Funds (2010-Present); Assistant Secretary, American Beacon Institutional Funds Trust (2017-Present); Assistant Secretary, American Beacon Sound Point Enhanced Income Fund (2018-2021); Assistant Secretary, American Beacon Apollo Total Return Fund (2018-2021). | ||
73
Trustees and Officers of the American Beacon FundsSM (Unaudited)
Name, Age | Position, Term of Office and Length of Time Served with the Trust | Principal Occupation(s) During Past 5 Years and Current Directorships | ||
| OFFICERS (CONT.) | Term | |||
| One Year | ||||
| Teresa A. Oxford (63) | Assistant Secretary since 2015 | Assistant Secretary, American Beacon Advisors, Inc. (2015-Present); Assistant Secretary, Resolute Investment Distributors (2018-2021); Assistant Secretary, Resolute Investment Managers, Inc. (2017-Present); Assistant Secretary, Resolute Investment Services (2018-Present); Assistant Secretary, Alpha Quant Advisors, LLC (2016-2020); Assistant Secretary, Continuous Capital, LLC (2020-Present); Assistant Secretary, American Beacon Select Funds (2015-Present); Assistant Secretary, American Beacon Institutional Funds Trust (2017-Present); Assistant Secretary, American Beacon Sound Point Enhanced Income Fund (2018-2021); Assistant Secretary, American Beacon Apollo Total Return Fund (2018-2021). | ||
| Michael D. Jiang (36) | Assistant Secretary since 2021 | Assistant Secretary (2021-Present), Resolute Investment Distributors, Inc.; Associate General Counsel (2021-Present), Resolute Investment Services, Inc.; Vice President (2018-2021), The Northern Trust Company; Second Vice President (2015-2018), The Northern Trust Company. Assistant Secretary, American Beacon Select Funds (2021-Present); Assistant Secretary, American Beacon Institutional Funds Trust (2021-Present); Assistant Secretary, American Beacon Sound Point Enhanced Income Fund (2021); Assistant Secretary, American Beacon Apollo Total Return Fund (2021). | ||
* As of 11/12/2014, the Board adopted a retirement plan that requires Trustees to retire no later than the last day of the calendar year in which they reach the age of 75.
** Mr. Duffy is being deemed to be an “interested person” of the Trust, as defined by the Investment Company Act of 1940, as amended, by virtue of his position with Mesirow Financial, Inc., a broker-dealer.
74
American Beacon FundsSM
October 31, 2021 (Unaudited)
The American Beacon Funds recognize and respect the privacy of our shareholders. We are providing this notice to you so you will understand how shareholder information may be collected and used.
We may collect nonpublic personal information about you from one or more of the following sources:
| • | information we receive from you on applications or other forms; |
| • | information about your transactions with us or our service providers; and |
| • | information we receive from third parties. |
We do not disclose any nonpublic personal information about our customers or former customers to anyone, except as permitted by law.
We restrict access to your nonpublic personal information to those employees or service providers who need to know that information to provide products or services to you. To ensure the confidentiality of your nonpublic personal information, we maintain safeguards that comply with federal standards.
75
This page intentionally left blank.
76

Shareholder reports are available online at www.americanbeaconfunds.com/reports. Please be advised that reports are no longer sent by mail. Instead, the reports are made available online, and you will be notified by mail each time a report is posted online. You will be provided with a website link to access the report. You may elect to receive all future reports in paper free of charge. You can request to continue receiving paper copies by calling 1-866-345-5954, or you may directly inform your financial intermediary. Detailed instructions are also included in your report notifications.
If you invest in the Fund through a financial institution, you may be able to receive the Fund’s regulatory mailings, such as the Prospectus, Annual Report and Semi-Annual Report, by e-mail. If you are interested in this option, please go to www.icsdelivery.com and search for your financial institution’s name or contact your financial institution directly.
To obtain more information about the Fund:
 |  | |
| By E-mail: | On the Internet: | |
| american_beacon.funds@ambeacon.com | Visit our website at www.americanbeaconfunds.com | |
By Telephone: Call (800) 658-5811 |
By Mail: American Beacon Funds P.O. Box 219643 Kansas City, MO 64121-9643 | |
| Availability of Quarterly Portfolio Schedules | Availability of Proxy Voting Policy and Records | |
| In addition to the Schedule of Investments provided in each semi-annual and annual report, the Fund files a complete schedule of its portfolio holdings with the Securities and Exchange Commission (“SEC”) on Form N-PORT as of the end of each fiscal quarter. The Fund’s Forms N-PORT are available on the SEC’s website at www.sec.gov. The Forms N-PORT may also be reviewed and copied at the SEC’s Public Reference Section, 100 F Street, NE, Washington, D.C. 20549-2736. Information regarding the operation of the SEC’s Public Reference Room may be obtained by calling (800)-SEC-0330. A complete schedule of the Fund’s portfolio holdings is also available at www.americanbeaconfunds.com approximately twenty days after the end of each month. | A description of the policies and procedures the Fund uses to determine how to vote proxies relating to portfolio securities is available in the Fund’s Statement of Additional Information, is available free of charge on the Fund’s website www.americanbeaconfunds.com and by calling 1-800-967-9009 or by accessing the SEC’s website at www.sec.gov. The Fund’s proxy voting record for the most recent year ended June 30 is filed annually with the SEC on Form N-PX. The Fund’s Forms N-PX are available on the SEC’s website at www.sec.gov. The Fund’s proxy voting record may also be obtained by calling 1-800-967-9009. | |


Fund Service Providers:
CUSTODIAN State Street Bank and Trust Company Boston, Massachusetts | TRANSFER AGENT DST Asset Manager Solutions, Inc. Quincy, Massachusetts | INDEPENDENT REGISTERED PUBLIC ACCOUNTING FIRM Ernst & Young LLP Dallas, Texas | DISTRIBUTOR Resolute Investment Distributors, Inc. Irving, Texas |
This report is prepared for shareholders of the American Beacon Funds and may be distributed to others only if preceded or accompanied by a current Prospectus or Summary Prospectus.
American Beacon Funds, American Beacon International Equity Fund and American Beacon Tocqueville International Value Fund are service marks of American Beacon Advisors, Inc.
AR 10/21

About American Beacon Advisors
Since 1986, American Beacon Advisors, Inc. has offered a variety of products and investment advisory services to numerous institutional and retail clients, including a variety of mutual funds, corporate cash management, and separate account management.
Our clients include defined benefit plans, defined contribution plans, foundations, endowments, corporations, financial planners, and other institutional investors. With American Beacon Advisors, you can put the experience of a multi-billion dollar asset management firm to work for your company.
LARGE CAP VALUE FUND RISKS
Investing in value stocks may limit downside risk over time; however, the Fund may produce more modest gains than riskier stock funds as a trade-off for this potentially lower risk. Investing in foreign securities may involve heightened risk due to currency fluctuations and economic and political risks. The use of futures contracts for cash management may subject the Fund to losing more money than invested. The Fund participates in a securities lending program. Please see the prospectus for a complete discussion of the Fund’s risks. There can be no assurances that the investment objectives of this Fund will be met.
Any opinions herein, including forecasts, reflect our judgment as of the end of the reporting period and are subject to change. Each advisor’s strategies and the Fund’s portfolio composition will change depending on economic and market conditions. This report is not a complete analysis of market conditions and therefore, should not be relied upon as investment advice. Although economic and market information has been compiled from reliable sources, American Beacon Advisors, Inc. makes no representation as to the completeness or accuracy of the statements contained herein.
American Beacon Funds | October 31, 2021 |
| 1 | ||||
| 2 | ||||
| 6 | ||||
| 8 | ||||
| 9 | ||||
| 16 | ||||
| 19 | ||||
| 39 | ||||
| 46 | ||||
Disclosure Regarding Approval of the Management and Investment Advisory Agreements | 47 | |||
| 52 | ||||
| 59 | ||||
| Back Cover |
 | Dear Shareholders, As Warren E. Buffett, the “Oracle of Omaha” and billionaire chairman and CEO of Berkshire Hathaway, once said, “Someone’s sitting in the shade today because someone planted a tree a long time ago.” That is to say, before we can enjoy the fruits of our labor, we must first devote our attention to the careful planning and cultivation of our estates. To achieve a strong yield requires time, diligence and patience – and there are no guarantees the seeds we plant today will thrive or result in a plentiful harvest. This can be said not only about the actions we undertake in our gardening or landscaping, but also those we initiate in our investment portfolios – especially as we take into account the potential for harm caused by natural disasters and other catastrophes, such as the COVID-19 pandemic. |
Because none of us – not even the Oracle of Omaha – has a crystal ball, to help give your investment portfolio the greatest chance for success over the long term, we encourage you to work with financial professionals to develop your personal savings plan, conduct annual plan reviews, and make thoughtful, purposeful plan adjustments to help manage your evolving financial needs and goals. By investing in different investment styles and asset classes, you may be able to help mitigate financial risks across your portfolio. By allocating your portfolio according to your risk-tolerance level, you may be better positioned to withstand short-term crises. With continuous nurturing, you will be better positioned to achieve enduring financial success.
Since 1986, American Beacon has endeavored to provide investors with a disciplined approach to realizing long-term financial goals. As a manager of managers, we strive to provide investment products that may enable investors to participate during market upswings while potentially insulating against market downswings. The investment teams behind our mutual funds seek to produce consistent, long-term results rather than focus only on short-term movements in the markets. In managing our investment products, we emphasize identifying opportunities that offer the potential for long-term financial rewards.
Thank you for entrusting your financial success with American Beacon. For additional information about our investment products or to access your account information, please visit our website at www.americanbeaconfunds.com.
Best Regards,

Gene L. Needles, Jr.
President
American Beacon Funds
1
Domestic Equity Market Overview
October 31, 2021 (Unaudited)
U.S. equities posted strong returns for the 12-month period ended October 31, 2021. The broader market, as measured by the Russell 3000 Index, posted a 43.89% gain. Smaller companies led the way with the Russell 2000 Index rising 50.80%. Mid- and large-cap companies also participated in the rally, with 45.40% and 43.51% returns for the Russell Midcap and Russell 1000 Indexes, respectively. The rally was consistent for most of the period, reflecting an improving economy, accommodative monetary policy and fiscal stimulus.
The prospect of full-scale COVID-19 vaccinations prompted a major shift in investor preference to under-owned Value stocks in the fourth quarter of 2020. Value’s outperformance continued into 2021 as the vaccine rollout accelerated, while massive fiscal and monetary stimulus set the stage for a powerful rebound in consumer spending. In June 2021 investor preference moved in favor of Growth-style stocks as the Federal Reserve spoke about potential tapering, while the spread of the COVID-19 delta variant in both Asia and the U.S. raised concerns about the economic impact. Stocks then rebounded strongly in October 2021 as macro concerns abated; both the Value and Growth cohorts benefited, with Growth outpacing Value. For the full 12-month period, Value stocks outpaced Growth as measured by the Russell 3000 Value Index return of 44.97% and the Russell 3000 Growth Index return of 42.81%.
Inflation picked up steam during 2021, reflecting supply chain disruptions and pent-up demand due to the pandemic. In its latest comments, the Federal Reserve acknowledged higher-than-expected inflation but continued to point to overall deceleration in the rate with the expectation that core inflation (measured by the personal consumption expenditures deflator) could rise between 2% and 2.5% in 2022 and 2023 compared to a roughly 4% increase in 2021. Rising inflation has persisted longer than the Federal Reserve initially expected, but supply chain disruptions from the pandemic have contributed meaningfully to inflation in certain segments of the economy.
With regard to monetary policy, the Federal Reserve maintained the federal funds rate at 0% to 0.25% over the year and announced plans to begin tapering quantitative easing. The Federal Reserve will reduce asset purchases by $10 billion for U.S. Treasuries and $5 billion for agency mortgage-backed securities. The dot plots from Federal Open Market Committee members suggest rate increases could begin in late 2022.
2
American Beacon Large Cap Value FundSM
Performance Overview
October 31, 2021 (Unaudited)
The Investor Class of the American Beacon Large Cap Value Fund (the “Fund”) returned 52.04% for the twelve months ended October 31, 2021, outperforming the Russell 1000® Value Index (the “Index”) return of 43.76% for the same period.
Comparison of Changes in Value of a $10,000 Investment for the period 10/31/2011 through 10/31/2021
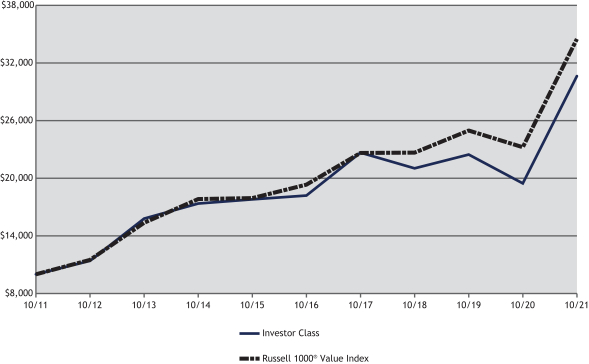
| Total Returns for the Period ended October 31, 2021 |
| |||||||||||||||||||||||||||||||
Ticker | 1 Year | 3 Years | 5 Years | 10 Years | Value of $10,000 | |||||||||||||||||||||||||||
R5 Class (1,6) | AADEX | 52.60 | % | 15.09 | % | 13.85 | % | 12.94 | % | $ | 33,766 | |||||||||||||||||||||
Y Class (1,6) | ABLYX | 52.47 | % | 15.00 | % | 13.76 | % | 12.86 | % | $ | 33,517 | |||||||||||||||||||||
Investor Class (1,6) | AAGPX | 52.04 | % | 14.70 | % | 13.47 | % | 12.56 | % | $ | 32,635 | |||||||||||||||||||||
Advisor Class (1,6) | AVASX | 51.89 | % | 14.54 | % | 13.31 | % | 12.41 | % | $ | 32,201 | |||||||||||||||||||||
A Class without sales charge (1,2,6) | ALVAX | 52.15 | % | 14.67 | % | 13.44 | % | 12.49 | % | $ | 32,435 | |||||||||||||||||||||
A Class with sales Charge (1,2,6) | ALVAX | 43.39 | % | 12.42 | % | 12.10 | % | 11.82 | % | $ | 30,568 | |||||||||||||||||||||
C Class without sales charge (1,3,6) | ALVCX | 51.05 | % | 13.88 | % | 12.67 | % | 11.67 | % | $ | 30,154 | |||||||||||||||||||||
C Class with sales charge (1,3,6) | ALVCX | 50.05 | % | 13.88 | % | 12.67 | % | 11.67 | % | $ | 30,154 | |||||||||||||||||||||
R6 Class (1,4,6) | AALRX | 52.65 | % | 15.14 | % | 13.88 | % | 12.96 | % | $ | 33,816 | |||||||||||||||||||||
Russell 1000® Value Index (5) | 43.76 | % | 13.90 | % | 12.39 | % | 12.85 | % | $ | 33,491 | ||||||||||||||||||||||
| 1. | Performance shown is historical and is not indicative of future returns. Investment returns and principal value will vary, and shares may be worth more or less at redemption than at original purchase. Performance shown is calculated based on the published end of day net asset values as of date indicated, and current performance may be lower or higher than the performance data quoted. To obtain performance as of the most recent month end, please visit www.americanbeaconfunds.com or call 1-800-967-9009. Fund performance in the table above does not reflect the deduction of taxes a shareholder would pay on distributions or the redemption of shares. Generally accepted accounting principles require adjustments to be made to the net assets of the Fund at period end for financial reporting purposes only; and as such, the total return based on the unadjusted net asset value per share may differ from the total return reported in the financial highlights. Please note that the recent performance of the securities market has helped produce short-term returns that are not typical and may not continue in the future. |
| 2. | A Class shares have a maximum sales charge of 5.75%. |
3
American Beacon Large Cap Value FundSM
Performance Overview
October 31, 2021 (Unaudited)
| 3. | A portion of the fees charged to the C Class was waived from 2010 through 2012, partially recovered in 2013 and 2014, and waived in 2018. Performance prior to waiving fees was lower than the actual returns shown for 2010 through 2012 and for 2018. C Class shares have a maximum contingent deferred sales charge of 1.00% for shares redeemed within one year of the date of purchase. |
| 4. | Fund performance for the five-year and ten-year periods represents the returns achieved by the R5 Class from 10/31/11 through 2/28/17, the inception date of the R6 Class, and the returns of the R6 Class since its inception. Expenses of the R6 Class are lower than those of the R5 Class. As a result, total returns shown may be lower than they would have been had the R6 Class been in existence since 10/31/11. A portion of the fees charged to the R6 Class of the Fund were waived from Class inception to 2020. Performance prior to waiving fees was lower than the actual returns shown for 2017 to 2020. |
| 5. | The Russell 1000® Value Index is an unmanaged index of those stocks in the Russell 1000 Index with lower price-to-book ratios and lower forecasted growth values. Russell 1000 Value Index and Russell 1000 Index are registered trademarks of Frank Russell Company. American Beacon Funds is not promoted, sponsored or endorsed by, nor in any way affiliated with the London Stock Exchange Group plc and its group undertakings (collectively, the “LSE Group”). FTSE Russell is a trading name of certain of the LSE Group companies. LSE Group is not responsible for and has not reviewed the American Beacon Large Cap Value Fund nor any associated literature or publications and LSE Group makes no representation or warranty, express or implied, as to their accuracy, or completeness, or otherwise. All rights in the Russell 1000 Value Index (the “Index”) vest in the relevant LSE Group company which owns the Index. Russell 1000® is a trademark of the relevant LSE Group company and is used by any other LSE Group company under license. The Index is calculated by or on behalf of FTSE International Limited or its affiliate, agent or partner. The LSE Group does not accept any liability whatsoever to any person arising out of (a) the use of, reliance on or any error in the Index or (b) investment in or operation of the Fund. The LSE Group makes no claim, prediction, warranty or representation either as to the results to be obtained from the Fund or the suitability of the Index for the purpose to which it is being put by the Manager. One cannot directly invest in an index. |
| 6. | The Total Annual Fund Operating Expense ratios set forth in the most recent Fund prospectus for the R5, Y, Investor, Advisor, A, C, and R6 Class shares were 0.63%, 0.70%, 0.96%, 1.10%, 1.00%, 1.68%, and 0.62%, respectively. The expense ratios above may vary from the expense ratios presented in other sections of this report that are based on expenses incurred during the period covered by this report. |
The Fund outperformed the Index during the period due to both positive security selection and sector allocation.
The Fund’s security selection in the Financials, Health Care and Energy sectors contributed positively to returns relative to the Index. In the Financials sector, contributors included Wells Fargo & Co. (up 143.9%), Goldman Sachs Group, Inc. (up 125.8%) and American International Group, Inc. (up 98.4%). Contributors in the Health Care sector included Anthem, Inc. (up 62.3%) and Johnson & Johnson (up 22.4%). Within the Energy sector, Marathon Oil Corp. (up 346.7%) and Hess Corp. (up 125.0%) contributed positively to relative returns. Conversely, security selection in the Materials sector detracted slightly from relative performance; detractors included International Flavors & Fragrances, Inc. (up 5.8%).
From a sector allocation perspective, overweight allocations to the Financials sector (up 74.2%) and the Energy sector (up 112.4%) and an underweight allocation to the Consumer Staples sector (up 18.6%) contributed positively to relative performance. Conversely, and underweight allocation to the Real Estate sector (up 52.3%) detracted slightly from relative returns during the period.
The sub-advisors continue to invest in a broadly diversified portfolio of companies that they believe have attractive valuations and above-average earnings growth potential. This approach should allow the Fund to benefit over the longer term.
| Top Ten Holdings (% Net Assets) | ||||||||
| Wells Fargo & Co. | 2.8 | |||||||
| Citigroup, Inc. | 2.5 | |||||||
| American International Group, Inc. | 2.2 | |||||||
| Anthem, Inc. | 2.2 | |||||||
| JPMorgan Chase & Co. | 2.2 | |||||||
| Comcast Corp., Class A | 2.0 | |||||||
| Goldman Sachs Group, Inc. | 1.7 | |||||||
| Hess Corp. | 1.7 | |||||||
| General Electric Co. | 1.5 | |||||||
| Merck & Co., Inc. | 1.4 | |||||||
| Total Fund Holdings | 162 | |||||||
4
American Beacon Large Cap Value FundSM
Performance Overview
October 31, 2021 (Unaudited)
| Sector Allocation (% Equities) | ||||||||
| Financials | 26.7 | |||||||
| Health Care | 15.5 | |||||||
| Industrials | 14.9 | |||||||
| Information Technology | 9.6 | |||||||
| Energy | 7.9 | |||||||
| Consumer Discretionary | 7.4 | |||||||
| Communication Services | 5.4 | |||||||
| Consumer Staples | 4.1 | |||||||
| Materials | 3.9 | |||||||
| Utilities | 3.5 | |||||||
| Real Estate | 1.1 |
5
American Beacon Large Cap Value FundSM
October 31, 2021 (Unaudited)
Fund Expense Example
As a shareholder of a Fund, you incur two types of costs: (1) transaction costs, including sales charges (loads) on purchase payments and redemption fees, if applicable, and (2) ongoing costs, including management fees, distribution (12b-1) fees, sub-transfer agent fees, and other Fund expenses. The Examples are intended to help you understand the ongoing cost (in dollars) of investing in the Funds and to compare these costs with the ongoing costs of investing in other mutual funds. The Examples are based on an investment of $1,000 invested at the beginning of the period in each Class and held for the entire period from May 1, 2021 through October 31, 2021.
Actual Expenses
The “Actual” lines of the tables provide information about actual account values and actual expenses. You may use the information on this page, together with the amount you invested, to estimate the expenses that you paid over the period. Simply divide your account value by $1,000 (for example, an $8,600 account value divided by $1,000 = $8.60), then multiply the result by the “Expenses Paid During Period” to estimate the expenses you paid on your account during this period. Shareholders of the Investor and R5 Classes that invest in the Funds through an IRA or Roth IRA may be subject to a custodial IRA fee of $15 that is typically deducted each December. If your account was subject to a custodial IRA fee during the period, your costs would have been $15 higher.
Hypothetical Example for Comparison Purposes
The “Hypothetical” lines of the tables provide information about hypothetical account values and hypothetical expenses based on the Funds’ actual expense ratio and an assumed 5% per year rate of return before expenses (not the Funds’ actual return). You may compare the ongoing costs of investing in the Funds with other funds by contrasting this 5% hypothetical example and the 5% hypothetical examples that appear in the shareholder reports of the other funds. The hypothetical account values and expenses may not be used to estimate the actual ending account balance or expenses you paid for the period. Shareholders of the Investor and R5 Classes that invest in the Funds through an IRA or Roth IRA may be subject to a custodial IRA fee of $15 that is typically deducted each December. If your account was subject to a custodial IRA fee during the period, your costs would have been $15 higher.
You should also be aware that the expenses shown in the table highlight only your ongoing costs and do not reflect any transaction costs charged by the Funds, such as sales charges (loads) or redemption fees, as applicable. Similarly, the expense examples for other funds do not reflect any transaction costs charged by those funds, such as sales charges (loads), redemption fees or exchange fees. Therefore, the “Hypothetical” lines of the tables are useful in comparing ongoing costs only and will not help you determine the relative total costs of owning different funds. If you were subject to any transaction costs during the period, your costs would have been higher.
6
American Beacon Large Cap Value FundSM
Expense Examples
October 31, 2021 (Unaudited)
| American Beacon Large Cap Value Fund |
| ||||||||||||||
| Beginning Account Value 5/1/2021 | Ending Account Value 10/31/2021 | Expenses Paid During Period 5/1/2021-10/31/2021* | |||||||||||||
| R5 Class | |||||||||||||||
| Actual | $1,000.00 | $1,061.30 | $3.27 | ||||||||||||
| Hypothetical** | $1,000.00 | $1,022.03 | $3.21 | ||||||||||||
| Y Class | |||||||||||||||
| Actual | $1,000.00 | $1,060.90 | $3.58 | ||||||||||||
| Hypothetical** | $1,000.00 | $1,021.73 | $3.52 | ||||||||||||
| Investor Class | |||||||||||||||
| Actual | $1,000.00 | $1,059.30 | $5.24 | ||||||||||||
| Hypothetical** | $1,000.00 | $1,020.11 | $5.14 | ||||||||||||
| Advisor Class | |||||||||||||||
| Actual | $1,000.00 | $1,058.80 | $5.66 | ||||||||||||
| Hypothetical** | $1,000.00 | $1,019.71 | $5.55 | ||||||||||||
| A Class | |||||||||||||||
| Actual | $1,000.00 | $1,060.00 | $4.67 | ||||||||||||
| Hypothetical** | $1,000.00 | $1,020.67 | $4.58 | ||||||||||||
| C Class | |||||||||||||||
| Actual | $1,000.00 | $1,055.80 | $8.65 | ||||||||||||
| Hypothetical** | $1,000.00 | $1,016.79 | $8.49 | ||||||||||||
| R6 Class | |||||||||||||||
| Actual | $1,000.00 | $1,061.30 | $3.12 | ||||||||||||
| Hypothetical** | $1,000.00 | $1,022.18 | $3.06 | ||||||||||||
| * | Expenses are equal to the Fund’s annualized expense ratios for the six-month period of 0.63%, 0.69%, 1.01%, 1.09%, 0.90%, 1.67%, and 0.60% for the R5, Y, Investor, Advisor, A, C, and R6 Classes, respectively, multiplied by the average account value over the period, multiplied by the number derived by dividing the number of days in the most recent fiscal half-year (184) by days in the year (365) to reflect the half-year period. |
| ** | 5% return before expenses. |
7
American Beacon Large Cap Value FundSM
Report of Independent Registered Public Accounting Firm
To the Shareholders and the Board of Trustees of American Beacon Large Cap Value Fund
Opinion on the Financial Statements
We have audited the accompanying statement of assets and liabilities of American Beacon Large Cap Value Fund (the “Fund”) (one of the funds constituting American Beacon Funds (the “Trust”)), including the schedule of investments, as of October 31, 2021, and the related statement of operations for the year then ended, the statements of changes in net assets for each of the two years in the period then ended, the financial highlights for each of the five years in the period then ended and the related notes (collectively referred to as the “financial statements”). In our opinion, the financial statements present fairly, in all material respects, the financial position of the Fund (one of the funds constituting American Beacon Funds) at October 31, 2021, the results of its operations for the year then ended, the changes in its net assets for each of the two years in the period then ended and its financial highlights for each of the five years in the period then ended, in conformity with U.S. generally accepted accounting principles.
Basis for Opinion
These financial statements are the responsibility of the Trust’s management. Our responsibility is to express an opinion on the Fund’s financial statements based on our audits. We are a public accounting firm registered with the Public Company Accounting Oversight Board (United States) (“PCAOB”) and are required to be independent with respect to the Trust in accordance with the U.S. federal securities laws and the applicable rules and regulations of the Securities and Exchange Commission and the PCAOB.
We conducted our audits in accordance with the standards of the PCAOB. Those standards require that we plan and perform the audit to obtain reasonable assurance about whether the financial statements are free of material misstatement, whether due to error or fraud. The Trust is not required to have, nor were we engaged to perform, an audit of the Trust’s internal control over financial reporting. As part of our audits we are required to obtain an understanding of internal control over financial reporting, but not for the purpose of expressing an opinion on the effectiveness of the Trust’s internal control over financial reporting. Accordingly, we express no such opinion.
Our audits included performing procedures to assess the risks of material misstatement of the financial statements, whether due to error or fraud, and performing procedures that respond to those risks. Such procedures included examining, on a test basis, evidence regarding the amounts and disclosures in the financial statements. Our procedures included confirmation of securities owned as of October 31, 2021, by correspondence with the custodian and brokers or by other appropriate auditing procedures where replies from brokers were not received. Our audits also included evaluating the accounting principles used and significant estimates made by management, as well as evaluating the overall presentation of the financial statements. We believe that our audits provide a reasonable basis for our opinion.

We have served as the auditor of one or more American Beacon investment companies since 1987.
Dallas, Texas
December 30, 2021
8
American Beacon Large Cap Value FundSM
October 31, 2021
| Shares | Fair Value | ||||||||||||||
| COMMON STOCKS - 96.63% | |||||||||||||||
| Communication Services - 5.25% | |||||||||||||||
| Interactive Media & Services - 0.94% | |||||||||||||||
| Alphabet, Inc., Class AA | 13,000 | $ | 38,491,960 | ||||||||||||
|
| ||||||||||||||
| Media - 3.53% | |||||||||||||||
| Altice USA, Inc., Class AA | 953,975 | 15,549,793 | |||||||||||||
| Comcast Corp., Class A | 1,582,444 | 81,385,095 | |||||||||||||
| Discovery, Inc., Class CA | 1,057,700 | 23,861,712 | |||||||||||||
| News Corp., Class A | 773,200 | 17,706,280 | |||||||||||||
| Omnicom Group, Inc. | 84,878 | 5,778,494 | |||||||||||||
|
| ||||||||||||||
| 144,281,374 | |||||||||||||||
|
| ||||||||||||||
| Wireless Telecommunication Services - 0.78% | |||||||||||||||
| T-Mobile US, Inc.A | 137,603 | 15,828,473 | |||||||||||||
| Vodafone Group PLC, ADR | 1,082,050 | 16,176,647 | |||||||||||||
|
| ||||||||||||||
| 32,005,120 | |||||||||||||||
|
| ||||||||||||||
Total Communication Services | 214,778,454 | ||||||||||||||
|
| ||||||||||||||
| Consumer Discretionary - 7.13% | |||||||||||||||
| Auto Components - 0.92% | |||||||||||||||
| Adient PLCA | 114,098 | 4,748,759 | |||||||||||||
| Goodyear Tire & Rubber Co.A | 276,600 | 5,288,592 | |||||||||||||
| Magna International, Inc.B | 336,700 | 27,373,710 | |||||||||||||
|
| ||||||||||||||
| 37,411,061 | |||||||||||||||
|
| ||||||||||||||
| Automobiles - 1.01% | |||||||||||||||
| General Motors Co.A | 662,732 | 36,072,503 | |||||||||||||
| Harley-Davidson, Inc. | 147,912 | 5,397,309 | |||||||||||||
|
| ||||||||||||||
| 41,469,812 | |||||||||||||||
|
| ||||||||||||||
| Hotels, Restaurants & Leisure - 1.56% | |||||||||||||||
| Aramark | 415,053 | 15,141,133 | |||||||||||||
| Booking Holdings, Inc.A | 3,900 | 9,441,042 | |||||||||||||
| Las Vegas Sands Corp.A | 786,440 | 30,521,736 | |||||||||||||
| Marriott International, Inc., Class AA | 54,435 | 8,710,689 | |||||||||||||
|
| ||||||||||||||
| 63,814,600 | |||||||||||||||
|
| ||||||||||||||
| Household Durables - 0.34% | |||||||||||||||
| Lennar Corp., Class A | 137,557 | 13,746,071 | |||||||||||||
|
| ||||||||||||||
| Multiline Retail - 0.97% | |||||||||||||||
| Dollar General Corp. | 179,108 | 39,676,004 | |||||||||||||
|
| ||||||||||||||
| Specialty Retail - 1.66% | |||||||||||||||
| Advance Auto Parts, Inc. | 145,540 | 32,822,181 | |||||||||||||
| Lowe’s Cos., Inc. | 149,626 | 34,985,551 | |||||||||||||
|
| ||||||||||||||
| 67,807,732 | |||||||||||||||
|
| ||||||||||||||
| Textiles, Apparel & Luxury Goods - 0.67% | |||||||||||||||
| Ralph Lauren Corp. | 216,337 | 27,511,576 | |||||||||||||
|
| ||||||||||||||
Total Consumer Discretionary | 291,436,856 | ||||||||||||||
|
| ||||||||||||||
| Consumer Staples - 3.92% | |||||||||||||||
| Beverages - 1.64% | |||||||||||||||
| Coca-Cola Europacific Partners PLC | 653,372 | 34,400,036 | |||||||||||||
| Diageo PLC, ADR | 102,989 | 20,563,813 | |||||||||||||
| PepsiCo, Inc. | 74,303 | 12,007,365 | |||||||||||||
|
| ||||||||||||||
| 66,971,214 | |||||||||||||||
|
| ||||||||||||||
See accompanying notes
9
American Beacon Large Cap Value FundSM
Schedule of Investments
October 31, 2021
| Shares | Fair Value | ||||||||||||||
| COMMON STOCKS - 96.63% (continued) | |||||||||||||||
| Consumer Staples - 3.92% (continued) | |||||||||||||||
| Food Products - 1.00% | |||||||||||||||
| Archer-Daniels-Midland Co. | 74,430 | $ | 4,781,383 | ||||||||||||
| JM Smucker Co. | 21,240 | 2,609,547 | |||||||||||||
| Mondelez International, Inc., Class A | 199,200 | 12,099,408 | |||||||||||||
| Nestle SA, ADR | 161,978 | 21,351,940 | |||||||||||||
|
| ||||||||||||||
| 40,842,278 | |||||||||||||||
|
| ||||||||||||||
| Household Products - 0.66% | |||||||||||||||
| Colgate-Palmolive Co. | 123,127 | 9,381,046 | |||||||||||||
| Kimberly-Clark Corp. | 80,880 | 10,473,151 | |||||||||||||
| Reckitt Benckiser Group PLC, ADR | 438,582 | 7,118,186 | |||||||||||||
|
| ||||||||||||||
| 26,972,383 | |||||||||||||||
|
| ||||||||||||||
| Personal Products - 0.51% | |||||||||||||||
| Unilever PLC, ADR | 388,400 | 20,810,472 | |||||||||||||
|
| ||||||||||||||
| Tobacco - 0.11% | |||||||||||||||
| Philip Morris International, Inc. | 51,042 | 4,825,511 | |||||||||||||
|
| ||||||||||||||
Total Consumer Staples | 160,421,858 | ||||||||||||||
|
| ||||||||||||||
| Energy - 7.66% | |||||||||||||||
| Energy Equipment & Services - 1.06% | |||||||||||||||
| Baker Hughes Co. | 293,400 | 7,358,472 | |||||||||||||
| Halliburton Co. | 574,000 | 14,344,260 | |||||||||||||
| NOV, Inc.A | 949,900 | 13,317,598 | |||||||||||||
| Schlumberger NV | 253,900 | 8,190,814 | |||||||||||||
|
| ||||||||||||||
| 43,211,144 | |||||||||||||||
|
| ||||||||||||||
| Oil, Gas & Consumable Fuels - 6.60% | |||||||||||||||
| APA Corp. | 1,000,800 | 26,230,968 | |||||||||||||
| Chevron Corp. | 62,609 | 7,168,104 | |||||||||||||
| ConocoPhillips | 179,147 | 13,344,660 | |||||||||||||
| EOG Resources, Inc. | 90,021 | 8,323,342 | |||||||||||||
| Hess Corp. | 831,244 | 68,635,817 | |||||||||||||
| Marathon Oil Corp. | 2,503,486 | 40,856,892 | |||||||||||||
| Marathon Petroleum Corp. | 148,580 | 9,795,879 | |||||||||||||
| Murphy Oil Corp. | 125,670 | 3,497,396 | |||||||||||||
| Phillips 66 | 501,447 | 37,498,207 | |||||||||||||
| Pioneer Natural Resources Co. | 176,710 | 33,041,236 | |||||||||||||
| Royal Dutch Shell PLC, Class A, ADR | 463,622 | 21,289,522 | |||||||||||||
|
| ||||||||||||||
| 269,682,023 | |||||||||||||||
|
| ||||||||||||||
Total Energy | 312,893,167 | ||||||||||||||
|
| ||||||||||||||
| Financials - 25.77% | |||||||||||||||
| Banks - 10.30% | |||||||||||||||
| Bank of America Corp. | 212,462 | 10,151,434 | |||||||||||||
| CIT Group, Inc. | 187,200 | 9,272,016 | |||||||||||||
| Citigroup, Inc. | 1,496,877 | 103,524,013 | |||||||||||||
| Citizens Financial Group, Inc. | 344,353 | 16,315,445 | |||||||||||||
| JPMorgan Chase & Co. | 525,048 | 89,200,405 | |||||||||||||
| PNC Financial Services Group, Inc. | 86,516 | 18,257,472 | |||||||||||||
| Truist Financial Corp. | 176,743 | 11,217,878 | |||||||||||||
| US Bancorp | 826,962 | 49,923,696 | |||||||||||||
| Wells Fargo & Co. | 2,209,103 | 113,017,710 | |||||||||||||
|
| ||||||||||||||
| 420,880,069 | |||||||||||||||
|
| ||||||||||||||
See accompanying notes
10
American Beacon Large Cap Value FundSM
Schedule of Investments
October 31, 2021
| Shares | Fair Value | ||||||||||||||
| COMMON STOCKS - 96.63% (continued) | |||||||||||||||
| Financials - 25.77% (continued) | |||||||||||||||
| Capital Markets - 5.72% | |||||||||||||||
| Bank of New York Mellon Corp. | 395,700 | $ | 23,425,440 | ||||||||||||
| BlackRock, Inc. | 21,181 | 19,983,426 | |||||||||||||
| Credit Suisse Group AG, ADRB | 1,260,300 | 12,993,693 | |||||||||||||
| Goldman Sachs Group, Inc. | 170,895 | 70,639,448 | |||||||||||||
| KKR & Co., Inc., Class A | 79,266 | 6,315,122 | |||||||||||||
| Moody’s Corp. | 17,360 | 7,016,044 | |||||||||||||
| Morgan Stanley | 249,793 | 25,673,725 | |||||||||||||
| Nasdaq, Inc. | 122,970 | 25,807,714 | |||||||||||||
| Northern Trust Corp. | 215,705 | 26,540,343 | |||||||||||||
| State Street Corp. | 157,280 | 15,499,944 | |||||||||||||
|
| ||||||||||||||
| 233,894,899 | |||||||||||||||
|
| ||||||||||||||
| Consumer Finance - 1.67% | |||||||||||||||
| American Express Co. | 287,123 | 49,896,235 | |||||||||||||
| SLM Corp. | 992,746 | 18,216,889 | |||||||||||||
|
| ||||||||||||||
| 68,113,124 | |||||||||||||||
|
| ||||||||||||||
| Diversified Financial Services - 0.66% | |||||||||||||||
| Berkshire Hathaway, Inc., Class BA | 70,500 | 20,234,205 | |||||||||||||
| Equitable Holdings, Inc. | 205,000 | 6,867,500 | |||||||||||||
|
| ||||||||||||||
| 27,101,705 | |||||||||||||||
|
| ||||||||||||||
| Insurance - 7.42% | |||||||||||||||
| American International Group, Inc. | 1,526,930 | 90,226,294 | |||||||||||||
| Aon PLC, Class A | 123,556 | 39,528,035 | |||||||||||||
| Chubb Ltd. | 206,133 | 40,274,266 | |||||||||||||
| Hartford Financial Services Group, Inc. | 230,900 | 16,839,537 | |||||||||||||
| Marsh & McLennan Cos., Inc. | 179,859 | 30,000,481 | |||||||||||||
| Progressive Corp. | 231,479 | 21,962,728 | |||||||||||||
| Travelers Cos., Inc. | 228,343 | 36,735,822 | |||||||||||||
| Willis Towers Watson PLC | 114,637 | 27,774,252 | |||||||||||||
|
| ||||||||||||||
| 303,341,415 | |||||||||||||||
|
| ||||||||||||||
Total Financials | 1,053,331,212 | ||||||||||||||
|
| ||||||||||||||
| Health Care - 14.98% | |||||||||||||||
| Health Care Equipment & Supplies - 3.18% | |||||||||||||||
| Abbott Laboratories | 172,588 | 22,244,867 | |||||||||||||
| Boston Scientific Corp.A | 441,646 | 19,048,192 | |||||||||||||
| Danaher Corp. | 72,124 | 22,486,099 | |||||||||||||
| Medtronic PLC | 489,317 | 58,649,536 | |||||||||||||
| Zimmer Biomet Holdings, Inc. | 52,867 | 7,566,325 | |||||||||||||
|
| ||||||||||||||
| �� | 129,995,019 | ||||||||||||||
|
| ||||||||||||||
| Health Care Providers & Services - 6.20% | |||||||||||||||
| Anthem, Inc. | 202,638 | 88,173,873 | |||||||||||||
| Centene Corp.A | 248,500 | 17,703,140 | |||||||||||||
| Cigna Corp. | 122,719 | 26,214,006 | |||||||||||||
| CVS Health Corp. | 408,528 | 36,473,380 | |||||||||||||
| HCA Healthcare, Inc. | 34,000 | 8,515,640 | |||||||||||||
| Humana, Inc. | 22,700 | 10,513,732 | |||||||||||||
| McKesson Corp. | 59,533 | 12,375,720 | |||||||||||||
| UnitedHealth Group, Inc. | 115,556 | 53,210,071 | |||||||||||||
|
| ||||||||||||||
| 253,179,562 | |||||||||||||||
|
| ||||||||||||||
See accompanying notes
11
American Beacon Large Cap Value FundSM
Schedule of Investments
October 31, 2021
| Shares | Fair Value | ||||||||||||||
| COMMON STOCKS - 96.63% (continued) | |||||||||||||||
| Health Care - 14.98% (continued) | |||||||||||||||
| Life Sciences Tools & Services - 0.71% | |||||||||||||||
| Thermo Fisher Scientific, Inc. | 46,044 | $ | 29,149,075 | ||||||||||||
|
| ||||||||||||||
| Pharmaceuticals - 4.89% | |||||||||||||||
| Bristol-Myers Squibb Co. | 135,700 | 7,924,880 | |||||||||||||
| GlaxoSmithKline PLC, ADRB | 444,034 | 18,795,959 | |||||||||||||
| Johnson & Johnson | 267,303 | 43,538,313 | |||||||||||||
| Merck & Co., Inc. | 667,838 | 58,803,136 | |||||||||||||
| Perrigo Co. PLC | 750,893 | 33,902,819 | |||||||||||||
| Pfizer, Inc. | 486,543 | 21,281,391 | |||||||||||||
| Roche Holding AG, ADR | 91,834 | 4,438,337 | |||||||||||||
| Sanofi, ADR | 223,364 | 11,264,246 | |||||||||||||
|
| ||||||||||||||
| 199,949,081 | |||||||||||||||
|
| ||||||||||||||
Total Health Care | 612,272,737 | ||||||||||||||
|
| ||||||||||||||
| Industrials - 14.45% | |||||||||||||||
| Aerospace & Defense - 2.92% | |||||||||||||||
| General Dynamics Corp. | 148,551 | 30,118,715 | |||||||||||||
| Lockheed Martin Corp. | 29,057 | 9,656,222 | |||||||||||||
| Northrop Grumman Corp. | 74,974 | 26,782,212 | |||||||||||||
| Raytheon Technologies Corp. | 593,382 | 52,727,925 | |||||||||||||
|
| ||||||||||||||
| 119,285,074 | |||||||||||||||
|
| ||||||||||||||
| Air Freight & Logistics - 0.63% | |||||||||||||||
| FedEx Corp. | 110,200 | 25,955,406 | |||||||||||||
|
| ||||||||||||||
| Building Products - 1.13% | |||||||||||||||
| Johnson Controls International PLC | 277,259 | 20,342,493 | |||||||||||||
| Masco Corp. | 167,999 | 11,012,335 | |||||||||||||
| Trane Technologies PLC | 82,196 | 14,871,722 | |||||||||||||
|
| ||||||||||||||
| 46,226,550 | |||||||||||||||
|
| ||||||||||||||
| Construction & Engineering - 0.85% | |||||||||||||||
| AECOMA | 456,873 | 31,236,407 | |||||||||||||
| Fluor Corp.A | 182,300 | 3,543,912 | |||||||||||||
|
| ||||||||||||||
| 34,780,319 | |||||||||||||||
|
| ||||||||||||||
| Electrical Equipment - 1.20% | |||||||||||||||
| Eaton Corp. PLC | 133,332 | 21,967,780 | |||||||||||||
| Emerson Electric Co. | 127,557 | 12,374,305 | |||||||||||||
| Vertiv Holdings Co. | 568,326 | 14,594,612 | |||||||||||||
|
| ||||||||||||||
| 48,936,697 | |||||||||||||||
|
| ||||||||||||||
| Industrial Conglomerates - 2.26% | |||||||||||||||
| General Electric Co. | 572,262 | 60,013,116 | |||||||||||||
| Honeywell International, Inc. | 147,273 | 32,196,823 | |||||||||||||
|
| ||||||||||||||
| 92,209,939 | |||||||||||||||
|
| ||||||||||||||
| Machinery - 3.64% | |||||||||||||||
| CNH Industrial NVB | 1,333,139 | 22,810,008 | |||||||||||||
| Cummins, Inc. | 72,297 | 17,339,713 | |||||||||||||
| Deere & Co. | 62,653 | 21,446,748 | |||||||||||||
| Illinois Tool Works, Inc. | 95,184 | 21,689,578 | |||||||||||||
| Otis Worldwide Corp. | 52,004 | 4,176,441 | |||||||||||||
| PACCAR, Inc. | 202,485 | 18,146,706 | |||||||||||||
| Stanley Black & Decker, Inc. | 240,015 | 43,137,896 | |||||||||||||
|
| ||||||||||||||
| 148,747,090 | |||||||||||||||
|
| ||||||||||||||
See accompanying notes
12
American Beacon Large Cap Value FundSM
Schedule of Investments
October 31, 2021
| Shares | Fair Value | ||||||||||||||
| COMMON STOCKS - 96.63% (continued) | |||||||||||||||
| Industrials - 14.45% (continued) | |||||||||||||||
| Professional Services - 0.40% | |||||||||||||||
| Equifax, Inc. | 58,749 | $ | 16,298,735 | ||||||||||||
|
| ||||||||||||||
| Road & Rail - 1.42% | |||||||||||||||
| Canadian National Railway Co. | 63,884 | 8,490,823 | |||||||||||||
| JB Hunt Transport Services, Inc. | 138,352 | 27,281,631 | |||||||||||||
| Union Pacific Corp. | 93,061 | 22,464,925 | |||||||||||||
|
| ||||||||||||||
| 58,237,379 | |||||||||||||||
|
| ||||||||||||||
Total Industrials | 590,677,189 | ||||||||||||||
|
| ||||||||||||||
| Information Technology - 9.29% | |||||||||||||||
| Communications Equipment - 0.95% | |||||||||||||||
| F5 Networks, Inc.A | 127,900 | 27,006,085 | |||||||||||||
| Telefonaktiebolaget LM Ericsson, ADRB | 1,089,920 | 11,847,430 | |||||||||||||
|
| ||||||||||||||
| 38,853,515 | |||||||||||||||
|
| ||||||||||||||
| Electronic Equipment, Instruments & Components - 0.80% | |||||||||||||||
| Corning, Inc. | 455,340 | 16,196,444 | |||||||||||||
| TE Connectivity Ltd. | 113,000 | 16,498,000 | |||||||||||||
|
| ||||||||||||||
| 32,694,444 | |||||||||||||||
|
| ||||||||||||||
| IT Services - 2.25% | |||||||||||||||
| Accenture PLC, Class A | 111,295 | 39,931,533 | |||||||||||||
| Cognizant Technology Solutions Corp., Class A | 435,659 | 34,020,611 | |||||||||||||
| Fidelity National Information Services, Inc. | 98,356 | 10,891,943 | |||||||||||||
| Fiserv, Inc.A | 72,040 | 7,095,220 | |||||||||||||
|
| ||||||||||||||
| 91,939,307 | |||||||||||||||
|
| ||||||||||||||
| Semiconductors & Semiconductor Equipment - 3.01% | |||||||||||||||
| Analog Devices, Inc. | 56,867 | 9,865,856 | |||||||||||||
| Broadcom, Inc. | 69,822 | 37,122,263 | |||||||||||||
| Intel Corp. | 198,510 | 9,726,990 | |||||||||||||
| NXP Semiconductors NV | 54,062 | 10,858,893 | |||||||||||||
| QUALCOMM, Inc. | 131,731 | 17,525,492 | |||||||||||||
| Texas Instruments, Inc. | 203,360 | 38,125,933 | |||||||||||||
|
| ||||||||||||||
| 123,225,427 | |||||||||||||||
|
| ||||||||||||||
| Software - 1.92% | |||||||||||||||
| Microsoft Corp. | 102,508 | 33,993,703 | |||||||||||||
| Oracle Corp. | 461,506 | 44,276,886 | |||||||||||||
|
| ||||||||||||||
| 78,270,589 | |||||||||||||||
|
| ||||||||||||||
| Technology Hardware, Storage & Peripherals - 0.36% | |||||||||||||||
| Hewlett Packard Enterprise Co. | 1,005,044 | 14,723,895 | |||||||||||||
|
| ||||||||||||||
Total Information Technology | 379,707,177 | ||||||||||||||
|
| ||||||||||||||
| Materials - 3.73% | |||||||||||||||
| Chemicals - 3.59% | |||||||||||||||
| Air Products and Chemicals, Inc. | 51,909 | 15,562,837 | |||||||||||||
| Axalta Coating Systems Ltd.A | 430,448 | 13,425,673 | |||||||||||||
| Corteva, Inc. | 556,489 | 24,012,500 | |||||||||||||
| DuPont de Nemours, Inc. | 137,248 | 9,552,461 | |||||||||||||
| International Flavors & Fragrances, Inc. | 306,324 | 45,167,474 | |||||||||||||
| PPG Industries, Inc. | 135,046 | 21,684,336 | |||||||||||||
| Sherwin-Williams Co. | 54,762 | 17,338,197 | |||||||||||||
|
| ||||||||||||||
| 146,743,478 | |||||||||||||||
|
| ||||||||||||||
See accompanying notes
13
American Beacon Large Cap Value FundSM
Schedule of Investments
October 31, 2021
| Shares | Fair Value | ||||||||||||||
| COMMON STOCKS - 96.63% (continued) | |||||||||||||||
| Materials - 3.73% (continued) | |||||||||||||||
| Containers & Packaging - 0.14% | |||||||||||||||
| International Paper Co. | 112,286 | $ | 5,577,246 | ||||||||||||
|
| ||||||||||||||
Total Materials | 152,320,724 | ||||||||||||||
|
| ||||||||||||||
| Real Estate - 1.08% | |||||||||||||||
| Equity Real Estate Investment Trusts (REITs) - 1.08% | |||||||||||||||
| MGM Growth Properties LLC, Class A | 979,729 | 38,581,728 | |||||||||||||
| Public Storage | 16,329 | 5,424,167 | |||||||||||||
|
| ||||||||||||||
| 44,005,895 | |||||||||||||||
|
| ||||||||||||||
Total Real Estate | 44,005,895 | ||||||||||||||
|
| ||||||||||||||
| Utilities - 3.37% | |||||||||||||||
| Electric Utilities - 2.93% | |||||||||||||||
| American Electric Power Co., Inc. | 105,630 | 8,947,917 | |||||||||||||
| Duke Energy Corp. | 259,464 | 26,467,923 | |||||||||||||
| Exelon Corp. | 345,577 | 18,381,241 | |||||||||||||
| PPL Corp. | 1,155,054 | 33,265,555 | |||||||||||||
| Southern Co. | 428,635 | 26,712,533 | |||||||||||||
| Xcel Energy, Inc. | 90,156 | 5,823,176 | |||||||||||||
|
| ||||||||||||||
| 119,598,345 | |||||||||||||||
|
| ||||||||||||||
| Multi-Utilities - 0.44% | |||||||||||||||
| Dominion Energy, Inc. | 239,460 | 18,182,198 | |||||||||||||
|
| ||||||||||||||
Total Utilities | 137,780,543 | ||||||||||||||
|
| ||||||||||||||
Total Common Stocks (Cost $2,496,751,959) | 3,949,625,812 | ||||||||||||||
|
| ||||||||||||||
| SHORT-TERM INVESTMENTS - 3.15% (Cost $128,676,414) | |||||||||||||||
| Investment Companies - 3.15% | |||||||||||||||
| American Beacon U.S. Government Money Market Select Fund, 0.01%C D | 128,676,414 | 128,676,414 | |||||||||||||
|
| ||||||||||||||
TOTAL INVESTMENTS - 99.78% (Cost $2,625,428,373) | 4,078,302,226 | ||||||||||||||
OTHER ASSETS, NET OF LIABILITIES - 0.22% | 9,190,606 | ||||||||||||||
|
| ||||||||||||||
TOTAL NET ASSETS - 100.00% | $ | 4,087,492,832 | |||||||||||||
|
| ||||||||||||||
| Percentages are stated as a percent of net assets. | |||||||||||||||
A Non-income producing security.
B All or a portion of this security is on loan, collateralized by either cash and/or U.S. Treasuries, at October 31, 2021 (Note 9).
C The Fund is affiliated by having the same investment advisor.
D 7-day yield.
ADR - American Depositary Receipt.
LLC - Limited Liability Company.
PLC - Public Limited Company.
See accompanying notes
14
American Beacon Large Cap Value FundSM
Schedule of Investments
October 31, 2021
| Long Futures Contracts Open on October 31, 2021: |
| |||||||||||||||
| Equity Futures Contracts | ||||||||||||||||
| Description | Number of Contracts | Expiration Date | Notional Amount | Contract Value | Unrealized Appreciation (Depreciation) | |||||||||||
| S&P 500 E-Mini Index | 543 | December 2021 | $ | 120,592,182 | $ | 124,808,550 | $ | 4,216,368 | ||||||||
|
|
|
|
|
| |||||||||||
| $ | 120,592,182 | $ | 124,808,550 | $ | 4,216,368 | |||||||||||
|
|
|
|
|
| |||||||||||
| Index Abbreviations: | ||
| S&P 500 | S&P 500 Index - U.S. Equity Large-Cap Index. | |
The Fund’s investments are summarized by level based on the inputs used to determine their values. As of October 31, 2021, the investments were classified as described below:
Large Cap Value Fund | Level 1 | Level 2 | Level 3 | Total | ||||||||||||||||||||||||
Assets | ||||||||||||||||||||||||||||
Common Stocks | $ | 3,949,625,812 | $ | - | $ | - | $ | 3,949,625,812 | ||||||||||||||||||||
Short-Term Investments | 128,676,414 | - | - | 128,676,414 | ||||||||||||||||||||||||
|
|
|
|
|
|
|
| |||||||||||||||||||||
Total Investments in Securities - Assets | $ | 4,078,302,226 | $ | - | $ | - | $ | 4,078,302,226 | ||||||||||||||||||||
|
|
|
|
|
|
|
| |||||||||||||||||||||
Financial Derivative Instruments - Assets |
| |||||||||||||||||||||||||||
Futures Contracts | $ | 4,216,368 | $ | - | $ | - | $ | 4,216,368 | ||||||||||||||||||||
|
|
|
|
|
|
|
| |||||||||||||||||||||
Total Financial Derivative Instruments - Assets | $ | 4,216,368 | $ | - | $ | - | $ | 4,216,368 | ||||||||||||||||||||
|
|
|
|
|
|
|
| |||||||||||||||||||||
U.S. GAAP requires transfers between all levels to/from level 3 be disclosed. During the year ended October 31, 2021, there were no transfers into or out of Level 3.
See accompanying notes
15
American Beacon Large Cap Value FundSM
Statement of Assets and Liabilities
October 31, 2021
Assets: | ||||
Investments in unaffiliated securities, at fair value†§ | $ | 3,949,625,812 | ||
Investments in affiliated securities, at fair value‡ | 128,676,414 | |||
Cash collateral held at broker for futures contracts | 7,239,000 | |||
Dividends and interest receivable | 3,475,127 | |||
Receivable for investments sold | 19,116,922 | |||
Receivable for fund shares sold | 2,121,324 | |||
Receivable for tax reclaims | 502,200 | |||
Receivable for expense reimbursement (Note 2) | 135,066 | |||
Receivable for variation margin on open futures contracts (Note 5) | 4,217,513 | |||
Prepaid expenses | 47,953 | |||
|
| |||
Total assets | 4,115,157,331 | |||
|
| |||
Liabilities: | ||||
Payable for investments purchased | 16,597,196 | |||
Payable for fund shares redeemed | 2,166,425 | |||
Cash due to broker for futures contracts | 3,958,862 | |||
Management and sub-advisory fees payable (Note 2) | 4,024,448 | |||
Service fees payable (Note 2) | 330,755 | |||
Transfer agent fees payable (Note 2) | 85,847 | |||
Custody and fund accounting fees payable | 256,442 | |||
Professional fees payable | 66,781 | |||
Trustee fees payable (Note 2) | 21,636 | |||
Payable for prospectus and shareholder reports | 73,164 | |||
Other liabilities | 82,943 | |||
|
| |||
Total liabilities | 27,664,499 | |||
|
| |||
Net assets | $ | 4,087,492,832 | ||
|
| |||
Analysis of net assets: | ||||
Paid-in-capital | $ | 2,321,820,755 | ||
Total distributable earnings (deficits)A | 1,765,672,077 | |||
|
| |||
Net assets | $ | 4,087,492,832 | ||
|
| |||
Shares outstanding at no par value (unlimited shares authorized): | ||||
R5 Class | 54,293,158 | |||
|
| |||
Y Class | 8,414,665 | |||
|
| |||
Investor Class | 29,449,112 | |||
|
| |||
Advisor Class | 2,321,837 | |||
|
| |||
A Class | 462,672 | |||
|
| |||
C Class | 254,844 | |||
|
| |||
R6 Class | 40,097,656 | |||
|
| |||
Net assets: | ||||
R5 Class | $ | 1,682,465,233 | ||
|
| |||
Y Class | $ | 258,183,363 | ||
|
| |||
Investor Class | $ | 821,099,597 | ||
|
| |||
Advisor Class | $ | 63,521,926 | ||
|
| |||
A Class | $ | 12,661,833 | ||
|
| |||
C Class | $ | 6,898,120 | ||
|
| |||
R6 Class | $ | 1,242,662,760 | ||
|
| |||
Net asset value, offering and redemption price per share: | ||||
R5 Class | $ | 30.99 | ||
|
| |||
Y Class | $ | 30.68 | ||
|
| |||
Investor Class | $ | 27.88 | ||
|
| |||
Advisor Class | $ | 27.36 | ||
|
| |||
A Class | $ | 27.37 | ||
|
| |||
A Class (offering price) | $ | 29.04 | ||
|
| |||
C Class | $ | 27.07 | ||
|
| |||
R6 Class | $ | 30.99 | ||
|
| |||
† Cost of investments in unaffiliated securities | $ | 2,496,751,959 | ||
‡ Cost of investments in affiliated securities | $ | 128,676,414 | ||
§ Fair value of securities on loan | $ | 19,126,587 | ||
A The Fund’s investments in affiliated securities did not have unrealized appreciation (depreciation) at year end. |
| |||
See accompanying notes
16
American Beacon Large Cap Value FundSM
Statement of Operations
For the year ended October 31, 2021
Investment income: |
| |||
Dividend income from unaffiliated securities (net of foreign taxes)† | $ | 80,757,896 | ||
Dividend income from affiliated securities (Note 2) | 9,628 | |||
Interest income | 2,904 | |||
Income derived from securities lending (Note 9) | 540,017 | |||
|
| |||
Total investment income | 81,310,445 | |||
|
| |||
Expenses: |
| |||
Management and sub-advisory fees (Note 2) | 23,317,879 | |||
Transfer agent fees: | ||||
R5 Class (Note 2) | 681,358 | |||
Y Class (Note 2) | 241,639 | |||
Investor Class | 33,110 | |||
Advisor Class | 2,871 | |||
A Class | 1,062 | |||
R6 Class | 35,484 | |||
Custody and fund accounting fees | 492,617 | |||
Professional fees | 226,171 | |||
Registration fees and expenses | 138,417 | |||
Service fees (Note 2): | ||||
Investor Class | 3,146,405 | |||
Advisor Class | 147,343 | |||
A Class | 21,723 | |||
C Class | 5,423 | |||
Distribution fees (Note 2): | ||||
Advisor Class | 147,277 | |||
A Class | 48,708 | |||
C Class | 62,307 | |||
Prospectus and shareholder report expenses | 202,072 | |||
Trustee fees (Note 2) | 285,645 | |||
Loan expense (Note 10) | 20,960 | |||
Other expenses | 428,661 | |||
|
| |||
Total expenses | 29,687,132 | |||
|
| |||
Net fees waived and expenses (reimbursed) (Note 2) | (18,227 | ) | ||
|
| |||
Net expenses | 29,668,905 | |||
|
| |||
Net investment income | 51,641,540 | |||
|
| |||
Realized and unrealized gain (loss) from investments: |
| |||
Net realized gain (loss) from: | ||||
Investments in unaffiliated securitiesA | 421,706,626 | |||
Foreign currency transactions | (966 | ) | ||
Futures contracts | 25,960,342 | |||
Change in net unrealized appreciation of: | ||||
Investments in unaffiliated securitiesB | 1,252,920,290 | |||
Futures contracts | 8,262,696 | |||
|
| |||
Net gain from investments | 1,708,848,988 | |||
|
| |||
Net increase in net assets resulting from operations | $ | 1,760,490,528 | ||
|
| |||
† Foreign taxes | $ | 516,726 | ||
A The Fund did not recognize net realized gains (losses) from the sale of investments in affiliated securities. | ||||
B The Fund’s investments in affiliated securities did not have a change in unrealized appreciation (depreciation) at year end. |
| |||
See accompanying notes
17
American Beacon Large Cap Value FundSM
Statement of Changes in Net Assets
| Year Ended October 31, 2021 | Year Ended October 31, 2020 | |||||||||||
Increase (decrease) in net assets: |
| |||||||||||
Operations: |
| |||||||||||
Net investment income | $ | 51,641,540 | $ | 81,178,908 | ||||||||
Net realized gain from investments in unaffiliated securities, foreign currency transactions and futures contracts | 447,666,002 | 467,774,870 | ||||||||||
Change in net unrealized appreciation (depreciation) of investments in unaffiliated securities and futures contracts | 1,261,182,986 | (1,000,341,114 | ) | |||||||||
|
|
|
| |||||||||
Net increase (decrease) in net assets resulting from operations | 1,760,490,528 | (451,387,336 | ) | |||||||||
|
|
|
| |||||||||
Distributions to shareholders: |
| |||||||||||
Total retained earnings: | ||||||||||||
R5 Class | (254,078,202 | ) | (273,627,748 | ) | ||||||||
Y Class | (26,891,195 | ) | (29,187,098 | ) | ||||||||
Investor Class | (112,558,225 | ) | (110,555,842 | ) | ||||||||
Advisor Class | (7,618,655 | ) | (6,464,926 | ) | ||||||||
A Class | (3,990,605 | ) | (4,077,104 | ) | ||||||||
C Class | (690,733 | ) | (658,758 | ) | ||||||||
R6 Class | (155,468,634 | ) | (76,992,021 | ) | ||||||||
|
|
|
| |||||||||
Net distributions to shareholders | (561,296,249 | ) | (501,563,497 | ) | ||||||||
|
|
|
| |||||||||
Capital share transactions (Note 11): |
| |||||||||||
Proceeds from sales of shares | 932,407,979 | 1,238,519,195 | ||||||||||
Reinvestment of dividends and distributions | 510,804,380 | 461,617,755 | ||||||||||
Cost of shares redeemed | (2,333,154,895 | ) | (2,384,380,519 | ) | ||||||||
|
|
|
| |||||||||
Net (decrease) in net assets from capital share transactions | (889,942,536 | ) | (684,243,569 | ) | ||||||||
|
|
|
| |||||||||
Net increase (decrease) in net assets | 309,251,743 | (1,637,194,402 | ) | |||||||||
|
|
|
| |||||||||
Net assets: |
| |||||||||||
Beginning of year | 3,778,241,089 | 5,415,435,491 | ||||||||||
|
|
|
| |||||||||
End of year | $ | 4,087,492,832 | $ | 3,778,241,089 | ||||||||
|
|
|
| |||||||||
See accompanying notes
18
American Beacon Large Cap Value FundSM
October 31, 2021
1. Organization and Significant Accounting Policies
American Beacon Funds (the “Trust”) is organized as a Massachusetts business trust. The Fund, a series within the Trust, is registered under the Investment Company Act of 1940, as amended (the “Act”), as a diversified, open-end management investment company. As of October 31, 2021, the Trust consists of twenty-eight active series, one of which is presented in this filing: American Beacon Large Cap Value Fund (the “Fund”). The remaining twenty-seven active series are reported in separate filings.
American Beacon Advisors, Inc. (the “Manager”) is a Delaware corporation and a wholly-owned subsidiary of Resolute Investment Managers, Inc. (“RIM”) organized in 1986 to provide business management, advisory, administrative, and asset management consulting services to the Trust and other investors. The Manager is registered as an investment advisor under the Investment Advisers Act of 1940, as amended (the “Advisers Act”). RIM is, in turn, a wholly-owned subsidiary of Resolute Acquisition, Inc., which is a wholly-owned subsidiary of Resolute Topco, Inc., a wholly-owned subsidiary of Resolute Investment Holdings, LLC (“RIH”). RIH is owned primarily by Kelso Investment Associates VIII, L.P., KEP VI, LLC and Estancia Capital Partners L.P., investment funds affiliated with Kelso & Company, L.P. (“Kelso”) or Estancia Capital Management, LLC (“Estancia”), which are private equity firms.
Recently Adopted Accounting Pronouncements
In March 2020, the Financial Accounting Standards Board (“FASB”) issued Accounting Standards Update (“ASU”) 2020-04, which provides optional expedients and exceptions for contracts, hedging relationships and other transactions affected by the transitioning away from the London Interbank Offered Rate (“LIBOR”) and other reference rates that are expected to be discontinued. The amendments in this ASU are effective for all entities as of March 12, 2020 through December 31, 2022. At this time, management is evaluating the implications of these changes on the financial statements.
In October 2020, the U.S. Securities and Exchange Commission (“SEC”) adopted new regulations governing the use of derivatives by registered investment companies. Rule 18f-4 will impose limits on the amount of derivatives the fund could enter into, eliminate the asset segregation framework currently used by funds to comply with Section 18 of the Act, and require funds whose use of derivatives is more than a limited specified exposure to establish and maintain a derivatives risk management program and appoint a derivatives risk manager. While the new rule became effective February 19, 2021, funds will not be required to fully comply with the new rule until August 19, 2022. It is not currently clear what impact, if any, the new rule will have on the availability, liquidity or performance of derivatives. When fully implemented, the new rule may require changes in how the fund will use derivatives, may adversely affect the fund’s performance and may increase costs related to the fund’s use of derivatives.
Class Disclosure
The Fund has multiple classes of shares designed to meet the needs of different groups of investors. The following table sets forth the differences amongst the classes:
Class | Eligible Investors | Minimum Initial Investments | ||||
| R5 Class | Large institutional investors - sold directly or through intermediary channels. | $ | 250,000 | |||
| Y Class | Large institutional retirement plan investors - sold directly or through intermediary channels. | $ | 100,000 | |||
| Investor Class | All investors using intermediary organizations, such as broker-dealers or retirement plan sponsors. | $ | 2,500 | |||
| Advisor Class | All investors who invest through intermediary organizations, such as broker-dealers or third party administrators. | $ | 2,500 | |||
19
American Beacon Large Cap Value FundSM
Notes to Financial Statements
October 31, 2021
Class | Eligible Investors | Minimum Initial Investments | ||||
| A Class | All investors who invest through intermediary organizations, such as broker-dealers or third party administrator. Retail investors who invest directly through a financial intermediary such as a broker, bank, or registered investment advisor which may include a front-end sales charge and a contingent deferred sales charge (“CDSC”). | $ | 2,500 | |||
| C Class | Retail investors who invest directly through a financial intermediary such as a broker or through employee directed benefit plans with applicable sales charges which may include CDSC. | $ | 1,000 | |||
| R6 Class | Large institutional retirement plan investors - sold through retirement plan sponsors. | None | ||||
Each class offered by the Trust has equal rights as to assets and voting privileges. Income and non-class specific expenses are allocated daily to each class based on the relative net assets. Realized and unrealized capital gains and losses of each class are allocated daily based on the relative net assets of each class of the respective Fund. Class specific expenses, where applicable, currently include service, distribution, transfer agent fees, and sub-transfer agent fees that vary amongst the classes as described more fully in Note 2.
Significant Accounting Policies
The following is a summary of significant accounting policies, consistently followed by the Fund in preparation of the financial statements. The Fund is considered an investment company and accordingly, follows the investment company accounting and reporting guidance of the FASB Accounting Standards Codification Topic 946, Financial Services – Investment Companies, a part of Generally Accepted Accounting Principles (“U.S. GAAP”).
Security Transactions and Investment Income
Security transactions are recorded as of the trade date for financial reporting purposes. Securities purchased or sold on a when-issued or delayed-delivery basis may be settled beyond a standard settlement period for the security after the trade date.
Dividend income, net of foreign taxes, is recorded on the ex-dividend date, except certain dividends from foreign securities which are recorded as soon as the information is available to the Fund. Tax reclaim accruals are automatically generated on accounting and custody systems at the time of the income event based on the tax databases maintained by the Fund’s custodian. Interest income, net of foreign taxes, is earned from settlement date, recorded on the accrual basis, and adjusted, if necessary, for accretion of discounts and amortization of premiums. Realized gains (losses) from securities sold are determined based on specific lot identification. Estimated tax liabilities on certain foreign securities are recorded on an accrual basis and are reflected as components of interest income or net change in unrealized appreciation (depreciation) on investments on the Statement of Operations, as appropriate. Tax liabilities realized as a result of such security sales are reflected as a component of net realized gain (loss) on investments on the Statement of Operations.
Distributions to Shareholders
The Fund distributes most or all of its net earnings and realized gains, if any, each taxable year in the form of dividends from net investment income and distributions of realized net capital gains and net gains from foreign currency transactions on an annual basis. The Fund does not have a fixed dividend rate and does not guarantee that it will pay any distributions in any particular period. Dividends to shareholders are determined in accordance with federal income tax regulations, which may differ in amount and character from net investment income and realized gains recognized for purposes of U.S. GAAP. To the extent necessary to fully distribute capital gains, the Fund may designate earnings and profits distributed to shareholders on the redemption of shares.
Commission Recapture
The Fund has established brokerage commission recapture arrangements with certain brokers or dealers. If the Fund’s investment advisor chooses to execute a transaction through a participating broker, the broker rebates
20
American Beacon Large Cap Value FundSM
Notes to Financial Statements
October 31, 2021
a portion of the commission back to the Fund. Any collateral benefit received through participation in the commission recapture program is directed exclusively to the Fund. This amount is reported with the net realized gain (loss) in the Fund’s Statement of Operations, if applicable.
Allocation of Income, Trust Expenses, Gains, and Losses
Investment income, realized and unrealized gains and losses from investments of the Fund is allocated daily to each class of shares based upon the relative proportion of net assets of each class to the total net assets of the Fund. Expenses directly charged or attributable to the Fund will be paid from the assets of the Fund. Generally, expenses of the Trust will be allocated among and charged to the assets of the Fund on a basis that the Trust’s Board of Trustees (the “Board”) deems fair and equitable, which may be based on the relative net assets of the Fund or nature of the services performed and relative applicability to the Fund.
Use of Estimates
The preparation of financial statements in conformity with U.S. GAAP requires management to make estimates and assumptions that affect the amounts reported in the financial statements and accompanying notes. Actual results may differ from those estimated.
Other
Under the Trust’s organizational documents, its officers and trustees are indemnified against certain liabilities arising out of the performance of their duties to the Trust. In the normal course of business, the Trust enters into contracts that provide indemnification to the other party or parties against potential costs or liabilities. The Trust’s maximum exposure under these arrangements is dependent on claims that may be made in the future and, therefore, cannot be estimated. The Trust has had no prior claims or losses pursuant to any such agreement.
2. Transactions with Affiliates
Management and Investment Sub-Advisory Agreements
The Fund and the Manager are parties to a Management Agreement that obligates the Manager to provide the Fund with investment advisory and administrative services. As compensation for performing the duties under the Management Agreement, the Manager will receive an annualized management fee based on a percentage of the Fund’s average daily net assets that is calculated and accrued daily according to the following schedule:
First $15 billion | 0.35 | % | ||
Next $15 billion | 0.325 | % | ||
Over $30 billion | 0.30 | % |
The Trust, on behalf of the Fund, and the Manager have entered into Investment Advisory Agreements with Barrow, Hanley, Mewhinney & Strauss, LLC; Hotchkis and Wiley Capital Management, LLC; and Massachusetts Financial Services Company (“Sub-Advisors”) pursuant to which the Fund has agreed to pay an annualized sub-advisory fee that is calculated and accrued daily based on the Fund’s average daily net assets.
The Management and Sub-Advisory Fees paid by the Fund for the year ended October 31, 2021 were as follows:
| Effective Fee Rate | Amount of Fees Paid | |||||||||||
Management Fees | 0.35 | % | $ | 14,897,334 | ||||||||
Sub-Advisor Fees | 0.20 | % | 8,420,545 | |||||||||
|
|
|
| |||||||||
Total | 0.55 | % | $ | 23,317,879 | ||||||||
|
|
|
| |||||||||
As compensation for services provided by the Manager in connection with securities lending activities conducted by the Fund, the lending Fund pays to the Manager, with respect to cash collateral posted by borrowers,
21
American Beacon Large Cap Value FundSM
Notes to Financial Statements
October 31, 2021
a fee of 10% of the net monthly interest income (the gross interest income earned by the investment of cash collateral, less the amount paid to borrowers and related expenses) from such activities and, with respect to loan fees paid by borrowers, a fee of 10% of such loan fees. Securities lending income is generated from the demand premium (if any) paid by the borrower to borrow a specific security and from the return on investment of cash collateral, reduced by negotiated rebate fees paid to the borrower and transaction costs. To the extent that a loan is secured by non-cash collateral, securities lending income is generated as a demand premium reduced by transaction costs. These fees are included in “Income derived from securities lending” and “Management and sub-advisory fees” on the Statement of Operations. During the year ended October 31, 2021, the Manager received securities lending fees of $59,470 for the securities lending activities of the Fund.
Distribution Plans
Separate Distribution Plans (the “Distribution Plans”) have been adopted pursuant to Rule 12b-1 under the Act for the Advisor, A, and C Classes of the Fund. Under the Distribution Plans, as compensation for distribution and shareholder servicing assistance, the Manager receives an annual fee of 0.25% of the average daily net assets of the Advisor and A Classes and 1.00% of the average daily net assets of the C Class. The fee will be payable without regard to whether the amount of the fee is more or less than the actual expenses incurred in a particular month by the Manager for distribution assistance.
Service Plans
The Manager and the Trust entered into a Service Plan that obligates the Manager to oversee additional shareholder servicing of the Investor, Advisor, A, and C Classes of the Fund. As compensation for performing the duties required under the Service Plan, the Manager receives an annualized fee up to 0.25% of the average daily net assets of the Advisor, A, and C Classes, and up to 0.375% of the average daily net assets of the Investor Class of the Fund.
Sub-Transfer Agent Fees
The Manager has entered into agreements, which include servicing agreements, with financial intermediaries that provide recordkeeping, processing, shareholder communications and other services to customers of the intermediaries that hold positions in the R5 and Y Classes of the Fund and has agreed to compensate the intermediaries for providing these services. Intermediaries transact with the Fund primarily through the use of omnibus accounts on behalf of its customers who hold positions in the Fund. Certain services would have been provided by the Fund’s transfer agent and other service providers if the shareholders’ accounts were maintained directly by the Fund’s transfer agent. Accordingly, the Fund, pursuant to Board approval, has agreed to reimburse the Manager for certain non-distribution shareholder services provided by financial intermediaries for the R5 and Y Classes. The reimbursement amounts (sub-transfer agent fees) paid to the Manager are subject to a fee limit of up to 0.10% of an intermediary’s average net assets in the R5 and Y Classes on an annual basis. During the year ended October 31, 2021, the sub-transfer agent fees, as reflected in “Transfer agent fees” on the Statement of Operations, were as follows:
Fund | Sub-Transfer Agent Fees | |||
Large Cap Value | $ | 854,517 | ||
As of October 31, 2021, the Fund owed the Manager the following reimbursement of sub-transfer agent fees, as reflected in “Transfer agent fees payable” on the Statement of Assets and Liabilities:
Fund | Reimbursement Sub-Transfer Agent Fees | |||
Large Cap Value | $ | 62,520 | ||
22
American Beacon Large Cap Value FundSM
Notes to Financial Statements
October 31, 2021
Investments in Affiliated Funds
The Fund may invest in the American Beacon U.S. Government Money Market Select Fund (the “USG Select Fund”). Cash collateral received by the Fund in connection with securities lending may also be invested in the USG Select Fund. The Fund listed below held the following shares with an October 31, 2021 fair value and dividend income earned from the investment in the USG Select Fund.
Affiliated Security | Type of Transaction | Fund | October 31, 2021 Shares/Principal | Change in Unrealized Gain (Loss) | Realized Gain (Loss) | Dividend Income | October 31, 2021 Fair Value | |||||||||||||||||||||||||||||||||||||||||||
| U.S. Government Money Market Select | Direct | Large Cap Value | $ | 128,676,414 | $ | - | $ | - | $ | 9,628 | $ | 128,676,414 | ||||||||||||||||||||||||||||||||||||||
The Fund and the USG Select Fund have the same investment advisor and therefore, are considered to be affiliated. The Manager serves as investment advisor to the USG Select Fund and receives management fees and administrative fees totaling 0.10% of the average daily net assets of the USG Select Fund. During the year ended October 31, 2021, the Manager earned fees on the Fund’s direct investments and securities lending collateral investments in the USG Select Fund as shown below:
Fund | Direct Investments in USG Select Fund | Securities Lending Collateral Investments in USG Select Fund | Total | |||||||||
Large Cap Value | $ | 114,325 | $ | 3,396 | $ | 117,721 | ||||||
Interfund Credit Facility
Pursuant to an exemptive order issued by the SEC, the Fund, along with other registered investment companies having management contracts with the Manager, may participate in a credit facility whereby each fund, under certain conditions, is permitted to lend money directly to and borrow directly from other participating funds for temporary purposes. The interfund credit facility is advantageous to the funds because it provides added liquidity and eliminates the need to maintain higher cash balances to meet redemptions. This situation could arise when shareholder redemptions exceed anticipated volumes and certain funds have insufficient cash on hand to satisfy such redemptions or when sales of securities do not settle as expected, resulting in a cash shortfall for the fund. When the fund liquidates portfolio securities to meet redemption requests, they often do not receive payment in settlement for up to two days (or longer for certain foreign transactions). Redemption requests normally are satisfied on the next business day. The credit facility provides a source of immediate, short-term liquidity pending settlement of the sale of portfolio securities. The credit facility is administered by a credit facility team consisting of professionals from the Manager’s asset management, compliance, and accounting areas who report the activities of the credit facility to the Board. During the year ended October 31, 2021, the Fund participated as a lender by loaning an average amount of $1,116,456 for 69 days at an average interest rate of 0.82% with interest charges earned of $1,735. This amount is included in “Interest income” on the Statement of Operations.
Expense Reimbursement Plan
The Manager contractually agreed to reduce fees and/or reimburse expenses for the classes of the Fund, through February 28, 2022, to the extent that total operating expenses (excluding taxes, interest, brokerage commissions, acquired fund fees and expenses, securities lending fees, expenses associated with securities sold
23
American Beacon Large Cap Value FundSM
Notes to Financial Statements
October 31, 2021
short, litigation, and other extraordinary expenses) exceed the Fund’s expense cap. During the year ended October 31, 2021, the Manager waived and/or reimbursed expenses as follows:
Fund | Class | Expense Cap | Reimbursed Expenses | (Recouped) Expenses | Expiration of Reimbursed Expenses | |||||||||||||||||||
| 11/1/2020 – 2/28/2021 | 3/1/2021 – 10/31/2021 | |||||||||||||||||||||||
Large Cap Value | R6 | 0.59 | % | 0.60 | % | $ | 18,227 | $ | (58,238 | )* | 2023-2024 | |||||||||||||
* This amount represents Recouped Expenses from prior fiscal years and is reflected in Other Expenses on the Statement of Operations.
Of the above amounts, $135,066 was disclosed as a Receivable for Expense Reimbursement on the Statement of Assets and Liabilities at October 31, 2021.
The Fund has adopted an Expense Reimbursement Plan whereby the Manager may seek repayment of such fee or voluntary reductions and expense reimbursements. Under the policy, the Manager can be reimbursed by the Fund for any contractual or voluntary fee reductions or expense reimbursements if reimbursement to the Manager (a) occurs within three years from the date of the Manager’s waiver/reimbursement and (b) does not cause the Fund’s annual operating expenses to exceed the lesser of the contractual percentage limit in effect at the time of the waiver/reimbursement or time of recoupment. The reimbursed expenses listed above will expire in 2023 and 2024. The carryover of excess expenses potentially reimbursable to the Manager, but not recorded as a liability are as follows:
Fund | Recouped Expenses | Excess Expense Carryover | Expired Expense Carryover | Expiration of Reimbursed Expenses | ||||||||||||
Large Cap Value | $ | 58,238 | $ | 199,853 | $ | - | 2022-2023 | |||||||||
Sales Commissions
The Fund’s Distributor, Resolute Investment Distributors, Inc. (“RID” or “Distributor”), may receive a portion of Class A sales charges from broker dealers which may be used to offset distribution related expenses. During the year ended October 31, 2021, RID collected $6,094 from the sale of Class A Shares of the Fund.
A CDSC of 0.50% will be deducted with respect to Class A Shares on certain purchases of $1,000,000 or more that are redeemed in whole or part within 18 months of purchase, unless waived as discussed in the Fund’s Prospectus. Any applicable CDSC will be 0.50% of the lesser of the original purchase price or the value of the redemption of the Class A Shares redeemed. During the year ended October 31, 2021, there were no CDSC fees collected for the Class A Shares of the Fund.
A CDSC of 1.00% will be deducted with respect to Class C Shares redeemed within 12 months of purchase, unless waived as discussed in the Fund’s Prospectus. Any applicable CDSC will be 1.00% of the lesser of the original purchase price or the value of the redemption of the Class C Shares redeemed. During the year ended October 31, 2021, CDSC fees of $1,063 were collected for Class C Shares of the Fund.
Trustee Fees and Expenses
Effective January 1, 2021, as compensation for their service to the American Beacon Funds Complex, including the Trust (collectively, the “Trusts”), each Trustee is compensated from the Trusts as follows: (1) an annual retainer of $120,000; (2) meeting attendance fee (for attendance in-person or via teleconference) of (a) $12,000 for in person attendance, or $5,000 for telephonic attendance, by Board members for each regularly scheduled or special Board meeting, (b) $2,500 for attendance by Committee members at meetings of the Audit and Compliance Committee and the Investment Committee, (c) $1,000 for attendance by Committee members at meetings of the Nominating and Governance Committee; and (d) $2,500 for attendance by Board members for each special telephonic Board meeting; and (3) reimbursement of reasonable expenses incurred in attending Board
24
American Beacon Large Cap Value FundSM
Notes to Financial Statements
October 31, 2021
meetings, Committee meetings, and relevant educational seminars. For this purpose, the Board considers attendance at regular meetings held by video conference to constitute in-person attendance at a Board meeting. The Trustees also may be compensated for attendance at special Board and/or Committee meetings from time to time. For her service as Board Chair, Ms. Cline receives an additional annual retainer of $50,000. Although she attends several committee meetings at each quarterly Board meeting, she receives only a single $2,500 fee each quarter for her attendance at those meetings. The chairpersons of the Audit and Compliance Committee and the Investment Committee each receive an additional annual retainer of $25,000 and the Chair of the Nominating and Governance Committee receives an additional annual retainer of $10,000.
3. Security Valuation and Fair Value Measurements
The price of the Fund’s shares is based on its net asset value (“NAV”) per share. The Fund’s NAV is computed by adding total assets, subtracting all the Fund’s liabilities, and dividing the result by the total number of shares outstanding.
The NAV of each class of the Fund’s shares is determined based on a pro rata allocation of the Fund’s investment income, expenses and total capital gains and losses. The Fund’s NAV per share is determined each business day as of the regular close of trading on the New York Stock Exchange (“NYSE” or “Exchange”), which is typically 4:00 p.m. Eastern Time (“ET”). However, if trading on the NYSE closes at a time other than 4:00 p.m. ET, the Fund’s NAV per share typically would still be determined as of the regular close of trading on the NYSE. The Fund does not price its shares on days that the NYSE is closed. Foreign exchanges may permit trading in foreign securities on days when the Fund is not open for business, which may result in the value of the Fund’s portfolio investments being affected at a time when you are unable to buy or sell shares.
Equity securities, including shares of closed-end funds and exchange-traded funds (“ETFs”), are valued at the last sale price or official closing price taken from the primary exchange in which each security trades. Investments in other mutual funds are valued at the closing NAV per share on the day of valuation. Debt securities are valued at bid quotes from broker/dealers or evaluated bid prices from pricing services, who may consider a number of inputs and factors, such as prices of comparable securities, yield curves, spreads, credit ratings, coupon rates, maturity, default rates, and underlying collateral. Futures are valued based on their daily settlement prices. Exchange-traded and over-the-counter (“OTC”) options are valued at the last sale price. Options with no last sale for the day are priced at mid quote. Swaps are valued at evaluated mid prices from pricing services.
The valuation of securities traded on foreign markets and certain fixed-income securities will generally be based on prices determined as of the earlier closing time of the markets on which they primarily trade unless a significant event has occurred. When the Fund holds securities or other assets that are denominated in a foreign currency, the Fund will normally use the currency exchange rates as of 4:00 p.m. ET.
Securities may be valued at fair value, as determined in good faith and pursuant to procedures approved by the Board, under certain limited circumstances. For example, fair value pricing will be used when market quotations are not readily available or reliable, as determined by the Manager, such as when (i) trading for a security is restricted or stopped; (ii) a security’s trading market is closed (other than customary closings); or (iii) a security has been de-listed from a national exchange. A security with limited market liquidity may require fair value pricing if the Manager determines that the available price does not reflect the security’s true market value. In addition, if a significant event that the Manager determines to affect the value of one or more securities held by the Fund occurs after the close of a related exchange but before the determination of the Fund’s NAV, fair value pricing may be used on the affected security or securities. Securities of small-capitalization companies are also more likely to require a fair value determination using these procedures because they are more thinly traded and less liquid than the securities of larger-capitalization companies. The Fund may fair value securities as a result of significant events occurring after the close of the foreign markets in which the Fund invests as described below. In addition, the Fund may invest in illiquid securities requiring these procedures.
25
American Beacon Large Cap Value FundSM
Notes to Financial Statements
October 31, 2021
The Fund may use fair value pricing for securities primarily traded in non-U.S. markets because most foreign markets close well before the Fund’s pricing time of 4:00 p.m. ET. The earlier close of these foreign markets gives rise to the possibility that significant events, including broad market moves, may have occurred in the interim and may materially affect the value of those securities. If the Manager determines that the last quoted prices of non-U.S. securities will, in its judgment, materially affect the value of some or all its portfolio securities, the Manager can adjust the previous closing prices to reflect what it believes to be the fair value of the securities as of the close of the Exchange. In deciding whether it is necessary to adjust closing prices to reflect fair value, the Manager reviews a variety of factors, including developments in foreign markets, the performance of U.S. securities markets, and the performance of instruments trading in U.S. markets that represent foreign securities and baskets of foreign securities. These securities are fair valued using a pricing service, using methods approved by the Board, that considers the correlation of the trading patterns of the foreign security to intraday trading in the U.S. markets, based on indices of domestic securities and other appropriate indicators such as prices of relevant American Depositary Receipts (“ADRs”) and futures contracts. The Valuation Committee, established by the Board, may also fair value securities in other situations, such as when a particular foreign market is closed but the Fund is open. The Fund uses outside pricing services to provide closing prices and information to evaluate and/or adjust those prices. As a means of evaluating its security valuation process, the Valuation Committee routinely compares closing prices, the next day’s opening prices in the same markets and adjusted prices.
Attempts to determine the fair value of securities introduce an element of subjectivity to the pricing of securities. As a result, the price of a security determined through fair valuation techniques may differ from the price quoted or published by other sources and may not accurately reflect the market value of the security when trading resumes. If a reliable market quotation becomes available for a security formerly valued through fair valuation techniques, the Manager compares the new market quotation to the fair value price to evaluate the effectiveness of the Fund’s fair valuation procedures. If any significant discrepancies are found, the Manager may adjust the Fund’s fair valuation procedures.
Valuation Inputs
Various inputs may be used to determine the fair value of the Fund’s investments. These inputs are summarized in three broad levels for financial statement purposes. The inputs or methodologies used to value securities are not necessarily an indication of the risk associated with investing in those securities.
| Level 1 | - | Quoted prices in active markets for identical securities. | ||
| Level 2 | - | Prices determined using other significant observable inputs. These may include quoted prices for similar securities, interest rates, prepayment speeds, credit risk, and others. | ||
| Level 3 | - | Prices determined using other significant unobservable inputs. Unobservable inputs reflect the Fund’s own assumptions about the factors market participants would use in pricing an investment. | ||
Level 1 and Level 2 trading assets and trading liabilities, at fair value
Common stocks, preferred securities and financial derivative instruments, such as futures contracts that are traded on a national securities exchange, are stated at the last reported sale or settlement price on the day of valuation. To the extent these securities are actively traded and valuation adjustments are not applied, they are categorized as Level 1 of the fair value hierarchy. Preferred securities and other equities traded on inactive markets or valued by reference to similar instruments are generally categorized as Level 2 of the fair value hierarchy.
Investments in registered open-end investment management companies will be valued based upon the NAVs of such investments and are categorized as Level 1 of the fair value hierarchy.
26
American Beacon Large Cap Value FundSM
Notes to Financial Statements
October 31, 2021
4. Securities and Other Investments
American Depositary Receipts and Non-Voting Depositary Receipts
ADRs are depositary receipts for foreign issuers in registered form traded in U.S. securities markets. Non-Voting Depositary Receipts (“NVDRs”) represent financial interests in an issuer but the holder is not entitled to any voting rights. Depositary receipts may not be denominated in the same currency as the securities into which they may be converted. Investing in depositary receipts entails substantially the same risks as direct investment in foreign securities. There is generally less publicly available information about foreign companies and there may be less governmental regulation and supervision of foreign stock exchanges, brokers, and listed companies. In addition, such companies may use different accounting and financial standards (and certain currencies may become unavailable for transfer from a foreign currency), resulting in the Fund’s possible inability to convert immediately into U.S. currency proceeds realized upon the sale of portfolio securities of the affected foreign companies. In addition, the Fund may invest in unsponsored depositary receipts, the issuers of which are not obligated to disclose material information about the underlying securities to investors in the United States. Ownership of unsponsored depositary receipts may not entitle the Fund to the same benefits and rights as ownership of a sponsored depositary receipt or the underlying security.
Common Stock
Common stock generally takes the form of shares in a corporation which represent an ownership interest. It ranks below preferred stock and debt securities in claims for dividends and for assets of the company in a liquidation or bankruptcy. The value of a company’s common stock may fall as a result of factors directly relating to that company, such as decisions made by its management or decreased demand for the company’s products or services. A stock’s value may also decline because of factors affecting not just the company, but also companies in the same industry or sector. The price of a company’s stock may also be affected by changes in financial markets that are relatively unrelated to the company, such as changes in interest rates, currency exchange rates or industry regulation. Companies that elect to pay dividends on their common stock generally only do so after they invest in their own business and make required payments to bondholders and on other debt and preferred stock. Therefore, the value of a company’s common stock will usually be more volatile than its bonds, other debt and preferred stock. Common stock may be exchange-traded or OTC. OTC stock may be less liquid than exchange-traded stock.
Other Investment Company Securities and Other Exchange-Traded Products
The Fund at times may invest in shares of other investment companies, including open-end funds, closed-end funds, business development companies (“BDCs”), ETFs, unit investment trusts, and other investment companies of the Trust. The Fund may invest in securities of an investment company advised by the Manager or the Sub-Advisor. Investments in the securities of other investment companies may involve duplication of advisory fees and certain other expenses. By investing in another investment company, the Fund becomes a shareholder of that investment company. As a result, Fund shareholders indirectly will bear the Fund’s proportionate share of the fees and expenses paid by shareholders of the other investment company, in addition to the fees and expenses Fund shareholders directly bear in connection with the Fund’s own operations. These other fees and expenses, if applicable, are reflected as Acquired Fund Fees and Expenses and are included in the Fees and Expenses Table for the Fund in its Prospectus. Investment in other investment companies may involve the payment of substantial premiums above the value of such issuer’s portfolio securities.
Publicly Traded Partnerships/Master Limited Partnerships (“MLPs”)
The Fund may invest in publicly traded partnerships such as MLPs. MLPs issue units that are registered with the SEC and are freely tradable on a securities exchange or in the OTC market. An MLP may have one or more general partners, who conduct the business, and one or more limited partners, who contribute capital. The general partner or partners are jointly and severally responsible for the liabilities of the MLP. (An MLP also may be an
27
American Beacon Large Cap Value FundSM
Notes to Financial Statements
October 31, 2021
entity similar to a limited partnership, such as an LLC, which has one or more managers or managing members and non-managing members (who are like limited partners)). The Fund invests in an MLP as a limited partner and normally would not be liable for the debts of an MLP beyond the amount the Fund has invested therein, but it would not be shielded to the same extent that a shareholder of a corporation would be. In certain instances, creditors of an MLP would have the right to seek a return of capital that had been distributed to a limited partner. The right of an MLP’s creditors would continue even after the Fund had sold its investment in the partnership. MLPs typically invest in real estate and oil and gas equipment leasing assets, but they also finance entertainment, research and development, and other projects.
Real Estate Investment Trusts (“REITs”)
REITs are pooled investment vehicles that own, and often operate, income producing real estate (known as “equity REITs”) or invest in mortgages secured by loans on such real estate (known as “mortgage REITs”) or both (known as “hybrid REITs”). REITs are susceptible to the risks associated with direct ownership of real estate, such as declines in property values, increase in property taxes, operating expenses, rising interest rates or overbuilding, zoning changes, and losses from casualty or condemnation. REITs typically are subject to management fees and other expenses that are separate from those of the Fund.
5. Financial Derivative Instruments
The Fund may utilize derivative instruments to gain market exposure on cash balances or reduce market exposure in anticipation of liquidity needs. When considering the Fund’s use of derivatives, it is important to note that the Fund does not use derivatives for the purpose of creating financial leverage.
Futures Contracts
A futures contract is a contract to purchase or sell a particular security, or the cash value of an asset, such as securities, indices, or currencies, at a specified future date at a price agreed upon when the contract is made. Under many such contracts, no delivery of the actual underlying asset is required. Rather, upon the expiration of the contract, settlement is made by exchanging cash in an amount equal to the difference between the contract price and the closing price of the asset (e.g., a security or an index) at expiration, net of the initial and variation margin that was previously paid. A Treasury futures contract is a contract for the future delivery of a U.S. Treasury security. An equity index futures contract is based on the value of an underlying index. The Fund may, from time to time, use futures positions to equitize cash and expose its portfolio to changes in securities prices or index prices. This can magnify gains and losses in the Fund. The Fund also may have to sell assets at inopportune times to satisfy its settlement or collateral obligations. The risks associated with the use of futures contracts also include that there may be an imperfect correlation between the changes in market value of the prices of futures contracts and the assets underlying such contracts and that there may not be a liquid secondary market for a futures contract.
During the year ended October 31, 2021, the Fund entered into futures contracts primarily for exposing cash to markets.
The Fund’s average futures contracts outstanding fluctuate throughout the operating year as required to meet strategic requirements. The following table illustrates the average quarterly volume of futures contracts. For the purpose of this disclosure, volume is measured by contracts outstanding at each quarter end.
Average Futures Contracts Outstanding | ||||
Fund | Year Ended October 31, 2021 | |||
Large Cap Value | 457 | |||
28
American Beacon Large Cap Value FundSM
Notes to Financial Statements
October 31, 2021
The following is a summary of the fair valuations of the Fund’s derivative instruments categorized by risk exposure(1):
| Fair values of financial instruments on the Statement of Assets and Liabilities as of October 31, 2021: |
| ||||||||||||||||||||||||||||||||||||||||||||||||||||||
| Derivatives not accounted for as hedging instruments | |||||||||||||||||||||||||||||||||||||||||||||||||||||||
Assets: | Credit contracts | Foreign exchange contracts | Commodity contracts | Interest rate contracts | Equity contracts | Total | |||||||||||||||||||||||||||||||||||||||||||||||||
| Receivable for variation margin from open futures contracts(2) | $ | - | $ | - | $ | - | $ | - | $ | 4,216,368 | $ | 4,216,368 | |||||||||||||||||||||||||||||||||||||||||||
| The effect of financial derivative instruments on the Statement of Operations as of October 31, 2021: |
| ||||||||||||||||||||||||||||||||||||||||||||||||||||||
| Derivatives not accounted for as hedging instruments | |||||||||||||||||||||||||||||||||||||||||||||||||||||||
Realized gain (loss) from derivatives | Credit contracts | Foreign exchange contracts | Commodity contracts | Interest rate contracts | Equity contracts | Total | |||||||||||||||||||||||||||||||||||||||||||||||||
| Futures contracts | $ | - | $ | - | $ | - | $ | - | $ | 25,960,342 | $ | 25,960,342 | |||||||||||||||||||||||||||||||||||||||||||
Net change in unrealized appreciation | Credit contracts | Foreign exchange contracts | Commodity contracts | Interest rate contracts | Equity contracts | Total | |||||||||||||||||||||||||||||||||||||||||||||||||
| Futures contracts | $ | - | $ | - | $ | - | $ | - | $ | 8,262,696 | $ | 8,262,696 | |||||||||||||||||||||||||||||||||||||||||||
(1) See Note 3 in the Notes to Financial Statements for additional information.
(2) Includes cumulative appreciation (depreciation) of futures contracts as reported in the Fund’s Schedule of Investments footnotes. Only current day’s variation margin is reported within the Statement of Assets and Liabilities.
Offsetting Assets and Liabilities
The Fund is a party to enforceable master netting agreements between brokers and counterparties which provide for the right to offset under certain circumstances. The Fund employs multiple counterparties and has elected not to offset qualifying financial and derivative instruments on the Statement of Assets and Liabilities, as such all financial and derivative instruments are presented on a gross basis. The impacts of netting arrangements that provide the right to offset are detailed below, if applicable. The net amount represents the net receivable or payable that would be due from or to the counterparty in the event of default. Exposure from borrowings and other financing agreements such as repurchase agreements can only be netted across transactions governed by the same Master Agreement with the same legal entity. All amounts reported below represent the balance as of the report date, October 31, 2021.
| Offsetting of Financial and Derivative Assets as of October 31, 2021: | ||||||||||||
| Assets | Liabilities | ||||||||||
| Futures Contracts(1) | $ | 4,216,368 | $ | - | ||||||||
|
|
|
| |||||||||
| Total derivative assets and liabilities in the Statement of Assets and Liabilities | $ | 4,216,368 | $ | - | ||||||||
|
|
|
| |||||||||
| Derivatives not subject to a Master Netting Agreement or similar agreement (“MNA”) | $ | (4,216,368 | ) | $ | - | |||||||
|
|
|
| |||||||||
(1) Includes cumulative appreciation or (depreciation) of futures contracts as reported in the Schedule of Investments footnotes. Only current day’s variation margin is reported within the Statement of Assets and Liabilities.
6. Principal Risks
Investing in the Fund may involve certain risks including, but not limited to, those described below.
29
American Beacon Large Cap Value FundSM
Notes to Financial Statements
October 31, 2021
Equity Investments Risk
Equity securities are subject to market risk. The Fund’s investments in equity securities may include common stocks, preferred stocks, securities convertible into or exchangeable for common stocks, REITs, depositary receipts, and U.S. dollar-denominated foreign stocks traded on U.S. exchanges. Such investments may expose the Fund to additional risk. The value of a company’s common stock may fall as a result of factors affecting the company, companies in the same industry or sector, or the financial markets overall. Common stock generally is subordinate to preferred stock upon the liquidation or bankruptcy of the issuing company. Preferred stocks and convertible securities are sensitive to movements in interest rates. Preferred stocks may be less liquid than common stocks and, unlike common stocks, participation in the growth of an issuer may be limited. Distributions on preferred stocks generally are payable at the discretion of an issuer and after required payments to bond holders. Convertible securities are subject to the risk that the credit standing of the issuer may have an effect on the convertible securities’ investment value. Investments in REITs are subject to the risks associated with investing in the real estate industry such as adverse developments affecting the real estate industry and real property values. Depositary receipts and U.S. dollar-denominated foreign stocks traded on U.S. exchanges are subject to certain of the risks associated with investing directly in foreign securities, including, but not limited to, currency exchange rate fluctuations, political and financial instability in the home country of a particular depositary receipt, less liquidity and more volatility, less government regulation and supervision and delays in transaction settlement.
Foreign Investing Risk
Non-U.S. investments carry potential risks not associated with U.S. investments. Such risks include, but are not limited to: (1) currency exchange rate fluctuations, (2) political and financial instability, (3) less liquidity, (4) lack of uniform accounting, auditing and financial reporting standards, (5) increased price volatility, (6) less government regulation and supervision of foreign stock exchanges, brokers and listed companies, and (7) delays in transaction settlement in some foreign markets. To the extent the Fund invests a significant portion of its assets in securities of a single country or region, it is more likely to be affected by events or conditions of that country or region.
Futures Contracts Risk
Futures contracts are derivative instruments where one party pays a fixed price for an agreed amount of securities or other underlying assets at an agreed date. The use of such derivative instruments may expose the Fund to additional risks that it would not be subject to if it invested directly in the securities underlying those derivatives. There may at times be an imperfect correlation between the movement in the prices of futures contracts and the value of their underlying instruments or indexes. There can be no assurance that any strategy used will succeed. There also can be no assurance that, at all times, a liquid market will exist for offsetting a futures contract that the Fund has previously bought or sold and this may result in the inability to close a futures contract when desired. Futures contracts may experience potentially dramatic price changes, which will increase the volatility of the Fund and may involve a small investment of cash (the amount of initial and variation margin) relative to the magnitude of the risk assumed (the potential increase or decrease in the price of the futures contract).
Market Risk
The Fund is subject to the risk that the securities markets will move down, sometimes rapidly and unpredictably, based on overall economic conditions and other factors, which may negatively affect the Fund’s performance. Equity securities generally have greater price volatility than fixed income securities, although under certain market conditions fixed income securities may have comparable or greater price volatility. During a general downturn in the securities markets, multiple assets may decline in value simultaneously. In some cases, traditional market participants have been less willing to make a market in some types of debt instruments, which has affected the liquidity of those instruments. During times of market turmoil, investors tend to look to the safety of securities
30
American Beacon Large Cap Value FundSM
Notes to Financial Statements
October 31, 2021
issued or backed by the U.S. Treasury, causing the prices of these securities to rise and the yields to decline. Reduced liquidity in fixed income and credit markets may negatively affect many issuers worldwide. Prices in many financial markets have increased significantly over the last decade, but there have also been periods of adverse market and financial developments and cyclical change during that timeframe, which have resulted in unusually high levels of volatility in domestic and foreign financial markets that has caused losses for investors and may occur again in the future, particularly if markets enter a period of uncertainty or economic weakness. The value of a security may decline due to adverse issuer-specific conditions, general market conditions unrelated to a particular issuer, or factors that affect a particular industry or industries. Changes in the financial condition of a single issuer or market segment also can impact the market as a whole.
Geopolitical and other events, including war, terrorism, economic uncertainty, trade disputes, pandemics, public health crises, natural disasters and related events have led, and in the future may continue to lead, to instability in world economies and markets generally and reduced liquidity in equity, credit and fixed-income markets, which may disrupt economies and markets and adversely affect the value of your investment. Adverse market events may also lead to increased shareholder redemptions, which could cause the Fund to experience a loss or difficulty in selling investments to meet redemption requests by shareholders and may increase the Fund’s portfolio turnover, which will increase the costs that the Fund incurs and lower the Fund’s performance. Even when securities markets perform well, there is no assurance that the investments held by the Fund will increase in value along with the broader market.
Policy changes by the U.S. government and/or Federal Reserve and political events within the U.S. and abroad, including the U.S. presidential election, the U.S. government’s inability at times to agree on a long-term budget and deficit reduction plan, the threat of a federal government shutdown and threats not to increase the federal government’s debt limit, may affect investor and consumer confidence and may adversely impact financial markets and the broader economy, perhaps suddenly and to a significant degree. The severity or duration of adverse economic conditions may also be affected by policy changes made by governments or quasi-governmental organizations. Global economies and financial markets are becoming increasingly interconnected, which increases the possibility of many markets being affected by events in a single country or events affecting a single or small number of issuers.
Markets and market participants are increasingly reliant upon both publicly available and proprietary information data systems. Data imprecision, software or other technology malfunctions, programming inaccuracies, unauthorized use or access, and similar circumstances may impair the performance of these systems and may have an adverse impact upon a single issuer, a group of issuers, or the market at large. In certain cases, an exchange or market may close or issue trading halts on either specific securities or even the entire market, which may result in the Fund being, among other things, unable to buy or sell certain securities or financial instruments or accurately price its investments. These fluctuations in securities prices could be a sustained trend or a drastic movement. The financial markets generally move in cycles, with periods of rising prices followed by periods of declining prices. The value of your investment may reflect these fluctuations.
Multiple Sub-Advisor Risk
The Manager may allocate the Fund’s assets among multiple sub-advisors, each of which is responsible for investing its allocated portion of the Fund’s assets. To a significant extent, the Fund’s performance will depend on the success of the Manager in allocating the Fund’s assets to sub-advisors and its selection and oversight of the sub-advisors. Because each sub-advisor manages its allocated portion of the Fund independently from another sub-advisor, the same security may be held in different portions of the Fund, or may be acquired for one portion of the Fund at a time when a sub-advisor to another portion deems it appropriate to dispose of the security from that other portion, resulting in higher expenses without accomplishing any net result in the Fund’s holdings. Similarly, under some market conditions, one sub-advisor may believe that temporary, defensive investments in short-term instruments or cash are appropriate when another sub-advisor believes continued exposure to the equity or debt markets is appropriate for its allocated portion of the Fund. Because each sub-advisor directs the trading for its
31
American Beacon Large Cap Value FundSM
Notes to Financial Statements
October 31, 2021
own portion of the Fund, and does not aggregate its transactions with those of the other sub-advisors, the Fund may incur higher brokerage costs than would be the case if a single sub-adviser were managing the entire Fund. In addition, while the Manager seeks to allocate the Fund’s assets among the Fund’s sub-advisors in a manner that it believes is consistent with achieving the Fund’s investment objective(s), the Manager may be subject to potential conflicts of interest in allocating the Fund’s assets among sub-advisors, due to factors that could impact the Manager’s revenues and profits.
Other Investment Companies Risk
The Fund may invest in shares of other registered investment companies, including money market funds that are advised by the Manager. To the extent that the Fund invests in shares of other registered investment companies, the Fund will indirectly bear the fees and expenses, including for example advisory and administrative fees, charged by those investment companies in addition to the Fund’s direct fees and expenses and will be subject to the risks associated with investments in those companies. For example, the Fund’s investments in money market funds are subject to interest rate risk, credit risk, and market risk. The Fund must rely on the investment company in which it invests to achieve its investment objective. If the investment company fails to achieve its investment objective, the value of the Fund’s investment will decline, adversely affecting the Fund’s performance. To the extent the Fund invests in other investment companies that invest in equity securities, fixed-income securities and/or foreign securities, or that track an index, the Fund is subject to the risks associated with the underlying investments held by the investment company or the index fluctuations to which the investment company is subject.
Recent Market Events Risk
An outbreak of infectious respiratory illness caused by a novel coronavirus, known as COVID-19, was first detected in China in December 2019 and has subsequently spread globally. Transmission of COVID-19 and efforts to contain its spread have resulted, and may continue to result, in significant disruptions to business operations, widespread business closures and layoffs, travel restrictions, closed international, national and local borders, prolonged quarantines and stay-at-home orders, disruption of and delays in healthcare service preparation and delivery, service and event cancellations, and lower consumer demand, as well as general concern and uncertainty that has negatively affected the global economy. The impact of the COVID-19 pandemic may last for an extended period of time and may result in a sustained economic downturn or recession. The U.S. Federal Reserve and the U.S. federal government have taken numerous measures to address the economic impact of the COVID-19 pandemic and stimulate the U.S. economy. The ultimate effects of these and other efforts that may be taken may not be known for some time.
The Federal Reserve has spent hundreds of billions of dollars to keep credit flowing through short-term money markets. Amid the Federal Reserve’s ongoing efforts, concerns about the markets’ dependence on the Federal Reserve’s provision of liquidity have grown. Future legislative, regulatory and policy changes may result in more restrictions on international trade, less stringent prudential regulation of certain players in the financial markets, and significant new investments in infrastructure and national defense. High public debt in the U.S. and other countries creates ongoing systemic and market risks and policymaking uncertainty.
A rise in protectionist trade policies, slowing global economic growth, risks associated with the United Kingdom’s departure from the European Union on December 31, 2020, commonly referred to as “Brexit,” and a trade agreement between the United Kingdom and the European Union, the risks associated with ongoing trade negotiations with China, the possibility of changes to some international trade agreements, tensions or open conflict between nations, or political or economic dysfunction within some nations that are major producers of oil could affect the economies of many nations, including the United States, in ways that cannot necessarily be foreseen at the present time.
32
American Beacon Large Cap Value FundSM
Notes to Financial Statements
October 31, 2021
Economists and others have expressed increasing concern about the potential effects of global climate change on property and security values. Certain issuers, industries and regions may be adversely affected by the impacts of climate change, including on the demand for and the development of goods and services and related production costs, and the impacts of legislation, regulation and international accords related to climate change, as well as any indirect consequences of regulation or business trends driven by climate change.
Sector Risk
Sector risk is the risk associated with the Fund holding a significant amount of investments in similar businesses, which would be similarly affected by particular economic or market events, which may, in certain circumstances, cause the value of the equity and debt securities of companies in a particular sector of the market to change. To the extent the Fund has substantial holdings within a particular sector, the risks to the Fund associated with that sector increase.
To the extent the Fund invests significantly in the financial services sector, the value of the Fund’s shares may be particularly vulnerable to factors affecting that sector, such as the availability and cost of capital funds, changes in interest rates, the rate of corporate and consumer debt defaults, extensive government regulation and price competition. The value of the Fund’s shares could experience significantly greater volatility than investment companies investing more broadly.
Securities Lending Risk
The Fund may lend its portfolio securities to brokers, dealers and financial institutions in order to obtain additional income. Borrowers of the Fund’s securities provide collateral either in the form of cash, which the Fund reinvests in securities or in the form of non-cash collateral consisting of securities issued or guaranteed by the U.S. government or one of its agencies or instrumentalities. The Fund will be responsible for the risks associated with the investment of cash collateral, including any collateral invested in an affiliated money market fund. The Fund may lose money on its investment of cash collateral or may fail to earn sufficient income on its investment to cover its payment to the borrower of a pre-negotiated fee or “rebate” for the use of that cash collateral in connection with the loan. The Fund could also lose money due to a decline in the value of non-cash collateral. In addition, delays may occur in the recovery of securities from borrowers, which could interfere with the Fund’s ability to vote proxies or to settle transactions or could result in increased costs. Moreover, if the borrower becomes subject to insolvency or similar proceedings, the Fund could incur delays in its ability to enforce its rights in its collateral. There also is a risk that a borrower may default on its obligation to return loaned securities at a time when the value of the Fund’s collateral is inadequate. Although the Fund’s securities lending agent may indemnify the Fund against that risk, it is also possible that the securities lending agent will be unable to satisfy its indemnification obligations. In any case in which the loaned securities are not returned to the Fund before an ex-dividend date, whether or not due to a default by the borrower, the payment in lieu of the dividend that the Fund receives from the securities’ borrower would not be treated as a dividend for federal income tax purposes and thus would not qualify for treatment as “qualified dividend income.”
7. Federal Income and Excise Taxes
It is the policy of the Fund to qualify as a regulated investment company (“RIC”), by complying with all applicable provisions of Subchapter M of the Internal Revenue Code, as amended, and to make distributions of taxable income sufficient to relieve it from substantially all federal income and excise taxes. For federal income tax purposes, the Fund is treated as a single entity for the purpose of determining such qualification.
The Fund does not have any unrecorded tax liabilities in the accompanying financial statements. Each of the tax years in the four year period ended October 31, 2021 remain subject to examination by the Internal Revenue Service. If applicable, the Fund recognizes interest accrued related to unrecognized tax benefits in interest expense and penalties in “Other expenses” on the Statement of Operations.
33
American Beacon Large Cap Value FundSM
Notes to Financial Statements
October 31, 2021
The Fund may be subject to taxes imposed by countries in which it invests. Such taxes are generally based on returns of income earned or gains realized or repatriated. Taxes are accrued and applied to net investment income, net realized capital gains and net unrealized appreciation (depreciation), as applicable, as the income is earned or capital gains are recorded.
Dividends are categorized in accordance with income tax regulations which may treat certain transactions differently than U.S. GAAP. Accordingly, the character of distributions and composition of net assets for tax purposes may differ from those reflected in the accompanying financial statements.
The tax character of distributions paid were as follows:
| Year Ended October 31, 2021 | Year Ended October 31, 2020 | |||||||||||
Distributions paid from: | ||||||||||||
Ordinary income* | ||||||||||||
R5 Class | $ | 34,682,616 | $ | 65,160,967 | ||||||||
Y Class | 3,563,893 | 6,822,201 | ||||||||||
Investor Class | 13,029,824 | 23,290,880 | ||||||||||
Advisor Class | 825,551 | 1,302,556 | ||||||||||
A Class | 450,180 | 837,320 | ||||||||||
C Class | 44,328 | 102,714 | ||||||||||
R6 Class | 21,578,876 | 18,513,208 | ||||||||||
Long-term capital gains | ||||||||||||
R5 Class | 219,395,586 | 208,466,781 | ||||||||||
Y Class | 23,327,302 | 22,364,897 | ||||||||||
Investor Class | 99,528,401 | 87,264,962 | ||||||||||
Advisor Class | 6,793,104 | 5,162,370 | ||||||||||
A Class | 3,540,425 | 3,239,784 | ||||||||||
C Class | 646,405 | 556,044 | ||||||||||
R6 Class | 133,889,758 | 58,478,813 | ||||||||||
|
|
|
| |||||||||
Total distributions paid | $ | 561,296,249 | $ | 501,563,497 | ||||||||
|
|
|
| |||||||||
* For tax purposes, short-term capital gains are considered ordinary income distributions.
As of October 31, 2021, $67,273,604 long-term capital gains designated for federal income tax purposes are due to the use of accumulated earnings and profits distributed to shareholders upon redemption of shares.
As of October 31, 2021, the components of distributable earnings (deficits) on a tax basis were as follows:
Fund | Tax Cost | Unrealized Appreciation | Unrealized (Depreciation) | Net Unrealized Appreciation (Depreciation) | ||||||||||||||||||||||||
Large Cap Value | $ | 2,731,407,963 | $ | 1,395,006,438 | $ | (48,112,175 | ) | $ | 1,346,894,263 | |||||||||||||||||||
Fund | Net Unrealized Appreciation (Depreciation) | Undistributed Ordinary Income | Undistributed Long-Term Capital Gains | Accumulated Capital and Other (Losses) | Other Temporary Differences | Distributable Earnings | ||||||||||||||||||||||||||||||||||||||
Large Cap Value | $ | 1,346,894,263 | $ | 118,648,306 | $ | 300,129,508 | $ | – | $ | – | $ | 1,765,672,077 | ||||||||||||||||||||||||||||||||
Financial reporting records are adjusted for permanent book/tax differences to reflect tax character. Financial records are not adjusted for temporary differences. The temporary differences between financial reporting and tax-basis reporting of unrealized appreciation (depreciation) are attributable primarily to the tax deferral of losses from wash sales, the realization for tax purposes of unrealized gains (losses) on certain derivative instruments, and reclassifications of income from investments in real estate securities and other securities.
Due to inherent differences in the recognition of income, expenses, and realized gains (losses) under U.S. GAAP and federal income tax regulations, permanent differences between book and tax reporting have been identified and appropriately reclassified on the Statement of Assets and Liabilities.
34
American Beacon Large Cap Value FundSM
Notes to Financial Statements
October 31, 2021
Accordingly, the following amounts represent current year permanent differences derived from equalization as of October 31, 2021:
Fund | Paid-In-Capital | Distributable Earnings/(Deficits) | ||||||||||
Large Cap Value | $ | 67,273,604 | $ | (67,273,604 | ) | |||||||
For federal income tax purposes, the Fund measures its capital loss carryforwards annually at October 31, its fiscal year end. Capital loss carryforwards retain their character as short-term and/or long-term and may be carried forward and applied against future realized capital gains with no expiration date.
As of October 31, 2021, the Fund did not have any capital loss carryforwards.
8. Investment Transactions
The aggregate cost of purchases and proceeds from sales and maturities of investments, other than short-term obligations, for the year ended October 31, 2021 were as follows:
Fund | Purchases (non-U.S. Government Securities) | Sales (non-U.S. Government Securities) | ||||||||||
Large Cap Value | $ | 932,052,504 | $ | 2,351,051,649 | ||||||||
A summary of the Fund’s transactions in the USG Select Fund for the year ended October 31, 2021 were as follows:
Fund | Type of Transaction | October 31, 2020 Shares/Fair Value | Purchases | Sales | October 31, 2021 Shares/Fair Value | |||||||||||||||||||||||||||||
| Large Cap Value | Direct | $ | 84,250,125 | $ | 2,322,013,441 | $ | 2,277,587,152 | $ | 128,676,414 | |||||||||||||||||||||||||
| Large Cap Value | Securities Lending | - | 118,377,938 | 118,377,938 | - | |||||||||||||||||||||||||||||
9. Securities Lending
The Fund may lend its securities to qualified financial institutions, such as certain broker-dealers, to earn additional income. The borrowers are required to secure their loans continuously with collateral in an amount at least equal to the fair value of the securities loaned, initially in an amount at least equal to 102% of the fair value of domestic securities loaned and 105% of the fair value of international securities loaned. Collateral is monitored and marked-to-market daily. Daily mark-to-market amounts are required to be paid to the borrower or received from the borrower by the end of the following business day. This one day settlement for mark-to-market amounts may result in the collateral being temporarily less than the value of the securities on loan or temporarily more than the required minimum collateral.
To the extent that a loan is collateralized by cash, such cash collateral shall be invested by the securities lending agent (the “Agent”) in money market mutual funds and other short-term investments, provided the investments meet certain quality and diversification requirements. Securities purchased with cash collateral proceeds are listed in the Fund’s Schedule of Investments and the collateral is shown on the Statement of Assets and Liabilities as a payable.
35
American Beacon Large Cap Value FundSM
Notes to Financial Statements
October 31, 2021
Securities lending income is generated from the demand premium (if any) paid by the borrower to borrow a specific security and from the return on investment of cash collateral, reduced by negotiated rebate fees paid to the borrower and transaction costs. To the extent that a loan is secured by non-cash collateral, securities lending income is generated as a demand premium reduced by transaction costs. The Fund, the Agent, and the Manager retained 80%, 10%, and 10%, respectively, of the income generated from securities lending.
While securities are on loan, the Fund continues to receive certain income associated with that security and any gain or loss in the market price that may occur during the term of the loan. In the case of domestic equities, the value of any dividend is received in the form of a substitute payment approximately equal to the dividend. In the case of foreign securities, a negotiated amount is received that is less than the actual dividend, but higher than the dividend amount minus the foreign tax that the Fund would be subject to on the dividend.
Securities lending transactions pose certain risks to the Fund, including that the borrower may not provide additional collateral when required or return the securities when due, that the value of the short-term investments will be less than the amount of cash collateral required to be returned to the borrower, that non-cash collateral may be subject to legal constraints in the event of a borrower bankruptcy, and that the cash collateral investments could become illiquid and unable to be used to return collateral to the borrower. The Fund could also experience delays and costs in gaining access to the collateral. The Fund bears the risk of any deficiency in the amount of the cash collateral available for return to the borrower and any action which impairs its ability to liquidate non-cash collateral to satisfy a borrower default.
As of October 31, 2021, the value of outstanding securities on loan and the value of collateral were as follows:
Fund | Market Value of Securities on Loan | Cash Collateral Received | Non-Cash Collateral Received | Total Collateral Received | ||||||||||||||||||||||||
Large Cap Value | $ | 19,126,587 | $ | - | $ | 19,925,475 | $ | 19,925,475 | ||||||||||||||||||||
Cash collateral is listed on the Fund’s Schedule of Investments and is shown on the Statement of Assets and Liabilities. Income earned on these investments is included in “Income derived from securities lending” on the Statement of Operations.
Non-cash collateral received by the Fund may not be sold or re-pledged except to satisfy a borrower default. Therefore, non-cash collateral is not included on the Fund’s Schedule of Investments or Statement of Assets and Liabilities.
10. Borrowing Arrangements
Effective November 12, 2020 (the “Effective Date”), the Fund, along with certain other funds managed by the Manager (“Participating Funds”), renewed a committed revolving line of credit (the “Committed Line”) agreement with State Street Bank and Trust Company (the “Bank”) to be used to facilitate portfolio liquidity. The maximum borrowing amount under the Committed Line is $150 million with interest at a rate equal to the higher of (a) Overnight Bank Funding Rate (“OBFR”) daily fluctuating rate per annum equal to 1.25% plus the sum of 0.10% or (b) the Federal Funds daily fluctuating rate per annum on amounts borrowed. Each of the Participating Funds paid a proportional amount of a closing fee of $100,000 on the Effective Date and a quarterly commitment fee at a rate of 0.25% per annum on the unused portion of the Committed Line amount. The Committed Line expires November 11, 2021, unless extended by the Bank or terminated by the Participating Funds in accordance with the agreement. Effective November 11, 2021, the Fund’s Committed Line was changed to a maximum of $100 million with an expiration of November 10, 2022.
On the Effective Date, the Fund, along with certain other Participating Funds managed by the Manager, also renewed an uncommitted discretionary demand revolving line of credit (the “Uncommitted Line”) agreement with the Bank to be used to facilitate portfolio liquidity. The maximum borrowing amount under the Uncommitted Line
36
American Beacon Large Cap Value FundSM
Notes to Financial Statements
October 31, 2021
is $50 million with interest at a rate equal to the higher of (a) Overnight Bank Funding Rate (“OBFR”) daily fluctuating rate per annum equal to 1.25% plus the sum of 0.10% or (b) the Federal Funds daily fluctuating rate per annum on amounts borrowed on each outstanding loan. Each of the Participating Funds paid a proportional amount of a closing fee of $35,000 on the Effective Date. The Uncommitted Line expires November 11, 2021 unless extended by the Bank or terminated by the Participating Funds in accordance with the agreement. Effective November 11, 2021, the Fund’s Uncommitted Line was changed to a maximum of $100 million with an expiration of November 10, 2022.
The Participating Funds paid administration, legal and arrangement fees, which are recognized as a component of “Loan expense” on the Statement of Operations, along with commitment fees, that have been allocated among the Participating Funds based on average daily net assets.
During the year ended October 31, 2021, the Fund did not utilize this facility.
11. Capital Share Transactions
The tables below summarize the activity in capital shares for each Class of the Fund:
| R5 Class | ||||||||||||||||||||||||||||
| Year Ended October 31, | ||||||||||||||||||||||||||||
| 2021 | 2020 | |||||||||||||||||||||||||||
Large Cap Value Fund | Shares | Amount | Shares | Amount | ||||||||||||||||||||||||
| Shares sold | 9,514,528 | $ | 261,378,308 | 14,583,865 | $ | 345,640,279 | ||||||||||||||||||||||
| Reinvestment of dividends | 9,027,196 | 216,381,886 | 8,842,185 | 241,214,794 | ||||||||||||||||||||||||
| Shares redeemed | (41,632,480 | ) | (1,173,557,287 | ) | (56,846,970 | ) | (1,416,115,045 | ) | ||||||||||||||||||||
|
|
|
|
|
|
|
| |||||||||||||||||||||
| Net (decrease) in shares outstanding | (23,090,756 | ) | $ | (695,797,093 | ) | (33,420,920 | ) | $ | (829,259,972 | ) | ||||||||||||||||||
|
|
|
|
|
|
|
| |||||||||||||||||||||
| Y Class | ||||||||||||||||||||||||||||
| Year Ended October 31, | ||||||||||||||||||||||||||||
| 2021 | 2020 | |||||||||||||||||||||||||||
Large Cap Value Fund | Shares | Amount | Shares | Amount | ||||||||||||||||||||||||
| Shares sold | 2,676,780 | $ | 75,015,392 | 4,619,593 | $ | 106,515,177 | ||||||||||||||||||||||
| Reinvestment of dividends | 1,085,985 | 25,792,134 | 1,043,006 | 28,234,181 | ||||||||||||||||||||||||
| Shares redeemed | (3,037,622 | ) | (82,439,293 | ) | (8,700,548 | ) | (223,599,140 | ) | ||||||||||||||||||||
|
|
|
|
|
|
|
| |||||||||||||||||||||
| Net increase (decrease) in shares outstanding | 725,143 | $ | 18,368,233 | (3,037,949 | ) | $ | (88,849,782 | ) | ||||||||||||||||||||
|
|
|
|
|
|
|
| |||||||||||||||||||||
| Investor Class | ||||||||||||||||||||||||||||
| Year Ended October 31, | ||||||||||||||||||||||||||||
| 2021 | 2020 | |||||||||||||||||||||||||||
Large Cap Value Fund | Shares | Amount | Shares | Amount | ||||||||||||||||||||||||
| Shares sold | 3,651,934 | $ | 92,653,002 | 4,873,178 | $ | 102,511,782 | ||||||||||||||||||||||
| Reinvestment of dividends | 5,150,897 | 111,413,906 | 4,323,502 | 107,957,844 | ||||||||||||||||||||||||
| Shares redeemed | (12,564,935 | ) | (310,817,392 | ) | (19,147,457 | ) | (414,908,921 | ) | ||||||||||||||||||||
|
|
|
|
|
|
|
| |||||||||||||||||||||
| Net (decrease) in shares outstanding | (3,762,104 | ) | $ | (106,750,484 | ) | (9,950,777 | ) | $ | (204,439,295 | ) | ||||||||||||||||||
|
|
|
|
|
|
|
| |||||||||||||||||||||
| Advisor Class | ||||||||||||||||||||||||||||
| Year Ended October 31, | ||||||||||||||||||||||||||||
| 2021 | 2020 | |||||||||||||||||||||||||||
Large Cap Value Fund | Shares | Amount | Shares | Amount | ||||||||||||||||||||||||
| Shares sold | 348,459 | $ | 8,359,633 | 549,199 | $ | 11,028,542 | ||||||||||||||||||||||
| Reinvestment of dividends | 331,974 | 7,054,439 | 209,035 | 5,140,176 | ||||||||||||||||||||||||
| Shares redeemed | (554,676 | ) | (13,386,335 | ) | (1,135,706 | ) | (25,190,406 | ) | ||||||||||||||||||||
|
|
|
|
|
|
|
| |||||||||||||||||||||
| Net increase (decrease) in shares outstanding | 125,757 | $ | 2,027,737 | (377,472 | ) | $ | (9,021,688 | ) | ||||||||||||||||||||
|
|
|
|
|
|
|
| |||||||||||||||||||||
| A Class | ||||||||||||||||||||||||||||
| Year Ended October 31, | ||||||||||||||||||||||||||||
| 2021 | 2020 | |||||||||||||||||||||||||||
Large Cap Value Fund | Shares | Amount | Shares | Amount | ||||||||||||||||||||||||
| Shares sold | 98,924 | $ | 2,464,857 | 224,146 | $ | 5,007,909 | ||||||||||||||||||||||
| Reinvestment of dividends | 184,657 | 3,920,273 | 164,301 | 4,035,240 | ||||||||||||||||||||||||
| Shares redeemed | (1,051,348 | ) | (24,700,324 | ) | (684,117 | ) | (13,767,798 | ) | ||||||||||||||||||||
|
|
|
|
|
|
|
| |||||||||||||||||||||
| Net (decrease) in shares outstanding | (767,767 | ) | $ | (18,315,194 | ) | (295,670 | ) | $ | (4,724,649 | ) | ||||||||||||||||||
|
|
|
|
|
|
|
| |||||||||||||||||||||
37
American Beacon Large Cap Value FundSM
Notes to Financial Statements
October 31, 2021
| C Class | ||||||||||||||||||||||||||||
| Year Ended October 31, | ||||||||||||||||||||||||||||
| 2021 | 2020 | |||||||||||||||||||||||||||
Large Cap Value Fund | Shares | Amount | Shares | Amount | ||||||||||||||||||||||||
| Shares sold | 76,910 | $ | 1,897,938 | 24,726 | $ | 531,337 | ||||||||||||||||||||||
| Reinvestment of dividends | 31,897 | 673,993 | 25,018 | 611,677 | ||||||||||||||||||||||||
| Shares redeemed | (79,903 | ) | (1,963,612 | ) | (91,652 | ) | (1,912,256 | ) | ||||||||||||||||||||
|
|
|
|
|
|
|
| |||||||||||||||||||||
| Net increase (decrease) in shares outstanding | 28,904 | $ | 608,319 | (41,908 | ) | $ | (769,242 | ) | ||||||||||||||||||||
|
|
|
|
|
|
|
| |||||||||||||||||||||
| R6 Class | ||||||||||||||||||||||||||||
| Year Ended October 31, | ||||||||||||||||||||||||||||
| 2021 | 2020 | |||||||||||||||||||||||||||
Large Cap Value Fund | Shares | Amount | Shares | Amount | ||||||||||||||||||||||||
| Shares sold | 17,246,084 | $ | 490,638,849 | 26,236,020 | $ | 667,284,169 | ||||||||||||||||||||||
| Reinvestment of dividends | 6,072,914 | 145,567,749 | 2,730,148 | 74,423,843 | ||||||||||||||||||||||||
| Shares redeemed | (26,373,754 | ) | (726,290,652 | ) | (11,934,191 | ) | (288,886,953 | ) | ||||||||||||||||||||
|
|
|
|
|
|
|
| |||||||||||||||||||||
| Net increase (decrease) in shares outstanding | (3,054,756 | ) | $ | (90,084,054 | ) | 17,031,977 | $ | 452,821,059 | ||||||||||||||||||||
|
|
|
|
|
|
|
| |||||||||||||||||||||
12. Subsequent Events
Management has evaluated subsequent events for possible recognition or disclosure in the financial statements through the date the financial statements are issued. Management has determined that there are no material events that would require disclosure in the Fund’s financial statements through this date.
38
American Beacon Large Cap Value FundSM
(For a share outstanding throughout the period)
| R5 ClassA | ||||||||||||||||||||||||||||||||||||
| Year Ended October 31, | ||||||||||||||||||||||||||||||||||||
| 2021 | 2020B | 2019 | 2018 | 2017 | ||||||||||||||||||||||||||||||||
|
| |||||||||||||||||||||||||||||||||||
Net asset value, beginning of period | $ | 23.36 | $ | 28.32 | $ | 28.41 | $ | 30.98 | $ | 25.80 | ||||||||||||||||||||||||||
|
|
|
|
|
|
|
|
|
| |||||||||||||||||||||||||||
Income (loss) from investment operations: | ||||||||||||||||||||||||||||||||||||
Net investment income | 0.59 | 0.65 | 0.63 | 0.63 | 0.59 | |||||||||||||||||||||||||||||||
Net gains (losses) on investments (both realized and unrealized) | 10.64 | (2.89 | ) | 1.69 | (0.07 | ) | 5.41 | |||||||||||||||||||||||||||||
|
|
|
|
|
|
|
|
|
| |||||||||||||||||||||||||||
Total income (loss) from investment operations | 11.23 | (2.24 | ) | 2.32 | 0.56 | 6.00 | ||||||||||||||||||||||||||||||
|
|
|
|
|
|
|
|
|
| |||||||||||||||||||||||||||
Less distributions: | ||||||||||||||||||||||||||||||||||||
Dividends from net investment income | (0.49 | ) | (0.62 | ) | (0.55 | ) | (0.55 | ) | (0.60 | ) | ||||||||||||||||||||||||||
Distributions from net realized gains | (3.11 | ) | (2.10 | ) | (1.86 | ) | (2.58 | ) | (0.22 | ) | ||||||||||||||||||||||||||
|
|
|
|
|
|
|
|
|
| |||||||||||||||||||||||||||
Total distributions | (3.60 | ) | (2.72 | ) | (2.41 | ) | (3.13 | ) | (0.82 | ) | ||||||||||||||||||||||||||
|
|
|
|
|
|
|
|
|
| |||||||||||||||||||||||||||
Net asset value, end of period | $ | 30.99 | $ | 23.36 | $ | 28.32 | $ | 28.41 | $ | 30.98 | ||||||||||||||||||||||||||
|
|
|
|
|
|
|
|
|
| |||||||||||||||||||||||||||
Total returnC | 52.60 | % | (9.29 | )% | 10.14 | % | 1.51 | % | 23.60 | % | ||||||||||||||||||||||||||
|
|
|
|
|
|
|
|
|
| |||||||||||||||||||||||||||
Ratios and supplemental data: |
| |||||||||||||||||||||||||||||||||||
Net assets, end of period | $ | 1,682,465,233 | $ | 1,807,587,315 | $ | 3,137,789,485 | $ | 3,700,700,522 | $ | 4,765,771,483 | ||||||||||||||||||||||||||
Ratios to average net assets: | ||||||||||||||||||||||||||||||||||||
Expenses, before reimbursements and/or recoupments | 0.63 | % | 0.63 | % | 0.63 | % | 0.62 | % | 0.60 | % | ||||||||||||||||||||||||||
Expenses, net of reimbursements and/or recoupments | 0.63 | % | 0.63 | % | 0.63 | % | 0.62 | % | 0.60 | % | ||||||||||||||||||||||||||
Net investment income, before expense reimbursements and/or recoupments | 1.30 | % | 1.90 | % | 2.07 | % | 1.83 | % | 1.78 | % | ||||||||||||||||||||||||||
Net investment income, net of reimbursements and/or recoupments | 1.30 | % | 1.90 | % | 2.07 | % | 1.83 | % | 1.78 | % | ||||||||||||||||||||||||||
Portfolio turnover rate | 23 | % | 67 | % | 23 | % | 23 | % | 25 | % | ||||||||||||||||||||||||||
| A | Prior to February 28, 2020, the R5 Class was known as Institutional Class. |
| B | On January 17, 2020, Brandywine Global Investment Management, LLC was terminated and ceased managing assets of the Fund. |
| C | Based on net asset value, which does not reflect the sales charge, redemption fee, or contingent deferred sales charge, if applicable. May include adjustments in accordance with U.S. GAAP and as such, the net asset value for reporting purposes and the returns based upon those net asset values may differ from the net asset value and returns for shareholder transactions. |
See accompanying notes
39
American Beacon Large Cap Value FundSM
Financial Highlights
(For a share outstanding throughout the period)
| Y Class | ||||||||||||||||||||||||||||||||||||
| Year Ended October 31, | ||||||||||||||||||||||||||||||||||||
| 2021 | 2020A | 2019 | 2018 | 2017 | ||||||||||||||||||||||||||||||||
|
| |||||||||||||||||||||||||||||||||||
Net asset value, beginning of period | $ | 23.16 | $ | 28.10 | $ | 28.20 | $ | 30.78 | $ | 25.64 | ||||||||||||||||||||||||||
|
|
|
|
|
|
|
|
|
| |||||||||||||||||||||||||||
Income (loss) from investment operations: | ||||||||||||||||||||||||||||||||||||
Net investment income | 0.38 | 0.39 | 0.56 | 0.57 | 0.48 | |||||||||||||||||||||||||||||||
Net gains (losses) on investments (both realized and unrealized) | 10.73 | (2.63 | ) | 1.72 | (0.04 | ) | 5.46 | |||||||||||||||||||||||||||||
|
|
|
|
|
|
|
|
|
| |||||||||||||||||||||||||||
Total income (loss) from investment operations | 11.11 | (2.24 | ) | 2.28 | 0.53 | 5.94 | ||||||||||||||||||||||||||||||
|
|
|
|
|
|
|
|
|
| |||||||||||||||||||||||||||
Less distributions: | ||||||||||||||||||||||||||||||||||||
Dividends from net investment income | (0.48 | ) | (0.60 | ) | (0.52 | ) | (0.53 | ) | (0.58 | ) | ||||||||||||||||||||||||||
Distributions from net realized gains | (3.11 | ) | (2.10 | ) | (1.86 | ) | (2.58 | ) | (0.22 | ) | ||||||||||||||||||||||||||
|
|
|
|
|
|
|
|
|
| |||||||||||||||||||||||||||
Total distributions | (3.59 | ) | (2.70 | ) | (2.38 | ) | (3.11 | ) | (0.80 | ) | ||||||||||||||||||||||||||
|
|
|
|
|
|
|
|
|
| |||||||||||||||||||||||||||
Net asset value, end of period | $ | 30.68 | $ | 23.16 | $ | 28.10 | $ | 28.20 | $ | 30.78 | ||||||||||||||||||||||||||
|
|
|
|
|
|
|
|
|
| |||||||||||||||||||||||||||
Total returnB | 52.47 | % | (9.35 | )% | 10.05 | % | 1.42 | % | 23.51 | % | ||||||||||||||||||||||||||
|
|
|
|
|
|
|
|
|
| |||||||||||||||||||||||||||
Ratios and supplemental data: |
| |||||||||||||||||||||||||||||||||||
Net assets, end of period | $ | 258,183,363 | $ | 178,065,442 | $ | 301,457,382 | $ | 298,017,629 | $ | 384,155,569 | ||||||||||||||||||||||||||
Ratios to average net assets: | ||||||||||||||||||||||||||||||||||||
Expenses, before reimbursements and/or recoupments | 0.69 | % | 0.70 | % | 0.70 | % | 0.68 | % | 0.67 | % | ||||||||||||||||||||||||||
Expenses, net of reimbursements and/or recoupments | 0.69 | % | 0.70 | % | 0.70 | % | 0.68 | % | 0.67 | % | ||||||||||||||||||||||||||
Net investment income, before expense reimbursements and/or recoupments | 1.21 | % | 1.84 | % | 1.98 | % | 1.77 | % | 1.69 | % | ||||||||||||||||||||||||||
Net investment income, net of reimbursements and/or recoupments | 1.21 | % | 1.84 | % | 1.98 | % | 1.77 | % | 1.69 | % | ||||||||||||||||||||||||||
Portfolio turnover rate | 23 | % | 67 | % | 23 | % | 23 | % | 25 | % | ||||||||||||||||||||||||||
| A | On January 17, 2020, Brandywine Global Investment Management, LLC was terminated and ceased managing assets of the Fund. |
| B | Based on net asset value, which does not reflect the sales charge, redemption fee, or contingent deferred sales charge, if applicable. May include adjustments in accordance with U.S. GAAP and as such, the net asset value for reporting purposes and the returns based upon those net asset values may differ from the net asset value and returns for shareholder transactions. |
See accompanying notes
40
American Beacon Large Cap Value FundSM
Financial Highlights
(For a share outstanding throughout the period)
| Investor Class | ||||||||||||||||||||||||||||||||||||
| Year Ended October 31, | ||||||||||||||||||||||||||||||||||||
| 2021 | 2020A | 2019 | 2018 | 2017 | ||||||||||||||||||||||||||||||||
|
| |||||||||||||||||||||||||||||||||||
Net asset value, beginning of period | $ | 21.32 | $ | 26.06 | $ | 26.33 | $ | 28.92 | $ | 24.13 | ||||||||||||||||||||||||||
|
|
|
|
|
|
|
|
|
| |||||||||||||||||||||||||||
Income (loss) from investment operations: | ||||||||||||||||||||||||||||||||||||
Net investment income | 0.20 | 0.29 | 0.41 | 0.41 | 0.40 | |||||||||||||||||||||||||||||||
Net gains (losses) on investments (both realized and unrealized) | 9.88 | (2.41 | ) | 1.63 | 0.02 | 5.12 | ||||||||||||||||||||||||||||||
|
|
|
|
|
|
|
|
|
| |||||||||||||||||||||||||||
Total income (loss) from investment operations | 10.08 | (2.12 | ) | 2.04 | 0.43 | 5.52 | ||||||||||||||||||||||||||||||
|
|
|
|
|
|
|
|
|
| |||||||||||||||||||||||||||
Less distributions: | ||||||||||||||||||||||||||||||||||||
Dividends from net investment income | (0.41 | ) | (0.52 | ) | (0.45 | ) | (0.44 | ) | (0.51 | ) | ||||||||||||||||||||||||||
Distributions from net realized gains | (3.11 | ) | (2.10 | ) | (1.86 | ) | (2.58 | ) | (0.22 | ) | ||||||||||||||||||||||||||
|
|
|
|
|
|
|
|
|
| |||||||||||||||||||||||||||
Total distributions | (3.52 | ) | (2.62 | ) | (2.31 | ) | (3.02 | ) | (0.73 | ) | ||||||||||||||||||||||||||
|
|
|
|
|
|
|
|
|
| |||||||||||||||||||||||||||
Net asset value, end of period | $ | 27.88 | $ | 21.32 | $ | 26.06 | $ | 26.33 | $ | 28.92 | ||||||||||||||||||||||||||
|
|
|
|
|
|
|
|
|
| |||||||||||||||||||||||||||
Total returnB | 52.04 | % | (9.59 | )% | 9.77 | % | 1.18 | % | 23.20 | % | ||||||||||||||||||||||||||
|
|
|
|
|
|
|
|
|
| |||||||||||||||||||||||||||
Ratios and supplemental data: |
| |||||||||||||||||||||||||||||||||||
Net assets, end of period | $ | 821,099,597 | $ | 707,970,431 | $ | 1,124,625,846 | $ | 1,505,354,807 | $ | 1,990,199,621 | ||||||||||||||||||||||||||
Ratios to average net assets: | ||||||||||||||||||||||||||||||||||||
Expenses, before reimbursements and/or recoupments | 0.98 | % | 0.96 | % | 0.96 | % | 0.95 | % | 0.92 | % | ||||||||||||||||||||||||||
Expenses, net of reimbursements and/or recoupments | 0.98 | % | 0.96 | % | 0.96 | % | 0.95 | % | 0.92 | % | ||||||||||||||||||||||||||
Net investment income, before expense reimbursements and/or recoupments | 0.93 | % | 1.57 | % | 1.74 | % | 1.50 | % | 1.46 | % | ||||||||||||||||||||||||||
Net investment income, net of reimbursements and/or recoupments | 0.93 | % | 1.57 | % | 1.74 | % | 1.50 | % | 1.46 | % | ||||||||||||||||||||||||||
Portfolio turnover rate | 23 | % | 67 | % | 23 | % | 23 | % | 25 | % | ||||||||||||||||||||||||||
| A | On January 17, 2020, Brandywine Global Investment Management, LLC was terminated and ceased managing assets of the Fund. |
| B | Based on net asset value, which does not reflect the sales charge, redemption fee, or contingent deferred sales charge, if applicable. May include adjustments in accordance with U.S. GAAP and as such, the net asset value for reporting purposes and the returns based upon those net asset values may differ from the net asset value and returns for shareholder transactions. |
See accompanying notes
41
American Beacon Large Cap Value FundSM
Financial Highlights
(For a share outstanding throughout the period)
| Advisor Class | ||||||||||||||||||||||||||||||||||||
| Year Ended October 31, | ||||||||||||||||||||||||||||||||||||
| 2021 | 2020A | 2019 | 2018 | 2017 | ||||||||||||||||||||||||||||||||
|
| |||||||||||||||||||||||||||||||||||
Net asset value, beginning of period | $ | 20.97 | $ | 25.68 | $ | 25.95 | $ | 28.54 | $ | 23.82 | ||||||||||||||||||||||||||
|
|
|
|
|
|
|
|
|
| |||||||||||||||||||||||||||
Income (loss) from investment operations: | ||||||||||||||||||||||||||||||||||||
Net investment income | 0.26 | 0.24 | 0.47 | 0.28 | 0.21 | |||||||||||||||||||||||||||||||
Net gains (losses) on investments (both realized and unrealized) | 9.62 | (2.36 | ) | 1.52 | 0.10 | 5.20 | ||||||||||||||||||||||||||||||
|
|
|
|
|
|
|
|
|
| |||||||||||||||||||||||||||
Total income (loss) from investment operations | 9.88 | (2.12 | ) | 1.99 | 0.38 | 5.41 | ||||||||||||||||||||||||||||||
|
|
|
|
|
|
|
|
|
| |||||||||||||||||||||||||||
Less distributions: | ||||||||||||||||||||||||||||||||||||
Dividends from net investment income | (0.38 | ) | (0.49 | ) | (0.40 | ) | (0.39 | ) | (0.47 | ) | ||||||||||||||||||||||||||
Distributions from net realized gains | (3.11 | ) | (2.10 | ) | (1.86 | ) | (2.58 | ) | (0.22 | ) | ||||||||||||||||||||||||||
|
|
|
|
|
|
|
|
|
| |||||||||||||||||||||||||||
Total distributions | (3.49 | ) | (2.59 | ) | (2.26 | ) | (2.97 | ) | (0.69 | ) | ||||||||||||||||||||||||||
|
|
|
|
|
|
|
|
|
| |||||||||||||||||||||||||||
Net asset value, end of period | $ | 27.36 | $ | 20.97 | $ | 25.68 | $ | 25.95 | $ | 28.54 | ||||||||||||||||||||||||||
|
|
|
|
|
|
|
|
|
| |||||||||||||||||||||||||||
Total returnB | 51.89 | % | (9.73 | )% | 9.64 | % | 1.00 | % | 23.00 | % | ||||||||||||||||||||||||||
|
|
|
|
|
|
|
|
|
| |||||||||||||||||||||||||||
Ratios and supplemental data: |
| |||||||||||||||||||||||||||||||||||
Net assets, end of period | $ | 63,521,926 | $ | 46,049,690 | $ | 66,077,449 | $ | 62,811,940 | $ | 88,196,090 | ||||||||||||||||||||||||||
Ratios to average net assets: | ||||||||||||||||||||||||||||||||||||
Expenses, before reimbursements and/or recoupments | 1.10 | % | 1.10 | % | 1.10 | % | 1.09 | % | 1.07 | % | ||||||||||||||||||||||||||
Expenses, net of reimbursements and/or recoupments | 1.10 | % | 1.10 | % | 1.10 | % | 1.09 | % | 1.07 | % | ||||||||||||||||||||||||||
Net investment income, before expense reimbursements and/or recoupments | 0.81 | % | 1.42 | % | 1.58 | % | 1.36 | % | 1.31 | % | ||||||||||||||||||||||||||
Net investment income, net of reimbursements and/or recoupments | 0.81 | % | 1.42 | % | 1.58 | % | 1.36 | % | 1.31 | % | ||||||||||||||||||||||||||
Portfolio turnover rate | 23 | % | 67 | % | 23 | % | 23 | % | 25 | % | ||||||||||||||||||||||||||
| A | On January 17, 2020, Brandywine Global Investment Management, LLC was terminated and ceased managing assets of the Fund. |
| B | Based on net asset value, which does not reflect the sales charge, redemption fee, or contingent deferred sales charge, if applicable. May include adjustments in accordance with U.S. GAAP and as such, the net asset value for reporting purposes and the returns based upon those net asset values may differ from the net asset value and returns for shareholder transactions. |
See accompanying notes
42
American Beacon Large Cap Value FundSM
Financial Highlights
(For a share outstanding throughout the period)
| A Class | ||||||||||||||||||||||||||||||||||||
| Year Ended October 31, | ||||||||||||||||||||||||||||||||||||
| 2021 | 2020A | 2019 | 2018 | 2017 | ||||||||||||||||||||||||||||||||
|
| |||||||||||||||||||||||||||||||||||
Net asset value, beginning of period | $ | 20.96 | $ | 25.66 | $ | 26.00 | $ | 28.61 | $ | 23.90 | ||||||||||||||||||||||||||
|
|
|
|
|
|
|
|
|
| |||||||||||||||||||||||||||
Income (loss) from investment operations: | ||||||||||||||||||||||||||||||||||||
Net investment income | 0.24 | B | 0.20 | 0.40 | 0.48 | 0.28 | ||||||||||||||||||||||||||||||
Net gains (losses) on investments (both realized and unrealized) | 9.68 | (2.29 | ) | 1.59 | (0.06 | ) | 5.17 | |||||||||||||||||||||||||||||
|
|
|
|
|
|
|
|
|
| |||||||||||||||||||||||||||
Total income (loss) from investment operations | 9.92 | (2.09 | ) | 1.99 | 0.42 | 5.45 | ||||||||||||||||||||||||||||||
|
|
|
|
|
|
|
|
|
| |||||||||||||||||||||||||||
Less distributions: | ||||||||||||||||||||||||||||||||||||
Dividends from net investment income | (0.40 | ) | (0.51 | ) | (0.47 | ) | (0.45 | ) | (0.52 | ) | ||||||||||||||||||||||||||
Distributions from net realized gains | (3.11 | ) | (2.10 | ) | (1.86 | ) | (2.58 | ) | (0.22 | ) | ||||||||||||||||||||||||||
|
|
|
|
|
|
|
|
|
| |||||||||||||||||||||||||||
Total distributions | (3.51 | ) | (2.61 | ) | (2.33 | ) | (3.03 | ) | (0.74 | ) | ||||||||||||||||||||||||||
|
|
|
|
|
|
|
|
|
| |||||||||||||||||||||||||||
Net asset value, end of period | $ | 27.37 | $ | 20.96 | $ | 25.66 | $ | 26.00 | $ | 28.61 | ||||||||||||||||||||||||||
|
|
|
|
|
|
|
|
|
| |||||||||||||||||||||||||||
Total returnC | 52.15 | % | (9.65 | )% | 9.72 | % | 1.15 | % | 23.13 | % | ||||||||||||||||||||||||||
|
|
|
|
|
|
|
|
|
| |||||||||||||||||||||||||||
Ratios and supplemental data: |
| |||||||||||||||||||||||||||||||||||
Net assets, end of period | $ | 12,661,833 | $ | 25,792,400 | $ | 39,157,098 | $ | 42,722,617 | $ | 40,073,435 | ||||||||||||||||||||||||||
Ratios to average net assets: | ||||||||||||||||||||||||||||||||||||
Expenses, before reimbursements and/or recoupments | 0.96 | % | 1.00 | % | 1.01 | % | 0.93 | % | 0.98 | % | ||||||||||||||||||||||||||
Expenses, net of reimbursements and/or recoupments | 0.96 | % | 1.00 | % | 1.01 | % | 0.93 | % | 0.98 | % | ||||||||||||||||||||||||||
Net investment income, before expense reimbursements and/or recoupments | 0.98 | % | 1.52 | % | 1.68 | % | 1.49 | % | 1.38 | % | ||||||||||||||||||||||||||
Net investment income, net of reimbursements and/or recoupments | 0.98 | % | 1.52 | % | 1.68 | % | 1.49 | % | 1.38 | % | ||||||||||||||||||||||||||
Portfolio turnover rate | 23 | % | 67 | % | 23 | % | 23 | % | 25 | % | ||||||||||||||||||||||||||
| A | On January 17, 2020, Brandywine Global Investment Management, LLC was terminated and ceased managing assets of the Fund. |
| B | Per share amounts have been calculated using the average shares method. |
| C | Based on net asset value, which does not reflect the sales charge, redemption fee, or contingent deferred sales charge, if applicable. May include adjustments in accordance with U.S. GAAP and as such, the net asset value for reporting purposes and the returns based upon those net asset values may differ from the net asset value and returns for shareholder transactions. |
See accompanying notes
43
American Beacon Large Cap Value FundSM
Financial Highlights
(For a share outstanding throughout the period)
| C Class | ||||||||||||||||||||||||||||||||||||
| Year Ended October 31, | ||||||||||||||||||||||||||||||||||||
| 2021 | 2020A | 2019 | 2018 | 2017 | ||||||||||||||||||||||||||||||||
|
| |||||||||||||||||||||||||||||||||||
Net asset value, beginning of period | $ | 20.74 | $ | 25.43 | $ | 25.71 | $ | 28.27 | $ | 23.57 | ||||||||||||||||||||||||||
|
|
|
|
|
|
|
|
|
| |||||||||||||||||||||||||||
Income (loss) from investment operations: | ||||||||||||||||||||||||||||||||||||
Net investment income | 0.16 | 0.08 | 0.26 | 0.21 | 0.09 | |||||||||||||||||||||||||||||||
Net gains (losses) on investments (both realized and unrealized) | 9.49 | (2.32 | ) | 1.57 | 0.05 | 5.11 | ||||||||||||||||||||||||||||||
|
|
|
|
|
|
|
|
|
| |||||||||||||||||||||||||||
Total income (loss) from investment operations | 9.65 | (2.24 | ) | 1.83 | 0.26 | 5.20 | ||||||||||||||||||||||||||||||
|
|
|
|
|
|
|
|
|
| |||||||||||||||||||||||||||
Less distributions: | ||||||||||||||||||||||||||||||||||||
Dividends from net investment income | (0.21 | ) | (0.35 | ) | (0.25 | ) | (0.24 | ) | (0.28 | ) | ||||||||||||||||||||||||||
Distributions from net realized gains | (3.11 | ) | (2.10 | ) | (1.86 | ) | (2.58 | ) | (0.22 | ) | ||||||||||||||||||||||||||
|
|
|
|
|
|
|
|
|
| |||||||||||||||||||||||||||
Total distributions | (3.32 | ) | (2.45 | ) | (2.11 | ) | (2.82 | ) | (0.50 | ) | ||||||||||||||||||||||||||
|
|
|
|
|
|
|
|
|
| |||||||||||||||||||||||||||
Net asset value, end of period | $ | 27.07 | $ | 20.74 | $ | 25.43 | $ | 25.71 | $ | 28.27 | ||||||||||||||||||||||||||
|
|
|
|
|
|
|
|
|
| |||||||||||||||||||||||||||
Total returnB | 51.05 | % | (10.26 | )% | 8.94 | % | 0.57 | % | 22.27 | % | ||||||||||||||||||||||||||
|
|
|
|
|
|
|
|
|
| |||||||||||||||||||||||||||
Ratios and supplemental data: |
| |||||||||||||||||||||||||||||||||||
Net assets, end of period | $ | 6,898,120 | $ | 4,687,004 | $ | 6,811,169 | $ | 6,851,003 | $ | 8,351,349 | ||||||||||||||||||||||||||
Ratios to average net assets: | ||||||||||||||||||||||||||||||||||||
Expenses, before reimbursements and/or recoupments | 1.68 | % | 1.68 | % | 1.70 | % | 1.64 | % | 1.72 | % | ||||||||||||||||||||||||||
Expenses, net of reimbursements and/or recoupments | 1.68 | % | 1.68 | % | 1.70 | %C | 1.54 | % | 1.72 | % | ||||||||||||||||||||||||||
Net investment income, before expense reimbursements and/or recoupments | 0.22 | % | 0.84 | % | 0.99 | % | 0.79 | % | 0.66 | % | ||||||||||||||||||||||||||
Net investment income, net of reimbursements and/or recoupments | 0.22 | % | 0.84 | % | 0.99 | % | 0.90 | % | 0.66 | % | ||||||||||||||||||||||||||
Portfolio turnover rate | 23 | % | 67 | % | 23 | % | 23 | % | 25 | % | ||||||||||||||||||||||||||
| A | On January 17, 2020, Brandywine Global Investment Management, LLC was terminated and ceased managing assets of the Fund. |
| B | Based on net asset value, which does not reflect the sales charge, redemption fee, or contingent deferred sales charge, if applicable. May include adjustments in accordance with U.S. GAAP and as such, the net asset value for reporting purposes and the returns based upon those net asset values may differ from the net asset value and returns for shareholder transactions. |
| C | This ratio does not include a voluntary reimbursement of service fees as included in the prior year. |
See accompanying notes
44
American Beacon Large Cap Value FundSM
Financial Highlights
(For a share outstanding throughout the period)
| R6 Class | ||||||||||||||||||||||||||||||||||||
| Year Ended October 31, | February 28, 2017A to October 31, 2017 | |||||||||||||||||||||||||||||||||||
| 2021 | 2020B | 2019 | 2018 | |||||||||||||||||||||||||||||||||
|
| |||||||||||||||||||||||||||||||||||
Net asset value, beginning of period | $ | 23.36 | $ | 28.31 | $ | 28.41 | $ | 30.98 | $ | 28.64 | ||||||||||||||||||||||||||
|
|
|
|
|
|
|
|
|
| |||||||||||||||||||||||||||
Income (loss) from investment operations: | ||||||||||||||||||||||||||||||||||||
Net investment income | 0.36 | 0.56 | 0.61 | 0.59 | 0.12 | |||||||||||||||||||||||||||||||
Net gains (losses) on investments (both realized and unrealized) | 10.88 | (2.78 | ) | 1.71 | (0.02 | ) | 2.22 | |||||||||||||||||||||||||||||
|
|
|
|
|
|
|
|
|
| |||||||||||||||||||||||||||
Total income (loss) from investment operations | 11.24 | (2.22 | ) | 2.32 | 0.57 | 2.34 | ||||||||||||||||||||||||||||||
|
|
|
|
|
|
|
|
|
| |||||||||||||||||||||||||||
Less distributions: | ||||||||||||||||||||||||||||||||||||
Dividends from net investment income | (0.50 | ) | (0.63 | ) | (0.56 | ) | (0.56 | ) | – | |||||||||||||||||||||||||||
Distributions from net realized gains | (3.11 | ) | (2.10 | ) | (1.86 | ) | (2.58 | ) | – | |||||||||||||||||||||||||||
|
|
|
|
|
|
|
|
|
| |||||||||||||||||||||||||||
Total distributions | (3.61 | ) | (2.73 | ) | (2.42 | ) | (3.14 | ) | – | |||||||||||||||||||||||||||
|
|
|
|
|
|
|
|
|
| |||||||||||||||||||||||||||
Net asset value, end of period | $ | 30.99 | $ | 23.36 | $ | 28.31 | $ | 28.41 | $ | 30.98 | ||||||||||||||||||||||||||
|
|
|
|
|
|
|
|
|
| |||||||||||||||||||||||||||
Total returnC | 52.65 | % | (9.23 | )% | 10.15 | % | 1.54 | % | 8.17 | %D | ||||||||||||||||||||||||||
|
|
|
|
|
|
|
|
|
| |||||||||||||||||||||||||||
Ratios and supplemental data: |
| |||||||||||||||||||||||||||||||||||
Net assets, end of period | $ | 1,242,662,760 | $ | 1,008,088,807 | $ | 739,517,062 | $ | 571,236,567 | $ | 40,982,401 | ||||||||||||||||||||||||||
Ratios to average net assets: | ||||||||||||||||||||||||||||||||||||
Expenses, before reimbursements and/or recoupments | 0.60 | % | 0.62 | % | 0.60 | % | 0.59 | % | 0.60 | %E | ||||||||||||||||||||||||||
Expenses, net of reimbursements and/or recoupments | 0.60 | % | 0.59 | % | 0.58 | % | 0.58 | % | 0.58 | %E | ||||||||||||||||||||||||||
Net investment income, before expense reimbursements and/or recoupments | 1.31 | % | 1.90 | % | 2.07 | % | 1.75 | % | 1.38 | %E | ||||||||||||||||||||||||||
Net investment income, net of reimbursements and/or recoupments | 1.31 | % | 1.93 | % | 2.09 | % | 1.76 | % | 1.40 | %E | ||||||||||||||||||||||||||
Portfolio turnover rate | 23 | % | 67 | % | 23 | % | 23 | % | 25 | %F | ||||||||||||||||||||||||||
| A | Commencement of operations. |
| B | On January 17, 2020, Brandywine Global Investment Management, LLC was terminated and ceased managing assets of the Fund. |
| C | Based on net asset value, which does not reflect the sales charge, redemption fee, or contingent deferred sales charge, if applicable. May include adjustments in accordance with U.S. GAAP and as such, the net asset value for reporting purposes and the returns based upon those net asset values may differ from the net asset value and returns for shareholder transactions. |
| D | Not annualized. |
| E | Annualized. |
| F | Portfolio turnover rate is for the period from February 28, 2017 through October 31, 2017 and is not annualized. |
See accompanying notes
45
American Beacon FundsSM
October 31, 2021 (Unaudited)
Certain tax information regarding the Funds are required to be provided to shareholders based upon the Funds’ income and distributions for the taxable year ended October 31, 2021. The information and distributions reported herein may differ from information and distributions taxable to the shareholders for the calendar year ended December 31, 2021.
The Fund designated the following items with regard to distributions paid during the fiscal year ended October 31, 2021. All designations are based on financial information available as of this annual report and, accordingly, are subject to change. For each item, it is the intention of the Funds to designate the maximum amount permitted under the Internal Revenue Code of 1986, as amended, and the regulations there under.
Corporate Dividends-Received Deduction:
Large Cap Value | 100.00 | % |
Qualified Dividend Income:
Large Cap Value | 100.00 | % |
Long-Term Capital Gain Distributions:
Large Cap Value | $554,394,585 |
Short-Term Capital Gain Distributions:
Large Cap Value | $ | 0 |
Shareholders will receive notification in January 2022 of the applicable tax information necessary to prepare their 2021 income tax returns.
46
Disclosure Regarding Approval of the Management and Investment Advisory Agreements (Unaudited)
Renewal and Approval of Management Agreement and Investment Advisory Agreements
At meetings held on May 17, 2021 and June 8-9, 2021 (collectively, the “Meetings”) via videoconference, the Board of Trustees (“Board” or “Trustees”) considered and then, at its June 9, 2021 meeting, approved the renewal of: (1) the Management Agreement between American Beacon Advisors, Inc. (“Manager”) and the American Beacon Funds (“Trust”), on behalf of the American Beacon Large Cap Value Fund (“Fund”); and (2) the Investment Advisory Agreements among the Manager, the Trust, on behalf of the Fund, and each of Barrow, Hanley, Mewhinney & Strauss, LLC (“Barrow”), Hotchkis and Wiley Capital Management, LLC (“Hotchkis”) and Massachusetts Financial Services Company (“MFS”) (each, a “subadvisor” and collectively, the “subadvisors”).
The Management Agreement and the Investment Advisory Agreements are referred to herein individually as an “Agreement” and collectively as the “Agreements.” In preparation for its consideration of the renewal of the Agreements, the Board undertook steps to gather and consider information furnished by the Manager, the subadvisors, Broadridge, Inc. (“Broadridge”) and Morningstar, Inc. (“Morningstar”). The Board, with the assistance of independent legal counsel, requested and received certain relevant information from the Manager and each subadvisor.
In advance of the Meetings, the Board’s Investment Committee and/or the Manager coordinated the production of information from Broadridge and Morningstar regarding the performance, fees and expenses of the Fund as well as information from the Manager and the subadvisors. At the Meetings, the Board considered the information provided in connection with the renewal process, as well as information furnished to the Board throughout the year at regular meetings of the Board and its committees. In connection with the Board’s consideration of the Agreements, the Trustees received and evaluated such information as they deemed necessary, including the impact of the COVID-19 pandemic on the operations of the Manager and the subadvisor. This information is described below in the section summarizing the factors the Board considered in connection with its renewal and approval of the Agreements, as well as the section describing additional Board considerations with respect to the Fund.
The Board noted that the Manager provides management and administrative services to the Fund pursuant to the Management Agreement. The Board considered that many mutual funds have separate contracts governing each type of service and observed that, with respect to such mutual funds, the actual management fee rates provided by Broadridge for peer group funds reflect the combined advisory and administrative fees, reduced by any fee waivers and/or reimbursements.
A firm may not have been able to, or opted not to, provide information in response to certain information requests, in which case the Board conducted its evaluation of the firm based on information that was provided. In such cases, the Board determined that the omission of any such information was not material to its considerations.
Provided below is an overview of certain factors the Board considered in connection with its decision to approve the renewal of the Agreements. The Board did not identify any particular information that was most relevant to its consideration of whether to approve the renewal of each Agreement, and each Trustee may have afforded different weight to the various factors. Legal counsel to the independent Trustees provided the Board with a memorandum regarding its responsibilities pertaining to the renewal of investment advisory contracts, such as the Agreements, and related regulatory guidelines. Based on its evaluation, the Board unanimously concluded that the terms of each Agreement were reasonable and fair and that the approval of the renewal of each Agreement was in the best interests of the Fund and its shareholders.
Considerations With Respect to the Renewal of the Management Agreement and the Investment Advisory Agreements
In determining whether to approve the renewal of the Agreements, the Board considered the Fund’s investment management and subadvisory relationships separately. In each instance, the Board considered, among
47
Disclosure Regarding Approval of the Management and Investment Advisory Agreements (Unaudited)
other things, the following factors: (1) the nature, extent and quality of the services provided; (2) the investment performance of the Fund and the subadvisors for the Fund; (3) the costs incurred by the Manager in rendering services to the Fund and its resulting profits or losses; (4) comparisons of services and fee rates with contracts entered into by the Manager or the subadvisors or their affiliates with other clients (such as pension funds and other institutional clients); (5) the extent to which economies of scale, if any, have been taken into account in setting each fee rate schedule; (6) whether fee rate levels reflect economies of scale, if any, for the benefit of Fund investors; and (7) any other benefits derived or anticipated to be derived by the Manager or the subadvisors from their relationships with the Fund.
Nature, Extent and Quality of Services. With respect to the renewal of the Management Agreement, the Board considered, among other factors: the Fund’s long-term performance; the length of service of key investment personnel at the Manager; the cost structure of the Fund; the Manager’s culture of compliance and support that reduce risks to the Fund; the Manager’s quality of services; the Manager’s active role in monitoring and, as appropriate, recommending additional or replacement subadvisors; and the Manager’s efforts to retain key employees and maintain staffing levels.
With respect to the renewal of each Investment Advisory Agreement, the Board considered, among other factors: the level of staffing and the size of each subadvisor; the adequacy of the resources committed to the Fund by each subadvisor; the financial stability of each subadvisor; and representations made by each subadvisor regarding its compliance program. Based on the foregoing information, the Board concluded that the nature, extent and quality of the management and advisory services provided by the Manager and each subadvisor were appropriate for the Fund.
Investment Performance. The Board evaluated the comparative information provided by Broadridge and the Manager regarding the performance of the Fund, relative to its Broadridge Performance Universe, Morningstar Category, and benchmark index, as well as the Fund’s Morningstar rating. The Board considered the information provided by Broadridge regarding its independent methodology for selecting the Fund’s Broadridge Performance Universe. In addition, the Board considered the performance reports and discussions with management at Board and Committee meetings throughout the year. The Board also evaluated the comparative information provided by each subadvisor regarding the performance of its portion of the Fund relative to the performance of comparable investment accounts or a composite of comparable investment accounts managed by the subadvisor and the Fund’s benchmark index. In addition, the Board considered the Manager’s recommendation to continue to retain each subadvisor. A discussion regarding the Board’s considerations with respect to the Fund’s performance appears below under “Additional Considerations and Conclusions with Respect to the Fund.”
Costs of the Services Provided to the Fund and the Profits Realized by the Manager from its Relationship with the Fund. In analyzing the costs of services and profitability of the Manager, the Board considered the revenues earned and the expenses incurred by the Manager, before and after the payment of distribution-related expenses by the Manager. The profits or losses were noted at both an aggregate level for all funds within the group of mutual funds sponsored by the Manager (the “Fund Complex”) and at an individual Fund level, with the Manager earning a profit before and after the payment of distribution-related expenses by the Manager for the Fund. The Board also considered comparative information provided by the Manager regarding the Manager’s overall profitability with respect to the Fund Complex relative to the overall profitability of other firms in the mutual fund industry, as disclosed in publicly available sources. Although the Board noted that, in certain cases, the fee rates paid by other clients of the Manager are lower than the fee rates paid by the Fund, the Manager represented that, among other matters, the difference is attributable to the fact that the Manager does not perform administrative services for non-investment company clients and reflects the greater level of responsibility and regulatory requirements associated with managing the Fund. The Board also noted that, for the R6 Class shares of the Fund, the Manager is waiving fees and/or reimbursing expenses.
The Board further considered that, with respect to the Fund, the Management Agreement provides for the Manager to receive a management fee comprised of an annualized fee that is retained by the Manager. In addition,
48
Disclosure Regarding Approval of the Management and Investment Advisory Agreements (Unaudited)
the Board considered that the Manager receives fees for administering and overseeing the securities lending program on behalf of the Fund. The Board also noted that certain share classes of the Fund maintain higher expense ratios in order to compensate third-party financial intermediaries.
In analyzing the fee rates charged by each subadvisor in connection with its investment advisory services to the Fund, the Board considered representations made by each subadvisor that the Fund’s subadvisory fee rate schedule generally was favorable compared to other comparable client accounts. The Board did not request profitability data from the subadvisors, because the Board did not view this data as imperative to its deliberations given the arm’s-length nature of the relationship between the Manager and the subadvisors with respect to the negotiation of subadvisory fee rates. In addition, the Board noted that subadvisors may not account for their profits on an account-by-account basis and that different firms likely employ different methodologies in connection with these calculations.
Based on the foregoing information, the Board concluded that the profitability levels of the Manager were reasonable in light of the services performed by the Manager. A discussion regarding the Board’s considerations with respect to the Fund’s fee rates is set forth below under “Additional Considerations and Conclusions with Respect to the Fund.”
Economies of Scale. In considering the reasonableness of the management and investment advisory fees rates, the Board considered whether economies of scale will be realized as the Fund grows and whether fee rate levels reflect these economies of scale for the benefit of Fund shareholders. In this regard, the Board considered that, with respect to each subadvisor, the Manager has negotiated breakpoints for the subadvisory fee rate schedule.
In addition, the Board noted the Manager’s representation that the Management Agreement contains fee schedule breakpoints at higher asset levels with respect to the Fund. In this regard, the Board considered that the Fund’s current assets did not exceed the threshold necessary to reach the first management fee breakpoint. Based on the foregoing information, the Board concluded that the Manager and subadvisor fee rate schedules for the Fund provide for a reasonable sharing of benefits from any economies of scale with the Fund.
Benefits Derived from the Relationship with the Fund. The Board considered the “fall-out” or ancillary benefits that accrue to the Manager and/or the subadvisors as a result of the advisory relationships with the Fund, including greater exposure in the marketplace with respect to the Manager’s or the subadvisors’ investment process and expanding the level of assets under management by the Manager and the subadvisors. The Board also considered that the Manager may invest the Fund’s cash balances and cash collateral provided by the borrowers of the Fund’s securities in the American Beacon U.S. Government Money Market Select Fund, which the Manager manages directly, and for which the Manager receives a fee. In addition, the Board noted that each subadvisor benefits from soft dollar arrangements for proprietary and/or third-party research. Based on the foregoing information, the Board concluded that the potential benefits accruing to the Manager and the subadvisors by virtue of their relationships with the Fund appear to be fair and reasonable.
Additional Considerations and Conclusions with Respect to the Fund
The performance comparisons below were made for the Fund’s R5 Class shares relative to the Fund’s Broadridge Performance Universe and Morningstar Category. With respect to the Broadridge Performance Universe, the 1st Quintile represents the top 20 percent of the universe based on performance and the 5th Quintile represents the bottom 20 percent of the universe based on performance. References to the Fund’s Broadridge Performance Universe are to the respective universe of mutual funds with comparable investment classifications and objectives as determined by Broadridge. The performance of individual firms was calculated by the Manager based on information provided by the Funds’ custodian.
49
Disclosure Regarding Approval of the Management and Investment Advisory Agreements (Unaudited)
In reviewing the performance, the Board viewed longer-term performance over a full market cycle, typically five years or longer, as the most important consideration because relative performance over shorter periods may be significantly impacted by market or economic events and not necessarily reflective of subadvisor skill.
The expense comparisons below were made for the Fund’s R5 Class shares relative to the Fund’s Broadridge Expense Universe and Broadridge Expense Group, and Y Class shares relative to the Fund’s Morningstar Fee Level universe. The 1st Quintile represents the lowest 20 percent of the universe or group based on lowest total expense, and the 5th Quintile represents the highest 20 percent of the universe or group based on highest total expense. References to the Fund’s Expense Group and Expense Universe are to the respective group or universe of comparable mutual funds as determined by Broadridge. A Broadridge Expense Group consists of the Fund and a representative sample of funds with similar operating structures and asset sizes, as selected by Broadridge. A Broadridge Expense Universe includes all funds with comparable investment classifications/objectives and similar operating structures to that of the share class under review for the Fund, including funds in the Broadridge Expense Group. The Broadridge expense comparisons are based on the most recent audited financial information publicly available for a Fund as of December 31, 2020. References to the Fund’s Morningstar Fee Level ranking are to the institutional share class of comparable mutual funds as determined by Morningstar.
The Board considered the Fund’s Morningstar fee level category with the 1st Quintile representing the lowest 20 percent of the category constituents and the 5th Quintile representing the highest 20 percent of the category in terms of total expense.
In reviewing expenses, the Board considered the positive impact of the fee waiver and the Manager’s agreement to continue the fee waiver. The Board also considered that, in connection with the change in the name of the Fund’s Institutional Class shares, the share class used for the Fund’s Morningstar Fee Level comparisons had changed from the R5 Class shares to the Y Class shares, which may have resulted in a less favorable Morningstar Fee Level Ranking for the Fund than in prior years.
In considering the renewal of the Management Agreement for the Fund, the Board considered the following additional factors:
Broadridge Total Expense Analysis Excluding 12b-1 Fees and Morningstar Fee Level Ranking
Compared to Broadridge Expense Group | 2nd Quintile | |
Compared to Broadridge Expense Universe | 2nd Quintile | |
Morningstar Fee Level Ranking | 3rd Quintile |
Broadridge and Morningstar Performance Analysis (five-year period ended December 31, 2020)
Compared to Broadridge Performance Universe | 3rd Quintile | |
Compared to Morningstar Category | 2nd Quintile |
In considering the renewal of the Investment Advisory Agreements with Barrow, Hotchkis and MFS, the Board considered that the diversification of investment strategies facilitated by the Fund’s multi-manager structure permits the Fund to mitigate the risks associated with a single subadvisor. The Board also considered the following additional factors:
Subadvisor Performance (compared to Broadridge Performance Universe for period indicated ended December 31, 2020)
Barrow | 5 Years | 2 | nd Quintile | |||
Hotchkis | 5 Years | 2 | nd Quintile | |||
MFS | 5 Years | 1 | st Quintile |
50
Disclosure Regarding Approval of the Management and Investment Advisory Agreements (Unaudited)
The Board also considered: (1) information provided by each subadvisor regarding fee rates charged for managing assets in the same or a similar strategy as the subadvisor manages its allocation of the Fund; (2) the recent termination of a prior subadvisor, and the reallocation of assets among the Fund’s remaining subadvisors; and (3) the Manager’s recommendation to continue to retain each subadvisor.
Based on these and other considerations, the Board: (1) concluded that the fees paid to the Manager and the subadvisors under the Management and Investment Advisory Agreements are fair and reasonable; and (2) determined that the Fund and its shareholders would benefit from the Manager’s and subadvisors’ continued management of the Fund.
51
Trustees and Officers of the American Beacon FundsSM (Unaudited)
The Trustees and officers of the American Beacon Funds (the “Trust”) are listed below, together with their principal occupations during the past five years. The address of each person listed below is 220 Las Colinas Boulevard East, Suite 1200, Irving, Texas 75039. Each Trustee oversees thirty funds in the fund complex that includes the Trust, the American Beacon Select Funds, and the American Beacon Institutional Funds Trust. The Trust’s Statement of Additional Information contains additional information about the Trustees and is available without charge by calling 1-800-658-5811.
Name, Age | Position, Term of Office and Length of Time Served with the Trust | Principal Occupation(s) During Past 5 Years and Current Directorships | ||
| INTERESTED TRUSTEES | Term | |||
| Lifetime of Trust until removal, resignation or retirement* | ||||
| Eugene J. Duffy (67)** | Trustee since 2008 | Managing Director, Global Investment Management Distribution, Mesirow Financial Administrative Corporation (2016-Present); Managing Director, Institutional Services, Intercontinental Real Estate Corporation (2014-2016); Trustee, American Beacon Select Funds (2008-Present); Trustee, American Beacon Institutional Funds Trust (2017-Present); Trustee, American Beacon Sound Point Enhanced Income Fund (2018–2021); Trustee, American Beacon Apollo Total Return Fund (2018–2021). | ||
| NON-INTERESTED TRUSTEES | Term | |||
| Lifetime of Trust until removal, resignation or retirement* | ||||
| Gilbert G. Alvarado (51) | Trustee since 2015 | President, SJVIIF, LLC, Impact Investment Fund (2018-Present); Director, Kura MD, Inc. (local telehealth organization) (2015-2017); Senior Vice President & CFO, Sierra Health Foundation (health conversion private foundation) (2006-Present); Senior Vice President & CFO, Sierra Health Foundation: Center for Health Program Management (California public benefit corporation) (2012-Present); Director, Innovative North State (2012-2015); Director, Sacramento Regional Technology Alliance (2011-2016); Director, Valley Healthcare Staffing (2017–2018); Trustee, American Beacon Select Funds (2015-Present); Trustee, American Beacon Institutional Funds Trust (2017-Present); Trustee, American Beacon Sound Point Enhanced Income Fund (2018–2021); Trustee, American Beacon Apollo Total Return Fund (2018–2021). | ||
| Joseph B. Armes (59) | Trustee since 2015 | Director, Switchback Energy Acquisition (2019-2021); Chairman & CEO, CSW Industrials f/k/a Capital Southwest Corporation (investment company) (2015-Present); Chairman of the Board of Capital Southwest Corporation, predecessor to CSW Industrials, Inc. (2014-2017) (investment company); President & CEO, JBA Investment Partners (family investment vehicle) (2010-Present); Director and Chair of Audit Committee, RSP Permian (oil and gas producer) (2013-2018); Trustee, American Beacon Select Funds (2015-Present); Trustee, American Beacon Institutional Funds Trust (2017-Present); Trustee, American Beacon Sound Point Enhanced Income Fund (2018–2021); Trustee, American Beacon Apollo Total Return Fund (2018–2021). | ||
| Gerard J. Arpey (63) | Trustee since 2012 | Partner, Emerald Creek Group (private equity firm) (2011-Present); Director, S.C. Johnson & Son, Inc. (privately held company) (2008-present); Director, The Home Depot, Inc. (2015-Present); Trustee, American Beacon Select Funds (2012-Present); Trustee, American Beacon Institutional Funds Trust (2017-Present); Trustee, American Beacon Sound Point Enhanced Income Fund (2018–2021); Trustee, American Beacon Apollo Total Return Fund (2018–2021). | ||
52
Trustees and Officers of the American Beacon FundsSM (Unaudited)
Name, Age | Position, Term of Office and Length of Time Served with the Trust | Principal Occupation(s) During Past 5 Years and Current Directorships | ||
| NON-INTERESTED TRUSTEES (CONT.) | Term | |||
| Lifetime of Trust until removal, resignation or retirement* | ||||
| Brenda A. Cline (60) | Trustee since 2004 Chair since 2019 Vice Chair 2018 | Chief Financial Officer, Treasurer and Secretary, Kimbell Art Foundation (1993-Present); Director, Tyler Technologies, Inc. (public sector software solutions company) (2014-Present); Director, Range Resources Corporation (oil and natural gas company) (2015-Present); Trustee, | ||
| Cushing Closed-End and Open-End Funds (2017-Present); Trustee, American Beacon Select Funds (2004-Present); Trustee, American Beacon Institutional Funds Trust (2017-Present); Trustee, American Beacon Sound Point Enhanced Income Fund (2018–2021); Trustee, American Beacon Apollo Total Return Fund (2018–2021). | ||||
| Claudia A. Holz (64) | Trustee since 2018 | Partner, KPMG LLP (1990–2017); Independent Director, Blue Owl Capital Inc. (2021-Present); Trustee, American Beacon Select Funds (2018-Present); Trustee, American Beacon Institutional Funds Trust (2018-Present); Trustee, American Beacon Sound Point Enhanced Income Fund (2018–2021); Trustee, American Beacon Apollo Total Return Fund (2018–2021). | ||
| Douglas A. Lindgren (59) | Trustee since 2018 | CEO North America, Carne Global Financial Services (2016-2017); Consultant, Carne Financial Services (2017-2019); Managing Director, IPS Investment Management and Global Head, Content Management, UBS Wealth Management (2010-2016); Trustee, American Beacon Select Funds (2018-Present); Trustee, American Beacon Institutional Funds Trust (2018-Present); Trustee, American Beacon Sound Point Enhanced Income Fund (2018–2021); Trustee, American Beacon Apollo Total Return Fund (2018–2021). | ||
| Barbara J. McKenna, CFA (58) | Trustee since 2012 | President/Managing Principal, Longfellow Investment Management Company (2005-Present); Trustee, American Beacon Select Funds (2012-Present); Trustee, American Beacon Institutional Funds Trust (2017-Present); Trustee, American Beacon Sound Point Enhanced Income Fund (2018–2021); Trustee, American Beacon Apollo Total Return Fund (2018–2021). | ||
53
Trustees and Officers of the American Beacon FundsSM (Unaudited)
Name, Age | Position, Term of Office and Length of Time Served with the Trust | Principal Occupation(s) During Past 5 Years and Current Directorships | ||
| OFFICERS | Term | |||
| One Year | ||||
| Gene L. Needles, Jr. (66) | President since 2009 | President (2009-2018), CEO and Director (2009–Present), and Chairman (2018-Present), American Beacon Advisors, Inc., President (2015-2018), Director and CEO (2015–Present), and Chairman (2018-Present), Resolute Investment Holdings, LLC; President (2015-2018), Director and CEO (2015-Present), and Chairman (2018-Present),Resolute Topco, Inc.; President (2015-2018); Director, and CEO (2015-Present), and Chairman (2018-Present), Resolute Acquisition, Inc.; President (2015-2018), Director and CEO (2015-Present), Chairman (2018-Present), Resolute Investment Managers, Inc.; Director, Chairman, President and CEO, Resolute Investment Distributors (2017-Present); Director, Chairman, President and CEO; Resolute Investment Services, Inc. (2017-Present); Manager, President and CEO, American Private Equity Management, LLC (2012-Present); Director, Chairman, President and CEO, Alpha Quant Advisors, LLC (2016-2020); Director, ARK Investment Management LLC (2016-2020); Director, Shapiro Capital Management LLC (2017-Present); Director, Chairman and CEO, Continuous Capital, LLC (2018-Present); Director, Green Harvest Asset Management (2019-Present); Director, National Investment Services of America, LLC (2019–Present); Director, RSW Investments Holdings LLC, (2019-Present); Manager, SSI Investment Management, LLC (2019-Present); President, American Beacon Cayman Managed Futures Strategy Fund, Ltd. (2014-Present); Director and President, American Beacon Cayman Transformational Innovation Company, LTD., (2017-2018); President, American Beacon Delaware Transformational Innovation Corporation (2017-2018); President American Beacon Cayman TargetRisk Company, Ltd. (2018-Present); Member, Investment Advisory Committee, Employees Retirement System of Texas (2017-Present); Trustee, American Beacon NextShares Trust (2015-2020); President, American Beacon Select Funds (2009-Present); President, American Beacon Institutional Funds Trust (2017-Present); President, American Beacon Sound Point Enhanced Income Fund (2018-2021); President, American Beacon Apollo Total Return Fund (2018-2021). | ||
| Rosemary K. Behan (62) | VP, Secretary and Chief Legal Officer since 2006 | Senior Vice President (2021-Present), Vice President(2006-2021), Secretary and General Counsel (2006-Present), American Beacon Advisors, Inc.; Secretary, Resolute Investment Holdings, LLC (2015-Present); Secretary, Resolute Topco, Inc. (2015-Present); Secretary, Resolute Acquisition, Inc. (2015–Present); Senior Vice President (2021-Present), Vice President(2015-2021), Secretary and General Counsel (2015-Present), Resolute Investment Managers, Inc.; Secretary, Resolute Investment Distributors, Inc. (2017-Present); Senior Vice President (2021-Present), Vice President(2017-2021), Secretary and General Counsel (2017-Present), Resolute Investment Services, Inc.; Secretary, American Private Equity Management, LLC (2008-Present); Secretary and General Counsel, Alpha Quant Advisors, LLC (2016-2020); Vice President and Secretary, Continuous Capital, LLC (2018-Present); Secretary, Green Harvest Asset Management (2019-2021); Secretary, American Beacon Delaware Transformational Innovation Corporation (2017-2018); Secretary, American Beacon Cayman Transformational Innovation Company, Ltd. (2017-2018); Secretary, American Beacon Cayman Managed Futures Strategy Fund, Ltd. (2014-Present); Secretary, American Beacon Cayman TargetRisk Company, Ltd (2018-Present); Chief Legal Officer, Vice President and Secretary, American Beacon Select Funds (2006-Present); Chief Legal Officer, Vice President and Secretary, American Beacon Institutional Funds Trust (2017-Present); Chief Legal Officer, Vice President and Secretary, American Beacon Sound Point Enhanced Income Fund (2018-2021); Chief Legal Officer, Vice President and Secretary American Beacon Apollo Total Return Fund (2018-2021). | ||
54
Trustees and Officers of the American Beacon FundsSM (Unaudited)
Name, Age | Position, Term of Office and Length of Time Served with the Trust | Principal Occupation(s) During Past 5 Years and Current Directorships | ||
| OFFICERS (CONT.) | Term | |||
| One Year | ||||
| Brian E. Brett (61) | VP since 2004 | Senior Vice President, Head of Distribution (2012-Present), American Beacon Advisors, Inc.; Senior Vice President, Resolute Investment Managers, Inc. (2017-Present); Senior Vice President, Resolute Investment Distributors, Inc. (2018-Present); Senior Vice President, Resolute Investment Services, Inc. (2018-Present); Vice President, American Beacon Select Funds (2004-Present); Vice President, American Beacon Institutional Funds Trust (2017-Present); Vice President American Beacon Sound Point Enhanced Income Fund (2018-2021); Vice President American Beacon Apollo Total Return Fund (2018-2021). | ||
| Paul B. Cavazos (52) | VP since 2016 | Chief Investment Officer and Senior Vice President, American Beacon Advisors, Inc. (2016-Present); Chief Investment Officer, DTE Energy (2007-2016); Vice President, American Private Equity Management, L.L.C. (2017–Present); Vice President, American Beacon Select Funds (2016-Present); Vice President, American Beacon Institutional Funds Trust (2017-Present); Vice President American Beacon Sound Point Enhanced Income Fund (2018-2021); Vice President American Beacon Apollo Total Return Fund (2018-2021). | ||
| Erica Duncan (51) | VP since 2011 | Vice President, American Beacon Advisors, Inc. (2011-Present); Vice President, Resolute Investment Managers (2018-Present); Vice President, Resolute Investment Services, Inc. (2018-Present); Vice President, American Beacon Select Funds (2011-Present); Vice President, American Beacon Institutional Funds Trust (2017-Present); Vice President American Beacon Sound Point Enhanced Income Fund (2018-2021); Vice President American Beacon Apollo Total Return Fund (2018-2021). | ||
| Melinda G. Heika (60) | VP since 2021 Principal Accounting Officer and Treasurer (2010-2021) | Senior Vice President (2021-Present), Treasurer and CFO (2010-Present), American Beacon Advisors, Inc.; Treasurer, Resolute Topco, Inc. (2015-Present); Treasurer, Resolute Investment Holdings, LLC. (2015-Present); Treasurer, Resolute Acquisition, Inc. (2015-Present); Senior Vice President (2021-Present), Treasurer and CFO, Resolute Investment Managers, Inc. (2017-Present); Treasurer, Resolute Investment Distributors, Inc. (2017); Senior Vice President (2021-Present); Treasurer and CFO, Resolute Investment Services, Inc. (2015-Present); Treasurer, American Private Equity Management, LLC (2012-Present); Treasurer and CFO, Alpha Quant Advisors, LLC (2016-2020); Treasurer and CFO, Continuous Capital, LLC (2018-Present); Treasurer, American Beacon Cayman Transformational Innovation, Ltd. (2017-2018); Treasurer, American Beacon Delaware Transformational Innovation Corporation (2017-2018); Director and Treasurer, American Beacon Cayman Managed Futures Strategy Fund, Ltd. (2014-Present); Treasurer, American Beacon Cayman TargetRisk Company, Ltd. (2018-Present); Vice President (2021-Present), Principal Accounting Officer (2017-2021) and Treasurer (2010-2021), American Beacon Select Funds; Vice President (2021–Present), Principal Accounting Officer and Treasurer (2017-2021), American Beacon Institutional Funds Trust; Vice President (2021), Principal Accounting Officer and Treasurer (2018-2021), American Beacon Sound Point Enhanced Income Fund; Vice President (2021), Principal Accounting Officer and Treasurer, American Beacon Apollo Total Return Fund (2018-2021). | ||
55
Trustees and Officers of the American Beacon FundsSM (Unaudited)
Name, Age | Position, Term of Office and Length of Time Served with the Trust | Principal Occupation(s) During Past 5 Years and Current Directorships | ||
| OFFICERS (CONT.) | Term | |||
| One Year | ||||
| Terri L. McKinney (57) | VP since 2010 | Senior Vice President (2021-Present), Vice President (2009-2021), American Beacon Advisors, Inc.; Senior Vice President (2021–Present); Vice President (2017-2021), Resolute Investment Managers, Inc.; Senior Vice President (2021-Present), Vice President (2018-Present), Resolute Investment Services, Inc; Vice President, Alpha Quant Advisors, LLC (2016- 2020); Vice President, Continuous Capital, LLC (2018-Present); Vice President, American Beacon Select Funds (2010-Present); Vice President, American Beacon Institutional Funds Trust (2017-Present); Vice President, American Beacon Sound Point Enhanced Income Fund (2018-2021); Vice President, American Beacon Apollo Total Return Fund (2018-2021). | ||
| Jeffrey K. Ringdahl (46) | VP since 2010 | Director (2015-Present), President (2018-Present), Chief Operating Officer (2010-Present), Senior Vice President (2013-2018), American Beacon Advisors, Inc.; Director (2015-Present), President (2018-Present), Senior Vice President (2015-2018), Resolute Investment Holdings, LLC; Director (2015-Present), President (2018-Present), Senior Vice President (2015-2018), Resolute Topco, Inc.; Director (2015-Present), President (2018-Present), Senior Vice President (2015-2018), Resolute Acquisition, Inc.; Director (2015-Present), President & COO (2018-Present), Senior Vice President (2015-2018), Resolute Investment Managers, Inc.; Director and Executive Vice President (2017-Present), Resolute Investment Distributors, Inc.; Director (2017-Present), President & COO (2018-Present), Executive Vice President (2017-2018), Resolute Investment Services, Inc.; Senior Vice President (2017-Present), Vice President (2012-2017), Manager (2015-Present), American Private Equity Management, LLC; Trustee, American Beacon NextShares Trust (2015-2020); Director, Executive Vice President & COO, Alpha Quant Advisors, LLC (2016-2020); Director, Shapiro Capital Management, LLC (2017-Present); Director, Executive Vice President & COO, Continuous Capital, LLC (2018-Present); Director, RSW Investments Holdings LLC, (2019-Present); Manager, SSI Investment Management, LLC (2019-Present); Director, National Investment Services of America, LLC (2019-Present); Director and Vice President, American Beacon Cayman Transformational Innovation Company, Ltd., (2017-Present); Vice President, American Beacon Delaware Transformational Innovation Corporation (2017-2018); Director and Vice President, American Beacon Cayman Managed Futures Strategy Fund, Ltd. (2014-Present); Vice President, American Beacon Cayman TargetRisk Company, Ltd (2018-Present); Vice President, American Beacon Select Funds (2010-2018); Vice President, American Beacon Institutional Funds Trust (2017-Present); Vice President, American Beacon Sound Point Enhanced Income Fund (2018-2021); Vice President, American Beacon Apollo Total Return Fund (2018-2021). | ||
| Samuel J. Silver (58) | VP since 2011 | Vice President (2011-Present), Chief Fixed Income Officer (2016-Present), American Beacon Advisors, Inc. (2011-Present); Vice President, American Beacon Select Funds (2011-Present); Vice President, American Beacon Institutional Funds Trust (2017-Present); Vice President, American Beacon Sound Point Enhanced Income Fund (2018-2021); Vice President, American Beacon Apollo Total Return Fund (2018-2021). | ||
56
Trustees and Officers of the American Beacon FundsSM (Unaudited)
Name, Age | Position, Term of Office and Length of Time Served with the Trust | Principal Occupation(s) During Past 5 Years and Current Directorships | ||
| OFFICERS (CONT.) | Term | |||
| One Year | ||||
| Christina E. Sears (50) | Chief Compliance Officer since 2004 and Asst. Secretary since 1999 | Vice President, American Beacon Advisors, Inc. (2019-Present); Chief Compliance Officer, American Beacon Advisors, Inc. (2004-Present); Vice President, Resolute Investment Managers, Inc. (2017-Present); Vice President, Resolute Investment Distributors (2017-Present); Vice President, Resolute Investment Services, Inc. (2019-Present); Chief Compliance Officer, American Private Equity Management, LLC (2012-Present); Chief Compliance Officer, Green Harvest Asset Management, LLC (2019-Present); Chief Compliance Officer, RSW Investments Holdings, LLC (2019-Present); Chief Compliance Officer (2016-2019) and Vice President, Alpha Quant Advisors, LLC (2016-2020); Vice President, Continuous Capital, LLC (2018-Present); Chief Compliance Officer (2004-Present) and Assistant Secretary (1999-Present), American Beacon Select Funds; Chief | ||
| Compliance Officer and Assistant Secretary, American Beacon Institutional Funds Trust (2017-Present); Chief Compliance Officer and Assistant Secretary, American Beacon Sound Point Enhanced Income Fund (2018-2021); Chief Compliance Officer and Assistant Secretary, American Beacon Apollo Total Return Fund (2018-2021). | ||||
| Sonia L. Bates (64) | Principal Accounting Officer and Treasurer since 2021 Assistant Treasurer (2011-2021) | Assistant Treasurer, American Beacon Advisors, Inc. (2011-2018); Assistant Treasurer, American Private Equity Management, LLC (2012-Present); Assistant Treasurer, American Beacon Cayman Transformational Innovation Company, Ltd. (2017-Present); Assistant Treasurer, American Beacon Cayman TargetRisk Company, Ltd. (2018-Present); Principal Accounting Officer and Treasurer (2021-Present), Assistant Treasurer (2011-2021), American Beacon Select Funds; Principal Accounting Officer and Treasurer (2021-Present), Assistant Treasurer (2017-2021), American Beacon Institutional Funds Trust; Principal Accounting Officer and Treasurer (2021), Assistant Treasurer (2018-2021), American Beacon Sound Point Enhanced Income Fund; Principal Accounting Officer and Treasurer (2021), Assistant Treasurer (2018-2021), American Beacon Apollo Total Return Fund. | ||
| Shelley L. Dyson (51) | Assistant Treasurer since 2021 | Assistant Treasurer, American Beacon Select Funds (2021-Present); Assistant Treasurer, American Beacon Institutional Funds Trust (2021-Present); Assistant Treasurer, American Beacon Sound Point Enhanced Income Fund (2021); Assistant Treasurer, American Beacon Apollo Total Return Fund (2021). | ||
| Shelley D. Abrahams (46) | Assistant Secretary since 2008 | Assistant Secretary, American Beacon Select Funds (2008-Present); Assistant Secretary, American Beacon Institutional Funds Trust (2017-Present); Assistant Secretary, American Beacon Sound Point Enhanced Income Fund (2018-2021); Assistant Secretary, American Beacon Apollo Total Return Fund (2018-2021). | ||
| Rebecca L. Harris (54) | Assistant Secretary since 2010 | Senior Vice President (2021-Present), Vice President (2011-Present), American Beacon Advisors, Inc.; Senior Vice President (2021-Present), Vice President (2017-Present), Resolute Investment Managers, Inc.; Senior Vice President (2021-Present), Vice President (2015-Present), Resolute Investment Services; Vice President, Alpha Quant Advisors, LLC (2016-2020); Vice President, Continuous Capital, LLC (2018-Present); Assistant Secretary, American Beacon Select Funds (2010-Present); Assistant Secretary, American Beacon Institutional Funds Trust (2017-Present); Assistant Secretary, American Beacon Sound Point Enhanced Income Fund (2018-2021); Assistant Secretary, American Beacon Apollo Total Return Fund (2018-2021). | ||
57
Trustees and Officers of the American Beacon FundsSM (Unaudited)
Name, Age | Position, Term of Office and Length of Time Served with the Trust | Principal Occupation(s) During Past 5 Years and Current Directorships | ||
| OFFICERS (CONT.) | Term | |||
| One Year | ||||
| Teresa A. Oxford (63) | Assistant Secretary since 2015 | Assistant Secretary, American Beacon Advisors, Inc. (2015-Present); Assistant Secretary, Resolute Investment Distributors (2018-2021); Assistant Secretary, Resolute Investment Managers, Inc. (2017-Present); Assistant Secretary, Resolute Investment Services (2018-Present); Assistant Secretary, Alpha Quant Advisors, LLC (2016-2020); Assistant Secretary, Continuous Capital, LLC (2020-Present); Assistant Secretary, American Beacon Select Funds (2015-Present); Assistant Secretary, American Beacon Institutional Funds Trust (2017-Present); Assistant Secretary, American Beacon Sound Point Enhanced Income Fund (2018-2021); Assistant Secretary, American Beacon Apollo Total Return Fund (2018-2021). | ||
| Michael D. Jiang (36) | Assistant Secretary since 2021 | Assistant Secretary (2021-Present), Resolute Investment Distributors, Inc.; Associate General Counsel (2021-Present), Resolute Investment Services, Inc.; Vice President (2018-2021), The Northern Trust Company; Second Vice President (2015-2018), The Northern Trust Company. Assistant | ||
| Secretary, American Beacon Select Funds (2021-Present); Assistant Secretary, American Beacon Institutional Funds Trust (2021-Present); Assistant Secretary, American Beacon Sound Point Enhanced Income Fund (2021); Assistant Secretary, American Beacon Apollo Total Return Fund (2021). | ||||
* As of 11/12/2014, the Board adopted a retirement plan that requires Trustees to retire no later than the last day of the calendar year in which they reach the age of 75.
** Mr. Duffy is being deemed to be an “interested person” of the Trust, as defined by the Investment Company Act of 1940, as amended, by virtue of his position with Mesirow Financial, Inc., a broker-dealer.
58
American Beacon FundsSM
October 31, 2021 (Unaudited)
The American Beacon Funds recognize and respect the privacy of our shareholders. We are providing this notice to you so you will understand how shareholder information may be collected and used.
We may collect nonpublic personal information about you from one or more of the following sources:
| • | information we receive from you on applications or other forms; |
| • | information about your transactions with us or our service providers; and |
| • | information we receive from third parties. |
We do not disclose any nonpublic personal information about our customers or former customers to anyone, except as permitted by law.
We restrict access to your nonpublic personal information to those employees or service providers who need to know that information to provide products or services to you. To ensure the confidentiality of your nonpublic personal information, we maintain safeguards that comply with federal standards.
59
This page intentionally left blank.
60

Shareholder reports are available online at www.americanbeaconfunds.com/reports. Please be advised that reports are no longer sent by mail. Instead, the reports are made available online, and you will be notified by mail each time a report is posted online. You will be provided with a website link to access the report. You may elect to receive all future reports in paper free of charge. You can request to continue receiving paper copies by calling 1-866-345-5954, or you may directly inform your financial intermediary. Detailed instructions are also included in your report notifications.
If you invest in the Fund through a financial institution, you may be able to receive the Fund’s regulatory mailings, such as the Prospectus, Annual Report and Semi-Annual Report, by e-mail. If you are interested in this option, please go to www.icsdelivery.com and search for your financial institution’s name or contact your financial institution directly.
To obtain more information about the Fund:
 |  | |
| By E-mail: | On the Internet: | |
| american_beacon.funds@ambeacon.com | Visit our website at www.americanbeaconfunds.com | |
By Telephone: Call (800) 658-5811 |
By Mail: American Beacon Funds P.O. Box 219643 Kansas City, MO 64121-9643 | |
| Availability of Quarterly Portfolio Schedules | Availability of Proxy Voting Policy and Records | |
| In addition to the Schedule of Investments provided in each semi-annual and annual report, the Fund files a complete schedule of its portfolio holdings with the Securities and Exchange Commission (“SEC”) on Form N-PORT as of the end of each fiscal quarter. The Fund’s Forms N-PORT are available on the SEC’s website at www.sec.gov. The Forms N-PORT may also be reviewed and copied at the SEC’s Public Reference Section, 100 F Street, NE, Washington, D.C. 20549-1520. Information regarding the operation of the SEC’s Public Reference Room may be obtained by calling (800)-SEC-0330. A complete schedule of the Fund’s portfolio holdings is also available at www.americanbeaconfunds.com approximately twenty days after the end of each month. | A description of the policies and procedures the Fund uses to determine how to vote proxies relating to portfolio securities is available in the Fund’s Statement of Additional Information, is available free of charge on the Fund’s website www.americanbeaconfunds.com and by calling 1-800-967-9009 or by accessing the SEC’s website at www.sec.gov. The Fund’s proxy voting record for the most recent year ended June 30 is filed annually with the SEC on Form N-PX. The Fund’s Forms N-PX are available on the SEC’s website at www.sec.gov. The Fund’s proxy voting record may also be obtained by calling 1-800-967-9009. | |


Fund Service Providers:
CUSTODIAN State Street Bank and Trust Company Boston, Massachusetts | TRANSFER AGENT DST Asset Manager Solutions, Inc. Quincy, Massachusetts | INDEPENDENT REGISTERED PUBLIC ACCOUNTING FIRM Ernst &Young LLP Dallas, Texas | DISTRIBUTOR Resolute Investment Distributors, Inc. Irving, Texas |
This report is prepared for shareholders of the American Beacon Funds and may be distributed to others only if preceded or accompanied by a current Prospectus or Summary Prospectus.
American Beacon Funds and American Beacon Large Cap Value Fund are service marks of American Beacon Advisors, Inc.
AR 10/21

About American Beacon Advisors
Since 1986, American Beacon Advisors, Inc. has offered a variety of products and investment advisory services to numerous institutional and retail clients, including a variety of mutual funds, corporate cash management, and separate account management.
Our clients include defined benefit plans, defined contribution plans, foundations, endowments, corporations, financial planners, and other institutional investors. With American Beacon Advisors, you can put the experience of a multi-billion dollar asset management firm to work for your company.
SMALL CAP VALUE FUND RISKS
Investing in small-capitalization stocks may involve greater volatility and lower liquidity than larger company stocks. Investing in value stocks may limit downside risk over time; however, the Fund may produce more modest gains than riskier stock funds as a trade-off for this potentially lower risk. Investing in foreign securities may involve heightened risk due to currency fluctuations and economic and political risks. The use of futures contracts for cash management may subject the Fund to losing more money than invested. The Fund participates in a securities lending program. Please see the prospectus for a complete discussion of the Fund’s risks. There can be no assurances that the investment objectives of this Fund will be met.
Any opinions herein, including forecasts, reflect our judgment as of the end of the reporting period and are subject to change. Each advisor’s strategies and the Fund’s portfolio composition will change depending on economic and market conditions. This report is not a complete analysis of market conditions and therefore, should not be relied upon as investment advice. Although economic and market information has been compiled from reliable sources, American Beacon Advisors, Inc. makes no representation as to the completeness or accuracy of the statements contained herein.
American Beacon Funds | October 31, 2021 |
| 1 | ||||
| 3 | ||||
| 6 | ||||
| 8 | ||||
| 9 | ||||
| 27 | ||||
| 30 | ||||
| 51 | ||||
| 58 | ||||
Disclosure Regarding Approval of the Management and Investment Advisory Agreements | 59 | |||
| 64 | ||||
| 71 | ||||
| Back Cover |
 | Dear Shareholders,
As Warren E. Buffett, the “Oracle of Omaha” and billionaire chairman and CEO of Berkshire Hathaway, once said, “Someone’s sitting in the shade today because someone planted a tree a long time ago.”
That is to say, before we can enjoy the fruits of our labor, we must first devote our attention to the careful planning and cultivation of our estates. To achieve a strong yield requires time, diligence and patience – and there are no guarantees the seeds we plant today will thrive or result in a plentiful harvest. This can be said not only about the actions we undertake in our gardening or landscaping, but also those we initiate in our investment portfolios – especially as we take into account the potential for harm caused by natural disasters and other catastrophes, such as the COVID-19 pandemic. |
Because none of us – not even the Oracle of Omaha – has a crystal ball, to help give your investment portfolio the greatest chance for success over the long term, we encourage you to work with financial professionals to develop your personal savings plan, conduct annual plan reviews, and make thoughtful, purposeful plan adjustments to help manage your evolving financial needs and goals. By investing in different investment styles and asset classes, you may be able to help mitigate financial risks across your portfolio. By allocating your portfolio according to your risk-tolerance level, you may be better positioned to withstand short-term crises. With continuous nurturing, you will be better positioned to achieve enduring financial success.
Since 1986, American Beacon has endeavored to provide investors with a disciplined approach to realizing long-term financial goals. As a manager of managers, we strive to provide investment products that may enable investors to participate during market upswings while potentially insulating against market downswings. The investment teams behind our mutual funds seek to produce consistent, long-term results rather than focus only on short-term movements in the markets. In managing our investment products, we emphasize identifying opportunities that offer the potential for long-term financial rewards.
Thank you for entrusting your financial success with American Beacon. For additional information about our investment products or to access your account information, please visit our website at www.americanbeaconfunds.com.
Best Regards,

Gene L. Needles, Jr.
President
American Beacon Funds
1
Domestic Equity Market Overview
October 31, 2021 (Unaudited)
U.S. equities posted strong returns for the 12-month period ended October 31, 2021. The broader market, as measured by the Russell 3000 Index, posted a 43.89% gain. Smaller companies led the way with the Russell 2000 Index rising 50.80%. Mid- and large-cap companies also participated in the rally, with 45.40% and 43.51% returns for the Russell Midcap and Russell 1000 Indexes, respectively. The rally was consistent for most of the period, reflecting an improving economy, accommodative monetary policy and fiscal stimulus.
The prospect of full-scale COVID-19 vaccinations prompted a major shift in investor preference to under-owned Value stocks in the fourth quarter of 2020. Value’s outperformance continued into 2021 as the vaccine rollout accelerated, while massive fiscal and monetary stimulus set the stage for a powerful rebound in consumer spending. In June 2021 investor preference moved in favor of Growth-style stocks as the Federal Reserve spoke about potential tapering, while the spread of the COVID-19 delta variant in both Asia and the U.S. raised concerns about the economic impact. Stocks then rebounded strongly in October 2021 as macro concerns abated; both the Value and Growth cohorts benefited, with Growth outpacing Value. For the full 12-month period, Value stocks outpaced Growth as measured by the Russell 3000 Value Index return of 44.97% and the Russell 3000 Growth Index return of 42.81%.
Inflation picked up steam during 2021, reflecting supply chain disruptions and pent-up demand due to the pandemic. In its latest comments, the Federal Reserve acknowledged higher-than-expected inflation but continued to point to overall deceleration in the rate with the expectation that core inflation (measured by the personal consumption expenditures deflator) could rise between 2% and 2.5% in 2022 and 2023 compared to a roughly 4% increase in 2021. Rising inflation has persisted longer than the Federal Reserve initially expected, but supply chain disruptions from the pandemic have contributed meaningfully to inflation in certain segments of the economy.
With regard to monetary policy, the Federal Reserve maintained the federal funds rate at 0% to 0.25% over the year and announced plans to begin tapering quantitative easing. The Federal Reserve will reduce asset purchases by $10 billion for U.S. Treasuries and $5 billion for agency mortgage-backed securities. The dot plots from Federal Open Market Committee members suggest rate increases could begin in late 2022.
2
American Beacon Small Cap Value FundSM
October 31, 2021 (Unaudited)
The Investor Class of the American Beacon Small Cap Value Fund (the “Fund”) returned 58.74% for the twelve months ended October 31, 2021, underperforming the Russell 2000® Value Index (the “Index”) return of 64.30% for the same period.
Comparison of Changes in Value of a $10,000 Investment for the period 10/31/2011 through 10/31/2021
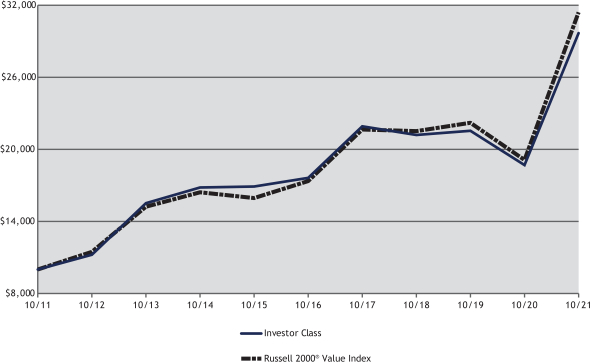
| Total Returns for the Period ended October 31, 2021 |
| |||||||||||||||||||||||||||||||
Ticker | 1 Year | 3 Years | 5 Years | 10 Years | Value of $10,000 10/31/2021 | |||||||||||||||||||||||||||
R5 Class (1,6) | AVFIX | 59.26 | % | 12.22 | % | 11.36 | % | 11.86 | % | $ | 30,683 | |||||||||||||||||||||
Y Class (1,6) | ABSYX | 59.15 | % | 12.14 | % | 11.26 | % | 11.77 | % | $ | 30,421 | |||||||||||||||||||||
Investor Class (1,6) | AVPAX | 58.74 | % | 11.85 | % | 10.99 | % | 11.48 | % | $ | 29,658 | |||||||||||||||||||||
Advisor Class (1,6) | AASSX | 58.56 | % | 11.69 | % | 10.83 | % | 11.32 | % | $ | 29,223 | |||||||||||||||||||||
A Class without sales charge (1,2,6) | ABSAX | 58.57 | % | 11.74 | % | 10.89 | % | 11.37 | % | $ | 29,355 | |||||||||||||||||||||
A Class with sales Charge (1,2,6) | ABSAX | 49.42 | % | 9.56 | % | 9.58 | % | 10.71 | % | $ | 27,667 | |||||||||||||||||||||
C Class without sales charge (1,3,6) | ASVCX | 57.47 | % | 10.95 | % | 10.13 | % | 10.57 | % | $ | 27,324 | |||||||||||||||||||||
C Class with sales charge (1,3,6) | ASVCX | 56.47 | % | 10.95 | % | 10.13 | % | 10.57 | % | $ | 27,324 | |||||||||||||||||||||
R6 Class (1,4,6) | AASRX | 59.38 | % | 12.26 | % | 11.39 | % | 11.88 | % | $ | 30,723 | |||||||||||||||||||||
Russell 2000® Value Index (5) | 64.30 | % | 13.44 | % | 12.61 | % | 12.12 | % | $ | 31,401 | ||||||||||||||||||||||
| 1. | Performance shown is historical and is not indicative of future returns. Investment returns and principal value will vary, and shares may be worth more or less at redemption than at original purchase. Performance shown is calculated based on the published end of day net asset values as of date indicated, and current performance may be lower or higher than the performance data quoted. To obtain performance as of the most recent month end, please visit www.americanbeaconfunds.com or call 1-800-967-9009. Fund performance in the table above does not reflect the deduction of taxes a shareholder would pay on distributions or the redemption of shares. Generally accepted accounting principles require adjustments to be made to the net assets of the Fund at period end for financial reporting purposes only; and as such, the total return based on the unadjusted net asset value per share may differ from the total return reported in the financial highlights. Please note that the recent performance of the securities market has helped produce short-term returns that are not typical and may not continue in the future. |
| 2. | A portion of the fees charged to the A Class of the Fund was waived in, 2012, 2013 and 2014 and fully recovered in 2015. Performance prior to waiving fees was lower than the actual returns shown for 2012, 2013 and 2014. The maximum sales charge for A Class is 5.75%. |
3
American Beacon Small Cap Value FundSM
Performance Overview
October 31, 2021 (Unaudited)
| 3. | A portion of the fees charged to the C Class of the Fund was waived in 2012 and 2013, fully recovered in 2015, and waived in 2018. Performance prior to waiving fees was lower than the actual returns shown in 2012, 2013 and 2018. The maximum contingent deferred sales charge for C Class is 1.00% for shares redeemed within one year of the date of purchase. |
| 4. | Fund performance for the five-year and ten-year periods represents the returns achieved by the R5 Class from 10/31/11 through 2/28/17, the inception date of the R6 Class, and the returns of the R6 Class since its inception. Expenses of the R6 Class are lower than those of the R5 Class. As a result, total returns shown may be lower than they would have been had the R6 Class been in existence since 10/31/11. |
| 5. | The Russell 2000® Value Index is an unmanaged index of those stocks in the Russell 2000 Index with lower price-to-book ratios and lower forecasted growth values. The Russell 2000® Index is an unmanaged index comprised of approximately 2,000 smaller-capitalization stocks. Russell 2000 Value Index and Russell 2000 Index are registered trademarks of Frank Russell Company. American Beacon Funds is not promoted, sponsored or endorsed by, nor in any way affiliated with the London Stock Exchange Group plc and its group undertakings (collectively, the “LSE Group”). FTSE Russell is a trading name of certain of the LSE Group companies. LSE Group is not responsible for and has not reviewed the American Beacon Small Cap Value Fund nor any associated literature or publications and LSE Group makes no representation or warranty, express or implied, as to their accuracy, or completeness, or otherwise. All rights in the Russell 2000 Index and the Russell 2000 Value Index (the “Indexes”) vest in the relevant LSE Group company which owns the Indexes. Russell 2000® is a trademark of the relevant LSE Group company and is used by any other LSE Group company under license. The Indexes are calculated by or on behalf of FTSE International Limited or its affiliate, agent or partner. The LSE Group does not accept any liability whatsoever to any person arising out of (a) the use of, reliance on or any error in the Indexes or (b) investment in or operation of the Fund. The LSE Group makes no claim, prediction, warranty or representation either as to the results to be obtained from the Fund or the suitability of the Indexes for the purpose to which it is being put by the Manager. One cannot directly invest in an index. |
| 6. | The Total Annual Fund Operating Expense ratios set forth in the most recent Fund prospectus for the R5, Y, Investor, Advisor, A, C and R6 Class shares were 0.83%, 0.90%, 1.16%, 1.26%, 1.27%, 1.97%, and 0.80%, respectively. The expense ratios above may vary from the expense ratios presented in other sections of this report that are based on expenses incurred during the period covered by this report. |
The Fund underperformed the Index during the period due mainly to security selection, while sector allocation contributed positively to relative performance.
Most of the Fund’s underperformance was attributable to security selection in the Consumer Discretionary, Energy and Industrials sectors. In the Consumer Discretionary sector, an absence from index-position GameStop Corp. (up 1,848.9%), which was removed from the Index in the June reconstitution, and not holding Macy’s, Inc. for the whole period (up 329.3%) detracted from returns relative to the Index. Detractors in the Energy sector included an absence from index-position SM Energy Co. (up 2,033.7%). Within the Industrials sector, Allison Transmission Holdings, Inc. (down 7.8%) and an absence from index-position Avis Budget Group, Inc. (up 121.6%), added to the Index in the June reconstitution, detracted from relative returns during the period. Conversely, security selection in the Financials sector contributed positively to relative returns; contributors included Evercore Inc., Class A (up 101.2%) and Popular, Inc. (up 98.8%).
From a sector allocation selection perspective, underweight allocations to the Health Care sector and Utilities sector and an overweight allocation to the Energy sector contributed positively to relative performance. This performance was marginally offset by an overweight allocation to the Consumer Discretionary sector.
The sub-advisors continue to focus on uncovering investment opportunities through stock selection that should benefit the Fund’s performance over the longer term.
| Top Ten Holdings (% Net Assets) | ||||||||
| Diodes, Inc. | 1.4 | |||||||
| KBR, Inc. | 1.2 | |||||||
| Range Resources Corp. | 1.2 | |||||||
| MGIC Investment Corp. | 1.1 | |||||||
| Fluor Corp. | 0.9 | |||||||
| Adient PLC | 0.8 | |||||||
| Darling Ingredients, Inc. | 0.8 | |||||||
| Evercore, Inc., Class A | 0.8 | |||||||
| Greenbrier Cos., Inc. | 0.8 | |||||||
| Popular, Inc. | 0.8 | |||||||
| Total Fund Holdings | 719 | |||||||
4
American Beacon Small Cap Value FundSM
Performance Overview
October 31, 2021 (Unaudited)
| Sector Allocation (% Equities) | ||||||||
| Financials | 25.3 | |||||||
| Industrials | 22.9 | |||||||
| Consumer Discretionary | 11.8 | |||||||
| Information Technology | 11.6 | |||||||
| Energy | 8.0 | |||||||
| Real Estate | 4.8 | |||||||
| Materials | 4.2 | |||||||
| Health Care | 4.1 | |||||||
| Consumer Staples | 2.7 | |||||||
| Utilities | 2.4 | |||||||
| Communication Services | 2.2 |
5
American Beacon Small Cap Value FundSM
October 31, 2021 (Unaudited)
Fund Expense Example
As a shareholder of a Fund, you incur two types of costs: (1) transaction costs, including sales charges (loads) on purchase payments and redemption fees, if applicable, and (2) ongoing costs, including management fees, distribution (12b-1) fees, sub-transfer agent fees, and other Fund expenses. The Examples are intended to help you understand the ongoing cost (in dollars) of investing in the Fund and to compare these costs with the ongoing costs of investing in other mutual funds. The Examples are based on an investment of $1,000 invested at the beginning of the period in each Class and held for the entire period from May 1, 2021 through October 31, 2021.
Actual Expenses
The “Actual” lines of the tables provide information about actual account values and actual expenses. You may use the information on this page, together with the amount you invested, to estimate the expenses that you paid over the period. Simply divide your account value by $1,000 (for example, an $8,600 account value divided by $1,000 = $8.60), then multiply the result by the “Expenses Paid During Period” to estimate the expenses you paid on your account during this period. Shareholders of the Investor and R5 Classes that invest in the Fund through an IRA or Roth IRA may be subject to a custodial IRA fee of $15 that is typically deducted each December. If your account was subject to a custodial IRA fee during the period, your costs would have been $15 higher.
Hypothetical Example for Comparison Purposes
The “Hypothetical” lines of the tables provide information about hypothetical account values and hypothetical expenses based on the Fund’s actual expense ratio and an assumed 5% per year rate of return before expenses (not the Fund’s actual return). You may compare the ongoing costs of investing in the Fund with other funds by contrasting this 5% hypothetical example and the 5% hypothetical examples that appear in the shareholder reports of the other funds. The hypothetical account values and expenses may not be used to estimate the actual ending account balance or expenses you paid for the period. Shareholders of the Investor and R5 Classes that invest in the Funds through an IRA or Roth IRA may be subject to a custodial IRA fee of $15 that is typically deducted each December. If your account was subject to a custodial IRA fee during the period, your costs would have been $15 higher.
You should also be aware that the expenses shown in the table highlight only your ongoing costs and do not reflect any transaction costs charged by the Fund, such as sales charges (loads) or redemption fees, as applicable. Similarly, the expense examples for other funds do not reflect any transaction costs charged by those funds, such as sales charges (loads), redemption fees or exchange fees. Therefore, the “Hypothetical” lines of the tables are useful in comparing ongoing costs only and will not help you determine the relative total costs of owning different funds. If you were subject to any transaction costs during the period, your costs would have been higher.
6
American Beacon Small Cap Value FundSM
Expense Examples
October 31, 2021 (Unaudited)
| American Beacon Small Cap Value Fund |
| ||||||||||||||
| Beginning Account Value 5/1/2021 | Ending Account Value 10/31/2021 | Expenses Paid During Period 5/1/2021-10/31/2021* | |||||||||||||
| R5 Class | |||||||||||||||
| Actual | $1,000.00 | $1,015.30 | $4.17 | ||||||||||||
| Hypothetical** | $1,000.00 | $1,021.07 | $4.18 | ||||||||||||
| Y Class | |||||||||||||||
| Actual | $1,000.00 | $1,014.90 | $4.52 | ||||||||||||
| Hypothetical** | $1,000.00 | $1,020.72 | $4.53 | ||||||||||||
| Investor Class | |||||||||||||||
| Actual | $1,000.00 | $1,013.30 | $5.84 | ||||||||||||
| Hypothetical** | $1,000.00 | $1,019.41 | $5.85 | ||||||||||||
| Advisor Class | |||||||||||||||
| Actual | $1,000.00 | $1,012.80 | $6.60 | ||||||||||||
| Hypothetical** | $1,000.00 | $1,018.65 | $6.61 | ||||||||||||
| A Class | |||||||||||||||
| Actual | $1,000.00 | $1,012.90 | $6.29 | ||||||||||||
| Hypothetical** | $1,000.00 | $1,018.96 | $6.31 | ||||||||||||
| C Class | |||||||||||||||
| Actual | $1,000.00 | $1,009.20 | $9.88 | ||||||||||||
| Hypothetical** | $1,000.00 | $1,015.38 | $9.91 | ||||||||||||
| R6 Class | |||||||||||||||
| Actual | $1,000.00 | $1,015.60 | $4.01 | ||||||||||||
| Hypothetical** | $1,000.00 | $1,021.22 | $4.02 | ||||||||||||
| * | Expenses are equal to the Fund’s annualized expense ratios for the six-month period of 0.82%, 0.89%, 1.15%, 1.30%, 1.24%, 1.95%, and 0.79% for the R5, Y, Investor, Advisor, A, C, and R6 Classes, respectively, multiplied by the average account value over the period, multiplied by the number derived by dividing the number of days in the most recent fiscal half-year (184) by days in the year (365) to reflect the half-year period. |
| ** | 5% return before expenses. |
7
American Beacon Small Cap Value FundSM
Report of Independent Registered Public Accounting Firm
To the Shareholders and the Board of Trustees of American Beacon Small Cap Value Fund
Opinion on the Financial Statements
We have audited the accompanying statement of assets and liabilities of American Beacon Small Cap Value Fund (the “Fund”) (one of the funds constituting American Beacon Funds (the “Trust”)), including the schedule of investments, as of October 31, 2021, and the related statement of operations for the year then ended, the statements of changes in net assets for each of the two years in the period then ended, the financial highlights for each of the five years in the period then ended and the related notes (collectively referred to as the “financial statements”). In our opinion, the financial statements present fairly, in all material respects, the financial position of the Fund (one of the funds constituting American Beacon Funds) at October 31, 2021, the results of its operations for the year then ended, the changes in its net assets for each of the two years in the period then ended and its financial highlights for each of the five years in the period then ended, in conformity with U.S. generally accepted accounting principles.
Basis for Opinion
These financial statements are the responsibility of the Trust’s management. Our responsibility is to express an opinion on the Fund’s financial statements based on our audits. We are a public accounting firm registered with the Public Company Accounting Oversight Board (United States) (“PCAOB”) and are required to be independent with respect to the Trust in accordance with the U.S. federal securities laws and the applicable rules and regulations of the Securities and Exchange Commission and the PCAOB.
We conducted our audits in accordance with the standards of the PCAOB. Those standards require that we plan and perform the audit to obtain reasonable assurance about whether the financial statements are free of material misstatement, whether due to error or fraud. The Trust is not required to have, nor were we engaged to perform, an audit of the Trust’s internal control over financial reporting. As part of our audits we are required to obtain an understanding of internal control over financial reporting, but not for the purpose of expressing an opinion on the effectiveness of the Trust’s internal control over financial reporting. Accordingly, we express no such opinion.
Our audits included performing procedures to assess the risks of material misstatement of the financial statements, whether due to error or fraud, and performing procedures that respond to those risks. Such procedures included examining, on a test basis, evidence regarding the amounts and disclosures in the financial statements. Our procedures included confirmation of securities owned as of October 31, 2021, by correspondence with the custodian and brokers or by other appropriate auditing procedures where replies from brokers were not received. Our audits also included evaluating the accounting principles used and significant estimates made by management, as well as evaluating the overall presentation of the financial statements. We believe that our audits provide a reasonable basis for our opinion.

We have served as the auditor of one or more American Beacon investment companies since 1987.
Dallas, Texas
December 30, 2021
8
American Beacon Small Cap Value FundSM
October 31, 2021
| Shares | Fair Value | ||||||||||||||
| COMMON STOCKS - 97.34% | |||||||||||||||
| Communication Services - 2.13% | |||||||||||||||
| Diversified Consumer Services - 0.02% | |||||||||||||||
| EchoStar Corp., Class AA | 46,100 | $ | 1,081,506 | ||||||||||||
|
| ||||||||||||||
| Diversified Telecommunication Services - 0.00% | |||||||||||||||
| Liberty Latin America Ltd., Class AA | 1,865 | 22,417 | |||||||||||||
| Liberty Latin America Ltd., Class CA | 1,448 | 17,420 | |||||||||||||
|
| ||||||||||||||
| 39,837 | |||||||||||||||
|
| ||||||||||||||
| Entertainment - 0.33% | |||||||||||||||
| IMAX Corp.A | 533,314 | 10,052,969 | |||||||||||||
| Lions Gate Entertainment Corp., Class AA | 415,628 | 5,382,383 | |||||||||||||
| Lions Gate Entertainment Corp., Class BA | 371,364 | 4,203,840 | |||||||||||||
|
| ||||||||||||||
| 19,639,192 | |||||||||||||||
|
| ||||||||||||||
| Interactive Media & Services - 0.09% | |||||||||||||||
| Cars.com, Inc.A | 9,254 | 120,487 | |||||||||||||
| Genius Sports Ltd.A B | 282,549 | 5,238,459 | |||||||||||||
|
| ||||||||||||||
| 5,358,946 | |||||||||||||||
|
| ||||||||||||||
| Media - 1.63% | |||||||||||||||
| AMC Networks, Inc., Class AA | 92,768 | 3,691,239 | |||||||||||||
| Emerald Holding, Inc.A | 36,516 | 147,890 | |||||||||||||
| Entravision Communications Corp., Class A | 8,348 | 66,533 | |||||||||||||
| Gray Television, Inc. | 996,213 | 23,351,233 | |||||||||||||
| John Wiley & Sons, Inc., Class A | 84,977 | 4,603,204 | |||||||||||||
| Scholastic Corp. | 155,882 | 5,641,369 | |||||||||||||
| Stagwell, Inc.A B | 4,308,420 | 37,397,086 | |||||||||||||
| TEGNA, Inc. | 1,096,379 | 21,554,811 | |||||||||||||
|
| ||||||||||||||
| 96,453,365 | |||||||||||||||
|
| ||||||||||||||
| Wireless Telecommunication Services - 0.06% | |||||||||||||||
| Telephone & Data Systems, Inc. | 192,592 | 3,609,174 | |||||||||||||
|
| ||||||||||||||
Total Communication Services | 126,182,020 | ||||||||||||||
|
| ||||||||||||||
| Consumer Discretionary - 11.50% | |||||||||||||||
| Auto Components - 2.59% | |||||||||||||||
| Adient PLCA | 1,119,943 | 46,612,028 | |||||||||||||
| American Axle & Manufacturing Holdings, Inc.A | 2,834,450 | 25,736,806 | |||||||||||||
| Dana, Inc. | 851,307 | 18,890,502 | |||||||||||||
| Gentherm, Inc.A | 465,228 | 34,254,738 | |||||||||||||
| Goodyear Tire & Rubber Co.A | 720,525 | 13,776,438 | |||||||||||||
| LCI Industries | 911 | 127,212 | |||||||||||||
| Motorcar Parts of America, Inc.A | 10,655 | 201,593 | |||||||||||||
| Patrick Industries, Inc. | 26,400 | 2,056,824 | |||||||||||||
| Standard Motor Products, Inc. | 143,495 | 6,873,410 | |||||||||||||
| Visteon Corp.A | 45,340 | 5,131,581 | |||||||||||||
|
| ||||||||||||||
| 153,661,132 | |||||||||||||||
|
| ||||||||||||||
| Automobiles - 0.38% | |||||||||||||||
| Harley-Davidson, Inc. | 90,974 | 3,319,641 | |||||||||||||
| Winnebago Industries, Inc. | 285,313 | 19,312,837 | |||||||||||||
|
| ||||||||||||||
| 22,632,478 | |||||||||||||||
|
| ||||||||||||||
| Distributors - 0.08% | |||||||||||||||
| Funko, Inc., Class AA | 288,551 | 4,729,351 | |||||||||||||
|
| ||||||||||||||
See accompanying notes
9
American Beacon Small Cap Value FundSM
Schedule of Investments
October 31, 2021
| Shares | Fair Value | ||||||||||||||
| COMMON STOCKS - 97.34% (continued) | |||||||||||||||
| Consumer Discretionary - 11.50% (continued) | |||||||||||||||
| Diversified Consumer Services - 0.74% | |||||||||||||||
| Adtalem Global Education, Inc.A | 3,230 | $ | 119,284 | ||||||||||||
| Graham Holdings Co., Class B | 12,113 | 7,096,401 | |||||||||||||
| H&R Block, Inc. | 1,147,154 | 26,464,843 | |||||||||||||
| Houghton Mifflin Harcourt Co.A | 708,929 | 10,059,702 | |||||||||||||
| Perdoceo Education Corp.A | 7,587 | 80,574 | |||||||||||||
|
| ||||||||||||||
| 43,820,804 | |||||||||||||||
|
| ||||||||||||||
| Hotels, Restaurants & Leisure - 0.67% | |||||||||||||||
| Bally’s Corp.A | 131,417 | 6,020,213 | |||||||||||||
| Boyd Gaming Corp.A | 87,836 | 5,602,180 | |||||||||||||
| Brinker International, Inc.A | 3,105 | 130,286 | |||||||||||||
| Cheesecake Factory, Inc.A | 486 | 19,751 | |||||||||||||
| Del Taco Restaurants, Inc. | 6,803 | 56,737 | |||||||||||||
| Hilton Grand Vacations, Inc.A | 3,111 | 156,421 | |||||||||||||
| International Game Technology PLCA B | 546,889 | 16,127,757 | |||||||||||||
| Jack in the Box, Inc. | 117,781 | 11,654,430 | |||||||||||||
| Potbelly Corp.A | 6,900 | 41,538 | |||||||||||||
| Travel & Leisure Co. | 2,828 | 153,673 | |||||||||||||
|
| ||||||||||||||
| 39,962,986 | |||||||||||||||
|
| ||||||||||||||
| Household Durables - 2.78% | |||||||||||||||
| Beazer Homes USA, Inc.A | 1,177 | 21,315 | |||||||||||||
| Cavco Industries, Inc.A | 34,558 | 8,307,052 | |||||||||||||
| Century Communities, Inc. | 100,111 | 6,713,444 | |||||||||||||
| Ethan Allen Interiors, Inc. | 9,507 | 220,657 | |||||||||||||
| GoPro, Inc., Class AA | 509,521 | 4,386,976 | |||||||||||||
| Green Brick Partners, Inc.A | 567,772 | 14,790,461 | |||||||||||||
| Hamilton Beach Brands Holding Co., Class A | 750 | 11,250 | |||||||||||||
| Helen of Troy Ltd.A | 24,029 | 5,405,323 | |||||||||||||
| Hooker Furniture Corp. | 5,852 | 147,529 | |||||||||||||
| KB Home | 451,838 | 18,141,296 | |||||||||||||
| La-Z-Boy, Inc. | 223,339 | 7,423,788 | |||||||||||||
| LGI Homes, Inc.A | 76,506 | 11,422,346 | |||||||||||||
| M/I Homes, Inc.A | 245,728 | 14,070,385 | |||||||||||||
| MDC Holdings, Inc. | 212,223 | 10,394,682 | |||||||||||||
| Meritage Homes Corp.A | 127,415 | 13,851,285 | |||||||||||||
| Taylor Morrison Home Corp.A | 81,439 | 2,486,333 | |||||||||||||
| Tempur Sealy International, Inc. | 277,856 | 12,356,256 | |||||||||||||
| TRI Pointe Homes, Inc.A | 454,636 | 10,997,645 | |||||||||||||
| Tupperware Brands Corp.A | 4,100 | 91,184 | |||||||||||||
| Whirlpool Corp. | 113,772 | 23,986,551 | |||||||||||||
|
| ||||||||||||||
| 165,225,758 | |||||||||||||||
|
| ||||||||||||||
| Internet & Direct Marketing Retail - 0.08% | |||||||||||||||
| PetMed Express, Inc.B | 3,578 | 101,723 | |||||||||||||
| Points International Ltd.A | 264,135 | 4,566,894 | |||||||||||||
|
| ||||||||||||||
| 4,668,617 | |||||||||||||||
|
| ||||||||||||||
| Leisure Products - 0.47% | |||||||||||||||
| Johnson Outdoors, Inc., Class A | 1,368 | 145,254 | |||||||||||||
| Malibu Boats, Inc., Class AA | 188,138 | 13,284,424 | |||||||||||||
| Sturm Ruger & Co., Inc.B | 12,246 | 965,965 | |||||||||||||
| Vista Outdoor, Inc.A | 319,484 | 13,367,211 | |||||||||||||
|
| ||||||||||||||
| 27,762,854 | |||||||||||||||
|
| ||||||||||||||
See accompanying notes
10
American Beacon Small Cap Value FundSM
Schedule of Investments
October 31, 2021
| Shares | Fair Value | ||||||||||||||
| COMMON STOCKS - 97.34% (continued) | |||||||||||||||
| Consumer Discretionary - 11.50% (continued) | |||||||||||||||
| Multiline Retail - 0.20% | |||||||||||||||
| Big Lots, Inc. | 134,884 | $ | 5,968,617 | ||||||||||||
| Franchise Group, Inc. | 3,735 | 137,448 | |||||||||||||
| Nordstrom, Inc.A B | 195,695 | 5,622,317 | |||||||||||||
|
| ||||||||||||||
| 11,728,382 | |||||||||||||||
|
| ||||||||||||||
| Specialty Retail - 2.63% | |||||||||||||||
| Aaron’s Co., Inc. | 7,200 | 168,408 | |||||||||||||
| Abercrombie & Fitch Co., Class AA | 66,000 | 2,609,640 | |||||||||||||
| Academy Sports & Outdoors, Inc.A | 1,762 | 75,378 | |||||||||||||
| American Eagle Outfitters, Inc.B | 5,796 | 137,597 | |||||||||||||
| Asbury Automotive Group, Inc.A | 59,262 | 11,598,166 | |||||||||||||
| Bed Bath & Beyond, Inc.A B | 217,929 | 3,059,723 | |||||||||||||
| Big 5 Sporting Goods Corp. | 6,100 | 147,498 | |||||||||||||
| Buckle, Inc. | 86,498 | 3,600,047 | |||||||||||||
| Caleres, Inc. | 309,991 | 7,148,392 | |||||||||||||
| Camping World Holdings, Inc., Class A | 389,155 | 14,496,024 | |||||||||||||
| Cato Corp., Class A | 10,557 | 186,120 | |||||||||||||
| Foot Locker, Inc. | 118,150 | 5,632,211 | |||||||||||||
| Genesco, Inc.A | 3,431 | 207,884 | |||||||||||||
| Group 1 Automotive, Inc. | 140,064 | 25,183,507 | |||||||||||||
| Guess?, Inc. | 258,813 | 5,360,017 | |||||||||||||
| Hibbett, Inc. | 29,697 | 2,299,736 | |||||||||||||
| MarineMax, Inc.A | 28,449 | 1,473,374 | |||||||||||||
| ODP Corp.A | 776,590 | 33,626,347 | |||||||||||||
| OneWater Marine, Inc., Class A | 4,197 | 186,095 | |||||||||||||
| Penske Automotive Group, Inc. | 961 | 101,914 | |||||||||||||
| Rent-A-Center, Inc. | 134,718 | 7,175,081 | |||||||||||||
| Sally Beauty Holdings, Inc.A | 594,476 | 9,071,704 | |||||||||||||
| Signet Jewelers Ltd. | 29,781 | 2,655,870 | |||||||||||||
| Sonic Automotive, Inc., Class A | 247,366 | 12,227,301 | |||||||||||||
| Tilly’s, Inc., Class A | 5,555 | 77,103 | |||||||||||||
| Urban Outfitters, Inc.A | 246,923 | 7,884,251 | |||||||||||||
| Zumiez, Inc.A | 2,361 | 96,093 | |||||||||||||
|
| ||||||||||||||
| 156,485,481 | |||||||||||||||
|
| ||||||||||||||
| Textiles, Apparel & Luxury Goods - 0.88% | |||||||||||||||
| Capri Holdings Ltd.A | 216,622 | 11,532,955 | |||||||||||||
| G-III Apparel Group Ltd.A | 379,096 | 10,864,891 | |||||||||||||
| Kontoor Brands, Inc. | 258,537 | 13,702,461 | |||||||||||||
| Oxford Industries, Inc. | 54,635 | 5,065,757 | |||||||||||||
| Rocky Brands, Inc. | 1,278 | 69,715 | |||||||||||||
| Skechers USA, Inc., Class AA | 239,542 | 11,069,236 | |||||||||||||
| Vera Bradley, Inc.A | 15,042 | 147,562 | |||||||||||||
| Wolverine World Wide, Inc. | 661 | 21,926 | |||||||||||||
|
| ||||||||||||||
| 52,474,503 | |||||||||||||||
|
| ||||||||||||||
Total Consumer Discretionary | 683,152,346 | ||||||||||||||
|
| ||||||||||||||
| Consumer Staples - 2.58% | |||||||||||||||
| Food & Staples Retailing - 0.55% | |||||||||||||||
| Andersons, Inc. | 112,902 | 3,845,442 | |||||||||||||
| Chefs’ Warehouse, Inc.A | 248,048 | 8,649,434 | |||||||||||||
| Ingles Markets, Inc., Class A | 48,614 | 3,363,603 | |||||||||||||
| Natural Grocers by Vitamin Cottage, Inc. | 12,404 | 151,081 | |||||||||||||
| PriceSmart, Inc. | 232 | 16,692 | |||||||||||||
| SpartanNash Co. | 193,344 | 4,473,980 | |||||||||||||
See accompanying notes
11
American Beacon Small Cap Value FundSM
Schedule of Investments
October 31, 2021
| Shares | Fair Value | ||||||||||||||
| COMMON STOCKS - 97.34% (continued) | |||||||||||||||
| Consumer Staples - 2.58% (continued) | |||||||||||||||
| Food & Staples Retailing - 0.55% (continued) | |||||||||||||||
| Sprouts Farmers Market, Inc.A | 127,634 | $ | 2,825,817 | ||||||||||||
| United Natural Foods, Inc.A | 187,770 | 8,147,340 | |||||||||||||
| Village Super Market, Inc., Class A | 5,672 | 126,315 | |||||||||||||
| Weis Markets, Inc. | 16,593 | 934,352 | |||||||||||||
|
| ||||||||||||||
| 32,534,056 | |||||||||||||||
|
| ||||||||||||||
| Food Products - 1.46% | |||||||||||||||
| B&G Foods, Inc. | 5,191 | 152,823 | |||||||||||||
| Darling Ingredients, Inc.A | 585,359 | 49,474,543 | |||||||||||||
| Fresh Del Monte Produce, Inc. | 251,754 | 8,431,241 | |||||||||||||
| Hain Celestial Group, Inc.A B | 180,056 | 8,079,113 | |||||||||||||
| J&J Snack Foods Corp. | 37,625 | 5,551,569 | |||||||||||||
| Seneca Foods Corp., Class AA | 509 | 26,279 | |||||||||||||
| SunOpta, Inc.A | 1,969,754 | 15,285,291 | |||||||||||||
|
| ||||||||||||||
| 87,000,859 | |||||||||||||||
|
| ||||||||||||||
| Household Products - 0.35% | |||||||||||||||
| Central Garden & Pet Co.A | 4,248 | 219,112 | |||||||||||||
| Energizer Holdings, Inc. | 5,454 | 198,908 | |||||||||||||
| Spectrum Brands Holdings, Inc. | 216,003 | 20,250,281 | |||||||||||||
|
| ||||||||||||||
| 20,668,301 | |||||||||||||||
|
| ||||||||||||||
| Personal Products - 0.14% | |||||||||||||||
| Edgewell Personal Care Co. | 189,566 | 6,632,914 | |||||||||||||
| Inter Parfums, Inc. | 13,609 | 1,257,199 | |||||||||||||
| Nu Skin Enterprises, Inc., Class A | 3,812 | 153,052 | |||||||||||||
| USANA Health Sciences, Inc.A | 1,561 | 151,511 | |||||||||||||
|
| ||||||||||||||
| 8,194,676 | |||||||||||||||
|
| ||||||||||||||
| Tobacco - 0.08% | |||||||||||||||
| Universal Corp. | 76,321 | 3,587,087 | |||||||||||||
| Vector Group Ltd. | 94,784 | 1,256,836 | |||||||||||||
|
| ||||||||||||||
| 4,843,923 | |||||||||||||||
|
| ||||||||||||||
Total Consumer Staples | 153,241,815 | ||||||||||||||
|
| ||||||||||||||
| Energy - 7.80% | |||||||||||||||
| Energy Equipment & Services - 1.49% | |||||||||||||||
| Cactus, Inc., Class A | 277,766 | 12,082,821 | |||||||||||||
| ChampionX Corp.A | 6,814 | 178,731 | |||||||||||||
| Core Laboratories NV | 2,626 | 68,302 | |||||||||||||
| Dril-Quip, Inc.A | 5,987 | 141,054 | |||||||||||||
| Expro Group Holdings NVA | 1,267,613 | 21,739,563 | |||||||||||||
| Helix Energy Solutions Group, Inc.A | 2,087,969 | 7,892,523 | |||||||||||||
| Helmerich & Payne, Inc. | 325,717 | 10,110,256 | |||||||||||||
| Liberty Oilfield Services, Inc., Class AA | 8,063 | 104,174 | |||||||||||||
| National Energy Services Reunited Corp.A B | 11,800 | 138,060 | |||||||||||||
| Newpark Resources, Inc.A | 40,500 | 137,700 | |||||||||||||
| NexTier Oilfield Solutions, Inc.A | 599,258 | 2,672,691 | |||||||||||||
| NOV, Inc.A | 1,049,748 | 14,717,467 | |||||||||||||
| Oceaneering International, Inc.A | 1,541 | 20,958 | |||||||||||||
| Oil States International, Inc.A | 1,162,639 | 7,045,592 | |||||||||||||
| Patterson-UTI Energy, Inc. | 569,258 | 4,872,848 | |||||||||||||
| ProPetro Holding Corp.A | 14,548 | 139,515 | |||||||||||||
| RPC, Inc.A | 5,343 | 28,799 | |||||||||||||
| Select Energy Services, Inc., Class AA | 22,406 | 134,660 | |||||||||||||
See accompanying notes
12
American Beacon Small Cap Value FundSM
Schedule of Investments
October 31, 2021
| Shares | Fair Value | ||||||||||||||
| COMMON STOCKS - 97.34% (continued) | |||||||||||||||
| Energy - 7.80% (continued) | |||||||||||||||
| Energy Equipment & Services - 1.49% (continued) | |||||||||||||||
| Solaris Oilfield Infrastructure, Inc., Class A | 19,196 | $ | 145,698 | ||||||||||||
| TechnipFMC PLCA | 8,036 | 59,225 | |||||||||||||
| Transocean Ltd.A | 1,687,216 | 5,955,872 | |||||||||||||
|
| ||||||||||||||
| 88,386,509 | |||||||||||||||
|
| ||||||||||||||
| Oil, Gas & Consumable Fuels - 6.31% | |||||||||||||||
| Altus Midstream Co., Class AB | 31,674 | 1,958,087 | |||||||||||||
| Amplify Energy Corp.A B | 10,800 | 36,828 | |||||||||||||
| Antero Midstream Corp. | 1,620,554 | 17,242,695 | |||||||||||||
| Antero Resources Corp.A | 2,223 | 44,171 | |||||||||||||
| APA Corp. | 285,904 | 7,493,544 | |||||||||||||
| Berry Corp. | 1,002,955 | 9,638,398 | |||||||||||||
| California Resources Corp.A | 4,800 | 221,424 | |||||||||||||
| Chesapeake Energy Corp. | 123,054 | 7,843,462 | |||||||||||||
| Civitas Resources, Inc. | 203,079 | 11,400,855 | |||||||||||||
| CNX Resources Corp.A | 2,597,615 | 37,951,155 | |||||||||||||
| Comstock Resources, Inc.A | 812,642 | 8,020,776 | |||||||||||||
| CVR Energy, Inc. | 3,594 | 68,897 | |||||||||||||
| DHT Holdings, Inc. | 894,284 | 5,821,789 | |||||||||||||
| Earthstone Energy, Inc., Class AA | 5,697 | 57,825 | |||||||||||||
| Enerplus Corp. | 1,212,507 | 11,482,441 | |||||||||||||
| EQT Corp.A | 468,293 | 9,323,714 | |||||||||||||
| Equitrans Midstream Corp. | 2,620,291 | 27,015,200 | |||||||||||||
| Green Plains, Inc.A B | 2,291 | 86,943 | |||||||||||||
| HollyFrontier Corp. | 284,224 | 9,606,771 | |||||||||||||
| Kosmos Energy Ltd.A | 4,836,347 | 17,410,849 | |||||||||||||
| Magnolia Oil & Gas Corp., Class A | 2,355 | 49,172 | |||||||||||||
| Murphy Oil Corp. | 1,101,529 | 30,655,552 | |||||||||||||
| Northern Oil & Gas, Inc. | 8,262 | 191,348 | |||||||||||||
| Oasis Petroleum, Inc. | 93,026 | 11,218,936 | |||||||||||||
| Par Pacific Holdings, Inc.A | 9,200 | 142,232 | |||||||||||||
| PBF Energy, Inc., Class AA | 363,059 | 5,304,292 | |||||||||||||
| PDC Energy, Inc. | 498,997 | 26,102,533 | |||||||||||||
| Penn Virginia Corp.A | 141,527 | 4,676,052 | |||||||||||||
| Range Resources Corp.A | 2,984,085 | 69,588,862 | |||||||||||||
| REX American Resources Corp.A | 1,437 | 126,384 | |||||||||||||
| SFL Corp. Ltd. | 7,301 | 57,751 | |||||||||||||
| Southwestern Energy Co.A | 2,047,663 | 9,992,595 | |||||||||||||
| Viper Energy Partners LP | 397,912 | 8,773,960 | |||||||||||||
| Whiting Petroleum Corp.A | 180,112 | 11,730,695 | |||||||||||||
| World Fuel Services Corp. | 454,984 | 13,890,661 | |||||||||||||
|
| ||||||||||||||
| 375,226,849 | |||||||||||||||
|
| ||||||||||||||
Total Energy | 463,613,358 | ||||||||||||||
|
| ||||||||||||||
| Financials - 24.66% | |||||||||||||||
| Banks - 13.56% | |||||||||||||||
| 1st Source Corp. | 3,176 | 153,337 | |||||||||||||
| Amalgamated Financial Corp. | 8,638 | 158,594 | |||||||||||||
| Ameris Bancorp | 304,235 | 15,938,872 | |||||||||||||
| Associated Banc-Corp. | 1,282,706 | 28,578,690 | |||||||||||||
| Atlantic Union Bankshares Corp. | 87,157 | 3,126,322 | |||||||||||||
| Bank of Marin Bancorp | 3,600 | 137,196 | |||||||||||||
| Bank of NT Butterfield & Son Ltd. | 971,689 | 34,883,635 | |||||||||||||
| Bank OZK | 218,581 | 9,764,013 | |||||||||||||
| BankUnited, Inc. | 108,548 | 4,402,707 | |||||||||||||
See accompanying notes
13
American Beacon Small Cap Value FundSM
Schedule of Investments
October 31, 2021
| Shares | Fair Value | ||||||||||||||
| COMMON STOCKS - 97.34% (continued) | |||||||||||||||
| Financials - 24.66% (continued) | |||||||||||||||
| Banks - 13.56% (continued) | |||||||||||||||
| Bankwell Financial Group, Inc. | 2,100 | $ | 62,370 | ||||||||||||
| Banner Corp. | 170,222 | 9,832,023 | |||||||||||||
| Bar Harbor Bankshares | 2,198 | 65,281 | |||||||||||||
| BCB Bancorp, Inc. | 4,900 | 74,088 | |||||||||||||
| Berkshire Hills Bancorp, Inc. | 54,111 | 1,469,114 | |||||||||||||
| BOK Financial Corp. | 1,318 | 133,342 | |||||||||||||
| Brookline Bancorp, Inc. | 86,738 | 1,392,145 | |||||||||||||
| Bryn Mawr Bank Corp. | 847 | 39,250 | |||||||||||||
| Cadence Bank | 202,353 | 5,872,290 | |||||||||||||
| Camden National Corp. | 901 | 42,888 | |||||||||||||
| Capital Bancorp, Inc. | 3,300 | 83,985 | |||||||||||||
| Carter Bankshares, Inc.A | 4,200 | 62,916 | |||||||||||||
| Cathay General Bancorp | 394,440 | 16,641,424 | |||||||||||||
| Central Pacific Financial Corp. | 329,467 | 9,057,048 | |||||||||||||
| Central Valley Community Bancorp | 4,600 | 98,118 | |||||||||||||
| CIT Group, Inc. | 3,851 | 190,740 | |||||||||||||
| Civista Bancshares, Inc. | 2,441 | 58,730 | |||||||||||||
| CNB Financial Corp. | 3,004 | 77,113 | |||||||||||||
| Columbia Banking System, Inc. | 316,624 | 10,806,377 | |||||||||||||
| Community Financial Corp. | 1,600 | 60,992 | |||||||||||||
| Community Trust Bancorp, Inc. | 2,906 | 126,934 | |||||||||||||
| ConnectOne Bancorp, Inc. | 4,610 | 155,495 | |||||||||||||
| CrossFirst Bankshares, Inc.A | 4,580 | 65,173 | |||||||||||||
| Customers Bancorp, Inc.A | 2,035 | 108,445 | |||||||||||||
| CVB Financial Corp. | 222,975 | 4,463,960 | |||||||||||||
| Dime Community Bancshares, Inc. | 4,405 | 157,170 | |||||||||||||
| Eagle Bancorp, Inc. | 3,543 | 200,498 | |||||||||||||
| Enterprise Financial Services Corp. | 44,755 | 2,104,380 | |||||||||||||
| Equity Bancshares, Inc., Class A | 2,321 | 77,661 | |||||||||||||
| FB Financial Corp. | 57,408 | 2,602,305 | |||||||||||||
| Financial Institutions, Inc. | 3,088 | 98,569 | |||||||||||||
| First BanCorp | 1,464,967 | 26,506,961 | |||||||||||||
| First Busey Corp. | 59,819 | 1,524,786 | |||||||||||||
| First Business Financial Services, Inc. | 1,525 | 44,530 | |||||||||||||
| First Commonwealth Financial Corp. | 95,862 | 1,466,689 | |||||||||||||
| First Financial Bancorp | 114,419 | 2,720,884 | |||||||||||||
| First Financial Corp. | 3,619 | 155,074 | |||||||||||||
| First Hawaiian, Inc. | 1,400,024 | 38,626,662 | |||||||||||||
| First Internet Bancorp | 3,047 | 103,720 | |||||||||||||
| First Interstate BancSystem, Inc., Class A | 304,194 | 12,645,345 | |||||||||||||
| First Merchants Corp. | 60,536 | 2,517,087 | |||||||||||||
| First Mid Bancshares, Inc. | 3,300 | 142,164 | |||||||||||||
| First Midwest Bancorp, Inc. | 117,777 | 2,267,207 | |||||||||||||
| First of Long Island Corp. | 4,693 | 94,470 | |||||||||||||
| Flushing Financial Corp. | 8,881 | 213,322 | |||||||||||||
| FNB Corp. | 1,290,154 | 15,030,294 | |||||||||||||
| Fulton Financial Corp. | 879,332 | 14,157,245 | |||||||||||||
| Great Southern Bancorp, Inc. | 2,637 | 148,806 | |||||||||||||
| Great Western Bancorp, Inc. | 38,562 | 1,313,036 | |||||||||||||
| Hancock Whitney Corp. | 434,360 | 21,492,133 | |||||||||||||
| Hanmi Financial Corp. | 9,838 | 218,305 | |||||||||||||
| Harborone Bancorp, Inc. | 400,220 | 5,751,161 | |||||||||||||
| Heartland Financial USA, Inc. | 48,808 | 2,446,257 | |||||||||||||
| Heritage Commerce Corp. | 566,353 | 6,790,572 | |||||||||||||
| Heritage Financial Corp. | 155,953 | 3,873,873 | |||||||||||||
| Hilltop Holdings, Inc. | 620,383 | 21,986,374 | |||||||||||||
| Home BancShares, Inc. | 342,873 | 8,146,662 | |||||||||||||
See accompanying notes
14
American Beacon Small Cap Value FundSM
Schedule of Investments
October 31, 2021
| Shares | Fair Value | ||||||||||||||
| COMMON STOCKS - 97.34% (continued) | |||||||||||||||
| Financials - 24.66% (continued) | |||||||||||||||
| Banks - 13.56% (continued) | |||||||||||||||
| HomeStreet, Inc. | 3,545 | $ | 167,182 | ||||||||||||
| HomeTrust Bancshares, Inc. | 3,091 | 93,966 | |||||||||||||
| Hope Bancorp, Inc. | 154,558 | 2,255,001 | |||||||||||||
| Horizon Bancorp, Inc. | 7,520 | 143,406 | |||||||||||||
| Independent Bank Corp. | 6,400 | 144,192 | |||||||||||||
| Independent Bank Group, Inc. | 89,401 | 6,462,798 | |||||||||||||
| International Bancshares Corp. | 111,186 | 4,714,286 | |||||||||||||
| Investar Holding Corp. | 3,300 | 61,710 | |||||||||||||
| Investors Bancorp, Inc. | 1,236,861 | 18,923,973 | |||||||||||||
| Lakeland Bancorp, Inc. | 8,507 | 152,956 | |||||||||||||
| Mercantile Bank Corp. | 4,182 | 143,735 | |||||||||||||
| Meta Financial Group, Inc. | 53,114 | 2,944,640 | |||||||||||||
| Metropolitan Bank Holding Corp.A | 1,754 | 159,368 | |||||||||||||
| Midland States Bancorp, Inc. | 6,774 | 173,821 | |||||||||||||
| MidWestOne Financial Group, Inc. | 3,226 | 101,135 | |||||||||||||
| National Bank Holdings Corp., Class A | 328,404 | 14,242,882 | |||||||||||||
| National Bankshares, Inc. | 1,200 | 44,700 | |||||||||||||
| NBT Bancorp, Inc. | 48,477 | 1,778,621 | |||||||||||||
| Northeast Bank | 1,200 | 39,720 | |||||||||||||
| Northrim BanCorp, Inc. | 1,392 | 61,833 | |||||||||||||
| OceanFirst Financial Corp. | 65,678 | 1,456,081 | |||||||||||||
| OFG Bancorp | 1,434,423 | 37,151,556 | |||||||||||||
| Old National Bancorp | 1,321,374 | 22,569,068 | |||||||||||||
| Orrstown Financial Services, Inc. | 1,869 | 44,314 | |||||||||||||
| Pacific Premier Bancorp, Inc. | 105,816 | 4,443,214 | |||||||||||||
| PacWest Bancorp | 134,237 | 6,372,230 | |||||||||||||
| PCB Bancorp | 7,000 | 149,100 | |||||||||||||
| Peapack-Gladstone Financial Corp. | 4,476 | 150,170 | |||||||||||||
| Peoples Bancorp, Inc. | 4,264 | 136,277 | |||||||||||||
| Popular, Inc. | 607,148 | 49,446,133 | |||||||||||||
| Preferred Bank | 1,828 | 125,346 | |||||||||||||
| Primis Financial Corp. | 6,503 | 98,520 | |||||||||||||
| Prosperity Bancshares, Inc. | 376,775 | 28,374,925 | |||||||||||||
| RBB Bancorp | 5,351 | 137,360 | |||||||||||||
| Renasant Corp. | 79,819 | 2,986,029 | |||||||||||||
| Republic Bancorp, Inc., Class A | 2,709 | 146,340 | |||||||||||||
| S&T Bancorp, Inc. | 46,051 | 1,407,319 | |||||||||||||
| Sandy Spring Bancorp, Inc. | 53,656 | 2,546,514 | |||||||||||||
| Seacoast Banking Corp. of Florida | 574,232 | 20,919,272 | |||||||||||||
| Sierra Bancorp | 3,935 | 98,218 | |||||||||||||
| Silvergate Capital Corp., Class AA | 40,295 | 6,311,003 | |||||||||||||
| Simmons First National Corp., Class A | 135,876 | 4,061,334 | |||||||||||||
| Southside Bancshares, Inc. | 32,444 | 1,340,586 | |||||||||||||
| SouthState Corp. | 114,426 | 8,935,526 | |||||||||||||
| Synovus Financial Corp. | 3,282 | 152,908 | |||||||||||||
| Texas Capital Bancshares, Inc.A | 690,165 | 41,823,999 | |||||||||||||
| Towne Bank | 5,553 | 175,031 | |||||||||||||
| TriCo Bancshares | 30,615 | 1,341,855 | |||||||||||||
| TriState Capital Holdings, Inc.A | 4,382 | 131,679 | |||||||||||||
| Trustmark Corp. | 113,707 | 3,617,020 | |||||||||||||
| UMB Financial Corp. | 374,052 | 36,963,819 | |||||||||||||
| Umpqua Holdings Corp. | 2,187,701 | 44,738,485 | |||||||||||||
| United Bankshares, Inc. | 147,086 | 5,440,711 | |||||||||||||
| United Community Banks, Inc. | 377,294 | 13,144,923 | |||||||||||||
| Univest Financial Corp. | 5,032 | 144,418 | |||||||||||||
| Valley National Bancorp | 541,635 | 7,182,080 | |||||||||||||
| Veritex Holdings, Inc. | 242,128 | 9,915,142 | |||||||||||||
See accompanying notes
15
American Beacon Small Cap Value FundSM
Schedule of Investments
October 31, 2021
| Shares | Fair Value | ||||||||||||||
| COMMON STOCKS - 97.34% (continued) | |||||||||||||||
| Financials - 24.66% (continued) | |||||||||||||||
| Banks - 13.56% (continued) | |||||||||||||||
| Washington Trust Bancorp, Inc. | 1,581 | $ | 86,417 | ||||||||||||
| Webster Financial Corp. | 214,033 | 11,977,287 | |||||||||||||
| WesBanco, Inc. | 274,820 | 9,555,491 | |||||||||||||
| Wintrust Financial Corp. | 146,583 | 12,972,596 | |||||||||||||
|
| ||||||||||||||
| 805,388,030 | |||||||||||||||
|
| ||||||||||||||
| Capital Markets - 3.66% | |||||||||||||||
| Affiliated Managers Group, Inc. | 76,238 | 12,798,836 | |||||||||||||
| AllianceBernstein Holding LP, MLP | 174,551 | 9,842,931 | |||||||||||||
| Artisan Partners Asset Management, Inc., Class A | 396 | 19,618 | |||||||||||||
| B Riley Financial, Inc. | 47,276 | 3,387,798 | |||||||||||||
| BGC Partners, Inc., Class A | 3,346 | 17,968 | |||||||||||||
| BrightSphere Investment Group, Inc. | 5,729 | 171,755 | |||||||||||||
| Cohen & Steers, Inc. | 88,527 | 8,400,327 | |||||||||||||
| Cowen, Inc., Class A | 5,612 | 211,741 | |||||||||||||
| Diamond Hill Investment Group, Inc. | 537 | 116,454 | |||||||||||||
| Evercore, Inc., Class A | 322,804 | 49,014,559 | |||||||||||||
| Federated Hermes, Inc. | 616,045 | 20,520,459 | |||||||||||||
| Greenhill & Co., Inc. | 9,292 | 146,070 | |||||||||||||
| Lazard Ltd., Class A | 539,716 | 26,440,687 | |||||||||||||
| LPL Financial Holdings, Inc. | 76,799 | 12,596,572 | |||||||||||||
| Piper Sandler Cos. | 30,281 | 4,986,978 | |||||||||||||
| Stifel Financial Corp. | 540,519 | 39,387,620 | |||||||||||||
| StoneX Group, Inc.A | 40,209 | 2,778,844 | |||||||||||||
| Victory Capital Holdings, Inc., Class A | 38,316 | 1,452,176 | |||||||||||||
| Virtu Financial, Inc., Class A | 64,700 | 1,609,736 | |||||||||||||
| Virtus Investment Partners, Inc. | 54,446 | 17,422,720 | |||||||||||||
| WisdomTree Investments, Inc. | 943,942 | 6,031,789 | |||||||||||||
|
| ||||||||||||||
| 217,355,638 | |||||||||||||||
|
| ||||||||||||||
| Consumer Finance - 0.92% | |||||||||||||||
| Encore Capital Group, Inc.A | 33,860 | 1,829,117 | |||||||||||||
| Enova International, Inc.A | 60,958 | 1,977,477 | |||||||||||||
| EZCORP, Inc., Class AA | 12,933 | 96,480 | |||||||||||||
| Navient Corp. | 380,183 | 7,489,605 | |||||||||||||
| Nelnet, Inc., Class A | 47,606 | 3,933,684 | |||||||||||||
| PRA Group, Inc.A | 51,200 | 2,195,456 | |||||||||||||
| PROG Holdings, Inc. | 186,282 | 7,535,107 | |||||||||||||
| SLM Corp. | 1,611,473 | 29,570,530 | |||||||||||||
|
| ||||||||||||||
| 54,627,456 | |||||||||||||||
|
| ||||||||||||||
| Insurance - 3.70% | |||||||||||||||
| Ambac Financial Group, Inc.A | 9,828 | 166,191 | |||||||||||||
| American Equity Investment Life Holding Co. | 167,565 | 5,340,296 | |||||||||||||
| American National Group, Inc. | 800 | 151,768 | |||||||||||||
| Argo Group International Holdings Ltd. | 263,558 | 14,522,046 | |||||||||||||
| Assured Guaranty Ltd. | 160,414 | 8,915,810 | |||||||||||||
| Axis Capital Holdings Ltd. | 181,051 | 9,427,325 | |||||||||||||
| Brighthouse Financial, Inc.A | 181,909 | 9,137,289 | |||||||||||||
| CNO Financial Group, Inc. | 1,396,286 | 33,706,344 | |||||||||||||
| Employers Holdings, Inc. | 5,167 | 199,446 | |||||||||||||
| Enstar Group Ltd.A | 192,277 | 44,373,686 | |||||||||||||
| Genworth Financial, Inc., Class AA | 284,742 | 1,170,290 | |||||||||||||
| Global Indemnity Group LLC, Class A | 358,208 | 8,808,335 | |||||||||||||
| Hanover Insurance Group, Inc. | 1,557 | 196,182 | |||||||||||||
| Horace Mann Educators Corp. | 508,488 | 19,922,560 | |||||||||||||
See accompanying notes
16
American Beacon Small Cap Value FundSM
Schedule of Investments
October 31, 2021
| Shares | Fair Value | ||||||||||||||
| COMMON STOCKS - 97.34% (continued) | |||||||||||||||
| Financials - 24.66% (continued) | |||||||||||||||
| Insurance - 3.70% (continued) | |||||||||||||||
| Mercury General Corp. | 314,660 | $ | 17,145,823 | ||||||||||||
| National Western Life Group, Inc., Class A | 6,788 | 1,459,488 | |||||||||||||
| ProAssurance Corp. | 112,344 | 2,573,801 | |||||||||||||
| Safety Insurance Group, Inc. | 2,600 | 203,866 | |||||||||||||
| Selective Insurance Group, Inc. | 119,032 | 9,328,538 | |||||||||||||
| Selectquote, Inc.A | 420,056 | 5,582,544 | |||||||||||||
| SiriusPoint Ltd.A | 21,994 | 206,744 | |||||||||||||
| Stewart Information Services Corp. | 54,739 | 3,895,775 | |||||||||||||
| United Fire Group, Inc. | 548 | 11,196 | |||||||||||||
| Universal Insurance Holdings, Inc. | 9,796 | 144,687 | |||||||||||||
| Unum Group | 688,093 | 17,525,729 | |||||||||||||
| White Mountains Insurance Group Ltd. | 5,241 | 5,529,203 | |||||||||||||
|
| ||||||||||||||
| 219,644,962 | |||||||||||||||
|
| ||||||||||||||
| Mortgage Real Estate Investment Trusts (REITs) - 0.13% | |||||||||||||||
| Arlington Asset Investment Corp., Class AA B | 18,991 | 72,925 | |||||||||||||
| BrightSpire Capital, Inc. | 15,280 | 149,897 | |||||||||||||
| Chimera Investment Corp. | 8,433 | 131,639 | |||||||||||||
| Granite Point Mortgage Trust, Inc. | 3,208 | 42,987 | |||||||||||||
| Great Ajax Corp. | 6,901 | 97,718 | |||||||||||||
| MFA Financial, Inc. | 15,313 | 69,062 | |||||||||||||
| New Residential Investment Corp. | 646,658 | 7,346,035 | |||||||||||||
| TPG RE Finance Trust, Inc. | 5,664 | 74,029 | |||||||||||||
|
| ||||||||||||||
| 7,984,292 | |||||||||||||||
|
| ||||||||||||||
| Thrifts & Mortgage Finance - 2.69% | |||||||||||||||
| Axos Financial, Inc.A | 180,990 | 9,592,470 | |||||||||||||
| Bridgewater Bancshares, Inc.A | 4,487 | 81,170 | |||||||||||||
| Essent Group Ltd. | 394,195 | 18,921,360 | |||||||||||||
| Federal Agricultural Mortgage Corp., Class C | 1,309 | 165,052 | |||||||||||||
| FS Bancorp, Inc. | 1,240 | 42,730 | |||||||||||||
| Luther Burbank Corp. | 254,670 | 3,695,262 | |||||||||||||
| Meridian Bancorp, Inc. | 1,977 | 45,866 | |||||||||||||
| MGIC Investment Corp. | 4,158,767 | 67,205,675 | |||||||||||||
| Mr Cooper Group, Inc.A | 183,258 | 8,034,031 | |||||||||||||
| NMI Holdings, Inc., Class AA | 395,659 | 9,606,601 | |||||||||||||
| Northfield Bancorp, Inc. | 7,982 | 140,084 | |||||||||||||
| Northwest Bancshares, Inc. | 260,323 | 3,592,457 | |||||||||||||
| PennyMac Financial Services, Inc. | 34,200 | 2,122,452 | |||||||||||||
| Premier Financial Corp. | 4,759 | 151,717 | |||||||||||||
| Provident Financial Services, Inc. | 164,563 | 4,074,580 | |||||||||||||
| Radian Group, Inc. | 668,274 | 15,951,700 | |||||||||||||
| Southern Missouri Bancorp, Inc. | 892 | 48,525 | |||||||||||||
| Territorial Bancorp, Inc. | 3,664 | 91,930 | |||||||||||||
| TrustCo Bank Corp. | 4,683 | 157,161 | |||||||||||||
| Washington Federal, Inc. | 347,379 | 12,283,321 | |||||||||||||
| Waterstone Financial, Inc. | 6,700 | 138,489 | |||||||||||||
| William Penn Bancorp, Inc. | 5,800 | 70,818 | |||||||||||||
| WSFS Financial Corp. | 69,531 | 3,602,401 | |||||||||||||
|
| ||||||||||||||
| 159,815,852 | |||||||||||||||
|
| ||||||||||||||
Total Financials | 1,464,816,230 | ||||||||||||||
|
| ||||||||||||||
| Health Care - 4.00% | |||||||||||||||
| Biotechnology - 0.60% | |||||||||||||||
| Alkermes PLCA | 348,785 | 10,564,698 | |||||||||||||
| Emergent BioSolutions, Inc.A | 199,929 | 9,530,615 | |||||||||||||
See accompanying notes
17
American Beacon Small Cap Value FundSM
Schedule of Investments
October 31, 2021
| Shares | Fair Value | ||||||||||||||
| COMMON STOCKS - 97.34% (continued) | |||||||||||||||
| Health Care - 4.00% (continued) | |||||||||||||||
| Biotechnology - 0.60% (continued) | |||||||||||||||
| Ironwood Pharmaceuticals, Inc.A | 785,777 | $ | 10,034,372 | ||||||||||||
| Vanda Pharmaceuticals, Inc.A | 312,939 | 5,357,516 | |||||||||||||
|
| ||||||||||||||
| 35,487,201 | |||||||||||||||
|
| ||||||||||||||
| Health Care Equipment & Supplies - 0.44% | |||||||||||||||
| Integer Holdings Corp.A | 119,854 | 10,789,257 | |||||||||||||
| Invacare Corp.A B | 584,613 | 2,887,988 | |||||||||||||
| NuVasive, Inc.A | 148,812 | 7,940,608 | |||||||||||||
| Varex Imaging Corp.A | 169,671 | 4,555,667 | |||||||||||||
|
| ||||||||||||||
| 26,173,520 | |||||||||||||||
|
| ||||||||||||||
| Health Care Providers & Services - 2.35% | |||||||||||||||
| Acadia Healthcare Co., Inc.A | 163,551 | 10,140,162 | |||||||||||||
| AMN Healthcare Services, Inc.A | 276,764 | 27,316,607 | |||||||||||||
| Apria, Inc.A | 315,109 | 11,794,530 | |||||||||||||
| Community Health Systems, Inc.A | 147,700 | 1,934,870 | |||||||||||||
| Encompass Health Corp. | 267,845 | 17,024,228 | |||||||||||||
| Hanger, Inc.A | 780,123 | 14,572,698 | |||||||||||||
| MEDNAX, Inc.A | 350,957 | 9,556,559 | |||||||||||||
| ModivCare, Inc.A | 38,418 | 6,253,298 | |||||||||||||
| Patterson Cos., Inc. | 3,874 | 121,101 | |||||||||||||
| R1 RCM, Inc.A | 604,198 | 13,111,097 | |||||||||||||
| Select Medical Holdings Corp. | 763,882 | 25,376,160 | |||||||||||||
| Triple-S Management Corp., Class BA | 74,026 | 2,612,377 | |||||||||||||
|
| ||||||||||||||
| 139,813,687 | |||||||||||||||
|
| ||||||||||||||
| Health Care Technology - 0.38% | |||||||||||||||
| Evolent Health, Inc., Class AA | 548,695 | 16,060,303 | |||||||||||||
| Omnicell, Inc.A | 36,849 | 6,564,649 | |||||||||||||
|
| ||||||||||||||
| 22,624,952 | |||||||||||||||
|
| ||||||||||||||
| Pharmaceuticals - 0.23% | |||||||||||||||
| Amneal Pharmaceuticals, Inc.A | 179,933 | 987,832 | |||||||||||||
| Prestige Consumer Healthcare, Inc.A | 114,928 | 6,894,531 | |||||||||||||
| Supernus Pharmaceuticals, Inc.A | 180,279 | 5,381,328 | |||||||||||||
| Taro Pharmaceutical Industries Ltd.A | 3,292 | 182,936 | |||||||||||||
|
| ||||||||||||||
| 13,446,627 | |||||||||||||||
|
| ||||||||||||||
Total Health Care | 237,545,987 | ||||||||||||||
|
| ||||||||||||||
| Industrials - 22.33% | |||||||||||||||
| Aerospace & Defense - 0.58% | |||||||||||||||
| AAR Corp.A | 112,872 | 3,992,283 | |||||||||||||
| Aerojet Rocketdyne Holdings, Inc. | 69,618 | 3,063,888 | |||||||||||||
| AeroVironment, Inc.A | 91,948 | 8,193,486 | |||||||||||||
| Curtiss-Wright Corp. | 67,241 | 8,585,331 | |||||||||||||
| Mercury Systems, Inc.A | 63,815 | 3,289,025 | |||||||||||||
| Moog, Inc., Class A | 1,929 | 145,697 | |||||||||||||
| National Presto Industries, Inc. | 1,828 | 151,998 | |||||||||||||
| Spirit AeroSystems Holdings, Inc., Class A | 171,912 | 7,098,247 | |||||||||||||
| Vectrus, Inc.A | 3,680 | 178,222 | |||||||||||||
|
| ||||||||||||||
| 34,698,177 | |||||||||||||||
|
| ||||||||||||||
| Air Freight & Logistics - 0.68% | |||||||||||||||
| Air Transport Services Group, Inc.A | 1,330,912 | 33,126,400 | |||||||||||||
| Atlas Air Worldwide Holdings, Inc.A | 87,539 | 7,101,164 | |||||||||||||
See accompanying notes
18
American Beacon Small Cap Value FundSM
Schedule of Investments
October 31, 2021
| Shares | Fair Value | ||||||||||||||
| COMMON STOCKS - 97.34% (continued) | |||||||||||||||
| Industrials - 22.33% (continued) | |||||||||||||||
| Air Freight & Logistics - 0.68% (continued) | |||||||||||||||
| Echo Global Logistics, Inc.A | 3,100 | $ | 149,513 | ||||||||||||
| Forward Air Corp. | 1,154 | 116,046 | |||||||||||||
|
| ||||||||||||||
| 40,493,123 | |||||||||||||||
|
| ||||||||||||||
| Airlines - 0.51% | |||||||||||||||
| JetBlue Airways Corp.A | 550,364 | 7,721,607 | |||||||||||||
| SkyWest, Inc.A | 424,973 | 18,286,588 | |||||||||||||
| Spirit Airlines, Inc.A | 192,537 | 4,206,934 | |||||||||||||
|
| ||||||||||||||
| 30,215,129 | |||||||||||||||
|
| ||||||||||||||
| Building Products - 2.71% | |||||||||||||||
| Apogee Enterprises, Inc. | 759,046 | 31,826,799 | |||||||||||||
| Armstrong Flooring, Inc.A | 439,748 | 1,248,884 | |||||||||||||
| Armstrong World Industries, Inc. | 79,297 | 8,377,728 | |||||||||||||
| Builders FirstSource, Inc.A | 247,674 | 14,431,964 | |||||||||||||
| Caesarstone Ltd. | 1,631 | 20,355 | |||||||||||||
| Cornerstone Building Brands, Inc.A | 1,276,594 | 18,268,060 | |||||||||||||
| Gibraltar Industries, Inc.A | 390,983 | 25,476,452 | |||||||||||||
| Griffon Corp. | 611,244 | 16,191,854 | |||||||||||||
| Insteel Industries, Inc. | 1,362 | 55,393 | |||||||||||||
| JELD-WEN Holding, Inc.A | 10,589 | 290,244 | |||||||||||||
| Masonite International Corp.A | 2,047 | 245,660 | |||||||||||||
| Resideo Technologies, Inc.A | 356,692 | 8,796,025 | |||||||||||||
| UFP Industries, Inc. | 433,325 | 35,458,985 | |||||||||||||
|
| ||||||||||||||
| 160,688,403 | |||||||||||||||
|
| ||||||||||||||
| Commercial Services & Supplies - 1.09% | |||||||||||||||
| ABM Industries, Inc. | 4,896 | 215,473 | |||||||||||||
| ACCO Brands Corp. | 30,406 | 251,458 | |||||||||||||
| Brink’s Co. | 253,956 | 17,492,489 | |||||||||||||
| Deluxe Corp. | 115,424 | 4,117,174 | |||||||||||||
| Ennis, Inc. | 7,991 | 151,350 | |||||||||||||
| Harsco Corp.A | 1,225,389 | 20,954,152 | |||||||||||||
| Herman Miller, Inc. | 3,945 | 153,539 | |||||||||||||
| HNI Corp. | 550 | 20,570 | |||||||||||||
| Interface, Inc. | 1,332,534 | 19,135,188 | |||||||||||||
| KAR Auction Services, Inc.A | 1,306 | 19,159 | |||||||||||||
| Kimball International, Inc., Class B | 8,864 | 96,352 | |||||||||||||
| Matthews International Corp., Class A | 3,643 | 125,210 | |||||||||||||
| Quad/Graphics, Inc.A | 513,758 | 2,024,206 | |||||||||||||
| Steelcase, Inc., Class A | 14,296 | 170,122 | |||||||||||||
| US Ecology, Inc.A | 2,626 | 84,531 | |||||||||||||
|
| ||||||||||||||
| 65,010,973 | |||||||||||||||
|
| ||||||||||||||
| Construction & Engineering - 3.25% | |||||||||||||||
| Comfort Systems USA, Inc. | 1,819 | 166,384 | |||||||||||||
| Construction Partners, Inc., Class AA | 85,948 | 3,060,608 | |||||||||||||
| Dycom Industries, Inc.A | 127,131 | 10,096,744 | |||||||||||||
| EMCOR Group, Inc. | 353,645 | 42,964,331 | |||||||||||||
| Fluor Corp.A | 2,786,350 | 54,166,644 | |||||||||||||
| Granite Construction, Inc. | 230,961 | 8,573,272 | |||||||||||||
| Great Lakes Dredge & Dock Corp.A | 14,118 | 214,876 | |||||||||||||
| MasTec, Inc.A B | 53,270 | 4,747,955 | |||||||||||||
| Matrix Service Co.A | 459,147 | 4,697,074 | |||||||||||||
| MYR Group, Inc.A | 1,240 | 126,666 | |||||||||||||
| Primoris Services Corp. | 821,134 | 22,129,561 | |||||||||||||
See accompanying notes
19
American Beacon Small Cap Value FundSM
Schedule of Investments
October 31, 2021
| Shares | Fair Value | ||||||||||||||
| COMMON STOCKS - 97.34% (continued) | |||||||||||||||
| Industrials - 22.33% (continued) | |||||||||||||||
| Construction & Engineering - 3.25% (continued) | |||||||||||||||
| Sterling Construction Co., Inc.A | 4,299 | $ | 103,348 | ||||||||||||
| Tutor Perini Corp.A | 16,727 | 227,822 | |||||||||||||
| Valmont Industries, Inc. | 642 | 153,412 | |||||||||||||
| WillScot Mobile Mini Holdings Corp.A | 1,196,202 | 41,568,020 | |||||||||||||
|
| ||||||||||||||
| 192,996,717 | |||||||||||||||
|
| ||||||||||||||
| Construction Materials - 0.06% | |||||||||||||||
| Zurn Water Solutions Corp. | 105,353 | 3,822,207 | |||||||||||||
|
| ||||||||||||||
| Electrical Equipment - 1.77% | |||||||||||||||
| Acuity Brands, Inc. | 463 | 95,114 | |||||||||||||
| Array Technologies, Inc.A | 493,162 | 10,529,009 | |||||||||||||
| Atkore, Inc.A | 82,352 | 7,784,735 | |||||||||||||
| AZZ, Inc. | 4,319 | 229,469 | |||||||||||||
| Encore Wire Corp. | 268,570 | 36,004,494 | |||||||||||||
| EnerSys | 170,080 | 13,613,203 | |||||||||||||
| GrafTech International Ltd. | 2,294,109 | 24,546,966 | |||||||||||||
| nVent Electric PLC | 240,472 | 8,524,733 | |||||||||||||
| Powell Industries, Inc. | 5,476 | 141,609 | |||||||||||||
| Preformed Line Products Co. | 1,423 | 98,756 | |||||||||||||
| Regal Beloit Corp. | 23,488 | 3,577,927 | |||||||||||||
| Thermon Group Holdings, Inc.A | 10,440 | 180,403 | |||||||||||||
|
| ||||||||||||||
| 105,326,418 | |||||||||||||||
|
| ||||||||||||||
| Machinery - 6.35% | |||||||||||||||
| Allison Transmission Holdings, Inc. | 891,989 | 29,756,753 | |||||||||||||
| Altra Industrial Motion Corp. | 842 | 43,910 | |||||||||||||
| Astec Industries, Inc. | 117,626 | 6,278,876 | |||||||||||||
| Barnes Group, Inc. | 302 | 12,666 | |||||||||||||
| CIRCOR International, Inc.A | 656 | 18,722 | |||||||||||||
| Crane Co. | 242,900 | 25,086,712 | |||||||||||||
| Energy Recovery, Inc.A | 311,055 | 6,320,638 | |||||||||||||
| Enerpac Tool Group Corp. | 884,241 | 18,471,795 | |||||||||||||
| EnPro Industries, Inc. | 303,033 | 27,169,939 | |||||||||||||
| Federal Signal Corp. | 888,072 | 38,018,362 | |||||||||||||
| Flowserve Corp. | 335,590 | 11,282,536 | |||||||||||||
| Gorman-Rupp Co. | 76,116 | 3,236,452 | |||||||||||||
| Graham Corp. | 3,361 | 42,718 | |||||||||||||
| Greenbrier Cos., Inc. | 1,215,919 | 49,876,997 | |||||||||||||
| Hillenbrand, Inc. | 391,344 | 17,790,498 | |||||||||||||
| Hyster-Yale Materials Handling, Inc. | 74,849 | 3,595,746 | |||||||||||||
| Kennametal, Inc. | 887,831 | 35,291,282 | |||||||||||||
| L B Foster Co., Class AA | 3,900 | 62,127 | |||||||||||||
| Lindsay Corp. | 41,367 | 6,025,931 | |||||||||||||
| Meritor, Inc.A | 866,211 | 21,083,576 | |||||||||||||
| Miller Industries, Inc. | 225,687 | 8,156,328 | |||||||||||||
| Mueller Industries, Inc. | 68,942 | 3,629,107 | |||||||||||||
| Mueller Water Products, Inc., Class A | 5,926 | 97,246 | |||||||||||||
| Oshkosh Corp. | 48,960 | 5,238,720 | |||||||||||||
| Shyft Group, Inc. | 240,382 | 9,906,142 | |||||||||||||
| Standex International Corp. | 175,724 | 19,552,809 | |||||||||||||
| Timken Co. | 239,402 | 16,985,572 | |||||||||||||
| Trinity Industries, Inc. | 229,690 | 6,442,805 | |||||||||||||
| Wabash National Corp. | 479,811 | 7,451,465 | |||||||||||||
|
| ||||||||||||||
| 376,926,430 | |||||||||||||||
|
| ||||||||||||||
See accompanying notes
20
American Beacon Small Cap Value FundSM
Schedule of Investments
October 31, 2021
| Shares | Fair Value | ||||||||||||||
| COMMON STOCKS - 97.34% (continued) | |||||||||||||||
| Industrials - 22.33% (continued) | |||||||||||||||
| Marine - 0.73% | |||||||||||||||
| Costamare, Inc. | 8,021 | $ | 107,562 | ||||||||||||
| Kirby Corp.A | 609,552 | 31,946,620 | |||||||||||||
| Matson, Inc. | 132,992 | 11,075,574 | |||||||||||||
|
| ||||||||||||||
| 43,129,756 | |||||||||||||||
|
| ||||||||||||||
| Professional Services - 2.58% | |||||||||||||||
| BGSF, Inc. | 7,006 | 84,282 | |||||||||||||
| CBIZ, Inc.A | 2,725 | 100,035 | |||||||||||||
| FTI Consulting, Inc.A | 664 | 95,563 | |||||||||||||
| Heidrick & Struggles International, Inc. | 4,509 | 211,382 | |||||||||||||
| Hudson Global, Inc.A | 60,974 | 1,018,266 | |||||||||||||
| Huron Consulting Group, Inc.A | 151,838 | 7,616,194 | |||||||||||||
| KBR, Inc. | 1,690,227 | 71,733,234 | |||||||||||||
| Kelly Services, Inc., Class A | 11,120 | 200,493 | |||||||||||||
| Korn Ferry | 511,603 | 39,500,868 | |||||||||||||
| Resources Connection, Inc. | 10,088 | 175,632 | |||||||||||||
| Science Applications International Corp. | 138,994 | 12,478,881 | |||||||||||||
| TrueBlue, Inc.A | 712,675 | 19,847,999 | |||||||||||||
|
| ||||||||||||||
| 153,062,829 | |||||||||||||||
|
| ||||||||||||||
| Road & Rail - 0.36% | |||||||||||||||
| ArcBest Corp. | 68,163 | 6,124,445 | |||||||||||||
| Heartland Express, Inc. | 9,100 | 148,603 | |||||||||||||
| Schneider National, Inc., Class B | 1,804 | 44,992 | |||||||||||||
| Universal Logistics Holdings, Inc. | 5,688 | 119,903 | |||||||||||||
| US Xpress Enterprises, Inc., Class AA | 2,376 | 17,986 | |||||||||||||
| Werner Enterprises, Inc. | 329,515 | 14,933,620 | |||||||||||||
|
| ||||||||||||||
| 21,389,549 | |||||||||||||||
|
| ||||||||||||||
| Trading Companies & Distributors - 1.66% | |||||||||||||||
| Air Lease Corp. | 251,468 | 10,071,293 | |||||||||||||
| Applied Industrial Technologies, Inc. | 1,305 | 127,211 | |||||||||||||
| Beacon Roofing Supply, Inc.A | 214,732 | 11,352,881 | |||||||||||||
| BlueLinx Holdings, Inc.A | 3,900 | 185,757 | |||||||||||||
| Boise Cascade Co. | 178,512 | 10,107,349 | |||||||||||||
| DXP Enterprises, Inc.A | 2,899 | 95,551 | |||||||||||||
| GATX Corp.B | 30,682 | 2,910,188 | |||||||||||||
| H&E Equipment Services, Inc. | 2,091 | 94,262 | |||||||||||||
| Herc Holdings, Inc. | 241 | 43,872 | |||||||||||||
| McGrath RentCorp | 103,797 | 7,487,916 | |||||||||||||
| MSC Industrial Direct Co., Inc., Class A | 95,149 | 7,999,176 | |||||||||||||
| NOW, Inc.A | 1,063,276 | 7,676,853 | |||||||||||||
| Rush Enterprises, Inc., Class A | 211,997 | 11,040,804 | |||||||||||||
| Titan Machinery, Inc.A | 87,215 | 2,478,650 | |||||||||||||
| Triton International Ltd. | 233,245 | 14,505,507 | |||||||||||||
| Univar Solutions, Inc.A | 472,013 | 12,074,093 | |||||||||||||
| WESCO International, Inc.A | 1,665 | 215,717 | |||||||||||||
|
| ||||||||||||||
| 98,467,080 | |||||||||||||||
|
| ||||||||||||||
Total Industrials | 1,326,226,791 | ||||||||||||||
|
| ||||||||||||||
| Information Technology - 11.24% | |||||||||||||||
| Communications Equipment - 1.46% | |||||||||||||||
| ADTRAN, Inc. | 484,729 | 8,957,792 | |||||||||||||
| CalAmp Corp.A | 1,664 | 16,008 | |||||||||||||
| Calix, Inc.A | 116,105 | 7,267,012 | |||||||||||||
See accompanying notes
21
American Beacon Small Cap Value FundSM
Schedule of Investments
October 31, 2021
| Shares | Fair Value | ||||||||||||||
| COMMON STOCKS - 97.34% (continued) | |||||||||||||||
| Information Technology - 11.24% (continued) | |||||||||||||||
| Communications Equipment - 1.46% (continued) | |||||||||||||||
| Casa Systems, Inc.A | 94,060 | $ | 595,400 | ||||||||||||
| Ciena Corp.A | 400,159 | 21,724,632 | |||||||||||||
| CommScope Holding Co., Inc.A | 348,702 | 3,734,598 | |||||||||||||
| Comtech Telecommunications Corp. | 8,960 | 193,267 | |||||||||||||
| Extreme Networks, Inc.A | 757,869 | 7,449,852 | |||||||||||||
| Infinera Corp.A B | 3,137,149 | 23,810,961 | |||||||||||||
| NETGEAR, Inc.A | 183,211 | 5,281,973 | |||||||||||||
| NetScout Systems, Inc.A | 4,209 | 113,896 | |||||||||||||
| Plantronics, Inc.A | 3,724 | 99,654 | |||||||||||||
| Viasat, Inc.A | 126,109 | 7,527,446 | |||||||||||||
|
| ||||||||||||||
| 86,772,491 | |||||||||||||||
|
| ||||||||||||||
| Electronic Equipment, Instruments & Components - 3.68% | |||||||||||||||
| Advanced Energy Industries, Inc. | 107,368 | 9,858,530 | |||||||||||||
| Arrow Electronics, Inc.A | 46,136 | 5,340,242 | |||||||||||||
| Avnet, Inc. | 814,047 | 31,023,331 | |||||||||||||
| Belden, Inc. | 241,101 | 14,516,691 | |||||||||||||
| Benchmark Electronics, Inc. | 632 | 14,732 | |||||||||||||
| Daktronics, Inc.A | 2,848 | 15,806 | |||||||||||||
| ePlus, Inc.A | 1,371 | 151,591 | |||||||||||||
| FabrinetA | 137,011 | 13,153,056 | |||||||||||||
| FARO Technologies, Inc.A | 332,802 | 24,484,243 | |||||||||||||
| II-VI, Inc.A B | 519,354 | 31,426,111 | |||||||||||||
| Insight Enterprises, Inc.A | 2,377 | 225,102 | |||||||||||||
| Kimball Electronics, Inc.A | 6,049 | 173,909 | |||||||||||||
| Methode Electronics, Inc. | 114,951 | 4,835,989 | |||||||||||||
| nLight, Inc.A | 162,554 | 4,571,019 | |||||||||||||
| PC Connection, Inc. | 3,465 | 159,563 | |||||||||||||
| Plexus Corp.A | 463 | 40,429 | |||||||||||||
| Rogers Corp.A | 151,702 | 30,510,306 | |||||||||||||
| Sanmina Corp.A | 393,009 | 14,836,090 | |||||||||||||
| ScanSource, Inc.A | 8,916 | 319,015 | |||||||||||||
| TTM Technologies, Inc.A | 872,666 | 11,554,098 | |||||||||||||
| Vishay Intertechnology, Inc. | 617,997 | 11,877,902 | |||||||||||||
| Vishay Precision Group, Inc.A | 277,278 | 9,452,407 | |||||||||||||
|
| ||||||||||||||
| 218,540,162 | |||||||||||||||
|
| ||||||||||||||
| IT Services - 1.21% | |||||||||||||||
| Alliance Data Systems Corp. | 87,578 | 7,466,025 | |||||||||||||
| BM Technologies, Inc.A | 7,586 | 67,819 | |||||||||||||
| Cass Information Systems, Inc. | 4,272 | 175,109 | |||||||||||||
| Conduent, Inc.A | 5,376 | 36,288 | |||||||||||||
| CSG Systems International, Inc. | 159,670 | 7,991,483 | |||||||||||||
| Euronet Worldwide, Inc.A | 242,365 | 27,190,929 | |||||||||||||
| ExlService Holdings, Inc.A | 118,706 | 14,556,917 | |||||||||||||
| MAXIMUS, Inc. | 110,740 | 9,365,282 | |||||||||||||
| Sabre Corp.A B | 17,000 | 176,460 | |||||||||||||
| Verra Mobility Corp.A | 349,400 | 5,199,072 | |||||||||||||
|
| ||||||||||||||
| 72,225,384 | |||||||||||||||
|
| ||||||||||||||
| Semiconductors & Semiconductor Equipment - 3.46% | |||||||||||||||
| Brooks Automation, Inc. | 340,533 | 39,655,068 | |||||||||||||
| Cohu, Inc.A | 823,197 | 26,375,232 | |||||||||||||
| Diodes, Inc.A | 848,177 | 81,501,328 | |||||||||||||
| Ichor Holdings Ltd.A | 3,165 | 138,374 | |||||||||||||
| Kulicke & Soffa Industries, Inc. | 158,399 | 9,028,743 | |||||||||||||
See accompanying notes
22
American Beacon Small Cap Value FundSM
Schedule of Investments
October 31, 2021
| Shares | Fair Value | ||||||||||||||
| COMMON STOCKS - 97.34% (continued) | |||||||||||||||
| Information Technology - 11.24% (continued) | |||||||||||||||
| Semiconductors & Semiconductor Equipment - 3.46% (continued) | |||||||||||||||
| MaxLinear, Inc.A | 161,745 | $ | 10,189,935 | ||||||||||||
| Photronics, Inc.A | 1,219,559 | 15,842,071 | |||||||||||||
| Tower Semiconductor Ltd.A | 317,887 | 10,131,059 | |||||||||||||
| Ultra Clean Holdings, Inc.A | 254,436 | 12,612,392 | |||||||||||||
|
| ||||||||||||||
| 205,474,202 | |||||||||||||||
|
| ||||||||||||||
| Software - 1.22% | |||||||||||||||
| A10 Networks, Inc.A | 384,762 | 7,191,202 | |||||||||||||
| Ebix, Inc.B | 3,224 | 105,779 | |||||||||||||
| InterDigital, Inc. | 256 | 17,139 | |||||||||||||
| Progress Software Corp. | 391,204 | 20,111,798 | |||||||||||||
| Telos Corp.A | 445,000 | 11,529,950 | |||||||||||||
| Verint Systems, Inc.A | 117,040 | 5,454,064 | |||||||||||||
| WM Technology, Inc.A B | 405,561 | 4,964,067 | |||||||||||||
| Xperi Holding Corp. | 415,762 | 7,450,455 | |||||||||||||
| Zuora, Inc., Class AA | 720,854 | 15,757,868 | |||||||||||||
|
| ||||||||||||||
| 72,582,322 | |||||||||||||||
|
| ||||||||||||||
| Technology Hardware, Storage & Peripherals - 0.21% | |||||||||||||||
| Diebold Nixdorf, Inc.A | 9,442 | 84,978 | |||||||||||||
| Super Micro Computer, Inc.A | 53,093 | 1,878,961 | |||||||||||||
| Xerox Holdings Corp. | 579,688 | 10,318,447 | |||||||||||||
|
| ||||||||||||||
| 12,282,386 | |||||||||||||||
|
| ||||||||||||||
Total Information Technology | 667,876,947 | ||||||||||||||
|
| ||||||||||||||
| Materials - 4.12% | |||||||||||||||
| Chemicals - 0.92% | |||||||||||||||
| AdvanSix, Inc.A | 6,072 | 295,099 | |||||||||||||
| American Vanguard Corp. | 9,604 | 149,630 | |||||||||||||
| Avient Corp. | 1,517 | 81,736 | |||||||||||||
| Cabot Corp. | 148,741 | 7,935,332 | |||||||||||||
| Chemours Co. | 362,854 | 10,167,169 | |||||||||||||
| ECOVYST, Inc. | 17,706 | 206,806 | |||||||||||||
| FutureFuel Corp. | 8,394 | 59,262 | |||||||||||||
| GCP Applied Technologies, Inc.A | 9,100 | 205,751 | |||||||||||||
| Hawkins, Inc. | 2,347 | 86,064 | |||||||||||||
| HB Fuller Co. | 2,486 | 175,288 | |||||||||||||
| Ingevity Corp.A | 1,116 | 86,948 | |||||||||||||
| Livent Corp.A B | 210,621 | 5,943,725 | |||||||||||||
| Minerals Technologies, Inc. | 171,679 | 12,178,908 | |||||||||||||
| Orion Engineered Carbons SAA | 596,771 | 11,219,295 | |||||||||||||
| Tredegar Corp. | 7,458 | 89,943 | |||||||||||||
| Trinseo PLC | 3,197 | 179,224 | |||||||||||||
| Tronox Holdings PLC, Class A | 243,233 | 5,672,194 | |||||||||||||
|
| ||||||||||||||
| 54,732,374 | |||||||||||||||
|
| ||||||||||||||
| Construction Materials - 0.26% | |||||||||||||||
| Eagle Materials, Inc. | 106,450 | 15,792,922 | |||||||||||||
|
| ||||||||||||||
| Containers & Packaging - 0.30% | |||||||||||||||
| Graphic Packaging Holding Co. | 595,150 | 11,861,340 | |||||||||||||
| O-I Glass, Inc.A | 435,619 | 5,684,828 | |||||||||||||
| TriMas Corp.A | 1,298 | 43,288 | |||||||||||||
|
| ||||||||||||||
| 17,589,456 | |||||||||||||||
|
| ||||||||||||||
See accompanying notes
23
American Beacon Small Cap Value FundSM
Schedule of Investments
October 31, 2021
| Shares | Fair Value | ||||||||||||||
| COMMON STOCKS - 97.34% (continued) | |||||||||||||||
| Materials - 4.12% (continued) | |||||||||||||||
| Metals & Mining - 2.51% | |||||||||||||||
| Alamos Gold, Inc., Class A | 1,788,753 | $ | 13,308,322 | ||||||||||||
| Allegheny Technologies, Inc.A | 1,765,134 | 28,418,657 | |||||||||||||
| Carpenter Technology Corp. | 343,404 | 10,604,316 | |||||||||||||
| Coeur Mining, Inc.A | 687,918 | 4,354,521 | |||||||||||||
| Commercial Metals Co. | 645,499 | 20,772,158 | |||||||||||||
| Compass Minerals International, Inc. | 2,100 | 137,760 | |||||||||||||
| Elah Holdings, Inc.A | 3,530 | 345,940 | |||||||||||||
| Ferroglobe PLCA | 1,823,721 | 12,091,270 | |||||||||||||
| Ferroglobe Representation & Warranty InsuranceC D | 2,123,070 | - | |||||||||||||
| Hecla Mining Co. | 1,108,718 | 6,408,390 | |||||||||||||
| Kaiser Aluminum Corp. | 1,761 | 171,064 | |||||||||||||
| Materion Corp. | 293,471 | 21,182,737 | |||||||||||||
| MP Materials Corp.A | 267,998 | 9,071,732 | |||||||||||||
| Ryerson Holding Corp. | 4,100 | 108,076 | |||||||||||||
| Schnitzer Steel Industries, Inc., Class A | 189,526 | 10,196,499 | |||||||||||||
| Warrior Met Coal, Inc. | 5,088 | 121,959 | |||||||||||||
| Worthington Industries, Inc. | 221,298 | 12,020,907 | |||||||||||||
|
| ||||||||||||||
| 149,314,308 | |||||||||||||||
|
| ||||||||||||||
| Paper & Forest Products - 0.13% | |||||||||||||||
| Clearwater Paper Corp.A | 632 | 26,437 | |||||||||||||
| Glatfelter Corp. | 9,327 | 153,243 | |||||||||||||
| Louisiana-Pacific Corp. | 58,700 | 3,459,191 | |||||||||||||
| Mercer International, Inc. | 15,855 | 170,758 | |||||||||||||
| Schweitzer-Mauduit International, Inc. | 107,316 | 3,738,889 | |||||||||||||
|
| ||||||||||||||
| 7,548,518 | |||||||||||||||
|
| ||||||||||||||
Total Materials | 244,977,578 | ||||||||||||||
|
| ||||||||||||||
| Real Estate - 4.67% | |||||||||||||||
| Equity Real Estate Investment Trusts (REITs) - 3.94% | |||||||||||||||
| Agree Realty Corp. | 143,377 | 10,188,370 | |||||||||||||
| Alexander’s, Inc. | 744 | 207,412 | |||||||||||||
| Apple Hospitality REIT, Inc. | 416,061 | 6,536,318 | |||||||||||||
| Brandywine Realty Trust | 778,879 | 10,320,147 | |||||||||||||
| CareTrust REIT, Inc. | 865,356 | 17,956,137 | |||||||||||||
| Corporate Office Properties Trust | 440,665 | 11,950,835 | |||||||||||||
| Equity CommonwealthA | 190,728 | 4,945,577 | |||||||||||||
| GEO Group, Inc.B | 9,789 | 80,074 | |||||||||||||
| Highwoods Properties, Inc. | 269,346 | 12,077,475 | |||||||||||||
| Industrial Logistics Properties Trust | 159,826 | 4,489,512 | |||||||||||||
| Kite Realty Group Trust | 296,410 | 6,017,123 | |||||||||||||
| Lexington Realty Trust | 2,012,559 | 29,322,985 | |||||||||||||
| Pebblebrook Hotel Trust | 235,357 | 5,286,118 | |||||||||||||
| Physicians Realty Trust | 509,437 | 9,684,398 | |||||||||||||
| Piedmont Office Realty Trust, Inc., Class A | 1,100,203 | 19,539,605 | |||||||||||||
| PotlatchDeltic Corp. | 374,117 | 19,555,096 | |||||||||||||
| Rayonier, Inc. | 204,016 | 7,615,917 | |||||||||||||
| Retail Opportunity Investments Corp. | 542,256 | 9,635,889 | |||||||||||||
| Seritage Growth Properties, Class AA B | 1,128,018 | 17,371,477 | |||||||||||||
| STAG Industrial, Inc. | 127,249 | 5,539,149 | |||||||||||||
| Sunstone Hotel Investors, Inc.A | 788,333 | 9,728,029 | |||||||||||||
| Terreno Realty Corp. | 95,916 | 7,014,337 | |||||||||||||
| Urban Edge Properties | 528,115 | 9,257,856 | |||||||||||||
|
| ||||||||||||||
| 234,319,836 | |||||||||||||||
|
| ||||||||||||||
| Real Estate Management & Development - 0.73% | |||||||||||||||
| Forestar Group, Inc.A | 6,613 | 129,416 | |||||||||||||
See accompanying notes
24
American Beacon Small Cap Value FundSM
Schedule of Investments
October 31, 2021
| Shares | Fair Value | ||||||||||||||
| COMMON STOCKS - 97.34% (continued) | |||||||||||||||
| Real Estate - 4.67% (continued) | |||||||||||||||
| Real Estate Management & Development - 0.73% (continued) | |||||||||||||||
| Howard Hughes Corp.A | 95,797 | $ | 8,346,793 | ||||||||||||
| Newmark Group, Inc., Class A | 900,807 | 13,404,008 | |||||||||||||
| RE/MAX Holdings, Inc., Class A | 5,146 | 163,694 | |||||||||||||
| Realogy Holdings Corp.A | 358,124 | 6,202,708 | |||||||||||||
| RMR Group, Inc., Class A | 429,753 | 14,951,107 | |||||||||||||
|
| ||||||||||||||
| 43,197,726 | |||||||||||||||
|
| ||||||||||||||
Total Real Estate | 277,517,562 | ||||||||||||||
|
| ||||||||||||||
| Utilities - 2.31% | |||||||||||||||
| Electric Utilities - 0.58% | |||||||||||||||
| ALLETE, Inc. | 3,260 | 200,620 | |||||||||||||
| Hawaiian Electric Industries, Inc. | 75,709 | 3,070,757 | |||||||||||||
| Otter Tail Corp. | 3,495 | 216,725 | |||||||||||||
| PNM Resources, Inc. | 4,117 | 204,821 | |||||||||||||
| Portland General Electric Co. | 627,675 | 30,950,654 | |||||||||||||
|
| ||||||||||||||
| 34,643,577 | |||||||||||||||
|
| ||||||||||||||
| Gas Utilities - 0.80% | |||||||||||||||
| Chesapeake Utilities Corp. | 56,674 | 7,428,261 | |||||||||||||
| National Fuel Gas Co. | 231,171 | 13,276,150 | |||||||||||||
| South Jersey Industries, Inc.B | 71,335 | 1,623,585 | |||||||||||||
| Southwest Gas Holdings, Inc. | 334,136 | 23,138,918 | |||||||||||||
| Spire, Inc. | 31,775 | 1,994,199 | |||||||||||||
|
| ||||||||||||||
| 47,461,113 | |||||||||||||||
|
| ||||||||||||||
| Multi-Utilities - 0.93% | |||||||||||||||
| Avista Corp. | 991,720 | 39,480,373 | |||||||||||||
| NorthWestern Corp. | 278,827 | 15,854,104 | |||||||||||||
|
| ||||||||||||||
| 55,334,477 | |||||||||||||||
|
| ||||||||||||||
Total Utilities | 137,439,167 | ||||||||||||||
|
| ||||||||||||||
Total Common Stocks (Cost $4,206,773,366) | 5,782,589,801 | ||||||||||||||
|
| ||||||||||||||
| SHORT-TERM INVESTMENTS - 2.51% (Cost $149,026,206) | |||||||||||||||
| Investment Companies - 2.51% | |||||||||||||||
| American Beacon U.S. Government Money Market Select Fund, 0.01%E F | 149,026,206 | 149,026,206 | |||||||||||||
|
| ||||||||||||||
| SECURITIES LENDING COLLATERAL - 0.18% (Cost $10,739,130) | |||||||||||||||
| Investment Companies - 0.18% | |||||||||||||||
| American Beacon U.S. Government Money Market Select Fund, 0.01%E F | 10,739,130 | 10,739,130 | |||||||||||||
|
| ||||||||||||||
TOTAL INVESTMENTS - 100.03% (Cost $4,366,538,702) | 5,942,355,137 | ||||||||||||||
LIABILITIES, NET OF OTHER ASSETS - (0.03%) | (1,506,164 | ) | |||||||||||||
|
| ||||||||||||||
TOTAL NET ASSETS - 100.00% | $ | 5,940,848,973 | |||||||||||||
|
| ||||||||||||||
| Percentages are stated as a percent of net assets. | |||||||||||||||
A Non-income producing security.
B All or a portion of this security is on loan, collateralized by either cash and/or U.S. Treasuries, at October 31, 2021 (Note 9).
C Value was determined using significant unobservable inputs.
D Fair valued pursuant to procedures approved by the Board of Trustees. At period end, the value of these securities amounted to $0 or 0.00% of net assets.
E The Fund is affiliated by having the same investment advisor.
F 7-day yield.
LLC - Limited Liability Company.
LP - Limited Partnership.
MLP - Master Limited Partnership.
PLC - Public Limited Company.
REIT - Real Estate Investment Trust.
See accompanying notes
25
American Beacon Small Cap Value FundSM
Schedule of Investments
October 31, 2021
| Long Futures Contracts Open on October 31, 2021: | ||||||||||||||||
| Equity Futures Contracts | ||||||||||||||||
| Description | Number of Contracts | Expiration Date | Notional Amount | Contract Value | Unrealized Appreciation (Depreciation) | |||||||||||
| Russell 2000 E-Mini Index | 1,253 | December 2021 | $ | 140,370,951 | $ | 143,800,545 | $ | 3,429,594 | ||||||||
|
|
|
|
|
| |||||||||||
| $ | 140,370,951 | $ | 143,800,545 | $ | 3,429,594 | |||||||||||
|
|
|
|
|
| |||||||||||
The Fund’s investments are summarized by level based on the inputs used to determine their values. As of October 31, 2021, the investments were classified as described below:
Small Cap Value Fund | Level 1 | Level 2 | Level 3 | Total | ||||||||||||||||||||||||
Assets |
| |||||||||||||||||||||||||||
Common Stocks | $ | 5,782,589,801 | $ | - | $ | 0 | (1) | $ | 5,782,589,801 | |||||||||||||||||||
Short-Term Investments | 149,026,206 | - | - | 149,026,206 | ||||||||||||||||||||||||
Securities Lending Collateral | 10,739,130 | - | - | 10,739,130 | ||||||||||||||||||||||||
|
|
|
|
|
|
|
| |||||||||||||||||||||
Total Investments in Securities - Assets | $ | 5,942,355,137 | $ | - | $ | - | $ | 5,942,355,137 | ||||||||||||||||||||
|
|
|
|
|
|
|
| |||||||||||||||||||||
Financial Derivative Instruments - Assets |
| |||||||||||||||||||||||||||
Futures Contracts | $ | 3,429,594 | $ | - | $ | - | $ | 3,429,594 | ||||||||||||||||||||
|
|
|
|
|
|
|
| |||||||||||||||||||||
Total Financial Derivative Instruments - Assets | $ | 3,429,594 | $ | - | $ | - | $ | 3,429,594 | ||||||||||||||||||||
|
|
|
|
|
|
|
| |||||||||||||||||||||
| (1) | Investment held in the Fund’s Portfolio with $0 fair value. |
U.S. GAAP requires transfers between all levels to/from level 3 be disclosed. During the year ended October 31, 2021, there were no transfers into or out of Level 3.
See accompanying notes
26
American Beacon Small Cap Value FundSM
Statement of Assets and Liabilities
October 31, 2021
Assets: |
| |||
Investments in unaffiliated securities, at fair value†§ | $ | 5,782,589,801 | ||
Investments in affiliated securities, at fair value‡ | 159,765,336 | |||
Cash | 2,436 | |||
Cash collateral held at custodian for the benefit of the broker | 9,460,000 | |||
Dividends and interest receivable | 1,600,493 | |||
Receivable for investments sold | 22,295,123 | |||
Receivable for fund shares sold | 3,803,906 | |||
Receivable for variation margin on open futures contracts (Note 5) | 3,431,963 | |||
Prepaid expenses | 39,547 | |||
|
| |||
Total assets | 5,982,988,605 | |||
|
| |||
Liabilities: |
| |||
Payable for investments purchased | 20,123,402 | |||
Payable for fund shares redeemed | 3,162,748 | |||
Cash due to broker for futures contracts | 3,419,900 | |||
Management and sub-advisory fees payable (Note 2) | 3,740,230 | |||
Service fees payable (Note 2) | 126,015 | |||
Transfer agent fees payable (Note 2) | 95,559 | |||
Payable upon return of securities loaned (Note 9)§ | 10,739,130 | |||
Custody and fund accounting fees payable | 340,561 | |||
Professional fees payable | 72,393 | |||
Trustee fees payable (Note 2) | 31,143 | |||
Payable for prospectus and shareholder reports | 157,741 | |||
Other liabilities | 130,810 | |||
|
| |||
Total liabilities | 42,139,632 | |||
|
| |||
Net assets | $ | 5,940,848,973 | ||
|
| |||
Analysis of net assets: |
| |||
Paid-in-capital | $ | 3,836,486,024 | ||
Total distributable earnings (deficits)A | 2,104,362,949 | |||
|
| |||
Net assets | $ | 5,940,848,973 | ||
|
| |||
Shares outstanding at no par value (unlimited shares authorized): |
| |||
R5 Class | 108,358,990 | |||
|
| |||
Y Class | 8,339,121 | |||
|
| |||
Investor Class | 12,346,517 | |||
|
| |||
Advisor Class | 1,118,110 | |||
|
| |||
A Class | 2,164,011 | |||
|
| |||
C Class | 409,294 | |||
|
| |||
R6 Class | 58,685,178 | |||
|
| |||
Net assets: |
| |||
R5 Class | $ | 3,380,005,813 | ||
|
| |||
Y Class | $ | 255,837,301 | ||
|
| |||
Investor Class | $ | 367,726,622 | ||
|
| |||
Advisor Class | $ | 32,801,309 | ||
|
| |||
A Class | $ | 63,024,594 | ||
|
| |||
C Class | $ | 11,261,210 | ||
|
| |||
R6 Class | $ | 1,830,192,124 | ||
|
| |||
Net asset value, offering and redemption price per share: |
| |||
R5 Class | $ | 31.19 | ||
|
| |||
Y Class | $ | 30.68 | ||
|
| |||
Investor Class | $ | 29.78 | ||
|
| |||
Advisor Class | $ | 29.34 | ||
|
| |||
A Class | $ | 29.12 | ||
|
| |||
A Class (offering price) | $ | 30.90 | ||
|
| |||
C Class | $ | 27.51 | ||
|
| |||
R6 Class | $ | 31.19 | ||
|
| |||
† Cost of investments in unaffiliated securities | $ | 4,206,773,366 | ||
‡ Cost of investments in affiliated securities | $ | 159,765,336 | ||
§ Fair value of securities on loan | $ | 69,502,259 | ||
| A The Fund’s investments in affiliated securities did not have unrealized appreciation (depreciation) at year end. |
| |||
See accompanying notes
27
American Beacon Small Cap Value FundSM
Statement of Operations
For the year ended October 31, 2021
Investment income: |
| |||
Dividend income from unaffiliated securities (net of foreign taxes)† | $ | 86,169,706 | ||
Dividend income from affiliated securities (Note 2) | 11,919 | |||
Interest income | 7,407 | |||
Income derived from securities lending (Note 9) | 1,324,616 | |||
|
| |||
Total investment income | 87,513,648 | |||
|
| |||
Expenses: |
| |||
Management and sub-advisory fees (Note 2) | 44,500,060 | |||
Transfer agent fees: | ||||
R5 Class (Note 2) | 1,120,781 | |||
Y Class (Note 2) | 262,083 | |||
Investor Class | 20,852 | |||
Advisor Class | 5,753 | |||
A Class | 8,734 | |||
C Class | 3,844 | |||
R6 Class | 56,193 | |||
Custody and fund accounting fees | 599,225 | |||
Professional fees | 288,306 | |||
Registration fees and expenses | 157,826 | |||
Service fees (Note 2): | ||||
Investor Class | 1,423,149 | |||
Advisor Class | 130,077 | |||
A Class | 124,070 | |||
C Class | 15,153 | |||
Distribution fees (Note 2): | ||||
Advisor Class | 130,092 | |||
A Class | 156,772 | |||
C Class | 110,746 | |||
Prospectus and shareholder report expenses | 476,483 | |||
Trustee fees (Note 2) | 400,500 | |||
Loan expense (Note 10) | 29,175 | |||
Other expenses | 514,561 | |||
|
| |||
Total expenses | 50,534,435 | |||
|
| |||
Net investment income | 36,979,213 | |||
|
| |||
Realized and unrealized gain (loss) from investments: |
| |||
Net realized gain from: | ||||
Investments in unaffiliated securitiesA | 992,666,576 | |||
Redemption in kind (Note 7) | 9,196,460 | |||
Commission recapture (Note 1) | 6,574 | |||
Foreign currency transactions | 540 | |||
Futures contracts | 42,199,986 | |||
Change in net unrealized appreciation (depreciation) of: | ||||
Investments in unaffiliated securitiesB | 1,477,923,882 | |||
Foreign currency transactions | (14 | ) | ||
Futures contracts | 4,188,616 | |||
|
| |||
Net gain from investments | 2,526,182,620 | |||
|
| |||
Net increase in net assets resulting from operations | $ | 2,563,161,833 | ||
|
| |||
† Foreign taxes | $ | 236,813 | ||
A The Fund did not recognize net realized gains (losses) from the sale of investments in affiliated securities. | ||||
B The Fund’s investments in affiliated securities did not have a change in unrealized appreciation (depreciation) at year end. |
| |||
See accompanying notes
28
American Beacon Small Cap Value FundSM
Statement of Changes in Net Assets
| Year Ended October 31, 2021 | Year Ended October 31, 2020 | |||||||||||
Increase (decrease) in net assets: |
| |||||||||||
Operations: |
| |||||||||||
Net investment income | $ | 36,979,213 | $ | 51,286,061 | ||||||||
Net realized gain (loss) from investments in unaffiliated securities, redemption in kind, commission recapture, foreign currency transactions and futures contracts | 1,044,070,136 | (349,000,273 | ) | |||||||||
Change in net unrealized appreciation (depreciation) of investments in unaffiliated securities, foreign currency transactions and futures contracts | 1,482,112,484 | (450,826,828 | ) | |||||||||
|
|
|
| |||||||||
Net increase (decrease) in net assets resulting from operations | 2,563,161,833 | (748,541,040 | ) | |||||||||
|
|
|
| |||||||||
Distributions to shareholders: |
| |||||||||||
Total retained earnings: | ||||||||||||
R5 Class | (30,252,473 | ) | (77,630,333 | ) | ||||||||
Y Class | (1,814,421 | ) | (4,669,476 | ) | ||||||||
Investor Class | (2,372,133 | ) | (7,055,350 | ) | ||||||||
Advisor Class | (272,130 | ) | (889,167 | ) | ||||||||
A Class | (318,938 | ) | (920,254 | ) | ||||||||
C Class | – | (127,221 | ) | |||||||||
R6 Class | (13,695,714 | ) | (25,997,687 | ) | ||||||||
|
|
|
| |||||||||
Net distributions to shareholders | (48,725,809 | ) | (117,289,488 | ) | ||||||||
|
|
|
| |||||||||
Capital share transactions (Note 11): |
| |||||||||||
Proceeds from sales of shares | 1,621,094,193 | 1,304,585,937 | ||||||||||
Reinvestment of dividends and distributions | 46,257,815 | 112,103,096 | ||||||||||
Cost of shares redeemed | (2,798,705,958 | ) | (2,191,361,762 | ) | ||||||||
|
|
|
| |||||||||
Net (decrease) in net assets from capital share transactions | (1,131,353,950 | ) | (774,672,729 | ) | ||||||||
|
|
|
| |||||||||
Net increase (decrease) in net assets | 1,383,082,074 | (1,640,503,257 | ) | |||||||||
|
|
|
| |||||||||
Net assets: |
| |||||||||||
Beginning of year | 4,557,766,899 | 6,198,270,156 | ||||||||||
|
|
|
| |||||||||
End of year | $ | 5,940,848,973 | $ | 4,557,766,899 | ||||||||
|
|
|
| |||||||||
See accompanying notes
29
American Beacon Small Cap Value FundSM
October 31, 2021
1. Organization and Significant Accounting Policies
American Beacon Funds (the “Trust”) is organized as a Massachusetts business trust. The Fund, a series within the Trust, is registered under the Investment Company Act of 1940, as amended (the “Act”), as a diversified, open-end management investment company. As of October 31, 2021, the Trust consists of twenty-eight active series, one of which is presented in this filing: American Beacon Small Cap Value Fund (the “Fund”). The remaining twenty-seven active series are reported in separate filings.
American Beacon Advisors, Inc. (the “Manager”) is a Delaware corporation and a wholly-owned subsidiary of Resolute Investment Managers, Inc. (“RIM”) organized in 1986 to provide business management, advisory, administrative, and asset management consulting services to the Trust and other investors. The Manager is registered as an investment advisor under the Investment Advisers Act of 1940, as amended (the “Advisers Act”). RIM is, in turn, a wholly-owned subsidiary of Resolute Acquisition, Inc., which is a wholly-owned subsidiary of Resolute Topco, Inc., a wholly-owned subsidiary of Resolute Investment Holdings, LLC (“RIH”). RIH is owned primarily by Kelso Investment Associates VIII, L.P., KEP VI, LLC and Estancia Capital Partners L.P., investment funds affiliated with Kelso & Company, L.P. (“Kelso”) or Estancia Capital Management, LLC (“Estancia”), which are private equity firms.
Recently Adopted Accounting Pronouncements
In March 2020, the Financial Accounting Standards Board (“FASB”) issued Accounting Standards Update (“ASU”) 2020-04, which provides optional expedients and exceptions for contracts, hedging relationships and other transactions affected by the transitioning away from the London Interbank Offered Rate (“LIBOR”) and other reference rates that are expected to be discontinued. The amendments in this ASU are effective for all entities as of March 12, 2020 through December 31, 2022. At this time, management is evaluating the implications of these changes on the financial statements.
In October 2020, the U.S. Securities and Exchange Commission (“SEC”) adopted new regulations governing the use of derivatives by registered investment companies. Rule 18f-4 will impose limits on the amount of derivatives the fund could enter into, eliminate the asset segregation framework currently used by funds to comply with Section 18 of the Act, and require funds whose use of derivatives is more than a limited specified exposure to establish and maintain a derivatives risk management program and appoint a derivatives risk manager. While the new rule became effective February 19, 2021, funds will not be required to fully comply with the new rule until August 19, 2022. It is not currently clear what impact, if any, the new rule will have on the availability, liquidity or performance of derivatives. When fully implemented, the new rule may require changes in how the fund will use derivatives, may adversely affect the fund’s performance and may increase costs related to the fund’s use of derivatives.
Class Disclosure
The Fund has multiple classes of shares designed to meet the needs of different groups of investors. The following table sets forth the differences amongst the classes:
Class | Eligible Investors | Minimum Initial Investments | ||||
| R5 Class | Large institutional investors - sold directly or through intermediary channels. | $ | 250,000 | |||
| Y Class | Large institutional retirement plan investors - sold directly or through intermediary channels. | $ | 100,000 | |||
| Investor Class | All investors using intermediary organizations, such as broker-dealers or retirement plan sponsors. | $ | 2,500 | |||
| Advisor Class | All investors who invest through intermediary organizations, such as broker-dealers or third party administrators. | $ | 2,500 | |||
30
American Beacon Small Cap Value FundSM
Notes to Financial Statements
October 31, 2021
Class | Eligible Investors | Minimum Initial Investments | ||||
| A Class | All investors who invest through intermediary organizations, such as broker-dealers or third party administrator. Retail investors who invest directly through a financial intermediary such as a broker, bank, or registered investment advisor which may include a front-end sales charge and a contingent deferred sales charge (“CDSC”). | $ | 2,500 | |||
| C Class | Retail investors who invest directly through a financial intermediary, such as a broker or through employee directed benefit plans with applicable sales charges which may include CDSC. | $ | 1,000 | |||
| R6 Class | Large institutional retirement plan investors—sold through retirement plan sponsors. | None | ||||
Each class offered by the Trust has equal rights as to assets and voting privileges. Income and non-class specific expenses are allocated daily to each class based on the relative net assets. Realized and unrealized capital gains and losses of each class are allocated daily based on the relative net assets of each class of the respective Fund. Class specific expenses, where applicable, currently include service, distribution, transfer agent fees, and sub-transfer agent fees that vary amongst the classes as described more fully in Note 2.
Significant Accounting Policies
The following is a summary of significant accounting policies, consistently followed by the Fund in preparation of the financial statements. The Fund is considered an investment company and accordingly, follows the investment company accounting and reporting guidance of the FASB Accounting Standards Codification Topic 946, Financial Services – Investment Companies, a part of Generally Accepted Accounting Principles (“U.S. GAAP”).
Security Transactions and Investment Income
Security transactions are recorded as of the trade date for financial reporting purposes. Securities purchased or sold on a when-issued or delayed-delivery basis may be settled beyond a standard settlement period for the security after the trade date.
Dividend income, net of foreign taxes, is recorded on the ex-dividend date, except certain dividends from foreign securities which are recorded as soon as the information is available to the Fund. Tax reclaim accruals are automatically generated on accounting and custody systems at the time of the income event based on the tax databases maintained by the Fund’s custodian. Reconciliations are performed between custody and accounting systems to help ensure reclaim accruals are in line. Interest income, net of foreign taxes, is earned from settlement date, recorded on the accrual basis, and adjusted, if necessary, for accretion of discounts and amortization of premiums. Realized gains (losses) from securities sold are determined based on specific lot identification.
Distributions to Shareholders
The Fund distributes most or all of its net earnings and realized gains, if any, each taxable year in the form of dividends from net investment income and distributions of realized net capital gains and net gains from foreign currency transactions on an annual basis. The Fund does not have a fixed dividend rate and does not guarantee that it will pay any distributions in any particular period. Dividends to shareholders are determined in accordance with federal income tax regulations, which may differ in amount and character from net investment income and realized gains recognized for purposes of U.S. GAAP. To the extent necessary to fully distribute capital gains, the Fund may designate earnings and profits distributed to shareholders on the redemption of shares.
Commission Recapture
The Fund has established brokerage commission recapture arrangements with certain brokers or dealers. If the Fund’s investment advisor chooses to execute a transaction through a participating broker, the broker rebates a portion of the commission back to the Fund. Any collateral benefit received through participation in the commission recapture program is directed exclusively to the Fund. This amount is reported with the net realized gain (loss) in the Fund’s Statement of Operations, if applicable.
31
American Beacon Small Cap Value FundSM
Notes to Financial Statements
October 31, 2021
Allocation of Income, Trust Expenses, Gains, and Losses
Investment income, realized and unrealized gains and losses from investments of the Fund is allocated daily to each class of shares based upon the relative proportion of net assets of each class to the total net assets of the Fund. Expenses directly charged or attributable to the Fund will be paid from the assets of the Fund. Generally, expenses of the Trust will be allocated among and charged to the assets of the Fund on a basis that the Trust’s Board of Trustees (the “Board”) deems fair and equitable, which may be based on the relative net assets of the Fund or nature of the services performed and relative applicability to the Fund.
Use of Estimates
The preparation of financial statements in conformity with U.S. GAAP requires management to make estimates and assumptions that affect the amounts reported in the financial statements and accompanying notes. Actual results may differ from those estimated.
Other
Under the Trust’s organizational documents, its officers and trustees are indemnified against certain liabilities arising out of the performance of their duties to the Trust. In the normal course of business, the Trust enters into contracts that provide indemnification to the other party or parties against potential costs or liabilities. The Trust’s maximum exposure under these arrangements is dependent on claims that may be made in the future and, therefore, cannot be estimated. The Trust has had no prior claims or losses pursuant to any such agreement.
2. Transactions with Affiliates
Management and Investment Sub-Advisory Agreements
The Fund and the Manager are parties to a Management Agreement that obligates the Manager to provide the Fund with investment advisory and administrative services. As compensation for performing the duties under the Management Agreement, the Manager will receive an annualized management fee based on a percentage of the Fund’s average daily net assets that is calculated and accrued daily according to the following schedule:
First $15 billion | 0.35 | % | ||
Next $15 billion | 0.325 | % | ||
Over $30 billion | 0.30 | % |
The Trust, on behalf of the Fund, and the Manager have entered into Investment Advisory Agreements with Barrow, Hanley, Mewhinney & Strauss, LLC; Brandywine Global Investment Management, LLC; Foundry Partners, LLC; Hillcrest Asset Management, LLC; Hotchkis and Wiley Capital Management, LLC; and Mellon Investments Corporation (“Sub-Advisors”) pursuant to which the Fund has agreed to pay an annualized sub-advisory fee that is calculated and accrued daily based on the Fund’s average daily net assets.
The Management and Sub-Advisory Fees paid by the Fund for the year ended October 31, 2021 were as follows:
| Effective Fee Rate | Amount of Fees Paid | |||||||||||
Management Fees | 0.35 | % | $ | 21,141,368 | ||||||||
Sub-Advisor Fees | 0.38 | % | 23,358,692 | |||||||||
|
|
|
| |||||||||
Total | 0.73 | % | $ | 44,500,060 | ||||||||
|
|
|
| |||||||||
As compensation for services provided by the Manager in connection with securities lending activities conducted by the Fund, the lending Fund pays to the Manager, with respect to cash collateral posted by borrowers, a fee of 10% of the net monthly interest income (the gross interest income earned by the investment of cash
32
American Beacon Small Cap Value FundSM
Notes to Financial Statements
October 31, 2021
collateral, less the amount paid to borrowers and related expenses) from such activities and, with respect to loan fees paid by borrowers, a fee of 10% of such loan fees. Securities lending income is generated from the demand premium (if any) paid by the borrower to borrow a specific security and from the return on investment of cash collateral, reduced by negotiated rebate fees paid to the borrower and transaction costs. To the extent that a loan is secured by non-cash collateral, securities lending income is generated as a demand premium reduced by transaction costs. These fees are included in “Income derived from securities lending” and “Management and sub-advisory fees” on the Statement of Operations. During the year ended October 31, 2021, the Manager received securities lending fees of $121,008 for the securities lending activities of the Fund.
Distribution Plans
Separate Distribution Plans (the “Distribution Plans”) have been adopted pursuant to Rule 12b-1 under the Act for the Advisor, A, and C Classes of the Fund. Under the Distribution Plans, as compensation for distribution and shareholder servicing assistance, the Manager receives an annual fee of 0.25% of the average daily net assets of the Advisor and A Classes and 1.00% of the average daily net assets of the C Class. The fee will be payable without regard to whether the amount of the fee is more or less than the actual expenses incurred in a particular month by the Manager for distribution assistance.
Service Plans
The Manager and the Trust entered into a Service Plan that obligates the Manager to oversee additional shareholder servicing of the Investor, Advisor, A, and C Classes of the Fund. As compensation for performing the duties required under the Service Plan, the Manager receives an annualized fee up to 0.25% of the average daily net assets of the A and C Classes, up to 0.25% of the average daily net assets of the Advisor Class, and up to 0.375% of the average daily net assets of the Investor Class of the Fund.
Sub-Transfer Agent Fees
The Manager has entered into agreements, which include servicing agreements, with financial intermediaries that provide recordkeeping, processing, shareholder communications and other services to customers of the intermediaries that hold positions in the R5 and Y Classes of the Fund and has agreed to compensate the intermediaries for providing these services. Intermediaries transact with the Fund primarily through the use of omnibus accounts on behalf of its customers who hold positions in the Fund. Certain services would have been provided by the Fund’s transfer agent and other service providers if the shareholders’ accounts were maintained directly by the Fund’s transfer agent. Accordingly, the Fund, pursuant to Board approval, has agreed to reimburse the Manager for certain non-distribution shareholder services provided by financial intermediaries for the R5 and Y Classes. The reimbursement amounts (sub-transfer agent fees) paid to the Manager are subject to a fee limit of up to 0.10% of an intermediary’s average net assets in the R5 and Y Classes on an annual basis. During the year ended October 31, 2021, the sub-transfer agent fees, as reflected in “Transfer agent fees” on the Statement of Operations, were as follows:
Fund | Sub-Transfer Agent Fees | |||
Small Cap Value | $ | 1,245,020 | ||
As of October 31, 2021, the Fund owed the Manager the following reimbursement of sub-transfer agent fees, as reflected in “Transfer agent fees payable” on the Statement of Assets and Liabilities:
Fund | Reimbursement Sub-Transfer Agent Fees | |||
Small Cap Value | $ | 56,943 | ||
33
American Beacon Small Cap Value FundSM
Notes to Financial Statements
October 31, 2021
Brokerage Commissions
Affiliated entities of a sub-advisor to the Fund received commissions on purchases and sales of the Fund’s portfolio securities totaling $266,393 for the year ended October 31, 2021.
Investments in Affiliated Funds
The Fund may invest in the American Beacon U.S. Government Money Market Select Fund (the “USG Select Fund”). The Fund listed below held the following shares with an October 31, 2021 fair value and dividend income earned from the investment in the USG Select Fund.
Affiliated Security | Type of Transaction | Fund | October 31, 2021 Shares/ Principal | Change in Unrealized Gain (Loss) | Realized Gain (Loss) | Dividend Income | October 31, 2021 Fair Value | |||||||||||||||||||||||||||||||||||||||||
| U.S. Government Money Market Select | Direct | Small Cap Value | $ | 149,026,206 | $ | - | $ | - | $ | 11,919 | $ | 149,026,206 | ||||||||||||||||||||||||||||||||||||
| U.S. Government Money Market Select | Securities Lending | Small Cap Value | 10,739,130 | - | - | N/A | 10,739,130 | |||||||||||||||||||||||||||||||||||||||||
The Fund and the USG Select Fund have the same investment advisor and therefore, are considered to be affiliated. The Manager serves as investment advisor to the USG Select Fund and receives management fees and administrative fees totaling 0.10% of the average daily net assets of the USG Select Fund. During the year ended October 31, 2021, the Manager earned fees on the Fund’s direct investments and securities lending collateral investments in the USG Select Fund as shown below:
Fund | Direct Investments in USG Select Fund | Securities Lending Collateral Investments in USG Select Fund | Total | |||||||||
Small Cap Value | $ | 145,476 | $ | 18,604 | $ | 164,080 | ||||||
Interfund Credit Facility
Pursuant to an exemptive order issued by the SEC, the Fund, along with other registered investment companies having management contracts with the Manager, may participate in a credit facility whereby each fund, under certain conditions, is permitted to lend money directly to and borrow directly from other participating funds for temporary purposes. The interfund credit facility is advantageous to the funds because it provides added liquidity and eliminates the need to maintain higher cash balances to meet redemptions. This situation could arise when shareholder redemptions exceed anticipated volumes and certain funds have insufficient cash on hand to satisfy such redemptions or when sales of securities do not settle as expected, resulting in a cash shortfall for the fund. When the fund liquidates portfolio securities to meet redemption requests, they often do not receive payment in settlement for up to two days (or longer for certain foreign transactions). Redemption requests normally are satisfied on the next business day. The credit facility provides a source of immediate, short-term liquidity pending settlement of the sale of portfolio securities. The credit facility is administered by a credit facility team consisting of professionals from the Manager’s asset management, compliance, and accounting areas who report the activities of the credit facility to the Board. During the year ended October 31, 2021, the Fund participated as a lender and loaned $14,361,692 for 20 days at an average interest rate of 0.82% with interest charges earned of $6,410. During the period ended October 31, 2021, the Fund borrowed $2,891,743 for 1 day at an interest rate of 0.84% with interest charges of $67. These amounts are included in “Interest income” on the Statement of Operations.
34
American Beacon Small Cap Value FundSM
Notes to Financial Statements
October 31, 2021
Expense Reimbursement Plan
The Fund has adopted an Expense Reimbursement Plan whereby the Manager may seek repayment of such fee or voluntary reductions and expense reimbursements. Under the policy, the Manager can be reimbursed by the Fund for any contractual or voluntary fee reductions or expense reimbursements if reimbursement to the Manager (a) occurs within three years from the date of the Manager’s waiver/reimbursement and (b) does not cause the Fund’s annual operating expenses to exceed the lesser of the contractual percentage limit in effect at the time of the waiver/reimbursement or time of recoupment. During the year ended October 31, 2021 there were no waived fees, expenses reimbursed, or recouped expenses.
Sales Commissions
The Fund’s Distributor, Resolute Investment Distributors, Inc. (“RID” or “Distributor”), may receive a portion of Class A sales charges from broker dealers which may be used to offset distribution related expenses. During the year ended October 31, 2021, RID collected $723 from the sale of Class A Shares of the Fund.
A CDSC of 0.50% will be deducted with respect to Class A Shares on certain purchases of $1,000,000 or more that are redeemed in whole or part within 18 months of purchase, unless waived as discussed in the Fund’s Prospectus. Any applicable CDSC will be 0.50% of the lesser of the original purchase price or the value of the redemption of the Class A Shares redeemed. During the year ended October 31, 2021, there were no CDSC fees collected for the Class A Shares of the Fund.
A CDSC of 1.00% will be deducted with respect to Class C Shares redeemed within 12 months of purchase, unless waived as discussed in the Fund’s Prospectus. Any applicable CDSC will be 1.00% of the lesser of the original purchase price or the value of the redemption of the Class C Shares redeemed. During the year ended October 31, 2021, CDSC fees of $132 were collected for Class C Shares of the Fund.
Trustee Fees and Expenses
Effective January 1, 2021, as compensation for their service to the American Beacon Funds Complex, including the Trust (collectively, the “Trusts”), each Trustee is compensated from the Trusts as follows: (1) an annual retainer of $120,000; (2) meeting attendance fee (for attendance in-person or via teleconference) of (a) $12,000 for in person attendance, or $5,000 for telephonic attendance, by Board members for each regularly scheduled or special Board meeting, (b) $2,500 for attendance by Committee members at meetings of the Audit and Compliance Committee and the Investment Committee, (c) $1,000 for attendance by Committee members at meetings of the Nominating and Governance Committee; and (d) $2,500 for attendance by Board members for each special telephonic Board meeting; and (3) reimbursement of reasonable expenses incurred in attending Board meetings, Committee meetings, and relevant educational seminars. For this purpose, the Board considers attendance at regular meetings held by video conference to constitute in-person attendance at a Board meeting. The Trustees also may be compensated for attendance at special Board and/or Committee meetings from time to time. For her service as Board Chair, Ms. Cline receives an additional annual retainer of $50,000. Although she attends several committee meetings at each quarterly Board meeting, she receives only a single $2,500 fee each quarter for her attendance at those meetings. The chairpersons of the Audit and Compliance Committee and the Investment Committee each receive an additional annual retainer of $25,000 and the Chair of the Nominating and Governance Committee receives an additional annual retainer of $10,000.
35
American Beacon Small Cap Value FundSM
Notes to Financial Statements
October 31, 2021
3. Security Valuation and Fair Value Measurements
The price of the Fund’s shares is based on its net asset value (“NAV”) per share. The Fund’s NAV is computed by adding total assets, subtracting all the Fund’s liabilities, and dividing the result by the total number of shares outstanding.
The NAV of each class of the Fund’s shares is determined based on a pro rata allocation of the Fund’s investment income, expenses and total capital gains and losses. The Fund’s NAV per share is determined each business day as of the regular close of trading on the New York Stock Exchange (“NYSE” or “Exchange”), which is typically 4:00 p.m. Eastern Time (“ET”). However, if trading on the NYSE closes at a time other than 4:00 p.m. ET, the Fund’s NAV per share typically would still be determined as of the regular close of trading on the NYSE. The Fund does not price its shares on days that the NYSE is closed. Foreign exchanges may permit trading in foreign securities on days when the Fund is not open for business, which may result in the value of the Fund’s portfolio investments being affected at a time when you are unable to buy or sell shares.
Equity securities, including shares of closed-end funds and exchange-traded funds (“ETFs”), are valued at the last sale price or official closing price taken from the primary exchange in which each security trades. Investments in other mutual funds are valued at the closing NAV per share on the day of valuation. Debt securities are valued at bid quotes from broker/dealers or evaluated bid prices from pricing services, who may consider a number of inputs and factors, such as prices of comparable securities, yield curves, spreads, credit ratings, coupon rates, maturity, default rates, and underlying collateral. Futures are valued based on their daily settlement prices. Exchange-traded and over-the-counter (“OTC”) options are valued at the last sale price. Options with no last sale for the day are priced at mid quote. Swaps are valued at evaluated mid prices from pricing services.
The valuation of securities traded on foreign markets and certain fixed-income securities will generally be based on prices determined as of the earlier closing time of the markets on which they primarily trade unless a significant event has occurred. When the Fund holds securities or other assets that are denominated in a foreign currency, the Fund will normally use the currency exchange rates as of 4:00 p.m. ET.
Securities may be valued at fair value, as determined in good faith and pursuant to procedures approved by the Board, under certain limited circumstances. For example, fair value pricing will be used when market quotations are not readily available or reliable, as determined by the Manager, such as when (i) trading for a security is restricted or stopped; (ii) a security’s trading market is closed (other than customary closings); or (iii) a security has been de-listed from a national exchange. A security with limited market liquidity may require fair value pricing if the Manager determines that the available price does not reflect the security’s true market value. In addition, if a significant event that the Manager determines to affect the value of one or more securities held by the Fund occurs after the close of a related exchange but before the determination of the Fund’s NAV, fair value pricing may be used on the affected security or securities. Securities of small-capitalization companies are also more likely to require a fair value determination using these procedures because they are more thinly traded and less liquid than the securities of larger-capitalization companies. The Fund may fair value securities as a result of significant events occurring after the close of the foreign markets in which the Fund invests as described below. In addition, the Fund may invest in illiquid securities requiring these procedures.
The Fund may use fair value pricing for securities primarily traded in non-U.S. markets because most foreign markets close well before the Fund’s pricing time of 4:00 p.m. ET. The earlier close of these foreign markets gives rise to the possibility that significant events, including broad market moves, may have occurred in the interim and may materially affect the value of those securities. If the Manager determines that the last quoted prices of non-U.S. securities will, in its judgment, materially affect the value of some or all its portfolio securities, the Manager can adjust the previous closing prices to reflect what it believes to be the fair value of the securities as of the close of the Exchange. In deciding whether it is necessary to adjust closing prices to reflect fair value, the Manager reviews a variety of factors, including developments in foreign markets, the performance of U.S. securities markets, and the performance of instruments trading in U.S. markets that represent foreign securities
36
American Beacon Small Cap Value FundSM
Notes to Financial Statements
October 31, 2021
and baskets of foreign securities. These securities are fair valued using a pricing service, using methods approved by the Board, that considers the correlation of the trading patterns of the foreign security to intraday trading in the U.S. markets, based on indices of domestic securities and other appropriate indicators such as prices of relevant American Depositary Receipts (“ADRs”) and futures contracts. The Valuation Committee, established by the Board, may also fair value securities in other situations, such as when a particular foreign market is closed but the Fund is open. The Fund uses outside pricing services to provide closing prices and information to evaluate and/or adjust those prices. As a means of evaluating its security valuation process, the Valuation Committee routinely compares closing prices, the next day’s opening prices in the same markets and adjusted prices.
Attempts to determine the fair value of securities introduce an element of subjectivity to the pricing of securities. As a result, the price of a security determined through fair valuation techniques may differ from the price quoted or published by other sources and may not accurately reflect the market value of the security when trading resumes. If a reliable market quotation becomes available for a security formerly valued through fair valuation techniques, the Manager compares the new market quotation to the fair value price to evaluate the effectiveness of the Fund’s fair valuation procedures. If any significant discrepancies are found, the Manager may adjust the Fund’s fair valuation procedures.
Valuation Inputs
Various inputs may be used to determine the fair value of the Fund’s investments. These inputs are summarized in three broad levels for financial statement purposes. The inputs or methodologies used to value securities are not necessarily an indication of the risk associated with investing in those securities.
| Level 1 | - | Quoted prices in active markets for identical securities. | ||
| Level 2 | - | Prices determined using other significant observable inputs. These may include quoted prices for similar securities, interest rates, prepayment speeds, credit risk, and others. | ||
| Level 3 | - | Prices determined using other significant unobservable inputs. Unobservable inputs reflect the Fund’s own assumptions about the factors market participants would use in pricing an investment. | ||
Level 1 and Level 2 trading assets and trading liabilities, at fair value
Common stocks, ETFs, preferred securities and financial derivative instruments, such as futures contracts that are traded on a national securities exchange, are stated at the last reported sale or settlement price on the day of valuation. To the extent these securities are actively traded and valuation adjustments are not applied, they are categorized as Level 1 of the fair value hierarchy. Preferred securities and other equities traded on inactive markets or valued by reference to similar instruments are generally categorized as Level 2 of the fair value hierarchy.
Investments in registered open-end investment management companies will be valued based upon the NAVs of such investments and are categorized as Level 1 of the fair value hierarchy.
Level 3 trading assets and trading liabilities, at fair value
The valuation techniques and significant inputs used in determining the fair values of financial instruments classified as Level 3 of the fair value hierarchy are as follows.
Securities and other assets for which market quotes are not readily available are valued at fair value as determined in good faith by the Board or persons acting at their direction and may be categorized as Level 3 of the fair value hierarchy.
Market quotes are considered not readily available in circumstances where there is an absence of current or reliable market-based data (e.g., trade information or broker quotes), including where events occur after the close
37
American Beacon Small Cap Value FundSM
Notes to Financial Statements
October 31, 2021
of the relevant market, but prior to the Exchange close, that materially affect the values of the Fund’s securities or assets. In addition, market quotes are considered not readily available when, due to extraordinary circumstances, the exchanges or markets on which the securities trade, do not open for trading for the entire day and no other market prices are available. The Board has delegated to the Manager the responsibility for monitoring significant events that may materially affect the fair values of the Fund’s securities or assets and for determining whether the value of the applicable securities or assets should be re-evaluated in light of such significant events.
The Board has adopted methods for valuing securities and other assets in circumstances where market quotes are not readily available, and has delegated the responsibility for applying the valuation methods to the Manager. For instances in which daily market quotes are not readily available, investments may be valued pursuant to guidelines established by the Board. In the event that the security or asset cannot be valued, pursuant to one of the valuation methods established by the Board, the fair value of the security or asset will be determined in good faith by the Valuation Committee, generally based upon recommendations provided by the Manager.
When the Fund uses fair valuation methods applied by the Manager that use significant unobservable inputs to determine its NAV, the securities priced using this methodology are categorized as Level 3 of the fair value hierarchy. These methods may require subjective determinations about the value of a security. While the Trust’s policy is intended to result in a calculation of the Fund’s NAV that fairly reflects security values as of the time of pricing, the Trust cannot guarantee that values determined by the Board or persons acting at their direction would accurately reflect the price that the Fund could obtain for a security if it were to dispose of that security as of the time of pricing (for instance, in a forced or distressed sale). The prices used by the Fund may differ from the value that would be realized if the securities were sold.
4. Securities and Other Investments
Common Stock
Common stock generally takes the form of shares in a corporation which represent an ownership interest. It ranks below preferred stock and debt securities in claims for dividends and for assets of the company in a liquidation or bankruptcy. The value of a company’s common stock may fall as a result of factors directly relating to that company, such as decisions made by its management or decreased demand for the company’s products or services. A stock’s value may also decline because of factors affecting not just the company, but also companies in the same industry or sector. The price of a company’s stock may also be affected by changes in financial markets that are relatively unrelated to the company, such as changes in interest rates, currency exchange rates or industry regulation. Companies that elect to pay dividends on their common stock generally only do so after they invest in their own business and make required payments to bondholders and on other debt and preferred stock. Therefore, the value of a company’s common stock will usually be more volatile than its bonds, other debt and preferred stock. Common stock may be exchange-traded or OTC. OTC stock may be less liquid than exchange-traded stock.
Depositary Receipts and U.S. Dollar-Denominated Foreign Stocks Traded on U.S. Exchanges
ADRs are U.S. dollar-denominated receipts issued generally by domestic banks and represent the deposit with the bank of a security of a foreign issuer. Depositary receipts may not be denominated in the same currency as the securities into which they may be converted. Investing in depositary receipts entails substantially the same risks as direct investment in foreign securities. There is generally less publicly available information about foreign companies and there may be less governmental regulation and supervision of foreign stock exchanges, brokers, and listed companies. In addition, such companies may use different accounting and financial standards (and certain currencies may become unavailable for transfer from a foreign currency), resulting in the Fund’s possible inability to convert immediately into U.S. currency proceeds realized upon the sale of portfolio securities of the affected foreign companies. In addition, the Fund may invest in unsponsored depositary receipts, the issuers of which are not obligated to disclose material information about the underlying securities to investors in the United States. Ownership of unsponsored depositary receipts may not entitle the Fund to the same benefits and rights as ownership of a sponsored depositary receipt or the underlying security.
38
American Beacon Small Cap Value FundSM
Notes to Financial Statements
October 31, 2021
Other Investment Company Securities and Other Exchange-Traded Products
The Fund at times may invest in shares of other investment companies, including open-end funds, closed-end funds, business development companies (“BDCs”), ETFs, unit investment trusts, and other investment companies of the Trust. The Fund may invest in securities of an investment company advised by the Manager or the Sub-Advisor. Investments in the securities of other investment companies may involve duplication of advisory fees and certain other expenses. By investing in another investment company, the Fund becomes a shareholder of that investment company. As a result, Fund shareholders indirectly will bear the Fund’s proportionate share of the fees and expenses paid by shareholders of the other investment company, in addition to the fees and expenses Fund shareholders directly bear in connection with the Fund’s own operations. These other fees and expenses, if applicable, are reflected as Acquired Fund Fees and Expenses and are included in the Fees and Expenses Table for the Fund in its Prospectus. Investment in other investment companies may involve the payment of substantial premiums above the value of such issuer’s portfolio securities.
Publicly Traded Partnerships/Master Limited Partnerships (“MLPs”)
The Fund may invest in publicly traded partnerships such as MLPs. MLPs issue units that are registered with the SEC and are freely tradable on a securities exchange or in the OTC market. An MLP may have one or more general partners, who conduct the business, and one or more limited partners, who contribute capital. The general partner or partners are jointly and severally responsible for the liabilities of the MLP. (An MLP also may be an entity similar to a limited partnership, such as an LLC, which has one or more managers or managing members and non-managing members (who are like limited partners)). The Fund invests in an MLP as a limited partner and normally would not be liable for the debts of an MLP beyond the amount the Fund has invested therein, but it would not be shielded to the same extent that a shareholder of a corporation would be. In certain instances, creditors of an MLP would have the right to seek a return of capital that had been distributed to a limited partner. The right of an MLP’s creditors would continue even after the Fund had sold its investment in the partnership. MLPs typically invest in real estate and oil and gas equipment leasing assets, but they also finance entertainment, research and development, and other projects.
Real Estate Investment Trusts (“REITs”)
REITs are pooled investment vehicles that own, and often operate, income producing real estate (known as “equity REITs”) or invest in mortgages secured by loans on such real estate (known as “mortgage REITs”) or both (known as “hybrid REITs”). REITs are susceptible to the risks associated with direct ownership of real estate, such as declines in property values, increase in property taxes, operating expenses, rising interest rates or overbuilding, zoning changes, and losses from casualty or condemnation. REITs typically are subject to management fees and other expenses that are separate from those of the Fund.
5. Financial Derivative Instruments
The Fund may utilize derivative instruments to gain market exposure on cash balances or reduce market exposure in anticipation of liquidity needs. When considering the Fund’s use of derivatives, it is important to note that the Fund does not use derivatives for the purpose of creating financial leverage.
Futures Contracts
A futures contract is a contract to purchase or sell a particular security, or the cash value of an asset, such as securities, indices, or currencies, at a specified future date at a price agreed upon when the contract is made. Under many such contracts, no delivery of the actual underlying asset is required. Rather, upon the expiration of the contract, settlement is made by exchanging cash in an amount equal to the difference between the contract price and the closing price of the asset (e.g., a security or an index) at expiration, net of the initial and variation margin that was previously paid. A Treasury futures contract is a contract for the future delivery of a U.S. Treasury
39
American Beacon Small Cap Value FundSM
Notes to Financial Statements
October 31, 2021
security. An equity index futures contract is based on the value of an underlying index. The Fund may, from time to time, use futures positions to equitize cash and expose its portfolio to changes in securities prices or index prices. This can magnify gains and losses in the Fund. The Fund also may have to sell assets at inopportune times to satisfy its settlement or collateral obligations. The risks associated with the use of futures contracts also include that there may be an imperfect correlation between the changes in market value of the prices of futures contracts and the assets underlying such contracts and that there may not be a liquid secondary market for a futures contract.
During the year ended October 31, 2021, the Fund entered into futures contracts primarily for exposing cash to markets.
The Fund’s average futures contracts outstanding fluctuate throughout the operating year as required to meet strategic requirements. The following table illustrates the average quarterly volume of futures contracts. For the purpose of this disclosure, volume is measured by contracts outstanding at each quarter end.
Average Futures Contracts Outstanding | ||||
Fund | Year Ended October 31, 2021 | |||
Small Cap Value | 1,235 | |||
The following is a summary of the fair valuations of the Fund’s derivative instruments categorized by risk exposure(1):
| Fair values of financial instruments on the Statement of Assets and Liabilities as of October 31, 2021: |
| |||||||||||||||||||||||||||||||||||||||||||
| Derivatives not accounted for as hedging instruments |
|
| ||||||||||||||||||||||||||||||||||||||||||
Assets: | Credit contracts | Foreign exchange contracts | Commodity contracts | Interest rate contracts | Equity contracts | Total | ||||||||||||||||||||||||||||||||||||||
| Receivable for variation margin from open futures contracts(2) | $ | - | $ | - | $ | - | $ | - | $ | 3,429,594 | $ | 3,429,594 | ||||||||||||||||||||||||||||||||
| The effect of financial derivative instruments on the Statement of Operations as of October 31, 2021: |
| ||||||||||||||||||||||||||||||||||||||||||||||||||||||
| Derivatives not accounted for as hedging instruments |
|
| |||||||||||||||||||||||||||||||||||||||||||||||||||||
Realized gain (loss) from derivatives | Credit contracts | Foreign exchange contracts | Commodity contracts | Interest rate contracts | Equity contracts | Total | |||||||||||||||||||||||||||||||||||||||||||||||||
| Futures contracts | $ | - | $ | - | $ | - | $ | - | $ | 42,199,986 | $ | 42,199,986 | |||||||||||||||||||||||||||||||||||||||||||
Net change in unrealized appreciation | Credit contracts | Foreign exchange contracts | Commodity contracts | Interest rate contracts | Equity contracts | Total | |||||||||||||||||||||||||||||||||||||||||||||||||
| Futures contracts | $ | - | $ | - | $ | - | $ | - | $ | 4,188,616 | $ | 4,188,616 | |||||||||||||||||||||||||||||||||||||||||||
(1) See Note 3 in the Notes to Financial Statements for additional information.
(2) Includes cumulative appreciation (depreciation) of futures contracts as reported in the Fund’s Schedule of Investments footnotes. Only current day’s variation margin is reported within the Statement of Assets and Liabilities.
Offsetting Assets and Liabilities
The Fund is a party to enforceable master netting agreements between brokers and counterparties which provide for the right to offset under certain circumstances. The Fund employs multiple counterparties and has elected not to offset qualifying financial and derivative instruments on the Statement of Assets and Liabilities, as such all financial and derivative instruments are presented on a gross basis. The impacts of netting arrangements that provide the right to offset are detailed below, if applicable. The net amount represents the net receivable or payable that would be due from or to the counterparty in the event of default. Exposure from borrowings and other financing agreements such as repurchase agreements can only be netted across transactions governed by the
40
American Beacon Small Cap Value FundSM
Notes to Financial Statements
October 31, 2021
same Master Agreement with the same legal entity. All amounts reported below represent the balance as of the report date, October 31, 2021.
| Offsetting of Financial and Derivative Assets as of October 31, 2021: | ||||||||||||
| Assets | Liabilities | ||||||||||
| Futures Contracts(1) | $ | 3,429,594 | $ | - | ||||||||
|
|
|
| |||||||||
| Total derivative assets and liabilities in the Statement of Assets and Liabilities | $ | 3,429,594 | $ | - | ||||||||
|
|
|
| |||||||||
| Derivatives not subject to a Master Netting Agreement or similar agreement (“MNA”) | $ | (3,429,594 | ) | $ | - | |||||||
|
|
|
| |||||||||
| Remaining Contractual Maturity of the Agreements As of October 31, 2021 | ||||||||||||||||||||||||||||||||||||
| Overnight and Continuous | <30 days | Between 30 & 90 days | >90 days | Total | ||||||||||||||||||||||||||||||||
Securities Lending Transactions | ||||||||||||||||||||||||||||||||||||
Common Stocks | $ | 10,739,130 | $ | - | $ | - | $ | - | $ | 10,739,130 | ||||||||||||||||||||||||||
|
|
|
|
|
|
|
|
|
| |||||||||||||||||||||||||||
Total Borrowings | $ | 10,739,130 | $ | - | $ | - | $ | - | $ | 10,739,130 | ||||||||||||||||||||||||||
|
|
|
|
|
|
|
|
|
| |||||||||||||||||||||||||||
Gross amount of recognized liabilities for securities lending transactions |
| $ | 10,739,130 | |||||||||||||||||||||||||||||||||
|
| |||||||||||||||||||||||||||||||||||
(1) Includes cumulative appreciation or (depreciation) of futures contracts as reported in the Schedule of Investments footnotes. Only current day’s variation margin is reported within the Statements of Assets and Liabilities.
6. Principal Risks
Investing in the Fund may involve certain risks including, but not limited to, those described below.
Equity Investments Risk
Equity securities are subject to market risk. The Fund’s investments in equity securities may include common stocks, preferred stocks, securities convertible into or exchangeable for common stocks, REITs, depositary receipts, and U.S. dollar-denominated foreign stocks traded on U.S. exchanges. Such investments may expose the Fund to additional risk. The value of a company’s common stock may fall as a result of factors affecting the company, companies in the same industry or sector, or the financial markets overall. Common stock generally is subordinate to preferred stock upon the liquidation or bankruptcy of the issuing company. Preferred stocks and convertible securities are sensitive to movements in interest rates. Preferred stocks may be less liquid than common stocks and, unlike common stocks, participation in the growth of an issuer may be limited. Distributions on preferred stocks generally are payable at the discretion of an issuer and after required payments to bond holders. Convertible securities are subject to the risk that the credit standing of the issuer may have an effect on the convertible securities’ investment value. Investments in REITs are subject to the risks associated with investing in the real estate industry such as adverse developments affecting the real estate industry and real property values. Depositary receipts and U.S. dollar-denominated foreign stocks traded on U.S. exchanges are subject to certain of the risks associated with investing directly in foreign securities, including, but not limited to, currency exchange rate fluctuations, political and financial instability in the home country of a particular depositary receipt, less liquidity and more volatility, less government regulation and supervision and delays in transaction settlement.
Foreign Investing Risk
Non-U.S. investments carry potential risks not associated with U.S. investments. Such risks include, but are not limited to: (1) currency exchange rate fluctuations, (2) political and financial instability, (3) less liquidity, (4) lack of uniform accounting, auditing and financial reporting standards, (5) increased price volatility, (6) less government regulation and supervision of foreign stock exchanges, brokers and listed companies, and (7) delays in transaction settlement in some foreign markets. To the extent the Fund invests a significant portion of its assets in securities of a single country or region, it is more likely to be affected by events or conditions of that country or region.
41
American Beacon Small Cap Value FundSM
Notes to Financial Statements
October 31, 2021
Futures Contracts Risk
Futures contracts are derivative instruments where one party pays a fixed price for an agreed amount of securities or other underlying assets at an agreed date. The use of such derivative instruments may expose the Fund to additional risks that it would not be subject to if it invested directly in the securities underlying those derivatives. There may at times be an imperfect correlation between the movement in the prices of futures contracts and the value of their underlying instruments or indexes. There can be no assurance that any strategy used will succeed. There also can be no assurance that, at all times, a liquid market will exist for offsetting a futures contract that the Fund has previously bought or sold and this may result in the inability to close a futures contract when desired. Futures contracts may experience potentially dramatic price changes, which will increase the volatility of the Fund and may involve a small investment of cash (the amount of initial and variation margin) relative to the magnitude of the risk assumed (the potential increase or decrease in the price of the futures contract).
Market Risk
The Fund is subject to the risk that the securities markets will move down, sometimes rapidly and unpredictably, based on overall economic conditions and other factors, which may negatively affect the Fund’s performance. Equity securities generally have greater price volatility than fixed income securities, although under certain market conditions fixed income securities may have comparable or greater price volatility. During a general downturn in the securities markets, multiple assets may decline in value simultaneously. In some cases, traditional market participants have been less willing to make a market in some types of debt instruments, which has affected the liquidity of those instruments. During times of market turmoil, investors tend to look to the safety of securities issued or backed by the U.S. Treasury, causing the prices of these securities to rise and the yields to decline. Reduced liquidity in fixed income and credit markets may negatively affect many issuers worldwide. Prices in many financial markets have increased significantly over the last decade, but there have also been periods of adverse market and financial developments and cyclical change during that timeframe, which have resulted in unusually high levels of volatility in domestic and foreign financial markets that has caused losses for investors and may occur again in the future, particularly if markets enter a period of uncertainty or economic weakness. The value of a security may decline due to adverse issuer-specific conditions, general market conditions unrelated to a particular issuer, or factors that affect a particular industry or industries. Changes in the financial condition of a single issuer or market segment also can impact the market as a whole.
Geopolitical and other events, including war, terrorism, economic uncertainty, trade disputes, pandemics, public health crises, natural disasters and related events have led, and in the future may continue to lead, to instability in world economies and markets generally and reduced liquidity in equity, credit and fixed-income markets, which may disrupt economies and markets and adversely affect the value of your investment. Adverse market events may also lead to increased shareholder redemptions, which could cause the Fund to experience a loss or difficulty in selling investments to meet redemption requests by shareholders and may increase the Fund’s portfolio turnover, which will increase the costs that the Fund incurs and lower the Fund’s performance. Even when securities markets perform well, there is no assurance that the investments held by the Fund will increase in value along with the broader market.
Policy changes by the U.S. government and/or Federal Reserve and political events within the U.S. and abroad, including the U.S. presidential election, the U.S. government’s inability at times to agree on a long-term budget and deficit reduction plan, the threat of a federal government shutdown and threats not to increase the federal government’s debt limit, may affect investor and consumer confidence and may adversely impact financial markets and the broader economy, perhaps suddenly and to a significant degree. The severity or duration of adverse economic conditions may also be affected by policy changes made by governments or quasi-governmental organizations. Global economies and financial markets are becoming increasingly interconnected, which increases the possibility of many markets being affected by events in a single country or events affecting a single or small number of issuers.
42
American Beacon Small Cap Value FundSM
Notes to Financial Statements
October 31, 2021
Markets and market participants are increasingly reliant upon both publicly available and proprietary information data systems. Data imprecision, software or other technology malfunctions, programming inaccuracies, unauthorized use or access, and similar circumstances may impair the performance of these systems and may have an adverse impact upon a single issuer, a group of issuers, or the market at large. In certain cases, an exchange or market may close or issue trading halts on either specific securities or even the entire market, which may result in the Fund being, among other things, unable to buy or sell certain securities or financial instruments or accurately price its investments. These fluctuations in securities prices could be a sustained trend or a drastic movement. The financial markets generally move in cycles, with periods of rising prices followed by periods of declining prices. The value of your investment may reflect these fluctuations.
Multiple Sub-Advisor Risk
The Manager may allocate the Fund’s assets among multiple sub-advisors, each of which is responsible for investing its allocated portion of the Fund’s assets. To a significant extent, the Fund’s performance will depend on the success of the Manager in allocating the Fund’s assets to sub-advisors and its selection and oversight of the sub-advisors. Because each sub-advisor manages its allocated portion of the Fund independently from another sub-advisor, the same security may be held in different portions of the Fund, or may be acquired for one portion of the Fund at a time when a sub-advisor to another portion deems it appropriate to dispose of the security from that other portion, resulting in higher expenses without accomplishing any net result in the Fund’s holdings. Similarly, under some market conditions, one sub-advisor may believe that temporary, defensive investments in short-term instruments or cash are appropriate when another sub-advisor believes continued exposure to the equity or debt markets is appropriate for its allocated portion of the Fund. Because each sub-advisor directs the trading for its own portion of the Fund, and does not aggregate its transactions with those of the other sub-advisors, the Fund may incur higher brokerage costs than would be the case if a single sub-adviser were managing the entire Fund. In addition, while the Manager seeks to allocate the Fund’s assets among the Fund’s sub-advisors in a manner that it believes is consistent with achieving the Fund’s investment objective(s), the Manager may be subject to potential conflicts of interest in allocating the Fund’s assets among sub-advisors, due to factors that could impact the Manager’s revenues and profits.
Other Investment Companies Risk
The Fund may invest in shares of other registered investment companies, including money market funds and ETFs. To the extent that the Fund invests in shares of other registered investment companies, the Fund will indirectly bear the fees and expenses, including for example, advisory and administrative fees, charged by those investment companies in addition to the Fund’s direct fees and expenses and will be subject to the risks associated with investments in those companies. For example, the Fund’s investments in money market funds are subject to interest rate risk, credit risk, and market risk. The Fund must rely on the investment company in which it invests to achieve its investment objective. If the investment company fails to achieve its investment objective, the value of the Fund’s investment may decline, adversely affecting the Fund’s performance. ETFs are subject to the following risks that do not apply to conventional funds: (1) the market price of an ETF’s shares may trade at a discount or premium to its NAV; (2) an active trading market for an ETF’s shares may not develop or be maintained; or (3) trading of an ETF’s shares may be halted if the listing exchange’s officials deem such action appropriate, the shares are delisted from the exchange, or the activation of market-wide “circuit breakers” (which are tied to large decreases in stock prices) halts stock trading generally. An ETF that tracks an index may not precisely replicate the returns of its benchmark index. To the extent the Fund invests in other investment companies that invest in equity securities, fixed-income securities and/or foreign securities, or that track an index, the Fund is subject to the risks associated with the underlying investments held by the investment company or the index fluctuations to which the investment company is subject. ETFs have expenses associated with their operation, typically including advisory fees.
43
American Beacon Small Cap Value FundSM
Notes to Financial Statements
October 31, 2021
Recent Market Events Risk
An outbreak of infectious respiratory illness caused by a novel coronavirus, known as COVID-19, was first detected in China in December 2019 and has subsequently spread globally. Transmission of COVID-19 and efforts to contain its spread have resulted, and may continue to result, in significant disruptions to business operations, widespread business closures and layoffs, travel restrictions, closed international, national and local borders, prolonged quarantines and stay-at-home orders, disruption of and delays in healthcare service preparation and delivery, service and event cancellations, and lower consumer demand, as well as general concern and uncertainty that has negatively affected the global economy. The impact of the COVID-19 pandemic may last for an extended period of time and may result in a sustained economic downturn or recession. The U.S. Federal Reserve and the U.S. federal government have taken numerous measures to address the economic impact of the COVID-19 pandemic and stimulate the U.S. economy. The ultimate effects of these and other efforts that may be taken may not be known for some time.
The Federal Reserve has spent hundreds of billions of dollars to keep credit flowing through short-term money markets. Amid the Federal Reserve’s ongoing efforts, concerns about the markets’ dependence on the Federal Reserve’s provision of liquidity have grown. Future legislative, regulatory and policy changes may result in more restrictions on international trade, less stringent prudential regulation of certain players in the financial markets, and significant new investments in infrastructure and national defense. High public debt in the U.S. and other countries creates ongoing systemic and market risks and policymaking uncertainty.
A rise in protectionist trade policies, slowing global economic growth, risks associated with the United Kingdom’s departure from the European Union on December 31, 2020, commonly referred to as “Brexit,” and a trade agreement between the United Kingdom and the European Union, the risks associated with ongoing trade negotiations with China, the possibility of changes to some international trade agreements, tensions or open conflict between nations, or political or economic dysfunction within some nations that are major producers of oil could affect the economies of many nations, including the United States, in ways that cannot necessarily be foreseen at the present time.
Economists and others have expressed increasing concern about the potential effects of global climate change on property and security values. Certain issuers, industries and regions may be adversely affected by the impacts of climate change, including on the demand for and the development of goods and services and related production costs, and the impacts of legislation, regulation and international accords related to climate change, as well as any indirect consequences of regulation or business trends driven by climate change.
Sector Risk
Sector risk is the risk associated with the Fund holding a significant amount of investments in similar businesses, which would be similarly affected by particular economic or market events, which may, in certain circumstances, cause the value of the equity and debt securities of companies in a particular sector of the market to change. To the extent the Fund has substantial holdings within a particular sector, the risks to the Fund associated with that sector increase.
To the extent the Fund invests significantly in the financial services sector, the value of the Fund’s shares may be particularly vulnerable to factors affecting that sector, such as the availability and cost of capital funds, changes in interest rates, the rate of corporate and consumer debt defaults, extensive government regulation and price competition. The value of the Fund’s shares could experience significantly greater volatility than investment companies investing more broadly.
44
American Beacon Small Cap Value FundSM
Notes to Financial Statements
October 31, 2021
Securities Lending Risk
The Fund may lend its portfolio securities to brokers, dealers and financial institutions in order to obtain additional income. Borrowers of the Fund’s securities provide collateral either in the form of cash, which the Fund reinvests in securities or in the form of non-cash collateral consisting of securities issued or guaranteed by the U.S. government or one of its agencies or instrumentalities. The Fund will be responsible for the risks associated with the investment of cash collateral, including any collateral invested in an affiliated money market fund. The Fund may lose money on its investment of cash collateral or may fail to earn sufficient income on its investment to cover its payment to the borrower of a pre-negotiated fee or “rebate” for the use of that cash collateral in connection with the loan. The Fund could also lose money due to a decline in the value of non-cash collateral. In addition, delays may occur in the recovery of securities from borrowers, which could interfere with the Fund’s ability to vote proxies or to settle transactions or could result in increased costs. Moreover, if the borrower becomes subject to insolvency or similar proceedings, the Fund could incur delays in its ability to enforce its rights in its collateral. There also is a risk that a borrower may default on its obligation to return loaned securities at a time when the value of the Fund’s collateral is inadequate. Although the Fund’s securities lending agent may indemnify the Fund against that risk, it is also possible that the securities lending agent will be unable to satisfy its indemnification obligations. In any case in which the loaned securities are not returned to the Fund before an ex-dividend date, whether or not due to a default by the borrower, the payment in lieu of the dividend that the Fund receives from the securities’ borrower would not be treated as a dividend for federal income tax purposes and thus would not qualify for treatment as “qualified dividend income.”
7. Federal Income and Excise Taxes
It is the policy of the Fund to qualify as a regulated investment company (“RIC”), by complying with all applicable provisions of Subchapter M of the Internal Revenue Code, as amended, and to make distributions of taxable income sufficient to relieve it from substantially all federal income and excise taxes. For federal income tax purposes, the Fund is treated as a single entity for the purpose of determining such qualification.
The Fund does not have any unrecorded tax liabilities in the accompanying financial statements. Each of the tax years in the four year period ended October 31, 2021 remain subject to examination by the Internal Revenue Service. If applicable, the Fund recognizes interest accrued related to unrecognized tax benefits in interest expense and penalties in “Other expenses” on the Statement of Operations.
The Fund may be subject to taxes imposed by countries in which it invests. Such taxes are generally based on returns of income earned or gains realized or repatriated. Taxes are accrued and applied to net investment income, net realized capital gains and net unrealized appreciation (depreciation), as applicable, as the income is earned or capital gains are recorded.
Dividends are categorized in accordance with income tax regulations which may treat certain transactions differently than U.S. GAAP. Accordingly, the character of distributions and composition of net assets for tax purposes may differ from those reflected in the accompanying financial statements.
45
American Beacon Small Cap Value FundSM
Notes to Financial Statements
October 31, 2021
The tax character of distributions paid were as follows:
| Year Ended October 31, 2021 | Year Ended October 31, 2020 | |||||||||||
Distributions paid from: | ||||||||||||
Ordinary income* | ||||||||||||
R5 Class | $ | 30,252,473 | $ | 49,800,258 | ||||||||
Y Class | 1,814,421 | 2,919,990 | ||||||||||
Investor Class | 2,372,133 | 3,994,989 | ||||||||||
Advisor Class | 272,130 | 461,474 | ||||||||||
A Class | 318,938 | 487,603 | ||||||||||
C Class | - | 30,237 | ||||||||||
R6 Class | 13,695,714 | 16,815,221 | ||||||||||
Long-term capital gains | ||||||||||||
R5 Class | - | 27,830,075 | ||||||||||
Y Class | - | 1,749,486 | ||||||||||
Investor Class | - | 3,060,361 | ||||||||||
Advisor Class | - | 427,693 | ||||||||||
A Class | - | 432,651 | ||||||||||
C Class | - | 96,984 | ||||||||||
R6 Class | - | 9,182,466 | ||||||||||
|
|
|
| |||||||||
Total distributions paid | $ | 48,725,809 | $ | 117,289,488 | ||||||||
|
|
|
| |||||||||
* For tax purposes, short-term capital gains are considered ordinary income distributions.
As of October 31, 2021, $83,410,224 long-term capital gains distributions designated for federal income tax purposes are due to the use of accumulated earnings and profits distributed to shareholders upon redemption of shares.
As of October 31, 2021, the components of distributable earnings (deficits) on a tax basis were as follows:
Fund | Tax Cost | Unrealized Appreciation | Unrealized (Depreciation) | Net Unrealized Appreciation (Depreciation) | ||||||||||||||||||||||||
Small Cap Value | $ | 4,463,318,441 | $ | 1,666,212,514 | $ | (187,175,818 | ) | $ | 1,479,036,696 | |||||||||||||||||||
Fund | Net Unrealized Appreciation (Depreciation) | Undistributed Ordinary Income | Undistributed Long-Term Capital Gains | Accumulated Capital and Other (Losses) | Other Temporary Differences | Distributable Earnings | ||||||||||||||||||||||||||||||||||||||
Small Cap Value | $ | 1,479,036,696 | $ | 280,207,572 | $ | 345,118,681 | $ | - | $ | - | $ | 2,104,362,949 | ||||||||||||||||||||||||||||||||
Financial reporting records are adjusted for permanent book/tax differences to reflect tax character. Financial records are not adjusted for temporary differences. The temporary differences between financial reporting and tax-basis reporting of unrealized appreciation (depreciation) are attributable primarily to the tax deferral of losses from wash sales, the realization for tax purposes of unrealized gains (losses) on certain derivative instruments, and reclassifications of income from investments in real estate investment securities and publicly traded partnerships.
Due to inherent differences in the recognition of income, expenses, and realized gains (losses) under U.S. GAAP and federal income tax regulations, permanent differences between book and tax reporting have been identified and appropriately reclassified on the Statement of Assets and Liabilities.
Shareholders of the Fund elected to receive securities rather than cash for their redemption proceeds. The Fund realized gains of $9,196,460 as a result of the in kind distribution, as disclosed on the Statement of Operations for the year ended October 31, 2021. These gains were not recognized for federal income tax purposes.
46
American Beacon Small Cap Value FundSM
Notes to Financial Statements
October 31, 2021
Accordingly, the following amounts represent current year permanent differences derived from equalization, redemptions in kind, and nondeductible expenses from investments in publicly traded partnerships as of October 31, 2021:
Fund | Paid-In-Capital | Distributable Earnings/(Deficits) | ||||||||||
Small Cap Value | $ | 92,523,746 | $ | (92,523,746 | ) | |||||||
For federal income tax purposes, the Fund measures its capital loss carryforwards annually at October 31, its fiscal year end. Capital loss carryforwards retain their character as short-term and/or long-term and may be carried forward and applied against future realized capital gains with no expiration date.
The Fund utilized $118,678,194 short-term and $198,805,194 long-term capital loss carryforwards and did not have any remaining capital loss carryforwards as of October 31, 2021.
8. Investment Transactions
The aggregate cost of purchases and proceeds from sales and maturities of investments, other than short-term obligations, for the year ended October 31, 2021 were as follows:
Fund | Purchases (non-U.S. Government Securities) | Sales (non-U.S. Government Securities) | ||||||||||
Small Cap Value | $ | 2,754,359,571 | $ | 3,792,434,947 | ||||||||
A summary of the Fund’s transactions in the USG Select Fund for the year ended October 31, 2021 were as follows:
Fund | Type of Transaction | October 31, 2020 Shares/Fair Value | Purchases | Sales | October 31, 2021 Shares/Fair Value | |||||||||||||||||||||||||||||
| Small Cap Value | Direct | $ | 110,411,904 | $ | 2,248,630,175 | $ | 2,210,015,873 | $ | 149,026,206 | |||||||||||||||||||||||||
| Small Cap Value | Securities Lending | 25,629,116 | 227,115,824 | 242,005,810 | 10,739,130 | |||||||||||||||||||||||||||||
9. Securities Lending
The Fund may lend its securities to qualified financial institutions, such as certain broker-dealers, to earn additional income. The borrowers are required to secure their loans continuously with collateral in an amount at least equal to the fair value of the securities loaned, initially in an amount at least equal to 102% of the fair value of domestic securities loaned and 105% of the fair value of international securities loaned. Collateral is monitored and marked-to-market daily. Daily mark-to-market amounts are required to be paid to the borrower or received from the borrower by the end of the following business day. This one day settlement for mark-to-market amounts may result in the collateral being temporarily less than the value of the securities on loan or temporarily more than the required minimum collateral.
To the extent that a loan is collateralized by cash, such cash collateral shall be invested by the securities lending agent (the “Agent”) in money market mutual funds and other short-term investments, provided the investments meet certain quality and diversification requirements. Securities purchased with cash collateral proceeds are listed in the Fund’s Schedule of Investments and the collateral is shown on the Statement of Assets and Liabilities as a payable.
Securities lending income is generated from the demand premium (if any) paid by the borrower to borrow a specific security and from the return on investment of cash collateral, reduced by negotiated rebate fees paid to the borrower and transaction costs. To the extent that a loan is secured by non-cash collateral, securities lending income is generated as a demand premium reduced by transaction costs. The Fund, the Agent, and the Manager retained 80%, 10%, and 10%, respectively, of the income generated from securities lending.
47
American Beacon Small Cap Value FundSM
Notes to Financial Statements
October 31, 2021
While securities are on loan, the Fund continues to receive certain income associated with that security and any gain or loss in the market price that may occur during the term of the loan. In the case of domestic equities, the value of any dividend is received in the form of a substitute payment approximately equal to the dividend. In the case of foreign securities, a negotiated amount is received that is less than the actual dividend, but higher than the dividend amount minus the foreign tax that the Fund would be subject to on the dividend.
Securities lending transactions pose certain risks to the Fund, including that the borrower may not provide additional collateral when required or return the securities when due, that the value of the short-term investments will be less than the amount of cash collateral required to be returned to the borrower, that non-cash collateral may be subject to legal constraints in the event of a borrower bankruptcy, and that the cash collateral investments could become illiquid and unable to be used to return collateral to the borrower. The Fund could also experience delays and costs in gaining access to the collateral. The Fund bears the risk of any deficiency in the amount of the cash collateral available for return to the borrower and any action which impairs its ability to liquidate non-cash collateral to satisfy a borrower default.
As of October 31, 2021, the value of outstanding securities on loan and the value of collateral were as follows:
Fund | Market Value of Securities on Loan | Cash Collateral Received | Non-Cash Collateral Received | Total Collateral Received | ||||||||||||||||||||||||
Small Cap Value | $ | 69,502,259 | $ | 10,739,130 | $ | 60,396,177 | $ | 71,135,307 | ||||||||||||||||||||
Cash collateral is listed on the Fund’s Schedule of Investments and is shown on the Statement of Assets and Liabilities. Income earned on these investments is included in “Income derived from securities lending” on the Statement of Operations.
Non-cash collateral received by the Fund may not be sold or re-pledged except to satisfy a borrower default. Therefore, non-cash collateral is not included on the Fund’s Schedule of Investments or Statement of Assets and Liabilities.
10. Borrowing Arrangements
Effective November 12, 2020 (the “Effective Date”), the Fund, along with certain other funds managed by the Manager (“Participating Funds”), renewed a committed revolving line of credit (the “Committed Line”) agreement with State Street Bank and Trust Company (the “Bank”) to be used to facilitate portfolio liquidity. The maximum borrowing amount under the Committed Line is $150 million with interest at a rate equal to the higher of (a) Overnight Bank Funding Rate (“OBFR”) daily fluctuating rate per annum equal to 1.25% plus the sum of 0.10% or (b) the Federal Funds daily fluctuating rate per annum on amounts borrowed. Each of the Participating Funds paid a proportional amount of a closing fee of $100,000 on the Effective Date and a quarterly commitment fee at a rate of 0.25% per annum on the unused portion of the Committed Line amount. The Committed Line expires November 11, 2021, unless extended by the Bank or terminated by the Participating Funds in accordance with the agreement. Effective November 11, 2021, the Fund’s Committed Line was changed to a maximum of $100 million with an expiration of November 10, 2022.
On the Effective Date, the Fund, along with certain other Participating Funds managed by the Manager, also renewed an uncommitted discretionary demand revolving line of credit (the “Uncommitted Line”) agreement with the Bank to be used to facilitate portfolio liquidity. The maximum borrowing amount under the Uncommitted Line is $50 million with interest at a rate equal to the higher of (a) Overnight Bank Funding Rate (“OBFR”) daily fluctuating rate per annum equal to 1.25% plus the sum of 0.10% or (b) the Federal Funds daily fluctuating rate per annum on amounts borrowed on each outstanding loan. Each of the Participating Funds paid a proportional amount of a closing fee of $35,000 on the Effective Date. The Uncommitted Line expires November 11, 2021 unless extended by the Bank or terminated by the Participating Funds in accordance with the agreement. Effective November 11, 2021, the Fund’s Uncommitted Line was changed to a maximum of $100 million with an expiration of November 10, 2022.
The Participating Funds paid administration, legal and arrangement fees, which are recognized as a component of “Loan expense” on the Statement of Operations, along with commitment fees, that have been allocated among the Participating Funds based on average daily net assets.
48
American Beacon Small Cap Value FundSM
Notes to Financial Statements
October 31, 2021
During the year ended October 31, 2021, the Fund did not utilize this facility.
11. Capital Share Transactions
The tables below summarize the activity in capital shares for each Class of the Fund:
| R5 Class | ||||||||||||||||||||||||||||
| Year Ended October 31, | ||||||||||||||||||||||||||||
| 2021 | 2020 | |||||||||||||||||||||||||||
Small Cap Value Fund | Shares | Amount | Shares | Amount | ||||||||||||||||||||||||
| Shares sold | 25,272,526 | $ | 734,344,099 | 39,439,761 | $ | 716,366,582 | ||||||||||||||||||||||
| Reinvestment of dividends | 1,148,888 | 28,354,544 | 3,024,304 | 73,672,049 | ||||||||||||||||||||||||
| Shares redeemed | (59,776,509 | ) | (1,698,015,121 | ) | (76,877,109 | ) | (1,510,018,985 | ) | ||||||||||||||||||||
|
|
|
|
|
|
|
| |||||||||||||||||||||
| Net (decrease) in shares outstanding | (33,355,095 | ) | $ | (935,316,478 | ) | (34,413,044 | ) | $ | (719,980,354 | ) | ||||||||||||||||||
|
|
|
|
|
|
|
| |||||||||||||||||||||
| Y Class | ||||||||||||||||||||||||||||
| Year Ended October 31, | ||||||||||||||||||||||||||||
| 2021 | 2020 | |||||||||||||||||||||||||||
Small Cap Value Fund | Shares | Amount | Shares | Amount | ||||||||||||||||||||||||
| Shares sold | 2,973,615 | $ | 82,535,591 | 3,989,719 | $ | 73,667,583 | ||||||||||||||||||||||
| Reinvestment of dividends | 70,195 | 1,705,030 | 183,614 | 4,403,056 | ||||||||||||||||||||||||
| Shares redeemed | (3,488,003 | ) | (97,995,999 | ) | (6,576,100 | ) | (127,119,945 | ) | ||||||||||||||||||||
|
|
|
|
|
|
|
| |||||||||||||||||||||
| Net (decrease) in shares outstanding | (444,193 | ) | $ | (13,755,378 | ) | (2,402,767 | ) | $ | (49,049,306 | ) | ||||||||||||||||||
|
|
|
|
|
|
|
| |||||||||||||||||||||
| Investor Class | ||||||||||||||||||||||||||||
| Year Ended October 31, | ||||||||||||||||||||||||||||
| 2021 | 2020 | |||||||||||||||||||||||||||
Small Cap Value Fund | Shares | Amount | Shares | Amount | ||||||||||||||||||||||||
| Shares sold | 3,635,707 | $ | 99,431,745 | 3,792,630 | $ | 69,752,665 | ||||||||||||||||||||||
| Reinvestment of dividends | 95,069 | 2,246,481 | 289,400 | 6,757,492 | ||||||||||||||||||||||||
| Shares redeemed | (7,414,960 | ) | (201,618,767 | ) | (7,246,353 | ) | (133,927,076 | ) | ||||||||||||||||||||
|
|
|
|
|
|
|
| |||||||||||||||||||||
| Net (decrease) in shares outstanding | (3,684,184 | ) | $ | (99,940,541 | ) | (3,164,323 | ) | $ | (57,416,919 | ) | ||||||||||||||||||
|
|
|
|
|
|
|
| |||||||||||||||||||||
| Advisor Class | ||||||||||||||||||||||||||||
| Year Ended October 31, | ||||||||||||||||||||||||||||
| 2021 | 2020 | |||||||||||||||||||||||||||
Small Cap Value Fund | Shares | Amount | Shares | Amount | ||||||||||||||||||||||||
| Shares sold | 699,128 | $ | 18,823,410 | 657,797 | $ | 11,111,813 | ||||||||||||||||||||||
| Reinvestment of dividends | 11,670 | 272,037 | 38,598 | 888,909 | ||||||||||||||||||||||||
| Shares redeemed | (1,903,700 | ) | (50,959,777 | ) | (1,213,292 | ) | (23,166,720 | ) | ||||||||||||||||||||
|
|
|
|
|
|
|
| |||||||||||||||||||||
| Net (decrease) in shares outstanding | (1,192,902 | ) | $ | (31,864,330 | ) | (516,897 | ) | $ | (11,165,998 | ) | ||||||||||||||||||
|
|
|
|
|
|
|
| |||||||||||||||||||||
| A Class | ||||||||||||||||||||||||||||
| Year Ended October 31, | ||||||||||||||||||||||||||||
| 2021 | 2020 | |||||||||||||||||||||||||||
Small Cap Value Fund | Shares | Amount | Shares | Amount | ||||||||||||||||||||||||
| Shares sold | 684,478 | $ | 18,647,795 | 848,676 | $ | 15,605,209 | ||||||||||||||||||||||
| Reinvestment of dividends | 13,698 | 316,837 | 40,097 | 916,617 | ||||||||||||||||||||||||
| Shares redeemed | (1,028,767 | ) | (27,369,382 | ) | (1,316,735 | ) | (24,718,335 | ) | ||||||||||||||||||||
|
|
|
|
|
|
|
| |||||||||||||||||||||
| Net (decrease) in shares outstanding | (330,591 | ) | $ | (8,404,750 | ) | (427,962 | ) | $ | (8,196,509 | ) | ||||||||||||||||||
|
|
|
|
|
|
|
| |||||||||||||||||||||
| C Class | ||||||||||||||||||||||||||||
| Year Ended October 31, | ||||||||||||||||||||||||||||
| 2021 | �� | 2020 | ||||||||||||||||||||||||||
Small Cap Value Fund | Shares | Amount | Shares | Amount | ||||||||||||||||||||||||
| Shares sold | 86,798 | $ | 2,256,647 | 95,220 | $ | 1,611,629 | ||||||||||||||||||||||
| Reinvestment of dividends | – | – | 5,705 | 124,090 | ||||||||||||||||||||||||
| Shares redeemed | (138,769 | ) | (3,584,911 | ) | (254,971 | ) | (4,363,916 | ) | ||||||||||||||||||||
|
|
|
|
|
|
|
| |||||||||||||||||||||
| Net (decrease) in shares outstanding | (51,971 | ) | $ | (1,328,264 | ) | (154,046 | ) | $ | (2,628,197 | ) | ||||||||||||||||||
|
|
|
|
|
|
|
| |||||||||||||||||||||
49
American Beacon Small Cap Value FundSM
Notes to Financial Statements
October 31, 2021
| R6 Class | ||||||||||||||||||||||||||||
| Year Ended October 31, | ||||||||||||||||||||||||||||
| 2021 | 2020 | |||||||||||||||||||||||||||
Small Cap Value Fund | Shares | Amount | Shares | Amount | ||||||||||||||||||||||||
| Shares sold | 22,939,812 | $ | 665,054,906 | 21,325,959 | $ | 416,470,456 | ||||||||||||||||||||||
| Reinvestment of dividends | 541,665 | 13,362,886 | 1,040,693 | 25,340,883 | ||||||||||||||||||||||||
| Shares redeemed | (24,922,627 | ) | (719,162,001 | ) | (18,819,838 | ) | (368,046,785 | ) | ||||||||||||||||||||
|
|
|
|
|
|
|
| |||||||||||||||||||||
| Net increase (decrease) in shares outstanding | (1,441,150 | ) | $ | (40,744,209 | ) | 3,546,814 | $ | 73,764,554 | ||||||||||||||||||||
|
|
|
|
|
|
|
| |||||||||||||||||||||
12. Subsequent Events
Management has evaluated subsequent events for possible recognition or disclosure in the financial statements through the date the financial statements are issued. Management has determined that there are no material events that would require disclosure in the Fund’s financial statements through this date.
50
American Beacon Small Cap Value FundSM
(For a share outstanding throughout the period)
| R5 ClassA | ||||||||||||||||||||||||||||||||||||
| Year Ended October 31, | ||||||||||||||||||||||||||||||||||||
| 2021 | 2020 | 2019 | 2018 | 2017 | ||||||||||||||||||||||||||||||||
|
| |||||||||||||||||||||||||||||||||||
Net asset value, beginning of period | $ | 19.76 | $ | 23.13 | $ | 26.14 | $ | 29.51 | $ | 24.36 | ||||||||||||||||||||||||||
|
|
|
|
|
|
|
|
|
| |||||||||||||||||||||||||||
Income (loss) from investment operations: | ||||||||||||||||||||||||||||||||||||
Net investment income | 0.25 | 0.26 | 0.26 | 0.21 | 0.17 | |||||||||||||||||||||||||||||||
Net gains (losses) on investments (both realized and unrealized) | 11.40 | (3.18 | ) | (0.25 | ) | (0.94 | ) | 5.83 | ||||||||||||||||||||||||||||
|
|
|
|
|
|
|
|
|
| |||||||||||||||||||||||||||
Total income (loss) from investment operations | 11.65 | (2.92 | ) | 0.01 | (0.73 | ) | 6.00 | |||||||||||||||||||||||||||||
|
|
|
|
|
|
|
|
|
| |||||||||||||||||||||||||||
Less distributions: | ||||||||||||||||||||||||||||||||||||
Dividends from net investment income | (0.22 | ) | (0.29 | ) | (0.18 | ) | (0.15 | ) | (0.23 | ) | ||||||||||||||||||||||||||
Distributions from net realized gains | - | (0.16 | ) | (2.84 | ) | (2.49 | ) | (0.62 | ) | |||||||||||||||||||||||||||
|
|
|
|
|
|
|
|
|
| |||||||||||||||||||||||||||
Total distributions | (0.22 | ) | (0.45 | ) | (3.02 | ) | (2.64 | ) | (0.85 | ) | ||||||||||||||||||||||||||
|
|
|
|
|
|
|
|
|
| |||||||||||||||||||||||||||
Net asset value, end of period | $ | 31.19 | $ | 19.76 | $ | 23.13 | $ | 26.14 | $ | 29.51 | ||||||||||||||||||||||||||
|
|
|
|
|
|
|
|
|
| |||||||||||||||||||||||||||
Total returnB | 59.26 | % | (13.00 | )% | 2.01 | % | (2.96 | )% | 24.80 | % | ||||||||||||||||||||||||||
|
|
|
|
|
|
|
|
|
| |||||||||||||||||||||||||||
Ratios and supplemental data: | ||||||||||||||||||||||||||||||||||||
Net assets, end of period | $ | 3,380,005,813 | $ | 2,799,722,660 | $ | 4,073,332,655 | $ | 4,604,864,422 | $ | 5,527,380,111 | ||||||||||||||||||||||||||
Ratios to average net assets: | ||||||||||||||||||||||||||||||||||||
Expenses, before reimbursements and/or recoupments | 0.81 | % | 0.82 | % | 0.83 | % | 0.80 | % | 0.82 | % | ||||||||||||||||||||||||||
Expenses, net of reimbursements and/or recoupments | 0.81 | % | 0.82 | % | 0.83 | % | 0.80 | % | 0.82 | % | ||||||||||||||||||||||||||
Net investment income, before expense reimbursements and/or recoupments | 0.65 | % | 1.04 | % | 1.07 | % | 0.66 | % | 0.58 | % | ||||||||||||||||||||||||||
Net investment income, net of reimbursements and/or recoupments | 0.65 | % | 1.04 | % | 1.07 | % | 0.66 | % | 0.58 | % | ||||||||||||||||||||||||||
Portfolio turnover rate | 48 | % | 61 | % | 48 | % | 69 | % | 48 | % | ||||||||||||||||||||||||||
| A | Prior to February 28, 2020, the R5 Class was known as Institutional Class. |
| B | Based on net asset value, which does not reflect the sales charge, redemption fee, or contingent deferred sales charge, if applicable. May include adjustments in accordance with U.S. GAAP and as such, the net asset value for reporting purposes and the returns based upon those net asset values may differ from the net asset value and returns for shareholder transactions. |
See accompanying notes
51
American Beacon Small Cap Value FundSM
Financial Highlights
(For a share outstanding throughout the period)
| Y Class | ||||||||||||||||||||||||||||||||||||
| Year Ended October 31, | ||||||||||||||||||||||||||||||||||||
| 2021 | 2020 | 2019 | 2018 | 2017 | ||||||||||||||||||||||||||||||||
|
| |||||||||||||||||||||||||||||||||||
Net asset value, beginning of period | $ | 19.44 | $ | 22.76 | $ | 25.77 | $ | 29.13 | $ | 24.06 | ||||||||||||||||||||||||||
|
|
|
|
|
|
|
|
|
| |||||||||||||||||||||||||||
Income (loss) from investment operations: | ||||||||||||||||||||||||||||||||||||
Net investment income | 0.16 | 0.22 | 0.26 | 0.17 | 0.12 | |||||||||||||||||||||||||||||||
Net gains (losses) on investments (both realized and unrealized) | 11.28 | (3.11 | ) | (0.27 | ) | (0.90 | ) | 5.78 | ||||||||||||||||||||||||||||
|
|
|
|
|
|
|
|
|
| |||||||||||||||||||||||||||
Total income (loss) from investment operations | 11.44 | (2.89 | ) | (0.01 | ) | (0.73 | ) | 5.90 | ||||||||||||||||||||||||||||
|
|
|
|
|
|
|
|
|
| |||||||||||||||||||||||||||
Less distributions: | ||||||||||||||||||||||||||||||||||||
Dividends from net investment income | (0.20 | ) | (0.27 | ) | (0.16 | ) | (0.14 | ) | (0.21 | ) | ||||||||||||||||||||||||||
Distributions from net realized gains | - | (0.16 | ) | (2.84 | ) | (2.49 | ) | (0.62 | ) | |||||||||||||||||||||||||||
|
|
|
|
|
|
|
|
|
| |||||||||||||||||||||||||||
Total distributions | (0.20 | ) | (0.43 | ) | (3.00 | ) | (2.63 | ) | (0.83 | ) | ||||||||||||||||||||||||||
|
|
|
|
|
|
|
|
|
| |||||||||||||||||||||||||||
Net asset value, end of period | $ | 30.68 | $ | 19.44 | $ | 22.76 | $ | 25.77 | $ | 29.13 | ||||||||||||||||||||||||||
|
|
|
|
|
|
|
|
|
| |||||||||||||||||||||||||||
Total returnA | 59.15 | % | (13.06 | )% | 1.93 | % | (3.03 | )% | 24.70 | % | ||||||||||||||||||||||||||
|
|
|
|
|
|
|
|
|
| |||||||||||||||||||||||||||
Ratios and supplemental data: | ||||||||||||||||||||||||||||||||||||
Net assets, end of period | $ | 255,837,301 | $ | 170,726,299 | $ | 254,599,477 | $ | 342,125,601 | $ | 379,409,116 | ||||||||||||||||||||||||||
Ratios to average net assets: | ||||||||||||||||||||||||||||||||||||
Expenses, before reimbursements and/or recoupments | 0.89 | % | 0.89 | % | 0.90 | % | 0.87 | % | 0.90 | % | ||||||||||||||||||||||||||
Expenses, net of reimbursements and/or recoupments | 0.89 | % | 0.89 | % | 0.90 | % | 0.87 | % | 0.90 | % | ||||||||||||||||||||||||||
Net investment income, before expense reimbursements and/or recoupments | 0.56 | % | 0.96 | % | 1.00 | % | 0.59 | % | 0.50 | % | ||||||||||||||||||||||||||
Net investment income, net of reimbursements and/or recoupments | 0.56 | % | 0.96 | % | 1.00 | % | 0.59 | % | 0.50 | % | ||||||||||||||||||||||||||
Portfolio turnover rate | 48 | % | 61 | % | 48 | % | 69 | % | 48 | % | ||||||||||||||||||||||||||
| A | Based on net asset value, which does not reflect the sales charge, redemption fee, or contingent deferred sales charge, if applicable. May include adjustments in accordance with U.S. GAAP and as such, the net asset value for reporting purposes and the returns based upon those net asset values may differ from the net asset value and returns for shareholder transactions. |
See accompanying notes
52
American Beacon Small Cap Value FundSM
Financial Highlights
(For a share outstanding throughout the period)
| Investor Class | ||||||||||||||||||||||||||||||||||||
| Year Ended October 31, | ||||||||||||||||||||||||||||||||||||
| 2021 | 2020 | 2019 | 2018 | 2017 | ||||||||||||||||||||||||||||||||
|
| |||||||||||||||||||||||||||||||||||
Net asset value, beginning of period | $ | 18.88 | $ | 22.12 | $ | 25.12 | $ | 28.46 | $ | 23.52 | ||||||||||||||||||||||||||
|
|
|
|
|
|
|
|
|
| |||||||||||||||||||||||||||
Income (loss) from investment operations: | ||||||||||||||||||||||||||||||||||||
Net investment income | 0.20 | 0.21 | 0.22 | 0.11 | 0.11 | |||||||||||||||||||||||||||||||
Net gains (losses) on investments (both realized and unrealized) | 10.85 | (3.08 | ) | (0.29 | ) | (0.89 | ) | 5.60 | ||||||||||||||||||||||||||||
|
|
|
|
|
|
|
|
|
| |||||||||||||||||||||||||||
Total income (loss) from investment operations | 11.05 | (2.87 | ) | (0.07 | ) | (0.78 | ) | 5.71 | ||||||||||||||||||||||||||||
|
|
|
|
|
|
|
|
|
| |||||||||||||||||||||||||||
Less distributions: | ||||||||||||||||||||||||||||||||||||
Dividends from net investment income | (0.15 | ) | (0.21 | ) | (0.09 | ) | (0.07 | ) | (0.15 | ) | ||||||||||||||||||||||||||
Distributions from net realized gains | - | (0.16 | ) | (2.84 | ) | (2.49 | ) | (0.62 | ) | |||||||||||||||||||||||||||
|
|
|
|
|
|
|
|
|
| |||||||||||||||||||||||||||
Total distributions | (0.15 | ) | (0.37 | ) | (2.93 | ) | (2.56 | ) | (0.77 | ) | ||||||||||||||||||||||||||
|
|
|
|
|
|
|
|
|
| |||||||||||||||||||||||||||
Net asset value, end of period | $ | 29.78 | $ | 18.88 | $ | 22.12 | $ | 25.12 | $ | 28.46 | ||||||||||||||||||||||||||
|
|
|
|
|
|
|
|
|
| |||||||||||||||||||||||||||
Total returnA | 58.74 | % | (13.30 | )% | 1.67 | % | (3.28 | )% | 24.43 | % | ||||||||||||||||||||||||||
|
|
|
|
|
|
|
|
|
| |||||||||||||||||||||||||||
Ratios and supplemental data: | ||||||||||||||||||||||||||||||||||||
Net assets, end of period | $ | 367,726,622 | $ | 302,626,954 | $ | 424,569,237 | $ | 538,602,473 | $ | 660,241,571 | ||||||||||||||||||||||||||
Ratios to average net assets: | ||||||||||||||||||||||||||||||||||||
Expenses, before reimbursements and/or recoupments | 1.15 | % | 1.15 | % | 1.14 | % | 1.13 | % | 1.12 | % | ||||||||||||||||||||||||||
Expenses, net of reimbursements and/or recoupments | 1.15 | % | 1.15 | % | 1.14 | % | 1.13 | % | 1.12 | % | ||||||||||||||||||||||||||
Net investment income, before expense reimbursements and/or recoupments | 0.32 | % | 0.70 | % | 0.76 | % | 0.33 | % | 0.27 | % | ||||||||||||||||||||||||||
Net investment income, net of reimbursements and/or recoupments | 0.32 | % | 0.70 | % | 0.76 | % | 0.33 | % | 0.27 | % | ||||||||||||||||||||||||||
Portfolio turnover rate | 48 | % | 61 | % | 48 | % | 69 | % | 48 | % | ||||||||||||||||||||||||||
| A | Based on net asset value, which does not reflect the sales charge, redemption fee, or contingent deferred sales charge, if applicable. May include adjustments in accordance with U.S. GAAP and as such, the net asset value for reporting purposes and the returns based upon those net asset values may differ from the net asset value and returns for shareholder transactions. |
See accompanying notes
53
American Beacon Small Cap Value FundSM
Financial Highlights
(For a share outstanding throughout the period)
| Advisor Class | ||||||||||||||||||||||||||||||||||||
| Year Ended October 31, | ||||||||||||||||||||||||||||||||||||
| 2021 | 2020 | 2019 | 2018 | 2017 | ||||||||||||||||||||||||||||||||
|
| |||||||||||||||||||||||||||||||||||
Net asset value, beginning of period | $ | 18.60 | $ | 21.79 | $ | 24.77 | $ | 28.09 | $ | 23.22 | ||||||||||||||||||||||||||
|
|
|
|
|
|
|
|
|
| |||||||||||||||||||||||||||
Income (loss) from investment operations: | ||||||||||||||||||||||||||||||||||||
Net investment income | 0.17 | 0.15 | 0.14 | 0.06 | 0.03 | |||||||||||||||||||||||||||||||
Net gains (losses) on investments (both realized and unrealized) | 10.69 | (3.01 | ) | (0.25 | ) | (0.88 | ) | 5.57 | ||||||||||||||||||||||||||||
|
|
|
|
|
|
|
|
|
| |||||||||||||||||||||||||||
Total income (loss) from investment operations | 10.86 | (2.86 | ) | (0.11 | ) | (0.82 | ) | 5.60 | ||||||||||||||||||||||||||||
|
|
|
|
|
|
|
|
|
| |||||||||||||||||||||||||||
Less distributions: | ||||||||||||||||||||||||||||||||||||
Dividends from net investment income | (0.12 | ) | (0.17 | ) | (0.03 | ) | (0.01 | ) | (0.11 | ) | ||||||||||||||||||||||||||
Distributions from net realized gains | - | (0.16 | ) | (2.84 | ) | (2.49 | ) | (0.62 | ) | |||||||||||||||||||||||||||
|
|
|
|
|
|
|
|
|
| |||||||||||||||||||||||||||
Total distributions | (0.12 | ) | (0.33 | ) | (2.87 | ) | (2.50 | ) | (0.73 | ) | ||||||||||||||||||||||||||
|
|
|
|
|
|
|
|
|
| |||||||||||||||||||||||||||
Net asset value, end of period | $ | 29.34 | $ | 18.60 | $ | 21.79 | $ | 24.77 | $ | 28.09 | ||||||||||||||||||||||||||
|
|
|
|
|
|
|
|
|
| |||||||||||||||||||||||||||
Total returnA | 58.56 | % | (13.40 | )% | 1.48 | % | (3.44 | )% | 24.26 | % | ||||||||||||||||||||||||||
|
|
|
|
|
|
|
|
|
| |||||||||||||||||||||||||||
Ratios and supplemental data: | ||||||||||||||||||||||||||||||||||||
Net assets, end of period | $ | 32,801,309 | $ | 42,987,242 | $ | 61,618,406 | $ | 77,578,775 | $ | 98,718,359 | ||||||||||||||||||||||||||
Ratios to average net assets: | ||||||||||||||||||||||||||||||||||||
Expenses, before reimbursements and/or recoupments | 1.29 | % | 1.25 | % | 1.34 | % | 1.28 | % | 1.30 | % | ||||||||||||||||||||||||||
Expenses, net of reimbursements and/or recoupments | 1.29 | % | 1.25 | % | 1.34 | % | 1.28 | % | 1.30 | % | ||||||||||||||||||||||||||
Net investment income, before expense reimbursements and/or recoupments | 0.20 | % | 0.60 | % | 0.56 | % | 0.18 | % | 0.11 | % | ||||||||||||||||||||||||||
Net investment income, net of reimbursements and/or recoupments | 0.20 | % | 0.60 | % | 0.56 | % | 0.18 | % | 0.11 | % | ||||||||||||||||||||||||||
Portfolio turnover rate | 48 | % | 61 | % | 48 | % | 69 | % | 48 | % | ||||||||||||||||||||||||||
| A | Based on net asset value, which does not reflect the sales charge, redemption fee, or contingent deferred sales charge, if applicable. May include adjustments in accordance with U.S. GAAP and as such, the net asset value for reporting purposes and the returns based upon those net asset values may differ from the net asset value and returns for shareholder transactions. |
See accompanying notes
54
American Beacon Small Cap Value FundSM
Financial Highlights
(For a share outstanding throughout the period)
| A Class | ||||||||||||||||||||||||||||||||||||
| Year Ended October 31, | ||||||||||||||||||||||||||||||||||||
| 2021 | 2020 | 2019 | 2018 | 2017 | ||||||||||||||||||||||||||||||||
|
| |||||||||||||||||||||||||||||||||||
Net asset value, beginning of period | $ | 18.47 | $ | 21.64 | $ | 24.65 | $ | 27.99 | $ | 23.14 | ||||||||||||||||||||||||||
|
|
|
|
|
|
|
|
|
| |||||||||||||||||||||||||||
Income (loss) from investment operations: | ||||||||||||||||||||||||||||||||||||
Net investment income | 0.06 | 0.12 | 0.14 | 0.07 | 0.07 | |||||||||||||||||||||||||||||||
Net gains (losses) on investments (both realized and unrealized) | 10.72 | (2.95 | ) | (0.24 | ) | (0.86 | ) | 5.53 | ||||||||||||||||||||||||||||
|
|
|
|
|
|
|
|
|
| |||||||||||||||||||||||||||
Total income (loss) from investment operations | 10.78 | (2.83 | ) | (0.10 | ) | (0.79 | ) | 5.60 | ||||||||||||||||||||||||||||
|
|
|
|
|
|
|
|
|
| |||||||||||||||||||||||||||
Less distributions: | ||||||||||||||||||||||||||||||||||||
Dividends from net investment income | (0.13 | ) | (0.18 | ) | (0.07 | ) | (0.06 | ) | (0.13 | ) | ||||||||||||||||||||||||||
Distributions from net realized gains | - | (0.16 | ) | (2.84 | ) | (2.49 | ) | (0.62 | ) | |||||||||||||||||||||||||||
|
|
|
|
|
|
|
|
|
| |||||||||||||||||||||||||||
Total distributions | (0.13 | ) | (0.34 | ) | (2.91 | ) | (2.55 | ) | (0.75 | ) | ||||||||||||||||||||||||||
|
|
|
|
|
|
|
|
|
| |||||||||||||||||||||||||||
Net asset value, end of period | $ | 29.12 | $ | 18.47 | $ | 21.64 | $ | 24.65 | $ | 27.99 | ||||||||||||||||||||||||||
|
|
|
|
|
|
|
|
|
| |||||||||||||||||||||||||||
Total returnA | 58.57 | % | (13.38 | )% | 1.56 | % | (3.37 | )% | 24.36 | % | ||||||||||||||||||||||||||
|
|
|
|
|
|
|
|
|
| |||||||||||||||||||||||||||
Ratios and supplemental data: | ||||||||||||||||||||||||||||||||||||
Net assets, end of period | $ | 63,024,594 | $ | 46,067,043 | $ | 63,246,155 | $ | 66,380,615 | $ | 63,481,305 | ||||||||||||||||||||||||||
Ratios to average net assets: | ||||||||||||||||||||||||||||||||||||
Expenses, before reimbursements and/or recoupments | 1.24 | % | 1.26 | % | 1.26 | % | 1.20 | % | 1.20 | % | ||||||||||||||||||||||||||
Expenses, net of reimbursements and/or recoupments | 1.24 | % | 1.26 | % | 1.26 | % | 1.20 | % | 1.20 | % | ||||||||||||||||||||||||||
Net investment income, before expense reimbursements and/or recoupments | 0.21 | % | 0.59 | % | 0.64 | % | 0.25 | % | 0.20 | % | ||||||||||||||||||||||||||
Net investment income, net of reimbursements and/or recoupments | 0.21 | % | 0.59 | % | 0.64 | % | 0.25 | % | 0.20 | % | ||||||||||||||||||||||||||
Portfolio turnover rate | 48 | % | 61 | % | 48 | % | 69 | % | 48 | % | ||||||||||||||||||||||||||
| A | Based on net asset value, which does not reflect the sales charge, redemption fee, or contingent deferred sales charge, if applicable. May include adjustments in accordance with U.S. GAAP and as such, the net asset value for reporting purposes and the returns based upon those net asset values may differ from the net asset value and returns for shareholder transactions. |
See accompanying notes
55
American Beacon Small Cap Value FundSM
Financial Highlights
(For a share outstanding throughout the period)
| C Class | ||||||||||||||||||||||||||||||||||||
| Year Ended October 31, | ||||||||||||||||||||||||||||||||||||
| 2021 | 2020 | 2019 | 2018 | 2017 | ||||||||||||||||||||||||||||||||
|
| |||||||||||||||||||||||||||||||||||
Net asset value, beginning of period | $ | 17.47 | $ | 20.51 | $ | 23.60 | $ | 26.98 | $ | 22.39 | ||||||||||||||||||||||||||
|
|
|
|
|
|
|
|
|
| |||||||||||||||||||||||||||
Income (loss) from investment operations: | ||||||||||||||||||||||||||||||||||||
Net investment (loss) | (0.22 | ) | (0.17 | ) | (0.01 | )A | (0.08 | ) | (0.14 | ) | ||||||||||||||||||||||||||
Net gains (losses) on investments (both realized and unrealized) | 10.26 | (2.66 | ) | (0.24 | ) | (0.81 | ) | 5.35 | ||||||||||||||||||||||||||||
|
|
|
|
|
|
|
|
|
| |||||||||||||||||||||||||||
Total income (loss) from investment operations | 10.04 | (2.83 | ) | (0.25 | ) | (0.89 | ) | 5.21 | ||||||||||||||||||||||||||||
|
|
|
|
|
|
|
|
|
| |||||||||||||||||||||||||||
Less distributions: | ||||||||||||||||||||||||||||||||||||
Dividends from net investment income | - | (0.05 | ) | - | - | - | ||||||||||||||||||||||||||||||
Distributions from net realized gains | - | (0.16 | ) | (2.84 | ) | (2.49 | ) | (0.62 | ) | |||||||||||||||||||||||||||
|
|
|
|
|
|
|
|
|
| |||||||||||||||||||||||||||
Total distributions | - | (0.21 | ) | (2.84 | ) | (2.49 | ) | (0.62 | ) | |||||||||||||||||||||||||||
|
|
|
|
|
|
|
|
|
| |||||||||||||||||||||||||||
Net asset value, end of period | $ | 27.51 | $ | 17.47 | $ | 20.51 | $ | 23.60 | $ | 26.98 | ||||||||||||||||||||||||||
|
|
|
|
|
|
|
|
|
| |||||||||||||||||||||||||||
Total returnB | 57.47 | % | (14.00 | )% | 0.85 | % | (3.89 | )% | 23.39 | % | ||||||||||||||||||||||||||
|
|
|
|
|
|
|
|
|
| |||||||||||||||||||||||||||
Ratios and supplemental data: | ||||||||||||||||||||||||||||||||||||
Net assets, end of period | $ | 11,261,210 | $ | 8,057,935 | $ | 12,619,613 | $ | 13,480,297 | $ | 15,335,554 | ||||||||||||||||||||||||||
Ratios to average net assets: | ||||||||||||||||||||||||||||||||||||
Expenses, before reimbursements and/or recoupments | 1.95 | % | 1.96 | % | 1.95 | % | 1.86 | % | 1.96 | % | ||||||||||||||||||||||||||
Expenses, net of reimbursements and/or recoupments | 1.95 | % | 1.96 | % | 1.95 | %C | 1.76 | % | 1.96 | % | ||||||||||||||||||||||||||
Net investment (loss), before expense reimbursements | (0.50 | )% | (0.10 | )% | (0.06 | )% | (0.41 | )% | (0.58 | )% | ||||||||||||||||||||||||||
Net investment (loss), net of reimbursements | (0.50 | )% | (0.10 | )% | (0.06 | )% | (0.31 | )% | (0.58 | )% | ||||||||||||||||||||||||||
Portfolio turnover rate | 48 | % | 61 | % | 48 | % | 69 | % | 48 | % | ||||||||||||||||||||||||||
| A | Per share amounts have been calculated using the average shares method. |
| B | Based on net asset value, which does not reflect the sales charge, redemption fee, or contingent deferred sales charge, if applicable. May include adjustments in accordance with U.S. GAAP and as such, the net asset value for reporting purposes and the returns based upon those net asset values may differ from the net asset value and returns for shareholder transactions. |
| C | This ratio does not include a voluntary reimbursement of service fees as included in the prior year. |
See accompanying notes
56
American Beacon Small Cap Value FundSM
Financial Highlights
(For a share outstanding throughout the period)
| R6 Class | ||||||||||||||||||||||||||||||||||||
| Year Ended October 31, | February 28, 2017A to October 31, | |||||||||||||||||||||||||||||||||||
| 2021 | 2020 | 2019 | 2018 | 2017 | ||||||||||||||||||||||||||||||||
|
| |||||||||||||||||||||||||||||||||||
Net asset value, beginning of period | $ | 19.75 | $ | 23.12 | $ | 26.14 | $ | 29.51 | $ | 28.03 | ||||||||||||||||||||||||||
|
|
|
|
|
|
|
|
|
| |||||||||||||||||||||||||||
Income (loss) from investment operations: | ||||||||||||||||||||||||||||||||||||
Net investment income (loss) | 0.19 | 0.22 | 0.26 | 0.22 | (0.00 | )B | ||||||||||||||||||||||||||||||
Net gains (losses) on investments | 11.48 | (3.14 | ) | (0.25 | ) | (0.94 | ) | 1.48 | ||||||||||||||||||||||||||||
|
|
|
|
|
|
|
|
|
| |||||||||||||||||||||||||||
Total income (loss) from investment operations | 11.67 | (2.92 | ) | 0.01 | (0.72 | ) | 1.48 | |||||||||||||||||||||||||||||
|
|
|
|
|
|
|
|
|
| |||||||||||||||||||||||||||
Less distributions: | ||||||||||||||||||||||||||||||||||||
Dividends from net investment income | (0.23 | ) | (0.29 | ) | (0.19 | ) | (0.16 | ) | - | |||||||||||||||||||||||||||
Distributions from net realized gains | - | (0.16 | ) | (2.84 | ) | (2.49 | ) | - | ||||||||||||||||||||||||||||
|
|
|
|
|
|
|
|
|
| |||||||||||||||||||||||||||
Total distributions | (0.23 | ) | (0.45 | ) | (3.03 | ) | (2.65 | ) | - | |||||||||||||||||||||||||||
|
|
|
|
|
|
|
|
|
| |||||||||||||||||||||||||||
Net asset value, end of period | $ | 31.19 | $ | 19.75 | $ | 23.12 | $ | 26.14 | $ | 29.51 | ||||||||||||||||||||||||||
|
|
|
|
|
|
|
|
|
| |||||||||||||||||||||||||||
Total returnC | 59.38 | % | (12.98 | )% | 2.01 | % | (2.93 | )% | 5.28 | %D | ||||||||||||||||||||||||||
|
|
|
|
|
|
|
|
|
| |||||||||||||||||||||||||||
Ratios and supplemental data: | ||||||||||||||||||||||||||||||||||||
Net assets, end of period | $ | 1,830,192,124 | $ | 1,187,578,766 | $ | 1,308,284,613 | $ | 902,241,051 | $ | 295,802,679 | ||||||||||||||||||||||||||
Ratios to average net assets: | ||||||||||||||||||||||||||||||||||||
Expenses, before reimbursements and/or recoupments | 0.79 | % | 0.79 | % | 0.80 | % | 0.77 | % | 0.80 | %E | ||||||||||||||||||||||||||
Expenses, net of reimbursements and/or recoupments | 0.79 | % | 0.79 | % | 0.80 | % | 0.77 | % | 0.80 | %E | ||||||||||||||||||||||||||
Net investment income (loss), before expense reimbursements | 0.66 | % | 1.06 | % | 1.08 | % | 0.66 | % | (0.04 | )%E | ||||||||||||||||||||||||||
Net investment income (loss), net of reimbursements | 0.66 | % | 1.06 | % | 1.08 | % | 0.66 | % | (0.04 | )%E | ||||||||||||||||||||||||||
Portfolio turnover rate | 48 | % | 61 | % | 48 | % | 69 | % | 48 | %F | ||||||||||||||||||||||||||
| A | Commencement of operations. |
| B | Amount represents less than $0.01 per share. |
| C | Based on net asset value, which does not reflect the sales charge, redemption fee, or contingent deferred sales charge, if applicable. May include adjustments in accordance with U.S. GAAP and as such, the net asset value for reporting purposes and the returns based upon those net asset values may differ from the net asset value and returns for shareholder transactions. |
| D | Not annualized. |
| E | Annualized. |
| F | Portfolio turnover rate is for the period from February 28, 2017 through October 31, 2017 and is not annualized. |
See accompanying notes
57
American Beacon FundsSM
October 31, 2021 (Unaudited)
Certain tax information regarding the Funds are required to be provided to shareholders based upon the Funds’ income and distributions for the taxable year ended October 31, 2021. The information and distributions reported herein may differ from information and distributions taxable to the shareholders for the calendar year ended December 31, 2021.
The Fund designated the following items with regard to distributions paid during the fiscal year ended October 31, 2021. All designations are based on financial information available as of this annual report and, accordingly, are subject to change. For each item, it is the intention of the Funds to designate the maximum amount permitted under the Internal Revenue Code of 1986, as amended, and the regulations there under.
Corporate Dividends-Received Deduction:
Small Cap Value | 100.00 | % |
Qualified Dividend Income:
Small Cap Value | 100.00 | % |
Long-Term Capital Gain Distributions:
Small Cap Value | $ | 83,410,224 |
Short-Term Capital Gain Distributions:
Small Cap Value | $ | 0 |
Shareholders will receive notification in January 2022 of the applicable tax information necessary to prepare their 2021 income tax returns.
58
Disclosure Regarding Approval of the Management and Investment Advisory Agreements (Unaudited)
Renewal and Approval of Management Agreement and Investment Advisory Agreements
At meetings held on May 17, 2021 and June 8-9, 2021 (collectively, the “Meetings”) via videoconference, the Board of Trustees (“Board” or “Trustees”) considered and then, at its June 9, 2021 meeting, approved the renewal of: (1) the Management Agreement between American Beacon Advisors, Inc. (“Manager”) and the American Beacon Funds (“Trust”), on behalf of the American Beacon Small Cap Value Fund (“Fund”); and (2) the Investment Advisory Agreements among the Manager, the Trust, on behalf of the Fund, and each of Barrow, Hanley, Mewhinney & Strauss, LLC (“Barrow”), Brandywine Global Investment Management, LLC (“Brandywine”), Foundry Partners, LLC (“Foundry”), Hillcrest Asset Management, LLC (“Hillcrest”), Hotchkis and Wiley Capital Management, LLC (“Hotchkis”) and Mellon Investments Corp. (“Mellon”) (each, a “subadvisor” and collectively, the “subadvisors”).
The Management Agreement and the Investment Advisory Agreements are referred to herein individually as an “Agreement” and collectively as the “Agreements.” In preparation for its consideration of the renewal of the Agreements, the Board undertook steps to gather and consider information furnished by the Manager, the subadvisors, Broadridge, Inc. (“Broadridge”) and Morningstar, Inc. (“Morningstar”). The Board, with the assistance of independent legal counsel, requested and received certain relevant information from the Manager and each subadvisor.
In advance of the Meetings, the Board’s Investment Committee and/or the Manager coordinated the production of information from Broadridge and Morningstar regarding the performance, fees and expenses of the Fund as well as information from the Manager and the subadvisors. At the Meetings, the Board considered the information provided in connection with the renewal process, as well as information furnished to the Board throughout the year at regular meetings of the Board and its committees. In connection with the Board’s consideration of the Agreements, the Trustees received and evaluated such information as they deemed necessary, including the impact of the COVID-19 pandemic on the operations of the Manager and the subadvisor. This information is described below in the section summarizing the factors the Board considered in connection with its renewal and approval of the Agreements, as well as the section describing additional Board considerations with respect to the Fund.
The Board noted that the Manager provides management and administrative services to the Fund pursuant to the Management Agreement. The Board considered that many mutual funds have separate contracts governing each type of service and observed that, with respect to such mutual funds, the actual management fee rates provided by Broadridge for peer group funds reflect the combined advisory and administrative fees, reduced by any fee waivers and/or reimbursements.
A firm may not have been able to, or opted not to, provide information in response to certain information requests, in which case the Board conducted its evaluation of the firm based on information that was provided. In such cases, the Board determined that the omission of any such information was not material to its considerations.
Provided below is an overview of certain factors the Board considered in connection with its decision to approve the renewal of the Agreements. The Board did not identify any particular information that was most relevant to its consideration of whether to approve the renewal of each Agreement, and each Trustee may have afforded different weight to the various factors. Legal counsel to the independent Trustees provided the Board with a memorandum regarding its responsibilities pertaining to the renewal of investment advisory contracts, such as the Agreements, and related regulatory guidelines. Based on its evaluation, the Board unanimously concluded that the terms of each Agreement were reasonable and fair and that the approval of the renewal of each Agreement was in the best interests of the Fund and its shareholders.
Considerations With Respect to the Renewal of the Management Agreement and the Investment Advisory Agreements
In determining whether to approve the renewal of the Agreements, the Board considered the Fund’s investment management and subadvisory relationships separately. In each instance, the Board considered, among
59
Disclosure Regarding Approval of the Management and Investment Advisory Agreements (Unaudited)
other things, the following factors: (1) the nature, extent and quality of the services provided; (2) the investment performance of the Fund and the subadvisors for the Fund; (3) the costs incurred by the Manager in rendering services to the Fund and its resulting profits or losses; (4) comparisons of services and fee rates with contracts entered into by the Manager or the subadvisors or their affiliates with other clients (such as pension funds and other institutional clients); (5) the extent to which economies of scale, if any, have been taken into account in setting each fee rate schedule; (6) whether fee rate levels reflect economies of scale, if any, for the benefit of Fund investors; and (7) any other benefits derived or anticipated to be derived by the Manager or the subadvisors from their relationships with the Fund.
Nature, Extent and Quality of Services. With respect to the renewal of the Management Agreement, the Board considered, among other factors: the Fund’s long-term performance; the length of service of key investment personnel at the Manager; the cost structure of the Fund; the Manager’s culture of compliance and support that reduce risks to the Fund; the Manager’s quality of services; the Manager’s active role in monitoring and, as appropriate, recommending additional or replacement subadvisors; and the Manager’s efforts to retain key employees and maintain staffing levels.
With respect to the renewal of each Investment Advisory Agreement, the Board considered, among other factors: the level of staffing and the size of each subadvisor; the adequacy of the resources committed to the Fund by each subadvisor; the financial stability of each subadvisor; and representations made by each subadvisor regarding its compliance program. Based on the foregoing information, the Board concluded that the nature, extent and quality of the management and advisory services provided by the Manager and each subadvisor were appropriate for the Fund.
Investment Performance. The Board evaluated the comparative information provided by Broadridge and the Manager regarding the performance of the Fund, relative to its Broadridge Performance Universe, Morningstar Category, and benchmark index, as well as the Fund’s Morningstar rating. The Board considered the information provided by Broadridge regarding its independent methodology for selecting the Fund’s Broadridge Performance Universe. In addition, the Board considered the performance reports and discussions with management at Board and Committee meetings throughout the year. The Board also evaluated the comparative information provided by each subadvisor regarding the performance of its portion of the Fund relative to the performance of comparable investment accounts and/or a composite of comparable investment accounts managed by the subadvisor and the Fund’s benchmark index. In addition, the Board considered the Manager’s recommendation to continue to retain each subadvisor. A discussion regarding the Board’s considerations with respect to the Fund’s performance appears below under “Additional Considerations and Conclusions with Respect to the Fund.”
Costs of the Services Provided to the Fund and the Profits Realized by the Manager from its Relationship with the Fund. In analyzing the costs of services and profitability of the Manager, the Board considered the revenues earned and the expenses incurred by the Manager, before and after the payment of distribution-related expenses by the Manager. The profits or losses were noted at both an aggregate level for all funds within the group of mutual funds sponsored by the Manager (the “Fund Complex”) and at an individual Fund level, with the Manager earning a profit before and after the payment of distribution-related expenses by the Manager for the Fund. The Board also considered comparative information provided by the Manager regarding the Manager’s overall profitability with respect to the Fund Complex relative to the overall profitability of other firms in the mutual fund industry, as disclosed in publicly available sources. Although the Board noted that, in certain cases, the fee rates paid by other clients of the Manager are lower than the fee rates paid by the Fund, the Manager represented that, among other matters, the difference is attributable to the fact that the Manager does not perform administrative services for non-investment company clients and reflects the greater level of responsibility and regulatory requirements associated with managing the Fund.
The Board further considered that, with respect to the Fund, the Management Agreement provides for the Manager to receive a management fee comprised of an annualized fee that is retained by the Manager. In addition, the Board considered that the Manager receives fees for administering and overseeing the securities lending
60
Disclosure Regarding Approval of the Management and Investment Advisory Agreements (Unaudited)
program on behalf of the Fund. The Board also noted that certain share classes of the Fund maintain higher expense ratios in order to compensate third-party financial intermediaries.
In analyzing the fee rates charged by each subadvisor in connection with its investment advisory services to the Fund, the Board considered representations made by each subadvisor that the Fund’s fee rate schedule generally was favorable compared to the fee rates that each subadvisor charges for any comparable client accounts. The Board did not request profitability data from the subadvisors, because the Board did not view this data as imperative to its deliberations given the arm’s-length nature of the relationship between the Manager and the subadvisors with respect to the negotiation of subadvisory fee rates. In addition, the Board noted that subadvisors may not account for their profits on an account-by-account basis and that different firms likely employ different methodologies in connection with these calculations.
Based on the foregoing information, the Board concluded that the profitability levels of the Manager were reasonable in light of the services performed by the Manager. A discussion regarding the Board’s considerations with respect to the Fund’s fee rates is set forth below under “Additional Considerations and Conclusions with Respect to the Fund.”
Economies of Scale. In considering the reasonableness of the management and investment advisory fees rates, the Board considered whether economies of scale will be realized as the Fund grows and whether fee rate levels reflect these economies of scale for the benefit of Fund shareholders. In this regard, the Board considered that, with respect to each subadvisor, the Manager has negotiated breakpoints for the subadvisory fee rate schedule.
In addition, the Board noted the Manager’s representation that the Management Agreement contains fee schedule breakpoints at higher asset levels with respect to the Fund. Based on the foregoing information, the Board concluded that the Manager and subadvisor fee rate schedules for the Fund provide for a reasonable sharing of benefits from any economies of scale with the Fund.
Benefits Derived from the Relationship with the Fund. The Board considered the “fall-out” or ancillary benefits that accrue to the Manager and/or the subadvisors as a result of the advisory relationships with the Fund, including greater exposure in the marketplace with respect to the Manager’s or the subadvisors’ investment process and expanding the level of assets under management by the Manager and the subadvisors. The Board also considered that the Manager may invest the Fund’s cash balances and cash collateral provided by the borrowers of the Fund’s securities in the American Beacon U.S. Government Money Market Select Fund, which the Manager manages directly, and for which the Manger receives a fee. In addition, the Board noted that each subadvisor, except for Hillcrest, benefits from soft dollar arrangements for proprietary and/or third-party research. Based on the foregoing information, the Board concluded that the potential benefits accruing to the Manager and the subadvisors by virtue of their relationships with the Fund appear to be fair and reasonable.
Additional Considerations and Conclusions with Respect to the Fund
The performance comparisons below were made for the Fund’s R5 Class shares relative to the Fund’s Broadridge Performance Universe and Morningstar Category. With respect to the Broadridge Performance Universe, the 1st Quintile represents the top 20 percent of the universe based on performance and the 5th Quintile represents the bottom 20 percent of the universe based on performance. References to the Fund’s Broadridge Performance Universe are to the respective universe of mutual funds with comparable investment classifications and objectives as determined by Broadridge. The performance of individual firms was calculated by the Manager based on information provided by the Funds’ custodian.
In reviewing the performance, the Board viewed longer-term performance over a full market cycle, typically five years or longer, as the most important consideration because relative performance over shorter periods may be significantly impacted by market or economic events and not necessarily reflective of subadvisor skill.
61
Disclosure Regarding Approval of the Management and Investment Advisory Agreements (Unaudited)
The expense comparisons below were made for the Fund’s R5 Class shares relative to the Fund’s Broadridge Expense Universe and Broadridge Expense Group and Y Class shares relative to the Fund’s Morningstar Fee Level universe. The 1st Quintile represents the lowest 20 percent of the universe or group based on lowest total expense, and the 5th Quintile represents the highest 20 percent of the universe or group based on highest total expense. References to the Fund’s Expense Group and Expense Universe are to the respective group or universe of comparable mutual funds as determined by Broadridge. A Broadridge Expense Group consists of the Fund and a representative sample of funds with similar operating structures and asset sizes, as selected by Broadridge. A Broadridge Expense Universe includes all funds with a comparable investment classifications/objectives and similar operating structures to that of the share class under review for the Fund, including funds in the Broadridge Expense Group. The Broadridge expense comparisons are based on the most recent audited financial information publicly available for a Fund as of December 31, 2020. References to the Fund’s Morningstar Fee Level ranking are to the institutional share class of comparable mutual funds as determined by Morningstar.
The Board considered the Fund’s Morningstar fee level category with the 1st Quintile representing the lowest 20 percent of the category constituents and the 5th Quintile representing the highest 20 percent of the category in terms of total expense.
The Board also considered that, in connection with the change in the name of the Fund’s Institutional Class shares, the share class used for the Fund’s Morningstar Fee Level comparisons had changed from the R5 Class shares to the Y Class shares, which may have resulted in a less favorable Morningstar Fee Level Ranking for the Fund than in prior years.
In considering the renewal of the Management Agreement for the Fund, the Board considered the following additional factors:
Broadridge Total Expense Analysis Excluding 12b-1 Fees and Morningstar Fee Level Ranking
Compared to Broadridge Expense Group | 2nd Quintile | |||
Compared to Broadridge Expense Universe | 2nd Quintile | |||
Morningstar Fee Level Ranking | 2nd Quintile |
Broadridge and Morningstar Performance Analysis (five-year period ended December 31, 2020)
Compared to Broadridge Performance Universe | 2nd Quintile | |
Compared to Morningstar Category | 2nd Quintile |
In considering the renewal of the Investment Advisory Agreements with Barrow, Brandywine, Foundry, Hillcrest, Hotchkis, and Mellon, the Board considered that the diversification of investment strategies facilitated by the Fund’s multi-manager structure permits the Fund to mitigate the risks associated with a single subadvisor. The Board also considered the following additional factors:
Subadvisor Performance (compared to Broadridge Performance Universe for period indicated ended December 31, 2020)
Barrow (Fundamental Strategy) | 5 Years | 1st Quintile | ||
Barrow (Diversified Strategy)* | 5 Years | 4th Quintile | ||
Brandywine | 5 Years | 5th Quintile | ||
Foundry | 5 Years | 3rd Quintile | ||
Hillcrest | 5 Years | 4th Quintile | ||
Hotchkis (Fundamental Strategy) | 5 Years | 4th Quintile | ||
Hotchkis (Diversified Strategy) | 3 Years | 3rd Quintile | ||
Mellon | 5 Years | 1st Quintile |
* The strategy was temporarily defunded in December 2020. The performance used for December 2020 is that of a composite of accounts managed by Barrow in the same strategy, net of Barrow’s blended fee rate for the Fund.
62
Disclosure Regarding Approval of the Management and Investment Advisory Agreements (Unaudited)
The Board also considered: (1) information provided by each subadvisor regarding fee rates charged for managing assets in the same or a similar strategy as the subadvisor manages its allocation of the Fund; (2) the Manager’s representation that Brandywine’s process, which focuses primarily on selecting stocks with low price to earnings multiples, has been out of favor, adversely affecting both shorter-term and longer-term performance; and (3) the Manager’s recommendation to continue to retain each subadvisor.
Based on these and other considerations, the Board: (1) concluded that the fees paid to the Manager and the subadvisors under the Management and Investment Advisory Agreements are fair and reasonable; and (2) determined that the Fund and its shareholders would benefit from the Manager’s and subadvisors’ continued management of the Fund.
Approvals Related to the American Beacon Small Cap Value Fund
At its June 8-9, 2021 meetings, the Boards of Trustees of American Beacon Funds (the “Trust”) considered the approval of a new investment advisory agreement (“New Agreement”) among American Beacon Advisors, Inc. (“Manager”), Newton Investment Management North America, LLC (“Newton”), and the Trust, on behalf of the American Beacon Small Cap Value Fund (“SCV Fund”). The Board was advised that Mellon Investments Corporation (“Mellon”), an indirect wholly-owned subsidiary of Bank of New York Mellon Corporation (“BNY Mellon”), and a sub-advisor to the SCV Fund, would be involved in a corporate reorganization (“Reorganization”), pursuant to which Newton, a newly-formed entity and also an indirect wholly-owned subsidiary of BNY Mellon, would replace Mellon as the sub-advisor to the SCV Fund.
The Board considered that Mellon had received an opinion of counsel that the Reorganization would not be deemed a change in control under the Investment Company Act of 1940, as amended (“1940 Act”), which would have resulted in the assignment and termination of the existing investment advisory agreement (“Existing Agreement”) with respect to the SCV Fund. The Board also considered that the majority of the Mellon personnel who provide services to the SCV Fund were expected to be transferred to Newton and to perform substantially the same functions after the Reorganization. Additionally, the Board considered that the Existing Agreement and New Agreement are identical except for the identity of the sub-advisor and the date. Therefore, the Board considered the information provided in connection with its review of the renewal of the Existing Agreement in determining whether to approve the New Agreement.
Based on the foregoing considerations, the Board, including a majority of Trustees who are not “interested persons” of the SCV Fund, the Manager or Newton, as that term is defined in the 1940 Act, concluded that the approval of the New Agreement was in the best interests of the SCV Fund and approved the New Agreement.
63
Trustees and Officers of the American Beacon FundsSM (Unaudited)
The Trustees and officers of the American Beacon Funds (the “Trust”) are listed below, together with their principal occupations during the past five years. The address of each person listed below is 220 Las Colinas Boulevard East, Suite 1200, Irving, Texas 75039. Each Trustee oversees thirty funds in the fund complex that includes the Trust, the American Beacon Select Funds, and the American Beacon Institutional Funds Trust. The Trust’s Statement of Additional Information contains additional information about the Trustees and is available without charge by calling 1-800-658-5811.
Name, Age | Position, Term of Office and Length of Time Served with the Trust | Principal Occupation(s) During Past 5 Years and Current Directorships | ||
| INTERESTED TRUSTEES | Term | |||
| Lifetime of Trust until removal, resignation or retirement* | ||||
| Eugene J. Duffy (67)** | Trustee since 2008 | Managing Director, Global Investment Management Distribution, Mesirow Financial Administrative Corporation (2016-Present); Managing Director, Institutional Services, Intercontinental Real Estate Corporation (2014-2016); Trustee, American Beacon Select Funds (2008-Present); Trustee, American Beacon Institutional Funds Trust (2017-Present); Trustee, American Beacon Sound Point Enhanced Income Fund (2018–2021); Trustee, American Beacon Apollo Total Return Fund (2018–2021). | ||
| NON-INTERESTED TRUSTEES | Term | |||
| Lifetime of Trust until removal, resignation or retirement* | ||||
| Gilbert G. Alvarado (51) | Trustee since 2015 | President, SJVIIF, LLC, Impact Investment Fund (2018-Present); Director, Kura MD, Inc. (local telehealth organization) (2015-2017); Senior Vice President & CFO, Sierra Health Foundation (health conversion private foundation) (2006-Present); Senior Vice President & CFO, Sierra Health Foundation: Center for Health Program Management (California public benefit corporation) (2012-Present); Director, Innovative North State (2012-2015); Director, Sacramento Regional Technology Alliance (2011-2016); Director, Valley Healthcare Staffing (2017–2018); Trustee, American Beacon Select Funds (2015-Present); Trustee, American Beacon Institutional Funds Trust (2017-Present); Trustee, American Beacon Sound Point Enhanced Income Fund (2018–2021); Trustee, American Beacon Apollo Total Return Fund (2018–2021). | ||
| Joseph B. Armes (59) | Trustee since 2015 | Director, Switchback Energy Acquisition (2019-2021); Chairman & CEO, CSW Industrials f/k/a Capital Southwest Corporation (investment company) (2015-Present); Chairman of the Board of Capital Southwest Corporation, predecessor to CSW Industrials, Inc. (2014-2017) (investment company); President & CEO, JBA Investment Partners (family investment vehicle) (2010-Present); Director and Chair of Audit Committee, RSP Permian (oil and gas producer) (2013-2018); Trustee, American Beacon Select Funds (2015-Present); Trustee, American Beacon Institutional Funds Trust (2017-Present); Trustee, American Beacon Sound Point Enhanced Income Fund (2018–2021); Trustee, American Beacon Apollo Total Return Fund (2018–2021). | ||
| Gerard J. Arpey (63) | Trustee since 2012 | Partner, Emerald Creek Group (private equity firm) (2011-Present); Director, S.C. Johnson & Son, Inc. (privately held company) (2008-present); Director, The Home Depot, Inc. (2015-Present); Trustee, American Beacon Select Funds (2012-Present); Trustee, American Beacon Institutional Funds Trust (2017-Present); Trustee, American Beacon Sound Point Enhanced Income Fund (2018–2021); Trustee, American Beacon Apollo Total Return Fund (2018–2021). | ||
64
Trustees and Officers of the American Beacon FundsSM (Unaudited)
Name, Age | Position, Term of Office and Length of Time Served with the Trust | Principal Occupation(s) During Past 5 Years and Current Directorships | ||
| NON-INTERESTED TRUSTEES (CONT.) | Term | |||
| Lifetime of Trust until removal, resignation or retirement* | ||||
| Brenda A. Cline (60) | Trustee since 2004 Chair since 2019 Vice Chair 2018 | Chief Financial Officer, Treasurer and Secretary, Kimbell Art Foundation (1993-Present); Director, Tyler Technologies, Inc. (public sector software solutions company) (2014-Present); Director, Range Resources Corporation (oil and natural gas company) (2015-Present); Trustee, Cushing Closed-End and Open-End Funds (2017-Present); Trustee, American Beacon Select Funds (2004-Present); Trustee, American Beacon Institutional Funds Trust (2017-Present); Trustee, American Beacon Sound Point Enhanced Income Fund (2018–2021); Trustee, American Beacon Apollo Total Return Fund (2018–2021). | ||
| Claudia A. Holz (64) | Trustee since 2018 | Partner, KPMG LLP (1990-2017); Independent Director, Blue Owl Capital Inc. (2021-Present); Trustee, American Beacon Select Funds (2018-Present); Trustee, American Beacon Institutional Funds Trust (2018-Present); Trustee, American Beacon Sound Point Enhanced Income Fund (2018–2021); Trustee, American Beacon Apollo Total Return Fund (2018–2021). | ||
| Douglas A. Lindgren (59) | Trustee since 2018 | CEO North America, Carne Global Financial Services (2016-2017); Consultant, Carne Financial Services (2017-2019); Managing Director, IPS Investment Management and Global Head, Content Management, UBS Wealth Management (2010-2016); Trustee, American Beacon Select Funds (2018-Present); Trustee, American Beacon Institutional Funds Trust (2018-Present); Trustee, American Beacon Sound Point Enhanced Income Fund (2018–2021); Trustee, American Beacon Apollo Total Return Fund (2018–2021). | ||
| Barbara J. McKenna, CFA (58) | Trustee since 2012 | President/Managing Principal, Longfellow Investment Management Company (2005-Present); Trustee, American Beacon Select Funds (2012-Present); Trustee, American Beacon Institutional Funds Trust (2017-Present); Trustee, American Beacon Sound Point Enhanced Income Fund (2018–2021); Trustee, American Beacon Apollo Total Return Fund (2018–2021). | ||
65
Trustees and Officers of the American Beacon FundsSM (Unaudited)
Name, Age | Position, Term of Office and Length of Time Served with the Trust | Principal Occupation(s) During Past 5 Years and Current Directorships | ||
| OFFICERS | Term | |||
| One Year | ||||
| Gene L. Needles, Jr. (66) | President since 2009 | President (2009-2018), CEO and Director (2009–Present), and Chairman (2018-Present), American Beacon Advisors, Inc., President (2015-2018), Director and CEO (2015–Present), and Chairman (2018-Present), Resolute Investment Holdings, LLC; President (2015-2018), Director and CEO (2015-Present), and Chairman (2018-Present),Resolute Topco, Inc.; President (2015-2018); Director, and CEO (2015-Present), and Chairman (2018-Present), Resolute Acquisition, Inc.; President (2015-2018), Director and CEO (2015-Present), Chairman (2018-Present), Resolute Investment Managers, Inc.; Director, Chairman, President and CEO, Resolute Investment Distributors (2017-Present); Director, Chairman, President and CEO; Resolute Investment Services, Inc. (2017-Present); Manager, President and CEO, American Private Equity Management, LLC (2012-Present); Director, Chairman, President and CEO, Alpha Quant Advisors, LLC (2016-2020); Director, ARK Investment Management LLC (2016-2020); Director, Shapiro Capital Management LLC (2017-Present); Director, Chairman and CEO, Continuous Capital, LLC (2018-Present); Director, Green Harvest Asset Management (2019-Present); Director, National Investment Services of America, LLC (2019 – Present); Director, RSW Investments Holdings LLC, (2019-Present); Manager, SSI Investment Management, LLC (2019-Present); President, American Beacon Cayman Managed Futures Strategy Fund, Ltd. (2014-Present); Director and President, American Beacon Cayman Transformational Innovation Company, LTD., (2017-2018); President, American Beacon Delaware Transformational Innovation Corporation (2017-2018); President American Beacon Cayman TargetRisk Company, Ltd. (2018-Present); Member, Investment Advisory Committee, Employees Retirement System of Texas (2017-Present); Trustee, American Beacon NextShares Trust (2015-2020); President, American Beacon Select Funds (2009-Present); President, American Beacon Institutional Funds Trust (2017-Present); President, American Beacon Sound Point Enhanced Income Fund (2018-2021); President, American Beacon Apollo Total Return Fund (2018-2021). | ||
| Rosemary K. Behan (62) | VP, Secretary and Chief Legal Officer since 2006 | Senior Vice President (2021-Present), Vice President(2006-2021), Secretary and General Counsel (2006-Present), American Beacon Advisors, Inc.; Secretary, Resolute Investment Holdings, LLC (2015-Present); Secretary, Resolute Topco, Inc. (2015-Present); Secretary, Resolute Acquisition, Inc. (2015–Present); Senior Vice President (2021-Present), Vice President(2015-2021), Secretary and General Counsel (2015-Present), Resolute Investment Managers, Inc.; Secretary, Resolute Investment Distributors, Inc. (2017-Present); Senior Vice President (2021-Present), Vice President(2017-2021), Secretary and General Counsel (2017-Present), Resolute Investment Services, Inc.; Secretary, American Private Equity Management, LLC (2008-Present); Secretary and General Counsel, Alpha Quant Advisors, LLC (2016-2020); Vice President and Secretary, Continuous Capital, LLC (2018-Present); Secretary, Green Harvest Asset Management (2019-2021); Secretary, American Beacon Delaware Transformational Innovation Corporation (2017-2018); Secretary, American Beacon Cayman Transformational Innovation Company, Ltd. (2017-2018); Secretary, American Beacon Cayman Managed Futures Strategy Fund, Ltd. (2014-Present); Secretary, American Beacon Cayman TargetRisk Company, Ltd (2018-Present); Chief Legal Officer, Vice President and Secretary, American Beacon Select Funds (2006-Present); Chief Legal Officer, Vice President and Secretary, American Beacon Institutional Funds Trust (2017-Present); Chief Legal Officer, Vice President and Secretary, American Beacon Sound Point Enhanced Income Fund (2018-2021); Chief Legal Officer, Vice President and Secretary American Beacon Apollo Total Return Fund (2018-2021). | ||
66
Trustees and Officers of the American Beacon FundsSM (Unaudited)
Name, Age | Position, Term of Office and Length of Time Served with the Trust | Principal Occupation(s) During Past 5 Years and Current Directorships | ||
| OFFICERS (CONT.) | Term | |||
| One Year | ||||
| Brian E. Brett (61) | VP since 2004 | Senior Vice President, Head of Distribution (2012-Present), American Beacon Advisors, Inc.; Senior Vice President, Resolute Investment Managers, Inc. (2017-Present); Senior Vice President, Resolute Investment Distributors, Inc. (2018-Present); Senior Vice President, Resolute Investment Services, Inc. (2018-Present); Vice President, American Beacon Select Funds (2004-Present); Vice President, American Beacon Institutional Funds Trust (2017-Present); Vice President American Beacon Sound Point Enhanced Income Fund (2018-2021); Vice President American Beacon Apollo Total Return Fund (2018-2021). | ||
| Paul B. Cavazos (52) | VP since 2016 | Chief Investment Officer and Senior Vice President, American Beacon Advisors, Inc. (2016-Present); Chief Investment Officer, DTE Energy (2007-2016); Vice President, American Private Equity Management, L.L.C. (2017–Present); Vice President, American Beacon Select Funds (2016-Present); Vice President, American Beacon Institutional Funds Trust (2017-Present); Vice President American Beacon Sound Point Enhanced Income Fund (2018-2021); Vice President American Beacon Apollo Total Return Fund (2018-2021). | ||
| Erica Duncan (51) | VP since 2011 | Vice President, American Beacon Advisors, Inc. (2011-Present); Vice President, Resolute Investment Managers (2018-Present); Vice President, Resolute Investment Services, Inc. (2018-Present); Vice President, American Beacon Select Funds (2011-Present); Vice President, American Beacon Institutional Funds Trust (2017-Present); Vice President American Beacon Sound Point Enhanced Income Fund (2018-2021); Vice President American Beacon Apollo Total Return Fund (2018-2021). | ||
| Melinda G. Heika (60) | VP since 2021 Principal Accounting Officer and Treasurer (2010-2021) | Senior Vice President (2021-Present), Treasurer and CFO (2010-Present), American Beacon Advisors, Inc.; Treasurer, Resolute Topco, Inc. (2015-Present); Treasurer, Resolute Investment Holdings, LLC. (2015-Present); Treasurer, Resolute Acquisition, Inc. (2015-Present); Senior Vice President (2021-Present), Treasurer and CFO, Resolute Investment Managers, Inc. (2017-Present); Treasurer, Resolute Investment Distributors, Inc. (2017); Senior Vice President (2021-Present); Treasurer and CFO, Resolute Investment Services, Inc. (2015-Present); Treasurer, American Private Equity Management, LLC (2012-Present); Treasurer and CFO, Alpha Quant Advisors, LLC (2016-2020); Treasurer and CFO, Continuous Capital, LLC (2018-Present); Treasurer, American Beacon Cayman Transformational Innovation, Ltd. (2017-2018); Treasurer, American Beacon Delaware Transformational Innovation Corporation (2017-2018); Director and Treasurer, American Beacon Cayman Managed Futures Strategy Fund, Ltd. (2014-Present); Treasurer, American Beacon Cayman TargetRisk Company, Ltd. (2018-Present); Vice President (2021-Present), Principal Accounting Officer (2017-2021) and Treasurer (2010-2021), American Beacon Select Funds; Vice President (2021–Present), Principal Accounting Officer and Treasurer (2017-2021), American Beacon Institutional Funds Trust; Vice President (2021), Principal Accounting Officer and Treasurer (2018-2021), American Beacon Sound Point Enhanced Income Fund; Vice President (2021), Principal Accounting Officer and Treasurer, American Beacon Apollo Total Return Fund (2018-2021). | ||
67
Trustees and Officers of the American Beacon FundsSM (Unaudited)
Name, Age | Position, Term of Office and Length of Time Served with the Trust | Principal Occupation(s) During Past 5 Years and Current Directorships | ||
| OFFICERS (CONT.) | Term | |||
| One Year | ||||
| Terri L. McKinney (57) | VP since 2010 | Senior Vice President (2021-Present), Vice President (2009-2021), American Beacon Advisors, Inc.; Senior Vice President (2021–Present); Vice President (2017-2021), Resolute Investment Managers, Inc.; Senior Vice President (2021-Present), Vice President (2018-Present), Resolute Investment Services, Inc; Vice President, Alpha Quant Advisors, LLC (2016-2020); Vice President, Continuous Capital, LLC (2018-Present); Vice President, American Beacon Select Funds (2010-Present); Vice President, American Beacon Institutional Funds Trust (2017-Present); Vice President, American Beacon Sound Point Enhanced Income Fund (2018-2021); Vice President, American Beacon Apollo Total Return Fund (2018-2021). | ||
| Jeffrey K. Ringdahl (46) | VP since 2010 | Director (2015-Present), President (2018-Present), Chief Operating Officer (2010-Present), Senior Vice President (2013-2018), American Beacon Advisors, Inc.; Director (2015-Present), President (2018-Present), Senior Vice President (2015-2018), Resolute Investment Holdings, LLC; Director (2015-Present), President (2018-Present), Senior Vice President (2015-2018), Resolute Topco, Inc.; Director (2015-Present), President (2018-Present), Senior Vice President (2015-2018), Resolute Acquisition, Inc.; Director (2015-Present), President & COO (2018-Present), Senior Vice President (2015-2018), Resolute Investment Managers, Inc.; Director and Executive Vice President (2017-Present), Resolute Investment Distributors, Inc.; Director (2017-Present), President & COO (2018-Present), Executive Vice President (2017-2018), Resolute Investment Services, Inc.; Senior Vice President (2017-Present), Vice President (2012-2017), Manager (2015-Present), American Private Equity Management, LLC; Trustee, American Beacon NextShares Trust (2015-2020); Director, Executive Vice President & COO, Alpha Quant Advisors, LLC (2016-2020); Director, Shapiro Capital Management, LLC (2017-Present); Director, Executive Vice President & COO, Continuous Capital, LLC (2018-Present); Director, RSW Investments Holdings LLC, (2019-Present); Manager, SSI Investment Management, LLC (2019-Present); Director, National Investment Services of America, LLC (2019-Present); Director and Vice President, American Beacon Cayman Transformational Innovation Company, Ltd., (2017-Present); Vice President, American Beacon Delaware Transformational Innovation Corporation (2017-2018); Director and Vice President, American Beacon Cayman Managed Futures Strategy Fund, Ltd. (2014-Present); Vice President, American Beacon Cayman TargetRisk Company, Ltd (2018-Present); Vice President, American Beacon Select Funds (2010-2018); Vice President, American Beacon Institutional Funds Trust (2017-Present); Vice President, American Beacon Sound Point Enhanced Income Fund (2018-2021); Vice President, American Beacon Apollo Total Return Fund (2018-2021). | ||
| Samuel J. Silver (58) | VP since 2011 | Vice President (2011-Present), Chief Fixed Income Officer (2016-Present), American Beacon Advisors, Inc. (2011-Present); Vice President, American Beacon Select Funds (2011-Present); Vice President, American Beacon Institutional Funds Trust (2017-Present); Vice President, American Beacon Sound Point Enhanced Income Fund (2018-2021); Vice President, American Beacon Apollo Total Return Fund (2018-2021). | ||
68
Trustees and Officers of the American Beacon FundsSM (Unaudited)
Name, Age | Position, Term of Office and Length of Time Served with the Trust | Principal Occupation(s) During Past 5 Years and Current Directorships | ||
| OFFICERS (CONT.) | Term | |||
| One Year | ||||
| Christina E. Sears (50) | Chief Compliance Officer since 2004 and Asst. Secretary since 1999 | Vice President, American Beacon Advisors, Inc. (2019-Present); Chief Compliance Officer, American Beacon Advisors, Inc. (2004-Present); Vice President, Resolute Investment Managers, Inc. (2017-Present); Vice President, Resolute Investment Distributors (2017-Present); Vice President, Resolute Investment Services, Inc. (2019-Present); Chief Compliance Officer, American Private Equity Management, LLC (2012-Present); Chief Compliance Officer, Green Harvest Asset Management, LLC (2019-Present); Chief Compliance Officer, RSW Investments Holdings, LLC (2019-Present); Chief Compliance Officer (2016-2019) and Vice President, Alpha Quant Advisors, LLC (2016-2020); Vice President, Continuous Capital, LLC (2018-Present); Chief Compliance Officer (2004-Present) and Assistant Secretary (1999-Present), American Beacon Select Funds; Chief Compliance Officer and Assistant Secretary, American Beacon Institutional Funds Trust (2017-Present); Chief Compliance Officer and Assistant Secretary, American Beacon Sound Point Enhanced Income Fund (2018-2021); Chief Compliance Officer and Assistant Secretary, American Beacon Apollo Total Return Fund (2018-2021). | ||
| Sonia L. Bates (64) | Principal Accounting Officer and Treasurer since 2021 Assistant Treasurer (2011-2021) | Assistant Treasurer, American Beacon Advisors, Inc. (2011-2018); Assistant Treasurer, American Private Equity Management, LLC (2012-Present); Assistant Treasurer, American Beacon Cayman Transformational Innovation Company, Ltd. (2017-Present); Assistant Treasurer, American Beacon Cayman TargetRisk Company, Ltd. (2018-Present); Principal Accounting Officer and Treasurer (2021-Present), Assistant Treasurer (2011-2021), American Beacon Select Funds; Principal Accounting Officer and Treasurer (2021-Present), Assistant Treasurer (2017-2021), American Beacon Institutional Funds Trust; Principal Accounting Officer and Treasurer (2021), Assistant Treasurer (2018-2021), American Beacon Sound Point Enhanced Income Fund; Principal Accounting Officer and Treasurer (2021), Assistant Treasurer (2018-2021), American Beacon Apollo Total Return Fund. | ||
| Shelley L. Dyson (51) | Assistant Treasurer since 2021 | Assistant Treasurer, American Beacon Select Funds (2021-Present); Assistant Treasurer, American Beacon Institutional Funds Trust (2021-Present); Assistant Treasurer, American Beacon Sound Point Enhanced Income Fund (2021); Assistant Treasurer, American Beacon Apollo Total Return Fund (2021). | ||
| Shelley D. Abrahams (46) | Assistant Secretary since 2008 | Assistant Secretary, American Beacon Select Funds (2008-Present); Assistant Secretary, American Beacon Institutional Funds Trust (2017-Present); Assistant Secretary, American Beacon Sound Point Enhanced Income Fund (2018-2021); Assistant Secretary, American Beacon Apollo Total Return Fund (2018-2021). | ||
| Rebecca L. Harris (54) | Assistant Secretary since 2010 | Senior Vice President (2021-Present), Vice President (2011-Present), American Beacon Advisors, Inc.; Senior Vice President (2021-Present), Vice President (2017-Present), Resolute Investment Managers, Inc.; Senior Vice President (2021-Present), Vice President (2015-Present), Resolute Investment Services; Vice President, Alpha Quant Advisors, LLC (2016-2020); Vice President, Continuous Capital, LLC (2018-Present); Assistant Secretary, American Beacon Select Funds (2010-Present); Assistant Secretary, American Beacon Institutional Funds Trust (2017-Present); Assistant Secretary, American Beacon Sound Point Enhanced Income Fund (2018-2021); Assistant Secretary, American Beacon Apollo Total Return Fund (2018-2021). | ||
69
Trustees and Officers of the American Beacon FundsSM (Unaudited)
Name, Age | Position, Term of Office and Length of Time Served with the Trust | Principal Occupation(s) During Past 5 Years and Current Directorships | ||
| OFFICERS (CONT.) | Term | |||
| One Year | ||||
| Teresa A. Oxford (63) | Assistant Secretary since 2015 | Assistant Secretary, American Beacon Advisors, Inc. (2015-Present); Assistant Secretary, Resolute Investment Distributors (2018-2021); Assistant Secretary, Resolute Investment Managers, Inc. (2017-Present); Assistant Secretary, Resolute Investment Services (2018-Present); Assistant Secretary, Alpha Quant Advisors, LLC (2016-2020); Assistant Secretary, Continuous Capital, LLC (2020-Present); Assistant Secretary, American Beacon Select Funds (2015-Present); Assistant Secretary, American Beacon Institutional Funds Trust (2017-Present); Assistant Secretary, American Beacon Sound Point Enhanced Income Fund (2018-2021); Assistant Secretary, American Beacon Apollo Total Return Fund (2018-2021). | ||
| Michael D. Jiang (36) | Assistant Secretary since 2021 | Assistant Secretary (2021-Present), Resolute Investment Distributors, Inc.; Associate General Counsel (2021-Present), Resolute Investment Services, Inc.; Vice President (2018-2021), The Northern Trust Company; Second Vice President (2015-2018), The Northern Trust Company. Assistant Secretary, American Beacon Select Funds (2021-Present); Assistant Secretary, American Beacon Institutional Funds Trust (2021-Present); Assistant Secretary, American Beacon Sound Point Enhanced Income Fund (2021); Assistant Secretary, American Beacon Apollo Total Return Fund (2021). | ||
* As of 11/12/2014, the Board adopted a retirement plan that requires Trustees to retire no later than the last day of the calendar year in which they reach the age of 75.
** Mr. Duffy is being deemed to be an “interested person” of the Trust, as defined by the Investment Company Act of 1940, as amended, by virtue of his position with Mesirow Financial, Inc., a broker-dealer.
70
American Beacon FundsSM
October 31, 2021 (Unaudited)
The American Beacon Funds recognize and respect the privacy of our shareholders. We are providing this notice to you so you will understand how shareholder information may be collected and used.
We may collect nonpublic personal information about you from one or more of the following sources:
| • | information we receive from you on applications or other forms; |
| • | information about your transactions with us or our service providers; and |
| • | information we receive from third parties. |
We do not disclose any nonpublic personal information about our customers or former customers to anyone, except as permitted by law.
We restrict access to your nonpublic personal information to those employees or service providers who need to know that information to provide products or services to you. To ensure the confidentiality of your nonpublic personal information, we maintain safeguards that comply with federal standards.
71
This page intentionally left blank.
72

Shareholder reports are available online at www.americanbeaconfunds.com/reports. Please be advised that reports are no longer sent by mail. Instead, the reports are made available online, and you will be notified by mail each time a report is posted online. You will be provided with a website link to access the report. You may elect to receive all future reports in paper free of charge. You can request to continue receiving paper copies by calling 1-866-345-5954, or you may directly inform your financial intermediary. Detailed instructions are also included in your report notifications.
If you invest in the Fund through a financial institution, you may be able to receive the Fund’s regulatory mailings, such as the Prospectus, Annual Report and Semi-Annual Report, by e-mail. If you are interested in this option, please go to www.icsdelivery.com and search for your financial institution’s name or contact your financial institution directly.
To obtain more information about the Fund:
 |  | |
| By E-mail: | On the Internet: | |
| american_beacon.funds@ambeacon.com | Visit our website at www.americanbeaconfunds.com | |
By Telephone: Call (800) 658-5811 |
By Mail: American Beacon Funds P.O. Box 219643 Kansas City, MO 64121-9643 | |
| Availability of Quarterly Portfolio Schedules | Availability of Proxy Voting Policy and Records | |
| In addition to the Schedule of Investments provided in each semi-annual and annual report, the Fund files a complete schedule of its portfolio holdings with the Securities and Exchange Commission (“SEC”) on Form N-PORT as of the end of each fiscal quarter. The Fund’s Forms N-PORT are available on the SEC’s website at www.sec.gov. The Forms N-PORT may also be reviewed and copied at the SEC’s Public Reference Section, 100 F Street, NE, Washington, D.C. 20549-1520. Information regarding the operation of the SEC’s Public Reference Room may be obtained by calling (800)-SEC-0330. A complete schedule of the Fund’s portfolio holdings is also available at www.americanbeaconfunds.com approximately twenty days after the end of each month. | A description of the policies and procedures the Fund uses to determine how to vote proxies relating to portfolio securities is available in the Fund’s Statement of Additional Information, is available free of charge on the Fund’s website www.americanbeaconfunds.com and by calling 1-800-967-9009 or by accessing the SEC’s website at www.sec.gov. The Fund’s proxy voting record for the most recent year ended June 30 is filed annually with the SEC on Form N-PX. The Fund’s Forms N-PX are available on the SEC’s website at www.sec.gov. The Fund’s proxy voting record may also be obtained by calling 1-800-967-9009. | |


Fund Service Providers:
CUSTODIAN State Street Bank and Trust Company Boston, Massachusetts | TRANSFER AGENT DST Asset Manager Solutions, Inc. Quincy, Massachusetts | INDEPENDENT REGISTERED PUBLIC ACCOUNTING FIRM Ernst & Young LLP Dallas, Texas | DISTRIBUTOR Resolute Investment Distributors, Inc. Irving, Texas |
This report is prepared for shareholders of the American Beacon Funds and may be distributed to others only if preceded or accompanied by a current Prospectus or Summary Prospectus.
American Beacon Funds and American Beacon Small Cap Value Fund are service marks of American Beacon Advisors, Inc.
AR 10/21
| ITEM 2. | CODE OF ETHICS. |
The Trust adopted a code of ethics that applies to its principal executive and financial officers (the “Code”). The Trust amended its code July 6, 2021 to remove two terminated investment companies and update the Principal Financial Officer. The Trust did not grant any waivers to the provisions of the Code during the period covered by the shareholder reports presented in Item 1. The Code is filed herewith as Exhibit 99.CODE ETH.
| ITEM 3. | AUDIT COMMITTEE FINANCIAL EXPERT. |
The Trust’s Board of Trustees has determined that Gilbert G. Alvarado and Claudia Holz, members of the Trust’s Audit and Compliance Committee, are “audit committee financial experts” as defined in Form N-CSR. Mr. Gilbert Alvarado and Ms. Claudia Holz are “independent” as defined in Form N-CSR.
| ITEM 4. | PRINCIPAL ACCOUNTANT FEES AND SERVICES. |
(a) Audit Fees | Fiscal Year Ended | |||
$286,669 | 10/31/2020 | |||
$297,311 | 10/31/2021 | |||
(b) Audit Related Fees | Fiscal Year Ended | |||
$0 | 10/31/2020 | |||
$0 | 10/31/2021 | |||
(c) Tax Fees(1) | Fiscal Year Ended | |||
$48,125 | 10/31/2020 | |||
$174,247 | 10/31/2021 | |||
(d) All Other Fees | Fiscal Year Ended | |||
$0 | 10/31/2020 | |||
$0 | 10/31/2021 | |||
(1) “Tax Fees” are the aggregate fees billed for professional services for tax advice, tax compliance, tax planning, filing assistance for EU reclaims and PFIC tax services. These fees include international, federal, state, and excise tax reviews.
(e)(1) Pursuant to its charter, the Trust’s Audit and Compliance Committee shall have the following duties and powers pertaining to pre-approval of audit and non-audit services provided by the Trust’s principal accountant:
| • | to approve, prior to appointment, the engagement of auditors to annually audit and provide their opinion on the Trusts’ financial statements, and, in connection therewith, reviewing and evaluating matters potentially affecting the independence and capabilities of the auditors; |
| • | to approve, prior to appointment, the engagement of the auditors to provide non-audit services to the Trusts, an investment adviser to any series of the Trusts or any entity controlling, controlled by, or under common control with an investment adviser (“adviser affiliate”) that provides ongoing services to the Trusts, if the engagement relates directly to the operations and financial reporting of the Trusts; |
| • | to consider whether the non-audit services provided by a Trust’s auditor to an investment adviser or any adviser affiliate that provides ongoing services to a series of the Trusts, which services were not pre-approved by the Committee, are compatible with maintaining the auditor’s independence; |
| • | to review the arrangements for and scope of the annual audit and any special audits; and |
| • | to review and approving the fees proposed to be charged to the Trusts by the auditors for each audit and non-audit service. |
The Audit and Compliance Committee may delegate any portion of its authority, including the authority to grant pre-approvals of audit and permitted non-audit services, to a subcommittee of one or more members. Any decisions of the subcommittee to grant pre-approvals shall be presented to the full audit committee at its next regularly scheduled meeting.
(e)(2) None of the fees disclosed in paragraphs (b) through (d) above were approved by the audit committee pursuant to paragraph (c)(7)(i)(C) of Rule 2-01 of Regulation S-X.
(f) Not applicable.
(g) Aggregate Non-Audit Fees for Services Rendered to the:
Registrant | Adviser | Adviser’s Affiliates Providing Ongoing Services to Registrant | Fiscal Year Ended | |||||
$ 48,125 | $221,475 | N/A | 10/31/2020 | |||||
$ 174,247 | $142,936 | N/A | 10/31/2021 | |||||
(h) Not applicable.
| ITEM 5. | AUDIT COMMITTEE OF LISTED REGISTRANTS. |
Not applicable.
| ITEM 6. | SCHEDULE OF INVESTMENTS. |
The schedules of investments for each series of the Trust are included in the shareholder reports presented in Item 1.
| ITEM 7. | DISCLOSURE OF PROXY VOTING POLICIES AND PROCEDURES FOR CLOSED-END MANAGEMENT INVESTMENT COMPANIES. |
Not applicable.
| ITEM 8. | PORTFOLIO MANAGERS OF CLOSED-END MANAGEMENT INVESTMENT COMPANIES. |
Not applicable.
| ITEM 9. | PURCHASES OF EQUITY SECURITIES BY CLOSED-END MANAGEMENT INVESTMENT COMPANY AND AFFILIATED PURCHASERS. |
Not applicable.
| ITEM 10. | SUBMISSION OF MATTERS TO A VOTE OF SECURITY HOLDERS. |
The Trust has made no material changes to the procedures by which shareholders may recommend nominees to the Trust’s Board of Trustees since the Trust last disclosed such procedures in Schedule 14A.
| ITEM 11. | CONTROLS AND PROCEDURES. |
(a) Based upon an evaluation within 90 days of the filing date of this report, the principal executive and financial officers concluded that the disclosure controls and procedures of the Trust are effective.
(b) There were no changes in the Trust’s internal control over financial reporting during the second fiscal quarter of the period covered by this report that has materially affected, or is reasonably likely to materially affect, the Trust’s internal control over financial reporting.
| ITEM 12 | DISCLOSURE OF SECURITIES LENDING ACTIVITIES FOR CLOSED-END MANAGMENT INVESTMENT COMPANIES. |
Not Applicable.
| ITEM 13. | EXHIBITS. |
(a)(1) Filed herewith as EX-99.CODE ETH.
(a)(3) Not applicable.
SIGNATURES
Pursuant to the requirements of the Securities Exchange Act of 1934 and the Investment Company Act of 1940, the registrant has duly caused this report to be signed on its behalf by the undersigned, thereunto duly authorized.
(Registrant): American Beacon Funds
| By /s/ Gene L. Needles, Jr. |
| Gene L. Needles, Jr. |
| President |
| American Beacon Funds |
Date: January 6, 2022
Pursuant to the requirements of the Securities Exchange Act of 1934 and the Investment Company Act of 1940, this report has been signed below by the following persons on behalf of the registrant and in the capacities and on the dates indicated.
| By /s/ Gene L. Needles, Jr. |
| Gene L. Needles, Jr. |
| President |
| American Beacon Funds |
Date: January 6, 2022
| By /s/ Sonia L. Bates |
| Sonia L. Bates |
| Treasurer |
| American Beacon Funds |
Date: January 6, 2022