0000809593americanbeacon:C000176826Member2023-03-310000809593americanbeacon:C000192444Memberamericanbeacon:ZimmerBiometHoldingsIncCTIMember2024-06-300000809593americanbeacon:AMERICANBEACONINDEXRUSSELL2500VALUEINDEX717BroadBasedIndexMember2017-11-300000809593americanbeacon:C000207660Member2023-03-310000809593americanbeacon:C000180738Member2018-09-30
UNITED STATES
SECURITIES AND EXCHANGE COMMISSION
Washington, D.C. 20549
FORM N-CSR
CERTIFIED SHAREHOLDER REPORT OF REGISTERED
MANAGEMENT INVESTMENT COMPANIES
Investment Company Act file number: 811-4984
AMERICAN BEACON FUNDS
(Exact name of registrant as specified in charter)
220 East Las Colinas Boulevard, Suite 1200
Irving, Texas 75039
(Address of principal executive offices)-(Zip code)
GREGORY STUMM, PRESIDENT
220 East Las Colinas Boulevard, Suite 1200
Irving, Texas 75039
(Name and address of agent for service)
Registrant’s telephone number, including area code: (817) 391-6100
Date of fiscal year end: June 30, 2024
Date of reporting period: June 30, 2024
Form N-CSR is to be used by management investment companies to file reports with the Commission not later than 10 days after the transmission to stockholders of any report that is required to be transmitted to stockholders under Rule 30e-1 under the Investment Company Act of 1940 (17 CFR 270.30e-1). The Commission may use the information provided on Form N-CSR in its regulatory, disclosure review, inspection, and policymaking roles.
A registrant is required to disclose the information specified by Form N-CSR, and the Commission will make this information public. A registrant is not required to respond to the collection of information contained in Form N-CSR unless the Form displays a currently valid Office of Management and Budget (“OMB”) control number. Please direct comments concerning the accuracy of the information collection burden estimate and any suggestions for reducing the burden to Secretary, Securities and Exchange Commission, 450 Fifth Street, NW, Washington, DC 20549-0609. The OMB has reviewed this collection of information under the clearance requirements of 44 U.S.C. § 3507.
Item 1. Reports to Shareholders
ARK Transformational Innovation Fund
Annual Shareholder Report - June 30, 2024
This annual shareholder report contains important information about American Beacon ARK Transformational Innovation Fund for the period of July 1, 2023 to June 30, 2024. You can find additional information about the Fund at www.americanbeaconfunds.com/literature. You can also request this information by contacting us at 800-658-5811.
What were the Fund costs for last year?
(based on a hypothetical $10,000 investment)
| Class Name | Cost of a $10,000 investment | Costs paid as a percentage of a $10,000 investment |
|---|
| Class A | $135 | 1.35% |
How did the Fund perform last year and what affected its performance?
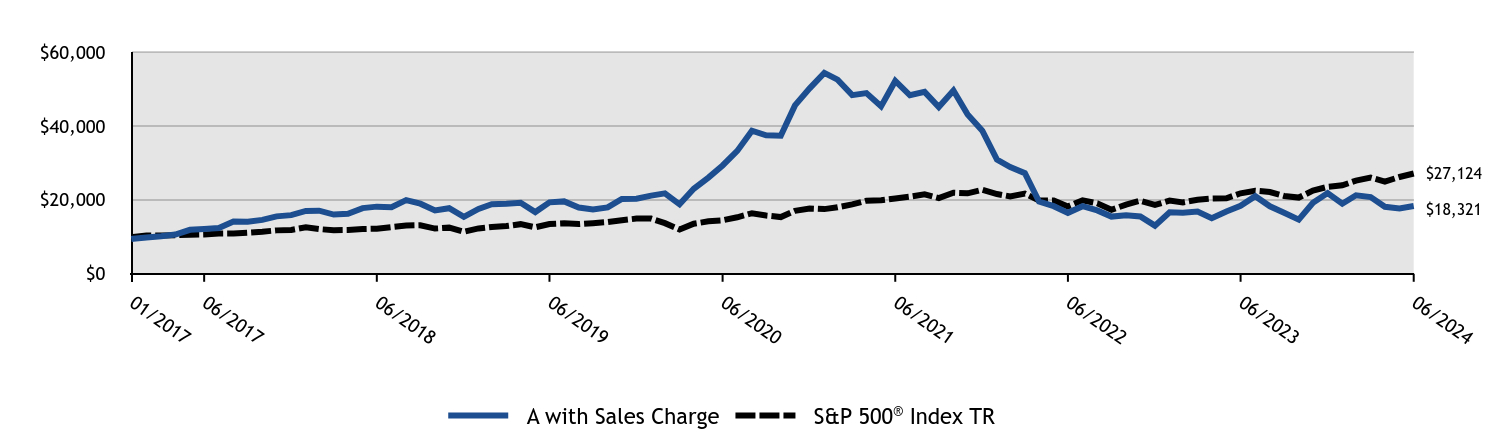
The A Class of the Fund returned -6.15% (with sales charges) and -0.42% (without sales charges) for the twelve months ended June 30, 2024, compared to the S&P 500 Index return of 24.56%.
• Overall market performance during the period was narrowly driven by megacap growth companies as interest rates remained higher for longer than anticipated, which hindered the Fund’s investment strategy of investing in transformational innovation companies.
• The Fund’s investments in the capital markets industry materially helped performance for the period. Conversely, its investments in the health care providers & services and health care equipment and supplies industries materially detracted from performance.
Cumulative Performance from January 27, 2017 through June 30, 2024
The initial investment, based on a $10,000 investment, is adjusted to reflect the maximum applicable sales charge, if any.
| A with Sales Charge | S&P 500® Index TR |
|---|
| 01/2017 | $9,425 | $10,000 |
| 01/2017 | $9,500 | $9,932 |
| 02/2017 | $9,802 | $10,326 |
| 03/2017 | $10,141 | $10,338 |
| 04/2017 | $10,622 | $10,444 |
| 05/2017 | $11,894 | $10,591 |
| 06/2017 | $12,130 | $10,657 |
| 07/2017 | $12,385 | $10,876 |
| 08/2017 | $14,138 | $10,910 |
| 09/2017 | $14,090 | $11,135 |
| 10/2017 | $14,590 | $11,395 |
| 11/2017 | $15,533 | $11,744 |
| 12/2017 | $15,861 | $11,875 |
| 01/2018 | $17,003 | $12,554 |
| 02/2018 | $17,081 | $12,092 |
| 03/2018 | $16,017 | $11,784 |
| 04/2018 | $16,251 | $11,830 |
| 05/2018 | $17,775 | $12,115 |
| 06/2018 | $18,165 | $12,189 |
| 07/2018 | $18,029 | $12,643 |
| 08/2018 | $19,943 | $13,055 |
| 09/2018 | $18,966 | $13,129 |
| 10/2018 | $17,120 | $12,232 |
| 11/2018 | $17,745 | $12,481 |
| 12/2018 | $15,388 | $11,354 |
| 01/2019 | $17,538 | $12,264 |
| 02/2019 | $18,839 | $12,658 |
| 03/2019 | $18,933 | $12,904 |
| 04/2019 | $19,216 | $13,426 |
| 05/2019 | $16,688 | $12,573 |
| 06/2019 | $19,321 | $13,459 |
| 07/2019 | $19,583 | $13,652 |
| 08/2019 | $17,937 | $13,436 |
| 09/2019 | $17,370 | $13,687 |
| 10/2019 | $17,947 | $13,984 |
| 11/2019 | $20,244 | $14,492 |
| 12/2019 | $20,312 | $14,929 |
| 01/2020 | $21,157 | $14,923 |
| 02/2020 | $21,752 | $13,695 |
| 03/2020 | $18,795 | $12,003 |
| 04/2020 | $22,987 | $13,542 |
| 05/2020 | $26,010 | $14,187 |
| 06/2020 | $29,303 | $14,469 |
| 07/2020 | $33,246 | $15,285 |
| 08/2020 | $38,706 | $16,384 |
| 09/2020 | $37,460 | $15,761 |
| 10/2020 | $37,363 | $15,342 |
| 11/2020 | $45,552 | $17,021 |
| 12/2020 | $50,167 | $17,676 |
| 01/2021 | $54,351 | $17,497 |
| 02/2021 | $52,504 | $17,980 |
| 03/2021 | $48,341 | $18,767 |
| 04/2021 | $48,885 | $19,769 |
| 05/2021 | $45,298 | $19,907 |
| 06/2021 | $52,167 | $20,371 |
| 07/2021 | $48,287 | $20,855 |
| 08/2021 | $49,211 | $21,490 |
| 09/2021 | $45,113 | $20,490 |
| 10/2021 | $49,591 | $21,926 |
| 11/2021 | $43,081 | $21,774 |
| 12/2021 | $38,699 | $22,750 |
| 01/2022 | $30,883 | $21,572 |
| 02/2022 | $28,850 | $20,926 |
| 03/2022 | $27,230 | $21,703 |
| 04/2022 | $19,527 | $19,811 |
| 05/2022 | $18,291 | $19,847 |
| 06/2022 | $16,486 | $18,209 |
| 07/2022 | $18,277 | $19,888 |
| 08/2022 | $17,140 | $19,077 |
| 09/2022 | $15,477 | $17,320 |
| 10/2022 | $15,846 | $18,722 |
| 11/2022 | $15,520 | $19,768 |
| 12/2022 | $13,024 | $18,629 |
| 01/2023 | $16,622 | $19,800 |
| 02/2023 | $16,498 | $19,317 |
| 03/2023 | $16,856 | $20,026 |
| 04/2023 | $15,049 | $20,339 |
| 05/2023 | $16,872 | $20,427 |
| 06/2023 | $18,383 | $21,777 |
| 07/2023 | $21,000 | $22,476 |
| 08/2023 | $18,258 | $22,118 |
| 09/2023 | $16,513 | $21,064 |
| 10/2023 | $14,644 | $20,621 |
| 11/2023 | $19,193 | $22,504 |
| 12/2023 | $21,826 | $23,527 |
| 01/2024 | $18,944 | $23,922 |
| 02/2024 | $21,249 | $25,199 |
| 03/2024 | $20,766 | $26,010 |
| 04/2024 | $18,118 | $24,948 |
| 05/2024 | $17,682 | $26,185 |
| 06/2024 | $18,321 | $27,124 |
Average Annual Total Returns (%)
| 1 Year | 5 Years | Since Inception (1/27/17) |
|---|
Class A without Sales Charge Footnote Reference1 | (0.42)% | (1.07)% | 9.36% |
Class A with Maximum Sales Charge - 5.75%Footnote Reference1 | (6.15)% | (2.24)% | 8.49% |
S&P 500® Index TR | 24.56% | 15.05% | 14.39% |
| Footnote | Description |
Footnote1 | Return may differ from actual shareholder return due to accounting adjustments for financial reporting purposes. |
Performance shown is historical and is not indicative of future returns. Investment returns and principal value will vary, and shares may be worth more or less at redemption than at original purchase. Performance shown is as of date indicated, and current performance may be lower or higher than the performance data quoted. To obtain performance as of the most recent month end, please visit americanbeaconfunds.com or call 800-967-9009. The graph and table do not reflect the deduction of taxes that a shareholder would pay on fund distributions or redemption of fund shares. The Fund's performance benefited from fee waivers. Performance includes historical performance of another Class of the Fund. For more information, visit americanbeaconfunds.com/Performance_Disclaimers.aspx.
| Total Net Assets | $191,692,975 |
| # of Portfolio Holdings | 33 |
| Portfolio Turnover Rate | 38% |
| Total Management Fees Paid | $2,331,958 |
What did the Fund invest in?
Top Ten Holdings - % Net Assets
| Tesla, Inc. | 13.6 |
| Roku, Inc. | 10.0 |
| Coinbase Global, Inc. | 9.2 |
| ROBLOX Corp. | 6.2 |
| Block, Inc. | 5.8 |
| Robinhood Markets, Inc. | 5.2 |
| CRISPR Therapeutics AG | 5.0 |
| UiPath, Inc. | 4.1 |
| Palantir Technologies, Inc. | 3.9 |
| Shopify, Inc. | 3.5 |
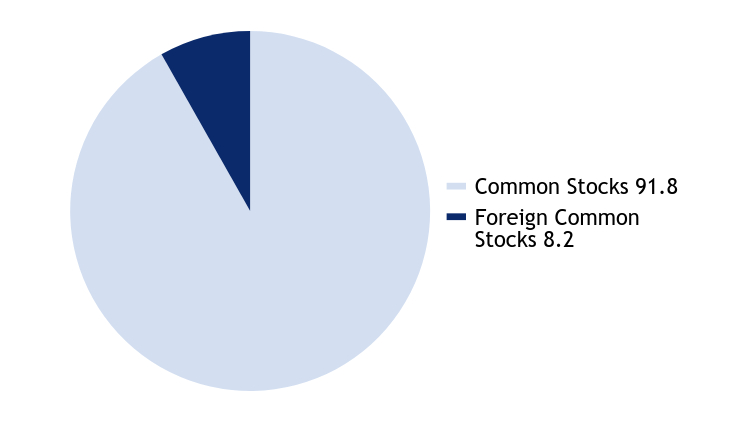
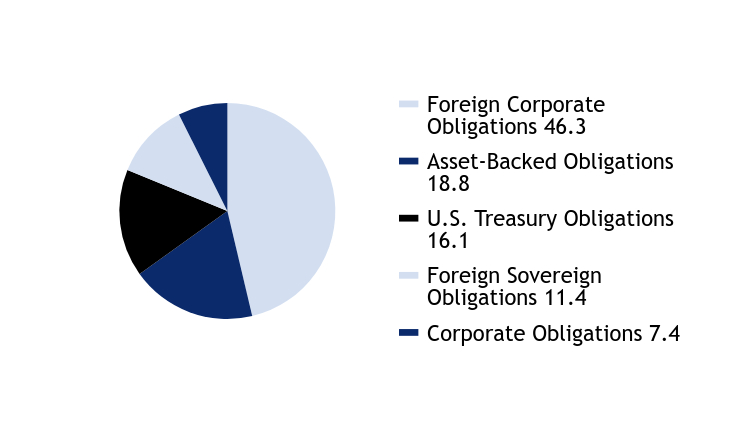
Asset Allocation - % Investments
| Value | Value |
|---|
| Common Stocks | 91.8 |
| Foreign Common Stocks | 8.2 |
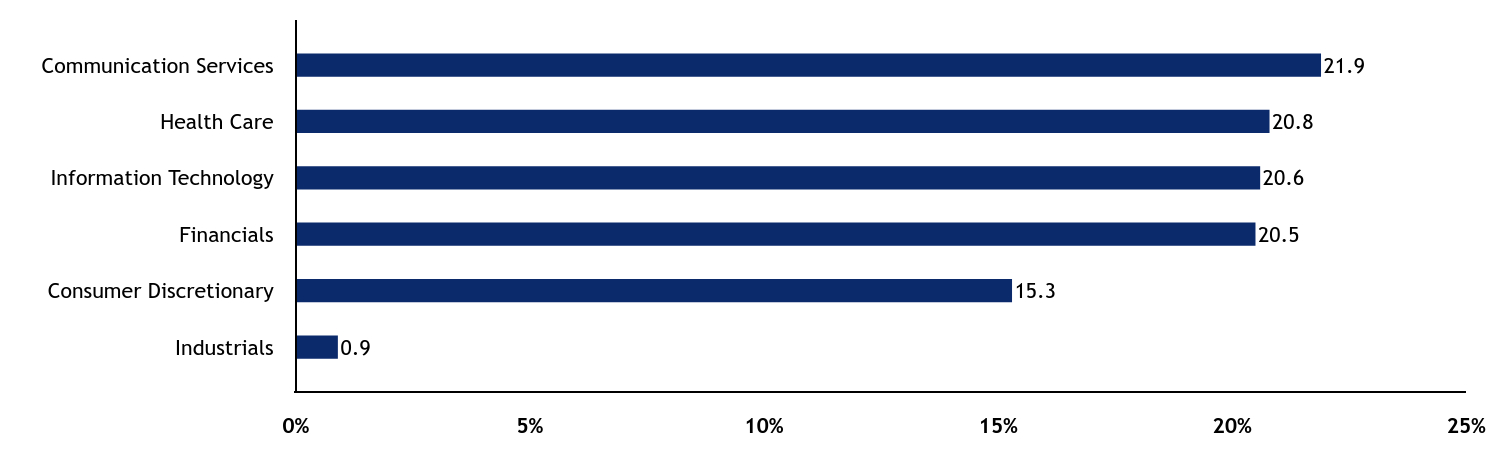
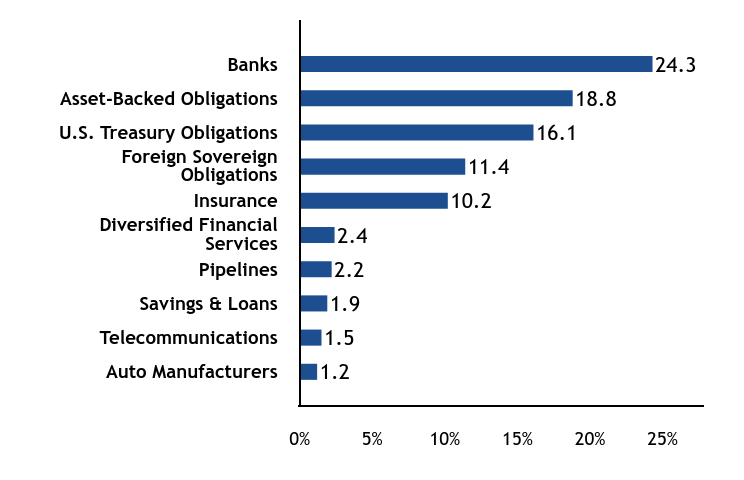
Sector Allocation - % Investments
| Value | Value |
|---|
| Industrials | 0.9 |
| Consumer Discretionary | 15.3 |
| Financials | 20.5 |
| Information Technology | 20.6 |
| Health Care | 20.8 |
| Communication Services | 21.9 |
For additional information about the Fund, including its prospectus, financial statements, holdings, and proxy voting information, please visit www.americanbeaconfunds.com/literature or call 1-800-658-5811
If your financial institution mailed only one copy of this Report to an address shared by more than one account, you can request an individual copy by contacting your financial institution.
Distributed by Resolute Investment Distributors, Inc.
ARK Transformational Innovation Fund
Annual Shareholder Report - June 30, 2024
ARK Transformational Innovation Fund
Annual Shareholder Report - June 30, 2024
This annual shareholder report contains important information about American Beacon ARK Transformational Innovation Fund for the period of July 1, 2023 to June 30, 2024. You can find additional information about the Fund at www.americanbeaconfunds.com/literature. You can also request this information by contacting us at 800-658-5811.
What were the Fund costs for last year?
(based on a hypothetical $10,000 investment)
| Class Name | Cost of a $10,000 investment | Costs paid as a percentage of a $10,000 investment |
|---|
| Class C | $210 | 2.11% |
How did the Fund perform last year and what affected its performance?
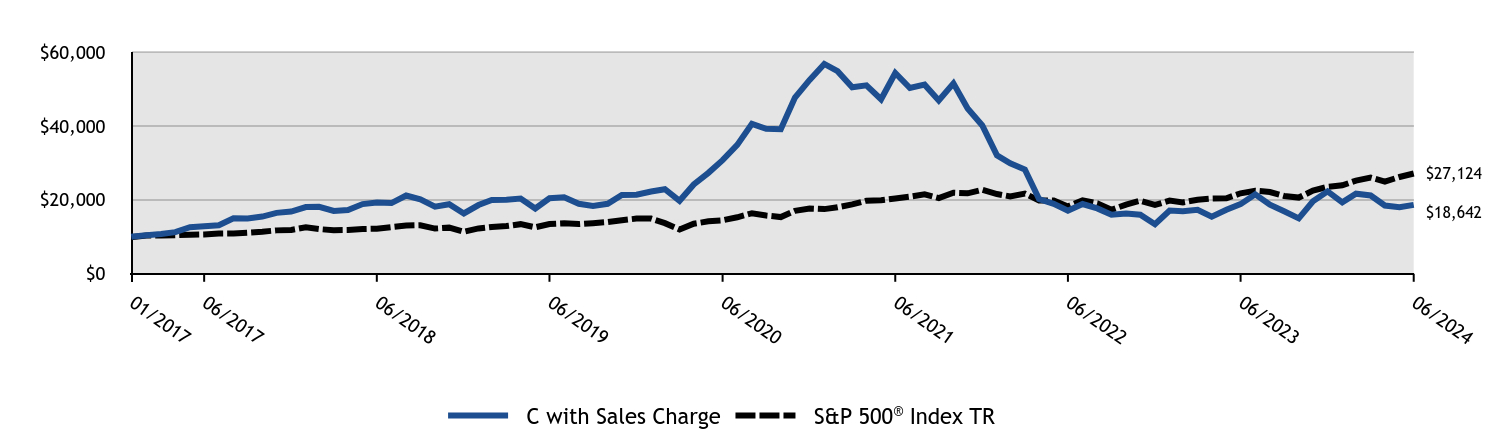
The C Class of the Fund returned -2.14% (with sales charges) and -1.14% (without sales charges) for the twelve months ended June 30, 2024, compared to the S&P 500 Index return of 24.56%.
• Overall market performance during the period was narrowly driven by megacap growth companies as interest rates remained higher for longer than anticipated, which hindered the Fund’s investment strategy of investing in transformational innovation companies.
• The Fund’s investments in the capital markets industry materially helped performance for the period. Conversely, its investments in the health care providers & services and health care equipment and supplies industries materially detracted from performance.
Cumulative Performance from January 27, 2017 through June 30, 2024
The initial investment, based on a $10,000 investment, is adjusted to reflect the maximum applicable sales charge, if any.
| C with Sales Charge | S&P 500® Index TR |
|---|
| 01/2017 | $10,000 | $10,000 |
| 01/2017 | $10,080 | $9,932 |
| 02/2017 | $10,400 | $10,326 |
| 03/2017 | $10,760 | $10,338 |
| 04/2017 | $11,270 | $10,444 |
| 05/2017 | $12,620 | $10,591 |
| 06/2017 | $12,870 | $10,657 |
| 07/2017 | $13,140 | $10,876 |
| 08/2017 | $15,000 | $10,910 |
| 09/2017 | $14,950 | $11,135 |
| 10/2017 | $15,480 | $11,395 |
| 11/2017 | $16,480 | $11,744 |
| 12/2017 | $16,828 | $11,875 |
| 01/2018 | $18,040 | $12,554 |
| 02/2018 | $18,123 | $12,092 |
| 03/2018 | $16,994 | $11,784 |
| 04/2018 | $17,243 | $11,830 |
| 05/2018 | $18,859 | $12,115 |
| 06/2018 | $19,274 | $12,189 |
| 07/2018 | $19,128 | $12,643 |
| 08/2018 | $21,159 | $13,055 |
| 09/2018 | $20,123 | $13,129 |
| 10/2018 | $18,165 | $12,232 |
| 11/2018 | $18,828 | $12,481 |
| 12/2018 | $16,327 | $11,354 |
| 01/2019 | $18,597 | $12,264 |
| 02/2019 | $19,966 | $12,658 |
| 03/2019 | $20,055 | $12,904 |
| 04/2019 | $20,333 | $13,426 |
| 05/2019 | $17,651 | $12,573 |
| 06/2019 | $20,422 | $13,459 |
| 07/2019 | $20,689 | $13,652 |
| 08/2019 | $18,942 | $13,436 |
| 09/2019 | $18,330 | $13,687 |
| 10/2019 | $18,931 | $13,984 |
| 11/2019 | $21,335 | $14,492 |
| 12/2019 | $21,387 | $14,929 |
| 01/2020 | $22,271 | $14,923 |
| 02/2020 | $22,879 | $13,695 |
| 03/2020 | $19,745 | $12,003 |
| 04/2020 | $24,153 | $13,542 |
| 05/2020 | $27,310 | $14,187 |
| 06/2020 | $30,743 | $14,469 |
| 07/2020 | $34,852 | $15,285 |
| 08/2020 | $40,558 | $16,384 |
| 09/2020 | $39,226 | $15,761 |
| 10/2020 | $39,100 | $15,342 |
| 11/2020 | $47,652 | $17,021 |
| 12/2020 | $52,439 | $17,676 |
| 01/2021 | $56,769 | $17,497 |
| 02/2021 | $54,823 | $17,980 |
| 03/2021 | $50,446 | $18,767 |
| 04/2021 | $50,976 | $19,769 |
| 05/2021 | $47,210 | $19,907 |
| 06/2021 | $54,316 | $20,371 |
| 07/2021 | $50,250 | $20,855 |
| 08/2021 | $51,172 | $21,490 |
| 09/2021 | $46,899 | $20,490 |
| 10/2021 | $51,506 | $21,926 |
| 11/2021 | $44,722 | $21,774 |
| 12/2021 | $40,139 | $22,750 |
| 01/2022 | $32,030 | $21,572 |
| 02/2022 | $29,887 | $20,926 |
| 03/2022 | $28,193 | $21,703 |
| 04/2022 | $20,204 | $19,811 |
| 05/2022 | $18,915 | $19,847 |
| 06/2022 | $17,042 | $18,209 |
| 07/2022 | $18,870 | $19,888 |
| 08/2022 | $17,686 | $19,077 |
| 09/2022 | $15,963 | $17,320 |
| 10/2022 | $16,337 | $18,722 |
| 11/2022 | $15,978 | $19,768 |
| 12/2022 | $13,405 | $18,629 |
| 01/2023 | $17,094 | $19,800 |
| 02/2023 | $16,946 | $19,317 |
| 03/2023 | $17,325 | $20,026 |
| 04/2023 | $15,447 | $20,339 |
| 05/2023 | $17,308 | $20,427 |
| 06/2023 | $18,840 | $21,777 |
| 07/2023 | $21,507 | $22,476 |
| 08/2023 | $18,691 | $22,118 |
| 09/2023 | $16,896 | $21,064 |
| 10/2023 | $14,986 | $20,621 |
| 11/2023 | $19,614 | $22,504 |
| 12/2023 | $22,298 | $23,527 |
| 01/2024 | $19,334 | $23,922 |
| 02/2024 | $21,672 | $25,199 |
| 03/2024 | $21,178 | $26,010 |
| 04/2024 | $18,461 | $24,948 |
| 05/2024 | $18,000 | $26,185 |
| 06/2024 | $18,642 | $27,124 |
Average Annual Total Returns (%)
| 1 Year | 5 Years | Since Inception (1/27/17) |
|---|
Class C without Deferred Sales Charge Footnote Reference1 | (1.14)% | (1.82)% | 8.74% |
Class C with Maximum Deferred Sales Charge -1.00%Footnote Reference1 | (2.14)% | (1.82)% | 8.74% |
S&P 500® Index TR | 24.56% | 15.05% | 14.39% |
| Footnote | Description |
Footnote1 | Return may differ from actual shareholder return due to accounting adjustments for financial reporting purposes. |
Performance shown is historical and is not indicative of future returns. Investment returns and principal value will vary, and shares may be worth more or less at redemption than at original purchase. Performance shown is as of date indicated, and current performance may be lower or higher than the performance data quoted. To obtain performance as of the most recent month end, please visit americanbeaconfunds.com or call 800-967-9009. The graph and table do not reflect the deduction of taxes that a shareholder would pay on fund distributions or redemption of fund shares. The Fund's performance benefited from fee waivers. Performance includes historical performance of another Class of the Fund. For more information, visit americanbeaconfunds.com/Performance_Disclaimers.aspx.
| Total Net Assets | $191,692,975 |
| # of Portfolio Holdings | 33 |
| Portfolio Turnover Rate | 38% |
| Total Management Fees Paid | $2,331,958 |
What did the Fund invest in?
Top Ten Holdings - % Net Assets
| Tesla, Inc. | 13.6 |
| Roku, Inc. | 10.0 |
| Coinbase Global, Inc. | 9.2 |
| ROBLOX Corp. | 6.2 |
| Block, Inc. | 5.8 |
| Robinhood Markets, Inc. | 5.2 |
| CRISPR Therapeutics AG | 5.0 |
| UiPath, Inc. | 4.1 |
| Palantir Technologies, Inc. | 3.9 |
| Shopify, Inc. | 3.5 |
Asset Allocation - % Investments
| Value | Value |
|---|
| Common Stocks | 91.8 |
| Foreign Common Stocks | 8.2 |
Sector Allocation - % Investments
| Value | Value |
|---|
| Industrials | 0.9 |
| Consumer Discretionary | 15.3 |
| Financials | 20.5 |
| Information Technology | 20.6 |
| Health Care | 20.8 |
| Communication Services | 21.9 |
For additional information about the Fund, including its prospectus, financial statements, holdings, and proxy voting information, please visit www.americanbeaconfunds.com/literature or call 1-800-658-5811
If your financial institution mailed only one copy of this Report to an address shared by more than one account, you can request an individual copy by contacting your financial institution.
Distributed by Resolute Investment Distributors, Inc.
ARK Transformational Innovation Fund
Annual Shareholder Report - June 30, 2024
ARK Transformational Innovation Fund
Annual Shareholder Report - June 30, 2024
This annual shareholder report contains important information about American Beacon ARK Transformational Innovation Fund for the period of July 1, 2023 to June 30, 2024. You can find additional information about the Fund at www.americanbeaconfunds.com/literature. You can also request this information by contacting us at 800-658-5811.
What were the Fund costs for last year?
(based on a hypothetical $10,000 investment)
| Class Name | Cost of a $10,000 investment | Costs paid as a percentage of a $10,000 investment |
|---|
| Investor | $133 | 1.33% |
How did the Fund perform last year and what affected its performance?
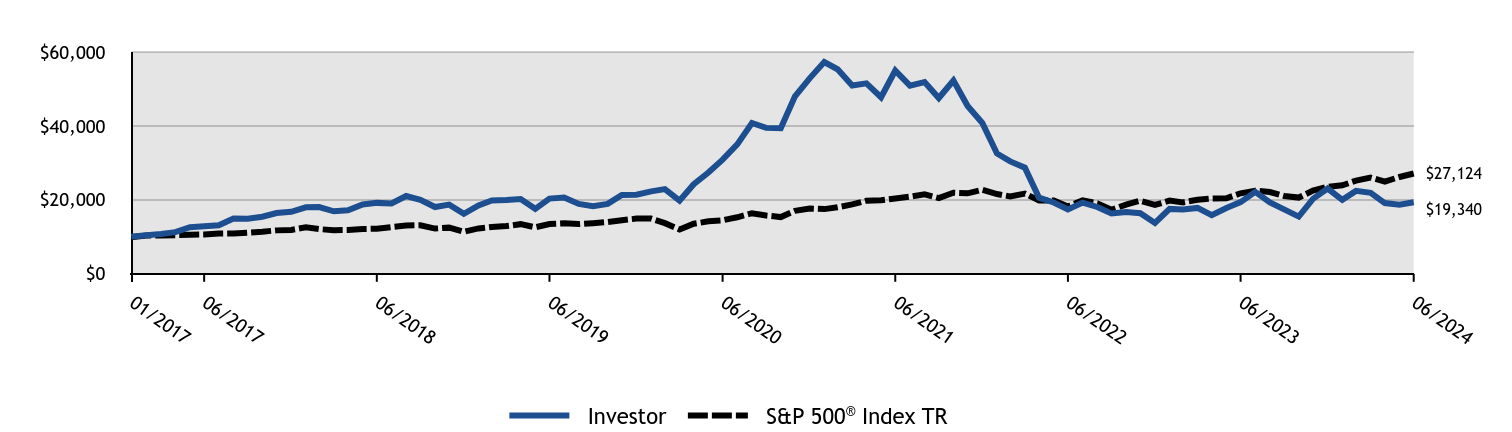
The Investor Class of the Fund returned -0.34% for the twelve months ended June 30, 2024, compared to the S&P 500 Index return of 24.56%.
• Overall market performance during the period was narrowly driven by megacap growth companies as interest rates remained higher for longer than anticipated, which hindered the Fund’s investment strategy of investing in transformational innovation companies.
• The Fund’s investments in the capital markets industry materially helped performance for the period. Conversely, its investments in the health care providers & services and health care equipment and supplies industries materially detracted from performance.
Cumulative Performance from January 27, 2017 through June 30, 2024
The initial investment, based on a $10,000 investment, is adjusted to reflect the maximum applicable sales charge, if any.
| Investor | S&P 500® Index TR |
|---|
| 01/2017 | $10,000 | $10,000 |
| 01/2017 | $10,080 | $9,932 |
| 02/2017 | $10,400 | $10,326 |
| 03/2017 | $10,750 | $10,338 |
| 04/2017 | $11,260 | $10,444 |
| 05/2017 | $12,610 | $10,591 |
| 06/2017 | $12,850 | $10,657 |
| 07/2017 | $13,120 | $10,876 |
| 08/2017 | $14,970 | $10,910 |
| 09/2017 | $14,920 | $11,135 |
| 10/2017 | $15,430 | $11,395 |
| 11/2017 | $16,430 | $11,744 |
| 12/2017 | $16,768 | $11,875 |
| 01/2018 | $17,970 | $12,554 |
| 02/2018 | $18,053 | $12,092 |
| 03/2018 | $16,913 | $11,784 |
| 04/2018 | $17,172 | $11,830 |
| 05/2018 | $18,768 | $12,115 |
| 06/2018 | $19,182 | $12,189 |
| 07/2018 | $19,037 | $12,643 |
| 08/2018 | $21,037 | $13,055 |
| 09/2018 | $20,011 | $13,129 |
| 10/2018 | $18,053 | $12,232 |
| 11/2018 | $18,706 | $12,481 |
| 12/2018 | $16,214 | $11,354 |
| 01/2019 | $18,469 | $12,264 |
| 02/2019 | $19,850 | $12,658 |
| 03/2019 | $19,950 | $12,904 |
| 04/2019 | $20,237 | $13,426 |
| 05/2019 | $17,573 | $12,573 |
| 06/2019 | $20,348 | $13,459 |
| 07/2019 | $20,635 | $13,652 |
| 08/2019 | $18,889 | $13,436 |
| 09/2019 | $18,303 | $13,687 |
| 10/2019 | $18,911 | $13,984 |
| 11/2019 | $21,331 | $14,492 |
| 12/2019 | $21,391 | $14,929 |
| 01/2020 | $22,293 | $14,923 |
| 02/2020 | $22,909 | $13,695 |
| 03/2020 | $19,793 | $12,003 |
| 04/2020 | $24,222 | $13,542 |
| 05/2020 | $27,407 | $14,187 |
| 06/2020 | $30,877 | $14,469 |
| 07/2020 | $35,020 | $15,285 |
| 08/2020 | $40,785 | $16,384 |
| 09/2020 | $39,472 | $15,761 |
| 10/2020 | $39,369 | $15,342 |
| 11/2020 | $47,999 | $17,021 |
| 12/2020 | $52,873 | $17,676 |
| 01/2021 | $57,272 | $17,497 |
| 02/2021 | $55,336 | $17,980 |
| 03/2021 | $50,948 | $18,767 |
| 04/2021 | $51,521 | $19,769 |
| 05/2021 | $47,751 | $19,907 |
| 06/2021 | $54,969 | $20,371 |
| 07/2021 | $50,891 | $20,855 |
| 08/2021 | $51,864 | $21,490 |
| 09/2021 | $47,545 | $20,490 |
| 10/2021 | $52,265 | $21,926 |
| 11/2021 | $45,403 | $21,774 |
| 12/2021 | $40,786 | $22,750 |
| 01/2022 | $32,554 | $21,572 |
| 02/2022 | $30,399 | $20,926 |
| 03/2022 | $28,708 | $21,703 |
| 04/2022 | $20,580 | $19,811 |
| 05/2022 | $19,293 | $19,847 |
| 06/2022 | $17,392 | $18,209 |
| 07/2022 | $19,263 | $19,888 |
| 08/2022 | $18,081 | $19,077 |
| 09/2022 | $16,329 | $17,320 |
| 10/2022 | $16,734 | $18,722 |
| 11/2022 | $16,374 | $19,768 |
| 12/2022 | $13,762 | $18,629 |
| 01/2023 | $17,552 | $19,800 |
| 02/2023 | $17,420 | $19,317 |
| 03/2023 | $17,814 | $20,026 |
| 04/2023 | $15,878 | $20,339 |
| 05/2023 | $17,814 | $20,427 |
| 06/2023 | $19,389 | $21,777 |
| 07/2023 | $22,161 | $22,476 |
| 08/2023 | $19,274 | $22,118 |
| 09/2023 | $17,420 | $21,064 |
| 10/2023 | $15,468 | $20,621 |
| 11/2023 | $20,258 | $22,504 |
| 12/2023 | $23,047 | $23,527 |
| 01/2024 | $19,996 | $23,922 |
| 02/2024 | $22,423 | $25,199 |
| 03/2024 | $21,915 | $26,010 |
| 04/2024 | $19,126 | $24,948 |
| 05/2024 | $18,667 | $26,185 |
| 06/2024 | $19,340 | $27,124 |
Average Annual Total Returns (%)
| 1 Year | 5 Years | Since Inception (1/27/17) |
|---|
Investor Class Footnote Reference1 | (0.34)% | (1.03)% | 9.28% |
S&P 500® Index TR | 24.56% | 15.05% | 14.39% |
| Footnote | Description |
Footnote1 | Return may differ from actual shareholder return due to accounting adjustments for financial reporting purposes. |
Performance shown is historical and is not indicative of future returns. Investment returns and principal value will vary, and shares may be worth more or less at redemption than at original purchase. Performance shown is as of date indicated, and current performance may be lower or higher than the performance data quoted. To obtain performance as of the most recent month end, please visit americanbeaconfunds.com or call 800-967-9009. The graph and table do not reflect the deduction of taxes that a shareholder would pay on fund distributions or redemption of fund shares. The Fund's performance benefited from fee waivers. For more information, visit americanbeaconfunds.com/Performance_Disclaimers.aspx.
| Total Net Assets | $191,692,975 |
| # of Portfolio Holdings | 33 |
| Portfolio Turnover Rate | 38% |
| Total Management Fees Paid | $2,331,958 |
What did the Fund invest in?
Top Ten Holdings - % Net Assets
| Tesla, Inc. | 13.6 |
| Roku, Inc. | 10.0 |
| Coinbase Global, Inc. | 9.2 |
| ROBLOX Corp. | 6.2 |
| Block, Inc. | 5.8 |
| Robinhood Markets, Inc. | 5.2 |
| CRISPR Therapeutics AG | 5.0 |
| UiPath, Inc. | 4.1 |
| Palantir Technologies, Inc. | 3.9 |
| Shopify, Inc. | 3.5 |
Asset Allocation - % Investments
| Value | Value |
|---|
| Common Stocks | 91.8 |
| Foreign Common Stocks | 8.2 |
Sector Allocation - % Investments
| Value | Value |
|---|
| Industrials | 0.9 |
| Consumer Discretionary | 15.3 |
| Financials | 20.5 |
| Information Technology | 20.6 |
| Health Care | 20.8 |
| Communication Services | 21.9 |
For additional information about the Fund, including its prospectus, financial statements, holdings, and proxy voting information, please visit www.americanbeaconfunds.com/literature or call 1-800-658-5811
If your financial institution mailed only one copy of this Report to an address shared by more than one account, you can request an individual copy by contacting your financial institution.
Distributed by Resolute Investment Distributors, Inc.
ARK Transformational Innovation Fund
Annual Shareholder Report - June 30, 2024
ARK Transformational Innovation Fund
Annual Shareholder Report - June 30, 2024
This annual shareholder report contains important information about American Beacon ARK Transformational Innovation Fund for the period of July 1, 2023 to June 30, 2024. You can find additional information about the Fund at www.americanbeaconfunds.com/literature. You can also request this information by contacting us at 800-658-5811.
What were the Fund costs for last year?
(based on a hypothetical $10,000 investment)
| Class Name | Cost of a $10,000 investment | Costs paid as a percentage of a $10,000 investment |
|---|
| R5 | $100 | 1.00% |
How did the Fund perform last year and what affected its performance?
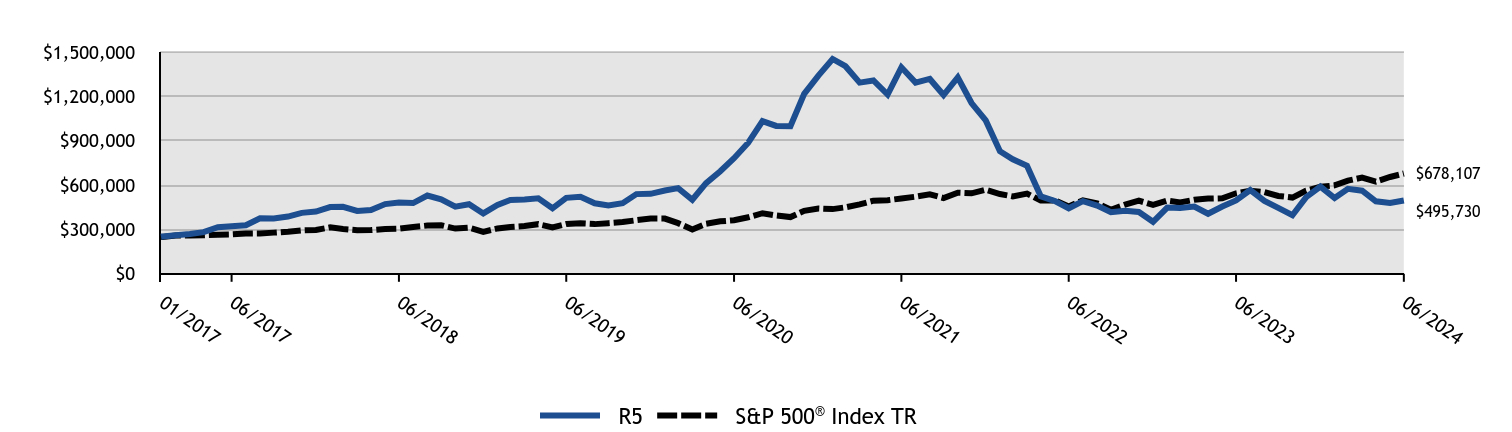
The R5 Class of the Fund returned -0.08% for the twelve months ended June 30, 2024, compared to the S&P 500 Index return of 24.56%.
• Overall market performance during the period was narrowly driven by megacap growth companies as interest rates remained higher for longer than anticipated, which hindered the Fund’s investment strategy of investing in transformational innovation companies.
• The Fund’s investments in the capital markets industry materially helped performance for the period. Conversely, its investments in the health care providers & services and health care equipment and supplies industries materially detracted from performance.
Cumulative Performance from January 27, 2017 through June 30, 2024
The initial investment, based on a $250,000 investment, is adjusted to reflect the maximum applicable sales charge, if any.
| R5 | S&P 500® Index TR |
|---|
| 01/2017 | $250,000 | $250,000 |
| 01/2017 | $252,000 | $248,289 |
| 02/2017 | $260,000 | $258,148 |
| 03/2017 | $269,000 | $258,449 |
| 04/2017 | $281,750 | $261,103 |
| 05/2017 | $315,500 | $264,778 |
| 06/2017 | $321,750 | $266,431 |
| 07/2017 | $328,500 | $271,909 |
| 08/2017 | $375,000 | $272,742 |
| 09/2017 | $373,750 | $278,368 |
| 10/2017 | $387,000 | $284,863 |
| 11/2017 | $412,000 | $293,600 |
| 12/2017 | $420,702 | $296,864 |
| 01/2018 | $451,011 | $313,861 |
| 02/2018 | $453,084 | $302,293 |
| 03/2018 | $424,847 | $294,611 |
| 04/2018 | $431,064 | $295,741 |
| 05/2018 | $471,476 | $302,863 |
| 06/2018 | $481,838 | $304,727 |
| 07/2018 | $478,212 | $316,068 |
| 08/2018 | $528,986 | $326,367 |
| 09/2018 | $503,081 | $328,224 |
| 10/2018 | $454,120 | $305,790 |
| 11/2018 | $470,699 | $312,022 |
| 12/2018 | $408,171 | $283,849 |
| 01/2019 | $465,061 | $306,595 |
| 02/2019 | $499,857 | $316,440 |
| 03/2019 | $502,619 | $322,589 |
| 04/2019 | $510,075 | $335,650 |
| 05/2019 | $442,967 | $314,320 |
| 06/2019 | $513,389 | $336,472 |
| 07/2019 | $520,570 | $341,308 |
| 08/2019 | $476,659 | $335,902 |
| 09/2019 | $462,023 | $342,187 |
| 10/2019 | $477,488 | $349,598 |
| 11/2019 | $538,796 | $362,288 |
| 12/2019 | $540,571 | $373,223 |
| 01/2020 | $563,380 | $373,076 |
| 02/2020 | $579,346 | $342,365 |
| 03/2020 | $500,655 | $300,079 |
| 04/2020 | $612,704 | $338,547 |
| 05/2020 | $693,390 | $354,671 |
| 06/2020 | $781,490 | $361,725 |
| 07/2020 | $886,696 | $382,120 |
| 08/2020 | $1,032,958 | $409,588 |
| 09/2020 | $1,000,170 | $394,025 |
| 10/2020 | $997,604 | $383,546 |
| 11/2020 | $1,216,854 | $425,530 |
| 12/2020 | $1,340,451 | $441,891 |
| 01/2021 | $1,452,728 | $437,430 |
| 02/2021 | $1,403,750 | $449,492 |
| 03/2021 | $1,292,905 | $469,178 |
| 04/2021 | $1,307,799 | $494,217 |
| 05/2021 | $1,212,421 | $497,669 |
| 06/2021 | $1,396,303 | $509,287 |
| 07/2021 | $1,292,905 | $521,385 |
| 08/2021 | $1,317,823 | $537,238 |
| 09/2021 | $1,208,697 | $512,251 |
| 10/2021 | $1,328,707 | $548,141 |
| 11/2021 | $1,154,850 | $544,343 |
| 12/2021 | $1,037,513 | $568,738 |
| 01/2022 | $828,361 | $539,307 |
| 02/2022 | $774,011 | $523,160 |
| 03/2022 | $730,907 | $542,585 |
| 04/2022 | $524,004 | $495,270 |
| 05/2022 | $491,394 | $496,179 |
| 06/2022 | $443,042 | $455,222 |
| 07/2022 | $491,394 | $497,196 |
| 08/2022 | $461,033 | $476,919 |
| 09/2022 | $416,429 | $432,996 |
| 10/2022 | $426,924 | $468,052 |
| 11/2022 | $417,929 | $494,208 |
| 12/2022 | $351,398 | $465,735 |
| 01/2023 | $448,166 | $494,999 |
| 02/2023 | $444,886 | $482,921 |
| 03/2023 | $455,137 | $500,651 |
| 04/2023 | $405,933 | $508,466 |
| 05/2023 | $455,137 | $510,676 |
| 06/2023 | $496,140 | $544,419 |
| 07/2023 | $566,666 | $561,908 |
| 08/2023 | $493,270 | $552,962 |
| 09/2023 | $446,116 | $526,598 |
| 10/2023 | $395,682 | $515,525 |
| 11/2023 | $518,692 | $562,606 |
| 12/2023 | $590,038 | $588,165 |
| 01/2024 | $512,541 | $598,049 |
| 02/2024 | $574,456 | $629,982 |
| 03/2024 | $561,745 | $650,251 |
| 04/2024 | $490,400 | $623,692 |
| 05/2024 | $478,509 | $654,618 |
| 06/2024 | $495,730 | $678,107 |
Average Annual Total Returns (%)
| 1 Year | 5 Years | Since Inception (1/27/17) |
|---|
Class R5 Footnote Reference1 | (0.08)% | (0.70)% | 9.66% |
S&P 500® Index TR | 24.56% | 15.05% | 14.39% |
| Footnote | Description |
Footnote1 | Return may differ from actual shareholder return due to accounting adjustments for financial reporting purposes. |
Performance shown is historical and is not indicative of future returns. Investment returns and principal value will vary, and shares may be worth more or less at redemption than at original purchase. Performance shown is as of date indicated, and current performance may be lower or higher than the performance data quoted. To obtain performance as of the most recent month end, please visit americanbeaconfunds.com or call 800-967-9009. The graph and table do not reflect the deduction of taxes that a shareholder would pay on fund distributions or redemption of fund shares. The Fund's performance benefited from fee waivers. For more information, visit americanbeaconfunds.com/Performance_Disclaimers.aspx.
| Total Net Assets | $191,692,975 |
| # of Portfolio Holdings | 33 |
| Portfolio Turnover Rate | 38% |
| Total Management Fees Paid | $2,331,958 |
What did the Fund invest in?
Top Ten Holdings - % Net Assets
| Tesla, Inc. | 13.6 |
| Roku, Inc. | 10.0 |
| Coinbase Global, Inc. | 9.2 |
| ROBLOX Corp. | 6.2 |
| Block, Inc. | 5.8 |
| Robinhood Markets, Inc. | 5.2 |
| CRISPR Therapeutics AG | 5.0 |
| UiPath, Inc. | 4.1 |
| Palantir Technologies, Inc. | 3.9 |
| Shopify, Inc. | 3.5 |
Asset Allocation - % Investments
| Value | Value |
|---|
| Common Stocks | 91.8 |
| Foreign Common Stocks | 8.2 |
Sector Allocation - % Investments
| Value | Value |
|---|
| Industrials | 0.9 |
| Consumer Discretionary | 15.3 |
| Financials | 20.5 |
| Information Technology | 20.6 |
| Health Care | 20.8 |
| Communication Services | 21.9 |
For additional information about the Fund, including its prospectus, financial statements, holdings, and proxy voting information, please visit www.americanbeaconfunds.com/literature or call 1-800-658-5811
If your financial institution mailed only one copy of this Report to an address shared by more than one account, you can request an individual copy by contacting your financial institution.
Distributed by Resolute Investment Distributors, Inc.
ARK Transformational Innovation Fund
Annual Shareholder Report - June 30, 2024
ARK Transformational Innovation Fund
Annual Shareholder Report - June 30, 2024
This annual shareholder report contains important information about American Beacon ARK Transformational Innovation Fund for the period of July 1, 2023 to June 30, 2024. You can find additional information about the Fund at www.americanbeaconfunds.com/literature. You can also request this information by contacting us at 800-658-5811.
What were the Fund costs for last year?
(based on a hypothetical $10,000 investment)
| Class Name | Cost of a $10,000 investment | Costs paid as a percentage of a $10,000 investment |
|---|
| R6 | $100 | 1.00% |
How did the Fund perform last year and what affected its performance?
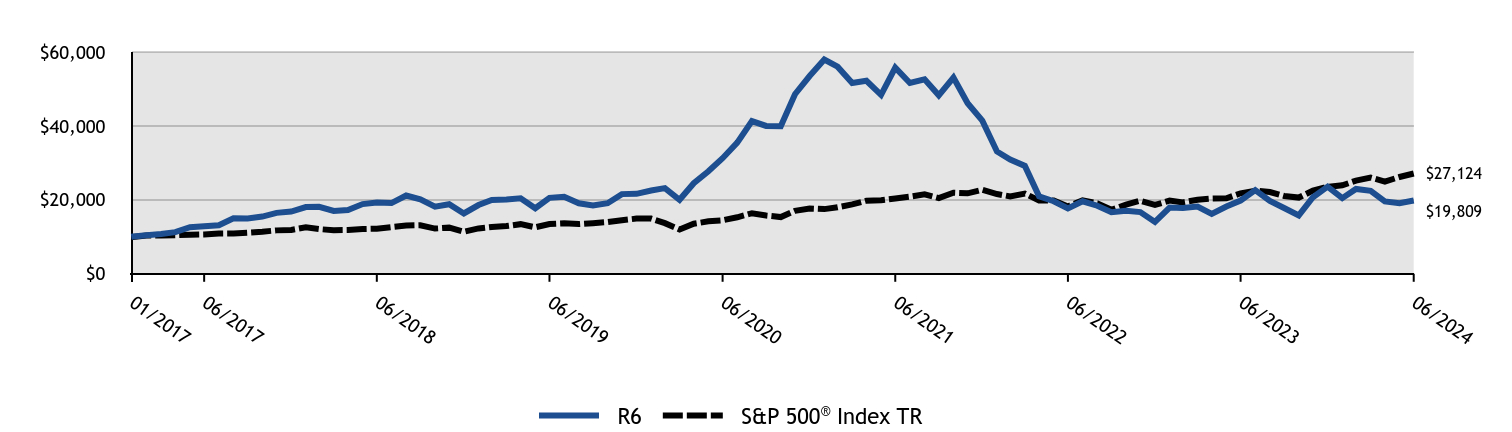
The R6 Class of the Fund returned 0.00% for the twelve months ended June 30, 2024, compared to the S&P 500 Index return of 24.56%.
• Overall market performance during the period was narrowly driven by megacap growth companies as interest rates remained higher for longer than anticipated, which hindered the Fund’s investment strategy of investing in transformational innovation companies.
• The Fund’s investments in the capital markets industry materially helped performance for the period. Conversely, its investments in the health care providers & services and health care equipment and supplies industries materially detracted from performance.
Cumulative Performance from January 27, 2017 through June 30, 2024
The initial investment, based on a $10,000 investment, is adjusted to reflect the maximum applicable sales charge, if any.
| R6 | S&P 500® Index TR |
|---|
| 01/2017 | $10,000 | $10,000 |
| 01/2017 | $10,080 | $9,932 |
| 02/2017 | $10,400 | $10,326 |
| 03/2017 | $10,760 | $10,338 |
| 04/2017 | $11,270 | $10,444 |
| 05/2017 | $12,620 | $10,591 |
| 06/2017 | $12,870 | $10,657 |
| 07/2017 | $13,140 | $10,876 |
| 08/2017 | $15,000 | $10,910 |
| 09/2017 | $14,950 | $11,135 |
| 10/2017 | $15,480 | $11,395 |
| 11/2017 | $16,480 | $11,744 |
| 12/2017 | $16,828 | $11,875 |
| 01/2018 | $18,040 | $12,554 |
| 02/2018 | $18,123 | $12,092 |
| 03/2018 | $16,994 | $11,784 |
| 04/2018 | $17,243 | $11,830 |
| 05/2018 | $18,859 | $12,115 |
| 06/2018 | $19,274 | $12,189 |
| 07/2018 | $19,128 | $12,643 |
| 08/2018 | $21,159 | $13,055 |
| 09/2018 | $20,123 | $13,129 |
| 10/2018 | $18,165 | $12,232 |
| 11/2018 | $18,828 | $12,481 |
| 12/2018 | $16,327 | $11,354 |
| 01/2019 | $18,602 | $12,264 |
| 02/2019 | $19,994 | $12,658 |
| 03/2019 | $20,105 | $12,904 |
| 04/2019 | $20,403 | $13,426 |
| 05/2019 | $17,719 | $12,573 |
| 06/2019 | $20,536 | $13,459 |
| 07/2019 | $20,823 | $13,652 |
| 08/2019 | $19,066 | $13,436 |
| 09/2019 | $18,481 | $13,687 |
| 10/2019 | $19,100 | $13,984 |
| 11/2019 | $21,552 | $14,492 |
| 12/2019 | $21,623 | $14,929 |
| 01/2020 | $22,535 | $14,923 |
| 02/2020 | $23,174 | $13,695 |
| 03/2020 | $20,026 | $12,003 |
| 04/2020 | $24,508 | $13,542 |
| 05/2020 | $27,736 | $14,187 |
| 06/2020 | $31,260 | $14,469 |
| 07/2020 | $35,468 | $15,285 |
| 08/2020 | $41,318 | $16,384 |
| 09/2020 | $40,007 | $15,761 |
| 10/2020 | $39,904 | $15,342 |
| 11/2020 | $48,583 | $17,021 |
| 12/2020 | $53,508 | $17,676 |
| 01/2021 | $57,965 | $17,497 |
| 02/2021 | $56,040 | $17,980 |
| 03/2021 | $51,618 | $18,767 |
| 04/2021 | $52,214 | $19,769 |
| 05/2021 | $48,411 | $19,907 |
| 06/2021 | $55,754 | $20,371 |
| 07/2021 | $51,618 | $20,855 |
| 08/2021 | $52,626 | $21,490 |
| 09/2021 | $48,273 | $20,490 |
| 10/2021 | $53,073 | $21,926 |
| 11/2021 | $46,120 | $21,774 |
| 12/2021 | $41,428 | $22,750 |
| 01/2022 | $33,089 | $21,572 |
| 02/2022 | $30,914 | $20,926 |
| 03/2022 | $29,189 | $21,703 |
| 04/2022 | $20,939 | $19,811 |
| 05/2022 | $19,634 | $19,847 |
| 06/2022 | $17,699 | $18,209 |
| 07/2022 | $19,619 | $19,888 |
| 08/2022 | $18,404 | $19,077 |
| 09/2022 | $16,634 | $17,320 |
| 10/2022 | $17,039 | $18,722 |
| 11/2022 | $16,694 | $19,768 |
| 12/2022 | $14,032 | $18,629 |
| 01/2023 | $17,905 | $19,800 |
| 02/2023 | $17,774 | $19,317 |
| 03/2023 | $18,184 | $20,026 |
| 04/2023 | $16,215 | $20,339 |
| 05/2023 | $18,184 | $20,427 |
| 06/2023 | $19,809 | $21,777 |
| 07/2023 | $22,632 | $22,476 |
| 08/2023 | $19,694 | $22,118 |
| 09/2023 | $17,807 | $21,064 |
| 10/2023 | $15,804 | $20,621 |
| 11/2023 | $20,711 | $22,504 |
| 12/2023 | $23,567 | $23,527 |
| 01/2024 | $20,465 | $23,922 |
| 02/2024 | $22,943 | $25,199 |
| 03/2024 | $22,435 | $26,010 |
| 04/2024 | $19,579 | $24,948 |
| 05/2024 | $19,120 | $26,185 |
| 06/2024 | $19,809 | $27,124 |
Average Annual Total Returns (%)
| 1 Year | 5 Years | Since Inception (1/27/17) |
|---|
R6 Class Footnote Reference1 | 0.00% | (0.72)% | 9.65% |
S&P 500® Index TR | 24.56% | 15.05% | 14.39% |
| Footnote | Description |
Footnote1 | Return may differ from actual shareholder return due to accounting adjustments for financial reporting purposes. |
Performance shown is historical and is not indicative of future returns. Investment returns and principal value will vary, and shares may be worth more or less at redemption than at original purchase. Performance shown is as of date indicated, and current performance may be lower or higher than the performance data quoted. To obtain performance as of the most recent month end, please visit americanbeaconfunds.com or call 800-967-9009. The graph and table do not reflect the deduction of taxes that a shareholder would pay on fund distributions or redemption of fund shares. The Fund's performance benefited from fee waivers. Performance includes historical performance of another Class of the Fund. For more information, visit americanbeaconfunds.com/Performance_Disclaimers.aspx.
| Total Net Assets | $191,692,975 |
| # of Portfolio Holdings | 33 |
| Portfolio Turnover Rate | 38% |
| Total Management Fees Paid | $2,331,958 |
What did the Fund invest in?
Top Ten Holdings - % Net Assets
| Tesla, Inc. | 13.6 |
| Roku, Inc. | 10.0 |
| Coinbase Global, Inc. | 9.2 |
| ROBLOX Corp. | 6.2 |
| Block, Inc. | 5.8 |
| Robinhood Markets, Inc. | 5.2 |
| CRISPR Therapeutics AG | 5.0 |
| UiPath, Inc. | 4.1 |
| Palantir Technologies, Inc. | 3.9 |
| Shopify, Inc. | 3.5 |
Asset Allocation - % Investments
| Value | Value |
|---|
| Common Stocks | 91.8 |
| Foreign Common Stocks | 8.2 |
Sector Allocation - % Investments
| Value | Value |
|---|
| Industrials | 0.9 |
| Consumer Discretionary | 15.3 |
| Financials | 20.5 |
| Information Technology | 20.6 |
| Health Care | 20.8 |
| Communication Services | 21.9 |
For additional information about the Fund, including its prospectus, financial statements, holdings, and proxy voting information, please visit www.americanbeaconfunds.com/literature or call 1-800-658-5811
If your financial institution mailed only one copy of this Report to an address shared by more than one account, you can request an individual copy by contacting your financial institution.
Distributed by Resolute Investment Distributors, Inc.
ARK Transformational Innovation Fund
Annual Shareholder Report - June 30, 2024
ARK Transformational Innovation Fund
Annual Shareholder Report - June 30, 2024
This annual shareholder report contains important information about American Beacon ARK Transformational Innovation Fund for the period of July 1, 2023 to June 30, 2024. You can find additional information about the Fund at www.americanbeaconfunds.com/literature. You can also request this information by contacting us at 800-658-5811.
What were the Fund costs for last year?
(based on a hypothetical $10,000 investment)
| Class Name | Cost of a $10,000 investment | Costs paid as a percentage of a $10,000 investment |
|---|
| Y | $109 | 1.09% |
How did the Fund perform last year and what affected its performance?
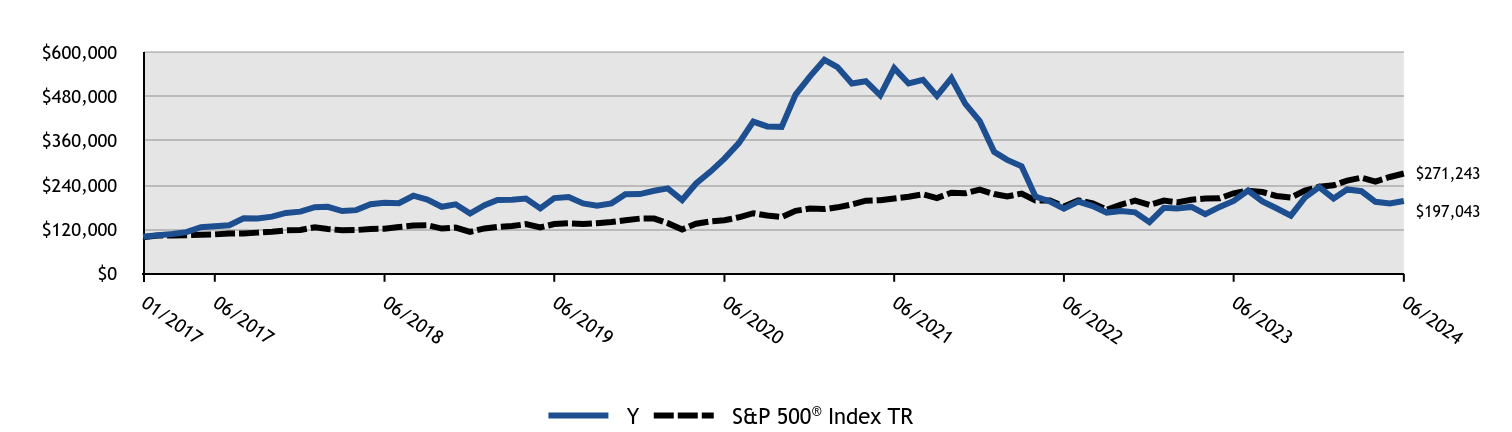
The Y Class of the Fund returned -0.17% for the twelve months ended June 30, 2024, compared to the S&P 500 Index return of 24.56%.
• Overall market performance during the period was narrowly driven by megacap growth companies as interest rates remained higher for longer than anticipated, which hindered the Fund’s investment strategy of investing in transformational innovation companies.
• The Fund’s investments in the capital markets industry materially helped performance for the period. Conversely, its investments in the health care providers & services and health care equipment and supplies industries materially detracted from performance.
Cumulative Performance from January 27, 2017 through June 30, 2024
The initial investment, based on a $100,000 investment, is adjusted to reflect the maximum applicable sales charge, if any.
| Y | S&P 500® Index TR |
|---|
| 01/2017 | $100,000 | $100,000 |
| 01/2017 | $100,800 | $99,316 |
| 02/2017 | $104,000 | $103,259 |
| 03/2017 | $107,600 | $103,380 |
| 04/2017 | $112,700 | $104,441 |
| 05/2017 | $126,200 | $105,911 |
| 06/2017 | $128,700 | $106,572 |
| 07/2017 | $131,300 | $108,764 |
| 08/2017 | $149,900 | $109,097 |
| 09/2017 | $149,400 | $111,347 |
| 10/2017 | $154,600 | $113,945 |
| 11/2017 | $164,600 | $117,440 |
| 12/2017 | $168,081 | $118,746 |
| 01/2018 | $180,205 | $125,544 |
| 02/2018 | $181,034 | $120,917 |
| 03/2018 | $169,635 | $117,844 |
| 04/2018 | $172,226 | $118,297 |
| 05/2018 | $188,288 | $121,145 |
| 06/2018 | $192,433 | $121,891 |
| 07/2018 | $190,982 | $126,427 |
| 08/2018 | $211,189 | $130,547 |
| 09/2018 | $200,930 | $131,290 |
| 10/2018 | $181,345 | $122,316 |
| 11/2018 | $187,977 | $124,809 |
| 12/2018 | $162,965 | $113,540 |
| 01/2019 | $185,614 | $122,638 |
| 02/2019 | $199,535 | $126,576 |
| 03/2019 | $200,530 | $129,035 |
| 04/2019 | $203,513 | $134,260 |
| 05/2019 | $176,775 | $125,728 |
| 06/2019 | $204,728 | $134,589 |
| 07/2019 | $207,601 | $136,523 |
| 08/2019 | $190,254 | $134,361 |
| 09/2019 | $184,288 | $136,875 |
| 10/2019 | $190,475 | $139,839 |
| 11/2019 | $214,893 | $144,915 |
| 12/2019 | $215,602 | $149,289 |
| 01/2020 | $224,614 | $149,231 |
| 02/2020 | $231,002 | $136,946 |
| 03/2020 | $199,632 | $120,031 |
| 04/2020 | $244,235 | $135,419 |
| 05/2020 | $276,404 | $141,868 |
| 06/2020 | $311,539 | $144,690 |
| 07/2020 | $353,519 | $152,848 |
| 08/2020 | $411,697 | $163,835 |
| 09/2020 | $398,579 | $157,610 |
| 10/2020 | $397,552 | $153,418 |
| 11/2020 | $484,934 | $170,212 |
| 12/2020 | $534,140 | $176,757 |
| 01/2021 | $578,823 | $174,972 |
| 02/2021 | $559,231 | $179,797 |
| 03/2021 | $515,006 | $187,671 |
| 04/2021 | $520,964 | $197,687 |
| 05/2021 | $482,925 | $199,068 |
| 06/2021 | $556,023 | $203,715 |
| 07/2021 | $514,777 | $208,554 |
| 08/2021 | $524,745 | $214,895 |
| 09/2021 | $481,207 | $204,901 |
| 10/2021 | $529,098 | $219,256 |
| 11/2021 | $459,667 | $217,737 |
| 12/2021 | $412,982 | $227,495 |
| 01/2022 | $329,786 | $215,723 |
| 02/2022 | $308,050 | $209,264 |
| 03/2022 | $290,812 | $217,034 |
| 04/2022 | $208,665 | $198,108 |
| 05/2022 | $195,623 | $198,472 |
| 06/2022 | $176,286 | $182,089 |
| 07/2022 | $195,473 | $198,878 |
| 08/2022 | $183,331 | $190,768 |
| 09/2022 | $165,643 | $173,198 |
| 10/2022 | $169,690 | $187,221 |
| 11/2022 | $166,242 | $197,683 |
| 12/2022 | $139,620 | $186,294 |
| 01/2023 | $178,340 | $197,999 |
| 02/2023 | $176,863 | $193,168 |
| 03/2023 | $180,965 | $200,260 |
| 04/2023 | $161,441 | $203,386 |
| 05/2023 | $180,965 | $204,270 |
| 06/2023 | $197,207 | $217,767 |
| 07/2023 | $225,263 | $224,763 |
| 08/2023 | $195,895 | $221,185 |
| 09/2023 | $177,191 | $210,639 |
| 10/2023 | $157,339 | $206,210 |
| 11/2023 | $206,067 | $225,042 |
| 12/2023 | $234,450 | $235,266 |
| 01/2024 | $203,606 | $239,220 |
| 02/2024 | $228,216 | $251,993 |
| 03/2024 | $223,294 | $260,101 |
| 04/2024 | $194,746 | $249,477 |
| 05/2024 | $190,153 | $261,847 |
| 06/2024 | $197,043 | $271,243 |
Average Annual Total Returns (%)
| 1 Year | 5 Years | Since Inception (1/27/17) |
|---|
Class Y Footnote Reference1 | (0.17)% | (0.78)% | 9.56% |
S&P 500® Index TR | 24.56% | 15.05% | 14.39% |
| Footnote | Description |
Footnote1 | Return may differ from actual shareholder return due to accounting adjustments for financial reporting purposes. |
Performance shown is historical and is not indicative of future returns. Investment returns and principal value will vary, and shares may be worth more or less at redemption than at original purchase. Performance shown is as of date indicated, and current performance may be lower or higher than the performance data quoted. To obtain performance as of the most recent month end, please visit americanbeaconfunds.com or call 800-967-9009. The graph and table do not reflect the deduction of taxes that a shareholder would pay on fund distributions or redemption of fund shares. The Fund's performance benefited from fee waivers. For more information, visit americanbeaconfunds.com/Performance_Disclaimers.aspx.
| Total Net Assets | $191,692,975 |
| # of Portfolio Holdings | 33 |
| Portfolio Turnover Rate | 38% |
| Total Management Fees Paid | $2,331,958 |
What did the Fund invest in?
Top Ten Holdings - % Net Assets
| Tesla, Inc. | 13.6 |
| Roku, Inc. | 10.0 |
| Coinbase Global, Inc. | 9.2 |
| ROBLOX Corp. | 6.2 |
| Block, Inc. | 5.8 |
| Robinhood Markets, Inc. | 5.2 |
| CRISPR Therapeutics AG | 5.0 |
| UiPath, Inc. | 4.1 |
| Palantir Technologies, Inc. | 3.9 |
| Shopify, Inc. | 3.5 |
Asset Allocation - % Investments
| Value | Value |
|---|
| Common Stocks | 91.8 |
| Foreign Common Stocks | 8.2 |
Sector Allocation - % Investments
| Value | Value |
|---|
| Industrials | 0.9 |
| Consumer Discretionary | 15.3 |
| Financials | 20.5 |
| Information Technology | 20.6 |
| Health Care | 20.8 |
| Communication Services | 21.9 |
For additional information about the Fund, including its prospectus, financial statements, holdings, and proxy voting information, please visit www.americanbeaconfunds.com/literature or call 1-800-658-5811
If your financial institution mailed only one copy of this Report to an address shared by more than one account, you can request an individual copy by contacting your financial institution.
Distributed by Resolute Investment Distributors, Inc.
ARK Transformational Innovation Fund
Annual Shareholder Report - June 30, 2024
Shapiro Equity Opportunities Fund
Annual Shareholder Report - June 30, 2024
This annual shareholder report contains important information about American Beacon Shapiro Equity Opportunities Fund for the period of July 1, 2023 to June 30, 2024. You can find additional information about the Fund at www.americanbeaconfunds.com/literature. You can also request this information by contacting us at 800-658-5811. This report describes changes to the Fund that occurred during the reporting period.
What were the Fund costs for last year?
(based on a hypothetical $10,000 investment)
| Class Name | Cost of a $10,000 investment | Costs paid as a percentage of a $10,000 investment |
|---|
| Class A | $115 | 1.08% |
How did the Fund perform last year and what affected its performance?
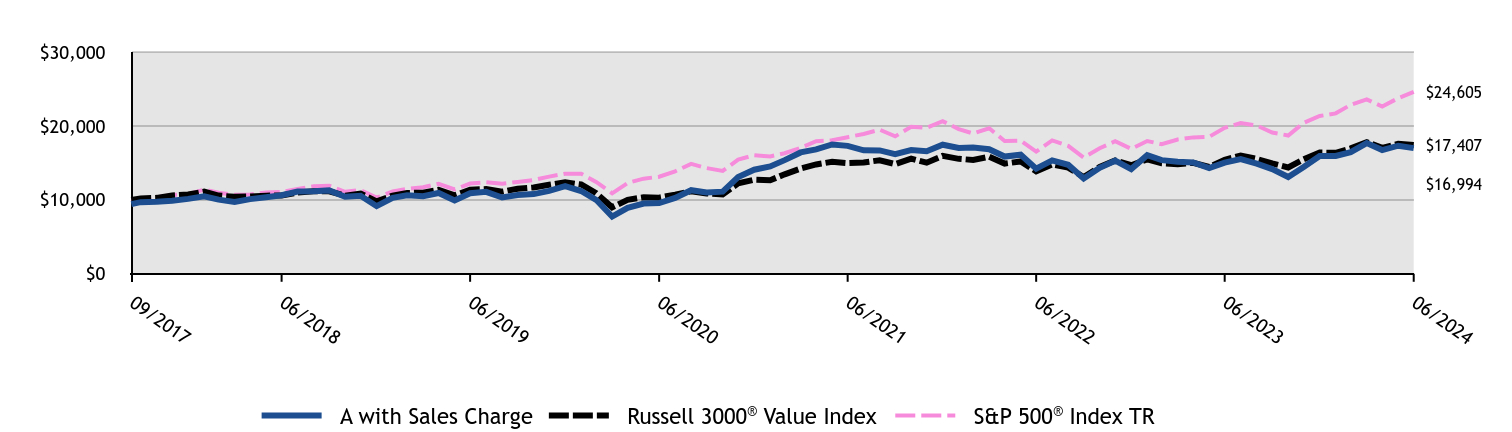
The A Class of the Fund returned 6.58% (with sales charges) and 13.05% (without sales charges) for the twelve months ended June 30, 2024, compared to the S&P 500 Index return of 24.56% and the Russell 3000 Value Index return of 12.93%.
• Over the trailing twelve months the market environment has been mixed for the sub-advisor’s investment style of long-term investing in stocks that were recent spinoffs, reorganizations, and misunderstood contrarian situations through an intrinsic value approach.
• Stocks held in the Fund with exposure to the Artificial Intelligence theme have benefited performance significantly.
• The Fund’s investments in smaller market cap stocks where the sub-advisor sees long-term intrinsic value opportunities have been challenged by the higher interest rate environment.
• The Fund’s performance was mainly driven by the sub-advisor’s securities selection decisions in the Information Technology and the Communication Services sectors, which contributed positively to performance, while securities selection in the Industrials sector detracted from performance.
• The S&P 500 Index TR has replaced the Russell 3000 Index since the last Shareholder Report to comply with a new regulatory requirement.
Cumulative Performance from September 12, 2017 through June 30, 2024
The initial investment, based on a $10,000 investment, is adjusted to reflect the maximum applicable sales charge, if any.
| A with Sales Charge | Russell 3000® Value Index | S&P 500® Index TR |
|---|
| 09/2017 | $9,425 | $10,000 | $10,000 |
| 09/2017 | $9,689 | $10,201 | $10,101 |
| 10/2017 | $9,736 | $10,270 | $10,336 |
| 11/2017 | $9,877 | $10,583 | $10,653 |
| 12/2017 | $10,129 | $10,718 | $10,772 |
| 01/2018 | $10,487 | $11,112 | $11,388 |
| 02/2018 | $10,025 | $10,580 | $10,969 |
| 03/2018 | $9,723 | $10,416 | $10,690 |
| 04/2018 | $10,100 | $10,461 | $10,731 |
| 05/2018 | $10,346 | $10,565 | $10,989 |
| 06/2018 | $10,629 | $10,594 | $11,057 |
| 07/2018 | $11,120 | $10,996 | $11,468 |
| 08/2018 | $11,148 | $11,166 | $11,842 |
| 09/2018 | $11,280 | $11,165 | $11,910 |
| 10/2018 | $10,412 | $10,556 | $11,096 |
| 11/2018 | $10,544 | $10,861 | $11,322 |
| 12/2018 | $9,147 | $9,799 | $10,299 |
| 01/2019 | $10,266 | $10,583 | $11,125 |
| 02/2019 | $10,616 | $10,926 | $11,482 |
| 03/2019 | $10,499 | $10,969 | $11,705 |
| 04/2019 | $10,927 | $11,359 | $12,179 |
| 05/2019 | $9,925 | $10,616 | $11,405 |
| 06/2019 | $10,898 | $11,372 | $12,209 |
| 07/2019 | $11,083 | $11,461 | $12,384 |
| 08/2019 | $10,314 | $11,104 | $12,188 |
| 09/2019 | $10,655 | $11,511 | $12,416 |
| 10/2019 | $10,781 | $11,680 | $12,685 |
| 11/2019 | $11,219 | $12,035 | $13,146 |
| 12/2019 | $11,850 | $12,372 | $13,542 |
| 01/2020 | $11,195 | $12,079 | $13,537 |
| 02/2020 | $10,008 | $10,909 | $12,423 |
| 03/2020 | $7,736 | $8,992 | $10,888 |
| 04/2020 | $8,923 | $10,009 | $12,284 |
| 05/2020 | $9,496 | $10,348 | $12,869 |
| 06/2020 | $9,568 | $10,300 | $13,125 |
| 07/2020 | $10,264 | $10,697 | $13,865 |
| 08/2020 | $11,308 | $11,146 | $14,862 |
| 09/2020 | $11,011 | $10,859 | $14,297 |
| 10/2020 | $11,113 | $10,746 | $13,917 |
| 11/2020 | $13,088 | $12,228 | $15,440 |
| 12/2020 | $14,075 | $12,728 | $16,034 |
| 01/2021 | $14,514 | $12,662 | $15,872 |
| 02/2021 | $15,371 | $13,456 | $16,310 |
| 03/2021 | $16,416 | $14,241 | $17,024 |
| 04/2021 | $16,823 | $14,791 | $17,933 |
| 05/2021 | $17,492 | $15,144 | $18,058 |
| 06/2021 | $17,304 | $14,976 | $18,479 |
| 07/2021 | $16,698 | $15,052 | $18,918 |
| 08/2021 | $16,687 | $15,357 | $19,494 |
| 09/2021 | $16,186 | $14,837 | $18,587 |
| 10/2021 | $16,740 | $15,578 | $19,889 |
| 11/2021 | $16,583 | $15,031 | $19,751 |
| 12/2021 | $17,457 | $15,957 | $20,637 |
| 01/2022 | $17,009 | $15,549 | $19,569 |
| 02/2022 | $17,065 | $15,396 | $18,983 |
| 03/2022 | $16,853 | $15,822 | $19,688 |
| 04/2022 | $15,857 | $14,908 | $17,971 |
| 05/2022 | $16,114 | $15,197 | $18,004 |
| 06/2022 | $14,223 | $13,859 | $16,518 |
| 07/2022 | $15,342 | $14,803 | $18,041 |
| 08/2022 | $14,738 | $14,361 | $17,305 |
| 09/2022 | $12,880 | $13,089 | $15,711 |
| 10/2022 | $14,335 | $14,449 | $16,983 |
| 11/2022 | $15,297 | $15,324 | $17,932 |
| 12/2022 | $14,156 | $14,683 | $16,899 |
| 01/2023 | $16,043 | $15,481 | $17,961 |
| 02/2023 | $15,373 | $14,947 | $17,523 |
| 03/2023 | $15,142 | $14,817 | $18,166 |
| 04/2023 | $15,057 | $15,007 | $18,450 |
| 05/2023 | $14,290 | $14,444 | $18,530 |
| 06/2023 | $15,032 | $15,414 | $19,754 |
| 07/2023 | $15,519 | $15,992 | $20,389 |
| 08/2023 | $14,898 | $15,540 | $20,064 |
| 09/2023 | $14,168 | $14,928 | $19,108 |
| 10/2023 | $13,097 | $14,380 | $18,706 |
| 11/2023 | $14,448 | $15,477 | $20,414 |
| 12/2023 | $15,928 | $16,395 | $21,342 |
| 01/2024 | $15,940 | $16,366 | $21,700 |
| 02/2024 | $16,454 | $16,966 | $22,859 |
| 03/2024 | $17,680 | $17,808 | $23,594 |
| 04/2024 | $16,736 | $17,026 | $22,631 |
| 05/2024 | $17,324 | $17,580 | $23,753 |
| 06/2024 | $16,994 | $17,407 | $24,605 |
Average Annual Total Returns (%)
| 1 Year | 5 Years | Since Inception (9/12/17) |
|---|
Class A without Sales Charge Footnote Reference1 | 13.05% | 9.29% | 9.06% |
Class A with Maximum Sales Charge - 5.75%Footnote Reference1 | 6.58% | 8.01% | 8.11% |
Russell 3000® Value Index | 12.93% | 8.89% | 8.50% |
S&P 500® Index TR | 24.56% | 15.05% | 14.16% |
| Footnote | Description |
Footnote1 | Return may differ from actual shareholder return due to accounting adjustments for financial reporting purposes. |
Performance shown is historical and is not indicative of future returns. Investment returns and principal value will vary, and shares may be worth more or less at redemption than at original purchase. Performance shown is as of date indicated, and current performance may be lower or higher than the performance data quoted. To obtain performance as of the most recent month end, please visit americanbeaconfunds.com or call 800-967-9009. The graph and table do not reflect the deduction of taxes that a shareholder would pay on fund distributions or redemption of fund shares. The Fund's performance benefited from fee waivers. Performance includes historical performance of another Class of the Fund. For more information, visit americanbeaconfunds.com/Performance_Disclaimers.aspx.
| Total Net Assets | $132,330,417 |
| # of Portfolio Holdings | 24 |
| Portfolio Turnover Rate | 59% |
| Total Management Fees Paid | $1,365,422 |
What did the Fund invest in?
Top Ten Holdings - % Net Assets
| Lions Gate Entertainment Corp. | 5.3 |
| Zimmer Biomet Holdings, Inc. | 5.0 |
| Berkshire Hathaway, Inc. | 5.0 |
| Mohawk Industries, Inc. | 4.9 |
| Alphabet, Inc. | 4.9 |
| Walt Disney Co. | 4.9 |
| Bank of America Corp. | 4.8 |
| Nasdaq, Inc. | 4.8 |
| Baxter International, Inc. | 4.8 |
| L3Harris Technologies, Inc. | 4.7 |
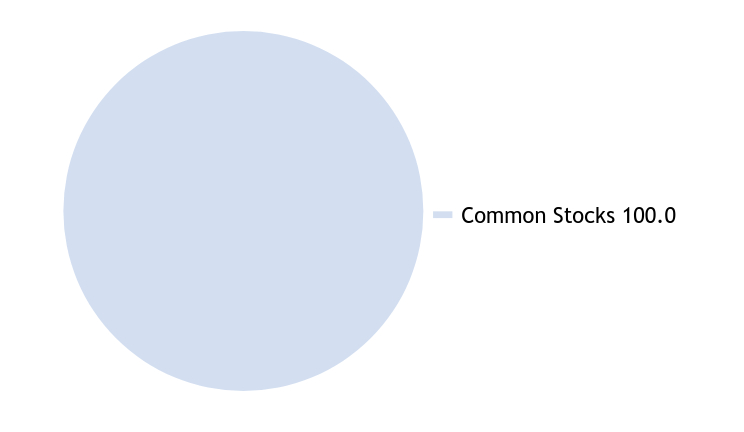
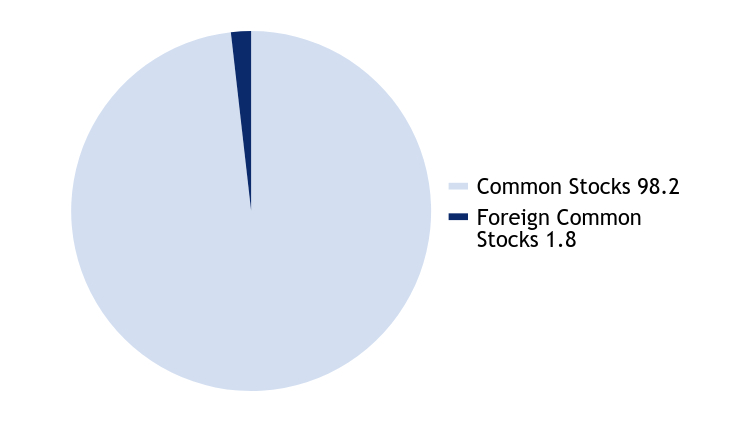
Asset Allocation - % Investments
| Value | Value |
|---|
| Common Stocks | 100.0 |
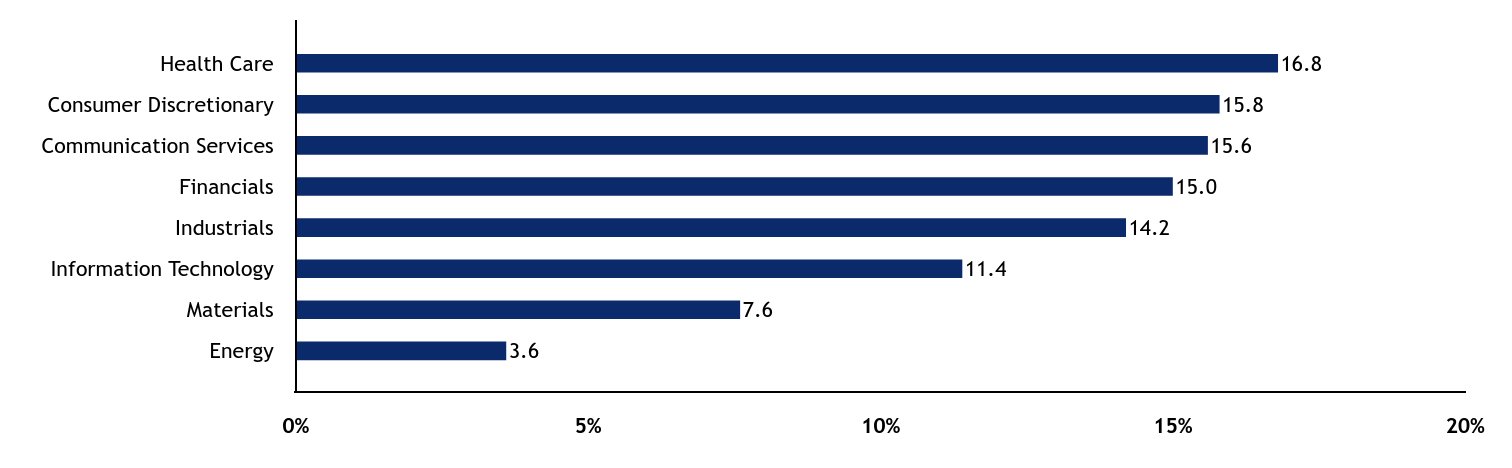
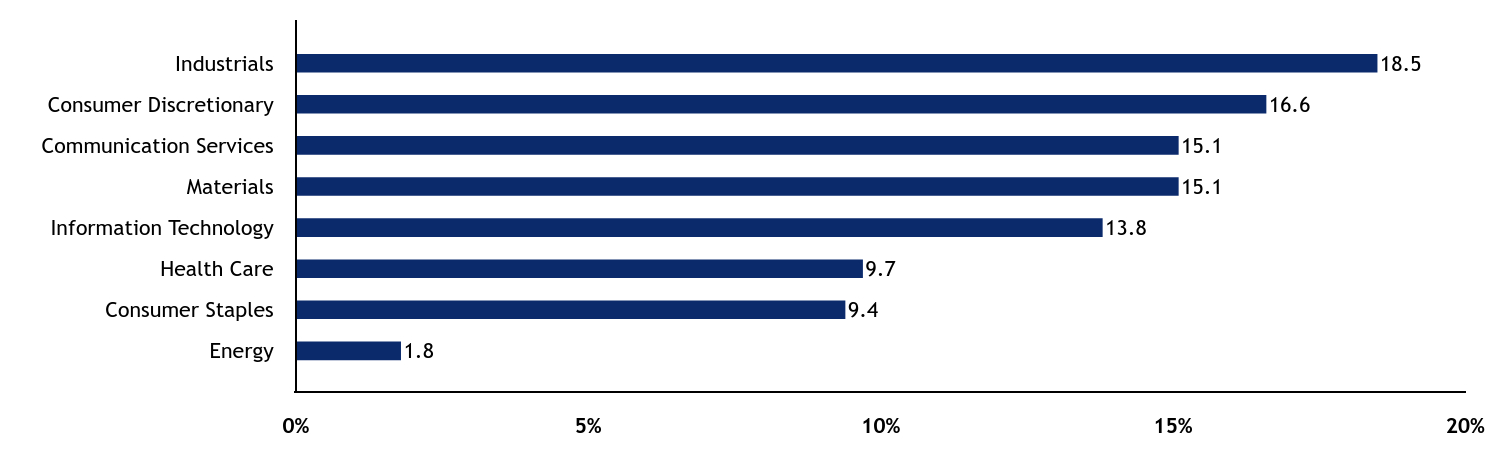
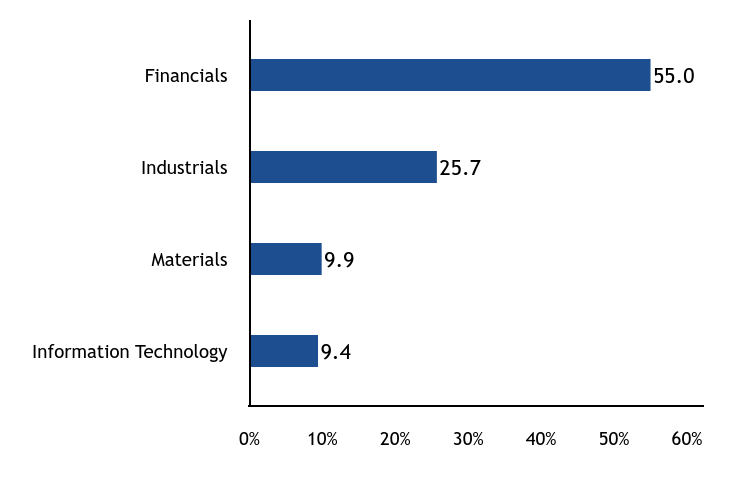
Sector Allocation - % Equities
| Value | Value |
|---|
| Energy | 3.6 |
| Materials | 7.6 |
| Information Technology | 11.4 |
| Industrials | 14.2 |
| Financials | 15.0 |
| Communication Services | 15.6 |
| Consumer Discretionary | 15.8 |
| Health Care | 16.8 |
This is a summary of certain changes to the Fund since June 30, 2023. For more complete information, you may review the Fund's next prospectus, which we expect to be available by November 1, 2024 at www.americanbeaconfunds.com/literature or upon request at 800-658-5811.
Effective November 1, 2023, the contractual expense limitation for the A Class was reduced from 1.12% to 1.06% (excluding taxes, interest, brokerage commissions, acquired fund fees and expenses, securities lending fees, expenses associated with securities sold short, litigation and other extraordinary expenses).
For additional information about the Fund, including its prospectus, financial statements, holdings, and proxy voting information, please visit www.americanbeaconfunds.com/literature or call 1-800-658-5811
If your financial institution mailed only one copy of this Report to an address shared by more than one account, you can request an individual copy by contacting your financial institution.
Distributed by Resolute Investment Distributors, Inc.
Shapiro Equity Opportunities Fund
Annual Shareholder Report - June 30, 2024
Shapiro Equity Opportunities Fund
Annual Shareholder Report - June 30, 2024
This annual shareholder report contains important information about American Beacon Shapiro Equity Opportunities Fund for the period of July 1, 2023 to June 30, 2024. You can find additional information about the Fund at www.americanbeaconfunds.com/literature. You can also request this information by contacting us at 800-658-5811. This report describes changes to the Fund that occurred during the reporting period.
What were the Fund costs for last year?
(based on a hypothetical $10,000 investment)
| Class Name | Cost of a $10,000 investment | Costs paid as a percentage of a $10,000 investment |
|---|
| Class C | $194 | 1.83% |
How did the Fund perform last year and what affected its performance?
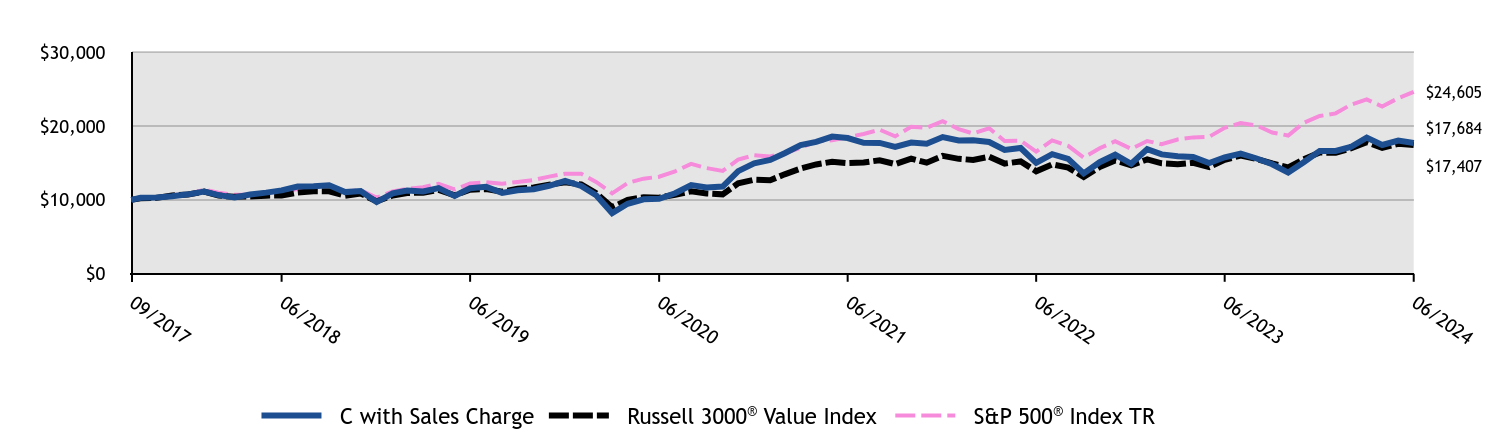
The C Class of the Fund returned 11.20% (with sales charges) and 12.20% (without sales charges) for the twelve months ended June 30, 2024, compared to the S&P 500 Index return of 24.56% and the Russell 3000 Value Index return of 12.93%.
• Over the trailing twelve months the market environment has been mixed for the sub-advisor’s investment style of long-term investing in stocks that were recent spinoffs, reorganizations, and misunderstood contrarian situations through an intrinsic value approach.
• Stocks held in the Fund with exposure to the Artificial Intelligence theme have benefited performance significantly.
• The Fund’s investments in smaller market cap stocks where the sub-advisor sees long-term intrinsic value opportunities have been challenged by the higher interest rate environment.
• The Fund’s performance was mainly driven by the sub-advisor’s securities selection decisions in the Information Technology and the Communication Services sectors, which contributed positively to performance, while securities selection in the Industrials sector detracted from performance.
• The S&P 500 Index TR has replaced the Russell 3000 Index since the last Shareholder Report to comply with a new regulatory requirement.
Cumulative Performance from September 12, 2017 through June 30, 2024
The initial investment, based on a $10,000 investment, is adjusted to reflect the maximum applicable sales charge, if any.
| C with Sales Charge | Russell 3000® Value Index | S&P 500® Index TR |
|---|
| 09/2017 | $10,000 | $10,000 | $10,000 |
| 09/2017 | $10,280 | $10,201 | $10,101 |
| 10/2017 | $10,330 | $10,270 | $10,336 |
| 11/2017 | $10,480 | $10,583 | $10,653 |
| 12/2017 | $10,747 | $10,718 | $10,772 |
| 01/2018 | $11,127 | $11,112 | $11,388 |
| 02/2018 | $10,636 | $10,580 | $10,969 |
| 03/2018 | $10,316 | $10,416 | $10,690 |
| 04/2018 | $10,717 | $10,461 | $10,731 |
| 05/2018 | $10,977 | $10,565 | $10,989 |
| 06/2018 | $11,277 | $10,594 | $11,057 |
| 07/2018 | $11,798 | $10,996 | $11,468 |
| 08/2018 | $11,828 | $11,166 | $11,842 |
| 09/2018 | $11,969 | $11,165 | $11,910 |
| 10/2018 | $11,047 | $10,556 | $11,096 |
| 11/2018 | $11,187 | $10,861 | $11,322 |
| 12/2018 | $9,704 | $9,799 | $10,299 |
| 01/2019 | $10,892 | $10,583 | $11,125 |
| 02/2019 | $11,263 | $10,926 | $11,482 |
| 03/2019 | $11,139 | $10,969 | $11,705 |
| 04/2019 | $11,594 | $11,359 | $12,179 |
| 05/2019 | $10,530 | $10,616 | $11,405 |
| 06/2019 | $11,563 | $11,372 | $12,209 |
| 07/2019 | $11,759 | $11,461 | $12,384 |
| 08/2019 | $10,943 | $11,104 | $12,188 |
| 09/2019 | $11,305 | $11,511 | $12,416 |
| 10/2019 | $11,439 | $11,680 | $12,685 |
| 11/2019 | $11,903 | $12,035 | $13,146 |
| 12/2019 | $12,573 | $12,372 | $13,542 |
| 01/2020 | $11,878 | $12,079 | $13,537 |
| 02/2020 | $10,618 | $10,909 | $12,423 |
| 03/2020 | $8,208 | $8,992 | $10,888 |
| 04/2020 | $9,468 | $10,009 | $12,284 |
| 05/2020 | $10,076 | $10,348 | $12,869 |
| 06/2020 | $10,152 | $10,300 | $13,125 |
| 07/2020 | $10,890 | $10,697 | $13,865 |
| 08/2020 | $11,997 | $11,146 | $14,862 |
| 09/2020 | $11,682 | $10,859 | $14,297 |
| 10/2020 | $11,791 | $10,746 | $13,917 |
| 11/2020 | $13,886 | $12,228 | $15,440 |
| 12/2020 | $14,934 | $12,728 | $16,034 |
| 01/2021 | $15,399 | $12,662 | $15,872 |
| 02/2021 | $16,308 | $13,456 | $16,310 |
| 03/2021 | $17,417 | $14,241 | $17,024 |
| 04/2021 | $17,849 | $14,791 | $17,933 |
| 05/2021 | $18,559 | $15,144 | $18,058 |
| 06/2021 | $18,359 | $14,976 | $18,479 |
| 07/2021 | $17,716 | $15,052 | $18,918 |
| 08/2021 | $17,705 | $15,357 | $19,494 |
| 09/2021 | $17,173 | $14,837 | $18,587 |
| 10/2021 | $17,761 | $15,578 | $19,889 |
| 11/2021 | $17,583 | $15,031 | $19,751 |
| 12/2021 | $18,496 | $15,957 | $20,637 |
| 01/2022 | $18,022 | $15,549 | $19,569 |
| 02/2022 | $18,070 | $15,396 | $18,983 |
| 03/2022 | $17,821 | $15,822 | $19,688 |
| 04/2022 | $16,754 | $14,908 | $17,971 |
| 05/2022 | $17,014 | $15,197 | $18,004 |
| 06/2022 | $15,011 | $13,859 | $16,518 |
| 07/2022 | $16,184 | $14,803 | $18,041 |
| 08/2022 | $15,544 | $14,361 | $17,305 |
| 09/2022 | $13,576 | $13,089 | $15,711 |
| 10/2022 | $15,094 | $14,449 | $16,983 |
| 11/2022 | $16,101 | $15,324 | $17,932 |
| 12/2022 | $14,878 | $14,683 | $16,899 |
| 01/2023 | $16,864 | $15,481 | $17,961 |
| 02/2023 | $16,147 | $14,947 | $17,523 |
| 03/2023 | $15,890 | $14,817 | $18,166 |
| 04/2023 | $15,801 | $15,007 | $18,450 |
| 05/2023 | $14,981 | $14,444 | $18,530 |
| 06/2023 | $15,762 | $15,414 | $19,754 |
| 07/2023 | $16,249 | $15,992 | $20,389 |
| 08/2023 | $15,596 | $15,540 | $20,064 |
| 09/2023 | $14,814 | $14,928 | $19,108 |
| 10/2023 | $13,686 | $14,380 | $18,706 |
| 11/2023 | $15,083 | $15,477 | $20,414 |
| 12/2023 | $16,621 | $16,395 | $21,342 |
| 01/2024 | $16,621 | $16,366 | $21,700 |
| 02/2024 | $17,146 | $16,966 | $22,859 |
| 03/2024 | $18,415 | $17,808 | $23,594 |
| 04/2024 | $17,428 | $17,026 | $22,631 |
| 05/2024 | $18,018 | $17,580 | $23,753 |
| 06/2024 | $17,684 | $17,407 | $24,605 |
Average Annual Total Returns (%)
| 1 Year | 5 Years | Since Inception (9/12/17) |
|---|
Class C without Deferred Sales Charge Footnote Reference1 | 12.20% | 8.87% | 8.75% |
Class C with Maximum Deferred Sales Charge -1.00%Footnote Reference1 | 11.20% | 8.87% | 8.75% |
Russell 3000® Value Index | 12.93% | 8.89% | 8.50% |
S&P 500® Index TR | 24.56% | 15.05% | 14.16% |
| Footnote | Description |
Footnote1 | Return may differ from actual shareholder return due to accounting adjustments for financial reporting purposes. |
Performance shown is historical and is not indicative of future returns. Investment returns and principal value will vary, and shares may be worth more or less at redemption than at original purchase. Performance shown is as of date indicated, and current performance may be lower or higher than the performance data quoted. To obtain performance as of the most recent month end, please visit americanbeaconfunds.com or call 800-967-9009. The graph and table do not reflect the deduction of taxes that a shareholder would pay on fund distributions or redemption of fund shares. The Fund's performance benefited from fee waivers. Performance includes historical performance of another Class of the Fund. For more information, visit americanbeaconfunds.com/Performance_Disclaimers.aspx.
| Total Net Assets | $132,330,417 |
| # of Portfolio Holdings | 24 |
| Portfolio Turnover Rate | 59% |
| Total Management Fees Paid | $1,365,422 |
What did the Fund invest in?
Top Ten Holdings - % Net Assets
| Lions Gate Entertainment Corp. | 5.3 |
| Zimmer Biomet Holdings, Inc. | 5.0 |
| Berkshire Hathaway, Inc. | 5.0 |
| Mohawk Industries, Inc. | 4.9 |
| Alphabet, Inc. | 4.9 |
| Walt Disney Co. | 4.9 |
| Bank of America Corp. | 4.8 |
| Nasdaq, Inc. | 4.8 |
| Baxter International, Inc. | 4.8 |
| L3Harris Technologies, Inc. | 4.7 |
Asset Allocation - % Investments
| Value | Value |
|---|
| Common Stocks | 100.0 |
Sector Allocation - % Equities
| Value | Value |
|---|
| Energy | 3.6 |
| Materials | 7.6 |
| Information Technology | 11.4 |
| Industrials | 14.2 |
| Financials | 15.0 |
| Communication Services | 15.6 |
| Consumer Discretionary | 15.8 |
| Health Care | 16.8 |
This is a summary of certain changes to the Fund since June 30, 2023. For more complete information, you may review the Fund's next prospectus, which we expect to be available by November 1, 2024 at www.americanbeaconfunds.com/literature or upon request at 800-658-5811.
Effective November 1, 2023, the contractual expense limitation for the C Class was reduced from 1.87% to 1.81% (excluding taxes, interest, brokerage commissions, acquired fund fees and expenses, securities lending fees, expenses associated with securities sold short, litigation and other extraordinary expenses).
For additional information about the Fund, including its prospectus, financial statements, holdings, and proxy voting information, please visit www.americanbeaconfunds.com/literature or call 1-800-658-5811
If your financial institution mailed only one copy of this Report to an address shared by more than one account, you can request an individual copy by contacting your financial institution.
Distributed by Resolute Investment Distributors, Inc.
Shapiro Equity Opportunities Fund
Annual Shareholder Report - June 30, 2024
Shapiro Equity Opportunities Fund
Annual Shareholder Report - June 30, 2024
This annual shareholder report contains important information about American Beacon Shapiro Equity Opportunities Fund for the period of July 1, 2023 to June 30, 2024. You can find additional information about the Fund at www.americanbeaconfunds.com/literature. You can also request this information by contacting us at 800-658-5811.
What were the Fund costs for last year?
(based on a hypothetical $10,000 investment)
| Class Name | Cost of a $10,000 investment | Costs paid as a percentage of a $10,000 investment |
|---|
| Investor | $114 | 1.07% |
How did the Fund perform last year and what affected its performance?
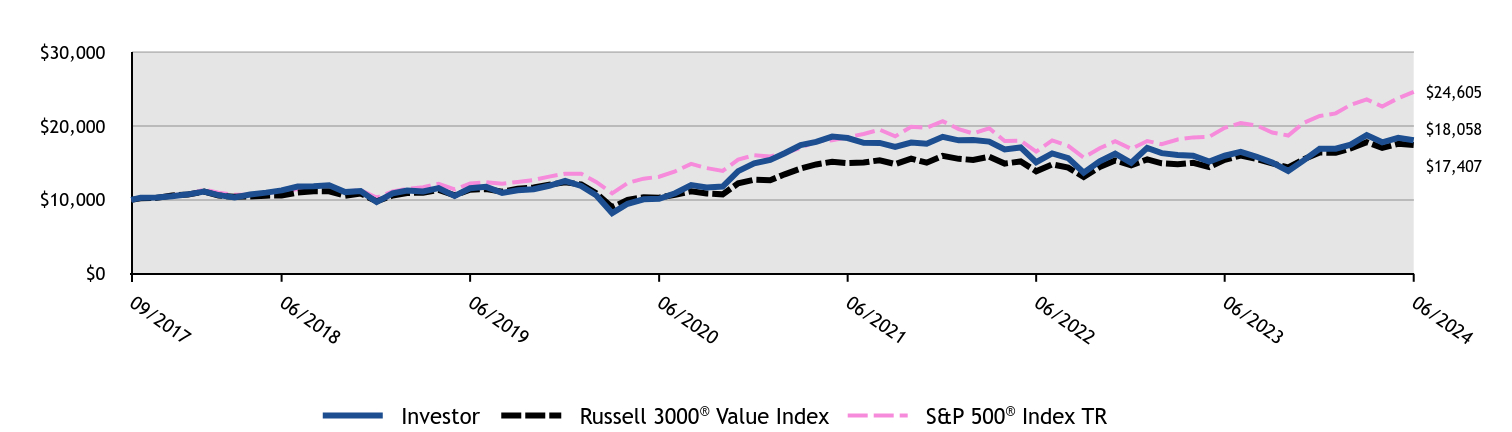
The Investor Class of the Fund returned 13.09% for the twelve months ended June 30, 2024, compared to the S&P 500 Index return of 24.56% and the Russell 3000 Value Index return of 12.93%.
• Over the trailing twelve months the market environment has been mixed for the sub-advisor’s investment style of long-term investing in stocks that were recent spinoffs, reorganizations, and misunderstood contrarian situations through an intrinsic value approach.
• Stocks held in the Fund with exposure to the Artificial Intelligence theme have benefited performance significantly.
• The Fund’s investments in smaller market cap stocks where the sub-advisor sees long-term intrinsic value opportunities have been challenged by the higher interest rate environment.
• The Fund’s performance was mainly driven by the sub-advisor’s securities selection decisions in the Information Technology and the Communication Services sectors, which contributed positively to performance, while securities selection in the Industrials sector detracted from performance.
• The S&P 500 Index TR has replaced the Russell 3000 Index since the last Shareholder Report to comply with a new regulatory requirement.
Cumulative Performance from September 12, 2017 through June 30, 2024
The initial investment, based on a $10,000 investment, is adjusted to reflect the maximum applicable sales charge, if any.
| Investor | Russell 3000® Value Index | S&P 500® Index TR |
|---|
| 09/2017 | $10,000 | $10,000 | $10,000 |
| 09/2017 | $10,280 | $10,201 | $10,101 |
| 10/2017 | $10,330 | $10,270 | $10,336 |
| 11/2017 | $10,480 | $10,583 | $10,653 |
| 12/2017 | $10,747 | $10,718 | $10,772 |
| 01/2018 | $11,127 | $11,112 | $11,388 |
| 02/2018 | $10,636 | $10,580 | $10,969 |
| 03/2018 | $10,316 | $10,416 | $10,690 |
| 04/2018 | $10,717 | $10,461 | $10,731 |
| 05/2018 | $10,977 | $10,565 | $10,989 |
| 06/2018 | $11,277 | $10,594 | $11,057 |
| 07/2018 | $11,798 | $10,996 | $11,468 |
| 08/2018 | $11,828 | $11,166 | $11,842 |
| 09/2018 | $11,969 | $11,165 | $11,910 |
| 10/2018 | $11,047 | $10,556 | $11,096 |
| 11/2018 | $11,187 | $10,861 | $11,322 |
| 12/2018 | $9,704 | $9,799 | $10,299 |
| 01/2019 | $10,892 | $10,583 | $11,125 |
| 02/2019 | $11,263 | $10,926 | $11,482 |
| 03/2019 | $11,139 | $10,969 | $11,705 |
| 04/2019 | $11,594 | $11,359 | $12,179 |
| 05/2019 | $10,530 | $10,616 | $11,405 |
| 06/2019 | $11,563 | $11,372 | $12,209 |
| 07/2019 | $11,759 | $11,461 | $12,384 |
| 08/2019 | $10,943 | $11,104 | $12,188 |
| 09/2019 | $11,305 | $11,511 | $12,416 |
| 10/2019 | $11,439 | $11,680 | $12,685 |
| 11/2019 | $11,903 | $12,035 | $13,146 |
| 12/2019 | $12,573 | $12,372 | $13,542 |
| 01/2020 | $11,878 | $12,079 | $13,537 |
| 02/2020 | $10,618 | $10,909 | $12,423 |
| 03/2020 | $8,208 | $8,992 | $10,888 |
| 04/2020 | $9,468 | $10,009 | $12,284 |
| 05/2020 | $10,076 | $10,348 | $12,869 |
| 06/2020 | $10,152 | $10,300 | $13,125 |
| 07/2020 | $10,890 | $10,697 | $13,865 |
| 08/2020 | $11,997 | $11,146 | $14,862 |
| 09/2020 | $11,682 | $10,859 | $14,297 |
| 10/2020 | $11,791 | $10,746 | $13,917 |
| 11/2020 | $13,886 | $12,228 | $15,440 |
| 12/2020 | $14,934 | $12,728 | $16,034 |
| 01/2021 | $15,399 | $12,662 | $15,872 |
| 02/2021 | $16,308 | $13,456 | $16,310 |
| 03/2021 | $17,417 | $14,241 | $17,024 |
| 04/2021 | $17,849 | $14,791 | $17,933 |
| 05/2021 | $18,559 | $15,144 | $18,058 |
| 06/2021 | $18,359 | $14,976 | $18,479 |
| 07/2021 | $17,716 | $15,052 | $18,918 |
| 08/2021 | $17,705 | $15,357 | $19,494 |
| 09/2021 | $17,173 | $14,837 | $18,587 |
| 10/2021 | $17,761 | $15,578 | $19,889 |
| 11/2021 | $17,594 | $15,031 | $19,751 |
| 12/2021 | $18,525 | $15,957 | $20,637 |
| 01/2022 | $18,051 | $15,549 | $19,569 |
| 02/2022 | $18,110 | $15,396 | $18,983 |
| 03/2022 | $17,885 | $15,822 | $19,688 |
| 04/2022 | $16,820 | $14,908 | $17,971 |
| 05/2022 | $17,092 | $15,197 | $18,004 |
| 06/2022 | $15,092 | $13,859 | $16,518 |
| 07/2022 | $16,287 | $14,803 | $18,041 |
| 08/2022 | $15,648 | $14,361 | $17,305 |
| 09/2022 | $13,672 | $13,089 | $15,711 |
| 10/2022 | $15,210 | $14,449 | $16,983 |
| 11/2022 | $16,240 | $15,324 | $17,932 |
| 12/2022 | $15,019 | $14,683 | $16,899 |
| 01/2023 | $17,034 | $15,481 | $17,961 |
| 02/2023 | $16,315 | $14,947 | $17,523 |
| 03/2023 | $16,071 | $14,817 | $18,166 |
| 04/2023 | $15,981 | $15,007 | $18,450 |
| 05/2023 | $15,173 | $14,444 | $18,530 |
| 06/2023 | $15,968 | $15,414 | $19,754 |
| 07/2023 | $16,482 | $15,992 | $20,389 |
| 08/2023 | $15,827 | $15,540 | $20,064 |
| 09/2023 | $15,044 | $14,928 | $19,108 |
| 10/2023 | $13,915 | $14,380 | $18,706 |
| 11/2023 | $15,339 | $15,477 | $20,414 |
| 12/2023 | $16,908 | $16,395 | $21,342 |
| 01/2024 | $16,921 | $16,366 | $21,700 |
| 02/2024 | $17,464 | $16,966 | $22,859 |
| 03/2024 | $18,768 | $17,808 | $23,594 |
| 04/2024 | $17,787 | $17,026 | $22,631 |
| 05/2024 | $18,394 | $17,580 | $23,753 |
| 06/2024 | $18,058 | $17,407 | $24,605 |
Average Annual Total Returns (%)
| 1 Year | 5 Years | Since Inception (9/12/17) |
|---|
Investor Class Footnote Reference1 | 13.09% | 9.33% | 9.08% |
Russell 3000® Value Index | 12.93% | 8.89% | 8.50% |
S&P 500® Index TR | 24.56% | 15.05% | 14.16% |
| Footnote | Description |
Footnote1 | Return may differ from actual shareholder return due to accounting adjustments for financial reporting purposes. |
Performance shown is historical and is not indicative of future returns. Investment returns and principal value will vary, and shares may be worth more or less at redemption than at original purchase. Performance shown is as of date indicated, and current performance may be lower or higher than the performance data quoted. To obtain performance as of the most recent month end, please visit americanbeaconfunds.com or call 800-967-9009. The graph and table do not reflect the deduction of taxes that a shareholder would pay on fund distributions or redemption of fund shares. The Fund's performance benefited from fee waivers. For more information, visit americanbeaconfunds.com/Performance_Disclaimers.aspx.
| Total Net Assets | $132,330,417 |
| # of Portfolio Holdings | 24 |
| Portfolio Turnover Rate | 59% |
| Total Management Fees Paid | $1,365,422 |
What did the Fund invest in?
Top Ten Holdings - % Net Assets
| Lions Gate Entertainment Corp. | 5.3 |
| Zimmer Biomet Holdings, Inc. | 5.0 |
| Berkshire Hathaway, Inc. | 5.0 |
| Mohawk Industries, Inc. | 4.9 |
| Alphabet, Inc. | 4.9 |
| Walt Disney Co. | 4.9 |
| Bank of America Corp. | 4.8 |
| Nasdaq, Inc. | 4.8 |
| Baxter International, Inc. | 4.8 |
| L3Harris Technologies, Inc. | 4.7 |
Asset Allocation - % Investments
| Value | Value |
|---|
| Common Stocks | 100.0 |
Sector Allocation - % Equities
| Value | Value |
|---|
| Energy | 3.6 |
| Materials | 7.6 |
| Information Technology | 11.4 |
| Industrials | 14.2 |
| Financials | 15.0 |
| Communication Services | 15.6 |
| Consumer Discretionary | 15.8 |
| Health Care | 16.8 |
For additional information about the Fund, including its prospectus, financial statements, holdings, and proxy voting information, please visit www.americanbeaconfunds.com/literature or call 1-800-658-5811
If your financial institution mailed only one copy of this Report to an address shared by more than one account, you can request an individual copy by contacting your financial institution.
Distributed by Resolute Investment Distributors, Inc.
Shapiro Equity Opportunities Fund
Annual Shareholder Report - June 30, 2024
Shapiro Equity Opportunities Fund
Annual Shareholder Report - June 30, 2024
This annual shareholder report contains important information about American Beacon Shapiro Equity Opportunities Fund for the period of July 1, 2023 to June 30, 2024. You can find additional information about the Fund at www.americanbeaconfunds.com/literature. You can also request this information by contacting us at 800-658-5811.
What were the Fund costs for last year?
(based on a hypothetical $10,000 investment)
| Class Name | Cost of a $10,000 investment | Costs paid as a percentage of a $10,000 investment |
|---|
| R5 | $85 | 0.80% |
How did the Fund perform last year and what affected its performance?
The R5 Class of the Fund returned 13.53% for the twelve months ended June 30, 2024, compared to the S&P 500 Index return of 24.56% and the Russell 3000 Value Index return of 12.93%.
• Over the trailing twelve months the market environment has been mixed for the sub-advisor’s investment style of long-term investing in stocks that were recent spinoffs, reorganizations, and misunderstood contrarian situations through an intrinsic value approach.
• Stocks held in the Fund with exposure to the Artificial Intelligence theme have benefited performance significantly.
• The Fund’s investments in smaller market cap stocks where the sub-advisor sees long-term intrinsic value opportunities have been challenged by the higher interest rate environment.
• The Fund’s performance was mainly driven by the sub-advisor’s securities selection decisions in the Information Technology and the Communication Services sectors, which contributed positively to performance, while securities selection in the Industrials sector detracted from performance.
• The S&P 500 Index TR has replaced the Russell 3000 Index since the last Shareholder Report to comply with a new regulatory requirement.
Cumulative Performance from September 12, 2017 through June 30, 2024
The initial investment, based on a $250,000 investment, is adjusted to reflect the maximum applicable sales charge, if any.
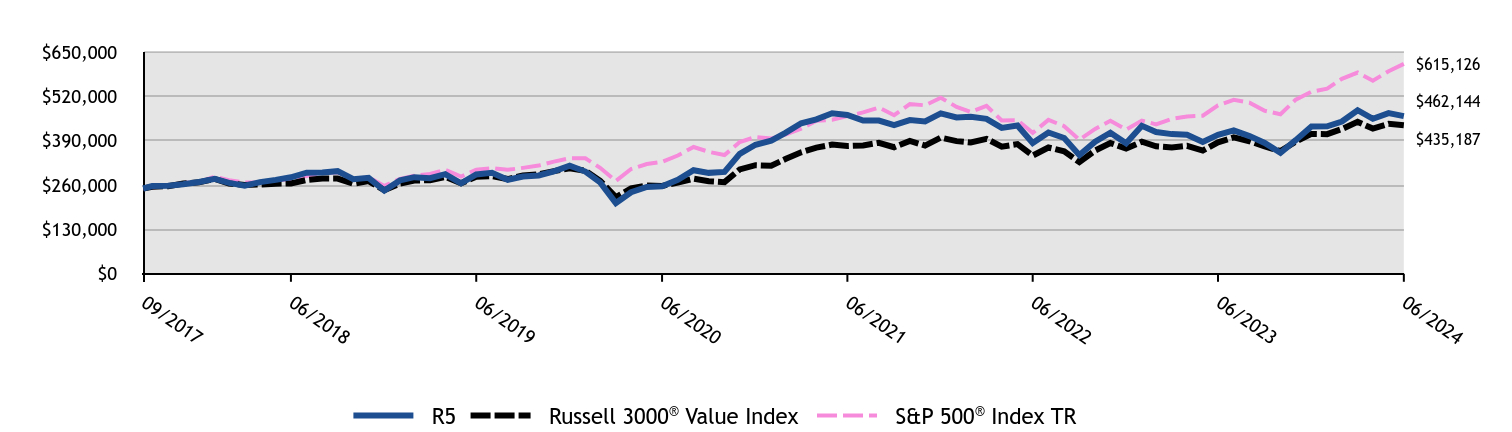
| R5 | Russell 3000® Value Index | S&P 500® Index TR |
|---|
| 09/2017 | $250,000 | $250,000 | $250,000 |
| 09/2017 | $257,000 | $255,014 | $252,514 |
| 10/2017 | $258,250 | $256,750 | $258,406 |
| 11/2017 | $262,250 | $264,578 | $266,331 |
| 12/2017 | $268,916 | $267,960 | $269,293 |
| 01/2018 | $278,430 | $277,798 | $284,711 |
| 02/2018 | $266,412 | $264,488 | $274,217 |
| 03/2018 | $258,399 | $260,405 | $267,248 |
| 04/2018 | $268,665 | $261,537 | $268,274 |
| 05/2018 | $275,175 | $264,121 | $274,734 |
| 06/2018 | $282,687 | $264,858 | $276,425 |
| 07/2018 | $296,208 | $274,896 | $286,712 |
| 08/2018 | $296,959 | $279,146 | $296,055 |
| 09/2018 | $300,715 | $279,134 | $297,740 |
| 10/2018 | $277,429 | $263,900 | $277,389 |
| 11/2018 | $281,185 | $271,522 | $283,042 |
| 12/2018 | $243,862 | $244,978 | $257,486 |
| 01/2019 | $273,797 | $264,577 | $278,120 |
| 02/2019 | $283,087 | $273,159 | $287,050 |
| 03/2019 | $279,990 | $274,215 | $292,628 |
| 04/2019 | $291,861 | $283,986 | $304,476 |
| 05/2019 | $265,023 | $265,388 | $285,127 |
| 06/2019 | $291,087 | $284,294 | $305,222 |
| 07/2019 | $296,248 | $286,522 | $309,608 |
| 08/2019 | $275,603 | $277,591 | $304,704 |
| 09/2019 | $284,893 | $287,779 | $310,405 |
| 10/2019 | $287,990 | $291,995 | $317,129 |
| 11/2019 | $300,119 | $300,877 | $328,640 |
| 12/2019 | $316,988 | $309,302 | $338,559 |
| 01/2020 | $299,589 | $301,984 | $338,426 |
| 02/2020 | $268,053 | $272,732 | $310,567 |
| 03/2020 | $207,429 | $224,798 | $272,208 |
| 04/2020 | $238,964 | $250,215 | $307,104 |
| 05/2020 | $254,460 | $258,707 | $321,730 |
| 06/2020 | $256,635 | $257,512 | $328,129 |
| 07/2020 | $275,394 | $267,415 | $346,630 |
| 08/2020 | $303,395 | $278,660 | $371,546 |
| 09/2020 | $295,783 | $271,464 | $357,429 |
| 10/2020 | $298,502 | $268,642 | $347,923 |
| 11/2020 | $351,514 | $305,704 | $386,008 |
| 12/2020 | $378,156 | $318,193 | $400,850 |
| 01/2021 | $390,095 | $316,543 | $396,803 |
| 02/2021 | $413,140 | $336,394 | $407,745 |
| 03/2021 | $441,182 | $356,025 | $425,602 |
| 04/2021 | $452,566 | $369,768 | $448,316 |
| 05/2021 | $470,336 | $378,598 | $451,447 |
| 06/2021 | $465,615 | $374,412 | $461,986 |
| 07/2021 | $449,234 | $376,293 | $472,961 |
| 08/2021 | $448,957 | $383,924 | $487,341 |
| 09/2021 | $435,907 | $370,937 | $464,675 |
| 10/2021 | $450,623 | $389,459 | $497,231 |
| 11/2021 | $446,458 | $375,763 | $493,786 |
| 12/2021 | $470,226 | $398,917 | $515,915 |
| 01/2022 | $458,336 | $388,718 | $489,218 |
| 02/2022 | $460,120 | $384,894 | $474,570 |
| 03/2022 | $454,175 | $395,545 | $492,191 |
| 04/2022 | $427,424 | $372,698 | $449,271 |
| 05/2022 | $434,557 | $379,937 | $450,095 |
| 06/2022 | $383,433 | $346,474 | $412,943 |
| 07/2022 | $414,048 | $370,081 | $451,018 |
| 08/2022 | $397,997 | $359,014 | $432,624 |
| 09/2022 | $347,765 | $327,222 | $392,780 |
| 10/2022 | $387,000 | $361,230 | $424,580 |
| 11/2022 | $413,454 | $383,101 | $448,308 |
| 12/2022 | $382,537 | $367,084 | $422,479 |
| 01/2023 | $433,542 | $387,032 | $449,025 |
| 02/2023 | $415,464 | $373,668 | $438,069 |
| 03/2023 | $409,330 | $370,437 | $454,152 |
| 04/2023 | $407,394 | $375,184 | $461,241 |
| 05/2023 | $386,411 | $361,095 | $463,246 |
| 06/2023 | $407,071 | $385,347 | $493,855 |
| 07/2023 | $420,306 | $399,793 | $509,720 |
| 08/2023 | $403,520 | $388,496 | $501,604 |
| 09/2023 | $383,505 | $373,197 | $477,689 |
| 10/2023 | $354,775 | $359,508 | $467,645 |
| 11/2023 | $391,576 | $386,927 | $510,353 |
| 12/2023 | $431,530 | $409,869 | $533,538 |
| 01/2024 | $432,181 | $409,149 | $542,504 |
| 02/2024 | $446,186 | $424,145 | $571,471 |
| 03/2024 | $479,405 | $445,204 | $589,858 |
| 04/2024 | $454,328 | $425,654 | $565,766 |
| 05/2024 | $470,937 | $439,504 | $593,819 |
| 06/2024 | $462,144 | $435,187 | $615,126 |
Average Annual Total Returns (%)
| 1 Year | 5 Years | Since Inception (9/12/17) |
|---|
Class R5 Footnote Reference1 | 13.53% | 9.69% | 9.46% |
Russell 3000® Value Index | 12.93% | 8.89% | 8.50% |
S&P 500® Index TR | 24.56% | 15.05% | 14.16% |
| Footnote | Description |
Footnote1 | Return may differ from actual shareholder return due to accounting adjustments for financial reporting purposes. |
Performance shown is historical and is not indicative of future returns. Investment returns and principal value will vary, and shares may be worth more or less at redemption than at original purchase. Performance shown is as of date indicated, and current performance may be lower or higher than the performance data quoted. To obtain performance as of the most recent month end, please visit americanbeaconfunds.com or call 800-967-9009. The graph and table do not reflect the deduction of taxes that a shareholder would pay on fund distributions or redemption of fund shares. The Fund's performance benefited from fee waivers. For more information, visit americanbeaconfunds.com/Performance_Disclaimers.aspx.
| Total Net Assets | $132,330,417 |
| # of Portfolio Holdings | 24 |
| Portfolio Turnover Rate | 59% |
| Total Management Fees Paid | $1,365,422 |
What did the Fund invest in?
Top Ten Holdings - % Net Assets
| Lions Gate Entertainment Corp. | 5.3 |
| Zimmer Biomet Holdings, Inc. | 5.0 |
| Berkshire Hathaway, Inc. | 5.0 |
| Mohawk Industries, Inc. | 4.9 |
| Alphabet, Inc. | 4.9 |
| Walt Disney Co. | 4.9 |
| Bank of America Corp. | 4.8 |
| Nasdaq, Inc. | 4.8 |
| Baxter International, Inc. | 4.8 |
| L3Harris Technologies, Inc. | 4.7 |
Asset Allocation - % Investments
| Value | Value |
|---|
| Common Stocks | 100.0 |
Sector Allocation - % Equities
| Value | Value |
|---|
| Energy | 3.6 |
| Materials | 7.6 |
| Information Technology | 11.4 |
| Industrials | 14.2 |
| Financials | 15.0 |
| Communication Services | 15.6 |
| Consumer Discretionary | 15.8 |
| Health Care | 16.8 |
For additional information about the Fund, including its prospectus, financial statements, holdings, and proxy voting information, please visit www.americanbeaconfunds.com/literature or call 1-800-658-5811
If your financial institution mailed only one copy of this Report to an address shared by more than one account, you can request an individual copy by contacting your financial institution.
Distributed by Resolute Investment Distributors, Inc.
Shapiro Equity Opportunities Fund
Annual Shareholder Report - June 30, 2024
Shapiro Equity Opportunities Fund
Annual Shareholder Report - June 30, 2024
This annual shareholder report contains important information about American Beacon Shapiro Equity Opportunities Fund for the period of July 1, 2023 to June 30, 2024. You can find additional information about the Fund at www.americanbeaconfunds.com/literature. You can also request this information by contacting us at 800-658-5811.
What were the Fund costs for last year?
(based on a hypothetical $10,000 investment)
| Class Name | Cost of a $10,000 investment | Costs paid as a percentage of a $10,000 investment |
|---|
| Y | $96 | 0.90% |
How did the Fund perform last year and what affected its performance?
The Y Class of the Fund returned 13.23% for the twelve months ended June 30, 2024, compared to the S&P 500 Index return of 24.56% and the Russell 3000 Value Index return of 12.93%.
• Over the trailing twelve months the market environment has been mixed for the sub-advisor’s investment style of long-term investing in stocks that were recent spinoffs, reorganizations, and misunderstood contrarian situations through an intrinsic value approach.
• Stocks held in the Fund with exposure to the Artificial Intelligence theme have benefited performance significantly.
• The Fund’s investments in smaller market cap stocks where the sub-advisor sees long-term intrinsic value opportunities have been challenged by the higher interest rate environment.
• The Fund’s performance was mainly driven by the sub-advisor’s securities selection decisions in the Information Technology and the Communication Services sectors, which contributed positively to performance, while securities selection in the Industrials sector detracted from performance.
• The S&P 500 Index TR has replaced the Russell 3000 Index since the last Shareholder Report to comply with a new regulatory requirement.
Cumulative Performance from September 12, 2017 through June 30, 2024
The initial investment, based on a $100,000 investment, is adjusted to reflect the maximum applicable sales charge, if any.
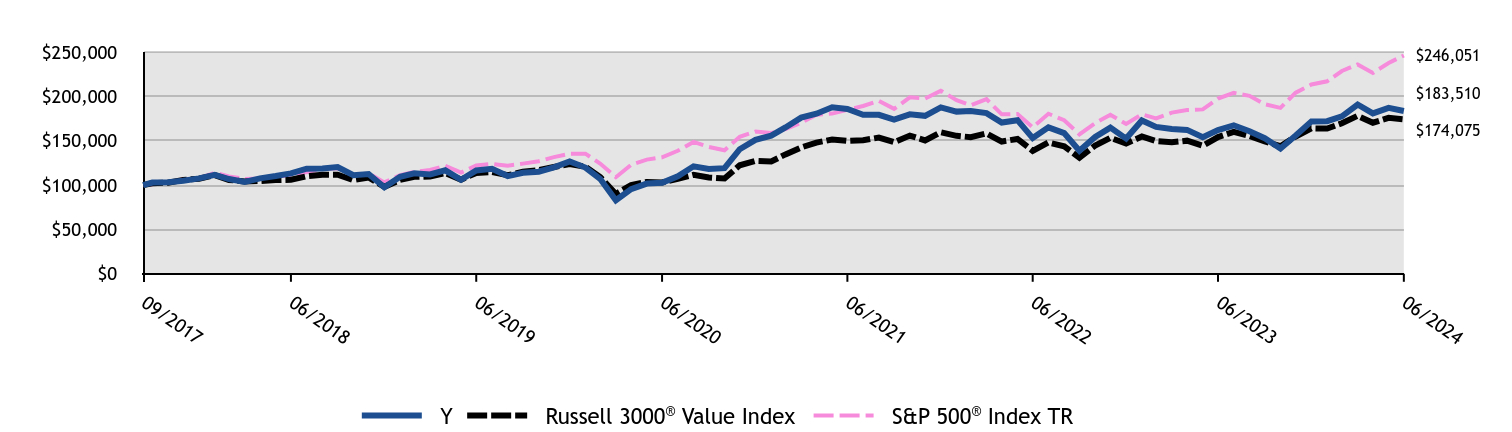
| Y | Russell 3000® Value Index | S&P 500® Index TR |
|---|
| 09/2017 | $100,000 | $100,000 | $100,000 |
| 09/2017 | $102,800 | $102,006 | $101,006 |
| 10/2017 | $103,300 | $102,700 | $103,362 |
| 11/2017 | $104,900 | $105,831 | $106,533 |
| 12/2017 | $107,566 | $107,184 | $107,717 |
| 01/2018 | $111,572 | $111,119 | $113,884 |
| 02/2018 | $106,765 | $105,795 | $109,687 |
| 03/2018 | $103,460 | $104,162 | $106,899 |
| 04/2018 | $107,566 | $104,615 | $107,310 |
| 05/2018 | $110,170 | $105,648 | $109,894 |
| 06/2018 | $113,175 | $105,943 | $110,570 |
| 07/2018 | $118,483 | $109,959 | $114,685 |
| 08/2018 | $118,784 | $111,658 | $118,422 |
| 09/2018 | $120,286 | $111,654 | $119,096 |
| 10/2018 | $111,072 | $105,560 | $110,956 |
| 11/2018 | $112,474 | $108,609 | $113,217 |
| 12/2018 | $97,545 | $97,991 | $102,994 |
| 01/2019 | $109,416 | $105,831 | $111,248 |
| 02/2019 | $113,235 | $109,264 | $114,820 |
| 03/2019 | $111,996 | $109,686 | $117,051 |
| 04/2019 | $116,641 | $113,594 | $121,790 |
| 05/2019 | $106,009 | $106,155 | $114,051 |
| 06/2019 | $116,435 | $113,718 | $122,089 |
| 07/2019 | $118,396 | $114,609 | $123,843 |
| 08/2019 | $110,138 | $111,036 | $121,882 |
| 09/2019 | $113,854 | $115,111 | $124,162 |
| 10/2019 | $115,093 | $116,798 | $126,851 |
| 11/2019 | $119,944 | $120,351 | $131,456 |
| 12/2019 | $126,692 | $123,721 | $135,424 |
| 01/2020 | $119,732 | $120,794 | $135,371 |
| 02/2020 | $107,117 | $109,093 | $124,227 |
| 03/2020 | $82,866 | $89,919 | $108,883 |
| 04/2020 | $95,481 | $100,086 | $122,841 |
| 05/2020 | $101,680 | $103,483 | $128,692 |
| 06/2020 | $102,550 | $103,005 | $131,251 |
| 07/2020 | $109,945 | $106,966 | $138,652 |
| 08/2020 | $121,146 | $111,464 | $148,619 |
| 09/2020 | $118,101 | $108,586 | $142,972 |
| 10/2020 | $119,080 | $107,457 | $139,169 |
| 11/2020 | $140,394 | $122,281 | $154,403 |
| 12/2020 | $150,943 | $127,277 | $160,340 |
| 01/2021 | $155,719 | $126,617 | $158,721 |
| 02/2021 | $164,938 | $134,558 | $163,098 |
| 03/2021 | $176,045 | $142,410 | $170,241 |
| 04/2021 | $180,488 | $147,907 | $179,326 |
| 05/2021 | $187,707 | $151,439 | $180,579 |
| 06/2021 | $185,708 | $149,765 | $184,794 |
| 07/2021 | $179,266 | $150,517 | $189,184 |
| 08/2021 | $179,155 | $153,570 | $194,937 |
| 09/2021 | $173,824 | $148,375 | $185,870 |
| 10/2021 | $179,710 | $155,783 | $198,892 |
| 11/2021 | $178,044 | $150,305 | $197,514 |
| 12/2021 | $187,549 | $159,567 | $206,366 |
| 01/2022 | $182,795 | $155,487 | $195,687 |
| 02/2022 | $183,389 | $153,958 | $189,828 |
| 03/2022 | $181,131 | $158,218 | $196,876 |
| 04/2022 | $170,434 | $149,079 | $179,708 |
| 05/2022 | $173,168 | $151,975 | $180,038 |
| 06/2022 | $152,963 | $138,590 | $165,177 |
| 07/2022 | $165,086 | $148,032 | $180,407 |
| 08/2022 | $158,549 | $143,606 | $173,050 |
| 09/2022 | $138,700 | $130,889 | $157,112 |
| 10/2022 | $154,270 | $144,492 | $169,832 |
| 11/2022 | $164,729 | $153,240 | $179,323 |
| 12/2022 | $152,390 | $146,834 | $168,991 |
| 01/2023 | $172,777 | $154,813 | $179,610 |
| 02/2023 | $165,551 | $149,467 | $175,228 |
| 03/2023 | $163,100 | $148,175 | $181,661 |
| 04/2023 | $162,196 | $150,073 | $184,496 |
| 05/2023 | $153,938 | $144,438 | $185,298 |
| 06/2023 | $162,067 | $154,139 | $197,542 |
| 07/2023 | $167,358 | $159,917 | $203,888 |
| 08/2023 | $160,648 | $155,398 | $200,642 |
| 09/2023 | $152,777 | $149,279 | $191,076 |
| 10/2023 | $141,293 | $143,803 | $187,058 |
| 11/2023 | $155,874 | $154,771 | $204,141 |
| 12/2023 | $171,796 | $163,948 | $213,415 |
| 01/2024 | $172,057 | $163,660 | $217,002 |
| 02/2024 | $177,523 | $169,658 | $228,589 |
| 03/2024 | $190,798 | $178,082 | $235,943 |
| 04/2024 | $180,776 | $170,262 | $226,306 |
| 05/2024 | $187,024 | $175,802 | $237,528 |
| 06/2024 | $183,510 | $174,075 | $246,051 |
Average Annual Total Returns (%)
| 1 Year | 5 Years | Since Inception (9/12/17) |
|---|
Class Y Footnote Reference1 | 13.23% | 9.53% | 9.34% |
Russell 3000® Value Index | 12.93% | 8.89% | 8.50% |
S&P 500® Index TR | 24.56% | 15.05% | 14.16% |
| Footnote | Description |
Footnote1 | Return may differ from actual shareholder return due to accounting adjustments for financial reporting purposes. |
Performance shown is historical and is not indicative of future returns. Investment returns and principal value will vary, and shares may be worth more or less at redemption than at original purchase. Performance shown is as of date indicated, and current performance may be lower or higher than the performance data quoted. To obtain performance as of the most recent month end, please visit americanbeaconfunds.com or call 800-967-9009. The graph and table do not reflect the deduction of taxes that a shareholder would pay on fund distributions or redemption of fund shares. The Fund's performance benefited from fee waivers. For more information, visit americanbeaconfunds.com/Performance_Disclaimers.aspx.
| Total Net Assets | $132,330,417 |
| # of Portfolio Holdings | 24 |
| Portfolio Turnover Rate | 59% |
| Total Management Fees Paid | $1,365,422 |
What did the Fund invest in?
Top Ten Holdings - % Net Assets
| Lions Gate Entertainment Corp. | 5.3 |
| Zimmer Biomet Holdings, Inc. | 5.0 |
| Berkshire Hathaway, Inc. | 5.0 |
| Mohawk Industries, Inc. | 4.9 |
| Alphabet, Inc. | 4.9 |
| Walt Disney Co. | 4.9 |
| Bank of America Corp. | 4.8 |
| Nasdaq, Inc. | 4.8 |
| Baxter International, Inc. | 4.8 |
| L3Harris Technologies, Inc. | 4.7 |
Asset Allocation - % Investments
| Value | Value |
|---|
| Common Stocks | 100.0 |
Sector Allocation - % Equities
| Value | Value |
|---|
| Energy | 3.6 |
| Materials | 7.6 |
| Information Technology | 11.4 |
| Industrials | 14.2 |
| Financials | 15.0 |
| Communication Services | 15.6 |
| Consumer Discretionary | 15.8 |
| Health Care | 16.8 |
For additional information about the Fund, including its prospectus, financial statements, holdings, and proxy voting information, please visit www.americanbeaconfunds.com/literature or call 1-800-658-5811
If your financial institution mailed only one copy of this Report to an address shared by more than one account, you can request an individual copy by contacting your financial institution.
Distributed by Resolute Investment Distributors, Inc.
Shapiro Equity Opportunities Fund
Annual Shareholder Report - June 30, 2024
Shapiro SMID Cap Equity Fund
Annual Shareholder Report - June 30, 2024
This annual shareholder report contains important information about American Beacon Shapiro SMID Cap Equity Fund for the period of July 1, 2023 to June 30, 2024. You can find additional information about the Fund at www.americanbeaconfunds.com/literature. You can also request this information by contacting us at 800-658-5811. This report describes changes to the Fund that occurred during the reporting period.
What were the Fund costs for last year?
(based on a hypothetical $10,000 investment)
| Class Name | Cost of a $10,000 investment | Costs paid as a percentage of a $10,000 investment |
|---|
| Class A | $124 | 1.25% |
How did the Fund perform last year and what affected its performance?
The A Class of the Fund returned -7.91% (with sales charges) and -2.26% (without sales charges) for the twelve months ended June 30, 2024, compared to the S&P 500 Index return of 24.56% and the Russell 2500 Value Index return of 11.24%.
• Over the trailing twelve months the market environment has been challenging for the sub-advisor’s investment style of long-term investing in stocks that were recent spinoffs, reorganizations, and misunderstood contrarian situations through an intrinsic value approach.
• In particular, higher interest rates contributed to underperformance by sub-advisor’s concentrated investments in complex situations.
• The sub-advisor’s security selection in the Materials and the Consumer Discretionary sectors materially detracted from Fund performance, while security selection in the Information Technology sector contributed positively to performance.
• An overweight allocation to the Communication Services sector and an underweight allocation to the Financials sector detracted from performance.
• The S&P 500 Index TR has replaced the Russell 2500® Index since the last Shareholder Report to comply with a new regulatory requirement.
Cumulative Performance from September 12, 2017 through June 30, 2024
The initial investment, based on a $10,000 investment, is adjusted to reflect the maximum applicable sales charge, if any.
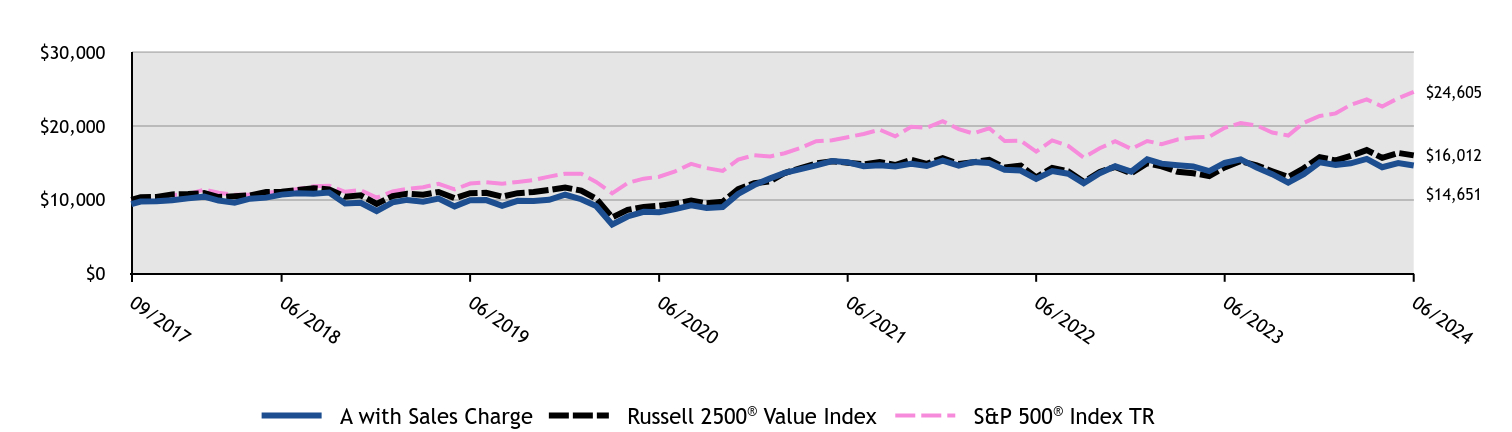
| A with Sales Charge | Russell 2500® Value Index | S&P 500® Index TR |
|---|
| 09/2017 | $9,425 | $10,000 | $10,000 |
| 09/2017 | $9,774 | $10,343 | $10,101 |
| 10/2017 | $9,811 | $10,399 | $10,336 |
| 11/2017 | $9,943 | $10,740 | $10,653 |
| 12/2017 | $10,198 | $10,782 | $10,772 |
| 01/2018 | $10,434 | $10,918 | $11,388 |
| 02/2018 | $9,906 | $10,382 | $10,969 |
| 03/2018 | $9,623 | $10,497 | $10,690 |
| 04/2018 | $10,160 | $10,611 | $10,731 |
| 05/2018 | $10,302 | $11,047 | $10,989 |
| 06/2018 | $10,707 | $11,105 | $11,057 |
| 07/2018 | $10,895 | $11,326 | $11,468 |
| 08/2018 | $10,839 | $11,584 | $11,842 |
| 09/2018 | $10,980 | $11,402 | $11,910 |
| 10/2018 | $9,519 | $10,427 | $11,096 |
| 11/2018 | $9,604 | $10,624 | $11,322 |
| 12/2018 | $8,487 | $9,450 | $10,299 |
| 01/2019 | $9,673 | $10,506 | $11,125 |
| 02/2019 | $9,993 | $10,834 | $11,482 |
| 03/2019 | $9,745 | $10,689 | $11,705 |
| 04/2019 | $10,178 | $11,064 | $12,179 |
| 05/2019 | $9,116 | $10,230 | $11,405 |
| 06/2019 | $9,951 | $10,892 | $12,209 |
| 07/2019 | $9,972 | $10,963 | $12,384 |
| 08/2019 | $9,199 | $10,429 | $12,188 |
| 09/2019 | $9,869 | $10,906 | $12,416 |
| 10/2019 | $9,848 | $11,063 | $12,685 |
| 11/2019 | $10,013 | $11,335 | $13,146 |
| 12/2019 | $10,691 | $11,677 | $13,542 |
| 01/2020 | $10,084 | $11,251 | $13,537 |
| 02/2020 | $9,178 | $10,166 | $12,423 |
| 03/2020 | $6,660 | $7,632 | $10,888 |
| 04/2020 | $7,753 | $8,641 | $12,284 |
| 05/2020 | $8,383 | $9,036 | $12,869 |
| 06/2020 | $8,316 | $9,204 | $13,125 |
| 07/2020 | $8,747 | $9,481 | $13,865 |
| 08/2020 | $9,255 | $9,911 | $14,862 |
| 09/2020 | $8,891 | $9,530 | $14,297 |
| 10/2020 | $9,034 | $9,745 | $13,917 |
| 11/2020 | $10,801 | $11,450 | $15,440 |
| 12/2020 | $12,001 | $12,246 | $16,034 |
| 01/2021 | $12,907 | $12,517 | $15,872 |
| 02/2021 | $13,656 | $13,631 | $16,310 |
| 03/2021 | $14,160 | $14,307 | $17,024 |
| 04/2021 | $14,652 | $14,921 | $17,933 |
| 05/2021 | $15,256 | $15,224 | $18,058 |
| 06/2021 | $15,077 | $15,023 | $18,479 |
| 07/2021 | $14,551 | $14,803 | $18,918 |
| 08/2021 | $14,674 | $15,115 | $19,494 |
| 09/2021 | $14,507 | $14,712 | $18,587 |
| 10/2021 | $14,887 | $15,411 | $19,889 |
| 11/2021 | $14,574 | $14,875 | $19,751 |
| 12/2021 | $15,313 | $15,649 | $20,637 |
| 01/2022 | $14,616 | $14,853 | $19,569 |
| 02/2022 | $15,123 | $15,095 | $18,983 |
| 03/2022 | $14,984 | $15,414 | $19,688 |
| 04/2022 | $14,071 | $14,369 | $17,971 |
| 05/2022 | $13,969 | $14,644 | $18,004 |
| 06/2022 | $12,841 | $13,041 | $16,518 |
| 07/2022 | $13,893 | $14,304 | $18,041 |
| 08/2022 | $13,538 | $13,855 | $17,305 |
| 09/2022 | $12,258 | $12,454 | $15,711 |
| 10/2022 | $13,602 | $13,769 | $16,983 |
| 11/2022 | $14,540 | $14,460 | $17,932 |
| 12/2022 | $13,812 | $13,601 | $16,899 |
| 01/2023 | $15,469 | $14,960 | $17,961 |
| 02/2023 | $14,899 | $14,536 | $17,523 |
| 03/2023 | $14,692 | $13,791 | $18,166 |
| 04/2023 | $14,524 | $13,607 | $18,450 |
| 05/2023 | $13,890 | $13,219 | $18,530 |
| 06/2023 | $14,990 | $14,394 | $19,754 |
| 07/2023 | $15,469 | $15,237 | $20,389 |
| 08/2023 | $14,356 | $14,651 | $20,064 |
| 09/2023 | $13,475 | $13,867 | $19,108 |
| 10/2023 | $12,336 | $13,089 | $18,706 |
| 11/2023 | $13,462 | $14,276 | $20,414 |
| 12/2023 | $15,070 | $15,775 | $21,342 |
| 01/2024 | $14,734 | $15,332 | $21,700 |
| 02/2024 | $14,944 | $15,947 | $22,859 |
| 03/2024 | $15,532 | $16,732 | $23,594 |
| 04/2024 | $14,413 | $15,680 | $22,631 |
| 05/2024 | $14,986 | $16,341 | $23,753 |
| 06/2024 | $14,651 | $16,012 | $24,605 |
Average Annual Total Returns (%)
| 1 Year | 5 Years | Since Inception (9/12/17) |
|---|
Class A without Sales Charge Footnote Reference1 | (2.26)% | 8.04% | 6.70% |
Class A with Maximum Sales Charge - 5.75%Footnote Reference1 | (7.91)% | 6.77% | 5.78% |
Russell 2500® Value Index | 11.24% | 8.01% | 7.17% |
S&P 500® Index TR | 24.56% | 15.05% | 14.16% |
| Footnote | Description |
Footnote1 | Return may differ from actual shareholder return due to accounting adjustments for financial reporting purposes. |
Performance shown is historical and is not indicative of future returns. Investment returns and principal value will vary, and shares may be worth more or less at redemption than at original purchase. Performance shown is as of date indicated, and current performance may be lower or higher than the performance data quoted. To obtain performance as of the most recent month end, please visit americanbeaconfunds.com or call 800-967-9009. The graph and table do not reflect the deduction of taxes that a shareholder would pay on fund distributions or redemption of fund shares. The Fund's performance benefited from fee waivers. Performance includes historical performance of another Class of the Fund. For more information, visit americanbeaconfunds.com/Performance_Disclaimers.aspx.
| Total Net Assets | $43,352,824 |
| # of Portfolio Holdings | 26 |
| Portfolio Turnover Rate | 43% |
| Total Management Fees Paid | $382,097 |
What did the Fund invest in?
Top Ten Holdings - % Net Assets
| Atlanta Braves Holdings, Inc. | 5.1 |
| Madison Square Garden Sports Corp. | 5.1 |
| Graphic Packaging Holding Co. | 4.9 |
| Ultra Clean Holdings, Inc. | 4.9 |
| Mohawk Industries, Inc. | 4.9 |
| BWX Technologies, Inc. | 4.9 |
| NCR Voyix Corp. | 4.9 |
| Lions Gate Entertainment Corp. | 4.8 |
| Ingredion, Inc. | 4.8 |
| SS&C Technologies Holdings, Inc. | 4.8 |
Asset Allocation - % Investments
| Value | Value |
|---|
| Common Stocks | 98.2 |
| Foreign Common Stocks | 1.8 |
Sector Allocation - % Equities
| Value | Value |
|---|
| Energy | 1.8 |
| Consumer Staples | 9.4 |
| Health Care | 9.7 |
| Information Technology | 13.8 |
| Materials | 15.1 |
| Communication Services | 15.1 |
| Consumer Discretionary | 16.6 |
| Industrials | 18.5 |
This is a summary of certain changes to the Fund since June 30, 2023. For more complete information, you may review the Fund's next prospectus, which we expect to be available by November 1, 2024 at www.americanbeaconfunds.com/literature or upon request at 800-658-5811.
Effective November 1, 2023, the contractual expense limitation for the A Class was reduced from 1.26% to 1.25% (excluding taxes, interest, brokerage commissions, acquired fund fees and expenses, securities lending fees, expenses associated with securities sold short, litigation and other extraordinary expenses).
For additional information about the Fund, including its prospectus, financial statements, holdings, and proxy voting information, please visit www.americanbeaconfunds.com/literature or call 1-800-658-5811
If your financial institution mailed only one copy of this Report to an address shared by more than one account, you can request an individual copy by contacting your financial institution.
Distributed by Resolute Investment Distributors, Inc.
Shapiro SMID Cap Equity Fund
Annual Shareholder Report - June 30, 2024
Shapiro SMID Cap Equity Fund
Annual Shareholder Report - June 30, 2024
This annual shareholder report contains important information about American Beacon Shapiro SMID Cap Equity Fund for the period of July 1, 2023 to June 30, 2024. You can find additional information about the Fund at www.americanbeaconfunds.com/literature. You can also request this information by contacting us at 800-658-5811.
What were the Fund costs for last year?
(based on a hypothetical $10,000 investment)
| Class Name | Cost of a $10,000 investment | Costs paid as a percentage of a $10,000 investment |
|---|
| Class C | $198 | 2.01% |
How did the Fund perform last year and what affected its performance?
The C Class of the Fund returned -4.02% (with sales charges) and -3.02% (without sales charges) for the twelve months ended June 30, 2024, compared to the S&P 500 Index return of 24.56% and the Russell 2500 Value Index return of 11.24%.
• Over the trailing twelve months the market environment has been challenging for the sub-advisor’s investment style of long-term investing in stocks that were recent spinoffs, reorganizations, and misunderstood contrarian situations through an intrinsic value approach.
• In particular, higher interest rates contributed to underperformance by sub-advisor’s concentrated investments in complex situations.
• The sub-advisor’s security selection in the Materials and the Consumer Discretionary sectors materially detracted from Fund performance, while security selection in the Information Technology sector contributed positively to performance.
• An overweight allocation to the Communication Services sector and an underweight allocation to the Financials sector detracted from performance.
• The S&P 500 Index TR has replaced the Russell 2500® Index since the last Shareholder Report to comply with a new regulatory requirement.
Cumulative Performance from September 12, 2017 through June 30, 2024
The initial investment, based on a $10,000 investment, is adjusted to reflect the maximum applicable sales charge, if any.
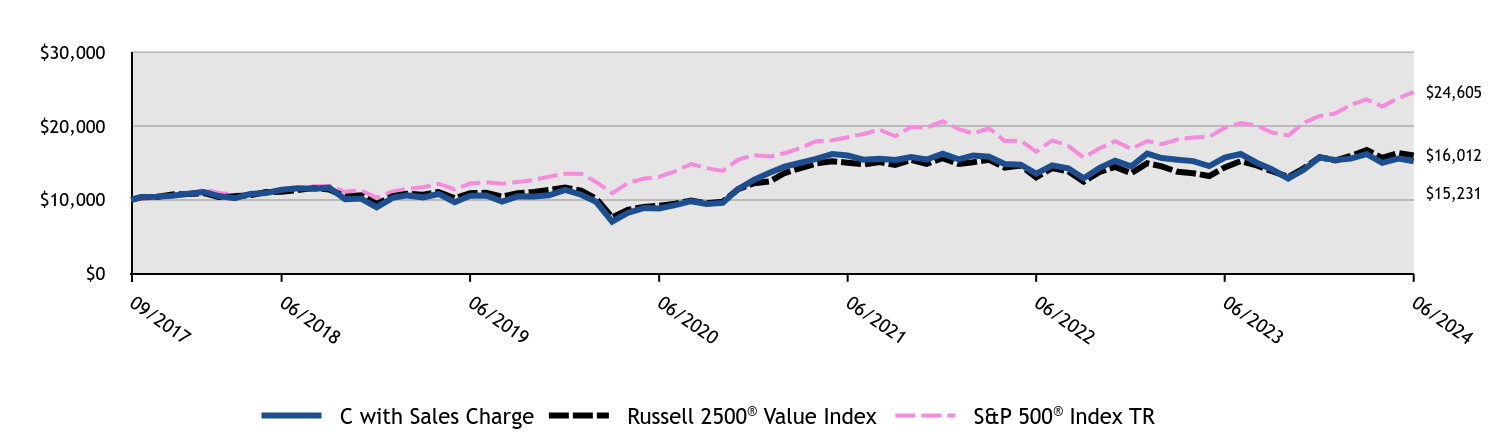
| C with Sales Charge | Russell 2500® Value Index | S&P 500® Index TR |
|---|
| 09/2017 | $10,000 | $10,000 | $10,000 |
| 09/2017 | $10,370 | $10,343 | $10,101 |
| 10/2017 | $10,410 | $10,399 | $10,336 |
| 11/2017 | $10,550 | $10,740 | $10,653 |
| 12/2017 | $10,820 | $10,782 | $10,772 |
| 01/2018 | $11,070 | $10,918 | $11,388 |
| 02/2018 | $10,510 | $10,382 | $10,969 |
| 03/2018 | $10,210 | $10,497 | $10,690 |
| 04/2018 | $10,780 | $10,611 | $10,731 |
| 05/2018 | $10,930 | $11,047 | $10,989 |
| 06/2018 | $11,360 | $11,105 | $11,057 |
| 07/2018 | $11,560 | $11,326 | $11,468 |
| 08/2018 | $11,500 | $11,584 | $11,842 |
| 09/2018 | $11,650 | $11,402 | $11,910 |
| 10/2018 | $10,100 | $10,427 | $11,096 |
| 11/2018 | $10,190 | $10,624 | $11,322 |
| 12/2018 | $9,005 | $9,450 | $10,299 |
| 01/2019 | $10,263 | $10,506 | $11,125 |
| 02/2019 | $10,602 | $10,834 | $11,482 |
| 03/2019 | $10,340 | $10,689 | $11,705 |
| 04/2019 | $10,799 | $11,064 | $12,179 |
| 05/2019 | $9,672 | $10,230 | $11,405 |
| 06/2019 | $10,558 | $10,892 | $12,209 |
| 07/2019 | $10,580 | $10,963 | $12,384 |
| 08/2019 | $9,760 | $10,429 | $12,188 |
| 09/2019 | $10,471 | $10,906 | $12,416 |
| 10/2019 | $10,449 | $11,063 | $12,685 |
| 11/2019 | $10,624 | $11,335 | $13,146 |
| 12/2019 | $11,343 | $11,677 | $13,542 |
| 01/2020 | $10,699 | $11,251 | $13,537 |
| 02/2020 | $9,738 | $10,166 | $12,423 |
| 03/2020 | $7,066 | $7,632 | $10,888 |
| 04/2020 | $8,226 | $8,641 | $12,284 |
| 05/2020 | $8,894 | $9,036 | $12,869 |
| 06/2020 | $8,824 | $9,204 | $13,125 |
| 07/2020 | $9,281 | $9,481 | $13,865 |
| 08/2020 | $9,820 | $9,911 | $14,862 |
| 09/2020 | $9,433 | $9,530 | $14,297 |
| 10/2020 | $9,585 | $9,745 | $13,917 |
| 11/2020 | $11,460 | $11,450 | $15,440 |
| 12/2020 | $12,733 | $12,246 | $16,034 |
| 01/2021 | $13,694 | $12,517 | $15,872 |
| 02/2021 | $14,490 | $13,631 | $16,310 |
| 03/2021 | $15,024 | $14,307 | $17,024 |
| 04/2021 | $15,546 | $14,921 | $17,933 |
| 05/2021 | $16,187 | $15,224 | $18,058 |
| 06/2021 | $15,997 | $15,023 | $18,479 |
| 07/2021 | $15,439 | $14,803 | $18,918 |
| 08/2021 | $15,569 | $15,115 | $19,494 |
| 09/2021 | $15,391 | $14,712 | $18,587 |
| 10/2021 | $15,795 | $15,411 | $19,889 |
| 11/2021 | $15,463 | $14,875 | $19,751 |
| 12/2021 | $16,232 | $15,649 | $20,637 |
| 01/2022 | $15,479 | $14,853 | $19,569 |
| 02/2022 | $16,004 | $15,095 | $18,983 |
| 03/2022 | $15,842 | $15,414 | $19,688 |
| 04/2022 | $14,861 | $14,369 | $17,971 |
| 05/2022 | $14,753 | $14,644 | $18,004 |
| 06/2022 | $13,556 | $13,041 | $16,518 |
| 07/2022 | $14,659 | $14,304 | $18,041 |
| 08/2022 | $14,269 | $13,855 | $17,305 |
| 09/2022 | $12,924 | $12,454 | $15,711 |
| 10/2022 | $14,323 | $13,769 | $16,983 |
| 11/2022 | $15,304 | $14,460 | $17,932 |
| 12/2022 | $14,525 | $13,601 | $16,899 |
| 01/2023 | $16,254 | $14,960 | $17,961 |
| 02/2023 | $15,650 | $14,536 | $17,523 |
| 03/2023 | $15,431 | $13,791 | $18,166 |
| 04/2023 | $15,239 | $13,607 | $18,450 |
| 05/2023 | $14,567 | $13,219 | $18,530 |
| 06/2023 | $15,705 | $14,394 | $19,754 |
| 07/2023 | $16,199 | $15,237 | $20,389 |
| 08/2023 | $15,019 | $14,651 | $20,064 |
| 09/2023 | $14,100 | $13,867 | $19,108 |
| 10/2023 | $12,893 | $13,089 | $18,706 |
| 11/2023 | $14,059 | $14,276 | $20,414 |
| 12/2023 | $15,735 | $15,775 | $21,342 |
| 01/2024 | $15,379 | $15,332 | $21,700 |
| 02/2024 | $15,572 | $15,947 | $22,859 |
| 03/2024 | $16,180 | $16,732 | $23,594 |
| 04/2024 | $15,008 | $15,680 | $22,631 |
| 05/2024 | $15,587 | $16,341 | $23,753 |
| 06/2024 | $15,231 | $16,012 | $24,605 |
Average Annual Total Returns (%)
| 1 Year | 5 Years | Since Inception (9/12/17) |
|---|
Class C without Deferred Sales Charge Footnote Reference1 | (3.02)% | 7.60% | 6.39% |
Class C with Maximum Deferred Sales Charge -1.00%Footnote Reference1 | (4.02)% | 7.60% | 6.39% |
Russell 2500® Value Index | 11.24% | 8.01% | 7.17% |
S&P 500® Index TR | 24.56% | 15.05% | 14.16% |
| Footnote | Description |
Footnote1 | Return may differ from actual shareholder return due to accounting adjustments for financial reporting purposes. |
Performance shown is historical and is not indicative of future returns. Investment returns and principal value will vary, and shares may be worth more or less at redemption than at original purchase. Performance shown is as of date indicated, and current performance may be lower or higher than the performance data quoted. To obtain performance as of the most recent month end, please visit americanbeaconfunds.com or call 800-967-9009. The graph and table do not reflect the deduction of taxes that a shareholder would pay on fund distributions or redemption of fund shares. The Fund's performance benefited from fee waivers. Performance includes historical performance of another Class of the Fund. For more information, visit americanbeaconfunds.com/Performance_Disclaimers.aspx.
| Total Net Assets | $43,352,824 |
| # of Portfolio Holdings | 26 |
| Portfolio Turnover Rate | 43% |
| Total Management Fees Paid | $382,097 |
What did the Fund invest in?
Top Ten Holdings - % Net Assets
| Atlanta Braves Holdings, Inc. | 5.1 |
| Madison Square Garden Sports Corp. | 5.1 |
| Graphic Packaging Holding Co. | 4.9 |
| Ultra Clean Holdings, Inc. | 4.9 |
| Mohawk Industries, Inc. | 4.9 |
| BWX Technologies, Inc. | 4.9 |
| NCR Voyix Corp. | 4.9 |
| Lions Gate Entertainment Corp. | 4.8 |
| Ingredion, Inc. | 4.8 |
| SS&C Technologies Holdings, Inc. | 4.8 |
Asset Allocation - % Investments
| Value | Value |
|---|
| Common Stocks | 98.2 |
| Foreign Common Stocks | 1.8 |
Sector Allocation - % Equities
| Value | Value |
|---|
| Energy | 1.8 |
| Consumer Staples | 9.4 |
| Health Care | 9.7 |
| Information Technology | 13.8 |
| Materials | 15.1 |
| Communication Services | 15.1 |
| Consumer Discretionary | 16.6 |
| Industrials | 18.5 |
For additional information about the Fund, including its prospectus, financial statements, holdings, and proxy voting information, please visit www.americanbeaconfunds.com/literature or call 1-800-658-5811
If your financial institution mailed only one copy of this Report to an address shared by more than one account, you can request an individual copy by contacting your financial institution.
Distributed by Resolute Investment Distributors, Inc.
Shapiro SMID Cap Equity Fund
Annual Shareholder Report - June 30, 2024
Shapiro SMID Cap Equity Fund
Annual Shareholder Report - June 30, 2024
This annual shareholder report contains important information about American Beacon Shapiro SMID Cap Equity Fund for the period of July 1, 2023 to June 30, 2024. You can find additional information about the Fund at www.americanbeaconfunds.com/literature. You can also request this information by contacting us at 800-658-5811.
What were the Fund costs for last year?
(based on a hypothetical $10,000 investment)
| Class Name | Cost of a $10,000 investment | Costs paid as a percentage of a $10,000 investment |
|---|
| Investor | $116 | 1.17% |
How did the Fund perform last year and what affected its performance?
The Investor Class of the Fund returned -2.17% for the twelve months ended June 30, 2024, compared to the S&P 500 Index return of 24.56% and the Russell 2500 Value Index return of 11.24%.
• Over the trailing twelve months the market environment has been challenging for the sub-advisor’s investment style of long-term investing in stocks that were recent spinoffs, reorganizations, and misunderstood contrarian situations through an intrinsic value approach.
• In particular, higher interest rates contributed to underperformance by sub-advisor’s concentrated investments in complex situations.
• The sub-advisor’s security selection in the Materials and the Consumer Discretionary sectors materially detracted from Fund performance, while security selection in the Information Technology sector contributed positively to performance.
• An overweight allocation to the Communication Services sector and an underweight allocation to the Financials sector detracted from performance.
• The S&P 500 Index TR has replaced the Russell 2500® Index since the last Shareholder Report to comply with a new regulatory requirement.
Cumulative Performance from September 12, 2017 through June 30, 2024
The initial investment, based on a $10,000 investment, is adjusted to reflect the maximum applicable sales charge, if any.
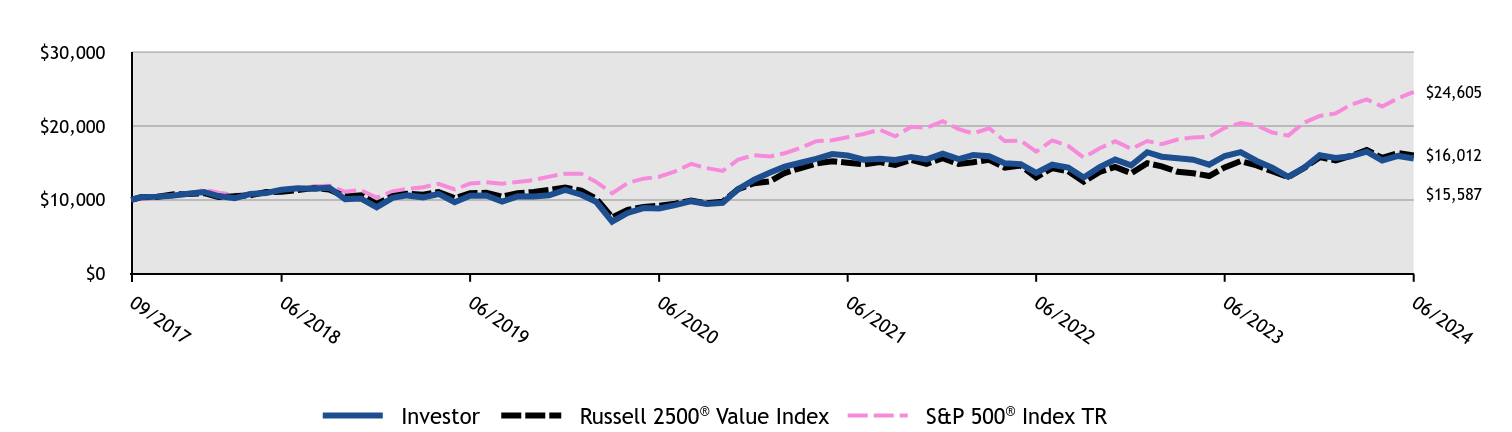
| Investor | Russell 2500® Value Index | S&P 500® Index TR |
|---|
| 09/2017 | $10,000 | $10,000 | $10,000 |
| 09/2017 | $10,370 | $10,343 | $10,101 |
| 10/2017 | $10,410 | $10,399 | $10,336 |
| 11/2017 | $10,550 | $10,740 | $10,653 |
| 12/2017 | $10,820 | $10,782 | $10,772 |
| 01/2018 | $11,070 | $10,918 | $11,388 |
| 02/2018 | $10,510 | $10,382 | $10,969 |
| 03/2018 | $10,210 | $10,497 | $10,690 |
| 04/2018 | $10,780 | $10,611 | $10,731 |
| 05/2018 | $10,930 | $11,047 | $10,989 |
| 06/2018 | $11,360 | $11,105 | $11,057 |
| 07/2018 | $11,560 | $11,326 | $11,468 |
| 08/2018 | $11,500 | $11,584 | $11,842 |
| 09/2018 | $11,650 | $11,402 | $11,910 |
| 10/2018 | $10,100 | $10,427 | $11,096 |
| 11/2018 | $10,190 | $10,624 | $11,322 |
| 12/2018 | $9,005 | $9,450 | $10,299 |
| 01/2019 | $10,263 | $10,506 | $11,125 |
| 02/2019 | $10,602 | $10,834 | $11,482 |
| 03/2019 | $10,340 | $10,689 | $11,705 |
| 04/2019 | $10,799 | $11,064 | $12,179 |
| 05/2019 | $9,672 | $10,230 | $11,405 |
| 06/2019 | $10,558 | $10,892 | $12,209 |
| 07/2019 | $10,580 | $10,963 | $12,384 |
| 08/2019 | $9,760 | $10,429 | $12,188 |
| 09/2019 | $10,471 | $10,906 | $12,416 |
| 10/2019 | $10,449 | $11,063 | $12,685 |
| 11/2019 | $10,624 | $11,335 | $13,146 |
| 12/2019 | $11,343 | $11,677 | $13,542 |
| 01/2020 | $10,699 | $11,251 | $13,537 |
| 02/2020 | $9,738 | $10,166 | $12,423 |
| 03/2020 | $7,066 | $7,632 | $10,888 |
| 04/2020 | $8,226 | $8,641 | $12,284 |
| 05/2020 | $8,894 | $9,036 | $12,869 |
| 06/2020 | $8,824 | $9,204 | $13,125 |
| 07/2020 | $9,281 | $9,481 | $13,865 |
| 08/2020 | $9,820 | $9,911 | $14,862 |
| 09/2020 | $9,433 | $9,530 | $14,297 |
| 10/2020 | $9,585 | $9,745 | $13,917 |
| 11/2020 | $11,460 | $11,450 | $15,440 |
| 12/2020 | $12,733 | $12,246 | $16,034 |
| 01/2021 | $13,694 | $12,517 | $15,872 |
| 02/2021 | $14,490 | $13,631 | $16,310 |
| 03/2021 | $15,024 | $14,307 | $17,024 |
| 04/2021 | $15,546 | $14,921 | $17,933 |
| 05/2021 | $16,187 | $15,224 | $18,058 |
| 06/2021 | $15,997 | $15,023 | $18,479 |
| 07/2021 | $15,439 | $14,803 | $18,918 |
| 08/2021 | $15,569 | $15,115 | $19,494 |
| 09/2021 | $15,391 | $14,712 | $18,587 |
| 10/2021 | $15,807 | $15,411 | $19,889 |
| 11/2021 | $15,474 | $14,875 | $19,751 |
| 12/2021 | $16,259 | $15,649 | $20,637 |
| 01/2022 | $15,519 | $14,853 | $19,569 |
| 02/2022 | $16,057 | $15,095 | $18,983 |
| 03/2022 | $15,909 | $15,414 | $19,688 |
| 04/2022 | $14,941 | $14,369 | $17,971 |
| 05/2022 | $14,834 | $14,644 | $18,004 |
| 06/2022 | $13,650 | $13,041 | $16,518 |
| 07/2022 | $14,753 | $14,304 | $18,041 |
| 08/2022 | $14,376 | $13,855 | $17,305 |
| 09/2022 | $13,031 | $12,454 | $15,711 |
| 10/2022 | $14,444 | $13,769 | $16,983 |
| 11/2022 | $15,452 | $14,460 | $17,932 |
| 12/2022 | $14,682 | $13,601 | $16,899 |
| 01/2023 | $16,440 | $14,960 | $17,961 |
| 02/2023 | $15,836 | $14,536 | $17,523 |
| 03/2023 | $15,616 | $13,791 | $18,166 |
| 04/2023 | $15,438 | $13,607 | $18,450 |
| 05/2023 | $14,765 | $13,219 | $18,530 |
| 06/2023 | $15,932 | $14,394 | $19,754 |
| 07/2023 | $16,454 | $15,237 | $20,389 |
| 08/2023 | $15,259 | $14,651 | $20,064 |
| 09/2023 | $14,339 | $13,867 | $19,108 |
| 10/2023 | $13,117 | $13,089 | $18,706 |
| 11/2023 | $14,312 | $14,276 | $20,414 |
| 12/2023 | $16,033 | $15,775 | $21,342 |
| 01/2024 | $15,676 | $15,332 | $21,700 |
| 02/2024 | $15,884 | $15,947 | $22,859 |
| 03/2024 | $16,522 | $16,732 | $23,594 |
| 04/2024 | $15,335 | $15,680 | $22,631 |
| 05/2024 | $15,943 | $16,341 | $23,753 |
| 06/2024 | $15,587 | $16,012 | $24,605 |
Average Annual Total Returns (%)
| 1 Year | 5 Years | Since Inception (9/12/17) |
|---|
Investor Class Footnote Reference1 | (2.17)% | 8.10% | 6.75% |
Russell 2500® Value Index | 11.24% | 8.01% | 7.17% |
S&P 500® Index TR | 24.56% | 15.05% | 14.16% |
| Footnote | Description |
Footnote1 | Return may differ from actual shareholder return due to accounting adjustments for financial reporting purposes. |
Performance shown is historical and is not indicative of future returns. Investment returns and principal value will vary, and shares may be worth more or less at redemption than at original purchase. Performance shown is as of date indicated, and current performance may be lower or higher than the performance data quoted. To obtain performance as of the most recent month end, please visit americanbeaconfunds.com or call 800-967-9009. The graph and table do not reflect the deduction of taxes that a shareholder would pay on fund distributions or redemption of fund shares. The Fund's performance benefited from fee waivers. For more information, visit americanbeaconfunds.com/Performance_Disclaimers.aspx.
| Total Net Assets | $43,352,824 |
| # of Portfolio Holdings | 26 |
| Portfolio Turnover Rate | 43% |
| Total Management Fees Paid | $382,097 |
What did the Fund invest in?
Top Ten Holdings - % Net Assets
| Atlanta Braves Holdings, Inc. | 5.1 |
| Madison Square Garden Sports Corp. | 5.1 |
| Graphic Packaging Holding Co. | 4.9 |
| Ultra Clean Holdings, Inc. | 4.9 |
| Mohawk Industries, Inc. | 4.9 |
| BWX Technologies, Inc. | 4.9 |
| NCR Voyix Corp. | 4.9 |
| Lions Gate Entertainment Corp. | 4.8 |
| Ingredion, Inc. | 4.8 |
| SS&C Technologies Holdings, Inc. | 4.8 |
Asset Allocation - % Investments
| Value | Value |
|---|
| Common Stocks | 98.2 |
| Foreign Common Stocks | 1.8 |
Sector Allocation - % Equities
| Value | Value |
|---|
| Energy | 1.8 |
| Consumer Staples | 9.4 |
| Health Care | 9.7 |
| Information Technology | 13.8 |
| Materials | 15.1 |
| Communication Services | 15.1 |
| Consumer Discretionary | 16.6 |
| Industrials | 18.5 |
For additional information about the Fund, including its prospectus, financial statements, holdings, and proxy voting information, please visit www.americanbeaconfunds.com/literature or call 1-800-658-5811
If your financial institution mailed only one copy of this Report to an address shared by more than one account, you can request an individual copy by contacting your financial institution.
Distributed by Resolute Investment Distributors, Inc.
Shapiro SMID Cap Equity Fund
Annual Shareholder Report - June 30, 2024
Shapiro SMID Cap Equity Fund
Annual Shareholder Report - June 30, 2024
This annual shareholder report contains important information about American Beacon Shapiro SMID Cap Equity Fund for the period of July 1, 2023 to June 30, 2024. You can find additional information about the Fund at www.americanbeaconfunds.com/literature. You can also request this information by contacting us at 800-658-5811.
What were the Fund costs for last year?
(based on a hypothetical $10,000 investment)
| Class Name | Cost of a $10,000 investment | Costs paid as a percentage of a $10,000 investment |
|---|
| R5 | $88 | 0.89% |
How did the Fund perform last year and what affected its performance?
The R5 Class of the Fund returned -1.94% for the twelve months ended June 30, 2024, compared to the S&P 500 Index return of 24.56% and the Russell 2500 Value Index return of 11.24%.
• Over the trailing twelve months the market environment has been challenging for the sub-advisor’s investment style of long-term investing in stocks that were recent spinoffs, reorganizations, and misunderstood contrarian situations through an intrinsic value approach.
• In particular, higher interest rates contributed to underperformance by sub-advisor’s concentrated investments in complex situations.
• The sub-advisor’s security selection in the Materials and the Consumer Discretionary sectors materially detracted from Fund performance, while security selection in the Information Technology sector contributed positively to performance.
• An overweight allocation to the Communication Services sector and an underweight allocation to the Financials sector detracted from performance.
• The S&P 500 Index TR has replaced the Russell 2500® Index since the last Shareholder Report to comply with a new regulatory requirement.
Cumulative Performance from September 12, 2017 through June 30, 2024
The initial investment, based on a $250,000 investment, is adjusted to reflect the maximum applicable sales charge, if any.
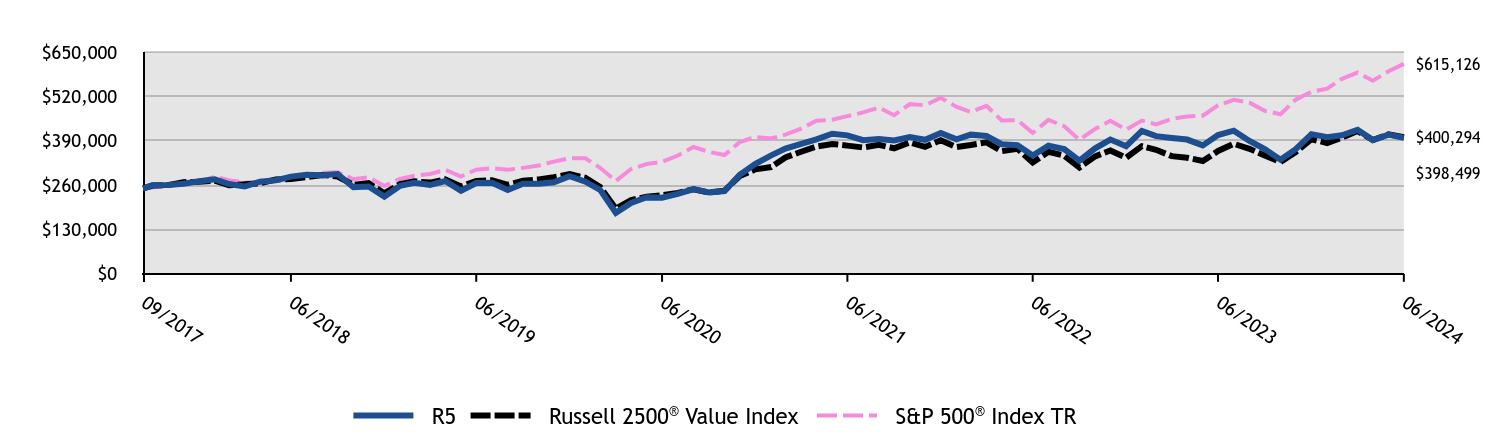
| R5 | Russell 2500® Value Index | S&P 500® Index TR |
|---|
| 09/2017 | $250,000 | $250,000 | $250,000 |
| 09/2017 | $259,250 | $258,569 | $252,514 |
| 10/2017 | $260,250 | $259,979 | $258,406 |
| 11/2017 | $264,000 | $268,492 | $266,331 |
| 12/2017 | $271,000 | $269,561 | $269,293 |
| 01/2018 | $277,000 | $272,958 | $284,711 |
| 02/2018 | $263,000 | $259,560 | $274,217 |
| 03/2018 | $255,750 | $262,413 | $267,248 |
| 04/2018 | $270,000 | $265,264 | $268,274 |
| 05/2018 | $274,000 | $276,172 | $274,734 |
| 06/2018 | $284,750 | $277,637 | $276,425 |
| 07/2018 | $290,000 | $283,150 | $286,712 |
| 08/2018 | $288,500 | $289,590 | $296,055 |
| 09/2018 | $292,500 | $285,058 | $297,740 |
| 10/2018 | $253,750 | $260,687 | $277,389 |
| 11/2018 | $256,000 | $265,609 | $283,042 |
| 12/2018 | $226,114 | $236,249 | $257,486 |
| 01/2019 | $257,830 | $262,650 | $278,120 |
| 02/2019 | $266,579 | $270,852 | $287,050 |
| 03/2019 | $260,017 | $267,237 | $292,628 |
| 04/2019 | $271,774 | $276,610 | $304,476 |
| 05/2019 | $243,339 | $255,750 | $285,127 |
| 06/2019 | $265,759 | $272,295 | $305,222 |
| 07/2019 | $266,579 | $274,066 | $309,608 |
| 08/2019 | $245,800 | $260,721 | $304,704 |
| 09/2019 | $263,845 | $272,650 | $310,405 |
| 10/2019 | $263,572 | $276,578 | $317,129 |
| 11/2019 | $267,946 | $283,364 | $328,640 |
| 12/2019 | $285,916 | $291,921 | $338,559 |
| 01/2020 | $269,820 | $281,287 | $338,426 |
| 02/2020 | $245,823 | $254,161 | $310,567 |
| 03/2020 | $178,514 | $190,796 | $272,208 |
| 04/2020 | $207,779 | $216,024 | $307,104 |
| 05/2020 | $224,460 | $225,889 | $321,730 |
| 06/2020 | $222,997 | $230,093 | $328,129 |
| 07/2020 | $234,410 | $237,014 | $346,630 |
| 08/2020 | $248,457 | $247,780 | $371,546 |
| 09/2020 | $238,507 | $238,243 | $357,429 |
| 10/2020 | $242,604 | $243,623 | $347,923 |
| 11/2020 | $290,013 | $286,251 | $386,008 |
| 12/2020 | $322,092 | $306,159 | $400,850 |
| 01/2021 | $346,983 | $312,921 | $396,803 |
| 02/2021 | $367,132 | $340,769 | $407,745 |
| 03/2021 | $380,763 | $357,683 | $425,602 |
| 04/2021 | $394,097 | $373,035 | $448,316 |
| 05/2021 | $410,394 | $380,611 | $451,447 |
| 06/2021 | $405,653 | $375,582 | $461,986 |
| 07/2021 | $391,430 | $370,084 | $472,961 |
| 08/2021 | $394,986 | $377,887 | $487,341 |
| 09/2021 | $390,541 | $367,812 | $464,675 |
| 10/2021 | $400,912 | $385,278 | $497,231 |
| 11/2021 | $392,615 | $371,867 | $493,786 |
| 12/2021 | $412,814 | $391,213 | $515,915 |
| 01/2022 | $394,050 | $371,329 | $489,218 |
| 02/2022 | $407,788 | $377,384 | $474,570 |
| 03/2022 | $404,102 | $385,341 | $492,191 |
| 04/2022 | $379,641 | $359,223 | $449,271 |
| 05/2022 | $376,961 | $366,100 | $450,095 |
| 06/2022 | $346,804 | $326,030 | $412,943 |
| 07/2022 | $375,285 | $357,591 | $451,018 |
| 08/2022 | $365,568 | $346,375 | $432,624 |
| 09/2022 | $331,390 | $311,347 | $392,780 |
| 10/2022 | $367,579 | $344,220 | $424,580 |
| 11/2022 | $393,379 | $361,511 | $448,308 |
| 12/2022 | $373,871 | $340,024 | $422,479 |
| 01/2023 | $418,681 | $373,998 | $449,025 |
| 02/2023 | $403,288 | $363,410 | $438,069 |
| 03/2023 | $397,815 | $344,767 | $454,152 |
| 04/2023 | $393,369 | $340,173 | $461,241 |
| 05/2023 | $376,266 | $330,465 | $463,246 |
| 06/2023 | $406,367 | $359,841 | $493,855 |
| 07/2023 | $419,365 | $380,935 | $509,720 |
| 08/2023 | $389,264 | $366,269 | $501,604 |
| 09/2023 | $365,662 | $346,667 | $477,689 |
| 10/2023 | $334,534 | $327,216 | $467,645 |
| 11/2023 | $365,320 | $356,911 | $510,353 |
| 12/2023 | $409,200 | $394,364 | $533,538 |
| 01/2024 | $400,344 | $383,298 | $542,504 |
| 02/2024 | $405,879 | $398,663 | $571,471 |
| 03/2024 | $422,114 | $418,303 | $589,858 |
| 04/2024 | $391,857 | $392,002 | $565,766 |
| 05/2024 | $407,724 | $408,524 | $593,819 |
| 06/2024 | $398,499 | $400,294 | $615,126 |
Average Annual Total Returns (%)
| 1 Year | 5 Years | Since Inception (9/12/17) |
|---|
Class R5 Footnote Reference1 | (1.94)% | 8.44% | 7.10% |
Russell 2500® Value Index | 11.24% | 8.01% | 7.17% |
S&P 500® Index TR | 24.56% | 15.05% | 14.16% |
| Footnote | Description |
Footnote1 | Return may differ from actual shareholder return due to accounting adjustments for financial reporting purposes. |
Performance shown is historical and is not indicative of future returns. Investment returns and principal value will vary, and shares may be worth more or less at redemption than at original purchase. Performance shown is as of date indicated, and current performance may be lower or higher than the performance data quoted. To obtain performance as of the most recent month end, please visit americanbeaconfunds.com or call 800-967-9009. The graph and table do not reflect the deduction of taxes that a shareholder would pay on fund distributions or redemption of fund shares. The Fund's performance benefited from fee waivers. For more information, visit americanbeaconfunds.com/Performance_Disclaimers.aspx.
| Total Net Assets | $43,352,824 |
| # of Portfolio Holdings | 26 |
| Portfolio Turnover Rate | 43% |
| Total Management Fees Paid | $382,097 |
What did the Fund invest in?
Top Ten Holdings - % Net Assets
| Atlanta Braves Holdings, Inc. | 5.1 |
| Madison Square Garden Sports Corp. | 5.1 |
| Graphic Packaging Holding Co. | 4.9 |
| Ultra Clean Holdings, Inc. | 4.9 |
| Mohawk Industries, Inc. | 4.9 |
| BWX Technologies, Inc. | 4.9 |
| NCR Voyix Corp. | 4.9 |
| Lions Gate Entertainment Corp. | 4.8 |
| Ingredion, Inc. | 4.8 |
| SS&C Technologies Holdings, Inc. | 4.8 |
Asset Allocation - % Investments
| Value | Value |
|---|
| Common Stocks | 98.2 |
| Foreign Common Stocks | 1.8 |
Sector Allocation - % Equities
| Value | Value |
|---|
| Energy | 1.8 |
| Consumer Staples | 9.4 |
| Health Care | 9.7 |
| Information Technology | 13.8 |
| Materials | 15.1 |
| Communication Services | 15.1 |
| Consumer Discretionary | 16.6 |
| Industrials | 18.5 |
For additional information about the Fund, including its prospectus, financial statements, holdings, and proxy voting information, please visit www.americanbeaconfunds.com/literature or call 1-800-658-5811
If your financial institution mailed only one copy of this Report to an address shared by more than one account, you can request an individual copy by contacting your financial institution.
Distributed by Resolute Investment Distributors, Inc.
Shapiro SMID Cap Equity Fund
Annual Shareholder Report - June 30, 2024
Shapiro SMID Cap Equity Fund
Annual Shareholder Report - June 30, 2024
This annual shareholder report contains important information about American Beacon Shapiro SMID Cap Equity Fund for the period of July 1, 2023 to June 30, 2024. You can find additional information about the Fund at www.americanbeaconfunds.com/literature. You can also request this information by contacting us at 800-658-5811. This report describes changes to the Fund that occurred during the reporting period.
What were the Fund costs for last year?
(based on a hypothetical $10,000 investment)
| Class Name | Cost of a $10,000 investment | Costs paid as a percentage of a $10,000 investment |
|---|
| R6 | $88 | 0.89% |
How did the Fund perform last year and what affected its performance?
The R6 Class of the Fund returned -1.85% for the twelve months ended June 30, 2024, compared to the S&P 500 Index return of 24.56% and the Russell 2500 Value Index return of 11.24%.
• Over the trailing twelve months the market environment has been challenging for the sub-advisor’s investment style of long-term investing in stocks that were recent spinoffs, reorganizations, and misunderstood contrarian situations through an intrinsic value approach.
• In particular, higher interest rates contributed to underperformance by sub-advisor’s concentrated investments in complex situations.
• The sub-advisor’s security selection in the Materials and the Consumer Discretionary sectors materially detracted from Fund performance, while security selection in the Information Technology sector contributed positively to performance.
• An overweight allocation to the Communication Services sector and an underweight allocation to the Financials sector detracted from performance.
• The S&P 500 Index TR has replaced the Russell 2500® Index since the last Shareholder Report to comply with a new regulatory requirement.
Cumulative Performance from September 12, 2017 through June 30, 2024
The initial investment, based on a $10,000 investment, is adjusted to reflect the maximum applicable sales charge, if any.
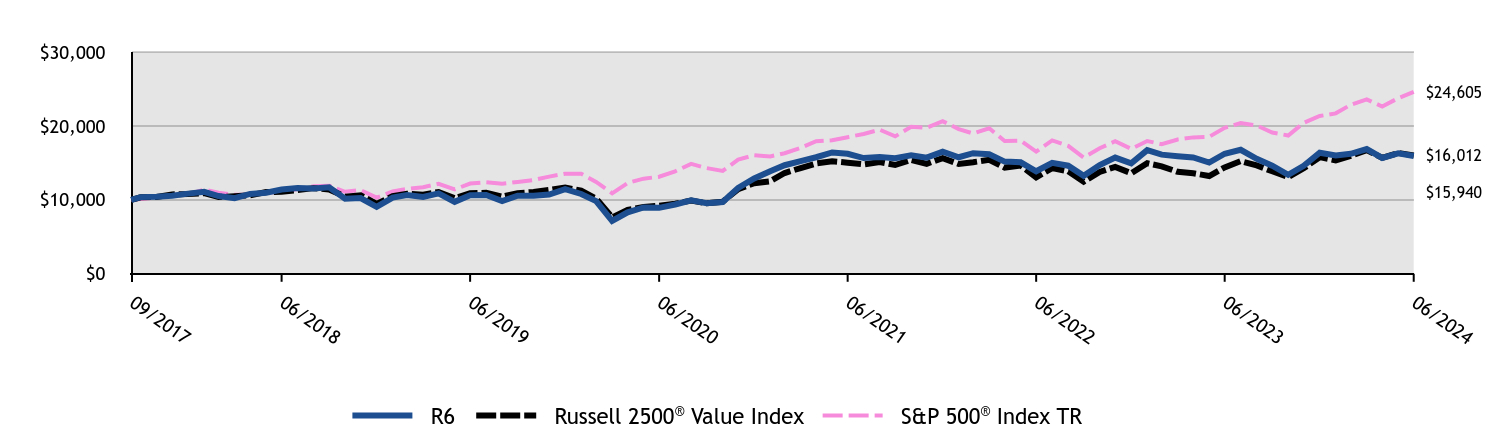
| R6 | Russell 2500® Value Index | S&P 500® Index TR |
|---|
| 09/2017 | $10,000 | $10,000 | $10,000 |
| 09/2017 | $10,370 | $10,343 | $10,101 |
| 10/2017 | $10,410 | $10,399 | $10,336 |
| 11/2017 | $10,560 | $10,740 | $10,653 |
| 12/2017 | $10,840 | $10,782 | $10,772 |
| 01/2018 | $11,080 | $10,918 | $11,388 |
| 02/2018 | $10,520 | $10,382 | $10,969 |
| 03/2018 | $10,230 | $10,497 | $10,690 |
| 04/2018 | $10,800 | $10,611 | $10,731 |
| 05/2018 | $10,960 | $11,047 | $10,989 |
| 06/2018 | $11,390 | $11,105 | $11,057 |
| 07/2018 | $11,600 | $11,326 | $11,468 |
| 08/2018 | $11,540 | $11,584 | $11,842 |
| 09/2018 | $11,700 | $11,402 | $11,910 |
| 10/2018 | $10,150 | $10,427 | $11,096 |
| 11/2018 | $10,240 | $10,624 | $11,322 |
| 12/2018 | $9,045 | $9,450 | $10,299 |
| 01/2019 | $10,313 | $10,506 | $11,125 |
| 02/2019 | $10,663 | $10,834 | $11,482 |
| 03/2019 | $10,401 | $10,689 | $11,705 |
| 04/2019 | $10,871 | $11,064 | $12,179 |
| 05/2019 | $9,734 | $10,230 | $11,405 |
| 06/2019 | $10,630 | $10,892 | $12,209 |
| 07/2019 | $10,663 | $10,963 | $12,384 |
| 08/2019 | $9,832 | $10,429 | $12,188 |
| 09/2019 | $10,554 | $10,906 | $12,416 |
| 10/2019 | $10,543 | $11,063 | $12,685 |
| 11/2019 | $10,718 | $11,335 | $13,146 |
| 12/2019 | $11,437 | $11,677 | $13,542 |
| 01/2020 | $10,793 | $11,251 | $13,537 |
| 02/2020 | $9,833 | $10,166 | $12,423 |
| 03/2020 | $7,141 | $7,632 | $10,888 |
| 04/2020 | $8,311 | $8,641 | $12,284 |
| 05/2020 | $8,978 | $9,036 | $12,869 |
| 06/2020 | $8,920 | $9,204 | $13,125 |
| 07/2020 | $9,376 | $9,481 | $13,865 |
| 08/2020 | $9,938 | $9,911 | $14,862 |
| 09/2020 | $9,540 | $9,530 | $14,297 |
| 10/2020 | $9,704 | $9,745 | $13,917 |
| 11/2020 | $11,601 | $11,450 | $15,440 |
| 12/2020 | $12,884 | $12,246 | $16,034 |
| 01/2021 | $13,879 | $12,517 | $15,872 |
| 02/2021 | $14,685 | $13,631 | $16,310 |
| 03/2021 | $15,231 | $14,307 | $17,024 |
| 04/2021 | $15,764 | $14,921 | $17,933 |
| 05/2021 | $16,416 | $15,224 | $18,058 |
| 06/2021 | $16,226 | $15,023 | $18,479 |
| 07/2021 | $15,657 | $14,803 | $18,918 |
| 08/2021 | $15,799 | $15,115 | $19,494 |
| 09/2021 | $15,622 | $14,712 | $18,587 |
| 10/2021 | $16,036 | $15,411 | $19,889 |
| 11/2021 | $15,705 | $14,875 | $19,751 |
| 12/2021 | $16,513 | $15,649 | $20,637 |
| 01/2022 | $15,762 | $14,853 | $19,569 |
| 02/2022 | $16,312 | $15,095 | $18,983 |
| 03/2022 | $16,164 | $15,414 | $19,688 |
| 04/2022 | $15,172 | $14,369 | $17,971 |
| 05/2022 | $15,078 | $14,644 | $18,004 |
| 06/2022 | $13,872 | $13,041 | $16,518 |
| 07/2022 | $14,998 | $14,304 | $18,041 |
| 08/2022 | $14,623 | $13,855 | $17,305 |
| 09/2022 | $13,256 | $12,454 | $15,711 |
| 10/2022 | $14,703 | $13,769 | $16,983 |
| 11/2022 | $15,722 | $14,460 | $17,932 |
| 12/2022 | $14,941 | $13,601 | $16,899 |
| 01/2023 | $16,734 | $14,960 | $17,961 |
| 02/2023 | $16,118 | $14,536 | $17,523 |
| 03/2023 | $15,913 | $13,791 | $18,166 |
| 04/2023 | $15,735 | $13,607 | $18,450 |
| 05/2023 | $15,051 | $13,219 | $18,530 |
| 06/2023 | $16,241 | $14,394 | $19,754 |
| 07/2023 | $16,775 | $15,237 | $20,389 |
| 08/2023 | $15,557 | $14,651 | $20,064 |
| 09/2023 | $14,626 | $13,867 | $19,108 |
| 10/2023 | $13,381 | $13,089 | $18,706 |
| 11/2023 | $14,599 | $14,276 | $20,414 |
| 12/2023 | $16,368 | $15,775 | $21,342 |
| 01/2024 | $15,999 | $15,332 | $21,700 |
| 02/2024 | $16,235 | $15,947 | $22,859 |
| 03/2024 | $16,870 | $16,732 | $23,594 |
| 04/2024 | $15,674 | $15,680 | $22,631 |
| 05/2024 | $16,294 | $16,341 | $23,753 |
| 06/2024 | $15,940 | $16,012 | $24,605 |
Average Annual Total Returns (%)
| 1 Year | 5 Years | Since Inception (9/12/17) |
|---|
R6 Class Footnote Reference1 | (1.85)% | 8.44% | 7.10% |
Russell 2500® Value Index | 11.24% | 8.01% | 7.17% |
S&P 500® Index TR | 24.56% | 15.05% | 14.16% |
| Footnote | Description |
Footnote1 | Return may differ from actual shareholder return due to accounting adjustments for financial reporting purposes. |
Performance shown is historical and is not indicative of future returns. Investment returns and principal value will vary, and shares may be worth more or less at redemption than at original purchase. Performance shown is as of date indicated, and current performance may be lower or higher than the performance data quoted. To obtain performance as of the most recent month end, please visit americanbeaconfunds.com or call 800-967-9009. The graph and table do not reflect the deduction of taxes that a shareholder would pay on fund distributions or redemption of fund shares. The Fund's performance benefited from fee waivers. Performance includes historical performance of another Class of the Fund. For more information, visit americanbeaconfunds.com/Performance_Disclaimers.aspx.
| Total Net Assets | $43,352,824 |
| # of Portfolio Holdings | 26 |
| Portfolio Turnover Rate | 43% |
| Total Management Fees Paid | $382,097 |
What did the Fund invest in?
Top Ten Holdings - % Net Assets
| Atlanta Braves Holdings, Inc. | 5.1 |
| Madison Square Garden Sports Corp. | 5.1 |
| Graphic Packaging Holding Co. | 4.9 |
| Ultra Clean Holdings, Inc. | 4.9 |
| Mohawk Industries, Inc. | 4.9 |
| BWX Technologies, Inc. | 4.9 |
| NCR Voyix Corp. | 4.9 |
| Lions Gate Entertainment Corp. | 4.8 |
| Ingredion, Inc. | 4.8 |
| SS&C Technologies Holdings, Inc. | 4.8 |
Asset Allocation - % Investments
| Value | Value |
|---|
| Common Stocks | 98.2 |
| Foreign Common Stocks | 1.8 |
Sector Allocation - % Equities
| Value | Value |
|---|
| Energy | 1.8 |
| Consumer Staples | 9.4 |
| Health Care | 9.7 |
| Information Technology | 13.8 |
| Materials | 15.1 |
| Communication Services | 15.1 |
| Consumer Discretionary | 16.6 |
| Industrials | 18.5 |
This is a summary of certain changes to the Fund since June 30, 2023. For more complete information, you may review the Fund's next prospectus, which we expect to be available by November 1, 2024 at www.americanbeaconfunds.com/literature or upon request at 800-658-5811.
Effective November 1, 2023, the contractual expense limitation for the R6 Class was reduced from 0.90% to 0.89% (excluding taxes, interest, brokerage commissions, acquired fund fees and expenses, securities lending fees, expenses associated with securities sold short, litigation and other extraordinary expenses).
For additional information about the Fund, including its prospectus, financial statements, holdings, and proxy voting information, please visit www.americanbeaconfunds.com/literature or call 1-800-658-5811
If your financial institution mailed only one copy of this Report to an address shared by more than one account, you can request an individual copy by contacting your financial institution.
Distributed by Resolute Investment Distributors, Inc.
Shapiro SMID Cap Equity Fund
Annual Shareholder Report - June 30, 2024
Shapiro SMID Cap Equity Fund
Annual Shareholder Report - June 30, 2024
This annual shareholder report contains important information about American Beacon Shapiro SMID Cap Equity Fund for the period of July 1, 2023 to June 30, 2024. You can find additional information about the Fund at www.americanbeaconfunds.com/literature. You can also request this information by contacting us at 800-658-5811.
What were the Fund costs for last year?
(based on a hypothetical $10,000 investment)
| Class Name | Cost of a $10,000 investment | Costs paid as a percentage of a $10,000 investment |
|---|
| Y | $95 | 0.96% |
How did the Fund perform last year and what affected its performance?
The Y Class of the Fund returned -1.95% for the twelve months ended June 30, 2024, compared to the S&P 500 Index return of 24.56% and the Russell 2500 Value Index return of 11.24%.
• Over the trailing twelve months the market environment has been challenging for the sub-advisor’s investment style of long-term investing in stocks that were recent spinoffs, reorganizations, and misunderstood contrarian situations through an intrinsic value approach.
• In particular, higher interest rates contributed to underperformance by sub-advisor’s concentrated investments in complex situations.
• The sub-advisor’s security selection in the Materials and the Consumer Discretionary sectors materially detracted from Fund performance, while security selection in the Information Technology sector contributed positively to performance.
• An overweight allocation to the Communication Services sector and an underweight allocation to the Financials sector detracted from performance.
• The S&P 500 Index TR has replaced the Russell 2500® Index since the last Shareholder Report to comply with a new regulatory requirement.
Cumulative Performance from September 12, 2017 through June 30, 2024
The initial investment, based on a $100,000 investment, is adjusted to reflect the maximum applicable sales charge, if any.
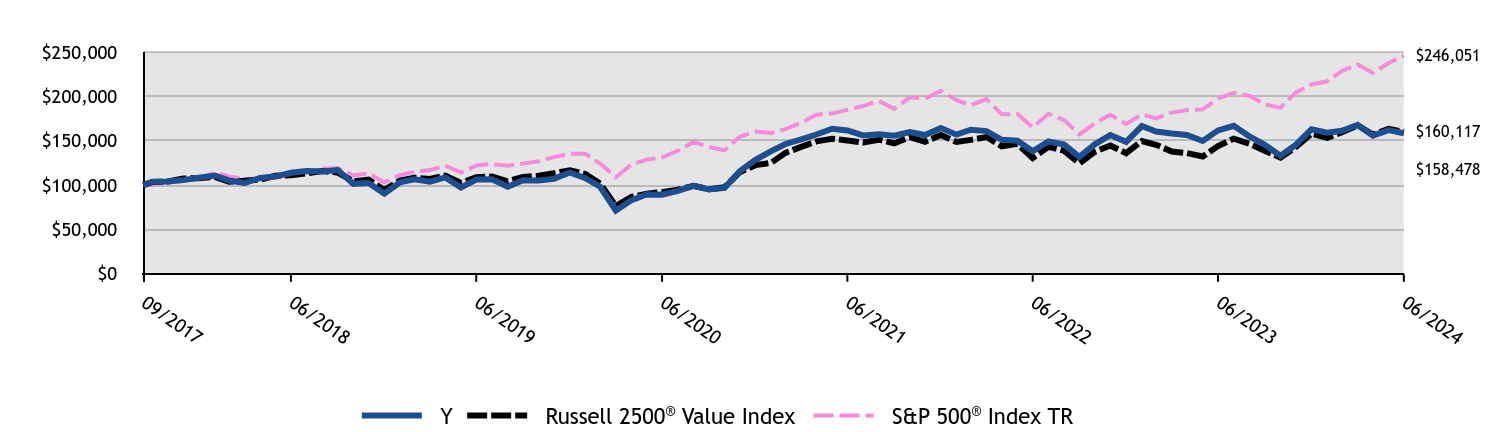
| Y | Russell 2500® Value Index | S&P 500® Index TR |
|---|
| 09/2017 | $100,000 | $100,000 | $100,000 |
| 09/2017 | $103,700 | $103,428 | $101,006 |
| 10/2017 | $104,100 | $103,992 | $103,362 |
| 11/2017 | $105,600 | $107,397 | $106,533 |
| 12/2017 | $108,300 | $107,824 | $107,717 |
| 01/2018 | $110,800 | $109,183 | $113,884 |
| 02/2018 | $105,200 | $103,824 | $109,687 |
| 03/2018 | $102,300 | $104,965 | $106,899 |
| 04/2018 | $108,000 | $106,106 | $107,310 |
| 05/2018 | $109,600 | $110,469 | $109,894 |
| 06/2018 | $113,900 | $111,055 | $110,570 |
| 07/2018 | $115,900 | $113,260 | $114,685 |
| 08/2018 | $115,300 | $115,836 | $118,422 |
| 09/2018 | $116,900 | $114,023 | $119,096 |
| 10/2018 | $101,400 | $104,275 | $110,956 |
| 11/2018 | $102,300 | $106,244 | $113,217 |
| 12/2018 | $90,346 | $94,500 | $102,994 |
| 01/2019 | $103,034 | $105,060 | $111,248 |
| 02/2019 | $106,534 | $108,341 | $114,820 |
| 03/2019 | $103,909 | $106,895 | $117,051 |
| 04/2019 | $108,612 | $110,644 | $121,790 |
| 05/2019 | $97,237 | $102,300 | $114,051 |
| 06/2019 | $106,206 | $108,918 | $122,089 |
| 07/2019 | $106,424 | $109,626 | $123,843 |
| 08/2019 | $98,221 | $104,288 | $121,882 |
| 09/2019 | $105,440 | $109,060 | $124,162 |
| 10/2019 | $105,221 | $110,631 | $126,851 |
| 11/2019 | $106,971 | $113,346 | $131,456 |
| 12/2019 | $114,160 | $116,768 | $135,424 |
| 01/2020 | $107,720 | $112,515 | $135,371 |
| 02/2020 | $98,119 | $101,664 | $124,227 |
| 03/2020 | $71,189 | $76,318 | $108,883 |
| 04/2020 | $82,781 | $86,410 | $122,841 |
| 05/2020 | $89,572 | $90,356 | $128,692 |
| 06/2020 | $88,986 | $92,037 | $131,251 |
| 07/2020 | $93,553 | $94,806 | $138,652 |
| 08/2020 | $99,056 | $99,112 | $148,619 |
| 09/2020 | $95,075 | $95,297 | $142,972 |
| 10/2020 | $96,714 | $97,449 | $139,169 |
| 11/2020 | $115,565 | $114,500 | $154,403 |
| 12/2020 | $128,400 | $122,464 | $160,340 |
| 01/2021 | $138,241 | $125,168 | $158,721 |
| 02/2021 | $146,303 | $136,308 | $163,098 |
| 03/2021 | $151,638 | $143,073 | $170,241 |
| 04/2021 | $156,973 | $149,214 | $179,326 |
| 05/2021 | $163,494 | $152,245 | $180,579 |
| 06/2021 | $161,597 | $150,233 | $184,794 |
| 07/2021 | $155,906 | $148,033 | $189,184 |
| 08/2021 | $157,329 | $151,155 | $194,937 |
| 09/2021 | $155,550 | $147,125 | $185,870 |
| 10/2021 | $159,700 | $154,111 | $198,892 |
| 11/2021 | $156,380 | $148,747 | $197,514 |
| 12/2021 | $164,347 | $156,485 | $206,366 |
| 01/2022 | $156,834 | $148,532 | $195,687 |
| 02/2022 | $162,334 | $150,954 | $189,828 |
| 03/2022 | $160,858 | $154,136 | $196,876 |
| 04/2022 | $151,065 | $143,689 | $179,708 |
| 05/2022 | $149,991 | $146,440 | $180,038 |
| 06/2022 | $138,051 | $130,412 | $165,177 |
| 07/2022 | $149,321 | $143,037 | $180,407 |
| 08/2022 | $145,564 | $138,550 | $173,050 |
| 09/2022 | $131,880 | $124,539 | $157,112 |
| 10/2022 | $146,235 | $137,688 | $169,832 |
| 11/2022 | $156,431 | $144,604 | $179,323 |
| 12/2022 | $148,755 | $136,009 | $168,991 |
| 01/2023 | $166,561 | $149,599 | $179,610 |
| 02/2023 | $160,398 | $145,364 | $175,228 |
| 03/2023 | $158,206 | $137,907 | $181,661 |
| 04/2023 | $156,562 | $136,069 | $184,496 |
| 05/2023 | $149,714 | $132,186 | $185,298 |
| 06/2023 | $161,630 | $143,936 | $197,542 |
| 07/2023 | $166,835 | $152,374 | $203,888 |
| 08/2023 | $154,782 | $146,508 | $200,642 |
| 09/2023 | $145,467 | $138,667 | $191,076 |
| 10/2023 | $133,003 | $130,886 | $187,058 |
| 11/2023 | $145,193 | $142,764 | $204,141 |
| 12/2023 | $162,765 | $157,745 | $213,415 |
| 01/2024 | $159,069 | $153,319 | $217,002 |
| 02/2024 | $161,287 | $159,465 | $228,589 |
| 03/2024 | $167,792 | $167,321 | $235,943 |
| 04/2024 | $155,817 | $156,801 | $226,306 |
| 05/2024 | $162,026 | $163,409 | $237,528 |
| 06/2024 | $158,478 | $160,117 | $246,051 |
Average Annual Total Returns (%)
| 1 Year | 5 Years | Since Inception (9/12/17) |
|---|
Class Y Footnote Reference1 | (1.95)% | 8.33% | 7.01% |
Russell 2500® Value Index | 11.24% | 8.01% | 7.17% |
S&P 500® Index TR | 24.56% | 15.05% | 14.16% |
| Footnote | Description |
Footnote1 | Return may differ from actual shareholder return due to accounting adjustments for financial reporting purposes. |
Performance shown is historical and is not indicative of future returns. Investment returns and principal value will vary, and shares may be worth more or less at redemption than at original purchase. Performance shown is as of date indicated, and current performance may be lower or higher than the performance data quoted. To obtain performance as of the most recent month end, please visit americanbeaconfunds.com or call 800-967-9009. The graph and table do not reflect the deduction of taxes that a shareholder would pay on fund distributions or redemption of fund shares. The Fund's performance benefited from fee waivers. For more information, visit americanbeaconfunds.com/Performance_Disclaimers.aspx.
| Total Net Assets | $43,352,824 |
| # of Portfolio Holdings | 26 |
| Portfolio Turnover Rate | 43% |
| Total Management Fees Paid | $382,097 |
What did the Fund invest in?
Top Ten Holdings - % Net Assets
| Atlanta Braves Holdings, Inc. | 5.1 |
| Madison Square Garden Sports Corp. | 5.1 |
| Graphic Packaging Holding Co. | 4.9 |
| Ultra Clean Holdings, Inc. | 4.9 |
| Mohawk Industries, Inc. | 4.9 |
| BWX Technologies, Inc. | 4.9 |
| NCR Voyix Corp. | 4.9 |
| Lions Gate Entertainment Corp. | 4.8 |
| Ingredion, Inc. | 4.8 |
| SS&C Technologies Holdings, Inc. | 4.8 |
Asset Allocation - % Investments
| Value | Value |
|---|
| Common Stocks | 98.2 |
| Foreign Common Stocks | 1.8 |
Sector Allocation - % Equities
| Value | Value |
|---|
| Energy | 1.8 |
| Consumer Staples | 9.4 |
| Health Care | 9.7 |
| Information Technology | 13.8 |
| Materials | 15.1 |
| Communication Services | 15.1 |
| Consumer Discretionary | 16.6 |
| Industrials | 18.5 |
For additional information about the Fund, including its prospectus, financial statements, holdings, and proxy voting information, please visit www.americanbeaconfunds.com/literature or call 1-800-658-5811
If your financial institution mailed only one copy of this Report to an address shared by more than one account, you can request an individual copy by contacting your financial institution.
Distributed by Resolute Investment Distributors, Inc.
Shapiro SMID Cap Equity Fund
Annual Shareholder Report - June 30, 2024
SSI Alternative Income Fund
Annual Shareholder Report - June 30, 2024
This annual shareholder report contains important information about American Beacon SSI Alternative Income Fund for the period of July 1, 2023 to June 30, 2024. You can find additional information about the Fund at www.americanbeaconfunds.com/literature. You can also request this information by contacting us at 800-658-5811.
What were the Fund costs for last year?
(based on a hypothetical $10,000 investment)
| Class Name | Cost of a $10,000 investment | Costs paid as a percentage of a $10,000 investment |
|---|
| Investor | $157 | 1.51% |
How did the Fund perform last year and what affected its performance?
The Investor Class of the Fund returned 7.50% for the twelve months ended June 30, 2024, compared to the Bloomberg U.S. Aggregate Bond Index return of 2.63% and the ICE BofA U.S. 3-Month Treasury Bill Index return of 5.40%.
• The Fund demonstrated attractive performance during the period as its hedged convertible bond strategy capitalized on interest rates that remained elevated, due to the Federal Reserve Bank’s continued narrative of ‘higher-for-longer’ rates, and income was a significant source of total return for the Fund.
• The Fund’s short duration and generally low volatility also benefited performance.
• The Fund’s holdings were diversified across sectors and industries with no individual position having a material impact on performance.
• Financials, Health Care, and Information Technology were the Fund’s largest sector exposures.
Cumulative Performance from June 30, 2014 through June 30, 2024
The initial investment, based on a $10,000 investment, is adjusted to reflect the maximum applicable sales charge, if any.

| Investor | ICE BofA US 3-Month Treasury Bill Index | Bloomberg US Aggregate Bond Index |
|---|
| 06/2014 | $10,000 | $10,000 | $10,000 |
| 07/2014 | $10,020 | $10,000 | $9,975 |
| 08/2014 | $10,000 | $10,001 | $10,085 |
| 09/2014 | $9,922 | $10,001 | $10,017 |
| 10/2014 | $9,824 | $10,001 | $10,115 |
| 11/2014 | $9,805 | $10,001 | $10,187 |
| 12/2014 | $9,737 | $10,001 | $10,196 |
| 01/2015 | $9,737 | $10,002 | $10,410 |
| 02/2015 | $9,777 | $10,002 | $10,312 |
| 03/2015 | $9,796 | $10,002 | $10,360 |
| 04/2015 | $9,865 | $10,002 | $10,323 |
| 05/2015 | $9,865 | $10,002 | $10,298 |
| 06/2015 | $9,807 | $10,002 | $10,186 |
| 07/2015 | $9,727 | $10,002 | $10,257 |
| 08/2015 | $9,637 | $10,003 | $10,242 |
| 09/2015 | $9,597 | $10,003 | $10,311 |
| 10/2015 | $9,647 | $10,003 | $10,313 |
| 11/2015 | $9,597 | $10,003 | $10,286 |
| 12/2015 | $9,482 | $10,007 | $10,252 |
| 01/2016 | $9,310 | $10,007 | $10,393 |
| 02/2016 | $9,280 | $10,009 | $10,467 |
| 03/2016 | $9,452 | $10,014 | $10,563 |
| 04/2016 | $9,624 | $10,017 | $10,604 |
| 05/2016 | $9,706 | $10,018 | $10,607 |
| 06/2016 | $9,750 | $10,021 | $10,797 |
| 07/2016 | $9,883 | $10,024 | $10,865 |
| 08/2016 | $9,984 | $10,026 | $10,853 |
| 09/2016 | $9,984 | $10,031 | $10,847 |
| 10/2016 | $10,015 | $10,033 | $10,764 |
| 11/2016 | $9,984 | $10,035 | $10,509 |
| 12/2016 | $10,001 | $10,039 | $10,524 |
| 01/2017 | $10,094 | $10,044 | $10,544 |
| 02/2017 | $10,124 | $10,048 | $10,615 |
| 03/2017 | $10,145 | $10,050 | $10,610 |
| 04/2017 | $10,186 | $10,057 | $10,692 |
| 05/2017 | $10,206 | $10,062 | $10,774 |
| 06/2017 | $10,252 | $10,070 | $10,763 |
| 07/2017 | $10,293 | $10,079 | $10,809 |
| 08/2017 | $10,324 | $10,088 | $10,906 |
| 09/2017 | $10,365 | $10,097 | $10,854 |
| 10/2017 | $10,375 | $10,106 | $10,861 |
| 11/2017 | $10,396 | $10,114 | $10,847 |
| 12/2017 | $10,407 | $10,125 | $10,897 |
| 01/2018 | $10,428 | $10,137 | $10,771 |
| 02/2018 | $10,448 | $10,147 | $10,669 |
| 03/2018 | $10,448 | $10,161 | $10,737 |
| 04/2018 | $10,469 | $10,175 | $10,658 |
| 05/2018 | $10,480 | $10,190 | $10,734 |
| 06/2018 | $10,483 | $10,207 | $10,720 |
| 07/2018 | $10,472 | $10,223 | $10,723 |
| 08/2018 | $10,514 | $10,242 | $10,792 |
| 09/2018 | $10,504 | $10,257 | $10,722 |
| 10/2018 | $10,514 | $10,275 | $10,638 |
| 11/2018 | $10,483 | $10,296 | $10,701 |
| 12/2018 | $10,432 | $10,315 | $10,898 |
| 01/2019 | $10,559 | $10,335 | $11,014 |
| 02/2019 | $10,622 | $10,354 | $11,007 |
| 03/2019 | $10,707 | $10,377 | $11,219 |
| 04/2019 | $10,770 | $10,396 | $11,221 |
| 05/2019 | $10,749 | $10,420 | $11,421 |
| 06/2019 | $10,855 | $10,443 | $11,564 |
| 07/2019 | $10,927 | $10,462 | $11,589 |
| 08/2019 | $10,980 | $10,484 | $11,890 |
| 09/2019 | $10,991 | $10,502 | $11,826 |
| 10/2019 | $11,034 | $10,522 | $11,862 |
| 11/2019 | $11,034 | $10,535 | $11,856 |
| 12/2019 | $11,091 | $10,550 | $11,848 |
| 01/2020 | $11,178 | $10,565 | $12,076 |
| 02/2020 | $11,178 | $10,580 | $12,293 |
| 03/2020 | $10,380 | $10,611 | $12,221 |
| 04/2020 | $10,610 | $10,612 | $12,438 |
| 05/2020 | $10,741 | $10,612 | $12,496 |
| 06/2020 | $11,102 | $10,613 | $12,575 |
| 07/2020 | $11,316 | $10,615 | $12,762 |
| 08/2020 | $11,658 | $10,616 | $12,659 |
| 09/2020 | $11,724 | $10,617 | $12,652 |
| 10/2020 | $11,769 | $10,619 | $12,596 |
| 11/2020 | $12,066 | $10,620 | $12,720 |
| 12/2020 | $12,197 | $10,621 | $12,737 |
| 01/2021 | $12,321 | $10,622 | $12,646 |
| 02/2021 | $12,501 | $10,623 | $12,463 |
| 03/2021 | $12,444 | $10,623 | $12,308 |
| 04/2021 | $12,456 | $10,624 | $12,405 |
| 05/2021 | $12,456 | $10,624 | $12,445 |
| 06/2021 | $12,523 | $10,623 | $12,533 |
| 07/2021 | $12,511 | $10,624 | $12,673 |
| 08/2021 | $12,545 | $10,624 | $12,649 |
| 09/2021 | $12,613 | $10,625 | $12,539 |
| 10/2021 | $12,715 | $10,625 | $12,536 |
| 11/2021 | $12,636 | $10,625 | $12,573 |
| 12/2021 | $12,641 | $10,626 | $12,541 |
| 01/2022 | $12,552 | $10,625 | $12,271 |
| 02/2022 | $12,451 | $10,627 | $12,134 |
| 03/2022 | $12,426 | $10,630 | $11,797 |
| 04/2022 | $12,236 | $10,632 | $11,349 |
| 05/2022 | $12,033 | $10,639 | $11,422 |
| 06/2022 | $11,768 | $10,641 | $11,243 |
| 07/2022 | $11,900 | $10,647 | $11,518 |
| 08/2022 | $12,027 | $10,664 | $11,192 |
| 09/2022 | $11,798 | $10,690 | $10,709 |
| 10/2022 | $11,900 | $10,707 | $10,570 |
| 11/2022 | $11,951 | $10,742 | $10,959 |
| 12/2022 | $11,974 | $10,781 | $10,909 |
| 01/2023 | $12,269 | $10,814 | $11,245 |
| 02/2023 | $12,256 | $10,850 | $10,954 |
| 03/2023 | $12,090 | $10,896 | $11,232 |
| 04/2023 | $12,179 | $10,931 | $11,300 |
| 05/2023 | $12,205 | $10,974 | $11,177 |
| 06/2023 | $12,384 | $11,024 | $11,137 |
| 07/2023 | $12,506 | $11,068 | $11,130 |
| 08/2023 | $12,558 | $11,118 | $11,059 |
| 09/2023 | $12,584 | $11,169 | $10,778 |
| 10/2023 | $12,440 | $11,218 | $10,607 |
| 11/2023 | $12,624 | $11,269 | $11,088 |
| 12/2023 | $12,886 | $11,321 | $11,512 |
| 01/2024 | $12,967 | $11,370 | $11,481 |
| 02/2024 | $13,022 | $11,416 | $11,318 |
| 03/2024 | $13,161 | $11,468 | $11,423 |
| 04/2024 | $13,162 | $11,517 | $11,134 |
| 05/2024 | $13,257 | $11,572 | $11,323 |
| 06/2024 | $13,313 | $11,619 | $11,430 |
Average Annual Total Returns (%)
| 1 Year | 5 Years | 10 Years |
|---|
Investor Class Footnote Reference1 | 7.50% | 4.17% | 2.90% |
| ICE BofA US 3-Month Treasury Bill Index | 5.40% | 2.16% | 1.51% |
| Bloomberg US Aggregate Bond Index | 2.63% | (0.23)% | 1.35% |
| Footnote | Description |
Footnote1 | Return may differ from actual shareholder return due to accounting adjustments for financial reporting purposes. |
Performance shown is historical and is not indicative of future returns. Investment returns and principal value will vary, and shares may be worth more or less at redemption than at original purchase. Performance shown is as of date indicated, and current performance may be lower or higher than the performance data quoted. To obtain performance as of the most recent month end, please visit americanbeaconfunds.com or call 800-967-9009. The graph and table do not reflect the deduction of taxes that a shareholder would pay on fund distributions or redemption of fund shares. The Fund's performance benefited from fee waivers. For more information, visit americanbeaconfunds.com/Performance_Disclaimers.aspx.
| Total Net Assets | $176,031,445 |
| # of Portfolio Holdings | 109 |
| Portfolio Turnover Rate | 127% |
| Total Management Fees Paid | $1,561,120 |
What did the Fund invest in?
Top Ten Holdings - % Net Assets
| Royal Caribbean Cruises Ltd., 6.000%, Due 8/15/2025 | 2.1 |
| Liberty TripAdvisor Holdings, Inc., 0.500%, Due 6/30/2051 | 2.0 |
| RWT Holdings, Inc., 5.750%, Due 10/1/2025 | 1.9 |
| Two Harbors Investment Corp., 6.250%, Due 1/15/2026 | 1.7 |
| PG&E Corp., 4.250%, Due 12/1/2027 | 1.7 |
| Liberty Media Corp., 3.750%, Due 3/15/2028 | 1.6 |
| Cheesecake Factory, Inc., 0.375%, Due 6/15/2026 | 1.4 |
| Upstart Holdings, Inc., 0.250%, Due 8/15/2026 | 1.3 |
| Collegium Pharmaceutical, Inc., 2.875%, Due 2/15/2029 | 1.3 |
| Western Digital Corp., 3.000%, Due 11/15/2028 | 1.3 |
Includes long positions only.
Asset Allocation - % Investments
| Value | Value |
|---|
| Convertible Obligations | 89.4 |
| Foreign Convertible Obligations | 4.8 |
| Convertible Preferred Stocks | 3.1 |
| Preferred Stocks | 2.7 |
Top Ten Industry Allocations - % Fixed Income
| Value | Value |
|---|
| Commercial Services | 3.7 |
| Electric | 5.0 |
| Leisure Time | 5.2 |
| Pharmaceuticals | 5.8 |
| Media | 6.0 |
| Health Care - Products | 6.7 |
| Internet | 7.1 |
| Diversified Financial Services | 7.3 |
| REITS | 9.3 |
| Software | 12.9 |
Includes long convertible bond and preferred stock holdings only. Excludes equity short positions.
Sector Allocation - % Equities
| Value | Value |
|---|
| Information Technology | 9.4 |
| Materials | 9.9 |
| Industrials | 25.7 |
| Financials | 55.0 |
For additional information about the Fund, including its prospectus, financial statements, holdings, and proxy voting information, please visit www.americanbeaconfunds.com/literature or call 1-800-658-5811
If your financial institution mailed only one copy of this Report to an address shared by more than one account, you can request an individual copy by contacting your financial institution.
Distributed by Resolute Investment Distributors, Inc.
SSI Alternative Income Fund
Annual Shareholder Report - June 30, 2024
SSI Alternative Income Fund
Annual Shareholder Report - June 30, 2024
This annual shareholder report contains important information about American Beacon SSI Alternative Income Fund for the period of July 1, 2023 to June 30, 2024. You can find additional information about the Fund at www.americanbeaconfunds.com/literature. You can also request this information by contacting us at 800-658-5811.
What were the Fund costs for last year?
(based on a hypothetical $10,000 investment)
| Class Name | Cost of a $10,000 investment | Costs paid as a percentage of a $10,000 investment |
|---|
| R5 | $123 | 1.18% |
How did the Fund perform last year and what affected its performance?
The R5 Class of the Fund returned 7.90% for the twelve months ended June 30, 2024, compared to the Bloomberg U.S. Aggregate Bond Index return of 2.63% and the ICE BofA U.S. 3-Month Treasury Bill Index return of 5.40%.
• The Fund demonstrated attractive performance during the period as its hedged convertible bond strategy capitalized on interest rates that remained elevated, due to the Federal Reserve Bank’s continued narrative of ‘higher-for-longer’ rates, and income was a significant source of total return for the Fund.
• The Fund’s short duration and generally low volatility also benefited performance.
• The Fund’s holdings were diversified across sectors and industries with no individual position having a material impact on performance.
• Financials, Health Care, and Information Technology were the Fund’s largest sector exposures.
Cumulative Performance from June 30, 2014 through June 30, 2024
The initial investment, based on a $250,000 investment, is adjusted to reflect the maximum applicable sales charge, if any.
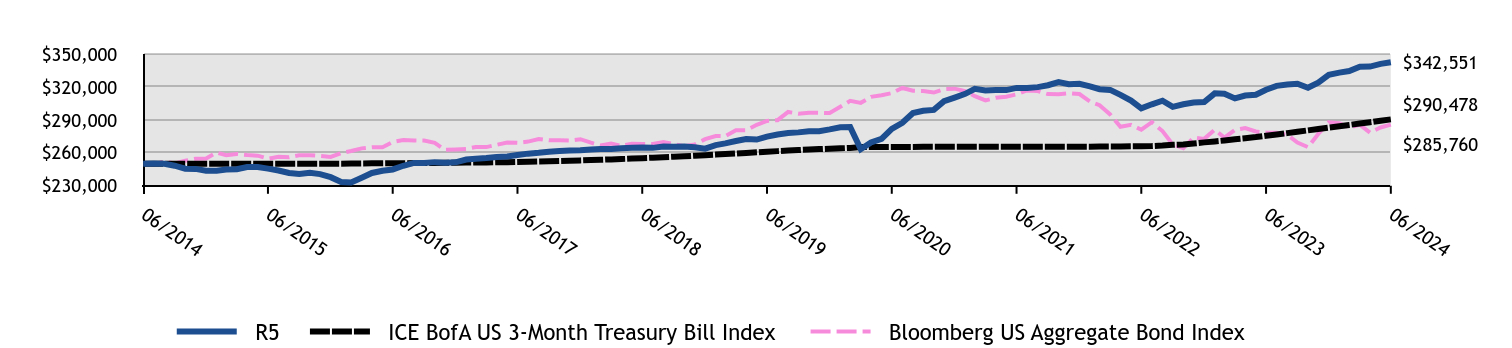
| R5 | ICE BofA US 3-Month Treasury Bill Index | Bloomberg US Aggregate Bond Index |
|---|
| 06/2014 | $250,000 | $250,000 | $250,000 |
| 07/2014 | $250,244 | $250,007 | $249,373 |
| 08/2014 | $250,000 | $250,018 | $252,126 |
| 09/2014 | $248,293 | $250,025 | $250,415 |
| 10/2014 | $245,610 | $250,029 | $252,876 |
| 11/2014 | $245,366 | $250,033 | $254,670 |
| 12/2014 | $243,671 | $250,036 | $254,908 |
| 01/2015 | $243,671 | $250,044 | $260,253 |
| 02/2015 | $244,904 | $250,044 | $257,806 |
| 03/2015 | $245,151 | $250,044 | $259,003 |
| 04/2015 | $247,124 | $250,047 | $258,074 |
| 05/2015 | $247,124 | $250,051 | $257,452 |
| 06/2015 | $245,633 | $250,058 | $254,645 |
| 07/2015 | $243,886 | $250,044 | $256,415 |
| 08/2015 | $241,639 | $250,083 | $256,047 |
| 09/2015 | $240,641 | $250,087 | $257,779 |
| 10/2015 | $241,889 | $250,069 | $257,822 |
| 11/2015 | $240,641 | $250,083 | $257,141 |
| 12/2015 | $237,840 | $250,167 | $256,310 |
| 01/2016 | $233,515 | $250,174 | $259,837 |
| 02/2016 | $233,007 | $250,236 | $261,680 |
| 03/2016 | $237,331 | $250,352 | $264,081 |
| 04/2016 | $241,655 | $250,417 | $265,095 |
| 05/2016 | $243,690 | $250,439 | $265,163 |
| 06/2016 | $244,883 | $250,533 | $269,927 |
| 07/2016 | $248,210 | $250,602 | $271,634 |
| 08/2016 | $250,769 | $250,649 | $271,323 |
| 09/2016 | $250,769 | $250,772 | $271,164 |
| 10/2016 | $251,536 | $250,834 | $269,090 |
| 11/2016 | $251,025 | $250,877 | $262,725 |
| 12/2016 | $251,350 | $250,982 | $263,096 |
| 01/2017 | $253,928 | $251,095 | $263,612 |
| 02/2017 | $254,701 | $251,200 | $265,384 |
| 03/2017 | $255,217 | $251,244 | $265,244 |
| 04/2017 | $256,248 | $251,414 | $267,291 |
| 05/2017 | $256,763 | $251,541 | $269,349 |
| 06/2017 | $257,970 | $251,751 | $269,078 |
| 07/2017 | $259,269 | $251,965 | $270,235 |
| 08/2017 | $260,048 | $252,201 | $272,659 |
| 09/2017 | $261,087 | $252,418 | $271,361 |
| 10/2017 | $261,607 | $252,643 | $271,518 |
| 11/2017 | $262,126 | $252,853 | $271,169 |
| 12/2017 | $262,287 | $253,132 | $272,414 |
| 01/2018 | $263,075 | $253,437 | $269,277 |
| 02/2018 | $263,600 | $253,676 | $266,724 |
| 03/2018 | $263,600 | $254,031 | $268,435 |
| 04/2018 | $264,125 | $254,365 | $266,438 |
| 05/2018 | $264,650 | $254,753 | $268,340 |
| 06/2018 | $264,789 | $255,181 | $268,010 |
| 07/2018 | $264,524 | $255,580 | $268,073 |
| 08/2018 | $265,848 | $256,040 | $269,798 |
| 09/2018 | $265,584 | $256,435 | $268,061 |
| 10/2018 | $265,848 | $256,877 | $265,942 |
| 11/2018 | $265,054 | $257,407 | $267,530 |
| 12/2018 | $263,794 | $257,878 | $272,445 |
| 01/2019 | $267,004 | $258,386 | $275,338 |
| 02/2019 | $268,609 | $258,846 | $275,179 |
| 03/2019 | $270,750 | $259,426 | $280,463 |
| 04/2019 | $272,622 | $259,912 | $280,534 |
| 05/2019 | $272,087 | $260,507 | $285,514 |
| 06/2019 | $274,763 | $261,083 | $289,100 |
| 07/2019 | $276,737 | $261,558 | $289,736 |
| 08/2019 | $278,093 | $262,094 | $297,243 |
| 09/2019 | $278,636 | $262,551 | $295,660 |
| 10/2019 | $279,721 | $263,055 | $296,551 |
| 11/2019 | $279,721 | $263,385 | $296,400 |
| 12/2019 | $281,339 | $263,759 | $296,193 |
| 01/2020 | $283,281 | $264,114 | $301,893 |
| 02/2020 | $283,559 | $264,502 | $307,327 |
| 03/2020 | $263,304 | $265,274 | $305,518 |
| 04/2020 | $269,408 | $265,296 | $310,949 |
| 05/2020 | $272,738 | $265,299 | $312,397 |
| 06/2020 | $281,894 | $265,336 | $314,365 |
| 07/2020 | $287,359 | $265,386 | $319,061 |
| 08/2020 | $296,322 | $265,408 | $316,485 |
| 09/2020 | $298,282 | $265,437 | $316,312 |
| 10/2020 | $299,123 | $265,466 | $314,899 |
| 11/2020 | $306,965 | $265,492 | $317,989 |
| 12/2020 | $310,273 | $265,521 | $318,427 |
| 01/2021 | $313,708 | $265,542 | $316,144 |
| 02/2021 | $318,288 | $265,568 | $311,579 |
| 03/2021 | $316,857 | $265,586 | $307,688 |
| 04/2021 | $317,143 | $265,589 | $310,119 |
| 05/2021 | $317,143 | $265,597 | $311,132 |
| 06/2021 | $319,147 | $265,586 | $313,318 |
| 07/2021 | $318,958 | $265,600 | $316,821 |
| 08/2021 | $319,825 | $265,611 | $316,218 |
| 09/2021 | $321,558 | $265,626 | $313,480 |
| 10/2021 | $324,447 | $265,615 | $313,394 |
| 11/2021 | $322,425 | $265,629 | $314,321 |
| 12/2021 | $322,800 | $265,651 | $313,517 |
| 01/2022 | $320,536 | $265,637 | $306,763 |
| 02/2022 | $317,948 | $265,673 | $303,340 |
| 03/2022 | $317,302 | $265,753 | $294,913 |
| 04/2022 | $312,773 | $265,792 | $283,721 |
| 05/2022 | $307,598 | $265,974 | $285,551 |
| 06/2022 | $300,482 | $266,032 | $281,071 |
| 07/2022 | $304,189 | $266,169 | $287,939 |
| 08/2022 | $307,453 | $266,597 | $279,803 |
| 09/2022 | $301,904 | $267,261 | $267,714 |
| 10/2022 | $304,189 | $267,681 | $264,246 |
| 11/2022 | $305,821 | $268,544 | $273,964 |
| 12/2022 | $306,293 | $269,516 | $272,728 |
| 01/2023 | $314,181 | $270,361 | $281,118 |
| 02/2023 | $313,852 | $271,241 | $273,850 |
| 03/2023 | $309,580 | $272,409 | $280,806 |
| 04/2023 | $312,209 | $273,268 | $282,508 |
| 05/2023 | $312,866 | $274,338 | $279,432 |
| 06/2023 | $317,467 | $275,592 | $278,435 |
| 07/2023 | $320,956 | $276,691 | $278,241 |
| 08/2023 | $322,300 | $277,938 | $276,464 |
| 09/2023 | $322,972 | $279,214 | $269,439 |
| 10/2023 | $319,276 | $280,461 | $265,187 |
| 11/2023 | $323,981 | $281,719 | $277,196 |
| 12/2023 | $330,947 | $283,031 | $287,807 |
| 01/2024 | $333,021 | $284,242 | $287,016 |
| 02/2024 | $334,475 | $285,406 | $282,961 |
| 03/2024 | $338,459 | $286,690 | $285,574 |
| 04/2024 | $338,544 | $287,919 | $278,361 |
| 05/2024 | $341,063 | $289,300 | $283,080 |
| 06/2024 | $342,551 | $290,478 | $285,760 |
Average Annual Total Returns (%)
| 1 Year | 5 Years | 10 Years |
|---|
Class R5 Footnote Reference1 | 7.90% | 4.51% | 3.20% |
| ICE BofA US 3-Month Treasury Bill Index | 5.40% | 2.16% | 1.51% |
| Bloomberg US Aggregate Bond Index | 2.63% | (0.23)% | 1.35% |
| Footnote | Description |
Footnote1 | Return may differ from actual shareholder return due to accounting adjustments for financial reporting purposes. |
Performance shown is historical and is not indicative of future returns. Investment returns and principal value will vary, and shares may be worth more or less at redemption than at original purchase. Performance shown is as of date indicated, and current performance may be lower or higher than the performance data quoted. To obtain performance as of the most recent month end, please visit americanbeaconfunds.com or call 800-967-9009. The graph and table do not reflect the deduction of taxes that a shareholder would pay on fund distributions or redemption of fund shares. The Fund's performance benefited from fee waivers. Performance includes historical performance of another Class of the Fund. For more information, visit americanbeaconfunds.com/Performance_Disclaimers.aspx.
| Total Net Assets | $176,031,445 |
| # of Portfolio Holdings | 109 |
| Portfolio Turnover Rate | 127% |
| Total Management Fees Paid | $1,561,120 |
What did the Fund invest in?
Top Ten Holdings - % Net Assets
| Royal Caribbean Cruises Ltd., 6.000%, Due 8/15/2025 | 2.1 |
| Liberty TripAdvisor Holdings, Inc., 0.500%, Due 6/30/2051 | 2.0 |
| RWT Holdings, Inc., 5.750%, Due 10/1/2025 | 1.9 |
| Two Harbors Investment Corp., 6.250%, Due 1/15/2026 | 1.7 |
| PG&E Corp., 4.250%, Due 12/1/2027 | 1.7 |
| Liberty Media Corp., 3.750%, Due 3/15/2028 | 1.6 |
| Cheesecake Factory, Inc., 0.375%, Due 6/15/2026 | 1.4 |
| Upstart Holdings, Inc., 0.250%, Due 8/15/2026 | 1.3 |
| Collegium Pharmaceutical, Inc., 2.875%, Due 2/15/2029 | 1.3 |
| Western Digital Corp., 3.000%, Due 11/15/2028 | 1.3 |
Includes long positions only.
Asset Allocation - % Investments
| Value | Value |
|---|
| Convertible Obligations | 89.4 |
| Foreign Convertible Obligations | 4.8 |
| Convertible Preferred Stocks | 3.1 |
| Preferred Stocks | 2.7 |
Top Ten Industry Allocations - % Fixed Income
| Value | Value |
|---|
| Commercial Services | 3.7 |
| Electric | 5.0 |
| Leisure Time | 5.2 |
| Pharmaceuticals | 5.8 |
| Media | 6.0 |
| Health Care - Products | 6.7 |
| Internet | 7.1 |
| Diversified Financial Services | 7.3 |
| REITS | 9.3 |
| Software | 12.9 |
Includes long convertible bond and preferred stock holdings only. Excludes equity short positions.
Sector Allocation - % Equities
| Value | Value |
|---|
| Information Technology | 9.4 |
| Materials | 9.9 |
| Industrials | 25.7 |
| Financials | 55.0 |
For additional information about the Fund, including its prospectus, financial statements, holdings, and proxy voting information, please visit www.americanbeaconfunds.com/literature or call 1-800-658-5811
If your financial institution mailed only one copy of this Report to an address shared by more than one account, you can request an individual copy by contacting your financial institution.
Distributed by Resolute Investment Distributors, Inc.
SSI Alternative Income Fund
Annual Shareholder Report - June 30, 2024
SSI Alternative Income Fund
Annual Shareholder Report - June 30, 2024
This annual shareholder report contains important information about American Beacon SSI Alternative Income Fund for the period of July 1, 2023 to June 30, 2024. You can find additional information about the Fund at www.americanbeaconfunds.com/literature. You can also request this information by contacting us at 800-658-5811.
What were the Fund costs for last year?
(based on a hypothetical $10,000 investment)
| Class Name | Cost of a $10,000 investment | Costs paid as a percentage of a $10,000 investment |
|---|
| Y | $131 | 1.26% |
How did the Fund perform last year and what affected its performance?
The Y Class of the Fund returned 7.80% for the twelve months ended June 30, 2024, compared to the Bloomberg U.S. Aggregate Bond Index return of 2.63% and the ICE BofA U.S. 3-Month Treasury Bill Index return of 5.40%.
• The Fund demonstrated attractive performance during the period as its hedged convertible bond strategy capitalized on interest rates that remained elevated, due to the Federal Reserve Bank’s continued narrative of ‘higher-for-longer’ rates, and income was a significant source of total return for the Fund.
• The Fund’s short duration and generally low volatility also benefited performance.
• The Fund’s holdings were diversified across sectors and industries with no individual position having a material impact on performance.
• Financials, Health Care, and Information Technology were the Fund’s largest sector exposures.
Cumulative Performance from June 30, 2014 through June 30, 2024
The initial investment, based on a $100,000 investment, is adjusted to reflect the maximum applicable sales charge, if any.
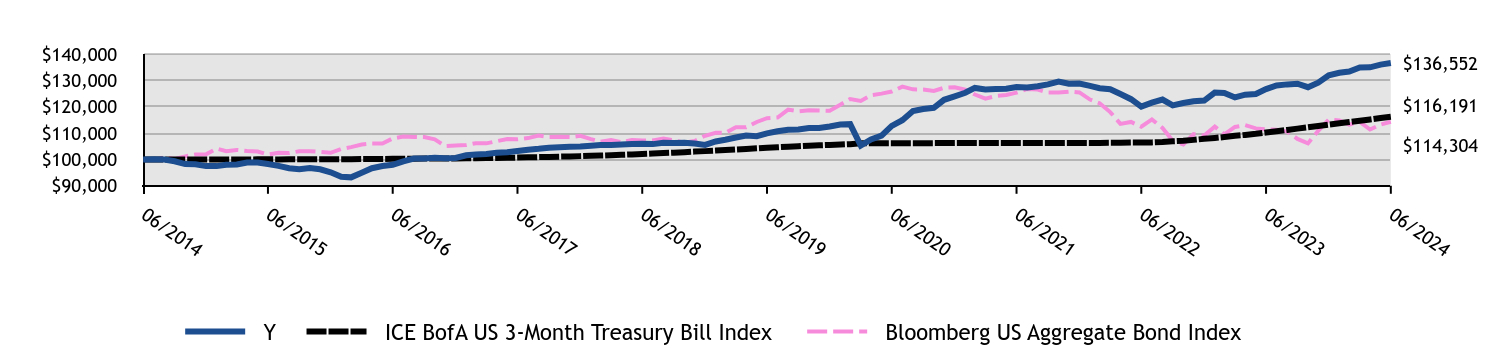
| Y | ICE BofA US 3-Month Treasury Bill Index | Bloomberg US Aggregate Bond Index |
|---|
| 06/2014 | $100,000 | $100,000 | $100,000 |
| 07/2014 | $100,098 | $100,003 | $99,749 |
| 08/2014 | $100,000 | $100,007 | $100,850 |
| 09/2014 | $99,317 | $100,010 | $100,166 |
| 10/2014 | $98,244 | $100,012 | $101,150 |
| 11/2014 | $98,146 | $100,013 | $101,868 |
| 12/2014 | $97,468 | $100,015 | $101,963 |
| 01/2015 | $97,468 | $100,017 | $104,101 |
| 02/2015 | $97,962 | $100,017 | $103,122 |
| 03/2015 | $98,060 | $100,017 | $103,601 |
| 04/2015 | $98,849 | $100,019 | $103,230 |
| 05/2015 | $98,849 | $100,020 | $102,981 |
| 06/2015 | $98,253 | $100,023 | $101,858 |
| 07/2015 | $97,554 | $100,017 | $102,566 |
| 08/2015 | $96,656 | $100,033 | $102,419 |
| 09/2015 | $96,256 | $100,035 | $103,112 |
| 10/2015 | $96,756 | $100,028 | $103,129 |
| 11/2015 | $96,256 | $100,033 | $102,856 |
| 12/2015 | $95,136 | $100,067 | $102,524 |
| 01/2016 | $93,406 | $100,070 | $103,935 |
| 02/2016 | $93,203 | $100,094 | $104,672 |
| 03/2016 | $94,932 | $100,141 | $105,632 |
| 04/2016 | $96,662 | $100,167 | $106,038 |
| 05/2016 | $97,476 | $100,175 | $106,065 |
| 06/2016 | $97,953 | $100,213 | $107,971 |
| 07/2016 | $99,284 | $100,241 | $108,653 |
| 08/2016 | $100,308 | $100,260 | $108,529 |
| 09/2016 | $100,308 | $100,309 | $108,466 |
| 10/2016 | $100,615 | $100,334 | $107,636 |
| 11/2016 | $100,410 | $100,351 | $105,090 |
| 12/2016 | $100,540 | $100,393 | $105,238 |
| 01/2017 | $101,571 | $100,438 | $105,445 |
| 02/2017 | $101,880 | $100,480 | $106,153 |
| 03/2017 | $102,087 | $100,497 | $106,098 |
| 04/2017 | $102,499 | $100,566 | $106,917 |
| 05/2017 | $102,705 | $100,616 | $107,739 |
| 06/2017 | $103,188 | $100,700 | $107,631 |
| 07/2017 | $103,708 | $100,786 | $108,094 |
| 08/2017 | $104,019 | $100,880 | $109,064 |
| 09/2017 | $104,435 | $100,967 | $108,544 |
| 10/2017 | $104,643 | $101,057 | $108,607 |
| 11/2017 | $104,851 | $101,141 | $108,468 |
| 12/2017 | $104,915 | $101,253 | $108,966 |
| 01/2018 | $105,230 | $101,375 | $107,711 |
| 02/2018 | $105,440 | $101,470 | $106,690 |
| 03/2018 | $105,440 | $101,613 | $107,374 |
| 04/2018 | $105,650 | $101,746 | $106,575 |
| 05/2018 | $105,860 | $101,901 | $107,336 |
| 06/2018 | $105,916 | $102,072 | $107,204 |
| 07/2018 | $105,810 | $102,232 | $107,229 |
| 08/2018 | $106,339 | $102,416 | $107,919 |
| 09/2018 | $106,233 | $102,574 | $107,224 |
| 10/2018 | $106,339 | $102,751 | $106,377 |
| 11/2018 | $106,022 | $102,963 | $107,012 |
| 12/2018 | $105,517 | $103,151 | $108,978 |
| 01/2019 | $106,802 | $103,354 | $110,135 |
| 02/2019 | $107,444 | $103,538 | $110,071 |
| 03/2019 | $108,300 | $103,770 | $112,185 |
| 04/2019 | $109,049 | $103,965 | $112,214 |
| 05/2019 | $108,835 | $104,203 | $114,206 |
| 06/2019 | $109,905 | $104,433 | $115,640 |
| 07/2019 | $110,695 | $104,623 | $115,894 |
| 08/2019 | $111,237 | $104,838 | $118,897 |
| 09/2019 | $111,346 | $105,021 | $118,264 |
| 10/2019 | $111,889 | $105,222 | $118,620 |
| 11/2019 | $111,889 | $105,354 | $118,560 |
| 12/2019 | $112,486 | $105,503 | $118,477 |
| 01/2020 | $113,262 | $105,646 | $120,757 |
| 02/2020 | $113,373 | $105,801 | $122,931 |
| 03/2020 | $105,275 | $106,110 | $122,207 |
| 04/2020 | $107,605 | $106,118 | $124,380 |
| 05/2020 | $109,047 | $106,120 | $124,959 |
| 06/2020 | $112,707 | $106,134 | $125,746 |
| 07/2020 | $114,893 | $106,155 | $127,624 |
| 08/2020 | $118,364 | $106,163 | $126,594 |
| 09/2020 | $119,148 | $106,175 | $126,525 |
| 10/2020 | $119,596 | $106,186 | $125,960 |
| 11/2020 | $122,619 | $106,197 | $127,196 |
| 12/2020 | $123,932 | $106,208 | $127,371 |
| 01/2021 | $125,305 | $106,217 | $126,458 |
| 02/2021 | $127,136 | $106,227 | $124,632 |
| 03/2021 | $126,564 | $106,234 | $123,075 |
| 04/2021 | $126,679 | $106,236 | $124,048 |
| 05/2021 | $126,793 | $106,239 | $124,453 |
| 06/2021 | $127,480 | $106,234 | $125,327 |
| 07/2021 | $127,322 | $106,240 | $126,729 |
| 08/2021 | $127,784 | $106,244 | $126,487 |
| 09/2021 | $128,476 | $106,250 | $125,392 |
| 10/2021 | $129,515 | $106,246 | $125,358 |
| 11/2021 | $128,707 | $106,252 | $125,728 |
| 12/2021 | $128,802 | $106,260 | $125,407 |
| 01/2022 | $127,897 | $106,255 | $122,705 |
| 02/2022 | $126,993 | $106,269 | $121,336 |
| 03/2022 | $126,606 | $106,301 | $117,965 |
| 04/2022 | $124,797 | $106,317 | $113,489 |
| 05/2022 | $122,859 | $106,389 | $114,220 |
| 06/2022 | $120,017 | $106,413 | $112,428 |
| 07/2022 | $121,556 | $106,468 | $115,176 |
| 08/2022 | $122,728 | $106,639 | $111,921 |
| 09/2022 | $120,513 | $106,904 | $107,085 |
| 10/2022 | $121,425 | $107,073 | $105,698 |
| 11/2022 | $122,077 | $107,418 | $109,586 |
| 12/2022 | $122,348 | $107,806 | $109,091 |
| 01/2023 | $125,364 | $108,144 | $112,447 |
| 02/2023 | $125,233 | $108,497 | $109,540 |
| 03/2023 | $123,528 | $108,964 | $112,323 |
| 04/2023 | $124,578 | $109,307 | $113,003 |
| 05/2023 | $124,840 | $109,735 | $111,773 |
| 06/2023 | $126,676 | $110,237 | $111,374 |
| 07/2023 | $128,068 | $110,676 | $111,297 |
| 08/2023 | $128,470 | $111,175 | $110,586 |
| 09/2023 | $128,738 | $111,686 | $107,775 |
| 10/2023 | $127,397 | $112,184 | $106,075 |
| 11/2023 | $129,141 | $112,688 | $110,878 |
| 12/2023 | $131,920 | $113,213 | $115,123 |
| 01/2024 | $132,886 | $113,697 | $114,807 |
| 02/2024 | $133,328 | $114,162 | $113,185 |
| 03/2024 | $134,918 | $114,676 | $114,230 |
| 04/2024 | $134,952 | $115,167 | $111,344 |
| 05/2024 | $135,957 | $115,720 | $113,232 |
| 06/2024 | $136,552 | $116,191 | $114,304 |
Average Annual Total Returns (%)
| 1 Year | 5 Years | 10 Years |
|---|
Class Y Footnote Reference1 | 7.80% | 4.44% | 3.16% |
| ICE BofA US 3-Month Treasury Bill Index | 5.40% | 2.16% | 1.51% |
| Bloomberg US Aggregate Bond Index | 2.63% | (0.23)% | 1.35% |
| Footnote | Description |
Footnote1 | Return may differ from actual shareholder return due to accounting adjustments for financial reporting purposes. |
Performance shown is historical and is not indicative of future returns. Investment returns and principal value will vary, and shares may be worth more or less at redemption than at original purchase. Performance shown is as of date indicated, and current performance may be lower or higher than the performance data quoted. To obtain performance as of the most recent month end, please visit americanbeaconfunds.com or call 800-967-9009. The graph and table do not reflect the deduction of taxes that a shareholder would pay on fund distributions or redemption of fund shares. The Fund's performance benefited from fee waivers. For more information, visit americanbeaconfunds.com/Performance_Disclaimers.aspx.
| Total Net Assets | $176,031,445 |
| # of Portfolio Holdings | 109 |
| Portfolio Turnover Rate | 127% |
| Total Management Fees Paid | $1,561,120 |
What did the Fund invest in?
Top Ten Holdings - % Net Assets
| Royal Caribbean Cruises Ltd., 6.000%, Due 8/15/2025 | 2.1 |
| Liberty TripAdvisor Holdings, Inc., 0.500%, Due 6/30/2051 | 2.0 |
| RWT Holdings, Inc., 5.750%, Due 10/1/2025 | 1.9 |
| Two Harbors Investment Corp., 6.250%, Due 1/15/2026 | 1.7 |
| PG&E Corp., 4.250%, Due 12/1/2027 | 1.7 |
| Liberty Media Corp., 3.750%, Due 3/15/2028 | 1.6 |
| Cheesecake Factory, Inc., 0.375%, Due 6/15/2026 | 1.4 |
| Upstart Holdings, Inc., 0.250%, Due 8/15/2026 | 1.3 |
| Collegium Pharmaceutical, Inc., 2.875%, Due 2/15/2029 | 1.3 |
| Western Digital Corp., 3.000%, Due 11/15/2028 | 1.3 |
Includes long positions only.
Asset Allocation - % Investments
| Value | Value |
|---|
| Convertible Obligations | 89.4 |
| Foreign Convertible Obligations | 4.8 |
| Convertible Preferred Stocks | 3.1 |
| Preferred Stocks | 2.7 |
Top Ten Industry Allocations - % Fixed Income
| Value | Value |
|---|
| Commercial Services | 3.7 |
| Electric | 5.0 |
| Leisure Time | 5.2 |
| Pharmaceuticals | 5.8 |
| Media | 6.0 |
| Health Care - Products | 6.7 |
| Internet | 7.1 |
| Diversified Financial Services | 7.3 |
| REITS | 9.3 |
| Software | 12.9 |
Includes long convertible bond and preferred stock holdings only. Excludes equity short positions.
Sector Allocation - % Equities
| Value | Value |
|---|
| Information Technology | 9.4 |
| Materials | 9.9 |
| Industrials | 25.7 |
| Financials | 55.0 |
For additional information about the Fund, including its prospectus, financial statements, holdings, and proxy voting information, please visit www.americanbeaconfunds.com/literature or call 1-800-658-5811
If your financial institution mailed only one copy of this Report to an address shared by more than one account, you can request an individual copy by contacting your financial institution.
Distributed by Resolute Investment Distributors, Inc.
SSI Alternative Income Fund
Annual Shareholder Report - June 30, 2024
TwentyFour Sustainable Short Term Bond Fund
Annual Shareholder Report - June 30, 2024
This annual shareholder report contains important information about American Beacon TwentyFour Sustainable Short Term Bond Fund for the period of July 1, 2023 to June 30, 2024. You can find additional information about the Fund at www.americanbeaconfunds.com/literature. You can also request this information by contacting us at 800-658-5811.
What were the Fund costs for last year?
(based on a hypothetical $10,000 investment)
| Class Name | Cost of a $10,000 investment | Costs paid as a percentage of a $10,000 investment |
|---|
| Class A | $90 | 0.87% |
How did the Fund perform last year and what affected its performance?
The A Class of the Fund returned 4.56% (with sales charges) and 7.30% (without sales charges) for the twelve months ended June 30, 2024, compared to the Bloomberg Global-Aggregate Total Return Index Value Hedged USD return of 4.20% and the ICE BofA 1-3 Year U.S. Corporate Index return of 6.01%.
• The Fund’s lower-duration investments benefited during the period as interest rates rose.
• The Fund held a variety of exposures across credit sectors that the sub-advisor deemed to offer attractive yield, and most sectors contributed positively to total returns.
• Investments in the Financials sector generated the largest contribution to the Fund’s return, followed by selections in the Investment Grade Corporate Bonds sector.
• The Bloomberg Global-Aggregate Total Return Index Value Hedged USD has been added since the last Shareholder Report to comply with a new regulatory requirement.
Cumulative Performance from February 18, 2020 through June 30, 2024
The initial investment, based on a $10,000 investment, is adjusted to reflect the maximum applicable sales charge, if any.
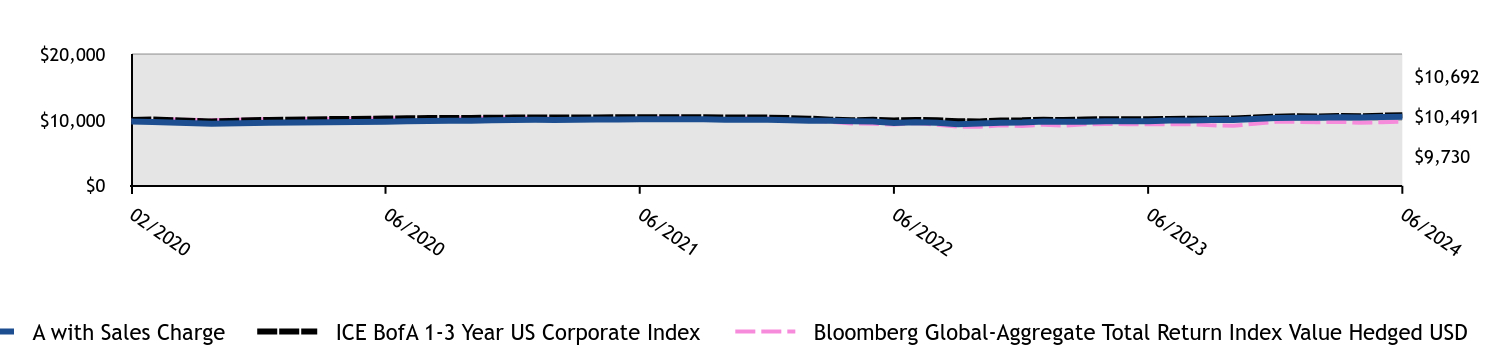
| A with Sales Charge | ICE BofA 1-3 Year US Corporate Index | Bloomberg Global-Aggregate Total Return Index Value Hedged USD |
|---|
| 02/2020 | $9,747 | $10,000 | $10,000 |
| 02/2020 | $9,698 | $10,051 | $10,111 |
| 03/2020 | $9,400 | $9,770 | $9,953 |
| 04/2020 | $9,576 | $10,002 | $10,114 |
| 05/2020 | $9,633 | $10,117 | $10,143 |
| 06/2020 | $9,709 | $10,198 | $10,194 |
| 07/2020 | $9,788 | $10,249 | $10,305 |
| 08/2020 | $9,838 | $10,275 | $10,230 |
| 09/2020 | $9,859 | $10,274 | $10,268 |
| 10/2020 | $9,869 | $10,292 | $10,268 |
| 11/2020 | $9,959 | $10,328 | $10,327 |
| 12/2020 | $9,995 | $10,350 | $10,359 |
| 01/2021 | $10,005 | $10,355 | $10,303 |
| 02/2021 | $9,999 | $10,360 | $10,143 |
| 03/2021 | $10,012 | $10,351 | $10,103 |
| 04/2021 | $10,054 | $10,373 | $10,129 |
| 05/2021 | $10,065 | $10,395 | $10,152 |
| 06/2021 | $10,088 | $10,387 | $10,202 |
| 07/2021 | $10,114 | $10,404 | $10,328 |
| 08/2021 | $10,114 | $10,409 | $10,308 |
| 09/2021 | $10,094 | $10,406 | $10,210 |
| 10/2021 | $10,031 | $10,371 | $10,184 |
| 11/2021 | $10,010 | $10,356 | $10,256 |
| 12/2021 | $10,022 | $10,349 | $10,215 |
| 01/2022 | $9,950 | $10,271 | $10,054 |
| 02/2022 | $9,874 | $10,192 | $9,920 |
| 03/2022 | $9,856 | $10,022 | $9,707 |
| 04/2022 | $9,782 | $9,948 | $9,446 |
| 05/2022 | $9,748 | $10,007 | $9,433 |
| 06/2022 | $9,541 | $9,921 | $9,290 |
| 07/2022 | $9,654 | $9,994 | $9,526 |
| 08/2022 | $9,560 | $9,937 | $9,278 |
| 09/2022 | $9,353 | $9,793 | $8,980 |
| 10/2022 | $9,446 | $9,771 | $8,949 |
| 11/2022 | $9,552 | $9,900 | $9,177 |
| 12/2022 | $9,612 | $9,929 | $9,069 |
| 01/2023 | $9,750 | $10,033 | $9,278 |
| 02/2023 | $9,733 | $9,970 | $9,130 |
| 03/2023 | $9,735 | $10,057 | $9,332 |
| 04/2023 | $9,786 | $10,116 | $9,380 |
| 05/2023 | $9,793 | $10,100 | $9,343 |
| 06/2023 | $9,777 | $10,086 | $9,338 |
| 07/2023 | $9,889 | $10,154 | $9,341 |
| 08/2023 | $9,913 | $10,185 | $9,329 |
| 09/2023 | $9,970 | $10,178 | $9,168 |
| 10/2023 | $10,002 | $10,200 | $9,103 |
| 11/2023 | $10,118 | $10,349 | $9,416 |
| 12/2023 | $10,272 | $10,486 | $9,717 |
| 01/2024 | $10,320 | $10,542 | $9,698 |
| 02/2024 | $10,322 | $10,520 | $9,631 |
| 03/2024 | $10,391 | $10,575 | $9,718 |
| 04/2024 | $10,375 | $10,554 | $9,562 |
| 05/2024 | $10,434 | $10,639 | $9,646 |
| 06/2024 | $10,491 | $10,692 | $9,730 |
Average Annual Total Returns (%)
| 1 Year | Since Inception (2/18/20) |
|---|
Class A without Sales Charge Footnote Reference1 | 7.30% | 1.70% |
Class A with Maximum Sales Charge - 5.75%Footnote Reference1 | 4.56% | 1.10% |
| ICE BofA 1-3 Year US Corporate Index | 6.01% | 1.55% |
| Bloomberg Global-Aggregate Total Return Index Value Hedged USD | 4.20% | (0.63)% |
| Footnote | Description |
Footnote1 | Return may differ from actual shareholder return due to accounting adjustments for financial reporting purposes. |
Performance shown is historical and is not indicative of future returns. Investment returns and principal value will vary, and shares may be worth more or less at redemption than at original purchase. Performance shown is as of date indicated, and current performance may be lower or higher than the performance data quoted. To obtain performance as of the most recent month end, please visit americanbeaconfunds.com or call 800-967-9009. The graph and table do not reflect the deduction of taxes that a shareholder would pay on fund distributions or redemption of fund shares. The Fund's performance benefited from fee waivers. For more information, visit americanbeaconfunds.com/Performance_Disclaimers.aspx.
| Total Net Assets | $10,609,008 |
| # of Portfolio Holdings | 71 |
| Portfolio Turnover Rate | 117% |
| Total Management Fees Paid | $67,646 |
What did the Fund invest in?
Top Ten Holdings - % Net Assets
| Bundesobligation, 2.100%, Due 4/12/2029 | 7.3 |
| U.S. Treasury Notes, 4.500%, Due 5/31/2029 | 3.0 |
| Nationwide Building Society, 5.875%, Due 12/20/2024 | 2.4 |
| Haleon U.K. Capital PLC, 3.125%, Due 3/24/2025 | 2.3 |
| Rothesay Life PLC, 8.000%, Due 10/30/2025 | 2.3 |
| Tower Bridge Funding PLC, 7.034%, Due 11/20/2063 | 2.0 |
| U.S. Treasury Notes, 4.125%, Due 3/31/2029 | 1.9 |
| Societe Generale SA, 2.226%, Due 1/21/2026 | 1.8 |
| Tesco Corporate Treasury Services PLC, 2.500%, Due 5/2/2025 | 1.7 |
| Bunzl Finance PLC, 2.250%, Due 6/11/2025 | 1.6 |
Excludes currency forwards.
Asset Allocation - % Investments
| Value | Value |
|---|
| Foreign Corporate Obligations | 68.0 |
| Corporate Obligations | 14.3 |
| Foreign Sovereign Obligations | 7.7 |
| U.S. Treasury Obligations | 5.1 |
| Collateralized Mortgage Obligations | 4.9 |
Excludes currency forwards.
Top Ten Industry Allocations - % Fixed Income
| Value | Value |
|---|
| Cosmetics/Personal Care | 2.4 |
| Software | 3.9 |
| Collateralized Mortgage Obligations | 4.9 |
| U.S. Treasury Obligations | 5.1 |
| Telecommunications | 5.7 |
| Electric | 5.9 |
| Savings & Loans | 6.2 |
| Foreign Sovereign Obligations | 7.7 |
| Insurance | 13.6 |
| Banks | 23.8 |
Top Ten Countries - % Investments
| Value | Value |
|---|
| Denmark | 1.0 |
| Belgium | 1.1 |
| Australia | 1.1 |
| Spain | 2.2 |
| Sweden | 2.3 |
| Netherlands | 4.6 |
| Germany | 8.9 |
| France | 10.8 |
| United States | 19.4 |
| United Kingdom | 48.6 |
Excludes foreign exchange holdings.
For additional information about the Fund, including its prospectus, financial statements, holdings, and proxy voting information, please visit www.americanbeaconfunds.com/literature or call 1-800-658-5811
If your financial institution mailed only one copy of this Report to an address shared by more than one account, you can request an individual copy by contacting your financial institution.
Distributed by Resolute Investment Distributors, Inc.
TwentyFour Sustainable Short Term Bond Fund
Annual Shareholder Report - June 30, 2024
TwentyFour Sustainable Short Term Bond Fund
Annual Shareholder Report - June 30, 2024
This annual shareholder report contains important information about American Beacon TwentyFour Sustainable Short Term Bond Fund for the period of July 1, 2023 to June 30, 2024. You can find additional information about the Fund at www.americanbeaconfunds.com/literature. You can also request this information by contacting us at 800-658-5811. This report describes changes to the Fund that occurred during the reporting period.
What were the Fund costs for last year?
(based on a hypothetical $10,000 investment)
| Class Name | Cost of a $10,000 investment | Costs paid as a percentage of a $10,000 investment |
|---|
| Class C | $157 | 1.52% |
How did the Fund perform last year and what affected its performance?
The C Class of the Fund returned 5.71% (with sales charges) and 6.71% (without sales charges) for the twelve months ended June 30, 2024, compared to the Bloomberg Global-Aggregate Total Return Index Value Hedged USD return of 4.20% and the ICE BofA 1-3 Year U.S. Corporate Index return of 6.01%.
• The Fund’s lower-duration investments benefited during the period as interest rates rose.
• The Fund held a variety of exposures across credit sectors that the sub-advisor deemed to offer attractive yield, and most sectors contributed positively to total returns.
• Investments in the Financials sector generated the largest contribution to the Fund’s return, followed by selections in the Investment Grade Corporate Bonds sector.
• The Bloomberg Global-Aggregate Total Return Index Value Hedged USD has been added since the last Shareholder Report to comply with a new regulatory requirement.
Cumulative Performance from February 18, 2020 through June 30, 2024
The initial investment, based on a $10,000 investment, is adjusted to reflect the maximum applicable sales charge, if any.
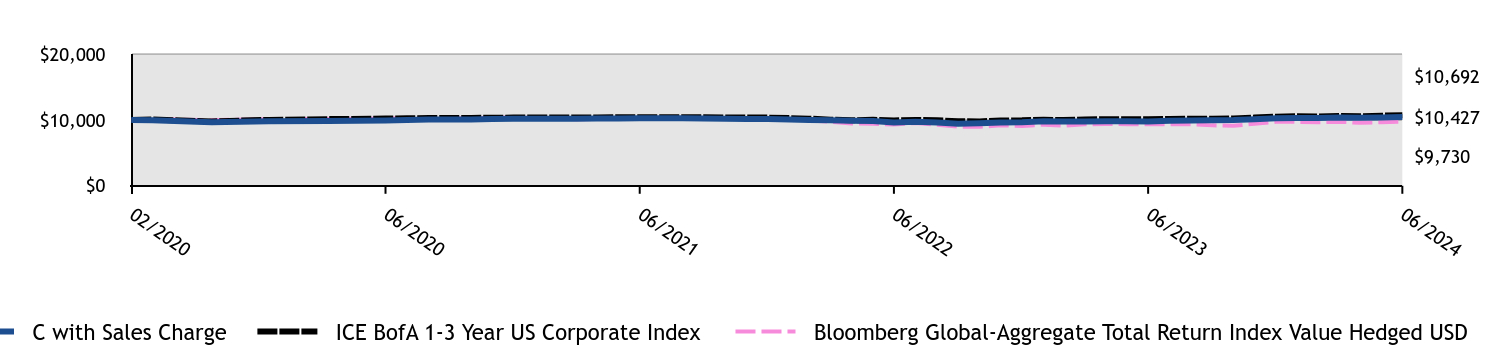
| C with Sales Charge | ICE BofA 1-3 Year US Corporate Index | Bloomberg Global-Aggregate Total Return Index Value Hedged USD |
|---|
| 02/2020 | $10,000 | $10,000 | $10,000 |
| 02/2020 | $9,950 | $10,051 | $10,111 |
| 03/2020 | $9,635 | $9,770 | $9,953 |
| 04/2020 | $9,805 | $10,002 | $10,114 |
| 05/2020 | $9,844 | $10,117 | $10,143 |
| 06/2020 | $9,921 | $10,198 | $10,194 |
| 07/2020 | $9,992 | $10,249 | $10,305 |
| 08/2020 | $10,043 | $10,275 | $10,230 |
| 09/2020 | $10,065 | $10,274 | $10,268 |
| 10/2020 | $10,065 | $10,292 | $10,268 |
| 11/2020 | $10,147 | $10,328 | $10,327 |
| 12/2020 | $10,184 | $10,350 | $10,359 |
| 01/2021 | $10,184 | $10,355 | $10,303 |
| 02/2021 | $10,168 | $10,360 | $10,143 |
| 03/2021 | $10,181 | $10,351 | $10,103 |
| 04/2021 | $10,214 | $10,373 | $10,129 |
| 05/2021 | $10,225 | $10,395 | $10,152 |
| 06/2021 | $10,239 | $10,387 | $10,202 |
| 07/2021 | $10,250 | $10,404 | $10,328 |
| 08/2021 | $10,250 | $10,409 | $10,308 |
| 09/2021 | $10,229 | $10,406 | $10,210 |
| 10/2021 | $10,155 | $10,371 | $10,184 |
| 11/2021 | $10,133 | $10,356 | $10,256 |
| 12/2021 | $10,134 | $10,349 | $10,215 |
| 01/2022 | $10,061 | $10,271 | $10,054 |
| 02/2022 | $9,972 | $10,192 | $9,920 |
| 03/2022 | $9,944 | $10,022 | $9,707 |
| 04/2022 | $9,867 | $9,948 | $9,446 |
| 05/2022 | $9,823 | $10,007 | $9,433 |
| 06/2022 | $9,610 | $9,921 | $9,290 |
| 07/2022 | $9,726 | $9,994 | $9,526 |
| 08/2022 | $9,619 | $9,937 | $9,278 |
| 09/2022 | $9,407 | $9,793 | $8,980 |
| 10/2022 | $9,492 | $9,771 | $8,949 |
| 11/2022 | $9,600 | $9,900 | $9,177 |
| 12/2022 | $9,651 | $9,929 | $9,069 |
| 01/2023 | $9,781 | $10,033 | $9,278 |
| 02/2023 | $9,763 | $9,970 | $9,130 |
| 03/2023 | $9,754 | $10,057 | $9,332 |
| 04/2023 | $9,806 | $10,116 | $9,380 |
| 05/2023 | $9,801 | $10,100 | $9,343 |
| 06/2023 | $9,771 | $10,086 | $9,338 |
| 07/2023 | $9,882 | $10,154 | $9,341 |
| 08/2023 | $9,907 | $10,185 | $9,329 |
| 09/2023 | $9,953 | $10,178 | $9,168 |
| 10/2023 | $9,986 | $10,200 | $9,103 |
| 11/2023 | $10,093 | $10,349 | $9,416 |
| 12/2023 | $10,239 | $10,486 | $9,717 |
| 01/2024 | $10,276 | $10,542 | $9,698 |
| 02/2024 | $10,278 | $10,520 | $9,631 |
| 03/2024 | $10,349 | $10,575 | $9,718 |
| 04/2024 | $10,320 | $10,554 | $9,562 |
| 05/2024 | $10,380 | $10,639 | $9,646 |
| 06/2024 | $10,427 | $10,692 | $9,730 |
Average Annual Total Returns (%)
| 1 Year | Since Inception (2/18/20) |
|---|
Class C without Deferred Sales Charge Footnote Reference1 | 6.71% | 0.96% |
Class C with Maximum Deferred Sales Charge -1.00%Footnote Reference1 | 5.71% | 0.96% |
| ICE BofA 1-3 Year US Corporate Index | 6.01% | 1.55% |
| Bloomberg Global-Aggregate Total Return Index Value Hedged USD | 4.20% | (0.63)% |
| Footnote | Description |
Footnote1 | Return may differ from actual shareholder return due to accounting adjustments for financial reporting purposes. |
Performance shown is historical and is not indicative of future returns. Investment returns and principal value will vary, and shares may be worth more or less at redemption than at original purchase. Performance shown is as of date indicated, and current performance may be lower or higher than the performance data quoted. To obtain performance as of the most recent month end, please visit americanbeaconfunds.com or call 800-967-9009. The graph and table do not reflect the deduction of taxes that a shareholder would pay on fund distributions or redemption of fund shares. The Fund's performance benefited from fee waivers. For more information, visit americanbeaconfunds.com/Performance_Disclaimers.aspx.
| Total Net Assets | $10,609,008 |
| # of Portfolio Holdings | 71 |
| Portfolio Turnover Rate | 117% |
| Total Management Fees Paid | $67,646 |
What did the Fund invest in?
Top Ten Holdings - % Net Assets
| Bundesobligation, 2.100%, Due 4/12/2029 | 7.3 |
| U.S. Treasury Notes, 4.500%, Due 5/31/2029 | 3.0 |
| Nationwide Building Society, 5.875%, Due 12/20/2024 | 2.4 |
| Haleon U.K. Capital PLC, 3.125%, Due 3/24/2025 | 2.3 |
| Rothesay Life PLC, 8.000%, Due 10/30/2025 | 2.3 |
| Tower Bridge Funding PLC, 7.034%, Due 11/20/2063 | 2.0 |
| U.S. Treasury Notes, 4.125%, Due 3/31/2029 | 1.9 |
| Societe Generale SA, 2.226%, Due 1/21/2026 | 1.8 |
| Tesco Corporate Treasury Services PLC, 2.500%, Due 5/2/2025 | 1.7 |
| Bunzl Finance PLC, 2.250%, Due 6/11/2025 | 1.6 |
Excludes currency forwards.
Asset Allocation - % Investments
| Value | Value |
|---|
| Foreign Corporate Obligations | 68.0 |
| Corporate Obligations | 14.3 |
| Foreign Sovereign Obligations | 7.7 |
| U.S. Treasury Obligations | 5.1 |
| Collateralized Mortgage Obligations | 4.9 |
Excludes currency forwards.
Top Ten Industry Allocations - % Fixed Income
| Value | Value |
|---|
| Cosmetics/Personal Care | 2.4 |
| Software | 3.9 |
| Collateralized Mortgage Obligations | 4.9 |
| U.S. Treasury Obligations | 5.1 |
| Telecommunications | 5.7 |
| Electric | 5.9 |
| Savings & Loans | 6.2 |
| Foreign Sovereign Obligations | 7.7 |
| Insurance | 13.6 |
| Banks | 23.8 |
Top Ten Countries - % Investments
| Value | Value |
|---|
| Denmark | 1.0 |
| Belgium | 1.1 |
| Australia | 1.1 |
| Spain | 2.2 |
| Sweden | 2.3 |
| Netherlands | 4.6 |
| Germany | 8.9 |
| France | 10.8 |
| United States | 19.4 |
| United Kingdom | 48.6 |
Excludes foreign exchange holdings.
This is a summary of certain changes to the Fund since June 30, 2023. For more complete information, you may review the Fund's next prospectus, which we expect to be available by November 1, 2024 at www.americanbeaconfunds.com/literature or upon request at 800-658-5811.
Effective November 1, 2023, the contractual expense limitation for the C Class was reduced from 1.62% to 1.48% (excluding taxes, interest, brokerage commissions, acquired fund fees and expenses, securities lending fees, expenses associated with securities sold short, litigation and other extraordinary expenses).
For additional information about the Fund, including its prospectus, financial statements, holdings, and proxy voting information, please visit www.americanbeaconfunds.com/literature or call 1-800-658-5811
If your financial institution mailed only one copy of this Report to an address shared by more than one account, you can request an individual copy by contacting your financial institution.
Distributed by Resolute Investment Distributors, Inc.
TwentyFour Sustainable Short Term Bond Fund
Annual Shareholder Report - June 30, 2024
TwentyFour Sustainable Short Term Bond Fund
Annual Shareholder Report - June 30, 2024
This annual shareholder report contains important information about American Beacon TwentyFour Sustainable Short Term Bond Fund for the period of July 1, 2023 to June 30, 2024. You can find additional information about the Fund at www.americanbeaconfunds.com/literature. You can also request this information by contacting us at 800-658-5811.
What were the Fund costs for last year?
(based on a hypothetical $10,000 investment)
| Class Name | Cost of a $10,000 investment | Costs paid as a percentage of a $10,000 investment |
|---|
| R6 | $48 | 0.47% |
How did the Fund perform last year and what affected its performance?
The R6 Class of the Fund returned 4.69% for the twelve months ended June 30, 2024, compared to the Bloomberg Global-Aggregate Total Return Index Value Hedged USD return of 4.20% and the ICE BofA 1-3 Year U.S. Corporate Index return of 6.01%.
• The Fund’s lower-duration investments benefited during the period as interest rates rose.
• The Fund held a variety of exposures across credit sectors that the sub-advisor deemed to offer attractive yield, and most sectors contributed positively to total returns.
• Investments in the Financials sector generated the largest contribution to the Fund’s return, followed by selections in the Investment Grade Corporate Bonds sector.
• The Bloomberg Global-Aggregate Total Return Index Value Hedged USD has been added since the last Shareholder Report to comply with a new regulatory requirement.
Cumulative Performance from February 18, 2020 through June 30, 2024
The initial investment, based on a $10,000 investment, is adjusted to reflect the maximum applicable sales charge, if any.
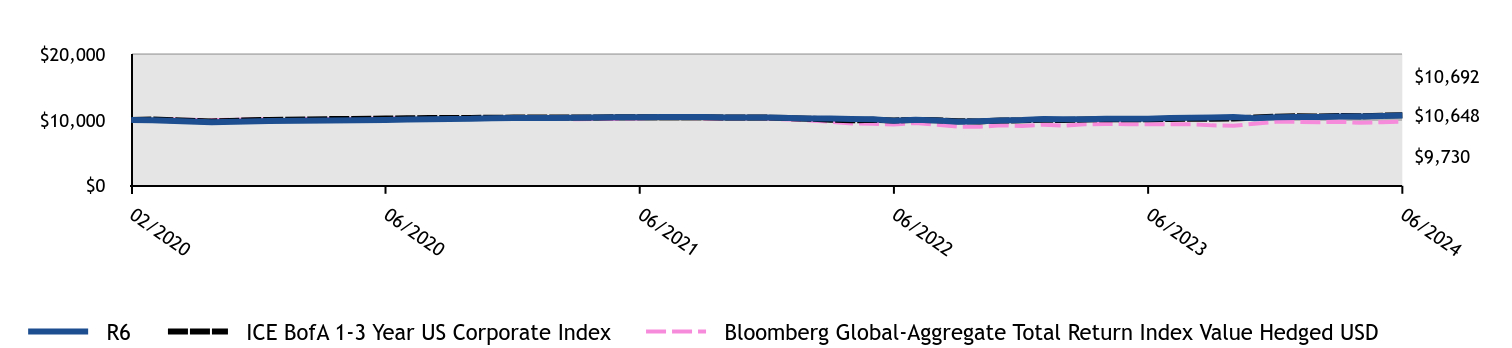
| R6 | ICE BofA 1-3 Year US Corporate Index | Bloomberg Global-Aggregate Total Return Index Value Hedged USD |
|---|
| 02/2020 | $10,000 | $10,000 | $10,000 |
| 02/2020 | $9,960 | $10,051 | $10,111 |
| 03/2020 | $9,655 | $9,770 | $9,953 |
| 04/2020 | $9,845 | $10,002 | $10,114 |
| 05/2020 | $9,904 | $10,117 | $10,143 |
| 06/2020 | $9,981 | $10,198 | $10,194 |
| 07/2020 | $10,052 | $10,249 | $10,305 |
| 08/2020 | $10,114 | $10,275 | $10,230 |
| 09/2020 | $10,146 | $10,274 | $10,268 |
| 10/2020 | $10,156 | $10,292 | $10,268 |
| 11/2020 | $10,248 | $10,328 | $10,327 |
| 12/2020 | $10,295 | $10,350 | $10,359 |
| 01/2021 | $10,305 | $10,355 | $10,303 |
| 02/2021 | $10,299 | $10,360 | $10,143 |
| 03/2021 | $10,323 | $10,351 | $10,103 |
| 04/2021 | $10,366 | $10,373 | $10,129 |
| 05/2021 | $10,387 | $10,395 | $10,152 |
| 06/2021 | $10,412 | $10,387 | $10,202 |
| 07/2021 | $10,431 | $10,404 | $10,328 |
| 08/2021 | $10,441 | $10,409 | $10,308 |
| 09/2021 | $10,420 | $10,406 | $10,210 |
| 10/2021 | $10,367 | $10,371 | $10,184 |
| 11/2021 | $10,345 | $10,356 | $10,256 |
| 12/2021 | $10,367 | $10,349 | $10,215 |
| 01/2022 | $10,294 | $10,271 | $10,054 |
| 02/2022 | $10,205 | $10,192 | $9,920 |
| 03/2022 | $10,198 | $10,022 | $9,707 |
| 04/2022 | $10,121 | $9,948 | $9,446 |
| 05/2022 | $10,087 | $10,007 | $9,433 |
| 06/2022 | $9,884 | $9,921 | $9,290 |
| 07/2022 | $10,010 | $9,994 | $9,526 |
| 08/2022 | $9,913 | $9,937 | $9,278 |
| 09/2022 | $9,701 | $9,793 | $8,980 |
| 10/2022 | $9,796 | $9,771 | $8,949 |
| 11/2022 | $9,926 | $9,900 | $9,177 |
| 12/2022 | $9,977 | $9,929 | $9,069 |
| 01/2023 | $10,130 | $10,033 | $9,278 |
| 02/2023 | $10,113 | $9,970 | $9,130 |
| 03/2023 | $10,115 | $10,057 | $9,332 |
| 04/2023 | $10,179 | $10,116 | $9,380 |
| 05/2023 | $10,187 | $10,100 | $9,343 |
| 06/2023 | $10,171 | $10,086 | $9,338 |
| 07/2023 | $10,285 | $10,154 | $9,341 |
| 08/2023 | $10,322 | $10,185 | $9,329 |
| 09/2023 | $10,380 | $10,178 | $9,168 |
| 10/2023 | $10,425 | $10,200 | $9,103 |
| 11/2023 | $10,240 | $10,349 | $9,416 |
| 12/2023 | $10,386 | $10,486 | $9,717 |
| 01/2024 | $10,435 | $10,542 | $9,698 |
| 02/2024 | $10,449 | $10,520 | $9,631 |
| 03/2024 | $10,533 | $10,575 | $9,718 |
| 04/2024 | $10,516 | $10,554 | $9,562 |
| 05/2024 | $10,576 | $10,639 | $9,646 |
| 06/2024 | $10,648 | $10,692 | $9,730 |
Average Annual Total Returns (%)
| 1 Year | Since Inception (2/18/20) |
|---|
R6 Class Footnote Reference1 | 4.69% | 1.45% |
| ICE BofA 1-3 Year US Corporate Index | 6.01% | 1.55% |
| Bloomberg Global-Aggregate Total Return Index Value Hedged USD | 4.20% | (0.63)% |
| Footnote | Description |
Footnote1 | Return may differ from actual shareholder return due to accounting adjustments for financial reporting purposes. |
Performance shown is historical and is not indicative of future returns. Investment returns and principal value will vary, and shares may be worth more or less at redemption than at original purchase. Performance shown is as of date indicated, and current performance may be lower or higher than the performance data quoted. To obtain performance as of the most recent month end, please visit americanbeaconfunds.com or call 800-967-9009. The graph and table do not reflect the deduction of taxes that a shareholder would pay on fund distributions or redemption of fund shares. The Fund's performance benefited from fee waivers. For more information, visit americanbeaconfunds.com/Performance_Disclaimers.aspx.
| Total Net Assets | $10,609,008 |
| # of Portfolio Holdings | 71 |
| Portfolio Turnover Rate | 117% |
| Total Management Fees Paid | $67,646 |
What did the Fund invest in?
Top Ten Holdings - % Net Assets
| Bundesobligation, 2.100%, Due 4/12/2029 | 7.3 |
| U.S. Treasury Notes, 4.500%, Due 5/31/2029 | 3.0 |
| Nationwide Building Society, 5.875%, Due 12/20/2024 | 2.4 |
| Haleon U.K. Capital PLC, 3.125%, Due 3/24/2025 | 2.3 |
| Rothesay Life PLC, 8.000%, Due 10/30/2025 | 2.3 |
| Tower Bridge Funding PLC, 7.034%, Due 11/20/2063 | 2.0 |
| U.S. Treasury Notes, 4.125%, Due 3/31/2029 | 1.9 |
| Societe Generale SA, 2.226%, Due 1/21/2026 | 1.8 |
| Tesco Corporate Treasury Services PLC, 2.500%, Due 5/2/2025 | 1.7 |
| Bunzl Finance PLC, 2.250%, Due 6/11/2025 | 1.6 |
Excludes currency forwards.
Asset Allocation - % Investments
| Value | Value |
|---|
| Foreign Corporate Obligations | 68.0 |
| Corporate Obligations | 14.3 |
| Foreign Sovereign Obligations | 7.7 |
| U.S. Treasury Obligations | 5.1 |
| Collateralized Mortgage Obligations | 4.9 |
Excludes currency forwards.
Top Ten Industry Allocations - % Fixed Income
| Value | Value |
|---|
| Cosmetics/Personal Care | 2.4 |
| Software | 3.9 |
| Collateralized Mortgage Obligations | 4.9 |
| U.S. Treasury Obligations | 5.1 |
| Telecommunications | 5.7 |
| Electric | 5.9 |
| Savings & Loans | 6.2 |
| Foreign Sovereign Obligations | 7.7 |
| Insurance | 13.6 |
| Banks | 23.8 |
Top Ten Countries - % Investments
| Value | Value |
|---|
| Denmark | 1.0 |
| Belgium | 1.1 |
| Australia | 1.1 |
| Spain | 2.2 |
| Sweden | 2.3 |
| Netherlands | 4.6 |
| Germany | 8.9 |
| France | 10.8 |
| United States | 19.4 |
| United Kingdom | 48.6 |
Excludes foreign exchange holdings.
For additional information about the Fund, including its prospectus, financial statements, holdings, and proxy voting information, please visit www.americanbeaconfunds.com/literature or call 1-800-658-5811
If your financial institution mailed only one copy of this Report to an address shared by more than one account, you can request an individual copy by contacting your financial institution.
Distributed by Resolute Investment Distributors, Inc.
TwentyFour Sustainable Short Term Bond Fund
Annual Shareholder Report - June 30, 2024
TwentyFour Sustainable Short Term Bond Fund
Annual Shareholder Report - June 30, 2024
This annual shareholder report contains important information about American Beacon TwentyFour Sustainable Short Term Bond Fund for the period of July 1, 2023 to June 30, 2024. You can find additional information about the Fund at www.americanbeaconfunds.com/literature. You can also request this information by contacting us at 800-658-5811.
What were the Fund costs for last year?
(based on a hypothetical $10,000 investment)
| Class Name | Cost of a $10,000 investment | Costs paid as a percentage of a $10,000 investment |
|---|
| Y | $60 | 0.58% |
How did the Fund perform last year and what affected its performance?
The Y Class of the Fund returned 7.75% for the twelve months ended June 30, 2024, compared to the Bloomberg Global-Aggregate Total Return Index Value Hedged USD return of 4.20% and the ICE BofA 1-3 Year U.S. Corporate Index return of 6.01%.
• The Fund’s lower-duration investments benefited during the period as interest rates rose.
• The Fund held a variety of exposures across credit sectors that the sub-advisor deemed to offer attractive yield, and most sectors contributed positively to total returns.
• Investments in the Financials sector generated the largest contribution to the Fund’s return, followed by selections in the Investment Grade Corporate Bonds sector.
• The Bloomberg Global-Aggregate Total Return Index Value Hedged USD has been added since the last Shareholder Report to comply with a new regulatory requirement.
Cumulative Performance from February 18, 2020 through June 30, 2024
The initial investment, based on a $100,000 investment, is adjusted to reflect the maximum applicable sales charge, if any.
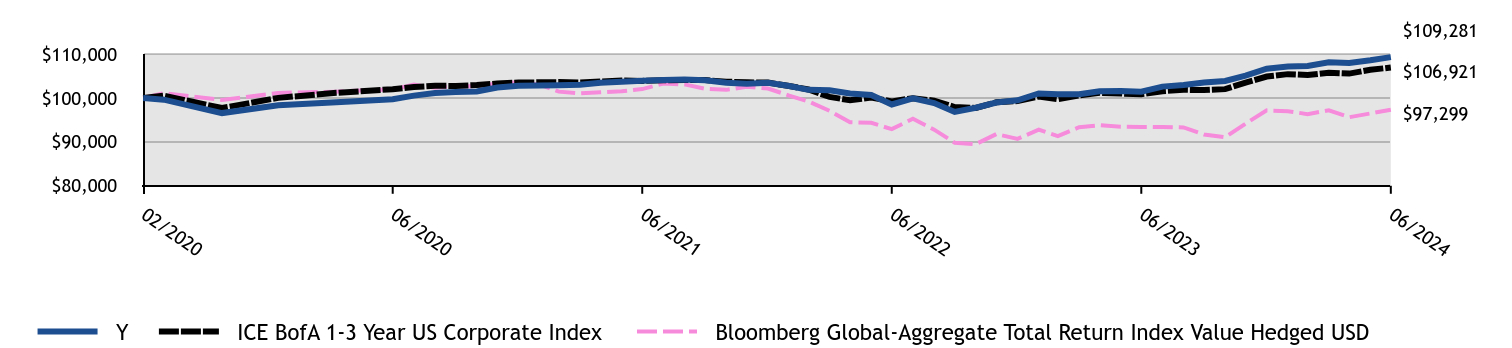
| Y | ICE BofA 1-3 Year US Corporate Index | Bloomberg Global-Aggregate Total Return Index Value Hedged USD |
|---|
| 02/2020 | $100,000 | $100,000 | $100,000 |
| 02/2020 | $99,600 | $100,507 | $101,106 |
| 03/2020 | $96,549 | $97,699 | $99,532 |
| 04/2020 | $98,347 | $100,017 | $101,144 |
| 05/2020 | $99,038 | $101,168 | $101,430 |
| 06/2020 | $99,712 | $101,984 | $101,936 |
| 07/2020 | $100,522 | $102,493 | $103,050 |
| 08/2020 | $101,138 | $102,752 | $102,304 |
| 09/2020 | $101,357 | $102,739 | $102,677 |
| 10/2020 | $101,455 | $102,923 | $102,685 |
| 11/2020 | $102,378 | $103,276 | $103,271 |
| 12/2020 | $102,746 | $103,498 | $103,588 |
| 01/2021 | $102,848 | $103,549 | $103,032 |
| 02/2021 | $102,892 | $103,599 | $101,430 |
| 03/2021 | $103,025 | $103,514 | $101,030 |
| 04/2021 | $103,461 | $103,729 | $101,294 |
| 05/2021 | $103,669 | $103,950 | $101,520 |
| 06/2021 | $103,913 | $103,867 | $102,015 |
| 07/2021 | $104,103 | $104,040 | $103,283 |
| 08/2021 | $104,208 | $104,086 | $103,076 |
| 09/2021 | $103,998 | $104,056 | $102,103 |
| 10/2021 | $103,461 | $103,708 | $101,836 |
| 11/2021 | $103,245 | $103,556 | $102,563 |
| 12/2021 | $103,466 | $103,488 | $102,147 |
| 01/2022 | $102,728 | $102,712 | $100,542 |
| 02/2022 | $101,841 | $101,921 | $99,205 |
| 03/2022 | $101,765 | $100,222 | $97,066 |
| 04/2022 | $100,998 | $99,483 | $94,457 |
| 05/2022 | $100,655 | $100,066 | $94,327 |
| 06/2022 | $98,515 | $99,209 | $92,896 |
| 07/2022 | $99,909 | $99,941 | $95,262 |
| 08/2022 | $98,830 | $99,375 | $92,775 |
| 09/2022 | $96,800 | $97,931 | $89,797 |
| 10/2022 | $97,760 | $97,708 | $89,489 |
| 11/2022 | $98,958 | $98,996 | $91,770 |
| 12/2022 | $99,472 | $99,293 | $90,687 |
| 01/2023 | $101,014 | $100,333 | $92,776 |
| 02/2023 | $100,840 | $99,699 | $91,296 |
| 03/2023 | $100,863 | $100,574 | $93,320 |
| 04/2023 | $101,505 | $101,157 | $93,801 |
| 05/2023 | $101,582 | $100,996 | $93,431 |
| 06/2023 | $101,418 | $100,858 | $93,376 |
| 07/2023 | $102,575 | $101,541 | $93,406 |
| 08/2023 | $102,944 | $101,848 | $93,288 |
| 09/2023 | $103,531 | $101,780 | $91,680 |
| 10/2023 | $103,859 | $102,004 | $91,029 |
| 11/2023 | $105,055 | $103,494 | $94,159 |
| 12/2023 | $106,648 | $104,863 | $97,168 |
| 01/2024 | $107,141 | $105,415 | $96,977 |
| 02/2024 | $107,284 | $105,203 | $96,312 |
| 03/2024 | $108,122 | $105,751 | $97,180 |
| 04/2024 | $107,953 | $105,539 | $95,616 |
| 05/2024 | $108,561 | $106,394 | $96,462 |
| 06/2024 | $109,281 | $106,921 | $97,299 |
Average Annual Total Returns (%)
| 1 Year | Since Inception (2/18/20) |
|---|
Class Y Footnote Reference1 | 7.75% | 2.05% |
| ICE BofA 1-3 Year US Corporate Index | 6.01% | 1.55% |
| Bloomberg Global-Aggregate Total Return Index Value Hedged USD | 4.20% | (0.63)% |
| Footnote | Description |
Footnote1 | Return may differ from actual shareholder return due to accounting adjustments for financial reporting purposes. |
Performance shown is historical and is not indicative of future returns. Investment returns and principal value will vary, and shares may be worth more or less at redemption than at original purchase. Performance shown is as of date indicated, and current performance may be lower or higher than the performance data quoted. To obtain performance as of the most recent month end, please visit americanbeaconfunds.com or call 800-967-9009. The graph and table do not reflect the deduction of taxes that a shareholder would pay on fund distributions or redemption of fund shares. The Fund's performance benefited from fee waivers. For more information, visit americanbeaconfunds.com/Performance_Disclaimers.aspx.
| Total Net Assets | $10,609,008 |
| # of Portfolio Holdings | 71 |
| Portfolio Turnover Rate | 117% |
| Total Management Fees Paid | $67,646 |
What did the Fund invest in?
Top Ten Holdings - % Net Assets
| Bundesobligation, 2.100%, Due 4/12/2029 | 7.3 |
| U.S. Treasury Notes, 4.500%, Due 5/31/2029 | 3.0 |
| Nationwide Building Society, 5.875%, Due 12/20/2024 | 2.4 |
| Haleon U.K. Capital PLC, 3.125%, Due 3/24/2025 | 2.3 |
| Rothesay Life PLC, 8.000%, Due 10/30/2025 | 2.3 |
| Tower Bridge Funding PLC, 7.034%, Due 11/20/2063 | 2.0 |
| U.S. Treasury Notes, 4.125%, Due 3/31/2029 | 1.9 |
| Societe Generale SA, 2.226%, Due 1/21/2026 | 1.8 |
| Tesco Corporate Treasury Services PLC, 2.500%, Due 5/2/2025 | 1.7 |
| Bunzl Finance PLC, 2.250%, Due 6/11/2025 | 1.6 |
Excludes currency forwards.
Asset Allocation - % Investments
| Value | Value |
|---|
| Foreign Corporate Obligations | 68.0 |
| Corporate Obligations | 14.3 |
| Foreign Sovereign Obligations | 7.7 |
| U.S. Treasury Obligations | 5.1 |
| Collateralized Mortgage Obligations | 4.9 |
Excludes currency forwards.
Top Ten Industry Allocations - % Fixed Income
| Value | Value |
|---|
| Cosmetics/Personal Care | 2.4 |
| Software | 3.9 |
| Collateralized Mortgage Obligations | 4.9 |
| U.S. Treasury Obligations | 5.1 |
| Telecommunications | 5.7 |
| Electric | 5.9 |
| Savings & Loans | 6.2 |
| Foreign Sovereign Obligations | 7.7 |
| Insurance | 13.6 |
| Banks | 23.8 |
Top Ten Countries - % Investments
| Value | Value |
|---|
| Denmark | 1.0 |
| Belgium | 1.1 |
| Australia | 1.1 |
| Spain | 2.2 |
| Sweden | 2.3 |
| Netherlands | 4.6 |
| Germany | 8.9 |
| France | 10.8 |
| United States | 19.4 |
| United Kingdom | 48.6 |
Excludes foreign exchange holdings.
For additional information about the Fund, including its prospectus, financial statements, holdings, and proxy voting information, please visit www.americanbeaconfunds.com/literature or call 1-800-658-5811
If your financial institution mailed only one copy of this Report to an address shared by more than one account, you can request an individual copy by contacting your financial institution.
Distributed by Resolute Investment Distributors, Inc.
TwentyFour Sustainable Short Term Bond Fund
Annual Shareholder Report - June 30, 2024
TwentyFour Strategic Income Fund
Annual Shareholder Report - June 30, 2024
This annual shareholder report contains important information about American Beacon TwentyFour Strategic Income Fund for the period of July 1, 2023 to June 30, 2024. You can find additional information about the Fund at www.americanbeaconfunds.com/literature. You can also request this information by contacting us at 800-658-5811.
What were the Fund costs for last year?
(based on a hypothetical $10,000 investment)
| Class Name | Cost of a $10,000 investment | Costs paid as a percentage of a $10,000 investment |
|---|
| Class A | $106 | 1.00% |
How did the Fund perform last year and what affected its performance?
The A Class of the Fund returned 8.36% (with sales charges) and 12.63% (without sales charges) for the twelve months ended June 30, 2024, compared to the Bloomberg Global-Aggregate Total Return Index Value Hedged USD return of 4.20%.
• The Fund’s lower-duration investments benefited during the period as interest rates rose.
• The Fund held a variety of exposures across credit sectors that the sub-advisor deemed to offer attractive yield, and most sectors contributed positively to total returns.
• Additional Tier-1 bonds issued by European banks generated the largest contribution to the Fund’s return, followed by European Collateralized Loan Obligations, which generated the next highest contribution to return.
Cumulative Performance from April 3, 2017 through June 30, 2024
The initial investment, based on a $10,000 investment, is adjusted to reflect the maximum applicable sales charge, if any.
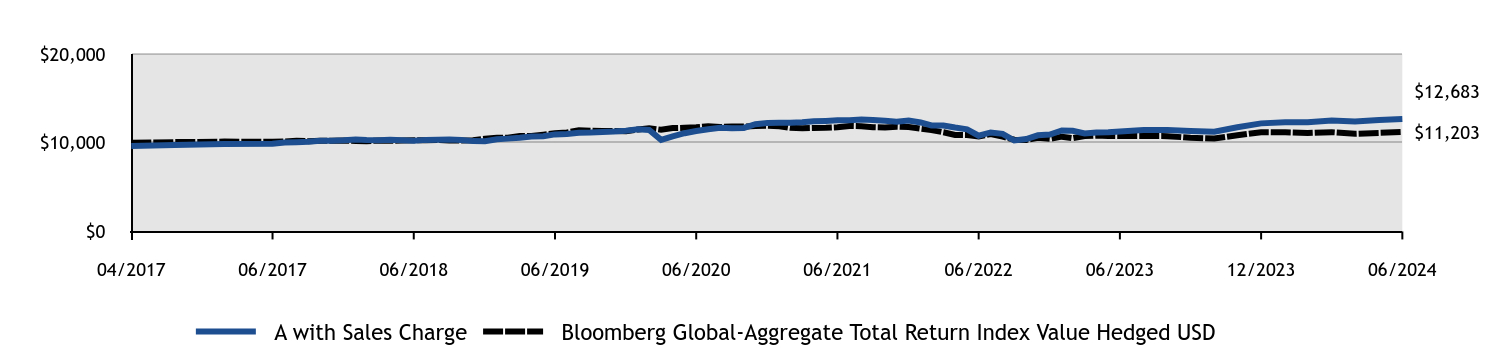
| A with Sales Charge | Bloomberg Global-Aggregate Total Return Index Value Hedged USD |
|---|
| 04/2017 | $9,625 | $10,000 |
| 04/2017 | $9,740 | $10,068 |
| 05/2017 | $9,866 | $10,127 |
| 06/2017 | $9,873 | $10,098 |
| 07/2017 | $10,030 | $10,131 |
| 08/2017 | $10,056 | $10,224 |
| 09/2017 | $10,100 | $10,177 |
| 10/2017 | $10,216 | $10,219 |
| 11/2017 | $10,221 | $10,235 |
| 12/2017 | $10,269 | $10,258 |
| 01/2018 | $10,358 | $10,185 |
| 02/2018 | $10,296 | $10,162 |
| 03/2018 | $10,272 | $10,246 |
| 04/2018 | $10,338 | $10,208 |
| 05/2018 | $10,266 | $10,246 |
| 06/2018 | $10,217 | $10,265 |
| 07/2018 | $10,320 | $10,268 |
| 08/2018 | $10,335 | $10,300 |
| 09/2018 | $10,361 | $10,260 |
| 10/2018 | $10,312 | $10,240 |
| 11/2018 | $10,181 | $10,290 |
| 12/2018 | $10,171 | $10,439 |
| 01/2019 | $10,382 | $10,550 |
| 02/2019 | $10,461 | $10,562 |
| 03/2019 | $10,565 | $10,751 |
| 04/2019 | $10,710 | $10,758 |
| 05/2019 | $10,721 | $10,913 |
| 06/2019 | $10,938 | $11,066 |
| 07/2019 | $10,992 | $11,153 |
| 08/2019 | $11,113 | $11,406 |
| 09/2019 | $11,143 | $11,353 |
| 10/2019 | $11,208 | $11,333 |
| 11/2019 | $11,262 | $11,320 |
| 12/2019 | $11,351 | $11,297 |
| 01/2020 | $11,526 | $11,501 |
| 02/2020 | $11,435 | $11,641 |
| 03/2020 | $10,318 | $11,460 |
| 04/2020 | $10,724 | $11,646 |
| 05/2020 | $11,075 | $11,679 |
| 06/2020 | $11,314 | $11,737 |
| 07/2020 | $11,519 | $11,865 |
| 08/2020 | $11,687 | $11,779 |
| 09/2020 | $11,639 | $11,822 |
| 10/2020 | $11,669 | $11,823 |
| 11/2020 | $12,089 | $11,891 |
| 12/2020 | $12,225 | $11,927 |
| 01/2021 | $12,237 | $11,863 |
| 02/2021 | $12,259 | $11,679 |
| 03/2021 | $12,310 | $11,633 |
| 04/2021 | $12,411 | $11,663 |
| 05/2021 | $12,457 | $11,689 |
| 06/2021 | $12,528 | $11,746 |
| 07/2021 | $12,532 | $11,892 |
| 08/2021 | $12,606 | $11,868 |
| 09/2021 | $12,572 | $11,756 |
| 10/2021 | $12,467 | $11,725 |
| 11/2021 | $12,364 | $11,809 |
| 12/2021 | $12,495 | $11,761 |
| 01/2022 | $12,284 | $11,576 |
| 02/2022 | $11,947 | $11,422 |
| 03/2022 | $11,947 | $11,176 |
| 04/2022 | $11,712 | $10,876 |
| 05/2022 | $11,505 | $10,861 |
| 06/2022 | $10,794 | $10,696 |
| 07/2022 | $11,157 | $10,968 |
| 08/2022 | $10,998 | $10,682 |
| 09/2022 | $10,249 | $10,339 |
| 10/2022 | $10,409 | $10,304 |
| 11/2022 | $10,837 | $10,566 |
| 12/2022 | $10,916 | $10,442 |
| 01/2023 | $11,377 | $10,682 |
| 02/2023 | $11,343 | $10,512 |
| 03/2023 | $11,038 | $10,745 |
| 04/2023 | $11,151 | $10,800 |
| 05/2023 | $11,189 | $10,758 |
| 06/2023 | $11,260 | $10,751 |
| 07/2023 | $11,430 | $10,755 |
| 08/2023 | $11,427 | $10,741 |
| 09/2023 | $11,324 | $10,556 |
| 10/2023 | $11,245 | $10,481 |
| 11/2023 | $11,740 | $10,841 |
| 12/2023 | $12,180 | $11,188 |
| 01/2024 | $12,313 | $11,166 |
| 02/2024 | $12,300 | $11,089 |
| 03/2024 | $12,516 | $11,189 |
| 04/2024 | $12,389 | $11,009 |
| 05/2024 | $12,572 | $11,107 |
| 06/2024 | $12,683 | $11,203 |
Average Annual Total Returns (%)
| 1 Year | 5 Years | Since Inception (4/3/17) |
|---|
Class A without Sales Charge Footnote Reference1 | 12.63% | 3.00% | 3.88% |
Class A with Maximum Sales Charge - 5.75%Footnote Reference1 | 8.36% | 2.21% | 3.34% |
| Bloomberg Global-Aggregate Total Return Index Value Hedged USD | 4.20% | 0.25% | 1.58% |
| Footnote | Description |
Footnote1 | Return may differ from actual shareholder return due to accounting adjustments for financial reporting purposes. |
Performance shown is historical and is not indicative of future returns. Investment returns and principal value will vary, and shares may be worth more or less at redemption than at original purchase. Performance shown is as of date indicated, and current performance may be lower or higher than the performance data quoted. To obtain performance as of the most recent month end, please visit americanbeaconfunds.com or call 800-967-9009. The graph and table do not reflect the deduction of taxes that a shareholder would pay on fund distributions or redemption of fund shares. The Fund's performance benefited from fee waivers. Performance includes historical performance of another Class of the Fund. For more information, visit americanbeaconfunds.com/Performance_Disclaimers.aspx.
| Total Net Assets | $230,637,114 |
| # of Portfolio Holdings | 215 |
| Portfolio Turnover Rate | 58% |
| Total Management Fees Paid | $1,005,004 |
What did the Fund invest in?
Top Ten Holdings - % Net Assets
| Bundesrepublik Deutschland Bundesanleihe, 2.200%, Due 2/15/2034 | 10.7 |
| U.S. Treasury Notes, 4.500%, Due 11/15/2033 | 6.8 |
| U.S. Treasury Notes, 4.000%, Due 2/15/2034 | 4.8 |
| U.S. Treasury Bills, 5.368%, Due 9/17/2024 | 3.9 |
| OCP Euro CLO DAC, 5.284%, Due 4/20/2038 | 1.4 |
| Contego CLO X DAC, 5.290%, Due 5/15/2038 | 1.2 |
| Voya Euro CLO II DAC, 4.866%, Due 7/15/2035 | 1.2 |
| Nationwide Building Society, 10.250%, Due 12/6/2049 | 1.2 |
| Phoenix Group Holdings PLC, 5.750%, Due 4/26/2028 | 1.1 |
| Rothesay Life PLC, 5.000%, Due 10/13/2031 | 0.9 |
Excludes currency forwards.
Asset Allocation - % Investments
| Value | Value |
|---|
| Foreign Corporate Obligations | 46.3 |
| Asset-Backed Obligations | 18.8 |
| U.S. Treasury Obligations | 16.1 |
| Foreign Sovereign Obligations | 11.4 |
| Corporate Obligations | 7.4 |
Excludes currency forwards.
Top Ten Industry Allocations - % Fixed Income
| Value | Value |
|---|
| Auto Manufacturers | 1.2 |
| Telecommunications | 1.5 |
| Savings & Loans | 1.9 |
| Pipelines | 2.2 |
| Diversified Financial Services | 2.4 |
| Insurance | 10.2 |
| Foreign Sovereign Obligations | 11.4 |
| U.S. Treasury Obligations | 16.1 |
| Asset-Backed Obligations | 18.8 |
| Banks | 24.3 |
Top Ten Countries - % Investments
| Value | Value |
|---|
| Mexico | 1.1 |
| Austria | 1.3 |
| Italy | 2.7 |
| Netherlands | 3.4 |
| France | 4.2 |
| Spain | 4.7 |
| Germany | 12.7 |
| Ireland | 19.1 |
| United Kingdom | 21.8 |
| United States | 23.5 |
Excludes foreign exchange holdings.
For additional information about the Fund, including its prospectus, financial statements, holdings, and proxy voting information, please visit www.americanbeaconfunds.com/literature or call 1-800-658-5811
If your financial institution mailed only one copy of this Report to an address shared by more than one account, you can request an individual copy by contacting your financial institution.
Distributed by Resolute Investment Distributors, Inc.
TwentyFour Strategic Income Fund
Annual Shareholder Report - June 30, 2024
TwentyFour Strategic Income Fund
Annual Shareholder Report - June 30, 2024
This annual shareholder report contains important information about American Beacon TwentyFour Strategic Income Fund for the period of July 1, 2023 to June 30, 2024. You can find additional information about the Fund at www.americanbeaconfunds.com/literature. You can also request this information by contacting us at 800-658-5811.
What were the Fund costs for last year?
(based on a hypothetical $10,000 investment)
| Class Name | Cost of a $10,000 investment | Costs paid as a percentage of a $10,000 investment |
|---|
| Class C | $190 | 1.79% |
How did the Fund perform last year and what affected its performance?
The C Class of the Fund returned 10.81% (with sales charges) and 11.81% (without sales charges) for the twelve months ended June 30, 2024, compared to the Bloomberg Global-Aggregate Total Return Index Value Hedged USD return of 4.20%.
• The Fund’s lower-duration investments benefited during the period as interest rates rose.
• The Fund held a variety of exposures across credit sectors that the sub-advisor deemed to offer attractive yield, and most sectors contributed positively to total returns.
• Additional Tier-1 bonds issued by European banks generated the largest contribution to the Fund’s return, followed by European Collateralized Loan Obligations, which generated the next highest contribution to return.
Cumulative Performance from April 3, 2017 through June 30, 2024
The initial investment, based on a $10,000 investment, is adjusted to reflect the maximum applicable sales charge, if any.
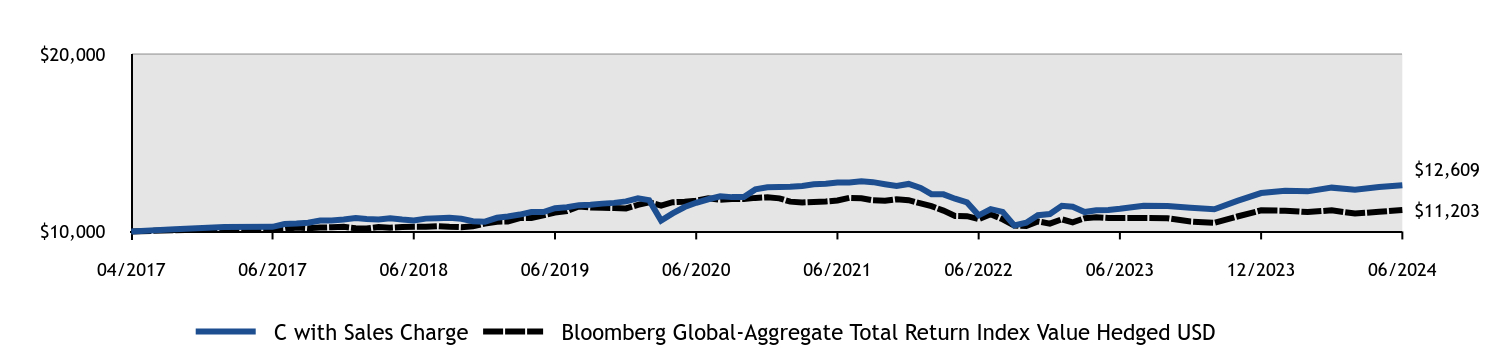
| C with Sales Charge | Bloomberg Global-Aggregate Total Return Index Value Hedged USD |
|---|
| 04/2017 | $10,000 | $10,000 |
| 04/2017 | $10,120 | $10,068 |
| 05/2017 | $10,251 | $10,127 |
| 06/2017 | $10,258 | $10,098 |
| 07/2017 | $10,421 | $10,131 |
| 08/2017 | $10,448 | $10,224 |
| 09/2017 | $10,494 | $10,177 |
| 10/2017 | $10,615 | $10,219 |
| 11/2017 | $10,620 | $10,235 |
| 12/2017 | $10,669 | $10,258 |
| 01/2018 | $10,762 | $10,185 |
| 02/2018 | $10,697 | $10,162 |
| 03/2018 | $10,672 | $10,246 |
| 04/2018 | $10,741 | $10,208 |
| 05/2018 | $10,667 | $10,246 |
| 06/2018 | $10,616 | $10,265 |
| 07/2018 | $10,722 | $10,268 |
| 08/2018 | $10,739 | $10,300 |
| 09/2018 | $10,765 | $10,260 |
| 10/2018 | $10,714 | $10,240 |
| 11/2018 | $10,578 | $10,290 |
| 12/2018 | $10,551 | $10,439 |
| 01/2019 | $10,770 | $10,550 |
| 02/2019 | $10,843 | $10,562 |
| 03/2019 | $10,951 | $10,751 |
| 04/2019 | $11,094 | $10,758 |
| 05/2019 | $11,093 | $10,913 |
| 06/2019 | $11,306 | $11,066 |
| 07/2019 | $11,362 | $11,153 |
| 08/2019 | $11,481 | $11,406 |
| 09/2019 | $11,505 | $11,353 |
| 10/2019 | $11,567 | $11,333 |
| 11/2019 | $11,609 | $11,320 |
| 12/2019 | $11,695 | $11,297 |
| 01/2020 | $11,865 | $11,501 |
| 02/2020 | $11,764 | $11,641 |
| 03/2020 | $10,617 | $11,460 |
| 04/2020 | $11,018 | $11,646 |
| 05/2020 | $11,374 | $11,679 |
| 06/2020 | $11,614 | $11,737 |
| 07/2020 | $11,813 | $11,865 |
| 08/2020 | $11,978 | $11,779 |
| 09/2020 | $11,934 | $11,822 |
| 10/2020 | $11,945 | $11,823 |
| 11/2020 | $12,370 | $11,891 |
| 12/2020 | $12,494 | $11,927 |
| 01/2021 | $12,505 | $11,863 |
| 02/2021 | $12,519 | $11,679 |
| 03/2021 | $12,564 | $11,633 |
| 04/2021 | $12,659 | $11,663 |
| 05/2021 | $12,685 | $11,689 |
| 06/2021 | $12,760 | $11,746 |
| 07/2021 | $12,755 | $11,892 |
| 08/2021 | $12,822 | $11,868 |
| 09/2021 | $12,778 | $11,756 |
| 10/2021 | $12,661 | $11,725 |
| 11/2021 | $12,560 | $11,809 |
| 12/2021 | $12,676 | $11,761 |
| 01/2022 | $12,449 | $11,576 |
| 02/2022 | $12,098 | $11,422 |
| 03/2022 | $12,091 | $11,176 |
| 04/2022 | $11,843 | $10,876 |
| 05/2022 | $11,636 | $10,861 |
| 06/2022 | $10,907 | $10,696 |
| 07/2022 | $11,255 | $10,968 |
| 08/2022 | $11,100 | $10,682 |
| 09/2022 | $10,334 | $10,339 |
| 10/2022 | $10,488 | $10,304 |
| 11/2022 | $10,914 | $10,566 |
| 12/2022 | $10,981 | $10,442 |
| 01/2023 | $11,447 | $10,682 |
| 02/2023 | $11,391 | $10,512 |
| 03/2023 | $11,091 | $10,745 |
| 04/2023 | $11,198 | $10,800 |
| 05/2023 | $11,214 | $10,758 |
| 06/2023 | $11,278 | $10,751 |
| 07/2023 | $11,441 | $10,755 |
| 08/2023 | $11,429 | $10,741 |
| 09/2023 | $11,333 | $10,556 |
| 10/2023 | $11,246 | $10,481 |
| 11/2023 | $11,720 | $10,841 |
| 12/2023 | $12,162 | $11,188 |
| 01/2024 | $12,295 | $11,166 |
| 02/2024 | $12,259 | $11,089 |
| 03/2024 | $12,468 | $11,189 |
| 04/2024 | $12,348 | $11,009 |
| 05/2024 | $12,507 | $11,107 |
| 06/2024 | $12,609 | $11,203 |
Average Annual Total Returns (%)
| 1 Year | 5 Years | Since Inception (4/3/17) |
|---|
Class C without Deferred Sales Charge Footnote Reference1 | 11.81% | 2.21% | 3.25% |
Class C with Maximum Deferred Sales Charge -1.00%Footnote Reference1 | 10.81% | 2.21% | 3.25% |
| Bloomberg Global-Aggregate Total Return Index Value Hedged USD | 4.20% | 0.25% | 1.58% |
| Footnote | Description |
Footnote1 | Return may differ from actual shareholder return due to accounting adjustments for financial reporting purposes. |
Performance shown is historical and is not indicative of future returns. Investment returns and principal value will vary, and shares may be worth more or less at redemption than at original purchase. Performance shown is as of date indicated, and current performance may be lower or higher than the performance data quoted. To obtain performance as of the most recent month end, please visit americanbeaconfunds.com or call 800-967-9009. The graph and table do not reflect the deduction of taxes that a shareholder would pay on fund distributions or redemption of fund shares. The Fund's performance benefited from fee waivers. Performance includes historical performance of another Class of the Fund. For more information, visit americanbeaconfunds.com/Performance_Disclaimers.aspx.
| Total Net Assets | $230,637,114 |
| # of Portfolio Holdings | 215 |
| Portfolio Turnover Rate | 58% |
| Total Management Fees Paid | $1,005,004 |
What did the Fund invest in?
Top Ten Holdings - % Net Assets
| Bundesrepublik Deutschland Bundesanleihe, 2.200%, Due 2/15/2034 | 10.7 |
| U.S. Treasury Notes, 4.500%, Due 11/15/2033 | 6.8 |
| U.S. Treasury Notes, 4.000%, Due 2/15/2034 | 4.8 |
| U.S. Treasury Bills, 5.368%, Due 9/17/2024 | 3.9 |
| OCP Euro CLO DAC, 5.284%, Due 4/20/2038 | 1.4 |
| Contego CLO X DAC, 5.290%, Due 5/15/2038 | 1.2 |
| Voya Euro CLO II DAC, 4.866%, Due 7/15/2035 | 1.2 |
| Nationwide Building Society, 10.250%, Due 12/6/2049 | 1.2 |
| Phoenix Group Holdings PLC, 5.750%, Due 4/26/2028 | 1.1 |
| Rothesay Life PLC, 5.000%, Due 10/13/2031 | 0.9 |
Excludes currency forwards.
Asset Allocation - % Investments
| Value | Value |
|---|
| Foreign Corporate Obligations | 46.3 |
| Asset-Backed Obligations | 18.8 |
| U.S. Treasury Obligations | 16.1 |
| Foreign Sovereign Obligations | 11.4 |
| Corporate Obligations | 7.4 |
Excludes currency forwards.
Top Ten Industry Allocations - % Fixed Income
| Value | Value |
|---|
| Auto Manufacturers | 1.2 |
| Telecommunications | 1.5 |
| Savings & Loans | 1.9 |
| Pipelines | 2.2 |
| Diversified Financial Services | 2.4 |
| Insurance | 10.2 |
| Foreign Sovereign Obligations | 11.4 |
| U.S. Treasury Obligations | 16.1 |
| Asset-Backed Obligations | 18.8 |
| Banks | 24.3 |
Top Ten Countries - % Investments
| Value | Value |
|---|
| Mexico | 1.1 |
| Austria | 1.3 |
| Italy | 2.7 |
| Netherlands | 3.4 |
| France | 4.2 |
| Spain | 4.7 |
| Germany | 12.7 |
| Ireland | 19.1 |
| United Kingdom | 21.8 |
| United States | 23.5 |
Excludes foreign exchange holdings.
For additional information about the Fund, including its prospectus, financial statements, holdings, and proxy voting information, please visit www.americanbeaconfunds.com/literature or call 1-800-658-5811
If your financial institution mailed only one copy of this Report to an address shared by more than one account, you can request an individual copy by contacting your financial institution.
Distributed by Resolute Investment Distributors, Inc.
TwentyFour Strategic Income Fund
Annual Shareholder Report - June 30, 2024
TwentyFour Strategic Income Fund
Annual Shareholder Report - June 30, 2024
This annual shareholder report contains important information about American Beacon TwentyFour Strategic Income Fund for the period of July 1, 2023 to June 30, 2024. You can find additional information about the Fund at www.americanbeaconfunds.com/literature. You can also request this information by contacting us at 800-658-5811.
What were the Fund costs for last year?
(based on a hypothetical $10,000 investment)
| Class Name | Cost of a $10,000 investment | Costs paid as a percentage of a $10,000 investment |
|---|
| Investor | $116 | 1.09% |
How did the Fund perform last year and what affected its performance?
The Investor Class of the Fund returned 12.78% for the twelve months ended June 30, 2024, compared to the Bloomberg Global-Aggregate Total Return Index Value Hedged USD return of 4.20%.
• The Fund’s lower-duration investments benefited during the period as interest rates rose.
• The Fund held a variety of exposures across credit sectors that the sub-advisor deemed to offer attractive yield, and most sectors contributed positively to total returns.
• Additional Tier-1 bonds issued by European banks generated the largest contribution to the Fund’s return, followed by European Collateralized Loan Obligations, which generated the next highest contribution to return.
Cumulative Performance from April 3, 2017 through June 30, 2024
The initial investment, based on a $10,000 investment, is adjusted to reflect the maximum applicable sales charge, if any.
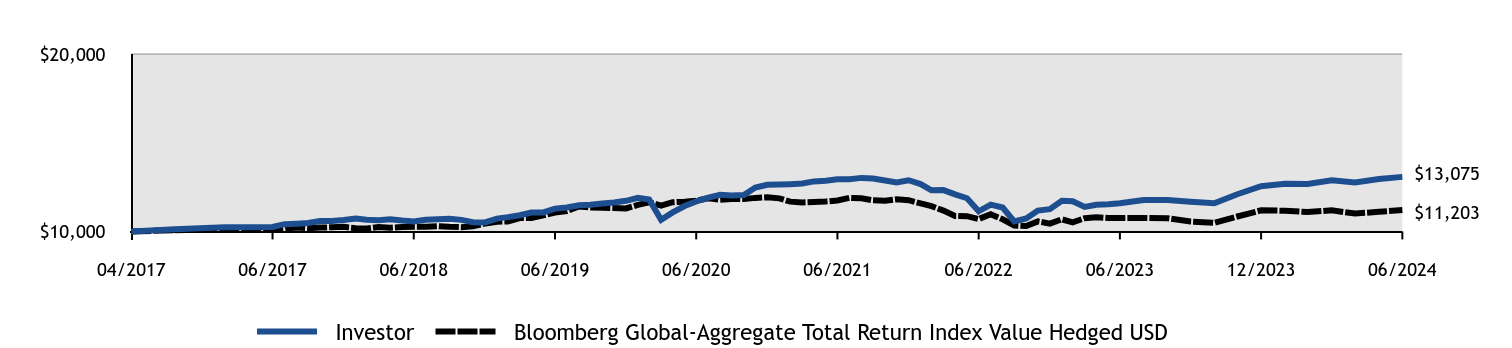
| Investor | Bloomberg Global-Aggregate Total Return Index Value Hedged USD |
|---|
| 04/2017 | $10,000 | $10,000 |
| 04/2017 | $10,120 | $10,068 |
| 05/2017 | $10,241 | $10,127 |
| 06/2017 | $10,248 | $10,098 |
| 07/2017 | $10,411 | $10,131 |
| 08/2017 | $10,438 | $10,224 |
| 09/2017 | $10,474 | $10,177 |
| 10/2017 | $10,584 | $10,219 |
| 11/2017 | $10,589 | $10,235 |
| 12/2017 | $10,639 | $10,258 |
| 01/2018 | $10,732 | $10,185 |
| 02/2018 | $10,657 | $10,162 |
| 03/2018 | $10,632 | $10,246 |
| 04/2018 | $10,690 | $10,208 |
| 05/2018 | $10,615 | $10,246 |
| 06/2018 | $10,564 | $10,265 |
| 07/2018 | $10,660 | $10,268 |
| 08/2018 | $10,687 | $10,300 |
| 09/2018 | $10,714 | $10,260 |
| 10/2018 | $10,652 | $10,240 |
| 11/2018 | $10,516 | $10,290 |
| 12/2018 | $10,505 | $10,439 |
| 01/2019 | $10,723 | $10,550 |
| 02/2019 | $10,805 | $10,562 |
| 03/2019 | $10,913 | $10,751 |
| 04/2019 | $11,063 | $10,758 |
| 05/2019 | $11,073 | $10,913 |
| 06/2019 | $11,287 | $11,066 |
| 07/2019 | $11,354 | $11,153 |
| 08/2019 | $11,479 | $11,406 |
| 09/2019 | $11,509 | $11,353 |
| 10/2019 | $11,577 | $11,333 |
| 11/2019 | $11,632 | $11,320 |
| 12/2019 | $11,726 | $11,297 |
| 01/2020 | $11,896 | $11,501 |
| 02/2020 | $11,802 | $11,641 |
| 03/2020 | $10,660 | $11,460 |
| 04/2020 | $11,069 | $11,646 |
| 05/2020 | $11,432 | $11,679 |
| 06/2020 | $11,691 | $11,737 |
| 07/2020 | $11,901 | $11,865 |
| 08/2020 | $12,063 | $11,779 |
| 09/2020 | $12,026 | $11,822 |
| 10/2020 | $12,056 | $11,823 |
| 11/2020 | $12,479 | $11,891 |
| 12/2020 | $12,631 | $11,927 |
| 01/2021 | $12,642 | $11,863 |
| 02/2021 | $12,665 | $11,679 |
| 03/2021 | $12,705 | $11,633 |
| 04/2021 | $12,821 | $11,663 |
| 05/2021 | $12,855 | $11,689 |
| 06/2021 | $12,939 | $11,746 |
| 07/2021 | $12,942 | $11,892 |
| 08/2021 | $13,018 | $11,868 |
| 09/2021 | $12,982 | $11,756 |
| 10/2021 | $12,871 | $11,725 |
| 11/2021 | $12,765 | $11,809 |
| 12/2021 | $12,886 | $11,761 |
| 01/2022 | $12,668 | $11,576 |
| 02/2022 | $12,319 | $11,422 |
| 03/2022 | $12,330 | $11,176 |
| 04/2022 | $12,086 | $10,876 |
| 05/2022 | $11,871 | $10,861 |
| 06/2022 | $11,136 | $10,696 |
| 07/2022 | $11,510 | $10,968 |
| 08/2022 | $11,346 | $10,682 |
| 09/2022 | $10,570 | $10,339 |
| 10/2022 | $10,735 | $10,304 |
| 11/2022 | $11,176 | $10,566 |
| 12/2022 | $11,257 | $10,442 |
| 01/2023 | $11,733 | $10,682 |
| 02/2023 | $11,698 | $10,512 |
| 03/2023 | $11,382 | $10,745 |
| 04/2023 | $11,498 | $10,800 |
| 05/2023 | $11,537 | $10,758 |
| 06/2023 | $11,594 | $10,751 |
| 07/2023 | $11,767 | $10,755 |
| 08/2023 | $11,778 | $10,741 |
| 09/2023 | $11,670 | $10,556 |
| 10/2023 | $11,588 | $10,481 |
| 11/2023 | $12,098 | $10,841 |
| 12/2023 | $12,550 | $11,188 |
| 01/2024 | $12,688 | $11,166 |
| 02/2024 | $12,673 | $11,089 |
| 03/2024 | $12,879 | $11,189 |
| 04/2024 | $12,763 | $11,009 |
| 05/2024 | $12,950 | $11,107 |
| 06/2024 | $13,075 | $11,203 |
Average Annual Total Returns (%)
| 1 Year | 5 Years | Since Inception (4/3/17) |
|---|
Investor Class Footnote Reference1 | 12.78% | 2.99% | 3.77% |
| Bloomberg Global-Aggregate Total Return Index Value Hedged USD | 4.20% | 0.25% | 1.58% |
| Footnote | Description |
Footnote1 | Return may differ from actual shareholder return due to accounting adjustments for financial reporting purposes. |
Performance shown is historical and is not indicative of future returns. Investment returns and principal value will vary, and shares may be worth more or less at redemption than at original purchase. Performance shown is as of date indicated, and current performance may be lower or higher than the performance data quoted. To obtain performance as of the most recent month end, please visit americanbeaconfunds.com or call 800-967-9009. The graph and table do not reflect the deduction of taxes that a shareholder would pay on fund distributions or redemption of fund shares. The Fund's performance benefited from fee waivers. For more information, visit americanbeaconfunds.com/Performance_Disclaimers.aspx.
| Total Net Assets | $230,637,114 |
| # of Portfolio Holdings | 215 |
| Portfolio Turnover Rate | 58% |
| Total Management Fees Paid | $1,005,004 |
What did the Fund invest in?
Top Ten Holdings - % Net Assets
| Bundesrepublik Deutschland Bundesanleihe, 2.200%, Due 2/15/2034 | 10.7 |
| U.S. Treasury Notes, 4.500%, Due 11/15/2033 | 6.8 |
| U.S. Treasury Notes, 4.000%, Due 2/15/2034 | 4.8 |
| U.S. Treasury Bills, 5.368%, Due 9/17/2024 | 3.9 |
| OCP Euro CLO DAC, 5.284%, Due 4/20/2038 | 1.4 |
| Contego CLO X DAC, 5.290%, Due 5/15/2038 | 1.2 |
| Voya Euro CLO II DAC, 4.866%, Due 7/15/2035 | 1.2 |
| Nationwide Building Society, 10.250%, Due 12/6/2049 | 1.2 |
| Phoenix Group Holdings PLC, 5.750%, Due 4/26/2028 | 1.1 |
| Rothesay Life PLC, 5.000%, Due 10/13/2031 | 0.9 |
Excludes currency forwards.
Asset Allocation - % Investments
| Value | Value |
|---|
| Foreign Corporate Obligations | 46.3 |
| Asset-Backed Obligations | 18.8 |
| U.S. Treasury Obligations | 16.1 |
| Foreign Sovereign Obligations | 11.4 |
| Corporate Obligations | 7.4 |
Excludes currency forwards.
Top Ten Industry Allocations - % Fixed Income
| Value | Value |
|---|
| Auto Manufacturers | 1.2 |
| Telecommunications | 1.5 |
| Savings & Loans | 1.9 |
| Pipelines | 2.2 |
| Diversified Financial Services | 2.4 |
| Insurance | 10.2 |
| Foreign Sovereign Obligations | 11.4 |
| U.S. Treasury Obligations | 16.1 |
| Asset-Backed Obligations | 18.8 |
| Banks | 24.3 |
Top Ten Countries - % Investments
| Value | Value |
|---|
| Mexico | 1.1 |
| Austria | 1.3 |
| Italy | 2.7 |
| Netherlands | 3.4 |
| France | 4.2 |
| Spain | 4.7 |
| Germany | 12.7 |
| Ireland | 19.1 |
| United Kingdom | 21.8 |
| United States | 23.5 |
Excludes foreign exchange holdings.
For additional information about the Fund, including its prospectus, financial statements, holdings, and proxy voting information, please visit www.americanbeaconfunds.com/literature or call 1-800-658-5811
If your financial institution mailed only one copy of this Report to an address shared by more than one account, you can request an individual copy by contacting your financial institution.
Distributed by Resolute Investment Distributors, Inc.
TwentyFour Strategic Income Fund
Annual Shareholder Report - June 30, 2024
TwntyFour SI_Investor 0624
TwentyFour Strategic Income Fund
Annual Shareholder Report - June 30, 2024
This annual shareholder report contains important information about American Beacon TwentyFour Strategic Income Fund for the period of July 1, 2023 to June 30, 2024. You can find additional information about the Fund at www.americanbeaconfunds.com/literature. You can also request this information by contacting us at 800-658-5811.
What were the Fund costs for last year?
(based on a hypothetical $10,000 investment)
| Class Name | Cost of a $10,000 investment | Costs paid as a percentage of a $10,000 investment |
|---|
| R5 | $77 | 0.72% |
How did the Fund perform last year and what affected its performance?
The R5 Class of the Fund returned 12.89% for the twelve months ended June 30, 2024, compared to the Bloomberg Global-Aggregate Total Return Index Value Hedged USD return of 4.20%.
• The Fund’s lower-duration investments benefited during the period as interest rates rose.
• The Fund held a variety of exposures across credit sectors that the sub-advisor deemed to offer attractive yield, and most sectors contributed positively to total returns.
• Additional Tier-1 bonds issued by European banks generated the largest contribution to the Fund’s return, followed by European Collateralized Loan Obligations, which generated the next highest contribution to return.
Cumulative Performance from April 3, 2017 through June 30, 2024
The initial investment, based on a $250,000 investment, is adjusted to reflect the maximum applicable sales charge, if any.
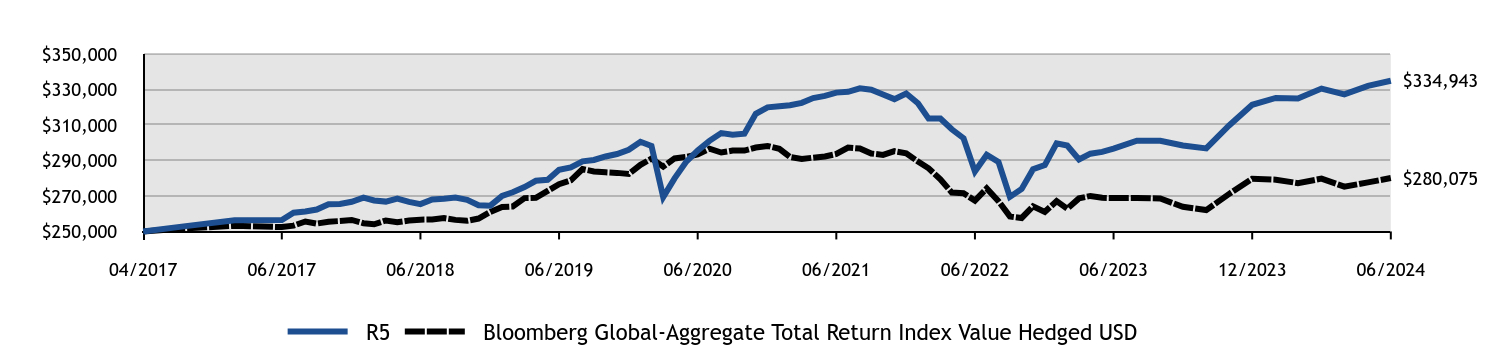
| R5 | Bloomberg Global-Aggregate Total Return Index Value Hedged USD |
|---|
| 04/2017 | $250,000 | $250,000 |
| 04/2017 | $253,000 | $251,695 |
| 05/2017 | $256,265 | $253,165 |
| 06/2017 | $256,452 | $252,456 |
| 07/2017 | $260,535 | $253,286 |
| 08/2017 | $261,202 | $255,594 |
| 09/2017 | $262,351 | $254,414 |
| 10/2017 | $265,368 | $255,487 |
| 11/2017 | $265,500 | $255,883 |
| 12/2017 | $266,728 | $256,455 |
| 01/2018 | $269,052 | $254,624 |
| 02/2018 | $267,436 | $254,050 |
| 03/2018 | $266,810 | $256,157 |
| 04/2018 | $268,527 | $255,204 |
| 05/2018 | $266,665 | $256,157 |
| 06/2018 | $265,395 | $256,634 |
| 07/2018 | $268,060 | $256,704 |
| 08/2018 | $268,464 | $257,493 |
| 09/2018 | $269,124 | $256,509 |
| 10/2018 | $267,852 | $256,007 |
| 11/2018 | $264,731 | $257,260 |
| 12/2018 | $264,532 | $260,976 |
| 01/2019 | $269,998 | $263,740 |
| 02/2019 | $272,065 | $264,057 |
| 03/2019 | $275,027 | $268,786 |
| 04/2019 | $278,540 | $268,946 |
| 05/2019 | $279,077 | $272,817 |
| 06/2019 | $284,701 | $276,642 |
| 07/2019 | $286,092 | $278,819 |
| 08/2019 | $289,505 | $285,142 |
| 09/2019 | $290,269 | $283,821 |
| 10/2019 | $292,239 | $283,331 |
| 11/2019 | $293,617 | $282,998 |
| 12/2019 | $295,986 | $282,418 |
| 01/2020 | $300,527 | $287,514 |
| 02/2020 | $298,196 | $291,033 |
| 03/2020 | $269,372 | $286,504 |
| 04/2020 | $279,909 | $291,142 |
| 05/2020 | $289,346 | $291,967 |
| 06/2020 | $295,561 | $293,424 |
| 07/2020 | $301,058 | $296,631 |
| 08/2020 | $305,442 | $294,482 |
| 09/2020 | $304,564 | $295,557 |
| 10/2020 | $305,092 | $295,579 |
| 11/2020 | $316,321 | $297,265 |
| 12/2020 | $319,930 | $298,179 |
| 01/2021 | $320,517 | $296,579 |
| 02/2021 | $321,131 | $291,966 |
| 03/2021 | $322,488 | $290,816 |
| 04/2021 | $325,158 | $291,576 |
| 05/2021 | $326,369 | $292,227 |
| 06/2021 | $328,245 | $293,652 |
| 07/2021 | $328,695 | $297,302 |
| 08/2021 | $330,672 | $296,706 |
| 09/2021 | $329,843 | $293,905 |
| 10/2021 | $327,166 | $293,136 |
| 11/2021 | $324,574 | $295,227 |
| 12/2021 | $327,759 | $294,030 |
| 01/2022 | $322,282 | $289,410 |
| 02/2022 | $313,600 | $285,561 |
| 03/2022 | $313,646 | $279,405 |
| 04/2022 | $307,582 | $271,896 |
| 05/2022 | $302,539 | $271,521 |
| 06/2022 | $283,806 | $267,401 |
| 07/2022 | $293,256 | $274,212 |
| 08/2022 | $289,177 | $267,053 |
| 09/2022 | $269,476 | $258,480 |
| 10/2022 | $273,937 | $257,596 |
| 11/2022 | $285,022 | $264,160 |
| 12/2022 | $287,383 | $261,042 |
| 01/2023 | $299,674 | $267,055 |
| 02/2023 | $298,422 | $262,795 |
| 03/2023 | $290,535 | $268,622 |
| 04/2023 | $293,829 | $270,006 |
| 05/2023 | $294,851 | $268,942 |
| 06/2023 | $296,703 | $268,782 |
| 07/2023 | $301,168 | $268,869 |
| 08/2023 | $301,090 | $268,531 |
| 09/2023 | $298,438 | $263,900 |
| 10/2023 | $296,789 | $262,027 |
| 11/2023 | $309,593 | $271,036 |
| 12/2023 | $321,396 | $279,698 |
| 01/2024 | $325,218 | $279,149 |
| 02/2024 | $324,901 | $277,234 |
| 03/2024 | $330,525 | $279,734 |
| 04/2024 | $327,287 | $275,230 |
| 05/2024 | $332,044 | $277,665 |
| 06/2024 | $334,943 | $280,075 |
Average Annual Total Returns (%)
| 1 Year | 5 Years | Since Inception (4/3/17) |
|---|
Class R5 Footnote Reference1 | 12.89% | 3.30% | 4.12% |
| Bloomberg Global-Aggregate Total Return Index Value Hedged USD | 4.20% | 0.25% | 1.58% |
| Footnote | Description |
Footnote1 | Return may differ from actual shareholder return due to accounting adjustments for financial reporting purposes. |
Performance shown is historical and is not indicative of future returns. Investment returns and principal value will vary, and shares may be worth more or less at redemption than at original purchase. Performance shown is as of date indicated, and current performance may be lower or higher than the performance data quoted. To obtain performance as of the most recent month end, please visit americanbeaconfunds.com or call 800-967-9009. The graph and table do not reflect the deduction of taxes that a shareholder would pay on fund distributions or redemption of fund shares. The Fund's performance benefited from fee waivers. For more information, visit americanbeaconfunds.com/Performance_Disclaimers.aspx.
| Total Net Assets | $230,637,114 |
| # of Portfolio Holdings | 215 |
| Portfolio Turnover Rate | 58% |
| Total Management Fees Paid | $1,005,004 |
What did the Fund invest in?
Top Ten Holdings - % Net Assets
| Bundesrepublik Deutschland Bundesanleihe, 2.200%, Due 2/15/2034 | 10.7 |
| U.S. Treasury Notes, 4.500%, Due 11/15/2033 | 6.8 |
| U.S. Treasury Notes, 4.000%, Due 2/15/2034 | 4.8 |
| U.S. Treasury Bills, 5.368%, Due 9/17/2024 | 3.9 |
| OCP Euro CLO DAC, 5.284%, Due 4/20/2038 | 1.4 |
| Contego CLO X DAC, 5.290%, Due 5/15/2038 | 1.2 |
| Voya Euro CLO II DAC, 4.866%, Due 7/15/2035 | 1.2 |
| Nationwide Building Society, 10.250%, Due 12/6/2049 | 1.2 |
| Phoenix Group Holdings PLC, 5.750%, Due 4/26/2028 | 1.1 |
| Rothesay Life PLC, 5.000%, Due 10/13/2031 | 0.9 |
Excludes currency forwards.
Asset Allocation - % Investments
| Value | Value |
|---|
| Foreign Corporate Obligations | 46.3 |
| Asset-Backed Obligations | 18.8 |
| U.S. Treasury Obligations | 16.1 |
| Foreign Sovereign Obligations | 11.4 |
| Corporate Obligations | 7.4 |
Excludes currency forwards.
Top Ten Industry Allocations - % Fixed Income
| Value | Value |
|---|
| Auto Manufacturers | 1.2 |
| Telecommunications | 1.5 |
| Savings & Loans | 1.9 |
| Pipelines | 2.2 |
| Diversified Financial Services | 2.4 |
| Insurance | 10.2 |
| Foreign Sovereign Obligations | 11.4 |
| U.S. Treasury Obligations | 16.1 |
| Asset-Backed Obligations | 18.8 |
| Banks | 24.3 |
Top Ten Countries - % Investments
| Value | Value |
|---|
| Mexico | 1.1 |
| Austria | 1.3 |
| Italy | 2.7 |
| Netherlands | 3.4 |
| France | 4.2 |
| Spain | 4.7 |
| Germany | 12.7 |
| Ireland | 19.1 |
| United Kingdom | 21.8 |
| United States | 23.5 |
Excludes foreign exchange holdings.
For additional information about the Fund, including its prospectus, financial statements, holdings, and proxy voting information, please visit www.americanbeaconfunds.com/literature or call 1-800-658-5811
If your financial institution mailed only one copy of this Report to an address shared by more than one account, you can request an individual copy by contacting your financial institution.
Distributed by Resolute Investment Distributors, Inc.
TwentyFour Strategic Income Fund
Annual Shareholder Report - June 30, 2024
TwentyFour Strategic Income Fund
Annual Shareholder Report - June 30, 2024
This annual shareholder report contains important information about American Beacon TwentyFour Strategic Income Fund for the period of July 1, 2023 to June 30, 2024. You can find additional information about the Fund at www.americanbeaconfunds.com/literature. You can also request this information by contacting us at 800-658-5811.
What were the Fund costs for last year?
(based on a hypothetical $10,000 investment)
| Class Name | Cost of a $10,000 investment | Costs paid as a percentage of a $10,000 investment |
|---|
| Y | $85 | 0.80% |
How did the Fund perform last year and what affected its performance?
The Y Class of the Fund returned 12.81% for the twelve months ended June 30, 2024, compared to the Bloomberg Global-Aggregate Total Return Index Value Hedged USD return of 4.20%.
• The Fund’s lower-duration investments benefited during the period as interest rates rose.
• The Fund held a variety of exposures across credit sectors that the sub-advisor deemed to offer attractive yield, and most sectors contributed positively to total returns.
• Additional Tier-1 bonds issued by European banks generated the largest contribution to the Fund’s return, followed by European Collateralized Loan Obligations, which generated the next highest contribution to return.
Cumulative Performance from April 3, 2017 through June 30, 2024
The initial investment, based on a $100,000 investment, is adjusted to reflect the maximum applicable sales charge, if any.

| Y | Bloomberg Global-Aggregate Total Return Index Value Hedged USD |
|---|
| 04/2017 | $100,000 | $100,000 |
| 04/2017 | $101,200 | $100,678 |
| 05/2017 | $102,506 | $101,266 |
| 06/2017 | $102,581 | $100,982 |
| 07/2017 | $104,113 | $101,314 |
| 08/2017 | $104,482 | $102,238 |
| 09/2017 | $104,839 | $101,766 |
| 10/2017 | $106,046 | $102,195 |
| 11/2017 | $106,099 | $102,353 |
| 12/2017 | $106,590 | $102,582 |
| 01/2018 | $107,520 | $101,850 |
| 02/2018 | $106,874 | $101,620 |
| 03/2018 | $106,624 | $102,463 |
| 04/2018 | $107,206 | $102,081 |
| 05/2018 | $106,461 | $102,463 |
| 06/2018 | $106,058 | $102,654 |
| 07/2018 | $107,019 | $102,682 |
| 08/2018 | $107,180 | $102,997 |
| 09/2018 | $107,550 | $102,603 |
| 10/2018 | $106,935 | $102,403 |
| 11/2018 | $105,687 | $102,904 |
| 12/2018 | $105,607 | $104,390 |
| 01/2019 | $107,794 | $105,496 |
| 02/2019 | $108,621 | $105,623 |
| 03/2019 | $109,805 | $107,515 |
| 04/2019 | $111,321 | $107,579 |
| 05/2019 | $111,425 | $109,127 |
| 06/2019 | $113,675 | $110,657 |
| 07/2019 | $114,342 | $111,528 |
| 08/2019 | $115,596 | $114,057 |
| 09/2019 | $115,902 | $113,528 |
| 10/2019 | $116,690 | $113,332 |
| 11/2019 | $117,241 | $113,199 |
| 12/2019 | $118,189 | $112,967 |
| 01/2020 | $120,006 | $115,006 |
| 02/2020 | $119,074 | $116,413 |
| 03/2020 | $107,542 | $114,602 |
| 04/2020 | $111,757 | $116,457 |
| 05/2020 | $115,415 | $116,787 |
| 06/2020 | $118,017 | $117,370 |
| 07/2020 | $120,114 | $118,653 |
| 08/2020 | $121,868 | $117,793 |
| 09/2020 | $121,517 | $118,223 |
| 10/2020 | $121,728 | $118,231 |
| 11/2020 | $126,104 | $118,906 |
| 12/2020 | $127,548 | $119,272 |
| 01/2021 | $127,783 | $118,632 |
| 02/2021 | $128,029 | $116,786 |
| 03/2021 | $128,572 | $116,326 |
| 04/2021 | $129,640 | $116,630 |
| 05/2021 | $130,124 | $116,891 |
| 06/2021 | $130,994 | $117,461 |
| 07/2021 | $131,055 | $118,921 |
| 08/2021 | $131,846 | $118,682 |
| 09/2021 | $131,514 | $117,562 |
| 10/2021 | $130,443 | $117,255 |
| 11/2021 | $129,405 | $118,091 |
| 12/2021 | $130,800 | $117,612 |
| 01/2022 | $128,486 | $115,764 |
| 02/2022 | $125,011 | $114,224 |
| 03/2022 | $125,152 | $111,762 |
| 04/2022 | $122,726 | $108,758 |
| 05/2022 | $120,584 | $108,609 |
| 06/2022 | $113,087 | $106,960 |
| 07/2022 | $116,869 | $109,685 |
| 08/2022 | $115,361 | $106,821 |
| 09/2022 | $107,476 | $103,392 |
| 10/2022 | $109,136 | $103,038 |
| 11/2022 | $113,699 | $105,664 |
| 12/2022 | $114,517 | $104,417 |
| 01/2023 | $119,439 | $106,822 |
| 02/2023 | $118,938 | $105,118 |
| 03/2023 | $115,779 | $107,449 |
| 04/2023 | $117,099 | $108,002 |
| 05/2023 | $117,508 | $107,577 |
| 06/2023 | $118,250 | $107,513 |
| 07/2023 | $120,018 | $107,548 |
| 08/2023 | $119,987 | $107,412 |
| 09/2023 | $118,924 | $105,560 |
| 10/2023 | $118,113 | $104,811 |
| 11/2023 | $123,393 | $108,414 |
| 12/2023 | $127,967 | $111,879 |
| 01/2024 | $129,498 | $111,660 |
| 02/2024 | $129,371 | $110,894 |
| 03/2024 | $131,470 | $111,894 |
| 04/2024 | $130,327 | $110,092 |
| 05/2024 | $132,233 | $111,066 |
| 06/2024 | $133,394 | $112,030 |
Average Annual Total Returns (%)
| 1 Year | 5 Years | Since Inception (4/3/17) |
|---|
Class Y Footnote Reference1 | 12.81% | 3.25% | 4.06% |
| Bloomberg Global-Aggregate Total Return Index Value Hedged USD | 4.20% | 0.25% | 1.58% |
| Footnote | Description |
Footnote1 | Return may differ from actual shareholder return due to accounting adjustments for financial reporting purposes. |
Performance shown is historical and is not indicative of future returns. Investment returns and principal value will vary, and shares may be worth more or less at redemption than at original purchase. Performance shown is as of date indicated, and current performance may be lower or higher than the performance data quoted. To obtain performance as of the most recent month end, please visit americanbeaconfunds.com or call 800-967-9009. The graph and table do not reflect the deduction of taxes that a shareholder would pay on fund distributions or redemption of fund shares. The Fund's performance benefited from fee waivers. For more information, visit americanbeaconfunds.com/Performance_Disclaimers.aspx.
| Total Net Assets | $230,637,114 |
| # of Portfolio Holdings | 215 |
| Portfolio Turnover Rate | 58% |
| Total Management Fees Paid | $1,005,004 |
What did the Fund invest in?
Top Ten Holdings - % Net Assets
| Bundesrepublik Deutschland Bundesanleihe, 2.200%, Due 2/15/2034 | 10.7 |
| U.S. Treasury Notes, 4.500%, Due 11/15/2033 | 6.8 |
| U.S. Treasury Notes, 4.000%, Due 2/15/2034 | 4.8 |
| U.S. Treasury Bills, 5.368%, Due 9/17/2024 | 3.9 |
| OCP Euro CLO DAC, 5.284%, Due 4/20/2038 | 1.4 |
| Contego CLO X DAC, 5.290%, Due 5/15/2038 | 1.2 |
| Voya Euro CLO II DAC, 4.866%, Due 7/15/2035 | 1.2 |
| Nationwide Building Society, 10.250%, Due 12/6/2049 | 1.2 |
| Phoenix Group Holdings PLC, 5.750%, Due 4/26/2028 | 1.1 |
| Rothesay Life PLC, 5.000%, Due 10/13/2031 | 0.9 |
Excludes currency forwards.
Asset Allocation - % Investments
| Value | Value |
|---|
| Foreign Corporate Obligations | 46.3 |
| Asset-Backed Obligations | 18.8 |
| U.S. Treasury Obligations | 16.1 |
| Foreign Sovereign Obligations | 11.4 |
| Corporate Obligations | 7.4 |
Excludes currency forwards.
Top Ten Industry Allocations - % Fixed Income
| Value | Value |
|---|
| Auto Manufacturers | 1.2 |
| Telecommunications | 1.5 |
| Savings & Loans | 1.9 |
| Pipelines | 2.2 |
| Diversified Financial Services | 2.4 |
| Insurance | 10.2 |
| Foreign Sovereign Obligations | 11.4 |
| U.S. Treasury Obligations | 16.1 |
| Asset-Backed Obligations | 18.8 |
| Banks | 24.3 |
Top Ten Countries - % Investments
| Value | Value |
|---|
| Mexico | 1.1 |
| Austria | 1.3 |
| Italy | 2.7 |
| Netherlands | 3.4 |
| France | 4.2 |
| Spain | 4.7 |
| Germany | 12.7 |
| Ireland | 19.1 |
| United Kingdom | 21.8 |
| United States | 23.5 |
Excludes foreign exchange holdings.
For additional information about the Fund, including its prospectus, financial statements, holdings, and proxy voting information, please visit www.americanbeaconfunds.com/literature or call 1-800-658-5811
If your financial institution mailed only one copy of this Report to an address shared by more than one account, you can request an individual copy by contacting your financial institution.
Distributed by Resolute Investment Distributors, Inc.
TwentyFour Strategic Income Fund
Annual Shareholder Report - June 30, 2024
Item 2. Code of Ethics
The registrant adopted a code of ethics (the “Code”) that applies to the registrant’s Principal Executive Officer and Principal Financial Officer. The registrant amended the Code on June 14, 2024 to update the name of the Principal Executive Officer. The registrant has not granted any waivers from the provisions of the Code during the period covered by the shareholder reports presented in Item 1. The Code is filed herewith as Exhibit 99.CODE ETH.
Item 3. Audit Committee Financial Expert
The registrant’s Board of Trustees of the Trust has determined that Claudia Holz, a member of the Trust’s Audit and Compliance Committee, is the “audit committee financial expert” as defined in Form N-CSR. Ms. Claudia is considered “independent” as defined in Item 3 of Form N-CSR.
Item 4. Principal Account Fees and Services
The registrant has engaged its principal accountant to perform audit services, audit-related services, tax services and other services during the past two fiscal years. “Audit services” refer to performing an audit of the registrant’s annual financial statements or services that are normally provided by the accountant in connection with statutory and regulatory filings or engagements for those fiscal years. “Audit-related services” refer to the assurance and related services by the principal accountant that are reasonably related to the performance of the audit. “Tax services” refer to professional services rendered by the principal accountant for tax compliance, tax advice, and tax planning. “Other services” refer to all other fees category would consist of service related to internal control reviews, strategy, and other consulting, financial information systems design and implementation, consulting on other information systems, and other tax services unrelated to the registrant. The following table details the aggregate fees billed for each of the last two fiscal years for audit fees, audit-related fees, tax fees, and all other fees by the principal accountant.
| | | | |
| (a) | | | |
| |
Audit Fees | | Fiscal Year
Ended | |
$278,000 | | | 6/30/2023 | |
$281,468 | | | 6/30/2024 | |
| |
| (b) | | | |
Audit Related Fees | | Fiscal Year
Ended | |
$0 | | | 6/30/2023 | |
$0 | | | 6/30/2024 | |
| |
| (c) | | | |
Tax Fees(1) | | Fiscal Year
Ended | |
$56,485 | | | 6/30/2023 | |
$54,375 | | | 6/30/2024 | |
| |
| (d) | | | |
All Other Fees | | Fiscal Year
Ended | |
$0 | | | 6/30/2023 | |
$0 | | | 6/30/2024 | |
(1) “Tax Fees” are the aggregate fees billed for professional services for tax advice, tax compliance, tax planning, filing assistance for EU reclaims and PFIC tax services. These fees include international, federal, state, and excise tax reviews.
(e)(1) Pursuant to its charter, the Trust’s Audit and Compliance Committee shall have the following duties and powers pertaining to pre-approval of audit and non-audit services provided by the registrant’s principal accountant:
| | • | | to approve, prior to appointment, the engagement of auditors to annually audit and provide their opinion on the Trusts’ financial statements, and, in connection therewith, reviewing and evaluating matters potentially affecting the independence and capabilities of the auditors; |
| | • | | to approve, prior to appointment, the engagement of the auditors to provide non-audit services to the Trusts, an investment adviser to any series of the Trusts or any entity controlling, controlled by, or under common control with an investment adviser (“adviser affiliate”) that provides ongoing services to the Trusts, if the engagement relates directly to the operations and financial reporting of the Trusts; |
| | • | | to consider whether the non-audit services provided by a Trust’s auditor to an investment adviser or any adviser affiliate that provides ongoing services to a series of the Trusts, which services were not pre-approved by the Committee, are compatible with maintaining the auditor’s independence; |
| | • | | to review the arrangements for and scope of the annual audit and any special audits; and |
| | • | | to review and approving the fees proposed to be charged to the Trusts by the auditors for each audit and non-audit service. |
The Audit and Compliance Committee may delegate any portion of its authority, including the authority to grant pre-approvals of audit and permitted non-audit services, to a subcommittee of one or more members. Any decisions of the subcommittee to grant pre-approvals shall be presented to the full audit committee at its next regularly scheduled meeting.
(e)(2) None of the fees disclosed in paragraphs (b) through (d) above were approved by the audit committee pursuant to paragraph (c)(7)(i)(C) of Rule 2-01 of Regulation S-X.
(f) Not applicable.
(g) Aggregate Non-Audit Fees for Services Rendered to the:
| | | | | | | | | | | | | | | | | | |
Registrant | | Adviser | | | | | Adviser’s Affiliates Providing
Ongoing Services to Registrant | | | | | | Fiscal Year
Ended | |
| $56,485 | | $0 | | | | | | | N/A | | | | | | | | 6/30/2023 | |
| $54,375 | | $32,969 | | | | | | | N/A | | | | | | | | 6/30/2024 | |
(h) Not applicable.
Item 5. Audit Committee of Listed Registrants
Not applicable.
Item 6. Investments
| (a) | The schedules of investments for each series of the Trust are included in the shareholder reports presented in Item 7. |
Financial Statements and Other Information
Name of registrant: American Beacon Funds
Date of fiscal year end: June 30, 2024
Date of reporting period: June 30, 2024
Item 7. Financial Statements and Financial Highlights for Open-End Management Investment Companies
American Beacon Funds
Although information has been compiled from reliable sources, American Beacon Advisors, Inc. makes no representation as to the completeness or accuracy of the statements contained herein. All information is as of the end of the reporting period, unless noted otherwise, and is subject to change. Each Fund’s portfolio composition will change depending on economic and market conditions.
American Beacon Funds | June 30, 2024 |
Contents
| | | | |
Additional Fund Information | | | Back Cover | |
American Beacon ARK Transformational Innovation FundSM
Report of Independent Registered Public Accounting Firm
To the Board of Trustees of American Beacon Funds and Shareholders of American Beacon ARK Transformational Innovation Fund
Opinion on the Financial Statements
We have audited the accompanying statement of assets and liabilities, including the schedule of investments, of American Beacon ARK Transformational Innovation Fund (one of the funds constituting American Beacon Funds, referred to hereafter as the “Fund”) as of June 30, 2024, the related statement of operations for the year ended June 30, 2024, the statement of changes in net assets for each of the two years in the period ended June 30, 2024, including the related notes, and the financial highlights for each of the periods indicated therein (collectively referred to as the “financial statements”). In our opinion, the financial statements present fairly, in all material respects, the financial position of the Fund as of June 30, 2024, the results of its operations for the year then ended, the changes in its net assets for each of the two years in the period ended June 30, 2024 and the financial highlights for each of the periods indicated therein in conformity with accounting principles generally accepted in the United States of America.
Basis for Opinion
These financial statements are the responsibility of the Fund’s management. Our responsibility is to express an opinion on the Fund’s financial statements based on our audits. We are a public accounting firm registered with the Public Company Accounting Oversight Board (United States) (PCAOB) and are required to be independent with respect to the Fund in accordance with the U.S. federal securities laws and the applicable rules and regulations of the Securities and Exchange Commission and the PCAOB.
We conducted our audits of these financial statements in accordance with the standards of the PCAOB. Those standards require that we plan and perform the audit to obtain reasonable assurance about whether the financial statements are free of material misstatement, whether due to error or fraud.
Our audits included performing procedures to assess the risks of material misstatement of the financial statements, whether due to error or fraud, and performing procedures that respond to those risks. Such procedures included examining, on a test basis, evidence regarding the amounts and disclosures in the financial statements. Our audits also included evaluating the accounting principles used and significant estimates made by management, as well as evaluating the overall presentation of the financial statements. Our procedures included confirmation of securities owned as of June 30, 2024 by correspondence with the custodians and brokers; when replies were not received from brokers, we performed other auditing procedures. We believe that our audits provide a reasonable basis for our opinion.
/s/PricewaterhouseCoopers LLP
Boston, Massachusetts
August 29, 2024
We have served as the auditor of one or more investment companies in the American Beacon family of funds since 2016.
1
American Beacon ARK Transformational Innovation FundSM
Schedule of Investments
June 30, 2024
| | | | | | | | | | | | | | | |
| | | |
| | | Shares | | | | Fair Value |
| | | | | | | |
| | | |
| COMMON STOCKS - 95.16% | | | | | | |
| | | |
| Communication Services - 22.73% | | | | | | |
| | | |
| Entertainment - 16.21% | | | | | | |
| ROBLOX Corp., Class AA | | | | 321,130 | | | | | | | | | $ | 11,949,247 | |
| Roku, Inc.A | | | | 319,127 | | | | | | | | | | 19,125,281 | |
| | | | | | | | | | | | | | | |
| | | | | | | | | | | | | | 31,074,528 | |
| | | | | | | | | | | | | | | |
| | | | | | | | | | | | | | | |
| | | |
| Interactive Media & Services - 4.26% | | | | | | |
| Meta Platforms, Inc., Class A | | | | 8,646 | | | | | | | | | | 4,359,486 | |
| Pinterest, Inc., Class AA | | | | 86,190 | | | | | | | | | | 3,798,394 | |
| | | | | | | | | | | | | | | |
| | | | | | | | | | | | | | 8,157,880 | |
| | | | | | | | | | | | | | | |
| | | | | | | | | | | | | | | |
| | | |
| Media - 2.26% | | | | | | |
| Trade Desk, Inc., Class AA | | | | 44,414 | | | | | | | | | | 4,337,915 | |
| | | | | | | | | | | | | | | |
| | | | | | | | | | | | | | | |
Total Communication Services | | | | | | | | | | | | | | 43,570,323 | |
| | | | | | | | | | | | | | | |
| | | | | | | | | | | | | | | |
| | | |
| Consumer Discretionary - 15.89% | | | | | | |
| | | |
| Automobiles - 13.58% | | | | | | |
| Tesla, Inc.A | | | | 131,492 | | | | | | | | | | 26,019,637 | |
| | | | | | | | | | | | | | | |
| | | | | | | | | | | | | | | |
| | | |
| Hotels, Restaurants & Leisure - 2.31% | | | | | | |
| DraftKings, Inc., Class AA | | | | 116,156 | | | | | | | | | | 4,433,674 | |
| | | | | | | | | | | | | | | |
| | | | | | | | | | | | | | | |
Total Consumer Discretionary | | | | | | | | | | | | | | 30,453,311 | |
| | | | | | | | | | | | | | | |
| | | | | | | | | | | | | | | |
| | | |
| Financials - 21.24% | | | | | | |
| | | |
| Capital Markets - 14.40% | | | | | | |
| Coinbase Global, Inc., Class AA | | | | 79,310 | | | | | | | | | | 17,625,061 | |
| Robinhood Markets, Inc., Class AA | | | | 439,722 | | | | | | | | | | 9,986,087 | |
| | | | | | | | | | | | | | | |
| | | | | | | | | | | | | | 27,611,148 | |
| | | | | | | | | | | | | | | |
| | | | | | | | | | | | | | | |
| | | |
| Consumer Finance - 0.99% | | | | | | |
| SoFi Technologies, Inc.A B | | | | 287,952 | | | | | | | | | | 1,903,363 | |
| | | | | | | | | | | | | | | |
| | | | | | | | | | | | | | | |
| | | |
| Financial Services - 5.85% | | | | | | |
| Block, Inc.A | | | | 173,751 | | | | | | | | | | 11,205,202 | |
| | | | | | | | | | | | | | | |
| | | | | | | | | | | | | | | |
Total Financials | | | | | | | | | | | | | | 40,719,713 | |
| | | | | | | | | | | | | | | |
| | | | | | | | | | | | | | | |
| | | |
| Health Care - 16.59% | | | | | | |
| | | |
| Biotechnology - 12.83% | | | | | | |
| Beam Therapeutics, Inc.A | | | | 111,525 | | | | | | | | | | 2,613,031 | |
| Intellia Therapeutics, Inc.A | | | | 267,290 | | | | | | | | | | 5,981,950 | |
| Moderna, Inc.A | | | | 20,330 | | | | | | | | | | 2,414,188 | |
| Natera, Inc.A | | | | 7,495 | | | | | | | | | | 811,634 | |
| Prime Medicine, Inc.A B | | | | 76,427 | | | | | | | | | | 392,835 | |
| Recursion Pharmaceuticals, Inc., Class AA B | | | | 573,851 | | | | | | | | | | 4,303,882 | |
| Twist Bioscience Corp.A | | | | 105,048 | | | | | | | | | | 5,176,765 | |
| Veracyte, Inc.A | | | | 131,052 | | | | | | | | | | 2,839,897 | |
| Verve Therapeutics, Inc.A | | | | 10,622 | | | | | | | | | | 51,835 | |
| | | | | | | | | | | | | | | |
| | | | | | | | | | | | | | 24,586,017 | |
| | | | | | | | | | | | | | | |
| | | | | | | | | | | | | | | |
| | | |
| Health Care Equipment & Supplies - 0.32% | | | | | | |
| Cerus Corp.A | | | | 349,620 | | | | | | | | | | 615,331 | |
| | | | | | | | | | | | | | | |
| | | | | | | | | | | | | | | |
| | | |
| Health Care Technology - 0.71% | | | | | | |
| Teladoc Health, Inc.A | | | | 139,780 | | | | | | | | | | 1,367,049 | |
| | | | | | | | | | | | | | | |
| | | | | | | | | | | | | | | |
See accompanying notes
2
American Beacon ARK Transformational Innovation FundSM
Schedule of Investments
June 30, 2024
| | | | | | | | | | | | | | | |
| | | |
| | | Shares | | | | Fair Value |
| | | | | | | |
| | | |
| COMMON STOCKS - 95.16% (continued) | | | | | | |
| | | |
| Health Care - 16.59% (continued) | | | | | | |
| | | |
| Life Sciences Tools & Services - 2.73% | | | | | | |
| 10X Genomics, Inc., Class AA | | | | 222,240 | | | | | | | | | $ | 4,322,568 | |
| Pacific Biosciences of California, Inc.A B | | | | 669,971 | | | | | | | | | | 917,860 | |
| | | | | | | | | | | | | | | |
| | | | | | | | | | | | | | 5,240,428 | |
| | | | | | | | | | | | | | | |
| | | | | | | | | | | | | | | |
Total Health Care | | | | | | | | | | | | | | 31,808,825 | |
| | | | | | | | | | | | | | | |
| | | | | | | | | | | | | | | |
| | | |
| Industrials - 0.93% | | | | | | |
| | | |
| Aerospace & Defense - 0.93% | | | | | | |
| Archer Aviation, Inc., Class AA B | | | | 507,527 | | | | | | | | | | 1,786,495 | |
| | | | | | | | | | | | | | | |
| | | | | | | | | | | | | | | |
| | | |
| Information Technology - 17.78% | | | | | | |
| | | |
| Semiconductors & Semiconductor Equipment - 2.02% | | | | | | |
| Teradyne, Inc. | | | | 26,075 | | | | | | | | | | 3,866,662 | |
| | | | | | | | | | | | | | | |
| | | | | | | | | | | | | | | |
| | | |
| Software - 15.76% | | | | | | |
| PagerDuty, Inc.A | | | | 277,213 | | | | | | | | | | 6,356,494 | |
| Palantir Technologies, Inc., Class AA | | | | 292,442 | | | | | | | | | | 7,407,556 | |
| UiPath, Inc., Class AA | | | | 620,236 | | | | | | | | | | 7,864,593 | |
| Unity Software, Inc.A | | | | 256,648 | | | | | | | | | | 4,173,096 | |
| Zoom Video Communications, Inc., Class AA | | | | 74,615 | | | | | | | | | | 4,416,462 | |
| | | | | | | | | | | | | | | |
| | | | | | | | | | | | | | 30,218,201 | |
| | | | | | | | | | | | | | | |
| | | | | | | | | | | | | | | |
Total Information Technology | | | | | | | | | | | | | | 34,084,863 | |
| | | | | | | | | | | | | | | |
| | | | | | | | | | | | | | | |
Total Common Stocks (Cost $175,443,047) | | | | | | | | | | | | | | 182,423,530 | |
| | | | | | | | | | | | | | | |
| | | | | | | | | | | | | | | |
| | | |
| FOREIGN COMMON STOCKS - 8.49% | | | | | | |
| | | |
| Health Care - 4.97% | | | | | | |
| | | |
| Biotechnology - 4.97% | | | | | | |
| CRISPR Therapeutics AGA B | | | | 176,487 | | | | | | | | | | 9,532,063 | |
| | | | | | | | | | | | | | | |
| | | | | | | | | | | | | | | |
| | | |
| Information Technology - 3.52% | | | | | | |
| | | |
| IT Services - 3.52% | | | | | | |
| Shopify, Inc., Class AA | | | | 102,050 | | | | | | | | | | 6,740,403 | |
| | | | | | | | | | | | | | | |
| | | | | | | | | | | | | | | |
Total Foreign Common Stocks (Cost $11,825,333) | | | | | | | | | | | | | | 16,272,466 | |
| | | | | | | | | | | | | | | |
| | | | | | | | | | | | | | | |
| | | |
| SHORT-TERM INVESTMENTS - 0.39% (Cost $748,964) | | | | | | |
| | | |
| Investment Companies - 0.39% | | | | | | |
| American Beacon U.S. Government Money Market Select Fund, 5.18%C D | | | | 748,964 | | | | | | | | | | 748,964 | |
| | | | | | | | | | | | | | | |
| | | | | | | | | | | | | | | |
| | | |
| SECURITIES LENDING COLLATERAL - 1.97% (Cost $3,772,602) | | | | | | |
| | | |
| Investment Companies - 1.97% | | | | | | |
| American Beacon U.S. Government Money Market Select Fund, 5.18%C D | | | | 3,772,602 | | | | | | | | | | 3,772,602 | |
| | | | | | | | | | | | | | | |
| | | | | | | | | | | | | | | |
TOTAL INVESTMENTS - 106.01% (Cost $191,789,946) | | | | | | | | | | | | | | 203,217,562 | |
LIABILITIES, NET OF OTHER ASSETS - (6.01%) | | | | | | | | | | | | | | (11,524,587 | ) |
| | | | | | | | | | | | | | | |
TOTAL NET ASSETS - 100.00% | | | | | | | | | | | | | $ | 191,692,975 | |
| | | | | | | | | | | | | | | |
| | | | | | | |
| Percentages are stated as a percent of net assets. | | | | | | | | | | | | | | | |
A Non-income producing security.
B All or a portion of this security is on loan, collateralized by either cash and/or U.S. Treasuries, at June 30, 2024 (Note 8).
C The Fund is affiliated by having the same investment advisor.
D 7-day yield.
See accompanying notes
3
American Beacon ARK Transformational Innovation FundSM
Schedule of Investments
June 30, 2024
The Fund’s investments are summarized by level based on the inputs used to determine their values. As of June 30, 2024, the investments were classified as described below:
| | | | | | | | | | | | | | | | | | | | | | | | | | | | |
ARK Transformational Innovation Fund | | Level 1 | | | | | | Level 2 | | | | | | Level 3 | | | | | | Total | |
Assets | | | | | | | | | | | | | | | | | | | | | | | | | | | | |
Common Stocks | | $ | 182,423,530 | | | | | | | $ | - | | | | | | | $ | - | | | | | | | $ | 182,423,530 | |
Foreign Common Stocks | | | 16,272,466 | | | | | | | | - | | | | | | | | - | | | | | | | | 16,272,466 | |
Short-Term Investments | | | 748,964 | | | | | | | | - | | | | | | | | - | | | | | | | | 748,964 | |
Securities Lending Collateral | | | 3,772,602 | | | | | | | | - | | | | | | | | - | | | | | | | | 3,772,602 | |
| | | | | | | | | | | | | | | | | | | | | | | | | | | | |
Total Investments in Securities - Assets | | $ | 203,217,562 | | | | | | | $ | - | | | | | | | $ | - | | | | | | | $ | 203,217,562 | |
| | | | | | | | | | | | | | | | | | | | | | | | | | | | |
U.S. GAAP requires transfers between all levels to/from level 3 be disclosed. During the year ended June 30, 2024, there were no transfers into or out of Level 3.
See accompanying notes
4
American Beacon ARK Transformational Innovation FundSM
Statement of Assets and Liabilities
June 30, 2024
| | | | |
Assets: | |
Investments in unaffiliated securities, at fair value† § | | $ | 198,695,996 | |
Investments in affiliated securities, at fair value‡ | | | 4,521,566 | |
Dividends and interest receivable | | | 8,740 | |
Receivable for investments sold | | | 232,365 | |
Receivable for fund shares sold | | | 86,739 | |
Receivable for tax reclaims | | | 99,869 | |
Prepaid expenses | | | 46,270 | |
| | | | |
Total assets | | | 203,691,545 | |
| | | | |
Liabilities: | |
Payable for investments purchased | | | 250,319 | |
Payable for fund shares redeemed | | | 7,358,212 | |
Payable for expense recoupment (Note 2) | | | 27,793 | |
Cash due to custodian | | | 284,642 | |
Management and sub-advisory fees payable (Note 2) | | | 159,302 | |
Service fees payable (Note 2) | | | 28,981 | |
Transfer agent fees payable (Note 2) | | | 13,404 | |
Payable upon return of securities loaned (Note 8)§ | | | 3,772,602 | |
Custody and fund accounting fees payable | | | 22,122 | |
Professional fees payable | | | 58,622 | |
Trustee fees payable (Note 2) | | | 1,179 | |
Payable for prospectus and shareholder reports | | | 19,541 | |
Other liabilities | | | 1,851 | |
| | | | |
Total liabilities | | | 11,998,570 | |
| | | | |
Commitments and contingent liabilities (Note 2) | | | | |
| | | | |
Net assets | | $ | 191,692,975 | |
| | | | |
Analysis of net assets: | |
Paid-in-capital | | $ | 619,989,799 | |
Total distributable earnings (deficits)A | | | (428,296,824 | ) |
| | | | |
Net assets | | $ | 191,692,975 | |
| | | | |
Shares outstanding at no par value (unlimited shares authorized): | |
R5 Class | | | 204,133 | |
| | | | |
Y Class | | | 9,711,978 | |
| | | | |
Investor Class | | | 3,828,570 | |
| | | | |
A Class | | | 1,346,729 | |
| | | | |
C Class | | | 830,748 | |
| | | | |
R6 Class | | | 192,569 | |
| | | | |
Net assets: | |
R5 Class | | $ | 2,467,952 | |
| | | | |
Y Class | | $ | 116,564,161 | |
| | | | |
Investor Class | | $ | 45,111,990 | |
| | | | |
A Class | | $ | 15,827,888 | |
| | | | |
C Class | | $ | 9,397,516 | |
| | | | |
R6 Class | | $ | 2,323,468 | |
| | | | |
Net asset value, offering and redemption price per share: | |
R5 Class | | $ | 12.09 | |
| | | | |
Y Class | | $ | 12.00 | |
| | | | |
Investor Class | | $ | 11.78 | |
| | | | |
A Class | | $ | 11.75 | |
| | | | |
A Class (offering price) | | $ | 12.47 | |
| | | | |
C Class | | $ | 11.31 | |
| | | | |
R6 Class | | $ | 12.07 | |
| | | | |
| |
† Cost of investments in unaffiliated securities | | $ | 187,268,380 | |
‡ Cost of investments in affiliated securities | | $ | 4,521,566 | |
§ Fair value of securities on loan | | $ | 12,695,570 | |
| |
A The Fund’s investments in affiliated securities did not have unrealized appreciation (depreciation) at year end. | | | | |
See accompanying notes
5
American Beacon ARK Transformational Innovation FundSM
Statement of Operations
For the period ended June 30, 2024
| | | | |
| | | ARK
Transformational
Innovation Fund | |
Investment income: | | | | |
Dividend income from unaffiliated securities | | $ | 18,370 | |
Dividend income from affiliated securities (Note 2) | | | 191,698 | |
Income derived from securities lending (Note 8) | | | 213,921 | |
| | | | |
Total investment income | | | 423,989 | |
| | | | |
Expenses: | | | | |
Management and sub-advisory fees (Note 2) | | | 2,331,958 | |
Transfer agent fees: | | | | |
R5 Class (Note 2) | | | 3,217 | |
Y Class (Note 2) | | | 172,456 | |
Investor Class | | | 4,037 | |
A Class | | | 1,017 | |
C Class | | | 632 | |
R6 Class | | | 746 | |
Custody and fund accounting fees | | | 67,704 | |
Professional fees | | | 109,133 | |
Registration fees and expenses | | | 99,225 | |
Service fees (Note 2): | | | | |
Investor Class | | | 212,126 | |
A Class | | | 36,773 | |
C Class | | | 25,963 | |
Distribution fees (Note 2): | | | | |
A Class | | | 50,034 | |
C Class | | | 112,439 | |
Prospectus and shareholder report expenses | | | 26,756 | |
Trustee fees (Note 2) | | | 26,429 | |
Loan expense (Note 2) | | | 3,347 | |
Line of credit interest expense (Note 9) | | | 2,215 | |
Other expenses | | | 65,746 | |
| | | | |
Total expenses | | | 3,351,953 | |
| | | | |
Net fees waived and expenses (reimbursed) (Note 2) | | | (255,087 | ) |
| | | | |
Net expenses | | | 3,096,866 | |
| | | | |
Net investment (loss) | | | (2,672,877 | ) |
| | | | |
| |
Realized and unrealized gain (loss) from investments: | | | | |
Net realized (loss) from: | | | | |
Investments in unaffiliated securitiesA | | | (201,232,005 | ) |
Change in net unrealized appreciation (depreciation) of: | | | | |
Investments in unaffiliated securitiesB | | | 207,152,039 | |
Foreign currency transactions | | | (7 | ) |
| | | | |
Net gain from investments | | | 5,920,027 | |
| | | | |
Net increase in net assets resulting from operations | | $ | 3,247,150 | |
| | | | |
|
A The Fund did not recognize net realized gains (losses) from the sale of investments in affiliated securities. | |
B The Fund’s investments in affiliated securities did not have a change in unrealized appreciation (depreciation) at year end. | |
See accompanying notes
6
American Beacon ARK Transformational Innovation FundSM
Statement of Changes in Net Assets
| | | | | | | | | | | | |
| | | Year Ended
June 30, 2024 | | | | | | Year Ended
June 30, 2023 | |
Increase (decrease) in net assets: | | | | | | | | | | | | |
Operations: | | | | | | | | | | | | |
Net investment (loss) | | $ | (2,672,877 | ) | | | | | | $ | (2,839,687 | ) |
Net realized (loss) from investments in unaffiliated securities | | | (201,232,005 | ) | | | | | | | (181,122,286 | ) |
Change in net unrealized appreciation of investments in unaffiliated securities, and foreign currency transactions | | | 207,152,032 | | | | | | | | 208,197,255 | |
| | | | | | | | | | | | |
Net increase in net assets resulting from operations | | | 3,247,150 | | | | | | | | 24,235,282 | |
| | | | | | | | | | | | |
Distributions to shareholders: | | | | | | | | | | | | |
Total retained earnings: | | | | | | | | | | | | |
R5 Class | | | - | | | | | | | | (267,134 | ) |
Y Class | | | - | | | | | | | | (10,260,124 | ) |
Investor Class | | | - | | | | | | | | (4,039,338 | ) |
A Class | | | - | | | | | | | | (1,376,666 | ) |
C Class | | | - | | | | | | | | (826,866 | ) |
R6 Class | | | - | | | | | | | | (39,638 | ) |
| | | | | | | | | | | | |
Net distributions to shareholders | | | - | | | | | | | | (16,809,766 | ) |
| | | | | | | | | | | | |
| | | |
Capital share transactions (Note 10): | | | | | | | | | | | | |
Proceeds from sales of shares | | | 66,788,087 | | | | | | | | 94,322,640 | |
Reinvestment of dividends and distributions | | | - | | | | | | | | 16,618,535 | |
Cost of shares redeemed | | | (153,566,206 | ) | | | | | | | (120,074,405 | ) |
| | | | | | | | | | | | |
Net (decrease) in net assets from capital share transactions | | | (86,778,119 | ) | | | | | | | (9,133,230 | ) |
| | | | | | | | | | | | |
Net (decrease) in net assets | | | (83,530,969 | ) | | | | | | | (1,707,714 | ) |
| | | | | | | | | | | | |
Net assets: | | | | | | | | | | | | |
Beginning of year | | | 275,223,944 | | | | | | | | 276,931,658 | |
| | | | | | | | | | | | |
End of year | | $ | 191,692,975 | | | | | | | $ | 275,223,944 | |
| | | | | | | | | | | | |
See accompanying notes
7
American Beacon ARK Transformational Innovation FundSM
Notes to Financial Statements
June 30, 2024
1. Organization and Significant Accounting Policies
American Beacon Funds (the “Trust”) is organized as a Massachusetts business trust. The Fund, a series within the Trust, is registered under the Investment Company Act of 1940, as amended (the “Act”), as a non-diversified, open-end management investment company. As of June 30, 2024, the Trust consists of twenty-four active series, one of which is presented in this filing: American Beacon ARK Transformational Innovation Fund (the “Fund”). The remaining twenty-three active series are reported in separate filings.
American Beacon Advisors, Inc. (the “Manager”) is a Delaware corporation and a wholly-owned subsidiary of Resolute Investment Managers, Inc. (“RIM”) organized in 1986 to provide business management, advisory, administrative, and asset management consulting services to the Trust and other investors. The Manager is registered as an investment advisor under the Investment Advisers Act of 1940, as amended (the “Advisers Act”). The Manager is an indirect wholly-owned subsidiary of Resolute Topco, Inc. (“Topco”), which is owned primarily by various institutional investment funds that are managed by financial institutions and other investment advisory firms. No owner of Topco owns 25% or more of the outstanding equity or voting interests of Topco.
Effective December 29, 2023, the Manager underwent a change of control, which resulted in the termination of the Fund’s previous management and investment advisory agreements. The Board approved an interim Management Agreement with the Manager and an interim Investment Advisory Agreement among the Manager, the sub-advisor and the Trust, on behalf of the Fund, that were effective on December 29, 2023. A new Management Agreement with the Manager was effective on January 9, 2024 upon its approval by shareholders.
Recently Adopted Accounting Pronouncements
In March 2020, the Financial Accounting Standards Board (“FASB”) issued Accounting Standards Update (“ASU”) No. 2020-04, Reference Rate Reform (Topic 848); Facilitation of the Effects of Reference Rate Reform on Financial Reporting, which provides optional guidance for a limited period of time to ease the potential burden in accounting for (or recognizing the effects of) reference rate reform. The guidance is applicable to contracts referencing London Inter-bank Offered Rate (“LIBOR”) or another reference rate that is expected to be discontinued due to reference rate reform. The ASU is effective as of March 12, 2020 and generally can be applied through December 31, 2022. In December 2022, the FASB issued ASU No. 2022-06 Reference Rate Reform (Topic 848): Deferral of the Sunset Date of Topic 848 which updates and clarifies ASU No. 2020-04. The amendments in this ASU defer the sunset date of Topic 848 from December 31, 2022, to December 31, 2024. Management expects these ASUs will not have a material impact on the Fund’s financial statements.
In June 2022, the FASB issued ASU No. 2022-03, Fair Value Measurement (Topic 820); Fair Value Measurement of Equity Securities Subject to Contractual Sale Restrictions, which provides clarifying guidance that a contractual restriction on the sale of an equity security is not considered part of the unit of account of the equity security and, therefore, is not considered in measuring fair value. The ASU is effective for fiscal years beginning after December 15, 2023, and interim periods within those fiscal years. Management has concluded that the ASU will not have a material impact on the Fund’s financial statements.
8
American Beacon ARK Transformational Innovation FundSM
Notes to Financial Statements
June 30, 2024
Class Disclosure
The Fund has multiple classes of shares designed to meet the needs of different groups of investors. The following table sets forth the differences amongst the classes:
| | | | | | |
Class | | Eligible Investors | | Minimum Initial
Investments | |
| R5 Class | | Large institutional investors - sold directly or through intermediary channels. | | $ | 250,000 | |
| | |
| Y Class | | Large institutional retirement plan investors - sold directly or through intermediary channels. | | $ | 100,000 | |
| | |
| Investor Class | | All investors using intermediary organizations, such as broker-dealers or retirement plan sponsors. | | $ | 2,500 | |
| | |
| A Class | | All investors who invest through intermediary organizations, such as broker-dealers or third party administrator. Retail investors who invest directly through a financial intermediary such as a broker, bank, or registered investment advisor which may include a front-end sales charge and a contingent deferred sales charge (“CDSC”). | | $ | 2,500 | |
| | |
| C Class | | Retail investors who invest directly through a financial intermediary such as a broker or through employee directed benefit plans with applicable sales charges which may include CDSC. | | $ | 1,000 | |
| | |
| R6 Class | | Large institutional retirement plan investors - sold through retirement plan sponsors. | | | None | |
Each class offered by the Trust has equal rights as to assets and voting privileges. Income and non-class specific expenses are allocated daily to each class based on the relative net assets. Realized and unrealized capital gains and losses of each class are allocated daily based on the relative net assets of each class of the respective Fund. Class specific expenses, where applicable, currently include service, distribution, transfer agent fees, and sub-transfer agent fees that vary amongst the classes as described more fully in Note 2.
Significant Accounting Policies
The following is a summary of significant accounting policies, consistently followed by the Fund in preparation of the financial statements. The Fund is considered an investment company and accordingly, follows the investment company accounting and reporting guidance of the FASB Accounting Standards Codification Topic 946, Financial Services – Investment Companies, a part of Generally Accepted Accounting Principles (“U.S. GAAP”).
Security Transactions and Investment Income
Security transactions are recorded as of the trade date for financial reporting purposes. Securities purchased or sold on a when-issued or delayed-delivery basis may be settled beyond a standard settlement period for the security after the trade date.
Dividend income, net of foreign taxes, is recorded on the ex-dividend date, except certain dividends from foreign securities which are recorded as soon as the information is available to the Fund. Interest income, net of foreign taxes, is earned from settlement date, recorded on the accrual basis, and adjusted, if necessary, for accretion of discounts and amortization of premiums. Realized gains (losses) from securities sold are determined based on specific lot identification.
Currency Translation
All assets and liabilities initially expressed in foreign currency values are converted into U.S. dollar values at the mean of the bid and ask prices of such currencies against U.S. dollars as last quoted by a recognized dealer. Income, expenses, and purchases and sales of investments are translated into U.S. dollars at the rate of the exchange prevailing on the respective dates of such transactions. The effect of changes in foreign currency
9
American Beacon ARK Transformational Innovation FundSM
Notes to Financial Statements
June 30, 2024
exchange rates on investments is separately identified from the fluctuations arising from changes in market values of securities held and is reported with all other foreign currency gains and losses on the Fund’s Statement of Operations.
Distributions to Shareholders
The Fund distributes most or all of its net earnings and realized gains, if any, each taxable year in the form of dividends from net investment income and distributions of realized net capital gains and net gains or losses from foreign currency transactions on an annual basis. The Fund does not have a fixed dividend rate and does not guarantee that it will pay any distributions in any particular period. Dividends to shareholders are determined in accordance with federal income tax regulations, which may differ in amount and character from net investment income and realized gains recognized for purposes of U.S. GAAP. To the extent necessary to fully distribute capital gains, the Fund may designate earnings and profits distributed to shareholders on the redemption of shares.
Commission Recapture
The Fund has established brokerage commission recapture arrangements with certain brokers or dealers. If the Fund’s investment advisor chooses to execute a transaction through a participating broker, the broker rebates a portion of the commission back to the Fund. Any collateral benefit received through participation in the commission recapture program is directed exclusively to the Fund. This amount is reported with the net realized gain (loss) in the Fund’s Statement of Operations, if applicable.
Allocation of Income, Trust Expenses, Gains, and Losses
Investment income and realized and unrealized gains and losses from investments of the Fund are allocated daily to each class of shares based upon the relative proportion of net assets of each class to the total net assets of the Fund. Expenses directly charged or attributable to the Fund will be paid from the assets of the Fund. Generally, expenses of the Trust will be allocated among and charged to the assets of the Fund on a basis that the Trust’s Board of Trustees (the “Board”) deems fair and equitable, which may be based on the relative net assets of the Fund or nature of the services performed and relative applicability to the Fund.
Use of Estimates
The preparation of financial statements in conformity with U.S. GAAP requires management to make estimates and assumptions that affect the amounts reported in the financial statements and accompanying notes. Actual results may differ from those estimated.
Other
Under the Trust’s organizational documents, its officers and trustees are indemnified against certain liabilities arising out of the performance of their duties to the Trust. In the normal course of business, the Trust enters into contracts that provide indemnification to the other party or parties against potential costs or liabilities. The Trust’s maximum exposure under these arrangements is dependent on claims that may be made in the future and, therefore, cannot be estimated. The Trust has had no prior claims or losses pursuant to any such agreement.
2. Transactions with Affiliates
Management and Investment Sub-Advisory Agreements
The Fund and the Manager are parties to a Management Agreement that obligates the Manager to provide the Fund with investment advisory and administrative services. As compensation for performing the duties under
10
American Beacon ARK Transformational Innovation FundSM
Notes to Financial Statements
June 30, 2024
the Management Agreement, the Manager will receive an annualized management fee based on a percentage of the Fund’s average daily net assets that is calculated and accrued daily according to the following schedule:
| | | | |
First $5 billion | | | 0.35 | % |
Next $5 billion | | | 0.325 | % |
Next $10 billion | | | 0.30 | % |
Over $20 billion | | | 0.275 | % |
The Trust, on behalf of the Fund, and the Manager have entered into an Investment Advisory Agreement with ARK Investment Management LLC (the “Sub-Advisor”) pursuant to which the Fund has agreed to pay an annualized sub-advisory fee that is calculated and accrued daily based on the Fund’s average daily net assets according to the following schedule:
| | | | |
First $5 billion | | | 0.55 | % |
Next $5 billion | | | 0.525 | % |
Next $10 billion | | | 0.50 | % |
Over $20 billion | | | 0.475 | % |
The Management and Sub-Advisory Fees paid by the Fund for the year ended June 30, 2024 were as follows:
| | | | | | | | | | | | |
| | | Effective Fee Rate | | | | | | Amount of Fees Paid | |
Management Fees | | | 0.35 | % | | | | | | $ | 921,394 | |
Sub-Advisory Fees | | | 0.55 | % | | | | | | | 1,410,564 | |
| | | | | | | | | | | | |
Total | | | 0.90 | % | | | | | | $ | 2,331,958 | |
| | | | | | | | | | | | |
As compensation for services provided by the Manager in connection with securities lending activities conducted by a Fund, the lending Fund pays to the Manager, with respect to cash collateral posted by borrowers, a fee of 10% of the net monthly investment income (the income earned in the form of interest, dividends and realized capital gains from the investment of cash collateral, plus any negative rebate fees paid by borrowers, less the rebate amount paid to borrowers as well as related expenses) and, with respect to collateral other than cash, a fee up to 10% of loan fees and demand premiums paid by borrowers. These fees are included in “Income derived from securities lending” and “Management and sub-advisory fees” on the Statement of Operations. During the year ended June 30, 2024, the Manager received securities lending fees of $24,177 for the securities lending activities of the Fund.
Distribution Plans
Separate Distribution Plans (the “Distribution Plans”) have been adopted pursuant to Rule 12b-1 under the Act for the A and C Classes of the Fund. Under the Distribution Plans, as compensation for distribution and shareholder servicing assistance, the Manager receives an annual fee of 0.25% of the average daily net assets of the A Class and 1.00% of the average daily net assets of the C Class. The fee will be payable without regard to whether the amount of the fee is more or less than the actual expenses incurred in a particular month by the Manager for distribution assistance.
Service Plans
The Manager and the Trust entered into a Service Plan that obligates the Manager to oversee additional shareholder servicing of the Investor, A and C Classes of the Fund. As compensation for performing the duties required under the Service Plan, the Manager receives an annualized fee up to 0.25% of the average daily net assets of the A and C Classes, and up to 0.375% of the average daily net assets of the Investor Class of the Fund.
11
American Beacon ARK Transformational Innovation FundSM
Notes to Financial Statements
June 30, 2024
Sub-Transfer Agent Fees
The Manager has entered into agreements, which include servicing agreements, with financial intermediaries that provide recordkeeping, processing, shareholder communications and other services to customers of the intermediaries that hold positions in the R5 and Y Classes of the Fund and has agreed to compensate the intermediaries for providing these services. Intermediaries transact with the Fund primarily through the use of omnibus accounts on behalf of its customers who hold positions in the Fund. Certain services would have been provided by the Fund’s transfer agent and other service providers if the shareholders’ accounts were maintained directly by the Fund’s transfer agent. Accordingly, the Fund, pursuant to Board approval, has agreed to reimburse the Manager for certain non-distribution shareholder services provided by financial intermediaries for the R5 and Y Classes. The reimbursement amounts (sub-transfer agent fees) paid to the Manager are subject to a fee limit of up to 0.10% of an intermediary’s average net assets in the R5 and Y Classes on an annual basis. During the year ended June 30, 2024, the sub-transfer agent fees, as reflected in “Transfer agent fees” on the Statement of Operations, were as follows:
| | | | |
Fund | | Sub-Transfer Agent Fees | |
ARK Transformational Innovation | | $ | 163,628 | |
As of June 30, 2024, the Fund owed the Manager the following reimbursement of sub-transfer agent fees, as reflected in “Transfer agent fees payable” on the Statement of Assets and Liabilities:
| | | | |
Fund | | Reimbursement
Sub-Transfer Agent Fees | |
ARK Transformational Innovation | | $ | 10,357 | |
Investments in Affiliated Funds
The Fund may invest in the American Beacon U.S. Government Money Market Select Fund (the “USG Select Fund”). Cash collateral received by the Fund in connection with securities lending may also be invested in the USG Select Fund. The Fund listed below held the following shares with a June 30, 2024 fair value and dividend income earned from the investment in the USG Select Fund.
| | | | | | | | | | | | | | | | | | | | | | | | | | | | | | | | | | | | | | | | | | | | | | | | |
Affiliated Security | | Type of
Transaction | | | | | Fund | | | | | June 30,
2024
Shares/Principal | | | | | | Change in
Unrealized
Gain (Loss) | | | | | | Realized
Gain
(Loss) | | | | | | Dividend
Income | | | | | | June 30,
2024
Shares/
Fair Value | |
| U.S. Government Money Market Select | | Direct | | | | | | ARK Transformational
Innovation | | | | | | $ | 748,964 | | | | | | | $ | - | | | | | | | $ | - | | | | | | | $ | 191,698 | | | | | | | $ | 748,964 | |
| U.S. Government Money Market Select | | Securities
Lending | | | | | | ARK Transformational
Innovation | | | | | | | 3,772,602 | | | | | | | | - | | | | | | | | - | | | | | | | | N/A | | | | | | | | 3,772,602 | |
The Fund and the USG Select Fund have the same investment advisor and therefore, are considered to be affiliated. The Manager serves as investment advisor to the USG Select Fund and receives management fees and administrative fees totaling 0.10% of the average daily net assets of the USG Select Fund. During the year ended June 30, 2024, the Manager earned fees on the Fund’s direct investments and securities lending collateral investments in the USG Select Fund as shown below:
| | | | | | | | | | | | |
Fund | | Direct Investments in
USG Select Fund | | | Securities Lending
Collateral
Investments in USG
Select Fund | | | Total | |
ARK Transformational Innovation | | $ | 3,713 | | | $ | 12,471 | | | $ | 16,184 | |
12
American Beacon ARK Transformational Innovation FundSM
Notes to Financial Statements
June 30, 2024
Interfund Credit Facility
Pursuant to an exemptive order issued by the U.S. Securities and Exchange Commission (“SEC”), the Fund, along with other registered investment companies having management contracts with the Manager, may participate in a credit facility whereby each fund, under certain conditions, is permitted to lend money directly to and borrow directly from other participating funds for temporary purposes. The interfund credit facility is advantageous to the funds because it provides added liquidity and eliminates the need to maintain higher cash balances to meet redemptions. This situation could arise when shareholder redemptions exceed anticipated volumes and certain funds have insufficient cash on hand to satisfy such redemptions or when sales of securities do not settle as expected, resulting in a cash shortfall for a fund. The credit facility provides a source of immediate, short-term liquidity pending settlement of the sale of portfolio securities. The credit facility is administered by a credit facility team consisting of professionals from the Manager’s asset management, compliance, and accounting areas who report the activities of the credit facility to the Board. During the year ended June 30, 2024, the Fund borrowed on average $1,020,934 for 8 days at an average interest rate of 6.14% with interest charges of $3,347. These amounts are recorded as “Loan expense” in the Statement of Operations.
Expense Reimbursement Plan
The Manager contractually agreed to reduce fees and/or reimburse expenses for the classes of the Fund, through October 31, 2024, to the extent that total operating expenses (excluding taxes, interest, brokerage commissions, acquired fund fees and expenses, securities lending fees, expenses associated with securities sold short, litigation, and other extraordinary expenses) exceed the Fund’s expense cap. During the year ended June 30, 2024, the Manager waived and/or reimbursed expenses as follows:
| | | | | | | | | | | | | | | | | | | | | | |
| | | | | Expense Cap | | | | | | | | | Expiration of
Reimbursed
Expenses | |
Fund | | Class | | 7/1/2023 -
10/31/2023 | | | 11/1/2023 -
6/30/2024 | | | Reimbursed
Expenses | | | (Recouped)
Expenses | |
ARK Transformational Innovation | | R5 | | | 0.99 | % | | | 0.99 | % | | $ | 5,829 | | | $ | - | | | | 2026-2027 | |
ARK Transformational Innovation | | Y | | | 1.08 | % | | | 1.08 | % | | | 133,747 | | | | (19,424 | )* | | | 2026-2027 | |
ARK Transformational Innovation | | Investor | | | 1.32 | % | | | 1.32 | % | | | 63,029 | | | | (6,046 | )* | | | 2026-2027 | |
ARK Transformational Innovation | | A | | | 1.34 | % | | | 1.34 | % | | | 30,192 | | | | (1,621 | )* | | | 2026-2027 | |
ARK Transformational Innovation | | C | | | 2.10 | % | | | 2.10 | % | | | 20,830 | | | | (596 | )* | | | 2026-2027 | |
ARK Transformational Innovation | | R6 | | | 0.99 | % | | | 0.99 | % | | | 1,460 | | | | (254 | )* | | | 2026-2027 | |
*These amounts represents Recouped Expenses from prior fiscal years and are reflected in Total Expenses on the Statements of Operations.
Of the above amounts, $27,793 was disclosed as a Payable for expense recoupment on the Statement of Assets and Liabilities at June 30, 2024.
The Fund has adopted an Expense Reimbursement Plan whereby the Manager may seek repayment of contractual or voluntary fee reductions and expense reimbursements. Under the policy, the Manager can be reimbursed by the Fund for any contractual or voluntary fee reductions or expense reimbursements if reimbursement to the Manager (a) occurs within three years from the date of the Manager’s waiver/reimbursement and (b) does not cause the Fund’s annual operating expenses to exceed the lesser of the contractual percentage limit in effect at the time of the waiver/reimbursement or time of recoupment. The reimbursed expenses listed above will expire in 2026 and 2027. The Fund did not record a liability for potential contingent reimbursement due
13
American Beacon ARK Transformational Innovation FundSM
Notes to Financial Statements
June 30, 2024
to the current assessment that a reimbursement is uncertain. The carryover of excess expenses potentially reimbursable to the Manager, but not recorded as a liability are as follows:
| | | | | | | | | | | | | | | | |
Fund | | Recouped
Expenses | | | Excess Expense
Carryover | | | Expired Expense
Carryover | | | Expiration of
Reimbursed
Expenses | |
ARK Transformational Innovation | | $ | 25,471 | | | $ | - | | | $ | 166,777 | | | | 2023-2024 | |
ARK Transformational Innovation | | | 253 | | | | 292,366 | | | | - | | | | 2024-2025 | |
ARK Transformational Innovation | | | 2,217 | | | | 313,060 | | | | - | | | | 2025-2026 | |
Sales Commissions
The Fund’s Distributor, Resolute Investment Distributors, Inc. (“RID” or “Distributor”), may receive a portion of A Class sales charges from broker dealers which may be used to offset distribution related expenses. During the year ended June 30, 2024, RID collected $12,464 from the sale of A Class Shares of the Fund.
A CDSC of 0.50% will be deducted with respect to A Class Shares on certain purchases of $1,000,000 or more that are redeemed in whole or part within 18 months of purchase, unless waived as discussed in the Fund’s Prospectus. Any applicable CDSC will be 0.50% of the lesser of the original purchase price or the value of the redemption of the A Class Shares redeemed. During the year ended June 30, 2024, there were no CDSC fees collected for A Class Shares of the Fund.
A CDSC of 1.00% will be deducted with respect to C Class Shares redeemed within 12 months of purchase, unless waived as discussed in the Fund’s Prospectus. Any applicable CDSC will be 1.00% of the lesser of the original purchase price or the value of the redemption of the C Class Shares redeemed. During the year ended June 30, 2024, CDSC fees of $4,674 were collected for C Class Shares of the Fund.
Trustee Fees and Expenses
As compensation for their service to the American Beacon Funds Complex, including the Trust (collectively, the “Trusts”), each Trustee is compensated from the Trusts as follows: (1) an annual retainer of $140,000; (2) meeting attendance fee (for attendance in-person or via teleconference) of (a) $12,000 for in person attendance, or $5,000 for telephonic attendance, by Board members for each regularly scheduled or special Board meeting, (b) $2,500 for attendance by Committee members at meetings of the Audit and Compliance Committee and the Investment Committee, (c) $1,000 for attendance by Committee members at meetings of the Nominating and Governance Committee; and (d) $2,500 for attendance by Board members for each special telephonic Board meeting; and (3) reimbursement of reasonable expenses incurred in attending Board meetings, Committee meetings, and relevant educational seminars. For this purpose, the Board considers attendance at regular meetings held by video conference to constitute in-person attendance at a Board meeting. The Trustees also may be compensated for attendance at special Board and/or Committee meetings from time to time. For her service as Board Chair, Ms. Cline receives an additional annual retainer of $50,000. Although she attends several committee meetings at each quarterly Board meeting, she receives only a single $2,500 fee each quarter for her attendance at the Audit and Compliance Committee and Investment Committee meetings. The chairpersons of the Audit and Compliance Committee and the Investment Committee each receive an additional annual retainer of $25,000 and the Chair of the Nominating and Governance Committee receives an additional annual retainer of $10,000.
3. Security Valuation and Fair Value Measurements
The price of the Fund’s shares is based on its net asset value (“NAV”) per share. The Fund’s NAV is computed by adding total assets, subtracting all the Fund’s liabilities, and dividing the result by the total number of shares outstanding.
14
American Beacon ARK Transformational Innovation FundSM
Notes to Financial Statements
June 30, 2024
The NAV of each class of the Fund’s shares is determined based on a pro rata allocation of the Fund’s investment income, expenses and total capital gains and losses. The Fund’s NAV per share is determined each business day as of the regular close of trading on the New York Stock Exchange (“NYSE” or “Exchange”), which is typically 4:00 p.m. Eastern Time (“ET”). However, if trading on the NYSE closes at a time other than 4:00 p.m. ET, the Fund’s NAV per share typically would still be determined as of the regular close of trading on the NYSE. The Fund does not price its shares on days that the NYSE is closed. Foreign exchanges may permit trading in foreign securities on days when the Fund is not open for business, which may result in the value of the Fund’s portfolio investments being affected at a time when you are unable to buy or sell shares.
Equity securities, including shares of closed-end funds and exchange-traded funds (“ETFs”), are valued at the last sale price or official closing price taken from the primary exchange in which each security trades. Investments in other mutual funds are valued at the closing NAV per share on the day of valuation. Debt securities are valued at bid quotes from broker/dealers or evaluated bid prices from pricing services, who may consider a number of inputs and factors, such as prices of comparable securities, yield curves, spreads, credit ratings, coupon rates, maturity, default rates, and underlying collateral. Futures are valued based on their daily settlement prices. Exchange-traded and over-the-counter (“OTC”) options are valued at the last sale price. Options with no last sale for the day are priced at mid quote. Swaps are valued at evaluated mid prices from pricing services.
The valuation of securities traded on foreign markets and certain fixed-income securities will generally be based on prices determined as of the earlier closing time of the markets on which they primarily trade unless a significant event has occurred. When the Fund holds securities or other assets that are denominated in a foreign currency, the Fund will normally use the currency exchange rates as of 4:00 p.m. ET.
Rule 2a-5 under the Investment Company Act (the “Valuation Rule”) establishes requirements for determining fair value in good faith for purposes of the Investment Company Act, including related oversight and reporting requirements. The Valuation Rule also defines when market quotations are “readily available,” which is the threshold for determining whether a Fund must fair value a security. Among other things, the Valuation Rule permits the Board to designate the Manager as Valuation Designee to perform the Fund’s fair value determinations subject to board oversight and certain reporting and other requirements intended to ensure that the Board receives the information it needs to oversee the Manager’s fair value determinations. Effective September 8, 2022, the Board has designated the Manager as valuation designee to perform fair value functions in accordance with the requirements of the Valuation Rule.
Securities may be valued at fair value, as determined in good faith and pursuant to the Manager’s procedures, under certain limited circumstances. For example, fair value pricing will be used for fixed-income securities and when market quotations are not readily available or reliable, as determined by the Manager, such as when (i) trading for a security is restricted or stopped; (ii) a security’s trading market is closed (other than customary closings); or (iii) a security has been de-listed from a national exchange. A security with limited market liquidity may require fair value pricing if the Manager determines that the available price does not reflect the security’s true market value. In addition, if a significant event that the Manager determines to affect the value of one or more securities held by the Fund occurs after the close of a related exchange but before the determination of the Fund’s NAV, fair value pricing may be used on the affected security or securities. Securities of small-capitalization companies are also more likely to require a fair value determination using these procedures because they are more thinly traded and less liquid than the securities of larger-capitalization companies. The Fund may fair value securities as a result of significant events occurring after the close of the foreign markets in which the Fund invests as described below. In addition, the Fund may invest in illiquid securities requiring these procedures.
The Fund may use fair value pricing for securities primarily traded in non-U.S. markets because most foreign markets close well before the Fund’s pricing time of 4:00 p.m. ET. The earlier close of these foreign markets gives rise to the possibility that significant events, including broad market moves, may have occurred in the interim and may materially affect the value of those securities. If the Manager determines that the last quoted prices of non-U.S. securities will, in its judgment, materially affect the value of some or all the Fund’s portfolio securities,
15
American Beacon ARK Transformational Innovation FundSM
Notes to Financial Statements
June 30, 2024
the Manager can adjust the previous closing prices to reflect what it believes to be the fair value of the securities as of the close of the Exchange. In deciding whether it is necessary to adjust closing prices to reflect fair value, the Manager reviews a variety of factors, including developments in foreign markets, the performance of U.S. securities markets, and the performance of instruments trading in U.S. markets that represent foreign securities and baskets of foreign securities. These securities are fair valued using a pricing service, using methods approved by the Manager, that considers the correlation of the trading patterns of the foreign security to intraday trading in the U.S. markets, based on indices of domestic securities and other appropriate indicators such as prices of relevant American Depositary Receipts (“ADRs”) and futures contracts. The Manager’s Valuation Committee may also fair value securities in other situations, such as when a particular foreign market is closed but the Fund is open. The Fund uses outside pricing services to provide closing prices and information to evaluate and/or adjust those prices. As a means of evaluating its security valuation process, the Valuation Committee routinely compares closing prices, the next day’s opening prices in the same markets and adjusted prices.
Attempts to determine the fair value of securities introduce an element of subjectivity to the pricing of securities. As a result, the price of a security determined through fair valuation techniques may differ from the price quoted or published by other sources and may not accurately reflect the market value of the security when trading resumes. If a reliable market quotation becomes available for a security formerly valued through fair valuation techniques, the Manager compares the new market quotation to the fair value price to evaluate the effectiveness of the Fund’s fair valuation procedures. If any significant discrepancies are found, the Manager may adjust Manager’s fair valuation procedures for the Fund.
Valuation Inputs
Various inputs may be used to determine the fair value of the Fund’s investments. These inputs are summarized in three broad levels for financial statement purposes. The inputs or methodologies used to value securities are not necessarily an indication of the risk associated with investing in those securities.
| | | | |
| Level 1 | | - | | Quoted prices in active markets for identical securities. |
| | |
| Level 2 | | - | | Prices determined using other significant observable inputs. These may include quoted prices for similar securities, interest rates, prepayment speeds, credit risk, and others. |
| | |
| Level 3 | | - | | Prices determined using other significant unobservable inputs. Unobservable inputs reflect the Fund’s own assumptions about the factors market participants would use in pricing an investment. |
Level 1 and Level 2 trading assets and trading liabilities, at fair value
Common stocks, ETFs and financial derivative instruments, such as futures contracts or options that are traded on a national securities exchange, are stated at the last reported sale or settlement price on the day of valuation. To the extent these securities are actively traded and valuation adjustments are not applied, they are categorized as Level 1 of the fair value hierarchy. Valuation adjustments may be applied to certain securities that are solely traded on a foreign exchange to account for the market movement between the close of the foreign market and the close of the Exchange. These securities are valued using pricing service providers that consider the correlation of the trading patterns of the foreign security to the intraday trading in the U.S. markets for investments. Securities using these valuation adjustments are categorized as Level 2 of the fair value hierarchy.
Investments in registered open-end investment management companies will be valued based upon the NAVs of such investments and are categorized as Level 1 of the fair value hierarchy.
16
American Beacon ARK Transformational Innovation FundSM
Notes to Financial Statements
June 30, 2024
4. Securities and Other Investments
Common Stock
Common stock generally takes the form of shares in a corporation which represent an ownership interest. It ranks below preferred stock and debt securities in claims for dividends and for assets of the company in a liquidation or bankruptcy. The value of a company’s common stock may fall as a result of factors directly relating to that company, such as decisions made by its management or decreased demand for the company’s products or services. A stock’s value may also decline because of factors affecting not just the company, but also companies in the same industry or sector. The price of a company’s stock may also be affected by changes in financial markets that are relatively unrelated to the company, such as changes in interest rates, currency exchange rates or industry regulation. Companies that elect to pay dividends on their common stock generally only do so after they invest in their own business and make required payments to bondholders and on other debt and preferred stock. Therefore, the value of a company’s common stock will usually be more volatile than its bonds, other debt and preferred stock. Common stock may be exchange-traded or OTC. OTC stock may be less liquid than exchange-traded stock.
Depositary Receipts and U.S. Dollar-Denominated Foreign Stocks Traded on U.S. Exchanges
The Fund may invest in securities issued by foreign companies through ADR and U.S. dollar-denominated foreign stocks traded on U.S. exchanges. These securities are subject to many of the risks inherent in investing in foreign securities, including, but not limited to, currency fluctuations and political and financial instability in the home country of a particular ADR or foreign stock. ADRs are U.S. dollar-denominated receipts issued generally by domestic banks and represent the deposit with the bank of a security of a foreign issuer. Depositary receipts may not be denominated in the same currency as the securities into which they may be converted. Investing in depositary receipts entails substantially the same risks as direct investment in foreign securities. There is generally less publicly available information about foreign companies and there may be less governmental regulation and supervision of foreign stock exchanges, brokers and listed companies. In addition, such companies may use different accounting and financial standards (and certain currencies may become unavailable for transfer from a foreign currency), resulting in the Fund’s possible inability to convert immediately into U.S. currency proceeds realized upon the sale of portfolio securities of the affected foreign companies. In addition, the Fund may invest in unsponsored depositary receipts, the issuers of which are not obligated to disclose material information about the underlying securities to investors in the United States. Ownership of unsponsored depositary receipts may not entitle the Fund to the same benefits and rights as ownership of a sponsored depositary receipt or the underlying securities.
Foreign Securities
The Fund may invest in securities of foreign issuers. Foreign issuers are issuers organized and doing business principally outside the United States and include corporations, banks, non-U.S. governments, and quasi-governmental organizations. While investments in foreign securities may be intended to reduce risk by providing further diversification, such investments involve sovereign and other risks, in addition to the credit and market risks normally associated with domestic securities. These additional risks include the possibility of adverse political and economic developments (including political or social instability, nationalization, expropriation, or confiscatory taxation); the potentially adverse effects of unavailability of public information regarding issuers, different governmental supervision and regulation of financial markets, reduced liquidity of certain financial markets, and the lack of uniform accounting, auditing, and financial reporting standards or the application of standards that are different or less stringent than those applied in the United States; different laws and customs governing securities tracking; and possibly limited access to the courts to enforce the Fund’s rights as an investor.
17
American Beacon ARK Transformational Innovation FundSM
Notes to Financial Statements
June 30, 2024
Other Investment Company Securities and Exchange-Traded Products
The Fund at times may invest in shares of other investment companies, including open-end funds, closed-end funds, business development companies (“BDCs”), ETFs, unit investment trusts, and other investment companies of the Trust. The Fund may invest in securities of an investment company advised by the Manager or the Sub-Advisor. Investments in the securities of other investment companies may involve duplication of advisory fees and certain other expenses. By investing in another investment company, the Fund becomes a shareholder of that investment company. As a result, Fund’s shareholders indirectly will bear the Fund’s proportionate share of the fees and expenses paid by shareholders of the other investment company, in addition to the fees and expenses Fund shareholders directly bear in connection with the Fund’s own operations. These other fees and expenses are reflected as Acquired Fund Fees and Expenses and are included in the Fees and Expenses Table for the Fund in its Prospectus, if applicable. Investments in other investment companies may involve the payment of substantial premiums above the value of such issuer’s portfolio securities.
The Fund can invest free cash balances in registered open-end investment companies regulated as government money market funds under the Investment Company Act, to provide liquidity or for defensive purposes. The Funds could invest in government money market funds rather than purchasing individual short-term investments. If the Funds invests in government money market funds, shareholders will bear their proportionate share of the expenses, including for example, advisory and administrative fees, of the government money market funds in which the Fund invests, including advisory fees charged by the Manager to any applicable money market funds advised by the Manager.
5. Principal Risks
Investing in the Fund may involve certain risks including, but not limited to, those described below.
Currency Risk
The Fund may have exposure to foreign currencies by using various instruments. Foreign currencies may fluctuate significantly over short periods of time for a number of reasons, including changes in interest rates, may be affected unpredictably by intervention, or the failure to intervene, of the U.S. or foreign governments, central banks, or supranational entities such as the International Monetary Fund, and may be affected by the imposition of currency controls or political developments in the U.S. or abroad. As a result, the Fund’s exposure to foreign currencies may reduce the returns of the Fund. Foreign currencies may decline in value relative to the U.S. dollar and other currencies and thereby affect the Fund’s investments. In addition, changes in currency exchange rates could adversely impact investment gains or add to investment losses.
Environmental, Social, and/or Governance Investing Risk
The use of environmental, social, and/or governance (“ESG”) considerations by a sub-advisor may cause the Fund to make different investments than funds that have a similar investment style but do not incorporate such considerations in their strategy. As with the use of any investment considerations involved in investment decisions, there is no guarantee that the use of any ESG investment considerations will result in the selection of issuers that will outperform other issuers or help reduce risk in the Fund. The Fund may underperform funds that do not incorporate these considerations.
Equity Investments Risk
Equity securities are subject to investment and market risk. The Fund’s investments in equity securities may include common stocks. Investing in such securities may expose the funds to additional risk. The value of a company’s common stock may fall as a result of factors affecting the company, companies in the same industry or sector, or the financial markets overall. Common stock generally is subordinate to preferred stock upon the liquidation or bankruptcy of the issuing company.
18
American Beacon ARK Transformational Innovation FundSM
Notes to Financial Statements
June 30, 2024
Foreign Investing Risk
Non-U.S. investments carry potential risks not associated with U.S. investments. Such risks include, but are not limited to: (1) currency exchange rate fluctuations, (2) political and financial instability, (3) less liquidity, (4) lack of uniform accounting, auditing and financial reporting standards, (5) greater volatility, (6) different government regulation and supervision of foreign stock exchanges, brokers and listed companies, and (7) delays in transaction settlement in some foreign markets. To the extent the Fund invests a significant portion of its assets in securities of a single country or region, it is more likely to be affected by events or conditions of that country or region. The Fund’s investment in a foreign issuer may subject the Fund to regulatory, political, currency, security, economic and other risks associated with that country. Global economic and financial markets are becoming increasingly interconnected and conditions (including recent volatility and instability) and events (including natural disasters) in one country, region or financial market may adversely impact issuers in a different country, region or financial market. There may be very limited oversight of certain foreign banks or securities depositories that hold foreign securities and currency and the laws of certain countries may limit the ability to recover such assets if a foreign bank or depository or their agents goes bankrupt. When investing in emerging markets, the risks of investing in foreign securities are heightened. Emerging markets have unique risks that are greater than, or in addition to, investing in developed markets because emerging markets are generally smaller, less developed, less liquid and more volatile than the securities markets of the U.S. and other developed markets. There are also risks of: greater political uncertainties; an economy’s dependence on revenues from particular commodities or on international aid or development assistance; currency transfer restrictions; a limited number of potential buyers for such securities, resulting in increased volatility and limited liquidity for emerging market securities; trading suspensions; and delays and disruptions in securities settlement procedures. In addition, there may be less information available to make investment decisions and more volatile rates of return.
Market Risk
The Fund is subject to the risk that the securities markets will move down, sometimes rapidly and unpredictably, based on overall economic conditions and other factors, which may negatively affect the Fund’s performance. Equity securities generally have greater price volatility than fixed-income securities, although under certain market conditions fixed-income securities may have comparable or greater price volatility. During a general downturn in the securities markets, multiple assets may decline in value simultaneously. In some cases, traditional market participants have been less willing to make a market in some types of debt instruments, which has affected the liquidity of those instruments. During times of market turmoil, investors tend to look to the safety of securities issued or backed by the U.S. Treasury, causing the prices of these securities to rise and the yields to decline. Reduced liquidity in fixed-income and credit markets may negatively affect many issuers worldwide. Prices in many financial markets have increased significantly over the last decade, but there have also been periods of adverse market and financial developments and cyclical change during that timeframe, which have resulted in unusually high levels of volatility in domestic and foreign financial markets that has caused losses for investors and may occur again in the future, particularly if markets enter a period of uncertainty or economic weakness. The value of a security may decline due to adverse issuer-specific conditions, general market conditions unrelated to a particular issuer, or factors that affect a particular industry or industries. Changes in the financial condition of a single issuer or market segment also can impact the market as a whole.
Geopolitical and other events, including war, terrorism, economic uncertainty, trade disputes, pandemics, public health crises, natural disasters and related events have led, and in the future may continue to lead, to instability in world economies and markets generally and reduced liquidity in equity, credit and fixed-income markets, which may disrupt economies and markets and adversely affect the value of your investment. Changes in value may be temporary or may last for extended periods.
Policy changes by the U.S. government and/or Federal Reserve and political events within the U.S. and abroad, including the U.S. presidential election, the U.S. government’s inability at times to agree on a long-term
19
American Beacon ARK Transformational Innovation FundSM
Notes to Financial Statements
June 30, 2024
budget and deficit reduction plan, the threat of a federal government shutdown and threats not to increase the federal government’s debt limit, may affect investor and consumer confidence and may adversely impact financial markets and the broader economy, perhaps suddenly and to a significant degree.
Markets and market participants are increasingly reliant upon both publicly available and proprietary information data systems. Data imprecision, software or other technology malfunctions, programming inaccuracies, unauthorized use or access, and similar circumstances may impair the performance of these systems and may have an adverse impact upon a single issuer, a group of issuers, or the market at large. The financial markets generally move in cycles, with periods of rising prices followed by periods of declining prices. The value of your investment may reflect these fluctuations.
Non-Diversification Risk
When a Fund is non-diversified, it may invest a high percentage of its assets in a limited number of issuers. When a Fund invests in a relatively small number of issuers, it may be more susceptible to risks associated with a single economic, political or regulatory occurrence than a more diversified portfolio might be. Some of those issuers also may present substantial credit or other risks. When a Fund is non-diversified, its NAV and total return may also fluctuate more or be subject to declines in weaker markets than a diversified mutual fund. Investments in securities of a limited number of issuers exposes a Fund to greater market risk, price volatility and potential losses than if assets were diversified among the securities of a greater number of issuers.
Other Investment Companies Risk
To the extent that a Fund invests in shares of other registered investment companies, a Fund will indirectly bear the fees and expenses, including, for example, advisory and administrative fees, charged by those investment companies in addition to a Fund’s direct fees and expenses. To the extent a Fund invest in other investment companies that invest in equity securities, fixed-income securities and/or foreign securities, or that track an index, a Fund is subject to the risks associated with the underlying investments held by the investment company or the index fluctuations to which the investment company is subject. Investments in government money market funds are subject to interest rate risk, credit risk, and market risk. Interest rate risk is the risk that rising interest rates could cause the value of such an investment to decline. Credit risk is the risk that the issuer, guarantor or insurer of an obligation, or the counterparty to a transaction, may fail or become less able or unwilling, to make timely payment of interest or principal or otherwise honor its obligations, or that it may default completely.
Recent Market Events Risk
Both U.S. and international markets have experienced significant volatility in recent months and years. As a result of such volatility, investment returns may fluctuate significantly. Moreover, the risks discussed herein associated with an investment in the Fund may be increased.
Although interest rates were unusually low in recent years in the U.S. and abroad, in 2022, the Federal Reserve and certain foreign central banks began to raise interest rates as part of their efforts to address rising inflation. It is difficult to accurately predict the pace at which interest rates may continue to increase, the timing, frequency or magnitude of any such increases, or when such increases might stop. Additionally, various economic and political factors could cause the Federal Reserve or another foreign central bank to change their approach in the future and such actions may result in an economic slowdown in the U.S. and abroad. Unexpected increases in interest rates could lead to market volatility or reduce liquidity in certain sectors of the market. Deteriorating economic fundamentals may, in turn, increase the risk of default or insolvency of particular issuers, negatively impact market value, cause credit spreads to widen, and reduce bank balance sheets. Any of these could cause an increase in market volatility, reduce liquidity across various markets or decrease confidence in the markets. Additionally, high public debt in the U.S. and other countries creates ongoing systemic and market risks and policymaking uncertainty.
20
American Beacon ARK Transformational Innovation FundSM
Notes to Financial Statements
June 30, 2024
In March 2023, the shutdown of certain financial institutions in the U.S. and questions regarding the viability of other financial institutions raised economic concerns over disruption in the U.S. and global banking systems. There can be no certainty that the actions taken by the U.S. or foreign governments will be effective in mitigating the effects of financial institution failures on the economy and restoring public confidence in the U.S. and global banking systems. Some countries, including the U.S., have in recent years adopted more protectionist trade policies. Slowing global economic growth; risks associated with a trade agreement between the United Kingdom and the European Union; the risks associated with ongoing trade negotiations with China; and the possibility of changes to some international trade agreements; political or economic dysfunction within some nations, including major producers of oil; and dramatic changes in commodity and currency prices could have adverse effects that cannot be foreseen at the present time.
Tensions, war, or open conflict between nations, such as between Russia and Ukraine, in the Middle East or in eastern Asia could affect the economies of many nations, including the United States. The duration of ongoing hostilities in the Middle East and between Russia and Ukraine, and any sanctions and related events cannot be predicted. Those events present material uncertainty and risk with respect to markets globally and the performance of the Fund and its investments or operations could be negatively impacted.
Regulators in the U.S. have proposed and recently adopted a number of changes to regulations involving the markets and issuers, some of which apply to the Fund. The full effect of various newly-adopted regulations is not currently known. Additionally, it is not clear whether the proposed regulations will be adopted. However, due to the broad scope of the new and proposed regulations, certain changes could limit the Fund’s ability to pursue its investment strategies or make certain investments, or may make it more costly for the Fund to operate, which may impact performance.
Economists and others have expressed increasing concern about the potential effects of global climate change on property and security values. Certain issuers, industries and regions may be adversely affected by the impacts of climate change, including on the demand for and the development of goods and services and related production costs, and the impacts of legislation, regulation and international accords related to climate change, as well as any indirect consequences of regulation or business trends driven by climate change.
Sector Risk
The Fund’s investing approach may dictate an emphasis on certain sectors or sub-sectors of the market at any given time. To the extent the Fund invests more heavily in one particular sector, industry, or sub-sector of the market, it thereby presents a more concentrated risk and its performance will be especially sensitive to developments that significantly affect those sectors or sub-sectors. In addition, the value of the Fund’s shares may change at different rates than to the value of shares of another fund that invests in a more diversified mix of sectors and industries. An individual sector, industry, or sub-sector of the market may have above-average performance during particular periods, but may also move up and down more than the broader market. The industries that constitute a sector may all react in the same way to economic, political or regulatory events. The Fund’s performance could also be affected if the sectors, industries, or sub-sectors do not perform as expected. Because the Fund may hold a limited number of securities, it may at times be substantially over-weighted in certain economic sectors and underweighted in others. Accordingly, the Fund’s performance is likely to be disproportionately affected by the factors influencing the sectors in which it is substantially over-weighted. Alternatively, the lack of exposure to one or more sectors or industries may adversely affect performance. As the Fund’s portfolio changes over time, the Fund’s exposure to a particular sector may become higher or lower.
Securities Lending Risk
The Fund may lend its portfolio securities to brokers, dealers and financial institutions in order to obtain additional income. Borrowers of the Fund’s securities provide collateral either in the form of cash, which the Fund reinvests in securities or in the form of non-cash collateral consisting of securities issued or guaranteed by the U.S.
21
American Beacon ARK Transformational Innovation FundSM
Notes to Financial Statements
June 30, 2024
government or one of its agencies or instrumentalities. The Fund will be responsible for the risks associated with the investment of cash collateral, including any collateral invested in an affiliated money market fund. The Fund may lose money on its investment of cash collateral or may fail to earn sufficient income on its investment to cover its payment to the borrower of a pre-negotiated fee or “rebate” for the use of that cash collateral in connection with the loan. The Fund could also lose money due to a decline in the value of non-cash collateral. In addition, delays may occur in the recovery of securities from borrowers, which could interfere with the Fund’s ability to vote proxies or to settle transactions or could result in increased costs. Moreover, if the borrower becomes subject to insolvency or similar proceedings, the Fund could incur delays in its ability to enforce its rights in its collateral. There also is a risk that a borrower may default on its obligation to return loaned securities at a time when the value of the Fund’s collateral is inadequate. Although the Fund’s securities lending agent may indemnify the Fund against that risk, it is also possible that the securities lending agent will be unable to satisfy its indemnification obligations. In any case in which the loaned securities are not returned to the Fund before an ex-dividend date, whether or not due to a default by the borrower, the payment in lieu of the dividend that the Fund receives from the securities’ borrower would not be treated as a dividend for federal income tax purposes and thus would not qualify for treatment as “qualified dividend income”.
Securities Selection Risk
Securities selected by the sub-advisor or the Manager for the Funds may not perform to expectations. The portfolio managers’ judgments about the attractiveness, value and anticipated price movements of a particular asset class or individual security may be incorrect, and there is no guarantee that individual securities will perform as anticipated. The value of an individual security can be more or less volatile than the market as a whole or a relative value approach may fail to produce the intended results. The portfolio managers’ assessment of relative value may be wrong or even if the assessment of relative value is correct, it may take a long period of time before the price and intrinsic value converge. It may not be possible to predict, or to hedge against, a widening in the yield spread of the securities selected by a sub-advisor. This could result in the Funds’ underperformance compared to other funds with similar investment objectives.
Valuation Risk
This is the risk that the Fund has valued a security at a price different from the price at which it can be sold. This risk may be especially pronounced for investments, such as derivatives, which may be illiquid or which may become illiquid and for securities that trade in relatively thin markets and/or markets that experience extreme volatility. The Fund’s ability to value its investments in an accurate and timely manner may be impacted by technological issues and/or errors by third-party service providers, such as pricing services or accounting agents. If market conditions make it difficult to value certain investments, the Fund may value these investments using more subjective methods, such as fair-value methodologies. Investors who purchase or redeem Fund shares on days when the Fund is holding fair-valued securities may receive fewer or more shares, or lower or higher redemption proceeds, than they would have received if the Fund had not fair-valued the securities or had used a different valuation methodology. The value of foreign securities, certain fixed-income securities and currencies, as applicable, may be materially affected by events after the close of the markets on which they are traded, but before the Fund determines its NAV.
Offsetting Assets and Liabilities
The Fund is a party to enforceable master netting agreements between brokers and counterparties which provide for the right to offset under certain circumstances. The Fund employs multiple money managers and counterparties and has elected not to offset qualifying financial and derivative instruments on the Statement of Assets and Liabilities, as such all financial and derivative instruments are presented on a gross basis. The impacts of netting arrangements that provide the right to offset are detailed below, if applicable. The net amount represents the net receivable or payable that would be due from or to the counterparty in the event of default. Exposure from borrowings and other financing agreements such as repurchase agreements can only be netted
22
American Beacon ARK Transformational Innovation FundSM
Notes to Financial Statements
June 30, 2024
across transactions governed by the same Master Agreement with the same legal entity. All amounts reported below represent the balance as of the report date, June 30, 2024.
| | | | | | | | | | | | | | | | | | | | | | | | | | | | | | | | | | | | |
| | | Remaining Contractual Maturity of the Agreements
As of June 30, 2024 | |
| | | Overnight and
Continuous | | | | | | <30 days | | | | | | Between
30 & 90 days | | | | | | >90 days | | | | | | Total | |
Securities Lending Transactions | | | | | | | | | | | | | | | | | | | | | | | | | | | | | | | | | | | | |
Common Stocks | | $ | 3,772,602 | | | | | | | $ | - | | | | | | | $ | - | | | | | | | $ | - | | | | | | | $ | 3,772,602 | |
| | | | | | | | | | | | | | | | | | | | | | | | | | | | | | | | | | | | |
Total Borrowings | | $ | 3,772,602 | | | | | | | $ | - | | | | | | | $ | - | | | | | | | $ | - | | | | | | | $ | 3,772,602 | |
| | | | | | | | | | | | | | | | | | | | | | | | | | | | | | | | | | | | |
Gross amount of recognized liabilities for securities lending transactions | | | $ | 3,772,602 | |
| | | | | | | | | | | | | | | | | | | | | | | | | | | | | | | | | | | | |
6. Federal Income and Excise Taxes
It is the policy of the Fund to qualify as a regulated investment company (“RIC”), by complying with all applicable provisions of Subchapter M of the Internal Revenue Code, as amended, and to make distributions of taxable income sufficient to relieve it from substantially all federal income and excise taxes. For federal income tax purposes, the Fund is treated as a single entity for the purpose of determining such qualification.
The Fund does not have any unrecorded tax liabilities in the accompanying financial statements. Each of the tax years in the four year ended June 30, 2024 remain subject to examination by the Internal Revenue Service. If applicable, the Fund recognizes interest accrued related to unrecognized tax benefits in interest expense and penalties in “Other expenses” on the Statement of Operations.
The Fund may be subject to taxes imposed by countries in which it invests. Such taxes are generally based on returns of income earned or gains realized or repatriated. Taxes are accrued and applied to net investment income, net realized capital gains and net unrealized appreciation (depreciation), as applicable, as the income is earned or capital gains are recorded.
Dividends are categorized in accordance with income tax regulations which may treat certain transactions differently than U.S. GAAP. Accordingly, the character of distributions and composition of net assets for tax purposes may differ from those reflected in the accompanying financial statements.
The tax character of distributions paid were as follows:
| | | | | | | | | | | | |
| | | Year Ended
June 30, 2024 | | | | | | Year Ended
June 30, 2023 | |
Distributions paid from: | | | | | | | | | | | | |
Long-term capital gains | | | | | | | | | | | | |
R5 Class | | | - | | | | | | | | 267,134 | |
Y Class | | | - | | | | | | | | 10,260,124 | |
Investor Class | | | - | | | | | | | | 4,039,338 | |
A Class | | | - | | | | | | | | 1,376,666 | |
C Class | | | - | | | | | | | | 826,866 | |
R6 Class | | | - | | | | | | | | 39,638 | |
| | | | | | | | | | | | |
Total distributions paid | | | - | | | | | | | $ | 16,809,766 | |
| | | | | | | | | | | | |
As of June 30, 2024, the components of distributable earnings (deficits) on a tax basis were as follows:
| | | | | | | | | | | | | | | | | | | | | | | | | | | | |
Fund | | Tax Cost | | | | | | Unrealized
Appreciation | | | | | | Unrealized
(Depreciation) | | | | | | Net Unrealized
Appreciation
(Depreciation) | |
ARK Transformational Innovation | | $ | 287,787,944 | | | | | | | $ | 42,119,214 | | | | | | | $ | (126,689,615 | ) | | | | | | $ | (84,570,401 | ) |
23
American Beacon ARK Transformational Innovation FundSM
Notes to Financial Statements
June 30, 2024
| | | | | | | | | | | | | | | | | | | | | | | | | | | | | | | | | | | | | | | | | | | | |
Fund | | Net Unrealized
Appreciation
(Depreciation) | | | | | | Undistributed
Ordinary
Income | | | | | | Undistributed
Long-Term
Capital Gains | | | | | | Accumulated
Capital and
Other (Losses) | | | | | | Other Temporary
Differences | | | | | | Distributable
Earnings | |
ARK Transformational Innovation | | $ | (84,570,401 | ) | | | | | | $ | - | | | | | | | $ | - | | | | | | | $ | (343,726,424 | ) | | | | | | $ | 1 | | | | | | | $ | (428,296,824 | ) |
Financial reporting records are adjusted for permanent book/tax differences to reflect tax character. Financial records are not adjusted for temporary differences. The temporary differences between financial reporting and tax-basis reporting of unrealized appreciation (depreciation) are attributable primarily to the tax deferral of losses from wash sales, the deferral of late year losses and the realization for tax purposes of unrealized gains from passive foreign investment companies.
Due to inherent differences in the recognition of income, expenses, and realized gains (losses) under U.S. GAAP and federal income tax regulations, permanent differences between book and tax reporting have been identified and appropriately reclassified on the Statement of Assets and Liabilities.
Accordingly, the following amounts represent current year permanent differences derived from unused net operating losses as of June 30, 2024:
| | | | | | | | | | | | |
Fund | | Paid-in-Capital | | | | | | Distributable
Earnings/(Deficits) | |
| ARK Transformational Innovation | | $ | (2,663,941 | ) | | | | | | $ | 2,663,941 | |
Under the Regulated Investment Company Modernization Act of 2010 (“RIC MOD”), net capital losses recognized by the Fund in taxable years beginning after December 22, 2010 are carried forward indefinitely and retain their character as short-term and/or long-term losses.
As of June 30, 2024, the Fund had the following capital loss carryforwards:
| | | | | | | | | | | | |
Fund | | Short-Term Capital
Loss Carryforwards | | | | | | Long-Term Capital
Loss Carryforwards | |
| ARK Transformational Innovation | | $ | 51,542,805 | | | | | | | $ | 290,903,774 | |
During the year ended June 30, 2024, the Fund utilized $2,222,880 short-term capital loss carryforwards.
The Fund is permitted for tax purposes to defer into the next fiscal year qualified late year losses. Qualified late year capital losses are net losses incurred after October 31 through the Fund’s fiscal year end, June 30, 2024. Qualified late year ordinary losses are specified losses generally incurred after October 31 through the end of the Fund’s fiscal year end, June 30, 2024. For the period ending June 30, 2024, the Fund deferred $1,279,845 ordinary loss to July 1, 2024.
7. Investment Transactions
The aggregate cost of purchases and proceeds from sales and maturities of investments, other than short-term obligations, for the year ended June 30, 2024 were as follows:
| | | | | | | | | | | | |
Fund | | Purchases
(non-U.S.
Government
Securities) | | | | | | Sales
(non-U.S.
Government
Securities) | |
| ARK Transformational Innovation | | $ | 96,017,715 | | | | | | | $ | 171,088,720 | |
24
American Beacon ARK Transformational Innovation FundSM
Notes to Financial Statements
June 30, 2024
A summary of the Fund’s transactions in the USG Select Fund for the year ended June 30, 2024 were as follows:
| | | | | | | | | | | | | | | | | | | | | | | | | | | | | | | | | | |
Fund | | Type of
Transaction | | | | | June 30,
2023
Shares/Fair
Value | | | | | | Purchases | | | | | | Sales | | | | | | June 30,
2024
Shares/Fair
Value | |
| ARK Transformational Innovation | | Direct | | | | | | $ | 7,285,814 | | | | | | | $ | 81,068,711 | | | | | | | $ | 87,605,561 | | | | | | | $ | 748,964 | |
| ARK Transformational Innovation | | Securities Lending | | | | | | | 3,846,396 | | | | | | | | 101,833,331 | | | | | | | | 101,907,125 | | | | | | | | 3,772,602 | |
8. Securities Lending
The Fund may lend its securities to qualified financial institutions, such as certain broker-dealers, to earn additional income. The borrowers are required to secure their loans continuously with collateral in an amount at least equal to the fair value of the securities loaned, initially in an amount at least equal to 102% of the fair value of domestic securities loaned and 105% of the fair value of international securities loaned. Collateral is monitored and marked-to-market daily. Daily mark-to-market amounts are required to be paid to the borrower or received from the borrower by the end of the following business day. This one day settlement for mark-to-market amounts may result in the collateral being temporarily less than the value of the securities on loan or temporarily more than the required minimum collateral.
To the extent that a loan is collateralized by cash, such cash collateral shall be invested by the securities lending agent (the “Agent”) in money market mutual funds and other short-term investments, provided the investments meet certain quality and diversification requirements. Securities purchased with cash collateral proceeds are listed in the Fund’s Schedule of Investments and the collateral is shown on the Statement of Assets and Liabilities as a payable.
Securities lending income is generated from the demand premium (if any) paid by the borrower to borrow a specific security and from the return on investment of cash collateral, reduced by negotiated rebate fees paid to the borrower and transaction costs. To the extent that a loan is secured by non-cash collateral, securities lending income is generated as a demand premium reduced by transaction costs. The Fund, the Agent, and the Manager retained 80%, 10%, and 10%, respectively, of the income generated from securities lending.
While securities are on loan, the Fund continues to receive certain income associated with that security and any gain or loss in the market price that may occur during the term of the loan. In the case of domestic equities, the value of any dividend is received in the form of a substitute payment approximately equal to the dividend. In the case of foreign securities, a negotiated amount is received that is less than the actual dividend, but higher than the dividend amount minus the foreign tax that the Fund would be subject to on the dividend.
Securities lending transactions pose certain risks to the Fund, including that the borrower may not provide additional collateral when required or return the securities when due, that the value of the short-term investments will be less than the amount of cash collateral required to be returned to the borrower, that non-cash collateral may be subject to legal constraints in the event of a borrower bankruptcy, and that the cash collateral investments could become illiquid and unable to be used to return collateral to the borrower. The Fund could also experience delays and costs in gaining access to the collateral. The Fund bears the risk of any deficiency in the amount of the cash collateral available for return to the borrower and any action which impairs its ability to liquidate non-cash collateral to satisfy a borrower default.
As of June 30, 2024, the value of outstanding securities on loan and the value of collateral were as follows:
| | | | | | | | | | | | | | | | | | | | | | | | | | |
Fund | | Fair Value of
Securities on Loan | | | | | Cash Collateral
Received | | | | | | Non-Cash Collateral
Received | | | | | | Total Collateral
Received | |
| ARK Transformational Innovation | | $12,695,570 | | | | | | $ | 3,772,602 | | | | | | | $ | 9,487,764 | | | | | | | $ | 13,260,366 | |
25
American Beacon ARK Transformational Innovation FundSM
Notes to Financial Statements
June 30, 2024
Cash collateral is listed on the Fund’s Schedule of Investments and is shown on the Statement of Assets and Liabilities. Income earned on these investments is included in “Income derived from securities lending” on the Statement of Operations.
Non-cash collateral received by the Fund may not be sold or re-pledged except to satisfy a borrower default. Therefore, non-cash collateral is not included on the Fund’s Schedule of Investments or Statement of Assets and Liabilities.
9. Borrowing Arrangements
Effective November 10, 2023 (the “Effective Date”), the Fund, along with certain other funds managed by the Manager (“Participating Funds”), renewed a committed revolving line of credit (the “Committed Line”) agreement with State Street Bank and Trust Company (the “Bank”) to be used to facilitate portfolio liquidity. The maximum borrowing amount under the Committed Line is $100 million with interest at a rate equal to the higher of (a) Overnight Bank Funding Rate (“OBFR”) daily fluctuating rate per annum equal to 1.25% plus the sum of 0.10% or (b) the Federal Funds daily fluctuating rate per annum on amounts borrowed. Each of the Participating Funds paid a proportional amount of a quarterly commitment fee at a rate of 0.25% per annum on the unused portion of the Committed Line amount. The Committed Line expires November 8, 2024, unless extended by the Bank or terminated by the Participating Funds in accordance with the agreement. Prior to the Effective Date, the maximum borrowing amount under the Committed Line was $100 million with an expiration date November 9, 2023.
On the Effective Date, the Fund, along with certain other Participating Funds managed by the Manager, also renewed an uncommitted discretionary demand revolving line of credit (the “Uncommitted Line”) agreement with the Bank to be used to facilitate portfolio liquidity. The maximum borrowing amount under the Uncommitted Line is $100 million with interest at a rate equal to the higher of (a) OBFR daily fluctuating rate per annum equal to 1.25% plus the sum of 0.10% or (b) the Federal Funds daily fluctuating rate per annum on amounts borrowed on each outstanding loan. Each of the Participating Funds paid a proportional amount of a closing fee of $35,000 on the Effective Date. The Uncommitted Line expires November 8, 2024, unless extended by the Bank or terminated by the Participating Funds in accordance with the agreement. Prior to the Effective Date, the maximum borrowing amount under the Uncommitted Line was $100 million with an expiration date November 9, 2023.
The Participating Funds paid administration, legal and arrangement fees, which are recognized as a component of “Line of credit expense” on the Statement of Operations, along with commitment fees, that have been allocated among the Participating Funds based on average daily net assets.
During the year ended June 30, 2024, the Fund did not utilize these facilities.
10. Capital Share Transactions
The tables below summarize the activity in capital shares for each Class of the Fund:
| | | | | | | | | | | | | | | | | | | | | | | | | | | | |
| | | R5 Class | |
| | | Year Ended
June 30, 2024 | | | | | | Year Ended
June 30, 2023 | |
ARK Transformational Innovation Fund | | Shares | | | | | | Amount | | | | | | Shares | | | | | | Amount | |
| Shares sold | | | 113,388 | | | | | | | $ | 1,455,038 | | | | | | | | 81,761 | | | | | | | $ | 912,917 | |
| Reinvestment of dividends | | | - | | | | | | | | - | | | | | | | | 30,642 | | | | | | | | 264,744 | |
| Shares redeemed | | | (279,223 | ) | | | | | | | (3,448,097 | ) | | | | | | | (128,977 | ) | | | | | | | (1,433,848 | ) |
| | | | | | | | | | | | | | | | | | | | | | | | | | | | |
| Net (decrease) in shares outstanding | | | (165,835 | ) | | | | | | $ | (1,993,059 | ) | | | | | | | (16,574 | ) | | | | | | $ | (256,187 | ) |
| | | | | | | | | | | | | | | | | | | | | | | | | | | | |
| | | | |
26
American Beacon ARK Transformational Innovation FundSM
Notes to Financial Statements
June 30, 2024
| | | | | | | | | | | | | | | | | | | | | | | | | | | | |
| | | Y Class | |
| | | Year Ended
June 30, 2024 | | | | | | Year Ended
June 30, 2023 | |
ARK Transformational Innovation Fund | | Shares | | | | | | Amount | | | | | | Shares | | | | | | Amount | |
| Shares sold | | | 3,340,457 | | | | | | | $ | 41,468,602 | | | | | | | | 6,072,595 | | | | | | | $ | 69,213,029 | |
| Reinvestment of dividends | | | - | | | | | | | | - | | | | | | | | 1,177,624 | | | | | | | | 10,115,788 | |
| Shares redeemed | | | (8,023,898 | ) | | | | | | | (100,969,989 | ) | | | | | | | (7,757,274 | ) | | | | | | | (85,969,323 | ) |
| | | | | | | | | | | | | | | | | | | | | | | | | | | | |
| Net (decrease) in shares outstanding | | | (4,683,441 | ) | | | | | | $ | (59,501,387 | ) | | | | | | | (507,055 | ) | | | | | | $ | (6,640,506 | ) |
| | | | | | | | | | | | | | | | | | | | | | | | | | | | |
| | | | |
| | | Investor Class | |
| | | Year Ended
June 30, 2024 | | | | | | Year Ended
June 30, 2023 | |
ARK Transformational Innovation Fund | | Shares | | | | | | Amount | | | | | | Shares | | | | | | Amount | |
| Shares sold | | | 1,368,085 | | | | | | | $ | 16,852,077 | | | | | | | | 1,629,724 | | | | | | | $ | 18,019,878 | |
| Reinvestment of dividends | | | - | | | | | | | | - | | | | | | | | 477,004 | | | | | | | | 4,035,453 | |
| Shares redeemed | | | (2,962,521 | ) | | | | | | | (36,168,363 | ) | | | | | | | (2,083,291 | ) | | | | | | | (22,811,873 | ) |
| | | | | | | | | | | | | | | | | | | | | | | | | | | | |
| Net increase (decrease) in shares outstanding | | | (1,594,436 | ) | | | | | | $ | (19,316,286 | ) | | | | | | | 23,437 | | | | | | | $ | (756,542 | ) |
| | | | | | | | | | | | | | | | | | | | | | | | | | | | |
| | | | | | | | | | | | | | | | | | | | | | | | | | | | |
| | | A Class | |
| | | Year Ended
June 30, 2024 | | | | | | Year Ended
June 30, 2023 | |
ARK Transformational Innovation Fund | | Shares | | | | | | Amount | | | | | | Shares | | | | | | Amount | |
| Shares sold | | | 309,243 | | | | | | | $ | 3,925,035 | | | | | | | | 421,138 | | | | | | | $ | 4,527,596 | |
| Reinvestment of dividends | | | - | | | | | | | | - | | | | | | | | 158,643 | | | | | | | | 1,338,947 | |
| Shares redeemed | | | (727,265 | ) | | | | | | | (8,859,833 | ) | | | | | | | (682,004 | ) | | | | | | | (7,213,188 | ) |
| | | | | | | | | | | | | | | | | | | | | | | | | | | | |
| Net (decrease) in shares outstanding | | | (418,022 | ) | | | | | | $ | (4,934,798 | ) | | | | | | | (102,223 | ) | | | | | | $ | (1,346,645 | ) |
| | | | | | | | | | | | | | | | | | | | | | | | | | | | |
| | | | |
| | | C Class | |
| | | Year Ended
June 30, 2024 | | | | | | Year Ended
June 30, 2023 | |
ARK Transformational Innovation Fund | | Shares | | | | | | Amount | | | | | | Shares | | | | | | Amount | |
| Shares sold | | | 82,124 | | | | | | | $ | 984,225 | | | | | | | | 127,226 | | | | | | | $ | 1,386,904 | |
| Reinvestment of dividends | | | - | | | | | | | | - | | | | | | | | 100,239 | | | | | | | | 823,965 | |
| Shares redeemed | | | (307,047 | ) | | | | | | | (3,655,450 | ) | | | | | | | (249,039 | ) | | | | | | | (2,567,216 | ) |
| | | | | | | | | | | | | | | | | | | | | | | | | | | | |
| Net (decrease) in shares outstanding | | | (224,923 | ) | | | | | | $ | (2,671,225 | ) | | | | | | | (21,574 | ) | | | | | | $ | (356,347 | ) |
| | | | | | | | | | | | | | | | | | | | | | | | | | | | |
| | | | |
| | | R6 Class | |
| | | Year Ended
June 30, 2024 | | | | | | Year Ended
June 30, 2023 | |
ARK Transformational Innovation Fund | | Shares | | | | | | Amount | | | | | | Shares | | | | | | Amount | |
| Shares sold | | | 168,394 | | | | | | | $ | 2,103,110 | | | | | | | | 23,953 | | | | | | | $ | 262,316 | |
| Reinvestment of dividends | | | - | | | | | | | | - | | | | | | | | 4,598 | | | | | | | | 39,638 | |
| Shares redeemed | | | (37,517 | ) | | | | | | | (464,474 | ) | | | | | | | (7,308 | ) | | | | | | | (78,957 | ) |
| | | | | | | | | | | | | | | | | | | | | | | | | | | | |
| Net increase in shares outstanding | | | 130,877 | | | | | | | $ | 1,638,636 | | | | | | | | 21,243 | | | | | | | $ | 222,997 | |
| | | | | | | | | | | | | | | | | | | | | | | | | | | | |
11. Subsequent Events
Management has evaluated subsequent events for possible recognition or disclosure in the financial statements through the date the financial statements are issued. Management has determined that there are no material events that would require disclosure in the Fund’s financial statements through this date.
27
American Beacon ARK Transformational Innovation FundSM
Financial Highlights
(For a share outstanding throughout the period)
| | | | | | | | | | | | | | | | | | | | | | | | | | | | | | | | | | | | |
| | | R5 ClassA | |
| | | Year Ended June 30, | |
| | | 2024 | | | | | | 2023 | | | | | | 2022 | | | | | | 2021 | | | | | | 2020 | |
| | | | |
Net asset value, beginning of period | | $ | 12.10 | | | | | | | $ | 11.82 | | | | | | | $ | 48.75 | | | | | | | $ | 27.41 | | | | | | | $ | 18.59 | |
| | | | | | | | | | | | | | | | | | | | | | | | | | | | | | | | | | | | |
Income (loss) from investment operations: | | | | | | | | | | | | | | | | | | | | | | | | | | | | | | | | | | | | |
Net investment (loss) | | | (1.52 | ) | | | | | | | (0.17 | ) | | | | | | | (0.12 | )B | | | | | | | (0.34 | )D | | | | | | | (0.16 | )B C |
Net gains (losses) on investments (both realized and unrealized) | | | 1.51 | | | | | | | | 1.26 | | | | | | | | (28.04 | ) | | | | | | | 21.91 | | | | | | | | 9.60 | |
| | | | | | | | | | | | | | | | | | | | | | | | | | | | | | | | | | | | |
Total income (loss) from investment operations | | | (0.01 | ) | | | | | | | 1.09 | | | | | | | | (28.16 | ) | | | | | | | 21.57 | | | | | | | | 9.44 | |
| | | | | | | | | | | | | | | | | | | | | | | | | | | | | | | | | | | | |
Less distributions: | | | | | | | | | | | | | | | | | | | | | | | | | | | | | | | | | | | | |
Dividends from net investment income | | | - | | | | | | | | - | | | | | | | | (0.90 | ) | | | | | | | (0.07 | ) | | | | | | | (0.03 | ) |
Distributions from net realized gains | | | - | | | | | | | | (0.81 | ) | | | | | | | (7.87 | ) | | | | | | | (0.16 | ) | | | | | | | (0.59 | ) |
| | | | | | | | | | | | | | | | | | | | | | | | | | | | | | | | | | | | |
Total distributions | | | - | | | | | | | | (0.81 | ) | | | | | | | (8.77 | ) | | | | | | | (0.23 | ) | | | | | | | (0.62 | ) |
| | | | | | | | | | | | | | | | | | | | | | | | | | | | | | | | | | | | |
Net asset value, end of period | | $ | 12.09 | | | | | | | $ | 12.10 | | | | | | | $ | 11.82 | | | | | | | $ | 48.75 | | | | | | | $ | 27.41 | |
| | | | | | | | | | | | | | | | | | | | | | | | | | | | | | | | | | | | |
Total returnE | | | (0.08 | )% | | | | | | | 11.98 | % | | | | | | | (68.27 | )% | | | | | | | 78.67 | % | | | | | | | 52.22 | % |
| | | | | | | | | | | | | | | | | | | | | | | | | | | | | | | | | | | | |
| | | | | | | | | |
Ratios and supplemental data: | | | | | | | | | | | | | | | | | | | | | | | | | | | | | | | | | | | | |
Net assets, end of period | | $ | 2,467,952 | | | | | | | $ | 4,474,962 | | | | | | | $ | 4,569,803 | | | | | | | $ | 16,943,552 | | | | | | | $ | 8,438,698 | |
Ratios to average net assets: | | | | | | | | | | | | | | | | | | | | | | | | | | | | | | | | | | | | |
Expenses, before reimbursements and/or recoupments | | | 1.13 | % | | | | | | | 1.13 | % | | | | | | | 1.12 | % | | | | | | | 1.03 | % | | | | | | | 1.24 | % |
Expenses, net of reimbursements and/or recoupmentsF | | | 1.00 | % | | | | | | | 0.99 | % | | | | | | | 1.06 | % | | | | | | | 1.00 | % | | | | | | | 1.00 | % |
Net investment (loss), before expense reimbursements and/or recoupments | | | (0.97 | )% | | | | | | | (1.03 | )% | | | | | | | (0.47 | )% | | | | | | | (0.87 | )%D | | | | | | | (1.04 | )%C |
Net investment (loss), net of reimbursements and/or recoupments | | | (0.84 | )% | | | | | | | (0.89 | )% | | | | | | | (0.41 | )% | | | | | | | (0.84 | )%D | | | | | | | (0.80 | )%C |
Portfolio turnover rate | | | 38 | % | | | | | | | 33 | % | | | | | | | 59 | % | | | | | | | 61 | % | | | | | | | 28 | % |
| A | Prior to February 28, 2020, the R5 Class was known as Institutional Class. |
| B | Per share amounts have been calculated using the average shares method. |
| C | Net investment income includes a significant dividend payment from Xilinx, Inc. amounting to $0.0021. |
| D | Net investment income includes a significant dividend payment from Novartis AG, ADR amounting to $0.0114. |
| E | Based on net asset value, which does not reflect the sales charge, redemption fee, or contingent deferred sales charge, if applicable. May include adjustments in accordance with U.S. GAAP and as such, the net asset value for reporting purposes and the returns based upon those net asset values may differ from the net asset value and returns for shareholder transactions. |
| F | Expense ratios may exceed stated expense caps in Note 2 due to security lending expenses. |
See accompanying notes
28
American Beacon ARK Transformational Innovation FundSM
Financial Highlights
(For a share outstanding throughout the period)
| | | | | | | | | | | | | | | | | | | | | | | | | | | | | | | | | | | | |
| | | Y Class | |
| | | Year Ended June 30, | |
| | | 2024 | | | | | | 2023 | | | | | | 2022 | | | | | | 2021 | | | | | | 2020 | |
| | | | |
Net asset value, beginning of period | | $ | 12.02 | | | | | | | $ | 11.76 | | | | | | | $ | 48.53 | | | | | | | $ | 27.31 | | | | | | | $ | 18.54 | |
| | | | | | | | | | | | | | | | | | | | | | | | | | | | | | | | | | | | |
Income (loss) from investment operations: | | | | | | | | | | | | | | | | | | | | | | | | | | | | | | | | | | | | |
Net investment (loss) | | | (0.88 | ) | | | | | | | (0.16 | ) | | | | | | | (0.04 | ) | | | | | | | (0.29 | )C | | | | | | | (0.19 | )A B |
Net gains (losses) on investments (both realized and unrealized) | | | 0.86 | | | | | | | | 1.23 | | | | | | | | (28.00 | ) | | | | | | | 21.73 | | | | | | | | 9.58 | |
| | | | | | | | | | | | | | | | | | | | | | | | | | | | | | | | | | | | |
Total income (loss) from investment operations | | | (0.02 | ) | | | | | | | 1.07 | | | | | | | | (28.04 | ) | | | | | | | 21.44 | | | | | | | | 9.39 | |
| | | | | | | | | | | | | | | | | | | | | | | | | | | | | | | | | | | | |
Less distributions: | | | | | | | | | | | | | | | | | | | | | | | | | | | | | | | | | | | | |
Dividends from net investment income | | | - | | | | | | | | - | | | | | | | | (0.86 | ) | | | | | | | (0.06 | ) | | | | | | | (0.03 | ) |
Distributions from net realized gains | | | - | | | | | | | | (0.81 | ) | | | | | | | (7.87 | ) | | | | | | | (0.16 | ) | | | | | | | (0.59 | ) |
| | | | | | | | | | | | | | | | | | | | | | | | | | | | | | | | | | | | |
Total distributions | | | - | | | | | | | | (0.81 | ) | | | | | | | (8.73 | ) | | | | | | | (0.22 | ) | | | | | | | (0.62 | ) |
| | | | | | | | | | | | | | | | | | | | | | | | | | | | | | | | | | | | |
Net asset value, end of period | | $ | 12.00 | | | | | | | $ | 12.02 | | | | | | | $ | 11.76 | | | | | | | $ | 48.53 | | | | | | | $ | 27.31 | |
| | | | | | | | | | | | | | | | | | | | | | | | | | | | | | | | | | | | |
Total returnD | | | (0.17 | )% | | | | | | | 11.87 | % | | | | | | | (68.30 | )% | | | | | | | 78.48 | % | | | | | | | 52.09 | % |
| | | | | | | | | | | | | | | | | | | | | | | | | | | | | | | | | | | | |
| | | | | | | | | |
Ratios and supplemental data: | | | | | | | | | | | | | | | | | | | | | | | | | | | | | | | | | | | | |
Net assets, end of period | | $ | 116,564,161 | | | | | | | $ | 172,981,127 | | | | | | | $ | 175,258,402 | | | | | | | $ | 735,669,845 | | | | | | | $ | 220,504,263 | |
Ratios to average net assets: | | | | | | | | | | | | | | | | | | | | | | | | | | | | | | | | | | | | |
Expenses, before reimbursements and/or recoupments | | | 1.17 | % | | | | | | | 1.19 | % | | | | | | | 1.19 | % | | | | | | | 1.11 | % | | | | | | | 1.26 | % |
Expenses, net of reimbursements and/or recoupmentsE | | | 1.09 | % | | | | | | | 1.08 | % | | | | | | | 1.15 | % | | | | | | | 1.09 | % | | | | | | | 1.10 | % |
Net investment (loss), before expense reimbursements and/or recoupments | | | (1.01 | )% | | | | | | | (1.09 | )% | | | | | | | (0.52 | )% | | | | | | | (0.95 | )%C | | | | | | | (1.08 | )%B |
Net investment (loss), net of reimbursements and/or recoupments | | | (0.93 | )% | | | | | | | (0.98 | )% | | | | | | | (0.48 | )% | | | | | | | (0.93 | )%C | | | | | | | (0.92 | )%B |
Portfolio turnover rate | | | 38 | % | | | | | | | 33 | % | | | | | | | 59 | % | | | | | | | 61 | % | | | | | | | 28 | % |
| A | Per share amounts have been calculated using the average shares method. |
| B | Net investment income includes a significant dividend payment from Xilinx, Inc. amounting to $0.0042. |
| C | Net investment income includes a significant dividend payment from Novartis AG, ADR amounting to $0.0150. |
| D | Based on net asset value, which does not reflect the sales charge, redemption fee, or contingent deferred sales charge, if applicable. May include adjustments in accordance with U.S. GAAP and as such, the net asset value for reporting purposes and the returns based upon those net asset values may differ from the net asset value and returns for shareholder transactions. |
| E | Expense ratios may exceed stated expense caps in Note 2 due to security lending expenses. |
See accompanying notes
29
American Beacon ARK Transformational Innovation FundSM
Financial Highlights
(For a share outstanding throughout the period)
| | | | | | | | | | | | | | | | | | | | | | | | | | | | | | | | | | | | |
| | | Investor Class | |
| | | Year Ended June 30, | |
| | | 2024 | | | | | | 2023 | | | | | | 2022 | | | | | | 2021 | | | | | | 2020 | |
| | | | |
Net asset value, beginning of period | | $ | 11.82 | | | | | | | $ | 11.62 | | | | | | | $ | 47.98 | | | | | | | $ | 27.05 | | | | | | | $ | 18.42 | |
| | | | | | | | | | | | | | | | | | | | | | | | | | | | | | | | | | | | |
Income (loss) from investment operations: | | | | | | | | | | | | | | | | | | | | | | | | | | | | | | | | | | | | |
Net investment (loss) | | | (0.89 | ) | | | | | | | (0.13 | ) | | | | | | | (0.37 | ) | | | | | | | (0.37 | )C | | | | | | | (0.25 | )A B |
Net gains (losses) on investments (both realized and unrealized) | | | 0.85 | | | | | | | | 1.14 | | | | | | | | (27.41 | ) | | | | | | | 21.48 | | | | | | | | 9.50 | |
| | | | | | | | | | | | | | | | | | | | | | | | | | | | | | | | | | | | |
Total income (loss) from investment operations | | | (0.04 | ) | | | | | | | 1.01 | | | | | | | | (27.78 | ) | | | | | | | 21.11 | | | | | | | | 9.25 | |
| | | | | | | | | | | | | | | | | | | | | | | | | | | | | | | | | | | | |
Less distributions: | | | | | | | | | | | | | | | | | | | | | | | | | | | | | | | | | | | | |
Dividends from net investment income | | | - | | | | | | | | - | | | | | | | | (0.71 | ) | | | | | | | (0.02 | ) | | | | | | | (0.03 | ) |
Distributions from net realized gains | | | - | | | | | | | | (0.81 | ) | | | | | | | (7.87 | ) | | | | | | | (0.16 | ) | | | | | | | (0.59 | ) |
| | | | | | | | | | | | | | | | | | | | | | | | | | | | | | | | | | | | |
Total distributions | | | - | | | | | | | | (0.81 | ) | | | | | | | (8.58 | ) | | | | | | | (0.18 | ) | | | | | | | (0.62 | ) |
| | | | | | | | | | | | | | | | | | | | | | | | | | | | | | | | | | | | |
Net asset value, end of period | | $ | 11.78 | | | | | | | $ | 11.82 | | | | | | | $ | 11.62 | | | | | | | $ | 47.98 | | | | | | | $ | 27.05 | |
| | | | | | | | | | | | | | | | | | | | | | | | | | | | | | | | | | | | |
Total returnD | | | (0.34 | )% | | | | | | | 11.48 | % | | | | | | | (68.36 | )% | | | | | | | 78.03 | % | | | | | | | 51.66 | % |
| | | | | | | | | | | | | | | | | | | | | | | | | | | | | | | | | | | | |
| | | | | | | | | |
Ratios and supplemental data: | | | | | | | | | | | | | | | | | | | | | | | | | | | | | | | | | | | | |
Net assets, end of period | | $ | 45,111,990 | | | | | | | $ | 64,126,589 | | | | | | | $ | 62,722,510 | | | | | | | $ | 331,002,394 | | | | | | | $ | 69,421,549 | |
Ratios to average net assets: | | | | | | | | | | | | | | | | | | | | | | | | | | | | | | | | | | | | |
Expenses, before reimbursements and/or recoupments | | | 1.44 | % | | | | | | | 1.46 | % | | | | | | | 1.45 | % | | | | | | | 1.38 | % | | | | | | | 1.52 | % |
Expenses, net of reimbursements and/or recoupmentsE | | | 1.33 | % | | | | | | | 1.32 | % | | | | | | | 1.39 | % | | | | | | | 1.34 | % | | | | | | | 1.38 | % |
Net investment (loss), before expense reimbursements and/or recoupments | | | (1.27 | )% | | | | | | | (1.36 | )% | | | | | | | (0.77 | )% | | | | | | | (1.21 | )%C | | | | | | | (1.34 | )%B |
Net investment (loss), net of reimbursements and/or recoupments | | | (1.16 | )% | | | | | | | (1.22 | )% | | | | | | | (0.71 | )% | | | | | | | (1.17 | )%C | | | | | | | (1.19 | )%B |
Portfolio turnover rate | | | 38 | % | | | | | | | 33 | % | | | | | | | 59 | % | | | | | | | 61 | % | | | | | | | 28 | % |
| A | Per share amounts have been calculated using the average shares method. |
| B | Net investment income includes a significant dividend payment from Xilinx, Inc. amounting to $0.0063. |
| C | Net investment income includes a significant dividend payment from Novartis AG, ADR amounting to $0.0143. |
| D | Based on net asset value, which does not reflect the sales charge, redemption fee, or contingent deferred sales charge, if applicable. May include adjustments in accordance with U.S. GAAP and as such, the net asset value for reporting purposes and the returns based upon those net asset values may differ from the net asset value and returns for shareholder transactions. |
| E | Expense ratios may exceed stated expense caps in Note 2 due to security lending expenses. |
See accompanying notes
30
American Beacon ARK Transformational Innovation FundSM
Financial Highlights
(For a share outstanding throughout the period)
| | | | | | | | | | | | | | | | | | | | | | | | | | | | | | | | | | | | |
| | | A Class | |
| | | Year Ended June 30, | |
| | | 2024 | | | | | | 2023 | | | | | | 2022 | | | | | | 2021 | | | | | | 2020 | |
| | | | |
Net asset value, beginning of period | | $ | 11.80 | | | | | | | $ | 11.60 | | | | | | | $ | 48.00 | | | | | | | $ | 27.05 | | | | | | | $ | 18.42 | |
| | | | | | | | | | | | | | | | | | | | | | | | | | | | | | | | | | | | |
Income (loss) from investment operations: | | | | | | | | | | | | | | | | | | | | | | | | | | | | | | | | | | | | |
Net investment (loss) | | | (0.64 | ) | | | | | | | (0.22 | ) | | | | | | | (0.06 | ) | | | | | | | (0.35 | )B | | | | | | | (0.06 | )A |
Net gains (losses) on investments (both realized and unrealized) | | | 0.59 | | | | | | | | 1.23 | | | | | | | | (27.74 | ) | | | | | | | 21.46 | | | | | | | | 9.31 | |
| | | | | | | | | | | | | | | | | | | | | | | | | | | | | | | | | | | | |
Total income (loss) from investment operations | | | (0.05 | ) | | | | | | | 1.01 | | | | | | | | (27.80 | ) | | | | | | | 21.11 | | | | | | | | 9.25 | |
| | | | | | | | | | | | | | | | | | | | | | | | | | | | | | | | | | | | |
Less distributions: | | | | | | | | | | | | | | | | | | | | | | | | | | | | | | | | | | | | |
Dividends from net investment income | | | - | | | | | | | | - | | | | | | | | (0.73 | ) | | | | | | | (0.00 | )C | | | | | | | (0.03 | ) |
Distributions from net realized gains | | | - | | | | | | | | (0.81 | ) | | | | | | | (7.87 | ) | | | | | | | (0.16 | ) | | | | | | | (0.59 | ) |
| | | | | | | | | | | | | | | | | | | | | | | | | | | | | | | | | | | | |
Total distributions | | | - | | | | | | | | (0.81 | ) | | | | | | | (8.60 | ) | | | | | | | (0.16 | ) | | | | | | | (0.62 | ) |
| | | | | | | | | | | | | | | | | | | | | | | | | | | | | | | | | | | | |
Net asset value, end of period | | $ | 11.75 | | | | | | | $ | 11.80 | | | | | | | $ | 11.60 | | | | | | | $ | 48.00 | | | | | | | $ | 27.05 | |
| | | | | | | | | | | | | | | | | | | | | | | | | | | | | | | | | | | | |
Total returnD | | | (0.42 | )% | | | | | | | 11.51 | % | | | | | | | (68.40 | )% | | | | | | | 78.03 | % | | | | | | | 51.66 | % |
| | | | | | | | | | | | | | | | | | | | | | | | | | | | | | | | | | | | |
| | | | | | | | | |
Ratios and supplemental data: | | | | | | | | | | | | | | | | | | | | | | | | | | | | | | | | | | | | |
Net assets, end of period | | $ | 15,827,888 | | | | | | | $ | 20,818,534 | | | | | | | $ | 21,659,351 | | | | | | | $ | 83,589,357 | | | | | | | $ | 23,391,480 | |
Ratios to average net assets: | | | | | | | | | | | | | | | | | | | | | | | | | | | | | | | | | | | | |
Expenses, before reimbursements and/or recoupments | | | 1.50 | % | | | | | | | 1.56 | % | | | | | | | 1.43 | % | | | | | | | 1.37 | % | | | | | | | 1.66 | % |
Expenses, net of reimbursements and/or recoupmentsE | | | 1.35 | % | | | | | | | 1.41 | %F | | | | | | | 1.43 | % | | | | | | | 1.37 | % | | | | | | | 1.40 | % |
Net investment (loss), before expense reimbursements and/or recoupments | | | (1.33 | )% | | | | | | | (1.46 | )% | | | | | | | (0.76 | )% | | | | | | | (1.21 | )%B | | | | | | | (1.47 | )%A |
Net investment (loss), net of reimbursements and/or recoupments | | | (1.18 | )% | | | | | | | (1.31 | )% | | | | | | | (0.76 | )% | | | | | | | (1.21 | )%B | | | | | | | (1.21 | )%A |
Portfolio turnover rate | | | 38 | % | | | | | | | 33 | % | | | | | | | 59 | % | | | | | | | 61 | % | | | | | | | 28 | % |
| A | Net investment income includes a significant dividend payment from Xilinx, Inc. amounting to $(0.0608). |
| B | Net investment income includes a significant dividend payment from Novartis AG, ADR amounting to $0.0160. |
| C | Amount represents less than $0.01 per share. |
| D | Based on net asset value, which does not reflect the sales charge, redemption fee, or contingent deferred sales charge, if applicable. May include adjustments in accordance with U.S. GAAP and as such, the net asset value for reporting purposes and the returns based upon those net asset values may differ from the net asset value and returns for shareholder transactions. |
| E | Expense ratios may exceed stated expense caps in Note 2 due to security lending expenses. |
| F | Expense ratios may exceed stated expense caps in Note 2 due to the change in the voluntary expense caps on November 1, 2022. |
See accompanying notes
31
American Beacon ARK Transformational Innovation FundSM
Financial Highlights
(For a share outstanding throughout the period)
| | | | | | | | | | | | | | | | | | | | | | | | | | | | | | | | | | | | |
| | | C Class | |
| | | Year Ended June 30, | |
| | | 2024 | | | | | | 2023 | | | | | | 2022 | | | | | | 2021 | | | | | | 2020 | |
| | | | |
Net asset value, beginning of period | | $ | 11.44 | | | | | | | $ | 11.37 | | | | | | | $ | 47.16 | | | | | | | $ | 26.78 | | | | | | | $ | 18.35 | |
| | | | | | | | | | | | | | | | | | | | | | | | | | | | | | | | | | | | |
Income (loss) from investment operations: | | | | | | | | | | | | | | | | | | | | | | | | | | | | | | | | | | | | |
Net investment (loss) | | | (0.73 | ) | | | | | | | (0.26 | ) | | | | | | | (0.27 | ) | | | | | | | (0.61 | )B | | | | | | | (0.09 | )A |
Net gains (losses) on investments (both realized and unrealized) | | | 0.60 | | | | | | | | 1.14 | | | | | | | | (27.23 | ) | | | | | | | 21.15 | | | | | | | | 9.11 | |
| | | | | | | | | | | | | | | | | | | | | | | | | | | | | | | | | | | | |
Total income (loss) from investment operations | | | (0.13 | ) | | | | | | | 0.88 | | | | | | | | (27.50 | ) | | | | | | | 20.54 | | | | | | | | 9.02 | |
| | | | | | | | | | | | | | | | | | | | | | | | | | | | | | | | | | | | |
Less distributions: | | | | | | | | | | | | | | | | | | | | | | | | | | | | | | | | | | | | |
Dividends from net investment income | | | - | | | | | | | | - | | | | | | | | (0.42 | ) | | | | | | | - | | | | | | | | - | |
Distributions from net realized gains | | | - | | | | | | | | (0.81 | ) | | | | | | | (7.87 | ) | | | | | | | (0.16 | ) | | | | | | | (0.59 | ) |
| | | | | | | | | | | | | | | | | | | | | | | | | | | | | | | | | | | | |
Total distributions | | | - | | | | | | | | (0.81 | ) | | | | | | | (8.29 | ) | | | | | | | (0.16 | ) | | | | | | | (0.59 | ) |
| | | | | | | | | | | | | | | | | | | | | | | | | | | | | | | | | | | | |
Net asset value, end of period | | $ | 11.31 | | | | | | | $ | 11.44 | | | | | | | $ | 11.37 | | | | | | | $ | 47.16 | | | | | | | $ | 26.78 | |
| | | | | | | | | | | | | | | | | | | | | | | | | | | | | | | | | | | | |
Total returnC | | | (1.14 | )% | | | | | | | 10.55 | % | | | | | | | (68.62 | )% | | | | | | | 76.68 | % | | | | | | | 50.54 | % |
| | | | | | | | | | | | | | | | | | | | | | | | | | | | | | | | | | | | |
| | | | | | | | | |
Ratios and supplemental data: | | | | | | | | | | | | | | | | | | | | | | | | | | | | | | | | | | | | |
Net assets, end of period | | $ | 9,397,516 | | | | | | | $ | 12,078,215 | | | | | | | $ | 12,244,432 | | | | | | | $ | 44,900,174 | | | | | | | $ | 15,060,539 | |
Ratios to average net assets: | | | | | | | | | | | | | | | | | | | | | | | | | | | | | | | | | | | | |
Expenses, before reimbursements and/or recoupments | | | 2.30 | % | | | | | | | 2.37 | % | | | | | | | 2.19 | % | | | | | | | 2.12 | % | | | | | | | 2.31 | % |
Expenses, net of reimbursements and/or recoupmentsD | | | 2.11 | % | | | | | | | 2.19 | %E | | | | | | | 2.19 | % | | | | | | | 2.12 | % | | | | | | | 2.15 | % |
Net investment (loss), before expense reimbursements and/or recoupments | | | (2.13 | )% | | | | | | | (2.27 | )% | | | | | | | (1.52 | )% | | | | | | | (1.96 | )%B | | | | | | | (2.13 | )%A |
Net investment (loss), net of reimbursements | | | (1.94 | )% | | | | | | | (2.09 | )% | | | | | | | (1.52 | )% | | | | | | | (1.96 | )%B | | | | | | | (1.97 | )%A |
Portfolio turnover rate | | | 38 | % | | | | | | | 33 | % | | | | | | | 59 | % | | | | | | | 61 | % | | | | | | | 28 | % |
| A | Net investment income includes a significant dividend payment from Xilinx, Inc. amounting to $(0.0873). |
| B | Net investment income includes a significant dividend payment from Novartis AG, ADR amounting to $0.0154. |
| C | Based on net asset value, which does not reflect the sales charge, redemption fee, or contingent deferred sales charge, if applicable. May include adjustments in accordance with U.S. GAAP and as such, the net asset value for reporting purposes and the returns based upon those net asset values may differ from the net asset value and returns for shareholder transactions. |
| D | Expense ratios may exceed stated expense caps in Note 2 due to security lending expenses. |
| E | Expense ratios may exceed stated expense caps in Note 2 due to the change in the voluntary expense caps on November 1, 2022. |
See accompanying notes
32
American Beacon ARK Transformational Innovation FundSM
Financial Highlights
(For a share outstanding throughout the period)
| | | | | | | | | | | | | | | | | | | | | | | | | | | | |
| | | R6 Class | |
| | | Year Ended June 30, | | | | | | October 28,
2020A to
June 30, 2021 | |
| | | 2024 | | | | | | 2023 | | | | | | 2022 | | | | |
| | | | |
Net asset value, beginning of period | | $ | 12.07 | | | | | | | $ | 11.80 | | | | | | | $ | 48.67 | | | | | | | $ | 36.25 | |
| | | | | | | | | | | | | | | | | | | | | | | | | | | | |
Income from investment operations: | | | | | | | | | | | | | | | | | | | | | | | | | | | | |
Net investment (loss) | | | (0.10 | )B | | | | | | | (0.10 | )B | | | | | | | (0.55 | ) | | | | | | | (0.14 | )C |
Net gains (losses) on investments (both realized and unrealized) | | | 0.10 | | | | | | | | 1.18 | | | | | | | | (27.54 | ) | | | | | | | 12.78 | |
| | | | | | | | | | | | | | | | | | | | | | | | | | | | |
Total income (loss) from investment operations | | | - | | | | | | | | 1.08 | | | | | | | | (28.09 | ) | | | | | | | 12.64 | |
| | | | | | | | | | | | | | | | | | | | | | | | | | | | |
Less distributions: | | | | | | | | | | | | | | | | | | | | | | | | | | | | |
Dividends from net investment income | | | - | | | | | | | | - | | | | | | | | (0.91 | ) | | | | | | | (0.06 | ) |
Distributions from net realized gains | | | - | | | | | | | | (0.81 | ) | | | | | | | (7.87 | ) | | | | | | | (0.16 | ) |
| | | | | | | | | | | | | | | | | | | | | | | | | | | | |
Total distributions | | | - | | | | | | | | (0.81 | ) | | | | | | | (8.78 | ) | | | | | | | (0.22 | ) |
| | | | | | | | | | | | | | | | | | | | | | | | | | | | |
Net asset value, end of period | | $ | 12.07 | | | | | | | $ | 12.07 | | | | | | | $ | 11.80 | | | | | | | $ | 48.67 | |
| | | | | | | | | | | | | | | | | | | | | | | | | | | | |
Total returnD | | | - | % | | | | | | | 11.92 | % | | | | | | | (68.25 | )% | | | | | | | 34.86 | %E |
| | | | | | | | | | | | | | | | | | | | | | | | | | | | |
| | | | | | | |
Ratios and supplemental data: | | | | | | | | | | | | | | | | | | | | | | | | | | | | |
Net assets, end of period | | $ | 2,323,468 | | | | | | | $ | 744,517 | | | | | | | $ | 477,160 | | | | | | | $ | 2,268,341 | |
Ratios to average net assets: | | | | | | | | | | | | | | | | | | | | | | | | | | | | |
Expenses, before reimbursements and/or recoupments | | | 1.13 | % | | | | | | | 1.18 | % | | | | | | | 1.12 | % | | | | | | | 1.22 | %F |
Expenses, net of reimbursements and/or recoupmentsG | | | 1.00 | % | | | | | | | 0.99 | % | | | | | | | 1.04 | % | | | | | | | 0.95 | %F |
Net investment (loss), before expense reimbursements and/or recoupments | | | (0.96 | )% | | | | | | | (1.07 | )% | | | | | | | (0.42 | )% | | | | | | | (1.05 | )%CF |
Net investment (loss), net of reimbursements | | | (0.83 | )% | | | | | | | (0.88 | )% | | | | | | | (0.34 | )% | | | | | | | (0.78 | )%CF |
Portfolio turnover rate | | | 38 | % | | | | | | | 33 | % | | | | | | | 59 | % | | | | | | | 61 | %E |
| A | Commencement of operations. |
| B | Per share amounts have been calculated using the average shares method. |
| C | Net investment income includes a significant dividend payment from Novartis AG, ADR amounting to $0.0197. |
| D | Based on net asset value, which does not reflect the sales charge, redemption fee, or contingent deferred sales charge, if applicable. May include adjustments in accordance with U.S. GAAP and as such, the net asset value for reporting purposes and the returns based upon those net asset values may differ from the net asset value and returns for shareholder transactions. |
| G | Expense ratios may exceed stated expense caps in Note 2 due to security lending expenses. |
See accompanying notes
33
American Beacon ARK Transformational Innovation FundSM
Federal Tax Information
June 30, 2024 (Unaudited)
Certain tax information regarding the Funds are required to be provided to shareholders based upon the Fund’s income and distributions for the taxable year ended June 30, 2024. The information and distributions reported herein may differ from information and distributions taxable to the shareholders for the calendar year ended December 31, 2024.
The Fund designated the following items with regard to distributions paid during the fiscal year ended June 30, 2024. All designations are based on financial information available as of this annual report and, accordingly, are subject to change. For each item, it is the intention of the Funds to designate the maximum amount permitted under the Internal Revenue Code of 1986, as amended, and the regulations there under.
Corporate Dividends-Received Deduction:
| | | | |
ARK Transformational Innovation | | | N/A | |
Qualified Dividend Income:
| | | | |
ARK Transformational Innovation | | | N/A | |
Long-Term Capital Gain Distributions:
| | | | |
ARK Transformational Innovation | | $ | 0 | |
Short-Term Capital Gain Distributions:
| | | | |
ARK Transformational Innovation | | | $0 | |
Shareholders will receive notification in January 2025 of the applicable tax information necessary to prepare their 2024 income tax returns.
34

Delivery of Documents
If you invest in the Fund through a financial institution, you may be able to receive the Fund’s regulatory mailings, such as the Prospectus, Annual Report, Semi-Annual Report and Financial Statement Reports, by e-mail. If you are interested in this option, please go to www.icsdelivery.com and search for your financial institution’s name or contact your financial institution directly.
You may request a paper copy of this document at no charge by contacting your financial institution. This document is also available for download at www.americanbeaconfunds.com or you can request an electronic copy by contacting your financial institution.
To obtain more information about the Fund:
| | |
 | |  |
| | |
| By E-mail: | | On the Internet: |
| american_beacon.funds@ambeacon.com | | Visit our website at www.americanbeaconfunds.com |
| | | |
| | | |
| | |
 | |  |
By Telephone: Call (800) 658-5811 | | By Mail: American Beacon Funds P.O. Box 219643 Kansas City, MO 64121-9643 |
|
|
|
Fund Service Providers:
| | | | | | | | | | | | |
CUSTODIAN State Street Bank and Trust Company Boston, Massachusetts | | | | TRANSFER AGENT SS&C GIDS, Inc. Quincy, Massachusetts | | | | INDEPENDENT REGISTERED PUBLIC ACCOUNTING FIRM PricewaterhouseCoopers LLP Boston, Massachusetts | | | | DISTRIBUTOR Resolute Investment Distributors, Inc. Irving, Texas |
This report is prepared for shareholders of the American Beacon Funds and may be distributed to others only if preceded or accompanied by a current Prospectus or Summary Prospectus.
American Beacon Funds, and American Beacon ARK Transformational Innovation Fund are service marks of American Beacon Advisors, Inc.
AR 06/24

American Beacon Funds
Although information has been compiled from reliable sources, American Beacon Advisors, Inc. makes no representation as to the completeness or accuracy of the statements contained herein. All information is as of the end of the reporting period, unless noted otherwise, and is subject to change. Each Fund’s portfolio composition will change depending on economic and market conditions.
American Beacon Funds | June 30, 2024 |
Contents
American Beacon FundsSM
Report of Independent Registered Public Accounting Firm
To the Board of Trustees of American Beacon Funds and Shareholders of American Beacon Shapiro Equity Opportunities Fund and American Beacon Shapiro SMID Cap Equity Fund
Opinions on the Financial Statements
We have audited the accompanying statements of assets and liabilities, including the schedules of investments, of American Beacon Shapiro Equity Opportunities Fund and American Beacon Shapiro SMID Cap Equity Fund (two of the funds constituting American Beacon Funds, hereafter collectively referred to as the “Funds”) as of June 30, 2024, the related statements of operations for the year ended June 30, 2024, the statements of changes in net assets for each of the two years in the period ended June 30, 2024, including the related notes, and the financial highlights for each of the periods indicated therein (collectively referred to as the “financial statements”). In our opinion, the financial statements present fairly, in all material respects, the financial position of each of the Funds as of June 30, 2024, the results of each of their operations for the year then ended, the changes in each of their net assets for each of the two years in the period ended June 30, 2024 and each of the financial highlights for each of the periods indicated therein in conformity with accounting principles generally accepted in the United States of America.
Basis for Opinions
These financial statements are the responsibility of the Funds’ management. Our responsibility is to express an opinion on the Funds’ financial statements based on our audits. We are a public accounting firm registered with the Public Company Accounting Oversight Board (United States) (PCAOB) and are required to be independent with respect to the Funds in accordance with the U.S. federal securities laws and the applicable rules and regulations of the Securities and Exchange Commission and the PCAOB.
We conducted our audits of these financial statements in accordance with the standards of the PCAOB. Those standards require that we plan and perform the audit to obtain reasonable assurance about whether the financial statements are free of material misstatement, whether due to error or fraud.
Our audits included performing procedures to assess the risks of material misstatement of the financial statements, whether due to error or fraud, and performing procedures that respond to those risks. Such procedures included examining, on a test basis, evidence regarding the amounts and disclosures in the financial statements. Our audits also included evaluating the accounting principles used and significant estimates made by management, as well as evaluating the overall presentation of the financial statements. Our procedures included confirmation of securities owned as of June 30, 2024 by correspondence with the custodians and brokers; when replies were not received from brokers, we performed other auditing procedures. We believe that our audits provide a reasonable basis for our opinions.
/s/ PricewaterhouseCoopers LLP
Boston, Massachusetts
August 29, 2024
We have served as the auditor of one or more investment companies in the American Beacon family of funds since 2016.
1
American Beacon Shapiro Equity Opportunities FundSM
Schedule of Investments
June 30, 2024
| | | | | | | | | | | | | | | |
| | | |
| | | Shares | | | | Fair Value |
| | | | | | | |
| | | |
| COMMON STOCKS - 97.07% | | | | | | |
| | | |
| Communication Services - 15.13% | | | | | | |
| | | |
| Entertainment - 10.19% | | | | | | |
| Lions Gate Entertainment Corp., Class BA | | | | 817,504 | | | | | | | | | $ | 7,006,009 | |
| Walt Disney Co. | | | | 65,250 | | | | | | | | | | 6,478,673 | |
| | | | | | | | | | | | | | | |
| | | | | | | | | | | | | | 13,484,682 | |
| | | | | | | | | | | | | | | |
| | | | | | | | | | | | | | | |
| | | |
| Interactive Media & Services - 4.94% | | | | | | |
| Alphabet, Inc., Class C | | | | 35,630 | | | | | | | | | | 6,535,254 | |
| | | | | | | | | | | | | | | |
| | | | | | | | | | | | | | | |
Total Communication Services | | | | | | | | | | | | | | 20,019,936 | |
| | | | | | | | | | | | | | | |
| | | | | | | | | | | | | | | |
| | | |
| Consumer Discretionary - 15.35% | | | | | | |
| | | |
| Hotels, Restaurants & Leisure - 4.17% | | | | | | |
| Penn Entertainment, Inc.A B | | | | 285,300 | | | | | | | | | | 5,521,982 | |
| | | | | | | | | | | | | | | |
| | | | | | | | | | | | | | | |
| | | |
| Household Durables - 4.94% | | | | | | |
| Mohawk Industries, Inc.A | | | | 57,570 | | | | | | | | | | 6,539,376 | |
| | | | | | | | | | | | | | | |
| | | | | | | | | | | | | | | |
| | | |
| Leisure Products - 4.69% | | | | | | |
| Topgolf Callaway Brands Corp.A | | | | 406,100 | | | | | | | | | | 6,213,330 | |
| | | | | | | | | | | | | | | |
| | | | | | | | | | | | | | | |
| | | |
| Textiles, Apparel & Luxury Goods - 1.55% | | | | | | |
| Carter’s, Inc. | | | | 33,000 | | | | | | | | | | 2,045,010 | |
| | | | | | | | | | | | | | | |
| | | | | | | | | | | | | | | |
Total Consumer Discretionary | | | | | | | | | | | | | | 20,319,698 | |
| | | | | | | | | | | | | | | |
| | | | | | | | | | | | | | | |
| | | |
| Energy - 3.54% | | | | | | |
| | | |
| Oil, Gas & Consumable Fuels - 3.54% | | | | | | |
| Devon Energy Corp. | | | | 98,720 | | | | | | | | | | 4,679,328 | |
| | | | | | | | | | | | | | | |
| | | | | | | | | | | | | | | |
| | | |
| Financials - 14.56% | | | | | | |
| | | |
| Banks - 4.81% | | | | | | |
| Bank of America Corp. | | | | 160,200 | | | | | | | | | | 6,371,154 | |
| | | | | | | | | | | | | | | |
| | | | | | | | | | | | | | | |
| | | |
| Capital Markets - 4.78% | | | | | | |
| Nasdaq, Inc. | | | | 104,880 | | | | | | | | | | 6,320,069 | |
| | | | | | | | | | | | | | | |
| | | | | | | | | | | | | | | |
| | | |
| Financial Services - 4.97% | | | | | | |
| Berkshire Hathaway, Inc., Class BA | | | | 16,155 | | | | | | | | | | 6,571,854 | |
| | | | | | | | | | | | | | | |
| | | | | | | | | | | | | | | |
Total Financials | | | | | | | | | | | | | | 19,263,077 | |
| | | | | | | | | | | | | | | |
| | | | | | | | | | | | | | | |
| | | |
| Health Care - 16.30% | | | | | | |
| | | |
| Health Care Equipment & Supplies - 9.76% | | | | | | |
| Baxter International, Inc. | | | | 188,800 | | | | | | | | | | 6,315,360 | |
| Zimmer Biomet Holdings, Inc. | | | | 60,865 | | | | | | | | | | 6,605,679 | |
| | | | | | | | | | | | | | | |
| | | | | | | | | | | | | | | |
| | | | | | | | | | | | | | 12,921,039 | |
| | | | | | | | | | | | | | | |
| | | | | | | | | | | | | | | |
| | | |
| Life Sciences Tools & Services - 2.56% | | | | | | |
| Avantor, Inc.A | | | | 159,800 | | | | | | | | | | 3,387,760 | |
| | | | | | | | | | | | | | | |
| | | | | | | | | | | | | | | |
| | | |
| Pharmaceuticals - 3.98% | | | | | | |
| Elanco Animal Health, Inc.A | | | | 365,100 | | | | | | | | | | 5,268,393 | |
| | | | | | | | | | | | | | | |
| | | | | | | | | | | | | | | |
Total Health Care | | | | | | | | | | | | | | 21,577,192 | |
| | | | | | | | | | | | | | | |
| | | | | | | | | | | | | | | |
| | | |
| Industrials - 13.76% | | | | | | |
| | | |
| Aerospace & Defense - 4.75% | | | | | | |
| L3Harris Technologies, Inc. | | | | 27,955 | | | | | | | | | | 6,278,134 | |
| | | | | | | | | | | | | | | |
| | | | | | | | | | | | | | | |
See accompanying notes
2
American Beacon Shapiro Equity Opportunities FundSM
Schedule of Investments
June 30, 2024
| | | | | | | | | | | | | | | |
| | | |
| | | Shares | | | | Fair Value |
| | | | | | | |
| | | |
| COMMON STOCKS - 97.07% (continued) | | | | | | |
| | | |
| Industrials - 13.76% (continued) | | | | | | |
| | | |
| Electrical Equipment - 4.48% | | | | | | |
| Sensata Technologies Holding PLC | | | | 158,600 | | | | | | | | | $ | 5,930,054 | |
| | | | | | | | | | | | | | | |
| | | | | | | | | | | | | | | |
| | | |
| Professional Services - 4.53% | | | | | | |
| SS&C Technologies Holdings, Inc. | | | | 95,700 | | | | | | | | | | 5,997,519 | |
| | | | | | | | | | | | | | | |
| | | | | | | | | | | | | | | |
Total Industrials | | | | | | | | | | | | | | 18,205,707 | |
| | | | | | | | | | | | | | | |
| | | | | | | | | | | | | | | |
| | | |
| Information Technology - 11.05% | | | | | | |
| | | |
| Communications Equipment - 1.57% | | | | | | |
| Infinera Corp.A | | | | 339,434 | | | | | | | | | | 2,067,153 | |
| | | | | | | | | | | | | | | |
| | | | | | | | | | | | | | | |
| | | |
| Electronic Equipment, Instruments & Components - 3.51% | | | | | | |
| Corning, Inc. | | | | 119,625 | | | | | | | | | | 4,647,431 | |
| | | | | | | | | | | | | | | |
| | | | | | | | | | | | | | | |
| | | |
| Semiconductors & Semiconductor Equipment - 4.72% | | | | | | |
| Micron Technology, Inc. | | | | 47,490 | | | | | | | | | | 6,246,360 | |
| | | | | | | | | | | | | | | |
| | | | | | | | | | | | | | | |
| | | |
| Software - 1.25% | | | | | | |
| NCR Voyix Corp.A | | | | 134,100 | | | | | | | | | | 1,656,135 | |
| | | | | | | | | | | | | | | |
| | | | | | | | | | | | | | | |
Total Information Technology | | | | | | | | | | | | | | 14,617,079 | |
| | | | | | | | | | | | | | | |
| | | | | | | | | | | | | | | |
| | | |
| Materials - 7.38% | | | | | | |
| | | |
| Chemicals - 2.64% | | | | | | |
| Axalta Coating Systems Ltd.A | | | | 102,320 | | | | | | | | | | 3,496,274 | |
| | | | | | | | | | | | | | | |
| | | | | | | | | | | | | | | |
| | | |
| Containers & Packaging - 4.74% | | | | | | |
| Graphic Packaging Holding Co. | | | | 239,300 | | | | | | | | | | 6,272,053 | |
| | | | | | | | | | | | | | | |
Total Materials | | | | | | | | | | | | | | 9,768,327 | |
| | | | | | | | | | | | | | | |
| | | | | | | | | | | | | | | |
Total Common Stocks (Cost $106,358,196) | | | | | | | | | | | | | | 128,450,344 | |
| | | | | | | | | | | | | | | |
| | | | | | | | | | | | | | | |
TOTAL INVESTMENTS - 97.07% (Cost $106,358,196) | | | | | | | | | | | | | | 128,450,344 | |
OTHER ASSETS, NET OF LIABILITIES - 2.93% | | | | | | | | | | | | | | 3,880,073 | |
| | | | | | | | | | | | | | | |
TOTAL NET ASSETS - 100.00% | | | | | | | | | | | | | $ | 132,330,417 | |
| | | | | | | | | | | | | | | |
| | | | | | | |
| Percentages are stated as a percent of net assets. | | | | | | | | | | | | | | | |
A Non-income producing security.
B All or a portion of this security is on loan, collateralized by either cash and/or U.S. Treasuries, at June 30, 2024 (Note 8).
PLC - Public Limited Company.
The Fund’s investments are summarized by level based on the inputs used to determine their values. As of June 30, 2024, the investments were classified as described below:
| | | | | | | | | | | | | | | | | | | | | | | | | | | | |
Shapiro Equity Opportunities Fund | | Level 1 | | | | | | Level 2 | | | | | | Level 3 | | | | | | Total | |
Assets | | | | | | | | | | | | | | | | | | | | | | | | | | | | |
Common Stocks | | $ | 128,450,344 | | | | | | | $ | - | | | | | | | $ | - | | | | | | | $ | 128,450,344 | |
| | | | | | | | | | | | | | | | | | | | | | | | | | | | |
Total Investments in Securities - Assets | | $ | 128,450,344 | | | | | | | $ | - | | | | | | | $ | - | | | | | | | $ | 128,450,344 | |
| | | | | | | | | | | | | | | | | | | | | | | | | | | | |
U.S. GAAP requires transfers between all levels to/from level 3 be disclosed. During the year ended June 30, 2024, there were no transfers into or out of Level 3.
See accompanying notes
3
American Beacon Shapiro SMID Cap Equity FundSM
Schedule of Investments
June 30, 2024
| | | | | | | | | | | | | | | |
| | | |
| | | Shares | | | | Fair Value |
| | | | | | | |
| | | |
| COMMON STOCKS - 97.46% | | | | | | |
| | | |
| Communication Services - 15.00% | | | | | | |
| | | |
| Entertainment - 15.00% | | | | | | |
| Atlanta Braves Holdings, Inc., Class CA | | | | 56,551 | | | | | | | | | $ | 2,230,371 | |
| Lions Gate Entertainment Corp., Class BA | | | | 243,126 | | | | | | | | | | 2,083,590 | |
| Madison Square Garden Sports Corp.A | | | | 11,643 | | | | | | | | | | 2,190,398 | |
| | | | | | | | | | | | | | | |
| | | | | | | | | | | | | | 6,504,359 | |
| | | | | | | | | | | | | | | |
| | | | | | | | | | | | | | | |
Total Communication Services | | | | | | | | | | | | | | 6,504,359 | |
| | | | | | | | | | | | | | | |
| | | | | | | | | | | | | | | |
| | | |
| Consumer Discretionary - 16.42% | | | | | | |
| | | |
| Hotels, Restaurants & Leisure - 4.07% | | | | | | |
| Penn Entertainment, Inc.A B | | | | 91,100 | | | | | | | | | | 1,763,241 | |
| | | | | | | | | | | | | | | |
| | | | | | | | | | | | | | | |
| | | |
| Household Durables - 4.89% | | | | | | |
| Mohawk Industries, Inc.A | | | | 18,677 | | | | | | | | | | 2,121,520 | |
| | | | | | | | | | | | | | | |
| | | | | | | | | | | | | | | |
| | | |
| Leisure Products - 4.74% | | | | | | |
| Topgolf Callaway Brands Corp.A | | | | 134,300 | | | | | | | | | | 2,054,790 | |
| | | | | | | | | | | | | | | |
| | | | | | | | | | | | | | | |
| | | |
| Specialty Retail - 1.07% | | | | | | |
| Urban Outfitters, Inc.A | | | | 11,327 | | | | | | | | | | 464,973 | |
| | | | | | | | | | | | | | | |
| | | | | | | | | | | | | | | |
| | | |
| Textiles, Apparel & Luxury Goods - 1.65% | | | | | | |
| Carter’s, Inc. | | | | 11,500 | | | | | | | | | | 712,655 | |
| | | | | | | | | | | | | | | |
| | | | | | | | | | | | | | | |
Total Consumer Discretionary | | | | | | | | | | | | | | 7,117,179 | |
| | | | | | | | | | | | | | | |
| | | | | | | | | | | | | | | |
| | | |
| Consumer Staples - 9.33% | | | | | | |
| | | |
| Food Products - 9.33% | | | | | | |
| Ingredion, Inc. | | | | 18,113 | | | | | | | | | | 2,077,561 | |
| TreeHouse Foods, Inc.A | | | | 53,750 | | | | | | | | | | 1,969,400 | |
| | | | | | | | | | | | | | | |
| | | | | | | | | | | | | | 4,046,961 | |
| | | | | | | | | | | | | | | |
| | | | | | | | | | | | | | | |
Total Consumer Staples | | | | | | | | | | | | | | 4,046,961 | |
| | | | | | | | | | | | | | | |
| | | | | | | | | | | | | | | |
| | | |
| Energy - 1.74% | | | | | | |
| | | |
| Oil, Gas & Consumable Fuels - 1.74% | | | | | | |
| Devon Energy Corp. | | | | 15,943 | | | | | | | | | | 755,698 | |
| | | | | | | | | | | | | | | |
| | | | | | | | | | | | | | | |
| | | |
| Health Care - 9.65% | | | | | | |
| | | |
| Health Care Equipment & Supplies - 5.59% | | | | | | |
| Envista Holdings Corp.A | | | | 50,300 | | | | | | | | | | 836,489 | |
| Neogen Corp.A | | | | 44,500 | | | | | | | | | | 695,535 | |
| Varex Imaging Corp.A | | | | 60,474 | | | | | | | | | | 890,782 | |
| | | | | | | | | | | | | | | |
| | | | | | | | | | | | | | 2,422,806 | |
| | | | | | | | | | | | | | | |
| | | | | | | | | | | | | | | |
| | | |
| Pharmaceuticals - 4.06% | | | | | | |
| Elanco Animal Health, Inc.A | | | | 121,982 | | | | | | | | | | 1,760,200 | |
| | | | | | | | | | | | | | | |
| | | | | | | | | | | | | | | |
Total Health Care | | | | | | | | | | | | | | 4,183,006 | |
| | | | | | | | | | | | | | | |
| | | | | | | | | | | | | | | |
| | | |
| Industrials - 18.37% | | | | | | |
| | | |
| Aerospace & Defense - 4.88% | | | | | | |
| BWX Technologies, Inc. | | | | 22,242 | | | | | | | | | | 2,112,990 | |
| | | | | | | | | | | | | | | |
| | | | | | | | | | | | | | | |
| | | |
| Electrical Equipment - 4.58% | | | | | | |
| Sensata Technologies Holding PLC | | | | 53,138 | | | | | | | | | | 1,986,830 | |
| | | | | | | | | | | | | | | |
| | | | | | | | | | | | | | | |
| | | |
| Professional Services - 8.91% | | | | | | |
| Dun & Bradstreet Holdings, Inc. | | | | 194,400 | | | | | | | | | | 1,800,144 | |
See accompanying notes
4
American Beacon Shapiro SMID Cap Equity FundSM
Schedule of Investments
June 30, 2024
| | | | | | | | | | | | | | | |
| | | |
| | | Shares | | | | Fair Value |
| | | | | | | |
| | | |
| COMMON STOCKS - 97.46% (continued) | | | | | | |
| | | |
| Industrials - 18.37% (continued) | | | | | | |
| | | |
| Professional Services - 8.91% (continued) | | | | | | |
| SS&C Technologies Holdings, Inc. | | | | 32,900 | | | | | | | | | $ | 2,061,843 | |
| | | | | | | | | | | | | | | |
| | | | | | | | | | | | | | 3,861,987 | |
| | | | | | | | | | | | | | | |
| | | | | | | | | | | | | | | |
Total Industrials | | | | | | | | | | | | | | 7,961,807 | |
| | | | | | | | | | | | | | | |
| | | | | | | | | | | | | | | |
| | | |
| Information Technology - 13.73% | | | | | | |
| | | |
| Communications Equipment - 3.95% | | | | | | |
| Infinera Corp.A | | | | 280,923 | | | | | | | | | | 1,710,821 | |
| | | | | | | | | | | | | | | |
| | | | | | | | | | | | | | | |
| | | |
| Semiconductors & Semiconductor Equipment - 4.93% | | | | | | |
| Ultra Clean Holdings, Inc.A | | | | 43,577 | | | | | | | | | | 2,135,273 | |
| | | | | | | | | | | | | | | |
| | | | | | | | | | | | | | | |
| | | |
| Software - 4.85% | | | | | | |
| NCR Voyix Corp.A | | | | 170,400 | | | | | | | | | | 2,104,440 | |
| | | | | | | | | | | | | | | |
| | | | | | | | | | | | | | | |
Total Information Technology | | | | | | | | | | | | | | 5,950,534 | |
| | | | | | | | | | | | | | | |
| | | | | | | | | | | | | | | |
| | | |
| Materials - 13.22% | | | | | | |
| | | |
| Chemicals - 8.28% | | | | | | |
| Axalta Coating Systems Ltd.A | | | | 52,855 | | | | | | | | | | 1,806,055 | |
| Ecovyst, Inc.A | | | | 199,074 | | | | | | | | | | 1,785,694 | |
| | | | | | | | | | | | | | | |
| | | | | | | | | | | | | | 3,591,749 | |
| | | | | | | | | | | | | | | |
| | | | | | | | | | | | | | | |
| | | |
| Containers & Packaging - 4.94% | | | | | | |
| Graphic Packaging Holding Co. | | | | 81,636 | | | | | | | | | | 2,139,680 | |
| | | | | | | | | | | | | | | |
Total Materials | | | | | | | | | | | | | | 5,731,429 | |
| | | | | | | | | | | | | | | |
| | | | | | | | | | | | | | | |
Total Common Stocks (Cost $37,261,017) | | | | | | | | | | | | | | 42,250,973 | |
| | | | | | | | | | | | | | | |
| | | | | | | | | | | | | | | |
| | | |
| FOREIGN COMMON STOCKS - 1.74% (Cost $1,768,666) | | | | | | |
| | | |
| Materials - 1.74% | | | | | | |
| | | |
| Chemicals - 1.74% | | | | | | |
| Arcadium Lithium PLCA B | | | | 224,720 | | | | | | | | | | 755,059 | |
| | | | | | | | | | | | | | | |
| | | | | | | | | | | | | | | |
| | | |
| SHORT-TERM INVESTMENTS - 0.97% (Cost $421,949) | | | | | | |
| | | |
| Investment Companies - 0.97% | | | | | | |
| American Beacon U.S. Government Money Market Select Fund, 5.18%C D | | | | 421,949 | | | | | | | | | | 421,949 | |
| | | | | | | | | | | | | | | |
| | | | | | | | | | | | | | | |
TOTAL INVESTMENTS - 100.17% (Cost $39,451,632) | | | | | | | | | | | | | | 43,427,981 | |
LIABILITIES, NET OF OTHER ASSETS - (0.17%) | | | | | | | | | | | | | | (75,157 | ) |
| | | | | | | | | | | | | | | |
TOTAL NET ASSETS - 100.00% | | | | | | | | | | | | | $ | 43,352,824 | |
| | | | | | | | | | | | | | | |
| | | | | | | |
| Percentages are stated as a percent of net assets. | | | | | | | | | | | | | | | |
A Non-income producing security.
B All or a portion of this security is on loan, collateralized by either cash and/or U.S. Treasuries, at June 30, 2024 (Note 8).
C The Fund is affiliated by having the same investment advisor.
D 7-day yield.
PLC - Public Limited Company.
See accompanying notes
5
American Beacon Shapiro SMID Cap Equity FundSM
Schedule of Investments
June 30, 2024
The Fund’s investments are summarized by level based on the inputs used to determine their values. As of June 30, 2024, the investments were classified as described below:
| | | | | | | | | | | | | | | | | | | | | | | | | | | | |
Shapiro SMID Cap Equity Fund | | Level 1 | | | | | | Level 2 | | | | | | Level 3 | | | | | | Total | |
Assets | |
Common Stocks | | $ | 42,250,973 | | | | | | | $ | - | | | | | | | $ | - | | | | | | | $ | 42,250,973 | |
Foreign Common Stocks | | | 755,059 | | | | | | | | - | | | | | | | | - | | | | | | | | 755,059 | |
Short-Term Investments | | | 421,949 | | | | | | | | - | | | | | | | | - | | | | | | | | 421,949 | |
| | | | | | | | | | | | | | | | | | | | | | | | | | | | |
Total Investments in Securities - Assets | | $ | 43,427,981 | | | | | | | $ | - | | | | | | | $ | - | | | | | | | $ | 43,427,981 | |
| | | | | | | | | | | | | | | | | | | | | | | | | | | | |
U.S. GAAP requires transfers between all levels to/from level 3 be disclosed. During the year ended June 30, 2024, there were no transfers into or out of Level 3.
See accompanying notes
6
American Beacon FundsSM
Statements of Assets and Liabilities
June 30, 2024
| | | | | | | | | | | | |
| | | Shapiro Equity
Opportunities Fund | | | | | | Shapiro SMID Cap
Equity Fund | |
Assets: | |
Investments in unaffiliated securities, at fair value§† | | $ | 128,450,344 | | | | | | | $ | 43,006,032 | |
Investments in affiliated securities, at fair value‡ | | | - | | | | | | | | 421,949 | |
Dividends and interest receivable | | | 115,878 | | | | | | | | 10,971 | |
Receivable for investments sold | | | 8,889,212 | | | | | | | | - | |
Receivable for fund shares sold | | | 213,572 | | | | | | | | 13,061 | |
Receivable for tax reclaims | | | - | | | | | | | | 3,289 | |
Receivable for expense reimbursement (Note 2) | | | 8,145 | | | | | | | | 3,681 | |
Prepaid expenses | | | 19,044 | | | | | | | | 6,954 | |
| | | | | | | | | | | | |
Total assets | | | 137,696,195 | | | | | | | | 43,465,937 | |
| | | | | | | | | | | | |
Liabilities: | |
Payable for investments purchased | | | 546,267 | | | | | | | | - | |
Payable for fund shares redeemed | | | 1,265 | | | | | | | | 10,570 | |
Management and sub-advisory fees payable (Note 2) | | | 82,217 | | | | | | | | 27,920 | |
Service fees payable (Note 2) | | | 450 | | | | | | | | 4,127 | |
Transfer agent fees payable (Note 2) | | | 11,175 | | | | | | | | 2,599 | |
Payable for interfund loan | | | 4,646,679 | | | | | | | | - | |
Custody and fund accounting fees payable | | | 18,193 | | | | | | | | 11,841 | |
Professional fees payable | | | 49,155 | | | | | | | | 45,436 | |
Registration fees payable | | | - | | | | | | | | 6,922 | |
Trustee fees payable (Note 2) | | | 508 | | | | | | | | 129 | |
Payable for prospectus and shareholder reports | | | 5,980 | | | | | | | | 3,493 | |
Other liabilities | | | 3,889 | | | | | | | | 76 | |
| | | | | | | | | | | | |
Total liabilities | | | 5,365,778 | | | | | | | | 113,113 | |
| | | | | | | | | | | | |
Commitments and contingent liabilities (Note 2) | | | | | | | | | | | | |
Net assets | | $ | 132,330,417 | | | | | | | $ | 43,352,824 | |
| | | | | | | | | | | | |
Analysis of net assets: | |
Paid-in-capital | | $ | 124,631,536 | | | | | | | $ | 39,158,077 | |
Total distributable earnings (deficits)A | | | 7,698,881 | | | | | | | | 4,194,747 | |
| | | | | | | | | | | | |
Net assets | | $ | 132,330,417 | | | | | | | $ | 43,352,824 | |
| | | | | | | | | | | | |
Shares outstanding at no par value (unlimited shares authorized): | |
R5 Class | | | 462,157 | | | | | | | | 1,630,709 | |
| | | | | | | | | | | | |
Y Class | | | 8,805,667 | | | | | | | | 999,261 | |
| | | | | | | | | | | | |
Investor Class | | | 100,283 | | | | | | | | 1,142,761 | |
| | | | | | | | | | | | |
A Class | | | 6,656 | | | | | | | | 165,628 | |
| | | | | | | | | | | | |
C Class | | | 6,647 | | | | | | | | 31,273 | |
| | | | | | | | | | | | |
R6 Class | | | N/A | | | | | | | | 90,335 | |
| | | | | | | | | | | | |
Net assets: | |
R5 Class | | $ | 6,556,093 | | | | | | | $ | 17,613,076 | |
| | | | | | | | | | | | |
Y Class | | $ | 124,188,718 | | | | | | | $ | 10,707,221 | |
| | | | | | | | | | | | |
Investor Class | | $ | 1,401,560 | | | | | | | $ | 12,001,262 | |
| | | | | | | | | | | | |
A Class | | $ | 92,350 | | | | | | | $ | 1,734,541 | |
| | | | | | | | | | | | |
C Class | | $ | 91,696 | | | | | | | $ | 321,211 | |
| | | | | | | | | | | | |
R6 Class | | $ | N/A | | | | | | | $ | 975,513 | |
| | | | | | | | | | | | |
Net asset value, offering and redemption price per share: | |
R5 Class | | $ | 14.19 | | | | | | | $ | 10.80 | |
| | | | | | | | | | | | |
Y Class | | $ | 14.10 | | | | | | | $ | 10.72 | |
| | | | | | | | | | | | |
Investor Class | | $ | 13.98 | | | | | | | $ | 10.50 | |
| | | | | | | | | | | | |
A Class | | $ | 13.87 | | | | | | | $ | 10.47 | |
| | | | | | | | | | | | |
A Class (offering price) | | $ | 14.72 | | | | | | | $ | 11.11 | |
| | | | | | | | | | | | |
C Class | | $ | 13.80 | | | | | | | $ | 10.27 | |
| | | | | | | | | | | | |
R6 Class | | $ | N/A | | | | | | | $ | 10.80 | |
| | | | | | | | | | | | |
| | | |
† Cost of investments in unaffiliated securities | | $ | 106,358,196 | | | | | | | $ | 39,029,683 | |
‡ Cost of investments in affiliated securities | | $ | - | | | | | | | $ | 421,949 | |
§ Fair value of securities on loan | | $ | 923,079 | | | | | | | $ | 2,392,385 | |
|
A The Fund’s investments in affiliated securities did not have unrealized appreciation (depreciation) at year end. | |
See accompanying notes
7
American Beacon FundsSM
Statements of Operations
For the period ended June 30, 2024
| | | | | | | | | | | | |
| | | Shapiro Equity
Opportunities Fund | | | | | | Shapiro SMID Cap
Equity Fund | |
Investment income: | |
Dividend income from unaffiliated securities | | $ | 2,365,140 | | | | | | | $ | 417,690 | |
Dividend income from affiliated securities (Note 2) | | | 218,760 | | | | | | | | 37,450 | |
Income derived from securities lending (Note 8) | | | 4,983 | | | | | | | | 5,335 | |
| | | | | | | | | | | | |
Total investment income | | | 2,588,883 | | | | | | | | 460,475 | |
| | | | | | | | | | | | |
Expenses: | |
Management and sub-advisory fees (Note 2) | | | 1,365,422 | | | | | | | | 382,097 | |
Transfer agent fees: | | | | | | | | | | | | |
R5 Class (Note 2) | | | 4,444 | | | | | | | | 6,303 | |
Y Class (Note 2) | | | 121,588 | | | | | | | | 12,353 | |
Investor Class | | | 1,430 | | | | | | | | 2,024 | |
A Class | | | 18 | | | | | | | | 260 | |
C Class | | | 18 | | | | | | | | 197 | |
R6 Class | | | - | | | | | | | | 102 | |
Custody and fund accounting fees | | | 58,110 | | | | | | | | 39,460 | |
Professional fees | | | 86,022 | | | | | | | | 56,237 | |
Registration fees and expenses | | | 74,616 | | | | | | | | 89,094 | |
Service fees (Note 2): | | | | | | | | | | | | |
Investor Class | | | 5,733 | | | | | | | | 47,717 | |
A Class | | | - | | | | | | | | 5,702 | |
C Class | | | - | | | | | | | | 838 | |
Distribution fees (Note 2): | | | | | | | | | | | | |
A Class | | | 213 | | | | | | | | 4,748 | |
C Class | | | 847 | | | | | | | | 6,216 | |
Prospectus and shareholder report expenses | | | 18,935 | | | | | | | | 17,548 | |
Trustee fees (Note 2) | | | 20,087 | | | | | | | | 5,205 | |
Loan expense (Note 2) | | | 20,283 | | | | | | | | 520 | |
Line of credit interest expense (Note 9) | | | 1,681 | | | | | | | | 460 | |
Other expenses | | | 32,026 | | | | | | | | 24,544 | |
| | | | | | | | | | | | |
Total expenses | | | 1,811,473 | | | | | | | | 701,625 | |
| | | | | | | | | | | | |
Net fees waived and expenses (reimbursed) (Note 2) | | | (109,010 | ) | | | | | | | (179,277 | ) |
| | | | | | | | | | | | |
Net expenses | | | 1,702,463 | | | | | | | | 522,348 | |
| | | | | | | | | | | | |
Net investment income (loss) | | | 886,420 | | | | | | | | (61,873 | ) |
| | | | | | | | | | | | |
|
Realized and unrealized gain (loss) from investments: | |
Net realized gain (loss) from: | | | | | | | | | | | | |
Investments in unaffiliated securitiesA | | | 3,060,019 | | | | | | | | 1,078,865 | |
Commission recapture (Note 1) | | | 36,412 | | | | | | | | 21,173 | |
Change in net unrealized appreciation (depreciation) of: | | | | | | | | | | | | |
Investments in unaffiliated securitiesB | | | 21,114,069 | | | | | | | | (2,918,909 | ) |
| | | | | | | | | | | | |
Net gain (loss) from investments | | | 24,210,500 | | | | | | | | (1,818,871 | ) |
| | | | | | | | | | | | |
Net increase (decrease) in net assets resulting from operations | | $ | 25,096,920 | | | | | | | $ | (1,880,744 | ) |
| | | | | | | | | | | | |
|
A The Fund did not recognize net realized gains (losses) from the sale of investments in affiliated securities. | |
B The Fund’s investments in affiliated securities did not have a change in unrealized appreciation (depreciation) at year end. | |
See accompanying notes
8
American Beacon FundsSM
Statements of Changes in Net Assets
| | | | | | | | | | | | | | | | | | | | | | | | | | | | |
| | | Shapiro Equity Opportunities Fund | | | | | | Shapiro SMID Cap Equity Fund | |
| | | Year Ended
June 30, 2024 | | | | | | Year Ended
June 30, 2023 | | | | | | Year Ended
June 30, 2024 | | | | | | Year Ended
June 30, 2023 | |
Increase (decrease) in net assets: | |
Operations: | |
Net investment income (loss) | | $ | 886,420 | | | | | | | $ | 1,792,279 | | | | | | | $ | (61,873 | ) | | | | | | $ | 178,983 | |
Net realized gain (loss) from investments in unaffiliated securities, and commission recapture | | | 3,096,431 | | | | | | | | (15,340,702 | ) | | | | | | | 1,100,038 | | | | | | | | 3,459,583 | |
Change in net unrealized appreciation (depreciation) of investments in unaffiliated securities | | | 21,114,069 | | | | | | | | 24,407,474 | | | | | | | | (2,918,909 | ) | | | | | | | 3,534,703 | |
| | | | | | | | | | | | | | | | | | | | | | | | | | | | |
Net increase (decrease) in net assets resulting from operations | | | 25,096,920 | | | | | | | | 10,859,051 | | | | | | | | (1,880,744 | ) | | | | | | | 7,173,269 | |
| | | | | | | | | | | | | | | | | | | | | | | | | | | | |
Distributions to shareholders: | |
Total retained earnings: | | | | | | | | | | | | | | | | | | | | | | | | | | | | |
R5 Class | | | (560,501 | ) | | | | | | | (4,417,286 | ) | | | | | | | (1,525,879 | ) | | | | | | | (564,962 | ) |
Y Class | | | (1,221,755 | ) | | | | | | | (9,551,750 | ) | | | | | | | (929,827 | ) | | | | | | | (374,842 | ) |
Investor Class | | | (9,550 | ) | | | | | | | (226,205 | ) | | | | | | | (1,149,011 | ) | | | | | | | (581,874 | ) |
A Class | | | (568 | ) | | | | | | | (6,708 | ) | | | | | | | (142,355 | ) | | | | | | | (59,671 | ) |
C Class | | | - | | | | | | | | (6,166 | ) | | | | | | | (54,956 | ) | | | | | | | (18,677 | ) |
R6 Class | | | - | | | | | | | | - | | | | | | | | (84,245 | ) | | | | | | | (25,839 | ) |
| | | | | | | | | | | | | | | | | | | | | | | | | | | | |
Net distributions to shareholders | | | (1,792,374 | ) | | | | | | | (14,208,115 | ) | | | | | | | (3,886,273 | ) | | | | | | | (1,625,865 | ) |
| | | | | | | | | | | | | | | | | | | | | | | | | | | | |
|
Capital share transactions (Note 10): | |
Proceeds from sales of shares | | | 38,149,774 | | | | | | | | 38,174,078 | | | | | | | | 6,161,273 | | | | | | | | 10,716,210 | |
Reinvestment of dividends and distributions | | | 1,562,586 | | | | | | | | 13,748,820 | | | | | | | | 3,872,223 | | | | | | | | 1,619,875 | |
Issued in reorganization | | | - | | | | | | | | - | | | | | | | | - | | | | | | | | 76,360,869 | |
Cost of shares redeemed | | | (123,272,987 | ) | | | | | | | (56,951,056 | ) | | | | | | | (24,058,428 | ) | | | | | | | (43,451,177 | ) |
| | | | | | | | | | | | | | | | | | | | | | | | | | | | |
Net increase (decrease) in net assets from capital share transactions | | | (83,560,627 | ) | | | | | | | (5,028,158 | ) | | | | | | | (14,024,932 | ) | | | | | | | 45,245,777 | |
| | | | | | | | | | | | | | | | | | | | | | | | | | | | |
Net increase (decrease) in net assets | | | (60,256,081 | ) | | | | | | | (8,377,222 | ) | | | | | | | (19,791,949 | ) | | | | | | | 50,793,181 | |
| | | | | | | | | | | | | | | | | | | | | | | | | | | | |
Net assets: | |
Beginning of year | | | 192,586,498 | | | | | | | | 200,963,720 | | | | | | | | 63,144,773 | | | | | | | | 12,351,592 | |
| | | | | | | | | | | | | | | | | | | | | | | | | | | | |
End of year | | $ | 132,330,417 | | | | | | | $ | 192,586,498 | | | | | | | $ | 43,352,824 | | | | | | | $ | 63,144,773 | |
| | | | | | | | | | | | | | | | | | | | | | | | | | | | |
See accompanying notes
9
American Beacon FundsSM
Notes to Financial Statements
June 30, 2024
1. Organization and Significant Accounting Policies
American Beacon Funds (the “Trust”) is organized as a Massachusetts business trust. The Funds, each a series within the Trust, are registered under the Investment Company Act of 1940, as amended (the “Act”), as diversified, open-end management investment companies. The American Beacon Shapiro Equity Opportunities Fund is non-diversified, and the American Beacon Shapiro SMID Cap Equity Fund is diversified, as defined by the Act. As of June 30, 2024, the Trust consists of twenty-four active series, two of which are presented in this filing: American Beacon Shapiro Equity Opportunities Fund and American Beacon Shapiro SMID Cap Equity Fund (collectively, the “Funds” and each individually a “Fund”). The remaining twenty-two active series are reported in separate filings.
American Beacon Advisors, Inc. (the “Manager”) is a Delaware corporation and a wholly-owned subsidiary of Resolute Investment Managers, Inc. (“RIM”) organized in 1986 to provide business management, advisory, administrative, and asset management consulting services to the Trust and other investors. The Manager is registered as an investment advisor under the Investment Advisers Act of 1940, as amended (the “Advisers Act”). The Manager is an indirect wholly-owned subsidiary of Resolute Topco, Inc. (“Topco”), which is owned primarily by various institutional investment funds that are managed by financial institutions and other investment advisory firms. No owner of Topco owns 25% or more of the outstanding equity or voting interests of Topco.
Effective December 29, 2023, the Manager underwent a change of control, which resulted in the termination of the Funds’ previous management and investment advisory agreements. The Board approved an interim Management Agreement with the Manager and an interim Investment Advisory Agreement among the Manager, the sub-advisor and the Trust, on behalf of the Funds, that were effective on December 29, 2023. A new Management Agreement with the Manager and a new Investment Advisory Agreement among the Manager, the sub-advisor and the Trust, on behalf of the Shapiro SMID Cap Equity Fund were effective on January 26, 2024 upon their approval by the Fund’s shareholders. A new Management Agreement with the Manager and a new Investment Advisory Agreement among the Manager, the sub-advisor and the Trust, on behalf of the Shapiro Equity Opportunities Fund were effective on February 27, 2024 upon their approval by the Fund’s shareholders.
Recently Adopted Accounting Pronouncements
In March 2020, the Financial Accounting Standards Board (“FASB”) issued Accounting Standards Update (“ASU”) No. 2020-04, Reference Rate Reform (Topic 848); Facilitation of the Effects of Reference Rate Reform on Financial Reporting, which provides optional guidance for a limited period of time to ease the potential burden in accounting for (or recognizing the effects of) reference rate reform. The guidance is applicable to contracts referencing London Inter-bank Offered Rate (“LIBOR”) or another reference rate that is expected to be discontinued due to reference rate reform. The ASU is effective as of March 12, 2020 and generally can be applied through December 31, 2022. In December 2022, the FASB issued ASU No. 2022-06 Reference Rate Reform (Topic 848): Deferral of the Sunset Date of Topic 848 which updates and clarifies ASU No. 2020-04. The amendments in this ASU defer the sunset date of Topic 848 from December 31, 2022, to December 31, 2024. Management expects these ASUs will not have a material impact on the Funds’ financial statements.
In June 2022, the FASB issued ASU No. 2022-03, Fair Value Measurement (Topic 820); Fair Value Measurement of Equity Securities Subject to Contractual Sale Restrictions, which provides clarifying guidance that a contractual restriction on the sale of an equity security is not considered part of the unit of account of the equity security and, therefore, is not considered in measuring fair value. The ASU is effective for fiscal years beginning after December 15, 2023, and interim periods within those fiscal years. Management has concluded that the ASU will not have a material impact on the Funds’ financial statements.
10
American Beacon FundsSM
Notes to Financial Statements
June 30, 2024
Class Disclosure
Each Fund has multiple classes of shares designed to meet the needs of different groups of investors; however, not all of the Funds offer all classes. The following table sets forth the differences amongst the classes:
| | | | | | |
Class | | Eligible Investors | | Minimum Initial
Investments | |
| R5 Class | | Large institutional investors - sold directly through intermediary channels. | | $ | 250,000 | |
| | |
| Y Class | | Large institutional retirement plan investors - sold directly or through intermediary channels. | | $ | 100,000 | |
| | |
| Investor Class | | All investors using intermediary organizations, such as broker-dealers or retirement plan sponsors. | | $ | 2,500 | |
| | |
| A Class | | All investors who invest through intermediary organizations, such as broker dealers or third party administrator. Retail investors who invest directly through a financial intermediary such as a broker, bank, or registered investment advisor which may include a front-end sales charge and a contingent deferred sales charge (“CDSC”). | | $ | 2,500 | |
| | |
| C Class | | Retail investors who invest directly through a financial intermediary such as a broker or through employee directed benefit plans with applicable sales charges which may include CDSC. | | $ | 1,000 | |
| | |
| R6 Class | | Large institutional retirement plan investors - sold through retirement plan. | | | None | |
Each class offered by the Trust has equal rights as to assets and voting privileges. Income and non-class specific expenses are allocated daily to each class based on the relative net assets. Realized and unrealized capital gains and losses of each class are allocated daily based on the relative net assets of each class of the respective Fund. Class specific expenses, where applicable, currently include service, distribution, transfer agent fees, and sub-transfer agent fees that vary amongst the classes as described more fully in Note 2.
Significant Accounting Policies
The following is a summary of significant accounting policies, consistently followed by the Funds in preparation of the financial statements. The Funds are considered investment companies and accordingly, follow the investment company accounting and reporting guidance of the FASB Accounting Standards Codification Topic 946, Financial Services – Investment Companies, a part of Generally Accepted Accounting Principles (“U.S. GAAP”).
Security Transactions and Investment Income
Security transactions are recorded as of the trade date for financial reporting purposes. Securities purchased or sold on a when-issued or delayed-delivery basis may be settled beyond a standard settlement period for the security after the trade date.
Dividend income, net of foreign taxes, is recorded on the ex-dividend date, except certain dividends from foreign securities which are recorded as soon as the information is available to the Funds. Interest income, net of foreign taxes, is earned from settlement date, recorded on the accrual basis, and adjusted, if necessary, for accretion of discounts and amortization of premiums. Realized gains (losses) from securities sold are determined based on specific lot identification.
Currency Translation
All assets and liabilities initially expressed in foreign currency values are converted into U.S. dollar values at the mean of the bid and ask prices of such currencies against U.S. dollars as last quoted by a recognized dealer. Income, expenses, and purchases and sales of investments are translated into U.S. dollars at the rate of the exchange prevailing on the respective dates of such transactions. The effect of changes in foreign currency exchange rates on investments is separately identified from the fluctuations arising from changes in market values of securities held and is reported with all other foreign currency gains and losses on the Funds’ Statements of Operations.
11
American Beacon FundsSM
Notes to Financial Statements
June 30, 2024
Distributions to Shareholders
The Funds distribute most or all of their net earnings and realized gains, if any, each taxable year in the form of dividends from net investment income and distributions of realized net capital gains and net gains from foreign currency transactions on an annual basis. The Funds do not have a fixed dividend rate and do not guarantee that they will pay any distributions in any particular period. Dividends to shareholders are determined in accordance with federal income tax regulations, which may differ in amount and character from net investment income and realized gains recognized for purposes of U.S. GAAP. To the extent necessary to fully distribute capital gains, the Funds may designate earnings and profits distributed to shareholders on the redemption of shares.
Commission Recapture
The Funds have established brokerage commission recapture arrangements with certain brokers or dealers. If the Funds’ investment advisor chooses to execute a transaction through a participating broker, the broker rebates a portion of the commission back to the Funds. Any collateral benefit received through participation in the commission recapture program is directed exclusively to the Funds. This amount is reported with the net realized gain (loss) in the Funds’ Statements of Operations, if applicable.
Allocation of Income, Trust Expenses, Gains, and Losses
Investment income and realized and unrealized gains and losses from investments of the Funds are allocated daily to each class of shares based upon the relative proportion of net assets of each class to the total net assets of the Funds. Expenses directly charged or attributable to a Fund will be paid from the assets of a Fund. Generally, expenses of the Trust will be allocated among and charged to the assets of the Funds on a basis that the Trust’s Board of Trustees (the “Board”) deems fair and equitable, which may be based on the relative net assets of the Funds or nature of the services performed and relative applicability to the Funds.
Use of Estimates
The preparation of financial statements in conformity with U.S. GAAP requires management to make estimates and assumptions that affect the amounts reported in the financial statements and accompanying notes. Actual results may differ from those estimated.
Other
Under the Trust’s organizational documents, its officers and trustees are indemnified against certain liabilities arising out of the performance of their duties to the Trust. In the normal course of business, the Trust enters into contracts that provide indemnification to the other party or parties against potential costs or liabilities. The Trust’s maximum exposure under these arrangements is dependent on claims that may be made in the future and, therefore, cannot be estimated. The Trust has had no prior claims or losses pursuant to any such agreement.
2. Transactions with Affiliates
Management and Investment Sub-Advisory Agreements
The Funds and the Manager are parties to a Management Agreement that obligates the Manager to provide the Funds with investment advisory and administrative services. As compensation for performing the duties under the Management Agreement, the Manager will receive an annualized management fee based on a percentage of each Fund’s average daily net assets that is calculated and accrued daily according to the following schedule:
| | | | |
First $5 billion | | | 0.35 | % |
Next $5 billion | | | 0.325 | % |
Next $10 billion | | | 0.30 | % |
Over $20 billion | | | 0.275 | % |
12
American Beacon FundsSM
Notes to Financial Statements
June 30, 2024
The Trust, on behalf of the Funds, and the Manager have entered into an Investment Advisory Agreement with Shapiro Capital Management LLC (“Shapiro”), an affiliate of the Manager, pursuant to which each Fund has agreed to pay Shapiro an annualized sub-advisory fee that is calculated and accrued daily based on each Fund’s average daily net assets according to the following schedule:
Shapiro Equity Opportunities Fund
| | | | |
First $250 million | | | 0.35 | % |
Next $250 million | | | 0.30 | % |
Over $500 million | | | 0.25 | % |
Shapiro SMID Cap Equity Fund
| | | | |
First $250 million | | | 0.40 | % |
Next $250 million | | | 0.35 | % |
Over $500 million | | | 0.30 | % |
The Management and Sub-Advisory Fees paid by the Funds for the year ended June 30, 2024 were as follows:
Shapiro Equity Opportunities Fund
| | | | | | | | | | | | |
| | | Effective Fee Rate | | | | | | Amount of Fees Paid | |
Management Fees | | | 0.35 | % | | | | | | $ | 682,987 | |
Sub-Advisory Fees | | | 0.35 | % | | | | | | | 682,435 | |
| | | | | | | | | | | | |
Total | | | 0.70 | % | | | | | | $ | 1,365,422 | |
| | | | | | | | | | | | |
Shapiro SMID Cap Equity Fund
| | | | | | | | | | | | |
| | | Effective Fee Rate | | | | | | Amount of Fees Paid | |
Management Fees | | | 0.35 | % | | | | | | $ | 180,091 | |
Sub-Advisory Fees | | | 0.40 | % | | | | | | | 202,006 | |
| | | | | | | | | | | | |
Total | | | 0.75 | % | | | | | | $ | 382,097 | |
| | | | | | | | | | | | |
As compensation for services provided by the Manager in connection with securities lending activities conducted by a Fund, the lending Fund pays to the Manager, with respect to cash collateral posted by borrowers, a fee of 10% of the net monthly investment income (the income earned in the form of interest, dividends and realized capital gains from the investment of cash collateral, plus any negative rebate fees paid by borrowers, less the rebate amount paid to borrowers as well as related expenses) and, with respect to collateral other than cash, a fee up to 10% of loan fees and demand premiums paid by borrowers. These fees are included in “Income derived from securities lending” and “Management and sub-advisory fees” on the Statements of Operations. During the year ended June 30, 2024, the Manager received securities lending fees of $615 and $550 for the securities lending activities of Shapiro Equity Opportunities Fund and Shapiro SMID Cap Equity Fund, respectively.
Distribution Plans
Separate Distribution Plans (the “Distribution Plans”) have been adopted pursuant to Rule 12b-1 under the Act for the A and C Classes of the Funds. Under the Distribution Plans, as compensation for distribution and shareholder servicing assistance, the Manager receives an annual fee of 0.25% of the average daily net assets of the A Classes, and 1.00% of the average daily net assets of the C Class. The fee will be payable without regard to whether the amount of the fee is more or less than the actual expenses incurred in a particular month by the Manager for distribution assistance.
13
American Beacon FundsSM
Notes to Financial Statements
June 30, 2024
Service Plans
The Manager and the Trust entered into Service Plans that obligate the Manager to oversee additional shareholder servicing of the Investor, A, and C Classes of the Funds. As compensation for performing the duties required under the Service Plans, the Manager receives an annualized fee up to 0.25% of the average daily net assets of the A and C Classes, and up to 0.375% of the average daily net assets of the Investor Class of the Funds.
Sub-Transfer Agent Fees
The Manager has entered into agreements, which include servicing agreements, with financial intermediaries that provide recordkeeping, processing, shareholder communications and other services to customers of the intermediaries that hold positions in the R5 and Y Classes of the Funds and has agreed to compensate the intermediaries for providing these services. Intermediaries transact with the Funds primarily through the use of omnibus accounts on behalf of their customers who hold positions in the Funds. Certain services would have been provided by the Funds’ transfer agent and other service providers if the shareholders’ accounts were maintained directly by the Funds’ transfer agent. Accordingly, the Funds, pursuant to Board approval, have agreed to reimburse the Manager for certain non-distribution shareholder services provided by financial intermediaries for the R5 and Y Classes. The reimbursement amounts (sub-transfer agent fees) paid to the Manager are subject to a fee limit of up to 0.10% of an intermediary’s average net assets in the R5 and Y Classes on an annual basis. During the year ended June 30, 2024, the sub-transfer agent fees, as reflected in “Transfer agent fees” on the Statements of Operations, were as follows:
| | | | |
Fund | | Sub-Transfer Agent Fees | |
Shapiro Equity Opportunities | | $ | 117,783 | |
Shapiro SMID Cap Equity | | | 14,996 | |
As of June 30, 2024, the Funds owed the Manager the following reimbursement of sub-transfer agent fees, as reflected in “Transfer agent fees payable” on the Statements of Assets and Liabilities:
| | | | |
Fund | | Reimbursement
Sub-Transfer Agent Fees | |
Shapiro Equity Opportunities | | $ | 9,411 | |
Shapiro SMID Cap Equity | | | 1,110 | |
Investments in Affiliated Funds
The Funds may invest in the American Beacon U.S. Government Money Market Select Fund (the “USG Select Fund”). Cash collateral received by the Funds in connection with securities lending may also be invested in the USG Select Fund. The Funds listed below held the following shares with a June 30, 2024 fair value and dividend income earned from the investment in the USG Select Fund.
| | | | | | | | | | | | | | | | | | | | | | | | | | | | | | | | | | | | | | | | | | | | | | | | |
Affiliated Security | | Type of
Transaction | | | | | Fund | | | | | June 30,
2024
Shares/Principal | | | | | | Change in
Unrealized
Gain (Loss) | | | | | | Realized
Gain
(Loss) | | | | | | Dividend
Income | | | | | | June 30,
2024
Shares/Fair Value | |
| U.S. Government Money Market Select | | Direct | | | | | | Shapiro Equity
Opportunities | | | | | | $ | - | | | | | | | $ | - | | | | | | | $ | - | | | | | | | $ | 218,760 | | | | | | | $ | - | |
| U.S. Government Money Market Select | | Direct | | | | | | Shapiro SMID
Cap Equity | | | | | | | 421,949 | | | | | | | | - | | | | | | | | - | | | | | | | | 37,450 | | | | | | | | 421,949 | |
14
American Beacon FundsSM
Notes to Financial Statements
June 30, 2024
The Funds and the USG Select Fund have the same investment advisor and therefore, are considered to be affiliated. The Manager serves as investment advisor to the USG Select Fund and receives management fees and administrative fees totaling 0.10% of the average daily net assets of the USG Select Fund. During the year ended June 30, 2024, the Manager earned fees on the Funds’ direct investments and securities lending collateral investments in the USG Select Fund as shown below:
| | | | | | | | | | | | |
Fund | | Direct Investments in
USG Select Fund | | | Securities Lending
Collateral
Investments in USG
Select Fund | | | Total | |
Shapiro Equity Opportunities | | $ | 4,236 | | | $ | 1,133 | | | $ | 5,369 | |
Shapiro SMID Cap Equity | | | 726 | | | | 796 | | | | 1,522 | |
Interfund Credit Facility
Pursuant to an exemptive order issued by the U.S. Securities and Exchange Commission (“SEC”), the Funds, along with other registered investment companies having management contracts with the Manager, may participate in a credit facility whereby each fund, under certain conditions, is permitted to lend money directly to and borrow directly from other participating funds for temporary purposes. The interfund credit facility is advantageous to the funds because it provides added liquidity and eliminates the need to maintain higher cash balances to meet redemptions. This situation could arise when shareholder redemptions exceed anticipated volumes and certain funds have insufficient cash on hand to satisfy such redemptions or when sales of securities do not settle as expected, resulting in a cash shortfall for a fund. The credit facility provides a source of immediate, short-term liquidity pending settlement of the sale of portfolio securities. The credit facility is administered by a credit facility team consisting of professionals from the Manager’s asset management, compliance, and accounting areas who report the activities of the credit facility to the Board. During the year ended June 30, 2024, the Shapiro Equity Opportunities Fund borrowed on average $6,461,816 for 7 days at an average interest rate of 6.14% with interest charges of $20,283 and the Shapiro SMID Cap Equity Fund borrowed on average $273,225 for 11 days at an average interest rate of 6.14% with interest charges of $520. These amounts are recorded as “Loan expense” in the Statements of Operations.
Expense Reimbursement Plan
The Manager contractually agreed to reduce fees and/or reimburse expenses for the classes of the Funds, through October 31, 2024, for the Shapiro Equity Opportunities Fund, and through the later of October 31, 2024 or two years following the closing date of the reorganization of the American Beacon Mid-Cap Value Fund into the Fund, for the Shapiro SMID Cap Equity Fund, to the extent that total operating expenses (excluding taxes, interest, brokerage commissions, acquired fund fees and expenses, securities lending fees, expenses associated with securities sold short, litigation, and other extraordinary expenses) exceed the Funds’ expense cap. During the year ended June 30, 2024, the Manager waived and/or reimbursed expenses as follows:
| | | | | | | | | | | | | | | | | | | | | | |
| | | | | Expense Cap | | | | | | | | | Expiration of
Reimbursed
Expenses | |
Fund | | Class | | 7/1/2023 -
10/31/2023 | | | 11/1/2023 -
06/30/2024 | | | Reimbursed
Expenses | | | (Recouped)
Expenses | |
Shapiro Equity Opportunities | | R5 | | | 0.79 | % | | | 0.79 | % | | $ | 38,328 | | | $ | - | | | | 2026-2027 | |
Shapiro Equity Opportunities | | Y | | | 0.89 | % | | | 0.89 | % | | | 66,631 | | | | - | | | | 2026-2027 | |
Shapiro Equity Opportunities | | Investor | | | 1.06 | % | | | 1.06 | % | | | 3,957 | | | | - | | | | 2026-2027 | |
Shapiro Equity Opportunities | | A | | | 1.12 | % | | | 1.06 | % | | | 47 | | | | (3 | )* | | | 2026-2027 | |
Shapiro Equity Opportunities | | C | | | 1.87 | % | | | 1.81 | % | | | 47 | | | | (3 | )* | | | 2026-2027 | |
Shapiro SMID Cap Equity | | R5 | | | 0.89 | % | | | 0.89 | % | | | 67,706 | | | | - | | | | 2026-2027 | |
Shapiro SMID Cap Equity | | Y | | | 0.96 | % | | | 0.96 | % | | $ | 42,272 | | | $ | - | | | | 2026-2027 | |
15
American Beacon FundsSM
Notes to Financial Statements
June 30, 2024
| | | | | | | | | | | | | | | | | | | | | | |
| | | | | Expense Cap | | | | | | | | | Expiration of
Reimbursed
Expenses | |
Fund | | Class | | 7/1/2023 -
10/31/2023 | | | 11/1/2023 -
06/30/2024 | | | Reimbursed
Expenses | | | (Recouped)
Expenses | |
Shapiro SMID Cap Equity | | Investor | | | 1.17 | % | | | 1.17 | % | | | 53,897 | | | | - | | |
| 2026-
2027 |
|
Shapiro SMID Cap Equity | | A | | | 1.26 | % | | | 1.25 | % | | | 9,628 | | | | - | | |
| 2026-
2027 |
|
Shapiro SMID Cap Equity | | C | | | 2.01 | % | | | 2.01 | % | | | 2,221 | | | | - | | |
| 2026-
2027 |
|
Shapiro SMID Cap Equity | | R6 | | | 0.90 | % | | | 0.89 | % | | | 3,553 | | | | - | | |
| 2026-
2027 |
|
*These amounts represents Recouped Expenses from prior fiscal years and are reflected in Total Expenses on the Statements of Operations
Of the above amounts, $8,145 and $3,681 were disclosed as a Receivable for expense reimbursement on the Statements of Assets and Liabilities at June 30, 2024 for the Shapiro Equity Opportunities Fund and Shapiro SMID Cap Equity Fund, respectively.
The Funds have adopted an Expense Reimbursement Plan whereby the Manager may seek repayment of such contractual or voluntary fee reductions and expense reimbursements. Under the policy, the Manager can be reimbursed by the Funds for any contractual or voluntary fee reductions or expense reimbursements if reimbursement to the Manager (a) occurs within three years from the date of the Manager’s waiver/reimbursement and (b) does not cause the Funds’ annual operating expenses to exceed the lesser of the contractual percentage limit in effect at the time of the waiver/reimbursement or time of recoupment. The reimbursed expenses listed above will expire in 2026 and 2027. The Funds did not record a liability for potential contingent reimbursements due to the current assessment that reimbursements are uncertain. The carryover of excess expenses potentially reimbursable to the Manager, but not recorded as a liability are as follows:
| | | | | | | | | | | | | | | | |
Fund | | Recouped
Expenses | | | Excess Expense
Carryover | | | Expired Expense
Carryover | | | Expiration of
Reimbursed
Expenses | |
Shapiro Equity Opportunities | | $ | | - | | $ | | - | | $ | 93,703 | | | | 2023-2024 | |
Shapiro Equity Opportunities | | | 6 | | | | 103,059 | | | | - | | | | 2024-2025 | |
Shapiro Equity Opportunities | | | - | | | | 154,812 | | | | - | | | | 2025-2026 | |
Shapiro SMID Cap Equity | | | - | | | | - | | | | 163,331 | | | | 2023-2024 | |
Shapiro SMID Cap Equity | | | - | | | | 178,280 | | | | - | | | | 2024-2025 | |
Shapiro SMID Cap Equity | | | - | | | | 250,989 | | | | - | | | | 2025-2026 | |
Concentration of Ownership
From time to time, the Funds may have a concentration of one or more accounts constituting a significant percentage of shares outstanding. Investment activities by holders of accounts that represent a significant ownership of more than 5% of the Funds’ outstanding shares could have a material impact on the Funds. As of June 30, 2024, based on management’s evaluation of the shareholder account base, one account has been identified as representing an unaffiliated significant ownership of approximately 11% for the Shapiro Equity Opportunities Fund and one shareholder has been identified as representing an affiliated significant ownership of approximately 11% for the Shapiro SMID Cap Equity Fund.
Sales Commissions
The Funds’ Distributor, Resolute Investment Distributors, Inc. (“RID” or “Distributor”), may receive a portion of Class A sales charges from broker dealers which may be used to offset distribution related expenses. During the year ended June 30, 2024, RID collected $66 for Shapiro SMID Cap Equity Fund from the sale of A Class Shares. There were no Class A sales charges collected for the Shapiro Equity Opportunities Fund.
16
American Beacon FundsSM
Notes to Financial Statements
June 30, 2024
A CDSC of 0.50% will be deducted with respect to Class A Shares on certain purchases of $1,000,000 or more that are redeemed in whole or part within 18 months of purchase, unless waived as discussed in the Funds’ Prospectus. Any applicable CDSC will be 0.50% of the lesser of the original purchase price or the value of the redemption of the Class A Shares redeemed. During the year ended June 30, 2024, there were no CDSC fees collected for the Class A Shares of the Shapiro Equity Opportunities Fund or the Shapiro SMID Cap Equity Fund.
A CDSC of 1.00% will be deducted with respect to Class C Shares redeemed within 12 months of purchase, unless waived as discussed in the Funds’ Prospectus. Any applicable CDSC will be 1.00% of the lesser of the original purchase price or the value of the redemption of the Class C Shares redeemed. During the year ended June 30, 2024, there were no CDSC fees collected for the Class C Shares of the Shapiro Equity Opportunities Fund or the Shapiro SMID Cap Equity Fund.
Trustee Fees and Expenses
As compensation for their service to the American Beacon Funds Complex, including the Trust (collectively, the “Trusts”), each Trustee is compensated from the Trusts as follows: (1) an annual retainer of $140,000; (2) meeting attendance fee (for attendance in-person or via teleconference) of (a) $12,000 for in-person attendance, or $5,000 for telephonic attendance, by Board members for each regularly scheduled or special Board meeting, (b) $2,500 for attendance by Committee members at meetings of the Audit Committee and the Investment Committee, (c) $1,000 for attendance by Committee members at meetings of the Nominating and Governance Committee; and (d) $2,500 for attendance by Board members for each special telephonic Board meeting; and (3) reimbursement of reasonable expenses incurred in attending Board meetings, Committee meetings, and relevant educational seminars. For this purpose, the Board considers attendance at regular meetings held by video conference to constitute in-person attendance at a Board meeting. The Trustees also may be compensated for attendance at special Board and/or Committee meetings from time to time. For her service as Board Chair, Ms. Cline receives an additional annual retainer of $50,000. Although she attends several committee meetings at each quarterly Board meeting, she receives a single $2,500 fee each quarter for her attendance at the Audit and Compliance Committee and Investment Committee meetings. The chairpersons of the Audit and Compliance Committee and the Investment Committee each receive an additional annual retainer of $25,000 and the Chair of the Nominating and Governance Committee receives an additional annual retainer of $10,000.
3. Security Valuation and Fair Value Measurements
The price of each Fund’s shares is based on its net asset value (“NAV”) per share. Each Fund’s NAV is computed by adding total assets, subtracting all the Fund’s liabilities, and dividing the result by the total number of shares outstanding.
The NAV of each class of a Fund’s shares is determined based on a pro rata allocation of a Fund’s investment income, expenses and total capital gains and losses. A Fund’s NAV per share is determined each business day as of the regular close of trading on the New York Stock Exchange (“NYSE” or “Exchange”), which is typically 4:00 p.m. Eastern Time (“ET”). However, if trading on the NYSE closes at a time other than 4:00 p.m. ET, a Fund’s NAV per share typically would still be determined as of the regular close of trading on the NYSE. The Funds do not price their shares on days that the NYSE is closed. Foreign exchanges may permit trading in foreign securities on days when a Fund is not open for business, which may result in the value of a Fund’s portfolio investments being affected at a time when you are unable to buy or sell shares.
Equity securities, including shares of closed-end funds and exchange-traded funds (“ETFs”), are valued at the last sale price or official closing price taken from the primary exchange in which each security trades. Investments in other mutual funds are valued at the closing NAV per share on the day of valuation. Debt securities are valued at bid quotes from broker/dealers or evaluated bid prices from pricing services, who may consider a number of inputs and factors, such as prices of comparable securities, yield curves, spreads, credit ratings, coupon rates, maturity, default rates, and underlying collateral. Futures are valued based on their daily settlement prices.
17
American Beacon FundsSM
Notes to Financial Statements
June 30, 2024
Exchange-traded and over-the-counter (“OTC”) options are valued at the last sale price. Options with no last sale for the day are priced at mid quote. Swaps are valued at evaluated mid prices from pricing services.
The valuation of securities traded on foreign markets and certain fixed-income securities will generally be based on prices determined as of the earlier closing time of the markets on which they primarily trade unless a significant event has occurred. When a Fund holds securities or other assets that are denominated in a foreign currency, a Fund will normally use the currency exchange rates as of 4:00 p.m. ET.
Rule 2a-5 under the Investment Company Act (the “Valuation Rule”) establishes requirements for determining fair value in good faith for purposes of the Investment Company Act, including related oversight and reporting requirements. The Valuation Rule also defines when market quotations are “readily available,” which is the threshold for determining whether a Fund must fair value a security. Among other things, the Valuation Rule permits the Board to designate the Manager as Valuation Designee to perform the Fund’s fair value determinations subject to board oversight and certain reporting and other requirements intended to ensure that the Board receives the information it needs to oversee the Manager’s fair value determinations. Effective September 8, 2022, the Board has designated the Manager as valuation designee to perform fair value functions in accordance with the requirements of the Valuation Rule.
Securities may be valued at fair value, as determined in good faith and pursuant to the Manager’s procedures approved by the Board, under certain limited circumstances. For example, fair value pricing will be used for fixed-income securities and when market quotations are not readily available or reliable, as determined by the Manager, such as when (i) trading for a security is restricted or stopped; (ii) a security’s trading market is closed (other than customary closings); or (iii) a security has been de-listed from a national exchange. A security with limited market liquidity may require fair value pricing if the Manager determines that the available price does not reflect the security’s true market value. In addition, if a significant event that the Manager determines to affect the value of one or more securities held by a Fund occurs after the close of a related exchange but before the determination of a Fund’s NAV, fair value pricing may be used on the affected security or securities. Securities of small-capitalization companies are also more likely to require a fair value determination using these procedures because they are more thinly traded and less liquid than the securities of larger-capitalization companies. The Funds may fair value securities as a result of significant events occurring after the close of the foreign markets in which a Fund invests as described below. In addition, the Funds may invest in illiquid securities requiring these procedures.
A Fund may use fair value pricing for securities primarily traded in non-U.S. markets because most foreign markets close well before a Fund’s pricing time of 4:00 p.m. ET. The earlier close of these foreign markets gives rise to the possibility that significant events, including broad market moves, may have occurred in the interim and may materially affect the value of those securities. If the Manager determines that the last quoted prices of non-U.S. securities will, in its judgment, materially affect the value of some or all a Funds’ portfolio securities, the Manager can adjust the previous closing prices to reflect what it believes to be the fair value of the securities as of the close of the Exchange. In deciding whether it is necessary to adjust closing prices to reflect fair value, the Manager reviews a variety of factors, including developments in foreign markets, the performance of U.S. securities markets, and the performance of instruments trading in U.S. markets that represent foreign securities and baskets of foreign securities. These securities are fair valued using a pricing service, using methods approved by the Manager, that considers the correlation of the trading patterns of the foreign security to intraday trading in the U.S. markets, based on indices of domestic securities and other appropriate indicators such as prices of relevant American Depositary Receipts (“ADRs”) and futures contracts. The Manager’s Valuation Committee may also fair value securities in other situations, such as when a particular foreign market is closed but a Fund is open. A Fund uses outside pricing services to provide closing prices and information to evaluate and/or adjust those prices. As a means of evaluating its security valuation process, the Valuation Committee routinely compares closing prices, the next day’s opening prices in the same markets and adjusted prices.
Attempts to determine the fair value of securities introduce an element of subjectivity to the pricing of securities. As a result, the price of a security determined through fair valuation techniques may differ from the price quoted or published by other sources and may not accurately reflect the market value of the security when
18
American Beacon FundsSM
Notes to Financial Statements
June 30, 2024
trading resumes. If a reliable market quotation becomes available for a security formerly valued through fair valuation techniques, the Manager compares the new market quotation to the fair value price to evaluate the effectiveness of a Fund’s fair valuation procedures. If any significant discrepancies are found, the Manager may adjust Manager’s fair valuation procedures for a Fund.
Valuation Inputs
Various inputs may be used to determine the fair value of the Funds’ investments. These inputs are summarized in three broad levels for financial statement purposes. The inputs or methodologies used to value securities are not necessarily an indication of the risk associated with investing in those securities.
| | | | |
| Level 1 | | - | | Quoted prices in active markets for identical securities. |
| | |
| Level 2 | | - | | Prices determined using other significant observable inputs. These may include quoted prices for similar securities, interest rates, prepayment speeds, credit risk, and others. |
| | |
| Level 3 | | - | | Prices determined using other significant unobservable inputs. Unobservable inputs reflect a Fund’s own assumptions about the factors market participants would use in pricing an investment. |
Level 1 and Level 2 trading assets and trading liabilities, at fair value
Common stocks and financial derivative instruments, such as futures contracts that are traded on a national securities exchange, are stated at the last reported sale or settlement price on the day of valuation. To the extent these securities are actively traded and valuation adjustments are not applied, they are categorized as Level 1 of the fair value hierarchy. Preferred securities and other equities traded on inactive markets or valued by reference to similar instruments are generally categorized as Level 2 of the fair value hierarchy.
Investments in registered open-end investment management companies will be valued based upon the NAVs of such investments and are categorized as Level 1 of the fair value hierarchy.
4. Securities and Other Investments
Common Stock
Common stock generally takes the form of shares in a corporation which represent an ownership interest. It ranks below preferred stock and debt securities in claims for dividends and for assets of the company in a liquidation or bankruptcy. The value of a company’s common stock may fall as a result of factors directly relating to that company, such as decisions made by its management or decreased demand for the company’s products or services. A stock’s value may also decline because of factors affecting not just the company, but also companies in the same industry or sector. The price of a company’s stock may also be affected by changes in financial markets that are relatively unrelated to the company, such as changes in interest rates, currency exchange rates or industry regulation. Companies that elect to pay dividends on their common stock generally only do so after they invest in their own business and make required payments to bondholders and on other debt and preferred stock. Therefore, the value of a company’s common stock will usually be more volatile than its bonds, other debt and preferred stock. Common stock may be exchange-traded or OTC. OTC stock may be less liquid than exchange-traded stock.
Other Investment Company Securities and Other Exchange-Traded Products
The Funds may invest in shares of other investment companies, including open-end funds, closed-end funds, business development companies (“BDCs”), ETFs, unit investment trusts, and other investment companies of the Trust. The Funds may invest in securities of an investment company advised by the Manager or the Sub-Advisor. As a result, the Funds’ shareholders indirectly will bear the Funds’ proportionate share of the fees and expenses paid by shareholders of the other investment company, in addition to the fees and expenses the Funds’ shareholders directly bear in connection with the Funds’ own operations. These other fees and expenses are reflected as
19
American Beacon FundsSM
Notes to Financial Statements
June 30, 2024
Acquired Fund Fees and Expenses and are included in the Fees and Expenses Table for the Funds in their Prospectus, if applicable. Investments in other investment companies may involve the payment of substantial premiums above the value of such issuer’s portfolio securities.
The Funds can invest free cash balances in registered open-end investment companies regulated as money market funds under the Act, to provide liquidity or for defensive purposes. The Funds could invest in government money market funds rather than purchasing individual short-term investments. If the Funds invest in government money market funds, shareholders will bear their proportionate share of the expenses, including for example, advisory and administrative fees, of the government money market funds in which the Funds invest, including advisory fees charged by the Manager to any applicable money market funds advised by the Manager.
5. Principal Risks
Investing in the Funds may involve certain risks including, but not limited to, those described below.
Dividend Risk
A Fund’s focus on dividend-paying stocks could cause a Fund to underperform funds that invest without consideration of a company’s track record of paying dividends. An issuer of stock held by a Fund may choose not to declare a dividend or the dividend rate might not remain at current levels or increase over time. Dividend paying stocks might not experience the same level of earnings growth or capital appreciation as non-dividend paying stocks. In addition, stocks of companies with a history of paying dividends may not participate in a broad market advance to the same degree as most other stocks, and a sharp rise in interest rates or an economic downturn could cause a company to unexpectedly reduce or eliminate its dividend. Securities that pay dividends may be sensitive to changes in interest rates, and as interest rates rise, the prices of such securities may fall. At times, a Fund may not be able to identify dividend-paying stocks that are attractive investments. The income received by a Fund will also fluctuate due to the amount of dividends that companies elect to pay.
Equity Investments Risk
Equity securities are subject to market risk. The Funds’ investments in equity securities may include common stocks, preferred stocks, securities convertible into or exchangeable for common stocks, REITs, depositary receipts, and U.S. dollar-denominated foreign stocks traded on U.S. exchanges. Such investments may expose the Funds to additional risk. The value of a company’s common stock may fall as a result of factors affecting the company, companies in the same industry or sector, or the financial markets overall. Common stock generally is subordinate to preferred stock upon the liquidation or bankruptcy of the issuing company. Preferred stocks and convertible securities are sensitive to movements in interest rates. Preferred stocks may be less liquid than common stocks and, unlike common stocks, participation in the growth of an issuer may be limited. Distributions on preferred stocks generally are payable at the discretion of an issuer and after required payments to bond holders. Convertible securities are subject to the risk that the credit standing of the issuer may have an effect on the convertible securities’ investment value. Investments in REITs are subject to the risks associated with investing in the real estate industry such as adverse developments affecting the real estate industry and real property values. Depositary receipts and U.S. dollar-denominated foreign stocks traded on U.S. exchanges are subject to certain of the risks associated with investing directly in foreign securities, including, but not limited to, currency exchange rate fluctuations, political and financial instability in the home country of a particular depositary receipt, less liquidity and more volatility, less government regulation and supervision and delays in transaction settlement.
Focused Holdings Risk
Because the Funds may have a focused portfolio of fewer companies, the increase or decrease of the value of a single investment may have a greater impact on the Funds’ NAV and total return when compared to other diversified funds. Although a focused portfolio has the potential to generate attractive returns over time, it also may increase the Funds’ volatility.
20
American Beacon FundsSM
Notes to Financial Statements
June 30, 2024
Market Risk
The Funds are subject to the risk that the securities markets will move down, sometimes rapidly and unpredictably, based on overall economic conditions and other factors, which may negatively affect the Fund’s performance. Equity securities generally have greater price volatility than fixed-income securities, although under certain market conditions fixed-income securities may have comparable or greater price volatility. During a general downturn in the securities markets, multiple assets may decline in value simultaneously. In some cases, traditional market participants have been less willing to make a market in some types of debt instruments, which has affected the liquidity of those instruments. During times of market turmoil, investors tend to look to the safety of securities issued or backed by the U.S. Treasury, causing the prices of these securities to rise and the yields to decline. Reduced liquidity in fixed-income and credit markets may negatively affect many issuers worldwide. Prices in many financial markets have increased significantly over the last decade, but there have also been periods of adverse market and financial developments and cyclical change during that timeframe, which have resulted in unusually high levels of volatility in domestic and foreign financial markets that has caused losses for investors and may occur again in the future, particularly if markets enter a period of uncertainty or economic weakness. The value of a security may decline due to adverse issuer-specific conditions, general market conditions unrelated to a particular issuer, or factors that affect a particular industry or industries. Changes in the financial condition of a single issuer or market segment also can impact the market as a whole. Geopolitical and other events, including war, terrorism, economic uncertainty, trade disputes, pandemics, public health crises, natural disasters and related events have led, and in the future may continue to lead, to instability in world economies and markets generally and reduced liquidity in equity, credit and fixed-income markets, which may disrupt economies and markets and adversely affect the value of your investment. Changes in value may be temporary or may last for extended periods.
Policy changes by the U.S. government and/or Federal Reserve and political events within the U.S. and abroad, including the U.S. presidential election, the U.S. government’s inability at times to agree on a long-term budget and deficit reduction plan, the threat of a federal government shutdown and threats not to increase the federal government’s debt limit, may affect investor and consumer confidence and may adversely impact financial markets and the broader economy, perhaps suddenly and to a significant degree.
Markets and market participants are increasingly reliant upon both publicly available and proprietary information data systems. Data imprecision, software or other technology malfunctions, programming inaccuracies, unauthorized use or access, and similar circumstances may impair the performance of these systems and may have an adverse impact upon a single issuer, a group of issuers, or the market at large. The financial markets generally move in cycles, with periods of rising prices followed by periods of declining prices. The value of your investment may reflect these fluctuations.
Non-Diversification Risk
When a Fund is non-diversified, it may invest a high percentage of its assets in a limited number of issuers. When a Fund invests in a relatively small number of issuers, it may be more susceptible to risks associated with a single economic, political or regulatory occurrence than a more diversified portfolio might be. Some of those issuers also may present substantial credit or other risks. When a Fund is non-diversified, its NAV and total return may also fluctuate more or be subject to declines in weaker markets than a diversified mutual fund. Investments in securities of a limited number of issuers exposes a Fund to greater market risk, price volatility and potential losses than if assets were diversified among the securities of a greater number of issuers.
Other Investment Companies Risk
To the extent that a Fund invests in shares of other registered investment companies, a Fund will indirectly bear the fees and expenses, including, for example, advisory and administrative fees, charged by those investment companies in addition to a Fund’s direct fees and expenses. To the extent a Fund invest in other investment companies that invest in equity securities, fixed-income securities and/or foreign securities, or that track an index,
21
American Beacon FundsSM
Notes to Financial Statements
June 30, 2024
a Fund is subject to the risks associated with the underlying investments held by the investment company or the index fluctuations to which the investment company is subject. Investments in government money market funds are subject to interest rate risk, credit risk, and market risk. Interest rate risk is the risk that rising interest rates could cause the value of such an investment to decline. Credit risk is the risk that the issuer, guarantor or insurer of an obligation, or the counterparty to a transaction, may fail or become less able or unwilling, to make timely payment of interest or principal or otherwise honor its obligations, or that it may default completely.
Recent Market Events Risk
Both U.S. and international markets have experienced significant volatility in recent months and years. As a result of such volatility, investment returns may fluctuate significantly. Moreover, the risks discussed herein associated with an investment in a Fund may be increased.
Although interest rates were unusually low in recent years in the U.S. and abroad, in 2022, the Federal Reserve and certain foreign central banks began to raise interest rates as part of their efforts to address rising inflation. It is difficult to accurately predict the pace at which interest rates may continue to increase, the timing, frequency or magnitude of any such increases, or when such increases might stop. Additionally, various economic and political factors could cause the Federal Reserve or another foreign central bank to change their approach in the future and such actions may result in an economic slowdown in the U.S. and abroad. Unexpected increases in interest rates could lead to market volatility or reduce liquidity in certain sectors of the market. Deteriorating economic fundamentals may, in turn, increase the risk of default or insolvency of particular issuers, negatively impact market value, cause credit spreads to widen, and reduce bank balance sheets. Any of these could cause an increase in market volatility, reduce liquidity across various markets or decrease confidence in the markets. Additionally, high public debt in the U.S. and other countries creates ongoing systemic and market risks and policymaking uncertainty.
In March 2023, the shutdown of certain financial institutions in the U.S. and questions regarding the viability of other financial institutions raised economic concerns over disruption in the U.S. and global banking systems. There can be no certainty that the actions taken by the U.S. or foreign governments will be effective in mitigating the effects of financial institution failures on the economy and restoring public confidence in the U.S. and global banking systems. Some countries, including the U.S., have in recent years adopted more protectionist trade policies. Slowing global economic growth; risks associated with a trade agreement between the United Kingdom and the European Union; the risks associated with ongoing trade negotiations with China; and the possibility of changes to some international trade agreements; political or economic dysfunction within some nations, including major producers of oil; and dramatic changes in commodity and currency prices could have adverse effects that cannot be foreseen at the present time.
Tensions, war, or open conflict between nations, such as between Russia and Ukraine, in the Middle East or in eastern Asia could affect the economies of many nations, including the United States. The duration of ongoing hostilities in the Middle East and between Russia and Ukraine, and any sanctions and related events cannot be predicted. Those events present material uncertainty and risk with respect to markets globally and the performance of a Fund and its investments or operations could be negatively impacted.
Regulators in the U.S. have proposed and recently adopted a number of changes to regulations involving the markets and issuers, some of which apply to the Fund. The full effect of various newly-adopted regulations is not currently known. Additionally, it is not clear whether the proposed regulations will be adopted. However, due to the broad scope of the new and proposed regulations, certain changes could limit a Fund’s ability to pursue its investment strategies or make certain investments, or may make it more costly for a Fund to operate, which may impact performance.
Economists and others have expressed increasing concern about the potential effects of global climate change on property and security values. Certain issuers, industries and regions may be adversely affected by the
22
American Beacon FundsSM
Notes to Financial Statements
June 30, 2024
impacts of climate change, including on the demand for and the development of goods and services and related production costs, and the impacts of legislation, regulation and international accords related to climate change, as well as any indirect consequences of regulation or business trends driven by climate change.
Securities Lending Risk
A Fund may lend its portfolio securities to brokers, dealers and financial institutions in to seek income. Borrowers of a Fund’s securities provide collateral either in the form of cash, which a Fund reinvests in securities or in the form of non-cash collateral consisting of securities issued or guaranteed by the U.S. government or one of its agencies or instrumentalities. A Fund will be responsible for the risks associated with the investment of cash collateral, including any collateral invested in an affiliated money market fund. A Fund may lose money on its investment of cash collateral or may fail to earn sufficient income on its investment to cover its payment to the borrower of a pre-negotiated fee or “rebate” for the use of that cash collateral in connection with the loan. A Fund could also lose money due to a decline in the value of non-cash collateral. In addition, delays may occur in the recovery of securities from borrowers, which could interfere with a Fund’s ability to vote proxies or to settle transactions or could result in increased costs. Moreover, if the borrower becomes subject to insolvency or similar proceedings, a Fund could incur delays in its ability to enforce its rights in its collateral. There also is a risk that a borrower may default on its obligation to return loaned securities at a time when the value of a Fund’s collateral is inadequate. Although a Fund’s securities lending agent may indemnify a Fund against that risk, it is also possible that the securities lending agent will be unable to satisfy its indemnification obligations. In any case in which the loaned securities are not returned to a Fund before an ex-dividend date, whether or not due to a default by the borrower, the payment in lieu of the dividend that a Fund receives from the securities’ borrower would not be treated as a dividend for federal income tax purposes and thus would not qualify for treatment as “qualified dividend income.”
Securities Selection Risk
Securities selected by the sub-advisor or the Manager for the Funds may not perform to expectations. The portfolio managers’ judgments about the attractiveness, value and anticipated price movements of a particular asset class or individual security may be incorrect, and there is no guarantee that individual securities will perform as anticipated. The value of an individual security can be more or less volatile than the market as a whole or a relative value approach may fail to produce the intended results. The portfolio managers’ assessment of relative value may be wrong or even if the assessment of relative value is correct, it may take a long period of time before the price and intrinsic value converge. It may not be possible to predict, or to hedge against, a widening in the yield spread of the securities selected by a sub-advisor. This could result in the Funds’ underperformance compared to other funds with similar investment objectives.
6. Federal Income and Excise Taxes
It is the policy of each Fund to qualify as a regulated investment company (“RIC”), by complying with all applicable provisions of Subchapter M of the Internal Revenue Code, as amended, and to make distributions of taxable income sufficient to relieve it from substantially all federal income and excise taxes. For federal income tax purposes, each Fund is treated as a single entity for the purpose of determining such qualification.
The Funds do not have any unrecorded tax liabilities in the accompanying financial statements. Each of the tax years in the four year period ended June 30, 2024 remain subject to examination by the Internal Revenue Service. If applicable, the Funds recognize interest accrued related to unrecognized tax benefits in interest expense and penalties in “Other expenses” on the Statements of Operations.
The Funds may be subject to taxes imposed by countries in which it invests. Such taxes are generally based on returns of income earned or gains realized or repatriated. Taxes are accrued and applied to net investment income, net realized capital gains and net unrealized appreciation (depreciation), as applicable, as the income is earned or capital gains are recorded.
23
American Beacon FundsSM
Notes to Financial Statements
June 30, 2024
Dividends are categorized in accordance with income tax regulations which may treat certain transactions differently than U.S. GAAP. Accordingly, the character of distributions and composition of net assets for tax purposes may differ from those reflected in the accompanying financial statements.
The tax character of distributions paid were as follows:
| | | | | | | | | | | | | | | | | | | | | | | | | | | | |
| | | Shapiro Equity Opportunities Fund | | | | | | Shapiro SMID Cap Equity Fund | |
| | | Year Ended
June 30, 2024 | | | | | | Year Ended
June 30, 2023 | | | | | | Year Ended
June 30, 2024 | | | | | | Year Ended
June 30, 2023 | |
Distributions paid from: | | | | | | | | | | | | | | | | | | | | | | | | | | | | |
Ordinary income* | | | | | | | | | | | | | | | | | | | | | | | | | | | | |
R5 Class | | $ | 560,501 | | | | | | | $ | 1,173,992 | | | | | | | $ | 1,163,107 | | | | | | | $ | 262,294 | |
Y Class | | | 1,221,755 | | | | | | | | 2,482,473 | | | | | | | | 708,765 | | | | | | | | 174,028 | |
Investor Class | | | 9,550 | | | | | | | | 54,883 | | | | | | | | 875,838 | | | | | | | | 270,146 | |
A Class | | | 568 | | | | | | | | 1,783 | | | | | | | | 108,510 | | | | | | | | 27,432 | |
C Class | | | - | | | | | | | | 1,247 | | | | | | | | 41,733 | | | | | | | | 7,881 | |
R6 Class | | | - | | | | | | | | - | | | | | | | | 64,216 | | | | | | | | 11,996 | |
Long-term capital gains | | | | | | | | | | | | | | | | | | | | | | | | | | | | |
R5 Class | | | - | | | | | | | | 3,243,294 | | | | | | | | 362,772 | | | | | | | | 302,668 | |
Y Class | | | - | | | | | | | | 7,069,277 | | | | | | | | 221,062 | | | | | | | | 200,814 | |
Investor Class | | | - | | | | | | | | 171,322 | | | | | | | | 273,173 | | | | | | | | 311,728 | |
A Class | | | - | | | | | | | | 4,925 | | | | | | | | 33,845 | | | | | | | | 32,239 | |
C Class | | | - | | | | | | | | 4,919 | | | | | | | | 13,223 | | | | | | | | 10,796 | |
R6 Class | | | - | | | | | | | | - | | | | | | | | 20,029 | | | | | | | | 13,843 | |
| | | | | | | | | | | | | | | | | | | | | | | | | | | | |
Total distributions paid | | | 1,792,374 | | | | | | | | 14,208,115 | | | | | | | | 3,886,273 | | | | | | | | 1,625,865 | |
| | | | | | | | | | | | | | | | | | | | | | | | | | | | |
*For tax purposes, short-term capital gains are considered ordinary income distributions.
As of June 30, 2024, the components of distributable earnings (deficits) on a tax basis were as follows:
| | | | | | | | | | | | | | | | | | | | | | | | | | | | |
Fund | | Tax Cost | | | | | | Unrealized
Appreciation | | | | | | Unrealized
(Depreciation) | | | | | | Net Unrealized
Appreciation
(Depreciation) | |
Shapiro Equity Opportunities | | $ | 109,496,883 | | | | | | | $ | 21,758,193 | | | | | | | $ | (2,804,733 | ) | | | | | | $ | 18,953,460 | |
Shapiro SMID Cap Equity | | | 39,802,973 | | | | | | | | 6,522,876 | | | | | | | | (2,897,868 | ) | | | | | | | 3,625,008 | |
| | | | | | | | | | | | | | | | | | | | | | | | | | | | | | | | | | | | | | | | | | | | |
Fund | | Net Unrealized
Appreciation
(Depreciation) | | | | | | Undistributed
Ordinary
Income | | | | | | Undistributed
Long-Term
Capital Gains | | | | | | Accumulated
Capital and
Other (Losses) | | | | | | Other Temporary
Differences | | | | | | Distributable
Earnings | |
Shapiro Equity Opportunities | | $ | 18,953,460 | | | | | | | $ | 884,806 | | | | | | | $ | - | | | | | | | $ | (12,137,764 | ) | | | | | | $ | (1,621 | ) | | | | | | $ | 7,698,881 | |
Shapiro SMID Cap Equity | | | 3,625,008 | | | | | | | | - | | | | | | | | 571,616 | | | | | | | | - | | | | | | | | (1,877 | ) | | | | | | | 4,194,747 | |
Financial reporting records are adjusted for permanent book/tax differences to reflect tax character. Financial records are not adjusted for temporary differences. The temporary differences between financial reporting and tax-basis reporting of unrealized appreciation (depreciation) are attributable primarily to the tax deferral of losses from wash sales and organizational expenses.
Due to inherent differences in the recognition of income, expenses, and realized gains (losses) under U.S. GAAP and federal income tax regulations, permanent differences between book and tax reporting have been identified and appropriately reclassified on the Statements of Assets and Liabilities.
Accordingly, the following amounts represent current year permanent differences derived from net operating loss as of June 30, 2024:
| | | | | | | | | | | | |
Fund | | Paid-in-Capital | | | | | | Distributable
Earnings/(Deficits) | |
Shapiro Equity Opportunities | | $ | - | | | | | | | $ | - | |
Shapiro SMID Cap Equity | | | (62,103 | ) | | | | | | | 62,103 | |
24
American Beacon FundsSM
Notes to Financial Statements
June 30, 2024
Under the Regulated Investment Company Modernization Act of 2010 (“RIC MOD”), net capital losses recognized by the Funds in taxable years beginning after December 22, 2010 are carried forward indefinitely and retain their character as short-term and/or long-term losses.
As of June 30, 2024, the Funds had the following capital loss carryforwards:
| | | | | | | | | | | | |
Fund | | Short-Term Capital
Loss Carryforwards | | | | | | Long-Term Capital
Loss Carryforwards | |
Shapiro Equity Opportunities | | $ | 6,079,711 | | | | | | | $ | 6,058,053 | |
Shapiro SMID Cap Equity | | | - | | | | | | | | - | |
During the year ended June 30, 2024, the Shapiro Equity Opportunities Fund utilized $6,254,336 long-term capital loss carryforwards.
7. Investment Transactions
The aggregate cost of purchases and proceeds from sales and maturities of investments, other than short-term obligations, for the year ended June 30, 2024 were as follows:
| | | | | | | | | | | | |
Fund | | Purchases (non-U.S.
Government
Securities) | | | | | | Sales (non-U.S.
Government
Securities) | |
Shapiro Equity Opportunities | | $ | 109,257,374 | | | | | | | $ | 190,650,190 | |
Shapiro SMID Cap Equity | | | 21,840,007 | | | | | | | | 37,873,668 | |
A summary of the Funds’ transactions in the USG Select Fund for the year ended June 30, 2024 were as follows:
| | | | | | | | | | | | | | | | | | | | | | | | | | | | | | | | | | |
Fund | | Type of
Transaction | | | | | June 30,
2023
Shares/Fair
Value | | | | | | Purchases | | | | | | Sales | | | | | | June 30,
2024
Shares/Fair
Value | |
| Shapiro Equity Opportunities | | Direct | | | | | | $ | 6,829,058 | | | | | | | $ | 88,381,081 | | | | | | | $ | 95,210,139 | | | | | | | $ | - | |
| Shapiro Equity Opportunities | | Securities Lending | | | | | | | - | | | | | | | | 42,602,019 | | | | | | | | 42,602,019 | | | | | | | | - | |
| Shapiro SMID Cap Equity | | Direct | | | | | | | 1,912,344 | | | | | | | | 22,688,325 | | | | | | | | 24,178,720 | | | | | | | | 421,949 | |
| Shapiro SMID Cap Equity | | Securities Lending | | | | | | | 2,218,416 | | | | | | | | 21,432,959 | | | | | | | | 23,651,375 | | | | | | | | - | |
8. Securities Lending
The Funds may lend their securities to qualified financial institutions, such as certain broker-dealers, to earn additional income. The borrowers are required to secure their loans continuously with collateral in an amount at least equal to the fair value of the securities loaned, initially in an amount at least equal to 102% of the fair value of domestic securities loaned and 105% of the fair value of international securities loaned. Collateral is monitored and marked-to-market daily. Daily mark-to-market amounts are required to be paid to the borrower or received from the borrower by the end of the following business day. This one day settlement for mark-to-market amounts may result in the collateral being temporarily less than the value of the securities on loan or temporarily more than the required minimum collateral.
To the extent that a loan is collateralized by cash, such cash collateral shall be invested by the securities lending agent (the “Agent”) in money market mutual funds and other short-term investments, provided the investments meet certain quality and diversification requirements. Securities purchased with cash collateral proceeds are listed in the Funds’ Schedule of Investments and the collateral is shown on the Statements of Assets and Liabilities as a payable.
25
American Beacon FundsSM
Notes to Financial Statements
June 30, 2024
Securities lending income is generated from the demand premium (if any) paid by the borrower to borrow a specific security and from the return on investment of cash collateral, reduced by negotiated rebate fees paid to the borrower and transaction costs. To the extent that a loan is secured by non-cash collateral, securities lending income is generated as a demand premium reduced by transaction costs. The Funds, the Agent, and the Manager retained 80%, 10%, and 10%, respectively, of the income generated from securities lending.
While securities are on loan, the Funds continue to receive certain income associated with that security and any gain or loss in the market price that may occur during the term of the loan. In the case of domestic equities, the value of any dividend is received in the form of a substitute payment approximately equal to the dividend. In the case of foreign securities, a negotiated amount is received that is less than the actual dividend, but higher than the dividend amount minus the foreign tax that the Funds would be subject to on the dividend.
Securities lending transactions pose certain risks to the Funds, including that the borrower may not provide additional collateral when required or return the securities when due, that the value of the short-term investments will be less than the amount of cash collateral required to be returned to the borrower, that non-cash collateral may be subject to legal constraints in the event of a borrower bankruptcy, and that the cash collateral investments could become illiquid and unable to be used to return collateral to the borrower. The Funds could also experience delays and costs in gaining access to the collateral. The Funds bear the risk of any deficiency in the amount of the cash collateral available for return to the borrower and any action which impairs its ability to liquidate non-cash collateral to satisfy a borrower default.
As of June 30, 2024, the value of outstanding securities on loan and the value of collateral were as follows:
| | | | | | | | | | | | | | | | | | | | | | | | | | |
Fund | | Fair Value of
Securities on Loan | | | | | Cash Collateral
Received | | | | | | Non-Cash Collateral
Received | | | | | | Total Collateral
Received | |
| Shapiro Equity Opportunities | | $923,079 | | | | | | $ | - | | | | | | | $ | 929,994 | | | | | | | $ | 929,994 | |
| Shapiro SMID Cap Equity | | 2,392,385 | | | | | | | - | | | | | | | | 2,434,822 | | | | | | | | 2,434,822 | |
Cash collateral is listed on the Funds’ Schedules of Investments and is shown on the Statements of Assets and Liabilities. Income earned on these investments is included in “Income derived from securities lending” on the Statements of Operations.
Non-cash collateral received by the Funds may not be sold or re-pledged except to satisfy a borrower default. Therefore, non-cash collateral is not included on the Funds’ Schedules of Investments or Statements of Assets and Liabilities.
9. Borrowing Arrangements
Effective November 10, 2023 (the “Effective Date”), the Funds, along with certain other funds managed by the Manager (“Participating Funds”), renewed a committed revolving line of credit (the “Committed Line”) agreement with State Street Bank and Trust Company (the “Bank”) to be used to facilitate portfolio liquidity. The maximum borrowing amount under the Committed Line is $100 million with interest at a rate equal to the higher of (a) Overnight Bank Funding Rate (“OBFR”) daily fluctuating rate per annum equal to 1.25% plus the sum of 0.10% or (b) the Federal Funds daily fluctuating rate per annum on amounts borrowed. Each of the Participating Funds paid a proportional amount of a quarterly commitment fee at a rate of 0.25% per annum on the unused portion of the Committed Line amount. The Committed Line expires November 8, 2024, unless extended by the Bank or terminated by the Participating Funds in accordance with the agreement. Prior to the Effective Date, the maximum borrowing amount under the Committed Line was $100 million with an expiration date November 9, 2023.
On the Effective Date, the Funds, along with certain other Participating Funds managed by the Manager, also renewed an uncommitted discretionary demand revolving line of credit (the “Uncommitted Line”) agreement with the Bank to be used to facilitate portfolio liquidity. The maximum borrowing amount under the Uncommitted Line is $100 million with interest at a rate equal to the higher of (a) OBFR daily fluctuating rate per annum equal to
26
American Beacon FundsSM
Notes to Financial Statements
June 30, 2024
1.25% plus the sum of 0.10% or (b) the Federal Funds daily fluctuating rate per annum on amounts borrowed on each outstanding loan. Each of the Participating Funds paid a proportional amount of a closing fee of $35,000 on the Effective Date. The Uncommitted Line expires November 8, 2024, unless extended by the Bank or terminated by the Participating Funds in accordance with the agreement. Prior to the Effective Date, the maximum borrowing amount under the Uncommitted Line was $100 million with an expiration date November 9, 2023.
The Participating Funds paid administration, legal and arrangement fees, which are recognized as a component of “Line of Credit expense” on the Statements of Operations, along with commitment fees, that have been allocated among the Participating Funds based on average daily net assets.
During the year ended June 30, 2024, the Funds did not utilize these facilities.
10. Capital Share Transactions
The tables below summarize the activity in capital shares for each Class of the Funds:
| | | | | | | | | | | | | | | | | | | | | | | | | | | | |
| | | R5 Class | |
| | | Year Ended
June 30, 2024 | | | | | | Year Ended
June 30, 2023 | |
Shapiro Equity Opportunities Fund | | Shares | | | | | | Amount | | | | | | Shares | | | | | | Amount | |
| Shares sold | | | 26,235 | | | | | | | $ | 331,204 | | | | | | | | 38,399 | | | | | | | $ | 468,653 | |
| Reinvestment of dividends | | | 42,366 | | | | | | | | 560,501 | | | | | | | | 377,223 | | | | | | | | 4,417,285 | |
| Shares redeemed | | | (4,397,430 | ) | | | | | | | (61,499,986 | ) | | | | | | | (27,131 | ) | | | | | | | (336,695 | ) |
| | | | | | | | | | | | | | | | | | | | | | | | | | | | |
| Net increase (decrease) in shares outstanding | | | (4,328,829 | ) | | | | | | $ | (60,608,281 | ) | | | | | | | 388,491 | | | | | | | $ | 4,549,243 | |
| | | | | | | | | | | | | | | | | | | | | | | | | | | | |
| | | | |
| | | Y Class | |
| | | Year Ended
June 30, 2024 | | | | | | Year Ended
June 30, 2023 | |
Shapiro Equity Opportunities Fund | | Shares | | | | | | Amount | | | | | | Shares | | | | | | Amount | |
| Shares sold | | | 3,026,529 | | | | | | | $ | 37,713,927 | | | | | | | | 2,923,320 | | | | | | | $ | 37,589,534 | |
| Reinvestment of dividends | | | 75,306 | | | | | | | | 992,535 | | | | | | | | 780,234 | | | | | | | | 9,105,330 | |
| Shares redeemed | | | (4,661,204 | ) | | | | | | | (61,078,304 | ) | | | | | | | (4,278,790 | ) | | | | | | | (54,949,364 | ) |
| | | | | | | | | | | | | | | | | | | | | | | | | | | | |
| Net (decrease) in shares outstanding | | | (1,559,369 | ) | | | | | | $ | (22,371,842 | ) | | | | | | | (575,236 | ) | | | | | | $ | (8,254,500 | ) |
| | | | | | | | | | | | | | | | | | | | | | | | | | | | |
| | | | |
| | | Investor Class | |
| | | Year Ended
June 30, 2024 | | | | | | Year Ended
June 30, 2023 | |
Shapiro Equity Opportunities Fund | | Shares | | | | | | Amount | | | | | | Shares | | | | | | Amount | |
| Shares sold | | | 7,891 | | | | | | | $ | 104,643 | | | | | | | | 9,044 | | | | | | | $ | 115,891 | |
| Reinvestment of dividends | | | 731 | | | | | | | | 9,550 | | | | | | | | 19,551 | | | | | | | | 226,205 | |
| Shares redeemed | | | (54,512 | ) | | | | | | | (694,697 | ) | | | | | | | (135,696 | ) | | | | | | | (1,664,997 | ) |
| | | | | | | | | | | | | | | | | | | | | | | | | | | | |
| Net (decrease) in shares outstanding | | | (45,890 | ) | | | | | | $ | (580,504 | ) | | | | | | | (107,101 | ) | | | | | | $ | (1,322,901 | ) |
| | | | | | | | | | | | | | | | | | | | | | | | | | | | |
| | | | |
| | | A Class | |
| | | Year Ended
June 30, 2024 | | | | | | Year Ended
June 30, 2023 | |
Shapiro Equity Opportunities Fund | | Shares | | | | | | Amount | | | | | | Shares | | | | | | Amount | |
| Shares sold | | | - | | | | | | | $ | - | | | | | | | | - | | | | | | | $ | - | |
| Reinvestment of dividends | | | - | | | | | | | | - | | | | | | | | - | | | | | | | | - | |
| Shares redeemed | | | - | | | | | | | | - | | | | | | | | - | | | | | | | | - | |
| | | | | | | | | | | | | | | | | | | | | | | | | | | | |
| Net increase in shares outstanding | | | - | | | | | | | $ | - | | | | | | | | - | | | | | | | $ | - | |
| | | | | | | | | | | | | | | | | | | | | | | | | | | | |
| | | | |
| | | C Class | |
| | | Year Ended
June 30, 2024 | | | | | | Year Ended
June 30, 2023 | |
Shapiro Equity Opportunities Fund | | Shares | | | | | | Amount | | | | | | Shares | | | | | | Amount | |
| Shares sold | | | - | | | | | | | $ | - | | | | | | | | - | | | | | | | $ | - | |
| Reinvestment of dividends | | | - | | | | | | | | - | | | | | | | | - | | | | | | | | - | |
| Shares redeemed | | | - | | | | | | | | - | | | | | | | | - | | | | | | | | - | |
| | | | | | | | | | | | | | | | | | | | | | | | | | | | |
| Net increase in shares outstanding | | | - | | | | | | | $ | - | | | | | | | | - | | | | | | | $ | - | |
| | | | | | | | | | | | | | | | | | | | | | | | | | | | |
| | | | |
27
American Beacon FundsSM
Notes to Financial Statements
June 30, 2024
| | | | | | | | | | | | | | | | | | | | | | | | | | | | |
| | | R5 Class | |
| | | Year Ended
June 30, 2024 | | | | | | Year Ended
June 30, 2023 | |
Shapiro SMID Cap Equity Fund | | Shares | | | | | | Amount | | | | | | Shares | | | | | | Amount | |
| Shares sold | | | 293,421 | | | | | | | $ | 3,201,693 | | | | | | | | 532,452 | | | | | | | $ | 5,887,471 | |
| Reinvestment of dividends | | | 138,344 | | | | | | | | 1,524,553 | | | | | | | | 52,237 | | | | | | | | 564,680 | |
| Issued in Reorganization | | | - | | | | | | | | - | | | | | | | | 2,248,531 | | | | | | | | 24,951,727 | |
| Shares redeemed | | | (791,085 | ) | | | | | | | (8,783,370 | ) | | | | | | | (1,434,593 | ) | | | | | | | (16,355,091 | ) |
| | | | | | | | | | | | | | | | | | | | | | | | | | | | |
| Net increase (decrease) in shares outstanding | | | (359,320 | ) | | | | | | $ | (4,057,124 | ) | | | | | | | 1,398,627 | | | | | | | $ | 15,048,787 | |
| | | | | | | | | | | | | | | | | | | | | | | | | | | | |
| | | | |
| | | Y Class | |
| | | Year Ended
June 30, 2024 | | | | | | Year Ended
June 30, 2023 | |
Shapiro SMID Cap Equity Fund | | Shares | | | | | | Amount | | | | | | Shares | | | | | | Amount | |
| Shares sold | | | 158,004 | | | | | | | $ | 1,717,918 | | | | | | | | 192,399 | | | | | | | $ | 2,217,808 | |
| Reinvestment of dividends | | | 84,106 | | | | | | | | 920,119 | | | | | | | | 34,450 | | | | | | | | 369,993 | |
| Issued in Reorganization | | | - | | | | | | | | - | | | | | | | | 1,813,806 | | | | | | | | 20,003,917 | |
| Shares redeemed | | | (615,797 | ) | | | | | | | (6,512,575 | ) | | | | | | | (880,657 | ) | | | | | | | (9,827,911 | ) |
| | | | | | | | | | | | | | | | | | | | | | | | | | | | |
| Net increase (decrease) in shares outstanding | | | (373,687 | ) | | | | | | $ | (3,874,538 | ) | | | | | | | 1,159,998 | | | | | | | $ | 12,763,807 | |
| | | | | | | | | | | | | | | | | | | | | | | | | | | | |
| | | | |
| | | Investor Class | |
| | | Year Ended
June 30, 2024 | | | | | | Year Ended
June 30, 2023 | |
Shapiro SMID Cap Equity Fund | | Shares | | | | | | Amount | | | | | | Shares | | | | | | Amount | |
| Shares sold | | | 57,273 | | | | | | | $ | 614,479 | | | | | | | | 191,492 | | | | | | | $ | 2,150,643 | |
| Reinvestment of dividends | | | 107,084 | | | | | | | | 1,149,010 | | | | | | | | 54,992 | | | | | | | | 581,820 | |
| Issued in Reorganization | | | - | | | | | | | | - | | | | | | | | 2,410,152 | | | | | | | | 26,190,156 | |
| Shares redeemed | | | (638,947 | ) | | | | | | | (6,754,830 | ) | | | | | | | (1,414,853 | ) | | | | | | | (15,467,732 | ) |
| | | | | | | | | | | | | | | | | | | | | | | | | | | | |
| Net increase (decrease) in shares outstanding | | | (474,590 | ) | | | | | | $ | (4,991,341 | ) | | | | | | | 1,241,783 | | | | | | | $ | 13,454,887 | |
| | | | | | | | | | | | | | | | | | | | | | | | | | | | |
| | | | |
| | | A Class | |
| | | Year Ended
June 30, 2024 | | | | | | Year Ended
June 30, 2023 | |
Shapiro SMID Cap Equity Fund | | Shares | | | | | | Amount | | | | | | Shares | | | | | | Amount | |
| Shares sold | | | 41,460 | | | | | | | $ | 433,341 | | | | | | | | 23,038 | | | | | | | $ | 258,854 | |
| Reinvestment of dividends | | | 13,134 | | | | | | | | 140,663 | | | | | | | | 5,605 | | | | | | | | 59,189 | |
| Issued in Reorganization | | | - | | | | | | | | - | | | | | | | | 261,868 | | | | | | | | 2,841,555 | |
| Shares redeemed | | | (100,502 | ) | | | | | | | (1,076,283 | ) | | | | | | | (86,466 | ) | | | | | | | (965,149 | ) |
| | | | | | | | | | | | | | | | | | | | | | | | | | | | |
| Net increase (decrease) in shares outstanding | | | (45,908 | ) | | | | | | $ | (502,279 | ) | | | | | | | 204,045 | | | | | | | $ | 2,194,449 | |
| | | | | | | | | | | | | | | | | | | | | | | | | | | | |
| | | | |
| | | C Class | |
| | | Year Ended
June 30, 2024 | | | | | | Year Ended
June 30, 2023 | |
Shapiro SMID Cap Equity Fund | | Shares | | | | | | Amount | | | | | | Shares | | | | | | Amount | |
| Shares sold | | | 1,734 | | | | | | | $ | 19,341 | | | | | | | | 685 | | | | | | | $ | 7,560 | |
| Reinvestment of dividends | | | 5,083 | | | | | | | | 53,633 | | | | | | | | 1,750 | | | | | | | | 18,354 | |
| Issued in Reorganization | | | - | | | | | | | | - | | | | | | | | 104,408 | | | | | | | | 1,124,519 | |
| Shares redeemed | | | (51,327 | ) | | | | | | | (534,337 | ) | | | | | | | (38,551 | ) | | | | | | | (426,829 | ) |
| | | | | | | | | | | | | | | | | | | | | | | | | | | | |
| Net increase (decrease) in shares outstanding | | | (44,510 | ) | | | | | | $ | (461,363 | ) | | | | | | | 68,292 | | | | | | | $ | 723,604 | |
| | | | | | | | | | | | | | | | | | | | | | | | | | | | |
| | | | |
| | | R6 Class | |
| | | Year Ended
June 30, 2024 | | | | | | Year Ended
June 30, 2023 | |
Shapiro SMID Cap Equity Fund | | Shares | | | | | | Amount | | | | | | Shares | | | | | | Amount | |
| Shares sold | | | 15,974 | | | | | | | $ | 174,501 | | | | | | | | 16,993 | | | | | | | $ | 193,874 | |
| Reinvestment of dividends | | | 7,645 | | | | | | | | 84,245 | | | | | | | | 2,390 | | | | | | | | 25,839 | |
| Issued in Reorganization | | | - | | | | | | | | - | | | | | | | | 112,576 | | | | | | | | 1,248,995 | |
| Shares redeemed | | | (36,716 | ) | | | | | | | (397,033 | ) | | | | | | | (35,896 | ) | | | | | | | (408,465 | ) |
| | | | | | | | | | | | | | | | | | | | | | | | | | | | |
| Net increase (decrease) in shares outstanding | | | (13,097 | ) | | | | | | $ | (138,287 | ) | | | | | | | 96,063 | | | | | | | $ | 1,060,243 | |
| | | | | | | | | | | | | | | | | | | | | | | | | | | | |
28
American Beacon FundsSM
Notes to Financial Statements
June 30, 2024
11. Subsequent Events
Management has evaluated subsequent events for possible recognition or disclosure in the financial statements through the date the financial statements are issued. Management has determined that there are no material events that would require disclosure in the Funds’ financial statements through this date.
29
American Beacon Shapiro Equity Opportunities FundSM
Financial Highlights
(For a share outstanding throughout the period)
| | | | | | | | | | | | | | | | | | | | | | | | | | | | | | | | | | | | |
| | | R5 ClassA | |
| | | Year Ended June 30, | |
| | | | |
| | | 2024 | | | | | | 2023 | | | | | | 2022 | | | | | | 2021 | | | | | | 2020 | |
| | | | |
Net asset value, beginning of period | | $ | 12.61 | | | | | | | $ | 12.90 | | | | | | | $ | 16.77 | | | | | | | $ | 9.44 | | | | | | | $ | 11.28 | |
| | | | | | | | | | | | | | | | | | | | | | | | | | | | | | | | | | | | |
Income (loss) from investment operations: | | | | | | | | | | | | | | | | | | | | | | | | | | | | | | | | | | | | |
Net investment income | | | 1.01 | | | | | | | | 0.12 | | | | | | | | 0.16 | | | | | | | | 0.12 | | | | | | | | 0.14 | |
Net gains (losses) on investments (both realized and unrealized) | | | 0.69 | | | | | | | | 0.60 | | | | | | | | (2.95 | ) | | | | | | | 7.49 | | | | | | | | (1.36 | ) |
| | | | | | | | | | | | | | | | | | | | | | | | | | | | | | | | | | | | |
Total income (loss) from investment operations | | | 1.70 | | | | | | | | 0.72 | | | | | | | | (2.79 | ) | | | | | | | 7.61 | | | | | | | | (1.22 | ) |
| | | | | | | | | | | | | | | | | | | | | | | | | | | | | | | | | | | | |
Less distributions: | | | | | | | | | | | | | | | | | | | | | | | | | | | | | | | | | | | | |
Dividends from net investment income | | | (0.12 | ) | | | | | | | (0.08 | ) | | | | | | | (0.16 | ) | | | | | | | (0.05 | ) | | | | | | | (0.11 | ) |
Distributions from net realized gains | | | - | | | | | | | | (0.93 | ) | | | | | | | (0.92 | ) | | | | | | | (0.23 | ) | | | | | | | (0.51 | ) |
| | | | | | | | | | | | | | | | | | | | | | | | | | | | | | | | | | | | |
Total distributions | | | (0.12 | ) | | | | | | | (1.01 | ) | | | | | | | (1.08 | ) | | | | | | | (0.28 | ) | | | | | | | (0.62 | ) |
| | | | | | | | | | | | | | | | | | | | | | | | | | | | | | | | | | | | |
Net asset value, end of period | | $ | 14.19 | | | | | | | $ | 12.61 | | | | | | | $ | 12.90 | | | | | | | $ | 16.77 | | | | | | | $ | 9.44 | |
| | | | | | | | | | | | | | | | | | | | | | | | | | | | | | | | | | | | |
Total returnB | | | 13.53 | % | | | | | | | 6.16 | % | | | | | | | (17.65 | )% | | | | | | | 81.43 | % | | | | | | | (11.84 | )% |
| | | | | | | | | | | | | | | | | | | | | | | | | | | | | | | | | | | | |
| | | | | | | | | |
Ratios and supplemental data: | | | | | | | | | | | | | | | | | | | | | | | | | | | | | | | | | | | | |
Net assets, end of period | | $ | 6,556,093 | | | | | | | $ | 60,402,983 | | | | | | | $ | 56,812,654 | | | | | | | $ | 71,421,117 | | | | | | | $ | 40,207,550 | |
Ratios to average net assets: | | | | | | | | | | | | | | | | | | | | | | | | | | | | | | | | | | | | |
Expenses, before reimbursements and/or recoupments | | | 0.87 | % | | | | | | | 0.87 | % | | | | | | | 0.83 | % | | | | | | | 0.86 | % | | | | | | | 0.97 | % |
Expenses, net of reimbursements and/or recoupmentsC | | | 0.80 | % | | | | | | | 0.79 | % | | | | | | | 0.79 | % | | | | | | | 0.79 | % | | | | | | | 0.79 | % |
Net investment income, before expense reimbursements and/or recoupments | | | 0.37 | % | | | | | | | 0.88 | % | | | | | | | 0.96 | % | | | | | | | 0.82 | % | | | | | | | 1.11 | % |
Net investment income, net of reimbursements and/or recoupments | | | 0.44 | % | | | | | | | 0.96 | % | | | | | | | 1.00 | % | | | | | | | 0.89 | % | | | | | | | 1.29 | % |
Portfolio turnover rate | | | 59 | % | | | | | | | 33 | % | | | | | | | 47 | % | | | | | | | 31 | % | | | | | | | 59 | % |
| A | Prior to February 28, 2020, the R5 Class was known as Institutional Class. |
| B | Based on net asset value, which does not reflect the sales charge, redemption fee, or contingent deferred sales charge, if applicable. May include adjustments in accordance with U.S. GAAP and as such, the net asset value for reporting purposes and the returns based upon those net asset values may differ from the net asset value and returns for shareholder transactions. |
| C | Expense ratios may exceed stated expense caps in Note 2 due to loan interest expense. |
See accompanying notes
30
American Beacon Shapiro Equity Opportunities FundSM
Financial Highlights
(For a share outstanding throughout the period)
| | | | | | | | | | | | | | | | | | | | | | | | | | | | | | | | | | | | |
| | | Y Class | |
| | | Year Ended June 30, | |
| | | | |
| | | 2024 | | | | | | 2023 | | | | | | 2022 | | | | | | 2021 | | | | | | 2020 | |
| | | | |
Net asset value, beginning of period | | $ | 12.56 | | | | | | | $ | 12.87 | | | | | | | $ | 16.72 | | | | | | | $ | 9.43 | | | | | | | $ | 11.28 | |
| | | | | | | | | | | | | | | | | | | | | | | | | | | | | | | | | | | | |
Income (loss) from investment operations: | | | | | | | | | | | | | | | | | | | | | | | | | | | | | | | | | | | | |
Net investment income | | | 0.06 | | | | | | | | 0.12 | | | | | | | | 0.14 | | | | | | | | 0.06 | | | | | | | | 0.12 | |
Net gains (losses) on investments (both realized and unrealized) | | | 1.59 | | | | | | | | 0.57 | | | | | | | | (2.92 | ) | | | | | | | 7.51 | | | | | | | | (1.35 | ) |
| | | | | | | | | | | | | | | | | | | | | | | | | | | | | | | | | | | | |
Total income (loss) from investment operations | | | 1.65 | | | | | | | | 0.69 | | | | | | | | (2.78 | ) | | | | | | | 7.57 | | | | | | | | (1.23 | ) |
| | | | | | | | | | | | | | | | | | | | | | | | | | | | | | | | | | | | |
Less distributions: | | | | | | | | | | | | | | | | | | | | | | | | | | | | | | | | | | | | |
Dividends from net investment income | | | (0.11 | ) | | | | | | | (0.07 | ) | | | | | | | (0.15 | ) | | | | | | | (0.05 | ) | | | | | | | (0.11 | ) |
Distributions from net realized gains | | | - | | | | | | | | (0.93 | ) | | | | | | | (0.92 | ) | | | | | | | (0.23 | ) | | | | | | | (0.51 | ) |
| | | | | | | | | | | | | | | | | | | | | | | | | | | | | | | | | | | | |
Total distributions | | | (0.11 | ) | | | | | | | (1.00 | ) | | | | | | | (1.07 | ) | | | | | | | (0.28 | ) | | | | | | | (0.62 | ) |
| | | | | | | | | | | | | | | | | | | | | | | | | | | | | | | | | | | | |
Net asset value, end of period | | $ | 14.10 | | | | | | | $ | 12.56 | | | | | | | $ | 12.87 | | | | | | | $ | 16.72 | | | | | | | $ | 9.43 | |
| | | | | | | | | | | | | | | | | | | | | | | | | | | | | | | | | | | | |
Total returnA | | | 13.23 | % | | | | | | | 5.95 | % | | | | | | | (17.63 | )% | | | | | | | 81.09 | % | | | | | | | (11.92 | )% |
| | | | | | | | | | | | | | | | | | | | | | | | | | | | | | | | | | | | |
| | | | | | | | | |
Ratios and supplemental data: | | | | | | | | | | | | | | | | | | | | | | | | | | | | | | | | | | | | |
Net assets, end of period | | $ | 124,188,718 | | | | | | | $ | 130,201,209 | | | | | | | $ | 140,753,789 | | | | | | | $ | 174,605,529 | | | | | | | $ | 30,239,629 | |
Ratios to average net assets: | | | | | | | | | | | | | | | | | | | | | | | | | | | | | | | | | | | | |
Expenses, before reimbursements and/or recoupments | | | 0.95 | % | | | | | | | 0.97 | % | | | | | | | 0.93 | % | | | | | | | 0.95 | % | | | | | | | 1.09 | % |
Expenses, net of reimbursements and/or recoupmentsB | | | 0.90 | % | | | | | | | 0.89 | % | | | | | | | 0.89 | % | | | | | | | 0.89 | % | | | | | | | 0.89 | % |
Net investment income, before expense reimbursements and/or recoupments | | | 0.42 | % | | | | | | | 0.80 | % | | | | | | | 0.85 | % | | | | | | | 0.77 | % | | | | | | | 0.99 | % |
Net investment income, net of reimbursements and/or recoupments | | | 0.47 | % | | | | | | | 0.88 | % | | | | | | | 0.89 | % | | | | | | | 0.83 | % | | | | | | | 1.19 | % |
Portfolio turnover rate | | | 59 | % | | | | | | | 33 | % | | | | | | | 47 | % | | | | | | | 31 | % | | | | | | | 59 | % |
| A | Based on net asset value, which does not reflect the sales charge, redemption fee, or contingent deferred sales charge, if applicable. May include adjustments in accordance with U.S. GAAP and as such, the net asset value for reporting purposes and the returns based upon those net asset values may differ from the net asset value and returns for shareholder transactions. |
| B | Expense ratios may exceed stated expense caps in Note 2 due to loan interest expense. |
See accompanying notes
31
American Beacon Shapiro Equity Opportunities FundSM
Financial Highlights
(For a share outstanding throughout the period)
| | | | | | | | | | | | | | | | | | | | | | | | | | | | | | | | | | | | |
| | | Investor Class | |
| | | Year Ended June 30, | |
| | | | |
| | | 2024 | | | | | | 2023 | | | | | | 2022 | | | | | | 2021 | | | | | | 2020 | |
Net asset value, beginning of period | | $ | 12.44 | | | | | | | $ | 12.75 | | | | | | | $ | 16.56 | | | | | | | $ | 9.35 | | | | | | | $ | 11.20 | |
| | | | | | | | | | | | | | | | | | | | | | | | | | | | | | | | | | | | |
Income (loss) from investment operations: | | | | | | | | | | | | | | | | | | | | | | | | | | | | | | | | | | | | |
Net investment income | | | 0.16 | | | | | | | | 0.21 | | | | | | | | 0.21 | | | | | | | | 0.08 | | | | | | | | 0.08 | |
Net gains (losses) on investments (both realized and unrealized) | | | 1.46 | | | | | | | | 0.46 | | | | | | | | (2.99 | ) | | | | | | | 7.41 | | | | | | | | (1.34 | ) |
| | | | | | | | | | | | | | | | | | | | | | | | | | | | | | | | | | | | |
Total income (loss) from investment operations | | | 1.62 | | | | | | | | 0.67 | | | | | | | | (2.78 | ) | | | | | | | 7.49 | | | | | | | | (1.26 | ) |
| | | | | | | | | | | | | | | | | | | | | | | | | | | | | | | | | | | | |
Less distributions: | | | | | | | | | | | | | | | | | | | | | | | | | | | | | | | | | | | | |
Dividends from net investment income | | | (0.08 | ) | | | | | | | (0.05 | ) | | | | | | | (0.11 | ) | | | | | | | (0.05 | ) | | | | | | | (0.08 | ) |
Distributions from net realized gains | | | - | | | | | | | | (0.93 | ) | | | | | | | (0.92 | ) | | | | | | | (0.23 | ) | | | | | | | (0.51 | ) |
| | | | | | | | | | | | | | | | | | | | | | | | | | | | | | | | | | | | |
Total distributions | | | (0.08 | ) | | | | | | | (0.98 | ) | | | | | | | (1.03 | ) | | | | | | | (0.28 | ) | | | | | | | (0.59 | ) |
| | | | | | | | | | | | | | | | | | | | | | | | | | | | | | | | | | | | |
Net asset value, end of period | | $ | 13.98 | | | | | | | $ | 12.44 | | | | | | | $ | 12.75 | | | | | | | $ | 16.56 | | | | | | | $ | 9.35 | |
| | | | | | | | | | | | | | | | | | | | | | | | | | | | | | | | | | | | |
Total returnA | | | 13.09 | % | | | | | | | 5.81 | % | | | | | | | (17.80 | )% | | | | | | | 80.85 | % | | | | | | | (12.20 | )% |
| | | | | | | | | | | | | | | | | | | | | | | | | | | | | | | | | | | | |
| | | | | | | | | |
Ratios and supplemental data: | | | | | | | | | | | | | | | | | | | | | | | | | | | | | | | | | | | | |
Net assets, end of period | | $ | 1,401,560 | | | | | | | $ | 1,818,356 | | | | | | | $ | 3,228,564 | | | | | | | $ | 19,032,563 | | | | | | | $ | 320,828 | |
Ratios to average net assets: | | | | | | | | | | | | | | | | | | | | | | | | | | | | | | | | | | | | |
Expenses, before reimbursements and/or recoupments | | | 1.33 | % | | | | | | | 1.29 | % | | | | | | | 1.21 | % | | | | | | | 1.26 | % | | | | | | | 2.20 | % |
Expenses, net of reimbursements and/or recoupmentsB | | | 1.07 | % | | | | | | | 1.06 | % | | | | | | | 1.06 | % | | | | | | | 1.06 | % | | | | | | | 1.17 | % |
Net investment income (loss), before expense reimbursements and/or recoupments | | | 0.02 | % | | | | | | | 0.49 | % | | | | | | | 0.51 | % | | | | | | | 0.57 | % | | | | | | | (0.11 | )% |
Net investment income, net of reimbursements and/or recoupments | | | 0.28 | % | | | | | | | 0.72 | % | | | | | | | 0.66 | % | | | | | | | 0.77 | % | | | | | | | 0.92 | % |
Portfolio turnover rate | | | 59 | % | | | | | | | 33 | % | | | | | | | 47 | % | | | | | | | 31 | % | | | | | | | 59 | % |
| A | Based on net asset value, which does not reflect the sales charge, redemption fee, or contingent deferred sales charge, if applicable. May include adjustments in accordance with U.S. GAAP and as such, the net asset value for reporting purposes and the returns based upon those net asset values may differ from the net asset value and returns for shareholder transactions. |
| B | Expense ratios may exceed stated expense caps in Note 2 due to loan interest expense. |
See accompanying notes
32
American Beacon Shapiro Equity Opportunities FundSM
Financial Highlights
(For a share outstanding throughout the period)
| | | | | | | | | | | | | | | | | | | | |
| | | A Class | |
| | | Year Ended June 30, | | | October 29, 2021A to June 30, 2022 | |
| | | | |
| | | 2024 | | | | | | 2023 | | | | |
| | | | |
Net asset value, beginning of period | | $ | 12.35 | | | | | | | $ | 12.71 | | | | | | | $ | 16.09 | |
| | | | | | | | | | | | | | | | | | | | |
Income (loss) from investment operations: | | | | | | | | | | | | | | | | | | | | |
Net investment income | | | 0.04 | | | | | | | | 0.08 | | | | | | | | 0.08 | |
Net gains (losses) on investments (both realized and unrealized) | | | 1.57 | | | | | | | | 0.57 | | | | | | | | (2.39 | ) |
| | | | | | | | | | | | | | | | | | | | |
Total income (loss) from investment operations | | | 1.61 | | | | | | | | 0.65 | | | | | | | | (2.31 | ) |
| | | | | | | | | | | | | | | | | | | | |
Less distributions: | | | | | | | | | | | | | | | | | | | | |
Dividends from net investment income | | | (0.09 | ) | | | | | | | (0.08 | ) | | | | | | | (0.15 | ) |
Distributions from net realized gains | | | – | | | | | | | | (0.93 | ) | | | | | | | (0.92 | ) |
| | | | | | | | | | | | | | | | | | | | |
Total distributions | | | (0.09 | ) | | | | | | | (1.01 | ) | | | | | | | (1.07 | ) |
| | | | | | | | | | | | | | | | | | | | |
Net asset value, end of period | | $ | 13.87 | | | | | | | $ | 12.35 | | | | | | | $ | 12.71 | |
| | | | | | | | | | | | | | | | | | | | |
Total returnB | | | 13.05 | % | | | | | | | 5.69 | % | | | | | | | (15.40 | )%C |
| | | | | | | | | | | | | | | | | | | | |
|
Ratios and supplemental data: | |
Net assets, end of period | | $ | 92,350 | | | | | | | $ | 82,228 | | | | | | | $ | 84,569 | |
Ratios to average net assets: | | | | | | | | | | | | | | | | | | | | |
Expenses, before reimbursements and/or recoupments | | | 1.14 | % | | | | | | | 1.13 | % | | | | | | | 3.36 | %D |
Expenses, net of reimbursements and/or recoupmentsE | | | 1.08 | %F | | | | | | | 1.12 | % | | | | | | | 1.12 | %D |
Net investment income (loss), before expense reimbursements and/or recoupments | | | 0.22 | % | | | | | | | 0.63 | % | | | | | | | (1.53 | )%D |
Net investment income, net of reimbursements and/or recoupments | | | 0.28 | % | | | | | | | 0.64 | % | | | | | | | 0.71 | %D |
Portfolio turnover rate | | | 59 | % | | | | | | | 33 | % | | | | | | | 47 | % |
| A | Commencement of operations. |
| B | Based on net asset value, which does not reflect the sales charge, redemption fee, or contingent deferred sales charge, if applicable. May include adjustments in accordance with U.S. GAAP and as such, the net asset value for reporting purposes and the returns based upon those net asset values may differ from the net asset value and returns for shareholder transactions. |
| E | Expense ratios may exceed stated expense caps in Note 2 due to loan interest expense. |
| F | Expense ratios may exceed stated expense caps in Note 2 due to the change in the contractual expense caps on November 1, 2023. |
See accompanying notes
33
American Beacon Shapiro Equity Opportunities FundSM
Financial Highlights
(For a share outstanding throughout the period)
| | | | | | | | | | | | | | | | | | | | |
| | | C Class | |
| | | Year Ended June 30, | | | October 29, 2021A to June 30, 2022 | |
| | | | |
| | | 2024 | | | | | | 2023 | | | | |
| | | | |
Net asset value, beginning of period | | $ | 12.30 | | | | | | | $ | 12.66 | | | | | | | $ | 16.09 | |
| | | | | | | | | | | | | | | | | | | | |
Income (loss) from investment operations: | | | | | | | | | | | | | | | | | | | | |
Net investment (loss) | | | (0.06 | ) | | | | | | | (0.01 | ) | | | | | | | (0.00 | )B C |
Net gains (losses) on investments (both realized and unrealized) | | | 1.56 | | | | | | | | 0.58 | | | | | | | | (2.38 | ) |
| | | | | | | | | | | | | | | | | | | | |
Total income (loss) from investment operations | | | 1.50 | | | | | | | | 0.57 | | | | | | | | (2.38 | ) |
| | | | | | | | | | | | | | | | | | | | |
Less distributions: | | | | | | | | | | | | | | | | | | | | |
Dividends from net investment income | | | – | | | | | | | | – | | | | | | | | (0.13 | ) |
Distributions from net realized gains | | | – | | | | | | | | (0.93 | ) | | | | | | | (0.92 | ) |
| | | | | | | | | | | | | | | | | | | | |
Total distributions | | | – | | | | | | | | (0.93 | ) | | | | | | | (1.05 | ) |
| | | | | | | | | | | | | | | | | | | | |
Net asset value, end of period | | $ | 13.80 | | | | | | | $ | 12.30 | | | | | | | $ | 12.66 | |
| | | | | | | | | | | | | | | | | | | | |
Total returnD | | | 12.20 | % | | | | | | | 5.01 | % | | | | | | | (15.85 | )%E |
| | | | | | | | | | | | | | | | | | | | |
|
Ratios and supplemental data: | |
Net assets, end of period | | $ | 91,696 | | | | | | | $ | 81,722 | | | | | | | $ | 84,144 | |
Ratios to average net assets: | | | | | | | | | | | | | | | | | | | | |
Expenses, before reimbursements and/or recoupments | | | 1.89 | % | | | | | | | 1.88 | % | | | | | | | 4.11 | %F |
Expenses, net of reimbursements and/or recoupmentsG | | | 1.83 | %H | | | | | | | 1.87 | % | | | | | | | 1.87 | %F |
Net investment (loss), before expense reimbursements and/or recoupments | | | (0.53 | )% | | | | | | | (0.12 | )% | | | | | | | (2.28 | )%F |
Net investment (loss), net of reimbursements | | | (0.47 | )% | | | | | | | (0.11 | )% | | | | | | | (0.04 | )%F |
Portfolio turnover rate | | | 59 | % | | | | | | | 33 | % | | | | | | | 47 | % |
| A | Commencement of operations. |
| B | Per share amounts have been calculated using the average shares method. |
| C | Amount represents less than $0.01 per share. |
| D | Based on net asset value, which does not reflect the sales charge, redemption fee, or contingent deferred sales charge, if applicable. May include adjustments in accordance with U.S. GAAP and as such, the net asset value for reporting purposes and the returns based upon those net asset values may differ from the net asset value and returns for shareholder transactions. |
| G | Expense ratios may exceed stated expense caps in Note 2 due to loan interest expense. |
| H | Expense ratios may exceed stated expense caps in Note 2 due to the change in the contractual expense caps on November 1, 2023. |
See accompanying notes
34
American Beacon Shapiro SMID Cap Equity FundSM
Financial Highlights
(For a share outstanding throughout the period)
| | | | | | | | | | | | | | | | | | | | | | | | | | | | | | | | | | | | |
| | | R5 ClassA | |
| | | Year Ended June 30, | |
| | | | |
| | | 2024 | | | | | | 2023 | | | | | | 2022 | | | | | | 2021 | | | | | | 2020 | |
| | | | |
Net asset value, beginning of period | | $ | 11.88 | | | | | | | $ | 10.35 | | | | | | | $ | 13.69 | | | | | | | $ | 7.62 | | | | | | | $ | 9.72 | |
| | | | | | | | | | | | | | | | | | | | | | | | | | | | | | | | | | | | |
Income (loss) from investment operations: | | | | | | | | | | | | | | | | | | | | | | | | | | | | | | | | | | | | |
Net investment income | | | 0.01 | | | | | | | | 0.02 | | | | | | | | 0.21 | B | | | | | | | 0.07 | C | | | | | | | 0.04 | |
Net gains (losses) on investments (both realized and unrealized) | | | (0.22 | ) | | | | | | | 1.73 | | | | | | | | (1.98 | ) | | | | | | | 6.13 | | | | | | | | (1.46 | ) |
| | | | | | | | | | | | | | | | | | | | | | | | | | | | | | | | | | | | |
Total income (loss) from investment operations | | | (0.21 | ) | | | | | | | 1.75 | | | | | | | | (1.77 | ) | | | | | | | 6.20 | | | | | | | | (1.42 | ) |
| | | | | | | | | | | | | | | | | | | | | | | | | | | | | | | | | | | | |
Less distributions: | | | | | | | | | | | | | | | | | | | | | | | | | | | | | | | | | | | | |
Dividends from net investment income | | | (0.01 | ) | | | | | | | (0.02 | ) | | | | | | | (0.26 | ) | | | | | | | (0.00 | )D | | | | | | | (0.05 | ) |
Distributions from net realized gains | | | (0.86 | ) | | | | | | | (0.20 | ) | | | | | | | (1.31 | ) | | | | | | | (0.13 | ) | | | | | | | (0.63 | ) |
| | | | | | | | | | | | | | | | | | | | | | | | | | | | | | | | | | | | |
Total distributions | | | (0.87 | ) | | | | | | | (0.22 | ) | | | | | | | (1.57 | ) | | | | | | | (0.13 | ) | | | | | | | (0.68 | ) |
| | | | | | | | | | | | | | | | | | | | | | | | | | | | | | | | | | | | |
Net asset value, end of period | | $ | 10.80 | | | | | | | $ | 11.88 | | | | | | | $ | 10.35 | | | | | | | $ | 13.69 | | | | | | | $ | 7.62 | |
| | | | | | | | | | | | | | | | | | | | | | | | | | | | | | | | | | | | |
Total returnE | | | (1.94 | )% | | | | | | | 17.17 | % | | | | | | | (14.51 | )% | | | | | | | 81.91 | % | | | | | | | (16.09 | )% |
| | | | | | | | | | | | | | | | | | | | | | | | | | | | | | | | | | | | |
|
Ratios and supplemental data: | |
Net assets, end of period | | $ | 17,613,076 | | | | | | | $ | 23,634,955 | | | | | | | $ | 6,121,930 | | | | | | | $ | 7,711,085 | | | | | | | $ | 4,276,389 | |
Ratios to average net assets: | | | | | | | | | | | | | | | | | | | | | | | | | | | | | | | | | | | | |
Expenses, before reimbursements and/or recoupments | | | 1.23 | % | | | | | | | 1.36 | % | | | | | | | 1.92 | % | | | | | | | 2.24 | % | | | | | | | 3.22 | % |
Expenses, net of reimbursements and/or recoupments | | | 0.89 | % | | | | | | | 0.89 | % | | | | | | | 0.89 | % | | | | | | | 0.89 | % | | | | | | | 0.90 | % |
Net investment income (loss), before expense reimbursements and/or recoupments | | | (0.34 | )% | | | | | | | 0.01 | % | | | | | | | 0.63 | %B | | | | | | | (0.71 | )%C | | | | | | | (1.84 | )% |
Net investment income, net of reimbursements and/or recoupments | | | 0.00 | %F | | | | | | | 0.48 | % | | | | | | | 1.66 | %B | | | | | | | 0.64 | %C | | | | | | | 0.48 | % |
Portfolio turnover rate | | | 43 | % | | | | | | | 36 | % | | | | | | | 34 | % | | | | | | | 64 | % | | | | | | | 48 | % |
| A | Prior to February 28, 2020, the R5 Class was known as Institutional Class. |
| B | Net investment income includes a significant dividend payment from Cadence Bank and Ecovyst, Inc. amounting to $0.1767. |
| C | Net investment income includes a significant dividend payment from PQ Group Holdings, Inc. amounting to $0.0223. |
| D | Amount represents less than $0.01 per share. |
| E | Based on net asset value, which does not reflect the sales charge, redemption fee, or contingent deferred sales charge, if applicable. May include adjustments in accordance with U.S. GAAP and as such, the net asset value for reporting purposes and the returns based upon those net asset values may differ from the net asset value and returns for shareholder transactions. |
| F | Amount represents less than 0.01%. |
See accompanying notes
35
American Beacon Shapiro SMID Cap Equity FundSM
Financial Highlights
(For a share outstanding throughout the period)
| | | | | | | | | | | | | | | | | | | | | | | | | | | | | | | | | | | | |
| | | Y Class | |
| | | Year Ended June 30, | |
| | | | |
| | | 2024 | | | | | | 2023 | | | | | | 2022 | | | | | | 2021 | | | | | | 2020 | |
| | | | |
Net asset value, beginning of period | | $ | 11.80 | | | | | | | $ | 10.29 | | | | | | | $ | 13.63 | | | | | | | $ | 7.60 | | | | | | | $ | 9.71 | |
| | | | | | | | | | | | | | | | | | | | | | | | | | | | | | | | | | | | |
Income (loss) from investment operations: | | | | | | | | | | | | | | | | | | | | | | | | | | | | | | | | | | | | |
Net investment income | | | (0.00 | )D | | | | | | | 0.05 | C | | | | | | | 0.29 | A | | | | | | | 0.04 | B C | | | | | | | 0.05 | |
Net gains (losses) on investments (both realized and unrealized) | | | (0.21 | ) | | | | | | | 1.68 | | | | | | | | (2.06 | ) | | | | | | | 6.12 | | | | | | | | (1.48 | ) |
| | | | | | | | | | | | | | | | | | | | | | | | | | | | | | | | | | | | |
Total income (loss) from investment operations | | | (0.21 | ) | | | | | | | 1.73 | | | | | | | | (1.77 | ) | | | | | | | 6.16 | | | | | | | | (1.43 | ) |
| | | | | | | | | | | | | | | | | | | | | | | | | | | | | | | | | | | | |
Less distributions: | | | | | | | | | | | | | | | | | | | | | | | | | | | | | | | | | | | | |
Dividends from net investment income | | | (0.01 | ) | | | | | | | (0.02 | ) | | | | | | | (0.26 | ) | | | | | | | (0.00 | )D | | | | | | | (0.05 | ) |
Distributions from net realized gains | | | (0.86 | ) | | | | | | | (0.20 | ) | | | | | | | (1.31 | ) | | | | | | | (0.13 | ) | | | | | | | (0.63 | ) |
| | | | | | | | | | | | | | | | | | | | | | | | | | | | | | | | | | | | |
Total distributions | | | (0.87 | ) | | | | | | | (0.22 | ) | | | | | | | (1.57 | ) | | | | | | | (0.13 | ) | | | | | | | (0.68 | ) |
| | | | | | | | | | | | | | | | | | | | | | | | | | | | | | | | | | | | |
Net asset value, end of period | | $ | 10.72 | | | | | | | $ | 11.80 | | | | | | | $ | 10.29 | | | | | | | $ | 13.63 | | | | | | | $ | 7.60 | |
| | | | | | | | | | | | | | | | | | | | | | | | | | | | | | | | | | | | |
Total returnE | | | (1.95 | )% | | | | | | | 17.08 | % | | | | | | | (14.57 | )% | | | | | | | 81.60 | % | | | | | | | (16.21 | )% |
| | | | | | | | | | | | | | | | | | | | | | | | | | | | | | | | | | | | |
| | | | | | | | | |
Ratios and supplemental data: | | | | | | | | | | | | | | | | | | | | | | | | | | | | | | | | | | | | |
Net assets, end of period | | $ | 10,707,221 | | | | | | | $ | 16,196,711 | | | | | | | $ | 2,191,298 | | | | | | | $ | 8,753,769 | | | | | | | $ | 104,553 | |
Ratios to average net assets: | | | | | | | | | | | | | | | | | | | | | | | | | | | | | | | | | | | | |
Expenses, before reimbursements and/or recoupments | | | 1.30 | % | | | | | | | 1.40 | % | | | | | | | 2.00 | % | | | | | | | 2.21 | % | | | | | | | 3.33 | % |
Expenses, net of reimbursements and/or recoupments | | | 0.96 | % | | | | | | | 0.96 | % | | | | | | | 0.97 | %F | | | | | | | 0.99 | % | | | | | | | 1.00 | % |
Net investment income (loss), before expense reimbursements and/or recoupments | | | (0.40 | )% | | | | | | | (0.03 | )% | | | | | | | 1.16 | %A | | | | | | | (0.94 | )%B | | | | | | | (1.91 | )% |
Net investment income (loss), net of reimbursements and/or recoupments | | | (0.06 | )% | | | | | | | 0.41 | % | | | | | | | 2.19 | %A | | | | | | | 0.28 | %B | | | | | | | 0.42 | % |
Portfolio turnover rate | | | 43 | % | | | | | | | 36 | % | | | | | | | 34 | % | | | | | | | 64 | % | | | | | | | 48 | % |
| A | Net investment income includes a significant dividend payment from Cadence Bank and Ecovyst, Inc. amounting to $0.2671. |
| B | Net investment income includes a significant dividend payment from PQ Group Holdings, Inc. amounting to $0.0412. |
| C | Per share amounts have been calculated using the average shares method. |
| D | Amount is less than $0.01 per share. |
| E | Based on net asset value, which does not reflect the sales charge, redemption fee, or contingent deferred sales charge, if applicable. May include adjustments in accordance with U.S. GAAP and as such, the net asset value for reporting purposes and the returns based upon those net asset values may differ from the net asset value and returns for shareholder transactions. |
| F | Expense ratios may exceed stated expense caps in Note 2 due to the change in the contractual expense caps on October 31, 2021. |
See accompanying notes
36
American Beacon Shapiro SMID Cap Equity FundSM
Financial Highlights
(For a share outstanding throughout the period)
| | | | | | | | | | | | | | | | | | | | | | | | | | | | | | | | | | | | |
| | | Investor Class | |
| | | Year Ended June 30, | |
| | | | |
| | | 2024 | | | | | | 2023 | | | | | | 2022 | | | | | | 2021 | | | | | | 2020 | |
| | | | |
Net asset value, beginning of period | | $ | 11.60 | | | | | | | $ | 10.15 | | | | | | | $ | 13.48 | | | | | | | $ | 7.53 | | | | | | | $ | 9.65 | |
| | | | | | | | | | | | | | | | | | | | | | | | | | | | | | | | | | | | |
Income (loss) from investment operations: | | | | | | | | | | | | | | | | | | | | | | | | | | | | | | | | | | | | |
Net investment income (loss) | | | (0.05 | ) | | | | | | | 0.05 | | | | | | | | 0.20 | A | | | | | | | 0.05 | B | | | | | | | 0.01 | |
Net gains (losses) on investments (both realized and unrealized) | | | (0.18 | ) | | | | | | | 1.62 | | | | | | | | (1.96 | ) | | | | | | | 6.03 | | | | | | | | (1.45 | ) |
| | | | | | | | | | | | | | | | | | | | | | | | | | | | | | | | | | | | |
Total income (loss) from investment operations | | | (0.23 | ) | | | | | | | 1.67 | | | | | | | | (1.76 | ) | | | | | | | 6.08 | | | | | | | | (1.44 | ) |
| | | | | | | | | | | | | | | | | | | | | | | | | | | | | | | | | | | | |
Less distributions: | | | | | | | | | | | | | | | | | | | | | | | | | | | | | | | | | | | | |
Dividends from net investment income | | | (0.01 | ) | | | | | | | (0.02 | ) | | | | | | | (0.26 | ) | | | | | | | (0.00 | )C | | | | | | | (0.05 | ) |
Distributions from net realized gains | | | (0.86 | ) | | | | | | | (0.20 | ) | | | | | | | (1.31 | ) | | | | | | | (0.13 | ) | | | | | | | (0.63 | ) |
| | | | | | | | | | | | | | | | | | | | | | | | | | | | | | | | | | | | |
Total distributions | | | (0.87 | ) | | | | | | | (0.22 | ) | | | | | | | (1.57 | ) | | | | | | | (0.13 | ) | | | | | | | (0.68 | ) |
| | | | | | | | | | | | | | | | | | | | | | | | | | | | | | | | | | | | |
Net asset value, end of period | | $ | 10.50 | | | | | | | $ | 11.60 | | | | | | | $ | 10.15 | | | | | | | $ | 13.48 | | | | | | | $ | 7.53 | |
| | | | | | | | | | | | | | | | | | | | | | | | | | | | | | | | | | | | |
Total returnD | | | (2.17 | )% | | | | | | | 16.72 | % | | | | | | | (14.67 | )% | | | | | | | 81.29 | % | | | | | | | (16.43 | )% |
| | | | | | | | | | | | | | | | | | | | | | | | | | | | | | | | | | | | |
|
Ratios and supplemental data: | |
Net assets, end of period | | $ | 12,001,262 | | | | | | | $ | 18,767,020 | | | | | | | $ | 3,810,635 | | | | | | | $ | 3,586,842 | | | | | | | $ | 913,709 | |
Ratios to average net assets: | | | | | | | | | | | | | | | | | | | | | | | | | | | | | | | | | | | | |
Expenses, before reimbursements and/or recoupments | | | 1.53 | % | | | | | | | 1.62 | % | | | | | | | 2.31 | % | | | | | | | 2.59 | % | | | | | | | 3.86 | % |
Expenses, net of reimbursements and/or recoupments | | | 1.17 | % | | | | | | | 1.17 | % | | | | | | | 1.17 | % | | | | | | | 1.20 | % | | | | | | | 1.28 | % |
Net investment income (loss), before expense reimbursements and/or recoupments | | | (0.63 | )% | | | | | | | (0.31 | )% | | | | | | | 0.11 | %A | | | | | | | (1.14 | )%B | | | | | | | (2.49 | )% |
Net investment income (loss), net of reimbursements and/or recoupments | | | (0.27 | )% | | | | | | | 0.14 | % | | | | | | | 1.25 | %A | | | | | | | 0.25 | %B | | | | | | | 0.09 | % |
Portfolio turnover rate | | | 43 | % | | | | | | | 36 | % | | | | | | | 34 | % | | | | | | | 64 | % | | | | | | | 48 | % |
| A | Net investment income includes a significant dividend payment from Cadence Bank and Ecovyst, Inc. amounting to $0.1558. |
| B | Net investment income includes a significant dividend payment from PQ Group Holdings, Inc. amounting to $0.0339. |
| C | Amount represents less than $0.01 per share. |
| D | Based on net asset value, which does not reflect the sales charge, redemption fee, or contingent deferred sales charge, if applicable. May include adjustments in accordance with U.S. GAAP and as such, the net asset value for reporting purposes and the returns based upon those net asset values may differ from the net asset value and returns for shareholder transactions. |
See accompanying notes
37
American Beacon Shapiro SMID Cap Equity FundSM
Financial Highlights
(For a share outstanding throughout the period)
| | | | | | | | | | | | | | | | | | | | |
| | | A Class | |
| | | Year Ended June 30, | | | | | | October 29, 2021A to June 30, | |
| | | 2024 | | | | | | 2023 | | | | | | 2022 | |
| | | | |
Net asset value, beginning of period | | $ | 11.58 | | | | | | | $ | 10.13 | | | | | | | $ | 13.35 | |
| | | | | | | | | | | | | | | | | | | | |
Income (loss) from investment operations: | | | | | | | | | | | | | | | | | | | | |
Net investment income (loss) | | | (0.05 | ) | | | | | | | 0.25 | | | | | | | | (0.00 | )B |
Net gains (losses) on investments (both realized and unrealized) | | | (0.19 | ) | | | | | | | 1.42 | | | | | | | | (1.65 | ) |
| | | | | | | | | | | | | | | | | | | | |
Total income (loss) from investment operations | | | (0.24 | ) | | | | | | | 1.67 | | | | | | | | (1.65 | ) |
| | | | | | | | | | | | | | | | | | | | |
Less distributions: | | | | | | | | | | | | | | | | | | | | |
Dividends from net investment income | | | (0.01 | ) | | | | | | | (0.02 | ) | | | | | | | (0.26 | ) |
Distributions from net realized gains | | | (0.86 | ) | | | | | | | (0.20 | ) | | | | | | | (1.31 | ) |
| | | | | | | | | | | | | | | | | | | | |
Total distributions | | | (0.87 | ) | | | | | | | (0.22 | ) | | | | | | | (1.57 | ) |
| | | | | | | | | | | | | | | | | | | | |
Net asset value, end of period | | $ | 10.47 | | | | | | | $ | 11.58 | | | | | | | $ | 10.13 | |
| | | | | | | | | | | | | | | | | | | | |
Total returnC | | | (2.26 | )% | | | | | | | 16.73 | % | | | | | | | (14.00 | )%D |
| | | | | | | | | | | | | | | | | | | | |
|
Ratios and supplemental data: | |
Net assets, end of period | | $ | 1,734,541 | | | | | | | $ | 2,450,065 | | | | | | | $ | 75,917 | |
Ratios to average net assets: | | | | | | | | | | | | | | | | | | | | |
Expenses, before reimbursements and/or recoupments | | | 1.76 | % | | | | | | | 1.66 | % | | | | | | | 4.75 | %E |
Expenses, net of reimbursements and/or recoupments | | | 1.25 | % | | | | | | | 1.26 | % | | | | | | | 1.26 | %E |
Net investment income (loss), before expense reimbursements and/or recoupments | | | (0.87 | )% | | | | | | | (0.32 | )% | | | | | | | (3.53 | )%E |
Net investment income (loss), net of reimbursements and/or recoupments | | | (0.36 | )% | | | | | | | 0.08 | % | | | | | | | (0.04 | )%E |
Portfolio turnover rate | | | 43 | % | | | | | | | 36 | % | | | | | | | 34 | % |
| A | Commencement of operations. |
| B | Amount represents less than $0.01 per share. |
| C | Based on net asset value, which does not reflect the sales charge, redemption fee, or contingent deferred sales charge, if applicable. May include adjustments in accordance with U.S. GAAP and as such, the net asset value for reporting purposes and the returns based upon those net asset values may differ from the net asset value and returns for shareholder transactions. |
See accompanying notes
38
American Beacon Shapiro SMID Cap Equity FundSM
Financial Highlights
(For a share outstanding throughout the period)
| | | | | | | | | | | | | | | | | | | | |
| | | C Class | |
| | | Year Ended June 30, | | | | | | October 29, 2021A to June 30, | |
| | | 2024 | | | | | | 2023 | | | | | | 2022 | |
| | | | |
Net asset value, beginning of period | | $ | 11.45 | | | | | | | $ | 10.08 | | | | | | | $ | 13.35 | |
| | | | | | | | | | | | | | | | | | | | |
Income (loss) from investment operations: | | | | | | | | | | | | | | | | | | | | |
Net investment (loss) | | | (0.36 | ) | | | | | | | (0.07 | )B | | | | | | | (0.06 | ) |
Net gains (losses) on investments (both realized and unrealized) | | | 0.04 | | | | | | | | 1.65 | | | | | | | | (1.64 | ) |
| | | | | | | | | | | | | | | | | | | | |
Total income (loss) from investment operations | | | (0.32 | ) | | | | | | | 1.58 | | | | | | | | (1.70 | ) |
| | | | | | | | | | | | | | | | | | | | |
Less distributions: | | | | | | | | | | | | | | | | | | | | |
Dividends from net investment income | | | - | | | | | | | | (0.01 | ) | | | | | | | (0.26 | ) |
Distributions from net realized gains | | | (0.86 | ) | | | | | | | (0.20 | ) | | | | | | | (1.31 | ) |
| | | | | | | | | | | | | | | | | | | | |
Total distributions | | | (0.86 | ) | | | | | | | (0.21 | ) | | | | | | | (1.57 | ) |
| | | | | | | | | | | | | | | | | | | | |
Net asset value, end of period | | $ | 10.27 | | | | | | | $ | 11.45 | | | | | | | $ | 10.08 | |
| | | | | | | | | | | | | | | | | | | | |
Total returnC | | | (3.02 | )% | | | | | | | 15.85 | % | | | | | | | (14.43 | )%D |
| | | | | | | | | | | | | | | | | | | | |
|
Ratios and supplemental data: | |
Net assets, end of period | | $ | 321,211 | | | | | | | $ | 867,865 | | | | | | | $ | 75,541 | |
Ratios to average net assets: | | | | | | | | | | | | | | | | | | | | |
Expenses, before reimbursements and/or recoupments | | | 2.37 | % | | | | | | | 2.43 | % | | | | | | | 5.51 | %E |
Expenses, net of reimbursements and/or recoupments | | | 2.01 | % | | | | | | | 2.01 | % | | | | | | | 2.01 | %E |
Net investment (loss), before expense reimbursements and/or recoupments | | | (1.46 | )% | | | | | | | (1.08 | )% | | | | | | | (4.29 | )%E |
Net investment (loss), net of reimbursements | | | (1.10 | )% | | | | | | | (0.66 | )% | | | | | | | (0.79 | )%E |
Portfolio turnover rate | | | 43 | % | | | | | | | 36 | % | | | | | | | 34 | % |
| A | Commencement of operations. |
| B | Per share amounts have been calculated using the average shares method. |
| C | Based on net asset value, which does not reflect the sales charge, redemption fee, or contingent deferred sales charge, if applicable. May include adjustments in accordance with U.S. GAAP and as such, the net asset value for reporting purposes and the returns based upon those net asset values may differ from the net asset value and returns for shareholder transactions. |
See accompanying notes
39
American Beacon Shapiro SMID Cap Equity FundSM
Financial Highlights
(For a share outstanding throughout the period)
| | | | | | | | | | | | | | | | | | | | |
| | | R6 Class | |
| | | Year Ended June 30, | | | | | | October 29, 2021A to June 30, | |
| | | 2024 | | | | | | 2023 | | | | | | 2022 | |
| | | | |
Net asset value, beginning of period | | $ | 11.87 | | | | | | | $ | 10.35 | | | | | | | $ | 13.57 | |
| | | | | | | | | | | | | | | | | | | | |
Income from investment operations: | | | | | | | | | | | | | | | | | | | | |
Net investment income | | | (0.00 | )B | | | | | | | 0.25 | | | | | | | | 0.03 | |
Net gains (losses) on investments (both realized and unrealized) | | | (0.20 | ) | | | | | | | 1.49 | | | | | | | | (1.68 | ) |
| | | | | | | | | | | | | | | | | | | | |
Total income (loss) from investment operations | | | (0.20 | ) | | | | | | | 1.74 | | | | | | | | (1.65 | ) |
| | | | | | | | | | | | | | | | | | | | |
Less distributions: | | | | | | | | | | | | | | | | | | | | |
Dividends from net investment income | | | (0.01 | ) | | | | | | | (0.02 | ) | | | | | | | (0.26 | ) |
Distributions from net realized gains | | | (0.86 | ) | | | | | | | (0.20 | ) | | | | | | | (1.31 | ) |
| | | | | | | | | | | | | | | | | | | | |
Total distributions | | | (0.87 | ) | | | | | | | (0.22 | ) | | | | | | | (1.57 | ) |
| | | | | | | | | | | | | | | | | | | | |
Net asset value, end of period | | $ | 10.80 | | | | | | | $ | 11.87 | | | | | | | $ | 10.35 | |
| | | | | | | | | | | | | | | | | | | | |
Total returnC | | | (1.85 | )% | | | | | | | 17.08 | % | | | | | | | (13.75 | )%D |
| | | | | | | | | | | | | | | | | | | | |
|
Ratios and supplemental data: | |
Net assets, end of period | | $ | 975,513 | | | | | | | $ | 1,228,157 | | | | | | | $ | 76,271 | |
Ratios to average net assets: | | | | | | | | | | | | | | | | | | | | |
Expenses, before reimbursements and/or recoupments | | | 1.20 | % | | | | | | | 1.30 | % | | | | | | | 4.49 | %E |
Expenses, net of reimbursements and/or recoupments | | | 0.89 | % | | | | | | | 0.90 | % | | | | | | | 0.90 | %E |
Net investment income (loss), before expense reimbursements and/or recoupments | | | (0.32 | )% | | | | | | | 0.05 | % | | | | | | | (3.27 | )%E |
Net investment income (loss), net of reimbursements | | | (0.01 | )% | | | | | | | 0.45 | % | | | | | | | 0.32 | %E |
Portfolio turnover rate | | | 43 | % | | | | | | | 36 | % | | | | | | | 34 | % |
| A | Commencement of operations. |
| B | Amount represents less than $0.01 per share. |
| C | Based on net asset value, which does not reflect the sales charge, redemption fee, or contingent deferred sales charge, if applicable. May include adjustments in accordance with U.S. GAAP and as such, the net asset value for reporting purposes and the returns based upon those net asset values may differ from the net asset value and returns for shareholder transactions. |
See accompanying notes
40
American Beacon FundsSM
Federal Tax Information
June 30, 2024 (Unaudited)
Certain tax information regarding the Funds are required to be provided to shareholders based upon the Fund’s income and distributions for the taxable year ended June 30, 2024. The information and distributions reported herein may differ from information and distributions taxable to the shareholders for the calendar year ended December 31, 2024.
The Fund designated the following items with regard to distributions paid during the fiscal year ended June 30, 2024. All designations are based on financial information available as of this annual report and, accordingly, are subject to change. For each item, it is the intention of the Funds to designate the maximum amount permitted under the Internal Revenue Code of 1986, as amended, and the regulations there under.
Corporate Dividends-Received Deduction:
| | | | |
Shapiro Equity Opportunities | | | 100.00 | % |
Shapiro SMID Cap Equity | | | 15.72 | % |
Qualified Dividend Income:
| | | | |
Shapiro Equity Opportunities | | | 100.00 | % |
Shapiro SMID Cap Equity | | | 16.68 | % |
Long-Term Capital Gain Distributions:
| | | | |
Shapiro Equity Opportunities | | $ | 0 | |
Shapiro SMID Cap Equity | | $ | 924,104 | |
Short-Term Capital Gain Distributions:
| | | | |
Shapiro Equity Opportunities | | $ | 0 | |
Shapiro SMID Cap Equity | | $ | 2,945,740 | |
Shareholders will receive notification in January 2025 of the applicable tax information necessary to prepare their 2024 income tax returns.
41

Delivery of Documents
If you invest in the Fund through a financial institution, you may be able to receive the Fund’s regulatory mailings, such as the Prospectus, Annual Report, Semi-Annual Report and Financial Statement Reports, by e-mail. If you are interested in this option, please go to www.icsdelivery.com and search for your financial institution’s name or contact your financial institution directly.
You may request a paper copy of this document at no charge by contacting your financial institution. This document is also available for download at www.americanbeaconfunds.com or you can request an electronic copy by contacting your financial institution.
To obtain more information about the Fund:
| | |
 | |  |
| | |
| By E-mail: | | On the Internet: |
| american_beacon.funds@ambeacon.com | | Visit our website at www.americanbeaconfunds.com |
| | | |
| | | |
| | |

By Telephone: Call (800) 658-5811 | | 
By Mail: American Beacon Funds P.O. Box 219643 Kansas City, MO 64121-9643 |
|
|
|
| | | |
Fund Service Providers:
| | | | | | | | | | | | |
CUSTODIAN State Street Bank and Trust Company Boston, Massachusetts | | | | TRANSFER AGENT SS&C GIDS, Inc. Quincy, Massachusetts | | | | INDEPENDENT REGISTERED PUBLIC ACCOUNTING FIRM PricewaterhouseCoopers LLP Boston, Massachusetts | | | | DISTRIBUTOR Resolute Investment Distributors, Inc. Irving, Texas |
This report is prepared for shareholders of the American Beacon Funds and may be distributed to others only if preceded or accompanied by a current Prospectus or Summary Prospectus.
American Beacon Funds, American Beacon Shapiro Equity Opportunities Fund and American Beacon Shapiro SMID Cap Equity Fund are service marks of American Beacon Advisors, Inc.
AR 06/24

American Beacon Funds
Although information has been compiled from reliable sources, American Beacon Advisors, Inc. makes no representation as to the completeness or accuracy of the statements contained herein. All information is as of the end of the reporting period, unless noted otherwise, and is subject to change. Each Fund’s portfolio composition will change depending on economic and market conditions.
American Beacon Funds | June 30, 2024 |
Contents
American Beacon FundsSM
Report of Independent Registered Public Accounting Firm
To the Board of Trustees of American Beacon Funds and Shareholders of American Beacon SSI Alternative Income Fund, American Beacon TwentyFour Strategic Income Fund and American Beacon TwentyFour Sustainable Short Term Bond Fund
Opinions on the Financial Statements
We have audited the accompanying statements of assets and liabilities, including the schedules of investments, of American Beacon SSI Alternative Fund, American Beacon TwentyFour Strategic Income Fund and American Beacon TwentyFour Sustainable Short Term Bond Fund (three of the funds constituting American Beacon Funds, hereafter collectively referred to as the “Funds”) as of June 30, 2024, the related statements of operations for the year ended June 30, 2024, the statements of changes in net assets for each of the two years in the period ended June 30, 2024, including the related notes, and the financial highlights for each of the periods indicated therein (collectively referred to as the “financial statements”). In our opinion, the financial statements present fairly, in all material respects, the financial position of each of the Funds as of June 30, 2024, the results of each of their operations for the year then ended, the changes in each of their net assets for each of the two years in the period ended June 30, 2024 and the financial highlights for each of the periods indicated therein in conformity with accounting principles generally accepted in the United States of America.
Basis for Opinions
These financial statements are the responsibility of the Funds’ management. Our responsibility is to express an opinion on the Funds’ financial statements based on our audits. We are a public accounting firm registered with the Public Company Accounting Oversight Board (United States) (PCAOB) and are required to be independent with respect to the Funds in accordance with the U.S. federal securities laws and the applicable rules and regulations of the Securities and Exchange Commission and the PCAOB.
We conducted our audits of these financial statements in accordance with the standards of the PCAOB. Those standards require that we plan and perform the audit to obtain reasonable assurance about whether the financial statements are free of material misstatement, whether due to error or fraud.
Our audits included performing procedures to assess the risks of material misstatement of the financial statements, whether due to error or fraud, and performing procedures that respond to those risks. Such procedures included examining, on a test basis, evidence regarding the amounts and disclosures in the financial statements. Our audits also included evaluating the accounting principles used and significant estimates made by management, as well as evaluating the overall presentation of the financial statements. Our procedures included confirmation of securities owned as of June 30, 2024 by correspondence with the custodians and brokers; when replies were not received from brokers, we performed other auditing procedures. We believe that our audits provide a reasonable basis for our opinions.
/s/ PricewaterhouseCoopers LLP
Boston, Massachusetts
August 29, 2024
We have served as the auditor of one or more investment companies in the American Beacon family of funds since 2016.
1
American Beacon SSI Alternative Income FundSM
Schedule of Investments
June 30, 2024
| | | | | | | | | | | | | | | |
| | | |
| | | Shares | | | | Fair Value |
| | | | | | | |
| | | |
| SECURITIES HELD LONG - 98.74% | | | | | | |
| | | |
| CONVERTIBLE PREFERRED STOCKS - 2.56% | | | | | | |
| | | |
| Financials - 0.40% | | | | | | |
| | | |
| Financial Services - 0.40% | | | | | | |
| Apollo Global Management, Inc., 6.750%, Due 07/31/2026 | | | | 10,692 | | | | | | | | | $ | 701,716 | |
| | | | | | | | | | | | | | | |
| | | | | | | | | | | | | | | |
| | | |
| Industrials - 1.24% | | | | | | |
| | | |
| Machinery - 1.24% | | | | | | |
| Chart Industries, Inc., Series B, 6.750%, Due 12/15/2025 | | | | 38,332 | | | | | | | | | | 2,183,007 | |
| | | | | | | | | | | | | | | |
| | | | | | | | | | | | | | | |
| | | |
| Information Technology - 0.45% | | | | | | |
| | | |
| Software - 0.45% | | | | | | |
| NCR Voyix Corp., Series A, 5.500%, PIK (In-kind rate 5.500%)A | | | | 767 | | | | | | | | | | 797,251 | |
| | | | | | | | | | | | | | | |
| | | | | | | | | | | | | | | |
| | | |
| Materials - 0.47% | | | | | | |
| | | |
| Chemicals - 0.47% | | | | | | |
| Lyondellbasell Advanced Polymers, Inc.A | | | | 1,026 | | | | | | | | | | 836,190 | |
| | | | | | | | | | | | | | | |
| | | | | | | | | | | | | | | |
Total Convertible Preferred Stocks (Cost $4,779,804) | | | | | | | | | | | | | | 4,518,164 | |
| | | | | | | | | | | | | | | |
| | | | | | | | | | | | | | | |
| | | |
| PREFERRED STOCKS - 2.25% | | | | | | |
| | | |
| Financials - 2.25% | | | | | | |
| | | |
| Mortgage Real Estate Investment Trusts (REITs) - 2.25% | | | | | | |
| AGNC Investment Corp., | | | | | | | | | | | | | | | |
Series E, 6.500%, (3 mo. USD LIBOR + 4.697%)A B | | | | 3,313 | | | | | | | | | | 83,223 | |
Series F, 6.125%, (3 mo. USD LIBOR + 4.993%)A B | | | | 39,299 | | | | | | | | | | 948,285 | |
| MFA Financial, Inc., Series C, 6.500%, (3 mo. USD LIBOR + 5.345%)A B | | | | 39,518 | | | | | | | | | | 928,673 | |
| New York Mortgage Trust, Inc., | | | | | | | | | | | | | | | |
Series E, 7.875%, (3 mo. USD LIBOR + 6.429%)A B | | | | 1,078 | | | | | | | | | | 25,721 | |
Series F, 6.875%, (Secured Overnight Financing Rate + 6.130%)A B | | | | 23,244 | | | | | | | | | | 468,599 | |
| Redwood Trust, Inc., 10.000%, (5 yr. CMT + 6.278%)A B | | | | 7,315 | | | | | | | | | | 183,241 | |
| Rithm Capital Corp., | | | | | | | | | | | | | | | |
Series B, 7.125%, (3 mo. USD LIBOR + 5.640%)A B | | | | 17,847 | | | | | | | | | | 449,030 | |
Series C, 6.375%, (3 mo. USD LIBOR + 4.969%)A B | | | | 36,984 | | | | | | | | | | 875,041 | |
| | | | | | | | | | | | | | | |
| | | | | | | | | | | | | | 3,961,813 | |
| | | | | | | | | | | | | | | |
| | | | | | | | | | | | | | | |
Total Financials | | | | | | | | | | | | | | 3,961,813 | |
| | | | | | | | | | | | | | | |
| | | | | | | | | | | | | | | |
Total Preferred Stocks (Cost $3,992,303) | | | | | | | | | | | | | | 3,961,813 | |
| | | | | | | | | | | | | | | |
| | | |
| | | Principal Amount | | | | |
| | | | | | | |
| | | |
| CONVERTIBLE OBLIGATIONS - 74.68% | | | | | | |
| | | |
| Basic Materials - 0.79% | | | | | | |
| | | |
| Mining - 0.79% | | | | | | |
| Century Aluminum Co., 2.750%, Due 5/1/2028C | | | $ | 911,000 | | | | | | | | | | 993,901 | |
| MP Materials Corp., 0.250%, Due 4/1/2026D | | | | 452,000 | | | | | | | | | | 401,132 | |
| | | | | | | | | | | | | | | |
| | | | | | | | | | | | | | 1,395,033 | |
| | | | | | | | | | | | | | | |
| | | | | | | | | | | | | | | |
Total Basic Materials | | | | | | | | | | | | | | 1,395,033 | |
| | | | | | | | | | | | | | | |
| | | | | | | | | | | | | | | |
| | | |
| Communications - 9.75% | | | | | | |
| | | |
| Internet - 5.27% | | | | | | |
| Airbnb, Inc., Due 3/15/2026C E | | | | 791,000 | | | | | | | | | | 721,725 | |
| Cardlytics, Inc., 4.250%, Due 4/1/2029C D | | | | 542,000 | | | | | | | | | | 438,207 | |
| Expedia Group, Inc., Due 2/15/2026E | | | | 1,496,000 | | | | | | | | | | 1,373,328 | |
| Perficient, Inc., 0.125%, Due 11/15/2026C | | | | 1,482,000 | | | | | | | | | | 1,432,253 | |
| Snap, Inc., Due 5/1/2027C E | | | | 2,347,000 | | | | | | | | | | 1,949,644 | |
| Upwork, Inc., 0.250%, Due 8/15/2026C | | | | 326,000 | | | | | | | | | | 289,190 | |
| Wayfair, Inc., 1.000%, Due 8/15/2026C | | | | 1,485,000 | | | | | | | | | | 1,336,081 | |
See accompanying notes
2
American Beacon SSI Alternative Income FundSM
Schedule of Investments
June 30, 2024
| | | | | | | | | | | | | | | |
| | | |
| | | Principal Amount | | | | Fair Value |
| | | | | | | |
| | | |
| SECURITIES HELD LONG - 98.74% (continued) | | | | | | |
| | | |
| CONVERTIBLE OBLIGATIONS - 74.68% (continued) | | | | | | |
| | | |
| Communications - 9.75% (continued) | | | | | | |
| | | |
| Internet - 5.27% (continued) | | | | | | |
| Ziff Davis, Inc., 1.750%, Due 11/1/2026 | | | $ | 959,000 | | | | | | | | | $ | 890,655 | |
| Zillow Group, Inc., 2.750%, Due 5/15/2025 | | | | 841,000 | | | | | | | | | | 851,000 | |
| | | | | | | | | | | | | | | |
| | | | | | | | | | | | | | 9,282,083 | |
| | | | | | | | | | | | | | | |
| | | | | | | | | | | | | | | |
| | | |
| Media - 4.48% | | | | | | |
| Cable One, Inc., 1.125%, Due 3/15/2028C | | | | 2,626,000 | | | | | | | | | | 1,949,225 | |
| Liberty Broadband Corp., 3.125%, Due 3/31/2053D F | | | | 863,000 | | | | | | | | | | 825,587 | |
| Liberty Media Corp., 3.750%, Due 3/15/2028C | | | | 2,678,000 | | | | | | | | | | 2,785,120 | |
| Sphere Entertainment Co., 3.500%, Due 12/1/2028C D | | | | 1,901,000 | | | | | | | | | | 2,315,064 | |
| | | | | | | | | | | | | | | |
| | | | | | | | | | | | | | 7,874,996 | |
| | | | | | | | | | | | | | | |
| | | | | | | | | | | | | | | |
Total Communications | | | | | | | | | | | | | | 17,157,079 | |
| | | | | | | | | | | | | | | |
| | | | | | | | | | | | | | | |
| | | |
| Consumer, Cyclical - 10.23% | | | | | | |
| | | |
| Airlines - 1.76% | | | | | | |
| American Airlines Group, Inc., 6.500%, Due 7/1/2025C | | | | 1,750,000 | | | | | | | | | | 1,809,850 | |
| JetBlue Airways Corp., 0.500%, Due 4/1/2026 | | | | 1,460,000 | | | | | | | | | | 1,280,627 | |
| | | | | | | | | | | | | | | |
| | | | | | | | | | | | | | 3,090,477 | |
| | | | | | | | | | | | | | | |
| | | | | | | | | | | | | | | |
| | | |
| Auto Manufacturers - 0.44% | | | | | | |
| Rivian Automotive, Inc., 4.625%, Due 3/15/2029C | | | | 808,000 | | | | | | | | | | 782,548 | |
| | | | | | | | | | | | | | | |
| | | | | | | | | | | | | | | |
| | | |
| Entertainment - 2.37% | | | | | | |
| DraftKings Holdings, Inc., Due 3/15/2028C E | | | | 861,000 | | | | | | | | | | 713,338 | |
| Live Nation Entertainment, Inc., 3.125%, Due 1/15/2029 | | | | 1,642,000 | | | | | | | | | | 1,813,050 | |
| Marriott Vacations Worldwide Corp., 3.250%, Due 12/15/2027C | | | | 1,801,000 | | | | | | | | | | 1,638,910 | |
| | | | | | | | | | | | | | | |
| | | | | | | | | | | | | | 4,165,298 | |
| | | | | | | | | | | | | | | |
| | | | | | | | | | | | | | | |
| | | |
| Home Builders - 0.15% | | | | | | |
| Meritage Homes Corp., 1.750%, Due 5/15/2028C D | | | | 258,000 | | | | | | | | | | 256,194 | |
| | | | | | | | | | | | | | | |
| | | | | | | | | | | | | | | |
| | | |
| Leisure Time - 4.10% | | | | | | |
| Liberty TripAdvisor Holdings, Inc., 0.500%, Due 6/30/2051C D F | | | | 3,855,000 | | | | | | | | | | 3,578,659 | |
| Royal Caribbean Cruises Ltd., 6.000%, Due 8/15/2025C | | | | 1,130,000 | | | | | | | | | | 3,644,815 | |
| | | | | | | | | | | | | | | |
| | | | | | | | | | | | | | 7,223,474 | |
| | | | | | | | | | | | | | | |
| | | | | | | | | | | | | | | |
| | | |
| Retail - 1.41% | | | | | | |
| Cheesecake Factory, Inc., 0.375%, Due 6/15/2026C | | | | 2,755,000 | | | | | | | | | | 2,485,746 | |
| | | | | | | | | | | | | | | |
| | | | | | | | | | | | | | | |
Total Consumer, Cyclical | | | | | | | | | | | | | | 18,003,737 | |
| | | | | | | | | | | | | | | |
| | | | | | | | | | | | | | | |
| | | |
| Consumer, Non-Cyclical - 16.77% | | | | | | |
| | | |
| Agriculture - 1.28% | | | | | | |
| Turning Point Brands, Inc., 2.500%, Due 7/15/2024 | | | | 2,261,000 | | | | | | | | | | 2,253,994 | |
| | | | | | | | | | | | | | | |
| | | | | | | | | | | | | | | |
| | | |
| Biotechnology - 1.79% | | | | | | |
| Bridgebio Pharma, Inc., 2.250%, Due 2/1/2029C | | | | 2,327,000 | | | | | | | | | | 1,842,641 | |
| Halozyme Therapeutics, Inc., 0.250%, Due 3/1/2027C | | | | 1,372,000 | | | | | | | | | | 1,307,941 | |
| | | | | | | | | | | | | | | |
| | | | | | | | | | | | | | 3,150,582 | |
| | | | | | | | | | | | | | | |
| | | | | | | | | | | | | | | |
| | | |
| Commercial Services - 2.94% | | | | | | |
| Affirm Holdings, Inc., Due 11/15/2026E | | | | 2,198,000 | | | | | | | | | | 1,824,340 | |
| Alarm.com Holdings, Inc., 2.250%, Due 6/1/2029C D | | | | 399,000 | | | | | | | | | | 390,249 | |
| Block, Inc., 0.250%, Due 11/1/2027C | | | | 1,422,000 | | | | | | | | | | 1,175,994 | |
| Chegg, Inc., 0.125%, Due 3/15/2025C | | | | 1,933,000 | | | | | | | | | | 1,788,025 | |
| | | | | | | | | | | | | | | |
| | | | | | | | | | | | | | 5,178,608 | |
| | | | | | | | | | | | | | | |
| | | | | | | | | | | | | | | |
See accompanying notes
3
American Beacon SSI Alternative Income FundSM
Schedule of Investments
June 30, 2024
| | | | | | | | | | | | | | | |
| | | |
| | | Principal Amount | | | | Fair Value |
| | | | | | | |
| | | |
| SECURITIES HELD LONG - 98.74% (continued) | | | | | | |
| | | |
| CONVERTIBLE OBLIGATIONS - 74.68% (continued) | | | | | | |
| | | |
| Consumer, Non-Cyclical - 16.77% (continued) | | | | | | |
| | | |
| Cosmetics/Personal Care - 1.52% | | | | | | |
| Beauty Health Co., 1.250%, Due 10/1/2026C D | | | $ | 2,314,000 | | | | | | | | | $ | 1,923,519 | |
| Spectrum Brands, Inc., 3.375%, Due 6/1/2029C D F | | | | 787,000 | | | | | | | | | | 757,881 | |
| | | | | | | | | | | | | | | |
| | | | | | | | | | | | | | 2,681,400 | |
| | | | | | | | | | | | | | | |
| | | | | | | | | | | | | | | |
| | | |
| Health Care - Products - 5.27% | | | | | | |
| CONMED Corp., 2.250%, Due 6/15/2027C | | | | 2,059,000 | | | | | | | | | | 1,838,714 | |
| Enovis Corp., 3.875%, Due 10/15/2028D | | | | 1,877,000 | | | | | | | | | | 1,968,973 | |
| Exact Sciences Corp., 0.375%, Due 3/15/2027C | | | | 2,010,000 | | | | | | | | | | 1,746,838 | |
| Haemonetics Corp., | | | | | | | | | | | | | | | |
Due 3/1/2026C E | | | | 1,377,000 | | | | | | | | | | 1,234,480 | |
2.500%, Due 6/1/2029D | | | | 395,000 | | | | | | | | | | 386,903 | |
| Integer Holdings Corp., 2.125%, Due 2/15/2028C | | | | 1,466,000 | | | | | | | | | | 2,092,715 | |
| | | | | | | | | | | | | | | |
| | | | | | | | | | | | | | 9,268,623 | |
| | | | | | | | | | | | | | | |
| | | | | | | | | | | | | | | |
| | | |
| Pharmaceuticals - 3.97% | | | | | | |
| Collegium Pharmaceutical, Inc., 2.875%, Due 2/15/2029C | | | | 2,139,000 | | | | | | | | | | 2,357,178 | |
| Jazz Investments I Ltd., 1.500%, Due 8/15/2024C | | | | 1,147,000 | | | | | | | | | | 1,140,118 | |
| Mirum Pharmaceuticals, Inc., 4.000%, Due 5/1/2029C | | | | 977,000 | | | | | | | | | | 1,308,569 | |
| Pacira BioSciences, Inc., 2.125%, Due 5/15/2029C D | | | | 521,000 | | | | | | | | | | 516,572 | |
| Revance Therapeutics, Inc., 1.750%, Due 2/15/2027C | | | | 2,531,000 | | | | | | | | | | 1,660,336 | |
| | | | | | | | | | | | | | | |
| | | | | | | | | | | | | | 6,982,773 | |
| | | | | | | | | | | | | | | |
| | | | | | | | | | | | | | | |
Total Consumer, Non-Cyclical | | | | | | | | | | | | | | 29,515,980 | |
| | | | | | | | | | | | | | | |
| | | | | | | | | | | | | | | |
| | | |
| Diversified - 1.87% | | | | | | |
| | | |
| Holding Companies - Diversified - 1.87% | | | | | | |
| RWT Holdings, Inc., 5.750%, Due 10/1/2025 | | | | 3,394,000 | | | | | | | | | | 3,292,318 | |
| | | | | | | | | | | | | | | |
| | | | | | | | | | | | | | | |
| | | |
| Financial - 14.55% | | | | | | |
| | | |
| Diversified Financial Services - 5.71% | | | | | | |
| Coinbase Global, Inc., 0.250%, Due 4/1/2030C D | | | | 330,000 | | | | | | | | | | 317,790 | |
| EZCORP, Inc., | | | | | | | | | | | | | | | |
2.375%, Due 5/1/2025 | | | | 594,000 | | | | | | | | | | 573,085 | |
3.750%, Due 12/15/2029D | | | | 463,000 | | | | | | | | | | 531,494 | |
| LendingTree, Inc., 0.500%, Due 7/15/2025C | | | | 2,292,000 | | | | | | | | | | 2,120,100 | |
| SoFi Technologies, Inc., Due 10/15/2026C D E | | | | 2,528,000 | | | | | | | | | | 2,184,192 | |
| Upstart Holdings, Inc., 0.250%, Due 8/15/2026 | | | | 2,995,000 | | | | | | | | | | 2,370,995 | |
| WisdomTree, Inc., 5.750%, Due 8/15/2028C | | | | 1,599,000 | | | | | | | | | | 1,957,134 | |
| | | | | | | | | | | | | | | |
| | | | | | | | | | | | | | 10,054,790 | |
| | | | | | | | | | | | | | | |
| | | | | | | | | | | | | | | |
| | | |
| Private Equity - 1.20% | | | | | | |
| HAT Holdings I LLC/HAT Holdings II LLC, Due 5/1/2025D E | | | | 2,020,000 | | | | | | | | | | 2,118,758 | |
| | | | | | | | | | | | | | | |
| | | | | | | | | | | | | | | |
| | | |
| Real Estate - 0.35% | | | | | | |
| Realogy Group LLC/Realogy Co-Issuer Corp., 0.250%, Due 6/15/2026C | | | | 756,000 | | | | | | | | | | 606,690 | |
| | | | | | | | | | | | | | | |
| | | | | | | | | | | | | | | |
| | | |
| REITS - 7.29% | | | | | | |
| Arbor Realty Trust, Inc., 7.500%, Due 8/1/2025 | | | | 851,000 | | | | | | | | | | 849,936 | |
| Blackstone Mortgage Trust, Inc., 5.500%, Due 3/15/2027 | | | | 1,222,000 | | | | | | | | | | 1,093,690 | |
| Pebblebrook Hotel Trust, 1.750%, Due 12/15/2026C | | | | 2,615,000 | | | | | | | | | | 2,307,738 | |
| PennyMac Corp., | | | | | | | | | | | | | | | |
5.500%, Due 11/1/2024 | | | | 1,068,000 | | | | | | | | | | 1,054,650 | |
5.500%, Due 3/15/2026 | | | | 2,403,000 | | | | | | | | | | 2,285,974 | |
8.500%, Due 6/1/2029D | | | | 525,000 | | | | | | | | | | 507,132 | |
| Summit Hotel Properties, Inc., 1.500%, Due 2/15/2026C | | | | 1,921,000 | | | | | | | | | | 1,728,900 | |
| Two Harbors Investment Corp., 6.250%, Due 1/15/2026 | | | | 3,152,000 | | | | | | | | | | 3,010,160 | |
| | | | | | | | | | | | | | | |
| | | | | | | | | | | | | | 12,838,180 | |
| | | | | | | | | | | | | | | |
| | | | | | | | | | | | | | | |
Total Financial | | | | | | | | | | | | | | 25,618,418 | |
| | | | | | | | | | | | | | | |
| | | | | | | | | | | | | | | |
See accompanying notes
4
American Beacon SSI Alternative Income FundSM
Schedule of Investments
June 30, 2024
| | | | | | | | | | | | | | | |
| | | |
| | | Principal Amount | | | | Fair Value |
| | | | | | | |
| | | |
| SECURITIES HELD LONG - 98.74% (continued) | | | | | | |
| | | |
| CONVERTIBLE OBLIGATIONS - 74.68% (continued) | | | | | | |
| | | |
| Industrial - 4.07% | | | | | | |
| | | |
| Electronics - 0.45% | | | | | | |
| Mesa Laboratories, Inc., 1.375%, Due 8/15/2025C | | | $ | 838,000 | | | | | | | | | $ | 787,366 | |
| | | | | | | | | | | | | | | |
| | | | | | | | | | | | | | | |
| | | |
| Machinery - Construction & Mining - 0.26% | | | | | | |
| Bloom Energy Corp., 3.000%, Due 6/1/2029C D | | | | 526,000 | | | | | | | | | | 463,143 | |
| | | | | | | | | | | | | | | |
| | | | | | | | | | | | | | | |
| | | |
| Metal Fabricate/Hardware - 0.59% | | | | | | |
| Xometry, Inc., 1.000%, Due 2/1/2027C | | | | 1,376,000 | | | | | | | | | | 1,028,519 | |
| | | | | | | | | | | | | | | |
| | | | | | | | | | | | | | | |
| | | |
| Transportation - 1.54% | | | | | | |
| Air Transport Services Group, Inc., 3.875%, Due 8/15/2029C D | | | | 2,173,000 | | | | | | | | | | 1,838,281 | |
| CryoPort, Inc., 0.750%, Due 12/1/2026C D | | | | 1,028,000 | | | | | | | | | | 864,805 | |
| | | | | | | | | | | | | | | |
| | | | | | | | | | | | | | 2,703,086 | |
| | | | | | | | | | | | | | | |
| | | | | | | | | | | | | | | |
| | | |
| Trucking & Leasing - 1.23% | | | | | | |
| Greenbrier Cos., Inc., 2.875%, Due 4/15/2028C | | | | 2,026,000 | | | | | | | | | | 2,171,872 | |
| | | | | | | | | | | | | | | |
| | | | | | | | | | | | | | | |
Total Industrial | | | | | | | | | | | | | | 7,153,986 | |
| | | | | | | | | | | | | | | |
| | | | | | | | | | | | | | | |
| | | |
| Technology - 12.73% | | | | | | |
| | | |
| Computers - 2.55% | | | | | | |
| 3D Systems Corp., Due 11/15/2026E | | | | 816,000 | | | | | | | | | | 660,550 | |
| Lumentum Holdings, Inc., 0.500%, Due 12/15/2026C | | | | 1,380,000 | | | | | | | | | | 1,242,822 | |
| Super Micro Computer, Inc., Due 3/1/2029C D E | | | | 247,000 | | | | | | | | | | 247,407 | |
| Western Digital Corp., 3.000%, Due 11/15/2028C D | | | | 1,467,000 | | | | | | | | | | 2,335,464 | |
| | | | | | | | | | | | | | | |
| | | | | | | | | | | | | | 4,486,243 | |
| | | | | | | | | | | | | | | |
| | | | | | | | | | | | | | | |
| | | |
| Software - 10.18% | | | | | | |
| Bentley Systems, Inc., 0.375%, Due 7/1/2027C | | | | 1,284,000 | | | | | | | | | | 1,146,612 | |
| BlackLine, Inc., 0.125%, Due 8/1/2024 | | | | 1,205,000 | | | | | | | | | | 1,195,360 | |
| CSG Systems International, Inc., 3.875%, Due 9/15/2028C D | | | | 1,580,000 | | | | | | | | | | 1,463,870 | |
| Dayforce, Inc., 0.250%, Due 3/15/2026C | | | | 1,599,000 | | | | | | | | | | 1,456,689 | |
| DigitalOcean Holdings, Inc., Due 12/1/2026E | | | | 1,971,000 | | | | | | | | | | 1,660,567 | |
| Envestnet, Inc., 2.625%, Due 12/1/2027C | | | | 1,887,000 | | | | | | | | | | 2,021,920 | |
| Evolent Health, Inc., 3.500%, Due 12/1/2029C D | | | | 1,772,000 | | | | | | | | | | 1,596,572 | |
| i3 Verticals LLC, 1.000%, Due 2/15/2025C | | | | 1,044,000 | | | | | | | | | | 998,128 | |
| Jamf Holding Corp., 0.125%, Due 9/1/2026C | | | | 1,452,000 | | | | | | | | | | 1,280,147 | |
| MicroStrategy, Inc., Due 2/15/2027C E | | | | 854,000 | | | | | | | | | | 1,022,665 | |
| Progress Software Corp., 3.500%, Due 3/1/2030C D | | | | 1,663,000 | | | | | | | | | | 1,694,736 | |
| Veradigm, Inc., 0.875%, Due 1/1/2027 | | | | 451,000 | | | | | | | | | | 481,894 | |
| Verint Systems, Inc., 0.250%, Due 4/15/2026C | | | | 1,904,000 | | | | | | | | | | 1,755,488 | |
| Vertex, Inc., 0.750%, Due 5/1/2029C D | | | | 129,000 | | | | | | | | | | 153,686 | |
| | | | | | | | | | | | | | | |
| | | | | | | | | | | | | | 17,928,334 | |
| | | | | | | | | | | | | | | |
| | | | | | | | | | | | | | | |
Total Technology | | | | | | | | | | | | | | 22,414,577 | |
| | | | | | | | | | | | | | | |
| | | | | | | | | | | | | | | |
| | | |
| Utilities - 3.92% | | | | | | |
| | | |
| Electric - 3.92% | | | | | | |
| CenterPoint Energy, Inc., 4.250%, Due 8/15/2026D | | | | 2,157,000 | | | | | | | | | | 2,168,069 | |
| Duke Energy Corp., 4.125%, Due 4/15/2026C | | | | 1,763,000 | | | | | | | | | | 1,757,822 | |
| PG&E Corp., 4.250%, Due 12/1/2027C D | | | | 2,956,000 | | | | | | | | | | 2,981,126 | |
| | | | | | | | | | | | | | | |
| | | | | | | | | | | | | | 6,907,017 | |
| | | | | | | | | | | | | | | |
| | | | | | | | | | | | | | | |
Total Utilities | | | | | | | | | | | | | | 6,907,017 | |
| | | | | | | | | | | | | | | |
| | | | | | | | | | | | | | | |
Total Convertible Obligations (Cost $132,484,936) | | | | | | | | | | | | | | 131,458,145 | |
| | | | | | | | | | | | | | | |
| | | | | | | | | | | | | | | |
See accompanying notes
5
American Beacon SSI Alternative Income FundSM
Schedule of Investments
June 30, 2024
| | | | | | | | | | | | | | | |
| | | |
| | | Principal Amount | | | | Fair Value |
| | | | | | | |
| | | |
| SECURITIES HELD LONG - 98.74% (continued) | | | | | | |
| | | |
| FOREIGN CONVERTIBLE OBLIGATIONS - 3.98% | | | | | | |
| | | |
| Basic Materials - 2.03% | | | | | | |
| | | |
| Mining - 2.03% | | | | | | |
| Equinox Gold Corp., 4.750%, Due 10/15/2028C D | | | $ | 1,282,000 | | | | | | | | | $ | 1,464,685 | |
| First Majestic Silver Corp., 0.375%, Due 1/15/2027C | | | | 1,442,000 | | | | | | | | | | 1,189,073 | |
| SSR Mining, Inc., 2.500%, Due 4/1/2039C F | | | | 1,020,000 | | | | | | | | | | 921,978 | |
| | | | | | | | | | | | | | | |
| | | | | | | | | | | | | | 3,575,736 | |
| | | | | | | | | | | | | | | |
| | | | | | | | | | | | | | | |
Total Basic Materials | | | | | | | | | | | | | | 3,575,736 | |
| | | | | | | | | | | | | | | |
| | | | | | | | | | | | | | | |
| | | |
| Communications - 0.53% | | | | | | |
| | | |
| Internet - 0.29% | | | | | | |
| Alibaba Group Holding Ltd., 0.500%, Due 6/1/2031C D | | | | 526,000 | | | | | | | | | | 508,379 | |
| | | | | | | | | | | | | | | |
| | | | | | | | | | | | | | | |
| | | |
| Media - 0.24% | | | | | | |
| Liberty Latin America Ltd., 2.000%, Due 7/15/2024 | | | | 426,000 | | | | | | | | | | 422,049 | |
| | | | | | | | | | | | | | | |
| | | | | | | | | | | | | | | |
Total Communications | | | | | | | | | | | | | | 930,428 | |
| | | | | | | | | | | | | | | |
| | | | | | | | | | | | | | | |
| | | |
| Consumer, Non-Cyclical - 0.58% | | | | | | |
| | | |
| Pharmaceuticals - 0.58% | | | | | | |
| Ascendis Pharma AS, 2.250%, Due 4/1/2028 | | | | 910,000 | | | | | | | | | | 1,011,659 | |
| | | | | | | | | | | | | | | |
| | | | | | | | | | | | | | | |
| | | |
| Energy - 0.84% | | | | | | |
| | | |
| Oil & Gas - 0.84% | | | | | | |
| Kosmos Energy Ltd., 3.125%, Due 3/15/2030C D | | | | 1,422,000 | | | | | | | | | | 1,485,990 | |
| | | | | | | | | | | | | | | |
| | | | | | | | | | | | | | | |
Total Foreign Convertible Obligations (Cost $6,800,546) | | | | | | | | | | | | | | 7,003,813 | |
| | | | | | | | | | | | | | | |
| | | |
| | | Shares | | | | |
| | | | | | | |
| | | |
| SHORT-TERM INVESTMENTS - 15.27% (Cost $26,876,633) | | | | | | |
| | | |
| Investment Companies - 15.27% | | | | | | |
| American Beacon U.S. Government Money Market Select Fund, 5.18%G H | | | | 26,876,633 | | | | | | | | | | 26,876,633 | |
| | | | | | | | | | | | | | | |
| | | | | | | | | | | | | | | |
Total Securities Held Long (Cost $174,934,222) | | | | | | | | | | | | | | 173,818,568 | |
| | | | | | | | | | | | | | | |
| | | | | | | | | | | | | | | |
| | | |
| SECURITIES SOLD SHORT - (19.75%) | | | | | | |
| | | |
| COMMON STOCKS - (19.75%) | | | | | | |
| | | |
| Communication Services - (2.34%) | | | | | | |
| | | |
| Entertainment - (1.44%) | | | | | | |
| Live Nation Entertainment, Inc.I | | | | (10,647 | ) | | | | | | | | | (998,050 | ) |
| Sphere Entertainment Co.I | | | | (43,598 | ) | | | | | | | | | (1,528,546 | ) |
| | | | | | | | | | | | | | | |
| | | | | | | | | | | | | | (2,526,596 | ) |
| | | | | | | | | | | | | | | |
| | | | | | | | | | | | | | | |
| | | |
| Interactive Media & Services - (0.09%) | | | | | | |
| Snap, Inc., Class AI | | | | (1,737 | ) | | | | | | | | | (28,851 | ) |
| Ziff Davis, Inc.I | | | | (2,334 | ) | | | | | | | | | (128,487 | ) |
| | | | | | | | | | | | | | | |
| | | | | | | | | | | | | | (157,338 | ) |
| | | | | | | | | | | | | | | |
| | | | | | | | | | | | | | | |
| | | |
| Media - (0.81%) | | | | | | |
| Cable One, Inc. | | | | (46 | ) | | | | | | | | | (16,284 | ) |
| Cardlytics, Inc.I | | | | (23,303 | ) | | | | | | | | | (191,318 | ) |
| Charter Communications, Inc., Class AI | | | | (345 | ) | | | | | | | | | (103,141 | ) |
| Liberty Media Corp.-Liberty SiriusXM, Class AI J | | | | (50,540 | ) | | | | | | | | | (1,119,461 | ) |
| | | | | | | | | | | | | | | |
| | | | | | | | | | | | | | (1,430,204 | ) |
| | | | | | | | | | | | | | | |
| | | | | | | | | | | | | | | |
Total Communication Services | | | | | | | | | | | | | | (4,114,138 | ) |
| | | | | | | | | | | | | | | |
| | | | | | | | | | | | | | | |
| | | |
| Consumer Discretionary - (2.94%) | | | | | | |
| | | |
| Automobiles - (0.26%) | | | | | | |
| Rivian Automotive, Inc., Class AI | | | | (33,721 | ) | | | | | | | | | (452,536 | ) |
| | | | | | | | | | | | | | | |
| | | | | | | | | | | | | | | |
See accompanying notes
6
American Beacon SSI Alternative Income FundSM
Schedule of Investments
June 30, 2024
| | | | | | | | | | | | | | | |
| | | |
| | | Shares | | | | Fair Value |
| | | | | | | |
| | | |
| SECURITIES SOLD SHORT - (19.75%) (continued) | | | | | | |
| | | |
| COMMON STOCKS - (19.75%) (continued) | | | | | | |
| | | |
| Consumer Discretionary - (2.94%) (continued) | | | | | | |
| | | |
| Broadline Retail - (0.10%) | | | | | | |
| Alibaba Group Holding Ltd., ADR | | | | (2,524 | ) | | | | | | | | $ | (181,728 | ) |
| | | | | | | | | | | | | | | |
| | | | | | | | | | | | | | | |
| | | |
| Hotels, Restaurants & Leisure - (2.45%) | | | | | | |
| Airbnb, Inc., Class AI | | | | (551 | ) | | | | | | | | | (83,548 | ) |
| Cheesecake Factory, Inc. | | | | (7,458 | ) | | | | | | | | | (293,025 | ) |
| DraftKings, Inc., Class AI | | | | (3,774 | ) | | | | | | | | | (144,054 | ) |
| Marriott Vacations Worldwide Corp. | | | | (2,348 | ) | | | | | | | | | (205,027 | ) |
| Royal Caribbean Cruises Ltd.I | | | | (22,544 | ) | | | | | | | | | (3,594,190 | ) |
| | | | | | | | | | | | | | | |
| | | | | | | | | | | | | | (4,319,844 | ) |
| | | | | | | | | | | | | | | |
| | | | | | | | | | | | | | | |
| | | |
| Household Durables - (0.06%) | | | | | | |
| Meritage Homes Corp. | | | | (619 | ) | | | | | | | | | (100,185 | ) |
| | | | | | | | | | | | | | | |
| | | | | | | | | | | | | | | |
| | | |
| Specialty Retail - (0.07%) | | | | | | |
| Wayfair, Inc., Class AI | | | | (2,280 | ) | | | | | | | | | (120,224 | ) |
| | | | | | | | | | | | | | | |
| | | | | | | | | | | | | | | |
Total Consumer Discretionary | | | | | | | | | | | | | | (5,174,517 | ) |
| | | | | | | | | | | | | | | |
| | | | | | | | | | | | | | | |
| | | |
| Consumer Staples - (0.19%) | | | | | | |
| | | |
| Household Products - (0.18%) | | | | | | |
| Spectrum Brands Holdings, Inc. | | | | (3,620 | ) | | | | | | | | | (311,066 | ) |
| | | | | | | | | | | | | | | |
| | | | | | | | | | | | | | | |
| | | |
| Personal Products - (0.01%) | | | | | | |
| Beauty Health Co.I | | | | (10,641 | ) | | | | | | | | | (20,431 | ) |
| | | | | | | | | | | | | | | |
| | | | | | | | | | | | | | | |
Total Consumer Staples | | | | | | | | | | | | | | (331,497 | ) |
| | | | | | | | | | | | | | | |
| | | | | | | | | | | | | | | |
| | | |
| Energy - (0.46%) | | | | | | |
| | | |
| Oil, Gas & Consumable Fuels - (0.46%) | | | | | | |
| Kosmos Energy Ltd.I | | | | (145,334 | ) | | | | | | | | | (805,150 | ) |
| | | | | | | | | | | | | | | |
| | | | | | | | | | | | | | | |
| | | |
| Financials - (1.34%) | | | | | | |
| | | |
| Capital Markets - (0.76%) | | | | | | |
| Coinbase Global, Inc., Class AI | | | | (685 | ) | | | | | | | | | (152,227 | ) |
| WisdomTree, Inc. | | | | (119,448 | ) | | | | | | | | | (1,183,730 | ) |
| | | | | | | | | | | | | | | |
| | | | | | | | | | | | | | (1,335,957 | ) |
| | | | | | | | | | | | | | | |
| | | | | | | | | | | | | | | |
| | | |
| Consumer Finance - (0.23%) | | | | | | |
| EZCORP, Inc., Class AI | | | | (32,469 | ) | | | | | | | | | (339,950 | ) |
| SoFi Technologies, Inc.I | | | | (11,846 | ) | | | | | | | | | (78,302 | ) |
| | | | | | | | | | | | | | | |
| | | | | | | | | | | | | | (418,252 | ) |
| | | | | | | | | | | | | | | |
| | | | | | | | | | | | | | | |
| | | |
| Financial Services - (0.35%) | | | | | | |
| Apollo Global Management, Inc. | | | | (4,677 | ) | | | | | | | | | (552,214 | ) |
| Block, Inc.I | | | | (935 | ) | | | | | | | | | (60,298 | ) |
| | | | | | | | | | | | | | | |
| | | | | | | | | | | | | | (612,512 | ) |
| | | | | | | | | | | | | | | |
| | | | | | | | | | | | | | | |
Total Financials | | | | | | | | | | | | | | (2,366,721 | ) |
| | | | | | | | | | | | | | | |
| | | | | | | | | | | | | | | |
| | | |
| Health Care - (4.12%) | | | | | | |
| | | |
| Biotechnology - (1.21%) | | | | | | |
| Ascendis Pharma AS, ADRI | | | | (3,457 | ) | | | | | | | | | (471,466 | ) |
| Bridgebio Pharma, Inc.I | | | | (6,649 | ) | | | | | | | | | (168,419 | ) |
| Exact Sciences Corp.I | | | | (5,743 | ) | | | | | | | | | (242,642 | ) |
| Halozyme Therapeutics, Inc.I | | | | (8,414 | ) | | | | | | | | | (440,557 | ) |
| Mirum Pharmaceuticals, Inc.I | | | | (23,618 | ) | | | | | | | | | (807,499 | ) |
| | | | | | | | | | | | | | | |
| | | | | | | | | | | | | | (2,130,583 | ) |
| | | | | | | | | | | | | | | |
| | | | | | | | | | | | | | | |
See accompanying notes
7
American Beacon SSI Alternative Income FundSM
Schedule of Investments
June 30, 2024
| | | | | | | | | | | | | | | |
| | | |
| | | Shares | | | | Fair Value |
| | | | | | | |
| | | |
| SECURITIES SOLD SHORT - (19.75%) (continued) | | | | | | |
| | | |
| COMMON STOCKS - (19.75%) (continued) | | | | | | |
| | | |
| Health Care - (4.12%) (continued) | | | | | | |
| | | |
| Health Care Equipment & Supplies - (1.62%) | | | | | | |
| CONMED Corp. | | | | (3,275 | ) | | | | | | | | $ | (227,023 | ) |
| Enovis Corp.I | | | | (20,378 | ) | | | | | | | | | (921,086 | ) |
| Haemonetics Corp.I | | | | (526 | ) | | | | | | | | | (43,516 | ) |
| Integer Holdings Corp.I | | | | (14,295 | ) | | | | | | | | | (1,655,218 | ) |
| | | | | | | | | | | | | | | |
| | | | | | | | | | | | | | (2,846,843 | ) |
| | | | | | | | | | | | | | | |
| | | | | | | | | | | | | | | |
| | | |
| Health Care Technology - (0.31%) | | | | | | |
| Evolent Health, Inc., Class AI | | | | (25,720 | ) | | | | | | | | | (491,767 | ) |
| Veradigm, Inc.I | | | | (5,096 | ) | | | | | | | | | (48,412 | ) |
| | | | | | | | | | | | | | | |
| | | | | | | | | | | | | | (540,179 | ) |
| | | | | | | | | | | | | | | |
| | | | | | | | | | | | | | | |
| | | |
| Pharmaceuticals - (0.98%) | | | | | | |
| Collegium Pharmaceutical, Inc.I | | | | (44,624 | ) | | | | | | | | | (1,436,893 | ) |
| Pacira BioSciences, Inc.I | | | | (8,597 | ) | | | | | | | | | (245,960 | ) |
| Revance Therapeutics, Inc.I | | | | (19,741 | ) | | | | | | | | | (50,734 | ) |
| | | | | | | | | | | | | | | |
| | | | | | | | | | | | | | (1,733,587 | ) |
| | | | | | | | | | | | | | | |
| | | | | | | | | | | | | | | |
Total Health Care | | | | | | | | | | | | | | (7,251,192 | ) |
| | | | | | | | | | | | | | | |
| | | | | | | | | | | | | | | |
| | | |
| Industrials - (2.41%) | | | | | | |
| | | |
| Air Freight & Logistics - (0.24%) | | | | | | |
| Air Transport Services Group, Inc.I | | | | (30,643 | ) | | | | | | | | | (425,018 | ) |
| | | | | | | | | | | | | | | |
| | | | | | | | | | | | | | | |
| | | |
| Electrical Equipment - (0.12%) | | | | | | |
| Bloom Energy Corp., Class AI | | | | (17,884 | ) | | | | | | | | | (218,900 | ) |
| | | | | | | | | | | | | | | |
| | | | | | | | | | | | | | | |
| | | |
| Machinery - (1.63%) | | | | | | |
| Chart Industries, Inc.I | | | | (12,330 | ) | | | | | | | | | (1,779,712 | ) |
| Greenbrier Cos., Inc. | | | | (21,855 | ) | | | | | | | | | (1,082,916 | ) |
| | | | | | | | | | | | | | | |
| | | | | | | | | | | | | | (2,862,628 | ) |
| | | | | | | | | | | | | | | |
| | | | | | | | | | | | | | | |
| | | |
| Passenger Airlines - (0.17%) | | | | | | |
| American Airlines Group, Inc.I | | | | (26,278 | ) | | | | | | | | | (297,730 | ) |
| | | | | | | | | | | | | | | |
| | | | | | | | | | | | | | | |
| | | |
| Professional Services - (0.20%) | | | | | | |
| CSG Systems International, Inc. | | | | (7,954 | ) | | | | | | | | | (327,466 | ) |
| Dayforce, Inc.I | | | | (609 | ) | | | | | | | | | (30,206 | ) |
| Upwork, Inc.I | | | | (326 | ) | | | | | | | | | (3,505 | ) |
| | | | | | | | | | | | | | | |
| | | | | | | | | | | | | | (361,177 | ) |
| | | | | | | | | | | | | | | |
| | | | | | | | | | | | | | | |
| | | |
| Trading Companies & Distributors - (0.05%) | | | | | | |
| Xometry, Inc., Class AI | | | | (7,339 | ) | | | | | | | | | (84,839 | ) |
| | | | | | | | | | | | | | | |
| | | | | | | | | | | | | | | |
Total Industrials | | | | | | | | | | | | | | (4,250,292 | ) |
| | | | | | | | | | | | | | | |
| | | | | | | | | | | | | | | |
| | | |
| Information Technology - (3.16%) | | | | | | |
| | | |
| Communications Equipment - (0.12%) | | | | | | |
| Lumentum Holdings, Inc.I | | | | (4,107 | ) | | | | | | | | | (209,129 | ) |
| | | | | | | | | | | | | | | |
| | | | | | | | | | | | | | | |
| | | |
| IT Services - (0.05%) | | | | | | |
| Perficient, Inc.I | | | | (1,186 | ) | | | | | | | | | (88,701 | ) |
| | | | | | | | | | | | | | | |
| | | | | | | | | | | | | | | |
| | | |
| Software - (2.02%) | | | | | | |
| Alarm.com Holdings, Inc.I | | | | (2,766 | ) | | | | | | | | | (175,752 | ) |
| Bentley Systems, Inc., Class B | | | | (5,321 | ) | | | | | | | | | (262,645 | ) |
| Envestnet, Inc.I | | | | (17,010 | ) | | | | | | | | | (1,064,656 | ) |
See accompanying notes
8
American Beacon SSI Alternative Income FundSM
Schedule of Investments
June 30, 2024
| | | | | | | | | | | | | | | |
| | | |
| | | Shares | | | | Fair Value |
| | | | | | | |
| | | |
| SECURITIES SOLD SHORT - (19.75%) (continued) | | | | | | |
| | | |
| COMMON STOCKS - (19.75%) (continued) | | | | | | |
| | | |
| Information Technology - (3.16%) (continued) | | | | | | |
| | | |
| Software - (2.02%) (continued) | | | | | | |
| Jamf Holding Corp.I | | | | (3,126 | ) | | | | | | | | $ | (51,579 | ) |
| MicroStrategy, Inc., Class AI | | | | (461 | ) | | | | | | | | | (635,018 | ) |
| NCR Voyix Corp.I | | | | (25,232 | ) | | | | | | | | | (311,615 | ) |
| Progress Software Corp. | | | | (14,090 | ) | | | | | | | | | (764,523 | ) |
| Verint Systems, Inc.I | | | | (6,219 | ) | | | | | | | | | (200,252 | ) |
| Vertex, Inc., Class AI | | | | (2,528 | ) | | | | | | | | | (91,134 | ) |
| | | | | | | | | | | | | | | |
| | | | | | | | | | | | | | (3,557,174 | ) |
| | | | | | | | | | | | | | | |
| | | | | | | | | | | | | | | |
| | | |
| Technology Hardware, Storage & Peripherals - (0.97%) | | | | | | |
| Super Micro Computer, Inc.I | | | | (105 | ) | | | | | | | | | (86,032 | ) |
| Western Digital Corp.I | | | | (21,369 | ) | | | | | | | | | (1,619,129 | ) |
| | | | | | | | | | | | | | | |
| | | | | | | | | | | | | | (1,705,161 | ) |
| | | | | | | | | | | | | | | |
| | | | | | | | | | | | | | | |
Total Information Technology | | | | | | | | | | | | | | (5,560,165 | ) |
| | | | | | | | | | | | | | | |
| | | | | | | | | | | | | | | |
| | | |
| Materials - (0.97%) | | | | | | |
| | | |
| Metals & Mining - (0.97%) | | | | | | |
| Century Aluminum Co.I | | | | (37,695 | ) | | | | | | | | | (631,391 | ) |
| Equinox Gold Corp.I | | | | (156,288 | ) | | | | | | | | | (817,386 | ) |
| First Majestic Silver Corp. | | | | (29,224 | ) | | | | | | | | | (173,006 | ) |
| MP Materials Corp.I | | | | (2,034 | ) | | | | | | | | | (25,893 | ) |
| SSR Mining, Inc. | | | | (15,688 | ) | | | | | | | | | (70,753 | ) |
| | | | | | | | | | | | | | | |
| | | | | | | | | | | | | | (1,718,429 | ) |
| | | | | | | | | | | | | | | |
| | | | | | | | | | | | | | | |
Total Materials | | | | | | | | | | | | | | (1,718,429 | ) |
| | | | | | | | | | | | | | | |
| | | | | | | | | | | | | | | |
| | | |
| Real Estate - (0.50%) | | | | | | |
| | | |
| Hotel & Resort REITs - (0.38%) | | | | | | |
| Pebblebrook Hotel Trust | | | | (35,289 | ) | | | | | | | | | (485,224 | ) |
| Summit Hotel Properties, Inc. | | | | (31,339 | ) | | | | | | | | | (187,720 | ) |
| | | | | | | | | | | | | | | |
| | | | | | | | | | | | | | (672,944 | ) |
| | | | | | | | | | | | | | | |
| | | | | | | | | | | | | | | |
| | | |
| Real Estate Management & Development - (0.12%) | | | | | | |
| Anywhere Real Estate, Inc.I | | | | (4,631 | ) | | | | | | | | | (15,329 | ) |
| Zillow Group, Inc., Class CI | | | | (4,149 | ) | | | | | | | | | (191,554 | ) |
| | | | | | | | | | | | | | | |
| | | | | | | | | | | | | | (206,883 | ) |
| | | | | | | | | | | | | | | |
| | | | | | | | | | | | | | | |
Total Real Estate | | | | | | | | | | | | | | (879,827 | ) |
| | | | | | | | | | | | | | | |
| | | | | | | | | | | | | | | |
| | | |
| Utilities - (1.32%) | | | | | | |
| | | |
| Electric Utilities - (0.96%) | | | | | | |
| Duke Energy Corp. | | | | (5,277 | ) | | | | | | | | | (528,914 | ) |
| PG&E Corp. | | | | (66,209 | ) | | | | | | | | | (1,156,009 | ) |
| | | | | | | | | | | | | | | |
| | | | | | | | | | | | | | (1,684,923 | ) |
| | | | | | | | | | | | | | | |
| | | | | | | | | | | | | | | |
| | | |
| Multi-Utilities - (0.36%) | | | | | | |
| CenterPoint Energy, Inc. | | | | (20,496 | ) | | | | | | | | | (634,966 | ) |
| | | | | | | | | | | | | | | |
| | | | | | | | | | | | | | | |
Total Utilities | | | | | | | | | | | | | | (2,319,889 | ) |
| | | | | | | | | | | | | | | |
| | | | | | | | | | | | | | | |
Total Common Stocks (Proceeds $(32,316,207)) | | | | | | | | | | | | | | (34,771,817 | ) |
| | | | | | | | | | | | | | | |
| | | | | | | | | | | | | | | |
Total Securities Sold Short (Proceeds $(32,316,207)) | | | | | | | | | | | | | | (34,771,817 | ) |
| | | | | | | | | | | | | | | |
| | | | | | | | | | | | | | | |
TOTAL INVESTMENTS IN SECURITIES (EXCLUDES SECURITIES SOLD SHORT) - 98.74% (Cost $174,934,222) | | | | | | | | | | | | | | 173,818,568 | |
TOTAL SECURITIES SOLD SHORT - (19.75%) (Proceeds $(32,316,207)) | | | | | | | | | | | | | | (34,771,817 | ) |
OTHER ASSETS, NET OF LIABILITIES - 21.01% | | | | | | | | | | | | | | 36,984,694 | |
| | | | | | | | | | | | | | | |
NET ASSETS - 100.00% | | | | | | | | | | | | | $ | 176,031,445 | |
| | | | | | | | | | | | | | | |
| | | | | | | |
| Percentages are stated as a percent of net assets. | | | | | | | | | | | | | | | |
See accompanying notes
9
American Beacon SSI Alternative Income FundSM
Schedule of Investments
June 30, 2024
A A type of Preferred Stock that has no maturity date.
B Variable, floating, or adjustable rate securities with an interest rate that changes periodically. Rates are periodically reset with rates that are based on a predetermined benchmark such as a widely followed interest rate such as T-bills, SOFR, LIBOR or PRIME plus a fixed spread. The interest rate disclosed reflects the rate in effect on June 30, 2024.
C This security or a piece thereof is held as segregated collateral. At period end, the value of these securities amounted to $99,304,029 or 56.41% of net assets.
D Security exempt from registration under the Securities Act of 1933. These securities may be resold to qualified institutional buyers pursuant to Rule 144A. At the period end, the value of these securities amounted to $38,684,519 or 21.98% of net assets. The Fund has no right to demand registration of these securities.
E Zero coupon bond.
F Callable security.
G The Fund is affiliated by having the same investment advisor.
H 7-day yield.
I Non-income producing security.
J Tracking Stock - A form of common stock that is issued by a parent company and tracks the performance of a specific division of that parent company. It allows investors the chance to invest in an individual sector of a company while the parent company maintains overall control.
CMT - Constant Maturity Treasury.
LIBOR - London Interbank Offered Rate.
LLC - Limited Liability Company.
PIK - Payment in Kind.
PRIME - A rate, charged by banks, based on the U.S. Federal Funds rate.
REIT – Real Estate Investment Trust.
SOFR - Secured Overnight Financing Rate.
The Fund’s investments are summarized by level based on the inputs used to determine their values. As of June 30, 2024, the investments were classified as described below:
| | | | | | | | | | | | | | | | | | | | | | | | | | | | |
SSI Alternative Income Fund | | Level 1 | | | | | | Level 2 | | | | | | Level 3 | | | | | | Total | |
Assets | | | | | | | | | | | | | | | | | | | | | | | | | | | | |
Convertible Preferred Stocks | | $ | - | | | | | | | $ | 4,518,164 | | | | | | | $ | - | | | | | | | $ | 4,518,164 | |
Preferred Stocks | | | 3,309,973 | | | | | | | | 651,840 | | | | | | | | - | | | | | | | | 3,961,813 | |
Convertible Obligations | | | - | | | | | | | | 131,458,145 | | | | | | | | - | | | | | | | | 131,458,145 | |
Foreign Convertible Obligations | | | - | | | | | | | | 7,003,813 | | | | | | | | - | | | | | | | | 7,003,813 | |
Short-Term Investments | | | 26,876,633 | | | | | | | | - | | | | | | | | - | | | | | | | | 26,876,633 | |
| | | | | | | | | | | | | | | | | | | | | | | | | | | | |
Total Investments in Securities - Assets | | $ | 30,186,606 | | | | | | | $ | 143,631,962 | | | | | | | $ | - | | | | | | | $ | 173,818,568 | |
| | | | | | | | | | | | | | | | | | | | | | | | | | | | |
| | | | | | | |
Liabilities | | | | | | | | | | | | | | | | | | | | | | | | | | | | |
Common Stocks (Sold Short) | | $ | (34,771,817 | ) | | | | | | $ | - | | | | | | | $ | - | | | | | | | $ | (34,771,817 | ) |
| | | | | | | | | | | | | | | | | | | | | | | | | | | | |
Total Investments in Securities - Liabilities | | | (34,771,817 | ) | | | | | | | - | | | | | | | | - | | | | | | | | (34,771,817 | ) |
| | | | | | | | | | | | | | | | | | | | | | | | | | | | |
Total Investments in Securities | | $ | (4,585,211 | ) | | | | | | $ | 143,631,962 | | | | | | | $ | - | | | | | | | $ | 139,046,751 | |
| | | | | | | | | | | | | | | | | | | | | | | | | | | | |
U.S. GAAP requires transfers between all levels to/from level 3 be disclosed. During the year ended June 30, 2024, there were no transfers into or out of Level 3.
See accompanying notes
10
American Beacon TwentyFour Strategic Income FundSM
Schedule of Investments
June 30, 2024
| | | | | | | | | | | | | | | |
| | | |
| | | Principal Amount* | | | | Fair Value |
| | | | | | | |
| | | |
| CORPORATE OBLIGATIONS - 7.13% | | | | | | |
| | | |
| Communications - 0.56% | | | | | | |
| | | |
| Internet - 0.29% | | | | | | |
| Uber Technologies, Inc., 4.500%, Due 8/15/2029A | | | $ | 695,000 | | | | | | | | | $ | 662,244 | |
| | | | | | | | | | | | | | | |
| | | | | | | | | | | | | | | |
| | | |
| Telecommunications - 0.27% | | | | | | |
| T-Mobile USA, Inc., 5.050%, Due 7/15/2033 | | | | 640,000 | | | | | | | | | | 627,348 | |
| | | | | | | | | | | | | | | |
| | | | | | | | | | | | | | | |
Total Communications | | | | | | | | | | | | | | 1,289,592 | |
| | | | | | | | | | | | | | | |
| | | | | | | | | | | | | | | |
| | | |
| Consumer, Cyclical - 1.16% | | | | | | |
| | | |
| Airlines - 0.24% | | | | | | |
| American Airlines, Inc./AAdvantage Loyalty IP Ltd., 5.750%, Due 4/20/2029A | | | | 575,000 | | | | | | | | | | 559,795 | |
| | | | | | | | | | | | | | | |
| | | | | | | | | | | | | | | |
| | | |
| Auto Manufacturers - 0.61% | | | | | | |
| Ford Motor Credit Co. LLC, | | | | | | | | | | | | | | | |
5.800%, Due 3/5/2027 | | | | 360,000 | | | | | | | | | | 360,060 | |
6.050%, Due 3/5/2031 | | | | 200,000 | | | | | | | | | | 200,419 | |
| General Motors Co., 5.600%, Due 10/15/2032 | | | | 415,000 | | | | | | | | | | 415,717 | |
| Stellantis NV, 4.250%, Due 6/16/2031B | | | EUR | 400,000 | | | | | | | | | | 435,850 | |
| | | | | | | | | | | | | | | |
| | | | | | | | | | | | | | 1,412,046 | |
| | | | | | | | | | | | | | | |
| | | | | | | | | | | | | | | |
| | | |
| Auto Parts & Equipment - 0.31% | | | | | | |
| American Axle & Manufacturing, Inc., 5.000%, Due 10/1/2029 | | | | 510,000 | | | | | | | | | | 467,688 | |
| Titan International, Inc., 7.000%, Due 4/30/2028 | | | | 245,000 | | | | | | | | | | 235,579 | |
| | | | | | | | | | | | | | | |
| | | | | | | | | | | | | | 703,267 | |
| | | | | | | | | | | | | | | |
| | | | | | | | | | | | | | | |
Total Consumer, Cyclical | | | | | | | | | | | | | | 2,675,108 | |
| | | | | | | | | | | | | | | |
| | | | | | | | | | | | | | | |
| | | |
| Consumer, Non-Cyclical - 1.17% | | | | | | |
| | | |
| Commercial Services - 0.46% | | | | | | |
| United Rentals North America, Inc., | | | | | | | | | | | | | | | |
6.000%, Due 12/15/2029A | | | | 590,000 | | | | | | | | | | 592,758 | |
6.125%, Due 3/15/2034A | | | | 475,000 | | | | | | | | | | 473,288 | |
| | | | | | | | | | | | | | | |
| | | | | | | | | | | | | | 1,066,046 | |
| | | | | | | | | | | | | | | |
| | | | | | | | | | | | | | | |
| | | |
| Food - 0.18% | | | | | | |
| General Mills, Inc., 4.950%, Due 3/29/2033 | | | | 430,000 | | | | | | | | | | 419,587 | |
| | | | | | | | | | | | | | | |
| | | | | | | | | | | | | | | |
| | | |
| Health Care - Services - 0.27% | | | | | | |
| HCA, Inc., | | | | | | | | | | | | | | | |
3.500%, Due 9/1/2030 | | | | 115,000 | | | | | | | | | | 103,862 | |
5.500%, Due 6/1/2033 | | | | 520,000 | | | | | | | | | | 516,710 | |
| | | | | | | | | | | | | | | |
| | | | | | | | | | | | | | 620,572 | |
| | | | | | | | | | | | | | | |
| | | | | | | | | | | | | | | |
| | | |
| Pharmaceuticals - 0.26% | | | | | | |
| CVS Health Corp., 5.300%, Due 6/1/2033 | | | | 330,000 | | | | | | | | | | 323,043 | |
| Prestige Brands, Inc., 5.125%, Due 1/15/2028A | | | | 280,000 | | | | | | | | | | 271,574 | |
| | | | | | | | | | | | | | | |
| | | | | | | | | | | | | | 594,617 | |
| | | | | | | | | | | | | | | |
| | | | | | | | | | | | | | | |
Total Consumer, Non-Cyclical | | | | | | | | | | | | | | 2,700,822 | |
| | | | | | | | | | | | | | | |
| | | | | | | | | | | | | | | |
| | | |
| Energy - 2.26% | | | | | | |
| | | |
| Oil & Gas - 0.12% | | | | | | |
| Solaris Midstream Holdings LLC, 7.625%, Due 4/1/2026A | | | | 265,000 | | | | | | | | | | 266,029 | |
| | | | | | | | | | | | | | | |
| | | | | | | | | | | | | | | |
See accompanying notes
11
American Beacon TwentyFour Strategic Income FundSM
Schedule of Investments
June 30, 2024
| | | | | | | | | | | | | | | |
| | | |
| | | Principal Amount* | | | | Fair Value |
| | | | | | | |
| | | |
| CORPORATE OBLIGATIONS - 7.13% (continued) | | | | | | |
| | | |
| Energy - 2.26% (continued) | | | | | | |
| | | |
| Pipelines - 2.14% | | | | | | |
| Antero Midstream Partners LP/Antero Midstream Finance Corp., 5.375%, Due 6/15/2029A | | | $ | 625,000 | | | | | | | | | $ | 605,914 | |
| EnLink Midstream LLC, | | | | | | | | | | | | | | | |
5.625%, Due 1/15/2028A | | | | 424,000 | | | | | | | | | | 421,572 | |
5.375%, Due 6/1/2029 | | | | 500,000 | | | | | | | | | | 489,550 | |
| Hess Midstream Operations LP, | | | | | | | | | | | | | | | |
5.125%, Due 6/15/2028A | | | | 400,000 | | | | | | | | | | 387,323 | |
5.500%, Due 10/15/2030A | | | | 340,000 | | | | | | | | | | 328,385 | |
| Kinetik Holdings LP, | | | | | | | | | | | | | | | |
6.625%, Due 12/15/2028A | | | | 100,000 | | | | | | | | | | 101,573 | |
5.875%, Due 6/15/2030A | | | | 500,000 | | | | | | | | | | 492,708 | |
| Plains All American Pipeline LP/PAA Finance Corp., | | | | | | | | | | | | | | | |
3.800%, Due 9/15/2030 | | | | 330,000 | | | | | | | | | | 301,677 | |
5.700%, Due 9/15/2034 | | | | 375,000 | | | | | | | | | | 372,223 | |
| Tallgrass Energy Partners LP/Tallgrass Energy Finance Corp., 7.375%, Due 2/15/2029A | | | | 535,000 | | | | | | | | | | 537,652 | |
| Targa Resources Corp., 6.125%, Due 3/15/2033 | | | | 280,000 | | | | | | | | | | 288,255 | |
| Targa Resources Partners LP/Targa Resources Partners Finance Corp., 4.875%, Due 2/1/2031 | | | | 650,000 | | | | | | | | | | 620,140 | |
| | | | | | | | | | | | | | | |
| | | | | | | | | | | | | | 4,946,972 | |
| | | | | | | | | | | | | | | |
| | | | | | | | | | | | | | | |
Total Energy | | | | | | | | | | | | | | 5,213,001 | |
| | | | | | | | | | | | | | | |
| | | | | | | | | | | | | | | |
| | | |
| Financial - 1.18% | | | | | | |
| | | |
| Diversified Financial Services - 0.87% | | | | | | |
| Burford Capital Global Finance LLC, 9.250%, Due 7/1/2031A | | | | 410,000 | | | | | | | | | | 431,499 | |
| Encore Capital Group, Inc., | | | | | | | | | | | | | | | |
5.375%, Due 2/15/2026A | | | GBP | 400,000 | | | | | | | | | | 498,055 | |
8.156%, Due 1/15/2028, (3 mo. EUR EURIBOR + 4.250%)B C | | | EUR | 580,000 | | | | | | | | | | 621,151 | |
9.250%, Due 4/1/2029A | | | | 440,000 | | | | | | | | | | 457,634 | |
| | | | | | | | | | | | | | | |
| | | | | | | | | | | | | | 2,008,339 | |
| | | | | | | | | | | | | | | |
| | | | | | | | | | | | | | | |
| | | |
| REITS - 0.31% | | | | | | |
| Digital Euro Finco LLC, 1.125%, Due 4/9/2028B | | | EUR | 200,000 | | | | | | | | | | 193,180 | |
| Equinix Europe 2 Financing Corp. LLC, 5.500%, Due 6/15/2034 | | | | 255,000 | | | | | | | | | | 255,296 | |
| Equinix, Inc., 3.900%, Due 4/15/2032 | | | | 300,000 | | | | | | | | | | 273,459 | |
| | | | | | | | | | | | | | | |
| | | | | | | | | | | | | | 721,935 | |
| | | | | | | | | | | | | | | |
| | | | | | | | | | | | | | | |
Total Financial | | | | | | | | | | | | | | 2,730,274 | |
| | | | | | | | | | | | | | | |
| | | | | | | | | | | | | | | |
| | | |
| Industrial - 0.30% | | | | | | |
| | | |
| Aerospace/Defense - 0.30% | | | | | | |
| Howmet Aerospace, Inc., | | | | | | | | | | | | | | | |
5.900%, Due 2/1/2027 | | | | 400,000 | | | | | | | | | | 405,426 | |
3.000%, Due 1/15/2029 | | | | 300,000 | | | | | | | | | | 272,369 | |
| | | | | | | | | | | | | | | |
| | | | | | | | | | | | | | 677,795 | |
| | | | | | | | | | | | | | | |
| | | | | | | | | | | | | | | |
Total Industrial | | | | | | | | | | | | | | 677,795 | |
| | | | | | | | | | | | | | | |
| | | | | | | | | | | | | | | |
| | | |
| Technology - 0.50% | | | | | | |
| | | |
| Software - 0.50% | | | | | | |
| Fidelity National Information Services, Inc., 1.500%, Due 5/21/2027 | | | EUR | 500,000 | | | | | | | | | | 505,205 | |
| MSCI, Inc., | | | | | | | | | | | | | | | |
3.875%, Due 2/15/2031A | | | | 450,000 | | | | | | | | | | 405,244 | |
3.250%, Due 8/15/2033A | | | | 300,000 | | | | | | | | | | 247,789 | |
| | | | | | | | | | | | | | | |
| | | | | | | | | | | | | | 1,158,238 | |
| | | | | | | | | | | | | | | |
| | | | | | | | | | | | | | | |
Total Technology | | | | | | | | | | | | | | 1,158,238 | |
| | | | | | | | | | | | | | | |
| | | | | | | | | | | | | | | |
Total Corporate Obligations (Cost $16,383,722) | | | | | | | | | | | | | | 16,444,830 | |
| | | | | | | | | | | | | | | |
| | | | | | | | | | | | | | | |
See accompanying notes
12
American Beacon TwentyFour Strategic Income FundSM
Schedule of Investments
June 30, 2024
| | | | | | | | | | | | | | | |
| | | |
| | | Principal Amount* | | | | Fair Value |
| | | | | | | |
| | | |
| FOREIGN CORPORATE OBLIGATIONS - 44.71% | | | | | | |
| | | |
| Basic Materials - 0.50% | | | | | | |
| | | |
| Chemicals - 0.50% | | | | | | |
| Sociedad Quimica y Minera de Chile SA, | | | | | | | | | | | | | | | |
6.500%, Due 11/7/2033A | | | $ | 200,000 | | | | | | | | | $ | 208,969 | |
6.500%, Due 11/7/2033B | | | | 400,000 | | | | | | | | | | 417,938 | |
| UPL Corp. Ltd., 4.625%, Due 6/16/2030B | | | | 630,000 | | | | | | | | | | 518,962 | |
| | | | | | | | | | | | | | | |
| | | | | | | | | | | | | | 1,145,869 | |
| | | | | | | | | | | | | | | |
| | | | | | | | | | | | | | | |
Total Basic Materials | | | | | | | | | | | | | | 1,145,869 | |
| | | | | | | | | | | | | | | |
| | | | | | | | | | | | | | | |
| | | |
| Communications - 1.50% | | | | | | |
| | | |
| Media - 0.30% | | | | | | |
| Virgin Media Secured Finance PLC, 5.250%, Due 5/15/2029A | | | GBP | 600,000 | | | | | | | | | | 688,764 | |
| | | | | | | | | | | | | | | |
| | | | | | | | | | | | | | | |
| | | |
| Telecommunications - 1.20% | | | | | | |
| Altice France SA, 5.500%, Due 1/15/2028A | | | | 200,000 | | | | | | | | | | 136,755 | |
| Network i2i Ltd., 3.975%, Due 3/3/2026, (5 yr. CMT + 3.390%)A C D | | | | 300,000 | | | | | | | | | | 284,080 | |
| Orange SA, 3.625%, Due 11/16/2031B | | | EUR | 400,000 | | | | | | | | | | 431,581 | |
| Sable International Finance Ltd., 5.750%, Due 9/7/2027A | | | | 386,000 | | | | | | | | | | 370,543 | |
| Telefonica Europe BV, 6.750%, Due 6/7/2031, (8 yr. EUR Swap + 3.615%)B C D | | | EUR | 400,000 | | | | | | | | | | 464,775 | |
| Vodafone Group PLC, | | | | | | | | | | | | | | | |
4.875%, Due 10/3/2078, (5 yr. GBP Swap + 3.267%)B C | | | GBP | 600,000 | | | | | | | | | | 745,566 | |
8.000%, Due 8/30/2086, (5 yr. U.K. Government Bond + 3.837%)B C | | | GBP | 250,000 | | | | | | | | | | 338,777 | |
| | | | | | | | | | | | | | | |
| | | | | | | | | | | | | | 2,772,077 | |
| | | | | | | | | | | | | | | |
| | | | | | | | | | | | | | | |
Total Communications | | | | | | | | | | | | | | 3,460,841 | |
| | | | | | | | | | | | | | | |
| | | | | | | | | | | | | | | |
| | | |
| Consumer, Cyclical - 2.14% | | | | | | |
| | | |
| Auto Manufacturers - 0.59% | | | | | | |
| Jaguar Land Rover Automotive PLC, 4.500%, Due 7/15/2028A | | | EUR | 300,000 | | | | | | | | | | 320,643 | |
| Volkswagen International Finance NV, | | | | | | | | | | | | | | | |
3.875%, Due 6/14/2027, (10 yr. EUR Swap + 3.370%)B C D | | | EUR | 400,000 | | | | | | | | | | 412,851 | |
4.625%, Due 6/27/2028, (10 yr. EUR Swap + 3.982%)B C D | | | EUR | 600,000 | | | | | | | | | | 629,727 | |
| | | | | | | | | | | | | | | |
| | | | | | | | | | | | | | 1,363,221 | |
| | | | | | | | | | | | | | | |
| | | | | | | | | | | | | | | |
| | | |
| Auto Parts & Equipment - 0.08% | | | | | | |
| Nemak SAB de CV, 2.250%, Due 7/20/2028B | | | EUR | 200,000 | | | | | | | | | | 188,588 | |
| | | | | | | | | | | | | | | |
| | | | | | | | | | | | | | | |
| | | |
| Entertainment - 0.54% | | | | | | |
| CPUK Finance Ltd., 5.876%, Due 8/28/2027B | | | GBP | 600,000 | | | | | | | | | | 760,412 | |
| Inter Media & Communication SpA, 6.750%, Due 2/9/2027B | | | EUR | 450,000 | | | | | | | | | | 474,699 | |
| | | | | | | | | | | | | | | |
| | | | | | | | | | | | | | 1,235,111 | |
| | | | | | | | | | | | | | | |
| | | | | | | | | | | | | | | |
| | | |
| Home Builders - 0.31% | | | | | | |
| Maison Finco PLC, 6.000%, Due 10/31/2027A | | | GBP | 600,000 | | | | | | | | | | 704,988 | |
| | | | | | | | | | | | | | | |
| | | | | | | | | | | | | | | |
| | | |
| Leisure Time - 0.13% | | | | | | |
| Pinnacle Bidco PLC, 10.000%, Due 10/11/2028B | | | GBP | 230,000 | | | | | | | | | | 308,551 | |
| | | | | | | | | | | | | | | |
| | | | | | | | | | | | | | | |
| | | |
| Retail - 0.49% | | | | | | |
| 1011778 BC ULC/New Red Finance, Inc., | | | | | | | | | | | | | | | |
3.500%, Due 2/15/2029A | | | | 375,000 | | | | | | | | | | 340,478 | |
6.125%, Due 6/15/2029A | | | | 425,000 | | | | | | | | | | 427,157 | |
| Punch Finance PLC, | | | | | | | | | | | | | | | |
6.125%, Due 6/30/2026B | | | GBP | 200,000 | | | | | | | | | | 248,294 | |
6.125%, Due 6/30/2026A | | | GBP | 100,000 | | | | | | | | | | 124,147 | |
| | | | | | | | | | | | | | | |
| | | | | | | | | | | | | | 1,140,076 | |
| | | | | | | | | | | | | | | |
| | | | | | | | | | | | | | | |
Total Consumer, Cyclical | | | | | | | | | | | | | | 4,940,535 | |
| | | | | | | | | | | | | | | |
| | | | | | | | | | | | | | | |
See accompanying notes
13
American Beacon TwentyFour Strategic Income FundSM
Schedule of Investments
June 30, 2024
| | | | | | | | | | | | | | | |
| | | |
| | | Principal Amount* | | | | Fair Value |
| | | | | | | |
| | | |
| FOREIGN CORPORATE OBLIGATIONS - 44.71% (continued) | | | | | | |
| | | |
| Consumer, Non-Cyclical - 1.73% | | | | | | |
| | | |
| Commercial Services - 0.69% | | | | | | |
| AA Bond Co. Ltd., 6.500%, Due 1/31/2026A | | | GBP | 470,000 | | | | | | | | | $ | 589,671 | |
| House of HR Group BV, 9.000%, Due 11/3/2029B | | | EUR | 300,000 | | | | | | | | | | 337,391 | |
| La Financiere Atalian SASU, 8.500%, Due 6/30/2028, Cash (3.500%) or PIK (in-kind rate 5.000%)A | | | EUR | 135,430 | | | | | | | | | | 85,210 | |
| RAC Bond Co. PLC, 5.250%, Due 11/4/2046A | | | GBP | 500,000 | | | | | | | | | | 592,640 | |
| | | | | | | | | | | | | | | |
| | | | | | | | | | | | | | 1,604,912 | |
| | | | | | | | | | | | | | | |
| | | | | | | | | | | | | | | |
| | | |
| Food - 0.83% | | | | | | |
| Bellis Acquisition Co. PLC, 4.500%, Due 2/16/2026A | | | GBP | 200,000 | | | | | | | | | | 249,481 | |
| Bimbo Bakeries USA, Inc., 6.050%, Due 1/15/2029A | | | $ | 400,000 | | | | | | | | | | 411,372 | |
| La Doria SpA, 8.328%, Due 11/12/2029, (3 mo. EUR EURIBOR + 4.500%)B C | | | EUR | 350,000 | | | | | | | | | | 381,392 | |
| Tesco Corporate Treasury Services PLC, 5.500%, Due 2/27/2035B | | | GBP | 700,000 | | | | | | | | | | 877,194 | |
| | | | | | | | | | | | | | | |
| | | | | | | | | | | | | | 1,919,439 | |
| | | | | | | | | | | | | | | |
| | | | | | | | | | | | | | | |
| | | |
| Pharmaceuticals - 0.13% | | | | | | |
| Cheplapharm Arzneimittel GmbH, 5.500%, Due 1/15/2028A | | | | 325,000 | | | | | | | | | | 300,655 | |
| | | | | | | | | | | | | | | |
| | | | | | | | | | | | | | | |
| | | |
| Private Placement - 0.08% | | | | | | |
| GTCR W-2 Merger Sub LLC/GTCR W Dutch Finance Sub BV 8.500%, Due 1/15/2031A | | | GBP | 130,000 | | | | | | | | | | 176,091 | |
| | | | | | | | | | | | | | | |
| | | | | | | | | | | | | | | |
Total Consumer, Non-Cyclical | | | | | | | | | | | | | | 4,001,097 | |
| | | | | | | | | | | | | | | |
| | | | | | | | | | | | | | | |
| | | |
| Energy - 0.20% | | | | | | |
| | | |
| Oil & Gas - 0.20% | | | | | | |
| Guara Norte SARL, 5.198%, Due 6/15/2034A | | | | 496,890 | | | | | | | | | | 457,805 | |
| | | | | | | | | | | | | | | |
| | | | | | | | | | | | | | | |
| | | |
| Financial - 36.62% | | | | | | |
| | | |
| Banks - 23.47% | | | | | | |
| Abanca Corp. Bancaria SA, | | | | | | | | | | | | | | | |
6.000%, Due 1/20/2026, (5 yr. EUR Swap + 6.570%)B C D | | | EUR | 600,000 | | | | | | | | | | 628,229 | |
10.625%, Due 7/14/2028, (5 yr. EUR Swap + 7.643%)B C D | | | EUR | 400,000 | | | | | | | | | | 476,037 | |
| ABN AMRO Bank NV, 6.875%, Due 9/22/2031, (5 yr. EUR Swap + 4.239%)B C D | | | EUR | 500,000 | | | | | | | | | | 542,040 | |
| AIB Group PLC, | | | | | | | | | | | | | | | |
6.250%, Due 6/23/2025, (5 yr. EUR Swap + 6.629%)B C D | | | EUR | 1,000,000 | | | | | | | | | | 1,070,549 | |
2.875%, Due 5/30/2031, (5 yr. EUR Swap + 3.300%)B C | | | EUR | 600,000 | | | | | | | | | | 622,914 | |
| Banco Bilbao Vizcaya Argentaria SA, 8.250%, Due 11/30/2033, (5 yr. U.K. Government Bond + 3.600%)B C | | | GBP | 1,000,000 | | | | | | | | | | 1,346,064 | |
| Banco de Sabadell SA, | | | | | | | | | | | | | | | |
5.750%, Due 3/15/2026, (5 yr. EUR Swap + 6.198%)B C D | | | EUR | 1,800,000 | | | | | | | | | | 1,881,928 | |
5.000%, Due 5/19/2027, (5 yr. EUR Swap + 5.171%)B C D | | | EUR | 600,000 | | | | | | | | | | 599,197 | |
| Banco Mercantil del Norte SA, | | | | | | | | | | | | | | | |
6.750%, Due 9/27/2024, (5 yr. CMT + 4.967%)B C D | | | | 200,000 | | | | | | | | | | 198,936 | |
8.375%, Due 10/14/2030, (10 yr. CMT + 7.760%)B C D | | | | 300,000 | | | | | | | | | | 301,914 | |
| Banco Santander SA, | | | | | | | | | | | | | | | |
4.375%, Due 1/14/2026, (5 yr. EUR Swap + 4.534%)B C D | | | EUR | 1,000,000 | | | | | | | | | | 1,026,110 | |
4.750%, Due 11/12/2026, (5 yr. CMT + 3.753%)C D | | | | 800,000 | | | | | | | | | | 715,080 | |
4.125%, Due 11/12/2027, (5 yr. EUR Swap + 4.311%)C D | | | EUR | 400,000 | | | | | | | | | | 385,007 | |
5.750%, Due 8/23/2033, (5 yr. EUR Swap + 2.850%)B C | | | EUR | 600,000 | | | | | | | | | | 670,111 | |
| Bank of Ireland Group PLC, | | | | | | | | | | | | | | | |
7.500%, Due 5/19/2025, (5 yr. EUR Swap + 7.924%)B C D | | | EUR | 700,000 | | | | | | | | | | 761,847 | |
6.750%, Due 3/1/2033, (5 yr. EUR Swap + 4.150%)B C | | | EUR | 240,000 | | | | | | | | | | 275,612 | |
| Barclays PLC, | | | | | | | | | | | | | | | |
6.375%, Due 12/15/2025, (5 yr. U.K. Government Bond + 6.016%)B C D | | | GBP | 1,240,000 | | | | | | | | | | 1,524,965 | |
4.375%, Due 3/15/2028, (5 yr. CMT + 3.410%)C D | | | | 1,530,000 | | | | | | | | | | 1,284,690 | |
9.250%, Due 9/15/2028, (5 yr. GBP Swap + 5.639%)C D | | | GBP | 1,100,000 | | | | | | | | | | 1,441,611 | |
| BAWAG Group AG, | | | | | | | | | | | | | | | |
5.000%, Due 5/14/2025, (5 yr. EUR Swap + 4.415%)B C D | | | EUR | 400,000 | | | | | | | | | | 414,458 | |
5.125%, Due 10/1/2025, (5 yr. EUR Swap + 5.546%)B C D | | | EUR | 1,000,000 | | | | | | | | | | 1,046,805 | |
See accompanying notes
14
American Beacon TwentyFour Strategic Income FundSM
Schedule of Investments
June 30, 2024
| | | | | | | | | | | | | | | |
| | | |
| | | Principal Amount* | | | | Fair Value |
| | | | | | | |
| | | |
| FOREIGN CORPORATE OBLIGATIONS - 44.71% (continued) | | | | | | |
| | | |
| Financial - 36.62% (continued) | | | | | | |
| | | |
| Banks - 23.47% (continued) | | | | | | |
| BBVA Bancomer SA, | | | | | | | | | | | | | | | |
5.125%, Due 1/18/2033, (5 yr. CMT + 2.650%)B C | | | $ | 200,000 | | | | | | | | | $ | 182,242 | |
5.875%, Due 9/13/2034, (5 yr. CMT + 4.308%)B C | | | | 400,000 | | | | | | | | | | 370,850 | |
| Belfius Bank SA, 3.625%, Due 4/16/2025, (5 yr. EUR Swap + 2.938%)B C D | | | EUR | 1,000,000 | | | | | | | | | | 1,018,233 | |
| BNP Paribas SA, | | | | | | | | | | | | | | | |
7.750%, Due 8/16/2029, (5 yr. CMT + 4.899%)B C D | | | | 1,000,000 | | | | | | | | | | 1,008,779 | |
6.875%, Due 12/6/2029, (5 yr. EUR Swap + 4.645%)B C D | | | EUR | 800,000 | | | | | | | | | | 872,825 | |
2.588%, Due 8/12/2035, (5 yr. CMT + 2.050%)B C | | | | 800,000 | | | | | | | | | | 654,589 | |
| CaixaBank SA, | | | | | | | | | | | | | | | |
3.625%, Due 9/14/2028, (5 yr. EUR Swap + 3.857%)B C D | | | EUR | 1,000,000 | | | | | | | | | | 894,244 | |
7.500%, Due 1/16/2030, (5 yr. EURIBOR ICE Swap + 5.295%)B C D | | | EUR | 400,000 | | | | | | | | | | 445,515 | |
6.250%, Due 2/23/2033, (5 yr. EUR Swap + 3.550%)B C | | | EUR | 300,000 | | | | | | | | | | 337,978 | |
| Commerzbank AG, 6.500%, Due 12/6/2032, (5 yr. EURIBOR ICE Swap + 4.300%)B C | | | EUR | 500,000 | | | | | | | | | | 565,249 | |
| Cooperatieve Rabobank UA, 4.875%, Due 6/29/2029, (5 yr. EUR Swap + 3.717%)B C D | | | EUR | 1,000,000 | | | | | | | | | | 1,002,683 | |
| Credit Agricole SA, | | | | | | | | | | | | | | | |
7.500%, Due 6/23/2026, (5 yr. GBP SONIA Linked ICE Swap + 4.812%)A C D | | | GBP | 800,000 | | | | | | | | | | 1,003,695 | |
1.874%, Due 12/9/2031, ( 5 yr. U.K. Government Bond + 1.500%)B C | | | GBP | 300,000 | | | | | | | | | | 343,632 | |
| Danske Bank AS, 4.375%, Due 5/18/2026, (5 yr. CMT + 3.387%)B C D | | | | 1,150,000 | | | | | | | | | | 1,073,320 | |
| Deutsche Bank AG, 6.750%, Due 10/30/2028, (5 yr. EURIBOR ICE Swap + 5.692%)B C D | | | EUR | 1,000,000 | | | | | | | | | | 1,030,276 | |
| Deutsche Pfandbriefbank AG, | | | | | | | | | | | | | | | |
4.600%, Due 2/22/2027B | | | EUR | 200,000 | | | | | | | | | | 157,430 | |
8.474%, Due 4/28/2028, Series 3529, (5 yr. EURIBOR ICE Swap + 5.383%)B C D | | | EUR | 400,000 | | | | | | | | | | 254,026 | |
| Erste Group Bank AG, 4.250%, Due 10/15/2027, (5 yr. EUR Swap + 4.646%)B C D | | | EUR | 1,400,000 | | | | | | | | | | 1,353,146 | |
| HSBC Holdings PLC, | | | | | | | | | | | | | | | |
5.875%, Due 9/28/2026, (5 yr. GBP Swap + 4.276%)C D | | | GBP | 1,319,000 | | | | | | | | | | 1,608,990 | |
6.364%, Due 11/16/2032, (5 yr. EUR Swap + 3.300%)B C | | | EUR | 500,000 | | | | | | | | | | 567,745 | |
| ING Groep NV, 3.875%, Due 5/16/2027, (5 yr. CMT + 2.862%)C D | | | | 1,900,000 | | | | | | | | | | 1,605,065 | |
| Intesa Sanpaolo SpA, | | | | | | | | | | | | | | | |
5.875%, Due 9/1/2031, (5 yr. EUR Swap + 6.086%)B C D | | | EUR | 1,100,000 | | | | | | | | | | 1,125,033 | |
8.505%, Due 9/20/2032B | | | GBP | 1,191,000 | | | | | | | | | | 1,627,899 | |
| Investec PLC, | | | | | | | | | | | | | | | |
10.500%, Due 8/28/2029, (5 yr. U.K. Government Bond + 6.566%)B C D | | | GBP | 800,000 | | | | | | | | | | 1,065,281 | |
9.125%, Due 3/6/2033, (5 yr. U.K. Government Bond + 5.905%)B C | | | GBP | 700,000 | | | | | | | | | | 939,555 | |
| Jyske Bank AS, 5.125%, Due 5/1/2035, (5 yr. EURIBOR ICE Swap + 2.500%)B C | | | EUR | 800,000 | | | | | | | | | | 874,448 | |
| Lloyds Banking Group PLC, | | | | | | | | | | | | | | | |
7.875%, Due 6/27/2029, (5 yr. GBP SONIA Linked ICE Swap + 5.107%)B C D | | | GBP | 1,000,000 | | | | | | | | | | 1,266,451 | |
2.707%, Due 12/3/2035, (5 yr. U.K. Government Bond + 2.400%)B C | | | GBP | 800,000 | | | | | | | | | | 822,824 | |
| NatWest Group PLC, | | | | | | | | | | | | | | | |
5.125%, Due 5/12/2027, (5 yr. U.K. Government Bond + 4.985%)C D | | | GBP | 200,000 | | | | | | | | | | 234,490 | |
4.500%, Due 3/31/2028, (5 yr. U.K. Government Bond + 3.992%)C D | | | GBP | 1,900,000 | | | | | | | | | | 2,115,207 | |
| Paragon Banking Group PLC, 4.375%, Due 9/25/2031, (5 yr. U.K. Government Bond + 3.956%)B C | | | GBP | 500,000 | | | | | | | | | | 594,917 | |
| Shawbrook Group PLC, 12.250%, Due 1/4/2034, (5 yr. U.K. Government Bond + 7.948%)B C | | | GBP | 600,000 | | | | | | | | | | 785,006 | |
| Societe Generale SA, | | | | | | | | | | | | | | | |
6.750%, Due 4/6/2028, (5 yr. USD Swap + 3.929%)B C D | | | | 1,000,000 | | | | | | | | | | 894,297 | |
5.375%, Due 11/18/2030, (5 yr. CMT + 4.514%)A C D | | | | 1,330,000 | | | | | | | | | | 1,071,526 | |
6.691%, Due 1/10/2034, (1 yr. CMT + 2.950%)B C | | | | 400,000 | | | | | | | | | | 413,554 | |
| Standard Chartered PLC, | | | | | | | | | | | | | | | |
7.750%, Due 8/15/2027, (5 yr. CMT + 4.976%)B C D | | | | 800,000 | | | | | | | | | | 807,907 | |
4.300%, Due 8/19/2028, (5 Yr. CMT + 3.135%)B C D | | | | 600,000 | | | | | | | | | | 500,722 | |
| Svenska Handelsbanken AB, 4.625%, Due 8/23/2032, (5 yr. U.K. Government Bond + 2.800%)B C | | | GBP | 600,000 | | | | | | | | | | 728,678 | |
| Swedbank AB, 4.000%, Due 3/17/2029, (5 yr. CMT + 2.864%)B C D | | | | 800,000 | | | | | | | | | | 664,400 | |
| Unicaja Banco SA, 3.125%, Due 7/19/2032, (5 yr. EUR Swap + 3.050%)B C | | | EUR | 700,000 | | | | | | | | | | 702,541 | |
| UniCredit SpA, 3.875%, Due 6/3/2027, (5 yr. EURIBOR ICE Swap + 4.081%)B C D | | | EUR | 1,600,000 | | | | | | | | | | 1,539,814 | |
| Virgin Money U.K. PLC, 8.250%, Due 6/17/2027, (5 yr. U.K. Government Bond + 6.357%)B C D | | | GBP | 1,402,000 | | | | | | | | | | 1,781,129 | |
| | | | | | | | | | | | | | | |
| | | | | | | | | | | | | | 54,120,295 | |
| | | | | | | | | | | | | | | |
| | | | | | | | | | | | | | | |
See accompanying notes
15
American Beacon TwentyFour Strategic Income FundSM
Schedule of Investments
June 30, 2024
| | | | | | | | | | | | | | | |
| | | |
| | | Principal Amount* | | | | Fair Value |
| | | | | | | |
| | | |
| FOREIGN CORPORATE OBLIGATIONS - 44.71% (continued) | | | | | | |
| | | |
| Financial - 36.62% (continued) | | | | | | |
| | | |
| Diversified Financial Services - 1.46% | | | | | | |
| Bracken MidCo1 PLC, 6.750%, Due 11/1/2027, Cash (6.750%) or PIK (in-kind rate 7.500%)A | | | GBP | 500,000 | | | | | | | | | $ | 592,547 | |
| Jerrold Finco PLC, | | | | | | | | | | | | | | | |
5.250%, Due 1/15/2027B | | | GBP | 530,000 | | | | | | | | | | 649,874 | |
7.875%, Due 4/15/2030A | | | GBP | 350,000 | | | | | | | | | | 443,541 | |
| OSB Group PLC, 6.000%, Due 10/7/2026, (5 yr. U.K. Government Bond + 5.393%)B C D | | | GBP | 1,049,000 | | | | | | | | | | 1,151,997 | |
| Sherwood Financing PLC, 6.000%, Due 11/15/2026A | | | GBP | 500,000 | | | | | | | | | | 536,294 | |
| | | | | | | | | | | | | | | |
| | | | | | | | | | | | | | 3,374,253 | |
| | | | | | | | | | | | | | | |
| | | | | | | | | | | | | | | |
| | | |
| Insurance - 9.85% | | | | | | |
| Achmea BV, 4.625%, Due 3/24/2029, (5 yr. EURIBOR ICE Swap + 4.780%)B C D | | | EUR | 1,400,000 | | | | | | | | | | 1,352,975 | |
| Aegon Ltd., 5.625%, Due 4/15/2029, (5 yr. EUR Swap + 5.207%)B C D | | | EUR | 900,000 | | | | | | | | | | 930,107 | |
| AG Insurance SA, 3.500%, Due 6/30/2047, (5 yr. EUR Swap + 3.875%)B C | | | EUR | 400,000 | | | | | | | | | | 417,641 | |
| ASR Nederland NV, 4.625%, Due 10/19/2027, (5 yr. EUR Swap + 3.789%)B C D | | | EUR | 750,000 | | | | | | | | | | 740,643 | |
| Athora Netherlands NV, 7.000%, Due 6/19/2025, (5 yr. EUR Swap + 6.463%)B C D | | | EUR | 900,000 | | | | | | | | | | 964,992 | |
| Aviva PLC, 6.875%, Due 12/15/2031, (5 yr. U.K. Government Bond + 4.649%)B C D | | | GBP | 700,000 | | | | | | | | | | 837,308 | |
| BUPA Finance PLC, | | | | | | | | | | | | | | | |
5.000%, Due 12/8/2026B | | | GBP | 350,000 | | | | | | | | | | 434,090 | |
4.000%, Due 9/24/2031, (5 yr. U.K. Government Bond + 3.170%)B C D | | | GBP | 1,056,000 | | | | | | | | | | 967,795 | |
| CNP Assurances SACA, 2.500%, Due 6/30/2051, (3 mo. EUR EURIBOR + 3.650%)B C | | | EUR | 500,000 | | | | | | | | | | 465,151 | |
| Direct Line Insurance Group PLC, 4.750%, Due 12/7/2027, (5 yr. GBP SONIA Linked ICE Swap + 3.394%)B C D | | | GBP | 1,160,000 | | | | | | | | | | 1,231,738 | |
| Galaxy Bidco Ltd., 6.500%, Due 7/31/2026B | | | GBP | 240,000 | | | | | | | | | | 298,833 | |
| La Mondiale SAM, | | | | | | | | | | | | | | | |
4.375%, Due 4/24/2029, (5 yr. EUR Swap + 4.411%)B C D | | | EUR | 700,000 | | | | | | | | | | 700,740 | |
4.800%, Due 1/18/2048, (5 yr. CMT + 3.235%)B C | | | $ | 800,000 | | | | | | | | | | 741,806 | |
| Legal & General Group PLC, 5.625%, Due 3/24/2031, (5 yr. U.K. Government Bond + 5.378%)B C D | | | GBP | 1,000,000 | | | | | | | | | | 1,123,468 | |
Mutuelle Assurance Des Commercants et Industriels de France et Des Cadres et Sal,
3.500%, Due 12/21/2028, (5 yr. EUR Swap + 3.592%)B C D | | | EUR | 600,000 | | | | | | | | | | 526,789 | |
| Pension Insurance Corp. PLC, | | | | | | | | | | | | | | | |
7.375%, Due 7/25/2029, (5 yr. U.K. Government Bond + 6.658%)C D | | | GBP | 1,664,000 | | | | | | | | | | 2,032,364 | |
4.625%, Due 5/7/2031B | | | GBP | 750,000 | | | | | | | | | | 843,517 | |
| Phoenix Group Holdings PLC, 5.750%, Due 4/26/2028, (5 yr. U.K. Government Bond + 4.170%)B C D | | | GBP | 2,200,000 | | | | | | | | | | 2,502,917 | |
| QBE Insurance Group Ltd., 5.250%, Due 5/16/2025, (5 yr. CMT + 3.047%)B C D | | | | 1,000,000 | | | | | | | | | | 979,933 | |
| Real Finance Bonds No. 6 PLC, 10.125%, Due 5/25/2033, (5 yr. U.K. Government Bond + 6.344%)B C D | | | GBP | 900,000 | | | | | | | | | | 1,237,954 | |
| Rothesay Life PLC, | | | | | | | | | | | | | | | |
6.875%, Due 9/12/2028, (5 yr. U.K. Government Bond + 5.419%)B C D | | | GBP | 300,000 | | | | | | | | | | 357,121 | |
5.000%, Due 10/13/2031, (5 yr. U.K. Government Bond + 3.873%)B C D | | | GBP | 2,200,000 | | | | | | | | | | 2,130,608 | |
| UnipolSai Assicurazioni SpA, 6.375%, Due 4/27/2030, (5 yr. EUR Swap + 6.744%)B C D | | | EUR | 840,000 | | | | | | | | | | 899,562 | |
| | | | | | | | | | | | | | | |
| | | | | | | | | | | | | | 22,718,052 | |
| | | | | | | | | | | | | | | |
| | | | | | | | | | | | | | | |
| | | |
| Savings & Loans - 1.84% | | | | | | |
| Nationwide Building Society, | | | | | | | | | | | | | | | |
5.750%, Due 6/20/2027, (5 yr. U.K. Government Bond + 5.625%)B C D | | | GBP | 1,300,000 | | | | | | | | | | 1,544,729 | |
10.250%, Due 12/6/2049 | | | GBP | 1,636,700 | | | | | | | | | | 2,699,982 | |
| | | | | | | | | | | | | | | |
| | | | | | | | | | | | | | 4,244,711 | |
| | | | | | | | | | | | | | | |
| | | | | | | | | | | | | | | |
Total Financial | | | | | | | | | | | | | | 84,457,311 | |
| | | | | | | | | | | | | | | |
| | | | | | | | | | | | | | | |
| | | |
| Industrial - 0.72% | | | | | | |
| | | |
| Aerospace/Defense - 0.18% | | | | | | |
| Rolls-Royce PLC, | | | | | | | | | | | | | | | |
4.625%, Due 2/16/2026B | | | EUR | 200,000 | | | | | | | | | | 215,904 | |
1.625%, Due 5/9/2028B | | | EUR | 200,000 | | | | | | | | | | 195,770 | |
| | | | | | | | | | | | | | | |
| | | | | | | | | | | | | | 411,674 | |
| | | | | | | | | | | | | | | |
| | | | | | | | | | | | | | | |
See accompanying notes
16
American Beacon TwentyFour Strategic Income FundSM
Schedule of Investments
June 30, 2024
| | | | | | | | | | | | | | | |
| | | |
| | | Principal Amount* | | | | Fair Value |
| | | | | | | |
| | | |
| FOREIGN CORPORATE OBLIGATIONS - 44.71% (continued) | | | | | | |
| | | |
| Industrial - 0.72% (continued) | | | | | | |
| | | |
| Machinery - Construction & Mining - 0.14% | | | | | | |
| Siemens Energy Finance BV, 4.000%, Due 4/5/2026B | | | EUR | 300,000 | | | | | | | | | $ | 321,293 | |
| | | | | | | | | | | | | | | |
| | | | | | | | | | | | | | | |
| | | |
| Transportation - 0.40% | | | | | | |
| Mobico Group PLC, 4.250%, Due 11/26/2025, (5 yr. U.K. Government Bond + 4.135%)B C D | | | GBP | 455,000 | | | | | | | | | | 520,616 | |
| Zenith Finco PLC, 6.500%, Due 6/30/2027A | | | GBP | 500,000 | | | | | | | | | | 415,573 | |
| | | | | | | | | | | | | | | |
| | | | | | | | | | | | | | 936,189 | |
| | | | | | | | | | | | | | | |
| | | | | | | | | | | | | | | |
Total Industrial | | | | | | | | | | | | | | 1,669,156 | |
| | | | | | | | | | | | | | | |
| | | | | | | | | | | | | | | |
| | | |
| Utilities - 1.30% | | | | | | |
| | | |
| Electric - 0.86% | | | | | | |
| ContourGlobal Power Holdings SA, | | | | | | | | | | | | | | | |
2.750%, Due 1/1/2026B | | | EUR | 300,000 | | | | | | | | | | 310,182 | |
3.125%, Due 1/1/2028A | | | EUR | 200,000 | | | | | | | | | | 197,589 | |
| ESB Finance DAC, 2.125%, Due 11/5/2033B | | | EUR | 500,000 | | | | | | | | | | 470,181 | |
| National Grid Electricity Distribution West Midlands PLC, 3.875%, Due 10/17/2024B | | | GBP | 700,000 | | | | | | | | | | 880,560 | |
| NGG Finance PLC, 5.625%, Due 6/18/2073, (12 yr. GBP Swap + 3.480%)B C | | | GBP | 100,000 | | | | | | | | | | 125,620 | |
| | | | | | | | | | | | | | | |
| | | | | | | | | | | | | | 1,984,132 | |
| | | | | | | | | | | | | | | |
| | | | | | | | | | | | | | | |
| | | |
| Gas - 0.32% | | | | | | |
| APA Infrastructure Ltd., 0.750%, Due 3/15/2029B | | | EUR | 800,000 | | | | | | | | | | 744,645 | |
| | | | | | | | | | | | | | | |
| | | | | | | | | | | | | | | |
| | | |
| Water - 0.12% | | | | | | |
| Severn Trent Utilities Finance PLC, 6.250%, Due 6/7/2029B | | | GBP | 200,000 | | | | | | | | | | 262,675 | |
| | | | | | | | | | | | | | | |
| | | | | | | | | | | | | | | |
Total Utilities | | | | | | | | | | | | | | 2,991,452 | |
| | | | | | | | | | | | | | | |
| | | | | | | | | | | | | | | |
Total Foreign Corporate Obligations (Cost $107,192,424) | | | | | | | | | | | | | | 103,124,066 | |
| | | | | | | | | | | | | | | |
| | | | | | | | | | | | | | | |
| | | |
| FOREIGN SOVEREIGN OBLIGATIONS - 10.97% | | | | | | |
| BBVA Bancomer SA, 8.125%, Due 1/8/2039, (5 yr. CMT + 4.214%)A C | | | $ | 700,000 | | | | | | | | | | 710,114 | |
| Bundesrepublik Deutschland Bundesanleihe, 2.200%, Due 2/15/2034, Series 10YB | | | EUR | 23,530,000 | | | | | | | | | | 24,601,330 | |
| | | | | | | | | | | | | | | |
| | | | | | | | | | | | | | | |
Total Foreign Sovereign Obligations (Cost $25,522,315) | | | | | | | | | | | | | | 25,311,444 | |
| | | | | | | | | | | | | | | |
| | | | | | | | | | | | | | | |
| | | |
| ASSET-BACKED OBLIGATIONS - 18.16% | | | | | | |
| Aqueduct European CLO 8 DAC, 10.334%, Due 7/15/2037, 2024-8A E, (3 mo. EUR EURIBOR + 6.590%)A C | | | EUR | 1,500,000 | | | | | | | | | | 1,603,966 | |
| Armada Euro CLO IV DAC, 13.006%, Due 7/15/2033, 4X F, (3 mo. EUR EURIBOR + 9.100%)B C | | | EUR | 700,000 | | | | | | | | | | 746,551 | |
| Capital Four CLO I DAC, 4.926%, Due 10/15/2034, 3A A, (3 mo. EUR EURIBOR + 1.020%)A C | | | EUR | 600,000 | | | | | | | | | | 640,617 | |
| Carlyle Global Market Strategies Euro CLO DAC, 8.586%, Due 5/17/2031, 2016 1A DR, (3 mo. EUR EURIBOR + 4.770%)A C | | | EUR | 500,000 | | | | | | | | | | 528,670 | |
| Contego CLO X DAC, 5.290%, Due 5/15/2038, 10A AR, (3 mo. EUR EURIBOR + 1.490%)A C | | | EUR | 2,600,000 | | | | | | | | | | 2,784,471 | |
| Cumulus Static CLO DAC, 5.499%, Due 4/25/2033, 2023-1A A, (3 mo. EUR EURIBOR + 1.500%)A C | | | EUR | 500,000 | | | | | | | | | | 536,609 | |
| CVC Cordatus Loan Fund X DAC, 9.929%, Due 1/27/2031, 10A F, (3 mo. EUR EURIBOR + 6.050%)A C | | | EUR | 1,000,000 | | | | | | | | | | 1,015,038 | |
| CVC Cordatus Loan Fund XVII DAC, 9.946%, Due 11/18/2033, 17A ER, (3 mo. EUR EURIBOR + 6.120%)A C | | | EUR | 1,250,000 | | | | | | | | | | 1,338,581 | |
| Dryden 56 Euro CLO DAC, 10.356%, Due 1/15/2032, 2017 56A F, (3 mo. EUR EURIBOR + 6.450%)A C | | | EUR | 1,100,000 | | | | | | | | | | 1,104,791 | |
| Dryden 62 Euro CLO DAC, 8.756%, Due 7/15/2031, 2017 62X E, (3 mo. EUR EURIBOR + 4.850%)B C | | | EUR | 1,000,000 | | | | | | | | | | 1,034,622 | |
| Golub Capital Partners CLO 75B Ltd., 5.306%, Due 7/25/2037, 2024-75A E, (3 mo. USD Term SOFR + 5.900%)A C | | | | 1,000,000 | | | | | | | | | | 1,000,000 | |
| Harvest CLO XVI DAC, 9.476%, Due 10/15/2031, 16A ER, (3 mo. EUR EURIBOR + 5.570%)A C | | | EUR | 1,550,000 | | | | | | | | | | 1,644,823 | |
| Hayfin Emerald CLO I DAC, 6.988%, Due 4/17/2034, 1A DR, (3 mo. EUR EURIBOR + 3.100%)A C | | | EUR | 1,500,000 | | | | | | | | | | 1,513,388 | |
| ICG Euro CLO, 1.000%, Due 2/15/2037, 2024-1A E, (3 mo. EUR EURIBOR + 6.540%)A C | | | EUR | 1,500,000 | | | | | | | | | | 1,590,361 | |
| Jubilee CLO DAC, 10.475%, Due 7/21/2037, 2024-28A E, (3 mo. EUR EURIBOR + 6.780%)A C | | | EUR | 1,500,000 | | | | | | | | | | 1,607,798 | |
| OCP Euro CLO DAC, 5.284%, Due 4/20/2038, 2024-9A A, (3 mo. EUR EURIBOR + 1.480%)A C | | | EUR | 3,000,000 | | | | | | | | | | 3,222,599 | |
| Penta CLO 16 DAC, 10.710%, Due 10/18/2036, Series 2024-16A, Class E, (3 mo. EUR EURIBOR + 6.790%)A C | | | EUR | 1,500,000 | | | | | | | | | | 1,608,381 | |
See accompanying notes
17
American Beacon TwentyFour Strategic Income FundSM
Schedule of Investments
June 30, 2024
| | | | | | | | | | | | | | | |
| | | |
| | | Principal Amount* | | | | Fair Value |
| | | | | | | |
| | | |
| ASSET-BACKED OBLIGATIONS - 18.16% (continued) | | | | | | |
| Penta CLO 9 DAC, | | | | | | | | | | | | | | | |
9.922%, Due 7/25/2036, 2021 9A E, (3 mo. EUR EURIBOR + 6.040%)A C | | | EUR | 1,000,000 | | | | | | | | | $ | 1,061,344 | |
12.622%, Due 7/25/2036, 2021 9A F, (3 mo. EUR EURIBOR + 8.740%)A C | | | EUR | 1,000,000 | | | | | | | | | | 1,042,774 | |
| Pikes Peak CLO 16 Ltd., 11.315%, Due 7/25/2037, 2024-16A E, (3 mo. USD Term SOFR + 6.000%)A C | | | | 1,500,000 | | | | | | | | | | 1,500,000 | |
| Providus CLO II DAC, 9.156%, Due 7/15/2031, 2X E, (3 mo. EUR EURIBOR + 5.250%)B C | | | EUR | 545,000 | | | | | | | | | | 582,209 | |
| Providus CLO VI DAC, 9.936%, Due 5/20/2034, 6A E, (3 mo. EUR EURIBOR + 6.110%)A C | | | EUR | 1,250,000 | | | | | | | | | | 1,327,242 | |
| Rockfield Park CLO DAC, 9.873%, Due 7/16/2034, 1A D, (3 mo. EUR EURIBOR + 5.950%)A C | | | EUR | 1,500,000 | | | | | | | | | | 1,614,458 | |
| RRE 5 Loan Management DAC, 10.256%, Due 1/15/2037, 5A DR, (3 mo. EUR EURIBOR + 6.350%)A C | | | EUR | 1,000,000 | | | | | | | | | | 1,070,867 | |
| Segovia European CLO DAC, 9.034%, Due 10/18/2031, 2018 5A E, (3 mo. EUR EURIBOR + 5.130%)A | | | EUR | 1,190,000 | | | | | | | | | | 1,274,446 | |
| Voya Euro CLO I DAC, 10.316%, Due 10/15/2030, 1X F, (3 mo. EUR EURIBOR + 6.410%)B C | | | EUR | 1,100,000 | | | | | | | | | | 1,152,878 | |
| Voya Euro CLO II DAC, | | | | | | | | | | | | | | | |
4.866%, Due 7/15/2035, 2A AR, (3 mo. EUR EURIBOR + 0.960%)A C | | | EUR | 2,557,000 | | | | | | | | | | 2,728,494 | |
9.926%, Due 7/15/2035, 2A ER, (3 mo. EUR EURIBOR + 6.020%)A C | | | EUR | 1,700,000 | | | | | | | | | | 1,828,510 | |
| Voya Euro CLO III DAC, 11.806%, Due 4/15/2033, 3X F, (3 mo. EUR EURIBOR + 7.900%)B C | | | EUR | 1,300,000 | | | | | | | | | | 1,318,458 | |
| Voya Euro CLO IV DAC, 10.066%, Due 10/15/2034, 4A ER, (3 mo. EUR EURIBOR + 6.160%)A C | | | EUR | 1,750,000 | | | | | | | | | | 1,865,278 | |
| | | | | | | | | | | | | | | |
| | | | | | | | | | | | | | | |
Total Asset-Backed Obligations (Cost $43,519,576) | | | | | | | | | | | | | | 41,888,224 | |
| | | | | | | | | | | | | | | |
| | | | | | | | | | | | | | | |
| | | |
| U.S. TREASURY OBLIGATIONS - 11.66% | | | | | | |
| U.S. Treasury Notes, | | | | | | | | | | | | | | | |
4.500%, Due 11/15/2033 | | | $ | 15,555,000 | | | | | | | | | | 15,732,424 | |
4.000%, Due 2/15/2034 | | | | 11,460,000 | | | | | | | | | | 11,148,431 | |
| | | | | | | | | | | | | | | |
| | | | | | | | | | | | | | | |
Total U.S. Treasury Obligations (Cost $27,174,793) | | | | | | | | | | | | | | 26,880,855 | |
| | | | | | | | | | | | | | | |
| | | | | | | | | | | | | | | |
| | | |
| SHORT-TERM INVESTMENTS - 5.42% | | | | | | |
| | | |
| U.S. Treasury Obligations - 3.90% | | | | | | |
| U.S. Treasury Bills, 5.368%, Due 9/17/2024 | | | | 9,100,000 | | | | | | | | | | 8,997,128 | |
| | | | | | | | | | | | | | | |
| | | |
| | | Shares | | | | |
| | | | | | | |
| | | |
| Investment Companies - 1.52% | | | | | | |
| American Beacon U.S. Government Money Market Select Fund, 5.18%E F | | | | 3,501,286 | | | | | | | | | | 3,501,286 | |
| | | | | | | | | | | | | | | |
| | | | | | | | | | | | | | | |
Total Short-Term Investments (Cost $12,498,437) | | | | | | | | | | | | | | 12,498,414 | |
| | | | | | | | | | | | | | | |
| | | | | | | | | | | | | | | |
TOTAL INVESTMENTS - 98.05% (Cost $232,291,267) | | | | | | | | | | | | | | 226,147,833 | |
OTHER ASSETS, NET OF LIABILITIES - 1.95% | | | | | | | | | | | | | | 4,489,281 | |
| | | | | | | | | | | | | | | |
TOTAL NET ASSETS - 100.00% | | | | | | | | | | | | | $ | 230,637,114 | |
| | | | | | | | | | | | | | | |
| | | | | | | |
Percentages are stated as a percent of net assets. *In U.S. Dollars unless otherwise noted. | | | | | | | | | | | | | | | |
A Security exempt from registration under the Securities Act of 1933. These securities may be resold to qualified institutional buyers pursuant to Rule 144A. At the period end, the value of these securities amounted to $56,234,870 or 24.38% of net assets. The Fund has no right to demand registration of these securities.
B Reg S - Security purchased under the Securities Act of 1933, which exempts from registration securities offered and sold outside of the United States. Such a security cannot be sold in the United States without either an effective registration statement filed pursuant to the Securities Act of 1933, or pursuant to an exemption from registration.
C Variable, floating, or adjustable rate securities with an interest rate that changes periodically. Rates are periodically reset with rates that are based on a predetermined benchmark such as a widely followed interest rate such as T-bills, SOFR, LIBOR or PRIME plus a fixed spread. The interest rate disclosed reflects the rate in effect on June 30, 2024.
D Perpetual maturity. The date shown, if any, is the next call date.
E 7-day yield.
F The Fund is affiliated by having the same investment advisor.
See accompanying notes
18
American Beacon TwentyFour Strategic Income FundSM
Schedule of Investments
June 30, 2024
CLO - Collateralized Loan Obligation.
CMT - Constant Maturity Treasury.
DAC - Designated Activity Company.
EURIBOR - Euro Interbank Offered Rate.
ICE - Intercontinental Exchange.
IP - Intellectual Property.
LIBOR - London Interbank Offered Rate.
LLC - Limited Liability Company.
LP - Limited Partnership.
PIK - Payment in Kind.
PLC - Public Limited Company.
PRIME - A rate, charged by banks, based on the U.S. Federal Funds rate.
REIT - Real Estate Investment Trust.
SOFR - Secured Overnight Financing Rate.
SONIA - Sterling Overnight Index Average.
| | | | | | | | | | | | | | | | | | | | | | | | | | | | |
| Forward Foreign Currency Contracts Open on June 30, 2024: | |
| Currency Purchased* | | | Currency Sold* | | | Settlement
Date | | Counterparty | | | Unrealized
Appreciation | | | Unrealized
(Depreciation) | | | Net Unrealized
Appreciation
(Depreciation) | |
| USD | | | 99,886,847 | | | EUR | | | 99,748,862 | | | 7/19/2024 | | | SSB | | | $ | 137,985 | | | $ | - | | | $ | 137,985 | |
| USD | | | 51,511,746 | | | GBP | | | 51,332,658 | | | 7/19/2024 | | | SSB | | | | 179,088 | | | | - | | | | 179,088 | |
| USD | | | 1,551,828 | | | EUR | | | 1,557,219 | | | 7/19/2024 | | | SSB | | | | - | | | | (5,391 | ) | | | (5,391 | ) |
| USD | | | 343,225 | | | EUR | | | 343,666 | | | 7/19/2024 | | | SSB | | | | - | | | | (441 | ) | | | (441 | ) |
| | | | | | | | | | | | | | | | | | | | | | | | | | | | |
| | | $ | 317,073 | | | $ | (5,832 | ) | | $ | 311,241 | |
| | | | | | | | | | | | | | | | | | | | | | | | | | | | |
| * | All values denominated in USD. |
| | |
| Glossary: |
| | |
| Counterparty Abbreviations: |
| SSB | | State Street Bank & Trust Co. |
|
| Currency Abbreviations: |
| EUR | | Euro |
| GBP | | British Pound |
| USD | | United States Dollar |
The Fund’s investments are summarized by level based on the inputs used to determine their values. As of June 30, 2024, the investments were classified as described below:
| | | | | | | | | | | | | | | | | | | | | | | | | | | | |
TwentyFour Strategic Income Fund | | Level 1 | | | | | | Level 2 | | | | | | Level 3 | | | | | | Total | |
Assets | | | | | | | | | | | | | | | | | | | | | | | | | | | | |
Corporate Obligations | | $ | - | | | | | | | $ | 16,444,830 | | | | | | | $ | - | | | | | | | $ | 16,444,830 | |
Foreign Corporate Obligations | | | - | | | | | | | | 103,124,066 | | | | | | | | - | | | | | | | | 103,124,066 | |
Foreign Sovereign Obligations | | | - | | | | | | | | 25,311,444 | | | | | | | | - | | | | | | | | 25,311,444 | |
Asset-Backed Obligations | | | - | | | | | | | | 41,888,224 | | | | | | | | - | | | | | | | | 41,888,224 | |
U.S. Treasury Obligations | | | - | | | | | | | | 26,880,855 | | | | | | | | - | | | | | | | | 26,880,855 | |
Short-Term Investments | | | 3,501,286 | | | | | | | | 8,997,128 | | | | | | | | - | | | | | | | | 12,498,414 | |
| | | | | | | | | | | | | | | | | | | | | | | | | | | | |
Total Investments in Securities - Assets | | $ | 3,501,286 | | | | | | | $ | 222,646,547 | | | | | | | $ | - | | | | | | | $ | 226,147,833 | |
| | | | | | | | | | | | | | | | | | | | | | | | | | | | |
| | | | | | | |
Financial Derivative Instruments - Assets | | | | | | | | | | | | | | | | | | | | | | | | | | | | |
Forward Foreign Currency Contracts | | $ | - | | | | | | | $ | 317,073 | | | | | | | $ | - | | | | | | | $ | 317,073 | |
| | | | | | | | | | | | | | | | | | | | | | | | | | | | |
Total Financial Derivative Instruments - Assets | | $ | - | | | | | | | $ | 317,073 | | | | | | | $ | - | | | | | | | $ | 317,073 | |
| | | | | | | | | | | | | | | | | | | | | | | | | | | | |
| | | | | | | |
Financial Derivative Instruments - Liabilities | | | | | | | | | | | | | | | | | | | | | | | | | | | | |
Forward Foreign Currency Contracts | | $ | - | | | | | | | $ | (5,832 | ) | | | | | | $ | - | | | | | | | $ | (5,832 | ) |
| | | | | | | | | | | | | | | | | | | | | | | | | | | | |
Total Financial Derivative Instruments - Liabilities | | $ | - | | | | | | | $ | (5,832 | ) | | | | | | $ | - | | | | | | | $ | (5,832 | ) |
| | | | | | | | | | | | | | | | | | | | | | | | | | | | |
U.S. GAAP requires transfers between all levels to/from level 3 be disclosed. During the year ended June 30, 2024, there were no transfers into or out of Level 3.
See accompanying notes
19
American Beacon TwentyFour Sustainable Short Term Bond FundSM
Schedule of Investments
June 30, 2024
| | | | | | | | | | | | | | | |
| | | |
| | | Principal Amount* | | | | Fair Value |
| | | | | | | |
| | | |
| CORPORATE OBLIGATIONS - 13.63% | | | | | | |
| | | |
| Communications - 2.50% | | | | | | |
| | | |
| Telecommunications - 2.50% | | | | | | |
| AT&T, Inc., 2.900%, Due 12/4/2026 | | | GBP | 100,000 | | | | | | | | | $ | 119,828 | |
| T-Mobile USA, Inc., 3.500%, Due 4/15/2025 | | | $ | 148,000 | | | | | | | | | | 145,521 | |
| | | | | | | | | | | | | | | |
| | | | | | | | | | | | | | 265,349 | |
| | | | | | | | | | | | | | | |
| | | | | | | | | | | | | | | |
Total Communications | | | | | | | | | | | | | | 265,349 | |
| | | | | | | | | | | | | | | |
| | | | | | | | | | | | | | | |
| | | |
| Consumer, Cyclical - 1.18% | | | | | | |
| | | |
| Auto Manufacturers - 1.18% | | | | | | |
| General Motors Financial Co., Inc., 5.150%, Due 8/15/2026A | | | GBP | 100,000 | | | | | | | | | | 125,325 | |
| | | | | | | | | | | | | | | |
| | | | | | | | | | | | | | | |
| | | |
| Consumer, Non-Cyclical - 4.89% | | | | | | |
| | | |
| Cosmetics/Personal Care - 2.31% | | | | | | |
| Haleon U.K. Capital PLC, 3.125%, Due 3/24/2025 | | | | 250,000 | | | | | | | | | | 245,474 | |
| | | | | | | | | | | | | | | |
| | | | | | | | | | | | | | | |
| | | |
| Health Care - Services - 1.30% | | | | | | |
| HCA, Inc., 5.250%, Due 6/15/2026 | | | | 138,000 | | | | | | | | | | 137,378 | |
| | | | | | | | | | | | | | | |
| | | | | | | | | | | | | | | |
| | | |
| Pharmaceuticals - 1.28% | | | | | | |
| Becton Dickinson & Co., 3.020%, Due 5/24/2025 | | | GBP | 110,000 | | | | | | | | | | 136,166 | |
| | | | | | | | | | | | | | | |
| | | | | | | | | | | | | | | |
Total Consumer, Non-Cyclical | | | | | | | | | | | | | | 519,018 | |
| | | | | | | | | | | | | | | |
| | | | | | | | | | | | | | | |
| | | |
| Financial - 2.34% | | | | | | |
| | | |
| Banks - 1.15% | | | | | | |
| Bank of America Corp., 2.300%, Due 7/25/2025A | | | GBP | 100,000 | | | | | | | | | | 122,415 | |
| | | | | | | | | | | | | | | |
| | | | | | | | | | | | | | | |
| | | |
| REITS - 1.19% | | | | | | |
| Digital Stout Holding LLC, 4.250%, Due 1/17/2025A | | | GBP | 100,000 | | | | | | | | | | 125,684 | |
| | | | | | | | | | | | | | | |
| | | | | | | | | | | | | | | |
Total Financial | | | | | | | | | | | | | | 248,099 | |
| | | | | | | | | | | | | | | |
| | | | | | | | | | | | | | | |
| | | |
| Technology - 2.72% | | | | | | |
| | | |
| Software - 2.72% | | | | | | |
| Fidelity National Information Services, Inc., 4.500%, Due 7/15/2025 | | | | 130,000 | | | | | | | | | | 128,561 | |
| Fiserv, Inc., 2.250%, Due 7/1/2025 | | | GBP | 130,000 | | | | | | | | | | 159,235 | |
| | | | | | | | | | | | | | | |
| | | | | | | | | | | | | | 287,796 | |
| | | | | | | | | | | | | | | |
| | | | | | | | | | | | | | | |
Total Technology | | | | | | | | | | | | | | 287,796 | |
| | | | | | | | | | | | | | | |
| | | | | | | | | | | | | | | |
Total Corporate Obligations (Cost $1,460,076) | | | | | | | | | | | | | | 1,445,587 | |
| | | | | | | | | | | | | | | |
| | | | | | | | | | | | | | | |
| | | |
| FOREIGN CORPORATE OBLIGATIONS - 64.98% | | | | | | |
| | | |
| Communications - 4.25% | | | | | | |
| | | |
| Media - 1.26% | | | | | | |
| Arqiva Financing PLC, 7.210%, Due 6/30/2045A | | | GBP | 100,000 | | | | | | | | | | 134,068 | |
| | | | | | | | | | | | | | | |
| | | | | | | | | | | | | | | |
| | | |
| Telecommunications - 2.99% | | | | | | |
| Orange SA, 5.000%, Due 10/1/2026, (5 yr. EUR Swap + 3.990%)A B C | | | EUR | 100,000 | | | | | | | | | | 108,302 | |
| Telefonica Europe BV, 3.875%, Due 6/22/2026, (8 yr. EUR Swap + 2.967%)A B C | | | EUR | 100,000 | | | | | | | | | | 105,675 | |
| Vodafone Group PLC, 2.625%, Due 8/27/2080, (5 yr. EUR Swap + 3.002%)A B | | | EUR | 100,000 | | | | | | | | | | 102,952 | |
| | | | | | | | | | | | | | | |
| | | | | | | | | | | | | | 316,929 | |
| | | | | | | | | | | | | | | |
| | | | | | | | | | | | | | | |
Total Communications | | | | | | | | | | | | | | 450,997 | |
| | | | | | | | | | | | | | | |
| | | | | | | | | | | | | | | |
| | | |
| Consumer, Cyclical - 2.81% | | | | | | |
| | | |
| Distribution/Wholesale - 1.62% | | | | | | |
| Bunzl Finance PLC, 2.250%, Due 6/11/2025A | | | GBP | 140,000 | | | | | | | | | | 171,884 | |
| | | | | | | | | | | | | | | |
| | | | | | | | | | | | | | | |
See accompanying notes
20
American Beacon TwentyFour Sustainable Short Term Bond FundSM
Schedule of Investments
June 30, 2024
| | | | | | | | | | | | | | | |
| | | |
| | | Principal Amount* | | | | Fair Value |
| | | | | | | |
| | | |
| FOREIGN CORPORATE OBLIGATIONS - 64.98% (continued) | | | | | | |
| | | |
| Consumer, Cyclical - 2.81% (continued) | | | | | | |
| | | |
| Entertainment - 1.19% | | | | | | |
| CPUK Finance Ltd., 5.876%, Due 8/28/2027A | | | GBP | 100,000 | | | | | | | | | $ | 126,736 | |
| | | | | | | | | | | | | | | |
| | | | | | | | | | | | | | | |
Total Consumer, Cyclical | | | | | | | | | | | | | | 298,620 | |
| | | | | | | | | | | | | | | |
| | | | | | | | | | | | | | | |
| | | |
| Consumer, Non-Cyclical - 1.75% | | | | | | |
| | | |
| Food - 1.75% | | | | | | |
| Tesco Corporate Treasury Services PLC, 2.500%, Due 5/2/2025A | | | GBP | 150,000 | | | | | | | | | | 185,417 | |
| | | | | | | | | | | | | | | |
| | | | | | | | | | | | | | | |
| | | |
| Financial - 42.63% | | | | | | |
| | | |
| Banks - 21.56% | | | | | | |
| ABN AMRO Bank NV, 5.250%, Due 5/26/2026A | | | GBP | 100,000 | | | | | | | | | | 126,658 | |
| Argenta Spaarbank NV, 5.375%, Due 11/29/2027, (1yr. EUR Swap + 2.750%)A B | | | EUR | 100,000 | | | | | | | | | | 110,144 | |
| Banco Santander SA, 1.500%, Due 4/14/2026A | | | GBP | 100,000 | | | | | | | | | | 118,450 | |
| Barclays PLC, | | | | | | | | | | | | | | | |
3.750%, Due 11/22/2030, (5 yr. U.K. Government Bond + 3.750%)A B | | | GBP | 100,000 | | | | | | | | | | 121,981 | |
8.407%, Due 11/14/2032, (5 yr. U.K. Government Bond + 4.750%)A B | | | GBP | 100,000 | | | | | | | | | | 133,235 | |
| BNP Paribas SA, 2.000%, Due 5/24/2031, (5 yr. U.K. Government Bond + 1.650%)A B | | | GBP | 100,000 | | | | | | | | | | 117,369 | |
| BPCE SA, 6.125%, Due 5/24/2029A | | | GBP | 100,000 | | | | | | | | | | 128,940 | |
| Credit Agricole SA, | | | | | | | | | | | | | | | |
5.375%, Due 1/15/2029, (1 yr. U.K. Government Bond + 1.650%)A B | | | GBP | 100,000 | | | | | | | | | | 125,922 | |
1.874%, Due 12/9/2031, ( 5 yr. U.K. Government Bond + 1.500%)A B | | | GBP | 100,000 | | | | | | | | | | 114,544 | |
| HSBC Holdings PLC, 1.750%, Due 7/24/2027, (Sterling Overnight Index Average + 1.307%)B | | | GBP | 100,000 | | | | | | | | | | 117,450 | |
| ING Groep NV, 6.250%, Due 5/20/2033, (5 yr. U.K. Government Bond + 2.800%)A B | | | GBP | 100,000 | | | | | | | | | | 127,087 | |
| Lloyds Banking Group PLC, | | | | | | | | | | | | | | | |
1.985%, Due 12/15/2031, (5 yr. U.K. Government Bond + 1.600%)B | | | GBP | 120,000 | | | | | | | | | | 138,798 | |
6.625%, Due 6/2/2033, (5 yr. U.K. Government Bond + 3.100%)A B | | | GBP | 100,000 | | | | | | | | | | 127,942 | |
| NatWest Group PLC, 3.622%, Due 8/14/2030, (5 yr. U.K. Government Bond + 3.550%)A B | | | GBP | 100,000 | | | | | | | | | | 123,667 | |
| Santander U.K. Group Holdings PLC, 7.098%, Due 11/16/2027, (1 yr. GBP Swap + 2.866%)A B | | | GBP | 100,000 | | | | | | | | | | 130,035 | |
| Societe Generale SA, 2.226%, Due 1/21/2026, (1 yr. CMT + 1.050%)B D | | | $ | 200,000 | | | | | | | | | | 195,622 | |
| Standard Chartered PLC, 2.500%, Due 9/9/2030, (5 yr. EUR Swap + 2.800%)A B | | | EUR | 100,000 | | | | | | | | | | 104,969 | |
| Virgin Money U.K. PLC, 5.125%, Due 12/11/2030, (5 yr. U.K. Government Bond + 5.250%)A B | | | GBP | 100,000 | | | | | | | | | | 124,429 | |
| | | | | | | | | | | | | | | |
| | | | | | | | | | | | | | 2,287,242 | |
| | | | | | | | | | | | | | | |
| | | | | | | | | | | | | | | |
| | | |
| Insurance - 13.03% | | | | | | |
| ASR Nederland NV, 3.375%, Due 5/2/2049, (5 yr. EUR Swap + 4.000%)A B | | | EUR | 100,000 | | | | | | | | | | 100,562 | |
| Aviva PLC, 6.125%, Due 11/14/2036, (5 yr. U.K. Government Bond + 2.850%)A B | | | GBP | 100,000 | | | | | | | | | | 127,422 | |
| AXA SA, 3.250%, Due 5/28/2049, (3 mo. EUR EURIBOR + 3.200%)A B | | | EUR | 100,000 | | | | | | | | | | 102,022 | |
| BUPA Finance PLC, 5.000%, Due 12/8/2026A | | | GBP | 100,000 | | | | | | | | | | 124,026 | |
| Caisse Nationale de Reassurance Mutuelle Agricole Groupama, 0.750%, Due 7/7/2028A | | | EUR | 100,000 | | | | | | | | | | 94,182 | |
| CNP Assurances SACA, 4.250%, Due 6/5/2045, (5 yr. EUR Swap + 3.600%)A B | | | EUR | 100,000 | | | | | | | | | | 106,292 | |
| Legal & General Group PLC, 5.375%, Due 10/27/2045, (5 yr. U.K. Government Bond + 4.580%)A B | | | GBP | 100,000 | | | | | | | | | | 125,158 | |
| NN Group NV, 4.500%, Due 1/15/2026, (3 mo. EUR EURIBOR + 4.000%)A B C | | | EUR | 100,000 | | | | | | | | | | 106,827 | |
| Phoenix Group Holdings PLC, 5.867%, Due 6/13/2029A | | | GBP | 100,000 | | | | | | | | | | 123,591 | |
| Real Finance Bonds No. 3 PLC, 6.125%, Due 11/13/2028A | | | GBP | 100,000 | | | | | | | | | | 127,564 | |
| Rothesay Life PLC, 8.000%, Due 10/30/2025A | | | GBP | 190,000 | | | | | | | | | | 244,637 | |
| | | | | | | | | | | | | | | |
| | | | | | | | | | | | | | 1,382,283 | |
| | | | | | | | | | | | | | | |
| | | | | | | | | | | | | | | |
| | | |
| Real Estate - 2.11% | | | | | | |
| Heimstaden Bostad Treasury BV, 0.250%, Due 10/13/2024A | | | EUR | 100,000 | | | | | | | | | | 104,797 | |
| Telereal Securitisation PLC, 1.963%, Due 12/10/2033, Series B2, (Sterling Overnight Index Average + 4.440%)A B | | | GBP | 100,000 | | | | | | | | | | 118,593 | |
| | | | | | | | | | | | | | | |
| | | | | | | | | | | | | | 223,390 | |
| | | | | | | | | | | | | | | |
| | | | | | | | | | | | | | | |
| | | |
| Savings & Loans - 5.93% | | | | | | |
| Coventry Building Society, 7.000%, Due 11/7/2027, (1 yr. U.K. Government Bond + 2.600%)A B | | | GBP | 100,000 | | | | | | | | | | 129,850 | |
| Leeds Building Society, 1.500%, Due 3/16/2027, (1 yr. U.K. Government Bond + 1.300%)A B | | | GBP | 100,000 | | | | | | | | | | 118,386 | |
| Nationwide Building Society, 5.875%, Due 12/20/2024, (5 yr. U.K. Government Bond + 5.390%)A B C | | | GBP | 200,000 | | | | | | | | | | 251,217 | |
See accompanying notes
21
American Beacon TwentyFour Sustainable Short Term Bond FundSM
Schedule of Investments
June 30, 2024
| | | | | | | | | | | | | | | |
| | | |
| | | Principal Amount* | | | | Fair Value |
| | | | | | | |
| | | |
| FOREIGN CORPORATE OBLIGATIONS - 64.98% (continued) | | | | | | |
| | | |
| Financial - 42.63% (continued) | | | | | | |
| | | |
| Savings & Loans - 5.93% (continued) | | | | | | |
| Yorkshire Building Society, 6.375%, Due 11/15/2028, (1 yr. U.K. Government Bond + 2.650%)A B | | | GBP | 100,000 | | | | | | | | | $ | 129,855 | |
| | | | | | | | | | | | | | | |
| | | | | | | | | | | | | | 629,308 | |
| | | | | | | | | | | | | | | |
| | | | | | | | | | | | | | | |
Total Financial | | | | | | | | | | | | | | 4,522,223 | |
| | | | | | | | | | | | | | | |
| | | | | | | | | | | | | | | |
| | | |
| Industrial - 4.69% | | | | | | |
| | | |
| Miscellaneous Manufacturing - 1.16% | | | | | | |
| Siemens Financieringsmaatschappij NV, 1.000%, Due 2/20/2025A | | | GBP | 100,000 | | | | | | | | | | 123,296 | |
| | | | | | | | | | | | | | | |
| | | | | | | | | | | | | | | |
| | | |
| Transportation - 2.29% | | | | | | |
| Eversholt Funding PLC, 6.359%, Due 12/2/2025A | | | GBP | 100,000 | | | | | | | | | | 127,820 | |
| Mobico Group PLC, 4.250%, Due 11/26/2025, (5 yr. U.K. Government Bond + 4.135%)A B C | | | GBP | 100,000 | | | | | | | | | | 114,421 | |
| | | | | | | | | | | | | | | |
| | | | | | | | | | | | | | 242,241 | |
| | | | | | | | | | | | | | | |
| | | | | | | | | | | | | | | |
| | | |
| Trucking & Leasing - 1.24% | | | | | | |
| Porterbrook Rail Finance Ltd., 7.125%, Due 10/20/2026 | | | GBP | 100,000 | | | | | | | | | | 131,553 | |
| | | | | | | | | | | | | | | |
| | | | | | | | | | | | | | | |
Total Industrial | | | | | | | | | | | | | | 497,090 | |
| | | | | | | | | | | | | | | |
| | | | | | | | | | | | | | | |
| | | |
| Technology - 1.01% | | | | | | |
| | | |
| Software - 1.01% | | | | | | |
| Sage Group PLC, 3.820%, Due 2/15/2028A | | | EUR | 100,000 | | | | | | | | | | 107,427 | |
| | | | | | | | | | | | | | | |
| | | | | | | | | | | | | | | |
| | | |
| Utilities - 7.84% | | | | | | |
| | | |
| Electric - 5.60% | | | | | | |
| NGG Finance PLC, 5.625%, Due 6/18/2073, (12 yr. GBP Swap + 3.480%)A B | | | GBP | 100,000 | | | | | | | | | | 125,620 | |
| NIE Finance PLC, 6.375%, Due 6/2/2026A | | | GBP | 100,000 | | | | | | | | | | 129,057 | |
| Orsted AS, 2.250%, Due 11/24/3017, (5 yr. EUR Swap + 1.899%)A B | | | EUR | 100,000 | | | | | | | | | | 105,838 | |
| SSE PLC, 4.000%, Due 1/21/2028, (5 yr. EUR Swap + 2.696%)A B C | | | EUR | 100,000 | | | | | | | | | | 104,663 | |
| Vattenfall AB, 6.875%, Due 8/17/2083, (5 yr. U.K. Government Bond + 3.059%)A B | | | GBP | 100,000 | | | | | | | | | | 128,748 | |
| | | | | | | | | | | | | | | |
| | | | | | | | | | | | | | 593,926 | |
| | | | | | | | | | | | | | | |
| | | | | | | | | | | | | | | |
| | | |
| Gas - 1.08% | | | | | | |
| APA Infrastructure Ltd., 7.125%, Due 11/9/2083, (5 yr. EURIBOR ICE Swap + 4.098%)A B | | | EUR | 100,000 | | | | | | | | | | 114,859 | |
| | | | | | | | | | | | | | | |
| | | | | | | | | | | | | | | |
| | | |
| Water - 1.16% | | | | | | |
| Severn Trent Utilities Finance PLC, 3.625%, Due 1/16/2026A | | | GBP | 100,000 | | | | | | | | | | 123,288 | |
| | | | | | | | | | | | | | | |
| | | | | | | | | | | | | | | |
Total Utilities | | | | | | | | | | | | | | 832,073 | |
| | | | | | | | | | | | | | | |
| | | | | | | | | | | | | | | |
Total Foreign Corporate Obligations (Cost $7,064,839) | | | | | | | | | | | | | | 6,893,847 | |
| | | | | | | | | | | | | | | |
| | | | | | | | | | | | | | | |
| | | |
| FOREIGN SOVEREIGN OBLIGATIONS - 7.35% (Cost $786,652) | | | | | | |
| Bundesobligation, 2.100%, Due 4/12/2029, Series 189A | | | EUR | 740,000 | | | | | | | | | | 779,450 | |
| | | | | | | | | | | | | | | |
| | | | | | | | | | | | | | | |
| | | |
| COLLATERALIZED MORTGAGE OBLIGATIONS - 4.66% | | | | | | |
| Castell PLC, 6.061% - 6.052%, Due 11/25/2053, 2021 1 A, (Sterling Overnight Index Average + 0.850%)A B | | | GBP | 32,473 | | | | | | | | | | 41,118 | |
| Together Asset-Backed Securitisation PLC, 5.928%, Due 7/12/2063, 2021 1ST1 A, (Sterling Overnight Index Average + 0.700%)A B | | | GBP | 61,471 | | | | | | | | | | 77,585 | |
| Tower Bridge Funding PLC, 7.034% - 7.015%, Due 11/20/2063, 2021 2 D, (Sterling Overnight Index Average + 1.800%)A B | | | GBP | 169,000 | | | | | | | | | | 212,736 | |
| Twin Bridges PLC, 7.334% - 7.306%, Due 3/12/2055, 2021 1 D, (Sterling Overnight Index Average + 2.100%)A B | | | GBP | 130,000 | | | | | | | | | | 163,287 | |
| | | | | | | | | | | | | | | |
| | | | | | | | | | | | | | | |
Total Collateralized Mortgage Obligations (Cost $533,540) | | | | | | | | | | | | | | 494,726 | |
| | | | | | | | | | | | | | | |
| | | | | | | | | | | | | | | |
See accompanying notes
22
American Beacon TwentyFour Sustainable Short Term Bond FundSM
Schedule of Investments
June 30, 2024
| | | | | | | | | | | | | | | |
| | | |
| | | Principal Amount* | | | | Fair Value |
| | | | | | | |
| | | |
| U.S. TREASURY OBLIGATIONS - 4.90% | | | | | | |
| U.S. Treasury Notes, | | | | | | | | | | | | | | | |
4.125%, Due 3/31/2029 | | | $ | 200,000 | | | | | | | | | $ | 198,078 | |
4.500%, Due 5/31/2029 | | | | 320,000 | | | | | | | | | | 322,375 | |
| | | | | | | | | | | | | | | |
| | | | | | | | | | | | | | | |
Total U.S. Treasury Obligations (Cost $521,436) | | | | | | | | | | | | | | 520,453 | |
| | | | | | | | | | | | | | | |
| | | | | | | | | | | | | | | |
TOTAL INVESTMENTS - 95.52% (Cost $10,366,543) | | | | | | | | | | | | | | 10,134,063 | |
OTHER ASSETS, NET OF LIABILITIES - 4.48% | | | | | | | | | | | | | | 474,945 | |
| | | | | | | | | | | | | | | |
TOTAL NET ASSETS - 100.00% | | | | | | | | | | | | | $ | 10,609,008 | |
| | | | | | | | | | | | | | | |
| | | | | | | |
Percentages are stated as a percent of net assets. *In U.S. Dollars unless otherwise noted. | | | | | | | | | | | | | | | |
A Reg S - Security purchased under the Securities Act of 1933, which exempts from registration securities offered and sold outside of the United States. Such a security cannot be sold in the United States without either an effective registration statement filed pursuant to the Securities Act of 1933, or pursuant to an exemption from registration.
B Variable, floating, or adjustable rate securities with an interest rate that changes periodically. Rates are periodically reset with rates that are based on a predetermined benchmark such as a widely followed interest rate such as T-bills, SOFR, LIBOR or PRIME plus a fixed spread. The interest rate disclosed reflects the rate in effect on June 30, 2024.
C Perpetual maturity. The date shown, if any, is the next call date.
D Security exempt from registration under the Securities Act of 1933. These securities may be resold to qualified institutional buyers pursuant to Rule 144A. At the period end, the value of these securities amounted to $195,622 or 1.84% of net assets. The Fund has no right to demand registration of these securities.
CMT - Constant Maturity Treasury.
EURIBOR - Euro Interbank Offered Rate.
ICE - Intercontinental Exchange.
LIBOR - London Interbank Offered Rate.
LLC - Limited Liability Company.
PLC - Public Limited Company.
PRIME - A rate, charged by banks, based on the U.S. Federal Funds rate.
REIT - Real Estate Investment Trust.
SOFR - Secured Overnight Financing Rate.
| | | | | | | | | | | | | | | | | | | | | | | | | | | | |
| Forward Foreign Currency Contracts Open on June 30, 2024: | |
| Currency Purchased* | | | Currency Sold* | | | Settlement
Date | | Counterparty | | | Unrealized
Appreciation | | | Unrealized
(Depreciation) | | | Net Unrealized
Appreciation
(Depreciation) | |
| EUR | | | 160,280 | | | USD | | | 159,949 | | | 7/25/2024 | | | SSB | | | $ | 331 | | | $ | - | | | $ | 331 | |
| EUR | | | 728,556 | | | USD | | | 727,577 | | | 7/25/2024 | | | SSB | | | | 979 | | | | - | | | | 979 | |
| GBP | | | 1,500,483 | | | USD | | | 1,504,393 | | | 7/25/2024 | | | SSB | | | | - | | | | (3,910 | ) | | | (3,910 | ) |
| USD | | | 8,066,394 | | | GBP | | | 8,024,966 | | | 7/25/2024 | | | SSB | | | | 41,428 | | | | - | | | | 41,428 | |
| USD | | | 3,302,844 | | | EUR | | | 3,295,758 | | | 7/25/2024 | | | SSB | | | | 7,086 | | | | - | | | | 7,086 | |
| | | | | | | | | | | | | | | | | | | | | | | | | | | | |
| | | $ | 49,824 | | | $ | (3,910 | ) | | $ | 45,914 | |
| | | | | | | | | | | | | | | | | | | | | | | | | | | | |
| * | All values denominated in USD. |
| | |
| Glossary: |
| | |
| Counterparty Abbreviations: |
| SSB | | State Street Bank & Trust Co. |
|
| Currency Abbreviations: |
| EUR | | Euro |
| GBP | | British Pound |
| USD | | United States Dollar |
See accompanying notes
23
American Beacon TwentyFour Sustainable Short Term Bond FundSM
Schedule of Investments
June 30, 2024
The Fund’s investments are summarized by level based on the inputs used to determine their values. As of June 30, 2024, the investments were classified as described below:
| | | | | | | | | | | | | | | | | | | | | | | | | | | | |
TwentyFour Sustainable Short Term Bond Fund | | Level 1 | | | | | | Level 2 | | | | | | Level 3 | | | | | | Total | |
Assets | | | | | | | | | | | | | | | | | | | | | | | | | | | | |
Corporate Obligations | | $ | - | | | | | | | $ | 1,445,587 | | | | | | | $ | - | | | | | | | $ | 1,445,587 | |
Foreign Corporate Obligations | | | - | | | | | | | | 6,893,847 | | | | | | | | - | | | | | | | | 6,893,847 | |
Foreign Sovereign Obligations | | | - | | | | | | | | 779,450 | | | | | | | | - | | | | | | | | 779,450 | |
Collateralized Mortgage Obligations | | | - | | | | | | | | 494,726 | | | | | | | | - | | | | | | | | 494,726 | |
U.S. Treasury Obligations | | | - | | | | | | | | 520,453 | | | | | | | | - | | | | | | | | 520,453 | |
| | | | | | | | | | | | | | | | | | | | | | | | | | | | |
Total Investments in Securities - Assets | | $ | - | | | | | | | $ | 10,134,063 | | | | | | | $ | - | | | | | | | $ | 10,134,063 | |
| | | | | | | | | | | | | | | | | | | | | | | | | | | | |
| | | | | | | |
Financial Derivative Instruments - Assets | | | | | | | | | | | | | | | | | | | | | | | | | | | | |
Forward Foreign Currency Contracts | | $ | - | | | | | | | $ | 49,824 | | | | | | | $ | - | | | | | | | $ | 49,824 | |
| | | | | | | | | | | | | | | | | | | | | | | | | | | | |
Total Financial Derivative Instruments - Assets | | $ | - | | | | | | | $ | 49,824 | | | | | | | $ | - | | | | | | | $ | 49,824 | |
| | | | | | | | | | | | | | | | | | | | | | | | | | | | |
| | | | | | | |
Financial Derivative Instruments - Liabilities | | | | | | | | | | | | | | | | | | | | | | | | | | | | |
Forward Foreign Currency Contracts | | $ | - | | | | | | | $ | (3,910 | ) | | | | | | $ | - | | | | | | | $ | (3,910 | ) |
| | | | | | | | | | | | | | | | | | | | | | | | | | | | |
Total Financial Derivative Instruments - Liabilities | | $ | - | | | | | | | $ | (3,910 | ) | | | | | | $ | - | | | | | | | $ | (3,910 | ) |
| | | | | | | | | | | | | | | | | | | | | | | | | | | | |
U.S. GAAP requires transfers between all levels to/from level 3 be disclosed. During the year ended June 30, 2024, there were no transfers into or out of Level 3.
See accompanying notes
24
American Beacon FundsSM
Statements of Assets and Liabilities
June 30, 2024
| | | | | | | | | | | | | | | | | | | | |
| | | SSI Alternative
Income Fund | | | | | | TwentyFour
Strategic Income
Fund | | | | | | TwentyFour
Sustainable Short
Term Bond Fund | |
Assets: | | | | | | | | | | | | | | | | | | | | |
Investments in unaffiliated securities, at fair value† | | $ | 146,941,935 | | | | | | | $ | 222,646,547 | | | | | | | $ | 10,134,063 | |
Investments in affiliated securities, at fair value‡ | | | 26,876,633 | | | | | | | | 3,501,286 | | | | | | | | - | |
Foreign currency, at fair value^ | | | - | | | | | | | | 631,329 | | | | | | | | 25,257 | |
Cash | | | 1,052 | | | | | | | | - | | | | | | | | 339,164 | |
Cash with brokers | | | 37,645,631 | | | | | | | | 677 | | | | | | | | - | |
Dividends and interest receivable | | | 910,536 | | | | | | | | 2,961,927 | | | | | | | | 150,168 | |
Receivable for investments sold | | | 678,403 | | | | | | | | 2,274,024 | | | | | | | | - | |
Receivable for fund shares sold | | | 393,042 | | | | | | | | 1,097,971 | | | | | | | | 100 | |
Receivable for tax reclaims | | | - | | | | | | | | 2,664 | | | | | | | | - | |
Receivable for expense reimbursement (Note 2) | | | 9,948 | | | | | | | | 38,662 | | | | | | | | 25,704 | |
Unrealized appreciation from forward foreign currency contracts | | | - | | | | | | | | 317,073 | | | | | | | | 49,824 | |
Prepaid expenses | | | 178,637 | | | | | | | | 55,672 | | | | | | | | 28,508 | |
| | | | | | | | | | | | | | | | | | | | |
Total assets | | | 213,635,817 | | | | | | | | 233,527,832 | | | | | | | | 10,752,788 | |
| | | | | | | | | | | | | | | | | | | | |
Liabilities: | | | | | | | | | | | | | | | | | | | | |
Payable for investments purchased | | | 2,496,758 | | | | | | | | 2,590,361 | | | | | | | | - | |
Payable for fund shares redeemed | | | 88,530 | | | | | | | | 29,065 | | | | | | | | 49,024 | |
Securities sold short, at fair value± | | | 34,771,817 | | | | | | | | - | | | | | | | | - | |
Dividends and interest expense payable | | | 6,337 | | | | | | | | - | | | | | | | | - | |
Management and sub-advisory fees payable (Note 2) | | | 109,564 | | | | | | | | 120,613 | | | | | | | | 5,628 | |
Service fees payable (Note 2) | | | 743 | | | | | | | | 8,696 | | | | | | | | 682 | |
Transfer agent fees payable (Note 2) | | | 34,670 | | | | | | | | 15,395 | | | | | | | | 1,764 | |
Custody and fund accounting fees payable | | | 19,897 | | | | | | | | 28,737 | | | | | | | | 15,277 | |
Professional fees payable | | | 60,403 | | | | | | | | 81,664 | | | | | | | | 65,331 | |
Trustee fees payable (Note 2) | | | 274 | | | | | | | | 357 | | | | | | | | 26 | |
Payable for prospectus and shareholder reports | | | 5,422 | | | | | | | | 8,753 | | | | | | | | 1,190 | |
Unrealized depreciation from forward foreign currency contracts | | | - | | | | | | | | 5,832 | | | | | | | | 3,910 | |
Other liabilities | | | 9,957 | | | | | | | | 1,245 | | | | | | | | 948 | |
| | | | | | | | | | | | | | | | | | | | |
Total liabilities | | | 37,604,372 | | | | | | | | 2,890,718 | | | | | | | | 143,780 | |
| | | | | | | | | | | | | | | | | | | | |
Commitments and contingent liabilities (Note 2) | | | | | | | | | | | | | | | | | | | | |
| | | | | | | | | | | | | | | | | | | | |
Net assets | | $ | 176,031,445 | | | | | | | $ | 230,637,114 | | | | | | | $ | 10,609,008 | |
| | | | | | | | | | | | | | | | | | | | |
Analysis of net assets: | | | | | | | | | | | | | | | | | | | | |
Paid-in-capital | | $ | 185,044,976 | | | | | | | $ | 280,053,381 | | | | | | | $ | 11,922,511 | |
Total distributable earnings (deficits)A | | | (9,013,531 | ) | | | | | | | (49,416,267 | ) | | | | | | | (1,313,503 | ) |
| | | | | | | | | | | | | | | | | | | | |
Net assets | | $ | 176,031,445 | | | | | | | $ | 230,637,114 | | | | | | | $ | 10,609,008 | |
| | | | | | | | | | | | | | | | | | | | |
See accompanying notes
25
American Beacon FundsSM
Statements of Assets and Liabilities
June 30, 2024
| | | | | | | | | | | | | | | | | | | | |
| | | SSI Alternative
Income Fund | | | | | | TwentyFour
Strategic Income
Fund | | | | | | TwentyFour
Sustainable Short
Term Bond Fund | |
Shares outstanding at no par value (unlimited shares authorized): | | | | | | | | | | | | | | | | | | | | |
R5 Class | | | 3,878,242 | | | | | | | | 1,351,746 | | | | | | | | N/A | |
| | | | | | | | | | | | | | | | | | | | |
Y Class | | | 13,966,533 | | | | | | | | 23,886,079 | | | | | | | | 1,115,394 | |
| | | | | | | | | | | | | | | | | | | | |
Investor Class | | | 314,854 | | | | | | | | 181,819 | | | | | | | | N/A | |
| | | | | | | | | | | | | | | | | | | | |
A Class | | | N/A | | | | | | | | 966,420 | | | | | | | | 5,051 | |
| | | | | | | | | | | | | | | | | | | | |
C Class | | | N/A | | | | | | | | 672,180 | | | | | | | | 94,495 | |
| | | | | | | | | | | | | | | | | | | | |
R6 Class | | | N/A | | | | | | | | N/A | | | | | | | | 3,537 | |
| | | | | | | | | | | | | | | | | | | | |
Net assets: | | | | | | | | | | | | | | | | | | | | |
R5 Class | | $ | 37,631,052 | | | | | | | $ | 11,602,470 | | | | | | | | N/A | |
| | | | | | | | | | | | | | | | | | | | |
Y Class | | $ | 135,345,378 | | | | | | | $ | 203,770,438 | | | | | | | $ | 9,743,738 | |
| | | | | | | | | | | | | | | | | | | | |
Investor Class | | $ | 3,055,015 | | | | | | | $ | 1,527,043 | | | | | | | | N/A | |
| | | | | | | | | | | | | | | | | | | | |
A Class | | | N/A | | | | | | | $ | 8,116,991 | | | | | | | $ | 43,744 | |
| | | | | | | | | | | | | | | | | | | | |
C Class | | | N/A | | | | | | | $ | 5,620,172 | | | | | | | $ | 791,225 | |
| | | | | | | | | | | | | | | | | | | | |
R6 Class | | | N/A | | | | | | | | N/A | | | | | | | $ | 30,301 | |
| | | | | | | | | | | | | | | | | | | | |
Net asset value, offering and redemption price per share: | | | | | | | | | | | | | | | | | | | | |
R5 Class | | $ | 9.70 | | | | | | | $ | 8.58 | | | | | | | | N/A | |
| | | | | | | | | | | | | | | | | | | | |
Y Class | | $ | 9.69 | | | | | | | $ | 8.53 | | | | | | | $ | 8.74 | |
| | | | | | | | | | | | | | | | | | | | |
Investor Class | | $ | 9.70 | | | | | | | $ | 8.40 | | | | | | | | N/A | |
| | | | | | | | | | | | | | | | | | | | |
A Class | | | N/A | | | | | | | $ | 8.40 | | | | | | | $ | 8.66 | |
| | | | | | | | | | | | | | | | | | | | |
A Class (offering price) | | | N/A | | | | | | | $ | 8.73 | | | | | | | $ | 8.88 | |
| | | | | | | | | | | | | | | | | | | | |
C Class | | | N/A | | | | | | | $ | 8.36 | | | | | | | $ | 8.37 | |
| | | | | | | | | | | | | | | | | | | | |
R6 Class | | | N/A | | | | | | | | N/A | | | | | | | $ | 8.57 | |
| | | | | | | | | | | | | | | | | | | | |
| | | | | |
† Cost of investments in unaffiliated securities | | $ | 148,057,589 | | | | | | | $ | 228,789,981 | | | | | | | $ | 10,366,543 | |
‡ Cost of investments in affiliated securities | | $ | 26,876,633 | | | | | | | $ | 3,501,286 | | | | | | | $ | - | |
^ Cost of foreign currency | | $ | - | | | | | | | $ | 631,262 | | | | | | | $ | 25,284 | |
± Proceeds of securities sold short | | $ | 32,316,207 | | | | | | | $ | - | | | | | | | $ | - | |
|
| A The Fund’s investments in affiliated securities did not have unrealized appreciation (depreciation) at year end. | |
See accompanying notes
26
American Beacon FundsSM
Statements of Operations
For the year ended June 30, 2024
| | | | | | | | | | | | | | | | | | | | |
| | | SSI Alternative
Income Fund | | | | | | TwentyFour
Strategic Income
Fund | | | | | | TwentyFour
Sustainable Short
Term Bond Fund | |
Investment income: | | | | | | | | | | | | | | | | | | | | |
Dividend income from unaffiliated securities | | $ | 500,584 | | | | | | | $ | - | | | | | | | $ | - | |
Dividend income from affiliated securities (Note 2) | | | 501,942 | | | | | | | | 334,094 | | | | | | | | - | |
Interest income | | | 5,072,028 | | | | | | | | 8,788,643 | | | | | | | | 511,399 | |
Interest income from short securities held at broker | | | 1,318,206 | | | | | | | | - | | | | | | | | - | |
Other income | | | - | | | | | | | | 614 | | | | | | | | 19 | |
| | | | | | | | | | | | | | | | | | | | |
Total investment income | | | 7,392,760 | | | | | | | | 9,123,351 | | | | | | | | 511,418 | |
| | | | | | | | | | | | | | | | | | | | |
Expenses: | | | | | | | | | | | | | | | | | | | | |
Management and sub-advisory fees (Note 2) | | | 1,561,120 | | | | | | | | 1,005,004 | | | | | | | | 67,646 | |
Transfer agent fees: | | | | | | | | | | | | | | | | | | | | |
R5 Class (Note 2) | | | 1,031 | | | | | | | | 3,051 | | | | | | | | - | |
Y Class (Note 2) | | | 91,260 | | | | | | | | 107,677 | | | | | | | | 8,872 | |
Investor Class | | | 1,435 | | | | | | | | 1,789 | | | | | | | | - | |
A Class | | | - | | | | | | | | 308 | | | | | | | | - | |
C Class | | | - | | | | | | | | 247 | | | | | | | | - | |
R6 Class | | | - | | | | | | | | - | | | | | | | | 146 | |
Custody and fund accounting fees | | | 69,747 | | | | | | | | 92,343 | | | | | | | | 56,000 | |
Professional fees | | | 73,028 | | | | | | | | 104,241 | | | | | | | | 66,166 | |
Registration fees and expenses | | | 48,078 | | | | | | | | 85,432 | | | | | | | | 61,769 | |
Service fees (Note 2): | | | | | | | | | | | | | | | | | | | | |
Investor Class | | | 9,607 | | | | | | | | 30,569 | | | | | | | | - | |
A Class | | | - | | | | | | | | 17,972 | | | | | | | | 269 | |
C Class | | | - | | | | | | | | 3,207 | | | | | | | | 199 | |
Distribution fees (Note 2): | | | | | | | | | | | | | | | | | | | | |
A Class | | | - | | | | | | | | 16,401 | | | | | | | | 270 | |
C Class | | | - | | | | | | | | 53,996 | | | | | | | | 6,103 | |
Prospectus and shareholder report expenses | | | 16,913 | | | | | | | | 22,909 | | | | | | | | 9,585 | |
Trustee fees (Note 2) | | | 11,832 | | | | | | | | 14,666 | | | | | | | | 1,305 | |
Prime broker fees | | | 189,035 | | | | | | | | - | | | | | | | | - | |
Dividends and interest on securities sold short | | | 132,302 | | | | | | | | - | | | | | | | | - | |
Loan expense (Note 2) | | | - | | | | | | | | - | | | | | | | | 824 | |
Line of credit interest expense (Note 9) | | | 944 | | | | | | | | 1,122 | | | | | | | | 118 | |
Other expenses | | | 17,689 | | | | | | | | 29,276 | | | | | | | | 12,098 | |
| | | | | | | | | | | | | | | | | | | | |
Total expenses | | | 2,224,021 | | | | | | | | 1,590,210 | | | | | | | | 291,370 | |
| | | | | | | | | | | | | | | | | | | | |
Net fees waived and expenses (reimbursed) (Note 2) | | | (192,445 | ) | | | | | | | (307,596 | ) | | | | | | | (217,433 | ) |
Net sub-advisory fees waived (Note 2) | | | (528,378 | ) | | | | | | | - | | | | | | | | - | |
| | | | | | | | | | | | | | | | | | | | |
Net expenses | | | 1,503,198 | | | | | | | | 1,282,614 | | | | | | | | 73,937 | |
| | | | | | | | | | | | | | | | | | | | |
Net investment income | | | 5,889,562 | | | | | | | | 7,840,737 | | | | | | | | 437,481 | |
| | | | | | | | | | | | | | | | | | | | |
| | | | | |
Realized and unrealized gain (loss) from investments: | | | | | | | | | | | | | | | | | | | | |
Net realized gain (loss) from: | | | | | | | | | | | | | | | | | | | | |
Investments in unaffiliated securitiesA | | | (2,057,005 | ) | | | | | | | (3,414,993 | ) | | | | | | | (202,263 | ) |
Foreign currency transactions | | | - | | | | | | | | (486,399 | ) | | | | | | | 63,362 | |
Forward foreign currency contracts | | | - | | | | | | | | 1,568,121 | | | | | | | | 37,328 | |
Swap agreements | | | - | | | | | | | | (21 | ) | | | | | | | - | |
Short sales | | | 3,432,332 | | | | | | | | - | | | | | | | | - | |
Change in net unrealized appreciation (depreciation) of: | | | | | | | | | | | | | | | | | | | | |
Investments in unaffiliated securitiesB | | | 3,774,558 | | | | | | | | 10,477,841 | | | | | | | | 421,870 | |
Foreign currency transactions | | | - | | | | | | | | (23,992 | ) | | | | | | | (5,350 | ) |
Forward foreign currency contracts | | | - | | | | | | | | 1,307,766 | | | | | | | | 158,625 | |
Short sales | | | (2,006,016 | ) | | | | | | | - | | | | | | | | - | |
| | | | | | | | | | | | | | | | | | | | |
Net gain from investments | | | 3,143,869 | | | | | | | | 9,428,323 | | | | | | | | 473,572 | |
| | | | | | | | | | | | | | | | | | | | |
Net increase in net assets resulting from operations | | $ | 9,033,431 | | | | | | | $ | 17,269,060 | | | | | | | $ | 911,053 | |
| | | | | | | | | | | | | | | | | | | | |
|
A The Fund did not recognize net realized gains (losses) from the sale of investments in affiliated securities. | |
B The Fund’s investments in affiliated securities did not have a change in unrealized appreciation (depreciation) at year end. | |
See accompanying notes
27
American Beacon FundsSM
Statements of Changes in Net Assets
| | | | | | | | | | | | | | | | | | | | | | | | | | | | |
| | | SSI Alternative Income Fund | | | | | | TwentyFour Strategic Income Fund | |
| | | Year Ended
June 30, 2024 | | | | | | Year Ended
June 30, 2023 | | | | | | Year Ended
June 30, 2024 | | | | | | Year Ended
June 30, 2023 | |
Increase (decrease) in net assets: | | | | | | | | | | | | | | | | | | | | | | | | | | | | |
Operations: | | | | | | | | | | | | | | | | | | | | | | | | | | | | |
Net investment income | | $ | 5,889,562 | | | | | | | $ | 3,813,776 | | | | | | | $ | 7,840,737 | | | | | | | $ | 6,253,554 | |
Net realized gain (loss) from investments in unaffiliated securities, foreign currency transactions, forward foreign currency contracts, swap agreements, and short sales | | | 1,375,327 | | | | | | | | (854,143 | ) | | | | | | | (2,333,292 | ) | | | | | | | (24,357,153 | ) |
Change in net unrealized appreciation of investments in unaffiliated securities, foreign currency transactions, forward foreign currency contracts, and short sales | | | 1,768,542 | | | | | | | | 3,158,102 | | | | | | | | 11,761,615 | | | | | | | | 22,505,978 | |
| | | | | | | | | | | | | | | | | | | | | | | | | | | | |
Net increase in net assets resulting from operations | | | 9,033,431 | | | | | | | | 6,117,735 | | | | | | | | 17,269,060 | | | | | | | | 4,402,379 | |
| | | | | | | | | | | | | | | | | | | | | | | | | | | | |
Distributions to shareholders: | | | | | | | | | | | | | | | | | | | | | | | | | | | | |
Total retained earnings: | | | | | | | | | | | | | | | | | | | | | | | | | | | | |
R5 Class | | | (1,186,736 | ) | | | | | | | (4,496 | ) | | | | | | | (361,957 | ) | | | | | | | (786,113 | ) |
Y Class | | | (6,809,234 | ) | | | | | | | (1,800,007 | ) | | | | | | | (4,059,045 | ) | | | | | | | (15,125,690 | ) |
Investor Class | | | (178,530 | ) | | | | | | | (6,033 | ) | | | | | | | (423,786 | ) | | | | | | | (1,961,048 | ) |
A Class | | | – | | | | | | | | – | | | | | | | | (258,051 | ) | | | | | | | (867,982 | ) |
C Class | | | – | | | | | | | | – | | | | | | | | (193,390 | ) | | | | | | | (851,694 | ) |
R6 Class | | | – | | | | | | | | – | | | | | | | | – | | | | | | | | – | |
Tax return of capital: | | | | | | | | | | | | | | | | | | | | | | | | | | | | |
R5 Class | | | – | | | | | | | | – | | | | | | | | (130,391 | ) | | | | | | | – | |
Y Class | | | – | | | | | | | | – | | | | | | | | (2,076,811 | ) | | | | | | | – | |
Investor Class | | | – | | | | | | | | – | | | | | | | | (37,601 | ) | | | | | | | – | |
A Class | | | – | | | | | | | | – | | | | | | | | (88,948 | ) | | | | | | | – | |
C Class | | | – | | | | | | | | – | | | | | | | | (52,951 | ) | | | | | | | – | |
R6 Class | | | – | | | | | | | | – | | | | | | | | – | | | | | | | | – | |
| | | | | | | | | | | | | | | | | | | | | | | | | | | | |
Net distributions to shareholders | | | (8,174,500 | ) | | | | | | | (1,810,536 | ) | | | | | | | (7,682,931 | ) | | | | | | | (19,592,527 | ) |
| | | | | | | | | | | | | | | | | | | | | | | | | | | | |
| | | | | | | |
Capital share transactions (Note 10): | | | | | | | | | | | | | | | | | | | | | | | | | | | | |
Proceeds from sales of shares | | | 104,499,122 | | | | | | | | 19,921,902 | | | | | | | | 154,115,522 | | | | | | | | 65,483,292 | |
Reinvestment of dividends and distributions | | | 6,837,309 | | | | | | | | 1,485,788 | | | | | | | | 7,434,799 | | | | | | | | 19,259,367 | |
Cost of shares redeemed | | | (38,762,087 | ) | | | | | | | (53,150,018 | ) | | | | | | | (50,163,728 | ) | | | | | | | (133,069,665 | ) |
| | | | | | | | | | | | | | | | | | | | | | | | | | | | |
Net increase (decrease) in net assets from capital share transactions | | | 72,574,344 | | | | | | | | (31,742,328 | ) | | | | | | | 111,386,593 | | | | | | | | (48,327,006 | ) |
| | | | | | | | | | | | | | | | | | | | | | | | | | | | |
Net increase (decrease) in net assets | | | 73,433,275 | | | | | | | | (27,435,129 | ) | | | | | | | 120,972,722 | | | | | | | | (63,517,154 | ) |
| | | | | | | | | | | | | | | | | | | | | | | | | | | | |
Net assets: | | | | | | | | | | | | | | | | | | | | | | | | | | | | |
Beginning of year | | | 102,598,170 | | | | | | | | 130,033,299 | | | | | | | | 109,664,392 | | | | | | | | 173,181,546 | |
| | | | | | | | | | | | | | | | | | | | | | | | | | | | |
End of year | | $ | 176,031,445 | | | | | | | $ | 102,598,170 | | | | | | | $ | 230,637,114 | | | | | | | $ | 109,664,392 | |
| | | | | | | | | | | | | | | | | | | | | | | | | | | | |
See accompanying notes
28
American Beacon FundsSM
Statements of Changes in Net Assets
| | | | | | | | | | | | |
| | | TwentyFour Sustainable
Short Term Bond Fund | |
| | | Year Ended
June 30, 2024 | | | | | | Year Ended
June 30, 2023 | |
Increase (decrease) in net assets: | | | | | | | | | | | | |
Operations: | | | | | | | | | | | | |
Net investment income | | $ | 437,481 | | | | | | | $ | 391,140 | |
Net realized gain (loss) from investments in unaffiliated securities, foreign currency transactions, forward foreign currency contracts, swap agreements, and short sales | | | (101,573 | ) | | | | | | | (581,052 | ) |
Change in net unrealized appreciation of investments in unaffiliated securities, foreign currency transactions, forward foreign currency contracts, and short sales | | | 575,145 | | | | | | | | 629,913 | |
| | | | | | | | | | | | |
Net increase in net assets resulting from operations | | | 911,053 | | | | | | | | 440,001 | |
| | | | | | | | | | | | |
Distributions to shareholders: | | | | | | | | | | | | |
Total retained earnings: | | | | | | | | | | | | |
R5 Class | | | – | | | | | | | | – | |
Y Class | | | – | | | | | | | | (765,187 | ) |
Investor Class | | | – | | | | | | | | – | |
A Class | | | – | | | | | | | | (12,601 | ) |
C Class | | | – | | | | | | | | (15,336 | ) |
R6 Class | | | – | | | | | | | | (1,029,403 | ) |
Tax return of capital: | | | | | | | | | | | | |
R5 Class | | | – | | | | | | | | – | |
Y Class | | | (318,242 | ) | | | | | | | – | |
Investor Class | | | – | | | | | | | | – | |
A Class | | | (4,316 | ) | | | | | | | – | |
C Class | | | (23,906 | ) | | | | | | | – | |
R6 Class | | | (136,008 | ) | | | | | | | – | |
| | | | | | | | | | | | |
Net distributions to shareholders | | | (482,472 | ) | | | | | | | (1,822,527 | ) |
| | | | | | | | | | | | |
| | | |
Capital share transactions (Note 10): | | | | | | | | | | | | |
Proceeds from sales of shares | | | 8,184,872 | | | | | | | | 3,335,351 | |
Reinvestment of dividends and distributions | | | 341,221 | | | | | | | | 771,486 | |
Cost of shares redeemed | | | (14,181,375 | ) | | | | | | | (1,470,420 | ) |
| | | | | | | | | | | | |
Net increase (decrease) in net assets from capital share transactions | | | (5,655,282 | ) | | | | | | | 2,636,417 | |
| | | | | | | | | | | | |
Net increase (decrease) in net assets | | | (5,226,701 | ) | | | | | | | 1,253,891 | |
| | | | | | | | | | | | |
Net assets: | | | | | | | | | | | | |
Beginning of year | | | 15,835,709 | | | | | | | | 14,581,818 | |
| | | | | | | | | | | | |
End of year | | $ | 10,609,008 | | | | | | | $ | 15,835,709 | |
| | | | | | | | | | | | |
See accompanying notes
29
American Beacon FundsSM
Notes to Financial Statements
June 30, 2024
1. Organization and Significant Accounting Policies
American Beacon Funds (the “Trust”) is organized as a Massachusetts business trust. The Funds, each a series within the Trust, are registered under the Investment Company Act of 1940, as amended (the “Act”), as diversified, open-end management investment companies. As of June 30, 2024, the Trust consists of twenty-four active series, three of which are presented in this filing: American Beacon SSI Alternative Income Fund, American Beacon TwentyFour Strategic Income Fund and American Beacon TwentyFour Sustainable Short Term Bond Fund (collectively, the “Funds” and each individually a “Fund”). The remaining twenty-one active series are reported in separate filings.
American Beacon Advisors, Inc. (the “Manager”) is a Delaware corporation and a wholly-owned subsidiary of Resolute Investment Managers, Inc. (“RIM”) organized in 1986 to provide business management, advisory, administrative, and asset management consulting services to the Trust and other investors. The Manager is registered as an investment advisor under the Investment Advisers Act of 1940, as amended (the “Advisers Act”). The Manager is an indirect wholly-owned subsidiary of Resolute Topco, Inc. (“Topco”), which is owned primarily by various institutional investment funds that are managed by financial institutions and other investment advisory firms. No owner of Topco owns 25% or more of the outstanding equity or voting interests of Topco.
Effective December 29, 2023, the Manager underwent a change of control, which resulted in the termination of the Funds’ previous management and investment advisory agreements. The Board approved a new Management Agreement with the Manager and new Investment Advisory Agreements among the Manager, the sub-advisors and the Trust, on behalf of the Funds, that were effective on December 29, 2023.
Recently Adopted Accounting Pronouncements
In March 2020, the Financial Accounting Standards Board (“FASB”) issued Accounting Standards Update (“ASU”) No. 2020-04, Reference Rate Reform (Topic 848); Facilitation of the Effects of Reference Rate Reform on Financial Reporting, which provides optional guidance for a limited period of time to ease the potential burden in accounting for (or recognizing the effects of) reference rate reform. The guidance is applicable to contracts referencing London Inter-bank Offered Rate (“LIBOR”) or another reference rate that is expected to be discontinued due to reference rate reform. The ASU is effective as of March 12, 2020 and generally can be applied through December 31, 2022. In December 2022, the FASB issued ASU No. 2022-06 Reference Rate Reform (Topic 848): Deferral of the Sunset Date of Topic 848 which updates and clarifies ASU No. 2020-04. The amendments in this ASU defer the sunset date of Topic 848 from December 31, 2022, to December 31, 2024. Management expects these ASUs will not have a material impact on the Funds’ financial statements.
In June 2022, the FASB issued ASU No. 2022-03, Fair Value Measurement (Topic 820); Fair Value Measurement of Equity Securities Subject to Contractual Sale Restrictions, which provides clarifying guidance that a contractual restriction on the sale of an equity security is not considered part of the unit of account of the equity security and, therefore, is not considered in measuring fair value. The ASU is effective for fiscal years beginning after December 15, 2023, and interim periods within those fiscal years. Management has concluded that the ASU will not have a material impact on the Funds’ financial statements.
30
American Beacon FundsSM
Notes to Financial Statements
June 30, 2024
Class Disclosure
Each Fund has multiple classes of shares designed to meet the needs of different groups of investors; however, not all of the Funds offer all classes. The following table sets forth the differences amongst the classes:
| | | | | | |
Class | | Eligible Investors | | Minimum Initial
Investments | |
| R5 Class | | Large institutional investors - sold directly through intermediary channels. | | $ | 250,000 | |
| | |
| Y Class | | Large institutional retirement plan investors - sold directly or through intermediary channels. | | $ | 100,000 | |
| | |
| Investor Class | | All investors using intermediary organizations, such as broker-dealers or retirement plan sponsors. | | $ | 2,500 | |
| | |
| A Class | | All investors who invest through intermediary organizations, such as broker-dealers or third-party administrator. Retail investors who invest directly through a financial intermediary such as a broker, bank, or registered investment advisor which may include a front-end sales charge and a contingent deferred sales charge (“CDSC”). | | $ | 2,500 | |
| | |
| C Class | | Retail investors who invest directly through a financial intermediary such as a broker or through employee directed benefit plans with applicable sales charges which may include CDSC. | | $ | 1,000 | |
| | |
| R6 Class | | Large institutional retirement plan investors - sold through retirement plan sponsors. | | | None | |
Each class offered by the Trust has equal rights as to assets and voting privileges. Income and non-class specific expenses are allocated daily to each class based on the relative net assets. Realized and unrealized capital gains and losses of each class are allocated daily based on the relative net assets of each class of the respective Fund. Class specific expenses, where applicable, currently include service, distribution, transfer agent fees, and sub-transfer agent fees that vary amongst the classes as described more fully in Note 2.
Significant Accounting Policies
The following is a summary of significant accounting policies, consistently followed by the Funds in preparation of the financial statements. The Funds are considered investment companies and accordingly, follow the investment company accounting and reporting guidance of the FASB Accounting Standards Codification Topic 946, Financial Services – Investment Companies, a part of Generally Accepted Accounting Principles (“U.S. GAAP”).
Security Transactions and Investment Income
Security transactions are recorded as of the trade date for financial reporting purposes. Securities purchased or sold on a when-issued or delayed-delivery basis may be settled beyond a standard settlement period for the security after the trade date.
Dividend income, net of foreign taxes, is recorded on the ex-dividend date, except certain dividends from foreign securities which are recorded as soon as the information is available to the Funds. Interest income, net of foreign taxes, is earned from settlement date, recorded on the accrual basis, and adjusted, if necessary, for accretion of discounts and amortization of premiums. Realized gains (losses) from securities sold are determined based on specific lot identification.
Currency Translation
All assets and liabilities initially expressed in foreign currency values are converted into U.S. dollar values at the mean of the bid and ask prices of such currencies against U.S. dollars as last quoted by a recognized dealer. Income, expenses, and purchases and sales of investments are translated into U.S. dollars at the rate of the
31
American Beacon FundsSM
Notes to Financial Statements
June 30, 2024
exchange prevailing on the respective dates of such transactions. The effect of changes in foreign currency exchange rates on investments is separately identified from the fluctuations arising from changes in market values of securities held and is reported with all other foreign currency gains and losses on the Funds’ Statements of Operations.
Distributions to Shareholders
Prior to January 1, 2024, the SSI Alternative Income Fund distributed most or all of its net earnings and realized gains, if any, each taxable year in the form of dividends from net investment income on a semi-annual basis and distributions of realized net capital gains and net gains from foreign currency transactions on an annual basis. Beginning January 1, 2024, the SSI Alternative Income Fund began distributing most of all of its net investment income on a monthly basis. The TwentyFour Strategic Income Fund and TwentyFour Sustainable Short Term Bond Fund distribute most or all of their net earnings and realized gains, if any, each taxable year in the form of dividends from net investment income on a monthly basis and distributions of realized net capital gains and net gains from foreign currency transactions on an annual basis. The Funds do not have a fixed dividend rate and do not guarantee that they will pay any distributions in any particular period. Dividends to shareholders are determined in accordance with federal income tax regulations, which may differ in amount and character from net investment income and realized gains recognized for purposes of U.S. GAAP. To the extent necessary to fully distribute capital gains, the Funds may designate earnings and profits distributed to shareholders on the redemption of shares.
Allocation of Income, Trust Expenses, Gains, and Losses
Investment income and realized and unrealized gains and losses from investments of the Funds are allocated daily to each class of shares based upon the relative proportion of net assets of each class to the total net assets of the Funds. Expenses directly charged or attributable to a Fund will be paid from the assets of a Fund. Generally, expenses of the Trust will be allocated among and charged to the assets of the Funds on a basis that the Trust’s Board of Trustees (the “Board”) deems fair and equitable, which may be based on the relative net assets of the Funds or nature of the services performed and relative applicability to the Funds.
Use of Estimates
The preparation of financial statements in conformity with U.S. GAAP requires management to make estimates and assumptions that affect the amounts reported in the financial statements and accompanying notes. Actual results may differ from those estimated.
Other
Under the Trust’s organizational documents, its officers and trustees are indemnified against certain liabilities arising out of the performance of their duties to the Trust. In the normal course of business, the Trust enters into contracts that provide indemnification to the other party or parties against potential costs or liabilities. The Trust’s maximum exposure under these arrangements is dependent on claims that may be made in the future and, therefore, cannot be estimated. The Trust has had no prior claims or losses pursuant to any such agreement.
2. Transactions with Affiliates
Management and Investment Sub-Advisory Agreements
The Funds and the Manager are parties to a Management Agreement that obligates the Manager to provide the Funds with investment advisory and administrative services. As compensation for performing the duties under
32
American Beacon FundsSM
Notes to Financial Statements
June 30, 2024
the Management Agreement, the Manager will receive an annualized management fee based on a percentage of each Fund’s average daily net assets that is calculated and accrued daily according to the following schedule:
| | | | |
First $5 billion | | | 0.35 | % |
Next $5 billion | | | 0.325 | % |
Next $10 billion | | | 0.30 | % |
Over $20 billion | | | 0.275 | % |
The Trust, on behalf of the Funds, and the Manager have entered into Investment Advisory Agreements with SSI Investment Management LLC and TwentyFour Asset Management (US) LP (the “Sub-Advisors”) pursuant to which the Funds have agreed to pay annualized sub-advisory fees that are calculated and accrued daily based on each Fund’s average daily net assets according to the following schedule:
SSI Alternative Income Fund
| | | | |
First $300 million | | | 0.95 | % |
Over $300 million | | | 0.85 | % |
TwentyFour Strategic Income Fund
| | | | |
First $1 billion | | | 0.32 | % |
Over $1 billion | | | 0.27 | % |
TwentyFour Sustainable Short Term Bond Fund
| | | | |
First $200 million | | | 0.20 | % |
Next $200 million | | | 0.185 | % |
Next $700 million | | | 0.175 | % |
Over $1.1 billion | | | 0.17 | % |
Effective December 20, 2022, the Sub-Advisor to the SSI Alternative Income Fund has contractually agreed to waive a portion of its sub-advisory fee equal to 0.44% of the SSI Alternative Income Fund’s average daily net assets managed by the Sub-Advisor through October 31, 2024. On December 29, 2023, Sub-Advisor contractually agreed to extend the waiver agreement through December 31, 2025. The contractual fee waiver by the Sub-Advisor can be modified only in the discretion and with the approval of a majority of the Board. For the year ended June 30, 2024, the Sub-Advisor waived $528,378 of its sub-advisory fees.
The Management and Sub-Advisory Fees paid by each Fund for the year ended June 30, 2024 were as follows:
SSI Alternative Income Fund
| | | | | | | | | | | | |
| | | Effective Fee Rate | | | | | | Amount of Fees Paid | |
Management Fees | | | 0.35 | % | | | | | | $ | 420,302 | |
Sub-Advisory Fees | | | 0.95 | % | | | | | | | 1,140,818 | |
| | | | | | | | | | | | |
Total | | | 1.30 | % | | | | | | $ | 1,561,120 | |
| | | | | | | | | | | | |
TwentyFour Strategic Income Fund
| | | | | | | | | | | | |
| | | Effective Fee Rate | | | | | | Amount of Fees Paid | |
Management Fees | | | 0.35 | % | | | | | | $ | 525,002 | |
Sub-Advisory Fees | | | 0.32 | % | | | | | | | 480,002 | |
| | | | | | | | | | | | |
Total | | | 0.67 | % | | | | | | $ | 1,005,004 | |
| | | | | | | | | | | | |
33
American Beacon FundsSM
Notes to Financial Statements
June 30, 2024
TwentyFour Sustainable Short Term Bond Fund
| | | | | | | | | | | | |
| | | Effective Fee Rate | | | | | | Amount of Fees Paid | |
Management Fees | | | 0.35 | % | | | | | | $ | 43,048 | |
Sub-Advisory Fees | | | 0.20 | % | | | | | | | 24,598 | |
| | | | | | | | | | | | |
Total | | | 0.55 | % | | | | | | $ | 67,646 | |
| | | | | | | | | | | | |
Distribution Plans
Separate Distribution Plans (the “Distribution Plans”) have been adopted pursuant to Rule 12b-1 under the Act for the A and C Classes of the TwentyFour Strategic Income Fund and the TwentyFour Sustainable Short Term Bond Fund. Under the Distribution Plans, as compensation for distribution and shareholder servicing assistance, the Manager receives an annual fee of 0.25% of the average daily net assets of the A Class and 1.00% of the average daily net assets of the C Class. The fee will be payable without regard to whether the amount of the fee is more or less than the actual expenses incurred in a particular month by the Manager for distribution assistance.
Service Plans
The Manager and the Trust entered into Service Plans that obligate the Manager to oversee additional shareholder servicing of the Investor, A, and C Classes of the Funds. As compensation for performing the duties required under the Service Plans, the Manager receives an annualized fee up to 0.25% of the average daily net assets of the A and C Classes and up to 0.375% of the average daily net assets of the Investor Class of the Funds.
Sub-Transfer Agent Fees
The Manager has entered into agreements, which include servicing agreements, with financial intermediaries that provide recordkeeping, processing, shareholder communications and other services to customers of the intermediaries that hold positions in the R5 and Y Classes of the Funds and has agreed to compensate the intermediaries for providing these services. Intermediaries transact with the Funds primarily through the use of omnibus accounts on behalf of their customers who hold positions in the Funds. Certain services would have been provided by the Funds’ transfer agent and other service providers if the shareholders’ accounts were maintained directly by the Funds’ transfer agent. Accordingly, the Funds, pursuant to Board approval, have agreed to reimburse the Manager for certain non-distribution shareholder services provided by financial intermediaries for the R5 and Y Classes. The reimbursement amounts (sub-transfer agent fees) paid to the Manager are subject to a fee limit of up to 0.10% of an intermediary’s average net assets in the R5 and Y Classes on an annual basis. During the year ended June 30, 2024, the sub-transfer agent fees, as reflected in “Transfer agent fees” on the Statements of Operations, were as follows:
| | | | |
Fund | | Sub-Transfer Agent Fees | |
SSI Alternative Income | | $ | 92,291 | |
TwentyFour Strategic Income | | | 104,144 | |
TwentyFour Sustainable Short Term Bond | | | 8,541 | |
As of June 30, 2024, the Funds owed the Manager the following reimbursement of sub-transfer agent fees, as reflected in “Transfer agent fees payable” on the Statements of Assets and Liabilities:
| | | | |
Fund | | Reimbursement
Sub-Transfer Agent Fees | |
SSI Alternative Income | | $ | 9,690 | |
TwentyFour Strategic Income | | | 13,663 | |
TwentyFour Sustainable Short Term Bond | | | 963 | |
34
American Beacon FundsSM
Notes to Financial Statements
June 30, 2024
Investments in Affiliated Funds
The Funds may invest in the American Beacon U.S. Government Money Market Select Fund (the “USG Select Fund”). The Funds listed below held the following shares with a June 30, 2024 fair value and dividend income earned from the investment in the USG Select Fund.
| | | | | | | | | | | | | | | | | | | | | | | | | | | | | | | | | | | | | | | | | | | | | | | | |
Affiliated Security | | Type of
Transaction | | | | | Fund | | | | | June 30,
2024
Shares/Principal | | | | | | Change in
Unrealized
Gain (Loss) | | | | | | Realized
Gain
(Loss) | | | | | | Dividend
Income | | | | | | June 30,
2024
Fair Value | |
| U.S. Government Money Market Select | | Direct | | | | | | SSI Alternative
Income | | | | | | $ | 26,876,633 | | | | | | | $ | - | | | | | | | $ | - | | | | | | | $ | 501,942 | | | | | | | $ | 26,876,633 | |
| U.S. Government Money Market Select | | Direct | | | | | | TwentyFour
Strategic Income | | | | | | | 3,501,286 | | | | | | | | - | | | | | | | | - | | | | | | | | 334,094 | | | | | | | | 3,501,286 | |
The Funds and the USG Select Fund have the same investment advisor and therefore, are considered to be affiliated. The Manager serves as investment advisor to the USG Select Fund and receives management fees and administrative fees totaling 0.10% of the average daily net assets of the USG Select Fund. During the year ended June 30, 2024, the Manager earned fees on the Funds’ direct investments in the USG Select Fund as shown below:
| | | | |
Fund | | Direct Investments in
USG Select Fund | |
SSI Alternative Income | | $ | 9,649 | |
TwentyFour Strategic Income | | | 6,430 | |
Interfund Credit Facility
Pursuant to an exemptive order issued by the U.S. Securities and Exchange Commission (“SEC”), the Funds, along with other registered investment companies having management contracts with the Manager, may participate in a credit facility whereby each fund, under certain conditions, is permitted to lend money directly to and borrow directly from other participating funds for temporary purposes. The interfund credit facility is advantageous to the funds because it provides added liquidity and eliminates the need to maintain higher cash balances to meet redemptions. This situation could arise when shareholder redemptions exceed anticipated volumes and certain funds have insufficient cash on hand to satisfy such redemptions or when sales of securities do not settle as expected, resulting in a cash shortfall for a fund. The credit facility provides a source of immediate, short-term liquidity pending settlement of the sale of portfolio securities. The credit facility is administered by a credit facility team consisting of professionals from the Manager’s asset management, compliance, and accounting areas who report the activities of the credit facility to the Board. During the year ended June 30, 2024, the TwentyFour Sustainable Short Term Bond Fund borrowed on average $979,901 for 5 days at an average interest rate of 6.14% with interest charges of $824. These amounts are recorded as “Loan expense” in the Statements of Operations. For the year ended June 30, 2024, the SSI Alternative Income Fund and TwentyFour Strategic Income Fund did not utilize the credit facility.
Expense Reimbursement Plan
The Manager contractually agreed to reduce fees and/or reimburse expenses for the classes of the Funds, through October 31, 2024, to the extent that total operating expenses (excluding taxes, interest, brokerage commissions, acquired fund fees and expenses, securities lending fees, expenses associated with securities sold
35
American Beacon FundsSM
Notes to Financial Statements
June 30, 2024
short, litigation, and other extraordinary expenses) exceed the Funds’ expense cap. During the year ended June 30, 2024, the Manager waived and/or reimbursed expenses as follows:
| | | | | | | | | | | | | | | | | | | | | | |
| | | | | Expense Cap | | | | | | | | | Expiration of
Reimbursed
Expenses | |
Fund | | Class | | 7/1/2023 -
10/31/2023 | | | 11/1/2023 -
6/30/2024 | | | Reimbursed
Expenses | | | (Recouped)
Expenses | |
SSI Alternative Income | | R5 | | | 0.92 | % | | | 0.92 | % | | $ | 27,214 | | | $ | - | | | | 2026-2027 | |
SSI Alternative Income | | Y | | | 0.99 | % | | | 0.99 | % | | | 158,829 | | | | - | | | | 2026-2027 | |
SSI Alternative Income | | Investor | | | 1.24 | % | | | 1.24 | % | | | 6,402 | | | | - | | | | 2026-2027 | |
TwentyFour Strategic Income | | R5 | | | 0.72 | % | | | 0.72 | % | | | 20,296 | | | | - | | | | 2026-2027 | |
TwentyFour Strategic Income | | Y | | | 0.80 | % | | | 0.80 | % | | | 231,984 | | | | - | | | | 2026-2027 | |
TwentyFour Strategic Income | | Investor | | | 1.09 | % | | | 1.09 | % | | | 17,567 | | | | (698 | )* | | | 2026-2027 | |
TwentyFour Strategic Income | | A | | | 1.00 | % | | | 1.00 | % | | | 28,266 | | | | - | | | | 2026-2027 | |
TwentyFour Strategic Income | | C | | | 1.79 | % | | | 1.79 | % | | | 9,483 | | | | - | | | | 2026-2027 | |
TwentyFour Sustainable Short Term Bond | | Y | | | 0.57 | % | | | 0.57 | % | | | 151,398 | | | | - | | | | 2026-2027 | |
TwentyFour Sustainable Short Term Bond | | A | | | 0.87 | % | | | 0.87 | % | | | 1,981 | | | | - | | | | 2026-2027 | |
TwentyFour Sustainable Short Term Bond | | C | | | 1.62 | % | | | 1.48 | % | | | 10,781 | | | | - | | | | 2026-2027 | |
TwentyFour Sustainable Short Term Bond | | R6 | | | 0.47 | % | | | 0.47 | % | | | 53,273 | | | | - | | | | 2026-2027 | |
* This amount represents Recouped Expenses from prior fiscal years and is reflected in Other expenses on the Statements of Operations.
Of the above amounts, $9,948, $38,662, and $25,704 were disclosed as a Receivable for expense reimbursement on the Statements of Assets and Liabilities at June 30, 2024 for the SSI Alternative Income Fund, TwentyFour Strategic Income Fund, and TwentyFour Sustainable Short Term Bond Fund, respectively.
The Funds have adopted an Expense Reimbursement Plan whereby the Manager may seek repayment of contractual or voluntary fee reductions and expense reimbursements. Under the policy, the Manager can be reimbursed by the Funds for any contractual or voluntary fee reductions or expense reimbursements if reimbursement to the Manager (a) occurs within three years from the date of the Manager’s waiver/reimbursement and (b) does not cause the Funds’ annual operating expenses to exceed the lesser of the contractual percentage limit in effect at the time of the waiver/reimbursement or time of recoupment. The reimbursed expenses listed above will expire in 2026 and 2027. The Funds’ did not record a liability for potential contingent reimbursements due to the current assessment that reimbursements are uncertain. The carryover of excess expenses potentially reimbursable to the Manager, but not recorded as a liability are as follows:
| | | | | | | | | | | | | | | | |
Fund | | Recouped
Expenses | | | Excess Expense
Carryover | | | Expired Expense
Carryover | | | Expiration of
Reimbursed
Expenses | |
SSI Alternative Income | | $ | - | | | $ | - | | | $ | 62,663 | | | | 2023-2024 | |
SSI Alternative Income | | | - | | | | 16,937 | | | | - | | | | 2024-2025 | |
SSI Alternative Income | | | - | | | | 115,232 | | | | - | | | | 2025-2026 | |
TwentyFour Strategic Income | | | 698 | | | | - | | | | 265,077 | | | | 2023-2024 | |
TwentyFour Strategic Income | | | - | | | | 307,340 | | | | - | | | | 2024-2025 | |
TwentyFour Strategic Income | | | - | | | | 325,416 | | | | - | | | | 2025-2026 | |
TwentyFour Sustainable Short Term Bond | | | - | | | | - | | | | 323,848 | | | | 2023-2024 | |
TwentyFour Sustainable Short Term Bond | | | - | | | | 234,153 | | | | - | | | | 2024-2025 | |
TwentyFour Sustainable Short Term Bond | | | - | | | | 190,316 | | | | - | | | | 2025-2026 | |
Concentration of Ownership
From time to time, the Funds may have a concentration of one or more accounts constituting a significant percentage of shares outstanding. Investment activities by holders of accounts that represent a significant ownership of more than 5% of the Funds’ outstanding shares could have a material impact on the Funds. As of
36
American Beacon FundsSM
Notes to Financial Statements
June 30, 2024
June 30, 2024, based on management’s evaluation of the shareholder account base, one account has been identified as representing an unaffiliated significant ownership of approximately 34% for the SSI Alternative Income Fund.
Sales Commissions
The Funds’ Distributor, Resolute Investment Distributors, Inc. (“RID” or “Distributor”), may receive a portion of A Class sales charges from broker dealers which may be used to offset distribution related expenses. During the year ended June 30, 2024, RID collected $4,249 and $47 for TwentyFour Strategic Income Fund and TwentyFour Sustainable Short Term Bond Fund, respectively, from the sale of A Class Shares.
A CDSC of 0.50% will be deducted with respect to A Class Shares on certain purchases of $1,000,000 or more that are redeemed in whole or part within 18 months of purchase, unless waived as discussed in the Funds’ Prospectus. Any applicable CDSC will be 0.50% of the lesser of the original purchase price or the value of the redemption of the A Class Shares redeemed. During the year ended June 30, 2024, there were no CDSC fees collected for the A Class Shares of the TwentyFour Strategic Income Fund or TwentyFour Sustainable Short Term Bond Fund.
A CDSC of 1.00% will be deducted with respect to C Class Shares redeemed within 12 months of purchase, unless waived as discussed in the Funds’ Prospectus. Any applicable CDSC will be 1.00% of the lesser of the original purchase price or the value of the redemption of the C Class Shares redeemed. During the year ended June 30, 2024, CDSC fees of $5,794 and $1,349 were collected for the C Class Shares of TwentyFour Strategic Income Fund and TwentyFour Sustainable Short Term Bond Fund, respectively.
Trustee Fees and Expenses
As compensation for their service to the American Beacon Funds Complex, including the Trust (collectively, the “Trusts”), each Trustee is compensated from the Trusts as follows: (1) an annual retainer of $140,000; (2) meeting attendance fee (for attendance in-person or via teleconference) of (a) $12,000 for in person attendance, or $5,000 for telephonic attendance, by Board members for each regularly scheduled or special Board meeting, (b) $2,500 for attendance by Committee members at meetings of the Audit and Compliance Committee and the Investment Committee, (c) $1,000 for attendance by Committee members at meetings of the Nominating and Governance Committee; and (d) $2,500 for attendance by Board members for each special telephonic Board meeting; and (3) reimbursement of reasonable expenses incurred in attending Board meetings, Committee meetings, and relevant educational seminars. For this purpose, the Board considers attendance at regular meetings held by video conference to constitute in-person attendance at a Board meeting. The Trustees also may be compensated for attendance at special Board and/or Committee meetings from time to time. For her service as Board Chair, Ms. Cline receives an additional annual retainer of $50,000. Although she attends several committee meetings at each quarterly Board meeting, she receives only a single $2,500 fee each quarter for her attendance at the Audit and Compliance Committee and Investment Committee meetings. The chairpersons of the Audit and Compliance Committee and the Investment Committee each receive an additional annual retainer of $25,000 and the Chair of the Nominating and Governance Committee receives an additional annual retainer of $10,000.
3. Security Valuation and Fair Value Measurements
The price of each Fund’s shares is based on its net asset value (“NAV”) per share. Each Fund’s NAV is computed by adding total assets, subtracting all the Fund’s liabilities, and dividing the result by the total number of shares outstanding.
The NAV of each class of a Fund’s shares is determined based on a pro rata allocation of a Fund’s investment income, expenses and total capital gains and losses. A Fund’s NAV per share is determined each business day as of the regular close of trading on the New York Stock Exchange (“NYSE” or “Exchange”), which is typically 4:00 p.m.
37
American Beacon FundsSM
Notes to Financial Statements
June 30, 2024
Eastern Time (“ET”). However, if trading on the NYSE closes at a time other than 4:00 p.m. ET, a Fund’s NAV per share typically would still be determined as of the regular close of trading on the NYSE. The Funds do not price their shares on days that the NYSE is closed. Foreign exchanges may permit trading in foreign securities on days when a Fund is not open for business, which may result in the value of a Fund’s portfolio investments being affected at a time when you are unable to buy or sell shares.
Equity securities, including shares of closed-end funds and exchange-traded funds (“ETFs”), are valued at the last sale price or official closing price taken from the primary exchange in which each security trades. Investments in other mutual funds are valued at the closing NAV per share on the day of valuation. Debt securities are valued at bid quotes from broker/dealers or evaluated bid prices from pricing services, who may consider a number of inputs and factors, such as prices of comparable securities, yield curves, spreads, credit ratings, coupon rates, maturity, default rates, and underlying collateral. Futures are valued based on their daily settlement prices. Exchange-traded and over-the-counter (“OTC”) options are valued at the last sale price. Options with no last sale for the day are priced at mid quote. Swaps are valued at evaluated mid prices from pricing services.
The valuation of securities traded on foreign markets and certain fixed-income securities will generally be based on prices determined as of the earlier closing time of the markets on which they primarily trade unless a significant event has occurred. When a Fund holds securities or other assets that are denominated in a foreign currency, a Fund will normally use the currency exchange rates as of 4:00 p.m. ET.
Rule 2a-5 under the Investment Company Act (the “Valuation Rule”) establishes requirements for determining fair value in good faith for purposes of the Investment Company Act, including related oversight and reporting requirements. The Valuation Rule also defines when market quotations are “readily available,” which is the threshold for determining whether a Fund must fair value a security. Among other things, the Valuation Rule permits the Board to designate the Manager as Valuation Designee to perform the Fund’s fair value determinations subject to board oversight and certain reporting and other requirements intended to ensure that the Board receives the information it needs to oversee the Manager’s fair value determinations. Effective September 8, 2022, the Board has designated the Manager as valuation designee to perform fair value functions in accordance with the requirements of the Valuation Rule.
Securities may be valued at fair value, as determined in good faith and pursuant to the Manager’s procedures, under certain limited circumstances. For example, fair value pricing will be used for fixed-income securities and when market quotations are not readily available or reliable, as determined by the Manager, such as when (i) trading for a security is restricted or stopped; (ii) a security’s trading market is closed (other than customary closings); or (iii) a security has been de-listed from a national exchange. A security with limited market liquidity may require fair value pricing if the Manager determines that the available price does not reflect the security’s true market value. In addition, if a significant event that the Manager determines to affect the value of one or more securities held by a Fund occurs after the close of a related exchange but before the determination of a Fund’s NAV, fair value pricing may be used on the affected security or securities. Securities of small-capitalization companies are also more likely to require a fair value determination using these procedures because they are more thinly traded and less liquid than the securities of larger-capitalization companies. The Funds may fair value securities as a result of significant events occurring after the close of the foreign markets in which a Fund invests as described below. In addition, the Funds may invest in illiquid securities requiring these procedures.
A Fund may use fair value pricing for securities primarily traded in non-U.S. markets because most foreign markets close well before a Fund’s pricing time of 4:00 p.m. ET. The earlier close of these foreign markets gives rise to the possibility that significant events, including broad market moves, may have occurred in the interim and may materially affect the value of those securities. If the Manager determines that the last quoted prices of non-U.S. securities will, in its judgment, materially affect the value of some or all a Fund’s portfolio securities, the Manager can adjust the previous closing prices to reflect what it believes to be the fair value of the securities as of the close of the Exchange. In deciding whether it is necessary to adjust closing prices to reflect fair value, the
38
American Beacon FundsSM
Notes to Financial Statements
June 30, 2024
Manager reviews a variety of factors, including developments in foreign markets, the performance of U.S. securities markets, and the performance of instruments trading in U.S. markets that represent foreign securities and baskets of foreign securities. These securities are fair valued using a pricing service, using methods approved by the Manager, that considers the correlation of the trading patterns of the foreign security to intraday trading in the U.S. markets, based on indices of domestic securities and other appropriate indicators such as prices of relevant American Depositary Receipts (“ADRs”) and futures contracts. The Manager’s Valuation Committee may also fair value securities in other situations, such as when a particular foreign market is closed but a Fund is open. A Fund uses outside pricing services to provide closing prices and information to evaluate and/or adjust those prices. As a means of evaluating its security valuation process, the Valuation Committee routinely compares closing prices, the next day’s opening prices in the same markets and adjusted prices.
Attempts to determine the fair value of securities introduce an element of subjectivity to the pricing of securities. As a result, the price of a security determined through fair valuation techniques may differ from the price quoted or published by other sources and may not accurately reflect the market value of the security when trading resumes. If a reliable market quotation becomes available for a security formerly valued through fair valuation techniques, the Manager compares the new market quotation to the fair value price to evaluate the effectiveness of a Fund’s fair valuation procedures. If any significant discrepancies are found, the Manager may adjust Manager’s fair valuation procedures for a Fund.
Investments in open-end mutual funds are valued at the closing NAV per share of the mutual fund on the day of valuation.
Securities for which the market prices are not readily available or are not reflective of the fair value of the security, as determined by the Manager, will be priced at fair value following procedures approved by the Board.
Other investments for which the above valuation procedures are inappropriate or are deemed not to reflect fair value, are stated at fair value as determined in good faith by the Manager’s Valuation Committee, pursuant to procedures established by the Board.
Valuation Inputs
Various inputs may be used to determine the fair value of the Funds’ investments. These inputs are summarized in three broad levels for financial statement purposes. The inputs or methodologies used to value securities are not necessarily an indication of the risk associated with investing in those securities.
| | | | |
| Level 1 | | - | | Quoted prices in active markets for identical securities. |
| | |
| Level 2 | | - | | Prices determined using other significant observable inputs. These may include quoted prices for similar securities, interest rates, prepayment speeds, credit risk, and others. |
| | |
| Level 3 | | - | | Prices determined using other significant unobservable inputs. Unobservable inputs reflect a Fund’s own assumptions about the factors market participants would use in pricing an investment. |
Level 1 and Level 2 trading assets and trading liabilities, at fair value
Fixed-income securities including corporate, convertible and municipal bonds and notes, U.S. government agencies, U.S. Treasury obligations, sovereign issues, bank loans, convertible preferred securities, and non-U.S. bonds are normally valued by pricing service providers that use broker dealer quotations, reported trades or valuation estimates from their internal pricing models. The service providers’ internal models use inputs that are observable such as issuer details, interest rates, yield curves, prepayment speeds, credit risks/spreads, default rates, and quoted prices for similar assets. Securities that use similar valuation techniques and inputs as described above are categorized as Level 2 of the fair value hierarchy. Fixed-income securities purchased on a delayed-delivery basis are marked-to-market daily until settlement at the forward settlement date and are categorized as Level 2 of the fair value hierarchy.
39
American Beacon FundsSM
Notes to Financial Statements
June 30, 2024
Mortgage-related and asset-backed securities (“ABS”) are usually issued as separate tranches, or classes, of securities within each deal. These securities are also normally valued by pricing service providers that use broker-dealer quotations or valuation estimates from their internal pricing models. The pricing models for these securities usually consider tranche-level attributes, current market data, estimated cash flows, and market-based yield spreads for each tranche, and incorporates deal collateral performance, as available. Mortgage-related and ABS that use similar valuation techniques and inputs as described above are categorized as Level 2 of the fair value hierarchy.
Common stocks, ETFs, preferred securities and financial derivative instruments, such as futures contracts or options that are traded on a national securities exchange, are stated at the last reported sale or settlement price on the day of valuation. To the extent these securities are actively traded and valuation adjustments are not applied, they are categorized as Level 1 of the fair value hierarchy. Preferred securities and other equities traded on inactive markets or valued by reference to similar instruments are generally categorized as Level 2 of the fair value hierarchy. Valuation adjustments may be applied to certain securities that are solely traded on a foreign exchange to account for the market movement between the close of the foreign market and the close of the Exchange. These securities are valued using pricing service providers that consider the correlation of the trading patterns of the foreign security to the intraday trading in the U.S. markets for investments. Securities using these valuation adjustments are categorized as Level 2 of the fair value hierarchy.
With respect to a Fund’s investments that do not have readily available market quotations, the Board has designated the Adviser as its valuation designee to perform fair valuations pursuant to Rule 2a-5 under the Act (the “Valuation Designee”). If market prices are not readily available or are deemed unreliable, the Valuation Designee will use the fair value of the security or other instrument as determined in good faith under policies and procedures established by and under the supervision of the Board (“Valuation Procedures”). Market prices are considered not readily available where there is an absence of current or reliable market-based data (e.g., trade information or broker quotes), including where events occur after the close of the relevant market, but prior to the NYSE Close, that materially affect the values of a Fund’s portfolio holdings or assets. In addition, market prices are considered not readily available when, due to extraordinary circumstances, the exchanges or markets on which the securities or other instruments trade do not open for trading for the entire day and no other market prices are available. Fair value pricing is subjective in nature and the use of fair value pricing by the Valuation Designee may cause the NAV of a Fund’s shares to differ significantly from the NAV that would have been calculated using market prices at the close of the exchange on which a portfolio holding is primarily traded. There can be no assurance that a Fund could obtain the fair value assigned to an investment if a Fund were to sell the investment at approximately the time at which a Fund determines its NAV.
Investments in registered open-end investment management companies will be valued based upon the NAVs of such investments and are categorized as Level 1 of the fair value hierarchy.
OTC financial derivative instruments, such as forward foreign currency contracts derive their value from underlying asset prices, indices, reference rates, and other inputs or a combination of these factors. These contracts are normally valued on the basis of broker dealer quotations or pricing service providers. Depending on the product and the terms of the transaction, the fair value of the financial derivative contracts can be estimated by a pricing service provider using a series of techniques, including simulation pricing models. The pricing models use inputs that are observed from actively quoted markets such as issuer details, indices, spreads, interest rates, curves, dividends, and exchange rates. Financial derivatives that use similar valuation techniques and inputs as described above are categorized as Level 2 of the fair value hierarchy.
4. Securities and Other Investments
Asset-Backed and Mortgage-Related Securities
ABS are fractional interests in pools of loans, receivables or other assets. They are issued by trusts or other special purpose vehicles and are collateralized by the loans, receivables or other assets that make up the pool. The
40
American Beacon FundsSM
Notes to Financial Statements
June 30, 2024
trust or other issuer passes the income from the underlying asset pool to the investor. A Fund, the Manager, and the sub-advisor do not select the loans or other assets that are included in the collateral backing those pools.
A Fund may also invest in debt obligations of U.S. Government-sponsored enterprises, including Fannie Mae, Freddie Mac, FFCB and the Tennessee Valley Authority. Although chartered or sponsored by Acts of Congress, these entities are not backed by the full faith and credit of the U.S. Government. Fannie Mae and Freddie Mac are supported by the issuers’ right to borrow from the U.S. Treasury, the discretionary authority of the U.S. Treasury to lend to the issuers. These securities may include mortgage instruments issued by U.S. government agencies (“agency mortgages”) or those issued by private entities (“non-agency mortgages”). Specific types of instruments may include mortgage pass-through securities, collateralized mortgage obligations (“CMOs”), commercial mortgage-backed securities, mortgage dollar rolls, CMO residuals, stripped mortgage-backed securities and other securities that directly or indirectly represent a participation in, or are secured by a payable from, mortgage loans on real property.
The TwentyFour Strategic Income Fund and TwentyFour Sustainable Short Term Bond Fund may invest in ABS and mortgage-related securities, including CMOs and mortgage-related securities issued by private organizations which are debt securities collateralized by mortgages or mortgage pass-through securities. CMOs divide the cash flow generated from the underlying mortgages or mortgage pass-through securities into different groups referred to as “tranches,” which are then retired sequentially over time in order of priority. The principal governmental issuers of such securities Fannie Mae, a government sponsored corporation owned entirely by private stockholders, and Freddie Mac, a corporate instrumentality of the United States created pursuant to an act of Congress that is owned entirely by the Federal Home Loan Banks. The issuers of CMOs are structured as trusts or corporations established for the purpose of issuing such CMOs and often have no assets other than those underlying the securities and any credit support provided. Mortgage-related securities are pools created by non-governmental issuers generally offering a higher rate of interest than government and government-related pools because there are no direct or indirect government guarantees of payments in such pools. However, timely payment of interest and principal of these pools is often partially supported by various enhancements such as over-collateralization and senior/subordination structures and by various forms of insurance or guarantees, including individual loan, title, pool and hazard insurance. The insurance and guarantees are issued by government entities, private insurers or the mortgage poolers. Although the market for such securities is becoming increasingly liquid, securities issued by certain private organizations may not be readily marketable.
Common Stock
Common stock generally takes the form of shares in a corporation which represent an ownership interest. It ranks below preferred stock and debt securities in claims for dividends and for assets of the company in a liquidation or bankruptcy. The value of a company’s common stock may fall as a result of factors directly relating to that company, such as decisions made by its management or decreased demand for the company’s products or services. A stock’s value may also decline because of factors affecting not just the company, but also companies in the same industry or sector. The price of a company’s stock may also be affected by changes in financial markets that are relatively unrelated to the company, such as changes in interest rates, currency exchange rates or industry regulation. Companies that elect to pay dividends on their common stock generally only do so after they invest in their own business and make required payments to bondholders and on other debt and preferred stock. Therefore, the value of a company’s common stock will usually be more volatile than its bonds, other debt and preferred stock. Common stock may be exchange-traded or OTC. OTC stock may be less liquid than exchange-traded stock.
Convertible Securities
Convertible securities include corporate bonds, notes, preferred stock or other securities that may be converted into or exchanged for a prescribed amount of common stock of the same or a different issuer within a particular period of time at a specified price or formula. A convertible security entitles the holder to receive interest paid or accrued on debt or dividends paid on preferred stock until the convertible security matures or is
41
American Beacon FundsSM
Notes to Financial Statements
June 30, 2024
redeemed, converted or exchanged. While no securities investment is without some risk, investments in convertible securities generally entail less risk than the issuer’s common stock, although the extent to which such risk is reduced depends in large measure upon the degree to which the convertible security sells above its value as a fixed income security. The market value of convertible securities tends to decline as interest rates increase and, conversely, to increase as interest rates decline. While convertible securities generally offer lower interest or dividend yields than non-convertible debt securities of similar quality, they do enable the investor to benefit from increases in the market price of the underlying common stock. Holders of convertible securities have a claim on the assets of the issuer prior to the common stockholders, but may be subordinated to holders of similar non-convertible securities of the same issuer. Because of the conversion feature, certain convertible securities may be considered equity equivalents.
Corporate Debt and Other Fixed-Income Securities
Typically, the values of fixed-income securities change inversely with prevailing interest rates. Therefore, a fundamental risk of fixed-income securities is interest rate risk, which is the risk that their value will generally decline as prevailing interest rates rise, which may cause a Fund’s net asset value to likewise decrease, and vice versa. How specific fixed-income securities may react to changes in interest rates will depend on the specific characteristics of each security. For example, while securities with longer maturities tend to produce higher yields, they also tend to be more sensitive to changes in prevailing interest rates and are therefore more volatile than shorter-term securities and are subject to greater market fluctuations as a result of changes in interest rates. In addition, there is prepayment risk, which is the risk that during periods of falling interest rates, certain fixed-income securities with higher interest rates may be prepaid by their issuers, thereby reducing the amount of interest payments. This may result in the Fund having to reinvest its proceeds in lower yielding securities. Fixed-income securities are also subject to credit risk, which is the risk that the credit strength of an issuer of a fixed-income security will weaken and/or that the issuer will be unable to make timely principal and interest payments and that the security may go into default.
Depositary Receipts and U.S. Dollar-Denominated Foreign Stocks Traded on U.S. Exchanges
ADRs are U.S. dollar-denominated receipts issued generally by domestic banks and represent the deposit with the bank of a security of a foreign issuer. Depositary receipts may not be denominated in the same currency as the securities into which they may be converted. Investing in depositary receipts and U.S. dollar-denominated foreign stocks traded on U.S. exchanges entails substantially the same risks as direct investment in foreign securities. There is generally less publicly available information about foreign companies and there may be less governmental regulation and supervision of foreign stock exchanges, brokers and listed companies. In addition, such companies may use different accounting and financial standards (and certain currencies may become unavailable for transfer from a foreign currency), resulting in a Fund’s possible inability to convert immediately into U.S. currency proceeds realized upon the sale of portfolio securities of the affected foreign companies. In addition, a Fund may invest in unsponsored depositary receipts, the issuers of which are not obligated to disclose material information about the underlying securities to investors in the United States. Ownership of unsponsored depositary receipts may not entitle a Fund to the same benefits and rights as ownership of a sponsored depositary receipt or the underlying security.
Floating Rate Securities
The coupons on certain fixed income securities in which the Funds may invest are not fixed and may fluctuate based upon changes in market rates. The coupon on a floating rate security is generally based on an interest rate such as a money market index, LIBOR or a Treasury bill rate. Floating rate obligations are less effective than fixed rate obligations at locking in a particular yield. Nevertheless, such obligations are subject to interest rate risk and may fluctuate in value in response to interest rate changes if there is a delay between changes in market interest rates and the interest reset date for the obligation, or for other reasons.
42
American Beacon FundsSM
Notes to Financial Statements
June 30, 2024
As short-term interest rates decline, the coupons on floating rate securities typically should decrease. Alternatively, during periods of increasing interest rates, changes in the coupons of floating rate securities may lag behind changes in market rates or may have limits on the maximum increases in the coupon rates. The value of floating rate securities may decline if their coupons do not rise as much, or as quickly, as interest rates in general. Floating rate securities will not generally increase in value if interest rates decline.
Foreign Debt Securities
The TwentyFour Strategic Income Fund and TwentyFour Sustainable Short Term Bond Fund may each invest a significant portion of its assets in a particular geographic region or country. The TwentyFour Strategic Income Fund may invest significantly in emerging markets and may consider a country to be an emerging market country based on a number of factors including, but not limited to, if the country is classified as an emerging or developing economy by any supranational organization such as the World Bank, International Finance Corporation or the United Nations, or related entities, or if the country is considered an emerging market country for purposes of constructing emerging market indices. Sovereign debt securities are typically issued or guaranteed by national governments in order to finance the issuing country’s growth and/or budget. Investing in foreign sovereign debt securities will expose the Funds to the direct or indirect consequences of political, social or economic changes in the countries that issue the debt securities. Quasi-sovereign debt securities are debt securities either explicitly guaranteed by a foreign government or their agencies or whose majority shareholder is a foreign government. Supranational organizations are entities designated or supported by a government or governmental group to promote economic development. Supranational organizations have no taxing authority and are dependent on their members for payments of interest and principal. Obligations of a supranational entity may be denominated in foreign currencies.
High-Yield Bonds
High-yield, non-investment-grade bonds (also known as “junk bonds”) are low-quality, high-risk corporate bonds that generally offer a high level of current income. These bonds are considered speculative by rating organizations. For example, Moody’s, S&P Global Ratings (“S&P Global”) and Fitch, Inc. rate them below Baa and BBB, respectively. High-yield bonds are often issued as a result of corporate restructurings, such as leveraged buyouts, mergers, acquisitions, or other similar events. They may also be issued by smaller, less creditworthy companies or by highly leveraged firms, which are generally less able to make scheduled payments of interest and principal than more financially stable firms. Because of their low credit quality, high-yield bonds must pay higher interest to compensate investors for the substantial credit risk they assume.
Lower-rated securities are subject to certain risks that may not be present with investments in higher-grade securities. Investors should consider carefully their ability to assume the risks associated with lower-rated securities before investing in a Fund. The lower rating of certain high yielding corporate income securities reflects a greater possibility that the financial condition of the issuer or adverse changes in general economic conditions may impair the ability of the issuer to pay income and principal. Changes by rating agencies in their ratings of a fixed income security also may affect the value of these investments. However, allocating investments in a Fund among securities of different issuers should reduce the risks of owning any such securities separately. The prices of these high yielding securities tend to be less sensitive to interest rate changes than higher-rated investments, but more sensitive to adverse economic changes or individual corporate developments. During economic downturns or periods of rising interest rates, highly leveraged issuers may experience financial stress that adversely affects their ability to service principal and interest payment obligations, to meet projected business goals or to obtain additional financing, and the markets for their securities may be more volatile. If an issuer defaults, a Fund may incur additional expenses to seek recovery. Additionally, accruals of interest income for a Fund may have to be adjusted in the event of default. In the event of an issuer’s default, a Fund may write off prior income accruals for that issuer, resulting in a reduction in a Fund’s current dividend payment. Frequently, the higher yields of high-yielding securities may not reflect the value of the income stream that holders of such securities may expect, but rather the risk that such securities may lose a substantial portion of their value as a result of their issuer’s financial
43
American Beacon FundsSM
Notes to Financial Statements
June 30, 2024
restructuring or default. Additionally, an economic downturn or an increase in interest rates could have a negative effect on the high-yield securities market and on the market value of the high-yield securities held by a Fund, as well as on the ability of the issuers of such securities to repay principal and interest on their borrowings.
Illiquid and Restricted Securities
Generally, an illiquid asset is an asset that the Funds reasonably expect cannot be sold or disposed of in current market conditions in seven calendar days or less without the sale or disposition significantly changing the market value of the investment, as determined pursuant to Rule 22e-4 under the Investment Company Act or as otherwise permitted or required by SEC rules and interpretations. Historically, illiquid securities have included securities that have not been registered under the Securities Act, securities that are otherwise not readily marketable, and repurchase agreements having a remaining maturity of longer than seven calendar days. Securities that have not been registered under the Securities Act are referred to as private placements or restricted securities and are purchased directly from the issuer or in the secondary market. These securities may be sold only in a privately negotiated transaction or pursuant to an exemption from registration. A large institutional market exists for certain securities that are not registered under the Securities Act, including repurchase agreements, commercial paper, foreign securities, municipal securities and corporate bonds and notes. Institutional investors depend on an efficient institutional market in which the unregistered security can be readily resold or on an issuer’s ability to honor a demand for repayment. However, the fact that there are contractual or legal restrictions on resale of such investments to the general public or to certain institutions may not be indicative of their liquidity.
Limitations on resale may have an adverse effect on the marketability of portfolio securities, and a Fund might be unable to dispose of restricted or other illiquid securities promptly or at reasonable prices and might thereby experience difficulty satisfying redemptions within seven calendar days. In addition, a Fund may get only limited information about an issuer, so it may be less able to predict a loss. A Fund also might have to register such restricted securities in order to dispose of them resulting in additional expense and delay. Adverse market conditions could impede such a public offering of securities.
In recognition of the increased size and liquidity of the institutional market for unregistered securities and the importance of institutional investors in the formation of capital, the SEC adopted Rule 144A under the Securities Act. Rule 144A is designed to facilitate efficient trading among institutional investors by permitting the sale of certain unregistered securities to qualified institutional buyers. To the extent privately placed securities held by a Fund qualify under Rule 144A and an institutional market develops for those securities, a Fund likely will be able to dispose of the securities without registering them under the Securities Act. To the extent that institutional buyers become, for a time, uninterested in purchasing these securities, investing in Rule 144A securities could increase the level of a Fund’s illiquidity. The Manager or the Sub-Advisor, as applicable, may determine that certain securities qualified for trading under Rule 144A are liquid. Regulation S under the Securities Act permits the sale abroad of securities that are not registered for sale in the United States and includes a provision for U.S. investors, such as a Fund, to purchase such unregistered securities if certain conditions are met.
Securities sold in private placement offerings made in reliance on the “private placement” exemption from registration afforded by Section 4(a)(2) of the Securities Act and resold to qualified institutional buyers under Rule 144A under the Securities Act (“Section 4(a)(2) securities”) are restricted as to disposition under the federal securities laws, and generally are sold to institutional investors, such as a Fund, that agree they are purchasing the securities for investment and not with an intention to distribute to the public. Any resale by the purchaser must be pursuant to an exempt transaction and may be accomplished in accordance with Rule 144A. Section 4(a)(2) securities normally are resold to other institutional investors through or with the assistance of the issuer or dealers that make a market in the Section 4(a)(2) securities, thus providing liquidity. The Manager and the sub-advisor will carefully monitor a Fund’s investments in Section 4(a)(2) securities offered and sold under Rule 144A, focusing on such important factors, among others, as valuation, liquidity, and availability of information. Investments in Section 4(a)(2) securities could have the effect of reducing a Fund’s liquidity to the extent that qualified institutional buyers no longer wish to purchase these restricted securities.
44
American Beacon FundsSM
Notes to Financial Statements
June 30, 2024
Restricted securities outstanding during the year ended June 30, 2024 are disclosed in the Notes to the Schedules of Investments.
Other Investment Company Securities and Other Exchange-Traded Products
The Funds may invest in shares of other investment companies, including open-end funds, closed-end funds, business development companies (“BDCs”), ETFs, unit investment trusts, and other investment companies of the Trust. The Funds may invest in securities of an investment company advised by the Manager or the Sub-Advisor. Investments in the securities of other investment companies may involve duplication of advisory fees and certain other expenses. By investing in another investment company, the Funds become a shareholder of that investment company. As a result, the Funds’ shareholders indirectly will bear the Funds’ proportionate share of the fees and expenses paid by shareholders of the other investment company, in addition to the fees and expenses the Funds’ shareholders directly bear in connection with the Funds’ own operations. These other fees and expenses are reflected as Acquired Fund Fees and Expenses and are included in the Fees and Expenses Table for the Funds in their Prospectus, if applicable. Investments in other investment companies may involve the payment of substantial premiums above the value of such issuer’s portfolio securities.
The Funds can invest free cash balances in registered open-end investment companies regulated as money market funds under the Act, to provide liquidity or for defensive purposes. The Funds could invest in money market funds rather than purchasing individual short-term investments. If the Funds invests in money market funds, shareholders will bear their proportionate share of the expenses, including for example, advisory and administrative fees, of the money market funds in which the Funds invest, including advisory fees charged by the Manager to any applicable money market funds advised by the Manager.
Payment-In-Kind Securities
The Funds may invest in payment-in-kind securities (“PIKs”). PIKs give the issuer the option at each interest payment date of making interest payments in either cash or additional debt securities. Those additional debt securities usually have the same terms, including maturity dates and interest rates, and associated risks as the original bonds. The daily market quotations of the original bonds may include the accrued interest (referred to as a dirty price) and require a pro-rata adjustment from the “Unrealized appreciation (depreciation) of investments” to “Dividend and interest receivable” in the Statements of Assets and Liabilities.
Preferred Stock
Preferred stock blends the characteristics of a bond and common stock. It can offer the higher yield of a bond and has priority over common stock in equity ownership, but does not have the seniority of a bond and its participation in the issuer’s growth may be limited. Preferred stock has preference over common stock in the receipt of dividends and in any residual assets after payment to creditors should the issuer be dissolved. Although the dividend is typically set at a fixed annual rate, in some circumstances it can be variable, changed or omitted by the issuer.
Real Estate Investment Trusts (“REITs”)
REITs are pooled investment vehicles that own, and often operate, income producing real estate (known as “equity REITs”) or invest in mortgages secured by loans on such real estate (known as “mortgage REITs”) or both (known as “hybrid REITs”). REITs are susceptible to the risks associated with direct ownership of real estate, such as declines in property values, increase in property taxes, operating expenses, rising interest rates or overbuilding, zoning changes, and losses from casualty or condemnation. REITs typically are subject to management fees and other expenses that are separate from those of a Fund.
45
American Beacon FundsSM
Notes to Financial Statements
June 30, 2024
Short Sales
The SSI Alternative Income Fund may enter into short sale transactions. A short sale is a transaction in which a Fund sells a security it does not own in anticipation of a decline in the market price of the security. Securities sold in short sale transactions and the dividends and interest payable on such securities, if any, are reflected as a liability. The Fund is obligated to deliver the security at the market price at the time the short position is closed. The risk of loss on a short sale transaction is theoretically unlimited, because there is no limit to the cost of replacing the security sold short, whereas losses from purchase transactions cannot exceed the total amount invested. As of June 30, 2024, short positions were held by the Fund and are disclosed in the Schedule of Investments. For the same period herein, securities pledged as collateral for short sales are disclosed in the Fund’s Schedule of Investments, and cash collateral for short sales are reflected as “Cash with brokers” on the Statements of Assets and Liabilities.
Variable and Floating Rate Securities
Variable and floating rate securities provide for a periodic adjustment in the interest rate paid on the obligations. A variable rate obligation has a coupon rate which is adjusted at predesignated periods in response to changes in the market rate of interest on which the coupon is based. The adjustment intervals may be regular, and range from daily up to annually, or may be event based, such as based on a change in the prime rate. Variable and floating rate obligations are less effective than fixed rate instruments at locking in a particular yield. Nevertheless, such obligations may fluctuate in value in response to interest rate changes if there is a delay between changes in market interest rates and the interest reset date for the obligation, or for other reasons.
A Fund may invest in floaters and engage in credit spread trades. The interest rate on a floater is a variable rate which is tied to another interest rate, such as a money-market index or U.S. Treasury bill rate. The interest rate on a floater resets periodically, typically every one or three months. While, because of the interest rate reset feature, floaters provide a Fund with a certain degree of protection against rises in interest rates, a Fund will participate in any declines in interest rates as well. A credit spread trade is an investment position relating to a difference in the prices or interest rates of two securities or currencies, where the value of the investment position is determined by movements in the difference between the prices or interest rates, as the case may be, of the respective securities or currencies.
5. Financial Derivative Instruments
The Funds may utilize derivative instruments to enhance return, hedge risk, gain efficient exposure to an asset class or to manage liquidity. When considering the Funds’ use of derivatives, it is important to note that the Funds do not use derivatives for the purpose of creating financial leverage.
Options Contracts
An option is a contract that gives the purchaser (holder) of the option, in return for a premium, the right to buy from (call) or sell to (put) the seller (writer) of the option the security or currency underlying the option at a specified exercise price at any time during the term of the option (normally not exceeding nine months). The writer of an option has the obligation upon exercise of the option to deliver the underlying security or currency upon payment of the exercise price, in the case of a call option, or to pay the exercise price upon delivery of the underlying security or currency, in the case of a put option. An option on a futures contract provides the holder with the right to enter into a ‘‘long’’ position in the underlying futures contract, in the case of a call option, or a ‘‘short’’ position in the underlying futures contract in the case of a put option, at a fixed exercise price to a stated expiration date. Upon exercise of the option by the holder, the contract market clearing house establishes a corresponding short position for the writer of the option, in the case of a call option, or a corresponding long position, in the case of a put option.
46
American Beacon FundsSM
Notes to Financial Statements
June 30, 2024
Straddle Options
The Funds may enter into differing forms of straddle options. A straddle is an investment strategy that uses combinations of options that allow a Fund to profit based on the future price movements of the underlying security, regardless of the direction of those movements. A written straddle involves simultaneously writing a call option and a put option on the same security with the same strike price and expiration date. The written straddle increases in value when the underlying security price has little volatility before the expiration date. A purchased straddle involves simultaneously purchasing a call option and a put option on the same security with the same strike price and expiration date. The purchased straddle increases in value when the underlying security price has high volatility, regardless of direction, before the expiration date.
Forward Foreign Currency Contracts
The Funds may have exposure to foreign currencies for investment or hedging purposes by purchasing or selling forward currency exchange contracts in non-U.S. currencies and by purchasing securities denominated in non-U.S. currencies. Foreign currencies may decline in value relative to the U.S. dollar and affect a Fund’s investments in securities that trade in, and receive revenues in, or in derivatives that provide exposure to, foreign (non-U.S.) currencies. Not all forward contracts require a counterparty to post collateral, which may expose a Fund to greater losses in the event of a default by a counterparty. Forward contracts are two-party contracts pursuant to which one party agrees to pay the counterparty a fixed price for an agreed upon amount of securities, or the cash value of the securities or the securities index, at an agreed upon future date. A forward currency contract is an obligation to buy or sell a specific currency at a future date, which may be any fixed number of days from the date of the contract agreed upon by the parties, at a price set at the time of the contract. Non-Deliverable Forward (“NDF”) currency contract is a forward contract where there is no physical settlement of the two currencies at maturity. Rather, on the contract settlement date, a net cash settlement will be made by one party to the other based on the difference between the contracted forward rate and the prevailing spot rate, on an agreed notional amount.
During the year ended June 30, 2024, the TwentyFour Strategic Income Fund and TwentyFour Sustainable Short Term Bond Fund entered into forward foreign currency contracts primarily for hedging.
The Funds’ forward foreign currency contract notional dollar values outstanding fluctuate throughout the operating year as required to meet strategic requirements. The following table illustrates the average monthly volume of forward foreign currency contracts. For the purpose of this disclosure, volume is measured by the amounts bought and sold in USD at each month end.
| | | | | | | | | | | | |
Average Forward Foreign Currency Notional Amounts Outstanding Year Ended June 30, 2024 | |
Fund | | Purchased Contracts | | | | | | Sold Contracts | |
TwentyFour Strategic Income | | $ | 524,947 | | | | | | | $ | 92,437,002 | |
TwentyFour Sustainable Short Term Bond | | | 247,363 | | | | | | | | 10,773,815 | |
Swap Agreements
A swap is a transaction in which a Fund and a counterparty agree to pay or receive payments at specified dates based upon or calculated by reference to changes in specified prices or rates (e.g., interest rates in the case of interest rate swaps) or the performance of specified securities or indices based on a specified amount (the “notional” amount). Nearly any type of derivative, including forward contracts, can be structured as a swap.
Swap agreements can be structured to provide exposure to a variety of different types of investments or market factors. For example, in an interest rate swap, fixed-rate payments may be exchanged for floating rate payments; in a currency swap, U.S. dollar-denominated payments may be exchanged for payments denominated in a foreign currency; and in a total return swap, payments tied to the investment return on a particular asset, group
47
American Beacon FundsSM
Notes to Financial Statements
June 30, 2024
of assets or index may be exchanged for payments that are effectively equivalent to interest payments or for payments tied to the return on another asset, group of assets, or index. Swaps may have a leverage component, and adverse changes in the value or level of the underlying asset, reference rate or index can result in gains or losses that are substantially greater than the amount invested in the swap itself.
Some swaps currently are, and more in the future will be, centrally cleared. Swaps that are centrally-cleared are exposed to the creditworthiness of the clearing organizations (and, consequently, that of their members — generally, banks and broker-dealers) involved in the transaction. For example, an investor could lose margin payments it has deposited with the clearing organization as well as the net amount of gains not yet paid by the clearing organization if it breaches its agreement with the investor or becomes insolvent or goes into bankruptcy. In the event of bankruptcy of the clearing organization, the investor may be able to recover only a portion of the net amount of gains on its transactions and of the margin owed to it, potentially resulting in losses to the investor.
Swaps that are not centrally cleared, involve the risk that a loss may be sustained as a result of the insolvency or bankruptcy of the counterparty or the failure of the counterparty to make required payments or otherwise comply with the terms of the agreement. To mitigate this risk, a Fund will only enter into swap agreements with counterparties considered by a sub-advisor to present minimum risk of default and a Fund normally obtains collateral to secure its exposure. Changing conditions in a particular market area, whether or not directly related to the referenced assets that underlie the swap agreement, may have an adverse impact on the creditworthiness of a counterparty.
The centrally cleared and OTC swap agreements into which a Fund enters normally provide for the obligations of a Fund and its counterparty in the event of a default or other early termination to be determined on a net basis. Similarly, periodic payments on a swap transaction that are due by each party on the same day normally are netted. A Fund may be required to pledge collateral to secure its obligations under a swap.
Interest Rate Swap Agreements
The TwentyFour Strategic Income Fund is subject to interest rate risk exposure in the normal course of pursuing its investment objectives. Because the Fund holds fixed rate bonds, the value of these bonds may decrease if interest rates rise. To help hedge against this risk and to maintain its ability to generate income at prevailing market rates, the Fund may enter into interest rate swap agreements. Interest rate swap agreements involve the exchange by the Fund with another party of their respective commitments to pay or receive interest with respect to the notional amount of principal.
During the year ended June 30, 2024, the TwentyFour Strategic Income Fund entered into interest rate swaps primarily for return enhancement, hedging and adjusting portfolio duration.
The following is a summary of the fair valuations of the Funds’ derivative instruments categorized by risk exposure(1):
TwentyFour Strategic Income Fund
| | | | | | | | | | | | | | | | | | | | | | | | | | | | | | | | | | | | | | | | | | | | | | | | | | | | | | | |
| Fair values of financial instruments on the Statements of Assets and Liabilities as of June 30, 2024: | |
| | | |
| | | Derivatives not accounted for as hedging instruments | | | | |
| | | | | | | | | | | |
Assets: | | Credit contracts | | | | Foreign exchange
contracts | | | | Commodity
contracts | | | | Interest rate
contracts | | | | Equity contracts | | | | Total |
| Unrealized appreciation of forward foreign currency contracts | | | $ | - | | | | | | | | | $ | 317,073 | | | | | | | | | $ | - | | | | | | | | | $ | - | | | | | | | | | $ | - | | | | | | | | | $ | 317,073 | |
| | | | | | | | | | | |
Liabilities: | | Credit contracts | | | | Foreign exchange
contracts | | | | Commodity
contracts | | | | Interest rate
contracts | | | | Equity contracts | | | | Total |
| Unrealized depreciation of forward foreign currency contracts | | | $ | - | | | | | | | | | $ | (5,832 | ) | | | | | | | | $ | - | | | | | | | | | $ | - | | | | | | | | | $ | - | | | | | | | | | $ | (5,832 | ) |
48
American Beacon FundsSM
Notes to Financial Statements
June 30, 2024
| | | | | | | | | | | | | | | | | | | | | | | | | | | | | | | | | | | | | | | | | | | | | | | | | | | | | | | |
| The effect of financial derivative instruments on the Statements of Operations as of June 30, 2024: | |
| | | |
| | | Derivatives not accounted for as hedging instruments | | | | |
| | | | | | | | | | | |
Realized gain (loss) from derivatives recognized as a result of
operations | | Credit
contracts | | | | Foreign
exchange
contracts | | | | Commodity
contracts | | | | Interest
rate
contracts | | | | Equity
contracts | | | | Total |
| Forward foreign currency contracts | | | $ | - | | | | | | | | | $ | 1,568,121 | | | | | | | | | $ | - | | | | | | | | | $ | - | | | | | | | | | $ | - | | | | | | | | | $ | 1,568,121 | |
| Swap agreements | | | | - | | | | | | | | | | - | | | | | | | | | | - | | | | | | | | | | (21 | ) | | | | | | | | | - | | | | | | | | | | (21 | ) |
| | | | | | | | | | | |
Net change in unrealized appreciation (depreciation) of
derivatives recognized as a result from operations: | | Credit
contracts | | | | Foreign
exchange
contracts | | | | Commodity
contracts | | | | Interest
rate
contracts | | | | Equity
contracts | | | | Total |
| Forward foreign currency contracts | | | $ | - | | | | | | | | | $ | 1,307,766 | | | | | | | | | $ | - | | | | | | | | | $ | - | | | | | | | | | $ | - | | | | | | | | | $ | 1,307,766 | |
TwentyFour Sustainable Short Term Bond Fund
| | | | | | | | | | | | | | | | | | | | | | | | | | | | | | | | | | | | | | | | | | | | | | | | | | | | | | | |
| Fair values of financial instruments on the Statements of Assets and Liabilities as of June 30, 2024: | |
| | | |
| | | Derivatives not accounted for as hedging instruments | | | | |
| | | | | | | | | | | |
Assets: | | Credit contracts | | | | Foreign exchange
contracts | | | | Commodity
contracts | | | | Interest rate
contracts | | | | Equity contracts | | | | Total |
| Unrealized appreciation of forward foreign currency contracts | | | $ | - | | | | | | | | | $ | 49,824 | | | | | | | | | $ | - | | | | | | | | | $ | - | | | | | | | | | $ | - | | | | | | | | | $ | 49,824 | |
| | | | | | | | | | | |
Liabilities: | | Credit contracts | | | | Foreign exchange
contracts | | | | Commodity
contracts | | | | Interest rate
contracts | | | | Equity contracts | | | | Total |
| Unrealized depreciation of forward foreign currency contracts | | | $ | - | | | | | | | | | $ | (3,910 | ) | | | | | | | | $ | - | | | | | | | | | $ | - | | | | | | | | | $ | - | | | | | | | | | $ | (3,910 | ) |
| | | | | | | | | | | | | | | | | | | | | | | | | | | | | | | | | | | | | | | | | | | | | | | | | | | | | | | |
| The effect of financial derivative instruments on the Statements of Operations as of June 30, 2024: | |
| | | |
| | | Derivatives not accounted for as hedging instruments | | | | |
| | | | | | | | | | | |
Realized gain (loss) from derivatives
recognized as a result of operations | | Credit contracts | | | | Foreign exchange
contracts | | | | Commodity
contracts | | | | Interest rate
contracts | | | | Equity contracts | | | | Total |
| Forward foreign currency contracts | | | $ | - | | | | | | | | | $ | 37,328 | | | | | | | | | $ | - | | | | | | | | | $ | - | | | | | | | | | $ | - | | | | | | | | | $ | 37,328 | |
| | | | | | | | | | | |
Net change in unrealized appreciation
(depreciation) of derivatives recognized
as a result from operations: | | Credit contracts | | | | Foreign exchange
contracts | | | | Commodity
contracts | | | | Interest rate
contracts | | | | Equity contracts | | | | Total |
| Forward foreign currency contracts | | | $ | - | | | | | | | | | $ | 158,625 | | | | | | | | | $ | - | | | | | | | | | $ | - | | | | | | | | | $ | - | | | | | | | | | $ | 158,625 | |
(1) See Note 3 in the Notes to Financial Statements for additional information.
Master Agreements
International Swaps and Derivatives Association, Inc. Master Agreements (“ISDA Master Agreements”) with counterparties govern transactions in OTC derivative and foreign exchange contracts entered into by the Funds and those counterparties. The ISDA Master Agreements contain provisions for general obligations, representations, agreements, collateral and events of default or termination. Events of termination include conditions that may entitle counterparties to elect to terminate early and cause settlement of all outstanding transactions under the applicable ISDA Master Agreement. Any election to terminate early could be material to the financial statements. Since different types of forward and OTC financial derivative transactions have different mechanics and are sometimes traded out of different legal entities of a particular counterparty organization, each type of transaction may be covered by a different Master Agreement, resulting in the need for multiple agreements with a single counterparty.
As the ISDA Master Agreements are specific to unique operations of different asset types, they allow a Fund to net its total exposure to a counterparty in the event of a default with respect to all the transactions governed under a single agreement with a counterparty.
49
American Beacon FundsSM
Notes to Financial Statements
June 30, 2024
Master Securities Forward Transaction Agreements (“Master Forward Agreements”) govern the considerations and factors surrounding the settlement of certain forward settling transactions, such as delayed delivery or sale-buyback financing transactions by and between a Fund and select counterparties. The Master Forward Agreements maintain provisions for, among other things, initiation and confirmation, payment and transfer, events of default, termination, and maintenance of collateral.
Offsetting Assets and Liabilities
The Funds are parties to enforceable master netting agreements between brokers and counterparties which provide for the right to offset under certain circumstances. The Funds employ multiple money managers and counterparties and have elected not to offset qualifying financial and derivative instruments on the Statements of Assets and Liabilities, as such all financial and derivative instruments are presented on a gross basis. The impacts of netting arrangements that provide the right to offset are detailed below, if applicable. The net amount represents the net receivable or payable that would be due from or to the counterparty in the event of default. Exposure from borrowings and other financing agreements such as repurchase agreements can only be netted across transactions governed by the same Master Agreement with the same legal entity. All amounts reported below represent the balance as of the report date, June 30, 2024.
TwentyFour Strategic Income Fund
| | | | | | | | | | | | |
| Offsetting of Financial and Derivative Assets as of June 30, 2024: | |
| | | Assets | | | | | | Liabilities | |
| Forward Foreign Currency Contracts | | $ | 317,073 | | | | | | | $ | 5,832 | |
| | | | | | | | | | | | |
| Total derivative assets and liabilities in the Statement of Assets and Liabilities | | $ | 317,073 | | | | | | | $ | 5,832 | |
| | | | | | | | | | | | |
| Total derivative assets and liabilities subject to an MNA | | $ | (317,073 | ) | | | | | | $ | (5,832 | ) |
| | | | | | | | | | | | |
| | | | | | | | | | | | | | | | | | | | | | | | | | | | | | | | | | | | |
| Financial Assets, Derivatives, and Collateral Received/(Pledged) by Counterparty as of June 30, 2024: | |
| | | | | | | | | | | | | | | Gross Amounts Not Offset in the
Statement of Assets and Liabilities | | | | | | | |
Counterparty | | Gross Amounts of Assets
Presented in the Statement
of Assets and Liabilities | | | | | | Derivatives
Available for
Offset | | | | | | Non-Cash
Collateral
Pledged | | | | | | Cash Collateral
Pledged | | | | | | Net Amount | |
| State Street Bank & Trust Co. | | $ | 317,073 | | | | | | | $ | (5,832 | ) | | | | | | $ | - | | | | | | | $ | - | | | | | | | $ | 311,241 | |
| | | | | | | |
| | | | | | | | | | | | | | | Gross Amounts Not Offset in the
Statement of Assets and Liabilities | | | | | | | |
Counterparty | | Gross Amounts of Liabilities
Presented in the Statement
of Assets and Liabilities | | | | | | Derivatives
Available for
Offset | | | | | | Non-Cash
Collateral
Received | | | | | | Cash Collateral
Received | | | | | | Net Amount | |
| State Street Bank & Trust Co. | | $ | 5,832 | | | | | | | $ | (5,832 | ) | | | | | | $ | - | | | | | | | $ | - | | | | | | | $ | - | |
TwentyFour Sustainable Short Term Bond Fund
| | | | | | | | | | | | |
| Offsetting of Financial and Derivative Assets as of June 30, 2024: | |
| | | Assets | | | | | | Liabilities | |
| Forward Foreign Currency Contracts | | $ | 49,824 | | | | | | | $ | 3,910 | |
| | | | | | | | | | | | |
| Total derivative assets and liabilities in the Statement of Assets and Liabilities | | $ | 49,824 | | | | | | | $ | 3,910 | |
| | | | | | | | | | | | |
| Total derivative assets and liabilities subject to an MNA | | $ | (49,824 | ) | | | | | | $ | (3,910 | ) |
| | | | | | | | | | | | |
50
American Beacon FundsSM
Notes to Financial Statements
June 30, 2024
| | | | | | | | | | | | | | | | | | | | | | | | | | | | | | | | | | | | |
| Financial Assets, Derivatives, and Collateral Received/(Pledged) by Counterparty as of June 30, 2024: | |
| | | | | | | | | | | | | | | Gross Amounts Not Offset in the
Statement of Assets and Liabilities | | | | | | | |
Counterparty | | Gross Amounts of Liabilities
Presented in the Statement
of Assets and Liabilities | | | | | | Derivatives
Available for
Offset | | | | | | Non-Cash
Collateral
Received | | | | | | Cash Collateral
Received | | | | | | Net Amount | |
| State Street Bank & Trust Co. | | $ | 49,824 | | | | | | | $ | (3,910 | ) | | | | | | $ | - | | | | | | | $ | - | | | | | | | $ | 45,914 | |
| | | | | | | |
| | | | | | | | | | | | | | | Gross Amounts Not Offset in the
Statement of Assets and Liabilities | | | | | | | |
Counterparty | | Gross Amounts of Liabilities
Presented in the Statement
of Assets and Liabilities | | | | | | Derivatives
Available for
Offset | | | | | | Non-Cash
Collateral
Received | | | | | | Cash Collateral
Received | | | | | | Net Amount | |
| State Street Bank & Trust Co. | | $ | 3,910 | | | | | | | $ | (3,910 | ) | | | | | | $ | - | | | | | | | $ | - | | | | | | | $ | - | |
6. Principal Risks
Investing in the Funds may involve certain risks including, but not limited to, those described below.
Asset-Backed and Mortgage Related Securities Risk
Investments in asset-backed and mortgage related securities are subject to market risks for fixed-income securities which include, but are not limited to, interest rate risk, prepayment risk and extension risk. Small movements in interest rates (both increases and decreases) may quickly and significantly reduce the value of certain Mortgage-Backed Securities (“MBS”) and ABS securities. If interest rates fall, the rate of prepayments tends to increase as borrowers are motivated to pay off debt and refinance at new lower rates. When mortgages and other obligations are prepaid and when securities are called, a Fund may have to reinvest in securities with a lower yield or fail to recover additional amounts (i.e., premiums) paid for securities with higher interest rates, resulting in an unexpected capital loss and/or a decrease in the amount of dividends and yield. Because prepayments increase when interest rates fall, the prices of MBS and ABS do not increase as much as other fixed-income securities when interest rates fall. When interest rates rise, borrowers are less likely to prepay their mortgage and other loans. A decreased rate of prepayments lengthens the expected maturity of MBS and ABS. Therefore, the prices of MBS and ABS may decrease more than prices of other fixed-income securities when interest rates rise. Rising interest rates tend to extend the duration of these securities, making them more sensitive to changes in interest rates. Rising interest rates also may increase the risk of default by borrowers. As a result, in a period of rising interest rates, a Fund that holds these types of securities, may experience additional volatility and losses. A decline in the credit quality of and defaults by the issuers of asset-backed and mortgage related securities or instability in the markets for such securities may affect the value and liquidity of such securities, which could result in losses to a Fund. In addition, certain asset-backed and mortgage related securities may include securities backed by pools of loans made to “subprime” borrowers or borrowers with blemished credit histories; the risk of defaults is generally higher in the case of mortgage pools that include such subprime mortgages.
Callable Securities Risk
The SSI Alternative Income Fund may invest in fixed-income securities with call features. A call feature allows the issuer of the security to redeem or call the security prior to its stated maturity date. In periods of falling interest rates, issuers may be more likely to call in securities that are paying higher coupon rates than prevailing interest rates. In the event of a call, the Fund would lose the income that would have been earned to maturity on that security, and the proceeds received by the Fund may be invested in securities paying lower coupon rates. Thus, the Fund’s income could be reduced as a result of a call. In addition, the market value of a callable security may decrease if it is perceived by the market as likely to be called, which could have a negative impact on the Fund’s total return.
51
American Beacon FundsSM
Notes to Financial Statements
June 30, 2024
Convertible Securities Risk
The value of a convertible security typically increases or decreases with the price of the underlying common stock. In general, a convertible security is subject to the risks of stocks, and its price may be as volatile as that of the underlying stock, when the underlying stock’s price is high relative to the conversion price and a convertible security is subject to the risks of debt securities, and is particularly sensitive to changes in interest rates, when the underlying stock’s price is low relative to the conversion price. Convertible securities generally have less potential for gain or loss than common stocks. Securities that are convertible other than at the option of the holder generally do not limit the potential for loss to the same extent as securities that are convertible at the option of the holder. Many convertible securities have credit ratings that are below investment grade and are subject to the same risks as an investment in lower-rated debt securities. The credit rating of a company’s convertible securities is generally lower than that of its non-convertible debt securities. Convertible securities are normally considered “junior” securities — that is, the company usually must pay interest on its non-convertible debt securities before it can make payments on its convertible securities. If the issuer stops paying interest or principal, convertible securities may become worthless and the Fund could lose its entire investment. In addition, because companies that issue convertible securities may be small- or mid-cap companies, to the extent the Fund invests in convertible securities issued by small- or mid-cap companies, it will be subject to the risks of investing in such companies.
Counterparty Risk
The Funds are subject to the risk that a party or participant to a transaction, such as a broker or derivative counterparty, will be unwilling or unable to satisfy its obligation to make timely principal, interest or settlement payments or to otherwise honor its obligations to the Funds. As a result, a Fund may obtain no recovery of its investment or may only obtain a limited recovery, and any recovery may be delayed. Not all derivative transactions require a counterparty to post collateral, which may expose a Fund to greater losses in the event of a default by a counterparty.
Some of the markets in which the Funds may effect derivative transactions are OTC or “interdealer” markets. The participants in such markets are typically not subject to credit evaluation and regulatory oversight to the same extent as are members of “exchange-based” markets. This exposes the Funds to the risk that a counterparty will not settle a transaction in accordance with its terms and conditions because of a credit or liquidity problem with the counterparty and the recent turbulence in the financial markets highlights the importance of being aware of counterparty risk resulting from OTC derivative transactions. The Funds are subject to the risk that a party or participant to a transaction, such as a broker or derivative counterparty, will be unwilling or unable to satisfy its obligation to make timely principal, interest or settlement payments or to otherwise honor its obligations to the Funds. As a result, the Funds may obtain no recovery of its investment or may only obtain a limited recovery, and any recovery may be delayed. Not all derivative transactions require a counterparty to post collateral, which may expose the Funds to greater losses in the event of a default by a counterparty.
Credit Risk
The Funds are subject to the risk that the issuer or guarantor of an obligation, or the counterparty to a transaction, including a derivatives contract or a loan, may fail, or become less able, to make timely payments of interest or principal or otherwise honor its obligations or default completely. The strategies utilized by the sub-advisor require accurate and detailed credit analysis of issuers and there can be no assurance that its analysis will be accurate or complete. The Funds may be subject to substantial losses in the event of credit deterioration or bankruptcy of one or more issuers in its portfolio. Financial strength and solvency of an issuer are the primary factors influencing credit risk. In addition, inadequacy of collateral or credit enhancement for a debt instrument may affect its credit risk. Credit risk may change over the life of an instrument and debt obligations which are rated by rating agencies may be subject to downgrade. The credit ratings of debt instruments and investments represent the rating agencies’ opinions regarding their credit quality and are not a guarantee of future credit
52
American Beacon FundsSM
Notes to Financial Statements
June 30, 2024
performance of such securities. Rating agencies attempt to evaluate the safety of the timely payment of principal and interest (or dividends) and do not evaluate the risks of fluctuations in market value. The ratings assigned to securities by rating agencies do not purport to fully reflect the true risks of an investment. Further, in recent years many highly-rated structured securities have been subject to substantial losses as the economic assumptions on which their ratings were based proved to be materially inaccurate. A decline in the credit rating of an individual security held by a Fund may have an adverse impact on its price and may make it difficult for a Fund to sell it. Ratings represent a rating agency’s opinion regarding the quality of the security and are not a guarantee of quality. Rating agencies might not always change their credit rating on an issuer or security in a timely manner to reflect events that could affect the issuer’s ability to make timely payments on its obligations. Credit risk is typically greater for securities with ratings that are below investment grade (commonly referred to as “junk bonds”). Since a Fund can invest significantly in high yield investments that are considered speculative in nature, this risk maybe substantial. Changes in the actual or perceived creditworthiness of an issuer, or a downgrade or default affecting any of a Fund’s securities, could affect a Fund’s performance.
Currency Risk
The Funds may have exposure to foreign currencies by using various instruments. Foreign currencies may fluctuate significantly over short periods of time for a number of reasons, including changes in interest rates, may be affected unpredictably by intervention, or the failure to intervene, of the U.S. or foreign governments, central banks, or supranational entities such as the International Monetary Fund, and may be affected by the imposition of currency controls or political developments in the U.S. or abroad. As a result, the Funds’ exposure to foreign currencies may reduce the returns of a Fund. Foreign currencies may decline in value relative to the U.S. dollar and other currencies and thereby affect the Funds’ investments. In addition, changes in currency exchange rates could adversely impact investment gains or add to investment losses. Currency derivatives may not always work as intended, and in specific cases, a Fund may be worse off than if it had not used such instrument(s). In the case of hedging positions, the U.S. dollar or other currency may decline in value relative to the foreign currency that is being hedged and thereby affect a Fund’s investments. There may not always be suitable hedging instruments available. Even where suitable hedging instruments are available, a Fund may choose to not hedge its currency risks.
Derivatives Risk
Derivatives are financial instruments that have a value which depends upon, or is derived from, a reference asset, such as one or more underlying securities, pools of securities, options, futures, indexes or currencies. A Fund may use derivatives to enhance total return of its portfolio, to hedge against fluctuations in interest rates or currency exchange rates, to change the effective duration of its portfolio, or to manage certain investment risks or as a substitute for the purchase or sale of the underlying currencies or securities. A Fund may also hold derivative instruments to obtain economic exposure to an issuer without directly holding its securities. Derivatives may involve significant risk. The use of derivative instruments may expose a Fund to additional risks that it would not be subject to if it invested directly in the securities or other instruments underlying those securities. Derivatives can be highly complex and their use within a management strategy can require specialized skills. There can be no assurance that any strategy used will succeed. If a sub-advisor incorrectly forecasts stock market values, or the direction of interest rates or currency exchange rates in utilizing a specific derivatives strategy for a Fund, a Fund could lose money. In addition, leverage embedded in a derivative instrument can expose a Fund to greater risk and increase its costs. Gains or losses in the value of a derivative instrument may be magnified and be much greater than the derivative’s original cost (generally the initial margin deposit). There may also be material and prolonged deviations between the theoretical value and realizable value of a derivative. Some derivatives have the potential for unlimited loss, regardless of the size of a Fund’s initial investment, for example, where a Fund may be called upon to deliver a security it does not own. As a result, a Fund could lose more than the amount it invests. Derivatives may at times be illiquid and may be more volatile than other types of investments. A Fund may not be able to close out or sell a derivative position at a particular time or at an anticipated price. Certain derivatives may also be difficult to value, and valuation may be more difficult in times of market turmoil. A Fund may buy or
53
American Beacon FundsSM
Notes to Financial Statements
June 30, 2024
sell derivatives not traded on organized exchanges. A Fund may also enter into transactions that are not cleared through clearing organizations. These types of transactions may be subject to heightened liquidity and valuation risk. Derivative investments can increase portfolio turnover and transaction costs. Derivatives also are subject to counterparty risk and credit risk. As a result, a Fund may not recover its investment or may only obtain a limited recovery, and any recovery may be delayed. Not all derivative transactions require a counterparty to post collateral, which may expose a Fund to greater losses in the event of a default by a counterparty. Certain derivatives require a Fund to post margin to secure its future obligation; if a Fund has insufficient cash, it may have to sell investments from its portfolio to meet daily variation margin requirements at a time when it maybe disadvantageous to do so. A Fund’s use of derivatives also may create financial leverage, which may result in losses that exceed the amount originally invested and accelerate the rate of losses. Suitable derivatives may not be available in all circumstances, and there can be no assurance that a Fund will use derivatives to reduce exposure to other risks when that might have been beneficial. Because the markets for certain derivative instruments (including markets located in foreign countries) are relatively new and still developing, suitable derivatives transactions may not be available in all circumstances for risk management or other purposes. Upon the expiration of a particular contract, a sub-advisor may wish to retain a Fund’s position in the derivative instrument by entering into a similar contract, but may be unable to do so if the counterparty to the original contract is unwilling to enter into the new contract and no other suitable counterparty can be found. Although a Fund may attempt to hedge against certain risks, the hedging instruments may not perform as expected and could produce losses. Hedging instruments may also reduce or eliminate gains that may otherwise have been available had a Fund not used the hedging instruments. A Fund may not hedge certain risks in particular situations, even if suitable instruments are available. A Fund’s ability to use derivatives may also be limited by certain regulatory and tax considerations. Ongoing changes to the regulation of the derivatives markets and potential changes in the regulation of funds using derivative instruments could limit a Fund’s ability to pursue its investment strategies. The extent and impact of the regulation is not yet fully known and may not be for some time. New regulation may make derivatives more costly, may limit their availability, may disrupt markets, or may otherwise adversely affect their value or performance. In addition to other changes, these rules provide for central clearing of derivatives that in the past were traded exclusively over-the-counter and may increase costs and margin requirements, but are expected to reduce certain counterparty risks.
Environmental, Social, and/or Governance Investing Risk
A Fund’s incorporation of environmental, social and/or governance (“ESG”) considerations, including criteria as determined by the sub-advisor, in its investment strategy may cause it to make different investments than funds that have a similar investment style but do not incorporate such considerations in their strategy. As with the use of any investment considerations involved in investment decisions, there is no guarantee that the ESG investment considerations used by a Fund will result in the selection of issuers that will outperform other issuers or help reduce risk in a Fund. A Fund’s ESG investment considerations may also affect a Fund’s exposure to certain sectors or types of investments, which may impact a Fund’s relative investment performance depending on the performance of issuers in those sectors relative to issuers in the broader market. A Fund may not be able to take advantage of certain investment opportunities due to these considerations, which may adversely affect investment performance. A Fund may underperform funds that do not incorporate these considerations. A Fund’s sub-advisor is dependent on available information to assist in the use of ESG investment considerations, and, because there are few generally accepted standards to use in such considerations, the information and considerations used for a Fund may differ from the information and considerations used for other funds. The limited availability of such information, as well as errors in or omissions from such information could result in incorrect evaluations of potential investments. There is no guarantee that a Fund’s efforts to select investments that meet a Fund’s ESG investing considerations will be successful.
Foreign Investing and Emerging Markets Risk
Non-U.S. investments carry potential risks not associated with U.S. investments. Such risks include, but are not limited to: (1) currency exchange rate fluctuations, (2) political and financial instability, (3) less liquidity,
54
American Beacon FundsSM
Notes to Financial Statements
June 30, 2024
(4) lack of uniform accounting, auditing and financial reporting standards, (5) increased price volatility, (6) less government regulation and supervision of foreign stock exchanges, brokers and listed companies, and (7) delays in transaction settlement in some foreign markets. To the extent the Funds invest a significant portion of its assets in securities of a single country or region, it is more likely to be affected by events or conditions of that country or region. In addition, the economies and political environments of emerging market countries tend to be more unstable than those of developed countries, resulting in more volatile rates of return than the developed markets and substantially greater risk to investors. There may be very limited oversight of certain foreign banks or securities depositories that hold foreign securities and currency and the laws of certain countries may limit the ability to recover such assets if a foreign bank or depository or their agents goes bankrupt. When investing in emerging markets, the risks of investing in foreign securities are heightened. Emerging markets have unique risks that are greater than, or in addition to, investing in developed markets because emerging markets are generally smaller, less developed, less liquid and more volatile than the securities markets of the U.S. and other developed markets. There are also risks of: greater political uncertainties; an economy’s dependence on revenues from particular commodities or on international aid or development assistance; currency transfer restrictions; a limited number of potential buyers for such securities, resulting in increased volatility and limited liquidity for emerging market securities; trading suspensions; and delays and disruptions in securities settlement procedures. In addition, there may be less information available to make investment decisions and more volatile rates of return.
High Portfolio Turnover Risk
Portfolio turnover is a measure of a Fund’s trading activity over a one-year period. A portfolio turnover rate of 100% would indicate that a Fund sold and replaced the entire value of its securities holdings during the period. High portfolio turnover could increase a Fund’s transaction costs because of increased broker commissions resulting from such transactions. These costs are not reflected in the Funds’ annual operating expenses or in the expense example, but they can have a negative impact on performance. Frequent trading by the Funds could also result in increased realized net capital gains, distributions of which are taxable to the Funds’ shareholders (including net short-term capital gain distributions, which are taxable to them as ordinary income).
High-Yield Bond Risk
Exposure to high-yield securities (commonly referred to as ‘’junk bonds’’) generally involves significantly greater risks of loss of your money than an investment in investment-grade securities. Compared with issuers of investment grade securities, issuers of high yield securities are more likely to encounter financial difficulties and to be materially affected by these difficulties. High yield debt securities may fluctuate more widely in price and yield and may fall in price when the economy is weak or expected to become weak. These securities also may be difficult to sell at the time and price a Fund desires. High yield securities are considered to be speculative with respect to an issuer’s ability to pay interest and principal and carry a greater risk that issuers of lower-rated securities will default on the timely payment of principal or interest. Rising interest rates may compound these difficulties and reduce an issuer’s ability to repay principal and interest obligations. Issuers of lower-rated securities also have a greater risk of default or bankruptcy. Issuers of securities that are in default or have defaulted may fail to resume principal or interest payments, in which case a Fund may lose its entire investment. Below-investment-grade securities may experience greater price volatility and less liquidity than investment-grade securities. Lower-rated securities are subject to certain risks that may not be present with investments in higher-grade securities. Investors should consider carefully their ability to assume the risks associated with lower-rated securities before investing in a Fund. The lower rating of certain high yielding corporate income securities reflects a greater possibility that the financial condition of the issuer or adverse changes in general economic conditions may impair the ability of the issuer to pay income and principal. Changes by credit rating agencies in their ratings of a fixed income security also may affect the value of these investments. However, allocating investments among securities of different issuers could reduce the risks of owning any such securities separately. The prices of these high yield securities tend to be less sensitive to interest rate changes than investment-grade investments, but more sensitive to adverse economic changes or individual corporate developments. During economic downturns or periods of rising interest rates, highly leveraged issuers may experience financial stress that adversely affects their
55
American Beacon FundsSM
Notes to Financial Statements
June 30, 2024
ability to service principal and interest payment obligations, to meet projected business goals or to obtain additional financing, and the markets for their securities may be more volatile. If an issuer defaults, a Fund may incur additional expenses to seek recovery. Additionally, accruals of interest income for a Fund may have to be adjusted in the event of default. In the event of an issuer’s default, a Fund may write off prior income accruals for that issuer, resulting in a reduction in a Fund’s current dividend payment. Frequently, the higher yields of high-yielding securities may not reflect the value of the income stream that holders of such securities may expect, but rather the risk that such securities may lose a substantial portion of their value as a result of their issuer’s financial restructuring or default.
Interest Rate Risk
Generally, the value of investments with interest rate risk, such as fixed-income securities or derivatives, will move in the opposite direction to movements in interest rates. Factors including central bank monetary policy, rising inflation rates, and changes in general economic conditions may cause interest rates to rise, which could cause the value of a Fund’s investments to decline. Interest rates may rise, perhaps significantly and/or rapidly, potentially resulting in substantial losses to a Fund. Interest rate changes may have a more pronounced effect on the market value of fixed-rate instruments than on floating-rate instruments. The value of floating rate and variable securities may decline if their interest rates do not rise as quickly, or as much, as general interest rates. The prices of fixed-income securities or derivatives are also affected by their durations. Fixed-income securities or derivatives with longer durations generally have greater sensitivity to changes in interest rates. Rising interest rates may cause the value of a Fund’s investments with longer durations and terms to maturity to decline, which may adversely affect the value of a Fund. For example, if a bond has a duration of eight years, a 1% increase in interest rates could be expected to result in an 8% decrease in the value of the bond. Fluctuations in interest rates may also affect the liquidity of fixed income securities and instruments held by the Fund.
LIBOR Risk
Certain of the instruments identified in a Fund’s principal investment strategies have coupon rates or may provide exposure to underlying investments with coupon rates, that are based on the ICE LIBOR (“LIBOR”), the Secured Overnight Financing Rate (“SOFR”), Euro Interbank Offered Rate and other similar types of reference rates (each, a “Reference Rate”). These Reference Rates are generally intended to represent the rate at which contributing banks may obtain short-term borrowings within certain financial markets.
Most maturities and currencies of LIBOR were phased out at the end of 2021, with the remaining ones phased out on June 30, 2023. These events and any additional regulatory or market changes may have an adverse impact on a Fund or its investments, including increased volatility or illiquidity in markets for instruments that rely on LIBOR. SOFR has been selected by a committee established by the Board of Governors of the Federal Reserve System and the Federal Reserve Bank of New York to replace LIBOR as a Reference Rate in the United States and U.S. law required that contracts without a practicable LIBOR alternative default to SOFR plus a set spread beginning in mid-2023. Other countries have undertaken similar initiatives to identify replacement Reference Rates for LIBOR in their respective markets. However, there are obstacles to converting certain existing investments and transactions to a new Reference Rate, as well as risks associated with using a new Reference Rate with respect to new investments and transactions. The transition process, or the failure of an industry to transition, could lead to increased volatility and illiquidity in markets for instruments that relied on LIBOR to determine interest rates and a reduction in the values of some LIBOR-based investments, all of which would impact a Fund. In addition, any substitute Reference Rate and any pricing adjustments imposed by a regulator or by counterparties or otherwise may adversely affect a Fund’s performance and/or NAV.
Liquidity Risk
When there is little or no active trading market for a specific type of security it can become more difficult to purchase or sell the securities at or near their perceived value. During such periods, certain investments held by
56
American Beacon FundsSM
Notes to Financial Statements
June 30, 2024
a Fund may be difficult to sell or other investments may be difficult to purchase at favorable times or prices. As a result, the Funds may have to lower the price on certain securities that it is trying to sell, sell other securities instead or forgo an investment opportunity, any of which could have a negative effect on Fund management or performance. Redemptions by a few large investors in the Funds at such times may have a significant adverse effect on a Fund’s NAV per share and remaining Fund shareholders. In addition, the market-making capacity of dealers in certain types of securities has been reduced in recent years, in part as a result of structural and regulatory changes, such as fewer proprietary trading desks and increased regulatory capital requirements for broker-dealers. Further, many broker-dealers have reduced their inventory of certain debt securities. This could negatively affect a Fund’s ability to buy or sell debt securities and increase the related volatility and trading costs. A Fund may lose money if it is forced to sell certain investments at unfavorable prices to meet redemption requests or other cash needs.
Market Risk
The Funds are subject to the risk that the securities markets will move down, sometimes rapidly and unpredictably, based on overall economic conditions and other factors, which may negatively affect a Fund’s performance. Equity securities generally have greater price volatility than fixed-income securities, although under certain market conditions fixed-income securities may have comparable or greater price volatility. During a general downturn in the securities markets, multiple assets may decline in value simultaneously. In some cases, traditional market participants have been less willing to make a market in some types of debt instruments, which has affected the liquidity of those instruments. During times of market turmoil, investors tend to look to the safety of securities issued or backed by the U.S. Treasury, causing the prices of these securities to rise and the yields to decline. Reduced liquidity in fixed-income and credit markets may negatively affect many issuers worldwide. Prices in many financial markets have increased significantly over the last decade, but there have also been periods of adverse market and financial developments and cyclical change during that timeframe, which have resulted in unusually high levels of volatility in domestic and foreign financial markets that has caused losses for investors and may occur again in the future, particularly if markets enter a period of uncertainty or economic weakness. The value of a security may decline due to adverse issuer-specific conditions, general market conditions unrelated to a particular issuer, or factors that affect a particular industry or industries. Changes in the financial condition of a single issuer or market segment also can impact the market as a whole.
Geopolitical and other events, including war, terrorism, economic uncertainty, trade disputes, pandemics, public health crises, natural disasters and related events have led, and in the future may continue to lead, to instability in world economies and markets generally and reduced liquidity in equity, credit and fixed-income markets, which may disrupt economies and markets and adversely affect the value of your investment. Changes in value may be temporary or may last for extended periods.
Policy changes by the U.S. government and/or Federal Reserve and political events within the U.S. and abroad, including the U.S. presidential election, the U.S. government’s inability at times to agree on a long-term budget and deficit reduction plan, the threat of a federal government shutdown and threats not to increase the federal government’s debt limit, may affect investor and consumer confidence and may adversely impact financial markets and the broader economy, perhaps suddenly and to a significant degree.
Markets and market participants are increasingly reliant upon both publicly available and proprietary information data systems. Data imprecision, software or other technology malfunctions, programming inaccuracies, unauthorized use or access, and similar circumstances may impair the performance of these systems and may have an adverse impact upon a single issuer, a group of issuers, or the market at large. The financial markets generally move in cycles, with periods of rising prices followed by periods of declining prices. The value of your investment may reflect these fluctuations.
57
American Beacon FundsSM
Notes to Financial Statements
June 30, 2024
Market Timing Risk
Funds that invest in high-yield, and, or have exposure to foreign securities through the derivatives it holds, are particularly subject to the risk of market timing activities. Frequent trading by Fund shareholders poses risks to other shareholders in the Funds, including (i) the dilution of the Funds’ NAV, (ii) an increase in the Funds’ expenses, and (iii) interference with the portfolio manager’s ability to execute efficient investment strategies. Because of specific securities in which the Funds may invest, it could be subject to the risk of market timing activities by shareholders. Some examples of these types of securities are high-yield and foreign securities. The limited trading activity of some high-yield securities may result in market prices that do not reflect the true market value of these securities. If a Fund trades foreign securities, it generally prices foreign securities using their closing prices from the foreign markets in which they trade, typically prior to the Funds’ calculation of its NAV. These prices may be affected by events that occur after the close of a foreign market but before the Funds price its shares. In such instances, the Funds may fair value high yield and foreign securities. However, some investors may engage in frequent short-term trading in the Funds to take advantage of any price differentials that may be reflected in the NAV of the Funds’ shares. While the Manager monitors trading in the Funds, there is no guarantee that it can detect all market timing activities.
Other Investment Companies Risk
To the extent that a Fund invests in shares of other registered investment companies, a Fund will indirectly bear the fees and expenses, including, for example, advisory and administrative fees, charged by those investment companies in addition to a Fund’s direct fees and expenses. If a Fund invests in other investment companies, a Fund may receive distributions of taxable gains from portfolio transactions by that investment company and may recognize taxable gains from transactions in shares of that investment company, which could be taxable to a Fund’s shareholders when distributed to them. A Fund must rely on the investment company in which it invests to achieve its investment objective. If the investment company fails to achieve its investment objective, the value of a Fund’s investment may decline, adversely affecting a Fund’s performance. To the extent a Fund invests in other investment companies that invest in equity securities, fixed-income securities and/or foreign securities, or that track an index, a Fund is subject to the risks associated with the underlying investments held by the investment company or the index fluctuations to which the investment company is subject. Investments in government money market funds are subject to interest rate risk, credit risk, and market risk. Interest rate risk is the risk that rising interest rates could cause the value of such an investment to decline. Credit risk is the risk that the issuer, guarantor or insurer of an obligation, or the counterparty to a transaction, may fail or become less able or unwilling, to make timely payment of interest or principal or otherwise honor its obligations, or that it may default completely.
Pay-In-Kind Securities Risk
Pay-in-kind securities are debt securities that do not make regular cash interest payments. Pay-in-kind securities pay interest through the issuance of additional securities. Because these securities do not pay current cash income, their prices can be volatile when interest rates fluctuate. If an issuer of pay-in-kind securities defaults, the Fund may lose its entire investment. Federal income tax law requires a holder of pay-in-kind securities to include in gross income each taxable year the portion of the non-cash income on those securities (i.e., the additional securities issued as interest thereon) accrued during that year. In order to continue to qualify for treatment as a “regulated investment company” (“RIC”) under the Internal Revenue Code, and avoid federal excise tax, a Fund may be required to distribute a portion of such non-cash income and may be required to dispose of other portfolio securities in order to generate cash to meet these distribution requirements, potentially during periods of adverse market prices.
58
American Beacon FundsSM
Notes to Financial Statements
June 30, 2024
Prepayment and Extension Risk
When interest rates fall, borrowers will generally repay the loans that underlie certain debt securities, especially mortgage-related and other types of ABS, more quickly than expected, causing the issuer of the security to repay the principal prior to the security’s expected maturity date. A Fund may need to reinvest the proceeds at a lower interest rate, reducing its income. Securities subject to prepayment risk generally offer less potential for gains when prevailing interest rates fall. If a Fund buys those securities at a premium, accelerated prepayments on those securities could cause a Fund to lose a portion of its principal investment. The impact of prepayments on the price of a security may be difficult to predict and may increase the security’s price volatility. Variable and floating rate securities may be less sensitive to prepayment risk. Extension risk is the risk that a decrease in prepayments may, as a result of higher interest rates or other factors, result in the extension of a security’s effective maturity, heighten interest rate risk and increase the potential for a decline in its price.
Recent Market Events Risk
Both U.S. and international markets have experienced significant volatility in recent months and years. As a result of such volatility, investment returns may fluctuate significantly. Moreover, the risks discussed herein associated with an investment in a Fund may be increased.
Although interest rates were unusually low in recent years in the U.S. and abroad, in 2022, the Federal Reserve and certain foreign central banks began to raise interest rates as part of their efforts to address rising inflation. It is difficult to accurately predict the pace at which interest rates may continue to increase, the timing, frequency or magnitude of any such increases, or when such increases might stop. Additionally, various economic and political factors could cause the Federal Reserve or another foreign central bank to change their approach in the future and such actions may result in an economic slowdown in the U.S. and abroad. Unexpected increases in interest rates could lead to market volatility or reduce liquidity in certain sectors of the market. Deteriorating economic fundamentals may, in turn, increase the risk of default or insolvency of particular issuers, negatively impact market value, cause credit spreads to widen, and reduce bank balance sheets. Any of these could cause an increase in market volatility, reduce liquidity across various markets or decrease confidence in the markets. Additionally, high public debt in the U.S. and other countries creates ongoing systemic and market risks and policymaking uncertainty.
In March 2023, the shutdown of certain financial institutions in the U.S. and questions regarding the viability of other financial institutions raised economic concerns over disruption in the U.S. and global banking systems. There can be no certainty that the actions taken by the U.S. or foreign governments will be effective in mitigating the effects of financial institution failures on the economy and restoring public confidence in the U.S. and global banking systems.
Some countries, including the U.S., have in recent years adopted more protectionist trade policies. Slowing global economic growth; risks associated with a trade agreement between the United Kingdom and the European Union; the risks associated with ongoing trade negotiations with China; and the possibility of changes to some international trade agreements; political or economic dysfunction within some nations, including major producers of oil; and dramatic changes in commodity and currency prices could have adverse effects that cannot be foreseen at the present time.
Tensions, war, or open conflict between nations, such as between Russia and Ukraine, in the Middle East or in eastern Asia could affect the economies of many nations, including the United States. The duration of ongoing hostilities in the Middle East and between Russia and Ukraine, and any sanctions and related events cannot be predicted. Those events present material uncertainty and risk with respect to markets globally and the performance of a Fund and its investments or operations could be negatively impacted.
Regulators in the U.S. have proposed and recently adopted a number of changes to regulations involving the markets and issuers, some of which apply to the Fund. The full effect of various newly-adopted regulations is not
59
American Beacon FundsSM
Notes to Financial Statements
June 30, 2024
currently known. Additionally, it is not clear whether the proposed regulations will be adopted. However, due to the broad scope of the new and proposed regulations, certain changes could limit a Fund’s ability to pursue its investment strategies or make certain investments, or may make it more costly for a Fund to operate, which may impact performance.
Economists and others have expressed increasing concern about the potential effects of global climate change on property and security values. Certain issuers, industries and regions may be adversely affected by the impacts of climate change, including on the demand for and the development of goods and services and related production costs, and the impacts of legislation, regulation and international accords related to climate change, as well as any indirect consequences of regulation or business trends driven by climate change.
Short Position Risk
The SSI Alternative Income Fund’s short positions are speculative and are subject to special risks. A short position involves the sale by a Fund of a security that it does not own. A Fund then intends to purchase the same security at a later date at a lower price. A Fund may enter into a short position through a forward commitment, a futures contract, an option, or a swap agreement. If the price of the security or derivative has increased during the time a Fund holds the short position, then a Fund will incur a loss equal to the increase in price from the time that the short position was entered into plus any premiums and interest paid to the third party. Therefore, short positions involve the risk that losses may be exaggerated, and that the Fund may lose more money than the actual cost of the investment. A Fund’s losses are potentially unlimited in a short position because the price appreciation of the security that a Fund is required to purchase is unlimited. There can be no assurance that the securities necessary to cover the short position will be available for purchase by a Fund. In addition, purchasing securities to close out the short position can itself cause the price of the relevant securities to rise further, thereby increasing any loss incurred by a Fund. Furthermore, a Fund may be forced to close out a short position prematurely if a counterparty from which a Fund borrowed securities demands their return, resulting in a loss on what might otherwise have been a profitable position. Short positions also include greater reliance on a sub-advisor’s ability to accurately anticipate the future value of a security or instrument. A Fund may invest the proceeds of a short sale, and therefore, be subject to the effect of leverage, in that short selling amplifies changes in a Fund’s NAV since it increases the exposure of a Fund to the market and may increase losses and the volatility of returns. If such instruments are traded over-the-counter, there is the risk that the counterparty may fail to honor its contract terms, causing a loss to a Fund.
Sovereign and Quasi Sovereign Debt Risk
An investment in sovereign and quasi-sovereign debt obligations involves special risks not present in corporate debt obligations. Sovereign and quasi-sovereign debt securities are issued or guaranteed by a sovereign government or entity affiliated with or backed by a sovereign government. The issuer of the sovereign or quasi-sovereign debt that controls the repayment of the debt may be unable or unwilling to repay principal or interest when due, and the Fund may have limited recourse in the event of a default. In addition, these investments are subject to risk of payment delays or defaults due to (1) country cash flow problems, (2) insufficient foreign currency reserves, (3) political considerations, (4) large debt positions relative to the country’s economy, (5) policies toward foreign lenders or investors, (6) the failure to implement economic reforms required by the International Monetary Fund or other multilateral agencies, or (7) an inability or unwillingness to repay debts. It may be particularly difficult to enforce the rights of debt holders in frontier and emerging markets. A governmental entity that defaults on an obligation may request additional time in which to pay or receive further loans or may seek to restructure its obligations to reduce interest rates or outstanding principal. There is no legal process for collecting sovereign and quasi-sovereign debt that a government does not pay nor are there bankruptcy proceedings through which all or part of the sovereign debt that a governmental entity has not repaid may be collected. Sovereign and quasi-sovereign debt risk is increased for emerging and frontier markets issuers, which are among the largest debtors to commercial banks and foreign governments. At times, certain emerging market countries have declared moratoria on the payment of principal and interest on external debt. Certain emerging
60
American Beacon FundsSM
Notes to Financial Statements
June 30, 2024
market countries have experienced difficulty in servicing their sovereign debt on a timely basis, which has led to defaults and the restructuring of certain indebtedness.
Sustainable Investing Risk
The TwentyFour Sustainable Short Term Bond Fund’s incorporation of sustainable investing considerations, including criteria as determined by the sub-advisor, in its investment strategy may cause it to make different investments than funds that have a similar investment style but do not incorporate such considerations in their strategy. As with the use of any investment considerations involved in investment decisions, there is no guarantee that the sustainable investment considerations used by the Fund will result in the selection of issuers that will outperform other issuers or help reduce risk in the Fund. The Fund may not be able to take advantage of certain investment opportunities due to these considerations, which may adversely affect investment performance. The Fund may underperform funds that do not incorporate these considerations. The sub-advisor uses sustainability research and/or ratings information provided by one or more third parties in performing this analysis and considering sustainability risks. As there are few generally accepted standards to use in such considerations, the information and considerations used for the Fund may differ from the information and consideration used for other funds.
U.S. Government Securities and Government-Sponsored Enterprises Risk
A security backed by the U.S. Treasury or the full faith and credit of the United States is guaranteed only as to the timely payment of interest and principal when held to maturity. The market prices for such securities are not guaranteed and will fluctuate. Additionally, circumstances could arise that would prevent the payment of interest or principal. This could result in losses to a Fund. Investments in government-sponsored enterprises are debt obligations issued by agencies and instrumentalities of the U.S. Government. These obligations vary in the level of support they receive from the U.S. Government. They may be: (i) supported by the full faith and credit of the U.S. Treasury, such as those of the Government National Mortgage Association (‘‘Ginnie Mae’’); (ii) supported by the right of the issuer to borrow from the U.S. Treasury, such as those of the Federal Home Loan Bank and the Federal Farm Credit Banks; (iii) supported by the discretionary authority of the U.S. Government to purchase the agency obligations, such as those of Fannie Mae and Freddie Mac or (iv) supported only by the credit of the issuer, such as those of the Federal Farm Credit Bureau. The U.S. Government may choose not to provide financial support to U.S. Government-sponsored agencies or instrumentalities if it is not legally obligated to do so, in which case, if the issuer defaulted, to the extent the Funds hold securities of such issuers, it might not be able to recover its investment from the U.S. Government. U.S. government securities and securities of government-sponsored entities are also subject to credit risk, interest rate risk and market risk. The rising U.S. national debt may lead to adverse impacts on the value of U.S. government securities due to potentially higher costs for the U.S. government to obtain new financing.
Valuation Risk
This is the risk that a Fund has valued a security at a price different from the price at which it can be sold. This risk may be especially pronounced for investments, such as derivatives, which may be illiquid or which may become illiquid and for securities that trade in relatively thin markets and/or markets that experience extreme volatility. A Fund’s ability to value its investments in an accurate and timely manner may be impacted by technological issues and/or errors by third party service providers, such as pricing services or accounting agents. If market conditions make it difficult to value certain investments, SEC rules an applicable accounting protocols may require a Fund may value these investments using more subjective methods, such as fair-value methodologies. Investors who purchase or redeem Fund shares on days when a Fund is holding fair-valued securities may receive fewer or more shares, or lower or higher redemption proceeds, than they would have received if a Fund had not fair-valued the securities or had used a different valuation methodology. The value of foreign securities, certain fixed-income securities and currencies, as applicable, may be materially affected by events after the close of the markets on which they are traded, but before a Fund determines its NAV.
61
American Beacon FundsSM
Notes to Financial Statements
June 30, 2024
Variable and Floating Rate Securities Risk
The coupons on certain fixed income securities in which a Fund may invest are not fixed and may fluctuate based upon changes in market rates. The coupon on a floating rate security is generally based on an interest rate such as a money-market index, SOFR, LIBOR or a Treasury bill rate. Such securities are subject to interest rate risk and may fluctuate in value in response to interest rate changes if there is a delay between changes in market interest rates and the interest reset date for the obligation, or for other reasons. As short-term interest rates decline, the coupons on variable and floating rate securities typically decrease. Alternatively, during periods of rising interest rates, changes in the coupons of variable and floating rate securities may lag behind changes in market rates or may have limits on the maximum increases in the coupon rates. The value of variable and floating rate securities may decline if their coupons do not rise as much, or as quickly, as interest rates in general. Conversely, variable and floating rate securities will not generally increase in value if interest rates decline. Variable and floating rate securities are less effective at locking in a particular yield and are subject to credit risk. Certain types of floating rate instruments may also be subject to greater liquidity risk than other debt securities.
7. Federal Income and Excise Taxes
It is the policy of each Fund to qualify as a RIC, by complying with all applicable provisions of Subchapter M of the Internal Revenue Code, as amended, and to make distributions of taxable income sufficient to relieve it from substantially all federal income and excise taxes. For federal income tax purposes, each Fund is treated as a single entity for the purpose of determining such qualification.
The Funds do not have any unrecorded tax liabilities in the accompanying financial statements. Each of the tax years in the four year period ended June 30, 2024 remain subject to examination by the Internal Revenue Service. If applicable, the Funds recognize interest accrued related to unrecognized tax benefits in interest expense and penalties in “Other expenses” on the Statements of Operations.
The Funds may be subject to taxes imposed by countries in which it invests. Such taxes are generally based on returns of income earned or gains realized or repatriated. Taxes are accrued and applied to net investment income, net realized capital gains and net unrealized appreciation (depreciation), as applicable, as the income is earned or capital gains are recorded.
Dividends are categorized in accordance with income tax regulations which may treat certain transactions differently than U.S. GAAP. Accordingly, the character of distributions and composition of net assets for tax purposes may differ from those reflected in the accompanying financial statements.
The tax character of distributions paid were as follows:
| | | | | | | | | | | | | | | | | | | | | | | | | | | | | | | | | | | | | | | | | | | | |
| | | SSI Alternative Income Fund | | | | | | TwentyFour Strategic
Income Fund | | | | | | TwentyFour Sustainable
Short Term Bond Fund | |
| | | Year Ended
June 30, 2024 | | | | | | Year Ended
June 30, 2023 | | | | | | Year Ended
June 30, 2024 | | | | | | Year Ended
June 30, 2023 | | | | | | Year Ended
June 30, 2024 | | | | | | Year Ended
June 30, 2023 | |
Distributions paid from: | | | | | | | | | | | | | | | | | | | | | | | | | | | | | | | | | | | | | | | | | | | | |
Ordinary income* | | | | | | | | | | | | | | | | | | | | | | | | | | | | | | | | | | | | | | | | | | | | |
R5 Class | | $ | 1,186,736 | | | | | | | $ | 4,496 | | | | | | | $ | 361,957 | | | | | | | $ | 786,113 | | | | | | | $ | - | | | | | | | $ | - | |
Y Class | | | 6,809,234 | | | | | | | | 1,800,007 | | | | | | | | 4,059,045 | | | | | | | | 15,125,690 | | | | | | | | - | | | | | | | | 765,187 | |
Investor Class | | | 178,530 | | | | | | | | 6,033 | | | | | | | | 423,786 | | | | | | | | 1,961,048 | | | | | | | | - | | | | | | | | - | |
A Class | | | - | | | | | | | | - | | | | | | | | 258,051 | | | | | | | | 867,982 | | | | | | | | - | | | | | | | | 12,601 | |
C Class | | | - | | | | | | | | - | | | | | | | | 193,390 | | | | | | | | 851,694 | | | | | | | | - | | | | | | | | 15,336 | |
R6 Class | | | - | | | | | | | | - | | | | | | | | - | | | | | | | | - | | | | | | | | - | | | | | | | | 1,029,403 | |
Return of capital | | | | | | | | | | | | | | | | | | | | | | | | | | | | | | | | | | | | | | | | | | | | |
R5 Class | | | - | | | | | | | | - | | | | | | | | 130,391 | | | | | | | | - | | | | | | | | - | | | | | | | | - | |
Y Class | | | - | | | | | | | | - | | | | | | | | 2,076,811 | | | | | | | | - | | | | | | | | 318,242 | | | | | | | | - | |
Investor Class | | | - | | | | | | | | - | | | | | | | | 37,601 | | | | | | | | - | | | | | | | | - | | | | | | | | - | |
A Class | | | - | | | | | | | | - | | | | | | | | 88,948 | | | | | | | | - | | | | | | | | 4,316 | | | | | | | | - | |
C Class | | | - | | | | | | | | - | | | | | | | | 52,951 | | | | | | | | - | | | | | | | | 23,906 | | | | | | | | - | |
R6 Class | | | - | | | | | | | | - | | | | | | | | - | | | | | | | | - | | | | | | | | 136,008 | | | | | | | | - | |
| | | | | | | | | | | | | | | | | | | | | | | | | | | | | | | | | | | | | | | | | | | | |
Total distributions paid | | $ | 8,174,500 | | | | | | | $ | 1,810,536 | | | | | | | $ | 7,682,931 | | | | | | | $ | 19,592,527 | | | | | | | $ | 482,472 | | | | | | | $ | 1,822,527 | |
| | | | | | | | | | | | | | | | | | | | | | | | | | | | | | | | | | | | | | | | | | | | |
62
American Beacon FundsSM
Notes to Financial Statements
June 30, 2024
*For tax purposes, short-term capital gains are considered ordinary income distributions.
As of June 30, 2024, the components of distributable earnings (deficits) on a tax basis were as follows:
| | | | | | | | | | | | | | | | | | | | | | | | | | | | |
Fund | | Tax Cost | | | | | | Unrealized
Appreciation | | | | | | Unrealized
(Depreciation) | | | | | | Net Unrealized
Appreciation
(Depreciation) | |
SSI Alternative Income | | $ | 175,922,749 | | | | | | | $ | 5,312,423 | | | | | | | $ | (9,872,214 | ) | | | | | | $ | (4,559,791 | ) |
TwentyFour Strategic Income | | | 232,905,411 | | | | | | | | 1,946,533 | | | | | | | | (8,718,813 | ) | | | | | | | (6,772,280 | ) |
TwentyFour Sustainable Short Term Bond | | | 10,432,069 | | | | | | | | 71,890 | | | | | | | | (370,096 | ) | | | | | | | (298,206 | ) |
| | | | | | | | | | | | | | | | | | | | | | | | | | | | | | | | | | | | | | | | | | | | |
Fund | | Net Unrealized
Appreciation
(Depreciation) | | | | | | Undistributed
Ordinary
Income | | | | | | Undistributed
Long-Term
Capital Gains | | | | | | Accumulated
Capital and
Other (Losses) | | | | | | Other Temporary
Differences | | | | | | Distributable
Earnings | |
SSI Alternative Income | | $ | (4,559,791 | ) | | | | | | $ | 2,384,702 | | | | | | | $ | - | | | | | | | $ | (6,838,442 | ) | | | | | | $ | - | | | | | | | $ | (9,013,531 | ) |
TwentyFour Strategic Income | | | (6,772,280 | ) | | | | | | | - | | | | | | | | - | | | | | | | | (42,643,989 | ) | | | | | | | 2 | | | | | | | | (49,416,267 | ) |
TwentyFour Sustainable Short Term Bond | | | (298,206 | ) | | | | | | | - | | | | | | | | - | | | | | | | | (1,015,297 | ) | | | | | | | - | | | | | | | | (1,313,503 | ) |
Financial reporting records are adjusted for permanent book/tax differences to reflect tax character. Financial records are not adjusted for temporary differences. The temporary differences between financial reporting and tax-basis reporting of unrealized appreciation (depreciation) are attributable primarily to the tax deferral of losses from wash sales, income realized for tax purposes from contingent payment debt instruments, the tax deferral of losses from straddles, deemed distributions from convertible obligations, late year loss deferrals, unused capital losses and the realization for tax purposes of unrealized gains (losses) on certain derivative instruments.
Due to inherent differences in the recognition of income, expenses, and realized gains (losses) under U.S. GAAP and federal income tax regulations, permanent differences between book and tax reporting have been identified and appropriately reclassified on the Statements of Assets and Liabilities.
Accordingly, the following amounts represent current year permanent differences derived from organization costs and net operating losses as of June 30, 2024:
| | | | | | | | | | | | |
Fund | | Paid-In-Capital | | | | | | Distributable
Earnings/(Deficits) | |
| SSI Alternative Income | | $ | 4,619 | | | | | | | $ | (4,619 | ) |
| TwentyFour Strategic Income | | | - | | | | | | | | - | |
| TwentyFour Sustainable Short Term Bond | | | (57,291 | ) | | | | | | | 57,291 | |
Under the Regulated Investment Company Modernization Act of 2010 (“RIC MOD”), net capital losses recognized by the Funds in taxable years beginning after December 22, 2010 are carried forward indefinitely and retain their character as short-term and/or long-term losses.
As of June 30, 2024, the Funds had the following post RIC MOD capital loss carryforwards:
| | | | | | | | | | | | |
Fund | | Short-Term
Capital Loss
Carryforwards | | | | | | Long-Term
Capital Loss
Carryforwards | |
| SSI Alternative Income | | $ | - | | | | | | | $ | 6,838,442 | |
TwentyFour Strategic Income
| | | 10,266,474 | | | | | | | | 32,004,450 | |
| TwentyFour Sustainable Short Term Bond | | | 145,567 | | | | | | | | 479,522 | |
For TwentyFour Sustainable Short Term Bond Fund, the ability to utilize capital loss carryforwards in the future could be limited under the Internal Revenue Code and related regulations based on the results of future transactions.
The Funds are permitted for tax purposes to defer into the next fiscal year qualified late year losses. Qualified late year capital losses are net losses incurred after October 31 through the Fund’s fiscal year end, June 30, 2024. Qualified late year ordinary losses are specified losses generally incurred after October 31 through
63
American Beacon FundsSM
Notes to Financial Statements
June 30, 2024
the end of the Fund’s fiscal year end, June 30, 2024. For the period ending June 30, 2024, TwentyFour Strategic Income deferred $373,065 ordinary loss and TwentyFour Sustainable Short Term Bond deferred $390,208 ordinary loss to July 1, 2024.
8. Investment Transactions
The aggregate cost of purchases and proceeds from sales and maturities of investments, other than short-term obligations, for the year ended June 30, 2024 were as follows:
| | | | | | | | | | | | | | | | | | | | | | | | | | | | |
Fund | | Purchases
(non-U.S.
Government
Securities) | | | | | | Purchases of U.S.
Government
Securities | | | | | | Sales
(non-U.S.
Government
Securities) | | | | | | Sales of U.S.
Government
Securities | |
SSI Alternative Income | | $ | 132,377,803 | | | | | | | $ | - | | | | | | | $ | 102,908,165 | | | | | | | $ | - | |
TwentyFour Strategic Income | | | 128,935,387 | | | | | | | | 56,635,561 | | | | | | | | 27,356,730 | | | | | | | | 54,354,887 | |
TwentyFour Sustainable Short Term Bond | | | 9,208,845 | | | | | | | | 3,894,687 | | | | | | | | 13,144,238 | | | | | | | | 3,376,078 | |
A summary of the Funds’ transactions in the USG Select Fund for the year ended June 30, 2024 were as follows:
| | | | | | | | | | | | | | | | | | | | | | | | | | | | | | | | | | | | |
Fund | | Type of
Transaction | | | | | | June 30,
2023
Shares/Fair
Value | | | | | | Purchases | | | | | | Sales | | | | | | June 30,
2024
Shares/Fair
Value | |
SSI Alternative Income | | | Direct | | | | | | | $ | 5,813,495 | | | | | | | $ | 112,119,607 | | | | | | | $ | 91,056,469 | | | | | | | $ | 26,876,633 | |
TwentyFour Strategic Income | | | Direct | | | | | | | | 3,383,500 | | | | | | | | 122,306,453 | | | | | | | | 122,188,667 | | | | | | | | 3,501,286 | |
9. Borrowing Arrangements
Effective November 10, 2023 (the “Effective Date”), the Funds, along with certain other funds managed by the Manager (“Participating Funds”), renewed a committed revolving line of credit (the “Committed Line”) agreement with State Street Bank and Trust Company (the “Bank”) to be used to facilitate portfolio liquidity. The maximum borrowing amount under the Committed Line is $100 million with interest at a rate equal to the higher of (a) Overnight Bank Funding Rate (“OBFR”) daily fluctuating rate per annum equal to 1.25% plus the sum of 0.10% or (b) the Federal Funds daily fluctuating rate per annum on amounts borrowed. Each of the Participating Funds paid a proportional amount of a quarterly commitment fee at a rate of 0.25% per annum on the unused portion of the Committed Line amount. The Committed Line expires November 8, 2024, unless extended by the Bank or terminated by the Participating Funds in accordance with the agreement. Prior to the Effective Date, the maximum borrowing amount under the Committed Line was $100 million with an expiration date November 9, 2023.
On the Effective Date, the Funds, along with certain other Participating Funds managed by the Manager, also renewed an uncommitted discretionary demand revolving line of credit (the “Uncommitted Line”) agreement with the Bank to be used to facilitate portfolio liquidity. The maximum borrowing amount under the Uncommitted Line is $100 million with interest at a rate equal to the higher of (a) OBFR daily fluctuating rate per annum equal to 1.25% plus the sum of 0.10% or (b) the Federal Funds daily fluctuating rate per annum on amounts borrowed on each outstanding loan. Each of the Participating Funds paid a proportional amount of a closing fee of $35,000 on the Effective Date. The Uncommitted Line expires November 8, 2024, unless extended by the Bank or terminated by the Participating Funds in accordance with the agreement. Prior to the Effective Date, the maximum borrowing amount under the Uncommitted Line was $100 million with an expiration date November 9, 2023.
The Participating Funds paid administration, legal and arrangement fees, which are recognized as a component of “Loan expense” on the Statements of Operations, along with commitment fees, that have been allocated among the Participating Funds based on average daily net assets.
During the year ended June 30, 2024, the Funds did not utilize these facilities.
64
American Beacon FundsSM
Notes to Financial Statements
June 30, 2024
10. Capital Share Transactions
The tables below summarize the activity in capital shares for each Class of the Funds:
| | | | | | | | | | | | | | | | | | | | | | | | | | | | |
| | | R5 Class | |
| | | Year Ended June 30, | |
| | | 2024 | | | | | | 2023 | |
SSI Alternative Income Fund | | Shares | | | | | | Amount | | | | | | Shares | | | | | | Amount | |
| Shares sold | | | 4,258,589 | | | | | | | $ | 40,788,721 | | | | | | | | 239 | | | | | | | $ | 2,263 | |
| Reinvestment of dividends | | | 33,910 | | | | | | | | 326,811 | | | | | | | | 329 | | | | | | | | 3,040 | |
| Shares redeemed | | | (437,413 | ) | | | | | | | (4,215,493 | ) | | | | | | | (7,704 | ) | | | | | | | (73,163 | ) |
| | | | | | | | | | | | | | | | | | | | | | | | | | | | |
| Net increase (decrease) in shares outstanding | | | 3,855,086 | | | | | | | $ | 36,900,039 | | | | | | | | (7,136 | ) | | | | | | $ | (67,860 | ) |
| | | | | | | | | | | | | | | | | | | | | | | | | | | | |
| | | | |
| | | Y Class | |
| | | Year Ended June 30, | |
| | | 2024 | | | | | | 2023 | |
SSI Alternative Income Fund | | Shares | | | | | | Amount | | | | | | Shares | | | | | | Amount | |
| Shares sold | | | 6,490,515 | | | | | | | $ | 62,542,083 | | | | | | | | 1,976,301 | | | | | | | $ | 18,650,934 | |
| Reinvestment of dividends | | | 663,802 | | | | | | | | 6,331,968 | | | | | | | | 159,662 | | | | | | | | 1,476,715 | |
| Shares redeemed | | | (3,598,946 | ) | | | | | | | (34,408,065 | ) | | | | | | | (5,630,750 | ) | | | | | | | (53,001,372 | ) |
| | | | | | | | | | | | | | | | | | | | | | | | | | | | |
| Net increase (decrease) in shares outstanding | | | 3,555,371 | | | | | | | $ | 34,465,986 | | | | | | | | (3,494,787 | ) | | | | | | $ | (32,873,723 | ) |
| | | | | | | | | | | | | | | | | | | | | | | | | | | | |
| | | | |
| | | Investor Class | |
| | | Year Ended June 30, | |
| | | 2024 | | | | | | 2023 | |
SSI Alternative Income Fund | | Shares | | | | | | Amount | | | | | | Shares | | | | | | Amount | |
| Shares sold | | | 122,441 | | | | | | | $ | 1,168,318 | | | | | | | | 133,983 | | | | | | | $ | 1,268,705 | |
| Reinvestment of dividends | | | 18,676 | | | | | | | | 178,530 | | | | | | | | 650 | | | | | | | | 6,033 | |
| Shares redeemed | | | (14,468 | ) | | | | | | | (138,529 | ) | | | | | | | (8,012 | ) | | | | | | | (75,483 | ) |
| | | | | | | | | | | | | | | | | | | | | | | | | | | | |
| Net increase in shares outstanding | | | 126,649 | | | | | | | $ | 1,208,319 | | | | | | | | 126,621 | | | | | | | $ | 1,199,255 | |
| | | | | | | | | | | | | | | | | | | | | | | | | | | | |
| | | | |
| | | R5 Class | |
| | | Year Ended June 30, | |
| | | 2024 | | | | | | 2023 | |
TwentyFour Strategic Income Fund | | Shares | | | | | | Amount | | | | | | Shares | | | | | | Amount | |
| Shares sold | | | 581,709 | | | | | | | $ | 4,869,717 | | | | | | | | 476,603 | | | | | | | $ | 3,823,593 | |
| Reinvestment of dividends | | | 59,722 | | | | | | | | 492,348 | | | | | | | | 96,450 | | | | | | | | 786,113 | |
| Shares redeemed | | | (260,194 | ) | | | | | | | (2,184,010 | ) | | | | | | | (59,965 | ) | | | | | | | (510,436 | ) |
| | | | | | | | | | | | | | | | | | | | | | | | | | | | |
| Net increase in shares outstanding | | | 381,237 | | | | | | | $ | 3,178,055 | | | | | | | | 513,088 | | | | | | | $ | 4,099,270 | |
| | | | | | | | | | | | | | | | | | | | | | | | | | | | |
| | | | |
| | | Y Class | |
| | | Year Ended June 30, | |
| | | 2024 | | | | | | 2023 | |
TwentyFour Strategic Income Fund | | Shares | | | | | | Amount | | | | | | Shares | | | | | | Amount | |
| Shares sold | | | 17,128,599 | | | | | | | $ | 142,887,676 | | | | | | | | 6,584,648 | | | | | | | $ | 54,381,609 | |
| Reinvestment of dividends | | | 715,745 | | | | | | | | 5,888,170 | | | | | | | | 1,812,913 | | | | | | | | 14,800,716 | |
| Shares redeemed | | | (4,178,245 | ) | | | | | | | (34,091,779 | ) | | | | | | | (13,454,362 | ) | | | | | | | (114,984,674 | ) |
| | | | | | | | | | | | | | | | | | | | | | | | | | | | |
| Net increase (decrease) in shares outstanding | | | 13,666,099 | | | | | | | $ | 114,684,067 | | | | | | | | (5,056,801 | ) | | | | | | $ | (45,802,349 | ) |
| | | | | | | | | | | | | | | | | | | | | | | | | | | | |
| | | | |
| | | Investor Class | |
| | | Year Ended June 30, | |
| | | 2024 | | | | | | 2023 | |
TwentyFour Strategic Income Fund | | Shares | | | | | | Amount | | | | | | Shares | | | | | | Amount | |
| Shares sold | | | 115,381 | | | | | | | $ | 933,891 | | | | | | | | 365,674 | | | | | | | $ | 3,010,708 | |
| Reinvestment of dividends | | | 57,679 | | | | | | | | 461,387 | | | | | | | | 243,979 | | | | | | | | 1,961,048 | |
| Shares redeemed | | | (1,281,356 | ) | | | | | | | (10,536,544 | ) | | | | | | | (1,337,187 | ) | | | | | | | (11,668,678 | ) |
| | | | | | | | | | | | | | | | | | | | | | | | | | | | |
| Net (decrease) in shares outstanding | | | (1,108,296 | ) | | | | | | $ | (9,141,266 | ) | | | | | | | (727,534 | ) | | | | | | $ | (6,696,922 | ) |
| | | | | | | | | | | | | | | | | | | | | | | | | | | | |
| | | | |
65
American Beacon FundsSM
Notes to Financial Statements
June 30, 2024
| | | | | | | | | | | | | | | | | | | | | | | | | | | | |
| | | A Class | |
| | | Year Ended June 30, | |
| | | 2024 | | | | | | 2023 | |
TwentyFour Strategic Income Fund | | Shares | | | | | | Amount | | | | | | Shares | | | | | | Amount | |
| Shares sold | | | 468,675 | | | | | | | $ | 3,766,847 | | | | | | | | 197,775 | | | | | | | $ | 1,601,221 | |
| Reinvestment of dividends | | | 42,920 | | | | | | | | 346,700 | | | | | | | | 107,064 | | | | | | | | 859,812 | |
| Shares redeemed | | | (194,365 | ) | | | | | | | (1,580,332 | ) | | | | | | | (267,480 | ) | | | | | | | (2,213,431 | ) |
| | | | | | | | | | | | | | | | | | | | | | | | | | | | |
| Net increase in shares outstanding | | | 317,230 | | | | | | | $ | 2,533,215 | | | | | | | | 37,359 | | | | | | | $ | 247,602 | |
| | | | | | | | | | | | | | | | | | | | | | | | | | | | |
| | | | |
| | | C Class | |
| | | Year Ended June 30, | |
| | | 2024 | | | | | | 2023 | |
TwentyFour Strategic Income Fund | | Shares | | | | | | Amount | | | | | | Shares | | | | | | Amount | |
| Shares sold | | | 204,422 | | | | | | | $ | 1,657,391 | | | | | | | | 331,336 | | | | | | | $ | 2,666,161 | |
| Reinvestment of dividends | | | 30,693 | | | | | | | | 246,194 | | | | | | | | 106,651 | | | | | | | | 851,678 | |
| Shares redeemed | | | (218,008 | ) | | | | | | | (1,771,063 | ) | | | | | | | (448,529 | ) | | | | | | | (3,692,446 | ) |
| | | | | | | | | | | | | | | | | | | | | | | | | | | | |
| Net increase (decrease) in shares outstanding | | | 17,107 | | | | | | | $ | 132,522 | | | | | | | | (10,542 | ) | | | | | | $ | (174,607 | ) |
| | | | | | | | | | | | | | | | | | | | | | | | | | | | |
| | | | |
| | | Y Class | |
| | | Year Ended June 30, | |
| | | 2024 | | | | | | 2023 | |
TwentyFour Sustainable Short Term Bond Fund | | Shares | | | | | | Amount | | | | | | Shares | | | | | | Amount | |
| Shares sold | | | 874,496 | | | | | | | $ | 7,569,523 | | | | | | | | 304,592 | | | | | | | $ | 2,699,095 | |
| Reinvestment of dividends | | | 36,699 | | | | | | | | 315,063 | | | | | | | | 90,102 | | | | | | | | 765,187 | |
| Shares redeemed | | | (617,521 | ) | | | | | | | (5,358,933 | ) | | | | | | | (148,135 | ) | | | | | | | (1,294,237 | ) |
| | | | | | | | | | | | | | | | | | | | | | | | | | | | |
| Net increase in shares outstanding | | | 293,674 | | | | | | | $ | 2,525,653 | | | | | | | | 246,559 | | | | | | | $ | 2,170,045 | |
| | | | | | | | | | | | | | | | | | | | | | | | | | | | |
| | | | |
| | | A Class | |
| | | Year Ended June 30, | |
| | | 2024 | | | | | | 2023 | |
TwentyFour Sustainable Short Term Bond Fund | | Shares | | | | | | Amount | | | | | | Shares | | | | | | Amount | |
| Shares sold | | | 16,732 | | | | | | | $ | 142,619 | | | | | | | | 21,663 | | | | | | | $ | 197,785 | |
| Reinvestment of dividends | | | 330 | | | | | | | | 2,813 | | | | | | | | 171 | | | | | | | | 1,477 | |
| Shares redeemed | | | (27,018 | ) | | | | | | | (231,553 | ) | | | | | | | (18,459 | ) | | | | | | | (169,654 | ) |
| | | | | | | | | | | | | | | | | | | | | | | | | | | | |
| Net increase (decrease) in shares outstanding | | | (9,956 | ) | | | | | | $ | (86,121 | ) | | | | | | | 3,375 | | | | | | | $ | 29,608 | |
| | | | | | | | | | | | | | | | | | | | | | | | | | | | |
| | | | |
| | | C Class | |
| | | Year Ended June 30, | |
| | | 2024 | | | | | | 2023 | |
TwentyFour Sustainable Short Term Bond Fund | | Shares | | | | | | Amount | | | | | | Shares | | | | | | Amount | |
| Shares sold | | | 57,035 | | | | | | | $ | 472,730 | | | | | | | | 53,258 | | | | | | | $ | 438,471 | |
| Reinvestment of dividends | | | 2,821 | | | | | | | | 23,345 | | | | | | | | 587 | | | | | | | | 4,822 | |
| Shares redeemed | | | (28,953 | ) | | | | | | | (238,889 | ) | | | | | | | (795 | ) | | | | | | | (6,529 | ) |
| | | | | | | | | | | | | | | | | | | | | | | | | | | | |
| Net increase in shares outstanding | | | 30,903 | | | | | | | $ | 257,186 | | | | | | | | 53,050 | | | | | | | $ | 436,764 | |
| | | | | | | | | | | | | | | | | | | | | | | | | | | | |
| | | | |
| | | R6 Class | |
| | | Year Ended June 30, | |
| | | 2024 | | | | | | 2023 | |
TwentyFour Sustainable Short Term Bond Fund | | Shares | | | | | | Amount | | | | | | Shares | | | | | | Amount | |
| Shares sold | | | - | | | | | | | $ | - | | | | | | | | - | | | | | | | $ | - | |
| Reinvestment of dividends | | | - | | | | | | | | - | | | | | | | | - | | | | | | | | - | |
| Shares redeemed | | | (967,964 | ) | | | | | | | (8,352,000 | ) | | | | | | | - | | | | | | | | - | |
| | | | | | | | | | | | | | | | | | | | | | | | | | | | |
| Net (decrease) in shares outstanding | | | (967,964 | ) | | | | | | $ | (8,352,000 | ) | | | | | | | - | | | | | | | $ | - | |
| | | | | | | | | | | | | | | | | | | | | | | | | | | | |
11. Subsequent Events
Management has evaluated subsequent events for possible recognition or disclosure in the financial statements through the date the financial statements are issued. Management has determined that there are no material events that would require disclosure in the Funds’ financial statements through this date.
66
American Beacon SSI Alternative Income FundSM
Financial Highlights
(For a share outstanding throughout the period)
| | | | | | | | | | | | | | | | | | | | | | | | | | | | | | | | | | | | |
| | | R5 ClassA | |
| | | Year Ended June 30, | |
| | | 2024 | | | | | | 2023 | | | | | | 2022 | | | | | | 2021 | | | | | | 2020 | |
| | | | |
Net asset value, beginning of period | | $ | 9.66 | | | | | | | $ | 9.29 | | | | | | | $ | 11.15 | | | | | | | $ | 10.15 | | | | | | | $ | 10.27 | |
| | | | | | | | | | | | | | | | | | | | | | | | | | | | | | | | | | | | |
Income (loss) from investment operations: | | | | | | | | | | | | | | | | | | | | | | | | | | | | | | | | | | | | |
Net investment income | | | 0.55 | | | | | | | | 0.31 | | | | | | | | 0.38 | | | | | | | | 0.16 | | | | | | | | 0.19 | |
Net gains (losses) on investments (both realized and unrealized) | | | 0.18 | | | | | | | | 0.21 | | | | | | | | (0.95 | ) | | | | | | | 1.18 | | | | | | | | 0.06 | |
| | | | | | | | | | | | | | | | | | | | | | | | | | | | | | | | | | | | |
Total income (loss) from investment operations | | | 0.73 | | | | | | | | 0.52 | | | | | | | | (0.57 | ) | | | | | | | 1.34 | | | | | | | | 0.25 | |
| | | | | | | | | | | | | | | | | | | | | | | | | | | | | | | | | | | | |
Less distributions: | | | | | | | | | | | | | | | | | | | | | | | | | | | | | | | | | | | | |
Dividends from net investment income | | | (0.69 | ) | | | | | | | (0.15 | ) | | | | | | | (0.21 | ) | | | | | | | (0.26 | ) | | | | | | | (0.37 | ) |
Distributions from net realized gains | | | - | | | | | | | | - | | | | | | | | (1.08 | ) | | | | | | | (0.08 | ) | | | | | | | - | |
| | | | | | | | | | | | | | | | | | | | | | | | | | | | | | | | | | | | |
Total distributions | | | (0.69 | ) | | | | | | | (0.15 | ) | | | | | | | (1.29 | ) | | | | | | | (0.34 | ) | | | | | | | (0.37 | ) |
| | | | | | | | | | | | | | | | | | | | | | | | | | | | | | | | | | | | |
Net asset value, end of period | | $ | 9.70 | | | | | | | $ | 9.66 | | | | | | | $ | 9.29 | | | | | | | $ | 11.15 | | | | | | | $ | 10.15 | |
| | | | | | | | | | | | | | | | | | | | | | | | | | | | | | | | | | | | |
Total returnB | | | 7.90 | % | | | | | | | 5.65 | % | | | | | | | (5.85 | )% | | | | | | | 13.33 | % | | | | | | | 2.49 | % |
| | | | | | | | | | | | | | | | | | | | | | | | | | | | | | | | | | | | |
|
Ratios and supplemental data: | |
Net assets, end of period | | $ | 37,631,052 | | | | | | | $ | 223,692 | | | | | | | $ | 281,521 | | | | | | | $ | 109,650 | | | | | | | $ | 99,760 | |
Ratios to average net assets: | | | | | | | | | | | | | | | | | | | | | | | | | | | | | | | | | | | | |
Expenses, before reimbursements and/or recoupments | | | 1.76 | % | | | | | | | 1.90 | % | | | | | | | 1.64 | % | | | | | | | 1.93 | % | | | | | | | 4.90 | % |
Expenses, net of reimbursements and/or recoupments | | | 1.18 | %C | | | | | | | 1.60 | %C D | | | | | | | 1.64 | %C | | | | | | | 1.89 | %C | | | | | | | 2.19 | %C |
Net investment income (loss), before expense reimbursements and/or recoupments | | | 4.41 | % | | | | | | | 3.18 | % | | | | | | | 1.47 | % | | | | | | | 1.43 | % | | | | | | | (0.81 | )% |
Net investment income, net of reimbursements and/or recoupments | | | 4.99 | % | | | | | | | 3.48 | % | | | | | | | 1.47 | % | | | | | | | 1.47 | % | | | | | | | 1.90 | % |
Portfolio turnover rate | | | 127 | % | | | | | | | 97 | % | | | | | | | 113 | % | | | | | | | 326 | % | | | | | | | 242 | % |
| A | Prior to February 28, 2020, the R5 Class was known as Institutional Class. |
| B | Based on net asset value, which does not reflect the sales charge, redemption fee, or contingent deferred sales charge, if applicable. May include adjustments in accordance with U.S. GAAP and as such, the net asset value for reporting purposes and the returns based upon those net asset values may differ from the net asset value and returns for shareholder transactions. |
| C | Includes non-operating expenses consisting of prime broker fees, dividends and interest expense from securities sold short. The Expenses, net of reimbursements, excluding non-operating expenses is 0.92%, 1.22%, 1.49%, 1.49% and 1.49% for the year ended June 30, 2024, year ended June 30, 2023, year ended June 30, 2022, year ended June 30, 2021 and year ended June 30, 2020, respectively. |
| D | Expense ratios may exceed stated expense caps in Note 2 due to the change in the contractual expense caps on December 22, 2022. |
See accompanying notes
67
American Beacon SSI Alternative Income FundSM
Financial Highlights
(For a share outstanding throughout the period)
| | | | | | | | | | | | | | | | | | | | | | | | | | | | | | | | | | | | |
| | | Y ClassA | |
| | | Year Ended June 30, | |
| | | 2024 | | | | | | 2023 | | | | | | 2022 | | | | | | 2021 | | | | | | 2020 | |
| | | | |
Net asset value, beginning of period | | $ | 9.66 | | | | | | | $ | 9.29 | | | | | | | $ | 11.14 | | | | | | | $ | 10.14 | | | | | | | $ | 10.27 | |
| | | | | | | | | | | | | | | | | | | | | | | | | | | | | | | | | | | | |
Income (loss) from investment operations: | | | | | | | | | | | | | | | | | | | | | | | | | | | | | | | | | | | | |
Net investment income | | | 0.57 | | | | | | | | 0.26 | | | | | | | | 0.19 | | | | | | | | 0.08 | | | | | | | | 0.19 | |
Net gains (losses) on investments (both realized and unrealized) | | | 0.15 | | | | | | | | 0.25 | | | | | | | | (0.76 | ) | | | | | | | 1.26 | | | | | | | | 0.05 | |
| | | | | | | | | | | | | | | | | | | | | | | | | | | | | | | | | | | | |
Total income (loss) from investment operations | | | 0.72 | | | | | | | | 0.51 | | | | | | | | (0.57 | ) | | | | | | | 1.34 | | | | | | | | 0.24 | |
| | | | | | | | | | | | | | | | | | | | | | | | | | | | | | | | | | | | |
Less distributions: | | | | | | | | | | | | | | | | | | | | | | | | | | | | | | | | | | | | |
Dividends from net investment income | | | (0.69 | ) | | | | | | | (0.14 | ) | | | | | | | (0.20 | ) | | | | | | | (0.26 | ) | | | | | | | (0.37 | ) |
Distributions from net realized gains | | | - | | | | | | | | - | | | | | | | | (1.08 | ) | | | | | | | (0.08 | ) | | | | | | | - | |
| | | | | | | | | | | | | | | | | | | | | | | | | | | | | | | | | | | | |
Total distributions | | | (0.69 | ) | | | | | | | (0.14 | ) | | | | | | | (1.28 | ) | | | | | | | (0.34 | ) | | | | | | | (0.37 | ) |
| | | | | | | | | | | | | | | | | | | | | | | | | | | | | | | | | | | | |
Net asset value, end of period | | $ | 9.69 | | | | | | | $ | 9.66 | | | | | | | $ | 9.29 | | | | | | | $ | 11.14 | | | | | | | $ | 10.14 | |
| | | | | | | | | | | | | | | | | | | | | | | | | | | | | | | | | | | | |
Total returnB | | | 7.80 | % | | | | | | | 5.55 | % | | | | | | | (5.85 | )% | | | | | | | 13.33 | % | | | | | | | 2.35 | % |
| | | | | | | | | | | | | | | | | | | | | | | | | | | | | | | | | | | | |
|
Ratios and supplemental data: | |
Net assets, end of period | | $ | 135,345,378 | | | | | | | $ | 100,552,992 | | | | | | | $ | 129,179,345 | | | | | | | $ | 129,211,872 | | | | | | | $ | 139,609,314 | |
Ratios to average net assets: | | | | | | | | | | | | | | | | | | | | | | | | | | | | | | | | | | | | |
Expenses, before reimbursements and/or recoupments | | | 1.86 | % | | | | | | | 1.97 | % | | | | | | | 1.74 | % | | | | | | | 2.00 | % | | | | | | | 2.32 | % |
Expenses, net of reimbursements and/or recoupments | | | 1.26 | % | | | C | | | | 1.65 | %C D | | | | | | | 1.73 | %C | | | | | | | 1.96 | %C | | | | | | | 2.27 | %C |
Net investment income, before expense reimbursements and/or recoupments | | | 4.30 | % | | | | | | | 3.11 | % | | | | | | | 1.26 | % | | | | | | | 1.24 | % | | | | | | | 1.81 | % |
Net investment income, net of reimbursements and/or recoupments | | | 4.90 | % | | | | | | | 3.43 | % | | | | | | | 1.27 | % | | | | | | | 1.28 | % | | | | | | | 1.86 | % |
Portfolio turnover rate | | | 127 | % | | | | | | | 97 | % | | | | | | | 113 | % | | | | | | | 326 | % | | | | | | | 242 | % |
| A | On May 17, 2019, Class I was re-designated as Y Class. |
| B | Based on net asset value, which does not reflect the sales charge, redemption fee, or contingent deferred sales charge, if applicable. May include adjustments in accordance with U.S. GAAP and as such, the net asset value for reporting purposes and the returns based upon those net asset values may differ from the net asset value and returns for shareholder transactions. |
| C | Includes non-operating expenses consisting of prime broker fees, dividends and interest expense from securities sold short. The Expenses, net of reimbursements, excluding non-operating expenses is 0.99%, 1.28%, 1.56%, 1.56 and 1.56% for the year ended June 30, 2024, year ended June 30, 2023, year ended June 30, 2022, year ended June 30, 2021 and year ended June 30, 2020, respectively. |
| D | Expense ratios may exceed stated expense caps in Note 2 due to the change in the contractual expense caps on December 22, 2022. |
See accompanying notes
68
American Beacon SSI Alternative Income FundSM
Financial Highlights
(For a share outstanding throughout the period)
| | | | | | | | | | | | | | | | | | | | | | | | | | | | | | | | | | | | |
| | | Investor ClassA | |
| | | Year Ended June 30, | |
| | | 2024 | | | | | | 2023 | | | | | | 2022 | | | | | | 2021 | | | | | | 2020 | |
| | | | |
Net asset value, beginning of period | | $ | 9.68 | | | | | | | $ | 9.30 | | | | | | | $ | 11.12 | | | | | | | $ | 10.13 | | | | | | | $ | 10.27 | |
| | | | | | | | | | | | | | | | | | | | | | | | | | | | | | | | | | | | |
Income (loss) from investment operations: | | | | | | | | | | | | | | | | | | | | | | | | | | | | | | | | | | | | |
Net investment income | | | 0.47 | | | | | | | | 0.44 | | | | | | | | 0.10 | B | | | | | | | 0.08 | | | | | | | | 0.17 | |
Net gains (losses) on investments (both realized and unrealized) | | | 0.23 | | | | | | | | 0.04 | | | | | | | | (0.69 | ) | | | | | | | 1.23 | | | | | | | | 0.04 | |
| | | | | | | | | | | | | | | | | | | | | | | | | | | | | | | | | | | | |
Total income (loss) from investment operations | | | 0.70 | | | | | | | | 0.48 | | | | | | | | (0.59 | ) | | | | | | | 1.31 | | | | | | | | 0.21 | |
| | | | | | | | | | | | | | | | | | | | | | | | | | | | | | | | | | | | |
Less distributions: | | | | | | | | | | | | | | | | | | | | | | | | | | | | | | | | | | | | |
Dividends from net investment income | | | (0.68 | ) | | | | | | | (0.10 | ) | | | | | | | (0.15 | ) | | | | | | | (0.24 | ) | | | | | | | (0.35 | ) |
Distributions from net realized gains | | | - | | | | | | | | - | | | | | | | | (1.08 | ) | | | | | | | (0.08 | ) | | | | | | | - | |
| | | | | | | | | | | | | | | | | | | | | | | | | | | | | | | | | | | | |
Total distributions | | | (0.68 | ) | | | | | | | (0.10 | ) | | | | | | | (1.23 | ) | | | | | | | (0.32 | ) | | | | | | | (0.35 | ) |
| | | | | | | | | | | | | | | | | | | | | | | | | | | | | | | | | | | | |
Net asset value, end of period | | $ | 9.70 | | | | | | | $ | 9.68 | | | | | | | $ | 9.30 | | | | | | | $ | 11.12 | | | | | | | $ | 10.13 | |
| | | | | | | | | | | | | | | | | | | | | | | | | | | | | | | | | | | | |
Total returnC | | | 7.50 | % | | | | | | | 5.24 | % | | | | | | | (6.03 | )% | | | | | | | 13.03 | % | | | | | | | 2.07 | % |
| | | | | | | | | | | | | | | | | | | | | | | | | | | | | | | | | | | | |
|
Ratios and supplemental data: | |
Net assets, end of period | | $ | 3,055,015 | | | | | | | $ | 1,821,486 | | | | | | | $ | 572,433 | | | | | | | $ | 1,411,885 | | | | | | | $ | 862,020 | |
Ratios to average net assets: | | | | | | | | | | | | | | | | | | | | | | | | | | | | | | | | | | | | |
Expenses, before reimbursements and/or recoupments | | | 2.20 | % | | | | | | | 2.35 | % | | | | | | | 2.13 | % | | | | | | | 2.32 | % | | | | | | | 2.97 | % |
Expenses, net of reimbursements and/or recoupments | | | 1.51 | %D | | | | | | | 1.72 | %D E | | | | | | | 1.99 | %D | | | | | | | 2.20 | %D | | | | | | | 2.52 | %D |
Net investment income, before expense reimbursements and/or recoupments | | | 3.96 | % | | | | | | | 3.05 | % | | | | | | | 0.81 | % | | | | | | | 0.84 | % | | | | | | | 1.13 | % |
Net investment income, net of reimbursements and/or recoupments | | | 4.65 | % | | | | | | | 3.68 | % | | | | | | | 0.95 | % | | | | | | | 0.96 | % | | | | | | | 1.58 | % |
Portfolio turnover rate | | | 127 | % | | | | | | | 97 | % | | | | | | | 113 | % | | | | | | | 326 | % | | | | | | | 242 | % |
| A | On May 17, 2019, Class A was re-designated as Investor Class. |
| B | Based on average shares outstanding for the period. |
| C | Based on net asset value, which does not reflect the sales charge, redemption fee, or contingent deferred sales charge, if applicable. May include adjustments in accordance with U.S. GAAP and as such, the net asset value for reporting purposes and the returns based upon those net asset values may differ from the net asset value and returns for shareholder transactions. |
| D | Includes non-operating expenses consisting of prime broker fees, dividends and interest expense from securities sold short. The Expenses, net of reimbursements, excluding non-operating expenses is 1.24%, 1.40%, 1.81%, 1.81% and 1.81% for the year ended June 30, 2024, year ended June 30, 2023, year ended June 30, 2022, year ended June 30, 2021 and year ended June 30, 2020, respectively. |
| E | Expense ratios may exceed stated expense caps in Note 2 due to the change in the contractual expense caps on December 22, 2022. |
See accompanying notes
69
American Beacon TwentyFour Strategic Income FundSM
Financial Highlights
(For a share outstanding throughout the period)
| | | | | | | | | | | | | | | | | | | | | | | | | | | | | | | | | | | | |
| | | R5 ClassA | |
| | | Year Ended June 30, | |
| | | 2024 | | | | | | 2023 | | | | | | 2022 | | | | | | 2021 | | | | | | 2020 | |
| | | | |
Net asset value, beginning of period | | $ | 8.02 | | | | | | | $ | 9.15 | | | | | | | $ | 11.02 | | | | | | | $ | 10.27 | | | | | | | $ | 10.24 | |
| | | | | | | | | | | | | | | | | | | | | | | | | | | | | | | | | | | | |
Income (loss) from investment operations: | | | | | | | | | | | | | | | | | | | | | | | | | | | | | | | | | | | | |
Net investment income | | | 0.76 | | | | | | | | 1.61 | | | | | | | | 0.38 | B | | | | | | | 0.41 | | | | | | | | 0.35 | |
Net gains (losses) on investments (both realized and unrealized) | | | 0.24 | | | | | | | | (1.22 | ) | | | | | | | (1.85 | ) | | | | | | | 0.71 | | | | | | | | 0.03 | |
| | | | | | | | | | | | | | | | | | | | | | | | | | | | | | | | | | | | |
Total income (loss) from investment operations | | | 1.00 | | | | | | | | 0.39 | | | | | | | | (1.47 | ) | | | | | | | 1.12 | | | | | | | | 0.38 | |
| | | | | | | | | | | | | | | | | | | | | | | | | | | | | | | | | | | | |
Less distributions: | | | | | | | | | | | | | | | | | | | | | | | | | | | | | | | | | | | | |
Dividends from net investment income | | | (0.33 | ) | | | | | | | (1.52 | ) | | | | | | | (0.40 | ) | | | | | | | (0.37 | ) | | | | | | | (0.35 | ) |
Tax return of capital | | | (0.11 | ) | | | | | | | - | | | | | | | | - | | | | | | | | - | | | | | | | | - | |
| | | | | | | | | | | | | | | | | | | | | | | | | | | | | | | | | | | | |
Total distributions | | | (0.44 | ) | | | | | | | (1.52 | ) | | | | | | | (0.40 | ) | | | | | | | (0.37 | ) | | | | | | | (0.35 | ) |
| | | | | | | | | | | | | | | | | | | | | | | | | | | | | | | | | | | | |
Net asset value, end of period | | $ | 8.58 | | | | | | | $ | 8.02 | | | | | | | $ | 9.15 | | | | | | | $ | 11.02 | | | | | | | $ | 10.27 | |
| | | | | | | | | | | | | | | | | | | | | | | | | | | | | | | | | | | | |
Total returnC | | | 12.89 | % | | | | | | | 4.77 | % | | | | | | | (13.73 | )% | | | | | | | 11.06 | % | | | | | | | 3.81 | % |
| | | | | | | | | | | | | | | | | | | | | | | | | | | | | | | | | | | | |
|
Ratios and supplemental data: | |
Net assets, end of period | | $ | 11,602,470 | | | | | | | $ | 7,782,080 | | | | | | | $ | 4,186,949 | | | | | | | $ | 11,799,339 | | | | | | | $ | 9,824,323 | |
Ratios to average net assets: | | | | | | | | | | | | | | | | | | | | | | | | | | | | | | | | | | | | |
Expenses, before reimbursements and/or recoupments | | | 0.93 | % | | | | | | | 1.01 | % | | | | | | | 0.88 | % | | | | | | | 0.91 | % | | | | | | | 1.01 | % |
Expenses, net of reimbursements and/or recoupments | | | 0.72 | % | | | | | | | 0.72 | % | | | | | | | 0.72 | % | | | | | | | 0.72 | % | | | | | | | 0.72 | % |
Net investment income, before expense reimbursements and/or recoupments | | | 5.16 | % | | | | | | | 5.05 | % | | | | | | | 3.43 | % | | | | | | | 3.05 | % | | | | | | | 2.69 | % |
Net investment income, net of reimbursements and/or recoupments | | | 5.37 | % | | | | | | | 5.34 | % | | | | | | | 3.59 | % | | | | | | | 3.24 | % | | | | | | | 2.98 | % |
Portfolio turnover rate | | | 58 | % | | | | | | | 63 | % | | | | | | | 48 | % | | | | | | | 79 | % | | | | | | | 185 | % |
| A | Prior to February 28, 2020, the R5 Class was known as Institutional Class. |
| B | Per share amounts have been calculated using the average shares method. |
| C | Based on net asset value, which does not reflect the sales charge, redemption fee, or contingent deferred sales charge, if applicable. May include adjustments in accordance with U.S. GAAP and as such, the net asset value for reporting purposes and the returns based upon those net asset values may differ from the net asset value and returns for shareholder transactions. |
See accompanying notes
70
American Beacon TwentyFour Strategic Income FundSM
Financial Highlights
(For a share outstanding throughout the period)
| | | | | | | | | | | | | | | | | | | | | | | | | | | | | | | | | | | | |
| | | Y Class | |
| | | Year Ended June 30, | |
| | | 2024 | | | | | | 2023 | | | | | | 2022 | | | | | | 2021 | | | | | | 2020 | |
| | | | |
Net asset value, beginning of period | | $ | 7.98 | | | | | | | $ | 9.12 | | | | | | | $ | 10.99 | | | | | | | $ | 10.25 | | | | | | | $ | 10.22 | |
| | | | | | | | | | | | | | | | | | | | | | | | | | | | | | | | | | | | |
Income (loss) from investment operations: | | | | | | | | | | | | | | | | | | | | | | | | | | | | | | | | | | | | |
Net investment income | | | 1.10 | | | | | | | | 0.48 | | | | | | | | 0.37 | | | | | | | | 0.39 | | | | | | | | 0.37 | |
Net gains (losses) on investments (both realized and unrealized) | | | (0.11 | ) | | | | | | | (0.10 | ) | | | | | | | (1.84 | ) | | | | | | | 0.72 | | | | | | | | 0.01 | |
| | | | | | | | | | | | | | | | | | | | | | | | | | | | | | | | | | | | |
Total income (loss) from investment operations | | | 0.99 | | | | | | | | 0.38 | | | | | | | | (1.47 | ) | | | | | | | 1.11 | | | | | | | | 0.38 | |
| | | | | | | | | | | | | | | | | | | | | | | | | | | | | | | | | | | | |
Less distributions: | | | | | | | | | | | | | | | | | | | | | | | | | | | | | | | | | | | | |
Dividends from net investment income | | | (0.33 | ) | | | | | | | (1.52 | ) | | | | | | | (0.40 | ) | | | | | | | (0.37 | ) | | | | | | | (0.35 | ) |
Tax return of capital | | | (0.11 | ) | | | | | | | - | | | | | | | | - | | | | | | | | - | | | | | | | | - | |
| | | | | | | | | | | | | | | | | | | | | | | | | | | | | | | | | | | | |
Total distributions | | | (0.44 | ) | | | | | | | (1.52 | ) | | | | | | | (0.40 | ) | | | | | | | (0.37 | ) | | | | | | | (0.35 | ) |
| | | | | | | | | | | | | | | | | | | | | | | | | | | | | | | | | | | | |
Net asset value, end of period | | $ | 8.53 | | | | | | | $ | 7.98 | | | | | | | $ | 9.12 | | | | | | | $ | 10.99 | | | | | | | $ | 10.25 | |
| | | | | | | | | | | | | | | | | | | | | | | | | | | | | | | | | | | | |
Total returnA | | | 12.81 | % | | | | | | | 4.68 | % | | | | | | | (13.76 | )% | | | | | | | 11.00 | % | | | | | | | 3.82 | % |
| | | | | | | | | | | | | | | | | | | | | | | | | | | | | | | | | | | | |
|
Ratios and supplemental data: | |
Net assets, end of period | | $ | 203,770,438 | | | | | | | $ | 81,509,591 | | | | | | | $ | 139,290,122 | | | | | | | $ | 183,749,947 | | | | | | | $ | 89,459,856 | |
Ratios to average net assets: | | | | | | | | | | | | | | | | | | | | | | | | | | | | | | | | | | | | |
Expenses, before reimbursements and/or recoupments | | | 0.99 | % | | | | | | | 1.06 | % | | | | | | | 0.93 | % | | | | | | | 0.96 | % | | | | | | | 1.09 | % |
Expenses, net of reimbursements and/or recoupments | | | 0.80 | % | | | | | | | 0.80 | % | | | | | | | 0.80 | % | | | | | | | 0.81 | % | | | | | | | 0.82 | % |
Net investment income, before expense reimbursements and/or recoupments | | | 5.08 | % | | | | | | | 4.90 | % | | | | | | | 3.48 | % | | | | | | | 3.02 | % | | | | | | | 2.58 | % |
Net investment income, net of reimbursements and/or recoupments | | | 5.27 | % | | | | | | | 5.16 | % | | | | | | | 3.61 | % | | | | | | | 3.17 | % | | | | | | | 2.85 | % |
Portfolio turnover rate | | | 58 | % | | | | | | | 63 | % | | | | | | | 48 | % | | | | | | | 79 | % | | | | | | | 185 | % |
| A | Based on net asset value, which does not reflect the sales charge, redemption fee, or contingent deferred sales charge, if applicable. May include adjustments in accordance with U.S. GAAP and as such, the net asset value for reporting purposes and the returns based upon those net asset values may differ from the net asset value and returns for shareholder transactions. |
See accompanying notes
71
American Beacon TwentyFour Strategic Income FundSM
Financial Highlights
(For a share outstanding throughout the period)
| | | | | | | | | | | | | | | | | | | | | | | | | | | | | | | | | | | | |
| | | Investor Class | |
| | | Year Ended June 30, | |
| | | 2024 | | | | | | 2023 | | | | | | 2022 | | | | | | 2021 | | | | | | 2020 | |
| | | | |
Net asset value, beginning of period | | $ | 7.85 | | | | | | | $ | 9.02 | | | | | | | $ | 10.88 | | | | | | | $ | 10.16 | | | | | | | $ | 10.15 | |
| | | | | | | | | | | | | | | | | | | | | | | | | | | | | | | | | | | | |
Income (loss) from investment operations: | | | | | | | | | | | | | | | | | | | | | | | | | | | | | | | | | | | | |
Net investment income | | | 0.41 | A | | | | | | | 0.40 | | | | | | | | 0.34 | | | | | | | | 0.33 | | | | | | | | 0.44 | |
Net gains (losses) on investments (both realized and unrealized) | | | 0.56 | | | | | | | | (0.06 | ) | | | | | | | (1.82 | ) | | | | | | | 0.74 | | | | | | | | (0.08 | ) |
| | | | | | | | | | | | | | | | | | | | | | | | | | | | | | | | | | | | |
Total income (loss) from investment operations | | | 0.97 | | | | | | | | 0.34 | | | | | | | | (1.48 | ) | | | | | | | 1.07 | | | | | | | | 0.36 | |
| | | | | | | | | | | | | | | | | | | | | | | | | | | | | | | | | | | | |
Less distributions: | | | | | | | | | | | | | | | | | | | | | | | | | | | | | | | | | | | | |
Dividends from net investment income | | | (0.32 | ) | | | | | | | (1.51 | ) | | | | | | | (0.38 | ) | | | | | | | (0.35 | ) | | | | | | | (0.35 | ) |
Tax return of capital | | | (0.10 | ) | | | | | | | – | | | | | | | | – | | | | | | | | – | | | | | | | | – | |
| | | | | | | | | | | | | | | | | | | | | | | | | | | | | | | | | | | | |
Total distributions | | | (0.42 | ) | | | | | | | (1.51 | ) | | | | | | | (0.38 | ) | | | | | | | (0.35 | ) | | | | | | | (0.35 | ) |
| | | | | | | | | | | | | | | | | | | | | | | | | | | | | | | | | | | | |
Net asset value, end of period | | $ | 8.40 | | | | | | | $ | 7.85 | | | | | | | $ | 9.02 | | | | | | | $ | 10.88 | | | | | | | $ | 10.16 | |
| | | | | | | | | | | | | | | | | | | | | | | | | | | | | | | | | | | | |
Total returnB | | | 12.78 | % | | | | | | | 4.23 | % | | | | | | | (14.03 | )% | | | | | | | 10.67 | % | | | | | | | 3.58 | % |
| | | | | | | | | | | | | | | | | | | | | | | | | | | | | | | | | | | | |
|
Ratios and supplemental data: | |
Net assets, end of period | | $ | 1,527,043 | | | | | | | $ | 10,133,625 | | | | | | | $ | 18,192,880 | | | | | | | $ | 23,773,539 | | | | | | | $ | 14,710,345 | |
Ratios to average net assets: | | | | | | | | | | | | | | | | | | | | | | | | | | | | | | | | | | | | |
Expenses, before reimbursements and/or recoupments | | | 1.31 | % | | | | | | | 1.35 | % | | | | | | | 1.22 | % | | | | | | | 1.24 | % | | | | | | | 1.42 | % |
Expenses, net of reimbursements and/or recoupments | | | 1.09 | % | | | | | | | 1.09 | % | | | | | | | 1.09 | % | | | | | | | 1.09 | % | | | | | | | 1.09 | % |
Net investment income, before expense reimbursements and/or recoupments | | | 4.87 | % | | | | | | | 4.59 | % | | | | | | | 3.20 | % | | | | | | | 2.73 | % | | | | | | | 2.23 | % |
Net investment income, net of reimbursements and/or recoupments | | | 5.09 | % | | | | | | | 4.85 | % | | | | | | | 3.33 | % | | | | | | | 2.88 | % | | | | | | | 2.56 | % |
Portfolio turnover rate | | | 58 | % | | | | | | | 63 | % | | | | | | | 48 | % | | | | | | | 79 | % | | | | | | | 185 | % |
| A | Per share amounts have been calculated using the average shares method. |
| B | Based on net asset value, which does not reflect the sales charge, redemption fee, or contingent deferred sales charge, if applicable. May include adjustments in accordance with U.S. GAAP and as such, the net asset value for reporting purposes and the returns based upon those net asset values may differ from the net asset value and returns for shareholder transactions. |
See accompanying notes
72
American Beacon TwentyFour Strategic Income FundSM
Financial Highlights
(For a share outstanding throughout the period)
| | | | | | | | | | | | | | | | | | | | | | | | | | | | | | | | | | | | |
| | | A Class | |
| | | Year Ended June 30, | |
| | | 2024 | | | | | | 2023 | | | | | | 2022 | | | | | | 2021 | | | | | | 2020 | |
| | | | |
Net asset value, beginning of period | | $ | 7.87 | | | | | | | $ | 9.03 | | | | | | | $ | 10.89 | | | | | | | $ | 10.16 | | | | | | | $ | 10.16 | |
| | | | | | | | | | | | | | | | | | | | | | | | | | | | | | | | | | | | |
Income (loss) from investment operations: | | | | | | | | | | | | | | | | | | | | | | | | | | | | | | | | | | | | |
Net investment income | | | 0.79 | | | | | | | | 0.59 | | | | | | | | 0.34 | | | | | | | | 0.35 | | | | | | | | 0.23 | |
Net gains (losses) on investments (both realized and unrealized) | | | 0.17 | | | | | | | | (0.23 | ) | | | | | | | (1.81 | ) | | | | | | | 0.72 | | | | | | | | 0.11 | |
| | | | | | | | | | | | | | | | | | | | | | | | | | | | | | | | | | | | |
Total income (loss) from investment operations | | | 0.96 | | | | | | | | 0.36 | | | | | | | | (1.47 | ) | | | | | | | 1.07 | | | | | | | | 0.34 | |
| | | | | | | | | | | | | | | | | | | | | | | | | | | | | | | | | | | | |
Less distributions: | | | | | | | | | | | | | | | | | | | | | | | | | | | | | | | | | | | | |
Dividends from net investment income | | | (0.33 | ) | | | | | | | (1.52 | ) | | | | | | | (0.39 | ) | | | | | | | (0.34 | ) | | | | | | | (0.34 | ) |
Tax return of capital | | | (0.10 | ) | | | | | | | – | | | | | | | | – | | | | | | | | – | | | | | | | | – | |
| | | | | | | | | | | | | | | | | | | | | | | | | | | | | | | | | | | | |
Total distributions | | | (0.43 | ) | | | | | | | (1.52 | ) | | | | | | | (0.39 | ) | | | | | | | (0.34 | ) | | | | | | | (0.34 | ) |
| | | | | | | | | | | | | | | | | | | | | | | | | | | | | | | | | | | | |
Net asset value, end of period | | $ | 8.40 | | | | | | | $ | 7.87 | | | | | | | $ | 9.03 | | | | | | | $ | 10.89 | | | | | | | $ | 10.16 | |
| | | | | | | | | | | | | | | | | | | | | | | | | | | | | | | | | | | | |
Total returnA | | | 12.63 | % | | | | | | | 4.44 | % | | | | | | | (13.94 | )% | | | | | | | 10.73 | % | | | | | | | 3.44 | % |
| | | | | | | | | | | | | | | | | | | | | | | | | | | | | | | | | | | | |
|
Ratios and supplemental data: | |
Net assets, end of period | | $ | 8,116,991 | | | | | | | $ | 5,107,605 | | | | | | | $ | 5,523,840 | | | | | | | $ | 7,020,746 | | | | | | | $ | 5,216,325 | |
Ratios to average net assets: | | | | | | | | | | | | | | | | | | | | | | | | | | | | | | | | | | | | |
Expenses, before reimbursements and/or recoupments | | | 1.43 | % | | | | | | | 1.31 | % | | | | | | | 1.14 | % | | | | | | | 1.16 | % | | | | | | | 1.34 | % |
Expenses, net of reimbursements and/or recoupments | | | 1.00 | % | | | | | | | 1.00 | % | | | | | | | 1.00 | % | | | | | | | 1.04 | % | | | | | | | 1.12 | % |
Net investment income, before expense reimbursements and/or recoupments | | | 4.67 | % | | | | | | | 4.70 | % | | | | | | | 3.28 | % | | | | | | | 2.81 | % | | | | | | | 2.35 | % |
Net investment income, net of reimbursements and/or recoupments | | | 5.10 | % | | | | | | | 5.01 | % | | | | | | | 3.42 | % | | | | | | | 2.93 | % | | | | | | | 2.57 | % |
Portfolio turnover rate | | | 58 | % | | | | | | | 63 | % | | | | | | | 48 | % | | | | | | | 79 | % | | | | | | | 185 | % |
| A | Based on net asset value, which does not reflect the sales charge, redemption fee, or contingent deferred sales charge, if applicable. May include adjustments in accordance with U.S. GAAP and as such, the net asset value for reporting purposes and the returns based upon those net asset values may differ from the net asset value and returns for shareholder transactions. |
See accompanying notes
73
American Beacon TwentyFour Strategic Income FundSM
Financial Highlights
(For a share outstanding throughout the period)
| | | | | | | | | | | | | | | | | | | | | | | | | | | | | | | | | | | | |
| | | C Class | |
| | | Year Ended June 30, | |
| | | 2024 | | | | | | 2023 | | | | | | 2022 | | | | | | 2021 | | | | | | 2020 | |
| | | | |
Net asset value, beginning of period | | $ | 7.83 | | | | | | | $ | 9.00 | | | | | | | $ | 10.85 | | | | | | | $ | 10.13 | | | | | | | $ | 10.14 | |
| | | | | | | | | | | | | | | | | | | | | | | | | | | | | | | | | | | | |
Income (loss) from investment operations: | | | | | | | | | | | | | | | | | | | | | | | | | | | | | | | | | | | | |
Net investment income | | | 0.38 | | | | | | | | 0.49 | | | | | | | | 0.25 | | | | | | | | 0.27 | | | | | | | | 0.30 | |
Net gains (losses) on investments (both realized and unrealized) | | | 0.52 | | | | | | | | (0.21 | ) | | | | | | | (1.80 | ) | | | | | | | 0.72 | | | | | | | | (0.03 | ) |
| | | | | | | | | | | | | | | | | | | | | | | | | | | | | | | | | | | | |
Total income (loss) from investment operations | | | 0.90 | | | | | | | | 0.28 | | | | | | | | (1.55 | ) | | | | | | | 0.99 | | | | | | | | 0.27 | |
| | | | | | | | | | | | | | | | | | | | | | | | | | | | | | | | | | | | |
Less distributions: | | | | | | | | | | | | | | | | | | | | | | | | | | | | | | | | | | | | |
Dividends from net investment income | | | (0.28 | ) | | | | | | | (1.45 | ) | | | | | | | (0.30 | ) | | | | | | | (0.27 | ) | | | | | | | (0.28 | ) |
Tax return of capital | | | (0.09 | ) | | | | | | | - | | | | | | | | - | | | | | | | | - | | | | | | | | - | |
| | | | | | | | | | | | | | | | | | | | | | | | | | | | | | | | | | | | |
Total distributions | | | (0.37 | ) | | | | | | | (1.45 | ) | | | | | | | (0.30 | ) | | | | | | | (0.27 | ) | | | | | | | (0.28 | ) |
| | | | | | | | | | | | | | | | | | | | | | | | | | | | | | | | | | | | |
Net asset value, end of period | | $ | 8.36 | | | | | | | $ | 7.83 | | | | | | | $ | 9.00 | | | | | | | $ | 10.85 | | | | | | | $ | 10.13 | |
| | | | | | | | | | | | | | | | | | | | | | | | | | | | | | | | | | | | |
Total returnA | | | 11.81 | % | | | | | | | 3.51 | % | | | | | | | (14.61 | )% | | | | | | | 9.87 | % | | | | | | | 2.72 | % |
| | | | | | | | | | | | | | | | | | | | | | | | | | | | | | | | | | | | |
|
Ratios and supplemental data: | |
Net assets, end of period | | $ | 5,620,172 | | | | | | | $ | 5,131,491 | | | | | | | $ | 5,987,755 | | | | | | | $ | 8,803,669 | | | | | | | $ | 4,735,447 | |
Ratios to average net assets: | | | | | | | | | | | | | | | | | | | | | | | | | | | | | | | | | | | | |
Expenses, before reimbursements and/or recoupments | | | 1.97 | % | | | | | | | 2.03 | % | | | | | | | 1.90 | % | | | | | | | 1.95 | % | | | | | | | 2.14 | % |
Expenses, net of reimbursements and/or recoupments | | | 1.79 | % | | | | | | | 1.80 | %B | | | | | | | 1.82 | %C | | | | | | | 1.85 | % | | | | | | | 1.87 | % |
Net investment income, before expense reimbursements and/or recoupments | | | 4.15 | % | | | | | | | 3.98 | % | | | | | | | 2.50 | % | | | | | | | 2.02 | % | | | | | | | 1.57 | % |
Net investment income, net of reimbursements and/or recoupments | | | 4.33 | % | | | | | | | 4.21 | % | | | | | | | 2.58 | % | | | | | | | 2.12 | % | | | | | | | 1.84 | % |
Portfolio turnover rate | | | 58 | % | | | | | | | 63 | % | | | | | | | 48 | % | | | | | | | 79 | % | | | | | | | 185 | % |
| A | Based on net asset value, which does not reflect the sales charge, redemption fee, or contingent deferred sales charge, if applicable. May include adjustments in accordance with U.S. GAAP and as such, the net asset value for reporting purposes and the returns based upon those net asset values may differ from the net asset value and returns for shareholder transactions. |
| B | Expense ratios may exceed stated expense caps in Note 2 due to the change in the contractual expense caps on November 1, 2022. |
| C | Expense ratios may exceed stated expense caps in Note 2 due to the change in the contractual expense caps on November 1, 2021. |
See accompanying notes
74
American Beacon TwentyFour Sustainable Short Term Bond FundSM
Financial Highlights
(For a share outstanding throughout the period)
| | | | | | | | | | | | | | | | | | | | | | | | | | | | | | | | | | | | |
| | | Y Class | |
| | | Year Ended June 30, | | | | | | February 18,
2020A
to
June 30,
2020 | |
| | | 2024 | | | | | | 2023 | | | | | | 2022 | | | | | | 2021 | | | | |
| | | | |
Net asset value, beginning of period | | $ | 8.43 | | | | | | | $ | 9.26 | | | | | | | $ | 10.02 | | | | | | | $ | 9.92 | | | | | | | $ | 10.00 | |
| | | | | | | | | | | | | | | | | | | | | | | | | | | | | | | | | | | | |
Income (loss) from investment operations: | | | | | | | | | | | | | | | | | | | | | | | | | | | | | | | | | | | | |
Net investment income | | | 0.52 | | | | | | | | 0.35 | | | | | | | | 0.32 | | | | | | | | 0.21 | | | | | | | | 0.05 | |
Net gains (losses) on investments (both realized and unrealized) | | | 0.12 | | | | | | | | (0.10 | ) | | | | | | | (0.83 | ) | | | | | | | 0.18 | | | | | | | | (0.06 | ) |
| | | | | | | | | | | | | | | | | | | | | | | | | | | | | | | | | | | | |
Total income (loss) from investment operations | | | 0.64 | | | | | | | | 0.25 | | | | | | | | (0.51 | ) | | | | | | | 0.39 | | | | | | | | (0.01 | ) |
| | | | | | | | | | | | | | | | | | | | | | | | | | | | | | | | | | | | |
Less distributions: | | | | | | | | | | | | | | | | | | | | | | | | | | | | | | | | | | | | |
Dividends from net investment income | | | - | | | | | | | | (1.08 | ) | | | | | | | (0.25 | ) | | | | | | | (0.29 | ) | | | | | | | (0.07 | ) |
Tax return of capital | | | (0.33 | ) | | | | | | | - | | | | | | | | - | | | | | | | | - | | | | | | | | - | |
| | | | | | | | | | | | | | | | | | | | | | | | | | | | | | | | | | | | |
Total distributions | | | (0.33 | ) | | | | | | | (1.08 | ) | | | | | | | (0.25 | ) | | | | | | | (0.29 | ) | | | | | | | (0.07 | ) |
| | | | | | | | | | | | | | | | | | | | | | | | | | | | | | | | | | | | |
Net asset value, end of period | | $ | 8.74 | | | | | | | $ | 8.43 | | | | | | | $ | 9.26 | | | | | | | $ | 10.02 | | | | | | | $ | 9.92 | |
| | | | | | | | | | | | | | | | | | | | | | | | | | | | | | | | | | | | |
Total returnB | | | 7.75 | % | | | | | | | 2.95 | % | | | | | | | (5.20 | )% | | | | | | | 4.00 | % | | | | | | | (0.09 | )%C |
| | | | | | | | | | | | | | | | | | | | | | | | | | | | | | | | | | | | |
|
Ratios and supplemental data: | |
Net assets, end of period | | $ | 9,743,738 | | | | | | | $ | 6,923,318 | | | | | | | $ | 5,328,507 | | | | | | | $ | 354,076 | | | | | | | $ | 149,445 | |
Ratios to average net assets: | | | | | | | | | | | | | | | | | | | | | | | | | | | | | | | | | | | | |
Expenses, before reimbursements and/or recoupments | | | 2.36 | % | | | | | | | 1.83 | % | | | | | | | 2.24 | % | | | | | | | 4.65 | %D | | | | | | | 11.60 | %D E |
Expenses, net of reimbursements and/or recoupmentsF | | | 0.58 | % | | | | | | | 0.57 | % | | | | | | | 0.57 | % | | | | | | | 0.57 | % | | | | | | | 0.57 | %E |
Net investment income (loss), before expense reimbursements and/or recoupments | | | 1.80 | % | | | | | | | 1.31 | % | | | | | | | (0.06 | )% | | | | | | | (2.71 | )%D | | | | | | | (9.96 | )%D E |
Net investment income, net of reimbursements and/or recoupments | | | 3.58 | % | | | | | | | 2.57 | % | | | | | | | 1.61 | % | | | | | | | 1.37 | % | | | | | | | 1.07 | %E |
Portfolio turnover rate | | | 117 | % | | | | | | | 60 | % | | | | | | | 43 | % | | | | | | | 54 | % | | | | | | | 7 | %C |
| A | Commencement of operations. |
| B | Based on net asset value, which does not reflect the sales charge, redemption fee, or contingent deferred sales charge, if applicable. May include adjustments in accordance with U.S. GAAP and as such, the net asset value for reporting purposes and the returns based upon those net asset values may differ from the net asset value and returns for shareholder transactions. |
| D | Includes non-recurring organization and offering costs. |
| F | Expense ratios may exceed stated expense caps in Note 2 due to loan interest expense. |
See accompanying notes
75
American Beacon TwentyFour Sustainable Short Term Bond FundSM
Financial Highlights
(For a share outstanding throughout the period)
| | | | | | | | | | | | | | | | | | | | | | | | | | | | | | | | | | | | |
| | | A Class | |
| | | Year Ended June 30, | | | | | | February 18,
2020A
to
June 30,
2020 | |
| | | 2024 | | | | | | 2023 | | | | | | 2022 | | | | | | 2021 | | | | |
| | | | |
Net asset value, beginning of period | | $ | 8.39 | | | | | | | $ | 9.23 | | | | | | | $ | 9.98 | | | | | | | $ | 9.91 | | | | | | | $ | 10.00 | |
| | | | | | | | | | | | | | | | | | | | | | | | | | | | | | | | | | | | |
Income (loss) from investment operations: | | | | | | | | | | | | | | | | | | | | | | | | | | | | | | | | | | | | |
Net investment income | | | 0.28 | B | | | | | | | 0.50 | | | | | | | | 0.12 | B | | | | | | | 0.11 | | | | | | | | 0.05 | |
Net gains (losses) on investments (both realized and unrealized) | | | 0.32 | | | | | | | | (0.29 | ) | | | | | | | (0.65 | ) | | | | | | | 0.25 | | | | | | | | (0.07 | ) |
| | | | | | | | | | | | | | | | | | | | | | | | | | | | | | | | | | | | |
Total income (loss) from investment operations | | | 0.60 | | | | | | | | 0.21 | | | | | | | | (0.53 | ) | | | | | | | 0.36 | | | | | | | | (0.02 | ) |
| | | | | | | | | | | | | | | | | | | | | | | | | | | | | | | | | | | | |
Less distributions: | | | | | | | | | | | | | | | | | | | | | | | | | | | | | | | | | | | | |
Dividends from net investment income | | | - | | | | | | | | (1.05 | ) | | | | | | | (0.22 | ) | | | | | | | (0.29 | ) | | | | | | | (0.07 | ) |
Tax return of capital | | | (0.33 | ) | | | | | | | - | | | | | | | | - | | | | | | | | - | | | | | | | | - | |
| | | | | | | | | | | | | | | | | | | | | | | | | | | | | | | | | | | | |
Total distributions | | | (0.33 | ) | | | | | | | (1.05 | ) | | | | | | | (0.22 | ) | | | | | | | (0.29 | ) | | | | | | | (0.07 | ) |
| | | | | | | | | | | | | | | | | | | | | | | | | | | | | | | | | | | | |
Net asset value, end of period | | $ | 8.66 | | | | | | | $ | 8.39 | | | | | | | $ | 9.23 | | | | | | | $ | 9.98 | | | | | | | $ | 9.91 | |
| | | | | | | | | | | | | | | | | | | | | | | | | | | | | | | | | | | | |
Total returnC | | | 7.30 | % | | | | | | | 2.48 | % | | | | | | | (5.43 | )% | | | | | | | 3.70 | % | | | | | | | (0.19 | )%D |
| | | | | | | | | | | | | | | | | | | | | | | | | | | | | | | | | | | | |
|
Ratios and supplemental data: | |
Net assets, end of period | | $ | 43,744 | | | | | | | $ | 125,866 | | | | | | | $ | 107,415 | | | | | | | $ | 202,627 | | | | | | | $ | 206,227 | |
Ratios to average net assets: | | | | | | | | | | | | | | | | | | | | | | | | | | | | | | | | | | | | |
Expenses, before reimbursements and/or recoupments | | | 2.72 | % | | | | | | | 2.26 | % | | | | | | | 3.13 | % | | | | | | | 5.33 | %E | | | | | | | 10.25 | %E F |
Expenses, net of reimbursements and/or recoupments | | | 0.87 | % | | | | | | | 0.87 | % | | | | | | | 0.87 | % | | | | | | | 0.87 | % | | | | | | | 0.87 | %F |
Net investment income (loss), before expense reimbursements and/or recoupments | | | 1.45 | % | | | | | | | 0.81 | % | | | | | | | (1.06 | )% | | | | | | | (3.36 | )%E | | | | | | | (8.59 | )%E F |
Net investment income, net of reimbursements and/or recoupments | | | 3.30 | % | | | | | | | 2.20 | % | | | | | | | 1.20 | % | | | | | | | 1.10 | % | | | | | | | 0.79 | %F |
Portfolio turnover rate | | | 117 | % | | | | | | | 60 | % | | | | | | | 43 | % | | | | | | | 54 | % | | | | | | | 7 | %D |
| A | Commencement of operations. |
| B | Per share amounts have been calculated using the average shares method. |
| C | Based on net asset value, which does not reflect the sales charge, redemption fee, or contingent deferred sales charge, if applicable. May include adjustments in accordance with U.S. GAAP and as such, the net asset value for reporting purposes and the returns based upon those net asset values may differ from the net asset value and returns for shareholder transactions. |
| E | Includes non-recurring organization and offering costs. |
See accompanying notes
76
American Beacon TwentyFour Sustainable Short Term Bond FundSM
Financial Highlights
(For a share outstanding throughout the period)
| | | | | | | | | | | | | | | | | | | | | | | | | | | | | | | | | | | | |
| | | C Class | |
| | | Year Ended June 30, | | | | | | February 18,
2020A
to
June 30,
2020 | |
| | | 2024 | | | | | | 2023 | | | | | | 2022 | | | | | | 2021 | | | | |
| | | | |
Net asset value, beginning of period | | $ | 8.16 | | | | | | | $ | 9.07 | | | | | | | $ | 9.87 | | | | | | | $ | 9.87 | | | | | | | $ | 10.00 | |
| | | | | | | | | | | | | | | | | | | | | | | | | | | | | | | | | | | | |
Income (loss) from investment operations: | | | | | | | | | | | | | | | | | | | | | | | | | | | | | | | | | | | | |
Net investment income | | | 0.35 | | | | | | | | 1.53 | | | | | | | | 0.04 | B | | | | | | | 0.03 | B | | | | | | | 0.02 | |
Net gains (losses) on investments (both realized and unrealized) | | | 0.19 | | | | | | | | (1.39 | ) | | | | | | | (0.64 | ) | | | | | | | 0.26 | | | | | | | | (0.08 | ) |
| | | | | | | | | | | | | | | | | | | | | | | | | | | | | | | | | | | | |
Total income (loss) from investment operations | | | 0.54 | | | | | | | | 0.14 | | | | | | | | (0.60 | ) | | | | | | | 0.29 | | | | | | | | (0.06 | ) |
| | | | | | | | | | | | | | | | | | | | | | | | | | | | | | | | | | | | |
Less distributions: | | | | | | | | | | | | | | | | | | | | | | | | | | | | | | | | | | | | |
Dividends from net investment income | | | - | | | | | | | | (1.05 | ) | | | | | | | (0.20 | ) | | | | | | | (0.29 | ) | | | | | | | (0.07 | ) |
Tax return of capital | | | (0.33 | ) | | | | | | | - | | | | | | | | - | | | | | | | | - | | | | | | | | - | |
| | | | | | | | | | | | | | | | | | | | | | | | | | | | | | | | | | | | |
Total distributions | | | (0.33 | ) | | | | | | | (1.05 | ) | | | | | | | (0.20 | ) | | | | | | | (0.29 | ) | | | | | | | (0.07 | ) |
| | | | | | | | | | | | | | | | | | | | | | | | | | | | | | | | | | | | |
Net asset value, end of period | | $ | 8.37 | | | | | | | $ | 8.16 | | | | | | | $ | 9.07 | | | | | | | $ | 9.87 | | | | | | | $ | 9.87 | |
| | | | | | | | | | | | | | | | | | | | | | | | | | | | | | | | | | | | |
Total returnC | | | 6.71 | % | | | | | | | 1.68 | % | | | | | | | (6.15 | )% | | | | | | | 3.00 | % | | | | | | | (0.59 | )%D |
| | | | | | | | | | | | | | | | | | | | | | | | | | | | | | | | | | | | |
|
Ratios and supplemental data: | |
Net assets, end of period | | $ | 791,225 | | | | | | | $ | 519,021 | | | | | | | $ | 95,605 | | | | | | | $ | 139,238 | | | | | | | $ | 254,319 | |
Ratios to average net assets: | | | | | | | | | | | | | | | | | | | | | | | | | | | | | | | | | | | | |
Expenses, before reimbursements and/or recoupments | | | 3.29 | % | | | | | | | 2.74 | % | | | | | | | 3.78 | % | | | | | | | 6.04 | %E | | | | | | | 10.34 | %E F |
Expenses, net of reimbursements and/or recoupments | | | 1.52 | %G | | | | | | | 1.62 | % | | | | | | | 1.62 | % | | | | | | | 1.62 | % | | | | | | | 1.62 | %F |
Net investment income (loss), before expense reimbursements and/or recoupments | | | 0.89 | % | | | | | | | 0.58 | % | | | | | | | (1.71 | )% | | | | | | | (4.08 | )%E | | | | | | | (8.62 | )%E F |
Net investment income, net of reimbursements and/or recoupments | | | 2.66 | % | | | | | | | 1.70 | % | | | | | | | 0.45 | % | | | | | | | 0.34 | % | | | | | | | 0.10 | %F |
Portfolio turnover rate | | | 117 | % | | | | | | | 60 | % | | | | | | | 43 | % | | | | | | | 54 | % | | | | | | | 7 | %D |
| A | Commencement of operations. |
| B | Per share amounts have been calculated using the average shares method. |
| C | Based on net asset value, which does not reflect the sales charge, redemption fee, or contingent deferred sales charge, if applicable. May include adjustments in accordance with U.S. GAAP and as such, the net asset value for reporting purposes and the returns based upon those net asset values may differ from the net asset value and returns for shareholder transactions. |
| E | Includes non-recurring organization and offering costs. |
| G | Expense ratios may exceed stated expense caps in Note 2 due to the change in the contractual expense caps on November 1, 2023. |
See accompanying notes
77
American Beacon TwentyFour Sustainable Short Term Bond FundSM
Financial Highlights
(For a share outstanding throughout the period)
| | | | | | | | | | | | | | | | | | | | | | | | | | | | | | | | | | | | |
| | | R6 Class | |
| | | Year Ended June 30, | | | | | | February 18,
2020A
to
June 30,
2020 | |
| | | 2024 | | | | | | 2023 | | | | | | 2022 | | | | | | 2021 | | | | |
| | | | |
Net asset value, beginning of period | | $ | 8.51 | | | | | | | $ | 9.32 | | | | | | | $ | 10.04 | | | | | | | $ | 9.92 | | | | | | | $ | 10.00 | |
| | | | | | | | | | | | | | | | | | | | | | | | | | | | | | | | | | | | |
Income (loss) from investment operations: | | | | | | | | | | | | | | | | | | | | | | | | | | | | | | | | | | | | |
Net investment income | | | 0.32 | B | | | | | | | 0.23 | | | | | | | | 0.16 | | | | | | | | 0.15 | | | | | | | | 0.04 | |
Net gains (losses) on investments (both realized and unrealized) | | | 0.07 | | | | | | | | 0.02 | | | | | | | | (0.66 | ) | | | | | | | 0.26 | | | | | | | | (0.05 | ) |
| | | | | | | | | | | | | | | | | | | | | | | | | | | | | | | | | | | | |
Total income (loss) from investment operations | | | 0.39 | | | | | | | | 0.25 | | | | | | | | (0.50 | ) | | | | | | | 0.41 | | | | | | | | (0.01 | ) |
| | | | | | | | | | | | | | | | | | | | | | | | | | | | | | | | | | | | |
Less distributions: | | | | | | | | | | | | | | | | | | | | | | | | | | | | | | | | | | | | |
Dividends from net investment income | | | - | | | | | | | | (1.06 | ) | | | | | | | (0.22 | ) | | | | | | | (0.29 | ) | | | | | | | (0.07 | ) |
Tax return of capital | | | (0.33 | ) | | | | | | | - | | | | | | | | - | | | | | | | | - | | | | | | | | - | |
| | | | | | | | | | | | | | | | | | | | | | | | | | | | | | | | | | | | |
Total distributions | | | (0.33 | ) | | | | | | | (1.06 | ) | | | | | | | (0.22 | ) | | | | | | | (0.29 | ) | | | | | | | (0.07 | ) |
| | | | | | | | | | | | | | | | | | | | | | | | | | | | | | | | | | | | |
Net asset value, end of period | | $ | 8.57 | | | | | | | $ | 8.51 | | | | | | | $ | 9.32 | | | | | | | $ | 10.04 | | | | | | | $ | 9.92 | |
| | | | | | | | | | | | | | | | | | | | | | | | | | | | | | | | | | | | |
Total returnC | | | 4.69 | % | | | | | | | 2.89 | % | | | | | | | (5.06 | )% | | | | | | | 4.21 | % | | | | | | | (0.09 | )%D |
| | | | | | | | | | | | | | | | | | | | | | | | | | | | | | | | | | | | |
|
Ratios and supplemental data: | |
Net assets, end of period | | $ | 30,301 | | | | | | | $ | 8,267,504 | | | | | | | $ | 9,050,291 | | | | | | | $ | 9,753,318 | | | | | | | $ | 9,638,229 | |
Ratios to average net assets: | | | | | | | | | | | | | | | | | | | | | | | | | | | | | | | | | | | | |
Expenses, before reimbursements and/or recoupments | | | 2.21 | % | | | | | | | 1.73 | % | | | | | | | 2.38 | % | | | | | | | 4.44 | %E | | | | | | | 6.83 | %E F |
Expenses, net of reimbursements and/or recoupments | | | 0.47 | % | | | | | | | 0.47 | % | | | | | | | 0.47 | % | | | | | | | 0.47 | % | | | | | | | 0.47 | %F |
Net investment income (loss), before expense reimbursements and/or recoupments | | | 1.93 | % | | | | | | | 1.36 | % | | | | | | | (0.30 | )% | | | | | | | (2.47 | )%E | | | | | | | (5.20 | )%E F |
Net investment income, net of reimbursements and/or recoupments | | | 3.67 | % | | | | | | | 2.62 | % | | | | | | | 1.61 | % | | | | | | | 1.50 | % | | | | | | | 1.16 | %F |
Portfolio turnover rate | | | 117 | % | | | | | | | 60 | % | | | | | | | 43 | % | | | | | | | 54 | % | | | | | | | 7 | %D |
| A | Commencement of operations. |
| B | Per share amounts have been calculated using the average shares method. |
| C | Based on net asset value, which does not reflect the sales charge, redemption fee, or contingent deferred sales charge, if applicable. May include adjustments in accordance with U.S. GAAP and as such, the net asset value for reporting purposes and the returns based upon those net asset values may differ from the net asset value and returns for shareholder transactions. |
| E | Includes non-recurring organization and offering costs. |
See accompanying notes
78
American Beacon FundSM
Federal Tax Information
June 30, 2024 (Unaudited)
Certain tax information regarding the Funds are required to be provided to shareholders based upon the Fund’s income and distributions for the taxable year ended June 30, 2024. The information and distributions reported herein may differ from information and distributions taxable to the shareholders for the calendar year ended December 31, 2024.
The Fund designated the following items with regard to distributions paid during the fiscal year ended June 30, 2024. All designations are based on financial information available as of this annual report and, accordingly, are subject to change. For each item, it is the intention of the Funds to designate the maximum amount permitted under the Internal Revenue Code of 1986, as amended, and the regulations there under.
Corporate Dividends-Received Deduction:
| | | | |
SSI Alternative Income Fund | | | 5.48 | % |
TwentyFour Strategic Income Fund | | | N/A | |
TwentyFour Sustainable Short Term Bond Fund | | | N/A | |
Qualified Dividend Income:
| | | | |
SSI Alternative Income Fund | | | 5.48 | % |
TwentyFour Strategic Income Fund | | | N/A | |
TwentyFour Sustainable Short Term Bond Fund | | | N/A | |
Long-Term Capital Gain Distributions:
| | | | |
SSI Alternative Income Fund | | $ | 0 | |
TwentyFour Strategic Income Fund | | | 0 | |
TwentyFour Sustainable Short Term Bond Fund | | | 0 | |
Short-Term Capital Gain Distributions:
| | | | |
SSI Alternative Income Fund | | $ | 0 | |
TwentyFour Strategic Income Fund | | | 0 | |
TwentyFour Sustainable Short Term Bond Fund | | | 0 | |
Return of Capital Distributions:
| | | | |
SSI Alternative Income Fund | | $ | 0 | |
TwentyFour Strategic Income Fund | | | 2,386,702 | |
TwentyFour Sustainable Short Term Bond Fund | | | 482,472 | |
Shareholders will receive notification in January 2025 of the applicable tax information necessary to prepare their 2024 income tax returns.
79

Delivery of Documents
If you invest in the Fund through a financial institution, you may be able to receive the Fund’s regulatory mailings, such as the Prospectus, Annual Report, Semi-Annual Report and Financial Statement Reports, by e-mail. If you are interested in this option, please go to www.icsdelivery.com and search for your financial institution’s name or contact your financial institution directly.
You may request a paper copy of this document at no charge by contacting your financial institution. This document is also available for download at www.americanbeaconfunds.com or you can request an electronic copy by contacting your financial institution.
To obtain more information about the Fund:
| | |
 | |  |
| | |
| By E-mail: | | On the Internet: |
| american_beacon.funds@ambeacon.com | | Visit our website at www.americanbeaconfunds.com |
| | | |
| | | |
| | |

By Telephone: Call (800) 658-5811 | | 
By Mail: American Beacon Funds P.O. Box 219643 Kansas City, MO 64121-9643 |
|
|
|
| | | |
Fund Service Providers:
| | | | | | | | | | | | |
CUSTODIAN State Street Bank and Trust Company Boston, Massachusetts | | | | TRANSFER AGENT SS&C GIDS, Inc. Quincy, Massachusetts | | | | INDEPENDENT REGISTERED PUBLIC ACCOUNTING FIRM PricewaterhouseCoopers LLP Boston, Massachusetts | | | | DISTRIBUTOR Resolute Investment Distributors, Inc. Irving, Texas |
This report is prepared for shareholders of the American Beacon Funds and may be distributed to others only if preceded or accompanied by a current Prospectus or Summary Prospectus.
American Beacon Funds, American Beacon SSI Alternative Income Fund, American Beacon TwentyFour Strategic Income Fund and American Beacon TwentyFour Sustainable Short Term Bond Fund are service marks of American Beacon Advisors, Inc.
AR 06/24
Item 8. Changes in and Disagreements with Accountants for Open-End Management Investment Companies
Not applicable.
Item 9. Proxy Disclosures for Open-End Management Investment Companies
Not applicable.
Item 10. Renumeration Paid to Directors, Officers, and Others of Open-End Management Investment Companies
The remuneration paid to directors, officers and others is included as part of the report to stockholders filed under Item 7 of this Form.
Item 11. Statement Regarding Basis for Approval of Investment Advisory Contract
Not applicable.
Item 12. Disclosure of Proxy Voting Policies and Procedures for Closed-End Management Investment Companies
Not applicable.
Item 13. Portfolio Managers of Closed-End Management Investment Companies
Not applicable.
Item 14. Purchase of Equity Securities by Closed-End Management Investment Company and Affiliated Purchasers
Not applicable.
Item 15. Submission of Matters to a Vote of Security Holders
The registrant has made no material changes to the procedures by which shareholders may recommend nominees to the Trust’s Board of Trustees.
Item 16. Controls and Procedures
(a) The registrant’s principal executive officer and principal financial officer have reviewed the registrant’s disclosure controls and procedures (as defined in Rule 30a-3(c) under the Investment Company Act of 1940, as amended) as of a date within 90 days of the filing of this report as required by Rule 30a-3(b) under the Act and Rules 13a-15(b) or 15d-15(b) under the Securities Exchange Act of 1934. Based upon their review, such officers have concluded that the registrant’s disclosure controls and procedures are effective in ensuring that information required to be disclosed in the report is appropriately recorded, processed, summarized and reported and made know to them by others within the registrant and by the registrant’s service provider.
(b) The registrant’s principal executive officer and principal financial officer are aware of no changes in the registrant’s internal control over financial reporting (as defined in Rule 30a-3(d) under the Act) that occurred during the period covered by this report that has materially affected, or is reasonably likely to materially affect, the registrant’s internal control over financial reporting.
Item 17. Disclosure of Securities Lending Activities for Closed-End Management Investment Companies
Not Applicable.
Item 18. Recovery of Erroneously Awarded Compensation
Not Applicable.
Item 19. Exhibits
(a)(1) Filed herewith as EX-99.CODE ETH.
(a)(2) A separate certification for each principal executive officer and principal financial officer of the registrant as required by Rule 30a-2(a) under the Investment Company Act of 1940 (17 CFR 270.30a-2(a)) is attached hereto as EX-99.CERT.
(a)(3) Not applicable.
(a)(4) Not applicable.
(b) The certifications of each principal executive officer and principal financial officer pursuant to Rule 30a-2(b) under the Investment Company Act of 1940, as amended, (17 CFR 270.30a-2(b), Rule 13a-14(b) or Rule 15d-14(b)) are attached hereto as EX-99.906CERT.
SIGNATURES
Pursuant to the requirements of the Securities Exchange Act of 1934 and the Investment Company Act of 1940, the registrant has duly caused this report to be signed on its behalf by the undersigned, thereunto duly authorized.
(Registrant): American Beacon Funds
| | |
| By | | /s/ Gregory Stumm |
|
| Gregory Stumm |
| President |
| American Beacon Funds |
| Date: September 9, 2024 |
Pursuant to the requirements of the Securities Exchange Act of 1934 and the Investment Company Act of 1940, this report has been signed below by the following persons on behalf of the registrant and in the capacities and on the dates indicated.
| | |
| By | | /s/ Gregory Stumm |
|
| Gregory Stumm |
| President |
| American Beacon Funds |
| Date: September 9, 2024 |
| | |
| By | | /s/ Sonia L. Bates |
|
| Sonia L. Bates |
| Chief Accounting Officer and Treasurer |
| American Beacon Funds |
| Date: September 9, 2024 |