Annual Report
Economic and Market Overview
The U.S. economy expanded modestly despite geopolitical and inflationary pressures during the 12-month period ended October 31, 2011. Although the manufacturing sector powered the U.S. economy out of the recession, its growth rate slowed in the second half of the period as high commodity prices reduced purchasing power. European and Asian manufacturing activity also weakened during the year. Third quarter U.S. gross domestic product growth registered an estimated annualized 2.0% rate, following 0.4% and 1.3% annualized rates in the first two quarters of 2011.1
The U.S. financial system continued to heal, but the country still faced persistent unemployment, housing market weakness and massive debt. The U.S. Federal Reserve Board (Fed) cut its growth forecast for the world’s largest economy as manufacturing growth slowed globally. Some observers attributed the slow growth to the effects of Japan’s earthquake and its aftermath, high commodity prices and a fading inventory restocking cycle. Monetary policy tightening in most parts of the world also inhibited growth and cooled the commodities rally. Inflation rose across much of the world but stayed relatively contained in the U.S. The Fed sought to boost economic growth by maintaining its accommodative monetary policy and undertook a second round of quantitative easing that ended on June 30, 2011. Subsequently, the Fed continued to purchase Treasuries with proceeds from maturing debt in an effort to support economic growth.
Corporate profit strength and favorable economic prospects in some regions of the world supported equities. U.S. stock markets generally did well for much of the 12-month period, but positive momentum waned as investors weathered oil supply disruptions due to revolutions and civil unrest in the Middle East and North Africa as well as the multiple crises triggered by Japan’s earthquake and tsunami. Also weighing on investor sentiment were sovereign debt worries and credit downgrades in Europe, the political stalemate in raising the U.S. debt ceiling and Standard & Poor’s downgrade of the long-term U.S. credit rating to AA+ from AAA. Despite significant volatility, U.S. stocks posted gains for the 12-month reporting period as measured by the Standard & Poor’s® 500 Index.2
1. Source: Bureau of Economic Analysis.
2. STANDARD & POOR’S®, S&P® and S&P 500® are registered trademarks of Standard & Poor’s Financial Services LLC.
Standard & Poor’s does not sponsor, endorse, sell or promote any S&P index-based product.
Annual Report | 3
Near period-end, the Fed announced plans designed to boost the economy by driving down long-term interest rates. The Fed intends to sell $400 billion in short-term securities over the next year and purchase an equal amount of long-term securities. The Fed also anticipated it would keep short-term rates near zero through mid-2013. In this environment, investors sought the perceived safety of U.S. Treasuries, which drove their prices higher and yields lower for the fiscal year under review.
The foregoing information reflects our analysis and opinions as of October 31, 2011. The information is not a complete analysis of every aspect of any market, country, industry, security or fund. Statements of fact are from sources considered reliable.
4 | Annual Report
Franklin Balanced Fund
Your Fund’s Goal and Main Investments: Franklin Balanced Fund seeks income and capital appreciation by investing in a combination of stocks, convertible securities and fixed income securities. The Fund will normally invest at least 25% of its total assets in equity securities (primarily common and preferred stock) and at least 25% of its total assets in debt securities, including bonds, notes, debentures and money market securities.
Annual Report | 5
sell securities for a number of possible reasons, including the achievement of certain stock prices or credit spreads, changes in the fundamental outlook or risk/reward profile of a security, less attractive values relative to market peers, or broad economic conditions affecting certain fixed income sectors.
Manager’s Discussion
The first half of the fiscal year under review was fairly benign as equity and corporate bond markets performed well. In the second half, however, market volatility increased materially, driven by concerns regarding the pace of future economic growth given developments such as fiscal austerity measures in developed economies, monetary tightening in emerging markets and the impact of the Japanese earthquake and tsunami; worsening conditions in Europe; and political gridlock in the U.S. that culminated in Standard & Poor’s downgrade of the long-term U.S. credit rating.
Over the course of the Fund’s fiscal year, equity markets delivered modest gains driven largely by the continued strong backdrop for corporate earnings, while broader fixed income markets were buoyed by a decline in long-term interest rates and fairly stable credit spreads for investment-grade corporate
6 | Annual Report
bonds. Their spreads widened from 168 basis points (bps; 100 basis points equal one percentage point) to 202 bps over Treasuries.
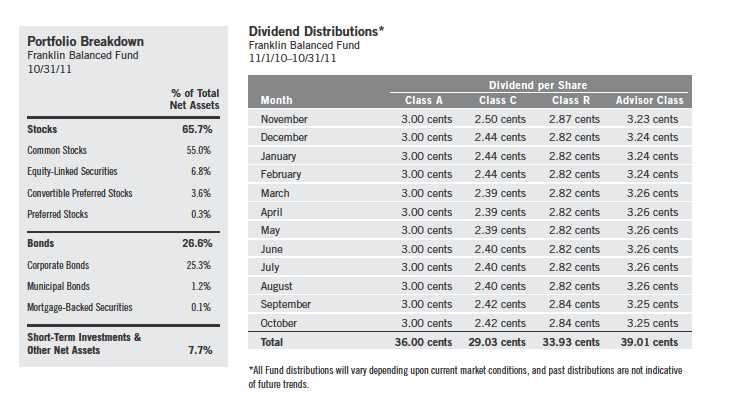
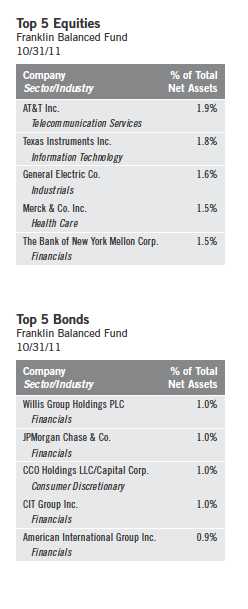
During the 12-month period, the Fund’s equity securities rose from 56.5% to 65.7% of total net assets, while fixed income securities declined from 29.5% to 26.6%, and short-term investments and other net assets (cash) was reduced from 14.0% to 7.7%. We believe over the long term, high dividend yielding common stocks, particularly of companies with what we consider strong operations, solid balance sheets and good potential for future dividend growth, can help us meet our long-term investment objectives of income and capital appreciation.
During the fiscal year, we meaningfully increased our weightings in several equity sectors including industrials, financials, materials and consumer staples while modestly reducing our holdings in energy, health care and utilities. The sharp pullback in equity markets as a whole, combined with rising correlations among stocks provided us with what we considered a favorable long-term opportunity to buy holdings in select companies possessing fundamentals the market failed to differentiate.
Energy, materials and consumer discretionary were top-performing equity sectors. The energy sector’s positive relative results were largely fueled by emerging market demand for oil, and led energy producers Exxon Mobil2 and ConocoPhillips and oil service industry companies Halliburton2 and Baker Hughes2 to contribute to Fund performance. Individual holdings providing support to equity performance included chemicals manufacturer Huntsman2 in the materials sector and fashion brand company Limited Brands2 in the consumer discretionary sector. In contrast, the financials equity sector was a key detractor from Fund performance. Heightened volatility roiled global financial markets during the period, and led Charles Schwab,2 Ally Financial,2 CIT Group and MetLife to hamper results. First Solar in the industrials sector weighed on Fund performance largely due to challenging political conditions in the company’s European market that caused the prices of solar panels to drop.2 Although the information technology equity sector contributed to results, our holding in document management services company Xerox lost value.2
On the fixed income side of the portfolio, we reduced our overall weighting but favored corporate bonds and held underweightings in most other fixed income sectors including Treasuries, agencies and mortgages. We remained focused on what we considered opportunities within corporate bonds, where we believe credit spreads may help drive excess return.
2. Sold by period-end.
Annual Report | 7
The majority of the Fund’s fixed income sectors contributed to performance. Our government-related sector holdings buoyed results, with key contributors from some municipal bonds we purchased during a period of investor fear over possible, large-scale municipal defaults. Our holdings rose in value after investors regained confidence and the municipal bond market strengthened. Corporate bonds generally performed well in an environment of generally stable credit spreads and declining long-term interest rates. In contrast, the Fund’s allocation to the brokerage industry detracted from performance, largely due to our position in MF Global Holdings, which used to be a major global financial derivatives broker. The company filed for bankruptcy protection on October 31, 2011, with the brokerage unit to be liquidated due to liquidity problems arising from investments in European sovereign bonds. The company is considered to be the first major American victim of the European sovereign debt crisis.
Thank you for your continued participation in Franklin Balanced Fund. We look forward to serving your future investment needs.

Shawn Lyons, CFA Blair Schmicker, CFA Brent Loder Alan E. Muschott, CFA
Portfolio Management Team Franklin Balanced Fund
CFA® is a trademark owned by CFA Institute.
The foregoing information reflects our analysis, opinions and portfolio holdings as of October 31, 2011, the end of the reporting period. The way we implement our main investment strategies and the resulting portfolio holdings may change depending on factors such as market and economic conditions. These opinions may not be relied upon as investment advice or an offer for a particular security. The information is not a complete analysis of every aspect of any market, country, industry, security or the Fund. Statements of fact are from sources considered reliable, but the investment manager makes no representation or warranty as to their completeness or accuracy. Although historical performance is no guarantee of future results, these insights may help you understand our investment management philosophy.
8 | Annual Report
Performance Summary as of 10/31/11
Franklin Balanced Fund
Your dividend income will vary depending on dividends or interest paid by securities in the Fund’s portfolio, adjusted for operating expenses of each class. Capital gain distributions are net profits realized from the sale of portfolio securities. The performance table and graphs do not reflect any taxes that a shareholder would pay on Fund dividends, capital gain distributions, if any, or any realized gains on the sale of Fund shares. Total return reflects reinvestment of the Fund’s dividends and capital gain distributions, if any, and any unrealized gains or losses.
Annual Report | 9
10 | Annual Report
Performance Summary (continued)
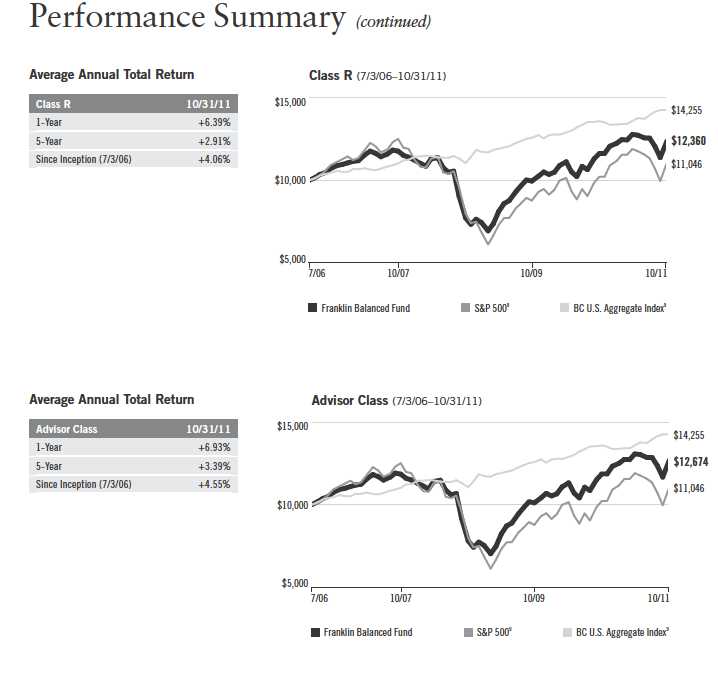
Total Return Index Comparison for a Hypothetical $10,000 Investment1
Total return represents the change in value of an investment over the periods shown. It includes any applicable maximum sales charge, Fund expenses, account fees and reinvested distributions. The unmanaged indexes include reinvestment of any income or distributions. They differ from the Fund in composition and do not pay management fees or expenses. One cannot invest directly in an index.
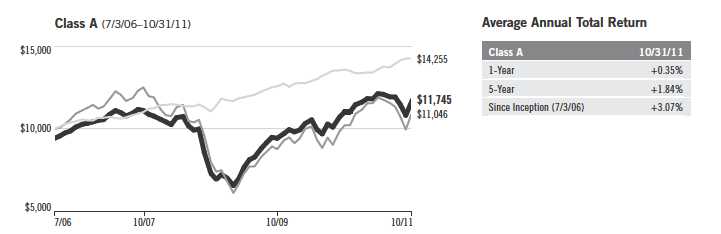
| Franklin Balanced Fund | S&P 5009 | BC U.S. Aggregate Index9 |

| Franklin Balanced Fund | S&P 5009 | BC U.S. Aggregate Index9 |
Annual Report | 11
12 | Annual Report
| Performance Summary (continued) | ||||
| Endnotes | ||||
| The Fund’s share price and yield will be affected by interest rate movements. Bond prices generally move in the opposite direction of interest | ||||
| rates. As prices of bonds in the Fund adjust to a rise in interest rates, the Fund’s share price may decline. While stocks have historically out- | ||||
| performed other asset classes over the long term, they tend to fluctuate more dramatically over the short term as a result of factors affecting | ||||
| individual companies, industries or the securities market as a whole. The Fund is actively managed but there is no guarantee that the man- | ||||
| ager’s investment decisions will produce the desired results. The Fund’s prospectus also includes a description of the main investment risks. | ||||
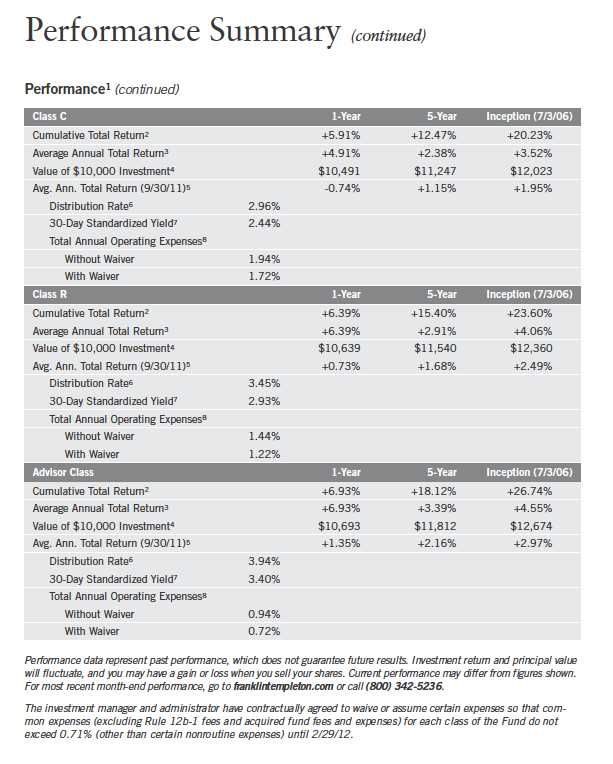
| Class C: | These shares have higher annual fees and expenses than Class A shares. | |||
| Class R: | Shares are available to certain eligible investors as described in the prospectus. These shares have higher annual fees and | |||
| expenses than Class A shares. | ||||
| Advisor Class: | Shares are available to certain eligible investors as described in the prospectus. | |||
| 1. If the manager and administrator had not waived fees, the Fund’s distribution rates and total returns would have been lower, and yields for the | ||||
| period would have been 2.76%, 2.25%, 2.73% and 3.21% for Classes A, C, R and Advisor, respectively. | ||||
| 2. Cumulative total return represents the change in value of an investment over the periods indicated. | ||||
| 3. Average annual total return represents the average annual change in value of an investment over the periods indicated. | ||||
| 4. These figures represent the value of a hypothetical $10,000 investment in the Fund over the periods indicated. | ||||
| 5. In accordance with SEC rules, we provide standardized average annual total return information through the latest calendar quarter. | ||||
| 6. Distribution rate is based on an annualization of the respective class’s October dividend and the maximum offering price (NAV for Classes C, R | ||||
| and Advisor) per share on 10/31/11. | ||||
| 7. The 30-day standardized yield for the 30 days ended 10/31/11 reflects an estimated yield to maturity (assuming all portfolio securities are held to | ||||
| maturity). It should be regarded as an estimate of the Fund’s rate of investment income, and it may not equal the Fund’s actual income distribution | ||||
| rate (which reflects the Fund’s past dividends paid to shareholders) or the income reported in the Fund’s financial statements. | ||||
| 8. Figures are as stated in the Fund’s prospectus current as of the date of this report. In periods of market volatility, assets may decline significantly, | ||||
| causing total annual Fund operating expenses to become higher than the figures shown. | ||||
| 9. Source: © 2011 Morningstar. The S&P 500 is a market capitalization-weighted index of 500 stocks designed to measure total U. S. equity market | ||||
| performance. The BC U.S. Aggregate Index is a market capitalization-weighted index representing the U.S. investment-grade, fixed-rate, taxable | ||||
| bond market with index components for government and corporate, mortgage pass-through and asset-backed securities. All issues included are | ||||
| SEC registered, taxable, dollar denominated and nonconvertible, must have at least one year to final maturity and must be rated investment grade | ||||
| (Baa3/BBB-/BBB- or higher) using the middle rating of Moody’s, Standard & Poor’s and Fitch, respectively. | ||||
| Annual Report | | | 13 | ||
Your Fund’s Expenses
Franklin Balanced Fund
As a Fund shareholder, you can incur two types of costs:
- Transaction costs, including sales charges (loads) on Fund purchases; and
- Ongoing Fund costs, including management fees, distribution and service (12b-1) fees, and other Fund expenses. All mutual funds have ongoing costs, sometimes referred to as operating expenses.
The following table shows ongoing costs of investing in the Fund and can help you understand these costs and compare them with those of other mutual funds. The table assumes a $1,000 investment held for the six months indicated.
Actual Fund Expenses
The first line (Actual) for each share class listed in the table provides actual account values and expenses. The “Ending Account Value” is derived from the Fund’s actual return, which includes the effect of Fund expenses.
You can estimate the expenses you paid during the period by following these steps. Of course, your account value and expenses will differ from those in this illustration:
| 1. | Divide your account value by $1,000. |
| If an account had an $8,600 value, then $8,600 ÷ $1,000 = 8.6. | |
| 2. | Multiply the result by the number under the heading “Expenses Paid During Period.” |
| If Expenses Paid During Period were $7.50, then 8.6 x $7.50 = $64.50. |
In this illustration, the estimated expenses paid this period are $64.50.
Hypothetical Example for Comparison with Other Funds
Information in the second line (Hypothetical) for each class in the table can help you compare ongoing costs of investing in the Fund with those of other mutual funds. This information may not be used to estimate the actual ending account balance or expenses you paid during the period. The hypothetical “Ending Account Value” is based on the actual expense ratio for each class and an assumed 5% annual rate of return before expenses, which does not represent the Fund’s actual return. The figure under the heading “Expenses Paid During Period” shows the hypothetical expenses your account would have incurred under this scenario. You can compare this figure with the 5% hypothetical examples that appear in shareholder reports of other funds.
14 | Annual Report
Your Fund’s Expenses (continued)
Please note that expenses shown in the table are meant to highlight ongoing costs and do not reflect any transaction costs, such as sales charges. Therefore, the second line for each class is useful in comparing ongoing costs only, and will not help you compare total costs of owning different funds. In addition, if transaction costs were included, your total costs would have been higher. Please refer to the Fund prospectus for additional information on operating expenses.

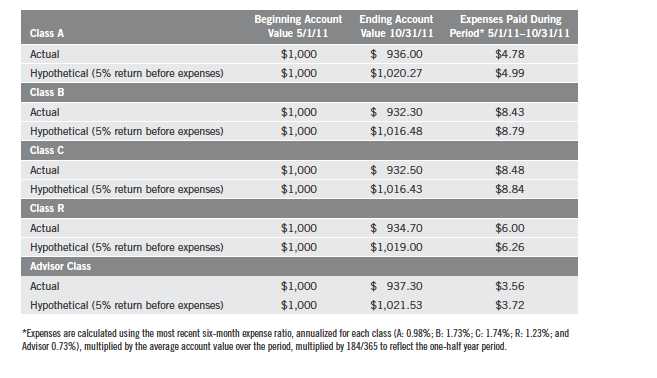
*Expenses are calculated using the most recent six-month expense ratio, net of expense waivers, annualized for each class (A: 1.01%; C: 1.71%; R: 1.21%; and Advisor: 0.71%), multiplied by the average account value over the period, multiplied by 184/365 to reflect the one-half year period.
Annual Report | 15
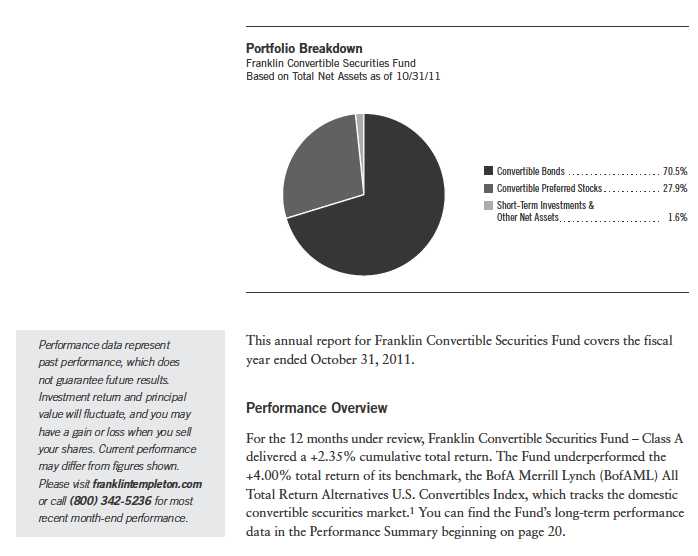
Franklin Convertible Securities Fund
Your Fund’s Goal and Main Investments: Franklin Convertible Securities Fund seeks to maximize total return consistent with reasonable risk by seeking to optimize capital appreciation and high current income under varying market conditions and investing at least 80% of its net assets in convertible securities.
1. Source: © 2011 Morningstar. All Rights Reserved. The information contained herein: (1) is proprietary to Morningstar and/or its content providers; (2) may not be copied or distributed; and (3) is not warranted to be accurate, complete or timely. Neither Morningstar nor its content providers are responsible for any damages or losses arising from any use of this information. The index is unmanaged and includes reinvestment of any income or distributions. One cannot invest directly in an index, and an index is not representative of the Fund’s portfolio.
The dollar value, number of shares or principal amount, and names of all portfolio holdings are listed in the Fund’s Statement of Investments (SOI). The SOI begins on page 68.
16 | Annual Report
Investment Strategy
We follow a strategy of maintaining a balance in the portfolio between the equity and debt characteristics of convertible securities with an emphasis on the equity features. Convertible securities are attractive for two reasons: the opportunity to participate in common stocks’ potential growth with relatively reduced volatility, and the potential for current income with potential downside protection from bonds. Typically we sell securities whose equity sensitivity becomes too high and no longer offers appropriate downside protection. Likewise, as securities become too bond-like — reducing their ability to appreciate with increases in the underlying common stock — we attempt to redeploy those assets into more balanced convertible securities and maintain the potential for the Fund’s upside participation. Our experienced team of analysts searches for investment opportunities among all economic sectors and considers a company’s long-term earnings, asset value and cash flow potential, to create a broadly diversified portfolio.
Manager’s Discussion
For the fiscal year under review, the Fund’s top performing sectors included information technology (IT), utilities and consumer discretionary, all of which produced positive results. The Fund’s investments in health care and energy companies also increased in value during the fiscal year.
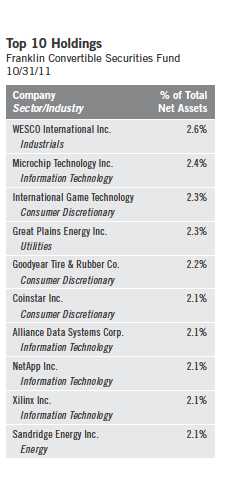
Within IT, the Fund’s holdings of semiconductor and IT services-related stocks enjoyed some of the largest gains as many technology companies continued to post stronger-than-expected corporate earnings results through the calendar quarter ended September 30, 2011. As computer hardware and software sales improved at the business and consumer levels, the Fund benefited from its positions in manufacturers of memory chips and semiconductors, particularly Microchip Technology and Xilinx. Our IT services holdings also performed well, where Alliance Data Systems was a standout; the company provides private-label credit card financing and processing, as well as database and direct marketing services, to some 900 businesses. Within the computers and peripherals industry, the Fund’s holding in EMC performed well. EMC provides IT infrastructure products and services designed to help businesses store, manage, protect and analyze their often massive quantities of data in a more flexible and cost-efficient way. EMC has recently been helping many companies around the world transition to the cloud computing platform.
Annual Report | 17
One of the Fund’s top health care performers was American Medical Systems Holdings (AMS; sold by period-end). AMS is a leading manufacturer of uro-logical devices, including products to help with erectile dysfunction, as well as urinary incontinence devices for men and women. AMS’s business benefited from its acquisition by Endo Pharmaceuticals, which was completed in June. The Fund’s standouts among consumer discretionary holdings included automotive component maker BorgWarner and shoe retailer DSW (sold by period-end).
The Fund’s underperformance relative to the benchmark index stemmed mainly from our positions in the economically sensitive financials, materials and industrials sectors. During a very difficult year for the financial services sector in general, one of the Fund’s biggest detractors was MF Global Holdings, which used to be a major global financial derivatives broker. The company filed for bankruptcy protection on October 31, 2011, with the brokerage unit to be liquidated due to liquidity problems arising from investments in European sovereign bonds. The company is considered to be the first major American victim of the European sovereign debt crisis.
In the materials sector, the Fund’s holdings of Mexican building materials company Cemex, one of the world’s leading cement makers, declined in part due to investor speculation that a slowing global economy would impede construction growth, thereby reducing demand for the company’s products. Our position in Luxembourg-based steelmaker ArcelorMittal also suffered generally from the economic outlook, and more specifically from clear signals that demand growth for steel — particularly in China and Europe — was losing momentum.
Within the industrials sector, investors appeared to price in their concerns about a global economic slowdown. The Fund’s position in commercial equipment manufacturer Ingersoll-Rand suffered from this trend, as did our holdings of AMR, the parent company of American Airlines, which filed for bankruptcy protection shortly after period-end.
18 | Annual Report
Thank you for your continued participation in Franklin Convertible Securities Fund. We look forward to serving your future investment needs.
The foregoing information reflects our analysis, opinions and portfolio holdings as of October 31, 2011, the end of the reporting period. The way we implement our main investment strategies and the resulting portfolio holdings may change depending on factors such as market and economic conditions. These opinions may not be relied upon as investment advice or an offer for a particular security. The information is not a complete analysis of every aspect of any market, country, industry, security or the Fund. Statements of fact are from sources considered reliable, but the investment manager makes no representation or warranty as to their completeness or accuracy. Although historical performance is no guarantee of future results, these insights may help you understand our investment management philosophy.
Annual Report | 19
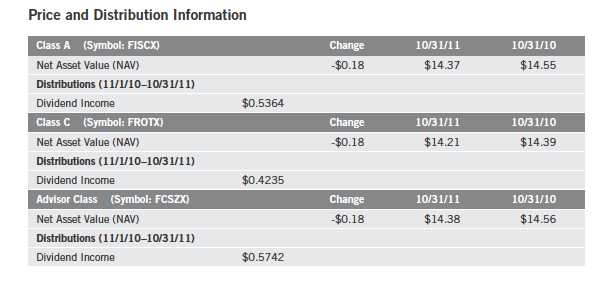
Performance Summary as of 10/31/11
Franklin Convertible Securities Fund
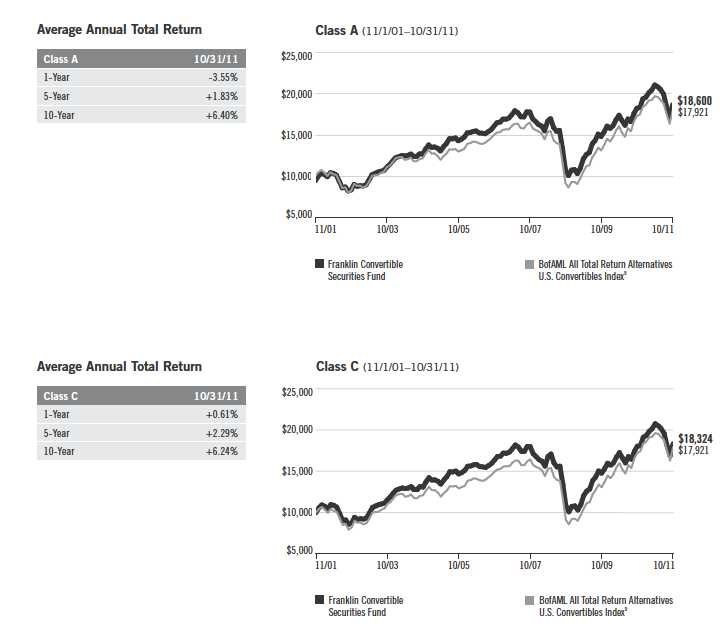
Your dividend income will vary depending on dividends or interest paid by securities in the Fund’s portfolio, adjusted for operating expenses of each class. Capital gain distributions are net profits realized from the sale of portfolio securities. The performance table and graphs do not reflect any taxes that a shareholder would pay on Fund dividends, capital gain distributions, if any, or any realized gains on the sale of Fund shares. Total return reflects reinvestment of the Fund’s dividends and capital gain distributions, if any, and any unrealized gains or losses.
20 | Annual Report
Performance Summary (continued)
Annual Report | 21
Performance Summary (continued)
Total Return Index Comparison for a Hypothetical $10,000 Investment
Total return represents the change in value of an investment over the periods shown. It includes any current, applicable, maximum sales charge, Fund expenses, account fees and reinvested distributions. The unmanaged index includes reinvestment of any income or distributions. It differs from the Fund in composition and does not pay management fees or expenses. One cannot invest directly in an index.
22 | Annual Report
Endnotes
The Fund may invest in high yielding, fixed income securities. High yields reflect the higher credit risk associated
with these lower rated securities and, in some cases, the lower market prices for these instruments. Interest rate
movements may affect the Fund’s share price and yield. Bond prices generally move in the opposite direction of
interest rates. As prices of bonds in the Fund adjust to a rise in interest rates, the Fund’s share price may decline.
The Fund may also invest in foreign securities, which involve special risks, including political uncertainty and cur-
rency volatility. The Fund is actively managed but there is no guarantee that the manager’s investment decisions
will produce the desired results. The Fund’s prospectus also includes a description of the main investment risks.
Class C: Prior to 1/1/04, these shares were offered with an initial sales charge; thus actual total returns
would have differed. These shares have higher annual fees and expenses than Class A shares.
Advisor Class: Shares are available to certain eligible investors as described in the prospectus.
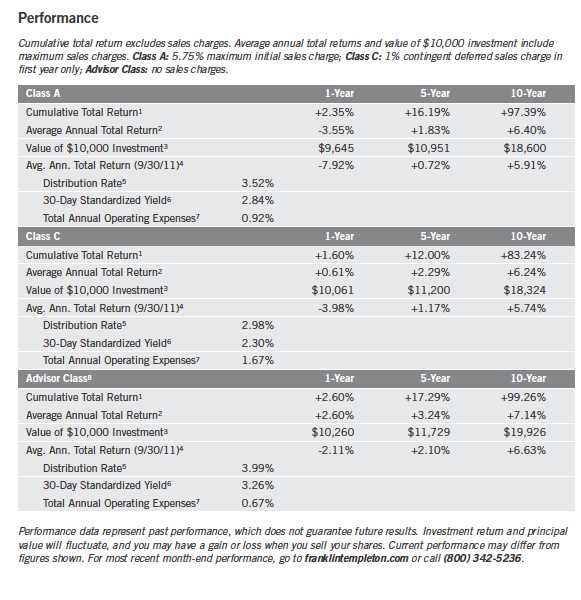
1. Cumulative total return represents the change in value of an investment over the periods indicated.
2. Average annual total return represents the average annual change in value of an investment over the periods
indicated.
3. These figures represent the value of a hypothetical $10,000 investment in the Fund over the periods indicated.
4. In accordance with SEC rules, we provide standardized average annual total return information through the latest
calendar quarter.
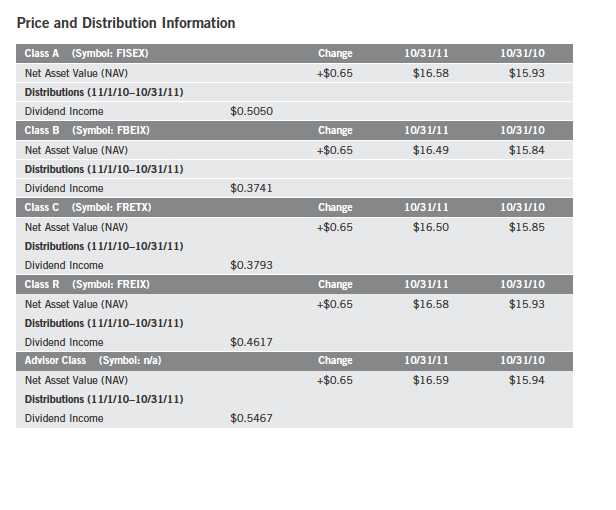
5. Distribution rate is based on the sum of the respective class’s last four quarterly dividends and the maximum
offering price (NAV for Classes C and Advisor) per share on 10/31/11.
6. The 30-day standardized yield for the 30 days ended 10/31/11 reflects an estimated yield to maturity (assuming
all portfolio securities are held to maturity). It should be regarded as an estimate of the Fund’s rate of investment
income, and it may not equal the Fund’s actual income distribution rate (which reflects the Fund’s past dividends
paid to shareholders) or the income reported in the Fund’s financial statements.
7. Figures are as stated in the Fund’s prospectus current as of the date of this report. In periods of market volatility,
assets may decline significantly, causing total annual Fund operating expenses to become higher than the figures
shown.
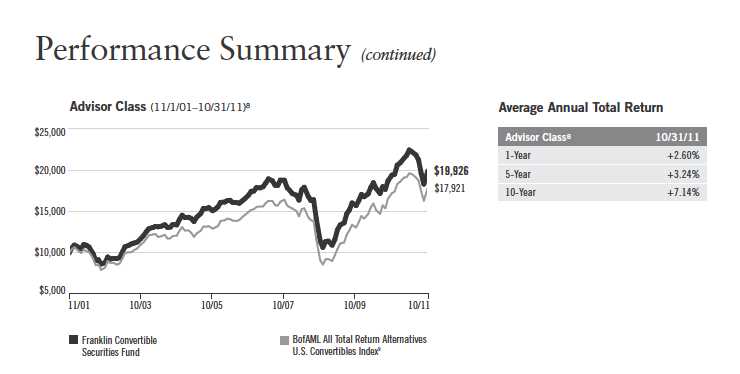
8. Effective 5/15/08, the Fund began offering Advisor Class shares, which do not have sales charges or a Rule 12b-1
plan. Performance quotations for this class reflect the following methods of calculation: (a) For periods prior to
5/15/08, a restated figure is used based upon the Fund’s Class A performance, excluding the effect of Class A’s
maximum initial sales charge, but reflecting the effect of the Class A Rule 12b-1 fees; and (b) for periods after
5/15/08 actual Advisor Class performance is used reflecting all charges and fees applicable to that class. Since
5/15/08 (commencement of sales), the cumulative and average annual total return of Advisor Class shares were
+10.10% and +2.82%.
9. Source: © 2011 Morningstar. The BofAML All Total Return Alternatives U.S. Convertibles Index comprises domes-
tic securities of all quality grades that are convertible into U.S. dollar-denominated common stock, ADRs or cash
equivalents and have a delta (measure of equity sensitivity) that indicates the security likely has a balance between
the debt and equity characteristics of the security.
Annual Report | 23
Your Fund’s Expenses
Franklin Convertible Securities Fund
As a Fund shareholder, you can incur two types of costs:
• Transaction costs, including sales charges (loads) on Fund purchases; and
• Ongoing Fund costs, including management fees, distribution and service (12b-1) fees, and other
Fund expenses. All mutual funds have ongoing costs, sometimes referred to as operating expenses.
The following table shows ongoing costs of investing in the Fund and can help you understand
these costs and compare them with those of other mutual funds. The table assumes a $1,000
investment held for the six months indicated.
Actual Fund Expenses
The first line (Actual) for each share class listed in the table provides actual account values and
expenses. The “Ending Account Value” is derived from the Fund’s actual return, which includes
the effect of Fund expenses.
You can estimate the expenses you paid during the period by following these steps. Of course,
your account value and expenses will differ from those in this illustration:
1. Divide your account value by $1,000.
If an account had an $8,600 value, then $8,600 ÷ $1,000 = 8.6.
2. Multiply the result by the number under the heading “Expenses Paid During Period.”
If Expenses Paid During Period were $7.50, then 8.6 x $7.50 = $64.50.
In this illustration, the estimated expenses paid this period are $64.50.
Hypothetical Example for Comparison with Other Funds
Information in the second line (Hypothetical) for each class in the table can help you compare
ongoing costs of investing in the Fund with those of other mutual funds. This information may
not be used to estimate the actual ending account balance or expenses you paid during the period.
The hypothetical “Ending Account Value” is based on the actual expense ratio for each class and
an assumed 5% annual rate of return before expenses, which does not represent the Fund’s actual
return. The figure under the heading “Expenses Paid During Period” shows the hypothetical
expenses your account would have incurred under this scenario. You can compare this figure
with the 5% hypothetical examples that appear in shareholder reports of other funds.
24 | Annual Report
Your Fund’s Expenses (continued)
Please note that expenses shown in the table are meant to highlight ongoing costs and do not reflect any transaction costs, such as sales charges. Therefore, the second line for each class is useful in comparing ongoing costs only, and will not help you compare total costs of owning different funds. In addition, if transaction costs were included, your total costs would have been higher. Please refer to the Fund prospectus for additional information on operating expenses.

Annual Report | 25
Franklin Equity Income Fund
Your Fund’s Goal and Main Investments: Franklin Equity Income Fund seeks to maximize total return, emphasizing high current income and long-term capital appreciation, consistent with reasonable risk, by investing at least 80% of its net assets in equity securities including securities convertible into common stocks.

This annual report for Franklin Equity Income Fund covers the fiscal year
ended October 31, 2011.
Performance Overview
For the 12 months under review, Franklin Equity Income Fund – Class A deliv-
ered a +7.27% cumulative total return. The Fund underperformed the broad
U.S. stock market as measured by the Standard & Poor’s 500 Index (S&P 500),
which produced total return of +8.09%.1 The Fund outperformed the +7.13%
total return of its peers in the Lipper Equity Income Funds Classification Average,
which consists of funds chosen by Lipper that seek relatively high current income
and growth of income by investing at least 60% of their portfolios in stocks.2
You can find the Fund’s long-term performance data in the Performance
Summary beginning on page 30.
Investment Strategy
We emphasize dividends in selecting stocks for the Fund because we believe
that over time dividend income can contribute significantly to total return. We
target companies we believe are financially strong but undervalued by the mar-
ket. Our experienced team of analysts searches for investment opportunities
among all economic sectors, and considers a company’s long-term earnings,
asset value and cash flow potential, to create a broadly diversified portfolio.
1. Source: © 2011 Morningstar. All Rights Reserved. The information contained herein: (1) is proprietary to Morningstar
and/or its content providers; (2) may not be copied or distributed; and (3) is not warranted to be accurate, complete or
timely. Neither Morningstar nor its content providers are responsible for any damages or losses arising from any use of
this information.
2. Source: Lipper Inc. For the six-month period ended 4/30/11, this category consisted of 286 funds. Lipper calcula-
tions do not include sales charges, or expense subsidization by a fund’s manager. The Fund’s performance relative to
the average may have differed if these and other factors had been considered.
The indexes are unmanaged and include reinvested dividends. One cannot invest directly in an index, and an index is
not representative of the Fund’s portfolio.
The dollar value, number of shares or principal amount, and names of all portfolio holdings are listed in the Fund’s
Statement of Investments (SOI). The SOI begins on page 76.
26 | Annual Report

Fund performance benefited from positive results among holdings in several sectors, particularly energy, consumer discretionary, telecommunication services and industrials. Many of the Fund’s energy sector positions in major oil producers, as well as oil and natural gas exploration companies and oilfield services providers, increased in value. Our top-performing holdings included Halliburton and Weatherford International (sold by period-end), which supply a wide range of equipment and services used in the oil and gas drilling industry worldwide. Major multinational oil and gas conglomerates such as Chevron, Exxon Mobil and ConocoPhillips also posted solid returns this fiscal year, as did Chesapeake Energy, an oil and gas exploration and production company that has been rapidly expanding its natural gas reserves through the acquisition and development of oil and gas assets across the U.S.
The Fund’s consumer discretionary holdings were led by specialty retailer Limited Brands and athletic footwear and apparel giant NIKE. These holdings benefited foremost from continued discretionary spending by Americans despite the fact that U.S. consumer sentiment deteriorated through period-end. Among telecommunication services companies, both Verizon and AT&T provided contributions to the Fund’s overall results. Industrials sector stocks
Annual Report | 27
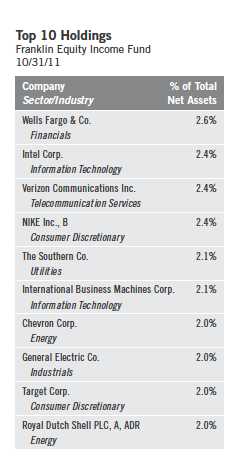
were also beneficial, largely because of gains in heavy machinery manufacturer Caterpillar. The company’s bottom line improved due to robust export demand for its equipment, particularly from China.
As corporate earnings improved, businesses continued to engage in long-awaited equipment and productivity upgrades that had been delayed by the recession. This shift in business sentiment had a positive impact on many of the Fund’s technology-related holdings. These included makers of computer hardware and electronic consumer products such as IBM and Apple, in addition to microchip manufacturers Intel and Microchip Technology, which benefited as many companies increased spending to upgrade their technology infrastructure.
In contrast, several disappointing investments, mainly in the financials sector, hindered the Fund’s results. Amid heightened stock market volatility in an uncertain regulatory environment for U.S. banks, large U.S. companies in the diversified financial services industry fared poorly as a whole. Among these were our holdings in Bank of America common stock, JPMorgan Chase & Co. and Citigroup (sold by period-end). Shares of insurers such as MetLife and QBE Insurance Group also fell in value during the period, exacerbating the Fund’s losses in the financials sector.
Raw-materials demand and pricing began to ebb as the stock and commodities markets retreated in volatile fashion during the late spring and summer of 2011, negatively impacting the Fund’s materials holdings. Detractors included steelmaker ArcelorMittal and diversified mining conglomerate Freeport-McMoRan Copper & Gold, the latter of which was further hindered by worker strikes at several of its mines (and despite gold reaching a new nominal all-time high price in September 2011).
Elsewhere, some of our information technology (IT) holdings weighed on performance, where office electronics manufacturer Xerox and network communications equipment maker Cisco Systems posted share price declines this fiscal year. Xerox suffered from temporary supply-chain issues resulting from the earthquake and tsunami in Japan, whereas Cisco experienced increased competition for its network products and a cyclical slowdown in spending from the public sector. Another notable detractor was electronics retailer Best Buy, which we sold during the year under review.
28 | Annual Report
Annual Report | 29
Performance Summary as of 10/31/11
Franklin Equity Income Fund
Your dividend income will vary depending on dividends or interest paid by securities in the Fund’s portfolio, adjusted for operating expenses of each class. Capital gain distributions are net profits realized from the sale of portfolio securities. The performance table and graphs do not reflect any taxes that a shareholder would pay on Fund dividends, capital gain distributions, if any, or any realized gains on the sale of Fund shares. Total return reflects reinvestment of the Fund’s dividends and capital gain distributions, if any, and any unrealized gains or losses.
30 | Annual Report
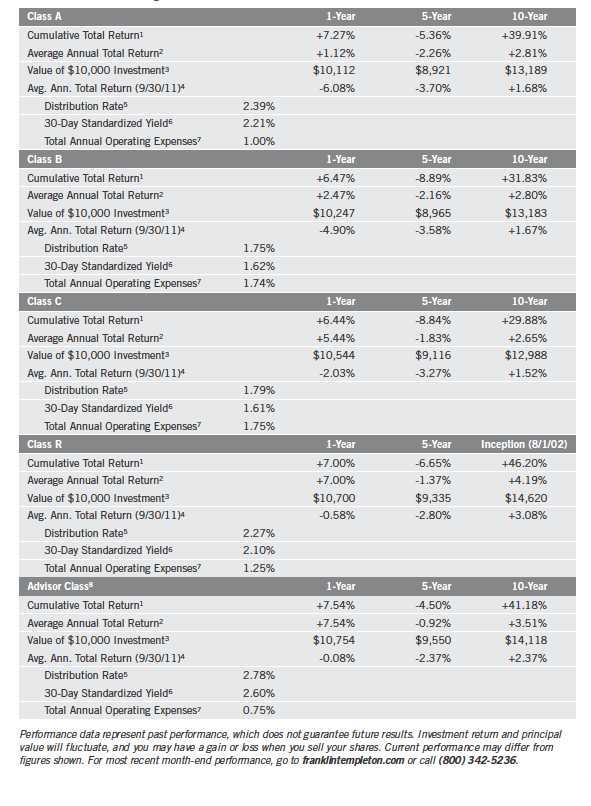
Performance Summary (continued)
Performance
Cumulative total return excludes sales charges. Average annual total returns and value of $10,000 investment include maximum sales charges. Class A: 5.75% maximum initial sales charge; Class B: contingent deferred sales charge (CDSC) declining from 4% to 1% over six years, and eliminated thereafter; Class C: 1% CDSC in first year only;
Class R/Advisor: no sales charges.
Annual Report | 31
Performance Summary (continued)
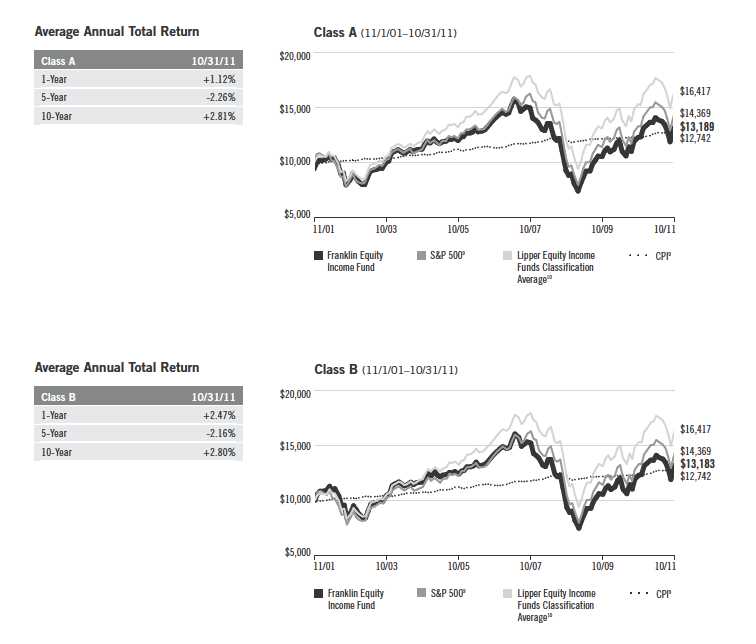
Total Return Index Comparison for a Hypothetical $10,000 Investment
Total return represents the change in value of an investment over the periods shown. It includes any current, applicable, maximum sales charge, Fund expenses, account fees and reinvested distributions. The unmanaged indexes include reinvestment of any income or distributions. They differ from the Fund in composition and do not pay management fees or expenses. One cannot invest directly in an index.
32 | Annual Report
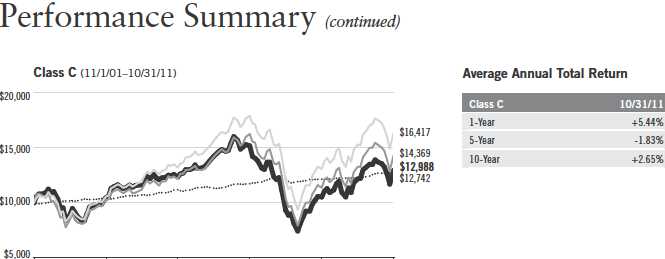
| 11/01 | 10/03 | 10/05 | 10/07 | 10/09 | 10/11 |
| Franklin Equity | S&P 5009 | Lipper Equity Income | CPI9 | ||
| Income Fund | Funds Classification | ||||
| Average10 | |||||
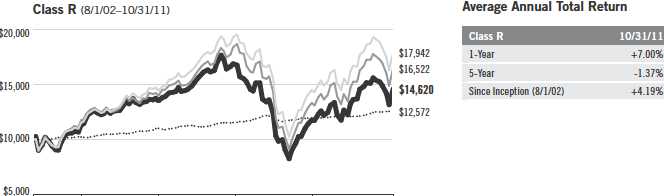
| 8/02 | 10/03 | 10/05 | 10/07 | 10/09 | 10/11 |
| Franklin Equity | S&P 5009 | Lipper Equity Income | CPI9 | ||
| Income Fund | Funds Classification | ||||
| Average10 | |||||
Annual Report | 33

Endnotes
While stocks have historically outperformed other asset classes over the long term, they tend to fluctuate more dramatically over the short
term as a result of factors affecting individual companies, industries or the securities market as a whole. The Fund’s investment in foreign
securities also involves special risks, including currency fluctuations and economic as well as political uncertainty. The Fund is actively man-
aged but there is no guarantee that the manager’s investment decisions will produce the desired results. The Fund’s prospectus also includes
a description of the main investment risks.
Class B: These shares have higher annual fees and expenses than Class A shares.
Class C: Prior to 1/1/04, these shares were offered with an initial sales charge; thus actual total returns would have differed. These shares
have higher annual fees and expenses than Class A shares.
Class R: Shares are available to certain eligible investors as described in the prospectus. These shares have higher annual fees and expenses
than Class A shares.
Advisor Class: Shares are available to certain eligible investors as described in the prospectus.
1. Cumulative total return represents the change in value of an investment over the periods indicated.
2. Average annual total return represents the average annual change in value of an investment over the periods indicated.
3. These figures represent the value of a hypothetical $10,000 investment in the Fund over the periods indicated.
4. In accordance with SEC rules, we provide standardized average annual total return information through the latest calendar quarter.
5. Distribution rate is based on an annualization of the respective class’s October dividend and the maximum offering price (NAV for Classes B, C, R,
and Advisor) per share on 10/31/11.
6. The 30-day standardized yield for the 30 days ended 10/31/11 reflects an estimated yield to maturity (assuming all portfolio securities are held to
maturity). It should be regarded as an estimate of the Fund’s rate of investment income, and it may not equal the Fund’s actual income distribution
rate (which reflects the Fund’s past dividends paid to shareholders) or the income reported in the Fund’s financial statements.
7. Figures are as stated in the Fund’s prospectus current as of the date of this report. In periods of market volatility, assets may decline significantly,
causing total annual Fund operating expenses to become higher than the figures shown.
8. Effective 5/15/08, the Fund began offering Advisor Class shares, which do not have sales charges or a Rule 12b-1 plan. Performance quotations
for this class reflect the following methods of calculation: (a) For periods prior to 5/15/08, a restated figure is used based upon the Fund’s Class A
performance, excluding the effect of Class A’s maximum initial sales charge, but reflecting the effect of the Class A Rule 12b-1 fees; and (b) for peri-
ods after 5/15/08, actual Advisor Class performance is used reflecting all charges and fees applicable to that class. Since 5/15/08 (commencement
of sales), the cumulative and average annual total returns of Advisor Class shares were -4.62% and -1.36%.
9. Sources: © 2011 Morningstar; Lipper Inc. The S&P 500 is a market capitalization-weighted index of 500 stocks designed to measure total U.S.
equity market performance. The Consumer Price Index (CPI), calculated by the U.S. Bureau of Labor Statistics, is a commonly used measure of the
inflation rate.
10. The Lipper Equity Income Funds Classification Average is an equally weighted average calculation of performance figures for all funds within the
Lipper Equity Income Funds classification in the Lipper Open-End underlying funds universe. Lipper Equity Income Funds seek relatively high current
income and growth of income through investing 60% or more of their portfolios in equities. For the one-year period ended 10/31/11, there were 286
funds in this category. Lipper calculations do not include sales charges or expense subsidization by a fund’s manager. The Fund’s performance rela-
tive to the average may have differed if these or other factors had been considered.
34 | Annual Report
Your Fund’s Expenses
Franklin Equity Income Fund
As a Fund shareholder, you can incur two types of costs:
- Transaction costs, including sales charges (loads) on Fund purchases; and
- Ongoing Fund costs, including management fees, distribution and service (12b-1) fees, and other Fund expenses. All mutual funds have ongoing costs, sometimes referred to as operating expenses.
The following table shows ongoing costs of investing in the Fund and can help you understand these costs and compare them with those of other mutual funds. The table assumes a $1,000 investment held for the six months indicated.
Actual Fund Expenses
The first line (Actual) for each share class listed in the table provides actual account values and expenses. The “Ending Account Value” is derived from the Fund’s actual return, which includes the effect of Fund expenses.
You can estimate the expenses you paid during the period by following these steps. Of course, your account value and expenses will differ from those in this illustration:
| 1. | Divide your account value by $1,000. |
| If an account had an $8,600 value, then $8,600 ÷ $1,000 = 8.6. | |
| 2. | Multiply the result by the number under the heading “Expenses Paid During Period.” |
| If Expenses Paid During Period were $7.50, then 8.6 x $7.50 = $64.50. |
In this illustration, the estimated expenses paid this period are $64.50.
Hypothetical Example for Comparison with Other Funds
Information in the second line (Hypothetical) for each class in the table can help you compare ongoing costs of investing in the Fund with those of other mutual funds. This information may not be used to estimate the actual ending account balance or expenses you paid during the period. The hypothetical “Ending Account Value” is based on the actual expense ratio for each class and an assumed 5% annual rate of return before expenses, which does not represent the Fund’s actual return. The figure under the heading “Expenses Paid During Period” shows the hypothetical expenses your account would have incurred under this scenario. You can compare this figure with the 5% hypothetical examples that appear in shareholder reports of other funds.
Annual Report | 35
Your Fund’s Expenses (continued)
Please note that expenses shown in the table are meant to highlight ongoing costs and do not reflect any transaction costs, such as sales charges. Therefore, the second line for each class is useful in comparing ongoing costs only, and will not help you compare total costs of owning different funds. In addition, if transaction costs were included, your total costs would have been higher. Please refer to the Fund prospectus for additional information on operating expenses.
36 | Annual Report
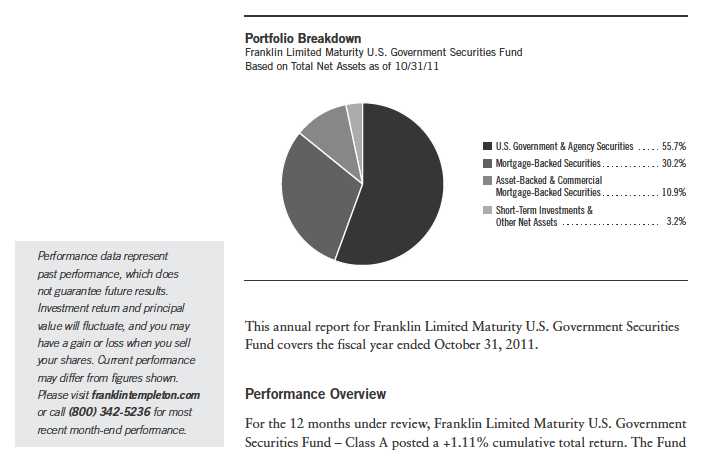
Franklin Limited Maturity U.S. Government Securities Fund
Your Fund’s Goal and Main Investments: Franklin Limited Maturity U.S. Government Securities Fund seeks to provide investors with as high a level of current income as is consistent with prudent investing, while seeking to preserve shareholders’ capital, by investing at least 80% of its net assets in securities with a dollar-weighted average maturity of less than 10 years and issued or guaranteed by the U.S. government, its agencies or instrumentalities.1 Some of the Fund’s investments may include securities issued by U.S. government-sponsored entities such as Fannie Mae and Freddie Mac.2
1. In determining a security’s maturity for the purposes of calculating the Fund’s dollar-weighted average maturity, an
estimate of the average time for its principal to be paid may be used. This can be substantially shorter than its stated
final maturity.
2. Although U.S. government sponsored entities may be chartered or sponsored by acts of Congress, their securities
are neither insured nor guaranteed by the U.S. government. Please refer to the Fund’s prospectus for a detailed discus-
sion regarding various levels of credit support. The Fund’s yield and share price are not guaranteed and will vary with
market conditions.
The dollar value, number of shares or principal amount, and names of all portfolio holdings are listed in the Fund’s
Statement of Investments (SOI). The SOI begins on page 82.
Annual Report | 37
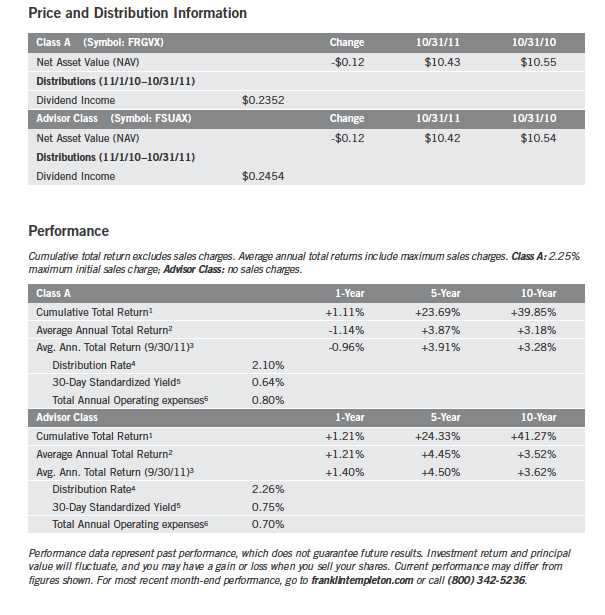
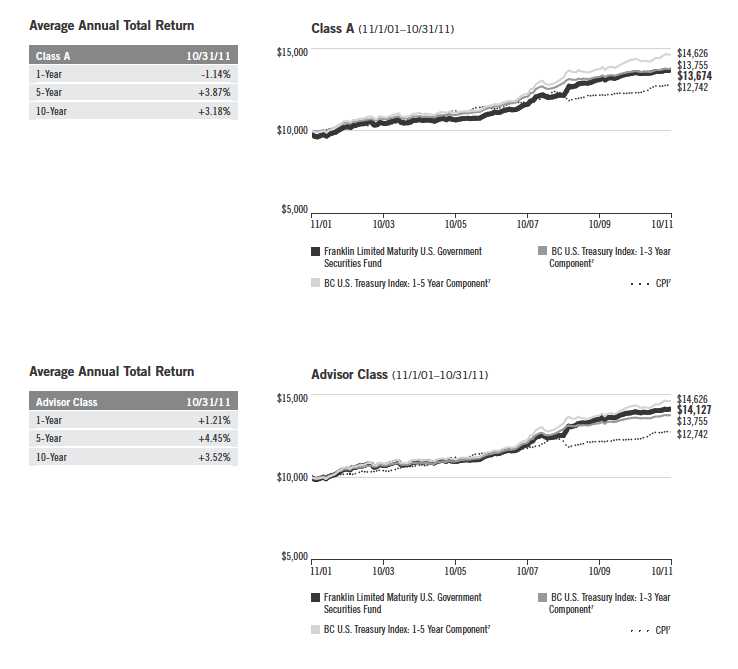
underperformed the +1.93% total return of its primary benchmark, the Barclays Capital (BC) U.S. Treasury Index: 1-5 Year Component, which tracks U.S. Treasury securities with one to five years remaining maturity.3 The Fund outperformed the +1.05% total return of its secondary benchmark, the Barclays Capital (BC) U.S. Treasury Index: 1-3 Year Component, which tracks U.S. Treasury securities with one to three years remaining maturity.3 You can find the Fund’s long-term performance data in the Performance Summary beginning on page 41.
Investment Strategy
We currently maintain the portfolio’s dollar-weighted average maturity between one and five years. The Fund’s dollar-weighted average maturity will vary with market conditions and the outlook for interest rates. We invest primarily in
3. Source: © 2011 Morningstar. All Rights Reserved. The information contained herein: (1) is proprietary to Morningstar and/or its content providers; (2) may not be copied or distributed; and (3) is not warranted to be accurate, complete or timely. Neither Morningstar nor its content providers are responsible for any damages or losses arising from any use of this information. The indexes are unmanaged and include reinvested dividends. One cannot invest directly in an index, and an index is not representative of the Fund’s portfolio.
38 | Annual Report
short- to intermediate-term securities guaranteed by the U.S. government, its agencies and instrumentalities. Some of the Fund’s investments may include securities issued by U.S. government-sponsored entities, such as Fannie Mae (FNMA) and Freddie Mac (FHLMC).2 The Fund’s portfolio emphasizes mortgage-backed bonds and agency debentures, while also diversifying across components of the U.S. Treasury sector. We analyze securities using proprietary and nonproprietary research to help identify attractive investment opportunities.
Manager’s Discussion
As measured by BC indexes, most fixed income sectors posted positive returns during the period, including the U.S. TIPS Index (+7.16%), the Ginnie Mae (GNMA) Index (+6.04%), the FNMA Index (+4.23%), the FHLMC Index (+4.11%), the U.S. Hybrid Adjustable-Rate Mortgage (ARM) Index (+3.05%) and the U.S. Agency Index (+2.73%).3 The Fund, which looked for attractive valuations within lower interest rate risk portions of these and other government bond markets, benefited from these trends.
The Fund invested in U.S. Treasuries, agency debentures, agency mortgage pass-through securities, other U.S. government-related bonds and cash investments. The Fund invested in agency mortgage pass-throughs including bonds backed by multi-family and single family homes with fixed-rate as well as adjustable-rate interest payments.
Many of the bonds the Fund owned during the period underperformed comparable maturity U.S. Treasuries after recent market volatility caused some flight to quality. However, our investments in each of the broad sectors contributed to total return, and many of our agency ARMs outperformed comparable Treasuries over the period. Many of the agency multi-family mortgages we added during the period also outperformed due to strong relative performance near period-end.
The portfolio had less interest rate risk than the benchmark BC U.S. Treasury Index: 1-5 Year Component due to our concern that interest rates could eventually rise from their historically low levels and lead to negative returns in longer duration bonds. However, during the period, interest rates fell and as a result, our lower interest rate risk positioning hurt performance relative to the benchmark.
Annual Report | 39
During the period, we continued to emphasize agency debentures and agency mortgage pass-through securities because we believe they offer better return potential, as well as an income advantage over Treasuries. However, we decreased our exposure to agency debentures, and within our agency mortgage allocation we shifted exposure out of single-family mortgage-backed bonds into multi-family mortgage-backed bonds, including FHLMC guaranteed K-program bonds. We increased our exposure to Treasuries and TIPS.
Thank you for your continued participation in Franklin Limited Maturity U.S. Government Securities Fund. We look forward to serving your future investment needs.

Portfolio Management Team
Franklin Limited Maturity
U.S. Government Securities Fund
The foregoing information reflects our analysis, opinions and portfolio holdings as of October 31, 2011, the end of the reporting period. The way we implement our main investment strategies and the resulting portfolio holdings may change depending on factors such as market and economic conditions. These opinions may not be relied upon as investment advice or an offer for a particular security. The information is not a complete analysis of every aspect of any market, country, industry, security or the Fund. Statements of fact are from sources considered reliable, but the investment manager makes no representation or warranty as to their completeness or accuracy. Although historical performance is no guarantee of future results, these insights may help you understand our investment management philosophy.
40 | Annual Report
Performance Summary as of 10/31/11
Franklin Limited Maturity U.S. Government Securities Fund
Your dividend income will vary depending on dividends or interest paid by securities in the Fund’s portfolio, adjusted for operating expenses of each class. Capital gain distributions are net profits realized from the sale of portfolio securities. The performance table and graphs do not reflect any taxes that a shareholder would pay on Fund dividends, capital gain distributions, if any, or any realized gains on the sale of Fund shares. Total return reflects reinvestment of the Fund’s dividends and capital gain distributions, if any, and any unrealized gains or losses.
Annual Report | 41
Performance Summary (continued)
Total Return Index Comparison for a Hypothetical $10,000 Investment
Total return represents the change in value of an investment over the periods shown. It includes any applicable maximum sales charge, Fund expenses, account fees and reinvested distributions. The unmanaged indexes include reinvestment of any income or distributions. They differ from the Fund in composition and do not pay management fees or expenses. One cannot invest directly in an index.
42 | Annual Report
Performance Summary (continued)
Endnotes
Interest rate movements, unscheduled mortgage prepayments and other risk factors will affect the Fund’s share price and yield. Bond prices, and thus a fund’s share price, generally move in the opposite direction of interest rates. Therefore, as prices of bonds in the Fund adjust to a rise in interest rates, the Fund’s share price may decline. Changes in the financial strength of a bond issuer or in a bond’s credit rating may affect its value. The Fund is actively managed but there is no guarantee that the manager’s investment decisions will produce the desired results. The Fund’s prospectus also includes a description of the main investment risks.
Advisor Class: Shares are available to certain eligible investors as described in the prospectus.
1. Cumulative total return represents the change in value of an investment over the periods indicated.
2. Average annual total return represents the average annual change in value of an investment over the periods indicated.
3. In accordance with SEC rules, we provide standardized average annual total return information through the latest calendar quarter.
4. Distribution rate is based on an annualization of the respective class’s October dividend and the maximum offering price (NAV for Advisor Class) per share on 10/31/11.
5. The 30-day standardized yield for the 30 days ended 10/31/11 reflects an estimated yield to maturity (assuming all portfolio securities are held to maturity). It should be regarded as an estimate of the Fund’s rate of investment income, and it may not equal the Fund’s actual income distribution rate (which reflects the Fund’s past dividends paid to shareholders) or the income reported in the Fund’s financial statements.
6. Figures are as stated in the Fund’s prospectus current as of the date of this report. In periods of market volatility, assets may decline significantly, causing total annual Fund operating expenses to become higher than the figures shown.
7. Source: © 2011 Morningstar. The BC U.S. Treasury Index: 1-5 Year Component is the 1-5 year component of the BC U.S. Treasury Index, which covers public obligations of the U.S. Treasury with a remaining maturity of one year or more. The BC U.S. Treasury Index: 1-3 Year Component is the 1-3 year component of the Barclays Capital U.S. Treasury Index. The Consumer Price Index (CPI), calculated by the U.S. Bureau of Labor Statistics, is a commonly used measure of the inflation rate.
Annual Report | 43
Your Fund’s Expenses
Franklin Limited Maturity U.S. Government Securities Fund
As a Fund shareholder, you can incur two types of costs:
- Transaction costs, including sales charges (loads) on Fund purchases; and
- Ongoing Fund costs, including management fees, distribution and service (12b-1) fees, and other Fund expenses. All mutual funds have ongoing costs, sometimes referred to as operating expenses.
The following table shows ongoing costs of investing in the Fund and can help you understand these costs and compare them with those of other mutual funds. The table assumes a $1,000 investment held for the six months indicated.
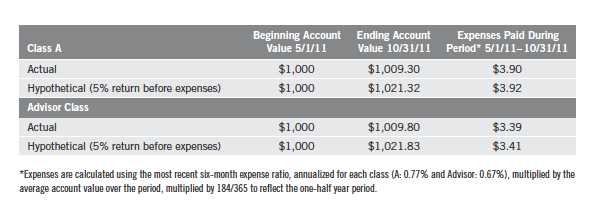
Actual Fund Expenses
The first line (Actual) for each share class listed in the table provides actual account values and expenses. The “Ending Account Value” is derived from the Fund’s actual return, which includes the effect of Fund expenses.
You can estimate the expenses you paid during the period by following these steps. Of course, your account value and expenses will differ from those in this illustration:
| 1. | Divide your account value by $1,000. |
| If an account had an $8,600 value, then $8,600 ÷ $1,000 = 8.6. | |
| 2. | Multiply the result by the number under the heading “Expenses Paid During Period.” |
| If Expenses Paid During Period were $7.50, then 8.6 x $7.50 = $64.50. |
In this illustration, the estimated expenses paid this period are $64.50.
Hypothetical Example for Comparison with Other Funds
Information in the second line (Hypothetical) for each class in the table can help you compare ongoing costs of investing in the Fund with those of other mutual funds. This information may not be used to estimate the actual ending account balance or expenses you paid during the period. The hypothetical “Ending Account Value” is based on the actual expense ratio for each class and an assumed 5% annual rate of return before expenses, which does not represent the Fund’s actual return. The figure under the heading “Expenses Paid During Period” shows the hypothetical expenses your account would have incurred under this scenario. You can compare this figure with the 5% hypothetical examples that appear in shareholder reports of other funds.
44 | Annual Report
Your Fund’s Expenses (continued)
Please note that expenses shown in the table are meant to highlight ongoing costs and do not reflect any transaction costs, such as sales charges. Therefore, the second line for each class is useful in comparing ongoing costs only, and will not help you compare total costs of owning different funds. In addition, if transaction costs were included, your total costs would have been higher. Please refer to the Fund prospectus for additional information on operating expenses.
Annual Report | 45
Franklin Real Return Fund
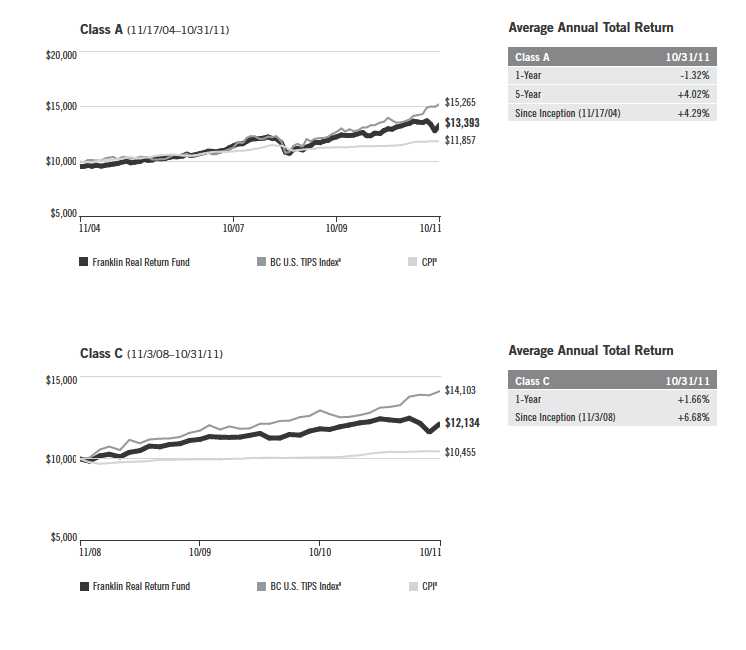
Your Fund’s Goal and Main Investments: Franklin Real Return Fund seeks to achieve total return that exceeds the rate of inflation over an economic cycle. The Fund will generally invest a substantial portion of its assets in inflation-protected securities. Managers also have the flexibility to invest in other sectors of the market to increase real return (total return less the rate of inflation) potential and offer greater diversification.
This annual report for Franklin Real Return Fund covers the fiscal year ended
October 31, 2011.
Performance Overview
For the 12 months under review, Franklin Real Return Fund – Class A posted
a +3.03% cumulative total return. The Fund underperformed the +9.03%
total return of its benchmark, the Barclays Capital (BC) U.S. TIPS Index,
which tracks the universe of inflation-protected notes issued by the U.S.
Treasury that have at least one year to final maturity.1 The Fund also under-
performed the Consumer Price Index (CPI) for Urban Consumers (All Items)
NSA (non-seasonally adjusted), a measure of the average change in prices of
all goods and services purchased for consumption by urban householders,
which rose 3.53% for the same period.1 You can find more of the Fund’s
performance data in the Performance Summary beginning on page 49.
Investment Strategy
We seek to allocate assets among investments to achieve the highest level of
real return (total return less the rate of inflation) consistent with an acceptable
level of risk. We will allocate the Fund’s assets among securities in various
market sectors based on our assessment of changing economic, global market,
industry and issuer conditions. When making our investment decisions, we use
a “top-down” analysis of macroeconomic trends combined with a “bottom-up”
fundamental analysis of market sectors, industries and issuers to try to take
advantage of varying sector reactions to economic events. We will evaluate such
criteria as country risk, business cycles, yield curves, and values between and
within markets.
1. Source: © 2011 Morningstar. All Rights Reserved. The information contained herein: (1) is proprietary to Morningstar
and/or its content providers; (2) may not be copied or distributed; and (3) is not warranted to be accurate, complete or
timely. Neither Morningstar nor its content providers are responsible for any damages or losses arising from any use of
this information. The indexes are unmanaged. The BC U.S. TIPS Index includes reinvested interest. One cannot invest
directly in an index, and an index is not representative of the Fund’s portfolio.
The dollar value, number of shares or principal amount, and names of all portfolio holdings are listed in the Fund’s
Statement of Investments (SOI). The SOI begins on page 89.
46 | Annual Report
Manager’s Discussion
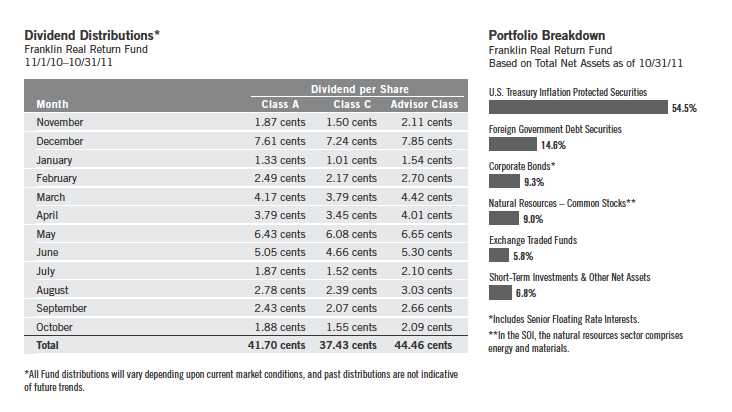
During the year under review, we invested the Fund’s assets in the allowable sectors. At period-end, a little over half of the Fund’s total net assets were invested in Treasury Inflation Protected Securities (TIPS). For diversification, we also allocated some of the Fund’s assets to natural resources, real estate investment trusts (REITs), short-term non-U.S. dollar securities, bank loans and high yield bonds. We employed a non-U.S. dollar strategy to help manage against dollar weakness versus certain currencies. We concentrated our TIPS holdings in shorter maturities during the Fund’s fiscal year.
Our diversified mix of inflation-sensitive assets underperformed during the year under review. The Fund’s exposure to REITs helped performance relative to the benchmark BC U.S. TIPS Index, as did our currency and TIPS exposures. However, investors’ flight to quality over the period led our allocation in below-investment-grade securities to detract from performance. Our exposure to natural resources securities also hurt performance relative to the benchmark index as commodity prices retreated during the global slowdown.
Annual Report | 47

48 | Annual Report
Performance Summary as of 10/31/11
Franklin Real Return Fund
Your dividend income will vary depending on dividends or interest paid by securities in the Fund’s portfolio, adjusted for operating expenses of each class. Capital gain distributions are net profits realized from the sale of portfolio securities. The performance table and graphs do not reflect any taxes that a shareholder would pay on Fund dividends, capital gain distributions, if any, or any realized gains on the sale of Fund shares. Total return reflects reinvestment of the Fund’s dividends and capital gain distributions, if any, and any unrealized gains or losses.
Annual Report | 49
Performance Summary (continued)

50 | Annual Report
Performance Summary (continued)
Total Return Index Comparison for a Hypothetical $10,000 Investment1
Total return represents the change in value of an investment over the period shown. It includes any applicable maximum sales charge, Fund expenses, account fees and reinvested distributions. The unmanaged index includes reinvestment of any income or distributions. It differs from the Fund in composition and does not pay management fees or expenses. One cannot invest directly in an index.
Annual Report | 51

Endnotes
Interest rate movements will affect the Fund’s share price and yield. Bond prices generally move in the oppo-
site direction of interest rates. Thus, as prices of bonds in the Fund adjust to a rise in interest rates, the Fund’s
share price may decline. While stocks have historically outperformed other asset classes over the long term,
they tend to fluctuate more dramatically over the short term. These price movements may result from factors
affecting individual companies, industries or the securities market as a whole. The risks of foreign securities
include currency fluctuations and political uncertainty. The Fund is actively managed but there is no guarantee
that the manager’s investment decisions will produce the desired results. The Fund’s prospectus also includes a
description of the main investment risks.
Class C: These shares have higher annual fees and expenses than Class A shares.
Advisor Class: Shares are available to certain eligible investors as described in the prospectus.
1. If the manager and administrator had not waived fees, the Fund’s distribution rates and total returns would have been
lower, and yields for the period would have been 1.91%, 1.61% and 2.25% for Classes A, C and Advisor, respectively.
2. Cumulative total return represents the change in value of an investment over the periods indicated.
3. Average annual total return represents the average annual change in value of an investment over the periods
indicated.
4. In accordance with SEC rules, we provide standardized average annual total return information through the latest
calendar quarter.
5. Distribution rate is based on an annualization of the respective class’s October dividend and the maximum offer-
ing price (NAV for Classes C and Advisor) per share on 10/31/11.
6. The 30-day standardized yield for the 30 days ended 10/31/11 reflects an estimated yield to maturity (assuming
all portfolio securities are held to maturity). It should be regarded as an estimate of the Fund’s rate of investment
income, and it may not equal the Fund’s actual income distribution rate (which reflects the Fund’s past dividends
paid to shareholders) or the income reported in the Fund’s financial statements.
7. Figures are as stated in the Fund’s prospectus current as of the date of this report. In periods of market volatil-
ity, assets may decline significantly, causing total annual Fund operating expenses to become higher than the
figures shown.
8. Source: © 2011 Morningstar. The BC U.S. TIPS Index comprises U.S. Treasury Inflation Protected Securities rated
investment grade (Baa3/BBB- or better) with at least one year to final maturity and at least $250 million par
amount outstanding. The Consumer Price Index (CPI), calculated by the U.S. Bureau of Labor Statistics, is a com-
monly used measure of the inflation rate.
52 | Annual Report
Your Fund’s Expenses
Franklin Real Return Fund
As a Fund shareholder, you can incur two types of costs:
- Transaction costs, including sales charges (loads) on Fund purchases; and
- Ongoing Fund costs, including management fees, distribution and service (12b-1) fees, and other Fund expenses. All mutual funds have ongoing costs, sometimes referred to as operating expenses.
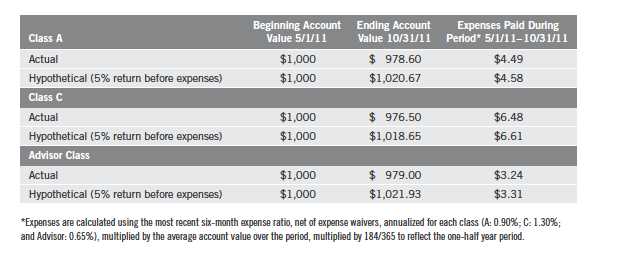
The following table shows ongoing costs of investing in the Fund and can help you understand these costs and compare them with those of other mutual funds. The table assumes a $1,000 investment held for the six months indicated.
Actual Fund Expenses
The first line (Actual) for each share class listed in the table provides actual account values and expenses. The “Ending Account Value” is derived from the Fund’s actual return, which includes the effect of Fund expenses.
You can estimate the expenses you paid during the period by following these steps. Of course, your account value and expenses will differ from those in this illustration:
| 1. | Divide your account value by $1,000. |
| If an account had an $8,600 value, then $8,600 ÷ $1,000 = 8.6. | |
| 2. | Multiply the result by the number under the heading “Expenses Paid During Period.” |
| If Expenses Paid During Period were $7.50, then 8.6 x $7.50 = $64.50. |
In this illustration, the estimated expenses paid this period are $64.50.
Hypothetical Example for Comparison with Other Funds
Information in the second line (Hypothetical) for each class in the table can help you compare ongoing costs of investing in the Fund with those of other mutual funds. This information may not be used to estimate the actual ending account balance or expenses you paid during the period. The hypothetical “Ending Account Value” is based on the actual expense ratio for each class and an assumed 5% annual rate of return before expenses, which does not represent the Fund’s actual return. The figure under the heading “Expenses Paid During Period” shows the hypothetical expenses your account would have incurred under this scenario. You can compare this figure with the 5% hypothetical examples that appear in shareholder reports of other funds.
Annual Report | 53
Your Fund’s Expenses (continued)
Please note that expenses shown in the table are meant to highlight ongoing costs and do not reflect any transaction costs, such as sales charges. Therefore, the second line for each class is useful in comparing ongoing costs only, and will not help you compare total costs of owning different funds. In addition, if transaction costs were included, your total costs would have been higher. Please refer to the Fund prospectus for additional information on operating expenses.
54 | Annual Report
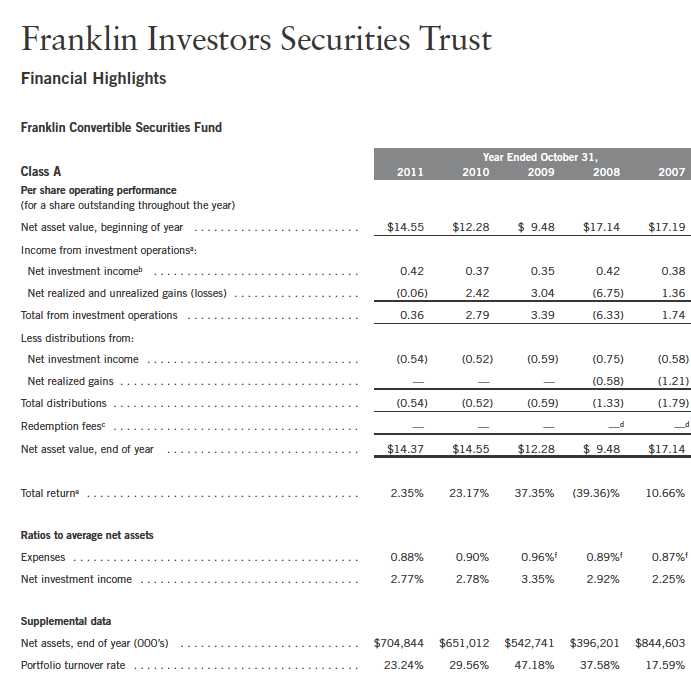
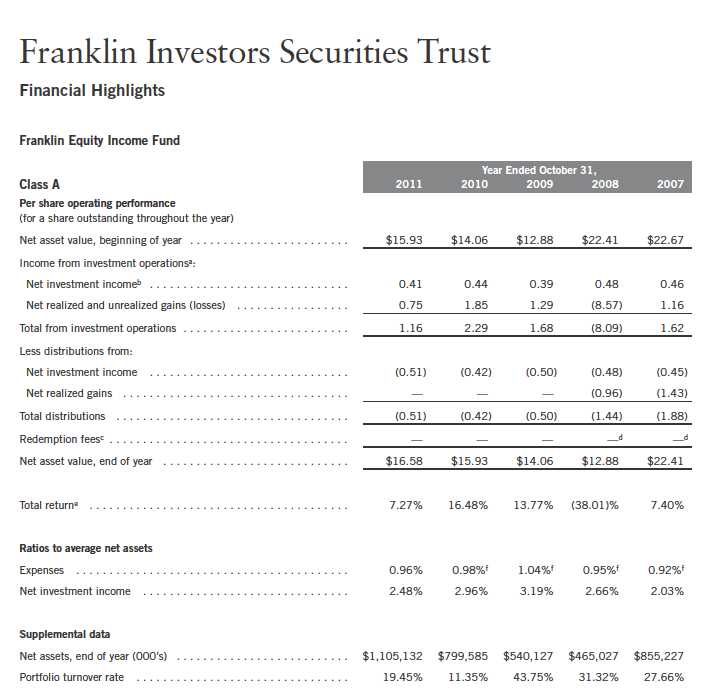
Franklin Investors Securities Trust
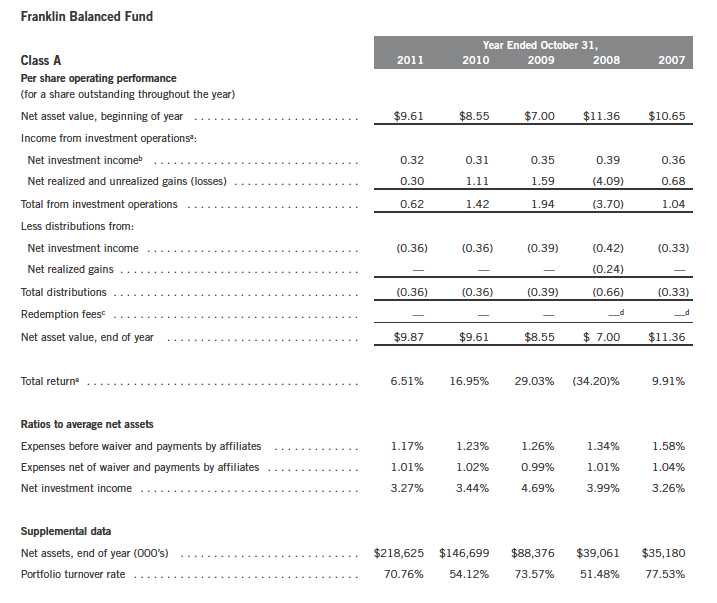
Financial Highlights
Annual Report | The accompanying notes are an integral part of these financial statements. | 55
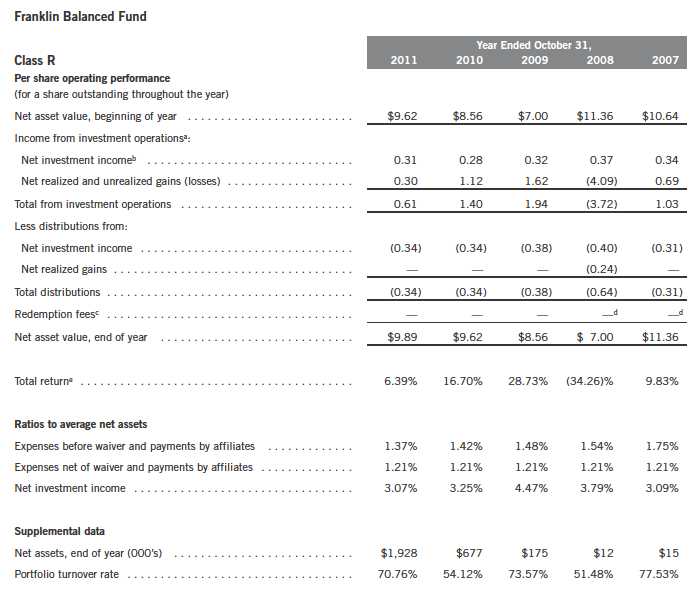
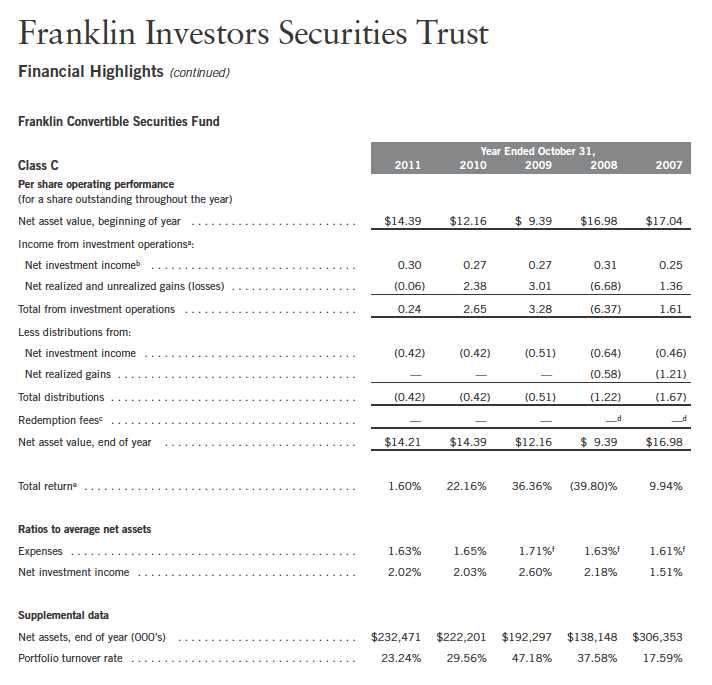
Franklin Investors Securities Trust
Financial Highlights (continued)
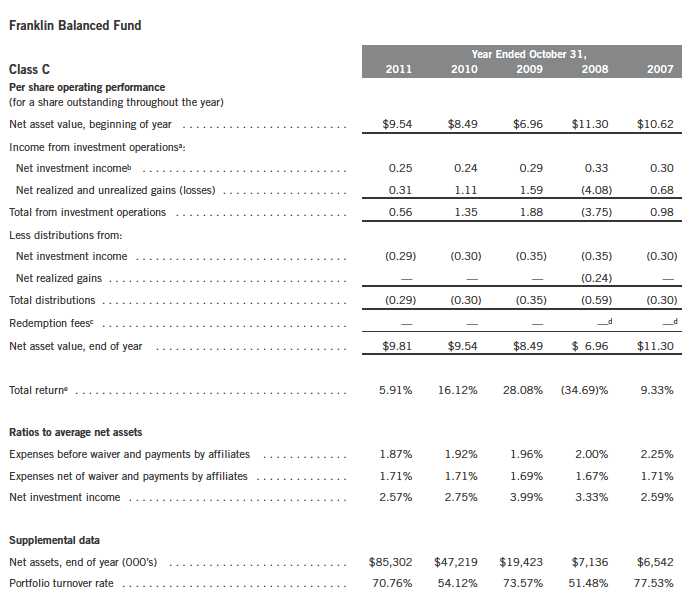
| aThe amount shown for a share outstanding throughout the period may not correlate with the Statement of Operations for the period due to the timing of sales and repurchases of |
| the Fund shares in relation to income earned and/or fluctuating market value of the investments of the Fund. |
| bBased on average daily shares outstanding. |
| cEffective September 1, 2008, the redemption fee was eliminated. |
| dAmount rounds to less than $0.01 per share. |
| eTotal return does not reflect sales commissions or contingent deferred sales charges, if applicable. |
56 | The accompanying notes are an integral part of these financial statements. | Annual Report
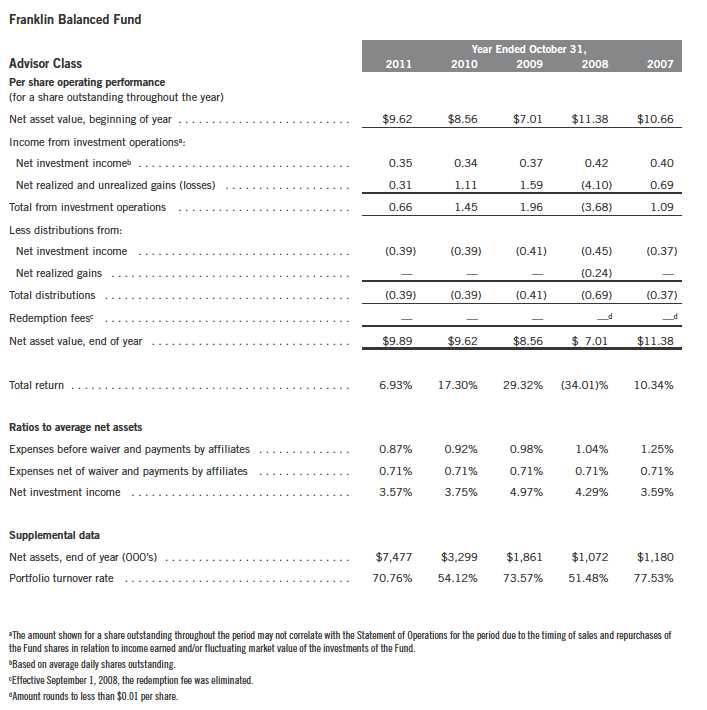
Franklin Investors Securities Trust
Financial Highlights (continued)
aThe amount shown for a share outstanding throughout the period may not correlate with the Statement of Operations for the period due to the timing of sales and repurchases of the Fund shares in relation to income earned and/or fluctuating market value of the investments of the Fund. bBased on average daily shares outstanding. cEffective September 1, 2008, the redemption fee was eliminated. dAmount rounds to less than $0.01 per share. eTotal return does not reflect sales commissions or contingent deferred sales charges, if applicable.
Annual Report | The accompanying notes are an integral part of these financial statements. | 57
Franklin Investors Securities Trust
Financial Highlights (continued)
58 | The accompanying notes are an integral part of these financial statements. | Annual Report
Annual Report | 59
60 | Annual Report
Annual Report | 61
62 | Annual Report
Annual Report | 63
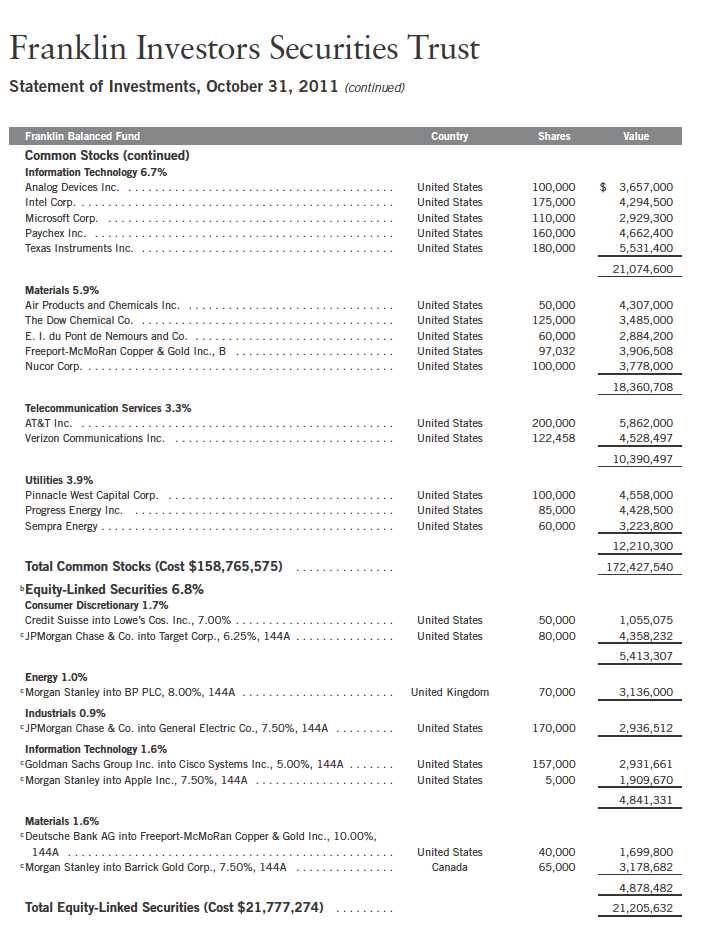
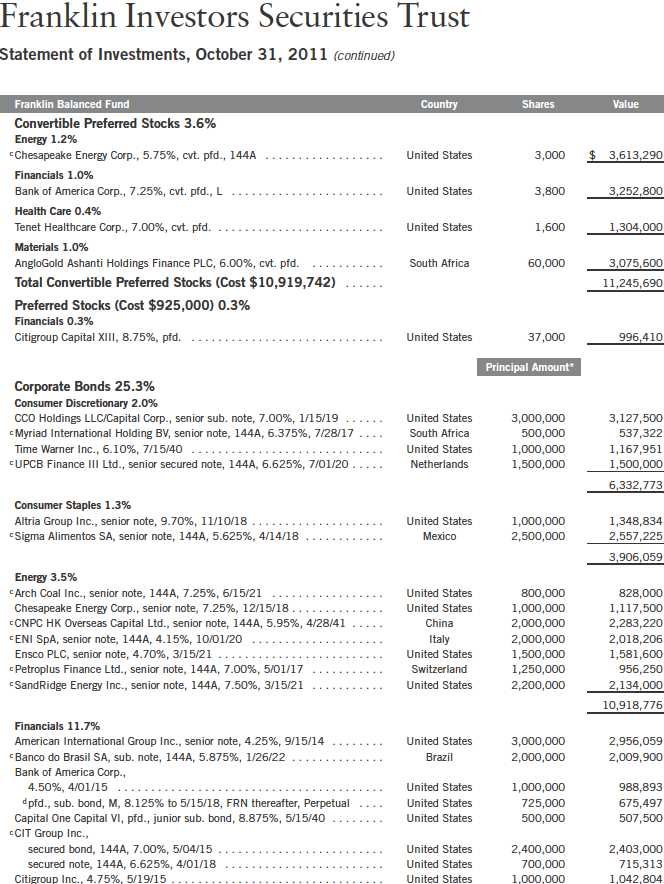
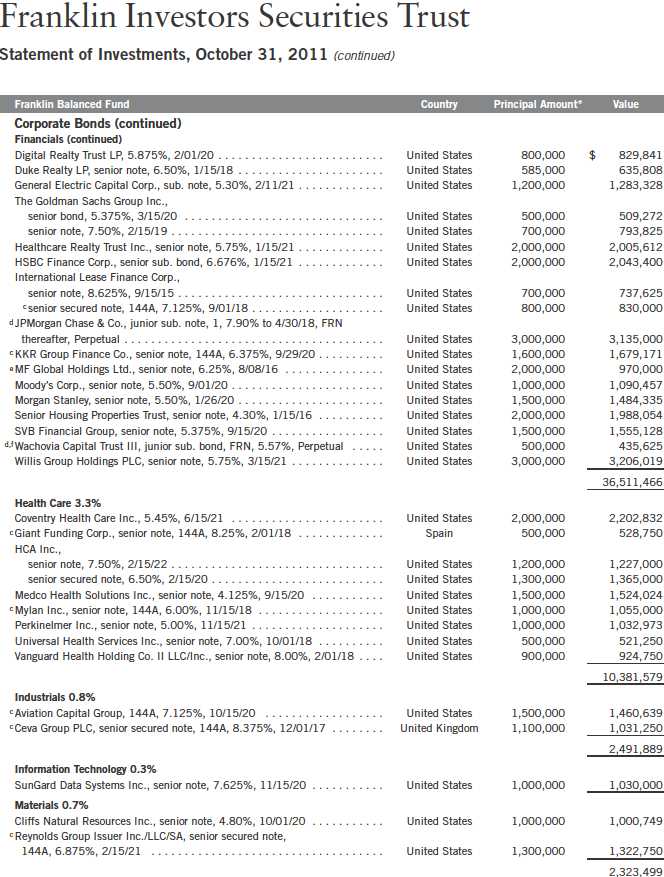
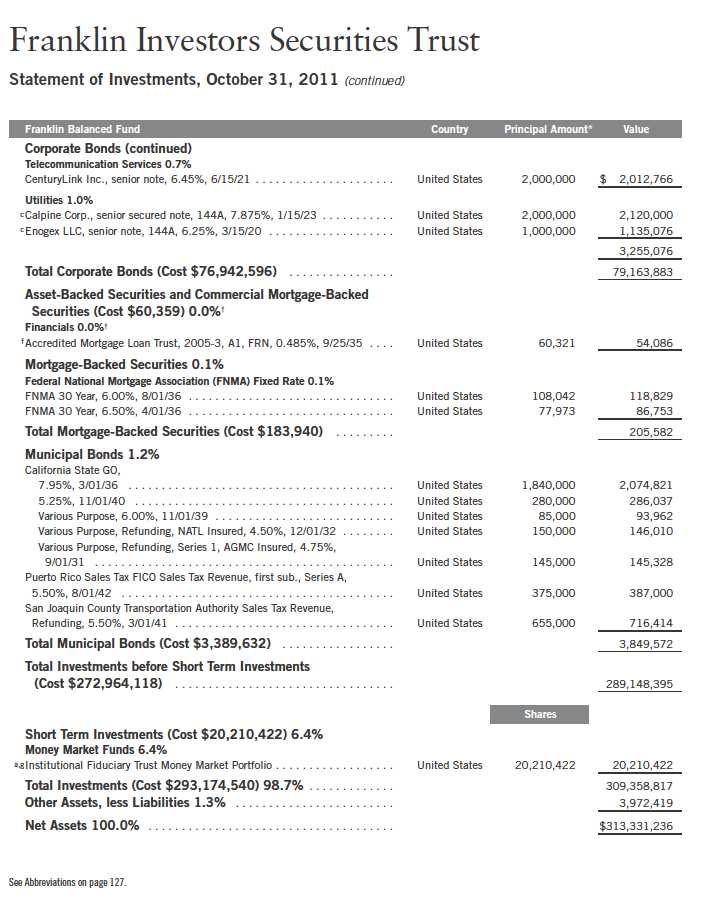
Franklin Investors Securities Trust
Statement of Investments, October 31, 2011 (continued)
64 | The accompanying notes are an integral part of these financial statements. | Annual Report
aThe amount shown for a share outstanding throughout the period may not correlate with the Statement of Operations for the period due to the timing of sales and repurchases of
the Fund shares in relation to income earned and/or fluctuating market value of the investments of the Fund.
bBased on average daily shares outstanding.
cEffective September 1, 2008, the redemption fee was eliminated.
dAmount rounds to less than $0.01 per share.
eTotal return does not reflect sales commissions or contingent deferred sales charges, if applicable.
fBenefit of expense reduction rounds to less than 0.01%.
Annual Report | The accompanying notes are an integral part of these financial statements. | 65
aThe amount shown for a share outstanding throughout the period may not correlate with the Statement of Operations for the period due to the timing of sales and repurchases of the Fund shares in relation to income earned and/or fluctuating market value of the investments of the Fund. bBased on average daily shares outstanding. cEffective September 1, 2008, the redemption fee was eliminated. dAmount rounds to less than $0.01 per share. eTotal return does not reflect sales commissions or contingent deferred sales charges, if applicable. fBenefit of expense reduction rounds to less than 0.01%.
66 | The accompanying notes are an integral part of these financial statements. | Annual Report
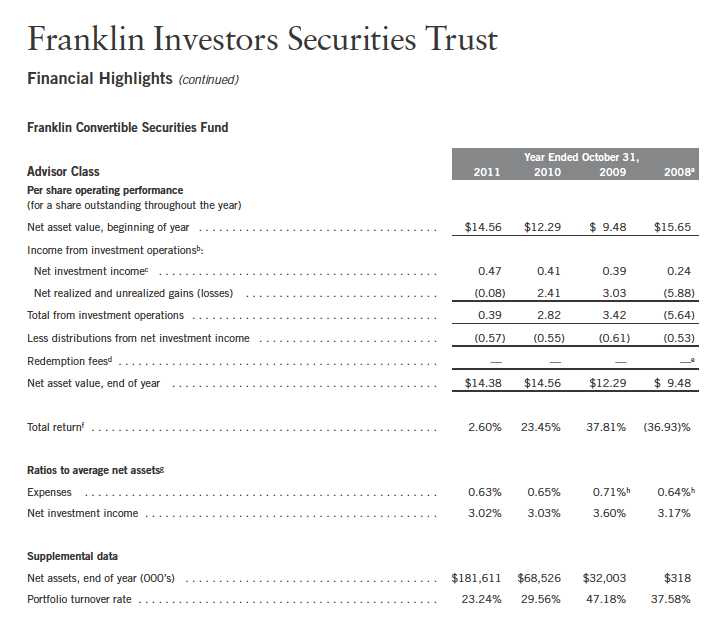
aFor the period May 15, 2008 (effective date) to October 31, 2008. bThe amount shown for a share outstanding throughout the period may not correlate with the Statement of Operations for the period due to the timing of sales and repurchases of the Fund shares in relation to income earned and/or fluctuating market value of the investments of the Fund. cBased on average daily shares outstanding. dEffective September 1, 2008, the redemption fee was eliminated. eAmount rounds to less than $0.01 per share. fTotal return is not annualized for periods less than one year. gRatios are annualized for periods less than one year. hBenefit of expense reduction rounds to less than 0.01%.
Annual Report | The accompanying notes are an integral part of these financial statements. | 67

68 | Annual Report
Annual Report | 69
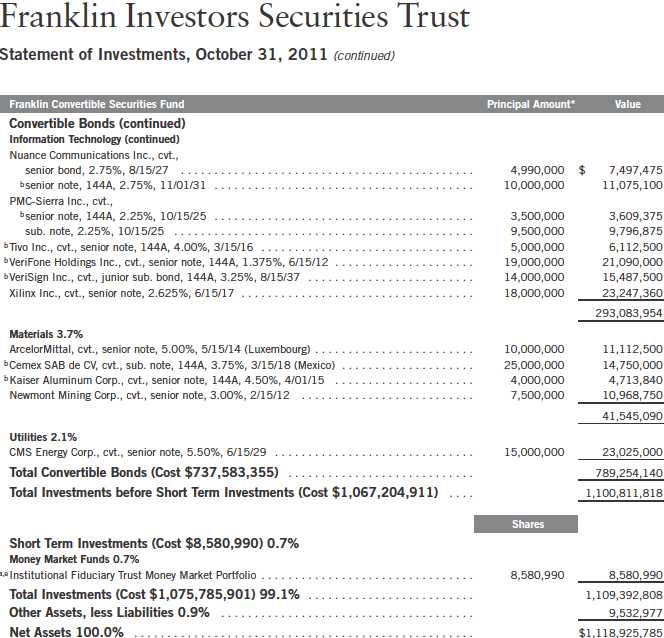
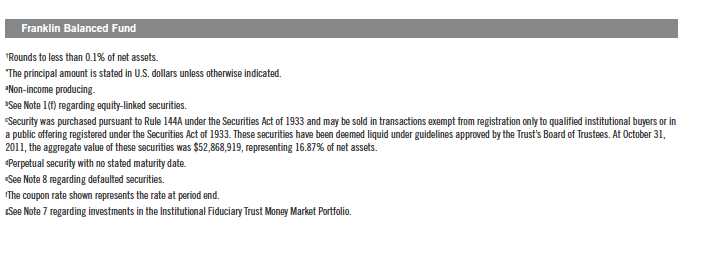
See Abbreviations on page 127.
*The principal amount is stated in U.S. dollars unless otherwise indicated.
aNon-income producing.
bSecurity was purchased pursuant to Rule 144A under the Securities Act of 1933 and may be sold in transactions exempt from registration only to qualified institutional buyers or in
a public offering registered under the Securities Act of 1933. These securities have been deemed liquid under guidelines approved by the Trust’s Board of Trustees. At October 31,
2011, the aggregate value of these securities was $316,314,434, representing 28.27% of net assets.
cSee Note 8 regarding defaulted securities.
dSee Note 9 regarding restricted securities.
eSee Note 7 regarding investments in the Institutional Fiduciary Trust Money Market Portfolio.
70 | The accompanying notes are an integral part of these financial statements. | Annual Report
| aThe amount shown for a share outstanding throughout the period may not correlate with the Statement of Operations for the period due to the timing of sales and repurchases of |
| the Fund shares in relation to income earned and/or fluctuating market value of the investments of the Fund. |
| bBased on average daily shares outstanding. |
| cEffective September 1, 2008, the redemption fee was eliminated. |
| dAmount rounds to less than $0.01 per share. |
| eTotal return does not reflect sales commissions or contingent deferred sales charges, if applicable. |
| fBenefit of expense reduction rounds to less than 0.01%. |
Annual Report | The accompanying notes are an integral part of these financial statements. | 71
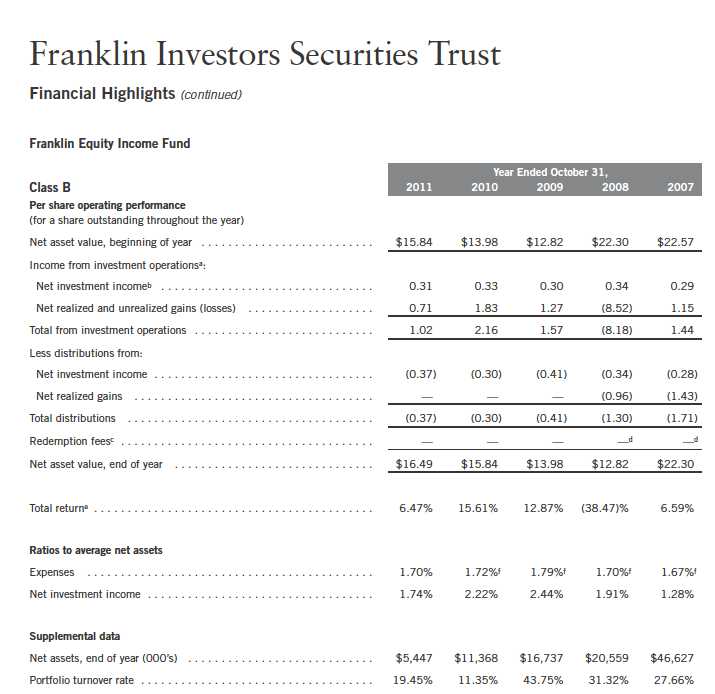
| aThe amount shown for a share outstanding throughout the period may not correlate with the Statement of Operations for the period due to the timing of sales and repurchases of |
| the Fund shares in relation to income earned and/or fluctuating market value of the investments of the Fund. |
| bBased on average daily shares outstanding. |
| cEffective September 1, 2008, the redemption fee was eliminated. |
| dAmount rounds to less than $0.01 per share. |
| eTotal return does not reflect sales commissions or contingent deferred sales charges, if applicable. |
| fBenefit of expense reduction rounds to less than 0.01%. |
72 | The accompanying notes are an integral part of these financial statements. | Annual Report
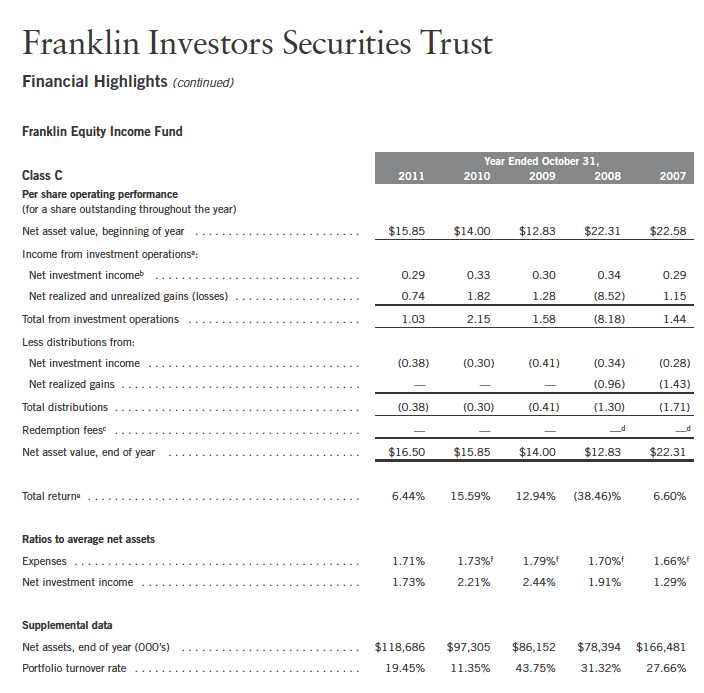
| aThe amount shown for a share outstanding throughout the period may not correlate with the Statement of Operations for the period due to the timing of sales and repurchases of |
| the Fund shares in relation to income earned and/or fluctuating market value of the investments of the Fund. |
| bBased on average daily shares outstanding. |
| cEffective September 1, 2008, the redemption fee was eliminated. |
| dAmount rounds to less than $0.01 per share. |
| eTotal return does not reflect sales commissions or contingent deferred sales charges, if applicable. |
| fBenefit of expense reduction rounds to less than 0.01%. |
Annual Report | The accompanying notes are an integral part of these financial statements. | 73
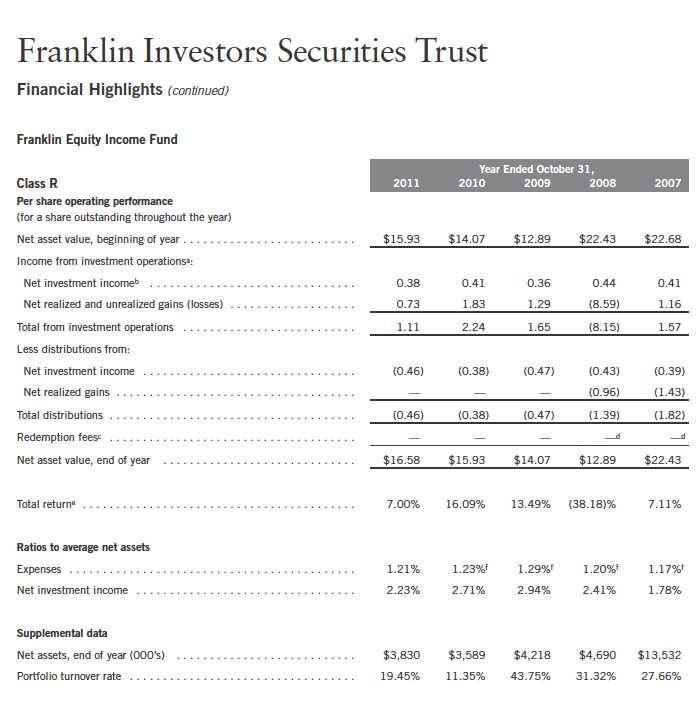
| aThe amount shown for a share outstanding throughout the period may not correlate with the Statement of Operations for the period due to the timing of sales and repurchases of |
| the Fund shares in relation to income earned and/or fluctuating market value of the investments of the Fund. |
| bBased on average daily shares outstanding. |
| cEffective September 1, 2008, the redemption fee was eliminated. |
| dAmount rounds to less than $0.01 per share. |
| eTotal return does not reflect sales commissions or contingent deferred sales charges, if applicable. |
| fBenefit of expense reduction rounds to less than 0.01%. |
74 | The accompanying notes are an integral part of these financial statements. | Annual Report
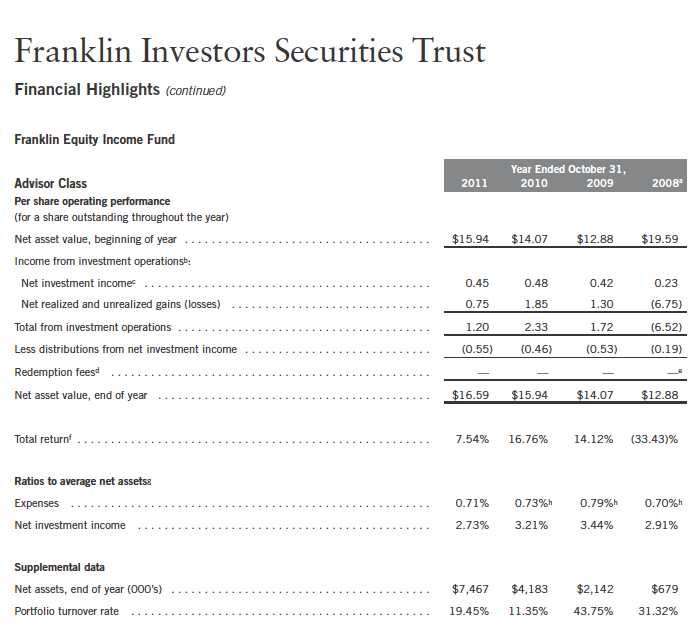
| aFor the period May 15, 2008 (effective date) to October 31, 2008. |
| bThe amount shown for a share outstanding throughout the period may not correlate with the Statement of Operations for the period due to the timing of sales and repurchases of |
| the Fund shares in relation to income earned and/or fluctuating market value of the investments of the Fund. |
| cBased on average daily shares outstanding. |
| dEffective September 1, 2008, the redemption fee was eliminated. |
| eAmount rounds to less than $0.01 per share. |
| fTotal return is not annualized for periods less than one year. |
| gRatios are annualized for periods less than one year. |
| hBenefit of expense reduction rounds to less than 0.01%. |
Annual Report | The accompanying notes are an integral part of these financial statements. | 75
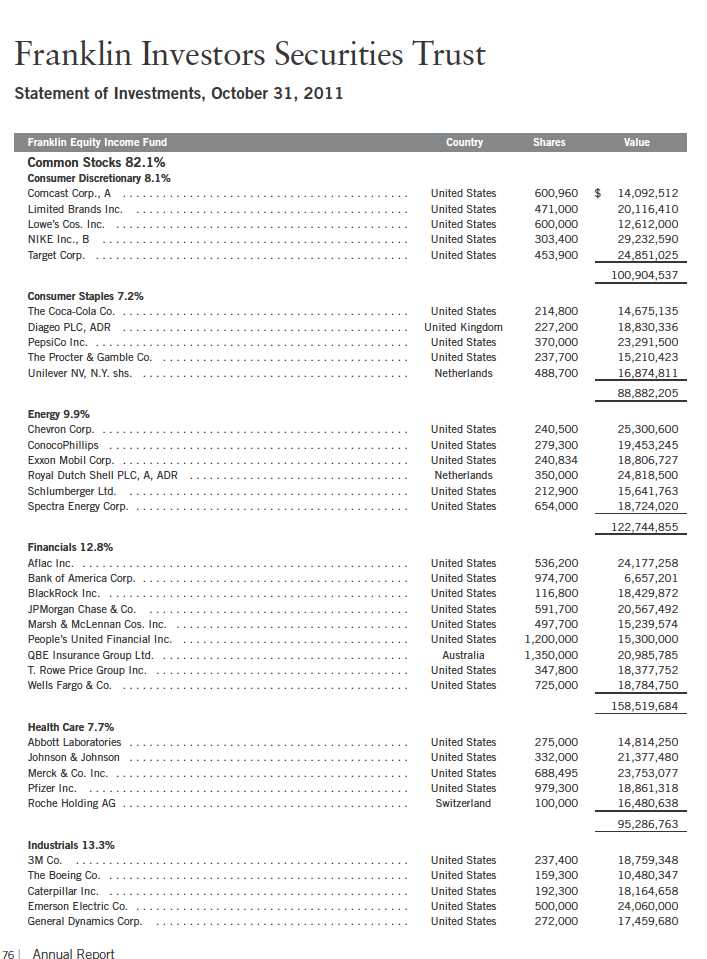

Annual Report | 77

78 | Annual Report
Annual Report | The accompanying notes are an integral part of these financial statements. | 79
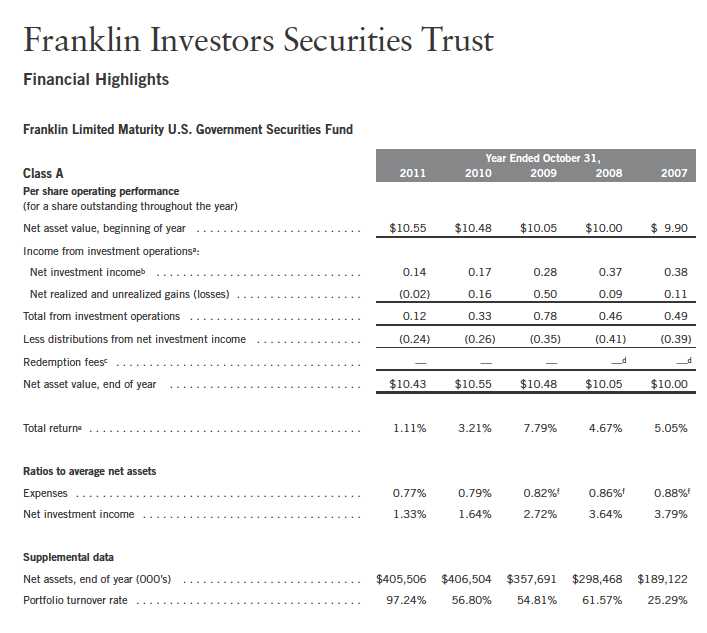
| aThe amount shown for a share outstanding throughout the period may not correlate with the Statement of Operations for the period due to the timing of sales and repurchases of |
| the Fund shares in relation to income earned and/or fluctuating market value of the investments of the Fund. |
| bBased on average daily shares outstanding. |
| cEffective September 1, 2008, the redemption fee was eliminated. |
| dAmount rounds to less than $0.01 per share. |
| eTotal return does not reflect sales commissions or contingent deferred sales charges, if applicable. |
| fBenefit of expense reduction rounds to less than 0.01%. |
80 | The accompanying notes are an integral part of these financial statements. | Annual Report
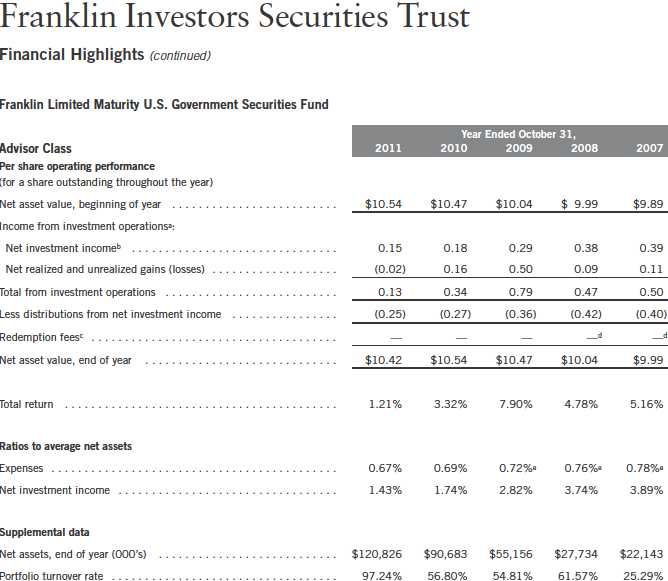
| aThe amount shown for a share outstanding throughout the period may not correlate with the Statement of Operations for the period due to the timing of sales and repurchases of |
| the Fund shares in relation to income earned and/or fluctuating market value of the investments of the Fund. |
| bBased on average daily shares outstanding. |
| cEffective September 1, 2008, the redemption fee was eliminated. |
| dAmount rounds to less than $0.01 per share. |
| eBenefit of expense reduction rounds to less than 0.01%. |
Annual Report | The accompanying notes are an integral part of these financial statements. | 81
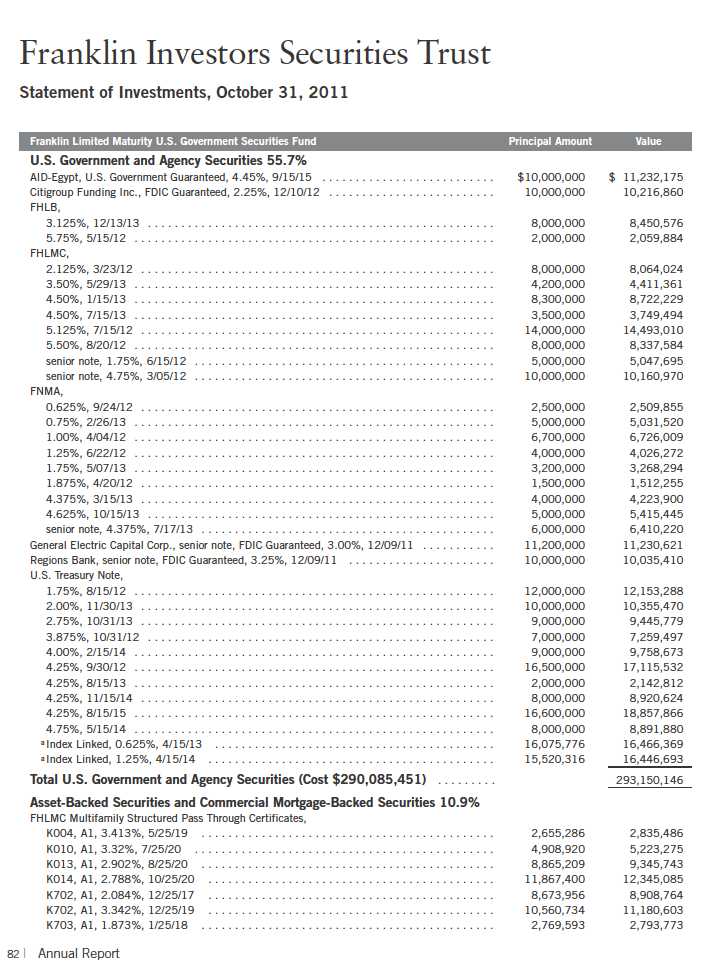
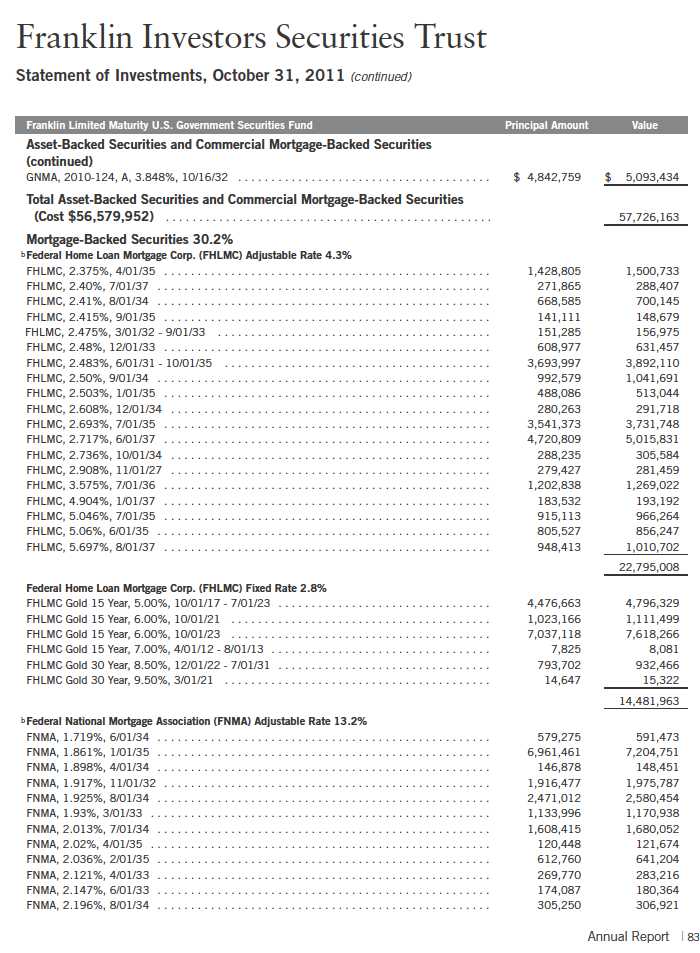
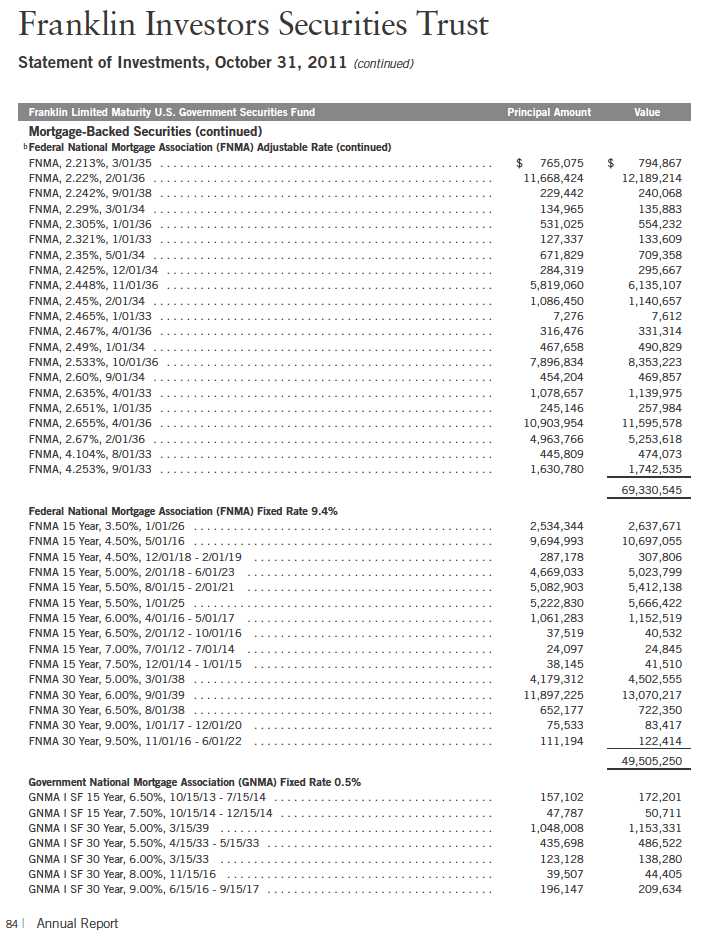
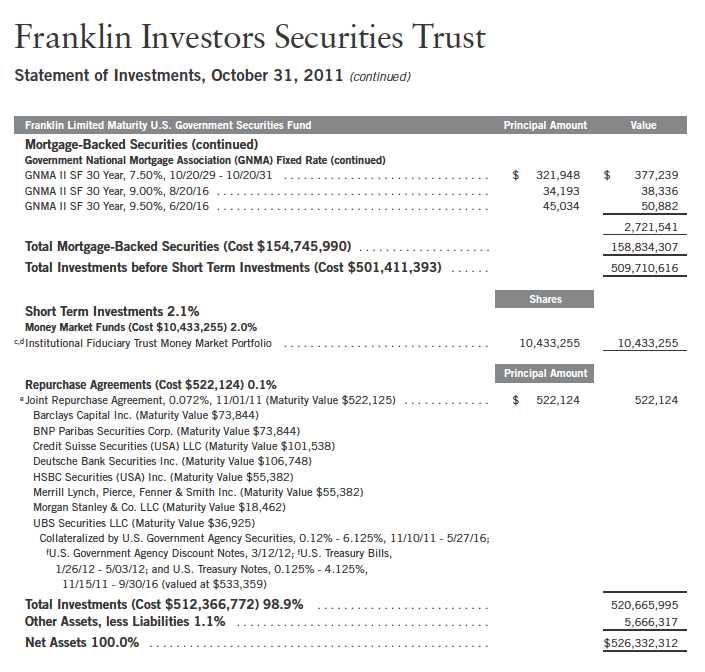
| See Abbreviations on page 127. |
| aPrincipal amount of security is adjusted for inflation. See Note 1(i). |
| bThe coupon rate shown represents the rate at period end. |
| cNon-income producing. |
| dSee Note 7 regarding investments in the Institutional Fiduciary Trust Money Market Portfolio. |
| eSee Note 1(c) regarding joint repurchase agreement. |
| fThe security is traded on a discount basis with no stated coupon rate. |
Annual Report | The accompanying notes are an integral part of these financial statements. | 85
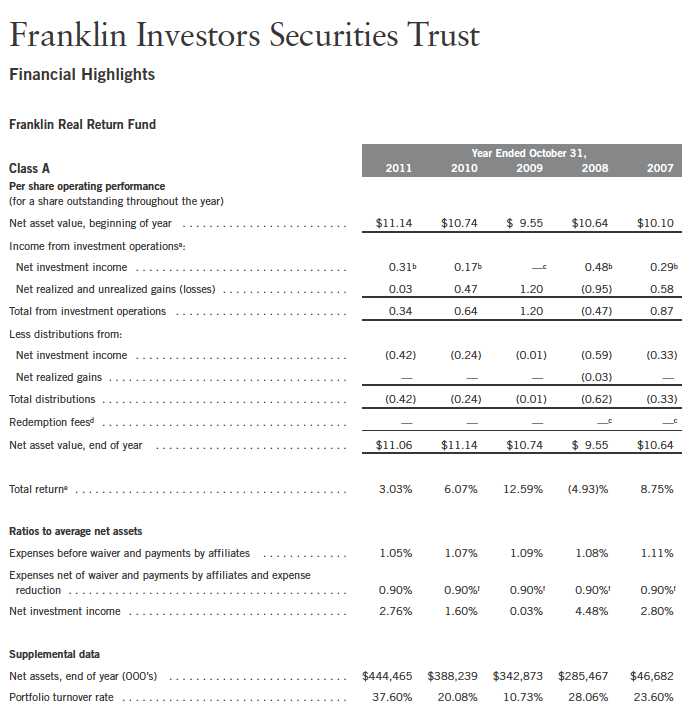
| aThe amount shown for a share outstanding throughout the period may not correlate with the Statement of Operations for the period and may fluctuate between classes due to the |
| timing of sales and repurchases of the Fund shares in relation to income earned, adjustments to interest income for the inflation-indexed bonds, and/or fluctuating market value of |
| the investments of the Fund. |
| bBased on average daily shares outstanding. |
| cAmount rounds to less than $0.01 per share. |
| dEffective September 1, 2008, the redemption fee was eliminated. |
| eTotal return does not reflect sales commissions or contingent deferred sales charges, if applicable. |
| fBenefit of expense reduction rounds to less than 0.01%. |
86 | The accompanying notes are an integral part of these financial statements. | Annual Report

| aFor the period November 3, 2008 (effective date) to October 31, 2009. |
| bThe amount shown for a share outstanding throughout the period may not correlate with the Statement of Operations for the period and may fluctuate between classes due to the |
| timing of sales and repurchases of the Fund shares in relation to income earned, adjustments to interest income for the inflation-indexed bonds, and/or fluctuating market value of |
| the investments of the Fund. |
| cBased on average daily shares outstanding. |
| dTotal return does not reflect sales commissions or contingent deferred sales charges, if applicable, and is not annualized for periods less than one year. |
| eRatios are annualized for periods less than one year. |
| fBenefit of expense reduction rounds to less than 0.01%. |
| gRatio is calculated based on the Fund level net investment income, as reflected on the Statement of Operations, and adjusted for class specific expenses. The amount may not cor- |
| relate with the per share amount due to the timing of income earned and/or fluctuating market value of the investments of the Fund in relation to the timing of sales and |
| repurchases of Fund shares. |
Annual Report | The accompanying notes are an integral part of these financial statements. | 87

| aThe amount shown for a share outstanding throughout the period may not correlate with the Statement of Operations for the period and may fluctuate between classes due to the |
| timing of sales and repurchases of the Fund shares in relation to income earned, adjustments to interest income for the inflation-indexed bonds, and/or fluctuating market value of |
| the investments of the Fund. |
| bBased on average daily shares outstanding. |
| cEffective September 1, 2008, the redemption fee was eliminated. |
| dAmount rounds to less than $0.01 per share. |
| eBenefit of expense reduction rounds to less than 0.01%. |
| 88 | The accompanying notes are an integral part of these financial statements. | Annual Report |
Annual Report | 89
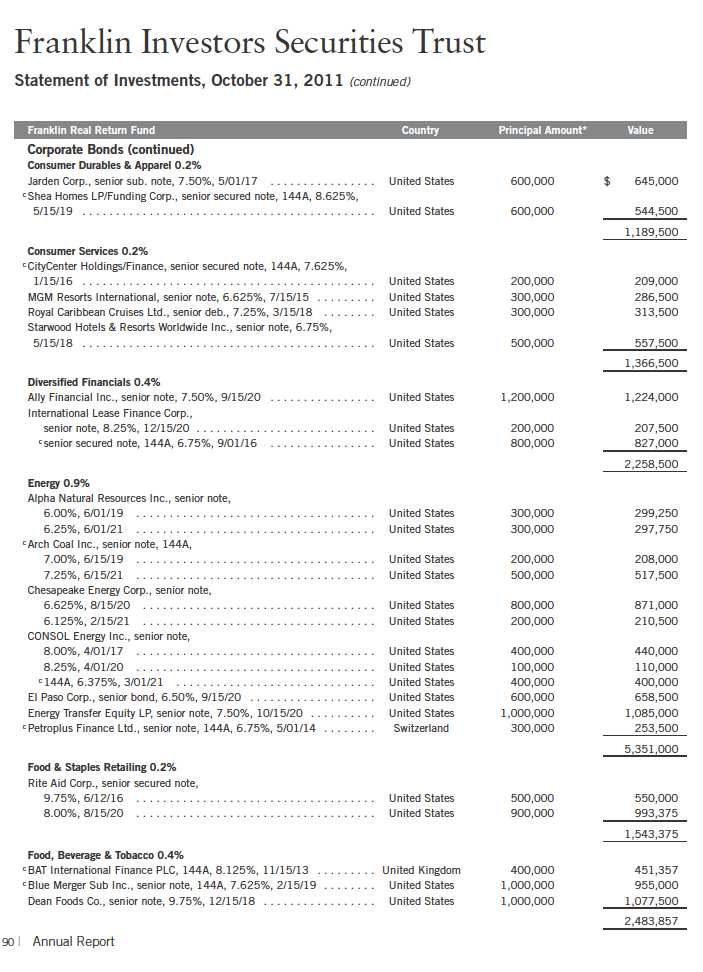
| Franklin Investors Securities Trust | ||||
| Statement of Investments, October 31, 2011 (continued) | ||||
| Franklin Real Return Fund | Country | Principal Amount* | Value | |
| Corporate Bonds (continued) | ||||
| Health Care Equipment & Services 0.1% | ||||
| DaVita Inc., senior note, 6.375%, 11/01/18 | United States | 200,000 | $ | 202,500 |
| c Fresenius US Finance II, senior note, 144A, 9.00%, 7/15/15 | Germany | 100,000 | 113,500 | |
| 316,000 | ||||
| Materials 0.6% | ||||
| c FMG Resources August 2006 Pty. Ltd., senior note, 144A, | ||||
| 7.00%, 11/01/15 | Australia | 200,000 | 200,750 | |
| 6.875%, 2/01/18 | Australia | 800,000 | 772,000 | |
| d NewPage Corp., senior secured note, 11.375%, 12/31/14 | United States | 600,000 | 451,500 | |
| Novelis Inc., senior note, | ||||
| 8.375%, 12/15/17 | Canada | 200,000 | 218,000 | |
| 8.75%, 12/15/20 | Canada | 600,000 | 657,000 | |
| c Reynolds Group Issuer Inc./LLC/SA, senior note, 144A, 8.75%, | ||||
| 5/15/18 | United States | 1,200,000 | 1,167,000 | |
| 3,466,250 | ||||
| Media 0.6% | ||||
| CCO Holdings LLC/Capital Corp., senior note, | ||||
| 8.125%, 4/30/20 | United States | 1,000,000 | 1,087,500 | |
| 6.50%, 4/30/21 | United States | 200,000 | 201,000 | |
| DISH DBS Corp., senior note, 7.125%, 2/01/16 | United States | 1,200,000 | 1,281,000 | |
| c Univision Communications Inc., senior secured note, 144A, | ||||
| 6.875%, 5/15/19 | United States | 900,000 | 882,000 | |
| 7.875%, 11/01/20 | United States | 100,000 | 101,500 | |
| 3,553,000 | ||||
| Pharmaceuticals, Biotechnology & Life Sciences 0.3% | ||||
| c Giant Funding Corp., senior note, 144A, 8.25%, 2/01/18 | Spain | 400,000 | 423,000 | |
| c Mylan Inc., senior note, 144A, 7.875%, 7/15/20 | United States | 1,200,000 | 1,350,000 | |
| 1,773,000 | ||||
| Software & Services 0.2% | ||||
| SunGard Data Systems Inc., | ||||
| senior note, 7.625%, 11/15/20 | United States | 400,000 | 412,000 | |
| senior secured note, 4.875%, 1/15/14 | United States | 600,000 | 606,000 | |
| 1,018,000 | ||||
| Technology Hardware & Equipment 0.1% | ||||
| c CommScope Inc., senior note, 144A, 8.25%, 1/15/19 | United States | 400,000 | 396,000 | |
| Telecommunication Services 0.2% | ||||
| Frontier Communications Corp., senior note, | ||||
| 8.25%, 4/15/17 | United States | 100,000 | 107,250 | |
| 8.50%, 4/15/20 | United States | 900,000 | 963,000 | |
| 8.75%, 4/15/22 | United States | 200,000 | 213,000 | |
| 1,283,250 | ||||
Annual Report | 91
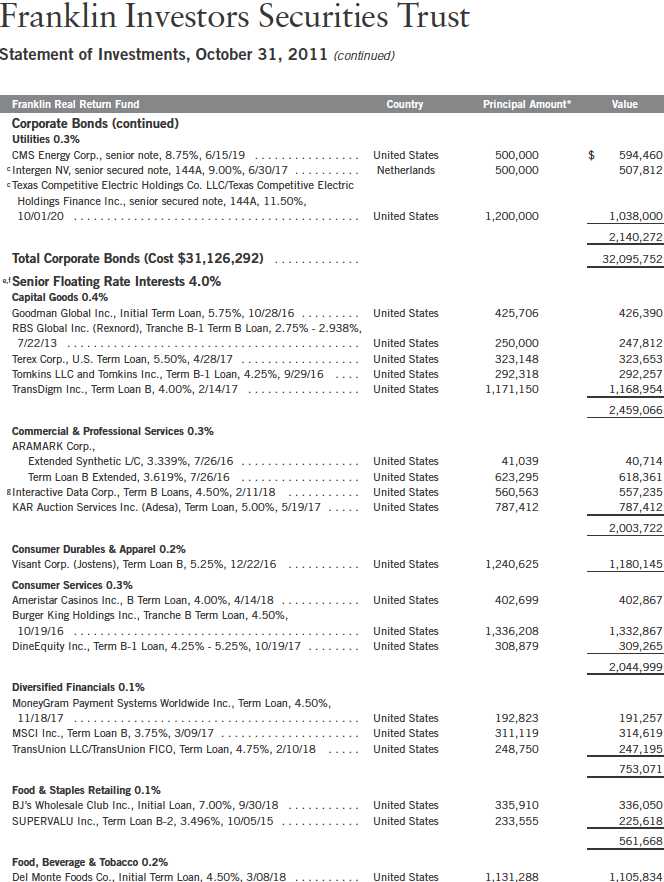
92 | Annual Report
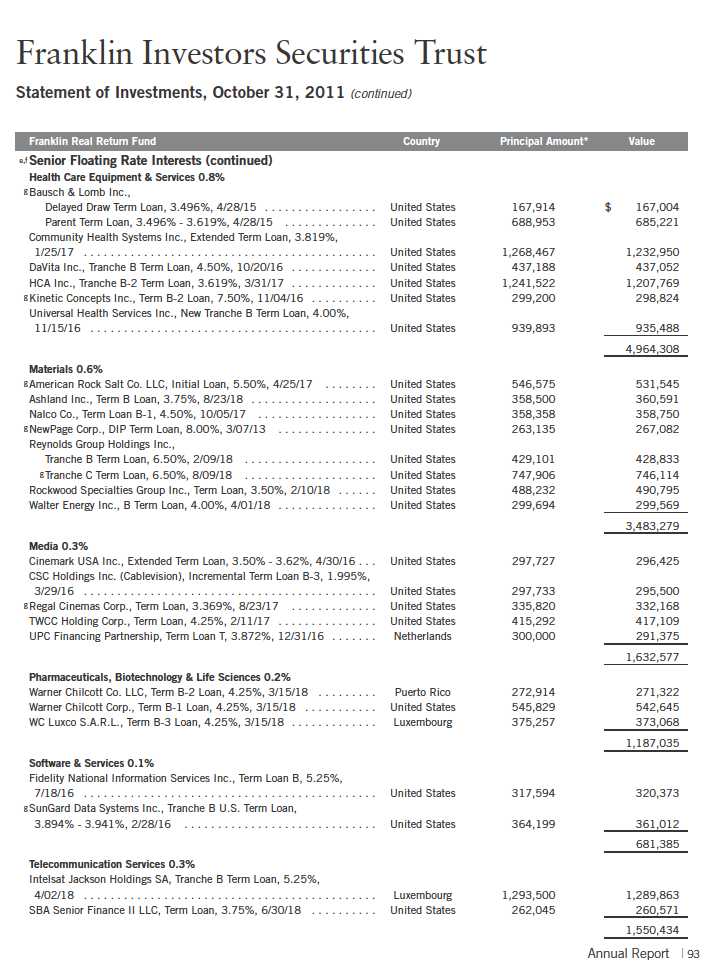
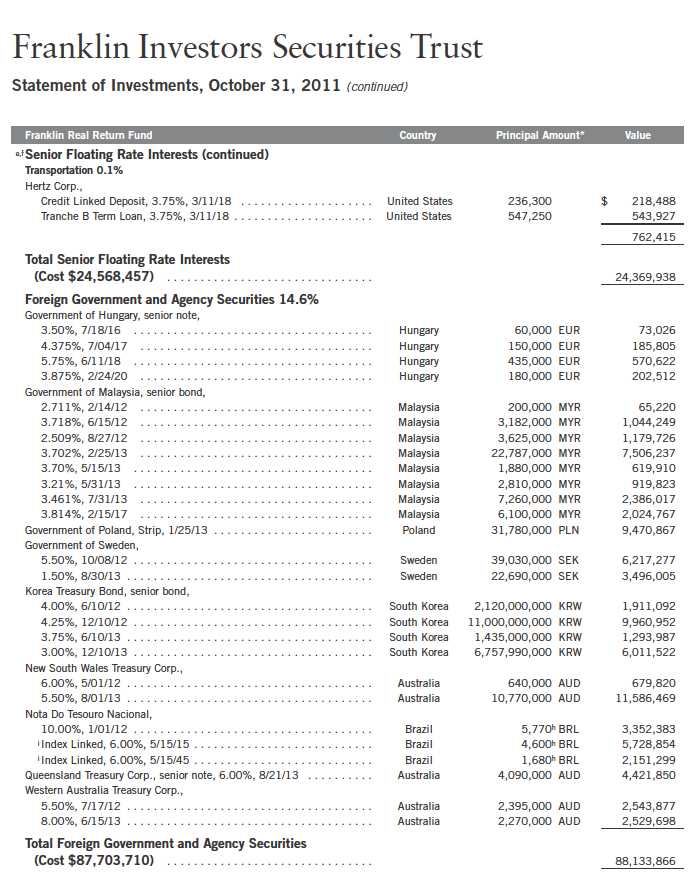
94 | Annual Report
Franklin Investors Securities Trust
Statement of Investments, October 31, 2011 (continued)
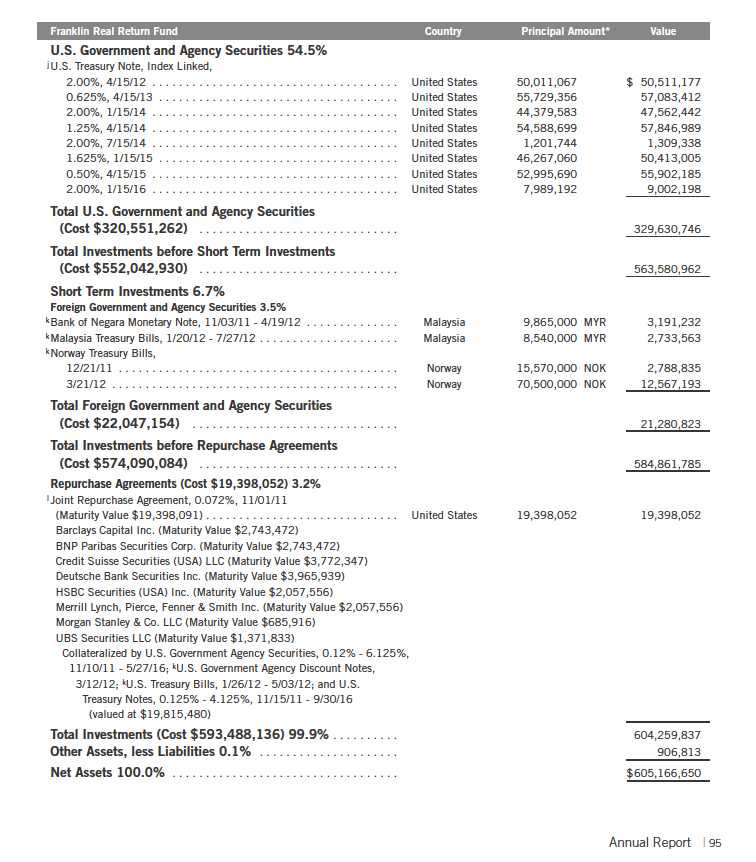
Franklin Investors Securities Trust
Statement of Investments, October 31, 2011 (continued)
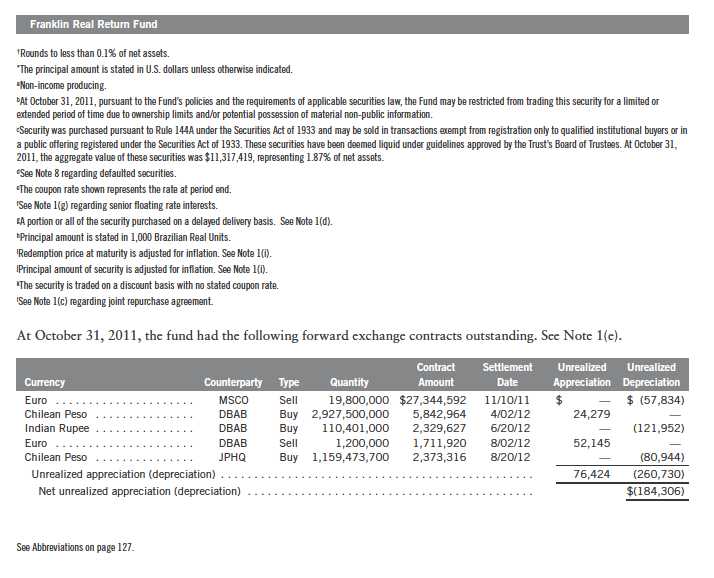
96 | The accompanying notes are an integral part of these financial statements. | Annual Report
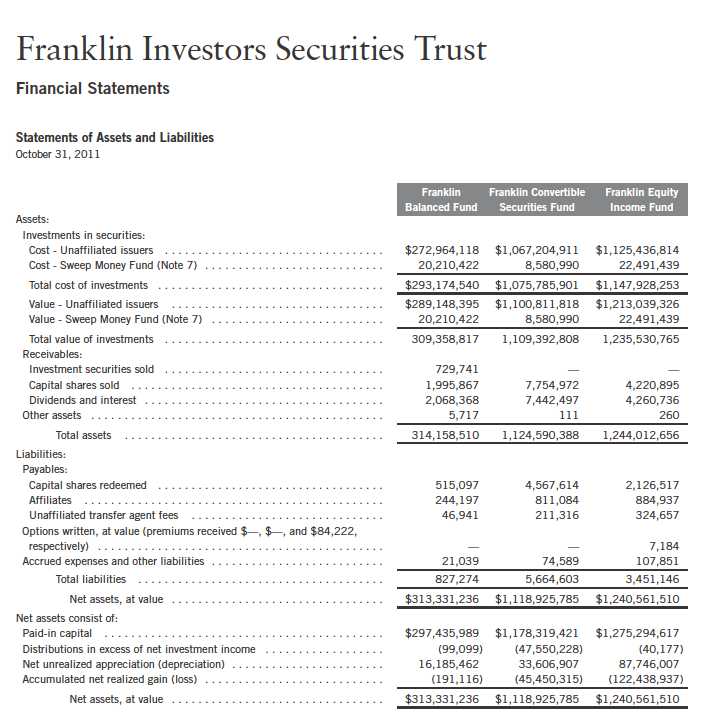
Annual Report | The accompanying notes are an integral part of these financial statements. | 97
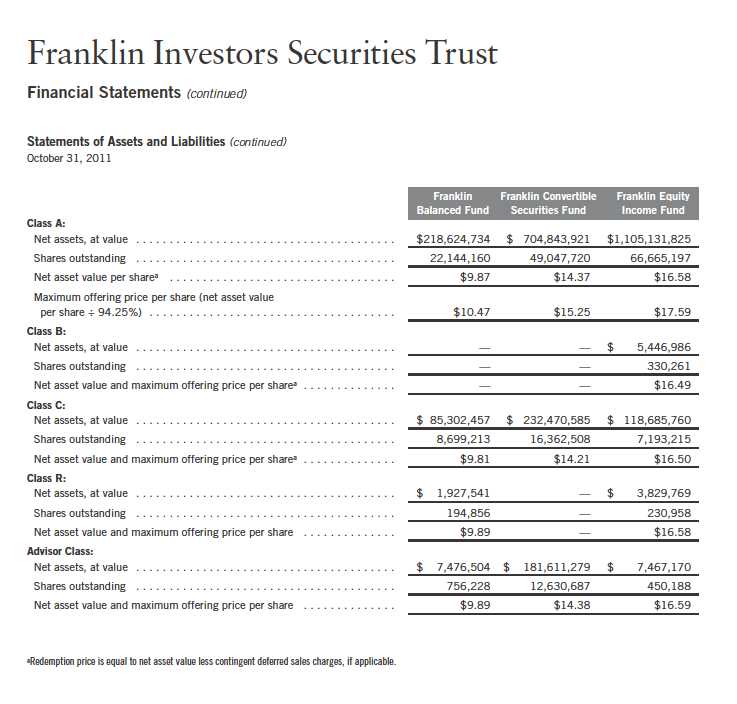
98 | The accompanying notes are an integral part of these financial statements. | Annual Report
Annual Report | The accompanying notes are an integral part of these financial statements. | 99
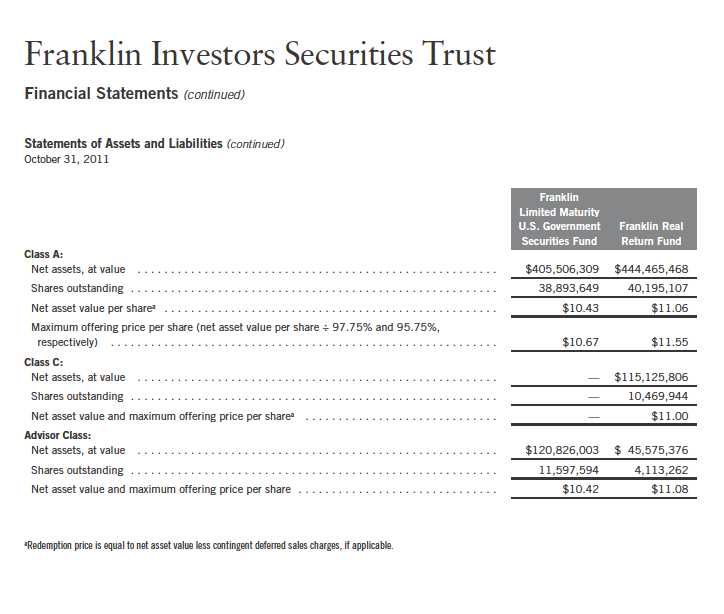
100 | The accompanying notes are an integral part of these financial statements. | Annual Report
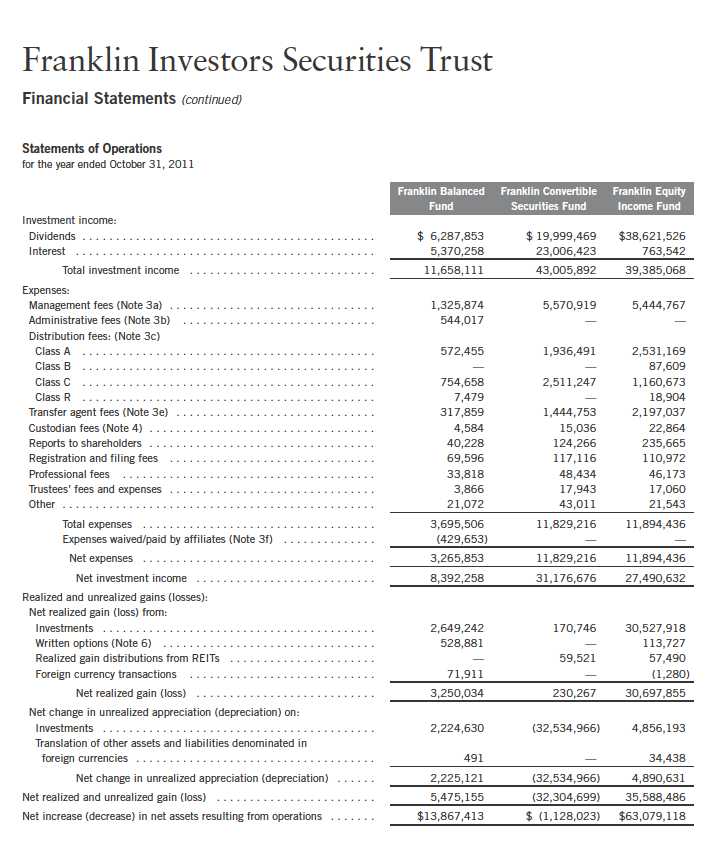
Annual Report | The accompanying notes are an integral part of these financial statements. | 101
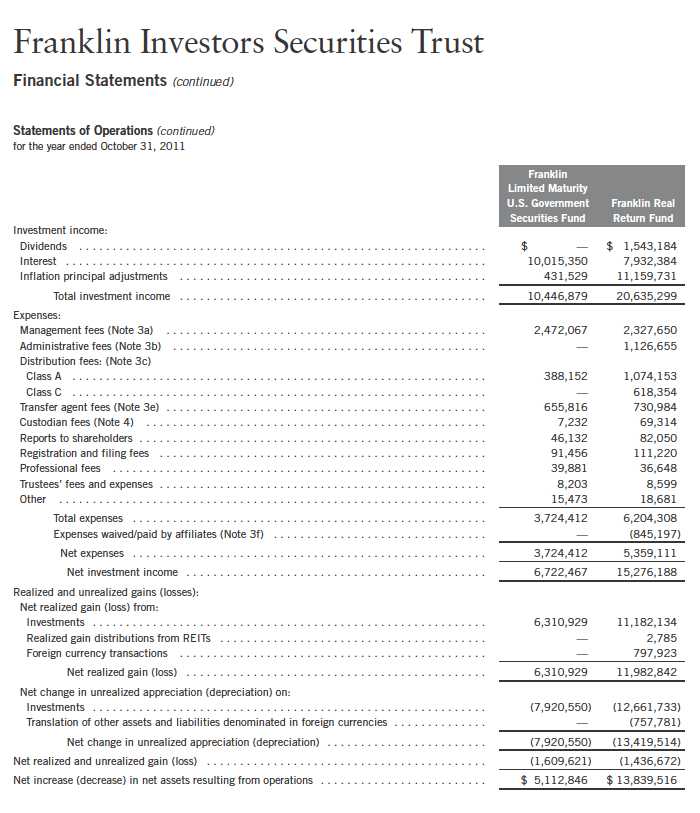
102 | The accompanying notes are an integral part of these financial statements. | Annual Report
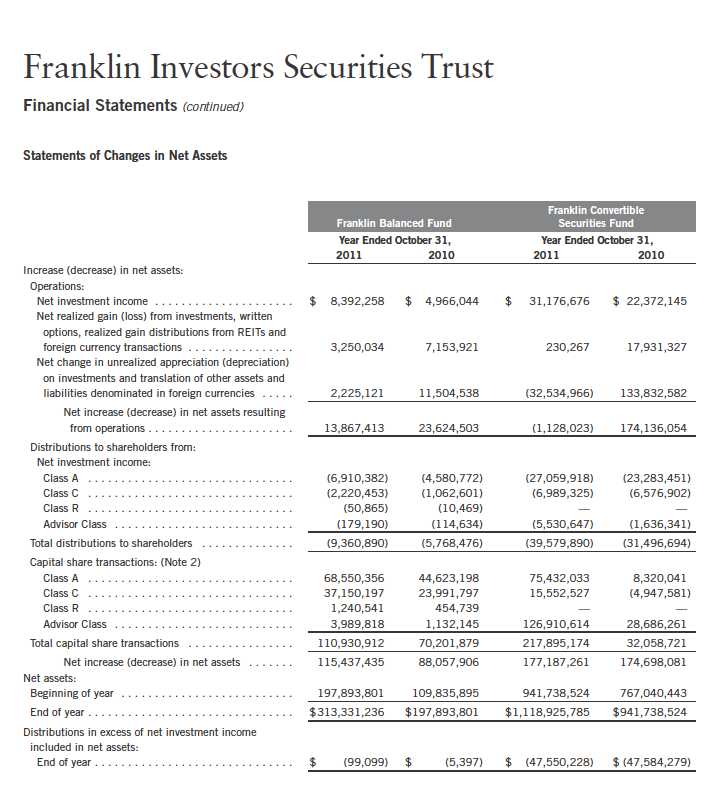
Annual Report | The accompanying notes are an integral part of these financial statements. | 103

104 | The accompanying notes are an integral part of these financial statements. | Annual Report
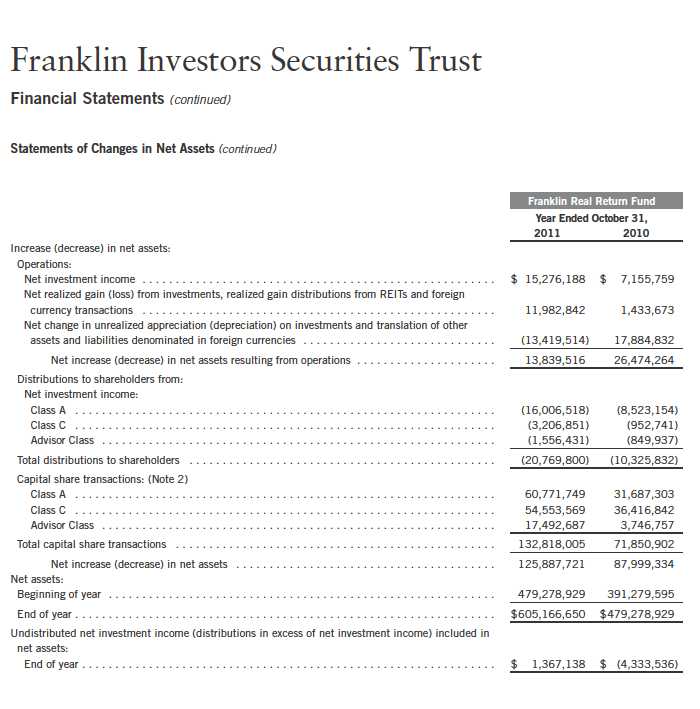
Annual Report | The accompanying notes are an integral part of these financial statements. | 105
Franklin Investors Securities Trust
Notes to Financial Statements
1. ORGANIZATION AND SIGNIFICANT ACCOUNTING POLICIES
Franklin Investors Securities Trust (Trust) is registered under the Investment Company Act of 1940, as amended, (1940 Act) as an open-end investment company, consisting of nine separate funds, five of which are included in this report (Funds). The financial statements of the remaining funds in the Trust are presented separately. The classes of shares offered within each of the Funds are indicated below. Each class of shares differs by its initial sales load, contingent deferred sales charges, distribution fees, voting rights on matters affecting a single class and its exchange privilege.

The following summarizes the Funds’ significant accounting policies.
a. Financial Instrument Valuation
The Funds’ investments in securities and other financial instruments are carried at fair value daily. Fair value is the price that would be received to sell an asset or paid to transfer a liability in an orderly transaction between market participants on the measurement date. Under procedures approved by the Trust’s Board of Trustees, the Funds may utilize independent pricing services, quotations from securities and financial instrument dealers, and other market sources to determine fair value.
Equity securities, exchange traded funds, and derivative financial instruments (derivatives) listed on an exchange or on the NASDAQ National Market System are valued at the last quoted sale price or the official closing price of the day, respectively. Foreign equity securities are valued as of the close of trading on the foreign stock exchange on which the security is primarily traded, or the NYSE, whichever is earlier. The value is then converted into its U.S. dollar equivalent at the foreign exchange rate in effect at the close of the NYSE on the day that the value of the security is determined. Over-the-counter securities are valued within the range of the most recent quoted bid and ask prices. Securities that trade in multiple markets or on multiple exchanges are valued according to the broadest and most representative market. Certain equity securities are valued based upon fundamental characteristics or relationships to similar securities. Investments in open-end mutual funds are valued at the closing net asset value.
Debt and certain preferred securities generally trade in the over-the-counter market rather than on a securities exchange. The Funds’ pricing services use multiple valuation techniques to determine fair value. In instances where sufficient market activity exists, the pricing services may utilize a market-based approach through which quotes from market makers are used to determine fair value. In instances where sufficient market activity may not exist or is limited, the
106 | Annual Report
Franklin Investors Securities Trust
Notes to Financial Statements (continued)
| 1. | ORGANIZATION AND SIGNIFICANT ACCOUNTING POLICIES (continued) |
| a. | Financial Instrument Valuation (continued) |
pricing services also utilize proprietary valuation models which may consider market characteristics such as benchmark yield curves, option-adjusted spreads, credit spreads, estimated default rates, coupon rates, anticipated timing of principal repayments, underlying collateral, and other unique security features in order to estimate the relevant cash flows, which are then discounted to calculate the fair value. Securities denominated in a foreign currency are converted into their U.S. dollar equivalent at the foreign exchange rate in effect at the close of the NYSE on the date that the values of the foreign debt securities are determined. Repurchase agreements are valued at cost, which approximates market value.
Certain derivatives trade in the over-the-counter market. The Funds’ pricing services use various techniques including industry standard option pricing models and proprietary discounted cash flow models to determine the fair value of those instruments. The Funds’ net benefit or obligation under the derivative contract, as measured by the fair market value of the contract, is included in net assets.
The Funds have procedures to determine the fair value of securities and other financial instruments for which market prices are not readily available or which may not be reliably priced. Under these procedures, the Funds primarily employ a market-based approach which may use related or comparable assets or liabilities, recent transactions, market multiples, book values, and other relevant information for the investment to determine the fair value of the investment. The Funds may also use an income-based valuation approach in which the anticipated future cash flows of the investment are discounted to calculate fair value. Discounts may also be applied due to the nature or duration of any restrictions on the disposition of the investments. Due to the inherent uncertainty of valuations of such investments, the fair values may differ significantly from the values that would have been used had an active market existed.
Trading in securities on foreign securities stock exchanges and over-the-counter markets may be completed before the daily close of business on the NYSE. Occasionally, events occur between the time at which trading in a foreign security is completed and the close of the NYSE that might call into question the reliability of the value of a portfolio security held by the fund. As a result, differences may arise between the value of the Funds’ portfolio securities as determined at the foreign market close and the latest indications of value at the close of the NYSE. In order to minimize the potential for these differences, the investment manager monitors price movements following the close of trading in foreign stock markets through a series of country specific market proxies (such as baskets of American Depositary Receipts, futures contracts and exchange traded funds). These price movements are measured against established trigger thresholds for each specific market proxy to assist in determining if an event has occurred that may call into question the reliability of the values of the foreign securities held by the Funds. If such an event occurs, the securities may be valued using fair value procedures, which may include the use of independent pricing services.
Annual Report | 107
Franklin Investors Securities Trust
Notes to Financial Statements (continued)
| 1. | ORGANIZATION AND SIGNIFICANT ACCOUNTING POLICIES (continued) |
| b. | Foreign Currency Translation |
Portfolio securities and other assets and liabilities denominated in foreign currencies are translated into U.S. dollars based on the exchange rate of such currencies against U.S. dollars on the date of valuation. The Funds may enter into foreign currency exchange contracts to facilitate transactions denominated in a foreign currency. Purchases and sales of securities, income and expense items denominated in foreign currencies are translated into U.S. dollars at the exchange rate in effect on the transaction date. Portfolio securities and assets and liabilities denominated in foreign currencies contain risks that those currencies will decline in value relative to the U.S. dollar. Occasionally, events may impact the availability or reliability of foreign exchange rates used to convert the U.S. dollar equivalent value. If such an event occurs, the foreign exchange rate will be valued at fair value using procedures established and approved by the Trust’s Board of Trustees.
The Funds do not separately report the effect of changes in foreign exchange rates from changes in market prices on securities held. Such changes are included in net realized and unrealized gain or loss from investments on the Statement of Operations.
Realized foreign exchange gains or losses arise from sales of foreign currencies, currency gains or losses realized between the trade and settlement dates on securities transactions and the difference between the recorded amounts of dividends, interest, and foreign withholding taxes and the U.S. dollar equivalent of the amounts actually received or paid. Net unrealized foreign exchange gains and losses arise from changes in foreign exchange rates on foreign denominated assets and liabilities other than investments in securities held at the end of the reporting period.
c. Joint Repurchase Agreement
Certain funds enter into a joint repurchase agreement whereby their uninvested cash balance is deposited into a joint cash account with other funds managed by the investment manager or an affiliate of the investment manager and is used to invest in one or more repurchase agreements. The value and face amount of the joint repurchase agreement are allocated to the funds based on their pro-rata interest. A repurchase agreement is accounted for as a loan by the fund to the seller, collateralized by securities which are delivered to the fund’s custodian. The market value, including accrued interest, of the initial collateralization is required to be at least 102% of the dollar amount invested by the funds, with the value of the underlying securities marked to market daily to maintain coverage of at least 100%. The joint repurchase agreement held by the Funds at year end had been entered into on October 31, 2011.
d. Securities Purchased on a Delayed Delivery Basis
Certain funds purchase securities on a delayed delivery basis, with payment and delivery scheduled for a future date. These transactions are subject to market fluctuations and are subject to the risk that the value at delivery may be more or less than the trade date purchase price. Although the Funds will generally purchase these securities with the intention of holding the securities, they may sell the securities before the settlement date. Sufficient assets have been segregated for these securities.
108 | Annual Report
Franklin Investors Securities Trust
Notes to Financial Statements (continued)
| 1. | ORGANIZATION AND SIGNIFICANT ACCOUNTING POLICIES (continued) |
| e. | Derivative Financial Instruments |
The Franklin Balanced Fund, the Franklin Equity Income Fund, and the Franklin Real Return Fund invested in derivatives in order to manage risk or gain exposure to various other investments or markets. Derivatives are financial contracts based on an underlying or notional amount, require no initial investment or an initial net investment that is smaller than would normally be required to have a similar response to changes in market factors, and require or permit net settlement. Derivatives contain various risks including the potential inability of the counter-party to fulfill their obligations under the terms of the contract, the potential for an illiquid secondary market, and/or the potential for market movements which expose the fund to gains or losses in excess of the amounts shown on the Statement of Assets and Liabilities. Realized gain and loss and unrealized appreciation and depreciation on these contracts for the period are included in the Statements of Operations.
The Franklin Real Return Fund entered into forward exchange contracts primarily to manage and/or gain exposure to certain foreign currencies. A forward exchange contract is an agreement between the fund and a counterparty to buy or sell a foreign currency for a specific exchange rate on a future date. Pursuant to the terms of the forward exchange contracts, cash or securities may be required to be deposited as collateral. Unrestricted cash may be invested according to the funds’ investment objectives.
The Franklin Balanced Fund and the Franklin Equity Income Fund purchased or wrote option contracts primarily to manage and/or gain exposure to equity price risk. An option is a contract entitling the holder to purchase or sell a specific amount of shares or units of an asset or notional amount of a swap (swaption), at a specified price. Options purchased are recorded as an asset while options written are recorded as a liability. Upon exercise of an option, the acquisition cost or sales proceeds of the security is adjusted by any premium paid or received. Upon expiration of an option, any premium paid or received is recorded as a realized loss or gain. Upon closing an option other than through expiration or exercise, the difference between the premium and the cost to close the position is recorded as a realized gain or loss. Pursuant to the terms of the written option contract, cash or securities may be required to be deposited as collateral.
See Notes 6 and 10 regarding investment transactions and other derivative information, respectively.
f. Equity-Linked Securities
The Franklin Balanced Fund and the Franklin Equity Income Fund invest in equity-linked securities. Equity-linked securities are hybrid financial instruments that generally combine both debt and equity characteristics into a single note form. Income received from equity linked securities is recorded as realized gains in the Statement of Operations and may be based on the performance of an underlying equity security, an equity index, or an option position. The risks of investing in equity-linked securities include unfavorable price movements in the underlying security and the
Annual Report | 109
Franklin Investors Securities Trust
Notes to Financial Statements (continued)
| 1. | ORGANIZATION AND SIGNIFICANT ACCOUNTING POLICIES (continued) |
| f. | Equity-Linked Securities (continued) |
credit risk of the issuing financial institution. There may be no guarantee of a return of principal with equity linked securities and the appreciation potential may be limited. Equity-linked securities may be more volatile and less liquid than other investments held by the fund.
g. Senior Floating Rate Interests
The Franklin Real Return Fund invests in senior secured corporate loans that pay interest at rates which are periodically reset by reference to a base lending rate plus a spread. These base lending rates are generally the prime rate offered by a designated U.S. bank or the London InterBank Offered Rate (LIBOR). Senior secured corporate loans often require prepayment of principal from excess cash flows or at the discretion of the borrower. As a result, actual maturity may be substantially less than the stated maturity.
Senior secured corporate loans in which the fund invests are generally readily marketable, but may be subject to some restrictions on resale.
h. Income Taxes
It is each fund’s policy to qualify as a regulated investment company under the Internal Revenue Code. Each fund intends to distribute to shareholders substantially all of its taxable income and net realized gains to relieve it from federal income and excise taxes. As a result, no provision for U.S. federal income taxes is required. Each fund files U.S. income tax returns as well as tax returns in certain other jurisdictions. Each fund records a provision for taxes in its financial statements including penalties and interest, if any, for a tax position taken on a tax return (or expected to be taken) when it fails to meet the more likely than not (a greater than 50% probability) threshold and based on the technical merits, the tax position may not be sustained upon examination by the tax authorities. As of October 31, 2011, and for all open tax years, each fund has determined that no provision for income tax is required in each fund’s financial statements. Open tax years are those that remain subject to examination and are based on each tax jurisdiction statute of limitation.
The Funds may be subject to foreign taxation related to income received, capital gains on the sale of securities and certain foreign currency transactions in the foreign jurisdictions in which it invests. Foreign taxes, if any, are recorded based on the tax regulations and rates that exist in the foreign markets in which the Funds invest. When a capital gain tax is determined to apply the Funds record an estimated deferred tax liability for unrealized gains on these securities in an amount that would be payable if the securities were disposed of on the valuation date.
i. Security Transactions, Investment Income, Expenses and Distributions
Security transactions are accounted for on trade date. Realized gains and losses on security transactions are determined on a specific identification basis. Interest income and estimated expenses are accrued daily. Amortization of premium and accretion of discount on debt securities
110 | Annual Report
Franklin Investors Securities Trust
Notes to Financial Statements (continued)
| 1. | ORGANIZATION AND SIGNIFICANT ACCOUNTING POLICIES (continued) |
| i. | Security Transactions, Investment Income, Expenses and Distributions (continued) |
are included in interest income. Facility fees are recognized as income over the expected term of the loan. Dividend income is recorded on the ex-dividend date except that certain dividends from foreign securities are recognized as soon as the Funds are notified of the ex-dividend date. Distributions to shareholders are recorded on the ex-dividend date and are determined according to income tax regulations (tax basis). Distributable earnings determined on a tax basis may differ from earnings recorded in accordance with accounting principles generally accepted in the United States of America. These differences may be permanent or temporary. Permanent differences are reclassified among capital accounts to reflect their tax character. These reclassifications have no impact on net assets or the results of operations. Temporary differences are not reclassified, as they may reverse in subsequent periods.
Common expenses incurred by the Trust are allocated among the funds based on the ratio of net assets of each fund to the combined net assets of the Trust. Fund specific expenses are charged directly to the fund that incurred the expense.
Realized and unrealized gains and losses and net investment income, not including class specific expenses, are allocated daily to each class of shares based upon the relative proportion of net assets of each class. Differences in per share distributions, by class, are generally due to differences in class specific expenses.
Inflation-indexed bonds are adjusted for inflation through periodic increases or decreases in the security’s interest accruals, face amount, or principal redemption value, by amounts corresponding to the rate of inflation as measured by an index. Any increase or decrease in the face amount or principal redemption value will be included as inflation principal adjustments on the Statements of Operations.
j. Accounting Estimates
The preparation of financial statements in accordance with accounting principles generally accepted in the United States of America requires management to make estimates and assumptions that affect the reported amounts of assets and liabilities at the date of the financial statements and the amounts of income and expenses during the reporting period. Actual results could differ from those estimates.
k. Guarantees and Indemnifications
Under the Trust’s organizational documents, its officers and trustees are indemnified by the Trust against certain liabilities arising out of the performance of their duties to the Trust. Additionally, in the normal course of business, the Trust, on behalf of the Funds, enters into contracts with service providers that contain general indemnification clauses. The Trust’s maximum exposure under these arrangements is unknown as this would involve future claims that may be made against the Trust that have not yet occurred. Currently, the Trust expects the risk of loss to be remote.
Annual Report | 111
Franklin Investors Securities Trust
Notes to Financial Statements (continued)
2. SHARES OF BENEFICIAL INTEREST
At October 31, 2011, there were an unlimited number of shares authorized (without par value).
Transactions in the Funds’ shares were as follows:
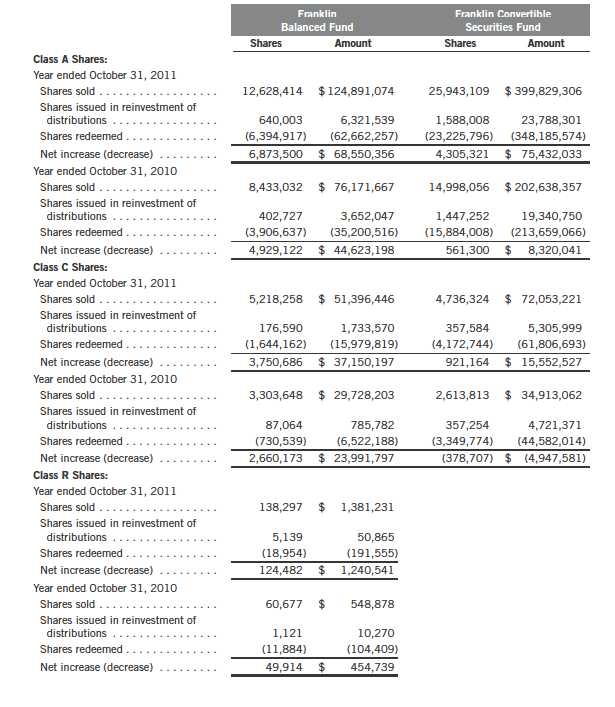
| 112 | | | Annual Report |
Franklin Investors Securities Trust
Notes to Financial Statements (continued)
2. SHARES OF BENEFICIAL INTEREST (continued)

Franklin Investors Securities Trust
Notes to Financial Statements (continued)
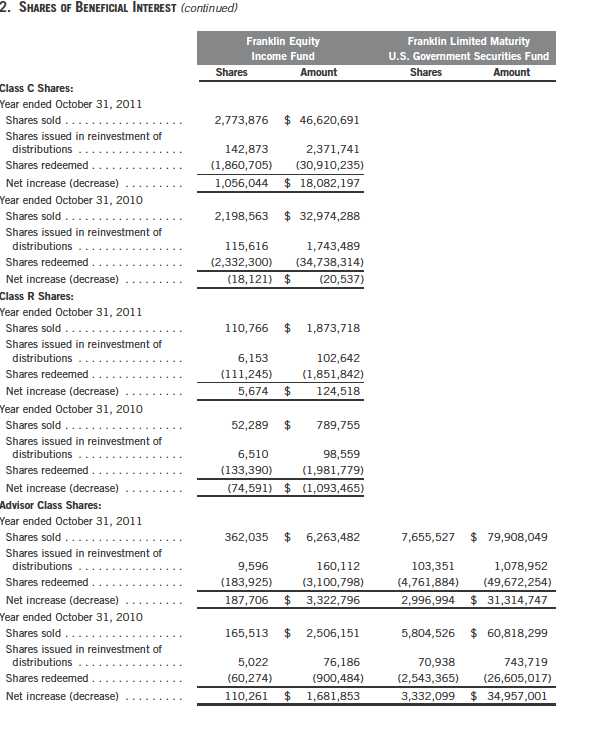
114 | Annual Report
Franklin Investors Securities Trust
Notes to Financial Statements (continued)
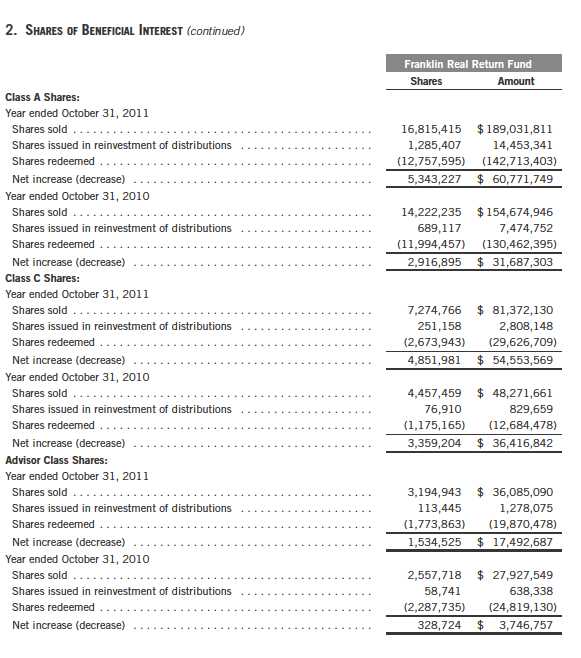
Annual Report | 115
Franklin Investors Securities Trust
Notes to Financial Statements (continued)
3. TRANSACTIONS WITH AFFILIATES
Franklin Resources, Inc. is the holding company for various subsidiaries that together are referred to as Franklin Templeton Investments. Certain officers and trustees of the Trust are also officers and/or directors of the following subsidiaries:
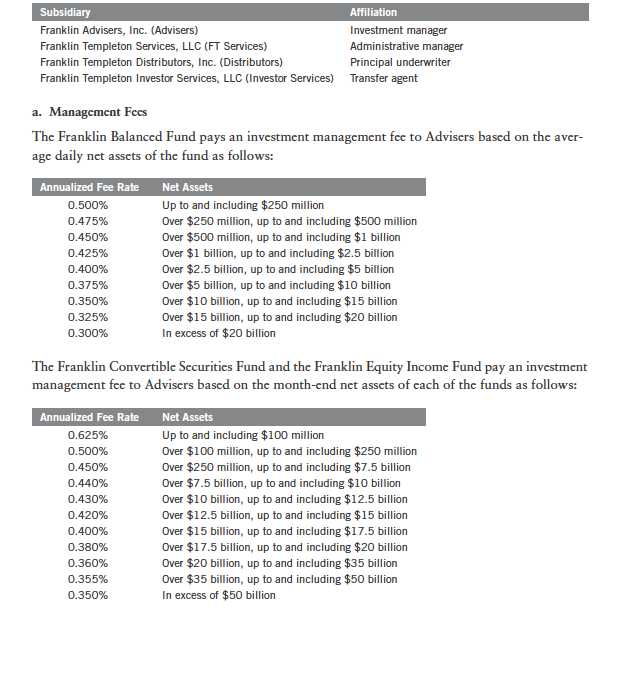
116 | Annual Report
Franklin Investors Securities Trust
Notes to Financial Statements (continued)
3. TRANSACTIONS WITH AFFILIATES (continued) a. Management Fees (continued)
The Franklin Limited Maturity U.S. Government Securities Fund pays an investment management fee to Advisers based on the month-end net assets of the fund as follows:
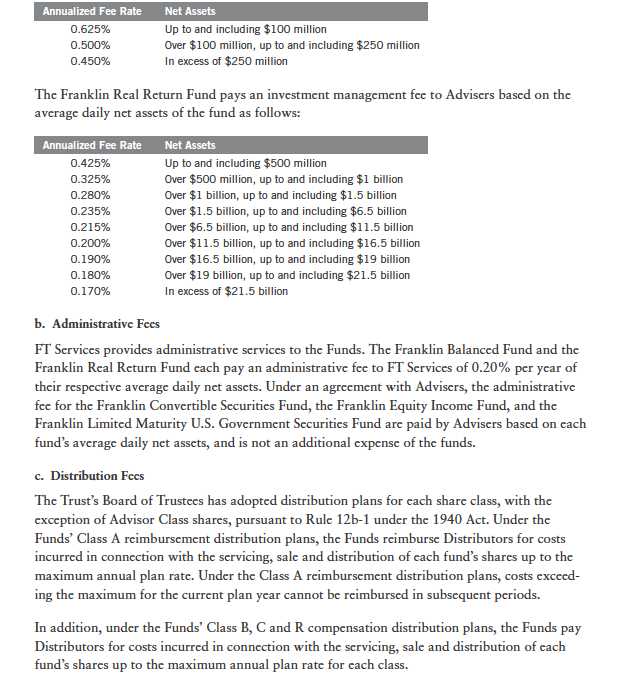
Annual Report | 117
Franklin Investors Securities Trust
Notes to Financial Statements (continued)
3. TRANSACTIONS WITH AFFILIATES (continued) c. Distribution Fees (continued)
The maximum annual plan rates, based on the average daily net assets, for each class, are as follows:
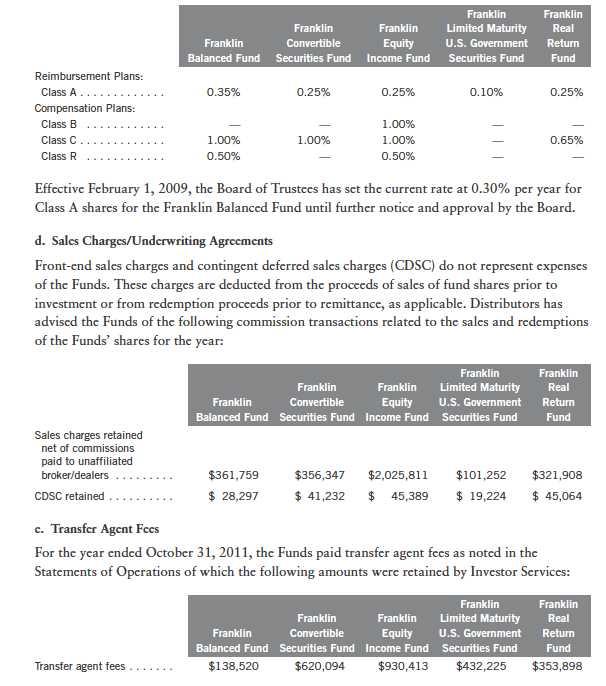
118 | Annual Report
Franklin Investors Securities Trust
Notes to Financial Statements (continued)
3. TRANSACTIONS WITH AFFILIATES (continued) f. Waiver and Expense Reimbursements
FT Services has contractually agreed in advance to waive or limit its fees and to assume as its own expense certain expenses otherwise payable by the the Franklin Balanced Fund and the Franklin Real Return Fund so that the common expenses (i.e. a combination of administrative fees and other expenses, but excluding distribution fees, and acquired fund fees and expenses), for each class of the funds do not exceed 0.71% and 0.65%, respectively (other than certain non-routine expenses or costs, including those relating to litigation, indemnification, reorganizations, and liquidations) until February 29, 2012.
4. EXPENSE OFFSET ARRANGEMENT
The Funds have entered into an arrangement with their custodian whereby credits realized as a result of uninvested cash balances are used to reduce a portion of the Funds’ custodian expenses. During the year ended October 31, 2011, there were no credits earned.
5. INCOME TAXES
For tax purposes, capital losses may be carried over to offset future capital gains, if any. At October 31, 2011, the capital loss carryforwards were as follows:
Annual Report | 119
Franklin Investors Securities Trust
Notes to Financial Statements (continued)
5. INCOME TAXES (continued)
for an unlimited period. Post-enactment capital loss carryforwards will retain their character as either short-term or long-term capital losses rather than being considered short-term as under previous law. Any post-enactment capital losses generated will be required to be utilized prior to the losses incurred in pre-enactment tax years.
The tax character of distributions paid during the years ended October 31, 2011 and 2010, was as follows:

120 | Annual Report
Franklin Investors Securities Trust
Notes to Financial Statements (continued)
5. INCOME TAXES (continued)
Differences between income and/or capital gains as determined on a book basis and a tax basis are primarily due to differing treatments of bond discounts and premiums, corporate actions, and wash sales.
6. INVESTMENT TRANSACTIONS
Purchases and sales of investments (excluding short term securities) for the year ended October 31, 2011, were as follows:
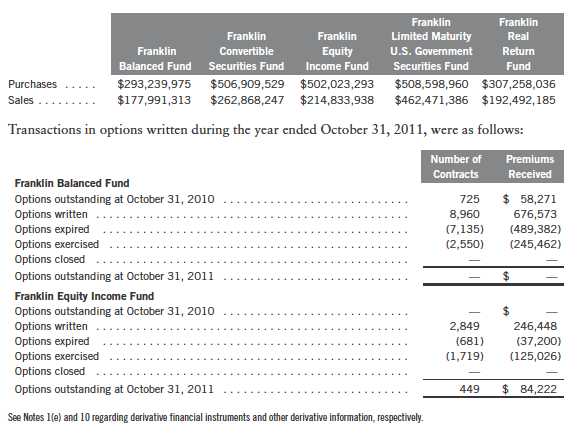
7. INVESTMENTS IN INSTITUTIONAL FIDUCIARY TRUST MONEY MARKET PORTFOLIO
The Franklin Balanced Fund, the Franklin Convertible Securities Fund, the Franklin Equity Income Fund and the Franklin Limited Maturity U.S. Government Securities Fund invest in the Institutional Fiduciary Trust Money Market Portfolio (Sweep Money Fund), an open-end investment company managed by Advisers. Management fees paid by the funds are reduced on assets invested in the Sweep Money Fund, in an amount not to exceed the management and administrative fees paid by the Sweep Money Fund.
Annual Report | 121
Franklin Investors Securities Trust
Notes to Financial Statements (continued)
8. CREDIT RISK AND DEFAULTED SECURITIES
At October 31, 2011, the Franklin Balanced Fund, the Franklin Convertible Securities Fund, the Franklin Equity Income Fund, and the Franklin Real Return Fund had 9.07%, 77.86%, 7.04%, and 9.01% respectively, of their portfolio invested in high yield securities, senior secured floating rate notes, or other securities rated below investment grade. These securities may be more sensitive to economic conditions causing greater price volatility and are potentially subject to a greater risk of loss due to default than higher rated securities.
The Franklin Balanced Fund, the Franklin Convertible Securities Fund, and the Franklin Real Return Fund held defaulted securities and/or other securities for which the income has been deemed uncollectible. At October 31, 2011 the aggregate value of these securities for the Franklin Balanced Fund, the Franklin Convertible Securities Fund, and the Franklin Real Return Fund was $970,000, $11,875,000, and $451,500, representing 0.31%, 1.06%, and 0.07%, respectively, of each fund’s net assets. The funds discontinue accruing income on securities for which income has been deemed uncollectible and provide an estimate for losses on interest receivable. The securities have been identified on the accompanying Statement of Investments.
9. RESTRICTED SECURITIES
The Franklin Convertible Securities Fund invests in securities that are restricted under the Securities Act of 1933 (1933 Act) or which are subject to legal, contractual, or other agreed upon restrictions on resale. Restricted securities are often purchased in private placement transactions, and cannot be sold without prior registration unless the sale is pursuant to an exemption under the 1933 Act. Disposal of these securities may require greater effort and expense, and prompt sale at an acceptable price may be difficult. The fund may have registration rights for restricted securities. The issuer generally incurs all registration costs.
At October 31, 2011, the Franklin Convertible Securities Fund held investments in restricted securities, excluding certain securities exempt from registration under the 1933 Act deemed to be liquid, as follows:
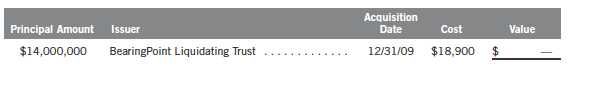
122 | Annual Report
Franklin Investors Securities Trust
Notes to Financial Statements (continued)
10. OTHER DERIVATIVE INFORMATION
At October 31, 2011, the Franklin Equity Income Fund and the Franklin Real Return Fund have invested in derivative contracts which are reflected on the Statement of Assets and Liabilities as follows:
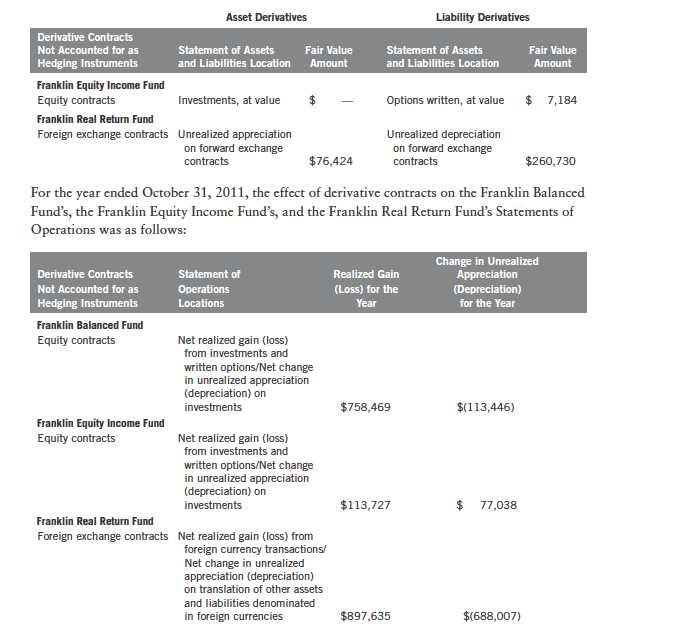
For the year ended October 31, 2011, the average month end market value of derivatives represented 0.27% of average month end net assets for Franklin Real Return Fund. The average month end number of open derivative contracts for the year for the Franklin Balanced Fund and the Franklin Equity Income Fund was 3 and 1, respectively.
Annual Report | 123
Franklin Investors Securities Trust
Notes to Financial Statements (continued)
10. OTHER DERIVATIVE INFORMATION (continued)
See Notes 1(e) and 6 regarding derivative financial instruments and investment transactions, respectively.
11. CREDIT FACILITY
The Funds, together with other U.S. registered and foreign investment funds (collectively, Borrowers), managed by Franklin Templeton Investments, are borrowers in a joint syndicated senior unsecured credit facility totaling $750 million (Global Credit Facility) which matures on January 20, 2012. This Global Credit Facility provides a source of funds to the Borrowers for temporary and emergency purposes, including the ability to meet future unanticipated or unusually large redemption requests.
Under the terms of the Global Credit Facility, the Funds shall, in addition to interest charged on any borrowings made by the Funds and other costs incurred by the Funds, pay their share of fees and expenses incurred in connection with the implementation and maintenance of the Global Credit Facility, based upon their relative share of the aggregate net assets of all of the Borrowers, including an annual commitment fee of 0.08% based upon the unused portion of the Global Credit Facility, which is reflected in other expenses on the Statements of Operations. During the year ended October 31, 2011, the Funds did not use the Global Credit Facility.
12. FAIR VALUE MEASUREMENTS
The Funds follow a fair value hierarchy that distinguishes between market data obtained from independent sources (observable inputs) and the Funds’ own market assumptions (unobservable inputs). These inputs are used in determining the value of the Funds’ investments and are summarized in the following fair value hierarchy:
- Level 1 – quoted prices in active markets for identical securities
- Level 2 – other significant observable inputs (including quoted prices for similar securi- ties, interest rates, prepayment speed, credit risk, etc.)
- Level 3 – significant unobservable inputs (including the Funds’ own assumptions in determining the fair value of investments)
The inputs or methodology used for valuing securities are not an indication of the risk associated with investing in those securities.
For movements between the levels within the fair value hierarchy, the Funds have adopted a policy of recognizing the transfers as of the date of the underlying event which caused the movement.
124 | Annual Report
Franklin Investors Securities Trust
Notes to Financial Statements (continued)
12. FAIR VALUE MEASUREMENTS (continued)
The following is a summary of the inputs used as of October 31, 2011, in valuing the Funds’ assets and liabilities carried at fair value:
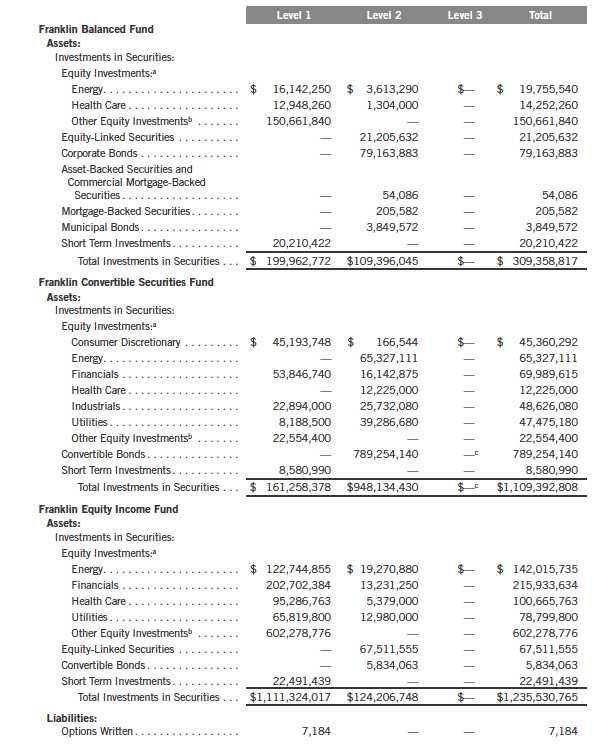
Annual Report | 125
Franklin Investors Securities Trust
Notes to Financial Statements (continued)
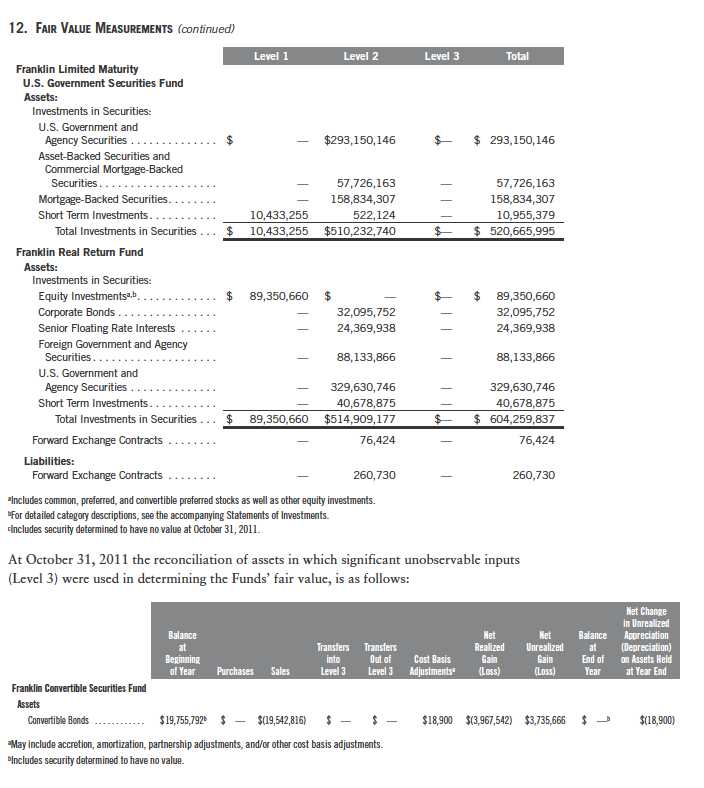
126 | Annual Report
Franklin Investors Securities Trust
Notes to Financial Statements (continued)
13. NEW ACCOUNTING PRONOUNCEMENTS
In May 2011, the Financial Accounting Standards Board (FASB) issued Accounting Standards Update (ASU) No. 2011-04, Fair Value Measurement (Topic 820): Amendments to Achieve Common Fair Value Measurement and Disclosure Requirements in U.S. GAAP and IFRSs. The amendments in the ASU will improve the comparability of fair value measurements presented and disclosed in financial statements prepared in accordance with U.S. GAAP (Generally Accepted Accounting Principles) and IFRS (International Financial Reporting Standards) and include new guidance for certain fair value measurement principles and disclosure requirements. The ASU is effective for interim and annual periods beginning after December 15, 2011. The Funds are currently reviewing the requirements and believe the adoption of this ASU will not have a material impact on the financial statements.
14. SUBSEQUENT EVENTS
The Funds have evaluated subsequent events through the issuance of the financial statements and determined that no events have occurred that require disclosure.
Annual Report | 127
Franklin Investors Securities Trust
Report of Independent Registered Public Accounting Firm
To the Board of Trustees and Shareholders of The Franklin Investors Securities Trust
In our opinion, the accompanying statements of assets and liabilities, including the statements of investments, and the related statements of operations and of changes in net assets and the financial highlights present fairly, in all material respects, the financial position of the Franklin Balanced Fund, the Franklin Convertible Securities Fund, the Franklin Equity Income Fund, the Franklin Limited Maturity U.S. Government Securities Fund, and the Franklin Real Return Fund (five of the funds constituting the Franklin Investors Securities Trust, hereafter referred to as the “Funds”) at October 31, 2011, the results of each of their operations for the year then ended, the changes in each of their net assets for each of the two years in the period then ended and the financial highlights for each of the periods presented, in conformity with accounting principles generally accepted in the United States of America. These financial statements and financial highlights (hereafter referred to as “financial statements”) are the responsibility of the Funds’ management. Our responsibility is to express an opinion on these financial statements based on our audits. We conducted our audits of these financial statements in accordance with the standards of the Public Company Accounting Oversight Board (United States). Those standards require that we plan and perform the audit to obtain reasonable assurance about whether the financial statements are free of material misstatement. An audit includes examining, on a test basis, evidence supporting the amounts and disclosures in the financial statements, assessing the accounting principles used and significant estimates made by management, and evaluating the overall financial statement presentation. We believe that our audits, which included confirmation of securities at October 31, 2011 by correspondence with the custodian and brokers, provide a reasonable basis for our opinion.
PricewaterhouseCoopers LLP
San Francisco, California
December 16, 2011
128 | Annual Report
Franklin Investors Securities Trust
Tax Designation (unaudited)
Under Section 854(b)(2) of the Internal Revenue Code (Code), the Funds designate the following percentage amounts of the ordinary income dividends as income qualifying for the dividends received deduction for the fiscal year ended October 31, 2011:
Distributions, including qualified dividend income, paid during calendar year 2011 will be reported to shareholders on Form 1099-DIV in January 2012. Shareholders are advised to check with their tax advisors for information on the treatment of these amounts on their individual income tax returns.
Under Section 871(k)(1)(C) of the Code, the Franklin Convertible Securities Fund designates the maximum amount allowable but no less than $15,265,022 as interest related dividends for purposes of the tax imposed under Section 871(a)(1)(A) of the Code for the fiscal year ended October 31, 2011.
Annual Report | 129
Franklin Investors Securities Trust
Board Members and Officers
The name, year of birth and address of the officers and board members, as well as their affiliations, positions held with the Trust, principal occupations during the past five years and number of portfolios overseen in the Franklin Templeton Investments fund complex are shown below. Generally, each board member serves until that person’s successor is elected and qualified.
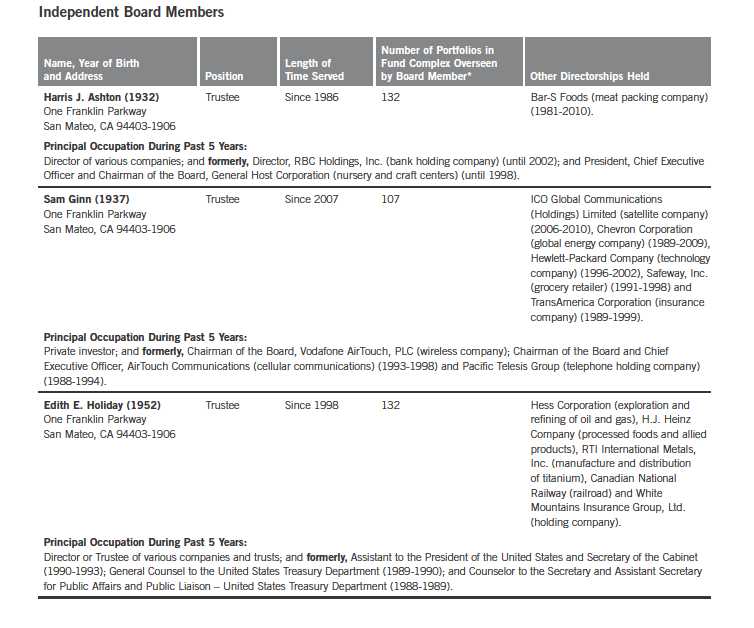
130 | Annual Report
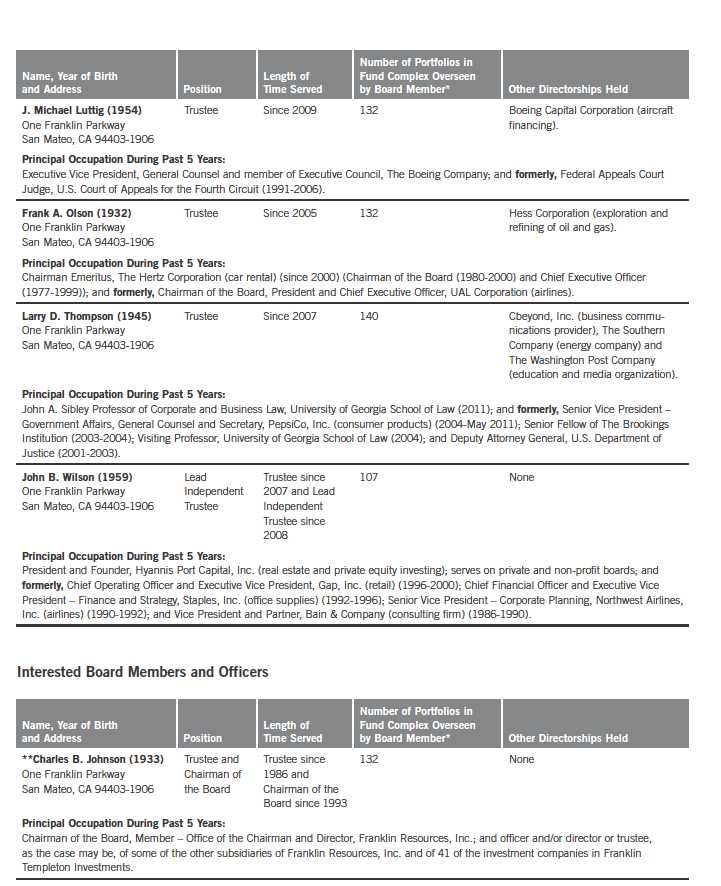
Annual Report | 131
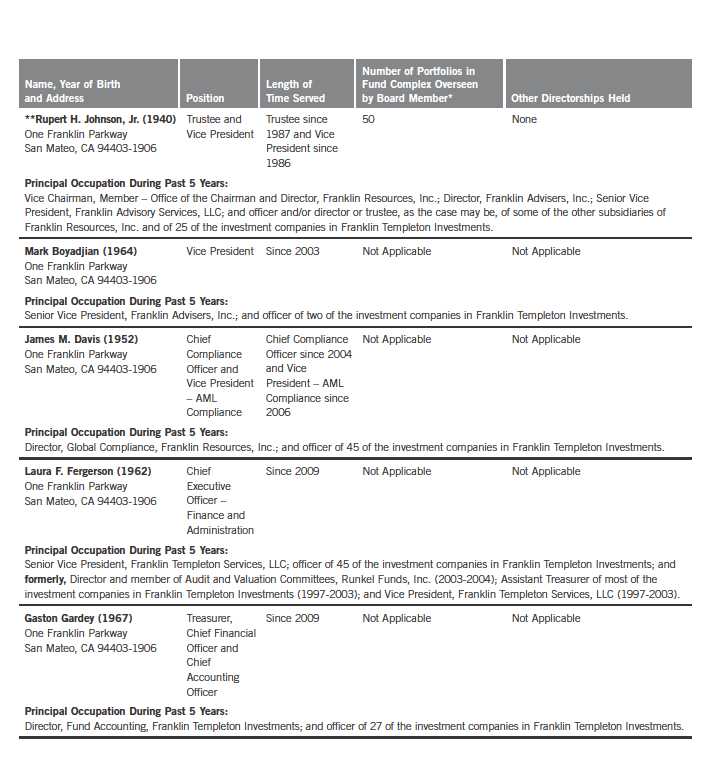
132 | Annual Report
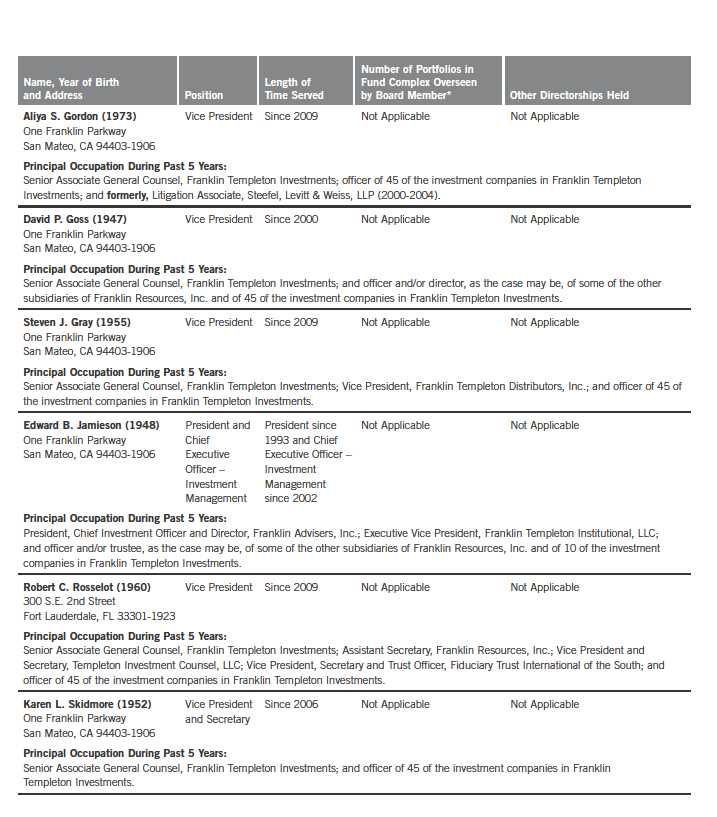
Annual Report | 133
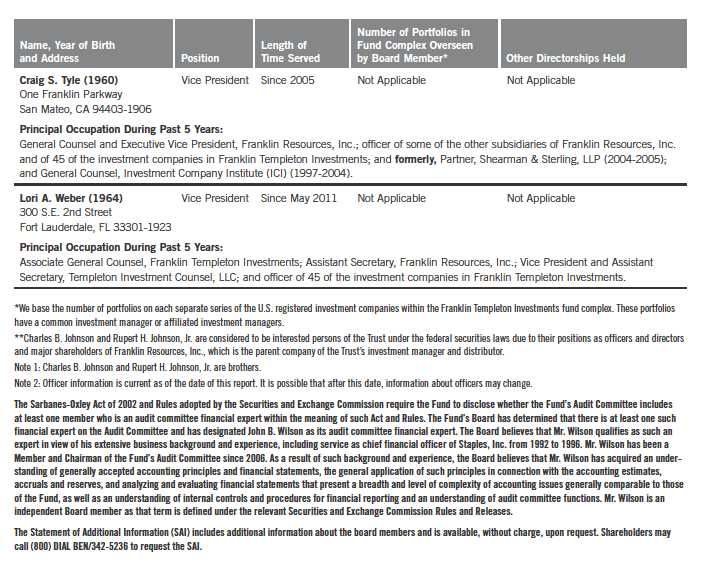
134 | Annual Report
Franklin Investors Securities Trust
Shareholder Information
Proxy Voting Policies and Procedures
The Trust’s investment manager has established Proxy Voting Policies and Procedures (Policies) that the Trust uses to determine how to vote proxies relating to portfolio securities. Shareholders may view the Trust’s complete Policies online at franklintempleton.com. Alternatively, shareholders may request copies of the Policies free of charge by calling the Proxy Group collect at (954) 527-7678 or by sending a written request to: Franklin Templeton Companies, LLC, 300 S.E. 2nd Street, Fort Lauderdale, FL 33301, Attention: Proxy Group. Copies of the Trust’s proxy voting records are also made available online at franklintempleton.com and posted on the U.S. Securities and Exchange Commission’s website at sec.gov and reflect the most recent 12-month period ended June 30.
Quarterly Statement of Investments
The Trust files a complete statement of investments with the U.S. Securities and Exchange Commission for the first and third quarters for each fiscal year on Form N-Q. Shareholders may view the filed Form N-Q by visiting the Commission’s website at sec.gov. The filed form may also be viewed and copied at the Commission’s Public Reference Room in Washington, DC. Information regarding the operations of the Public Reference Room may be obtained by calling (800) SEC-0330.
Householding of Reports and Prospectuses
You will receive the Fund’s financial reports every six months as well as an annual updated summary prospectus (prospectus available upon request). To reduce Fund expenses, we try to identify related shareholders in a household and send only one copy of the financial reports and summary prospectus. This process, called “householding,” will continue indefinitely unless you instruct us otherwise. If you prefer not to have these documents householded, please call us at (800) 632-2301. At any time you may view current prospectuses/summary prospectuses and financial reports on our website. If you choose, you may receive these documents through electronic delivery.
Annual Report | 135
This page intentionally left blank.
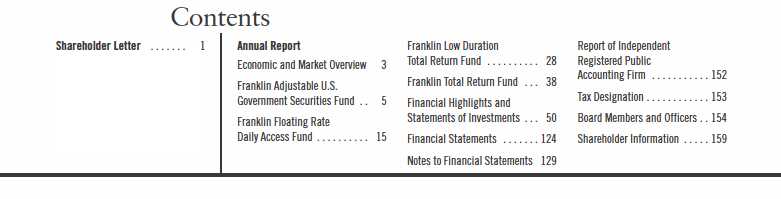
Annual Report
Economic and Market Overview
During the 12 months under review, Federal Reserve Board (Fed) policymakers maintained historically low interest rates while adopting a more restrained view of the economy largely because of developments in Europe and signs the U.S. economic expansion lacked momentum. To promote a stronger recovery and help maintain inflation levels the Fed believed consistent with its dual mandate to foster maximum employment and price stability, the Fed undertook a second round of quantitative easing consisting of a $600 billion purchase of longer term U.S. Treasuries, which ended on June 30. Subsequently, the Fed continued to purchase U.S. Treasuries with proceeds from maturing debt in an effort to support economic growth.
Despite the Fed’s actions, the economy grew more slowly than expected, and unemployment remained high. The foreclosure rate increased, but lawmakers made efforts to strengthen the weak real estate market by making it easier for homeowners to refinance. After showing improvement early in the reporting period, manufacturing activity weakened partly because of global supply-chain disruptions following Japan’s natural disasters. Geopolitical instability in some oil-producing regions drove up oil prices for much of the period. However, investor concerns over weak economic data contributed to a drop in crude oil prices from their 12-month high of $114 per barrel on April 29 to $93 at period-end. Storms and droughts in several states reduced crop yields, pushing up grain prices. As oil and food prices rose, the pace of inflation accelerated during the period.
Generally favorable economic improvements and positive corporate earnings reports somewhat eased investor concerns about the turmoil in North Africa and the Middle East, multiple crises triggered by Japan’s earthquake, widening debt problems and political instability in the eurozone, as well as headwinds facing the U.S. economy. During the 12 months under review, fixed income markets, as measured by the BC U.S. Aggregate Index, and U.S. stocks, as measured by the Standard & Poor’s® 500 Index, posted moderate gains.1 Heightened volatility, however, roiled global financial markets amid U.S. lawmakers’ protracted debate and eventual compromise on the debt limit, independent credit rating
1. STANDARD & POOR’S®, S&P® and S&P 500® are registered trademarks of Standard & Poor’s Financial Services LLC.
Standard & Poor’s does not sponsor, endorse, sell or promote any S&P index-based product.
Annual Report | 3
agency Standard & Poor’s downgrade of the long-term U.S. credit rating to AA+ from AAA, and fears of sovereign debt crisis contagion in Europe. In September, the Fed announced plans designed to boost the economy by driving down long-term interest rates. The Fed intends to sell $400 billion in short-term securities over the next year and purchase an equal amount of long-term securities. The Fed also anticipated it would keep short-term rates near zero through mid-2013. In this environment, investors sought the perceived safety of U.S. Treasuries, which drove their prices higher and yields lower for the period under review.
The foregoing information reflects our analysis and opinions as of October 31, 2011. The information is not a complete analysis of every aspect of any market, country, industry, security or fund. Statements of fact are from sources considered reliable.
4 | Annual Report
Franklin Adjustable
U.S. Government Securities Fund
Your Fund’s Goal and Main Investments: Franklin Adjustable U.S. Government
Securities Fund seeks to provide a high level of current income while providing lower volatility of principal than a fund that invests in fixed-rate securities by investing at least 80% of its net assets in adjustable-rate U.S. government mortgage securities, which are issued or guaranteed by the U.S. government, its agency or instrumentalities.1 The Fund’s investments include securities issued by Ginnie Mae and government-sponsored entities, such as Fannie Mae and Freddie Mac.2
This annual report for Franklin Adjustable U.S. Government Securities Fund covers the fiscal year ended October 31, 2011.
Performance Overview
Franklin Adjustable U.S. Government Securities Fund – Class A posted a +1.30% cumulative total return for the 12 months under review. The Fund outperformed the +0.80% total return of its benchmark, the Barclays Capital (BC) U.S. Government Index: 1-2 Year Component, which measures public obligations of the U.S. Treasury with one to two years to final maturity and publicly issued debt of U.S. government agencies, quasi-federal corporations, and corporate or foreign debt guaranteed by the U.S. government.3 You can find the Fund’s long-term performance data in the Performance Summary beginning on page 9.
1. Securities owned by the Fund, but not shares of the Fund, are guaranteed by the U.S. government, its agencies or instrumentalities as to timely payment of principal and interest.
2. Although U.S. government-sponsored entities may be chartered or sponsored by acts of Congress, their securities are neither issued nor guaranteed by the U.S. Treasury. Please see the Fund’s prospectus for a detailed discussion regarding various levels of credit support for government agency or instrumentality securities. The Fund’s yield and share price are not guaranteed and will vary with market conditions.
3. Source: © 2011 Morningstar. All Rights Reserved. The information contained herein: (1) is proprietary to Morningstar and/or its content providers; (2) may not be copied or distributed; and (3) is not warranted to be accurate, complete or timely. Neither Morningstar nor its content providers are responsible for any damages or losses arising from any use of this information. The index is unmanaged and includes reinvested interest. One cannot invest directly in an index, and an index is not representative of the Fund’s portfolio.
The dollar value, number of shares or principal amount, and names of all portfolio holdings are listed in the Fund’s Statement of Investments (SOI). The SOI begins on page 53.
Annual Report | 5
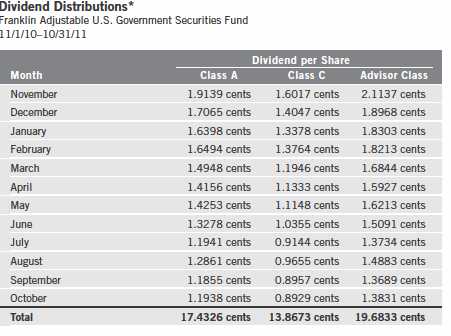
*Assumes shares were purchased and held for the entire accrual period. Since dividends accrue daily, your actual distributions will vary depending on the date you purchased your shares and any account activity. All Fund distributions will vary depending upon current market conditions, and past distributions are not indicative of future trends.
Investment Strategy
We employ a conservative investment strategy as we strive to produce solid performance in a variety of interest rate climates. We typically invest in seasoned adjustable-rate mortgage (ARM) securities, which have been through different interest rate cycles and may have a lower sensitivity to shifts in interest rates. We choose securities using a value-oriented approach, emphasizing the bonds’ economic fundamentals in relation to comparable securities as well as their historical prepayment performance.
Manager’s Discussion
During the 12-month reporting period, Franklin Adjustable U.S. Government Securities Fund employed a conservative strategy investing primarily in agency ARM securities that were either explicitly or implicitly backed by the U.S. government. The Fund focused on securities guaranteed by Fannie Mae (FNMA) and Freddie Mac (FHLMC).1
6 | Annual Report
The Fund took a collateral-intensive research approach seeking to uncover opportunities across the investment universe and focused on seasoned ARMs. Such securities typically have been through several interest rate cycles and therefore have prepayment rates that tend to be less sensitive to interest rate changes, compared to fixed-rate counterparts. We have found these securities in the Fund historically have experienced lower volatility than comparable short-duration Treasuries and have provided more consistent income.
With the ARM market priced at a premium and mortgage rates near historical lows, prepayment risk remained elevated. The team analyzed the prepayment behavior of individual ARM securities and identified those with what we considered the most attractive prepayment profiles. To the extent we can buy ARMs that will prepay slower than market expectations, we may add value for the Fund’s investors.
Although overall prepayment levels gradually declined, the Home Affordable Refinance Program’s (HARP’s) expansion could increase the number of borrowers eligible to refinance their homes. HARP’s expansion could be positive for U.S. household finances, but it could negatively affect related MBS security valuations. Although ARMs will continue to be included in this version of HARP, the 105% loan-to-value cap will remain in place, which could reduce the refinancing potential for a number of homeowners. Many analysts expect ARM prepayments will be concentrated in higher coupon bonds with longer periodic rate reset intervals, which the Fund generally does not focus on. Our investment universe during the period had a current interest rate below the prevailing 5/1 ARM rate and 15- or 30-year fixed mortgage rate. In our analysis, the revised HARP program’s potential effects on ARM prepayments should be minimal, and we do not anticipate seeing any impact until early 2012.
Over the period, we continued to add to seasoned, post-reset FNMA and FHLMC ARM positions with average coupons below 4% as we found pockets of value in LIBOR indexed securities.
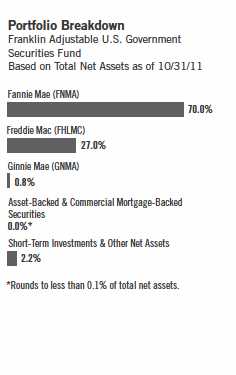
Annual Report | 7
Thank you for your continued participation in Franklin Adjustable U.S. Government Securities Fund. We look forward to serving your future investment needs.

CFA® is a trademark owned by CFA Institute.
The foregoing information reflects our analysis, opinions and portfolio holdings as of October 31, 2011, the end of the reporting period. The way we implement our main investment strategies and the resulting portfolio holdings may change depending on factors such as market and economic conditions. These opinions may not be relied upon as investment advice or an offer for a particular security. The information is not a complete analysis of every aspect of any market, country, industry, security or the Fund. Statements of fact are from sources considered reliable, but the investment manager makes no representation or warranty as to their completeness or accuracy. Although historical performance is no guarantee of future results, these insights may help you understand our investment management philosophy.
8 | Annual Report
Performance Summary as of 10/31/11
Franklin Adjustable U.S. Government Securities Fund
Your dividend income will vary depending on dividends or interest paid by securities in the Fund’s portfolio, adjusted for operating expenses of each class. Capital gain distributions are net profits realized from the sale of portfolio securities. The performance table and graphs do not reflect any taxes that a shareholder would pay on Fund dividends, capital gain distributions, if any, or any realized gains on the sale of Fund shares. Total return reflects reinvestment of the Fund’s dividends and capital gain distributions, if any, and any unrealized gains or losses.
Annual Report | 9
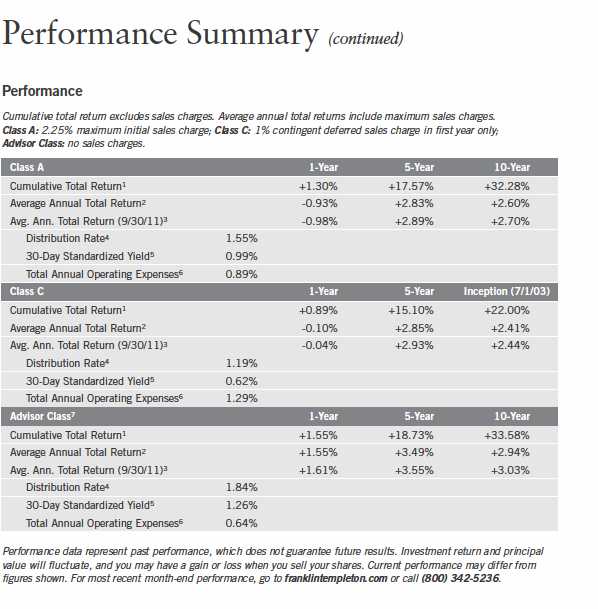
10 | Annual Report
Performance Summary (continued)
Total Return Index Comparison for a Hypothetical $10,000 Investment
Total return represents the change in value of an investment over the periods shown. It includes any current, applicable, maximum sales charge, Fund expenses, account fees and reinvested distributions. The unmanaged index includes reinvestment of any income or distributions. It differs from the Fund in composition and does not pay management fees or expenses. One cannot invest directly in an index.

Annual Report | 11
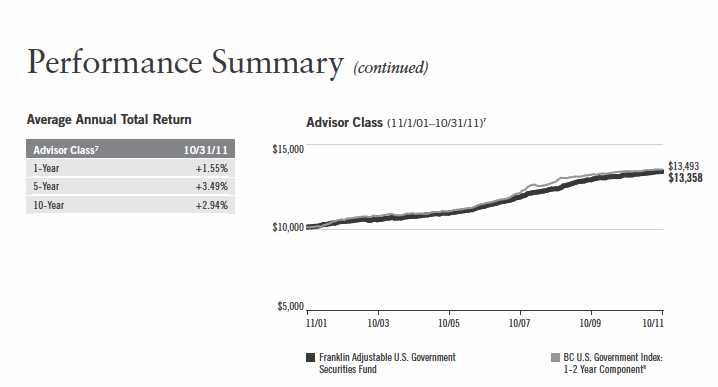
Endnotes
Interest rate movements, unscheduled mortgage prepayments and other risk factors will affect the Fund’s share price and yield. Bond prices generally move in the opposite direction of interest rates. Thus, as prices of bonds in the Fund adjust to a rise in interest rates, the Fund’s share price may decline. Changes in the financial strength of a bond issuer or in a bond’s credit rating may affect its value. The Fund is actively managed but there is no guarantee that the manager’s investment decisions will produce the desired results. The Fund’s prospectus also includes a description of the main investment risks.
Class C: Prior to 1/1/04, these shares were offered with an initial sales charge; thus actual total returns would have differed. These shares have higher annual fees and expenses than Class A shares.
Advisor Class: Shares are available to certain eligible investors as described in the prospectus.
1. Cumulative total return represents the change in value of an investment over the periods indicated.
2. Average annual total return represents the average annual change in value of an investment over the periods indicated.
3. In accordance with SEC rules, we provide standardized average annual total return information through the latest calendar quarter.
4. Distribution rate is based on an annualization of the sum of the respective class’s past 30 days’ daily distributions and the maximum offering price (NAV for Classes C and Advisor) per share on 10/31/11.
5. The 30-day standardized yield for the 30 days ended 10/31/11 reflects an estimated yield to maturity (assuming all portfolio securities are held to maturity). It should be regarded as an estimate of the Fund’s rate of investment income, and it may not equal the Fund’s actual income distribution rate (which reflects the Fund’s past dividends paid to shareholders) or the income reported in the Fund’s financial statements.
6. Figures are as stated in the Fund’s prospectus current as of the date of this report. In periods of market volatility, assets may decline significantly, causing total annual Fund operating expenses to become higher than the figures shown.
7. Effective 5/15/08, the Fund began offering Advisor class shares, which do not have sales charges or a Rule 12b-1 plan. Performance quotations for this class reflect the following methods of calculation: (a) For periods prior to 5/15/08, a restated figure is used based upon the Fund’s Class A performance, excluding the effect of Class A’s maximum initial sales charge, but reflecting the effect of the Class A Rule 12b-1 fees; and (b) for periods after 5/15/08 actual Advisor Class performance is used reflecting all charges and fees applicable to that class. Since 5/15/08 (commencement of sales), the cumulative and average annual total returns of Advisor Class shares were +10.21% and +2.85%.
8. Source: © 2011 Morningstar. The BC U.S. Government Index: 1-2 Year Component includes public obligations of the U.S. Treasury with at least one year up to, but not including, two years to final maturity and publicly issued debt of U.S. government agencies, quasi-federal corporations, and corporate or foreign debt guaranteed by the U.S. government.
12 | Annual Report
Your Fund’s Expenses
Franklin Adjustable U.S. Government Securities Fund
As a Fund shareholder, you can incur two types of costs:
• Transaction costs, including sales charges (loads) on Fund purchases; and
• Ongoing Fund costs, including management fees, distribution and service (12b-1) fees, and other Fund expenses. All mutual funds have ongoing costs, sometimes referred to as operating expenses.
The following table shows ongoing costs of investing in the Fund and can help you understand these costs and compare them with those of other mutual funds. The table assumes a $1,000 investment held for the six months indicated.
Actual Fund Expenses
The first line (Actual) for each share class listed in the table provides actual account values and expenses. The “Ending Account Value” is derived from the Fund’s actual return, which includes the effect of Fund expenses.
You can estimate the expenses you paid during the period by following these steps. Of course, your account value and expenses will differ from those in this illustration:
1. Divide your account value by $1,000.
If an account had an $8,600 value, then $8,600 ÷ $1,000 = 8.6.
2. Multiply the result by the number under the heading “Expenses Paid During Period.”
If Expenses Paid During Period were $7.50, then 8.6 x $7.50 = $64.50.
In this illustration, the estimated expenses paid this period are $64.50.
Hypothetical Example for Comparison with Other Funds
Information in the second line (Hypothetical) for each class in the table can help you compare ongoing costs of investing in the Fund with those of other mutual funds. This information may not be used to estimate the actual ending account balance or expenses you paid during the period. The hypothetical “Ending Account Value” is based on the actual expense ratio for each class and an assumed 5% annual rate of return before expenses, which does not represent the Fund’s actual return. The figure under the heading “Expenses Paid During Period” shows the hypothetical expenses your account would have incurred under this scenario. You can compare this figure with the 5% hypothetical examples that appear in shareholder reports of other funds.
Annual Report | 13
Your Fund’s Expenses (continued)
Please note that expenses shown in the table are meant to highlight ongoing costs and do not reflect any transaction costs, such as sales charges. Therefore, the second line for each class is useful in comparing ongoing costs only, and will not help you compare total costs of owning different funds. In addition, if transaction costs were included, your total costs would have been higher. Please refer to the Fund prospectus for additional information on operating expenses.
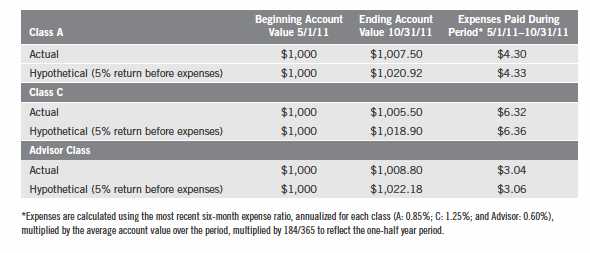
14 | Annual Report
Franklin Floating Rate Daily Access Fund
Your Fund’s Goals and Main Investments: Franklin Floating Rate Daily Access Fund seeks to provide a high level of current income and, secondarily, preservation of capital by investing at least 80% of its net assets in income-producing floating interest rate corporate loans and corporate debt securities.
This annual report for Franklin Floating Rate Daily Access Fund covers the fiscal year ended October 31, 2011.
Performance Overview
Franklin Floating Rate Daily Access Fund – Class A delivered a +2.17% cumulative total return for the 12 months under review. The Fund underperformed the +3.54% total return of its benchmark, the Credit Suisse Leveraged Loan Index (CS LLI), which is designed to mirror the investable universe of the U.S. dollar-denominated leveraged loan market.1 You can find the Fund’s long-term performance data in the Performance Summary beginning on page 21.
Bank Loan Market Overview
A surge in asset inflows buoyed the loan market in the first half of the Fund’s fiscal year, leading to demand outstripping supply, gains in the secondary market and an increase in primary issuance. However, slowing economic growth and renewed fears of contagion from the European sovereign debt crisis toward period-end heightened risk aversion and led to volatility across capital markets. As the loan market weakened in August 2011, outflows from the asset class accelerated, helping to lower prices in the secondary market and dampen activity in the primary market. The loan market then modestly recovered toward period-end as the odds for another U.S. recession appeared to diminish due to better-than-expected economic data.
During the first few months of the 12-month period, inflows into loan mutual funds reached record levels as investors expected loans to provide a hedge against rising interest rates and possibly inflation. A wide array of investors, including hedge funds, high yield accounts and multi-strategy accounts,
1. Source: © 2011 Morningstar. All Rights Reserved. The information contained herein: (1) is proprietary to Morningstar and/or its content providers; (2) may not be copied or distributed; and (3) is not warranted to be accurate, complete or timely. Neither Morningstar nor its content providers are responsible for any damages or losses arising from any use of this information. The index is unmanaged and includes reinvested interest. One cannot invest directly in an index, and an index is not representative of the Fund’s portfolio.
The dollar value, number of shares or principal amount, and names of all portfolio holdings are listed in the Fund’s Statement of Investments (SOI). The SOI begins on page 60.
Annual Report | 15
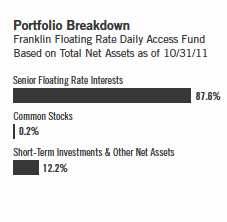
increasingly participated in the loan market, while more investment firms launched new loan mutual funds seeking to capture a portion of those inflows. Additionally, bond-for-loan refinancing provided another source of cash to investor accounts. Amid historically low interest rates, many companies opted to issue new high yield bonds and repay institutional term loans with the proceeds. Repayments, in turn, helped to increase cash positions in loan mutual funds and collateralized loan obligations (CLOs), which contributed to demand in the primary and secondary markets.
The surge in inflows and repayments, combined with a lack of new-issue supply, led to a rally in loan prices. Consequently, many loans with relatively attractive yield spreads began to trade above par value and were subsequently refinanced with lower pricing, including reductions in spreads and LIBOR (London Interbank Offered Rate) floors. Amid the competition for new loans in the early months of 2011, investors unable to receive sufficient allocations in the primary market were forced to purchase loans above the initial issue price in the secondary market. The types of deals in the primary market also reflected a reduction in risk aversion as the volume of second-lien and “covenant-lite” loans continued to recover from recessionary lows.
In May and June of 2011, despite weaker U.S. economic reports, the loan market experienced an increase in new issuance in response to cash balances that had built up over prior months. Meanwhile, inflows into the asset class began to abate, helping balance demand with supply. Deals were largely split between larger, higher credit quality deals that were more popular with investors, and deals that were smaller and more difficult to place. Many of the larger issuers with higher credit ratings attracted healthy demand from commercial banks, which experienced continued growth in deposits. As a result, the portion of pro-rata debt that is typically preferred by these banks increased in many deals and provided better-rated issuers with cheaper financing. In contrast, some smaller and lower-rated deals faced more skepticism among investors.
Investor risk aversion increased significantly in August 2011 following downward revisions in U.S. gross domestic product estimates and a downgrade of the U.S. long-term sovereign credit rating by Standard & Poor’s, both of which added to existing fears of contagion stemming from the European sovereign debt crisis. Reinforcing expectations of below-trend growth and the possibility of significant downside risks, the Federal Reserve Board (Fed) in August announced it would keep its benchmark federal funds target rate in the 0% to 0.25% range until mid-2013. In September, the Fed announced a plan to purchase Treasury securities with longer dated maturities while selling Treasury securities with shorter maturities, intending to push down interest rates overall.
16 | Annual Report
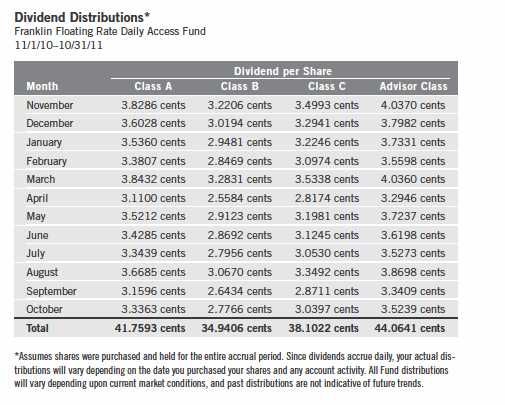
Over the one-year period, as investors became increasingly concerned about bank solvency in the U.S. and Europe, three-month LIBOR increased from 0.29% to 0.43%, while the 10-year Treasury note yield fell from 2.60% to 2.11%, amid a general flight to quality.
Declines in the loan market were especially acute relative to other asset classes following the Fed’s announcement on rates. The surge in redemption requests forced many loan mutual fund managers to sell loans to raise cash and meet substantial redemptions, driving secondary prices even lower. The forced selling among managers worsened declines in net asset values (NAVs) of loan mutual funds, which prompted further redemptions, helping to cause a self-perpetuating feedback loop. With prospects diminishing for higher interest rates, largely due to accommodative Fed policies, investor demand for loan mutual funds continued to subside and shifted toward asset classes that would possibly benefit from an extended period of low interest rates. In October, high yield mutual funds attracted record inflows as outflows from loan mutual funds moderated. High yield accounts, along with hedge funds and banks, began to invest in some loans that were trading at steep discounts to their par value, helping to pare significant declines from the previous months.
Annual Report | 17
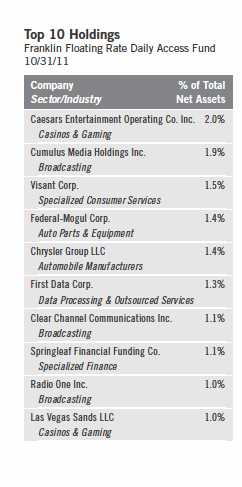
Although loan-market volatility persisted throughout much of the one-year period, many companies continued to report favorable earnings and revenue growth. Publicly filing loan issuers reported consecutive quarters of double-digit revenue growth, in addition to year-over-year earnings gains. Credit rating agencies, reacting to the increases in earnings, upgraded the ratings of more issuers than they downgraded, continuing the steady improvement in ratings among loan issuers since 2009. Overall, the default rate moved lower from 2.28% in October 2010 to 0.32% in October 2011 (by principal amount over the past 12 months).2 Additionally, investors generally expected the default rate to remain relatively low as many issuers with near-term maturities extended their maturities or refinanced debt during the one-year period.
Investment Strategy
We use a detailed credit analysis process to select corporate loan and corporate debt securities that meet our criteria. We conduct ongoing credit monitoring of our investments. To help manage the credit risk associated with investing in below-investment-grade securities, we diversify the Fund by investing in a large number of loans of companies that we have identified as having attractive risk/reward profiles, favorable capital structures, strong asset coverage and dominant market shares. This diversification potentially reduces credit risk by spreading assets across many different industries.
Manager’s Discussion
During the fiscal year, the Fund’s returns lagged those of its benchmark, the CS LLI, largely due to its individual loan selection, particularly in the diversified media industry. In the first part of the period, the Fund’s higher credit quality focus (in loans rated BB) and overall defensive positioning led to the underperformance, as lower rated credits (rated B and below) significantly outperformed loans rated BB. However, higher rated credits outperformed in August as the loan market weakened significantly. Overall, for the year ended October 31, 2011, BB-rated loans returned +3.37%, B-rated loans returned +3.55%, CCC/Split CCC-rated loans returned +1.53% and distressed (CC, C and defaulted) loans returned +3.42%, as measured by the CS LLI.3
The Fund continued to invest in companies with what we regarded as adequate liquidity and strong cash flows to service debt in the primary and secondary markets. As large investor inflows began to slow and issuance accelerated in the middle of the reporting period, repricing activity began to subside and there were
2. Source: S&P Leveraged Commentary & Data, “LoanStats Weekly Supplemental.” 3. Source: Credit Suisse.
18 | Annual Report
what we considered more attractive opportunities in the primary market that offered higher spreads, LIBOR floors, and meaningful original issue discounts (OIDs). Toward the end of the period, as many loans were trading at steep discounts to par value, we invested in secondary market loans that we believed provided potential for price appreciation, with a preference for higher credit-quality issuers. Throughout the one-year period, we shifted our industry positioning into areas we believed might benefit more from the modest economic recovery, such as the broadcasting and automotive industries, while also using LCDX, a tradable index of 100 equally weighted loan credit default swaps (LCDS), to help the Fund manage strong inflows and outflows over the 12-month period, which also aided performance.
We maintained our overweighted position in the broadcasting industry as spending on advertising continued to rebound from recessionary lows. The equity of Citadel Broadcasting, which we received during the company’s restructuring as it emerged from Chapter 11 bankruptcy protection, was among the top performers following its acquisition by Cumulus Media. The offer by Cumulus, which included a combination of cash and Cumulus stock, exceeded the recovery following Citadel’s exit from bankruptcy. The Fund subsequently invested in the first lien and second lien facilities of Cumulus Media, which issued loans to finance the acquisition. We found Cumulus compelling due to a track record of stable free cash flows, a recovery in advertising expenditures, and its high profit margins for the industry. Moreover, the transaction enabled the combined company to position itself as the second-largest U.S. radio broadcaster by number of stations, providing an attractive asset base for our collateral.
We also continued to favor loans in the automotive industry, which showed signs of recovery as vehicle sales improved.4 During the period, we invested in the term loan of Chrysler Group, which reentered the loan market to refinance a portion of its existing debt to repay obligations to the governments of the U.S. and Canada. We found the term loan attractive as the company reorganized its capital structure, which reduced interest expenses. Moreover, we believed Chrysler would benefit from rebounding automotive industry fundamentals, improved cost structure and manufacturing capabilities, and significant labor cost reductions. Also benefiting from favorable trends in the automotive industry were our existing term loans of Federal-Mogul, a supplier of vehicular components, which contributed to Fund performance. The company benefited from consecutive quarters of profitable results. Furthermore, Federal-Mogul captured additional market share as its growth prospects appear to have improved due to new technologies and program launches.
4. Automotive industry holdings are in auto parts and equipment and automobile manufacturing in the SOI.
Annual Report | 19
A couple of loans in the diversified media/publishing industry hurt Fund performance during the period. Dex One,5 a provider of print and online marketing through yellow pages directories and websites, continued to suffer amid a declining directories market. Despite advertising weakness in this particular media segment, the company continued to generate strong free cash flow and pay down debt, while providing high income relative to other loans in the market. Additionally, our position in Tribune, a multimedia corporation and newspaper publisher, contributed to performance in the first part of the one-year period, but underperformed overall amid investor concerns about the potential for a lower recovery once the company emerges from bankruptcy.
Although many of our bank loans at period-end were trading below par value, and current loan credit spreads ended the Fund’s fiscal year meaningfully wider than their long-term averages, corporate fundamentals and balance sheet liquidity remained strong for companies in the Fund’s portfolio. Over the past year, the majority of these issuers displayed solid earnings growth, helping to minimize defaults in our portfolio.
Thank you for your continued participation in Franklin Floating Rate Daily Access Fund. We look forward to serving your future investment needs.

The foregoing information reflects our analysis, opinions and portfolio holdings as of October 31, 2011, the end of the reporting period. The way we implement our main investment strategies and the resulting portfolio holdings may change depending on factors such as market and economic conditions. These opinions may not be relied upon as investment advice or an offer for a particular security. The information is not a complete analysis of every aspect of any market, country, industry, security or the Fund. Statements of fact are from sources considered reliable, but the investment manager makes no representation or warranty as to their completeness or accuracy. Although historical performance is no guarantee of future results, these insights may help you understand our investment management philosophy.
5. R.H. Donnelley Inc. in the SOI.
20 | Annual Report
Performance Summary as of 10/31/11
Franklin Floating Rate Daily Access Fund
Your dividend income will vary depending on dividends or interest paid by securities in the Fund’s portfolio, adjusted for operating expenses of each class. Capital gain distributions are net profits realized from the sale of portfolio securities. The performance table and graphs do not reflect any taxes that a shareholder would pay on Fund dividends, capital gain distributions, if any, or any realized gains on the sale of Fund shares. Total return reflects reinvestment of the Fund’s dividends and capital gain distributions, if any, and any unrealized gains or losses.

Annual Report | 21
Performance Summary (continued)

22 | Annual Report
Performance Summary (continued)
Total Return Index Comparison for a Hypothetical $10,000 Investment
Total return represents the change in value of an investment over the periods shown. It includes any applicable maximum sales charge, Fund expenses, account fees and reinvested distributions. The unmanaged index includes reinvestment of any income or distributions. It differs from the Fund in composition and does not pay management fees or expenses. One cannot invest directly in an index.
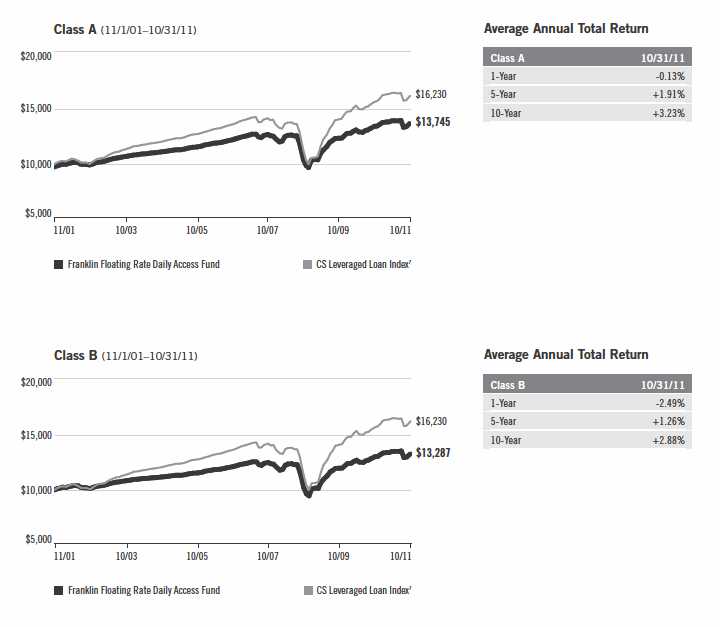
Annual Report | 23
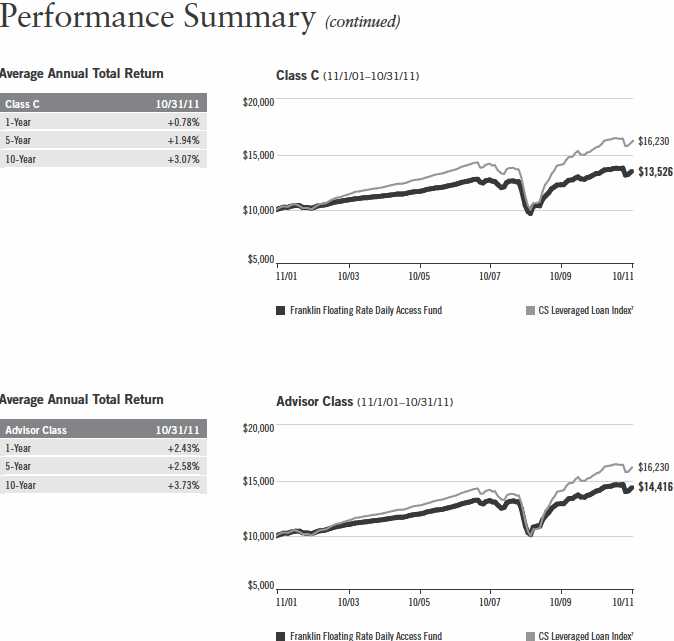
24 | Annual Report
Performance Summary (continued)
Endnotes
Investors should be aware that the Fund’s share price and yield will fluctuate with market conditions. The Fund should not be considered an alternative to money market funds or certificates of deposit (CDs). The floating rate loans and debt securities in which the Fund invests tend to be rated below investment grade. Investing in higher yielding, lower rated, floating rate loans and debt securities involves greater risk of default, which could result in loss of principal — a risk that may be heightened in a slowing economy. Interest earned on floating rate loans varies with changes in prevailing interest rates. Therefore, while floating rate loans offer higher interest income when interest rates rise, they will also generate less income when interest rates decline. Changes in the financial strength of a bond issuer or in a bond’s credit rating may affect its value. The Fund is actively managed but there is no guarantee that the manager’s investment decisions will produce the desired results. The Fund’s prospectus also includes a description of the main investment risks.
Class B: These shares have higher annual fees and expenses than Class A shares. Class C: These shares have higher annual fees and expenses than Class A shares. Advisor Class: Shares are available to certain eligible investors as described in the prospectus.
1. Cumulative total return represents the change in value of an investment over the periods indicated.
2. Average annual total return represents the average annual change in value of an investment over the periods indicated.
3. In accordance with SEC rules, we provide standardized average annual total return information through the latest calendar quarter.
4. Distribution rate is based on an annualization of the sum of the respective class’s past 30 days’ daily distributions and the maximum offering price (NAV for Classes B, C and Advisor) per share on 10/31/11.
5. The 30-day standardized yield for the 30 days ended 10/31/11 reflects an estimated yield to maturity (assuming all portfolio securities are held to maturity). It should be regarded as an estimate of the Fund’s rate of investment income, and it may not equal the Fund’s actual income distribution rate (which reflects the Fund’s past dividends paid to shareholders) or the income reported in the Fund’s financial statements.
6. Figures are as stated in the Fund’s prospectus current as of the date of this report. In periods of market volatility, assets may decline significantly, causing total annual Fund operating expenses to become higher than the figures shown.
7. Source: © 2011 Morningstar. The CS Leveraged Loan Index is designed to mirror the investable universe of the U.S. dollar-denominated leveraged loan market. Loans must be rated BB or lower by Moody’s or S&P.
Annual Report | 25
Your Fund’s Expenses
Franklin Floating Rate Daily Access Fund
As a Fund shareholder, you can incur two types of costs:
• Transaction costs, including sales charges (loads) on Fund purchases; and
• Ongoing Fund costs, including management fees, distribution and service (12b-1) fees, and other Fund expenses. All mutual funds have ongoing costs, sometimes referred to as operating expenses.
The following table shows ongoing costs of investing in the Fund and can help you understand these costs and compare them with those of other mutual funds. The table assumes a $1,000 investment held for the six months indicated.
Actual Fund Expenses
The first line (Actual) for each share class listed in the table provides actual account values and expenses. The “Ending Account Value” is derived from the Fund’s actual return, which includes the effect of Fund expenses.
You can estimate the expenses you paid during the period by following these steps. Of course, your account value and expenses will differ from those in this illustration:
1. Divide your account value by $1,000.
If an account had an $8,600 value, then $8,600 ÷ $1,000 = 8.6.
2. Multiply the result by the number under the heading “Expenses Paid During Period.”
If Expenses Paid During Period were $7.50, then 8.6 x $7.50 = $64.50.
In this illustration, the estimated expenses paid this period are $64.50.
Hypothetical Example for Comparison with Other Funds
Information in the second line (Hypothetical) for each class in the table can help you compare ongoing costs of investing in the Fund with those of other mutual funds. This information may not be used to estimate the actual ending account balance or expenses you paid during the period. The hypothetical “Ending Account Value” is based on the actual expense ratio for each class and an assumed 5% annual rate of return before expenses, which does not represent the Fund’s actual return. The figure under the heading “Expenses Paid During Period” shows the hypothetical expenses your account would have incurred under this scenario. You can compare this figure with the 5% hypothetical examples that appear in shareholder reports of other funds.
26 | Annual Report
Your Fund’s Expenses (continued)
Please note that expenses shown in the table are meant to highlight ongoing costs and do not reflect any transaction costs, such as sales charges. Therefore, the second line for each class is useful in comparing ongoing costs only, and will not help you compare total costs of owning different funds. In addition, if transaction costs were included, your total costs would have been higher. Please refer to the Fund prospectus for additional information on operating expenses.
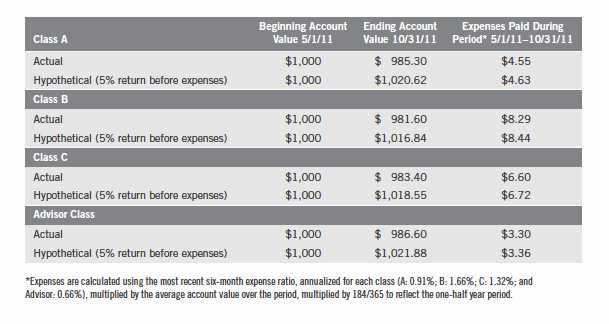
Annual Report | 27
Franklin Low Duration Total Return Fund
Your Fund’s Goal and Main Investments: Franklin Low Duration Total Return Fund seeks a high level of current income as is consistent with prudent investing, while seeking capital preservation. The Fund invests primarily in investment-grade debt securities, including government and corporate debt securities and mortgage- and asset-backed securities, targeting an estimated average portfolio duration of three years or less.
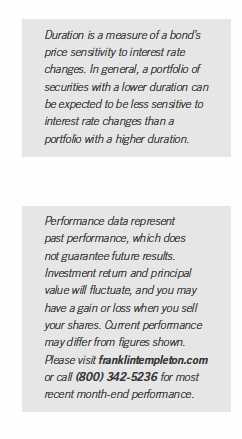
This annual report for Franklin Low Duration Total Return Fund covers the fiscal year ended October 31, 2011.
Performance Overview
Franklin Low Duration Total Return Fund – Class A had a +0.99% cumulative total return for the 12 months under review. The Fund underperformed the +1.21% total return of its benchmark, the Barclays Capital (BC) U.S. Government/Credit Index: 1-3 Year Component, which tracks public obligations of the U.S. Treasury with one to three years to final maturity and publicly issued debt of U.S. government agencies, quasi-federal corporations, and corporate or foreign debt guaranteed by the U.S. government.1 You can find more of the Fund’s performance data in the Performance Summary beginning on page 32.
Investment Strategy
We seek to invest in a combination of fixed income securities, primarily from across the investment-grade debt universe. We analyze securities using proprietary and nonproprietary research to help us identify attractive investment opportunities across the entire fixed income opportunity set, on a relative basis. When making investment decisions, we evaluate business cycles, yield curves, and values between and within markets. Through a low duration portfolio, we seek to position the Fund to be less affected by interest rate changes than a fund with a higher duration. In addition, we may use derivative transactions,
1. Source: © 2011 Morningstar. All Rights Reserved. The information contained herein: (1) is proprietary to Morningstar and/or its content providers; (2) may not be copied or distributed; and (3) is not warranted to be accurate, complete or timely. Neither Morningstar nor its content providers are responsible for any damages or losses arising from any use of this information. The index is unmanaged and includes reinvested interest. One cannot invest directly in an index, and an index is not representative of the Fund’s portfolio.
The dollar value, number of shares or principal amount, and names of all portfolio holdings are listed in the Fund’s Statement of Investments (SOI). The SOI begins on page 72.
28 | Annual Report
such as currency and cross-currency forwards, futures contracts and swap agreements to obtain net long or short exposures to selected currencies, interest rates, countries, duration or credit risks.
Manager’s Discussion
As measured by BC Indexes, the U.S. Corporate Investment Grade Index posted the best absolute performance (+6.14%) among some of the fixed income sectors in which the Fund invested during the period.1 Several other major fixed income sectors posted positive returns as well, including the U.S. Corporate High Yield Index (+5.17%), the U.S. Residential MBS Index (+4.53%), the Commercial Mortgage-Backed Securities (CMBS) Index (+4.13%), the Emerging Markets (U.S. Dollar) Index (+3.75%), the Asset-Backed Securities Index (+3.08%) and the U.S. Agency Index (+2.73%).1
Annual Report | 29

During the reporting period, we continued to feel many of the best opportunities in global bond markets were outside the U.S. Accordingly, the Fund maintained an overweighted exposure to international bonds and currencies relative to the benchmark index. Foreign bonds and currencies, including emerging market debt, contributed to returns. The Fund benefited from strong CMBS performance. We continued to favor higher quality CMBS, but we also found what we considered opportunities in lower credit quality CMBS that offered attractive yields and solid fundamental value, in our assessment. Our weighting in agency mortgages benefited relative performance as those sectors produced positive performance during the period. We added exposure to municipal bonds during the period, which we believe offered better value than U.S. Treasuries and have low historical default rates compared with other credit sectors.
We took the opportunity during the period to decrease the Fund’s exposure to select below investment-grade corporate securities, including high yield and floating rate bank loan debt, which delivered strong performance and became more fairly valued, in our view. Although we tempered our expectations due to concerns about European sovereign and bank credit, the Fund maintained an overweighted allocation to corporate credit sectors as valuations remained attractive to us on a longer term basis. The Fund’s positioning in below investment-grade credit sectors contributed to performance. Our lower interest rate risk positioning, relative to the benchmark, detracted from performance as interest rates declined over the period.
30 | Annual Report
Thank you for your continued participation in Franklin Low Duration Total Return Fund. We look forward to serving your future investment needs.

The foregoing information reflects our analysis, opinions and portfolio holdings as of October 31, 2011, the end of the reporting period. The way we implement our main investment strategies and the resulting portfolio holdings may change depending on factors such as market and economic conditions. These opinions may not be relied upon as investment advice or an offer for a particular security. The information is not a complete analysis of every aspect of any market, country, industry, security or the Fund. Statements of fact are from sources considered reliable, but the investment manager makes no representation or warranty as to their completeness or accuracy. Although historical performance is no guarantee of future results, these insights may help you understand our investment management philosophy.
Annual Report | 31
Performance Summary as of 10/31/11
Franklin Low Duration Total Return Fund
Your dividend income will vary depending on dividends or interest paid by securities in the Fund’s portfolio, adjusted for operating expenses of each class. Capital gain distributions are net profits realized from the sale of portfolio securities. The performance table and graphs do not reflect any taxes that a shareholder would pay on Fund dividends, capital gain distributions, if any, or any realized gains on the sale of Fund shares. Total return reflects reinvestment of the Fund’s dividends and capital gain distributions, if any, and any unrealized gains or losses.
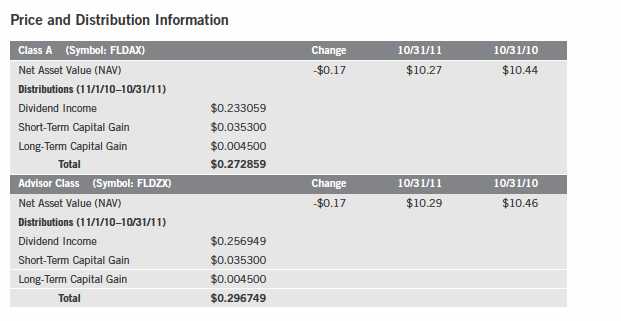
32 | Annual Report
Performance Summary (continued)
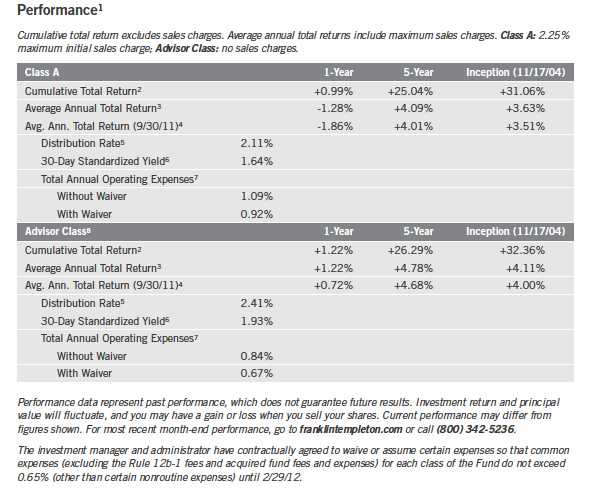
Annual Report | 33
Performance Summary (continued)
Total Return Index Comparison for a Hypothetical $10,000 Investment1
Total return represents the change in value of an investment over the periods shown. It includes any applicable maximum sales charge, Fund expenses, account fees and reinvested distributions. The unmanaged index includes reinvestment of any income or distributions. It differs from the Fund in composition and does not pay management fees or expenses. One cannot invest directly in an index.
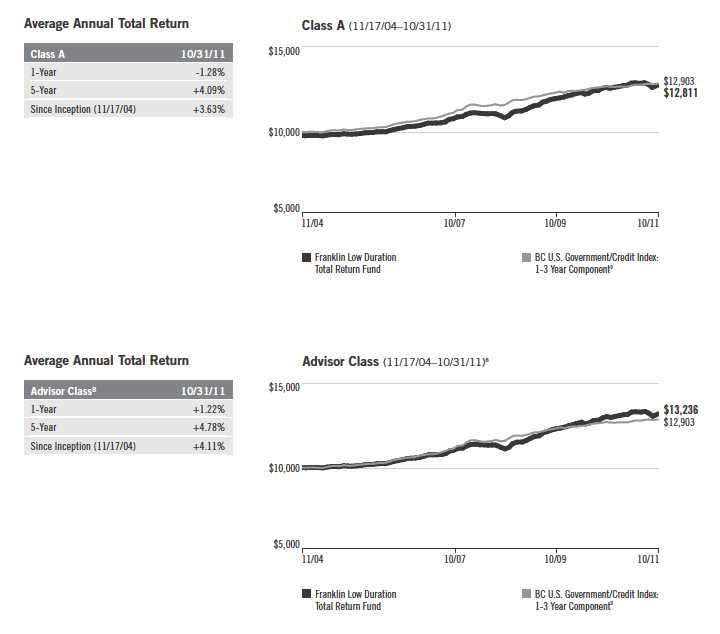
34 | Annual Report
Performance Summary (continued)
Endnotes
Interest rate movements will affect the Fund’s share price and yield. Bond prices generally move in the opposite direction of interest rates. Thus, as prices of bonds in the Fund adjust to a rise in interest rates, the Fund’s share price may decline. The Fund’s investment in derivatives, such as financial futures and option contracts, and the Fund’s use of foreign currency techniques involve special risks as such techniques may not achieve the anticipated benefits and/or may result in losses to the Fund. Some derivatives are particularly sensitive to changes in interest rates. The risks of foreign securities include currency fluctuations and political uncertainty. Changes in the financial strength of a bond issuer or in a bond’s credit rating may affect its value. The Fund is actively managed but there is no guarantee that the manager’s investment decisions will produce the desired results. The Fund’s prospectus also includes a description of the main investment risks.
Advisor Class: Shares are available to certain eligible investors as described in the prospectus.
1. If the manager and administrator had not waived fees, the Fund’s distribution rates and total returns would have been lower, and yields for the period would have been 1.52% for Class A and 1.81% for Advisor Class.
2. Cumulative total return represents the change in value of an investment over the periods indicated.
3. Average annual total return represents the average annual change in value of an investment over the periods indicated.
4. In accordance with SEC rules, we provide standardized average annual total return information through the latest calendar quarter.
5. Distribution rate is based on an annualization of the sum of the respective class’s past 30 days’ daily distributions and the maximum offering price (NAV for Advisor Class) per share on 10/31/11.
6. The 30-day standardized yield for the 30 days ended 10/31/11 reflects an estimated yield to maturity (assuming all portfolio securities are held to maturity). It should be regarded as an estimate of the Fund’s rate of investment income, and it may not equal the Fund’s actual income distribution rate (which reflects the Fund’s past dividends paid to shareholders) or the income reported in the Fund’s financial statements.
7. Figures are as stated in the Fund’s prospectus current as of the date of this report. In periods of market volatility, assets may decline significantly, causing total annual Fund operating expenses to become higher than the figures shown.
8. Effective 5/15/08, the Fund began offering Advisor class shares, which do not have sales charges or a Rule 12b-1 plan. Performance quotations for this class reflect the following methods of calculation: (a) For periods prior to 5/15/08, a restated figure is used based upon the Fund’s Class A performance, excluding the effect of Class A’s maximum initial sales charge, but reflecting the effect of the Class A Rule 12b-1 fees; and (b) for periods after 5/15/08 actual Advisor Class performance is used reflecting all charges and fees applicable to that class. Since 5/15/08 (commencement of sales), the cumulative and average annual total returns of Advisor Class shares were +16.29% and +4.45%.
9. Source: © 2011 Morningstar. The BC U.S. Government/Credit Index: 1-3 Year Component includes dollar-denominated investment grade corporate debt and non-native currency agency and local authority debt, sovereign, supranational, and taxable municipal debt, public obligations of the U.S. Treasury with at least one year up to, but not including, three years to final maturity, and publicly issued debt of U.S. government agencies, quasi-federal corporations, and corporate or foreign debt guaranteed by the U.S. government.

Your Fund’s Expenses
Franklin Low Duration Total Return Fund
As a Fund shareholder, you can incur two types of costs:
- Transaction costs, including sales charges (loads) on Fund purchases; and
- Ongoing Fund costs, including management fees, distribution and service (12b-1) fees, and other Fund expenses. All mutual funds have ongoing costs, sometimes referred to as operating expenses.
The following table shows ongoing costs of investing in the Fund and can help you understand these costs and compare them with those of other mutual funds. The table assumes a $1,000 investment held for the six months indicated.
Actual Fund Expenses
The first line (Actual) for each share class listed in the table provides actual account values and expenses. The “Ending Account Value” is derived from the Fund’s actual return, which includes the effect of Fund expenses.
You can estimate the expenses you paid during the period by following these steps. Of course, your account value and expenses will differ from those in this illustration:
| 1. | Divide your account value by $1,000. |
| If an account had an $8,600 value, then $8,600 ÷ $1,000 = 8.6. | |
| 2. | Multiply the result by the number under the heading “Expenses Paid During Period.” |
| If Expenses Paid During Period were $7.50, then 8.6 x $7.50 = $64.50. |
In this illustration, the estimated expenses paid this period are $64.50.
Hypothetical Example for Comparison with Other Funds
Information in the second line (Hypothetical) for each class in the table can help you compare ongoing costs of investing in the Fund with those of other mutual funds. This information may not be used to estimate the actual ending account balance or expenses you paid during the period. The hypothetical “Ending Account Value” is based on the actual expense ratio for each class and an assumed 5% annual rate of return before expenses, which does not represent the Fund’s actual return. The figure under the heading “Expenses Paid During Period” shows the hypothetical expenses your account would have incurred under this scenario. You can compare this figure with the 5% hypothetical examples that appear in shareholder reports of other funds.
36 | Annual Report
Your Fund’s Expenses (continued)
Please note that expenses shown in the table are meant to highlight ongoing costs and do not reflect any transaction costs, such as sales charges. Therefore, the second line for each class is useful in comparing ongoing costs only, and will not help you compare total costs of owning different funds. In addition, if transaction costs were included, your total costs would have been higher. Please refer to the Fund prospectus for additional information on operating expenses.
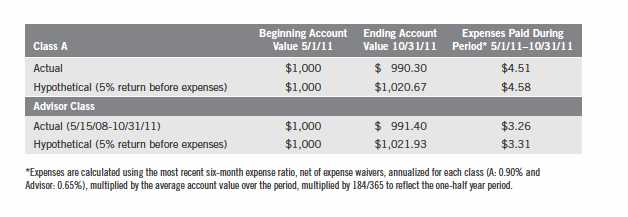
Annual Report | 37
Franklin Total Return Fund
Your Fund’s Goals and Main Investments: Franklin Total Return Fund seeks to provide investors with high current income consistent with preservation of capital. Capital appreciation over the long term is a secondary goal. The Fund invests at least 80% of its assets in investment-grade debt securities. The Fund focuses on government and corporate debt securities and mortgage- and asset-backed securities.
This annual report for Franklin Total Return Fund covers the fiscal year ended October 31, 2011.
Performance Overview
Franklin Total Return Fund – Class A posted a cumulative total return of +4.26% for the 12 months under review. The Fund underperformed the +5.00% total return of its benchmark, the Barclays Capital (BC) U.S. Aggregate Index, which measures the U.S. investment-grade, fixed-rate, taxable bond market with index components for government and corporate, mortgage pass-through and asset-backed securities.1 You can find the Fund’s long-term performance data in the Performance Summary beginning on page 42.
Investment Strategy
We seek to invest in a combination of fixed income securities, predominantly from across the investment-grade debt universe. We analyze securities using proprietary and nonproprietary research to help us identify attractive investment opportunities, across the entire fixed income opportunity set, on a relative basis. The Fund may also invest up to 20% of its total assets in noninvestment-grade debt securities. In addition, we may use derivative transactions, such as currency and cross-currency forwards, futures contracts and swap agreements to obtain net long or short exposures to selected currencies, interest rates, countries, duration or credit risks.
1. Source: © 2011 Morningstar. All Rights Reserved. The information contained herein: (1) is proprietary to Morningstar and/or its content providers; (2) may not be copied or distributed; and (3) is not warranted to be accurate, complete or timely. Neither Morningstar nor its content providers are responsible for any damages or losses arising from any use of this information. The index is unmanaged and includes reinvested interest. One cannot invest directly in an index, and an index is not representative of the Fund’s portfolio.
The dollar value, number of shares or principal amount, and names of all portfolio holdings are listed in the Fund’s Statement of Investments (SOI). The SOI begins on page 96.
38 | Annual Report
Manager’s Discussion
As measured by BC Indexes, the U.S. Corporate Investment Grade Index posted the best absolute performance (+6.14%) among some of the fixed income sectors in which the Fund invested during the period.1 Several other major fixed income sectors posted positive returns as well, including the U.S. Corporate High Yield Index (+5.17%), the U.S. Residential MBS Index (+4.53%), the Commercial Mortgage-Backed Securities (CMBS) Index (+4.13%), the Emerging Markets (U.S. Dollar) Index (+3.75%), the Asset-Backed Securities Index (+3.08%) and the U.S. Agency Index (+2.73%).1
During the reporting period, we continued to feel many of the best opportunities in global bond markets were outside the U.S. Accordingly, the Fund maintained an overweighted exposure to international bonds and currencies. Foreign bonds and currencies, including emerging market debt, contributed to returns. The Fund benefited from strong CMBS performance. Although we decreased the overall amount of CMBS in the Fund, we found what we considered opportunities in lower credit quality CMBS that offered attractive yields and solid fundamental value, in our assessment. We maintained a small exposure to municipal bonds during the period, which we believe offered better value than U.S. Treasuries and have low historical default rates compared with other credit sectors.
Annual Report | 39
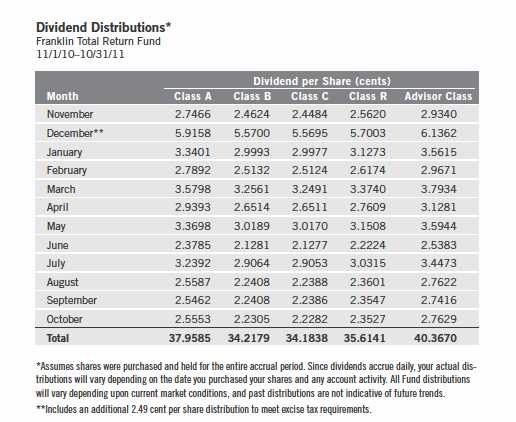
We took the opportunity during the period to decrease the Fund’s exposure to select below investment-grade corporate securities, including high yield and floating rate bank loan debt, which delivered strong performance and became more fairly valued, in our view. Although we tempered our expectations due to concerns about European sovereign and bank credit, the Fund maintained an overweighted allocation to corporate credit sectors as valuations remained attractive to us on a longer term basis. The Fund’s positioning in below investment-grade credit sectors detracted from performance as these sectors were negatively affected by risk aversion. Our lower interest rate risk positioning, relative to the benchmark, detracted from performance as interest rates declined over the period. The Fund’s municipal bond allocation underperformed Treasuries and negatively impacted the Fund. Our lower weighting in agency mortgages, relative to the benchmark, detracted from performance as these sectors produced positive performance during the period.
40 | Annual Report
Thank you for your continued participation in Franklin Total Return Fund.
We look forward to serving your future investment needs.
The foregoing information reflects our analysis, opinions and portfolio holdings as of October 31, 2011, the end of the reporting period. The way we implement our main investment strategies and the resulting portfolio holdings may change depending on factors such as market and economic conditions. These opinions may not be relied upon as investment advice or an offer for a particular security. The information is not a complete analysis of every aspect of any market, country, industry, security or the Fund. Statements of fact are from sources considered reliable, but the investment manager makes no representation or warranty as to their completeness or accuracy. Although historical performance is no guarantee of future results, these insights may help you understand our investment management philosophy.
Annual Report | 41
Performance Summary as of 10/31/11
Franklin Total Return Fund
Your dividend income will vary depending on dividends or interest paid by securities in the Fund’s portfolio, adjusted for operating expenses of each class. Capital gain distributions are net profits realized from the sale of portfolio securities. The performance table and graphs do not reflect any taxes that a shareholder would pay on Fund dividends, capital gain distributions, if any, or any realized gains on the sale of Fund shares. Total return reflects reinvestment of the Fund’s dividends and capital gain distributions, if any, and any unrealized gains or losses.

42 | Annual Report
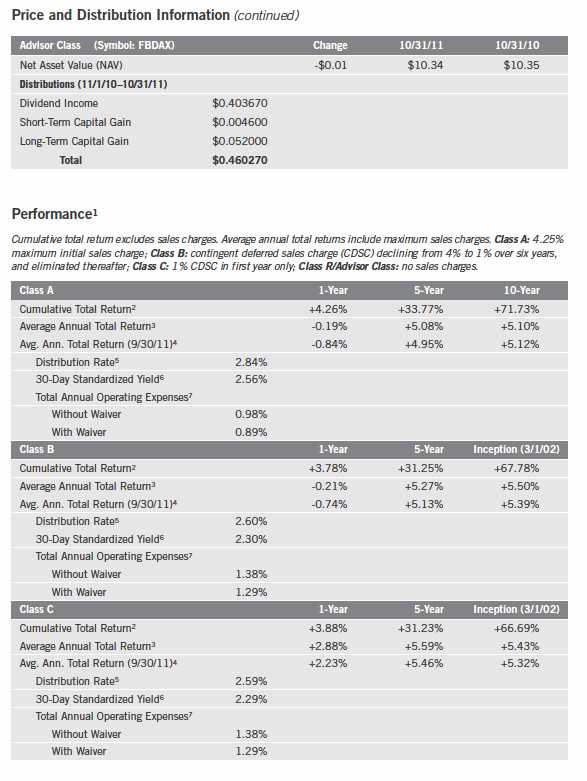
Performance Summary (continued)
Annual Report | 43
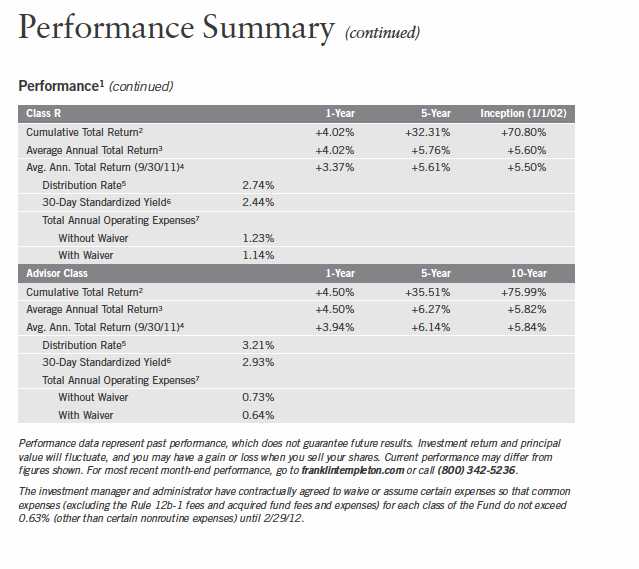
44 | Annual Report
Performance Summary (continued)
Total Return Index Comparison for a Hypothetical $10,000 Investment1
Total return represents the change in value of an investment over the periods shown. It includes any current, applicable, maximum sales charge, Fund expenses, account fees and reinvested distributions. The unmanaged index includes reinvestment of any income or distributions. It differs from the Fund in composition and does not pay management fees or expenses. One cannot invest directly in an index.

Annual Report | 45
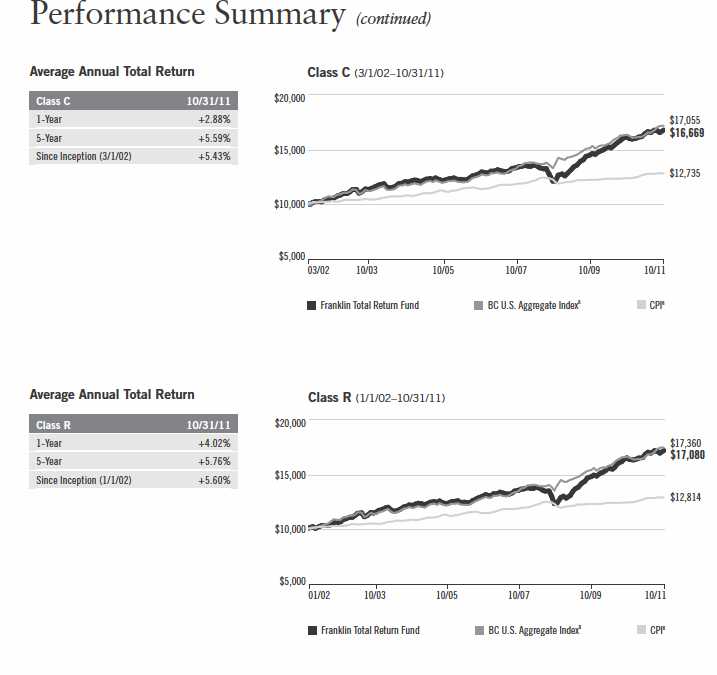
46 | Annual Report
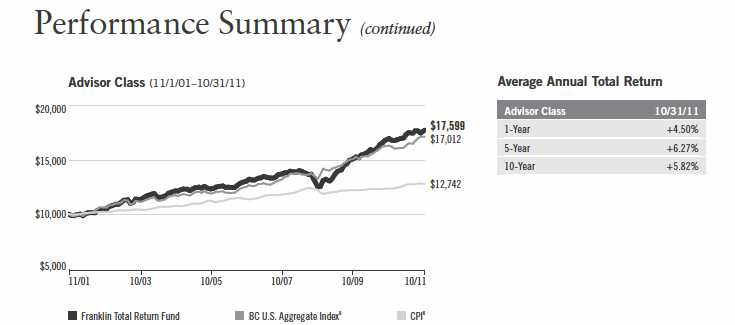
Endnotes
Interest rate movements and mortgage prepayments will affect the Fund’s share price and yield. Bond prices generally move in the opposite direction of interest rates. Thus, as prices of bonds in the Fund adjust to a rise in interest rates, the Fund’s share price may decline. Investing in derivative securities such as financial futures and option contracts involves special risks. The risks associated with higher yielding, lower rated securities (commonly called junk bonds) include higher risk of default and loss of principal. Investment in foreign securities also involves special risks, including currency fluctuations, and political and economic uncertainty. Investing in derivative securities, such as financial futures and option contracts, and the use of foreign currency techniques involve special risks as such techniques may not achieve the anticipated benefits and/or may result in losses to the Fund. The Fund is actively managed but there is no guarantee that the manager’s investment decisions will produce the desired results. The Fund’s prospectus also includes a description of the main investment risks.
Class B: These shares have higher annual fees and expenses than Class A shares.
Class C: Prior to 1/1/04, these shares were offered with an initial sales charge; thus actual total returns would have differed. These shares have higher annual fees and expenses than Class A shares.
Class R: Shares are available to certain eligible investors as described in the prospectus. These shares have higher annual fees and expenses than Class A shares.
Advisor Class: Shares are available to certain eligible investors as described in the prospectus.
1. If the manager and administrator had not waived fees, the Fund’s distribution rates and total returns would have been lower, and yields for the period would have been 2.53%, 2.25%, 2.24%, 2.39% and 2.88% for Classes A, B, C, R and Advisor, respectively.
2. Cumulative total return represents the change in value of an investment over the periods indicated.
3. Average annual total return represents the average annual change in value of an investment over the periods indicated.
4. In accordance with SEC rules, we provide standardized average annual total return information through the latest calendar quarter.
5. Distribution rate is based on an annualization of the sum of the respective class’s past 30 days’ daily distributions and the maximum offering price (NAV for Classes B, C, R and Advisor) per share on 10/31/11.
6. The 30-day standardized yield for the 30 days ended 10/31/11 reflects an estimated yield to maturity (assuming all portfolio securities are held to maturity). It should be regarded as an estimate of the Fund’s rate of investment income, and it may not equal the Fund’s actual income distribution rate (which reflects the Fund’s past dividends paid to shareholders) or the income reported in the Fund’s financial statements.
7. Figures are as stated in the Fund’s prospectus current as of the date of this report. In periods of market volatility, assets may decline significantly, causing total annual Fund operating expenses to become higher than the figures shown.
8. Source: © 2011 Morningstar. The BC U.S. Aggregate Index is a market capitalization-weighted index representing the U.S. investment-grade, fixed-rate, taxable bond market with index components for government and corporate, mortgage pass-through and asset-backed securities. All issues included are SEC registered, taxable, dollar denominated and nonconvertible, must have at least one year to final maturity and must be rated investment grade (Baa3/BBB-/BBB- or higher) using the middle rating of Moody’s, Standard & Poor’s and Fitch, respectively. The Consumer Price Index (CPI), calculated by the U.S. Bureau of Labor Statistics, is a commonly used measure of the inflation rate.

Your Fund’s Expenses
Franklin Total Return Fund
As a Fund shareholder, you can incur two types of costs:
• Transaction costs, including sales charges (loads) on Fund purchases; and
• Ongoing Fund costs, including management fees, distribution and service (12b-1) fees, and other Fund expenses. All mutual funds have ongoing costs, sometimes referred to as operating expenses.
The following table shows ongoing costs of investing in the Fund and can help you understand these costs and compare them with those of other mutual funds. The table assumes a $1,000 investment held for the six months indicated.
Actual Fund Expenses
The first line (Actual) for each share class listed in the table provides actual account values and expenses. The “Ending Account Value” is derived from the Fund’s actual return, which includes the effect of Fund expenses.
You can estimate the expenses you paid during the period by following these steps. Of course, your account value and expenses will differ from those in this illustration:
1. Divide your account value by $1,000.
If an account had an $8,600 value, then $8,600 ÷ $1,000 = 8.6.
2. Multiply the result by the number under the heading “Expenses Paid During Period.”
If Expenses Paid During Period were $7.50, then 8.6 x $7.50 = $64.50.
In this illustration, the estimated expenses paid this period are $64.50.
Hypothetical Example for Comparison with Other Funds
Information in the second line (Hypothetical) for each class in the table can help you compare ongoing costs of investing in the Fund with those of other mutual funds. This information may not be used to estimate the actual ending account balance or expenses you paid during the period. The hypothetical “Ending Account Value” is based on the actual expense ratio for each class and an assumed 5% annual rate of return before expenses, which does not represent the Fund’s actual return. The figure under the heading “Expenses Paid During Period” shows the hypothetical expenses your account would have incurred under this scenario. You can compare this figure with the 5% hypothetical examples that appear in shareholder reports of other funds.
48 | Annual Report
Your Fund’s Expenses (continued)
Please note that expenses shown in the table are meant to highlight ongoing costs and do not reflect any transaction costs, such as sales charges. Therefore, the second line for each class is useful in comparing ongoing costs only, and will not help you compare total costs of owning different funds. In addition, if transaction costs were included, your total costs would have been higher. Please refer to the Fund prospectus for additional information on operating expenses.

Franklin Investors Securities Trust
Financial Highlights

aThe amount shown for a share outstanding throughout the period may not correlate with the Statement of Operations for the period due to the timing of sales and repurchases of the Fund shares in relation to income earned and/or fluctuating market value of the investments of the Fund. bEffective September 1, 2008, the redemption fee was eliminated. cAmount rounds to less than $0.001 per share. dTotal return does not reflect sales commissions or contingent deferred sales charges, if applicable. eBenefit of expense reduction rounds to less than 0.01%.
50 | The accompanying notes are an integral part of these financial statements. | Annual Report
Franklin Investors Securities Trust
Financial Highlights (continued)
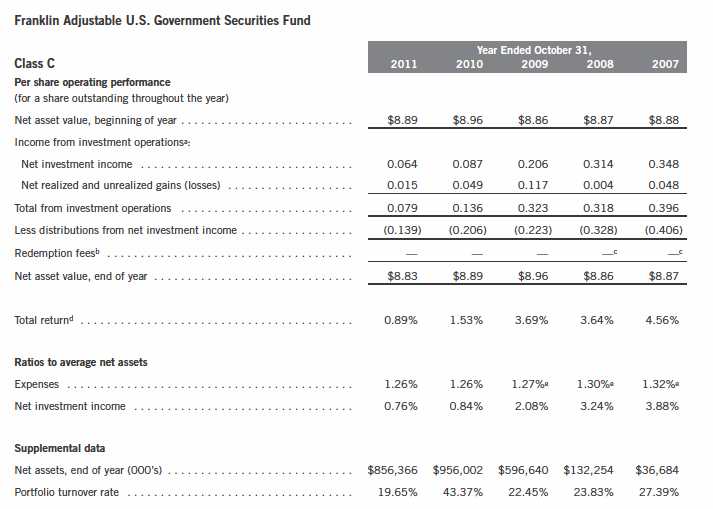
aThe amount shown for a share outstanding throughout the period may not correlate with the Statement of Operations for the period due to the timing of sales and repurchases of the Fund shares in relation to income earned and/or fluctuating market value of the investments of the Fund. bEffective September 1, 2008, the redemption fee was eliminated. cAmount rounds to less than $0.001 per share. dTotal return does not reflect sales commissions or contingent deferred sales charges, if applicable. eBenefit of expense reduction rounds to less than 0.01%.
Annual Report | The accompanying notes are an integral part of these financial statements. | 51
Franklin Investors Securities Trust
Financial Highlights (continued)
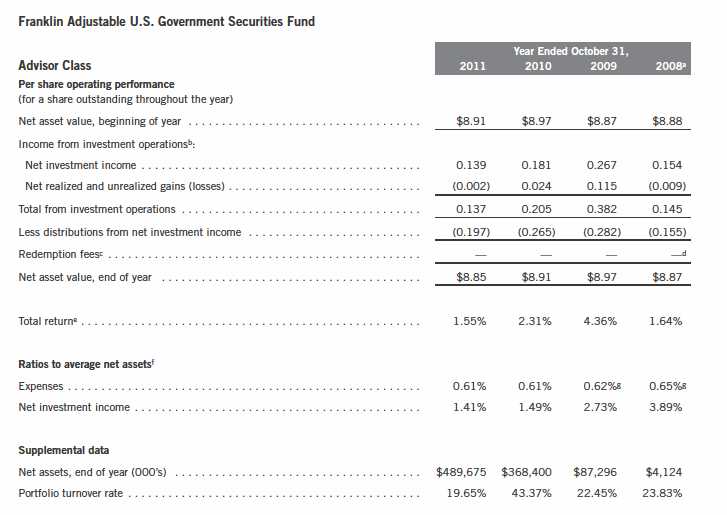
aFor the period May 15, 2008 (effective date) to October 31, 2008. bThe amount shown for a share outstanding throughout the period may not correlate with the Statement of Operations for the period due to the timing of sales and repurchases of the Fund shares in relation to income earned and/or fluctuating market value of the investments of the Fund. cEffective September 1, 2008, the redemption fee was eliminated. dAmount rounds to less than $0.001 per share. eTotal return is not annualized for periods less than one year. fRatios are annualized for periods less than one year. gBenefit of expense reduction rounds to less than 0.01%.
52 | The accompanying notes are an integral part of these financial statements. | Annual Report
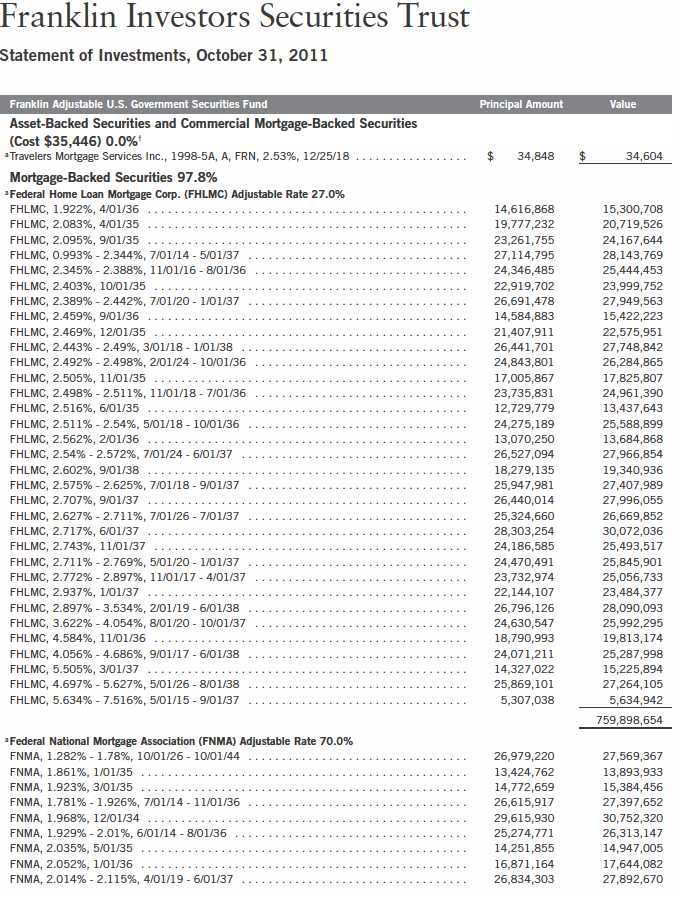
Annual Report | 53
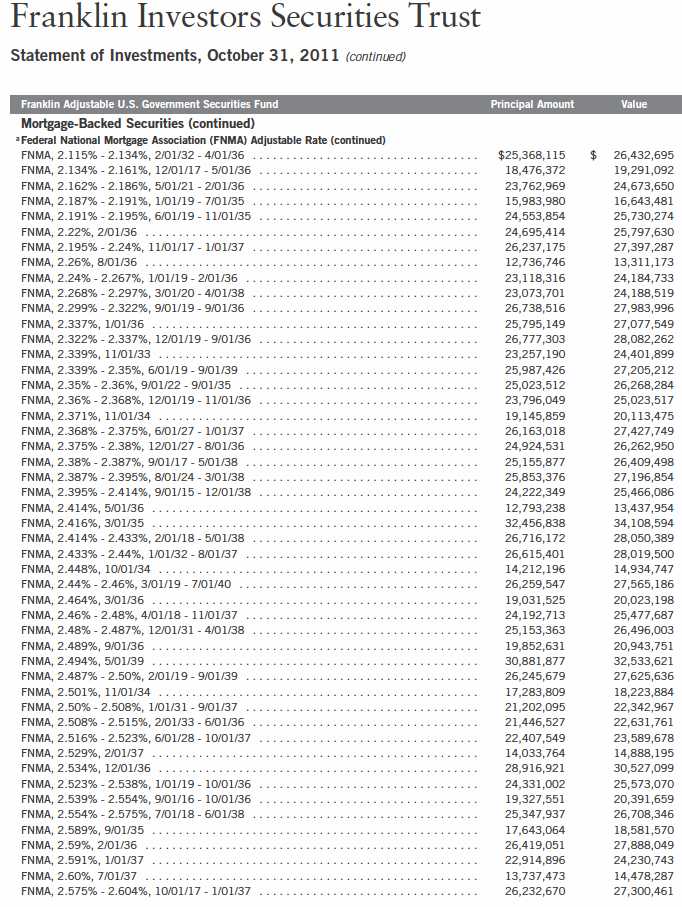
54 | Annual Report
Franklin Investors Securities Trust
Statement of Investments, October 31, 2011 (continued)
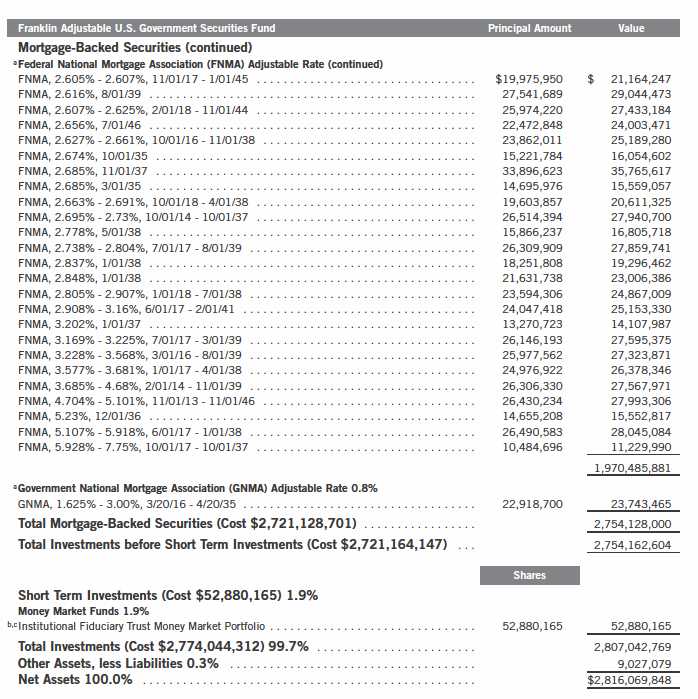
| See Abbreviations on page 151. | ||
| †Rounds to less than 0.1% of net assets. | ||
| aThe coupon rate shown represents the rate at period end. | ||
| bNon-income producing. | ||
| cSee Note 7 regarding investments in the Institutional Fiduciary Trust Money Market Portfolio. | ||
| Annual Report | The accompanying notes are an integral part of these financial statements. | | | 55 |
Franklin Investors Securities Trust
Financial Highlights
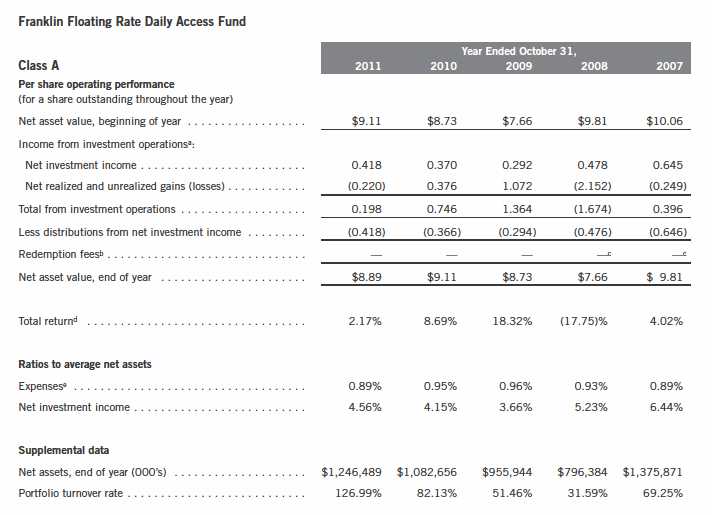
| aThe amount shown for a share outstanding throughout the period may not correlate with the Statement of Operations for the period due to the timing of sales and repurchases of |
| the Fund shares in relation to income earned and/or fluctuating market value of the investments of the Fund. |
| bEffective September 1, 2008, the redemption fee was eliminated. |
| cAmount rounds to less than $0.001 per share. |
| dTotal return does not reflect sales commissions or contingent deferred sales charges, if applicable. |
| eBenefit of expense reduction rounds to less than 0.01%. |
56 | The accompanying notes are an integral part of these financial statements. | Annual Report
Franklin Investors Securities Trust
Financial Highlights (continued)
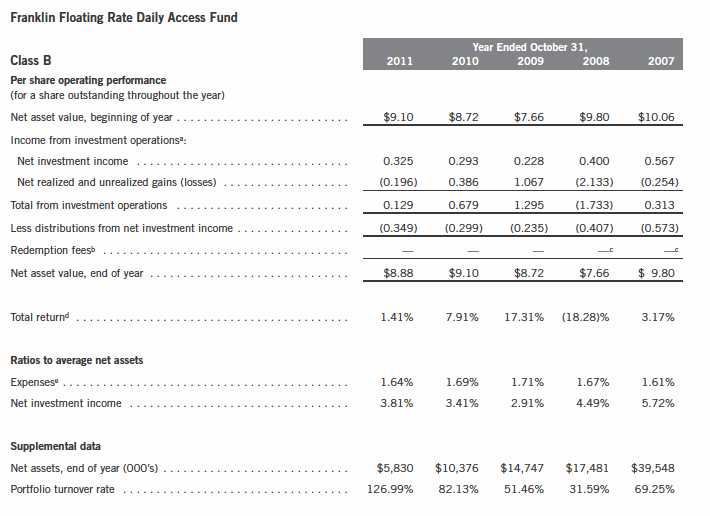
| aThe amount shown for a share outstanding throughout the period may not correlate with the Statement of Operations for the period due to the timing of sales and repurchases of |
| the Fund shares in relation to income earned and/or fluctuating market value of the investments of the Fund. |
| bEffective September 1, 2008, the redemption fee was eliminated. |
| cAmount rounds to less than $0.001 per share. |
| dTotal return does not reflect sales commissions or contingent deferred sales charges, if applicable. |
| eBenefit of expense reduction rounds to less than 0.01%. |
Annual Report | The accompanying notes are an integral part of these financial statements. | 57
Franklin Investors Securities Trust
Financial Highlights (continued)
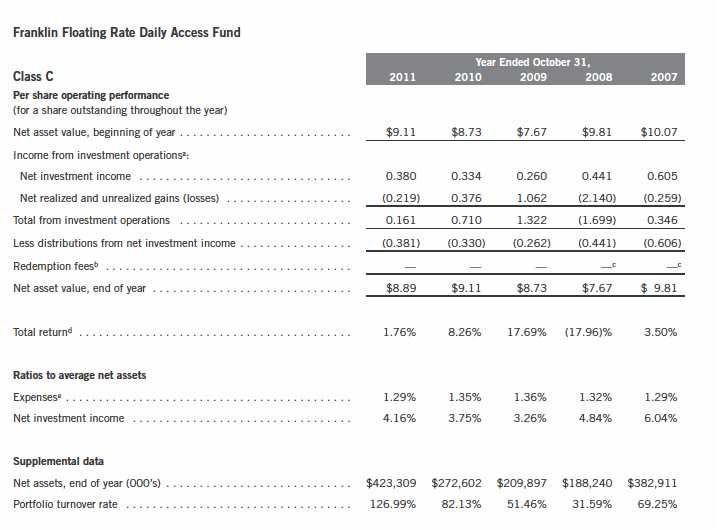
| aThe amount shown for a share outstanding throughout the period may not correlate with the Statement of Operations for the period due to the timing of sales and repurchases of |
| the Fund shares in relation to income earned and/or fluctuating market value of the investments of the Fund. |
| bEffective September 1, 2008, the redemption fee was eliminated. |
| cAmount rounds to less than $0.001 per share. |
| dTotal return does not reflect sales commissions or contingent deferred sales charges, if applicable. |
| eBenefit of expense reduction rounds to less than 0.01%. |
58 | The accompanying notes are an integral part of these financial statements. | Annual Report
Franklin Investors Securities Trust
Financial Highlights (continued)
| aThe amount shown for a share outstanding throughout the period may not correlate with the Statement of Operations for the period due to the timing of sales and repurchases of |
| the Fund shares in relation to income earned and/or fluctuating market value of the investments of the Fund. |
| bEffective September 1, 2008, the redemption fee was eliminated. |
| cAmount rounds to less than $0.001 per share. |
| dBenefit of expense reduction rounds to less than 0.01%. |
Annual Report | The accompanying notes are an integral part of these financial statements. | 59
Franklin Investors Securities Trust
Statement of Investments, October 31, 2011
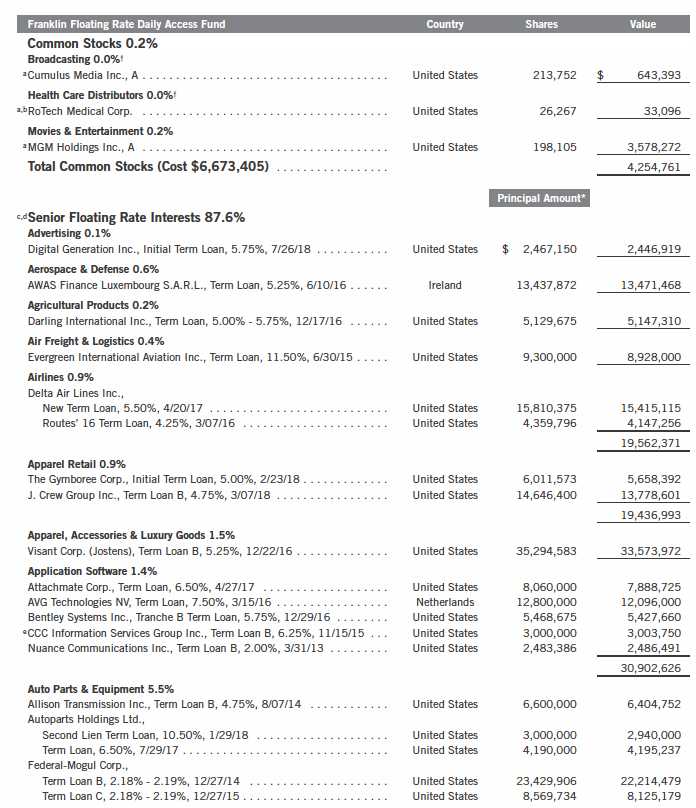
60 | Annual Report
Franklin Investors Securities Trust
Statement of Investments, October 31, 2011 (continued)
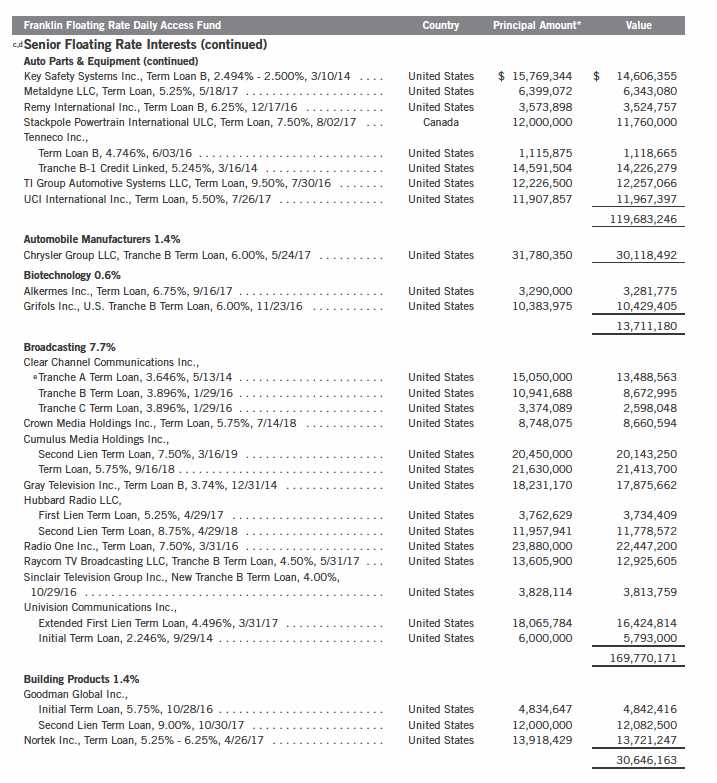
Annual Report | 61
Franklin Investors Securities Trust
Statement of Investments, October 31, 2011 (continued)
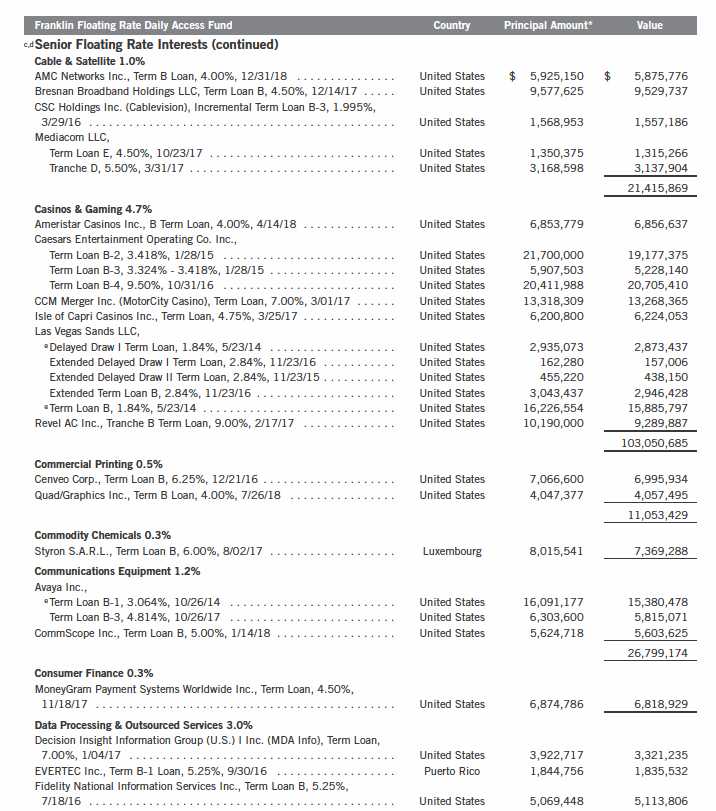
62 | Annual Report
Franklin Investors Securities Trust
Statement of Investments, October 31, 2011 (continued)
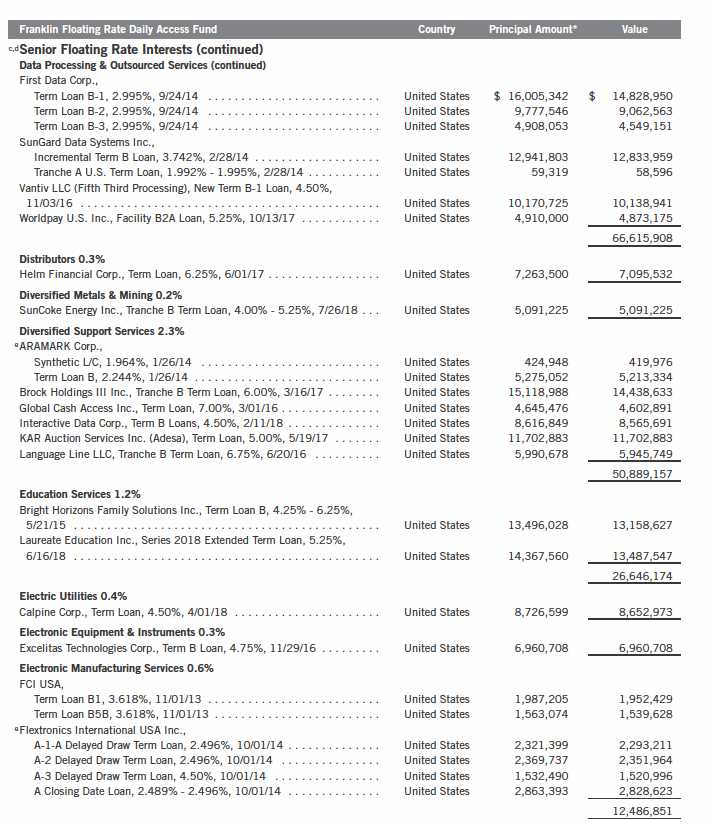
Annual Report | 63
Franklin Investors Securities Trust
Statement of Investments, October 31, 2011 (continued)
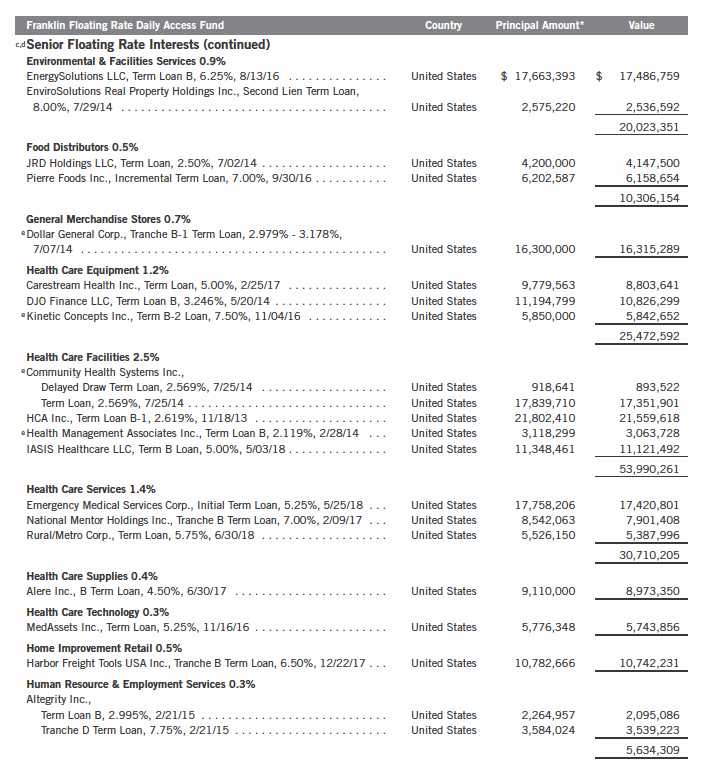
64 | Annual Report
Franklin Investors Securities Trust
Statement of Investments, October 31, 2011 (continued)
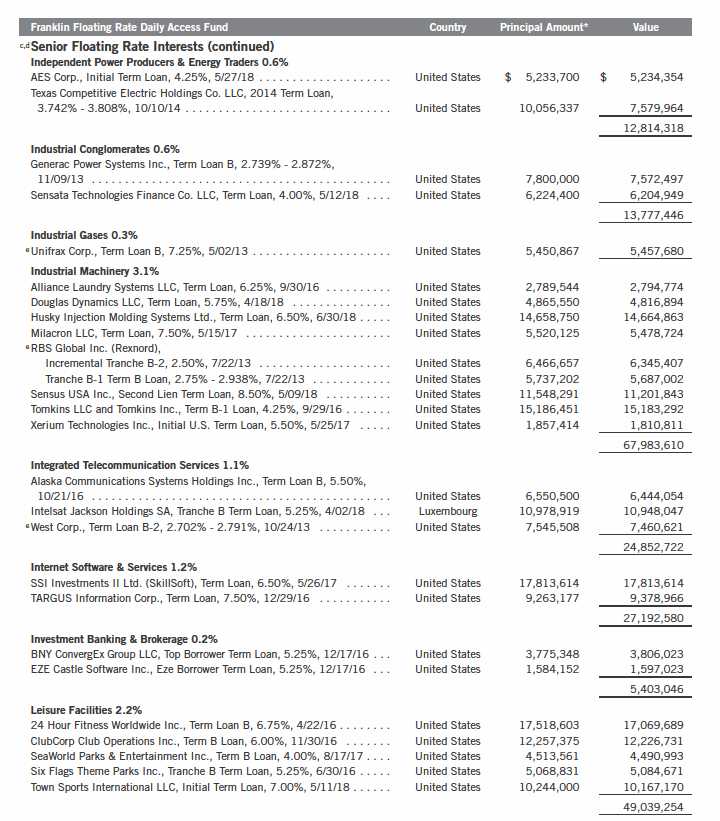
Annual Report | 65
Franklin Investors Securities Trust
Statement of Investments, October 31, 2011 (continued)

66 | Annual Report
Franklin Investors Securities Trust
Statement of Investments, October 31, 2011 (continued)
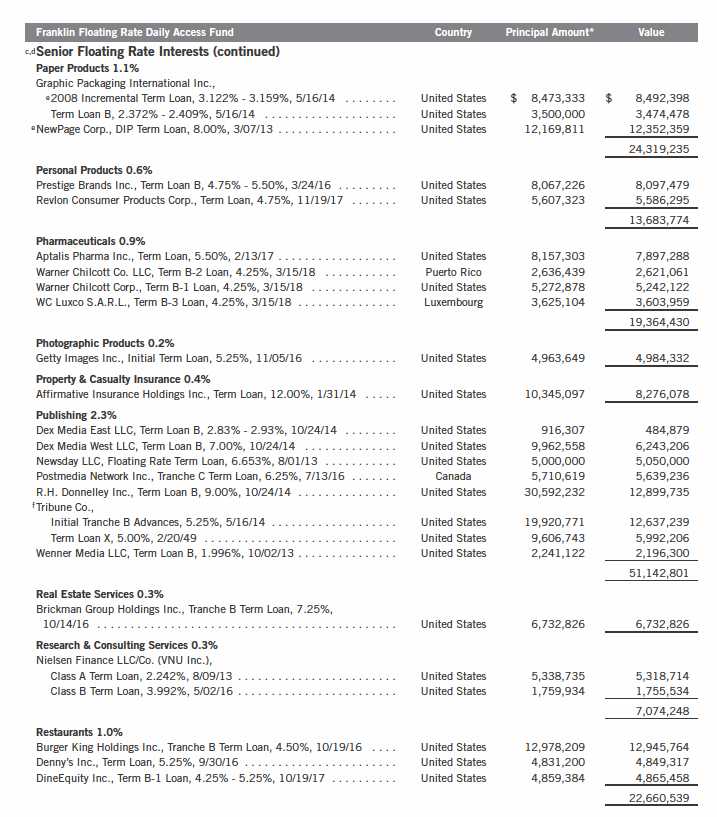
Annual Report | 67
Franklin Investors Securities Trust
Statement of Investments, October 31, 2011 (continued)

68 | Annual Report
| See Abbreviations on page 151. |
| †Rounds to less than 0.1% of net assets. |
| *The principal amount is stated in U.S. dollars unless otherwise indicated. |
| aNon-income producing. |
| bSecurity has been deemed illiquid because it may not be able to be sold within seven days. |
| cThe coupon rate shown represents the rate at period end. |
| dSee Note 1(g) regarding senior floating rate interests. |
| eA portion or all of the security purchased on a delayed delivery basis. See Note 1(c). |
| fSee Note 8 regarding defaulted securities. |
| gSee Note 9 regarding unfunded loan commitments. |
| hSee Note 7 regarding investments in the Institutional Fiduciary Trust Money Market Portfolio. |
Annual Report | The accompanying notes are an integral part of these financial statements. | 69
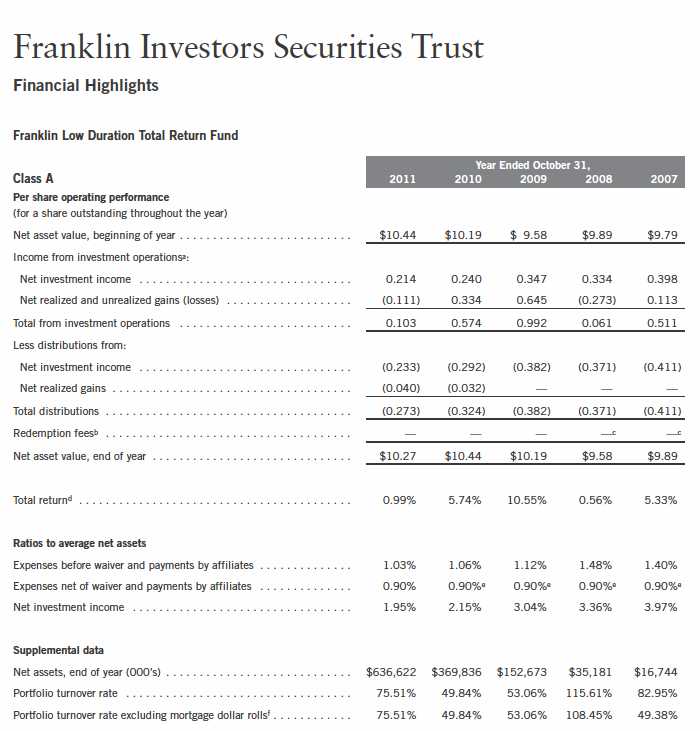
| aThe amount shown for a share outstanding throughout the period may not correlate with the Statement of Operations for the period due to the timing of sales and repurchases of |
| the Fund shares in relation to income earned and/or fluctuating market value of the investments of the Fund. |
| bEffective September 1, 2008, the redemption fee was eliminated. |
| cAmount rounds to less than $0.001 per share. |
| dTotal return does not reflect sales commissions or contingent deferred sales charges, if applicable. |
| eBenefit of expense reduction rounds to less than 0.01%. |
| fSee Note 1(f) regarding mortgage dollar rolls. |
70 | The accompanying notes are an integral part of these financial statements. | Annual Report
Franklin Investors Securities Trust
Financial Highlights (continued)
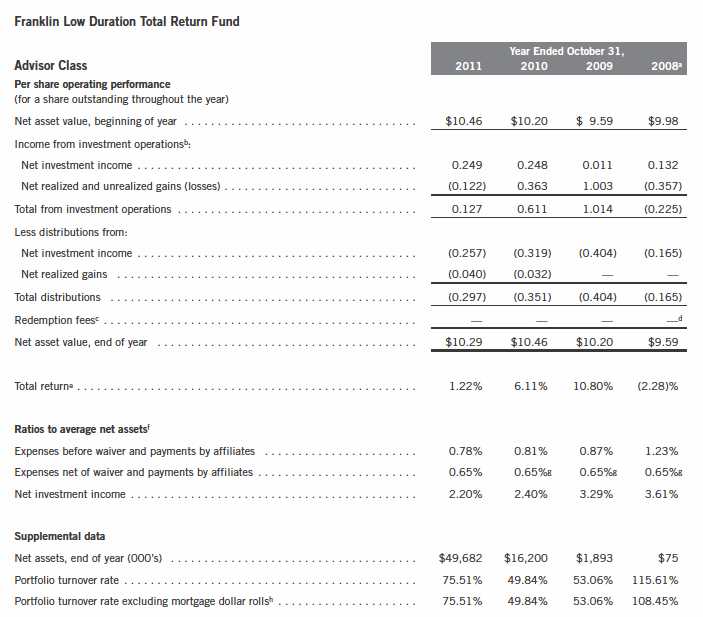
| aFor the period May 15, 2008 (effective date) to October 31, 2008. |
| bThe amount shown for a share outstanding throughout the period may not correlate with the Statement of Operations for the period due to the timing of sales and repurchases of |
| the Fund shares in relation to income earned and/or fluctuating market value of the investments of the Fund. |
| cEffective September 1, 2008, the redemption fee was eliminated. |
| dAmount rounds to less than $0.001 per share. |
| eTotal return is not annualized for periods less than one year. |
| fRatios are annualized for periods less than one year. |
| gBenefit of expense reduction rounds to less than 0.01%. |
| hSee Note 1(f) regarding mortgage dollar rolls. |
Annual Report | The accompanying notes are an integral part of these financial statements. | 71
Franklin Investors Securities Trust
Statement of Investments, October 31, 2011
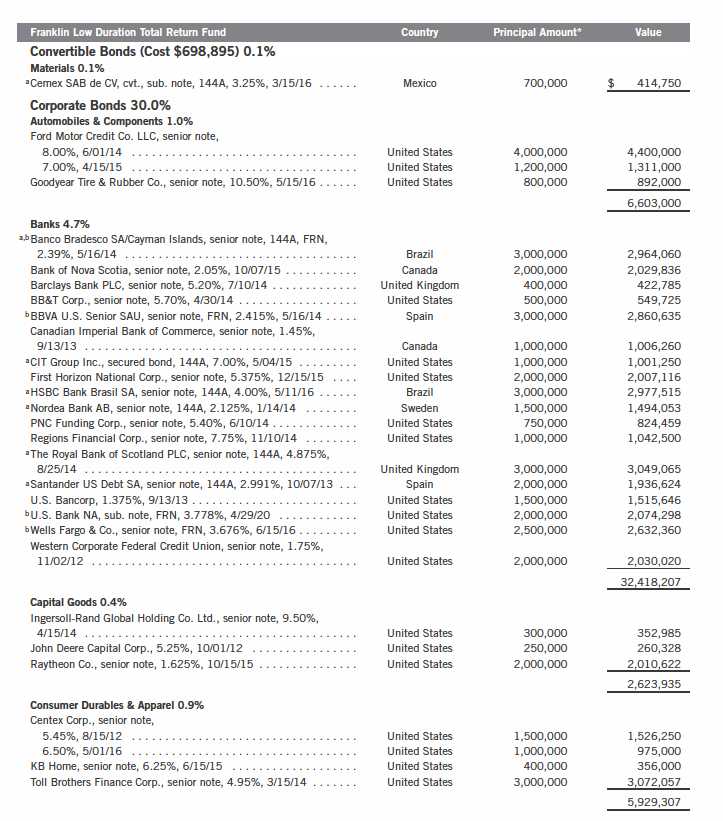
72 | Annual Report
Franklin Investors Securities Trust
Statement of Investments, October 31, 2011 (continued)
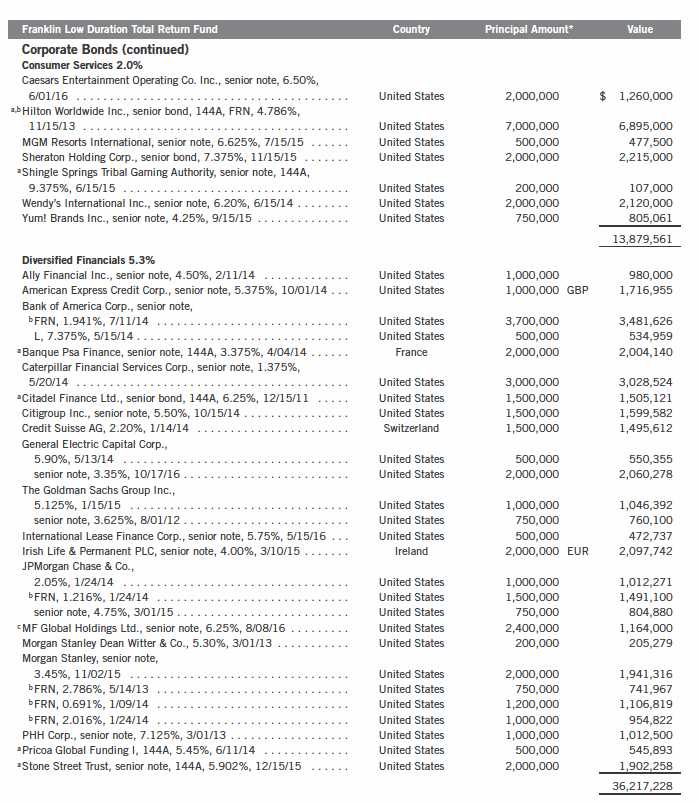
Annual Report | 73
Franklin Investors Securities Trust
Statement of Investments, October 31, 2011 (continued)

74 | Annual Report
Franklin Investors Securities Trust
Statement of Investments, October 31, 2011 (continued)
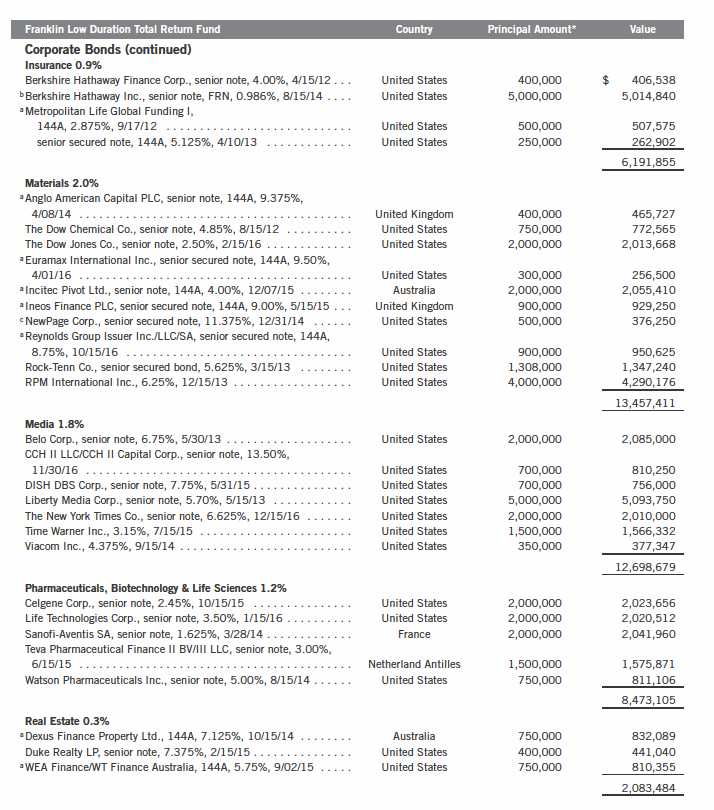
Annual Report | 75
Franklin Investors Securities Trust
Statement of Investments, October 31, 2011 (continued)
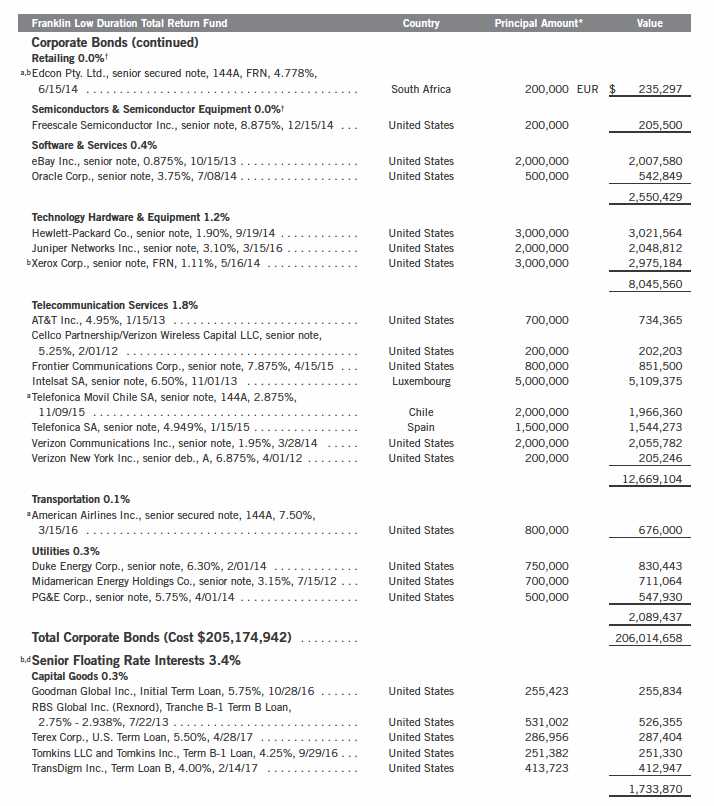
76 | Annual Report
Franklin Investors Securities Trust
Statement of Investments, October 31, 2011 (continued)
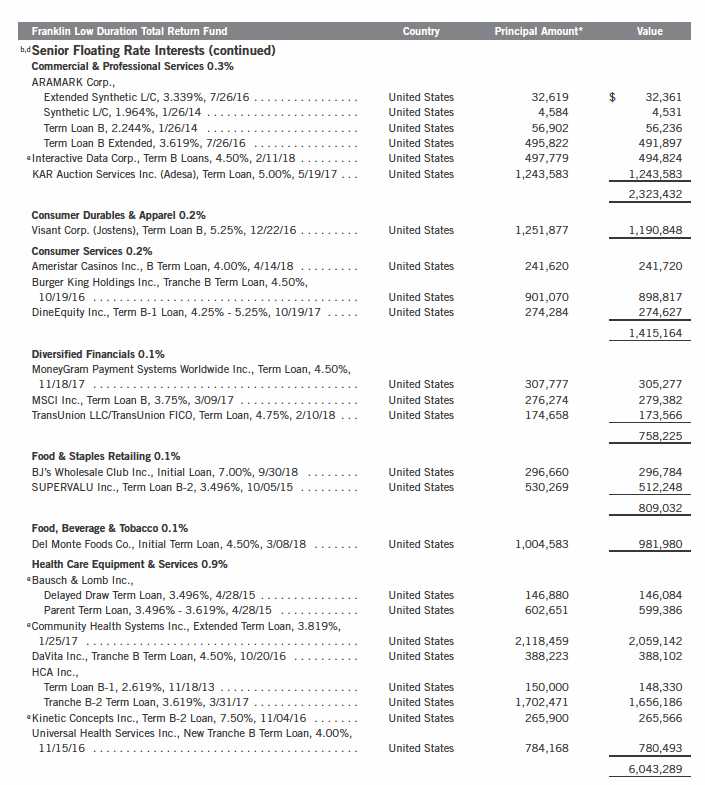
Annual Report | 77
Franklin Investors Securities Trust
Statement of Investments, October 31, 2011 (continued)
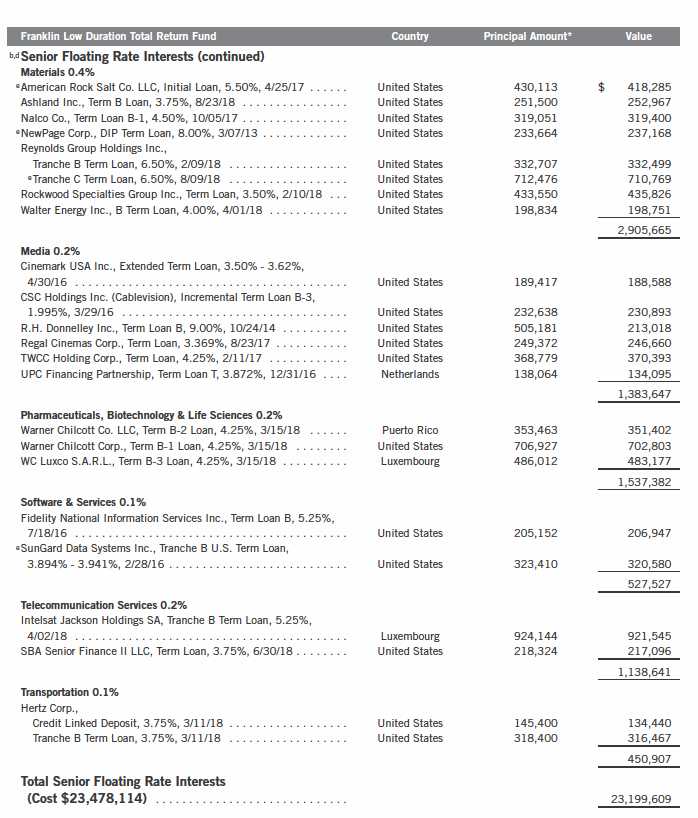
78 | Annual Report
Franklin Investors Securities Trust
Statement of Investments, October 31, 2011 (continued)
Annual Report | 79
Franklin Investors Securities Trust
Statement of Investments, October 31, 2011 (continued)
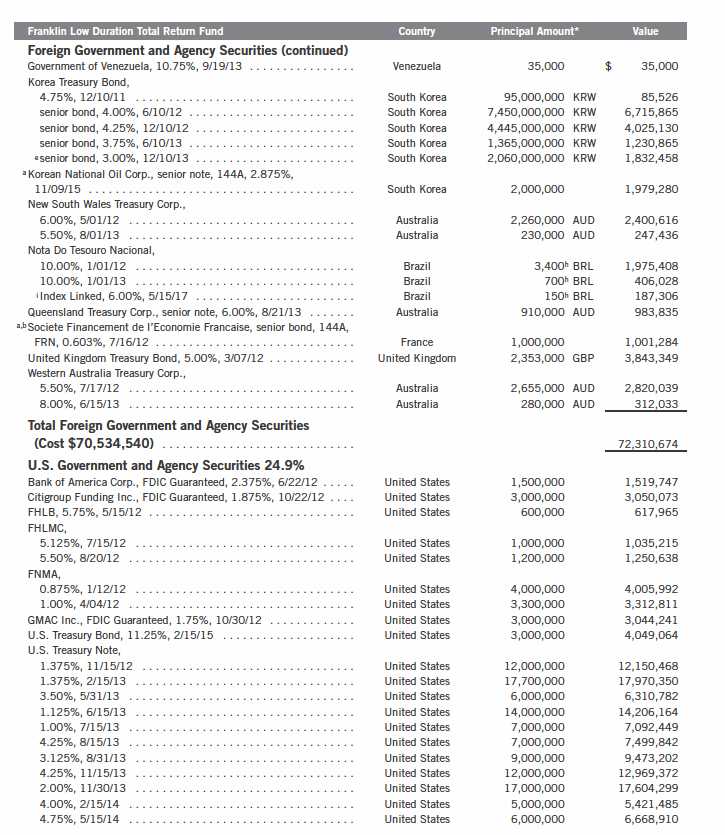
80 | Annual Report
Franklin Investors Securities Trust
Statement of Investments, October 31, 2011 (continued)
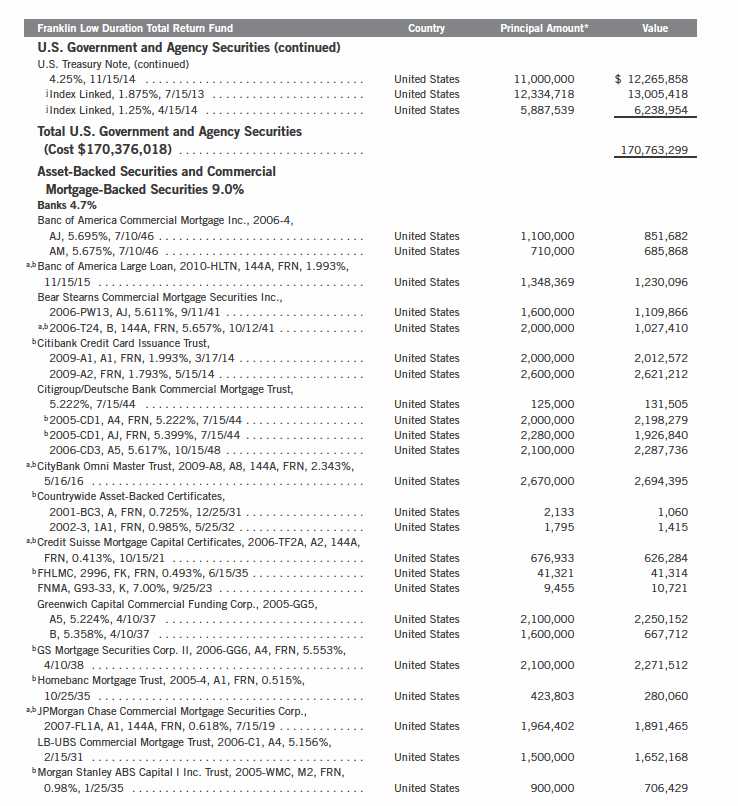
Annual Report | 81
Franklin Investors Securities Trust
Statement of Investments, October 31, 2011 (continued)
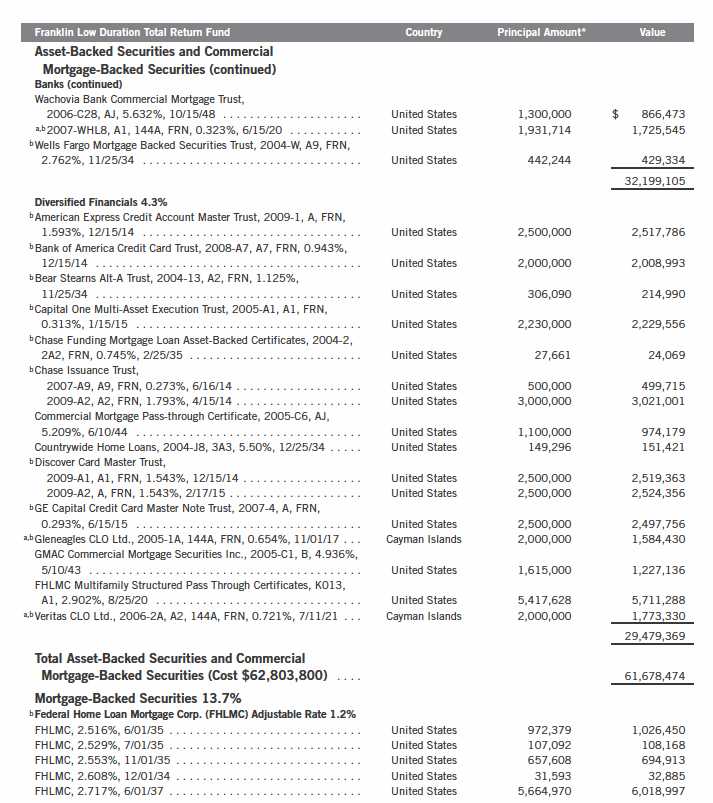
82 | Annual Report
Franklin Investors Securities Trust
Statement of Investments, October 31, 2011 (continued)

Annual Report | 83
Franklin Investors Securities Trust
Statement of Investments, October 31, 2011 (continued)
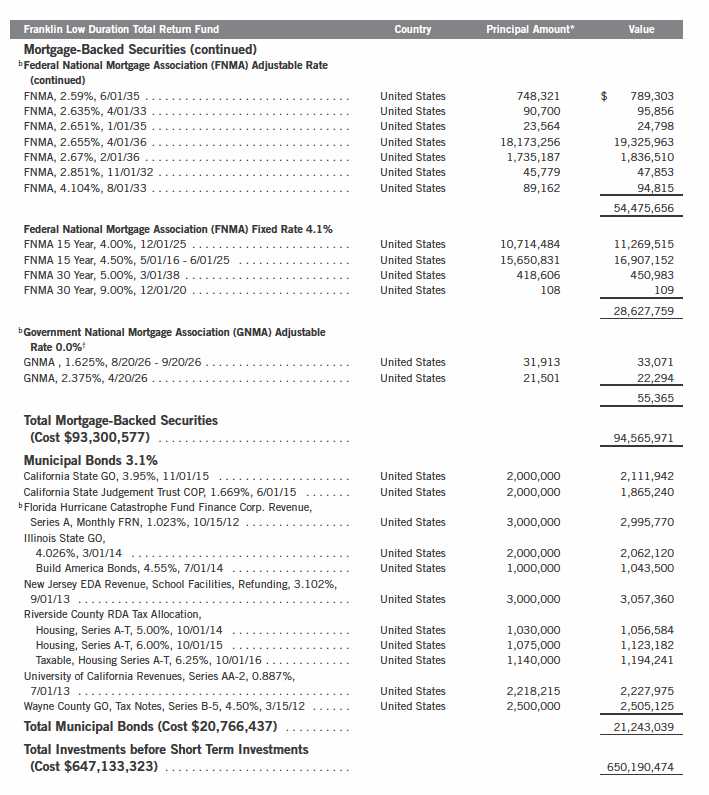
84 | Annual Report
Franklin Investors Securities Trust
Statement of Investments, October 31, 2011 (continued)
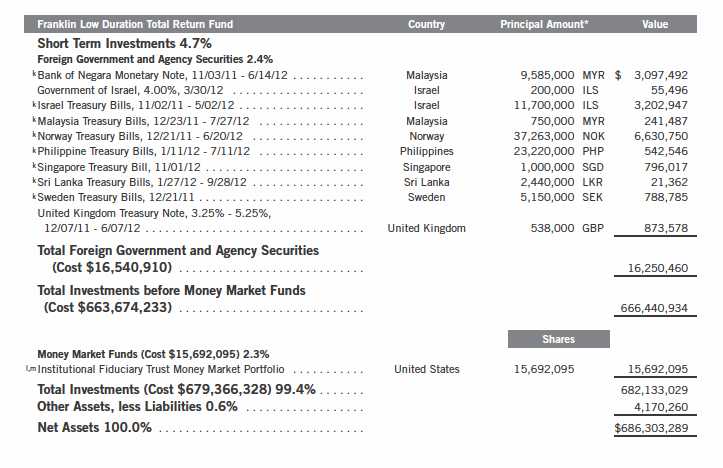
| †Rounds to less than 0.1% of net assets. |
| *The principal amount is stated in U.S. dollars unless otherwise indicated. |
| aSecurity was purchased pursuant to Rule 144A under the Securities Act of 1933 and may be sold in transactions exempt from registration only to qualified institutional buyers or in |
| a public offering registered under the Securities Act of 1933. These securities have been deemed liquid under guidelines approved by the Trust’s Board of Trustees. At October 31, |
| 2011, the aggregate value of these securities was $64,589,766, representing 9.41% of net assets. |
| bThe coupon rate shown represents the rate at period end. |
| cSee Note 8 regarding defaulted securities. |
| dSee Note 1(g) regarding senior floating rate interests. |
| eA portion or all of the security purchased on a delayed delivery basis. See Note 1(c). |
| fThe principal amount is stated in original face, and scheduled paydowns are reflected in the market price on ex-date. |
| gPrincipal amount is stated in 100 Mexican Peso Units. |
| hPrincipal amount is stated in 1,000 Brazilian Real Units. |
| iRedemption price at maturity is adjusted for inflation. See Note 1(i). |
| jPrincipal amount of security is adjusted for inflation. See Note 1(i). |
| kThe security is traded on a discount basis with no stated coupon rate. |
| lNon-income producing. |
| mSee Note 7 regarding investments in the Institutional Fiduciary Trust Money Market Portfolio. |
Annual Report | 85
Franklin Investors Securities Trust
Statement of Investments, October 31, 2011 (continued)

86 | Annual Report
Franklin Investors Securities Trust
Statement of Investments, October 31, 2011 (continued)

Annual Report | 87
Franklin Investors Securities Trust
Statement of Investments, October 31, 2011 (continued)
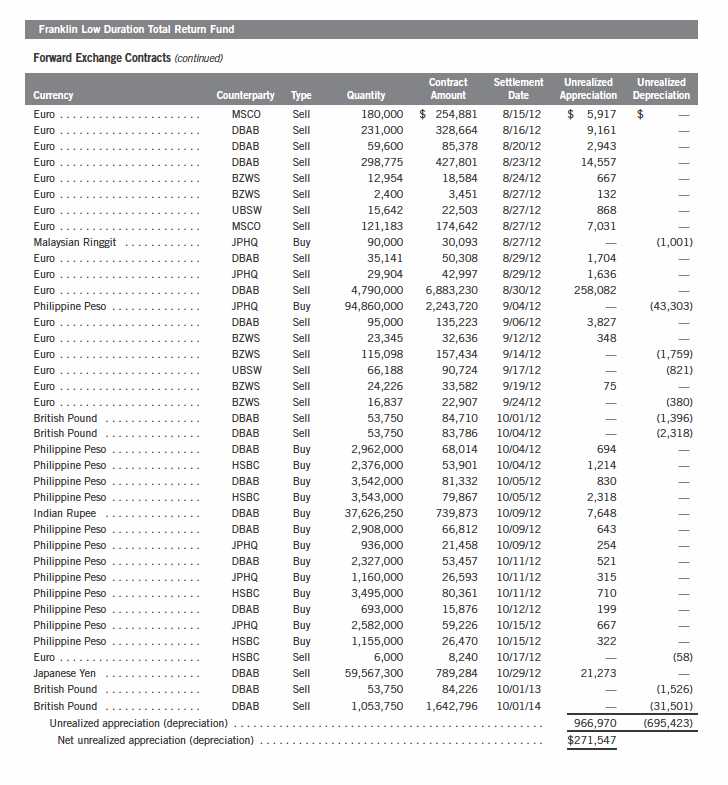
88 | Annual Report
Franklin Investors Securities Trust
Statement of Investments, October 31, 2011 (continued)
Annual Report | 89
Franklin Investors Securities Trust
Statement of Investments, October 31, 2011 (continued)
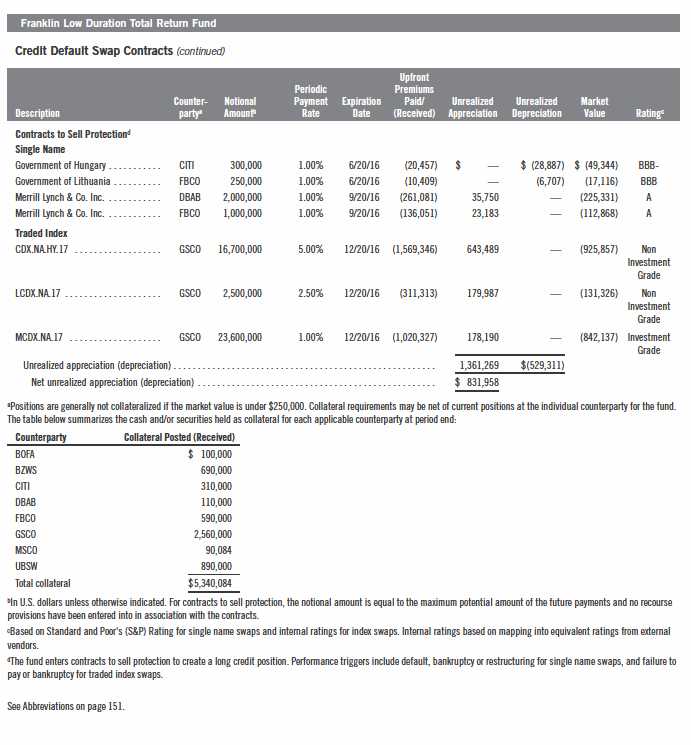
90 | The accompanying notes are an integral part of these financial statements. | Annual Report
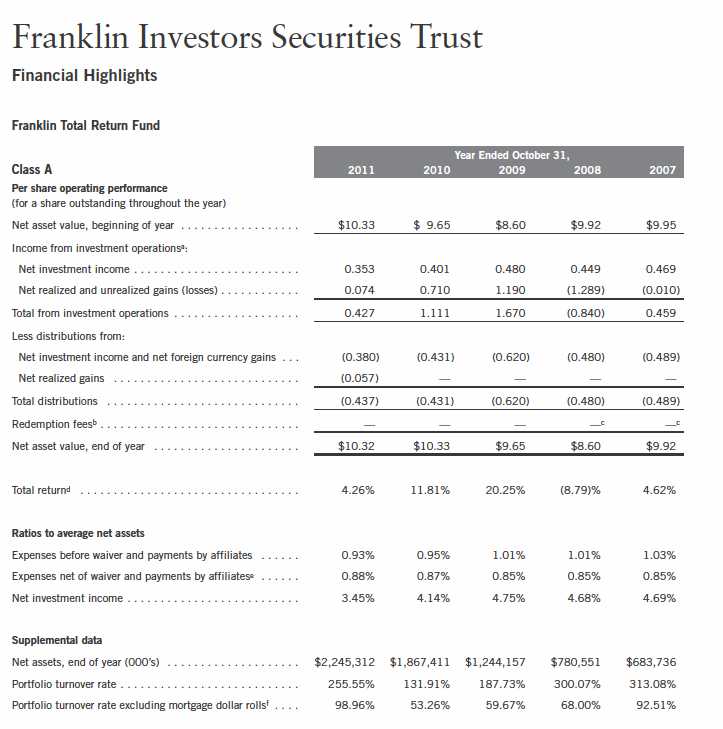
| aThe amount shown for a share outstanding throughout the period may not correlate with the Statement of Operations for the period due to the timing of sales and repurchases of |
| the Fund shares in relation to income earned and/or fluctuating market value of the investments of the Fund. |
| bEffective September 1, 2008, the redemption fee was eliminated. |
| cAmount rounds to less than $0.001 per share. |
| dTotal return does not reflect sales commissions or contingent deferred sales charges, if applicable. |
| eBenefit of expense reduction rounds to less than 0.01%. |
| fSee Note 1(f) regarding mortgage dollar rolls. |
Annual Report | The accompanying notes are an integral part of these financial statements. | 91
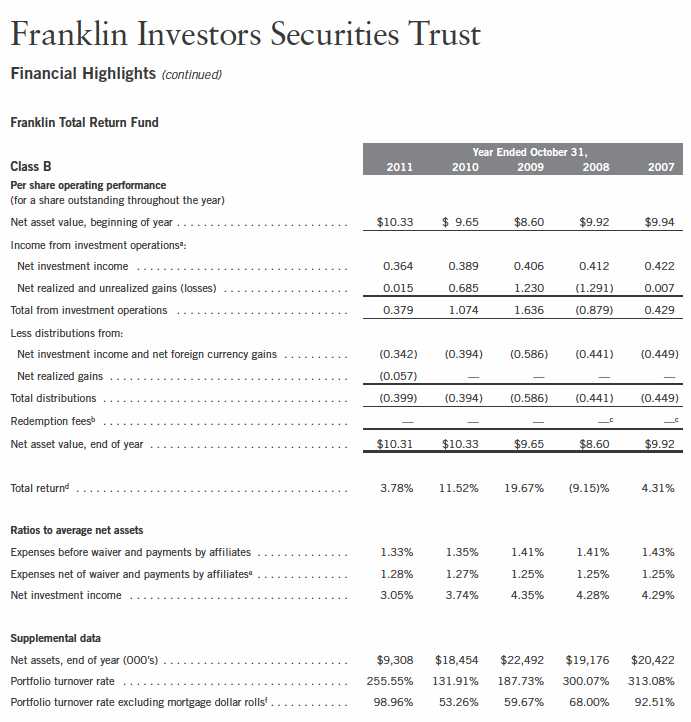
| aThe amount shown for a share outstanding throughout the period may not correlate with the Statement of Operations for the period due to the timing of sales and repurchases of |
| the Fund shares in relation to income earned and/or fluctuating market value of the investments of the Fund. |
| bEffective September 1, 2008, the redemption fee was eliminated. |
| cAmount rounds to less than $0.001 per share. |
| dTotal return does not reflect sales commissions or contingent deferred sales charges, if applicable. |
| eBenefit of expense reduction rounds to less than 0.01%. |
| fSee Note 1(f) regarding mortgage dollar rolls. |
92 | The accompanying notes are an integral part of these financial statements. | Annual Report
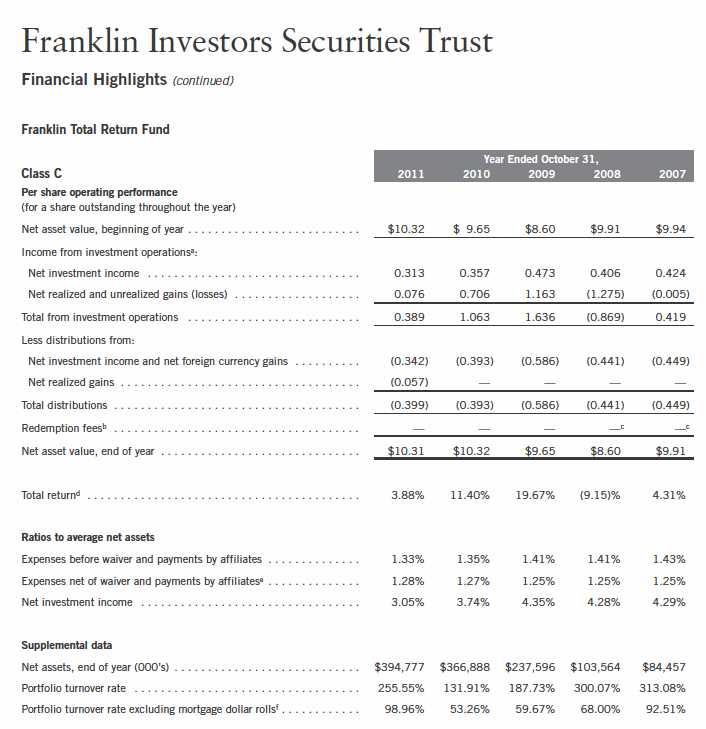
| aThe amount shown for a share outstanding throughout the period may not correlate with the Statement of Operations for the period due to the timing of sales and repurchases of |
| the Fund shares in relation to income earned and/or fluctuating market value of the investments of the Fund. |
| bEffective September 1, 2008, the redemption fee was eliminated. |
| cAmount rounds to less than $0.001 per share. |
| dTotal return does not reflect sales commissions or contingent deferred sales charges, if applicable. |
| eBenefit of expense reduction rounds to less than 0.01%. |
| fSee Note 1(f) regarding mortgage dollar rolls. |
Annual Report | The accompanying notes are an integral part of these financial statements. | 93
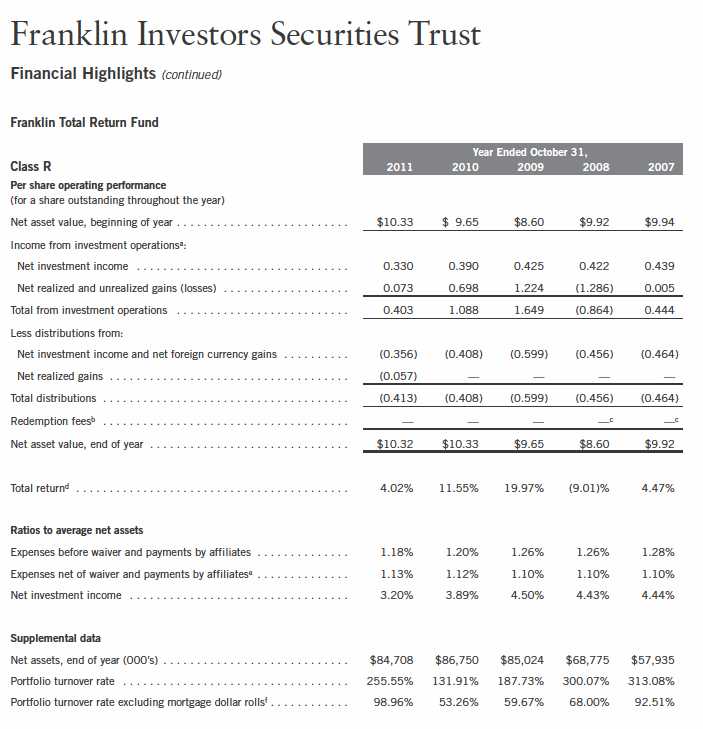
| aThe amount shown for a share outstanding throughout the period may not correlate with the Statement of Operations for the period due to the timing of sales and repurchases of |
| the Fund shares in relation to income earned and/or fluctuating market value of the investments of the Fund. |
| bEffective September 1, 2008, the redemption fee was eliminated. |
| cAmount rounds to less than $0.001 per share. |
| dTotal return does not reflect sales commissions or contingent deferred sales charges, if applicable. |
| eBenefit of expense reduction rounds to less than 0.01%. |
| fSee Note 1(f) regarding mortgage dollar rolls. |
94 | The accompanying notes are an integral part of these financial statements. | Annual Report
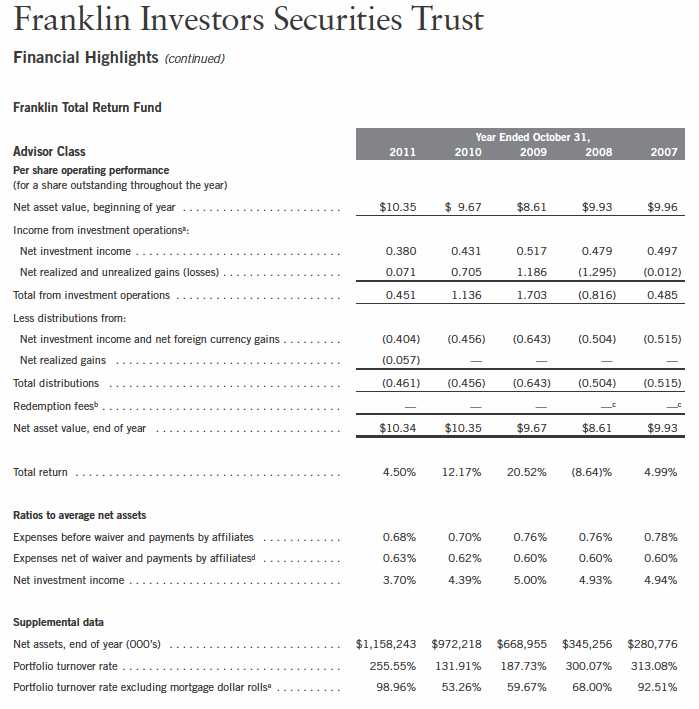
| aThe amount shown for a share outstanding throughout the period may not correlate with the Statement of Operations for the period due to the timing of sales and repurchases of |
| the Fund shares in relation to income earned and/or fluctuating market value of the investments of the Fund. |
| bEffective September 1, 2008, the redemption fee was eliminated. |
| cAmount rounds to less than $0.001 per share. |
| dBenefit of expense reduction rounds to less than 0.01%. |
| eSee Note 1(f) regarding mortgage dollar rolls. |
Annual Report | The accompanying notes are an integral part of these financial statements. | 95
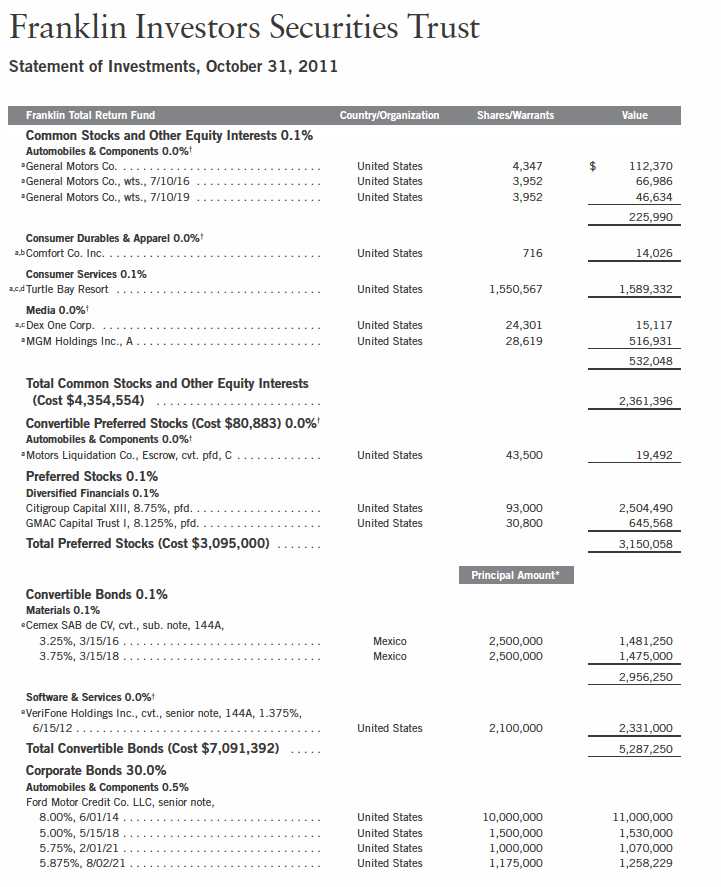
96 | Annual Report
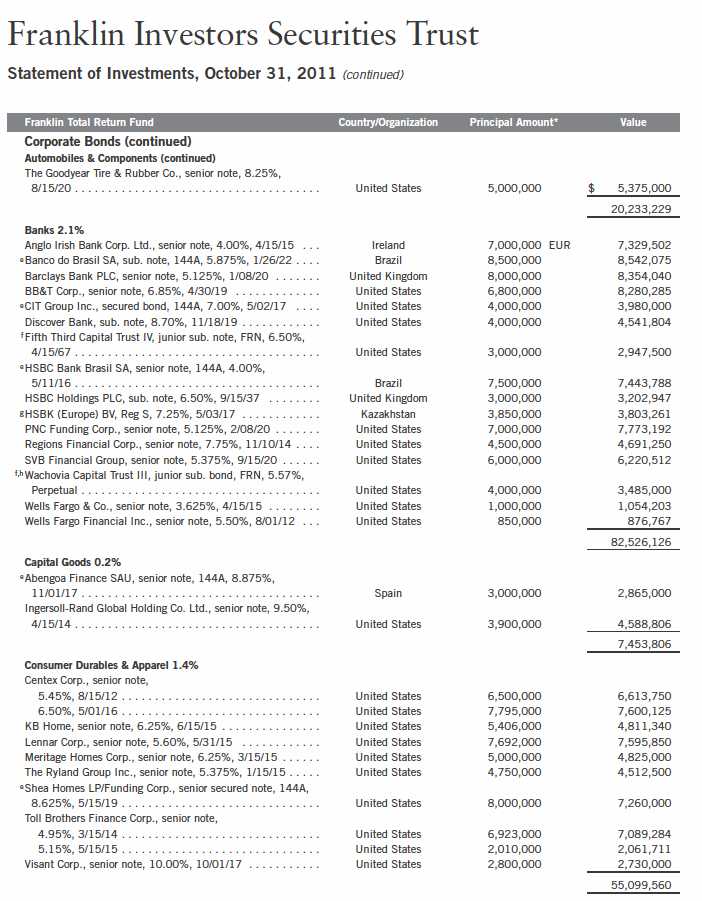
Annual Report | 97
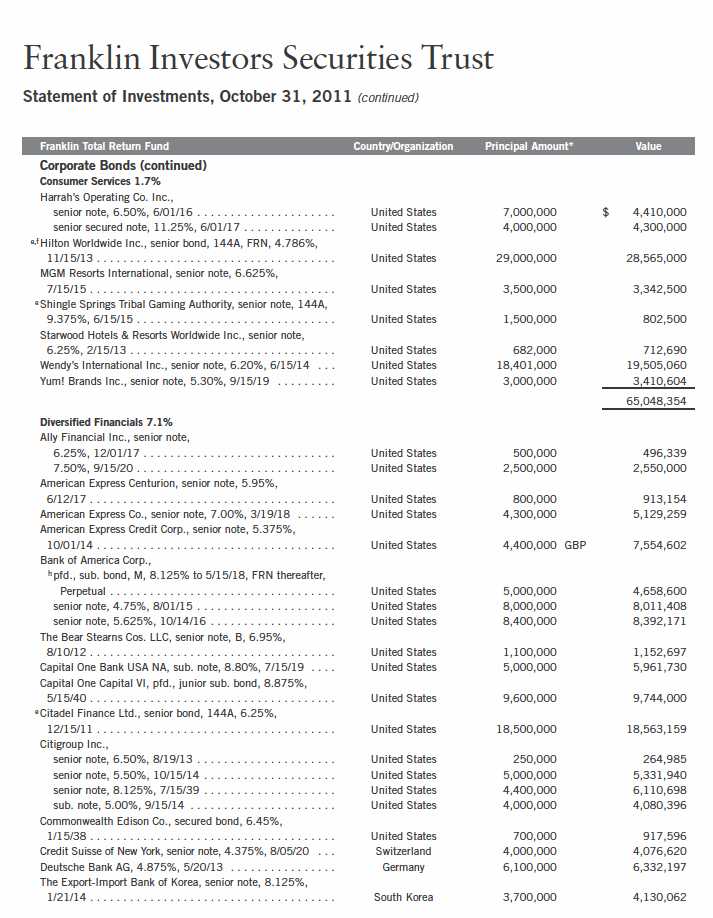
98 | Annual Report
Franklin Investors Securities Trust
Statement of Investments, October 31, 2011 (continued)
Annual Report | 99
Franklin Investors Securities Trust
Statement of Investments, October 31, 2011 (continued)

100 | Annual Report
Franklin Investors Securities Trust
Statement of Investments, October 31, 2011 (continued)
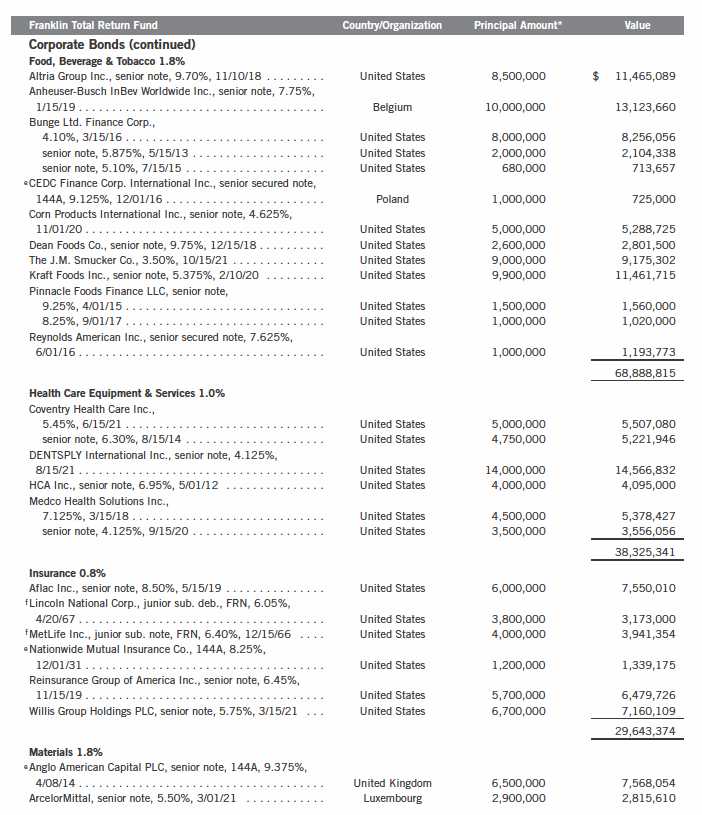
Annual Report | 101
Franklin Investors Securities Trust
Statement of Investments, October 31, 2011 (continued)

102 | Annual Report
Franklin Investors Securities Trust
Statement of Investments, October 31, 2011 (continued)
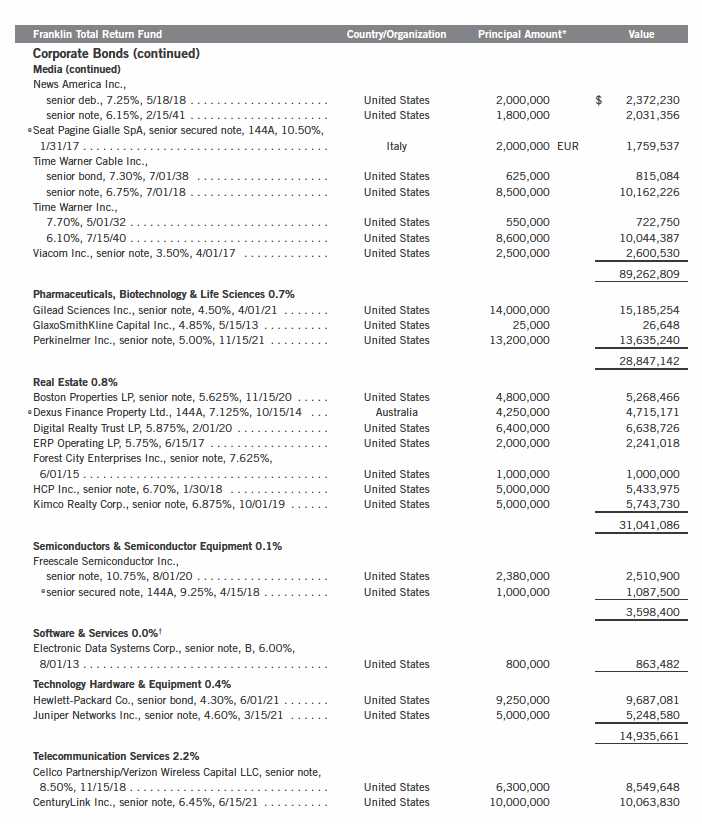
Annual Report | 103
Franklin Investors Securities Trust
Statement of Investments, October 31, 2011 (continued)

104 | Annual Report
Franklin Investors Securities Trust
Statement of Investments, October 31, 2011 (continued)
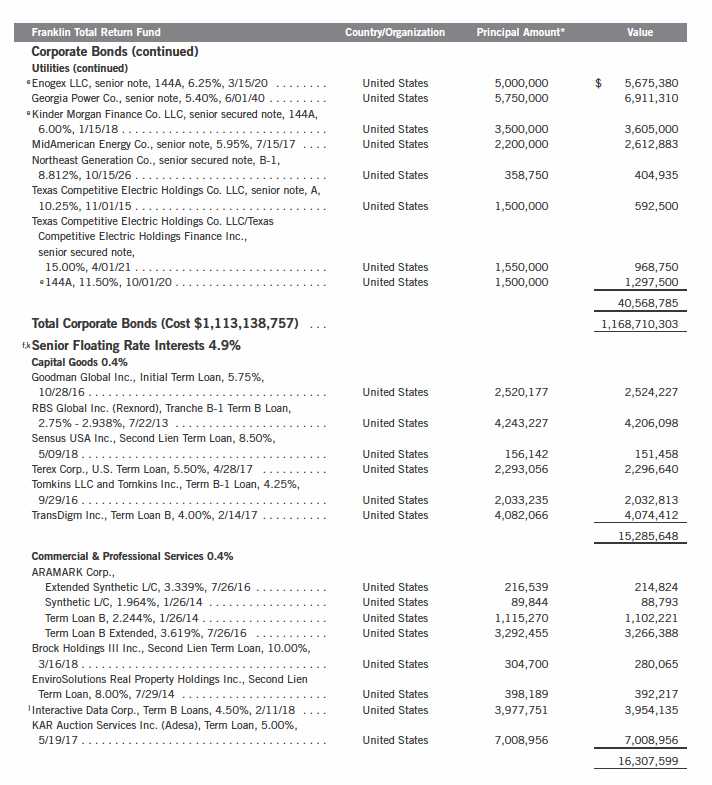
Annual Report | 105
Franklin Investors Securities Trust
Statement of Investments, October 31, 2011 (continued)
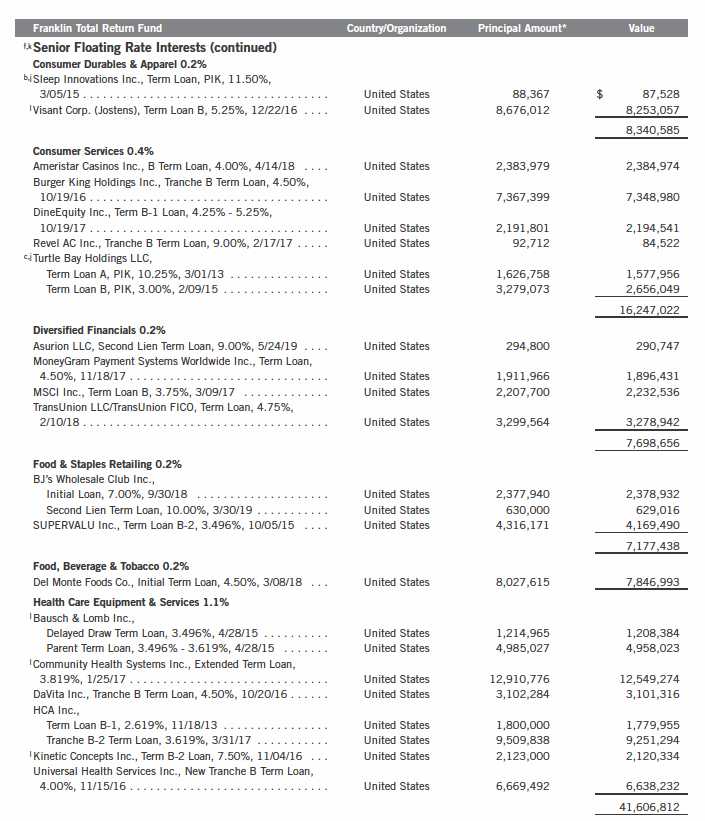
106 | Annual Report
Franklin Investors Securities Trust
Statement of Investments, October 31, 2011 (continued)
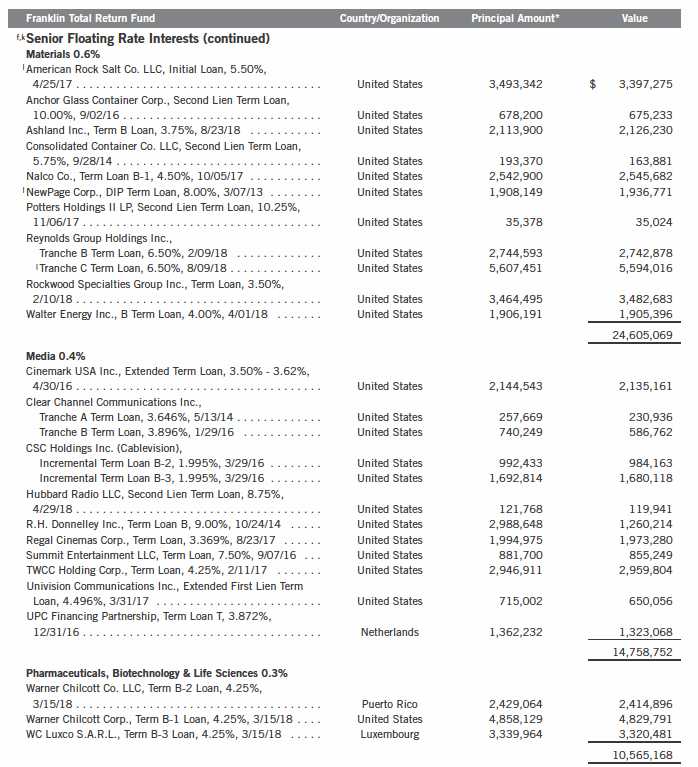
Annual Report | 107
Franklin Investors Securities Trust
Statement of Investments, October 31, 2011 (continued)
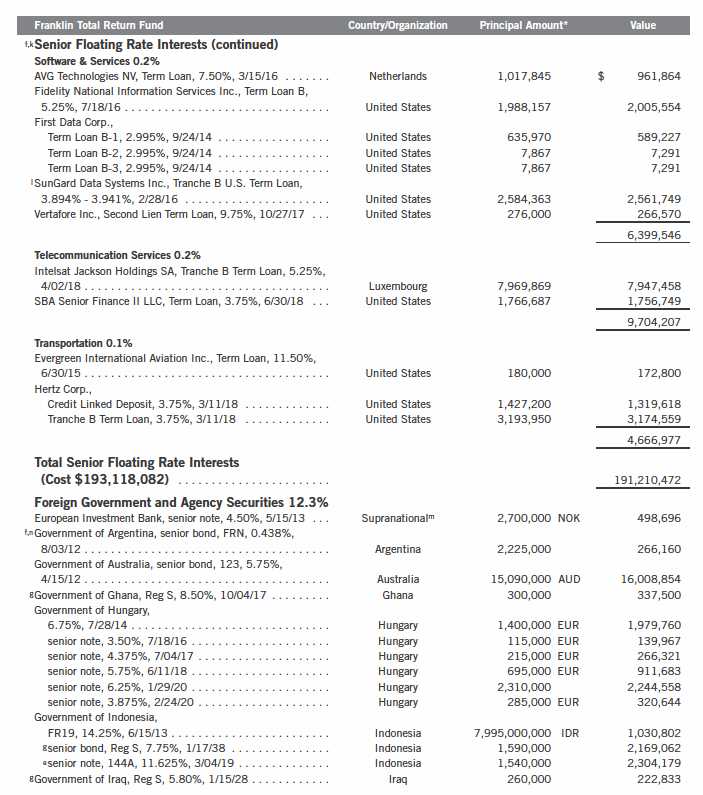
108 | Annual Report
Franklin Investors Securities Trust
Statement of Investments, October 31, 2011 (continued)
Annual Report | 109
Franklin Investors Securities Trust
Statement of Investments, October 31, 2011 (continued)
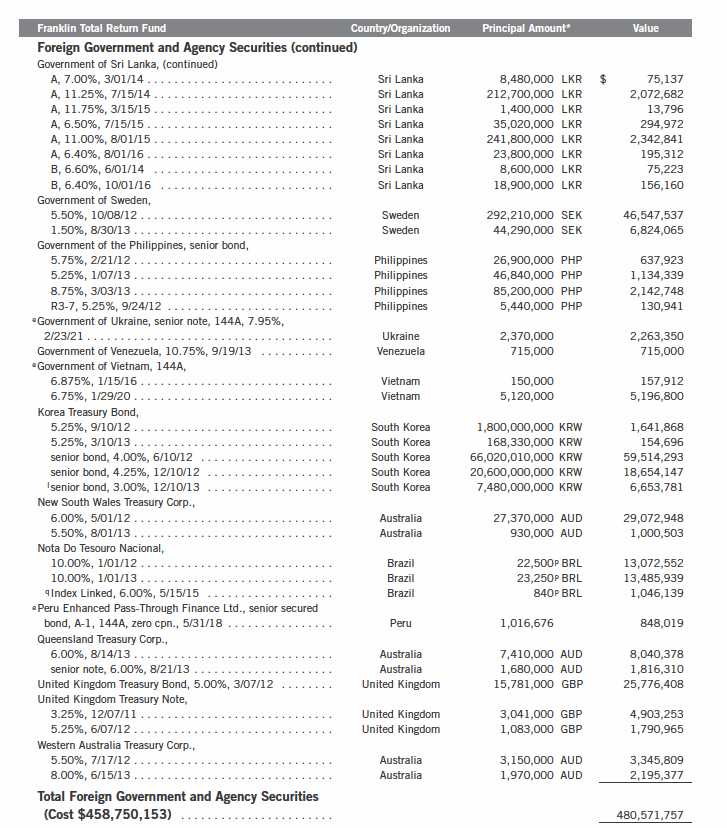
110 | Annual Report
Franklin Investors Securities Trust
Statement of Investments, October 31, 2011 (continued)
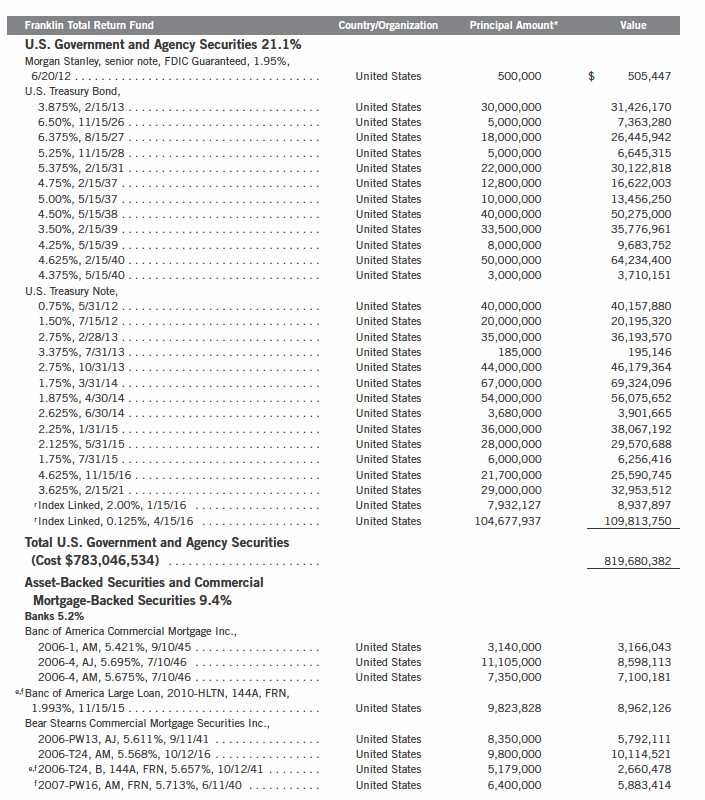
Annual Report | 111
Franklin Investors Securities Trust
Statement of Investments, October 31, 2011 (continued)
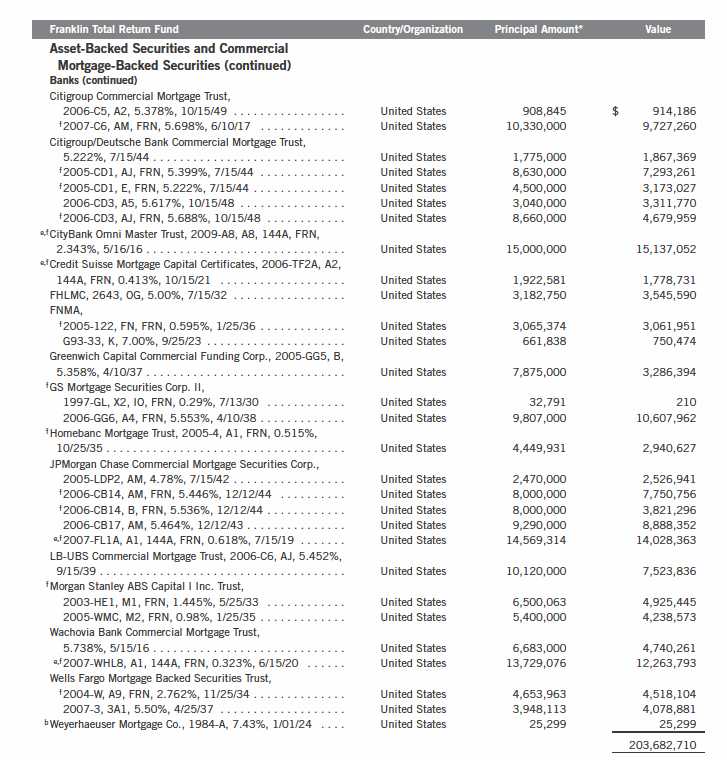
112 | Annual Report
Franklin Investors Securities Trust
Statement of Investments, October 31, 2011 (continued)

Annual Report | 113
Franklin Investors Securities Trust
Statement of Investments, October 31, 2011 (continued)
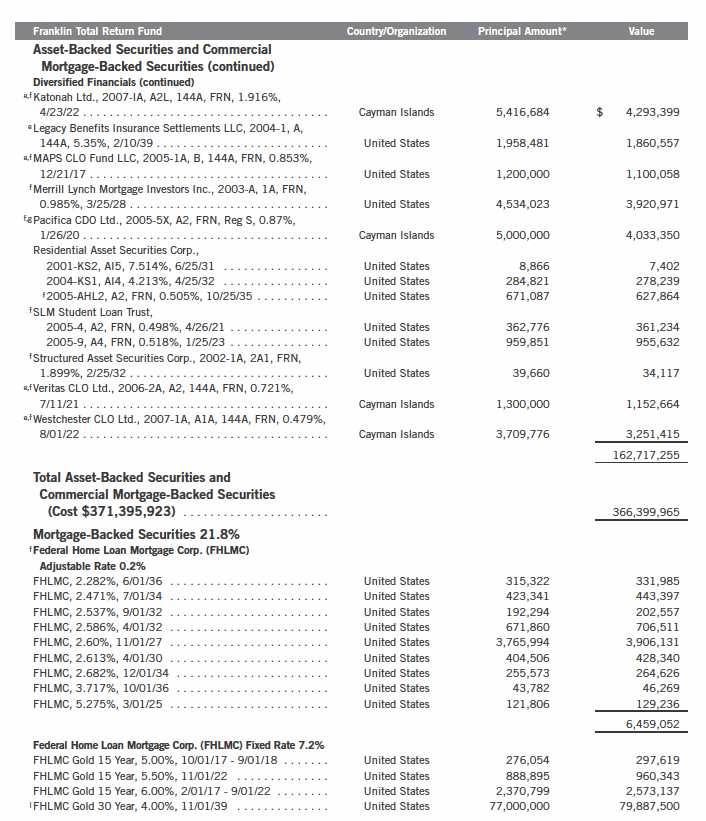
114 | Annual Report
Franklin Investors Securities Trust
Statement of Investments, October 31, 2011 (continued)
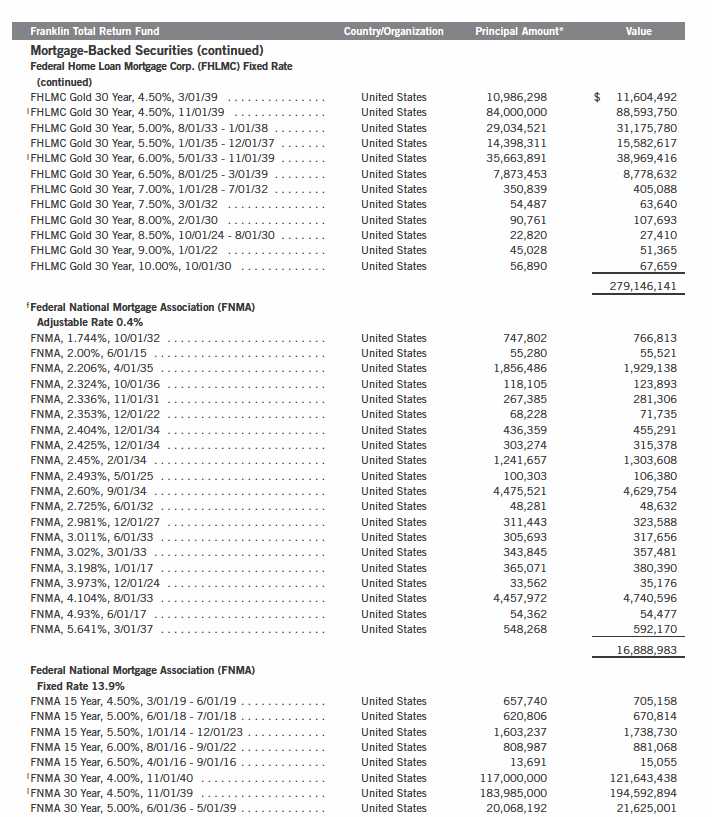
Annual Report | 115
Franklin Investors Securities Trust
Statement of Investments, October 31, 2011 (continued)
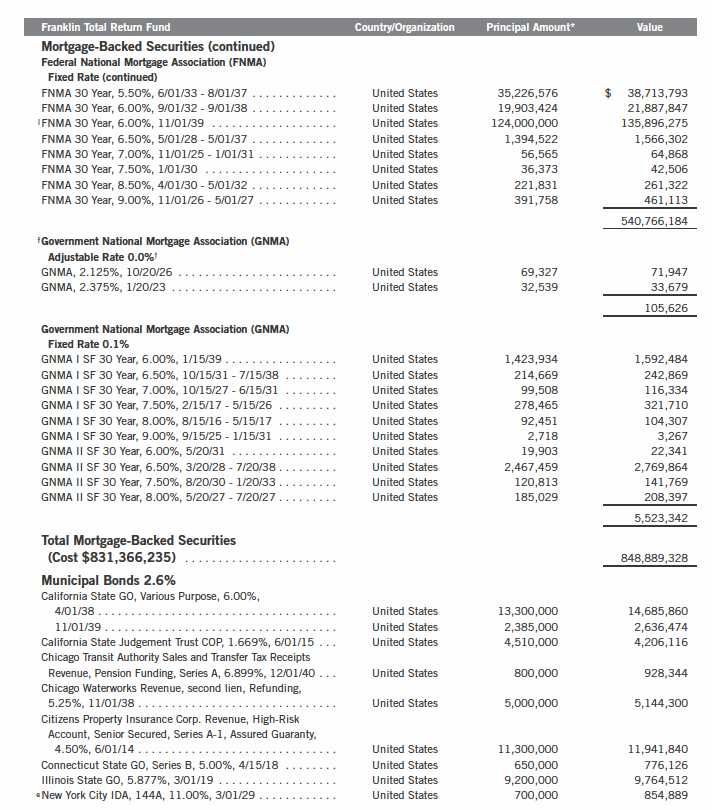
116 | Annual Report
Franklin Investors Securities Trust
Statement of Investments, October 31, 2011 (continued)
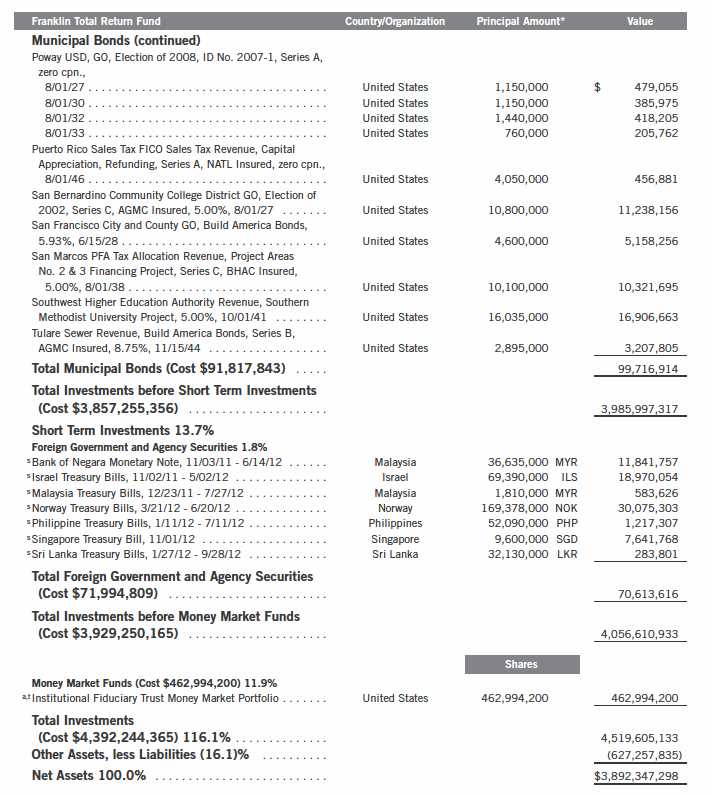
Annual Report | 117
Franklin Investors Securities Trust
Statement of Investments, October 31, 2011 (continued)
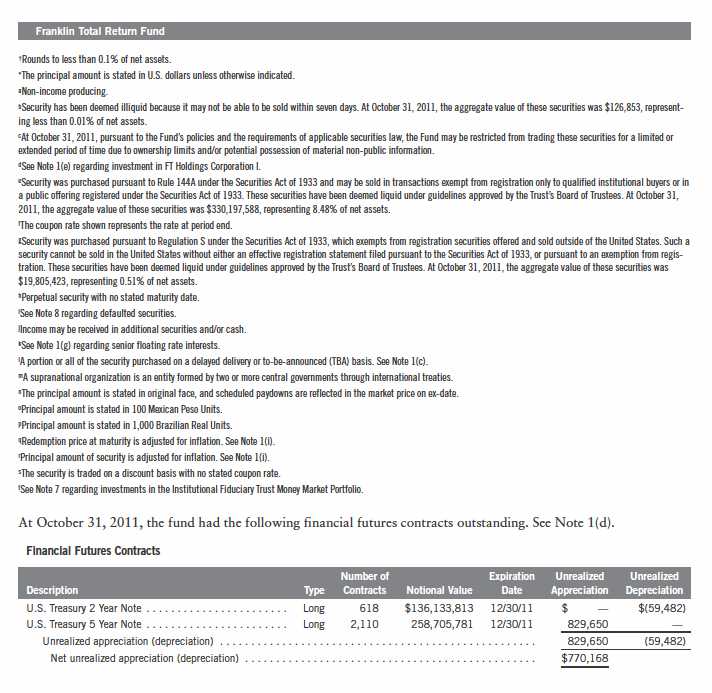
118 | Annual Report
Franklin Investors Securities Trust
Statement of Investments, October 31, 2011 (continued)
Annual Report | 119
Franklin Investors Securities Trust
Statement of Investments, October 31, 2011 (continued)

120 | Annual Report
Franklin Investors Securities Trust
Statement of Investments, October 31, 2011 (continued)
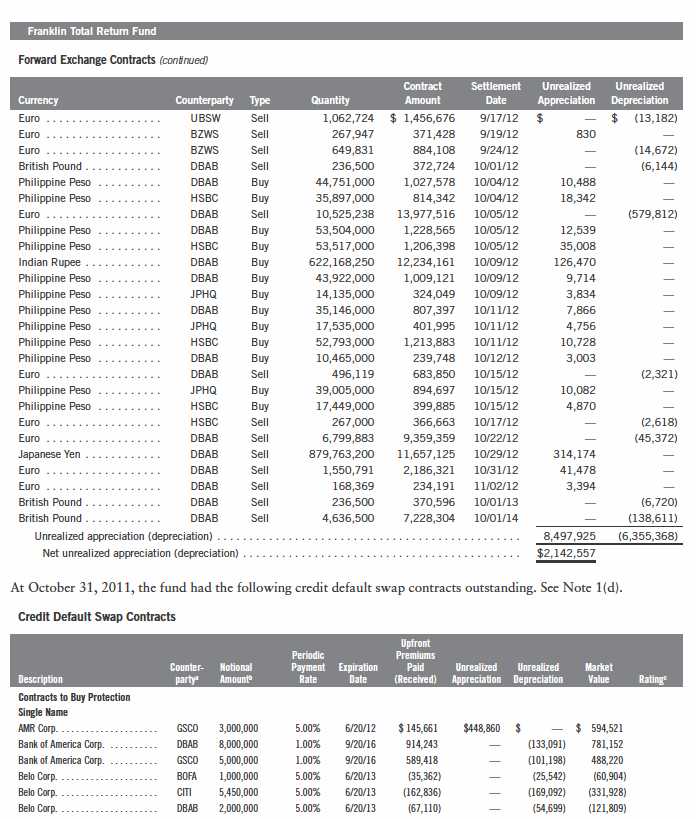
Annual Report | 121
Franklin Investors Securities Trust
Statement of Investments, October 31, 2011 (continued)
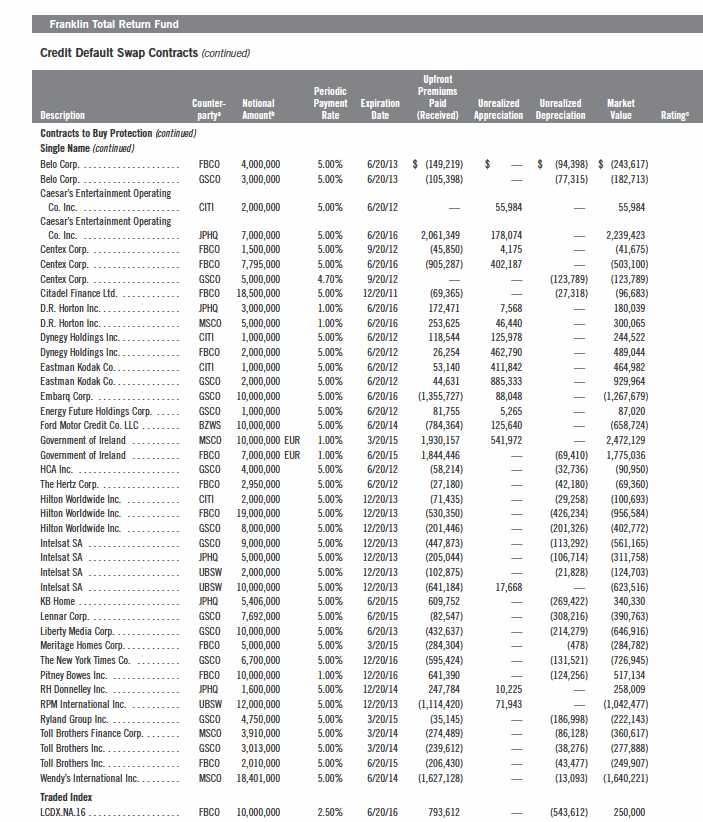
122 | Annual Report
Franklin Investors Securities Trust
Statement of Investments, October 31, 2011 (continued)
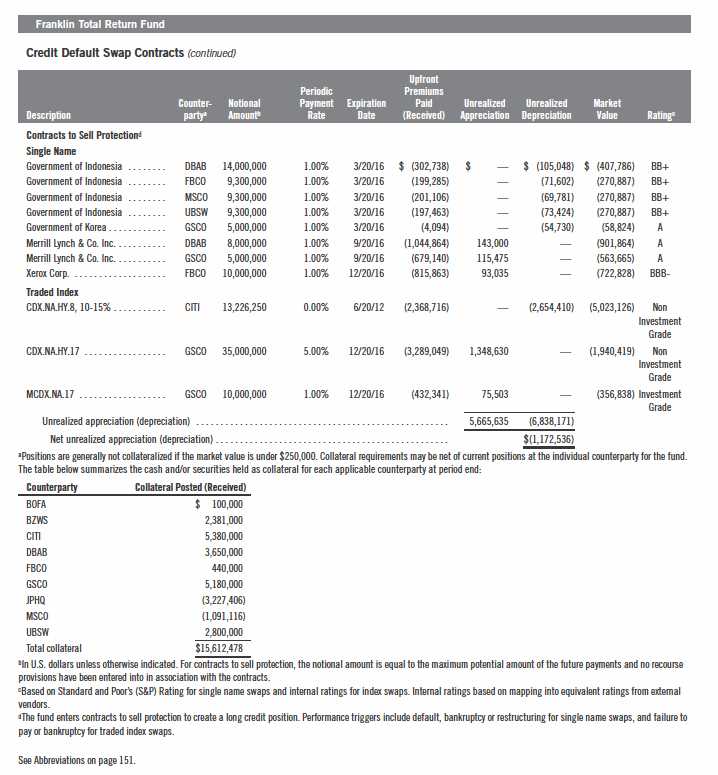
Annual Report | The accompanying notes are an integral part of these financial statements. | 123
Franklin Investors Securities Trust
Financial Statements
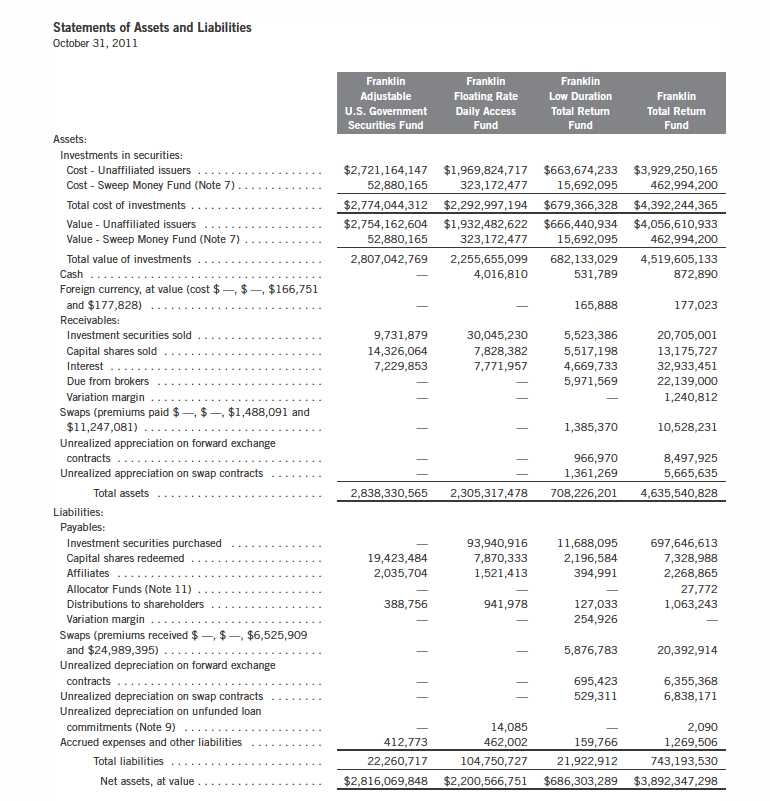
124 | The accompanying notes are an integral part of these financial statements. | Annual Report
Franklin Investors Securities Trust
Financial Statements (continued)

aRedemption price is equal to net asset value less contingent deferred sales charges, if applicable.
Annual Report | The accompanying notes are an integral part of these financial statements. | 125
Franklin Investors Securities Trust
Financial Statements (continued)
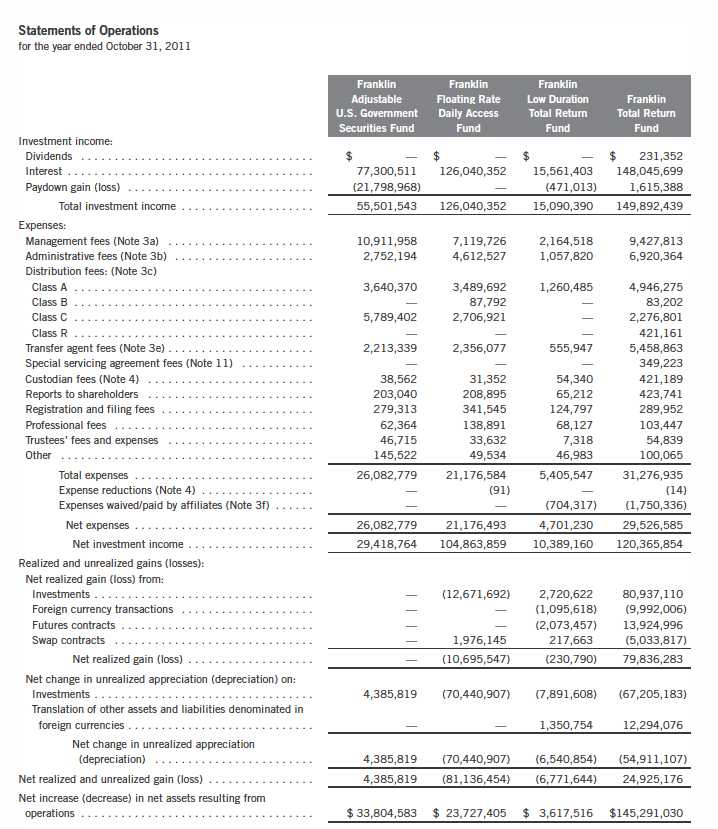
126 | The accompanying notes are an integral part of these financial statements. | Annual Report
Franklin Investors Securities Trust
Financial Statements (continued)
Statements of Changes in Net Assets
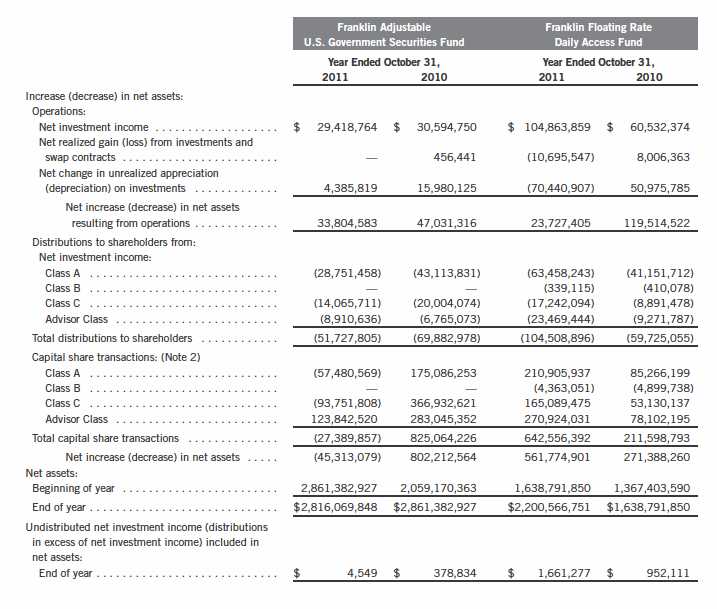
Annual Report | The accompanying notes are an integral part of these financial statements. | 127
Franklin Investors Securities Trust
Financial Statements (continued)
Statements of Changes in Net Assets (continued)
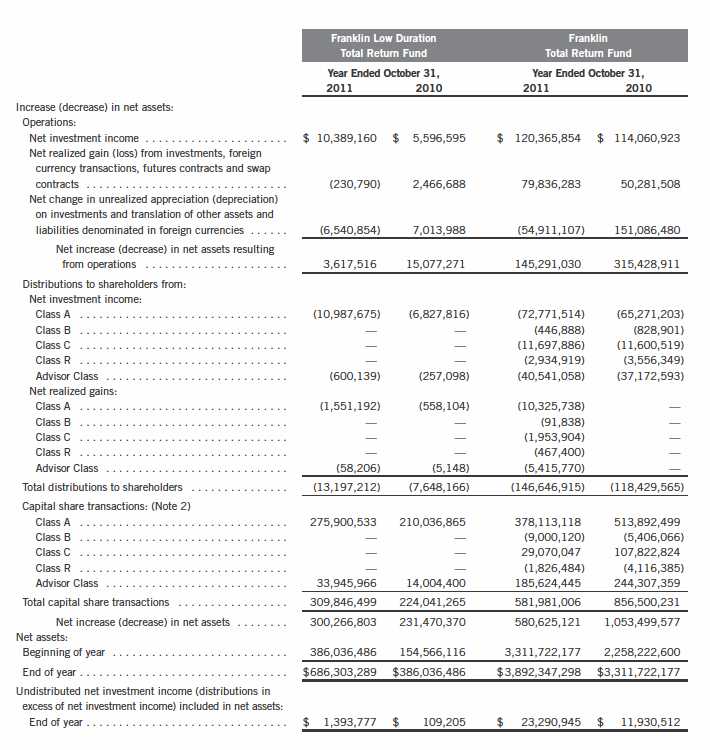
128 | The accompanying notes are an integral part of these financial statements. | Annual Report
Franklin Investors Securities Trust
Notes to Financial Statements
1. ORGANIZATION AND SIGNIFICANT ACCOUNTING POLICIES
Franklin Investors Securities Trust (Trust) is registered under the Investment Company Act of 1940, as amended, (1940 Act) as an open-end investment company, consisting of nine separate funds, four of which are included in this report (Funds). The financial statements of the remaining funds in the Trust are presented separately. The classes of shares offered within each of the Funds are indicated below. Each class of shares differs by its initial sales load, contingent deferred sales charges, distribution fees, voting rights on matters affecting a single class and its exchange privilege.
The following summarizes the Funds’ significant accounting policies.
a. Financial Instrument Valuation
The Funds’ investments in securities and other financial instruments are carried at fair value daily. Fair value is the price that would be received to sell an asset or paid to transfer a liability in an orderly transaction between market participants on the measurement date. Under procedures approved by the Trust’s Board of Trustees, the Funds may utilize independent pricing services, quotations from securities and financial instrument dealers, and other market sources to determine fair value.
Equity securities and derivative financial instruments (derivatives) listed on an exchange or on the NASDAQ National Market System are valued at the last quoted sale price or the official closing price of the day, respectively. Over-the-counter securities are valued within the range of the most recent quoted bid and ask prices. Securities that trade in multiple markets or on multiple exchanges are valued according to the broadest and most representative market. Certain equity securities are valued based upon fundamental characteristics or relationships to similar securities. Investments in open-end mutual funds are valued at the closing net asset value.
Debt securities generally trade in the over-the-counter market rather than on a securities exchange. The Funds’ pricing services use multiple valuation techniques to determine fair value. In instances where sufficient market activity exists, the pricing services may utilize a market-based approach through which quotes from market makers are used to determine fair value. In instances where sufficient market activity may not exist or is limited, the pricing services also utilize proprietary valuation models which may consider market characteristics such as benchmark yield curves, option-adjusted spreads, credit spreads, estimated default rates, coupon rates, anticipated timing of principal repayments, underlying collateral, and other unique security features in order to estimate the relevant cash flows, which are then discounted to calculate the fair value. Securities denominated in a foreign currency are converted into their U.S. dollar equivalent at the foreign
Annual Report | 129
Franklin Investors Securities Trust
Notes to Financial Statements (continued)
| 1. | ORGANIZATION AND SIGNIFICANT ACCOUNTING POLICIES (continued) |
| a. | Financial Instrument Valuation (continued) |
exchange rate in effect at the close of the NYSE on the date that the values of the foreign debt securities are determined. Derivative financial instruments listed on an exchange are valued at the official closing price of the day.
Certain derivatives trade in the over-the-counter market. The Funds’ pricing services use various techniques including industry standard option pricing models and proprietary discounted cash flow models to determine the fair value of those instruments. The Funds’ net benefit or obligation under the derivative contract, as measured by the fair market value of the contract, is included in net assets.
The Funds have procedures to determine the fair value of securities and other financial instruments for which market prices are not readily available or which may not be reliably priced. Under these procedures, the Funds primarily employ a market-based approach which may use related or comparable assets or liabilities, recent transactions, market multiples, book values, and other relevant information for the investment to determine the fair value of the investment. The Funds may also use an income-based valuation approach in which the anticipated future cash flows of the investment are discounted to calculate fair value. Discounts may also be applied due to the nature or duration of any restrictions on the disposition of the investments. Due to the inherent uncertainty of valuations of such investments, the fair values may differ significantly from the values that would have been used had an active market existed.
b. Foreign Currency Translation
Portfolio securities and other assets and liabilities denominated in foreign currencies are translated into U.S. dollars based on the exchange rate of such currencies against U.S. dollars on the date of valuation. The Funds may enter into foreign currency exchange contracts to facilitate transactions denominated in a foreign currency. Purchases and sales of securities, income and expense items denominated in foreign currencies are translated into U.S. dollars at the exchange rate in effect on the transaction date. Portfolio securities and assets and liabilities denominated in foreign currencies contain risks that those currencies will decline in value relative to the U.S. dollar. Occasionally, events may impact the availability or reliability of foreign exchange rates used to convert the U.S. dollar equivalent value. If such an event occurs, the foreign exchange rate will be valued at fair value using procedures established and approved by the Trust’s Board of Trustees.
The Funds do not separately report the effect of changes in foreign exchange rates from changes in market prices on securities held. Such changes are included in net realized and unrealized gain or loss from investments on the Statements of Operations.
130 | Annual Report
Franklin Investors Securities Trust
Notes to Financial Statements (continued)
| 1. | ORGANIZATION AND SIGNIFICANT ACCOUNTING POLICIES (continued) |
| b. | Foreign Currency Translation (continued) |
Realized foreign exchange gains or losses arise from sales of foreign currencies, currency gains or losses realized between the trade and settlement dates on securities transactions and the difference between the recorded amounts of dividends, interest, and foreign withholding taxes and the U.S. dollar equivalent of the amounts actually received or paid. Net unrealized foreign exchange gains and losses arise from changes in foreign exchange rates on foreign denominated assets and liabilities other than investments in securities held at the end of the reporting period.
c. Securities Purchased on a Delayed Delivery and TBA Basis
The Funds purchase securities on a delayed delivery and to-be-announced (TBA) basis, with payment and delivery scheduled for a future date. These transactions are subject to market fluctuations and are subject to the risk that the value at delivery may be more or less than the trade date purchase price. Although the Funds will generally purchase these securities with the intention of holding the securities, they may sell the securities before the settlement date. Sufficient assets have been segregated for these securities.
d. Derivative Financial Instruments
The Funds, except Franklin Adjustable U.S. Government Securities Fund, invested in derivatives in order to manage risk or gain exposure to various other investments or markets. Derivatives are financial contracts based on an underlying or notional amount, require no initial investment or an initial net investment that is smaller than would normally be required to have a similar response to changes in market factors, and require or permit net settlement. Derivatives contain various risks including the potential inability of the counterparty to fulfill their obligations under the terms of the contract, the potential for an illiquid secondary market, and/or the potential for market movements which expose the fund to gains or losses in excess of the amounts shown on the Statements of Assets and Liabilities. Realized gain and loss and unrealized appreciation and depreciation on these contracts for the period are included in the Statements of Operations.
The Franklin Low Duration Total Return Fund and Franklin Total Return Fund entered into financial futures contracts primarily to manage interest rate risk. A futures contract is an agreement between the fund and a counterparty to buy or sell an asset for a specified price on a future date. Required initial margin deposits of cash or securities are pledged by the fund. Subsequent payments, known as variation margin, are made or received by the fund, depending on fluctuations in the value of the underlying security. Such variation margin is accounted for as unrealized appreciation or depreciation until the contract is closed, at which time the gains or losses are realized.
Annual Report | 131
Franklin Investors Securities Trust
Notes to Financial Statements (continued)
| 1. | ORGANIZATION AND SIGNIFICANT ACCOUNTING POLICIES (continued) |
| d. | Derivative Financial Instruments (continued) |
The Franklin Low Duration Total Return Fund and Franklin Total Return Fund entered into forward exchange contracts primarily to manage and/or gain exposure to certain foreign currencies. A forward exchange contract is an agreement between the fund and a counterparty to buy or sell a foreign currency for a specific exchange rate on a future date. Pursuant to the terms of the forward exchange contracts, cash or securities may be required to be deposited as collateral. Unrestricted cash may be invested according to the funds’ investment objectives.
The Funds, except Franklin Adjustable U.S. Government Securities Fund, entered into credit default swap contracts primarily to manage and/or gain exposure to credit risk. A credit default swap is an agreement between the fund and a counterparty whereby the buyer of the contract receives credit protection and the seller of the contract guarantees the credit worthiness of a referenced debt obligation. The underlying referenced debt obligation may be a single issuer of corporate or sovereign debt, a credit index, or a tranche of a credit index. In the event of a default of the underlying referenced debt obligation, the buyer is entitled to receive the notional amount of the credit default swap contract from the seller in exchange for the referenced debt obligation, a net settlement amount equal to the notional amount of the credit default swap less the recovery value of the referenced debt obligation, or other agreed upon amount. Over the term of the contract, the buyer pays the seller a periodic stream of payments, provided that no event of default has occurred. Such periodic payments are accrued daily as an unrealized appreciation or depreciation until the payments are made, at which time they are realized. Payments received or paid to initiate a credit default swap contract are reflected on the Statements of Assets and Liabilities and represent compensating factors between stated terms of the credit default swap agreement and prevailing market conditions (credit spreads and other relevant factors). These upfront payments are amortized over the term of the contract as a realized gain or loss on the Statements of Operations. Pursuant to the terms of the credit default swap contract, cash or securities may be required to be deposited as collateral. Unrestricted cash may be invested according to the funds’ investment objectives.
At October 31, 2011, the Franklin Low Duration Total Return Fund holds $279,916 in U.S. Treasury Bills and the Franklin Total Return Fund held $4,318,522 in U.S. Government Agency Securities and U.S. Treasury Notes as collateral for derivatives.
See Note 10 regarding other derivative information.
e. FT Holdings Corporation I
The Franklin Total Return Fund invests in certain securities through its investment in FT Holdings Corporation I, a Delaware Corporation and a wholly-owned subsidiary (Subsidiary) of the fund. The Subsidiary has the ability to invest in securities consistent with the investment objective of
132 | Annual Report
Franklin Investors Securities Trust
Notes to Financial Statements (continued)
| 1. | ORGANIZATION AND SIGNIFICANT ACCOUNTING POLICIES (continued) |
| e. | FT Holdings Corporation I (continued) |
the fund. At October 31, 2011, all Subsidiary investments as well as any other assets and liabilities are reflected in the fund’s Statement of Investments and Statement of Assets and Liabilities. All income and expenses of the Subsidiary during the period ended October 31, 2011, have been included in the fund’s Statement of Operations.
f. Mortgage Dollar Rolls
The Franklin Total Return Fund enters into mortgage dollar rolls, typically on a TBA basis. Mortgage dollar rolls are agreements between the fund and a financial institution to simultaneously sell and repurchase mortgage-backed securities at a future date. Gains or losses are realized on the initial sale, and the difference between the repurchase price and the sale price is recorded as an unrealized gain or loss to the fund upon entering into the mortgage dollar roll. In addition, the fund may invest the cash proceeds that are received from the initial sale. During the period between the sale and repurchase, the fund is not entitled to principal and interest paid on the mortgage backed securities. The risks of mortgage dollar roll transactions include the potential inability of the counterparty to fulfill its obligations.
g. Senior Floating Rate Interests
The Funds, except Franklin Adjustable U.S. Government Securities Fund, invest in senior secured corporate loans that pay interest at rates which are periodically reset by reference to a base lending rate plus a spread. These base lending rates are generally the prime rate offered by a designated U.S. bank or the London InterBank Offered Rate (LIBOR). Senior secured corporate loans often require prepayment of principal from excess cash flows or at the discretion of the borrower. As a result, actual maturity may be substantially less than the stated maturity.
Senior secured corporate loans in which the funds invest are generally readily marketable, but may be subject to some restrictions on resale.
h. Income Taxes
It is each fund’s policy to qualify as a regulated investment company under the Internal Revenue Code. Each fund intends to distribute to shareholders substantially all of its taxable income and net realized gains to relieve it from federal income and excise taxes. As a result, no provision for U.S. federal income taxes is required. Each fund files U.S. income tax returns as well as tax returns in certain other jurisdictions. Each fund records a provision for taxes in its financial statements including penalties and interest, if any, for a tax position taken on a tax return (or expected to be taken) when it fails to meet the more likely than not (a greater than 50% probability) threshold and based on the technical merits, the tax position may not be sustained upon examination by the tax authorities. As of October 31, 2011, and for all open tax years, each fund has determined that no provision for income tax is required in each fund’s financial statements. Open tax years are those that remain subject to examination and are based on each tax jurisdiction statute of limitation.
Annual Report | 133
Franklin Investors Securities Trust
Notes to Financial Statements (continued)
| 1. | ORGANIZATION AND SIGNIFICANT ACCOUNTING POLICIES (continued) |
| i. | Security Transactions, Investment Income, Expenses and Distributions |
Security transactions are accounted for on trade date. Realized gains and losses on security transactions are determined on a specific identification basis. Interest income and estimated expenses are accrued daily. Amortization of premium and accretion of discount on debt securities are included in interest income. Facility fees are recognized as income over the expected term of the loan. Dividend income is recorded on the ex-dividend date. Dividends from net investment income are normally declared daily; these dividends may be reinvested or paid monthly to shareholders. Distributions from realized capital gains and other distributions, if any, are recorded on the ex-dividend date. Distributions to shareholders are determined according to income tax regulations (tax basis). Distributable earnings determined on a tax basis may differ from earnings recorded in accordance with accounting principles generally accepted in the United States of America. These differences may be permanent or temporary. Permanent differences are reclassified among capital accounts to reflect their tax character. These reclassifications have no impact on net assets or the results of operations. Temporary differences are not reclassified, as they may reverse in subsequent periods.
Common expenses incurred by the Trust are allocated among the funds based on the ratio of net assets of each fund to the combined net assets of the Trust. Fund specific expenses are charged directly to the fund that incurred the expense.
Net investment income, not including class specific expenses, is allocated daily to each class of shares based upon the relative value of the settled shares of each class. Realized and unrealized gains and losses are allocated daily to each class of shares based upon the relative proportion of net assets of each class. Differences in per share distributions, by class, are generally due to differences in class specific expenses.
Inflation-indexed bonds are adjusted for inflation through periodic increases or decreases in the security’s interest accruals, face amount, or principal redemption value, by amounts corresponding to the rate of inflation as measured by an index. Any increase or decrease in the face amount or principal redemption value will be included as interest income on the Statements of Operations.
j. Accounting Estimates
The preparation of financial statements in accordance with accounting principles generally accepted in the United States of America requires management to make estimates and assumptions that affect the reported amounts of assets and liabilities at the date of the financial statements and the amounts of income and expenses during the reporting period. Actual results could differ from those estimates.
134 | Annual Report
Franklin Investors Securities Trust
Notes to Financial Statements (continued)
1. ORGANIZATION AND SIGNIFICANT ACCOUNTING POLICIES (continued) k. Guarantees and Indemnifications
Under the Trust’s organizational documents, its officers and trustees are indemnified by the Trust against certain liabilities arising out of the performance of their duties to the Trust. Additionally, in the normal course of business, the Trust, on behalf of the Funds, enters into contracts with service providers that contain general indemnification clauses. The Trust’s maximum exposure under these arrangements is unknown as this would involve future claims that may be made against the Trust that have not yet occurred. Currently, the Trust expects the risk of loss to be remote.
2. SHARES OF BENEFICIAL INTEREST
At October 31, 2011, there were an unlimited number of shares authorized (without par value).
Transactions in the Funds’ shares were as follows:
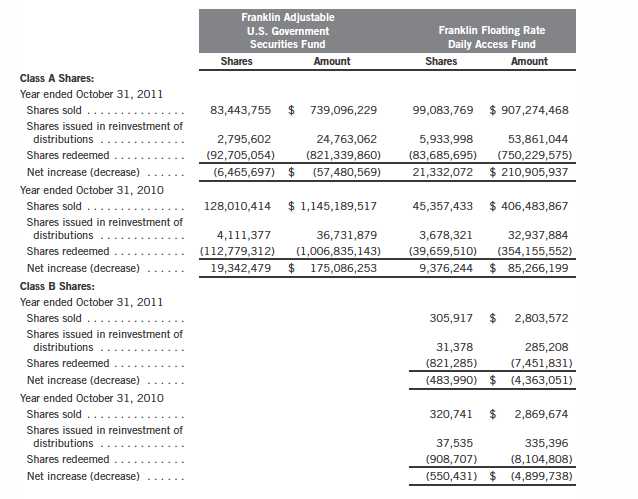
Annual Report | 135
Franklin Investors Securities Trust
Notes to Financial Statements (continued)
2. SHARES OF BENEFICIAL INTEREST (continued)
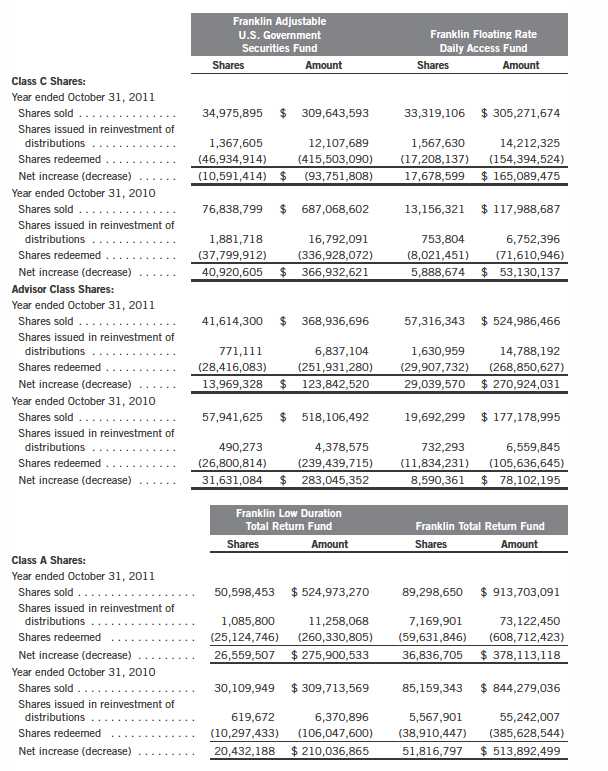
136 | Annual Report
Franklin Investors Securities Trust
Notes to Financial Statements (continued)
2. SHARES OF BENEFICIAL INTEREST (continued)
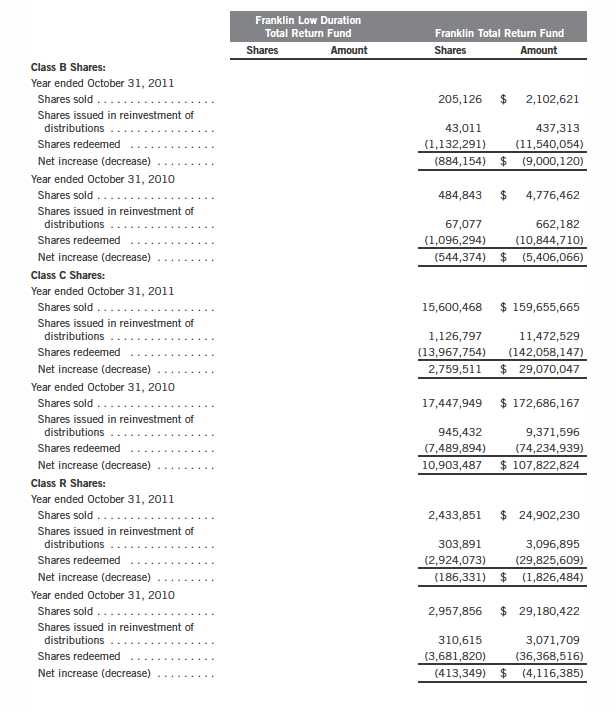
Annual Report | 137
Franklin Investors Securities Trust
Notes to Financial Statements (continued)

138 | Annual Report
Franklin Investors Securities Trust
Notes to Financial Statements (continued)
3. TRANSACTIONS WITH AFFILIATES (continued) a. Management Fees (continued)
The Franklin Floating Rate Daily Access Fund pays an investment management fee to Advisers based on the average daily net assets of the fund as follows:
The Funds, except Franklin Adjustable U.S. Government Securities Fund, pay an administrative fee to FT Services of 0.20% per year of the average daily net assets of each of the funds.
Annual Report | 139
Franklin Investors Securities Trust
Notes to Financial Statements (continued)
3. TRANSACTIONS WITH AFFILIATES (continued) c. Distribution Fees
The Trust’s Board of Trustees has adopted distribution plans for each share class, with the exception of Advisor Class shares, pursuant to Rule 12b-1 under the 1940 Act. Under the Funds’ Class A reimbursement distribution plans, the Funds reimburse Distributors for costs incurred in connection with the servicing, sale and distribution of the Funds’ shares up to the maximum annual plan rate. Under the Class A reimbursement distribution plans, costs exceeding the maximum for the current plan year cannot be reimbursed in subsequent periods.
In addition, under the funds’ Class B, C and R compensation distribution plans, the funds pay Distributors for costs incurred in connection with the servicing, sale and distribution of each fund’s shares up to the maximum annual plan rate for each class.
The maximum annual plan rates, based on the average daily net assets, for each class, are as follows:
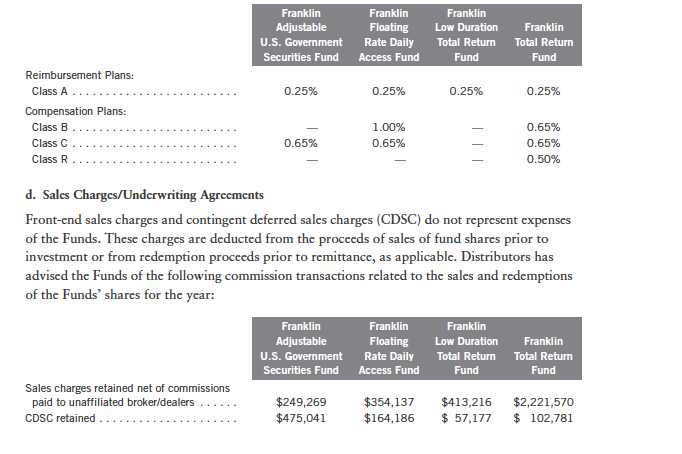
140 | Annual Report
Franklin Investors Securities Trust
Notes to Financial Statements (continued)
3. TRANSACTIONS WITH AFFILIATES (continued) e. Transfer Agent Fees
For the year ended October 31, 2011, the Funds paid transfer agent fees as noted in the Statements of Operations of which the following amounts were retained by Investor Services:
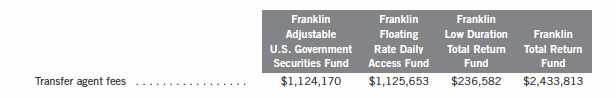
f. Waiver and Expense Reimbursements
FT Services has contractually agreed in advance to waive or limit its fees and to assume as its own expense certain expenses otherwise payable by the Franklin Low Duration Total Return Fund and Franklin Total Return Fund so that the common expenses (i.e. a combination of management fees, administrative fees, and other expenses, but excluding distribution fees, acquired fund fees and expenses) for each class of the funds do not exceed 0.65% and 0.63%, respectively (other than certain non-routine expenses or costs, including those relating to litigation, indemnification, reorganizations, and liquidations) until February 29, 2012.
4. EXPENSE OFFSET ARRANGEMENT
The Funds have entered into an arrangement with their custodian whereby credits realized as a result of uninvested cash balances are used to reduce a portion of the Funds’ custodian expenses. During the year ended October 31, 2011, the custodian fees were reduced as noted in the Statements of Operations.
Annual Report | 141
Franklin Investors Securities Trust
Notes to Financial Statements (continued)
5. INCOME TAXES
For tax purposes, capital losses may be carried over to offset future capital gains, if any. At October 31, 2011, the capital loss carryforwards were as follows:
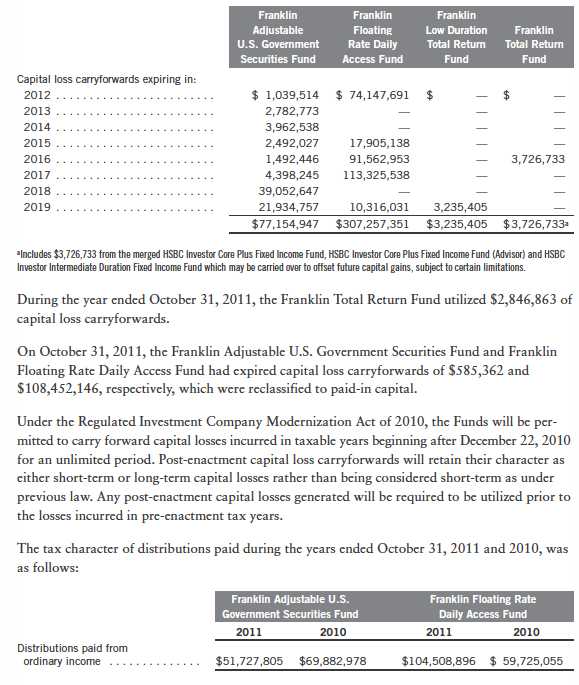
142 | Annual Report
Franklin Investors Securities Trust
Notes to Financial Statements (continued)
5. INCOME TAXES (continued)
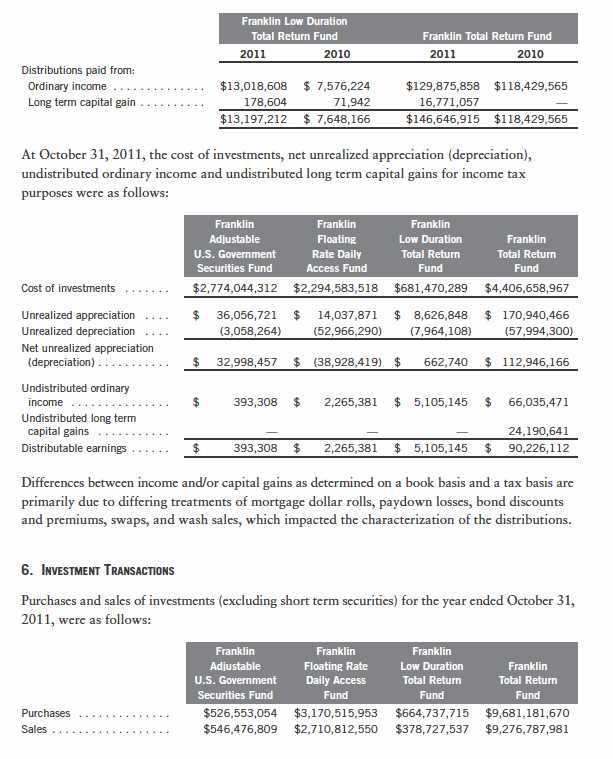
Annual Report | 143
Franklin Investors Securities Trust
Notes to Financial Statements (continued)
7. INVESTMENTS IN INSTITUTIONAL FIDUCIARY TRUST MONEY MARKET PORTFOLIO
The Funds invest in the Institutional Fiduciary Trust Money Market Portfolio (Sweep Money Fund), an open-end investment company managed by Advisers. Management fees paid by the Funds are reduced on assets invested in the Sweep Money Fund, in an amount not to exceed the management and administrative fees paid by the Sweep Money Fund.
8. CREDIT RISK AND DEFAULTED SECURITIES
At October 31, 2011, the Franklin Floating Rate Daily Access Fund, Franklin Low Duration Total Return Fund and the Franklin Total Return Fund had 84.78%, 17.30% and 13.89%, respectively, of their portfolio invested in high yield , senior secured floating rate notes, or other securities rated below investment grade. These securities may be more sensitive to economic conditions causing greater price volatility and are potentially subject to a greater risk of loss due to default than higher rated securities.
The funds held defaulted securities and/or other securities for which the income has been deemed uncollectible. At October 31, 2011, the aggregate value of these securities for the Franklin Floating Rate Daily Access Fund, Franklin Low Duration Total Return Fund and the Franklin Total Return Fund was $18,629,445, $1,164,000, and $7,070,750, representing 0.85%, 0.22%, and 0.18%, respectively, of each fund’s net assets. The funds discontinue accruing income on securities for which income has been deemed uncollectible and provide an estimate for losses on interest receivable. The securities have been identified on the accompanying Statements of Investments.
9. UNFUNDED LOAN COMMITMENTS
The Funds, except Franklin Adjustable U.S. Government Securities Fund, enter into certain credit agreements, all or a portion of which may be unfunded. The funds are obligated to fund these loan commitments at the borrowers’ discretion. Funded portions of credit agreements are presented on the Statements of Investments.
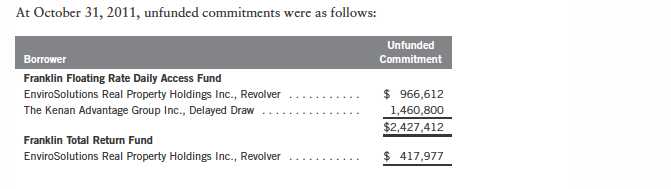
144 | Annual Report
Franklin Investors Securities Trust
Notes to Financial Statements (continued)
9. UNFUNDED LOAN COMMITMENTS (continued)
Unfunded loan commitments and funded portions of credit agreements are marked to market daily and any unrealized appreciation or depreciation is included in the Statements of Assets and Liabilities and Statements of Operations.
10. OTHER DERIVATIVE INFORMATION
At October 31, 2011, the Funds, except Franklin Adjustable U.S. Government Securities Fund, have invested in derivative contracts which are reflected on the Statements of Assets and Liabilities as follows:
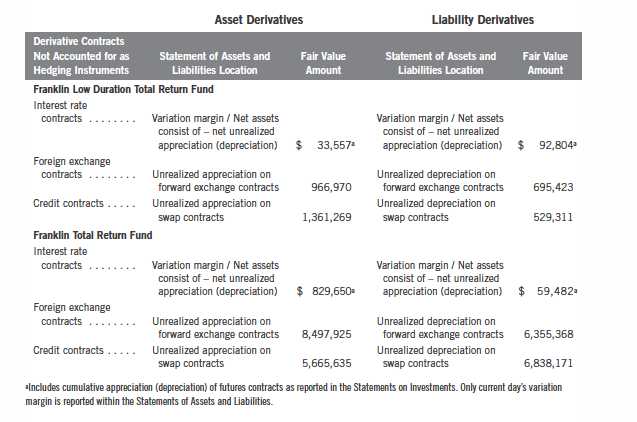
Annual Report | 145
Franklin Investors Securities Trust
Notes to Financial Statements (continued)
10. OTHER DERIVATIVE INFORMATION (continued)
For the period ended October 31, 2011, the effect of derivative contracts on the funds’ Statements of Operations was as follows:
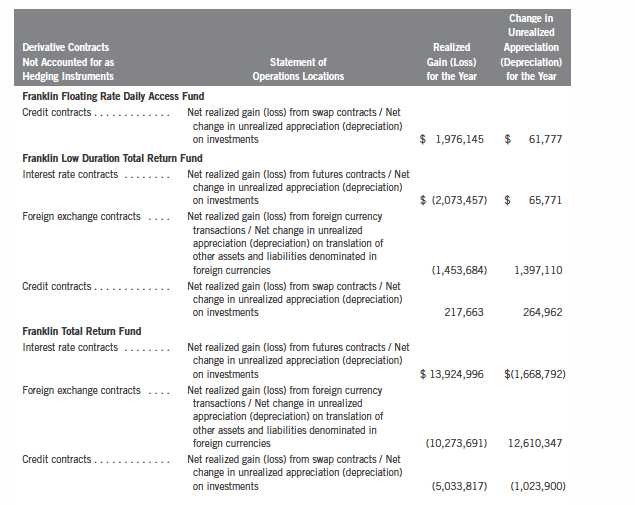
For the year ended October 31, 2011, the average month end market value of derivatives represented 0.01%, 0.53% and 0.71%, respectively of average month end net assets for each of the above mentioned funds. The average month end number of open derivative contracts for the year was 1, 122, and 136, respectively.
See Note 1(d) regarding derivative financial instruments.
146 | Annual Report
Franklin Investors Securities Trust
Notes to Financial Statements (continued)
11. SPECIAL SERVICING AGREEMENT
The Franklin Floating Rate Daily Access Fund and the Franklin Total Return Fund, which are eligible underlying investments of one or more of the Franklin Templeton Fund Allocator Series Funds (Allocator Funds), participate in a Special Servicing Agreement (SSA) with the Allocator Funds and certain service providers of the funds and the Allocator Funds. Under the SSA, the funds may pay a portion of the Allocator Funds’ expenses (other than any asset allocation, administrative and distribution fees), to the extent such payments are less than the amount of the benefits realized or expected to be realized by the funds (e.g., due to reduced costs associated with servicing accounts) from the investment in the funds by the Allocator Funds. The Allocator Funds are either managed by Advisers or administered by FT Services. For the year ended October 31, 2011, the Franklin Total Return Fund was held by one or more of the Allocator Funds and the amount of expenses borne by the fund is noted in the Statement of Operations. At October 31, 2011, 5.33% of the fund’s outstanding shares were held by one or more of the Allocator Funds.
12. CREDIT FACILITY
The Funds, together with other U.S. registered and foreign investment funds (collectively, Borrowers), managed by Franklin Templeton Investments, are borrowers in a joint syndicated senior unsecured credit facility totaling $750 million (Global Credit Facility) which matures on January 20, 2012. This Global Credit Facility provides a source of funds to the Borrowers for temporary and emergency purposes, including the ability to meet future unanticipated or unusually large redemption requests.
Under the terms of the Global Credit Facility, the Funds shall, in addition to interest charged on any borrowings made by the Funds and other costs incurred by the Funds, pay their share of fees and expenses incurred in connection with the implementation and maintenance of the Global Credit Facility, based upon their relative share of the aggregate net assets of all of the Borrowers, including an annual commitment fee of 0.08% based upon the unused portion of the Global Credit Facility, which is reflected in other expenses on the Statements of Operations. During the year ended October 31, 2011, the Funds did not use the Global Credit Facility.
13. FUND LITIGATION
In July 2003, Adelphia Communications Corp. (“Adelphia”) and related parties, along with its Official Committee of Unsecured Creditors, (collectively “Plaintiffs”) filed an adversary proceeding in the then-pending Adelphia bankruptcy case in the U.S. Bankruptcy Court for the Southern District of New York against more than 400 banks, financial services companies, insurance companies, investment banks, mutual funds and other parties that had arranged for the sale of, or purchased the bank debt of, Adelphia or its related parties. Named defendants included Franklin Floating Rate Daily Access Fund (individually and as successor to the Franklin Floating Rate
Annual Report | 147
Franklin Investors Securities Trust
Notes to Financial Statements (continued)
13. FUND LITIGATION (continued)
Trust’s interests in the credit facilities at issue), Franklin Floating Rate Trust, and Franklin Floating Rate Master Series (collectively the “Franklin Funds”), and Franklin CLOs I through III, among other defendants (together the “Non-Agent Bank Defendants”). Plaintiffs alleged that the purchasers of the bank debt knew, or should have known, that the loan proceeds would not benefit Adelphia, but instead would be used to enrich Adelphia insiders and sought avoidance of the loans and recovery of fraudulent transfers. Following transfer of the matter to the U.S. District Court for the Southern District of New York, in June 2008, the court dismissed the claims against the Non-Agent Bank Defendants, including the Franklin Funds. Plaintiffs then appealed the dismissal and the U.S. Court of Appeals for the Second Circuit affirmed the dismissal in May 2010. In October 2010, Plaintiffs agreed to forego further appeal of the dismissal of the claims and the dismissal of those claims is now final.
The final issue for the parties to resolve related to defendants’ (including the Franklin Funds’) entitlement to payment of certain legal fees under a litigation indemnity fund established as part of the Adelphia bankruptcy plan. The parties reached agreement resolving the issue effective November 7, 2011, pursuant to which Plaintiffs paid an agreed amount to be applied to defendants’ legal fees. The Franklin Funds do not have to pay any additional legal fees and the matter is now fully resolved.
14. FAIR VALUE MEASUREMENTS
The Funds follow a fair value hierarchy that distinguishes between market data obtained from independent sources (observable inputs) and the Funds’ own market assumptions (unobservable inputs). These inputs are used in determining the value of the Funds’ investments and are summarized in the following fair value hierarchy:
- Level 1 – quoted prices in active markets for identical securities
- Level 2 – other significant observable inputs (including quoted prices for similar securities, interest rates, prepayment speed, credit risk, etc.)
- Level 3 – significant unobservable inputs (including the Funds’ own assumptions in determining the fair value of investments)
The inputs or methodology used for valuing securities are not an indication of the risk associated with investing in those securities.
For movements between the levels within the fair value hierarchy, the Funds have adopted a policy of recognizing the transfers as of the date of the underlying event which caused the movement.
148 | Annual Report
Franklin Investors Securities Trust
Notes to Financial Statements (continued)
14. FAIR VALUE MEASUREMENTS (continued)
The following is a summary of the inputs used as of October 31, 2011, in valuing the Funds’ assets and liabilities carried at fair value:
Annual Report | 149
Franklin Investors Securities Trust
Notes to Financial Statements (continued)
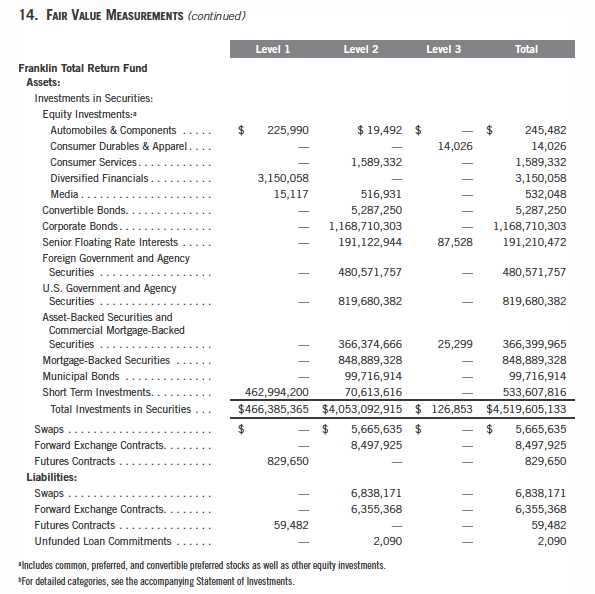
15. NEW ACCOUNTING PRONOUNCEMENTS
In April 2011, the Financial Accounting Standards Board (FASB) issued Accounting Standards Update (ASU) No. 2011-03, Transfers and Servicing (Topic 860): Reconsideration of Effective Control for Repurchase Agreements with the main objective to improve the accounting for repurchase agreements and other similar agreements that both entitle and obligate a transferor to repurchase or redeem financial assets before their maturity. The ASU modifies the criteria for determining effective control of transferred assets and as a result, certain agreements may now be accounted for as secured borrowings. The ASU is effective for transactions occurring in

Franklin Investors Securities Trust
Notes to Financial Statements (continued)
15. NEW ACCOUNTING PRONOUNCEMENTS (continued)
interim and annual periods beginning after December 15, 2011. The Funds are currently reviewing the requirements and believe the adoption of this ASU will not have a material impact on the financial statements.
In May 2011, FASB issued ASU No. 2011-04, Fair Value Measurement (Topic 820): Amendments to Achieve Common Fair Value Measurement and Disclosure Requirements in U.S. GAAP and IFRSs. The amendments in the ASU will improve the comparability of fair value measurements presented and disclosed in financial statements prepared in accordance with U.S. GAAP (Generally Accepted Accounting Principles) and IFRS (International Financial Reporting Standards) and include new guidance for certain fair value measurement principles and disclosure requirements. The ASU is effective for interim and annual periods beginning after December 15, 2011. The Funds are currently reviewing the requirements and believe the adoption of this ASU will not have a material impact on the financial statements.
16. SUBSEQUENT EVENTS
The Funds have evaluated subsequent events through the issuance of the financial statements and determined that no events have occurred that require disclosure other than those already disclosed in the financial statements.
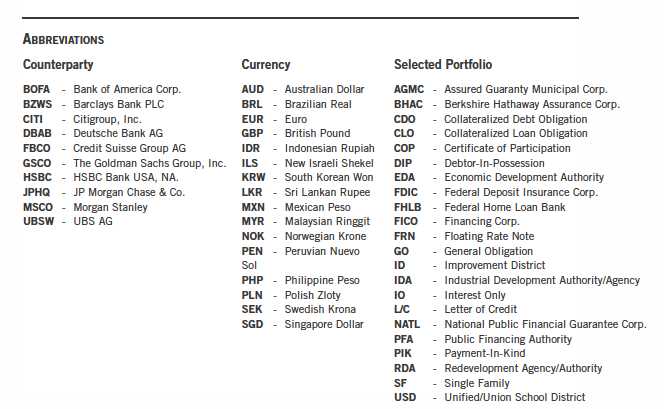
Annual Report | 151
Franklin Investors Securities Trust
Report of Independent Registered Public Accounting Firm
To the Board of Trustees and Shareholders of Franklin Investors Securities Trust
In our opinion, the accompanying statements of assets and liabilities, including the statements of investments, and the related statements of operations and of changes in net assets and the financial highlights present fairly, in all material respects, the financial position of Franklin Adjustable U.S. Government Securities Fund, Franklin Floating Rate Daily Access Fund, Franklin Low Duration Total Return Fund and Franklin Total Return Fund (separate portfolios constituting Franklin Investors Securities Trust, hereafter referred to as the “Funds”) at October 31, 2011, the results of each of their operations for the year then ended, the changes in each of their net assets for each of the two years in the period then ended and the financial highlights for each of the periods presented, in conformity with accounting principles generally accepted in the United States of America. These financial statements and financial highlights (hereafter referred to as “financial statements”) are the responsibility of the Funds’ management. Our responsibility is to express an opinion on these financial statements based on our audits. We conducted our audits of these financial statements in accordance with the standards of the Public Company Accounting Oversight Board (United States). Those standards require that we plan and perform the audit to obtain reasonable assurance about whether the financial statements are free of material misstatement. An audit includes examining, on a test basis, evidence supporting the amounts and disclosures in the financial statements, assessing the accounting principles used and significant estimates made by management, and evaluating the overall financial statement presentation. We believe that our audits, which included confirmation of securities at October 31, 2011 by correspondence with the custodian and brokers, provide a reasonable basis for our opinion.
PricewaterhouseCoopers LLP
San Francisco, California
December 16, 2011
152 | Annual Report
Franklin Investors Securities Trust
Tax Designation (unaudited)
Under Section 852(b)(3)(C) of the Internal Revenue Code (Code), the Franklin Low Duration Total Return Fund and Franklin Total Return Fund designate the maximum amount allowable but no less than $178,604 and $16,771,057, respectively, as long term capital gain dividends for the fiscal year ended October 31, 2011.
Under Section 871(k)(2)(C) of the Code, the Franklin Low Duration Total Return Fund and Franklin Total Return Fund designate the maximum amount allowable but no less than $1,427,242 and $1,483,593, respectively, as short term capital gain dividends for purposes of the tax imposed under Section 871(a)(1)(A) of the Code for the fiscal year ended October 31, 2011.
Under Section 871(k)(1)(C) of the Code, the Funds designate the maximum amount allowable but no less than the following amounts as interest related dividends for purposes of the tax imposed under Section 871(a)(1)(A) of the Code for the fiscal year ended October 31, 2011:
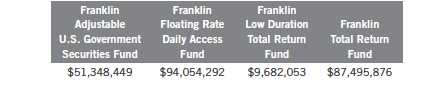
Annual Report | 153
Franklin Investors Securities Trust
Board Members and Officers
The name, year of birth and address of the officers and board members, as well as their affiliations, positions held with the Trust, principal occupations during the past five years and number of portfolios overseen in the Franklin Templeton Investments fund complex are shown below. Generally, each board member serves until that person’s successor is elected and qualified.
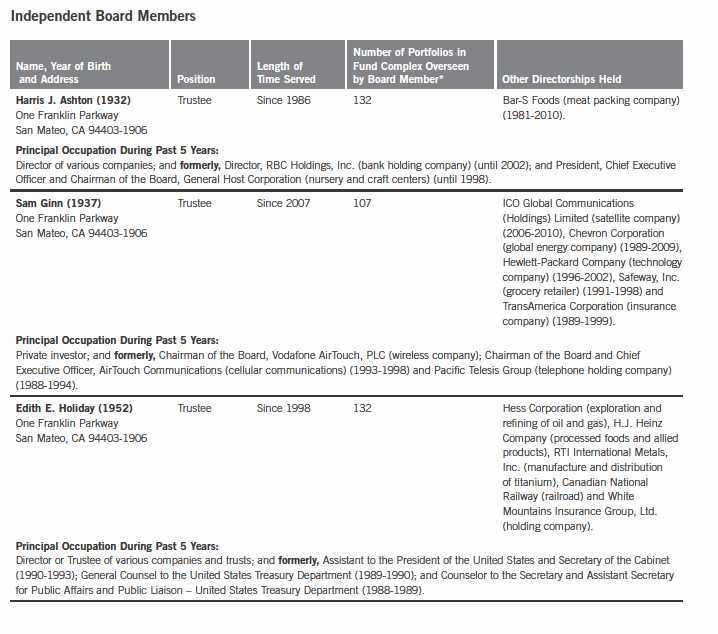
154 | Annual Report
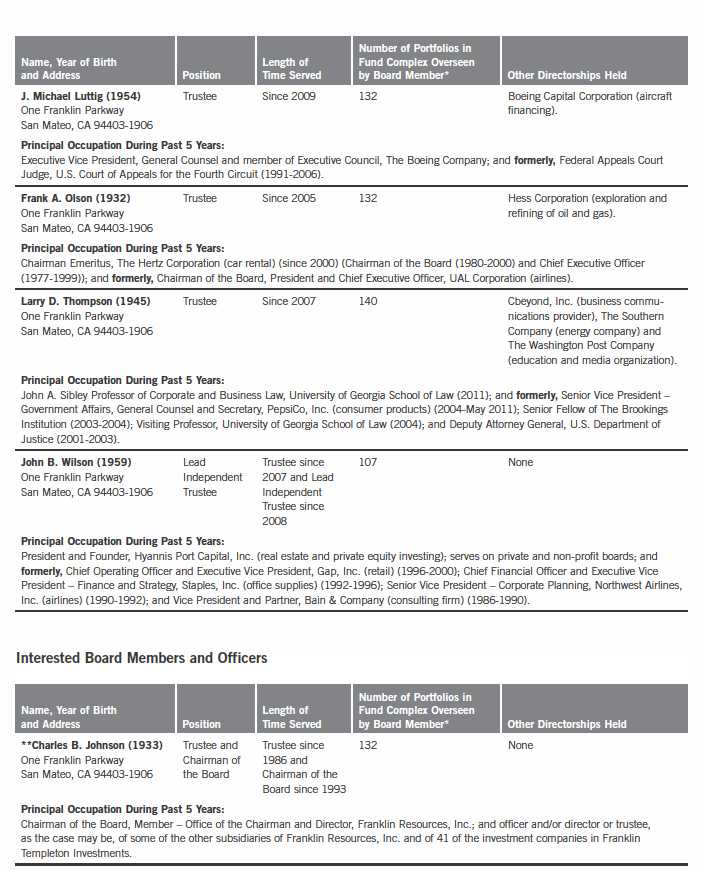
Annual Report | 155
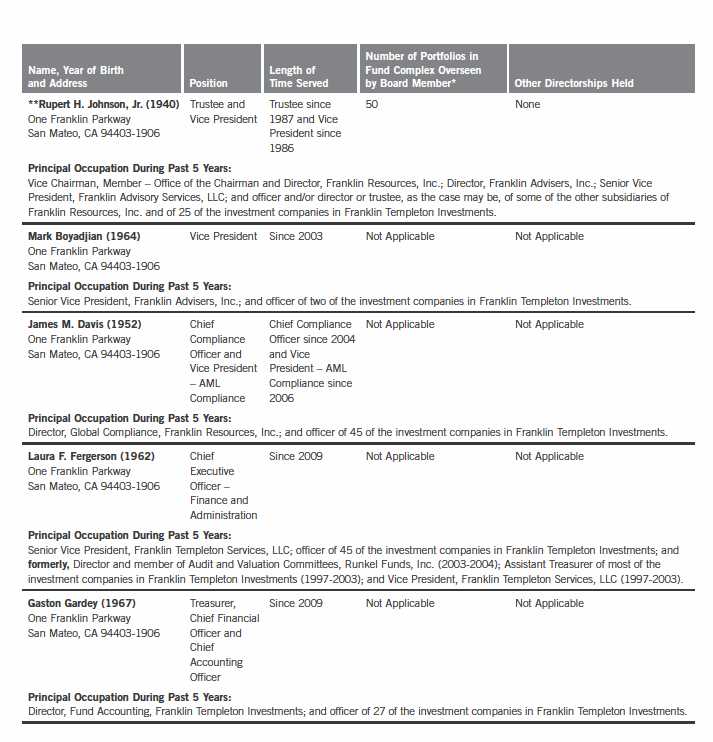
156 | Annual Report
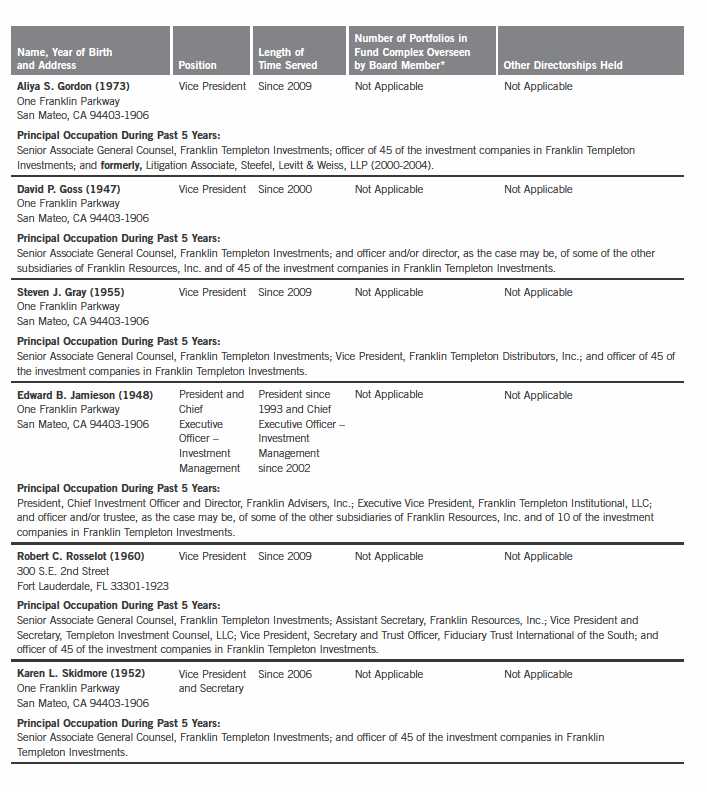
Annual Report | 157
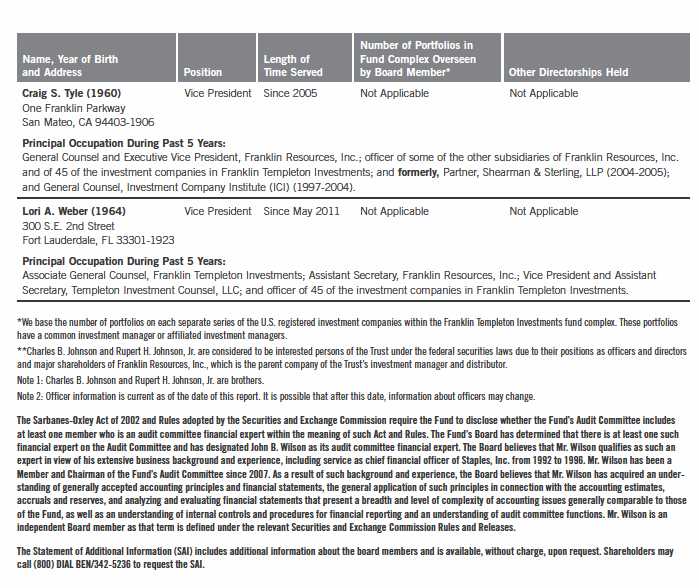
158 | Annual Report
Franklin Investors Securities Trust
Shareholder Information
Proxy Voting Policies and Procedures
The Trust’s investment manager has established Proxy Voting Policies and Procedures (Policies) that the Trust uses to determine how to vote proxies relating to portfolio securities. Shareholders may view the Trust’s complete Policies online at franklintempleton.com. Alternatively, shareholders may request copies of the Policies free of charge by calling the Proxy Group collect at (954) 527-7678 or by sending a written request to: Franklin Templeton Companies, LLC, 300 S.E. 2nd Street, Fort Lauderdale, FL 33301, Attention: Proxy Group. Copies of the Trust’s proxy voting records are also made available online at franklintempleton.com and posted on the U.S. Securities and Exchange Commission’s website at sec.gov and reflect the most recent 12-month period ended June 30.
Quarterly Statement of Investments
The Trust files a complete statement of investments with the U.S. Securities and Exchange Commission for the first and third quarters for each fiscal year on Form N-Q. Shareholders may view the filed Form N-Q by visiting the Commission’s website at sec.gov. The filed form may also be viewed and copied at the Commission’s Public Reference Room in Washington, DC. Information regarding the operations of the Public Reference Room may be obtained by calling (800) SEC-0330.
Householding of Reports and Prospectuses
You will receive each Fund’s financial reports every six months as well as an annual updated summary prospectus (prospectus available upon request). To reduce Fund expenses, we try to identify related shareholders in a household and send only one copy of the financial reports and summary prospectus. This process, called “householding,” will continue indefinitely unless you instruct us otherwise. If you prefer not to have these documents householded, please call us at (800) 632-2301. At any time you may view current prospectuses/summary prospectuses and financial reports on our website. If you choose, you may receive these documents through electronic delivery.
Annual Report | 159
This page intentionally left blank.
Item 2. Code of Ethics.
(a) The Registrant has adopted a code of ethics that applies to its principal executive officers and principal financial and accounting officer.
| (c) | N/A |
| (d) | N/A |
| (f) | Pursuant to Item 12(a)(1), the Registrant is attaching as an exhibit a copy of its code of ethics that applies to its principal executive officers and principal financial and accounting officer. |
Item 3. Audit Committee Financial Expert.
(a)(1) The Registrant has an audit committee financial expert serving on its audit committee.
(2) The audit committee financial expert is John B. Wilson and he is "independent" as defined under the relevant Securities and Exchange Commission Rules and Releases.
Item 4. Principal Accountant Fees and Services.
(a) Audit Fees
The aggregate fees paid to the principal accountant for professional services rendered by the principal accountant for the audit of the registrant’s annual financial statements or for services that are normally provided by the principal accountant in connection with statutory and regulatory filings or engagements were $438,959 for the fiscal year ended October 31, 2011 and $408,963 for the fiscal year ended October 31, 2010.
(b) Audit-Related Fees
There were no fees paid to the principal accountant for assurance and related services rendered by the principal accountant to the registrant that are reasonably related to the performance of the audit of the registrant's financial statements and are not reported under paragraph (a) of Item 4.
There were no fees paid to the principal accountant for assurance and related services rendered by the principal accountant to the registrant's investment adviser and any entity controlling, controlled by or under common control with the investment adviser that provides ongoing services to the registrant that are reasonably related to the performance of the audit of their financial statements.
(c) Tax Fees
The aggregate fees paid to the principal accountant for professional services rendered by the principal accountant to the registrant for tax compliance, tax advice and tax planning were $10,000 for the fiscal year ended October 31, 2011 and $0 for the fiscal year ended October 31, 2010. The services for which these fees were paid included preparation of tax returns.
The aggregate fees paid to the principal accountant for professional services rendered by the principal accountant to the registrant’s investment adviser and any entity controlling, controlled by or under common control with the investment adviser that provides ongoing services to the registrant for tax compliance, tax advice and tax planning were $75,000 for the fiscal year ended October 31, 2011 and $35,000 for the fiscal year ended October 31, 2010. The services for which these fees were paid included technical tax consultation for capital gain tax reporting to foreign governments and the application of the local country tax laws to investments made by various Franklin Templeton funds.
(d) All Other Fees
The aggregate fees paid to the principal accountant for products and services rendered by the principal accountant to the registrant not reported in paragraphs (a)-(c) of Item 4 were $0 for the fiscal year ended October 31, 2011 and $4,078 for the fiscal year ended October 31, 2010. The services for which these fees were paid include review of materials provided to the fund Board in connection with the investment management contract renewal process.
The aggregate fees paid to the principal accountant for products and services rendered by the principal accountant to the registrant’s investment adviser and any entity controlling, controlled by or under common control with the investment adviser that provides ongoing services to the registrant not reported in paragraphs (a)-(c) of Item 4 were $0 for the fiscal year ended October 31, 2011 and $140,722 for the fiscal year ended October 31, 2010. The services for which these fees were paid include review of materials provided to the fund Board in connection with the investment management contract renewal process.
(e) (1) The registrant’s audit committee is directly responsible for approving the services to be provided by the auditors, including:
| (i) | pre-approval of all audit and audit related services; |
| (ii) | pre-approval of all non-audit related services to be provided to the Fund by the auditors; |
(iii) pre-approval of all non-audit related services to be provided to the registrant by the auditors to the registrant’s investment adviser or to any entity that controls, is controlled by or is under common control with the registrant’s investment adviser and that provides ongoing services to the registrant where the non-audit services relate directly to the operations or financial reporting of the registrant; and
(iv) establishment by the audit committee, if deemed necessary or appropriate, as an alternative to committee pre-approval of services to be provided by the auditors, as required by paragraphs (ii) and (iii) above, of policies and procedures to permit such services to be pre-approved by other means, such as through establishment of guidelines or by action of a designated member or members of the committee; provided the policies and procedures are detailed as to the particular service and the committee is informed of each service and such policies and procedures do not include delegation of audit
committee responsibilities, as contemplated under the Securities Exchange Act of 1934, to management; subject, in the case of (ii) through (iv), to any waivers, exceptions or exemptions that may be available under applicable law or rules.
(e) (2) None of the services provided to the registrant described in paragraphs (b)-(d) of Item 4 were approved by the audit committee pursuant to paragraph (c)(7)(i)(C) of Rule 2-01 of regulation S-X.
| (f) | No disclosures are required by this Item 4(f). |
| (g) | The aggregate non-audit fees paid to the principal accountant for services rendered by the principal accountant to the registrant and the registrant’s investment adviser and any entity controlling, controlled by or under common control with the investment adviser that provides ongoing services to the registrant were $85,000 for the fiscal year ended October 31, 2011 and $179,800 for the fiscal year ended October 31, 2010. |
(h) The registrant’s audit committee of the board has considered whether the provision of non-audit services that were rendered to the registrant’s investment adviser (not including any sub-adviser whose role is primarily portfolio management and is subcontracted with or overseen by another investment adviser), and any entity controlling, controlled by, or under common control with the investment adviser that provides ongoing services to the registrant that were not pre-approved pursuant to paragraph (c)(7)(ii) of Rule 2-01 of Regulation S-X is compatible with maintaining the principal accountant’s independence.
Item 5. Audit Committee of Listed Registrants. N/A
Item 6. Schedule of Investments. N/A
Item 7. Disclosure of Proxy Voting Policies and Procedures for Closed-End Management Investment Companies. N/A
Item 8. Portfolio Managers of Closed-End Management Investment Companies. N/A
Item 9. Purchases of Equity Securities by Closed-End Management Investment Company and Affiliated Purchasers. N/A
Item 10. Submission of Matters to a Vote of Security Holders.
There have been no changes to the procedures by which shareholders may recommend nominees to the Registrant's Board of Trustees that would require disclosure herein.
Item 11. Controls and Procedures.
(a) Evaluation of Disclosure Controls and Procedures. The Registrant maintains disclosure controls and procedures that are designed to ensure that information required to be disclosed in the Registrant’s filings under the Securities Exchange Act of 1934 and the Investment Company Act of 1940 is recorded, processed, summarized and reported within the periods specified in the rules and forms of the Securities and Exchange Commission. Such information is accumulated and
communicated to the Registrant’s management, including its principal executive officer and principal financial officer, as appropriate, to allow timely decisions regarding required disclosure. The Registrant’s management, including the principal executive officer and the principal financial officer, recognizes that any set of controls and procedures, no matter how well designed and operated, can provide only reasonable assurance of achieving the desired control objectives.
Within 90 days prior to the filing date of this Shareholder Report on Form N-CSR, the Registrant had carried out an evaluation, under the supervision and with the participation of the Registrant’s management, including the Registrant’s principal executive officer and the Registrant’s principal financial officer, of the effectiveness of the design and operation of the Registrant’s disclosure controls and procedures. Based on such evaluation, the Registrant’s principal executive officer and principal financial officer concluded that the Registrant’s disclosure controls and procedures are effective.
(b) Changes in Internal Controls.
There have been no significant
changes in the Registrant’s internal controls or in other factors that could significantly affect the internal controls subsequent to the date of their evaluation in connection with the preparation of this Shareholder Report on Form N-CSR.
Item 12. Exhibits.
| (a) | (1) Code of Ethics |
| (a) | (2) Certifications pursuant to Section 302 of the Sarbanes-Oxley Act of 2002 of Laura F. Fergerson, Chief Executive Officer - Finance and Administration, and Gaston Gardey, Chief Financial Officer and Chief Accounting Officer |
(b) Certifications pursuant to Section 906 of the Sarbanes-Oxley Act of 2002 of Laura F. Fergerson, Chief Executive Officer - Finance and Administration, and Gaston Gardey, Chief Financial Officer and Chief Accounting Officer
SIGNATURES
Pursuant to the requirements of the Securities Exchange Act of 1934 and the Investment Company Act of 1940, the registrant has duly caused this report to be signed on its behalf by the undersigned, thereunto duly authorized.
FRANKLIN INVESTORS SECURITIES TRUST