UNITED STATES
SECURITIES AND EXCHANGE COMMISSION
Washington, DC 20549
FORM N-CSR
CERTIFIED SHAREHOLDER REPORT OF REGISTERED MANAGEMENT INVESTMENT COMPANIES
Investment Company Act file number_811-04986
Franklin Investors Securities Trust
(Exact name of registrant as specified in charter)
One Franklin Parkway, San Mateo, CA 94403-1906
(Address of principal executive offices) (Zip code)
Craig S. Tyle, One Franklin Parkway, San Mateo, CA 94403-1906
(Name and address of agent for service)
Registrant's telephone number, including area code: 650 312-2000
Date of fiscal year end: 10/31
Date of reporting period: 10/31/14
Item 1. Reports to Stockholders.
| Contents | |
| Shareholder Letter | 1 |
| Annual Report | |
| Economic and Market Overview | 3 |
| Franklin Balanced Fund | 4 |
| Franklin Convertible | |
| Securities Fund | 14 |
| Franklin Equity Income Fund | 23 |
| Franklin Real Return Fund | 33 |
| Financial Highlights and | |
| Statements of Investments | 42 |
| Financial Statements | 81 |
| Notes to Financial Statements | 86 |
| Report of Independent Registered | |
| Public Accounting Firm | 103 |
| Tax Information | 104 |
| Board Members and Officers | 105 |
| Shareholder Information | 110 |
| 1
Annual Report
Economic and Market Overview
The U.S. economy continued to grow during the 12-month period ended October 31, 2014, underpinned by manufacturing activity, consumer and business spending, and generally rising inventories. Economic activity expanded in the third quarter, resulting largely from increased federal defense spending and a narrower trade deficit. In the housing market, home sales experienced some weather-related weakness in early 2014 but began to recover in May, and home prices stayed higher than a year earlier. Except for a sharp rebound in March, retail sales missed consensus expectations for most of the period under review. The unemployment rate declined to 5.8% in October 2014 from 7.2% in October 2013.1 Inflation, as measured by the Consumer Price Index, remained low for the period.
In January 2014, the Federal Reserve Board (Fed) began reducing its bond purchases $10 billion a month, based on largely positive economic and employment data in late 2013. After further gradual reductions during the year, the Fed ended its asset purchase program in October based on its view that underlying economic strength could support ongoing progress in labor market conditions. The Fed reaffirmed it would maintain its near-zero interest rate policy for a “considerable time” and stated its actions to normalize monetary policy remained dependent on economic performance. Additionally, the Fed noted that although inflation might remain low in the near term, the likelihood of inflation running persistently below its 2% longer term goal had diminished somewhat since early 2014.
Investor confidence grew as corporate profits rose and the economy generally strengthened. The market endured brief sell-offs when many investors reacted to political instability in certain emerging markets, crises in Ukraine and the Middle East, weakness in Europe and moderating economic data in China. U.S. stocks rose for the 12 months under review as the Standard & Poor’s 500 Index and Dow Jones Industrial Average reached all-time highs.
The 10-year Treasury yield rose from 2.57% at the beginning of the period to a high of 3.04% on December 31, 2013, mainly because of an improved economic environment and market uncertainty about the Fed’s plans. However, the yield declined to 2.35% at period-end as investors shifted to less risky assets following the crises in Ukraine and the Middle East, growth concerns about emerging markets, record low bond yields, weak economic data in Europe and lower Treasury issuance.
The foregoing information reflects our analysis and opinions as of October 31, 2014. The information is not a complete analysis of every aspect of any market, country, industry, security or fund. Statements of fact are from sources considered reliable.
1. Source: Bureau of Labor Statistics.
franklintempleton.com Annual Report | 3
Franklin Balanced Fund
This annual report for Franklin Balanced Fund covers the fiscal year ended October 31, 2014.
Your Fund’s Goal and Main Investments
The Fund seeks both income and capital appreciation by investing in a combination of stocks, convertible securities and debt securities. The Fund will normally invest at least 25% of its total assets in equity securities (primarily common and preferred stock) and at least 25% of its total assets in debt securities, including bonds, notes, debentures and money market securities.
| Portfolio Breakdown* | ||
| 10/31/14 | ||
| % of Total | ||
| Net Assets | ||
| Stocks | 64.4 | % |
| Common Stocks | 53.7 | % |
| Equity-Linked Securities | 5.0 | % |
| Convertible Preferred Stocks | 5.0 | % |
| Preferred Stocks | 0.7 | % |
| Bonds | 29.8 | % |
| Corporate Bonds | 29.8 | % |
| Short-Term Investments & Other Net Assets | 5.8 | % |
*Percentages reflect certain derivatives held in the portfolio (or their underlying
reference assets) and may not total 100% or may be negative due to rounding,
use of derivatives, unsettled trades or other factors.
Performance Overview
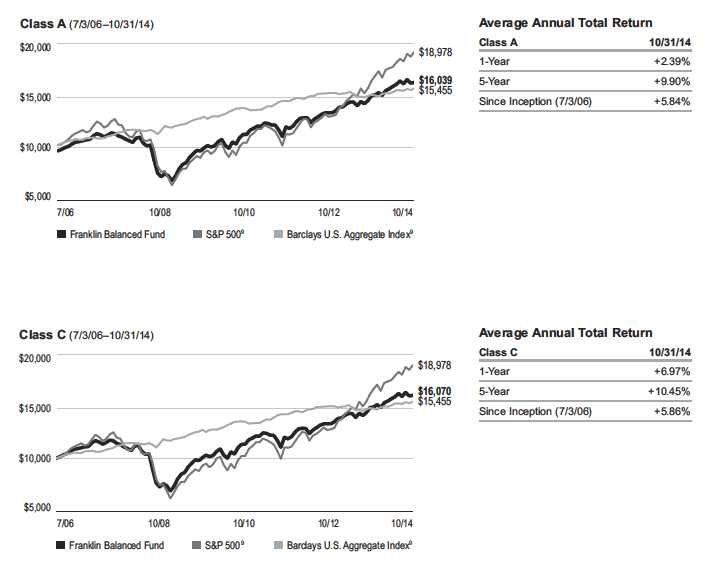
For the 12 months under review, the Fund’s Class A shares delivered a cumulative total return of +8.66%. In comparison, the Fund’s equity benchmark, the Standard & Poor’s 500 Index (S&P 500®), which is a broad measure of U.S. stock performance, posted a +17.27% total return.1 The Fund’s fixed income benchmark, the Barclays U.S. Aggregate Index, which tracks the U.S. investment-grade, taxable bond market, posted a +4.14% return.1 You can find the Fund’s long-term performance data in the Performance Summary beginning on page 7.
Performance data represent past performance, which does not guarantee future results. Investment return and principal value will fluctuate, and you may have a gain or loss when you sell your shares. Current performance may differ from figures shown. Please visit franklintempleton.com or call (800) 342-5236 for most recent month-end performance.
Investment Strategy
We apply a bottom-up approach to investing in individual securities. We will assess the market price of a company’s securities relative to our evaluation of the company’s long-term earnings, asset value and cash flow potential. We also consider a company’s price/earnings ratio, profit margins and liquidation value. In determining an optimal mix of equity and fixed income investments for the Fund, we assess changing economic, market and industry conditions. We may sell securities for a number of possible reasons, including the achievement of certain stock prices or credit spreads, changes in the fundamental outlook or risk/reward profile of a security, less attractive values relative to market peers, or broad economic conditions affecting certain fixed income sectors.
| Dividend Distributions* | |||||
| 11/1/13–10/31/14 | |||||
| Dividend per Share (cents) | |||||
| Advisor | |||||
| Month | Class A | Class C | Class R | Class R6 | Class |
| November | 3.00 | 2.36 | 2.82 | 3.39 | 3.28 |
| December | 3.00 | 2.33 | 2.81 | 3.44 | 3.29 |
| January | 3.00 | 2.33 | 2.81 | 3.44 | 3.29 |
| February | 3.00 | 2.33 | 2.81 | 3.44 | 3.29 |
| March | 3.00 | 2.34 | 2.81 | 3.41 | 3.29 |
| April | 3.00 | 2.34 | 2.81 | 3.41 | 3.29 |
| May | 3.00 | 2.34 | 2.81 | 3.41 | 3.29 |
| June | 3.00 | 2.32 | 2.80 | 3.36 | 3.29 |
| July | 3.00 | 2.32 | 2.80 | 3.36 | 3.29 |
| August | 3.00 | 2.32 | 2.80 | 3.36 | 3.29 |
| September | 3.00 | 2.29 | 2.80 | 3.43 | 3.31 |
| October | 3.00 | 2.29 | 2.80 | 3.43 | 3.31 |
| Total | 36.00 | 27.91 | 33.68 | 40.88 | 39.51 |
*All Fund distributions will vary depending upon current market conditions, and past
distributions are not indicative of future trends.
1. Source: Morningstar.
The indexes are unmanaged and include reinvestment of any income or distributions. One cannot invest directly in an index, and an index is not representative of the
Fund’s portfolio.
The dollar value, number of shares or principal amount, and names of all portfolio holdings are listed in the Fund’s Statement of Investments (SOI).
The SOI begins on page 47.
4 | Annual Report franklintempleton.com
FRANKLIN BALANCED FUND
Manager’s Discussion
During the 12 months under review, the Fund’s equity and fixed income components contributed to absolute performance. The majority of the Fund’s equity sector positions delivered positive results, led by information technology, industrials and utilities. In contrast, the energy sector detracted from performance. All of the Fund’s fixed income sectors contributed to returns, owing to strong corporate bond performance. The U.S. corporate bond market continued to benefit from low default rates, improved credit quality and investor demand for income.
Although the Fund remained well diversified, during the year we decreased the Fund’s overall equity weighting from 69.1% to 64.4% of total net assets, particularly with reductions to the energy, materials and consumer staples sectors. In contrast, we added to the Fund’s equity sector weightings in utilities, information technology and health care during the period, seeking to take advantage of what we considered were attractive valuations. The Fund’s fixed income exposure slightly increased from 27.4% to 29.8% of total net assets. The Fund’s cash position increased during the period from 3.5% to 5.8% of total net assets. The Fund typically weights the benchmark index at 60% for the S&P 500 and 40% for the Barclays U.S. Aggregate Index. The Fund’s asset mix relative to that of its benchmark contributed to relative performance.
Several equity sectors contributed strong returns during the period, including information technology, utilities, financials and health care. The Fund benefited from equity information technology holdings including Apple, Intel and Texas Instruments. Utilities sector holdings including Duke Energy, The Southern Co., NextEra Energy and Xcel Energy delivered strong returns as long-term interest rates declined and opportunities for energy and power infrastructure companies drove growth in the rate base for regulated operations. Within financials, our holdings in major diversified banks including JPMorgan Chase & Co., Wells Fargo & Co. and Bank of America as well as a new position in Citigroup benefited from continued favorable credit trends and improved growth in loan issuance levels. A leading contributor among health care holdings was Eli Lilly & Co., which received Food and Drug Administration approval to market several drugs during a period generally marked by sales and revenue declines.
| Top Five Equity Holdings | ||
| 10/31/14 | ||
| Company | % of Total | |
| Sector/Industry | Net Assets | |
| Intel Corp., ord. & equity-linked | 1.7 | % |
| Information Technology | ||
| Apple Inc. | 1.6 | % |
| Information Technology | ||
| Schlumberger Ltd. | 1.5 | % |
| Energy | ||
| Verizon Communications Inc. | 1.5 | % |
| Telecommunication Services | ||
| PG&E Corp. | 1.4 | % |
| Utilities | ||
Detractors among equity positions were concentrated in the energy and materials sectors as slowing expectations for global economic growth and decelerating demand from important emerging economies, particularly China, reduced the prices of many commodities including iron ore, steel, coal and oil. Within the energy sector, our convertible securities holdings of exploration and production companies Cobalt International Energy,2 Sanchez Energy and Rex Energy, a new holding, declined in value along with the pullback in global crude oil prices. Certain holdings in the materials sector including Freeport-McMoRan, BHP Billiton and Rio Tinto also hurt results.
Within the fixed income side of the portfolio, our investments in corporate bonds delivered strong returns relative to the Barclays U.S. Aggregate Index. For the Fund’s fixed income benchmark, the corporate credit sector led returns and outpaced Treasuries, asset-backed securities and mortgage-backed securities. Our considerable exposure to the fixed income banking sector contributed to absolute and relative returns.3 We continued to focus on banks with improving fundamentals and moved further down the capital structure seeking incremental yield. Deutsche Bank, Citigroup, PNC Financial Services Group and JPMorgan Chase & Co. produced positive returns. Certain fixed income finance companies also helped performance during the period, as SLM2 and General Electric Capital Corp. delivered double-digit returns.4 Finance companies represented another sector that benefited from continued balance sheet repair and positive credit fundamentals. The fixed income communications sector also produced significant returns, led
2. No longer held at period-end.
3. Banking holdings are in financials in the fixed income section of the SOI.
4. Finance companies are in financials in the fixed income section of the SOI.
franklintempleton.com Annual Report | 5
FRANKLIN BALANCED FUND
by Verizon Communications, Charter Communications5 and Telefonica Emisiones.6 In general, fixed income consumer noncyclical holdings were steady performers during the period.7
| Top Five Bond Holdings | ||
| 10/31/14 | ||
| Company | % of Total | |
| Sector/Industry | Net Assets | |
| Citigroup Inc. | 1.0 | % |
| Financials | ||
| Energy Transfer Partners LP | 0.9 | % |
| Energy | ||
| JPMorgan Chase & Co. | 0.9 | % |
| Financials | ||
| HCP Inc. | 0.8 | % |
| Financials | ||
| Sabine Pass Liquefaction LLC | 0.8 | % |
| Energy | ||
In contrast, certain fixed income materials and energy companies faced headwinds. We had very few fixed income detractors, but the few we did have were concentrated in these sectors. Oilfield services companies were challenged during the period, and our exposure to Ocean Rig UDW2 modestly detracted from performance. Exposure to coal producer Peabody Energy also modestly hindered returns. We sought to take advantage of this volatile environment, and we acquired positions in pipeline companies that yielded positive results.
The Fund used derivative instruments during the period, such as equity options. The goal of these instruments is to enhance Fund returns and more efficiently enter and exit stock positions at prices the Fund deems attractive. None of these positions had a material impact on performance.
What is an option?
An option is a contract to buy or sell a specific financial product
known as the option’s underlying instrument at a specific price.
The buyer of an option has the right, but not the obligation, to
buy or sell the underlying instrument at or until a specified expi-
ration date. Conversely, the seller (“writer”) of an option who
opens a transaction is obligated to buy or sell the underlying
instrument should the option holder exercise that right.
Thank you for your continued participation in Franklin Balanced Fund. We look forward to serving your future investment needs.

The foregoing information reflects our analysis, opinions and portfolio holdings as of October 31, 2014, the end of the reporting period. The way we implement our main investment strategies and the resulting portfolio holdings may change depending on factors such as market and economic conditions. These opinions may not be relied upon as investment advice or an offer for a particular security. The information is not a complete analysis of every aspect of any market, country, industry, security or the Fund. Statements of fact are from sources considered reliable, but the investment manager makes no representation or warranty as to their completeness or accuracy. Although historical performance is no guarantee of future results, these insights may help you understand our investment management philosophy.
5. Charter Communications comprises CCO Holdings in the SOI.
6. Communications companies are in consumer discretionary and telecommunication services in the fixed income section of the SOI.
7. Consumer non-cyclical companies are in consumer staples and health care in the fixed income section of the SOI.
See www.franklintempletondatasources.com for additional data provider information.
CFA® is a trademark owned by CFA Institute.
6 | Annual Report franklintempleton.com
FRANKLIN BALANCED FUND
Performance Summary as of October 31, 2014
Your dividend income will vary depending on dividends or interest paid by securities in the Fund’s portfolio, adjusted for operating expenses of each class. Capital gain distributions are net profits realized from the sale of portfolio securities. The performance tables and graphs do not reflect any taxes that a shareholder would pay on Fund dividends, capital gain distributions, if any, or any realized gains on the sale of Fund shares. Total return reflects reinvestment of the Fund’s dividends and capital gain distributions, if any, and any unrealized gains or losses.
| Net Asset Value | ||||||||
| Share Class (Symbol) | 10/31/14 | 10/31/13 | Change | |||||
| A (FBLAX) | $ | 11.86 | $ | 11.43 | +$ | 0.43 | ||
| C (FBMCX) | $ | 11.77 | $ | 11.34 | +$ | 0.43 | ||
| R (N/A) | $ | 11.89 | $ | 11.45 | +$ | 0.44 | ||
| R6 (FBFRX) | $ | 11.89 | $ | 11.45 | +$ | 0.44 | ||
| Advisor (FBFZX) | $ | 11.88 | $ | 11.45 | +$ | 0.43 | ||
| Distributions (11/1/13-10/31/14) | ||||||||
| Dividend | Short-Term | Long-Term | ||||||
| Share Class | Income | Capital Gain | Capital Gain | Total | ||||
| A | $ | 0.3600 | $ | 0.0312 | $ | 0.1395 | $ | 0.5307 |
| C | $ | 0.2791 | $ | 0.0312 | $ | 0.1395 | $ | 0.4498 |
| R | $ | 0.3368 | $ | 0.0312 | $ | 0.1395 | $ | 0.5075 |
| R6 | $ | 0.4088 | $ | 0.0312 | $ | 0.1395 | $ | 0.5795 |
| Advisor | $ | 0.3951 | $ | 0.0312 | $ | 0.1395 | $ | 0.5658 |
franklintempleton.com Annual Report | 7
FRANKLIN BALANCED FUND
PERFORMANCE SUMMARY
| Performance as of 10/31/141 |
| Cumulative total return excludes sales charges. Average annual total returns and value of $10,000 investment include maximum |
| sales charges. Class A: 5.75% maximum initial sales charge; Class C: 1% contingent deferred sales charge in first year only; |
| Class R/R6/Advisor Class: no sales charges. |
| Value of | Average Annual | ||||||||||||||
| Cumulative | Average Annual | $ | 10,000 | Total Return | Total Annual Operating Expenses6 | ||||||||||
| Share Class | Total Return2 | Total Return3 | Investment4 | (9/30/14 | )5 | (with waiver) | (without waiver) | ||||||||
| A | 1.13 | % | 1.14 | % | |||||||||||
| 1-Year | + | 8.66 | % | + | 2.39 | % | $ | 10,239 | + | 5.44 | % | ||||
| 5-Year | + | 70.10 | % | + | 9.90 | % | $ | 16,035 | + | 9.67 | % | ||||
| Since Inception (7/3/06) | + | 70.18 | % | + | 5.84 | % | $ | 16,039 | + | 5.84 | % | ||||
| C | 1.83 | % | 1.84 | % | |||||||||||
| 1-Year | + | 7.97 | % | + | 6.97 | % | $ | 10,697 | + | 10.13 | % | ||||
| 5-Year | + | 64.39 | % | + | 10.45 | % | $ | 16,439 | + | 10.20 | % | ||||
| Since Inception (7/3/06) | + | 60.70 | % | + | 5.86 | % | $ | 16,070 | + | 5.88 | % | ||||
| R | 1.33 | % | 1.34 | % | |||||||||||
| 1-Year | + | 8.51 | % | + | 8.51 | % | $ | 10,851 | + | 11.65 | % | ||||
| 5-Year | + | 68.57 | % | + | 11.01 | % | $ | 16,857 | + | 10.76 | % | ||||
| Since Inception (7/3/06) | + | 67.82 | % | + | 6.41 | % | $ | 16,782 | + | 6.43 | % | ||||
| R6 | 0.72 | % | 0.73 | % | |||||||||||
| 1-Year | + | 9.29 | % | + | 9.29 | % | $ | 10,929 | + | 12.26 | % | ||||
| Since Inception (5/1/13) | + | 14.92 | % | + | 9.70 | % | $ | 11,492 | + | 9.82 | % | ||||
| Advisor | 0.83 | % | 0.84 | % | |||||||||||
| 1-Year | + | 8.97 | % | + | 8.97 | % | $ | 10,897 | + | 12.22 | % | ||||
| 5-Year | + | 72.72 | % | + | 11.55 | % | $ | 17,272 | + | 11.30 | % | ||||
| Since Inception (7/3/06) | + | 74.53 | % | + | 6.92 | % | $ | 17,453 | + | 6.93 | % | ||||
| Distribution | 30-Day Standardized Yield8 | ||||||||||||||
| Share Class | Rate7 | (with waiver) | (without waiver) | ||||||||||||
| A | 2.86 | % | 2.23 | % | 2.23 | % | |||||||||
| C | 2.33 | % | 1.66 | % | 1.66 | % | |||||||||
| R | 2.83 | % | 2.16 | % | 2.16 | % | |||||||||
| R6 | 3.46 | % | 2.78 | % | 2.77 | % | |||||||||
| Advisor | 3.34 | % | 2.66 | % | 2.66 | % | |||||||||
Performance data represent past performance, which does not guarantee future results. Investment return and principal value will fluctuate, and you may have a gain or loss when you sell your shares. Current performance may differ from figures shown. For most recent month-end performance, go to franklintempleton.com or call (800) 342-5236.
8 | Annual Report franklintempleton.com
FRANKLIN BALANCED FUND
PERFORMANCE SUMMARY
Total Return Index Comparison for a Hypothetical $10,000 Investment1
Total return represents the change in value of an investment over the periods shown. It includes any applicable maximum sales charge, Fund expenses, account fees and reinvested distributions. The unmanaged indexes include reinvestment of any income or distributions. They differ from the Fund in composition and do not pay management fees or expenses. One cannot invest directly in an index.
franklintempleton.com Annual Report | 9
FRANKLIN BALANCED FUND
PERFORMANCE SUMMARY
Total Return Index Comparison for a Hypothetical $10,000 Investment1 (continued)

10 | Annual Report franklintempleton.com
FRANKLIN BALANCED FUND
PERFORMANCE SUMMARY
Total Return Index Comparison for a Hypothetical $10,000 Investment1 (continued)
All investments involve risks, including possible loss of principal. The Fund’s share price and yield will be affected by interest rate movements. Bond prices generally move in the opposite direction of interest rates. As prices of bonds in the Fund adjust to a rise in interest rates, the Fund’s share price may decline. Stock prices fluctuate, sometimes rapidly and dramatically, due to factors affecting individual companies, particular industries or sectors, or general market conditions. The Fund is actively managed but there is no guarantee that the manager’s investment decisions will produce the desired results. The Fund’s prospectus also includes a description of the main investment risks.
| Class C: | These shares have higher annual fees and expenses than Class A shares. |
| Class R: | Shares are available to certain eligible investors as described in the prospectus. These shares have higher annual fees and expenses than Class A shares. |
| Class R6: | Shares are available to certain eligible investors as described in the prospectus. |
| Advisor Class: | Shares are available to certain eligible investors as described in the prospectus. |
1. The Fund has a fee waiver associated with its investments in a Franklin Templeton money fund, contractually guaranteed through at least its current fiscal year-end.
Fund investment results reflect the fee waiver, to the extent applicable; without this reduction, the results would have been lower.
2. Cumulative total return represents the change in value of an investment over the periods indicated.
3. Average annual total return represents the average annual change in value of an investment over the periods indicated.
4. These figures represent the value of a hypothetical $10,000 investment in the Fund over the periods indicated.
5. In accordance with SEC rules, we provide standardized average annual total return information through the latest calendar quarter.
6. Figures are as stated in the Fund’s current prospectus. In periods of market volatility, assets may decline significantly, causing total annual Fund operating expenses to
become higher than the figures shown.
7. Distribution rate is based on an annualization of the respective class’s October dividend and the maximum offering price (NAV for Classes C, R, R6 and Advisor) per
share on 10/31/14.
8. The 30-day standardized yield for the 30 days ended 10/31/14 reflects an estimated yield to maturity (assuming all portfolio securities are held to maturity). It should be
regarded as an estimate of the Fund’s rate of investment income, and it may not equal the Fund’s actual income distribution rate (which reflects the Fund’s past dividends
paid to shareholders) or the income reported in the Fund’s financial statements.
9. Source: Morningstar. The S&P 500 is a market capitalization-weighted index of 500 stocks designed to measure total U.S. equity market performance. The Barclays U.S.
Aggregate Index is a market capitalization-weighted index representing the U.S. investment-grade, fixed-rate, taxable bond market with index components for government
and corporate, mortgage pass-through and asset-backed securities. All issues included are SEC registered, taxable, dollar denominated and nonconvertible, must have at
least one year to final maturity and must be rated investment grade (Baa3/BBB-/BBB- or higher) using the middle rating of Moody’s, S&P and Fitch, respectively.
See www.franklintempletondatasources.com for additional data provider information.
franklintempleton.com Annual Report | 11
FRANKLIN BALANCED FUND
Your Fund’s Expenses
As a Fund shareholder, you can incur two types of costs:
- Transaction costs, including sales charges (loads) on Fund purchases; and
- Ongoing Fund costs, including management fees, distribu- tion and service (12b-1) fees, and other Fund expenses. All mutual funds have ongoing costs, sometimes referred to as operating expenses.
The following table shows ongoing costs of investing in the Fund and can help you understand these costs and compare them with those of other mutual funds. The table assumes a $1,000 investment held for the six months indicated.
Actual Fund Expenses
The first line (Actual) for each share class listed in the table provides actual account values and expenses. The “Ending Account Value” is derived from the Fund’s actual return, which includes the effect of Fund expenses.
You can estimate the expenses you paid during the period by following these steps. Of course, your account value and expenses will differ from those in this illustration:
| 1. | Divide your account value by $1,000. |
| If an account had an $8,600 value, then $8,600 ÷ $1,000 = 8.6. | |
| 2. | Multiply the result by the number under the heading “Expenses Paid During Period.” |
| If Expenses Paid During Period were $7.50, then 8.6 x $7.50 = $64.50. |
In this illustration, the estimated expenses paid this period are $64.50.
Hypothetical Example for Comparison with Other Funds
Information in the second line (Hypothetical) for each class in the table can help you compare ongoing costs of investing in the Fund with those of other mutual funds. This information may not be used to estimate the actual ending account balance or expenses you paid during the period. The hypothetical “Ending Account Value” is based on the actual expense ratio for each class and an assumed 5% annual rate of return before expenses, which does not represent the Fund’s actual return. The figure under the heading “Expenses Paid During Period” shows the hypothetical expenses your account would have incurred under this scenario. You can compare this figure with the 5% hypothetical examples that appear in shareholder reports of other funds.
Please note that expenses shown in the table are meant to highlight ongoing costs and do not reflect any transaction costs, such as sales charges. Therefore, the second line for each class is useful in comparing ongoing costs only, and will not help you compare total costs of owning different funds. In addition, if transaction costs were included, your total costs would have been higher. Please refer to the Fund prospectus for additional information on operating expenses.
12 | Annual Report
franklintempleton.com
FRANKLIN BALANCED FUND
YOUR FUND’S EXPENSES
| Beginning Account | Ending Account | Expenses Paid During | ||||
| Share Class | Value 5/1/14 | Value 10/31/14 | Period* 5/1/14–10/31/14 | |||
| A | ||||||
| Actual | $ | 1,000 | $ | 1,024.80 | $ | 5.56 |
| Hypothetical (5% return before expenses) | $ | 1,000 | $ | 1,019.71 | $ | 5.55 |
| C | ||||||
| Actual | $ | 1,000 | $ | 1,021.40 | $ | 9.12 |
| Hypothetical (5% return before expenses) | $ | 1,000 | $ | 1,016.18 | $ | 9.10 |
| R | ||||||
| Actual | $ | 1,000 | $ | 1,023.70 | $ | 6.58 |
| Hypothetical (5% return before expenses) | $ | 1,000 | $ | 1,018.70 | $ | 6.56 |
| R6 | ||||||
| Actual | $ | 1,000 | $ | 1,028.60 | $ | 3.48 |
| Hypothetical (5% return before expenses) | $ | 1,000 | $ | 1,021.78 | $ | 3.47 |
| Advisor | ||||||
| Actual | $ | 1,000 | $ | 1,026.30 | $ | 4.03 |
| Hypothetical (5% return before expenses) | $ | 1,000 | $ | 1,021.22 | $ | 4.02 |
*Expenses are calculated using the most recent six-month expense ratio, net of expense waivers, annualized for each class (A: 1.09%;
C: 1.79%; R: 1.29%; R6: 0.68%; and Advisor: 0.79%), multiplied by the average account value over the period, multiplied by 184/365 to
reflect the one-half year period.
franklintempleton.com Annual Report | 13
Franklin Convertible Securities Fund
This annual report for Franklin Convertible Securities Fund covers the fiscal year ended October 31, 2014.
Your Fund’s Goal and Main Investments
The Fund seeks to maximize total return, consistent with reasonable risk, by seeking to optimize capital appreciation and high current income under varying market conditions and investing at least 80% of its net assets in convertible securities.

Performance Overview
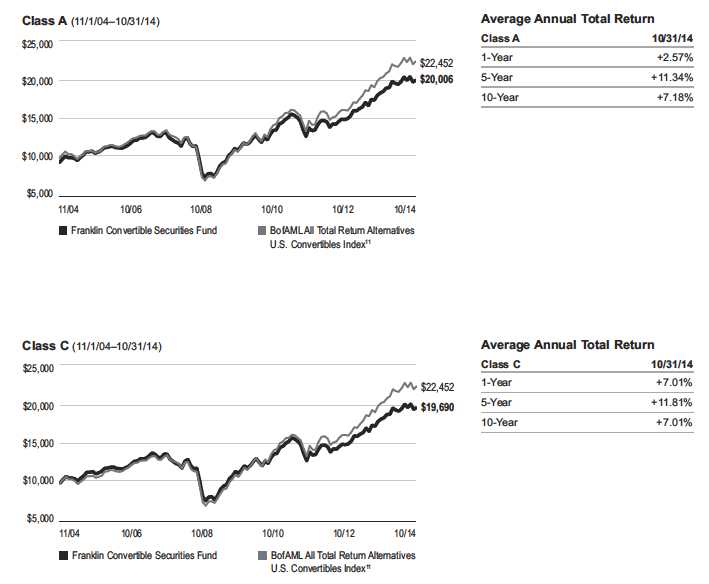
For the 12 months under review, the Fund’s Class A shares delivered a cumulative total return of +8.85%. In comparison, the Fund’s benchmark, the BofA Merrill Lynch (BofAML) All Total Return Alternatives U.S. Convertibles Index, which tracks the domestic convertible securities market, posted a +10.65% total return.1 You can find the Fund’s long-term performance data in the Performance Summary beginning on page 16.
Performance data represent past performance, which does not guarantee future results. Investment return and principal value will fluctuate, and you may have a gain or loss when you sell your shares. Current performance may differ from figures shown. Please visit franklintempleton.com or call (800) 342-5236 for most recent month-end performance.
Investment Strategy
We follow a strategy of maintaining a balance in the portfolio between the equity and debt characteristics of convertible securities with an emphasis on the equity features. Convertible securities are attractive for two reasons: the opportunity to participate in common stocks’ potential growth with relatively reduced volatility, and the potential for current income with potential downside protection from bonds. Typically we sell securities whose equity sensitivity becomes too high and no longer offers appropriate downside protection. Likewise, as securities become too bond-like — reducing their ability to appreciate with increases in the underlying common stock —we attempt to redeploy those assets into more balanced convertible securities and maintain the potential for the Fund’s upside participation. Our experienced team of analysts searches for investment opportunities among all economic sectors and considers a company’s long-term earnings, asset value and cash flow potential, to create a broadly diversified portfolio.
| Top 10 Holdings | ||
| 10/31/14 | ||
| Company | % of Total | |
| Sector/Industry | Net Assets | |
| Micron Technology Inc. | 2.8 | % |
| Information Technology | ||
| Novellus Systems Inc. | 2.4 | % |
| Information Technology | ||
| BioMarin Pharmaceutical Inc. | 2.3 | % |
| Health Care | ||
| Electronic Arts Inc. | 2.2 | % |
| Information Technology | ||
| Trulia Inc. | 2.2 | % |
| Information Technology | ||
| Forest City Enterprises Inc. | 2.1 | % |
| Financials | ||
| Jarden Corp. | 2.0 | % |
| Consumer Discretionary | ||
| Omnicare Inc. | 2.0 | % |
| Health Care | ||
| Salesforce.com Inc. | 2.0 | % |
| Information Technology | ||
| NetSuite Inc. | 1.9 | % |
| Information Technology | ||
1. Source: BofA Merrill Lynch, used with permission. BOFA MERRILL LYNCH IS LICENSING THE MERRILL LYNCH INDICES “AS IS,” MAKES NO WARRANTIES
REGARDING SAME, DOES NOT GUARANTEE THE QUALITY, ACCURACY AND/OR COMPLETENESS OF THE MERRILL LYNCH INDICES OR ANY DATA INCLUDED
THEREIN OR DERIVED THEREFROM, AND ASSUMES NO LIABILITY IN CONNNECTION WITH THEIR USE.
The index is unmanaged and includes reinvestment of any income and distributions. One cannot invest directly in an index, and an index is not representative of the
Fund’s portfolio.
See www.franklintempletondatasources.com for additional data provider information.
The dollar value, number of shares or principal amount, and names of all portfolio holdings are listed in the Fund’s Statement of Investments (SOI).
The SOI begins on page 58.
14 | Annual Report franklintempleton.com
FRANKLIN CONVERTIBLE SECURITIES FUND
Manager’s Discussion
Most sectors the Fund invested in rose in value, as did the majority of the portfolio’s individual securities, supporting overall performance during the Fund’s fiscal year. Investments in the information technology, health care, industrials and utilities sectors accounted for the bulk of the Fund’s total return. Within information technology, the Fund’s holdings of convertible bonds issued by semiconductor and semiconductor equipment companies, such as Micron Technology and Lam Research (Novellus Systems in the SOI), enjoyed some of the largest gains. Pharmaceuticals firms Salix Pharmaceuticals, Mylan and Pacira Pharmaceuticals, as well as Omnicare, which provides pharmacy services to elder care facilities, were key contributors in the health care sector. In the utilities sector, electricity supplier NextEra Energy convertible preferred stock was a standout performer.
Despite the Fund’s positive results this reporting period, there were a few disappointments in the portfolio. By sector, energy, materials and consumer staples detracted from performance. On an individual security basis, key detractors included Cobalt International Energy convertible notes, Sanchez Energy convertible preferred stock, and new investments in McDermott International and Rex Energy. In materials, Cliffs Natural Resources convertible preferred shares declined in value. A new investment in packaged food purveyor Post Holdings convertible preferred shares also hurt Fund performance.
Thank you for your continued participation in Franklin Convertible Securities Fund. We look forward to serving your future investment needs.

The foregoing information reflects our analysis, opinions and portfolio holdings as of October 31, 2014, the end of the reporting period. The way we implement our main investment strategies and the resulting portfolio holdings may change depending on factors such as market and economic conditions. These opinions may not be relied upon as investment advice or an offer for a particular security. The information is not a complete analysis of every aspect of any market, country, industry, security or the Fund. Statements of fact are from sources considered reliable, but the investment manager makes no representation or warranty as to their completeness or accuracy. Although historical performance is no guarantee of future results, these insights may help you understand our investment management philosophy.
franklintempleton.com Annual Report | 15
FRANKLIN CONVERTIBLE SECURITIES FUND
Performance Summary as of October 31, 2014
Your dividend income will vary depending on dividends or interest paid by securities in the Fund’s portfolio, adjusted for operating expenses of each class. Capital gain distributions are net profits realized from the sale of portfolio securities. The performance tables and graphs do not reflect any taxes that a shareholder would pay on Fund dividends, capital gain distributions, if any, or any realized gains on the sale of Fund shares. Total return reflects reinvestment of the Fund’s dividends and capital gain distributions, if any, and any unrealized gains or losses.
| Net Asset Value | ||||||
| Share Class (Symbol) | 10/31/14 | 10/31/13 | Change | |||
| A (FISCX) | $ | 18.97 | $ | 17.82 | +$ | 1.15 |
| C (FROTX) | $ | 18.73 | $ | 17.60 | +$ | 1.13 |
| Advisor (FCSZX) | $ | 18.98 | $ | 17.83 | +$ | 1.15 |
| 10/31/14 | 3/4/14 | |||||
| R6 (N/A) | $ | 18.99 | $ | 19.21 | -$ | 0.22 |
| Distributions | ||||||
| Dividend | Long-Term | |||||
| Share Class | Income | Capital Gain | Total | |||
| A(11/1/13-10/31/14) | $ | 0.3347 | $ | 0.0745 | $ | 0.4092 |
| C(11/1/13-10/31/14) | $ | 0.2029 | $ | 0.0745 | $ | 0.2774 |
| R6(3/4/14 -10/31/14) | $ | 0.2401 | — | $ | 0.2401 | |
| Advisor (11/1/13-10/31/14) | $ | 0.3838 | $ | 0.0745 | $ | 0.4583 |
16 | Annual Report franklintempleton.com
FRANKLIN CONVERTIBLE SECURITIES FUND
PERFORMANCE SUMMARY
Performance as of 10/31/141
Cumulative total return excludes sales charges. Average annual total returns and value of $10,000 investment include maximum sales charges. Class A: 5.75% maximum initial sales charge; Class C: 1% contingent deferred sales charge in first year only;
Class R6/Advisor Class: no sales charges.
| Cumulative | Average Annual | Value of | Average Annual | Total Annual Operating | |||||||||
| Share Class | Total Return2 | Total Return3 | $ | 10,000 Investment4 | Total Return (9/30/14)5 | Operating Expenses6 | |||||||
| A | 0.88 | % | |||||||||||
| 1-Year | + | 8.85 | % | + | 2.57 | % | $ | 10,257 | + | 3.24 | % | ||
| 5-Year | + | 81.57 | % | + | 11.34 | % | $ | 17,112 | + | 10.64 | % | ||
| 10-Year | + | 112.20 | % | + | 7.18 | % | $ | 20,006 | + | 7.01 | % | ||
| C | 1.63 | % | |||||||||||
| 1-Year | + | 8.01 | % | + | 7.01 | % | $ | 10,701 | + | 7.70 | % | ||
| 5-Year | + | 74.78 | % | + | 11.81 | % | $ | 17,478 | + | 11.13 | % | ||
| 10-Year | + | 96.90 | % | + | 7.01 | % | $ | 19,690 | + | 6.84 | % | ||
| R67 | 0.52 | % | |||||||||||
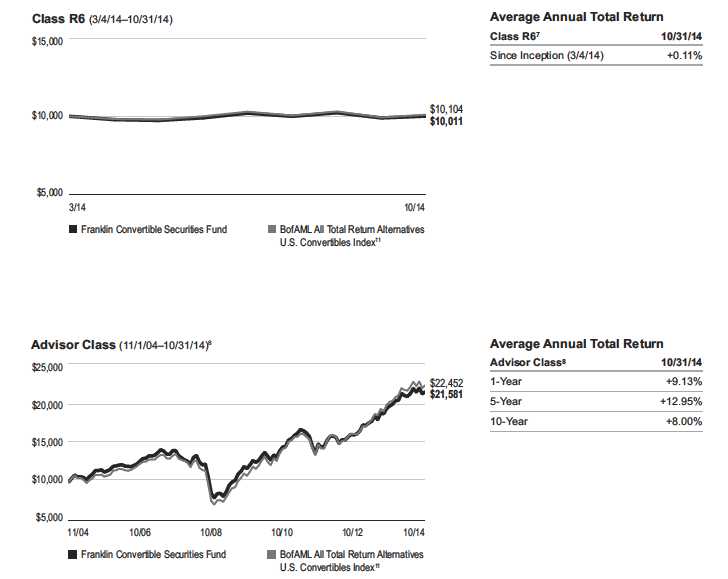
| Since Inception (3/4/14) | + | 0.11 | % | + | 0.11 | % | $ | 10,011 | -1.05 | % | |||
| Advisor8 | 0.63 | % | |||||||||||
| 1-Year | + | 9.13 | % | + | 9.13 | % | $ | 10,913 | + | 9.83 | % | ||
| 5-Year | + | 83.80 | % | + | 12.95 | % | $ | 18,380 | + | 12.24 | % | ||
| 10-Year | + | 115.81 | % | + | 8.00 | % | $ | 21,581 | + | 7.83 | % |
| Distribution | 30-Day Standardized Yield10 | |||||
| Share Class | Rate9 | (with waiver) | (without waiver) | |||
| A | 1.66 | % | 0.76 | % | 0.75 | % |
| C | 1.08 | % | 0.07 | % | 0.07 | % |
| R6 | 2.08 | % | 1.17 | % | 1.17 | % |
| Advisor | 2.02 | % | 1.05 | % | 1.05 | % |
Performance data represent past performance, which does not guarantee future results. Investment return and principal value will fluctuate, and you may have a gain or loss when you sell your shares. Current performance may differ from figures shown. For most recent month-end performance, go to franklintempleton.com or call (800) 342-5236.
franklintempleton.com Annual Report | 17
FRANKLIN CONVERTIBLE SECURITIES FUND
PERFORMANCE SUMMARY
Total Return Index Comparison for a Hypothetical $10,000 Investment1
Total return represents the change in value of an investment over the periods shown. It includes any applicable maximum sales charge, Fund expenses, account fees and reinvested distributions. The unmanaged index includes reinvestment of any income or distributions. It differs from the Fund in composition and does not pay management fees or expenses. One cannot invest directly in an index.
18 | Annual Report franklintempleton.com
FRANKLIN CONVERTIBLE SECURITIES FUND
PERFORMANCE SUMMARY
Total Return Index Comparison for a Hypothetical $10,000 Investment1 (continued)
franklintempleton.com Annual Report | 19
FRANKLIN CONVERTIBLE SECURITIES FUND
PERFORMANCE SUMMARY
All investments involve risks, including possible loss of principal. The Fund may invest in high yielding, fixed income securities. High yields reflect the higher credit risk associated with these lower rated securities and, in some cases, the lower market prices for these instruments. Interest rate movements may affect the Fund’s share price and yield. Bond prices generally move in the opposite direction of interest rates. As prices of bonds in the Fund adjust to a rise in interest rates, the Fund’s share price may decline. The Fund may also invest in foreign securities, which involve special risks, including political uncertainty and currency volatility. The Fund is actively managed but there is no guarantee that the manager’s investment decisions will produce the desired results. The Fund’s prospectus also includes a description of the main investment risks.
| Class C: | These shares have higher annual fees and expenses than Class A shares. |
| Class R6: | Shares are available to certain eligible investors as described in the prospectus. |
| Advisor Class: | Shares are available to certain eligible investors as described in the prospectus. |
1. The Fund has a fee waiver associated with its investments in a Franklin Templeton money fund, contractually guaranteed through at least its current fiscal year-end.
Fund investment results reflect the fee waiver, to the extent applicable; without this reduction, the results would have been lower.
2. Cumulative total return represents the change in value of an investment over the periods indicated.
3. Average annual total return represents the average annual change in value of an investment over the periods indicated.
4. These figures represent the value of a hypothetical $10,000 investment in the Fund over the periods indicated.
5. In accordance with SEC rules, we provide standardized average annual total return information through the latest calendar quarter.
6. Figures are as stated in the Fund’s current prospectus. In periods of market volatility, assets may decline significantly, causing total annual Fund operating expenses to
become higher than the figures shown.
7. Performance shown is not annualized.
8. Effective 5/15/08, the Fund began offering Advisor Class shares, which do not have sales charges or a Rule 12b-1 plan. Performance quotations for this class reflect the
following methods of calculation: (a) For periods prior to 5/15/08, a restated figure is used based upon the Fund’s Class A performance, excluding the effect of Class A’s
maximum initial sales charge, but reflecting the effect of the Class A Rule 12b-1 fees; and (b) for periods after 5/15/08 actual Advisor Class performance is used reflecting
all charges and fees applicable to that class. Since 5/15/08 (commencement of sales), the cumulative and average annual total returns of Advisor Class shares were
+59.76% and +7.52%.
9. Distribution rate is based on the sum of the respective class’s last four quarterly dividends (for Class R6: based on Advisor Class’s first fiscal quarter dividend and
Class R6’s three quarterly dividends) and the maximum offering price (NAV for Classes C, R6 and Advisor) per share on 10/31/14.
10. The 30-day standardized yield for the 30 days ended 10/31/14 reflects an estimated yield to maturity (assuming all portfolio securities are held to maturity). It should be
regarded as an estimate of the Fund’s rate of investment income, and it may not equal the Fund’s actual income distribution rate (which reflects the Fund’s past dividends
paid to shareholders) or the income reported in the Fund’s financial statements.
11. Source: BofA Merrill Lynch, used with permission. BOFA MERRILL LYNCH IS LICENSING THE MERRILL LYNCH INDICES “AS IS,” MAKES NO WARRANTIES
REGARDING SAME, DOES NOT GUARANTEE THE QUALITY, ACCURACY AND/OR COMPLETENESS OF THE MERRILL LYNCH INDICES OR ANY DATA INCLUDED
THERIN OR DERIVED THEREFROM, AND ASSUMES NO LIABILITY IN CONNECTION WITH THEIR USE. The BofAML All Total Return Alternatives U.S. Convertibles
Index comprises domestic securities of all quality grades that are convertible into U.S. dollar-denominated common stock, ADRs or cash equivalents and have a delta
(measure of equity sensitivity) that indicates the security likely has a balance between the debt and equity characteristics of the security.
See www.franklintempletondatasources.com for additional data provider information.
20 | Annual Report franklintempleton.com
FRANKLIN CONVERTIBLE SECURITIES FUND
Your Fund’s Expenses
As a Fund shareholder, you can incur two types of costs:
- Transaction costs, including sales charges (loads) on Fund purchases; and
- Ongoing Fund costs, including management fees, distribu- tion and service (12b-1) fees, and other Fund expenses. All mutual funds have ongoing costs, sometimes referred to as operating expenses.
The following table shows ongoing costs of investing in the Fund and can help you understand these costs and compare them with those of other mutual funds. The table assumes a $1,000 investment held for the six months indicated.
Actual Fund Expenses
The first line (Actual) for each share class listed in the table provides actual account values and expenses. The “Ending Account Value” is derived from the Fund’s actual return, which includes the effect of Fund expenses.
You can estimate the expenses you paid during the period by following these steps. Of course, your account value and expenses will differ from those in this illustration:
| 1. | Divide your account value by $1,000. |
| If an account had an $8,600 value, then $8,600 ÷ $1,000 = 8.6. | |
| 2. | Multiply the result by the number under the heading “Expenses Paid During Period.” |
| If Expenses Paid During Period were $7.50, then 8.6 x $7.50 = $64.50. |
In this illustration, the estimated expenses paid this period are $64.50.
Hypothetical Example for Comparison with Other Funds
Information in the second line (Hypothetical) for each class in the table can help you compare ongoing costs of investing in the Fund with those of other mutual funds. This information may not be used to estimate the actual ending account balance or expenses you paid during the period. The hypothetical “Ending Account Value” is based on the actual expense ratio for each class and an assumed 5% annual rate of return before expenses, which does not represent the Fund’s actual return. The figure under the heading “Expenses Paid During Period” shows the hypothetical expenses your account would have incurred under this scenario. You can compare this figure with the 5% hypothetical examples that appear in shareholder reports of other funds.
Please note that expenses shown in the table are meant to highlight ongoing costs and do not reflect any transaction costs, such as sales charges. Therefore, the second line for each class is useful in comparing ongoing costs only, and will not help you compare total costs of owning different funds. In addition, if transaction costs were included, your total costs would have been higher. Please refer to the Fund prospectus for additional information on operating expenses.
franklintempleton.com Annual Report | 21
| FRANKLIN CONVERTIBLE SECURITIES FUND | ||||||
| YOUR FUND’S EXPENSES | ||||||
| Beginning Account | Ending Account | Expenses Paid During | ||||
| Share Class | Value 5/1/14 | Value 10/31/14 | Period* 5/1/14–10/31/14 | |||
| A | ||||||
| Actual | $ | 1,000 | $ | 1,026.60 | $ | 4.50 |
| Hypothetical (5% return before expenses) | $ | 1,000 | $ | 1,020.77 | $ | 4.48 |
| C | ||||||
| Actual | $ | 1,000 | $ | 1,022.60 | $ | 8.31 |
| Hypothetical (5% return before expenses) | $ | 1,000 | $ | 1,016.99 | $ | 8.29 |
| R6 | ||||||
| Actual | $ | 1,000 | $ | 1,028.40 | $ | 2.56 |
| Hypothetical (5% return before expenses) | $ | 1,000 | $ | 1,022.68 | $ | 2.55 |
| Advisor | ||||||
| Actual | $ | 1,000 | $ | 1,027.90 | $ | 3.22 |
| Hypothetical (5% return before expenses) | $ | 1,000 | $ | 1,022.03 | $ | 3.21 |
*Expenses are calculated using the most recent six-month expense ratio, net of expense waivers, annualized for each class (A: 0.88%;
C: 1.63%; R6: 0.50%; and Advisor: 0.63%), multiplied by the average account value over the period, multiplied by 184/365 to reflect the
one-half year period.
22 | Annual Report franklintempleton.com
Franklin Equity Income Fund
This annual report for Franklin Equity Income Fund covers the fiscal year ended October 31, 2014.
Your Fund’s Goal and Main Investments
The Fund seeks to maximize total return, emphasizing high current income and long-term capital appreciation, consistent with reasonable risk, by investing at least 80% of its net assets in equity securities including securities convertible into common stocks.
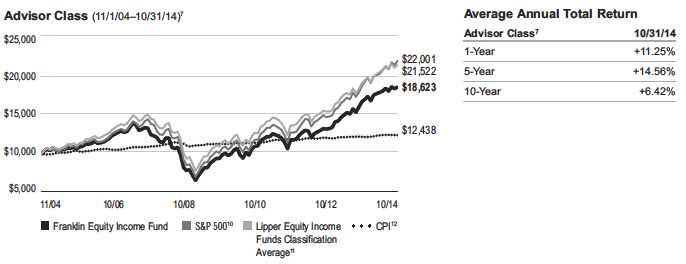
Performance Overview
For the 12 months under review, the Fund’s Class A shares delivered a +10.99% cumulative total return. In comparison, the Fund’s benchmark, the Standard & Poor’s 500 Index (S&P 500), which tracks the broad U.S. stock market, generated a +17.27% total return.1 The Fund’s peers, as measured by the Lipper Equity Income Funds Classification Average, which consists of funds chosen by Lipper that seek relatively high current income and growth of income by investing at least 60% of their portfolios in stocks, posted a +12.58% total return.2 You can find the Fund’s long-term performance data in the Performance Summary beginning on page 26.
Performance data represent past performance, which does not guarantee future results. Investment return and principal value will fluctuate, and you may have a gain or loss when you sell your shares. Current performance may differ from figures shown. Please visit franklintempleton.com or call (800) 342-5236 for most recent month-end performance.
Investment Strategy
We seek to invest in a broadly diversified portfolio of equity securities that we consider to be financially strong, with a focus on “blue chip” companies. We apply a bottom-up approach to investing in individual securities. We will assess the market price of a company’s securities relative to our evaluation of the company’s long-term earnings, asset value and cash flow potential. We also consider a company’s price/earnings ratio,
profit margins, balance sheet and liquidation value. We consider dividend yield in selecting stocks for the Fund because we believe that, over time, dividend income can contribute significantly to total return and can be a more consistent source of investment return than capital appreciation. We seek to take advantage of price dislocations that result from the market’s short-term focus and choose to invest in those companies that, in our opinion, offer the best trade-off between growth opportunity, business and financial risk, and valuation.
1. Source: Morningstar.
2. Source: Lipper, a Thomson Reuters Company. For the one-year period ended 10/31/14, this category consisted of 473 funds. Lipper calculations do not include sales
charges, or expense subsidization by a fund’s manager. The Fund’s performance relative to the average may have differed if these and other factors had been considered.
The indexes are unmanaged and include reinvested dividends. One cannot invest directly in an index, and an index is not representative of the Fund’s portfolio.
See www.franklintempletondatasources.com for additional data provider information.
The dollar value, number of shares or principal amount, and names of all portfolio holdings are listed in the Fund’s Statement of Investments (SOI).
The SOI begins on page 67.
franklintempleton.com Annual Report | 23
FRANKLIN EQUITY INCOME FUND
| Dividend Distributions* | |||||
| 11/1/13–10/31/14 | |||||
| Dividend per Share (cents) | |||||
| Advisor | |||||
| Month | Class A | Class C | Class R | Class R6 | Class |
| November | 3.70 | 2.40 | 3.26 | 4.41 | 4.14 |
| December** | 8.77 | 7.36 | 8.28 | 9.47 | 9.25 |
| January | 3.70 | 2.29 | 3.21 | 4.40 | 4.18 |
| February | 3.70 | 2.29 | 3.21 | 4.40 | 4.18 |
| March | 3.70 | 2.29 | 3.23 | 4.34 | 4.17 |
| April | 3.70 | 2.29 | 3.23 | 4.34 | 4.17 |
| May | 3.70 | 2.29 | 3.23 | 4.34 | 4.17 |
| June | 3.90 | 2.44 | 3.42 | 4.60 | 4.39 |
| July | 3.90 | 2.44 | 3.42 | 4.60 | 4.39 |
| August | 3.90 | 2.44 | 3.42 | 4.60 | 4.39 |
| September | 3.90 | 2.42 | 3.41 | 4.64 | 4.40 |
| October | 3.90 | 2.42 | 3.41 | 4.64 | 4.40 |
| Total | 50.47 | 33.37 | 44.73 | 58.78 | 56.23 |
*All Fund distributions will vary depending upon current market conditions, and past
distributions are not indicative of future trends.
**Includes an additional 5.07 cent per share distribution to meet excise tax
requirements.
Manager’s Discussion
Every sector the Fund invested in rose in value, as did most of the portfolio’s individual securities, supporting overall performance during the Fund’s fiscal year. Key contributing sectors included industrials, information technology (IT), financials and consumer discretionary. Within the industrials sector, the Fund’s positions in aerospace and defense firm Lockheed Martin, waste-management company Republic Services and industrial engines manufacturer Cummins (sold by period-end) were strong performers. Among IT holdings, top contributors included software leader Microsoft and semiconductor maker Intel. Wells Fargo & Co., JPMorgan Chase & Co. and investment manager BlackRock were leading contributors in the financials sector. Specialty retailer L Brands and athletic equipment and apparel maker NIKE led performance in the consumer discretionary sector. Other standout performers included pharmaceuticals firm Eli Lilly & Co., natural gas and electricity utility PG&E, and Dow Chemical.
Despite the Fund’s positive results this reporting period, there were a few disappointments in the portfolio. Key detractors included automakers Ford Motor and General Motors, French pharmaceuticals company Sanofi, and mining firms Freeport-McMoRan and BHP Billiton (Australia). Heavy equipment manufacturer Caterpillar, insurer Aflac and software firm CA also detracted from performance.
| Top 10 Holdings | ||
| 10/31/14 | ||
| Company | % of Total | |
| Sector/Industry | Net Assets | |
| Lockheed Martin Corp. | 2.4 | % |
| Industrials | ||
| Microsoft Corp. | 2.4 | % |
| Information Technology | ||
| Republic Services Inc. | 2.3 | % |
| Industrials | ||
| Intel Corp. | 2.2 | % |
| Information Technology | ||
| L Brands Inc. | 2.2 | % |
| Consumer Discretionary | ||
| BlackRock Inc. | 2.2 | % |
| Financials | ||
| PepsiCo Inc. | 2.1 | % |
| Consumer Staples | ||
| NIKE Inc., B | 2.1 | % |
| Consumer Discretionary | ||
| JPMorgan Chase & Co. | 2.0 | % |
| Financials | ||
| Roche Holding AG | 2.0 | % |
| Health Care | ||
24 | Annual Report franklintempleton.com
FRANKLIN EQUITY INCOME FUND
Thank you for your continued participation in Franklin Equity Income Fund. We look forward to serving your future investment needs.

The foregoing information reflects our analysis, opinions and portfolio holdings as of October 31, 2014, the end of the reporting period. The way we implement our main investment strategies and the resulting portfolio holdings may change depending on factors such as market and economic conditions. These opinions may not be relied upon as investment advice or an offer for a particular security. The information is not a complete analysis of every aspect of any market, country, industry, security or the Fund. Statements of fact are from sources considered reliable, but the investment manager makes no representation or warranty as to their completeness or accuracy. Although historical performance is no guarantee of future results, these insights may help you understand our investment management philosophy.
franklintempleton.com Annual Report | 25
FRANKLIN EQUITY INCOME FUND
Performance Summary as of October 31, 2014
Your dividend income will vary depending on dividends or interest paid by securities in the Fund’s portfolio, adjusted for operating expenses of each class. Capital gain distributions are net profits realized from the sale of portfolio securities. The performance tables and graphs do not reflect any taxes that a shareholder would pay on Fund dividends, capital gain distributions, if any, or any realized gains on the sale of Fund shares. Total return reflects reinvestment of the Fund’s dividends and capital gain distributions, if any, and any unrealized gains or losses.
| Net Asset Value | ||||||
| Share Class (Symbol) | 10/31/14 | 10/31/13 | Change | |||
| A (FISEX) | $ | 23.93 | $ | 22.16 | +$ | 1.77 |
| C (FRETX) | $ | 23.79 | $ | 22.04 | +$ | 1.75 |
| R (FREIX) | $ | 23.93 | $ | 22.17 | +$ | 1.76 |
| R6 (N/A) | $ | 23.95 | $ | 22.18 | +$ | 1.77 |
| Advisor (FEIFX) | $ | 23.96 | $ | 22.19 | +$ | 1.77 |
| Distributions (11/1/13–10/31/14) | ||||||
| Dividend | Long-Term | |||||
| Share Class | Income | Capital Gain | Total | |||
| A | $ | 0.5047 | $ | 0.1212 | $ | 0.6259 |
| C | $ | 0.3337 | $ | 0.1212 | $ | 0.4549 |
| R | $ | 0.4473 | $ | 0.1212 | $ | 0.5685 |
| R6 | $ | 0.5878 | $ | 0.1212 | $ | 0.7090 |
| Advisor | $ | 0.5623 | $ | 0.1212 | $ | 0.6835 |
26 | Annual Report
franklintempleton.com
FRANKLIN EQUITY INCOME FUND
PERFORMANCE SUMMARY
Performance as of 10/31/141
Cumulative total return excludes sales charges. Average annual total returns and value of $10,000 investment include maximum
sales charges. Class A: 5.75% maximum initial sales charge; Class C: 1% contingent deferred sales charge in first year only;
Class R/R6/Advisor: no sales charges.
| Cumulative | Average Annual | Value of | Average Annual | Total Annual Operating | |||||||||
| Share Class | Total Return2 | Total Return3 | $ | 10,000 Investment4 | Total Return (9/30/14)5 | Operating Expenses6 | |||||||
| A | 0.91 | % | |||||||||||
| 1-Year | + | 10.99 | % | + | 4.62 | % | $ | 10,462 | + | 7.78 | % | ||
| 5-Year | + | 94.83 | % | + | 12.92 | % | $ | 18,360 | + | 12.59 | % | ||
| 10-Year | + | 83.09 | % | + | 5.61 | % | $ | 17,260 | + | 5.52 | % | ||
| C | 1.66 | % | |||||||||||
| 1-Year | + | 10.14 | % | + | 9.14 | % | $ | 10,914 | + | 12.49 | % | ||
| 5-Year | + | 87.53 | % | + | 13.40 | % | $ | 18,753 | + | 13.09 | % | ||
| 10-Year | + | 69.92 | % | + | 5.44 | % | $ | 16,992 | + | 5.35 | % | ||
| R | 1.16 | % | |||||||||||
| 1-Year | + | 10.67 | % | + | 10.67 | % | $ | 11,067 | + | 14.12 | % | ||
| 5-Year | + | 92.23 | % | + | 13.96 | % | $ | 19,223 | + | 13.65 | % | ||
| 10-Year | + | 78.35 | % | + | 5.96 | % | $ | 17,835 | + | 5.87 | % | ||
| R6 | 0.49 | % | |||||||||||
| 1-Year | + | 11.38 | % | + | 11.38 | % | $ | 11,138 | + | 14.80 | % | ||
| Since Inception (5/1/13) | + | 25.08 | % | + | 16.07 | % | $ | 12,508 | + | 16.22 | % | ||
| Advisor7 | 0.66 | % | |||||||||||
| 1-Year | + | 11.25 | % | + | 11.25 | % | $ | 11,125 | + | 14.67 | % | ||
| 5-Year | + | 97.33 | % | + | 14.56 | % | $ | 19,733 | + | 14.23 | % | ||
| 10-Year | + | 86.23 | % | + | 6.42 | % | $ | 18,623 | + | 6.32 | % |
| Distribution | 30-Day Standardized Yield9 | |||||
| Share Class | Rate8 | (with waiver) | (without waiver) | |||
| A | 1.84 | % | 2.05 | % | 2.05 | % |
| C | 1.22 | % | 1.45 | % | 1.45 | % |
| R | 1.71 | % | 1.93 | % | 1.93 | % |
| R6 | 2.32 | % | 2.52 | % | 2.52 | % |
| Advisor | 2.20 | % | 2.41 | % | 2.41 | % |
Performance data represent past performance, which does not guarantee future results. Investment return and principal value will fluctuate, and you may have a gain or loss when you sell your shares. Current performance may differ from figures shown. For most recent month-end performance, go to franklintempleton.com or call (800) 342-5236.
franklintempleton.com Annual Report | 27
FRANKLIN EQUITY INCOME FUND
PERFORMANCE SUMMARY
Total Return Index Comparison for a Hypothetical $10,000 Investment1
Total return represents the change in value of an investment over the periods shown. It includes any applicable maximum sales charge, Fund expenses, account fees and reinvested distributions. The unmanaged indexes include reinvestment of any income or distributions. They differ from the Fund in composition and do not pay management fees or expenses. One cannot invest directly in an index.

28 | Annual Report franklintempleton.com
FRANKLIN EQUITY INCOME FUND
PERFORMANCE SUMMARY
Total Return Index Comparison for a Hypothetical $10,000 Investment1 (continued)

franklintempleton.com Annual Report | 29
FRANKLIN EQUITY INCOME FUND
PERFORMANCE SUMMARY
Total Return Index Comparison for a Hypothetical $10,000 Investment1 (continued)
All investments involve risks, including possible loss of principal. Stock prices fluctuate, sometimes rapidly and dramatically, due to factors affecting individual companies, particular industries or sectors, or general market conditions. Convertible securities are subject to the risks of stocks when the underlying stock price is high relative to the conversion price and debt securities when the underlying stock price is low relative to the conversion price. The Fund’s investment in foreign securities also involves special risks, including currency fluctuations and economic as well as political uncertainty. The Fund is actively managed but there is no guarantee that the manager’s investment decisions will produce the desired results. The Fund’s prospectus also includes a description of the main investment risks.
| Class C: | These shares have higher annual fees and expenses than Class A shares. |
| Class R: | Shares are available to certain eligible investors as described in the prospectus. These shares have higher annual fees and expenses than Class A shares. |
| Class R6: | Shares are available to certain eligible investors as described in the prospectus. |
| Advisor Class: | Shares are available to certain eligible investors as described in the prospectus. |
1. The Fund has a fee waiver associated with its investments in a Franklin Templeton money fund, contractually guaranteed through at least its current fiscal year-end.
Fund investment results reflect the fee waiver, to the extent applicable; without this reduction, the results would have been lower.
2. Cumulative total return represents the change in value of an investment over the periods indicated.
3. Average annual total return represents the average annual change in value of an investment over the periods indicated.
4. These figures represent the value of a hypothetical $10,000 investment in the Fund over the periods indicated.
5. In accordance with SEC rules, we provide standardized average annual total return information through the latest calendar quarter.
6. Figures are as stated in the Fund’s current prospectus. In periods of market volatility, assets may decline significantly, causing total annual Fund operating expenses to
become higher than the figures shown.
7. Effective 5/15/08, the Fund began offering Advisor Class shares, which do not have sales charges or a Rule 12b-1 plan. Performance quotations for this class reflect the
following methods of calculation: (a) For periods prior to 5/15/08, a restated figure is used based upon the Fund’s Class A performance, excluding the effect of Class A’s
maximum initial sales charge, but reflecting the effect of the Class A Rule 12b-1 fees; and (b) for periods after 5/15/08, actual Advisor Class performance is used reflecting
all charges and fees applicable to that class. Since 5/15/08 (commencement of sales), the cumulative and average annual total returns of Advisor Class shares were
+49.90% and +6.46%.
8. Distribution rate is based on an annualization of the respective class’s October dividend and the maximum offering price (NAV for Classes C, R, R6, and Advisor) per
share on 10/31/14.
9. The 30-day standardized yield for the 30 days ended 10/31/14 reflects an estimated yield to maturity (assuming all portfolio securities are held to maturity). It should be
regarded as an estimate of the Fund’s rate of investment income, and it may not equal the Fund’s actual income distribution rate (which reflects the Fund’s past dividends
paid to shareholders) or the income reported in the Fund’s financial statements.
10. Source: Morningstar. The S&P 500 is a market capitalization-weighted index of 500 stocks designed to measure total U.S. equity market performance.
11. Source: Lipper, a Thomson Reuters Company. The Lipper Equity Income Funds Classification Average is an equally weighted average calculation of performance
figures for all funds within the Lipper Equity Income Funds classification in the Lipper Open-End underlying funds universe. Lipper Equity Income Funds seek relatively high
current income and growth of income through investing 60% or more of their portfolios in equities. For the one-year period ended 10/31/14, there were 473 funds in this
category. Lipper calculations do not include sales charges or expense subsidization by a fund’s manager. The Fund’s performance relative to the average may have differed
if these or other factors had been considered.
12. Source: Bureau of Labor Statistics, bls.gov/cpi. The Consumer Price Index (CPI) is a commonly used measure of the inflation rate.
See www.franklintempletondatasources.com for additional data provider information.
30 | Annual Report franklintempleton.com
FRANKLIN EQUITY INCOME FUND
Your Fund’s Expenses
As a Fund shareholder, you can incur two types of costs:
- Transaction costs, including sales charges (loads) on Fund purchases; and
- Ongoing Fund costs, including management fees, distribu- tion and service (12b-1) fees, and other Fund expenses. All mutual funds have ongoing costs, sometimes referred to as operating expenses.
The following table shows ongoing costs of investing in the Fund and can help you understand these costs and compare them with those of other mutual funds. The table assumes a $1,000 investment held for the six months indicated.
Actual Fund Expenses
The first line (Actual) for each share class listed in the table provides actual account values and expenses. The “Ending Account Value” is derived from the Fund’s actual return, which includes the effect of Fund expenses.
You can estimate the expenses you paid during the period by following these steps. Of course, your account value and expenses will differ from those in this illustration:
| 1. | Divide your account value by $1,000. |
| If an account had an $8,600 value, then $8,600 ÷ $1,000 = 8.6. | |
| 2. | Multiply the result by the number under the heading “Expenses Paid During Period.” |
| If Expenses Paid During Period were $7.50, then 8.6 x $7.50 = $64.50. |
In this illustration, the estimated expenses paid this period are $64.50.
Hypothetical Example for Comparison with Other Funds
Information in the second line (Hypothetical) for each class in the table can help you compare ongoing costs of investing in the Fund with those of other mutual funds. This information may not be used to estimate the actual ending account balance or expenses you paid during the period. The hypothetical “Ending Account Value” is based on the actual expense ratio for each class and an assumed 5% annual rate of return before expenses, which does not represent the Fund’s actual return. The figure under the heading “Expenses Paid During Period” shows the hypothetical expenses your account would have incurred under this scenario. You can compare this figure with the 5% hypothetical examples that appear in shareholder reports of other funds.
Please note that expenses shown in the table are meant to highlight ongoing costs and do not reflect any transaction costs, such as sales charges. Therefore, the second line for each class is useful in comparing ongoing costs only, and will not help you compare total costs of owning different funds. In addition, if transaction costs were included, your total costs would have been higher. Please refer to the Fund prospectus for additional information on operating expenses.
franklintempleton.com Annual Report | 31
| FRANKLIN EQUITY INCOME FUND | ||||||
| YOUR FUND’S EXPENSES | ||||||
| Beginning Account | Ending Account | Expenses Paid During | ||||
| Share Class | Value 5/1/14 | Value 10/31/14 | Period* 5/1/14–10/31/14 | |||
| A | ||||||
| Actual | $ | 1,000 | $ | 1,037.30 | $ | 4.47 |
| Hypothetical (5% return before expenses) | $ | 1,000 | $ | 1,020.82 | $ | 4.43 |
| C | ||||||
| Actual | $ | 1,000 | $ | 1,033.20 | $ | 8.30 |
| Hypothetical (5% return before expenses) | $ | 1,000 | $ | 1,017.04 | $ | 8.24 |
| R | ||||||
| Actual | $ | 1,000 | $ | 1,036.00 | $ | 5.75 |
| Hypothetical (5% return before expenses) | $ | 1,000 | $ | 1,019.56 | $ | 5.70 |
| R6 | ||||||
| Actual | $ | 1,000 | $ | 1,039.10 | $ | 2.57 |
| Hypothetical (5% return before expenses) | $ | 1,000 | $ | 1,022.68 | $ | 2.55 |
| Advisor | ||||||
| Actual | $ | 1,000 | $ | 1,038.50 | $ | 3.19 |
| Hypothetical (5% return before expenses) | $ | 1,000 | $ | 1,022.08 | $ | 3.16 |
*Expenses are calculated using the most recent six-month expense ratio, net of expense waivers, annualized for each class (A: 0.87%;
C: 1.62%; R: 1.12%; R6: 0.50%; and Advisor: 0.62%), multiplied by the average account value over the period, multiplied by 184/365 to
reflect the one-half year period.
32 | Annual Report franklintempleton.com
Franklin Real Return Fund
This annual report for Franklin Real Return Fund covers the fiscal year ended October 31, 2014.
Your Fund’s Goal and Main Investments
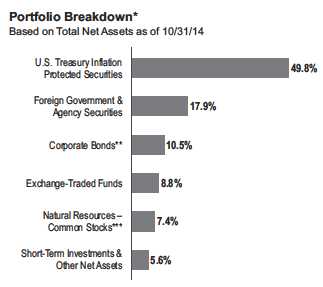
The Fund seeks to achieve total return that exceeds the rate of inflation over an economic cycle. The Fund will generally invest a substantial portion of its assets in inflation-protected securities. Managers also have the flexibility to invest in other sectors of the market to increase real return (total return less inflation) potential and offer greater diversification.
*Percentages reflect certain derivatives held in the portfolio (or their underlying
reference assets) and may not total 100% or may be negative due to rounding,
use of derivatives, unsettled trades or other factors.
**Includes Senior Floating Rate Interests.
***In the SOI, the natural resources sector comprises energy and materials.
Performance Overview
For the 12 months under review, the Fund’s Class A shares posted a +0.75% cumulative total return. In comparison, the Fund’s benchmark, the Barclays U.S. TIPS Index, which tracks the universe of inflation-protected notes issued by the U.S. Treasury that have at least one year to final maturity, produced a +1.90% total return.1 Also for comparison, the Consumer Price Index (CPI) for Urban Consumers (All Items) NSA (non-seasonally adjusted), a measure of the average change in prices of all goods and services purchased for consumption by urban householders, rose 1.66% for the same period.2 You can find more of the Fund’s performance data in the Performance Summary beginning on page 35.
Performance data represent past performance, which does not guarantee future results. Investment return and principal value will fluctuate, and you may have a gain or loss when you sell your shares. Current performance may differ from figures shown. Please visit franklintempleton.com or call (800) 342-5236 for most recent month-end performance.
Investment Strategy
We seek to allocate assets among investments to achieve the highest level of real return (total return less the rate of inflation) consistent with an acceptable level of risk. We will allocate the Fund’s assets among securities in various market sectors based on our assessment of changing economic, global market, industry and issuer conditions. When making our investment decisions, we use a “top-down” analysis of macroeconomic trends combined with a “bottom-up” fundamental analysis of market sectors, industries and issuers to try to take advantage of varying sector reactions to economic events. We will evaluate such criteria as country risk, business cycles, yield curves, and values between and within markets.
Manager’s Discussion
Although growth contracted in the first quarter of 2014, data for the second quarter of 2014 indicated the economy had rebounded more strongly and broadly than originally estimated, driven by increased personal consumption, private inventory investment, exports, residential and nonresidential fixed investment, and local government spending. Economic activity expanded in the third quarter, underpinned by increased federal defense spending and a narrower trade deficit. Housing data continued to recover, after the effects subsided from 2013’s severe winter and higher mortgage rates. Consumer price inflation remained subdued for the period.
In a sign of more confidence in the economic outlook, the Federal Reserve Board (Fed) revised its quantitative easing policy by reducing its monthly asset purchases starting in January. After further gradual reductions during the year, the Fed ended its asset purchase program in October and reaffirmed it would maintain its low interest rate policy for a “considerable time.”
1. Source: Morningstar.
The index is unmanaged and includes reinvestment of any income or distributions. One cannot invest directly in an index, and an index is not representative of the
Fund’s portfolio.
2. Source: Bureau of Labor Statistics.
See www.franklintempletondatasources.com for additional data provider information.
The dollar value, number of shares or principal amount, and names of all portfolio holdings are listed in the Fund’s Statement of Investments (SOI).
The SOI begins on page 74.
franklintempleton.com Annual Report | 33
| FRANKLIN REAL RETURN FUND | ||||
| Dividend Distributions* | ||||
| 11/1/13–10/31/14 | ||||
| Dividend per Share (cents) | ||||
| Advisor | ||||
| Month | Class A | Class C | Class R6 | Class |
| November | 0.89 | 0.56 | 1.20 | 1.10 |
| December | 7.18 | 6.83 | 7.53 | 7.40 |
| January** | — | — | — | — |
| February** | — | — | — | — |
| March | 1.47 | —** | 2.52 | 2.18 |
| April** | — | — | — | — |
| May | 3.69 | 2.95 | 4.43 | 4.20 |
| June | 3.45 | 3.10 | 3.79 | 3.67 |
| July | 3.15 | 2.76 | 3.54 | 3.40 |
| August | 1.60 | 1.26 | 1.94 | 1.83 |
| September | 2.03 | 1.66 | 2.40 | 2.27 |
| October | 0.75 | 0.39 | 1.10 | 0.98 |
| Total | 24.21 | 19.51 | 28.45 | 27.03 |
*All Fund distributions will vary depending upon current market conditions, and past
distributions are not indicative of future trends.
**The Fund paid no dividends due to negative inflation adjustments for TIPS, which
are the Fund’s primary investments.
We invested the Fund’s assets in the allowable sectors during the period under review. At period-end, just under half of total net assets were invested in Treasury Inflation Protected Securities (TIPS). For diversification, we also allocated the Fund’s assets to foreign government and agency securities, senior secured floating rate loans, exchange-traded funds (ETFs), natural resources and short-term investments. We employed a non-U.S. dollar strategy to help hedge against U.S. dollar weakness versus certain currencies and concentrated our TIPS holdings in shorter maturities.
During the period, we increased the Fund’s allocations to TIPS and ETFs. In contrast, we decreased the Fund’s allocations in foreign government debt securities, corporate bonds and natural resources.
The Fund’s real estate investment trust (REIT) holding through investment in an ETF provided a strong boost to performance. Our investments in foreign government bonds, high yield corporate bonds, senior secured floating rate loans and natural resources stocks also helped results. In contrast, the Fund’s non-U.S. dollar holdings hindered Fund performance.
Thank you for your continued participation in Franklin Real Return Fund. We look forward to serving your future investment needs.

The foregoing information reflects our analysis, opinions and portfolio holdings as of October 31, 2014, the end of the reporting period. The way we implement our main investment strategies and the resulting portfolio holdings may change depending on factors such as market and economic conditions. These opinions may not be relied upon as investment advice or an offer for a particular security. The information is not a complete analysis of every aspect of any market, country, industry, security or the Fund. Statements of fact are from sources considered reliable, but the investment manager makes no representation or warranty as to their completeness or accuracy. Although historical performance is no guarantee of future results, these insights may help you understand our investment management philosophy.
34 | Annual Report franklintempleton.com
FRANKLIN REAL RETURN FUND
Performance Summary as of October 31, 2014
Your dividend income will vary depending on dividends or interest paid by securities in the Fund’s portfolio, adjusted for operating expenses of each class. Capital gain distributions are net profits realized from the sale of portfolio securities. The performance tables and graphs do not reflect any taxes that a shareholder would pay on Fund dividends, capital gain distributions, if any, or any realized gains on the sale of Fund shares. Total return reflects reinvestment of the Fund’s dividends and capital gain distributions, if any, and any unrealized gains or losses.
| Net Asset Value | ||||||
| Share Class (Symbol) | 10/31/14 | 10/31/13 | Change | |||
| A (FRRAX) | $ | 10.66 | $ | 10.82 | -$ | 0.16 |
| C (FRRCX) | $ | 10.59 | $ | 10.76 | -$ | 0.17 |
| R6 (FRRRX) | $ | 10.68 | $ | 10.85 | -$ | 0.17 |
| Advisor (FARRX) | $ | 10.68 | $ | 10.85 | -$ | 0.17 |
| Distributions (11/1/13-10/31/14) | ||||||
| Dividend | ||||||
| Share Class | Income | |||||
| A | $ | 0.2421 | ||||
| C | $ | 0.1951 | ||||
| R6 | $ | 0.2845 | ||||
| Advisor | $ | 0.2703 | ||||
franklintempleton.com Annual Report | 35
FRANKLIN REAL RETURN FUND
PERFORMANCE SUMMARY
Performance as of 10/31/141
Cumulative total return excludes sales charges. Average annual total returns include maximum sales charges. Class A: 4.25% maximum initial sales charge; Class C: 1% contingent deferred sales charge in the first year only; Class R6/Advisor Class: no sales charges.
| Cumulative | Average Annual | Average Annual | Total Annual Operating Expenses5 | ||||||||||
| Share Class | Total Return2 | Total Return3 | Total Return (9/30/14)4 | (with waiver) | (without waiver) | ||||||||
| A | 0.92 | % | 1.10 | % | |||||||||
| 1-Year | + | 0.75 | % | -3.53 | % | -2.45 | % | ||||||
| 5-Year | + | 13.43 | % | + | 1.66 | % | + | 1.81 | % | ||||
| Since Inception (11/17/04) | + | 45.14 | % | + | 3.37 | % | + | 3.39 | % | ||||
| C | 1.32 | % | 1.50 | % | |||||||||
| 1-Year | + | 0.22 | % | -0.77 | % | + | 0.59 | % | |||||
| 5-Year | + | 11.17 | % | + | 2.14 | % | + | 2.29 | % | ||||
| Since Inception (11/03/08) | + | 24.35 | % | + | 3.70 | % | + | 3.77 | % | ||||
| R6 | 0.54 | % | 0.72 | % | |||||||||
| 1-Year | + | 1.04 | % | + | 1.04 | % | + | 2.41 | % | ||||
| Since Inception (5/1/13) | + | 0.99 | % | + | 0.66 | % | + | 0.69 | % | ||||
| Advisor | 0.67 | % | 0.85 | % | |||||||||
| 1-Year | + | 0.91 | % | + | 0.91 | % | + | 2.18 | % | ||||
| 5-Year | + | 14.85 | % | + | 2.81 | % | + | 2.94 | % | ||||
| Since Inception (11/17/04) | + | 48.77 | % | + | 4.07 | % | + | 4.10 | % | ||||
| Distribution | 30-Day Standardized Yield7 | |||||
| Share Class | Rate6 | (with waiver) | (without waiver) | |||
| A | 0.81 | % | 1.19 | % | 0.99 | % |
| C | 0.44 | % | 0.82 | % | 0.63 | % |
| R6 | 1.24 | % | 1.66 | % | 1.46 | % |
| Advisor | 1.10 | % | 1.45 | % | 1.29 | % |
Performance data represent past performance, which does not guarantee future results. Investment return and principal value will fluctuate, and you may have a gain or loss when you sell your shares. Current performance may differ from figures shown. For most recent month-end performance, go to franklintempleton.com or call (800) 342-5236.
36 | Annual Report franklintempleton.com
FRANKLIN REAL RETURN FUND
PERFORMANCE SUMMARY
Total Return Index Comparison for a Hypothetical $10,000 Investment1
Total return represents the change in value of an investment over the period shown. It includes any applicable maximum sales charge, Fund expenses, account fees and reinvested distributions. The unmanaged index includes reinvestment of any income or distributions. It differs from the Fund in composition and does not pay management fees or expenses. One cannot invest directly in an index.
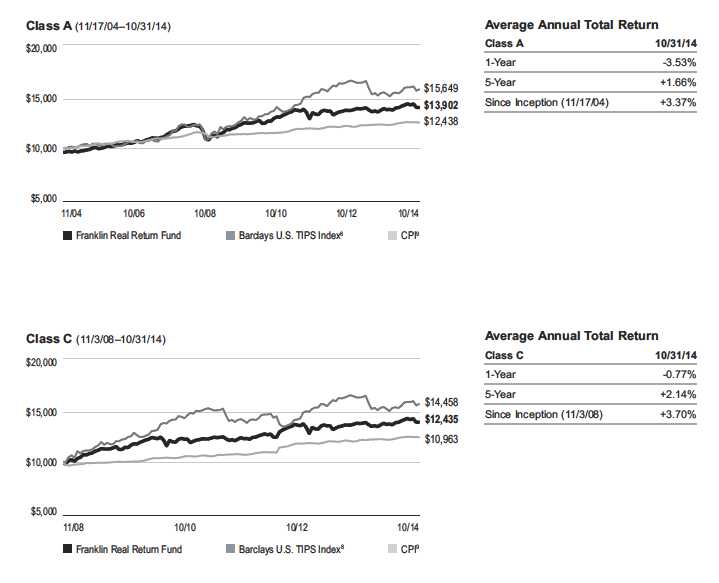
franklintempleton.com Annual Report | 37
FRANKLIN REAL RETURN FUND
PERFORMANCE SUMMARY
Total Return Index Comparison for a Hypothetical $10,000 Investment1 (continued)
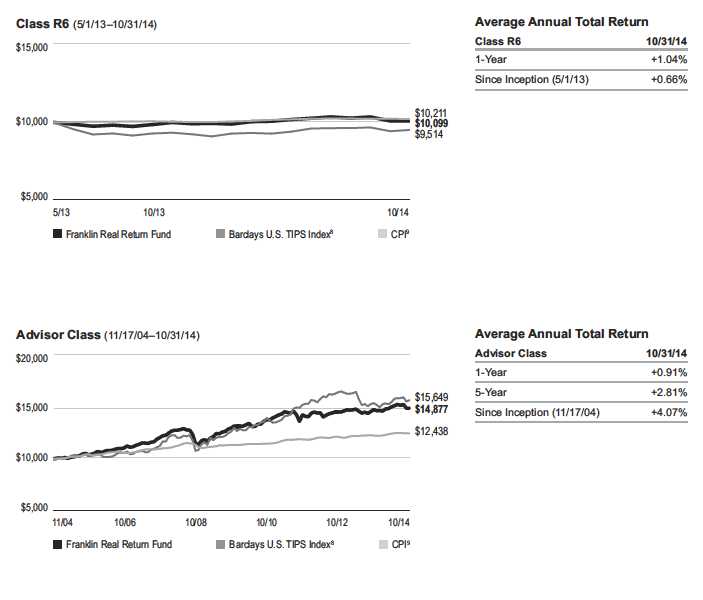
38 | Annual Report franklintempleton.com
FRANKLIN REAL RETURN FUND
PERFORMANCE SUMMARY
All investments involve risks, including possible loss of principal. Interest rate movements will affect the Fund’s share price and yield. Bond prices generally move in the opposite direction of interest rates. As prices of bonds in a fund adjust to a rise in interest rates, the Fund’s share price may decline. Foreign securities involve special risks, including currency fluctuations and economic and political uncertainties. Changes in the financial strength of a bond issuer or in a bond’s credit rating may affect its value. Stock prices fluctuate, sometimes rapidly and dramatically, due to factors affecting individual companies, particular industries or sectors, or general market conditions. The Fund is actively managed but there is no guarantee that the manager’s investment decisions will produce the desired results. The Fund’s prospectus also includes a description of the main investment risks.
| Class C: | These shares have higher annual fees and expenses than Class A shares. |
| Class R6: | Shares are available to certain eligible investors as described in the prospectus. |
| Advisor Class: | Shares are available to certain eligible investors as described in the prospectus. |
1. The Fund has an expense reduction contractually guaranteed through at least 2/28/15. Fund investment results reflect the expense reduction, to the extent applicable;
without this reduction, the results would have been lower.
2. Cumulative total return represents the change in value of an investment over the periods indicated.
3. Average annual total return represents the average annual change in value of an investment over the periods indicated.
4. In accordance with SEC rules, we provide standardized average annual total return information through the latest calendar quarter.
5. Figures are as stated in the Fund’s current prospectus. In periods of market volatility, assets may decline significantly, causing total annual Fund operating expenses to
become higher than the figures shown.
6. Distribution rate is based on an annualization of the respective class’s October dividend and the maximum offering price (NAV for Classes C, R6 and Advisor) per share
on 10/31/14.
7. The 30-day standardized yield for the 30 days ended 10/31/14 reflects an estimated yield to maturity (assuming all portfolio securities are held to maturity). It should be
regarded as an estimate of the Fund’s rate of investment income, and it may not equal the Fund’s actual income distribution rate (which reflects the Fund’s past dividends
paid to shareholders) or the income reported in the Fund’s financial statements.
8. Source: Morningstar. The Barclays U.S. TIPS Index comprises U.S. TIPS rated investment grade (Baa3/BBB- or better) with at least one year to final maturity and at least
$250 million par amount outstanding.
9. Source: Bureau of Labor Statistics, bls.gov/cpi. The Consumer Price Index (CPI) is a commonly used measure of the inflation rate.
See www.franklintempletondatasources.com for additional data provider information.
franklintempleton.com Annual Report | 39
FRANKLIN REAL RETURN FUND
Your Fund’s Expenses
As a Fund shareholder, you can incur two types of costs:
- Transaction costs, including sales charges (loads) on Fund purchases; and
- Ongoing Fund costs, including management fees, distribu- tion and service (12b-1) fees, and other Fund expenses. All mutual funds have ongoing costs, sometimes referred to as operating expenses.
The following table shows ongoing costs of investing in the Fund and can help you understand these costs and compare them with those of other mutual funds. The table assumes a $1,000 investment held for the six months indicated.
Actual Fund Expenses
The first line (Actual) for each share class listed in the table provides actual account values and expenses. The “Ending Account Value” is derived from the Fund’s actual return, which includes the effect of Fund expenses.
You can estimate the expenses you paid during the period by following these steps. Of course, your account value and expenses will differ from those in this illustration:
| 1. | Divide your account value by $1,000. |
| If an account had an $8,600 value, then $8,600 ÷ $1,000 = 8.6. | |
| 2. | Multiply the result by the number under the heading “Expenses Paid During Period.” |
| If Expenses Paid During Period were $7.50, then 8.6 x $7.50 = $64.50. |
In this illustration, the estimated expenses paid this period are $64.50.
Hypothetical Example for Comparison with Other Funds
Information in the second line (Hypothetical) for each class in the table can help you compare ongoing costs of investing in the Fund with those of other mutual funds. This information may not be used to estimate the actual ending account balance or expenses you paid during the period. The hypothetical “Ending Account Value” is based on the actual expense ratio for each class and an assumed 5% annual rate of return before expenses, which does not represent the Fund’s actual return. The figure under the heading “Expenses Paid During Period” shows the hypothetical expenses your account would have incurred under this scenario. You can compare this figure with the 5% hypothetical examples that appear in shareholder reports of other funds.
Please note that expenses shown in the table are meant to highlight ongoing costs and do not reflect any transaction costs, such as sales charges. Therefore, the second line for each class is useful in comparing ongoing costs only, and will not help you compare total costs of owning different funds. In addition, if transaction costs were included, your total costs would have been higher. Please refer to the Fund prospectus for additional information on operating expenses.
40 | Annual Report
franklintempleton.com
FRANKLIN REAL RETURN FUND
YOUR FUND’S EXPENSES
| Beginning Account | Ending Account | Expenses Paid During | ||||
| Share Class | Value 5/1/14 | Value 10/31/14 | Period* 5/1/14–10/31/14 | |||
| A | ||||||
| Actual | $ | 1,000 | $ | 991.20 | $ | 4.52 |
| Hypothetical (5% return before expenses) | $ | 1,000 | $ | 1,020.67 | $ | 4.58 |
| C | ||||||
| Actual | $ | 1,000 | $ | 987.90 | $ | 6.51 |
| Hypothetical (5% return before expenses) | $ | 1,000 | $ | 1,018.65 | $ | 6.61 |
| R6 | ||||||
| Actual | $ | 1,000 | $ | 991.70 | $ | 2.61 |
| Hypothetical (5% return before expenses) | $ | 1,000 | $ | 1,022.58 | $ | 2.65 |
| Advisor | ||||||
| Actual | $ | 1,000 | $ | 991.90 | $ | 3.26 |
| Hypothetical (5% return before expenses) | $ | 1,000 | $ | 1,021.93 | $ | 3.31 |
*Expenses are calculated using the most recent six-month expense ratio, net of expense waivers, annualized for each class (A: 0.90%;
C: 1.30%; R6: 0.52%; and Advisor: 0.65%), multiplied by the average account value over the period, multiplied by 184/365 to reflect
the one-half year period.
franklintempleton.com Annual Report | 41
| FRANKLIN INVESTORS SECURITIES TRUST | |||||||||||||||
| Financial Highlights | |||||||||||||||
| Franklin Balanced Fund | |||||||||||||||
| Year Ended October 31, | |||||||||||||||
| 2014 | 2013 | 2012 | 2011 | 2010 | |||||||||||
| Class A | |||||||||||||||
| Per share operating performance | |||||||||||||||
| (for a share outstanding throughout the year) | |||||||||||||||
| Net asset value, beginning of year | $ | 11.43 | $ | 10.64 | $ | 9.87 | $ | 9.61 | $ | 8.55 | |||||
| Income from investment operationsa: | |||||||||||||||
| Net investment incomeb | 0.31 | c | 0.27 | 0.30 | 0.32 | 0.31 | |||||||||
| Net realized and unrealized gains (losses) | 0.65 | 1.02 | 0.83 | 0.30 | 1.11 | ||||||||||
| Total from investment operations | 0.96 | 1.29 | 1.13 | 0.62 | 1.42 | ||||||||||
| Less distributions from: | |||||||||||||||
| Net investment income | (0.36 | ) | (0.36 | ) | (0.36 | ) | (0.36 | ) | (0.36 | ) | |||||
| Net realized gains | (0.17 | ) | (0.14 | ) | (—)d | — | — | ||||||||
| Total distributions | (0.53 | ) | (0.50 | ) | (0.36 | ) | (0.36 | ) | (0.36 | ) | |||||
| Net asset value, end of year | $ | 11.86 | $ | 11.43 | $ | 10.64 | $ | 9.87 | $ | 9.61 | |||||
| Total returne | 8.66 | % | 12.51 | % | 11.70 | % | 6.51 | % | 16.95 | % | |||||
| Ratios to average net assets | |||||||||||||||
| Expenses before waiver and payments by affiliates | 1.09 | % | 1.12 | % | 1.15 | % | 1.17 | % | 1.23 | % | |||||
| Expenses net of waiver and payments by affiliates | 1.09 | %f | 1.10 | %f | 1.01 | % | 1.01 | % | 1.02 | % | |||||
| Net investment income | 2.64 | %c | 2.51 | % | 2.95 | % | 3.27 | % | 3.44 | % | |||||
| Supplemental data | |||||||||||||||
| Net assets, end of year (000’s) | $ | 2,053,623 | $ | 1,354,710 | $ | 627,287 | $ | 218,625 | $ | 146,699 | |||||
| Portfolio turnover rate | 40.54 | % | 58.52 | % | 58.59 | % | 70.76 | % | 54.12 | % | |||||
aThe amount shown for a share outstanding throughout the period may not correlate with the Statement of Operations for the period due to the timing of sales and
repurchases of the Fund shares in relation to income earned and/or fluctuating fair value of the investments of the Fund.
bBased on average daily shares outstanding.
cNet investment income per share includes approximately $0.03 per share received in the form of a special dividend paid in connection with certain Fund holdings.
Excluding this amount, the ratio of net investment income to average net assets would have been 2.39%.
dAmount rounds to less than $0.01 per share.
eTotal return does not reflect sales commissions or contingent deferred sales charges, if applicable.
fBenefit of expense reduction rounds to less than 0.01%.
42 | Annual Report | The accompanying notes are an integral part of these financial statements. franklintempleton.com
FRANKLIN INVESTORS SECURITIES TRUST
FINANCIAL HIGHLIGHTS
| Franklin Balanced Fund (continued) | |||||||||||||||
| Year Ended October 31, | |||||||||||||||
| 2014 | 2013 | 2012 | 2011 | 2010 | |||||||||||
| Class C | |||||||||||||||
| Per share operating performance | |||||||||||||||
| (for a share outstanding throughout the year) | |||||||||||||||
| Net asset value, beginning of year | $ | 11.34 | $ | 10.57 | $ | 9.81 | $ | 9.54 | $ | 8.49 | |||||
| Income from investment operationsa: | |||||||||||||||
| Net investment incomeb | 0.23 | c | 0.20 | 0.23 | 0.25 | 0.24 | |||||||||
| Net realized and unrealized gains (losses) | 0.65 | 0.99 | 0.82 | 0.31 | 1.11 | ||||||||||
| Total from investment operations | 0.88 | 1.19 | 1.05 | 0.56 | 1.35 | ||||||||||
| Less distributions from: | |||||||||||||||
| Net investment income | (0.28 | ) | (0.28 | ) | (0.29 | ) | (0.29 | ) | (0.30 | ) | |||||
| Net realized gains | (0.17 | ) | (0.14 | ) | (—)d | — | — | ||||||||
| Total distributions | (0.45 | ) | (0.42 | ) | (0.29 | ) | (0.29 | ) | (0.30 | ) | |||||
| Net asset value, end of year | $ | 11.77 | $ | 11.34 | $ | 10.57 | $ | 9.81 | $ | 9.54 | |||||
| Total returne | 7.97 | % | 11.62 | % | 10.91 | % | 5.91 | % | 16.12 | % | |||||
| Ratios to average net assets | |||||||||||||||
| Expenses before waiver and payments by affiliates | 1.79 | % | 1.82 | % | 1.85 | % | 1.87 | % | 1.92 | % | |||||
| Expenses net of waiver and payments by affiliates | 1.79 | %f | 1.80 | %f | 1.71 | % | 1.71 | % | 1.71 | % | |||||
| Net investment income | 1.94 | %c | 1.81 | % | 2.25 | % | 2.57 | % | 2.75 | % | |||||
| Supplemental data | |||||||||||||||
| Net assets, end of year (000’s) | $ | 492,514 | $ | 354,359 | $ | 187,991 | $ | 85,302 | $ | 47,219 | |||||
| Portfolio turnover rate | 40.54 | % | 58.52 | % | 58.59 | % | 70.76 | % | 54.12 | % | |||||
aThe amount shown for a share outstanding throughout the period may not correlate with the Statement of Operations for the period due to the timing of sales and
repurchases of the Fund shares in relation to income earned and/or fluctuating fair value of the investments of the Fund.
bBased on average daily shares outstanding.
cNet investment income per share includes approximately $0.03 per share received in the form of a special dividend paid in connection with certain Fund holdings.
Excluding this amount, the ratio of net investment income to average net assets would have been 1.69%.
dAmount rounds to less than $0.01 per share.
eTotal return does not reflect sales commissions or contingent deferred sales charges, if applicable.
fBenefit of expense reduction rounds to less than 0.01%.
franklintempleton.com The accompanying notes are an integral part of these financial statements. | Annual Report | 43
FRANKLIN INVESTORS SECURITIES TRUST
FINANCIAL HIGHLIGHTS
| Franklin Balanced Fund (continued) | |||||||||||||||
| Year Ended October 31, | |||||||||||||||
| 2014 | 2013 | 2012 | 2011 | 2010 | |||||||||||
| Class R | |||||||||||||||
| Per share operating performance | |||||||||||||||
| (for a share outstanding throughout the year) | |||||||||||||||
| Net asset value, beginning of year | $ | 11.45 | $ | 10.66 | $ | 9.89 | $ | 9.62 | $ | 8.56 | |||||
| Income from investment operationsa: | |||||||||||||||
| Net investment incomeb | 0.29 | c | 0.26 | 0.29 | 0.31 | 0.28 | |||||||||
| Net realized and unrealized gains (losses) | 0.66 | 1.01 | 0.82 | 0.30 | 1.12 | ||||||||||
| Total from investment operations | 0.95 | 1.27 | 1.11 | 0.61 | 1.40 | ||||||||||
| Less distributions from: | |||||||||||||||
| Net investment income | (0.34 | ) | (0.34 | ) | (0.34 | ) | (0.34 | ) | (0.34 | ) | |||||
| Net realized gains | (0.17 | ) | (0.14 | ) | (—)d | — | — | ||||||||
| Total distributions | (0.51 | ) | (0.48 | ) | (0.34 | ) | (0.34 | ) | (0.34 | ) | |||||
| Net asset value, end of year | $ | 11.89 | $ | 11.45 | $ | 10.66 | $ | 9.89 | $ | 9.62 | |||||
| Total return | 8.51 | % | 12.26 | % | 11.46 | % | 6.39 | % | 16.70 | % | |||||
| Ratios to average net assets | |||||||||||||||
| Expenses before waiver and payments by affiliates | 1.29 | % | 1.32 | % | 1.35 | % | 1.37 | % | 1.42 | % | |||||
| Expenses net of waiver and payments by affiliates | 1.29 | %e | 1.30 | %e | 1.21 | % | 1.21 | % | 1.21 | % | |||||
| Net investment income | 2.44 | %c | 2.31 | % | 2.75 | % | 3.07 | % | 3.25 | % | |||||
| Supplemental data | |||||||||||||||
| Net assets, end of year (000’s) | $ | 3,598 | $ | 3,253 | $ | 2,378 | $ | 1,928 | $ | 677 | |||||
| Portfolio turnover rate | 40.54 | % | 58.52 | % | 58.59 | % | 70.76 | % | 54.12 | % | |||||
aThe amount shown for a share outstanding throughout the period may not correlate with the Statement of Operations for the period due to the timing of sales and
repurchases of the Fund shares in relation to income earned and/or fluctuating fair value of the investments of the Fund.
bBased on average daily shares outstanding.
cNet investment income per share includes approximately $0.03 per share received in the form of a special dividend paid in connection with certain Fund holdings.
Excluding this amount, the ratio of net investment income to average net assets would have been 2.19%.
dAmount rounds to less than $0.01 per share.
eBenefit of expense reduction rounds to less than 0.01%.
44 | Annual Report | The accompanying notes are an integral part of these financial statements. franklintempleton.com
FRANKLIN INVESTORS SECURITIES TRUST
FINANCIAL HIGHLIGHTS
| Franklin Balanced Fund (continued) | ||||||
| Year Ended | ||||||
| October 31, | ||||||
| 2014 | 2013 | a | ||||
| Class R6 | ||||||
| Per share operating performance | ||||||
| (for a share outstanding throughout the year) | ||||||
| Net asset value, beginning of year | $ | 11.45 | $ | 11.08 | ||
| Income from investment operationsb: | ||||||
| Net investment incomec | 0.37 | d | 0.19 | |||
| Net realized and unrealized gains (losses) | 0.65 | 0.38 | ||||
| Total from investment operations | 1.02 | 0.57 | ||||
| Less distributions from: | ||||||
| Net investment income | (0.41 | ) | (0.20 | ) | ||
| Net realized gains | (0.17 | ) | — | |||
| Total distributions | (0.58 | ) | (0.20 | ) | ||
| Net asset value, end of year | $ | 11.89 | $ | 11.45 | ||
| Total returne | 9.29 | % | 5.15 | % | ||
| Ratios to average net assetsf | ||||||
| Expenses before waiver and payments by affiliates | 0.68 | % | 1.82 | % | ||
| Expenses net of waiver and payments by affiliatesg | 0.68 | % | 0.70 | % | ||
| Net investment income | 3.05 | %d | 2.91 | % | ||
| Supplemental data | ||||||
| Net assets, end of year (000’s) | $ | 513 | $ | 5 | ||
| Portfolio turnover rate | 40.54 | % | 58.52 | % | ||
aFor the period May 1, 2013 (effective date) to October 31, 2013.
bThe amount shown for a share outstanding throughout the period may not correlate with the Statement of Operations for the period due to the timing of sales and
repurchases of the Fund shares in relation to income earned and/or fluctuating fair value of the investments of the Fund.
cBased on average daily shares outstanding.
dNet investment income per share includes approximately $0.03 per share received in the form of a special dividend paid in connection with certain Fund holdings.
Excluding this amount, the ratio of net investment income to average net assets would have been 2.80%.
eTotal return is not annualized for periods less than one year.
fRatios are annualized for periods less than one year.
gBenefit of expense reduction rounds to less than 0.01%.
franklintempleton.com The accompanying notes are an integral part of these financial statements. | Annual Report | 45
FRANKLIN INVESTORS SECURITIES TRUST
FINANCIAL HIGHLIGHTS
| Franklin Balanced Fund (continued) | |||||||||||||||
| Year Ended October 31, | |||||||||||||||
| 2014 | 2013 | 2012 | 2011 | 2010 | |||||||||||
| Advisor Class | |||||||||||||||
| Per share operating performance | |||||||||||||||
| (for a share outstanding throughout the year) | |||||||||||||||
| Net asset value, beginning of year | $ | 11.45 | $ | 10.66 | $ | 9.89 | $ | 9.62 | $ | 8.56 | |||||
| Income from investment operationsa: | |||||||||||||||
| Net investment incomeb | 0.35 | c | 0.30 | 0.34 | 0.35 | 0.34 | |||||||||
| Net realized and unrealized gains (losses) | 0.65 | 1.02 | 0.82 | 0.31 | 1.11 | ||||||||||
| Total from investment operations | 1.00 | 1.32 | 1.16 | 0.66 | 1.45 | ||||||||||
| Less distributions from: | |||||||||||||||
| Net investment income | (0.40 | ) | (0.39 | ) | (0.39 | ) | (0.39 | ) | (0.39 | ) | |||||
| Net realized gains | (0.17 | ) | (0.14 | ) | (—)d | — | — | ||||||||
| Total distributions | (0.57 | ) | (0.53 | ) | (0.39 | ) | (0.39 | ) | (0.39 | ) | |||||
| Net asset value, end of year | $ | 11.88 | $ | 11.45 | $ | 10.66 | $ | 9.89 | $ | 9.62 | |||||
| Total return | 8.97 | % | 12.82 | % | 12.01 | % | 6.93 | % | 17.30 | % | |||||
| Ratios to average net assets | |||||||||||||||
| Expenses before waiver and payments by affiliates | 0.79 | % | 0.82 | % | 0.85 | % | 0.87 | % | 0.92 | % | |||||
| Expenses net of waiver and payments by affiliates | 0.79 | %e | 0.80 | %e | 0.71 | % | 0.71 | % | 0.71 | % | |||||
| Net investment income | 2.94 | %c | 2.81 | % | 3.25 | % | 3.57 | % | 3.75 | % | |||||
| Supplemental data | |||||||||||||||
| Net assets, end of year (000’s) | $ | 41,494 | $ | 68,201 | $ | 13,779 | $ | 7,477 | $ | 3,299 | |||||
| Portfolio turnover rate | 40.54 | % | 58.52 | % | 58.59 | % | 70.76 | % | 54.12 | % | |||||
aThe amount shown for a share outstanding throughout the period may not correlate with the Statement of Operations for the period due to the timing of sales and
repurchases of the Fund shares in relation to income earned and/or fluctuating fair value of the investments of the Fund.
bBased on average daily shares outstanding.
cNet investment income per share includes approximately $0.03 per share received in the form of a special dividend paid in connection with certain Fund holdings.
Excluding this amount, the ratio of net investment income to average net assets would have been 2.69%.
dAmount rounds to less than $0.01 per share.
eBenefit of expense reduction rounds to less than 0.01%.
46 | Annual Report | The accompanying notes are an integral part of these financial statements. franklintempleton.com
| FRANKLIN INVESTORS SECURITIES TRUST | ||||
| Statement of Investments, October 31, 2014 | ||||
| Franklin Balanced Fund | ||||
| Country | Shares | Value | ||
| Common Stocks 53.7% | ||||
| Consumer Discretionary 5.7% | ||||
| Comcast Corp., A | United States | 500,000 | $ | 27,675,000 |
| Ford Motor Co. | United States | 1,500,000 | 21,135,000 | |
| General Motors Co. | United States | 750,000 | 23,550,000 | |
| Lowe’s Cos. Inc. | United States | 398,000 | 22,765,600 | |
| Starwood Hotels & Resorts Worldwide Inc. | United States | 250,000 | 19,165,000 | |
| Target Corp. | United States | 550,000 | 34,001,000 | |
| 148,291,600 | ||||
| Consumer Staples 2.2% | ||||
| PepsiCo Inc. | United States | 265,000 | 25,485,050 | |
| The Procter & Gamble Co. | United States | 140,000 | 12,217,800 | |
| Walgreen Co. | United States | 300,000 | 19,266,000 | |
| 56,968,850 | ||||
| Energy 6.5% | ||||
| BP PLC, ADR | United Kingdom | 400,000 | 17,384,000 | |
| Chevron Corp. | United States | 200,000 | 23,990,000 | |
| Eni SpA | Italy | 500,000 | 10,654,750 | |
| Halliburton Co. | United States | 250,000 | 13,785,000 | |
| Kinder Morgan Inc. | United States | 560,000 | 21,672,000 | |
| Royal Dutch Shell PLC, A, ADR | United Kingdom | 200,000 | 14,358,000 | |
| Schlumberger Ltd. | United States | 400,000 | 39,464,000 | |
| The Williams Cos. Inc. | United States | 500,000 | 27,755,000 | |
| 169,062,750 | ||||
| Financials 2.5% | ||||
| JPMorgan Chase & Co. | United States | 300,000 | 18,144,000 | |
| MetLife Inc. | United States | 557,270 | 30,226,325 | |
| Wells Fargo & Co. | United States | 300,000 | 15,927,000 | |
| 64,297,325 | ||||
| Health Care 3.8% | ||||
| Eli Lilly & Co. | United States | 425,000 | 28,190,250 | |
| Johnson & Johnson | United States | 250,000 | 26,945,000 | |
| Pfizer Inc. | United States | 700,000 | 20,965,000 | |
| Sanofi, ADR | France | 500,000 | 23,120,000 | |
| 99,220,250 | ||||
| Industrials 9.2% | ||||
| The Boeing Co. | United States | 210,000 | 26,231,100 | |
| Caterpillar Inc. | United States | 300,000 | 30,423,000 | |
| Deere & Co. | United States | 300,010 | 25,662,856 | |
| General Electric Co. | United States | 1,199,998 | 30,971,948 | |
| Lockheed Martin Corp. | United States | 75,000 | 14,292,750 | |
| Northrop Grumman Corp. | United States | 125,000 | 17,245,000 | |
| Raytheon Co. | United States | 250,000 | 25,970,000 | |
| Republic Services Inc. | United States | 700,000 | 26,880,000 | |
| United Parcel Service Inc., B | United States | 250,000 | 26,227,500 | |
| Waste Management Inc. | United States | 300,000 | 14,667,000 | |
| 238,571,154 | ||||
franklintempleton.com Annual Report | 47
FRANKLIN INVESTORS SECURITIES TRUST
STATEMENT OF INVESTMENTS
| Franklin Balanced Fund (continued) | ||||
| Country | Shares | Value | ||
| Common Stocks (continued) | ||||
| Information Technology 7.6% | ||||
| Analog Devices Inc. | United States | 450,000 | $ | 22,329,000 |
| Apple Inc. | United States | 385,238 | 41,605,704 | |
| Cisco Systems Inc. | United States | 1,000,000 | 24,470,000 | |
| Intel Corp. | United States | 600,000 | 20,406,000 | |
| Maxim Integrated Products Inc. | United States | 650,000 | 19,071,000 | |
| Microsoft Corp. | United States | 300,000 | 14,085,000 | |
| QUALCOMM Inc. | United States | 200,000 | 15,702,000 | |
| Texas Instruments Inc. | United States | 500,000 | 24,830,000 | |
| Xilinx Inc. | United States | 300,000 | 13,344,000 | |
| 195,842,704 | ||||
| Materials 7.2% | ||||
| Agrium Inc. | Canada | 300,000 | 29,346,000 | |
| BHP Billiton Ltd., ADR | Australia | 300,000 | 17,832,000 | |
| The Dow Chemical Co. | United States | 500,000 | 24,700,000 | |
| E. I. du Pont de Nemours and Co. | United States | 275,000 | 19,016,250 | |
| Freeport-McMoRan Inc., B | United States | 800,000 | 22,800,000 | |
| The Mosaic Co. | United States | 568,742 | 25,200,958 | |
| Potash Corp. of Saskatchewan Inc. | Canada | 450,000 | 15,376,500 | |
| Praxair Inc. | United States | 100,000 | 12,599,000 | |
| Rio Tinto PLC, ADR | United Kingdom | 400,000 | 19,188,000 | |
| 186,058,708 | ||||
| Telecommunication Services 2.8% | ||||
| AT&T Inc. | United States | 1,000,000 | 34,840,000 | |
| Verizon Communications Inc. | United States | 750,000 | 37,687,500 | |
| 72,527,500 | ||||
| Utilities 6.2% | ||||
| Duke Energy Corp. | United States | 400,000 | 32,860,000 | |
| Exelon Corp. | United States | 500,000 | 18,295,000 | |
| NextEra Energy Inc. | United States | 100,000 | 10,022,000 | |
| PG&E Corp. | United States | 700,000 | 35,224,000 | |
| Portland General Electric Co. | United States | 300,000 | 10,923,000 | |
| The Southern Co. | United States | 600,000 | 27,816,000 | |
| Xcel Energy Inc. | United States | 800,000 | 26,776,000 | |
| 161,916,000 | ||||
| Total Common Stocks (Cost $1,212,168,338) | 1,392,756,841 | |||
| aEquity-Linked Securities 5.0% | ||||
| Consumer Staples 0.6% | ||||
| bWells Fargo & Co. into Whole Foods Market Inc., 7.00%, 144A | United States | 400,000 | 15,730,880 | |
| Financials 0.4% | ||||
| bThe Goldman Sachs Group Inc. into Citigroup Inc., 5.00%, 144A | United States | 212,000 | 10,959,170 | |
| Information Technology 2.3% | ||||
| bCredit Suisse New York into Freescale Semiconductor Ltd., 7.00%, 144A | United States | 771,000 | 15,562,018 | |
| bCredit Suisse New York into Intel Corp., 6.00%, 144A | United States | 800,000 | 23,588,160 | |
| bCredit Suisse New York into Yahoo! Inc., 7.00%, 144A | United States | 492,000 | 21,074,870 | |
| 60,225,048 |
48 | Annual Report
franklintempleton.com
FRANKLIN INVESTORS SECURITIES TRUST
STATEMENT OF INVESTMENTS
| Franklin Balanced Fund (continued) | ||||
| Country | Shares | Value | ||
| aEquity-Linked Securities (continued) | ||||
| Materials 1.7% | ||||
| bCredit Suisse New York into LyondellBasell Industries NV, 6.00%, 144A | United States | 272,000 | $ | 24,737,937 |
| bMorgan Stanley into Rio Tinto PLC, 7.50%, 144A | United Kingdom | 260,000 | 12,949,586 | |
| bWells Fargo & Co. into Freeport-McMoRan Inc., 7.50%, 144A | United States | 192,000 | 5,696,717 | |
| 43,384,240 | ||||
| Total Equity-Linked Securities (Cost $131,437,980) | 130,299,338 | |||
| Convertible Preferred Stocks 5.0% | ||||
| Energy 1.3% | ||||
| bChesapeake Energy Corp., 5.75%, cvt. pfd., 144A | United States | 11,000 | 11,983,125 | |
| bPenn Virginia Corp., 6.00%, cvt. pfd., 144A | United States | 75,000 | 6,197,250 | |
| Rex Energy Corp., 6.00%, cvt. pfd., A | United States | 115,000 | 8,711,055 | |
| Sanchez Energy Corp., 4.875%, cvt. pfd. | United States | 60,000 | 2,866,860 | |
| Sanchez Energy Corp., 6.50%, cvt. pfd., B | United States | 90,000 | 4,639,500 | |
| 34,397,790 | ||||
| Financials 1.2% | ||||
| Bank of America Corp., 7.25%, cvt. pfd., L | United States | 12,901 | 14,748,552 | |
| Wells Fargo & Co., 7.50%, cvt. pfd., A | United States | 12,500 | 15,050,000 | |
| 29,798,552 | ||||
| Industrials 0.2% | ||||
| United Technologies Corp., 7.50%, cvt. pfd. | United States | 93,800 | 5,475,106 | |
| Materials 0.2% | ||||
| ArcelorMittal, 6.00%, cvt. pfd. | Luxembourg | 200,000 | 4,100,000 | |
| Cliffs Natural Resources Inc., 7.00%, cvt. pfd. | United States | 100,000 | 1,050,000 | |
| 5,150,000 | ||||
| Utilities 2.1% | ||||
| Dominion Resources Inc., 6.125%, cvt. pfd., A | United States | 350,000 | 19,908,000 | |
| Dominion Resources Inc., 6.375%, cvt. pfd., A | United States | 238,900 | 12,028,615 | |
| Exelon Corp., 6.50%, cvt. pfd. | United States | 100,000 | 5,268,000 | |
| NextEra Energy Inc., 5.599%, cvt. pfd. | United States | 100,000 | 6,560,500 | |
| NextEra Energy Inc., 5.799%, cvt. pfd. | United States | 200,000 | 11,090,000 | |
| 54,855,115 | ||||
| Total Convertible Preferred Stocks (Cost $127,543,927) | 129,676,563 | |||
| Preferred Stocks 0.7% | ||||
| Financials 0.7% | ||||
| Ally Financial Inc., 8.50%, pfd., A | United States | 120,300 | 3,185,544 | |
| Citigroup Capital XIII, 8.75%, pfd. | United States | 37,000 | 984,940 | |
| cMorgan Stanley, 6.375%, pfd., I | United States | 310,000 | 7,815,100 | |
| U.S. Bancorp, 6.00%, pfd., G | United States | 180,000 | 4,870,800 | |
| Total Preferred Stocks (Cost $15,605,532) | 16,856,384 | |||
| Principal | ||||
| Amount* | ||||
| Corporate Bonds 29.8% | ||||
| Consumer Discretionary 2.1% | ||||
| CCO Holdings LLC/CCO Holdings Capital Corp., senior bond, 5.75%, 1/15/24 | United States | 10,000,000 | 10,262,500 | |
| DISH DBS Corp., senior note, 5.875%, 7/15/22 | United States | 3,000,000 | 3,187,500 | |
| Dollar General Corp., senior bond, 3.25%, 4/15/23 | United States | 15,000,000 | 13,488,030 | |
| Ford Motor Credit Co. LLC, senior note, 3.00%, 6/12/17 | United States | 6,000,000 | 6,190,194 | |
| franklintempleton.com | Annual Report | 49 | |||
FRANKLIN INVESTORS SECURITIES TRUST
STATEMENT OF INVESTMENTS
| Franklin Balanced Fund (continued) | ||||
| Principal | ||||
| Country | Amount* | Value | ||
| Corporate Bonds (continued) | ||||
| Consumer Discretionary (continued) | ||||
| bS.A.C.I. Falabella, senior note, 144A, 3.75%, 4/30/23 | Chile | 7,000,000 | $ | 6,909,091 |
| bTiffany & Co., senior bond, 144A, 4.90%, 10/01/44 | United States | 7,000,000 | 7,181,412 | |
| Trinity Acquisition PLC, senior note, 4.625%, 8/15/23 | United Kingdom | 7,000,000 | 7,360,675 | |
| 54,579,402 | ||||
| Consumer Staples 2.5% | ||||
| bCencosud SA, senior note, 144A, 4.875%, 1/20/23 | Chile | 7,000,000 | 7,055,335 | |
| Kraft Foods Group Inc., senior bond, 3.50%, 6/06/22 | United States | 10,000,000 | 10,247,740 | |
| Lorillard Tobacco Co., senior note, 2.30%, 8/21/17 | United States | 10,000,000 | 10,111,380 | |
| Mondelez International Inc., senior bond, 4.00%, 2/01/24 | United States | 15,000,000 | 15,503,385 | |
| Sysco Corp., senior bond, 4.35%, 10/02/34 | United States | 10,000,000 | 10,379,120 | |
| Tyson Foods Inc., senior bond, 3.95%, 8/15/24 | United States | 12,100,000 | 12,360,029 | |
| 65,656,989 | ||||
| Energy 5.3% | ||||
| bCalifornia Resources Corp., senior bond, 144A, 6.00%, 11/15/24 | United States | 8,400,000 | 8,631,000 | |
| Chesapeake Energy Corp., senior note, 5.375%, 6/15/21 | United States | 7,500,000 | 7,856,250 | |
| Ecopetrol SA, senior bond, 4.125%, 1/16/25 | Colombia | 15,000,000 | 14,647,425 | |
| El Paso Pipeline Partners Operating Co. LLC, senior note, 4.30%, 5/01/24 | United States | 12,900,000 | 12,980,625 | |
| bEnable Midstream Partners LP, senior note, 144A, 3.90%, 5/15/24 | United States | 9,700,000 | 9,715,016 | |
| Energy Transfer Partners LP, senior bond, 3.60%, 2/01/23 | United States | 25,000,000 | 24,526,100 | |
| Ensco PLC, senior bond, 5.75%, 10/01/44 | United States | 3,800,000 | 3,963,894 | |
| EOG Resources Inc., senior bond, 2.625%, 3/15/23 | United States | 5,500,000 | 5,304,700 | |
| Freeport-McMoran Oil & Gas LLC / FCX Oil & Gas Inc., senior note, | ||||
| 6.125%, 6/15/19 | United States | 1,846,000 | 2,023,678 | |
| 6.50%, 11/15/20 | United States | 3,258,000 | 3,565,881 | |
| Peabody Energy Corp., senior note, 6.25%, 11/15/21 | United States | 4,000,000 | 3,802,500 | |
| bPetrofac Ltd., senior note, 144A, 3.40%, 10/10/18 | United Kingdom | 3,000,000 | 3,093,390 | |
| Phillips 66, senior note, 1.95%, 3/05/15 | United States | 7,500,000 | 7,537,882 | |
| Sabine Pass Liquefaction LLC, | ||||
| first lien, 5.625%, 2/01/21 | United States | 7,500,000 | 7,893,750 | |
| bsenior secured note, first lien, 144A, 5.75%, 5/15/24 | United States | 13,200,000 | 13,711,500 | |
| Weatherford International Ltd., senior bond, 5.95%, 4/15/42 | United States | 4,000,000 | 4,248,104 | |
| The Williams Cos. Inc., senior bond, 3.70%, 1/15/23 | United States | 5,000,000 | 4,710,005 | |
| 138,211,700 | ||||
| Financials 11.2% | ||||
| dBank of America Corp., junior sub. bond, M, 8.125% to 5/15/18, FRN thereafter, | ||||
| Perpetual | United States | 10,000,000 | 10,900,000 | |
| Capital One Bank USA NA, | ||||
| senior note, 2.30%, 6/05/19 | United States | 14,000,000 | 13,934,270 | |
| sub. bond, 3.375%, 2/15/23 | United States | 5,000,000 | 4,958,685 | |
| Citigroup Inc., | ||||
| djunior sub. bond, M, 6.30% to 5/15/24, FRN thereafter, Perpetual | United States | 15,000,000 | 14,943,750 | |
| sub. bond, 5.50%, 9/13/25 | United States | 10,000,000 | 11,100,120 | |
| Deutsche Bank AG, sub. bond, 4.296% to 5/24/23, FRN thereafter, 5/24/28 | Germany | 15,000,000 | 14,568,750 | |
| dGeneral Electric Capital Corp., junior sub. bond, 7.125% to 6/15/22, | ||||
| FRN thereafter, Perpetual | United States | 8,000,000 | 9,350,000 | |
| HCP Inc., senior bond, 3.875%, 8/15/24 | United States | 21,700,000 | 21,759,892 | |
| Healthcare Trust of America Holdings LP, senior note, 3.375%, 7/15/21 | United States | 10,000,000 | 9,999,840 | |
| HSBC Finance Corp., senior sub. bond, 6.676%, 1/15/21 | United States | 2,000,000 | 2,361,810 | |
| b,eING Bank NV, senior note, 144A, FRN, 1.874%, 9/25/15 | Netherlands | 5,000,000 | 5,066,050 |
50 | Annual Report franklintempleton.com
FRANKLIN INVESTORS SECURITIES TRUST
STATEMENT OF INVESTMENTS
| Franklin Balanced Fund (continued) | ||||
| Principal | ||||
| Country | Amount* | Value | ||
| Corporate Bonds (continued) | ||||
| Financials (continued) | ||||
| dJPMorgan Chase & Co., | ||||
| junior sub. bond, V, 5.00% to 7/30/19, FRN thereafter, Perpetual | United States | 13,000,000 | $ | 12,853,750 |
| junior sub. note, 1, 7.90% to 4/30/19, FRN thereafter, Perpetual | United States | 10,000,000 | 10,887,500 | |
| bLiberty Mutual Group Inc., senior note, 144A, 4.95%, 5/01/22 | United States | 7,100,000 | 7,704,721 | |
| bMizuho Bank Ltd., senior note, 144A, 2.45%, 4/16/19 | Japan | 12,000,000 | 12,023,268 | |
| Morgan Stanley, senior sub. bond, 4.35%, 9/08/26 | United States | 15,000,000 | 15,054,030 | |
| Navient LLC, senior note, 6.125%, 3/25/24 | United States | 15,000,000 | 15,525,150 | |
| bNippon Life Insurance Co., sub. bond, 144A, 5.10% to10/16/24, FRN thereafter, | ||||
| 10/16/44 | Japan | 15,000,000 | 15,705,600 | |
| dPNC Financial Services Group Inc., junior sub. note, 4.85% to 6/01/23, | ||||
| FRN thereafter, Perpetual | United States | 12,000,000 | 11,430,000 | |
| Prologis LP, senior note, 4.25%, 8/15/23 | United States | 12,000,000 | 12,523,164 | |
| bPrudential Covered Trust, secured note, 144A, 2.997%, 9/30/15 | United States | 2,550,000 | 2,598,256 | |
| Prudential Financial Inc., junior sub. note, 5.875%, 9/15/42 | United States | 5,000,000 | 5,325,000 | |
| Realty Income Corp., senior bond, 3.875%, 7/15/24 | United States | 15,000,000 | 15,087,825 | |
| Royal Bank of Scotland Group PLC, sub. note, | ||||
| 6.125%, 12/15/22 | United Kingdom | 4,000,000 | 4,340,000 | |
| 5.125%, 5/28/24 | United Kingdom | 10,400,000 | 10,445,500 | |
| Senior Housing Properties Trust, senior note, 6.75%, 12/15/21 | United States | 7,000,000 | 8,020,593 | |
| U.S. Bank NA, sub. note, 3.778% to 4/29/18, FRN thereafter, 4/29/20 | United States | 4,500,000 | 4,564,841 | |
| dWells Fargo & Co., junior sub. bond, S, 5.90% to 6/15/24, FRN thereafter, Perpetual | United States | 7,900,000 | 8,141,740 | |
| 291,174,105 | ||||
| Health Care 2.1% | ||||
| Celgene Corp., senior bond, 4.00%, 8/15/23 | United States | 10,000,000 | 10,459,150 | |
| Edwards Lifesciences Corp., senior note, 2.875%, 10/15/18 | United States | 10,000,000 | 10,202,810 | |
| HCA Inc., senior secured note, first lien, 5.00%, 3/15/24 | United States | 7,000,000 | 7,236,320 | |
| PerkinElmer Inc., senior note, 5.00%, 11/15/21 | United States | 2,000,000 | 2,173,388 | |
| Thermo Fisher Scientific Inc., senior note, 2.40%, 2/01/19 | United States | 12,000,000 | 12,080,136 | |
| bValeant Pharmaceuticals International Inc., senior note, 144A, 6.75%, 8/15/18 | United States | 10,400,000 | 11,089,000 | |
| 53,240,804 | ||||
| Industrials 1.0% | ||||
| bAir Canada 2013-1A Pass Through Trust, first lien, 144A, 4.125%, 11/15/26 | Canada | 6,833,070 | 6,867,235 | |
| bAviation Capital Group Corp., senior note, 144A, 3.875%, 9/27/16 | United States | 12,000,000 | 12,333,768 | |
| bBombardier Inc., senior note, 144A, 6.00%, 10/15/22 | Canada | 5,000,000 | 5,140,625 | |
| 24,341,628 | ||||
| Information Technology 1.2% | ||||
| bFreescale Semiconductor Inc., | ||||
| secured note, 144A, 5.00%, 5/15/21 | United States | 8,500,000 | 8,415,000 | |
| senior secured note, 144A, 6.00%, 1/15/22 | United States | 6,100,000 | 6,267,750 | |
| Oracle Corp., senior note, 2.50%, 10/15/22 | United States | 10,000,000 | 9,669,270 | |
| ViaSat Inc., senior note, 6.875%, 6/15/20 | United States | 5,000,000 | 5,312,500 | |
| 29,664,520 | ||||
| Materials 1.4% | ||||
| bAlpek SA de CV, senior note, 144A, 4.50%, 11/20/22 | Mexico | 5,000,000 | 5,101,700 | |
| bCemex SAB de CV, senior secured note, 144A, 6.50%, 12/10/19 | Mexico | 6,000,000 | 6,423,750 | |
| CrownAmericas LLC/CrownAmericas Capital Corp. IV, senior bond, 4.50%, 1/15/23 | United States | 5,000,000 | 4,937,500 | |
| Freeport-McMoRan Inc., senior bond, 3.875%, 3/15/23 | United States | 7,000,000 | 6,928,110 | |
| bGlencore Funding LLC, senior note, 144A, 4.125%, 5/30/23 | Switzerland | 10,000,000 | 9,974,520 | |
| Reliance Steel & Aluminum Co., senior note, 4.50%, 4/15/23 | United States | 4,000,000 | 4,085,248 | |
| 37,450,828 | ||||
franklintempleton.com Annual Report | 51
FRANKLIN INVESTORS SECURITIES TRUST
STATEMENT OF INVESTMENTS
| Franklin Balanced Fund (continued) | |||||
| Principal | |||||
| Country | Amount* | Value | |||
| Corporate Bonds (continued) | |||||
| Telecommunication Services 1.3% | |||||
| bSoftBank Corp., senior note, 144A, 4.50%, 4/15/20 | Japan | 10,000,000 | $ | 10,150,000 | |
| Telefonica Emisiones SAU, senior note, 4.57%, 4/27/23 | Spain | 10,000,000 | 10,623,950 | ||
| Verizon Communications Inc., senior bond, 6.55%, 9/15/43 | United States | 11,000,000 | 13,907,113 | ||
| 34,681,063 | |||||
| Utilities 1.7% | |||||
| bCalpine Corp., senior secured note, first lien, 144A, 6.00%, 1/15/22 | United States | 7,400,000 | 8,010,500 | ||
| b,dEDF SA, sub. note, 144A, 5.25% to 1/29/23, FRN thereafter, Perpetual | France | 10,000,000 | 10,400,600 | ||
| bEnogex LLC, senior note, 144A, 6.25%, 3/15/20 | United States | 5,000,000 | 5,749,940 | ||
| bInterGen NV, secured bond, 144A, 7.00%, 6/30/23 | Netherlands | 10,000,000 | 9,625,000 | ||
| bNGL Energy Partners LP/NGL Energy Finance Corp., senior note, 144A, 6.875%, | |||||
| 10/15/21 | United States | 10,000,000 | 10,675,000 | ||
| 44,461,040 | |||||
| Total Corporate Bonds (Cost $747,781,654) | 773,462,079 | ||||
| Total Investments before Short Term Investments | |||||
| (Cost $2,234,537,431) | 2,443,051,205 | ||||
| Short Term Investments 4.4% | |||||
| U.S. Government and Agency Securities (Cost $18,199,859) 0.7% | |||||
| f,gU.S. Treasury Bill, 11/28/14 | United States | 18,200,000 | 18,199,963 | ||
| Total Investments before Money Market Funds | |||||
| (Cost $2,252,737,290) | 2,461,251,168 | ||||
| Shares | |||||
| Money Market Funds (Cost $95,445,564) 3.7% | |||||
| c,hInstitutional Fiduciary Trust Money Market Portfolio | United States | 95,445,564 | 95,445,564 | ||
| Total Investments (Cost $2,348,182,854) 98.6% | 2,556,696,732 | ||||
| Options Written (0.0)%† | (162,500 | ) | |||
| Other Assets, less Liabilities 1.4% | 35,207,653 | ||||
| Net Assets 100.0% | $ | 2,591,741,885 | |||
| Number of | |||||
| Contracts | |||||
| iOptions Written (0.0)%† | |||||
| Puts – Exchange-Traded | |||||
| Energy (0.0)%† | |||||
| EOG Resources Inc., November Strike Price $85, Expires 11/22/14 | United States | 1,000 | $ | (95,000 | ) |
| Consumer Discretionary (0.0)%† | |||||
| Las Vegas Sands Corp., November Strike Price $58, Expires 11/22/14 | United States | 1,500 | (67,500 | ) | |
| Total Options Written (Premiums received $406,518) | $ | (162,500 | ) | ||
*The principal amount is stated in U.S. dollars unless otherwise indicated.
†Rounds to less than 0.1% of net assets.
aSee Note 1(g) regarding equity-linked securities.
bSecurity was purchased pursuant to Rule 144A under the Securities Act of 1933 and may be sold in transactions exempt from registration only to qualified institutional buyers
or in a public offering registered under the Securities Act of 1933. These securities have been deemed liquid under guidelines approved by the Trust’s Board of Trustees. At
October 31, 2014, the aggregate value of these securities was $374,098,740, representing 14.43% of net assets.
52 | Annual Report franklintempleton.com
FRANKLIN INVESTORS SECURITIES TRUST
STATEMENT OF INVESTMENTS
Franklin Balanced Fund (continued)
cNon-income producing.
dPerpetual security with no stated maturity date.
eThe coupon rate shown represents the rate at period end.
fThe security is traded on a discount basis with no stated coupon rate.
gSecurity or a portion of the security has been pledged as collateral for written options contracts. At October 31, 2014, the value of this security pledged as collateral was
$18,063,964, representing 0.70% of net assets.
hSee Note 3(f) regarding investments in Institutional Fiduciary Trust Money Market Portfolio.
iSee Note 1(e) regarding written options.
At October 31, 2014, the fund had the following forward exchange contracts outstanding. See Note 1(e).
| Contract | Settlement | Unrealized | Unrealized | ||||||||
| Currency | Counterpartya | Type | Quantity | Amount | Date | Appreciation | Depreciation | ||||
| Swiss Franc | DBAB | Buy | 3,806,375 | $ | 4,210,592 | 4/16/15 | $ | — | $ | (246,620 | ) |
| Swiss Franc | DBAB | Sell | 3,806,375 | 4,285,011 | 4/16/15 | 321,039 | — | ||||
| Unrealized appreciation (depreciation) | 321,039 | (246,620 | ) | ||||||||
| Net unrealized appreciation (depreciation) | $ | 74,419 | |||||||||
| aMay be comprised of multiple contracts with the same counterparty, currency and settlement date. | |||||||||||
See Abbreviations on page 102.
franklintempleton.com The accompanying notes are an integral part of these financial statements. | Annual Report | 53
| FRANKLIN INVESTORS SECURITIES TRUST | |||||||||||||||
| Financial Highlights | |||||||||||||||
| Franklin Convertible Securities Fund | |||||||||||||||
| Year Ended October 31, | |||||||||||||||
| 2014 | 2013 | 2012 | 2011 | 2010 | |||||||||||
| Class A | |||||||||||||||
| Per share operating performance | |||||||||||||||
| (for a share outstanding throughout the year) | |||||||||||||||
| Net asset value, beginning of year | $ | 17.82 | $ | 14.93 | $ | 14.37 | $ | 14.55 | $ | 12.28 | |||||
| Income from investment operationsa: | |||||||||||||||
| Net investment incomeb | 0.23 | 0.37 | 0.41 | 0.42 | 0.37 | ||||||||||
| Net realized and unrealized gains (losses) | 1.32 | 2.99 | 0.67 | (0.06 | ) | 2.42 | |||||||||
| Total from investment operations | 1.55 | 3.36 | 1.08 | 0.36 | 2.79 | ||||||||||
| Less distributions from: | |||||||||||||||
| Net investment income | (0.33 | ) | (0.47 | ) | (0.52 | ) | (0.54 | ) | (0.52 | ) | |||||
| Net realized gains | (0.07 | ) | — | — | — | — | |||||||||
| Total distributions | (0.40 | ) | (0.47 | ) | (0.52 | ) | (0.54 | ) | (0.52 | ) | |||||
| Net asset value, end of year | $ | 18.97 | $ | 17.82 | $ | 14.93 | $ | 14.37 | $ | 14.55 | |||||
| Total returnc | 8.85 | % | 22.92 | % | 7.66 | % | 2.35 | % | 23.17 | % | |||||
| Ratios to average net assets | |||||||||||||||
| Expenses | 0.88 | %d,e | 0.88 | %e | 0.90 | % | 0.88 | % | 0.90 | % | |||||
| Net investment income | 1.23 | % | 2.25 | % | 2.84 | % | 2.77 | % | 2.78 | % | |||||
| Supplemental data | |||||||||||||||
| Net assets, end of year (000’s) | $ | 921,134 | $ | 844,498 | $ | 602,804 | $ | 704,844 | $ | 651,012 | |||||
| Portfolio turnover rate | 23.05 | % | 34.69 | % | 12.82 | % | 23.24 | % | 29.56 | % | |||||
aThe amount shown for a share outstanding throughout the period may not correlate with the Statement of Operations for the period due to the timing of sales and
repurchases of the Fund shares in relation to income earned and/or fluctuating fair value of the investments of the Fund.
bBased on average daily shares outstanding.
cTotal return does not reflect sales commissions or contingent deferred sales charges, if applicable.
dBenefit of waiver and payments by affiliates rounds to less than 0.01%.
eBenefit of expense reduction rounds to less than 0.01%.
54 | Annual Report | The accompanying notes are an integral part of these financial statements. franklintempleton.com
| FRANKLIN INVESTORS SECURITIES TRUST | |||||||||||||||
| FINANCIAL HIGHLIGHTS | |||||||||||||||
| Franklin Convertible Securities Fund (continued) | |||||||||||||||
| Year Ended October 31, | |||||||||||||||
| 2014 | 2013 | 2012 | 2011 | 2010 | |||||||||||
| Class C | |||||||||||||||
| Per share operating performance | |||||||||||||||
| (for a share outstanding throughout the year) | |||||||||||||||
| Net asset value, beginning of year | $ | 17.60 | $ | 14.75 | $ | 14.21 | $ | 14.39 | $ | 12.16 | |||||
| Income from investment operationsa: | |||||||||||||||
| Net investment incomeb | 0.09 | 0.24 | 0.30 | 0.30 | 0.27 | ||||||||||
| Net realized and unrealized gains (losses) | 1.31 | 2.97 | 0.65 | (0.06 | ) | 2.38 | |||||||||
| Total from investment operations | 1.40 | 3.21 | 0.95 | 0.24 | 2.65 | ||||||||||
| Less distributions from: | |||||||||||||||
| Net investment income | (0.20 | ) | (0.36 | ) | (0.41 | ) | (0.42 | ) | (0.42 | ) | |||||
| Net realized gains | (0.07 | ) | — | — | — | — | |||||||||
| Total distributions | (0.27 | ) | (0.36 | ) | (0.41 | ) | (0.42 | ) | (0.42 | ) | |||||
| Net asset value, end of year | $ | 18.73 | $ | 17.60 | $ | 14.75 | $ | 14.21 | $ | 14.39 | |||||
| Total returnc | 8.01 | % | 22.11 | % | 6.79 | % | 1.60 | % | 22.16 | % | |||||
| Ratios to average net assets | |||||||||||||||
| Expenses | 1.63 | %d,e | 1.63 | %e | 1.65 | % | 1.63 | % | 1.65 | % | |||||
| Net investment income | 0.48 | % | 1.50 | % | 2.09 | % | 2.02 | % | 2.03 | % | |||||
| Supplemental data | |||||||||||||||
| Net assets, end of year (000’s) | $ | 333,034 | $ | 273,132 | $ | 211,630 | $ | 232,471 | $ | 222,201 | |||||
| Portfolio turnover rate | 23.05 | % | 34.69 | % | 12.82 | % | 23.24 | % | 29.56 | % | |||||
aThe amount shown for a share outstanding throughout the period may not correlate with the Statement of Operations for the period due to the timing of sales and
repurchases of the Fund shares in relation to income earned and/or fluctuating fair value of the investments of the Fund.
bBased on average daily shares outstanding.
cTotal return does not reflect sales commissions or contingent deferred sales charges, if applicable.
dBenefit of waiver and payments by affiliates rounds to less than 0.01%.
eBenefit of expense reduction rounds to less than 0.01%.
franklintempleton.com The accompanying notes are an integral part of these financial statements. | Annual Report | 55
| FRANKLIN INVESTORS SECURITIES TRUST | |||
| FINANCIAL HIGHLIGHTS | |||
| Franklin Convertible Securities Fund (continued) | |||
| Period Ended | |||
| October 31, | |||
| 2014 | a | ||
| Class R6 | |||
| Per share operating performance | |||
| (for a share outstanding throughout the period) | |||
| Net asset value, beginning of period | $ | 19.21 | |
| Income from investment operationsb: | |||
| Net investment incomec | 0.19 | ||
| Net realized and unrealized gains (losses) | (0.17 | ) | |
| Total from investment operations | 0.02 | ||
| Less distributions from net investment income | (0.24 | ) | |
| Net asset value, end of period | $ | 18.99 | |
| Total returnd | 0.11 | % | |
| Ratios to average net assetse | |||
| Expensesf | 0.51 | % | |
| Net investment income | 1.60 | % | |
| Supplemental data | |||
| Net assets, end of period (000’s) | $ | 3,093 | |
| Portfolio turnover rate | 23.05 | % | |
aFor the period March 4, 2014 (effective date) to October 31, 2014.
bThe amount shown for a share outstanding throughout the period may not correlate with the Statement of Operations for the period due to the timing of sales and
repurchases of the Fund shares in relation to income earned and/or fluctuating fair value of the investments of the Fund.
cBased on average daily shares outstanding.
dTotal return is not annualized for periods less than one year.
eRatios are annualized for periods less than one year.
fBenefit of waiver and payments by affiliates and expense reduction rounds to less than 0.01%.
56 | Annual Report | The accompanying notes are an integral part of these financial statements. franklintempleton.com
| FRANKLIN INVESTORS SECURITIES TRUST | |||||||||||||||
| FINANCIAL HIGHLIGHTS | |||||||||||||||
| Franklin Convertible Securities Fund (continued) | |||||||||||||||
| Year Ended October 31, | |||||||||||||||
| 2014 | 2013 | 2012 | 2011 | 2010 | |||||||||||
| Advisor Class | |||||||||||||||
| Per share operating performance | |||||||||||||||
| (for a share outstanding throughout the year) | |||||||||||||||
| Net asset value, beginning of year | $ | 17.83 | $ | 14.94 | $ | 14.38 | $ | 14.56 | $ | 12.29 | |||||
| Income from investment operationsa: | |||||||||||||||
| Net investment incomeb | 0.28 | 0.41 | 0.45 | 0.47 | 0.41 | ||||||||||
| Net realized and unrealized gains (losses) | 1.32 | 2.99 | 0.66 | (0.08 | ) | 2.41 | |||||||||
| Total from investment operations | 1.60 | 3.40 | 1.11 | 0.39 | 2.82 | ||||||||||
| Less distributions from: | |||||||||||||||
| Net investment income | (0.38 | ) | (0.51 | ) | (0.55 | ) | (0.57 | ) | (0.55 | ) | |||||
| Net realized gains | (0.07 | ) | — | — | — | — | |||||||||
| Total distributions | (0.45 | ) | (0.51 | ) | (0.55 | ) | (0.57 | ) | (0.55 | ) | |||||
| Net asset value, end of year | $ | 18.98 | $ | 17.83 | $ | 14.94 | $ | 14.38 | $ | 14.56 | |||||
| Total return | 9.13 | % | 23.21 | % | 7.93 | % | 2.60 | % | 23.45 | % | |||||
| Ratios to average net assets | |||||||||||||||
| Expenses | 0.63 | %c,d | 0.63 | %d | 0.65 | % | 0.63 | % | 0.65 | % | |||||
| Net investment income | 1.48 | % | 2.50 | % | 3.09 | % | 3.02 | % | 3.03 | % | |||||
| Supplemental data | |||||||||||||||
| Net assets, end of year (000’s) | $ | 877,190 | $ | 387,528 | $ | 196,765 | $ | 181,611 | $ | 68,526 | |||||
| Portfolio turnover rate | 23.05 | % | 34.69 | % | 12.82 | % | 23.24 | % | 29.56 | % | |||||
aThe amount shown for a share outstanding throughout the period may not correlate with the Statement of Operations for the period due to the timing of sales and
repurchases of the Fund shares in relation to income earned and/or fluctuating fair value of the investments of the Fund.
bBased on average daily shares outstanding.
cBenefit of waiver and payments by affiliates rounds to less than 0.01%.
dBenefit of expense reduction rounds to less than 0.01%.
franklintempleton.com The accompanying notes are an integral part of these financial statements. | Annual Report | 57
| FRANKLIN INVESTORS SECURITIES TRUST | ||||
| Statement of Investments, October 31, 2014 | ||||
| Franklin Convertible Securities Fund | ||||
| Country | Shares | Value | ||
| Common Stocks 1.6% | ||||
| Consumer Discretionary 0.6% | ||||
| General Motors Co. | United States | 404,132 | $ | 12,689,745 |
| Financials 1.0% | ||||
| aAffiliated Managers Group Inc. | United States | 55,553 | 11,098,934 | |
| MetLife Inc. | United States | 191,281 | 10,375,081 | |
| 21,474,015 | ||||
| Total Common Stocks (Cost $34,095,237) | 34,163,760 | |||
| Convertible Preferred Stocks 18.5% | ||||
| Consumer Staples 2.9% | ||||
| Post Holdings Inc., 5.25%, cvt. pfd. | United States | 95,200 | 8,046,999 | |
| bPost Holdings Inc., 2.50%, cvt. pfd., 144A | United States | 176,200 | 13,732,587 | |
| Tyson Foods Inc., 4.75%, cvt. pfd. | United States | 800,000 | 40,128,000 | |
| 61,907,586 | ||||
| Energy 4.0% | ||||
| bChesapeake Energy Corp., 5.75%, cvt. pfd., 144A | United States | 18,500 | 20,153,438 | |
| McDermott International Inc., 6.25%, cvt. pfd. | United States | 960,000 | 15,600,000 | |
| Rex Energy Corp., 6.00%, cvt. pfd., A | United States | 250,000 | 18,937,075 | |
| Sanchez Energy Corp., 6.50%, cvt. pfd., B | United States | 236,000 | 12,165,800 | |
| SandRidge Energy Inc., 7.00%, cvt. pfd. | United States | 200,000 | 16,926,000 | |
| 83,782,313 | ||||
| Financials 0.7% | ||||
| Wintrust Financial Corp., 5.00%, cvt. pfd. | United States | 12,300 | 15,416,512 | |
| Industrials 3.4% | ||||
| Stanley Black & Decker Inc., 4.75%, cvt. pfd. | United States | 297,600 | 39,771,264 | |
| United Technologies Corp., 7.50%, cvt. pfd. | United States | 570,100 | 33,276,737 | |
| 73,048,001 | ||||
| Materials 2.6% | ||||
| aAlcoa Inc., 5.38%, cvt. pfd. | United States | 750,000 | 39,075,000 | |
| ArcelorMittal, 6.00%, cvt. pfd. | Luxembourg | 395,000 | 8,097,500 | |
| Cliffs Natural Resources Inc., 7.00%, cvt. pfd. | United States | 792,000 | 8,316,000 | |
| 55,488,500 | ||||
| Utilities 4.9% | ||||
| Dominion Resources Inc., 6.00%, cvt. pfd., B | United States | 310,000 | 17,685,500 | |
| Dominion Resources Inc., 6.125%, cvt. pfd., A | United States | 220,000 | 12,513,600 | |
| Dominion Resources Inc., 6.375%, cvt. pfd., A | United States | 185,200 | 9,324,820 | |
| Exelon Corp., 6.50%, cvt. pfd. | United States | 500,000 | 26,340,000 | |
| The Laclede Group Inc., 6.75%, cvt. pfd. | United States | 60,000 | 3,330,000 | |
| NextEra Energy Inc., 5.599%, cvt. pfd. | United States | 400,000 | 26,242,000 | |
| NextEra Energy Inc., 5.799%, cvt. pfd. | United States | 164,000 | 9,093,800 | |
| 104,529,720 | ||||
| Total Convertible Preferred Stocks (Cost $405,215,282) | 394,172,632 | |||
58 | Annual Report franklintempleton.com
FRANKLIN INVESTORS SECURITIES TRUST
STATEMENT OF INVESTMENTS
| Franklin Convertible Securities Fund (continued) | ||||
| Principal | ||||
| Country | Amount* | Value | ||
| Convertible Bonds 77.7% | ||||
| Consumer Discretionary 14.1% | ||||
| Ctrip.com International Ltd., cvt., senior note, 1.25%, 10/15/18 | China | 19,200,000 | $ | 20,205,312 |
| bHomeAway Inc., cvt., senior note, 144A, 0.125%, 4/01/19 | United States | 36,500,000 | 35,473,438 | |
| Iconix Brand Group Inc., cvt., senior sub. note, 2.50%, 6/01/16 | United States | 30,190,000 | 40,643,287 | |
| bJarden Corp., cvt., sub. bond, 144A, 1.125%, 3/15/34 | United States | 40,000,000 | 42,950,000 | |
| Liberty Interactive LLC, cvt., senior note, 0.75%, 3/30/43 | United States | 17,250,000 | 23,783,438 | |
| Liberty Interactive LLC into Motorola Solutions Inc., cvt., senior deb., 3.50%, | ||||
| 1/15/31 | United States | 8,000,000 | 4,340,000 | |
| bLiberty Media Corp., cvt., senior note, 144A, 1.375%, 10/15/23 | United States | 21,200,000 | 21,186,750 | |
| MGM Resorts International, cvt., senior note, 4.25%, 4/15/15 | United States | 29,000,000 | 37,265,000 | |
| The Priceline Group Inc., cvt., senior note, 0.35%, 6/15/20 | United States | 35,000,000 | 39,856,250 | |
| Shutterfly Inc., cvt., 0.25%, 5/15/18 | United States | 37,465,000 | 36,317,634 | |
| 302,021,109 | ||||
| Energy 1.6% | ||||
| Cobalt International Energy Inc., cvt., | ||||
| senior bond, 3.125%, 5/15/24 | United States | 25,000,000 | 19,703,125 | |
| senior note, 2.625%, 12/01/19 | United States | 19,900,000 | 14,813,063 | |
| 34,516,188 | ||||
| Financials 2.6% | ||||
| Forest City Enterprises Inc., cvt., | ||||
| A, senior note, 3.625%, 8/15/20 | United States | 20,250,000 | 21,515,625 | |
| senior note, 4.25%, 8/15/18 | United States | 20,000,000 | 22,625,000 | |
| cMF Global Holdings Ltd., cvt., senior note, 1.875%, 2/01/16 | United States | 25,000,000 | 10,500,000 | |
| 54,640,625 | ||||
| Health Care 17.4% | ||||
| BioMarin Pharmaceutical Inc., cvt., senior sub. note, | ||||
| 0.75%, 10/15/18 | United States | 6,000,000 | 6,933,750 | |
| 1.50%, 10/15/20 | United States | 35,700,000 | 42,148,312 | |
| Brookdale Senior Living Inc., cvt., senior note, 2.75%, 6/15/18 | United States | 26,200,000 | 34,338,375 | |
| Corsicanto Ltd., cvt., senior bond, 3.50%, 1/15/32 | Ireland | 12,500,000 | 7,562,500 | |
| Depomed Inc., cvt., senior note, 2.50%, 9/01/21 | United States | 16,000,000 | 17,070,000 | |
| Fluidigm Corp., cvt., senior bond, 2.75%, 2/01/34 | United States | 14,418,000 | 13,363,684 | |
| HeartWare International Inc., cvt., senior note, 3.50%, 12/15/17 | United States | 10,000,000 | 10,681,250 | |
| bIllumina Inc., senior bond, 144A, cvt., 0.50%, 6/15/21 | United States | 33,000,000 | 38,094,375 | |
| bJazz Investments I Ltd., cvt., senior note, 144A, 1.875%, 8/15/21 | United States | 35,000,000 | 40,576,550 | |
| Mylan Inc., cvt., senior note, 3.75%, 9/15/15 | United States | 9,500,000 | 38,237,500 | |
| Omnicare Inc., cvt., senior sub. note, 3.50%, 2/15/44 | United States | 36,563,000 | 41,704,672 | |
| Pacira Pharmaceuticals Inc., cvt., senior note, 3.25%, 2/01/19 | United States | 5,880,000 | 22,035,300 | |
| Salix Pharmaceuticals Ltd., cvt., senior note, 2.75%, 5/15/15 | United States | 12,000,000 | 37,125,000 | |
| Spectranetics Corp., cvt., senior note, 2.625%, 6/01/34 | United States | 17,000,000 | 20,984,375 | |
| 370,855,643 | ||||
| Industrials 2.2% | ||||
| The KEYW Holding Corp., cvt., senior note, 2.50%, 7/15/19 | United States | 20,000,000 | 17,825,000 | |
| bUTI Worldwide Inc., cvt., senior note, 144A, 4.50%, 3/01/19 | United States | 28,000,000 | 30,187,500 | |
| 48,012,500 | ||||
franklintempleton.com Annual Report | 59
| FRANKLIN INVESTORS SECURITIES TRUST | ||||
| STATEMENT OF INVESTMENTS | ||||
| Franklin Convertible Securities Fund (continued) | ||||
| Principal | ||||
| Country | Amount* | Value | ||
| Convertible Bonds (continued) | ||||
| Information Technology 37.2% | ||||
| c,dBearingPoint Liquidating Trust | United States | 14,000,000 | $ | — |
| Bottomline Technologies Inc., cvt., senior note, 1.50%, 12/01/17 | United States | 16,400,000 | 17,445,500 | |
| bConcur Technologies Inc., cvt., senior note, 144A, 2.50%, 4/15/15 | United States | 3,900,000 | 9,559,875 | |
| Electronic Arts Inc., cvt., senior note, 0.75%, 7/15/16 | United States | 34,600,000 | 46,947,875 | |
| bElectronics for Imaging Inc., cvt., senior note, 144A, 0.75%, 9/01/19 | United States | 22,000,000 | 23,301,520 | |
| Intel Corp., cvt., | ||||
| junior sub., 3.25%, 8/01/39 | United States | 8,000,000 | 13,285,040 | |
| bjunior sub. bond, 144A, 2.95%, 12/15/35 | United States | 19,000,000 | 24,343,750 | |
| junior sub. deb., 2.95%, 12/15/35 | United States | 2,000,000 | 2,562,500 | |
| JDS Uniphase Corp., senior bond, cvt., 0.625%, 8/15/33 | United States | 39,900,000 | 41,097,000 | |
| bMercadoLibre Inc., cvt., senior note, 144A, 2.25%, 7/01/19 | Argentina | 5,000,000 | 6,250,000 | |
| bMicrochip Technology Inc., cvt., junior sub. note, 144A, 2.125%, 12/15/37 | United States | 20,000,000 | 34,087,500 | |
| Micron Technology Inc., cvt., senior bond, 2.125%, 2/15/33 | United States | 19,800,000 | 60,179,625 | |
| NetSuite Inc., cvt., senior note, 0.25%, 6/01/18 | United States | 36,300,000 | 41,382,000 | |
| Novellus Systems Inc., cvt., senior note, 2.625%, 5/15/41 | United States | 22,600,000 | 51,090,125 | |
| bPalo Alto Networks Inc., cvt., senior note, 144A, zero cpn., 7/01/19 | United States | 32,500,000 | 38,228,125 | |
| bProofpoint Inc., cvt., senior note, 144A, 1.25%, 12/15/18 | United States | 18,075,000 | 23,621,766 | |
| bQihoo 360 Technologies Co. Ltd., cvt., senior note, 144A, 1.75%, 8/15/21 | China | 24,000,000 | 21,975,000 | |
| Salesforce.com Inc., cvt., senior note, 0.25%, 4/01/18 | United States | 35,200,000 | 41,646,000 | |
| SanDisk Corp., cvt., senior note, 0.50%, 10/15/20 | United States | 33,000,000 | 39,022,500 | |
| bServiceNow Inc., cvt., senior note, 144A, zero cpn., 11/01/18 | United States | 31,500,000 | 35,929,687 | |
| bSunpower Corp., cvt., senior note, 144A, 0.875%, 6/01/21 | United States | 6,000,000 | 6,123,750 | |
| Take-Two Interactive Software Inc., cvt., senior note, 1.00%, 7/01/18 | United States | 16,400,000 | 22,099,000 | |
| bTrulia Inc., cvt., senior note, 144A, 2.75%, 12/15/20 | United States | 32,000,000 | 46,640,000 | |
| bTwitter Inc., cvt., senior note, 144A, 1.00%, 9/15/21 | United States | 35,000,000 | 31,871,875 | |
| bVeriSign Inc., cvt., junior sub. bond, 144A, 3.25%, 8/15/37 | United States | 14,000,000 | 25,173,750 | |
| Xilinx Inc., cvt., senior note, 2.625%, 6/15/17 | United States | 19,270,000 | 30,277,988 | |
| bYahoo! Inc., cvt., 144A, zero cpn., 12/01/18 | United States | 35,100,000 | 37,929,937 | |
| bYandex NV, cvt., senior note, 144A, 1.125%, 12/15/18 | Russia | 23,900,000 | 21,958,125 | |
| 794,029,813 | ||||
| Materials 2.6% | ||||
| B2Gold Corp., cvt., senior sub. note, 3.25%, 10/01/18 | Canada | 15,400,000 | 13,676,740 | |
| Cemex SAB de CV, cvt., sub. note, 3.75%, 3/15/18 | Mexico | 24,000,000 | 33,526,800 | |
| Kaiser Aluminum Corp., cvt., senior note, 4.50%, 4/01/15 | United States | 4,000,000 | 5,847,600 | |
| Molycorp Inc., cvt., senior note, 5.50%, 2/01/18 | United States | 7,360,000 | 2,649,600 | |
| 55,700,740 | ||||
| Total Convertible Bonds (Cost $1,389,227,640) | 1,659,776,618 | |||
| Shares | ||||
| Escrows and Litigation Trusts (Cost $22,362) 0.0%† | ||||
| aMotors Liquidation Co., Escrow Account, cvt. pfd., D | United States | 376,200 | 3,762 | |
| Total Investments before Short Term Investments | ||||
| (Cost $1,828,560,521) | 2,088,116,772 | |||
60 | Annual Report
franklintempleton.com
FRANKLIN INVESTORS SECURITIES TRUST
STATEMENT OF INVESTMENTS
| Franklin Convertible Securities Fund (continued) | ||||
| Country | Shares | Value | ||
| Short Term Investments (Cost $39,603,650) 1.9% | ||||
| Money Market Funds 1.9% | ||||
| a,eInstitutional Fiduciary Trust Money Market Portfolio | United States | 39,603,650 | $ | 39,603,650 |
| Total Investments (Cost $1,868,164,171) 99.7% | 2,127,720,422 | |||
| Other Assets, less Liabilities 0.3% | 6,730,039 | |||
| Net Assets 100.0% | $ | 2,134,450,461 | ||
See Abbreviations on page 102.
*The principal amount is stated in U.S. dollars unless otherwise indicated.
†Rounds to less than 0.1% of net assets.
aNon-income producing.
bSecurity was purchased pursuant to Rule 144A under the Securities Act of 1933 and may be sold in transactions exempt from registration only to qualified institutional buyers
or in a public offering registered under the Securities Act of 1933. These securities have been deemed liquid under guidelines approved by the Trust’s Board of Trustees. At
October 31, 2014, the aggregate value of these securities was $629,349,298, representing 29.49% of net assets.
cSee Note 7 regarding defaulted securities.
dSee Note 8 regarding restricted securities.
eSee Note 3(f) regarding investments in Institutional Fiduciary Trust Money Market Portfolio.
franklintempleton.com The accompanying notes are an integral part of these financial statements. | Annual Report | 61
| FRANKLIN INVESTORS SECURITIES TRUST | |||||||||||||||
| Financial Highlights | |||||||||||||||
| Franklin Equity Income Fund | |||||||||||||||
| Year Ended October 31, | |||||||||||||||
| 2014 | 2013 | 2012 | 2011 | 2010 | |||||||||||
| Class A | |||||||||||||||
| Per share operating performance | |||||||||||||||
| (for a share outstanding throughout the year) | |||||||||||||||
| Net asset value, beginning of year | $ | 22.16 | $ | 18.01 | $ | 16.58 | $ | 15.93 | $ | 14.06 | |||||
| Income from investment operationsa: | |||||||||||||||
| Net investment incomeb | 0.66 | c | 0.44 | 0.41 | 0.41 | 0.44 | |||||||||
| Net realized and unrealized gains (losses) | 1.73 | 4.19 | 1.46 | 0.75 | 1.85 | ||||||||||
| Total from investment operations | 2.39 | 4.63 | 1.87 | 1.16 | 2.29 | ||||||||||
| Less distributions from: | |||||||||||||||
| Net investment income | (0.50 | ) | (0.48 | ) | (0.44 | ) | (0.51 | ) | (0.42 | ) | |||||
| Net realized gains | (0.12 | ) | — | — | — | — | |||||||||
| Total distributions | (0.62 | ) | (0.48 | ) | (0.44 | ) | (0.51 | ) | (0.42 | ) | |||||
| Net asset value, end of year | $ | 23.93 | $ | 22.16 | $ | 18.01 | $ | 16.58 | $ | 15.93 | |||||
| Total returnd | 10.99 | % | 26.07 | % | 11.43 | % | 7.27 | % | 16.48 | % | |||||
| Ratios to average net assets | |||||||||||||||
| Expenses | 0.87 | %e,f | 0.91 | %f | 0.95 | % | 0.96 | % | 0.98 | %f | |||||
| Net investment income | 2.87 | %c | 2.19 | % | 2.36 | % | 2.48 | % | 2.96 | % | |||||
| Supplemental data | |||||||||||||||
| Net assets, end of year (000’s) | $ | 1,762,318 | $ | 1,637,089 | $ | 1,305,791 | $ | 1,105,132 | $ | 799,585 | |||||
| Portfolio turnover rate | 20.15 | % | 33.18 | % | 19.71 | % | 19.45 | % | 11.35 | % | |||||
aThe amount shown for a share outstanding throughout the period may not correlate with the Statement of Operations for the period due to the timing of sales and
repurchases of the Fund shares in relation to income earned and/or fluctuating fair value of the investments of the Fund.
bBased on average daily shares outstanding.
cNet investment income per share includes approximately $0.17 per share received in the form of a special dividend paid in connection with certain Fund holdings.
Excluding this amount, the ratio of net investment income to average net assets would have been 2.15%.
dTotal return does not reflect sales commissions or contingent deferred sales charges, if applicable.
eBenefit of waiver and payments by affiliates rounds to less than 0.01%.
f Benefit of expense reduction rounds to less than 0.01%.
62 | Annual Report | The accompanying notes are an integral part of these financial statements. franklintempleton.com
FRANKLIN INVESTORS SECURITIES TRUST
FINANCIAL HIGHLIGHTS
| Franklin Equity Income Fund (continued) | |||||||||||||||
| Year Ended October 31, | |||||||||||||||
| 2014 | 2013 | 2012 | 2011 | 2010 | |||||||||||
| Class C | |||||||||||||||
| Per share operating performance | |||||||||||||||
| (for a share outstanding throughout the year) | |||||||||||||||
| Net asset value, beginning of year | $ | 22.04 | $ | 17.91 | $ | 16.50 | $ | 15.85 | $ | 14.00 | |||||
| Income from investment operationsa: | |||||||||||||||
| Net investment incomeb | 0.49 | c | 0.28 | 0.28 | 0.29 | 0.33 | |||||||||
| Net realized and unrealized gains (losses) | 1.71 | 4.18 | 1.45 | 0.74 | 1.82 | ||||||||||
| Total from investment operations | 2.20 | 4.46 | 1.73 | 1.03 | 2.15 | ||||||||||
| Less distributions from: | |||||||||||||||
| Net investment income | (0.33 | ) | (0.33 | ) | (0.32 | ) | (0.38 | ) | (0.30 | ) | |||||
| Net realized gains | (0.12 | ) | — | — | — | — | |||||||||
| Total distributions | (0.45 | ) | (0.33 | ) | (0.32 | ) | (0.38 | ) | (0.30 | ) | |||||
| Net asset value, end of year | $ | 23.79 | $ | 22.04 | $ | 17.91 | $ | 16.50 | $ | 15.85 | |||||
| Total returnd | 10.14 | % | 25.18 | % | 10.56 | % | 6.44 | % | 15.59 | % | |||||
| Ratios to average net assets | |||||||||||||||
| Expenses | 1.62 | %e,f | 1.66 | %f | 1.70 | % | 1.71 | % | 1.73 | %f | |||||
| Net investment income | 2.12 | %c | 1.44 | % | 1.61 | % | 1.73 | % | 2.21 | % | |||||
| Supplemental data | |||||||||||||||
| Net assets, end of year (000’s) | $ | 241,566 | $ | 208,325 | $ | 134,746 | $ | 118,686 | $ | 97,305 | |||||
| Portfolio turnover rate | 20.15 | % | 33.18 | % | 19.71 | % | 19.45 | % | 11.35 | % | |||||
aThe amount shown for a share outstanding throughout the period may not correlate with the Statement of Operations for the period due to the timing of sales and
repurchases of the Fund shares in relation to income earned and/or fluctuating fair value of the investments of the Fund.
bBased on average daily shares outstanding.
cNet investment income per share includes approximately $0.17 per share received in the form of a special dividend paid in connection with certain Fund holdings.
Excluding this amount, the ratio of net investment income to average net assets would have been 1.40%.
dTotal return does not reflect sales commissions or contingent deferred sales charges, if applicable.
eBenefit of waiver and payments by affiliates rounds to less than 0.01%.
f Benefit of expense reduction rounds to less than 0.01%.
franklintempleton.com The accompanying notes are an integral part of these financial statements. | Annual Report | 63
| FRANKLIN INVESTORS SECURITIES TRUST | |||||||||||||||
| FINANCIAL HIGHLIGHTS | |||||||||||||||
| Franklin Equity Income Fund (continued) | |||||||||||||||
| Year Ended October 31, | |||||||||||||||
| 2014 | 2013 | 2012 | 2011 | 2010 | |||||||||||
| Class R | |||||||||||||||
| Per share operating performance | |||||||||||||||
| (for a share outstanding throughout the year) | |||||||||||||||
| Net asset value, beginning of year | $ | 22.17 | $ | 18.01 | $ | 16.58 | $ | 15.93 | $ | 14.07 | |||||
| Income from investment operationsa: | |||||||||||||||
| Net investment incomeb | 0.61 | c | 0.39 | 0.37 | 0.38 | 0.41 | |||||||||
| Net realized and unrealized gains (losses) | 1.72 | 4.20 | 1.46 | 0.73 | 1.83 | ||||||||||
| Total from investment operations | 2.33 | 4.59 | 1.83 | 1.11 | 2.24 | ||||||||||
| Less distributions from: | |||||||||||||||
| Net investment income | (0.45 | ) | (0.43 | ) | (0.40 | ) | (0.46 | ) | (0.38 | ) | |||||
| Net realized gains | (0.12 | ) | — | — | — | — | |||||||||
| Total distributions | (0.57 | ) | (0.43 | ) | (0.40 | ) | (0.46 | ) | (0.38 | ) | |||||
| Net asset value, end of year | $ | 23.93 | $ | 22.17 | $ | 18.01 | $ | 16.58 | $ | 15.93 | |||||
| Total return | 10.67 | % | 25.81 | % | 11.16 | % | 7.00 | % | 16.09 | % | |||||
| Ratios to average net assets | |||||||||||||||
| Expenses | 1.12 | %d,e | 1.16 | %e | 1.20 | % | 1.21 | % | 1.23 | %e | |||||
| Net investment income | 2.62 | %c | 1.94 | % | 2.11 | % | 2.23 | % | 2.71 | % | |||||
| Supplemental data | |||||||||||||||
| Net assets, end of year (000’s) | $ | 7,305 | $ | 5,844 | $ | 4,940 | $ | 3,830 | $ | 3,589 | |||||
| Portfolio turnover rate | 20.15 | % | 33.18 | % | 19.71 | % | 19.45 | % | 11.35 | % | |||||
aThe amount shown for a share outstanding throughout the period may not correlate with the Statement of Operations for the period due to the timing of sales and
repurchases of the Fund shares in relation to income earned and/or fluctuating fair value of the investments of the Fund.
bBased on average daily shares outstanding.
cNet investment income per share includes approximately $0.17 per share received in the form of a special dividend paid in connection with certain Fund holdings.
Excluding this amount, the ratio of net investment income to average net assets would have been 1.90%.
dBenefit of waiver and payments by affiliates rounds to less than 0.01%.
eBenefit of expense reduction rounds to less than 0.01%.
64 | Annual Report | The accompanying notes are an integral part of these financial statements. franklintempleton.com
FRANKLIN INVESTORS SECURITIES TRUST
FINANCIAL HIGHLIGHTS
| Franklin Equity Income Fund (continued) | ||||||
| Year Ended | ||||||
| October 31, | ||||||
| 2014 | 2013 | a | ||||
| Class R6 | ||||||
| Per share operating performance | ||||||
| (for a share outstanding throughout the year) | ||||||
| Net asset value, beginning of year | $ | 22.18 | $ | 20.00 | ||
| Income from investment operationsb: | ||||||
| Net investment incomec | 0.75 | d | 0.26 | |||
| Net realized and unrealized gains (losses) | 1.73 | 2.18 | ||||
| Total from investment operations | 2.48 | 2.44 | ||||
| Less distributions from: | ||||||
| Net investment income | (0.59 | ) | (0.26 | ) | ||
| Net realized gains | (0.12 | ) | — | |||
| Total distributions | (0.71 | ) | (0.26 | ) | ||
| Net asset value, end of year | $ | 23.95 | $ | 22.18 | ||
| Total returne | 11.38 | % | 12.30 | % | ||
| Ratios to average net assetsf | ||||||
| Expenses before waiver and payments by affiliates | 1.78 | % | 2.16 | % | ||
| Expenses net of waiver and payments by affiliatesg | 0.50 | % | 0.51 | % | ||
| Net investment income | 3.24 | %d | 2.59 | % | ||
| Supplemental data | ||||||
| Net assets, end of year (000’s) | $ | 6 | $ | 6 | ||
| Portfolio turnover rate | 20.15 | % | 33.18 | % | ||
aFor the period May 1, 2013 (effective date) to October 31, 2013.
bThe amount shown for a share outstanding throughout the period may not correlate with the Statement of Operations for the period due to the timing of sales and
repurchases of the Fund shares in relation to income earned and/or fluctuating fair value of the investments of the Fund.
cBased on average daily shares outstanding.
dNet investment income per share includes approximately $0.17 per share received in the form of a special dividend paid in connection with certain Fund holdings.
Excluding this amount, the ratio of net investment income to average net assets would have been 2.51%.
eTotal return is not annualized for periods less than one year.
f Ratios are annualized for periods less than one year.
gBenefit of expense reduction rounds to less than 0.01%.
franklintempleton.com The accompanying notes are an integral part of these financial statements. | Annual Report | 65
| FRANKLIN INVESTORS SECURITIES TRUST | |||||||||||||||
| FINANCIAL HIGHLIGHTS | |||||||||||||||
| Franklin Equity Income Fund (continued) | |||||||||||||||
| Year Ended October 31, | |||||||||||||||
| 2014 | 2013 | 2012 | 2011 | 2010 | |||||||||||
| Advisor Class | |||||||||||||||
| Per share operating performance | |||||||||||||||
| (for a share outstanding throughout the year) | |||||||||||||||
| Net asset value, beginning of year | $ | 22.19 | $ | 18.02 | $ | 16.59 | $ | 15.94 | $ | 14.07 | |||||
| Income from investment operationsa: | |||||||||||||||
| Net investment incomeb | 0.71 | c | 0.48 | 0.45 | 0.45 | 0.48 | |||||||||
| Net realized and unrealized gains (losses) | 1.74 | 4.22 | 1.46 | 0.75 | 1.85 | ||||||||||
| Total from investment operations | 2.45 | 4.70 | 1.91 | 1.20 | 2.33 | ||||||||||
| Less distributions from: | |||||||||||||||
| Net investment income | (0.56 | ) | (0.53 | ) | (0.48 | ) | (0.55 | ) | (0.46 | ) | |||||
| Net realized gains | (0.12 | ) | — | — | — | — | |||||||||
| Total distributions | (0.68 | ) | (0.53 | ) | (0.48 | ) | (0.55 | ) | (0.46 | ) | |||||
| Net asset value, end of year | $ | 23.96 | $ | 22.19 | $ | 18.02 | $ | 16.59 | $ | 15.94 | |||||
| Total return | 11.25 | % | 26.48 | % | 11.69 | % | 7.54 | % | 16.76 | % | |||||
| Ratios to average net assets | |||||||||||||||
| Expenses | 0.62 | %d,e | 0.66 | %e | 0.70 | % | 0.71 | % | 0.73 | %e | |||||
| Net investment income | 3.12 | %c | 2.44 | % | 2.61 | % | 2.73 | % | 3.21 | % | |||||
| Supplemental data | |||||||||||||||
| Net assets, end of year (000’s) | $ | 30,166 | $ | 17,534 | $ | 10,527 | $ | 7,467 | $ | 4,183 | |||||
| Portfolio turnover rate | 20.15 | % | 33.18 | % | 19.71 | % | 19.45 | % | 11.35 | % | |||||
aThe amount shown for a share outstanding throughout the period may not correlate with the Statement of Operations for the period due to the timing of sales and
repurchases of the Fund shares in relation to income earned and/or fluctuating fair value of the investments of the Fund.
bBased on average daily shares outstanding.
cNet investment income per share includes approximately $0.17 per share received in the form of a special dividend paid in connection with certain Fund holdings.
Excluding this amount, the ratio of net investment income to average net assets would have been 2.40%.
dBenefit of waiver and payments by affiliates rounds to less than 0.01%.
eBenefit of expense reduction rounds to less than 0.01%.
66 | Annual Report | The accompanying notes are an integral part of these financial statements. franklintempleton.com
| FRANKLIN INVESTORS SECURITIES TRUST | ||||
| Statement of Investments, October 31, 2014 | ||||
| Franklin Equity Income Fund | ||||
| Country | Shares | Value | ||
| Common Stocks 92.7% | ||||
| Consumer Discretionary 15.1% | ||||
| Ford Motor Co. | United States | 2,440,200 | $ | 34,382,417 |
| General Motors Co. | United States | 231,564 | 7,271,110 | |
| L Brands Inc. | United States | 622,200 | 44,873,064 | |
| Lowe’s Cos. Inc. | United States | 600,000 | 34,320,000 | |
| McDonald’s Corp. | United States | 398,900 | 37,388,897 | |
| NIKE Inc., B | United States | 458,000 | 42,580,260 | |
| Starwood Hotels & Resorts Worldwide Inc. | United States | 515,200 | 39,495,232 | |
| Target Corp. | United States | 571,500 | 35,330,130 | |
| Wynn Resorts Ltd. | United States | 175,600 | 33,365,756 | |
| 309,006,866 | ||||
| Consumer Staples 7.6% | ||||
| Diageo PLC, ADR | United Kingdom | 284,000 | 33,503,480 | |
| Mead Johnson Nutrition Co., A | United States | 331,900 | 32,960,989 | |
| Nestle SA | Switzerland | 335,000 | 24,516,867 | |
| PepsiCo Inc. | United States | 448,900 | 43,170,713 | |
| The Procter & Gamble Co. | United States | 237,700 | 20,744,079 | |
| 154,896,128 | ||||
| Energy 6.7% | ||||
| BP PLC, ADR | United Kingdom | 391,271 | 17,004,638 | |
| Chevron Corp. | United States | 172,400 | 20,679,380 | |
| Exxon Mobil Corp. | United States | 367,234 | 35,515,200 | |
| HollyFrontier Corp. | United States | 600,000 | 27,228,000 | |
| Royal Dutch Shell PLC, A, ADR | United Kingdom | 512,000 | 36,756,480 | |
| 137,183,698 | ||||
| Financials 13.4% | ||||
| Aflac Inc. | United States | 536,200 | 32,027,226 | |
| Bank of America Corp. | United States | 974,700 | 16,725,852 | |
| BlackRock Inc. | United States | 129,700 | 44,241,967 | |
| JPMorgan Chase & Co. | United States | 691,500 | 41,821,920 | |
| Marsh & McLennan Cos. Inc. | United States | 497,700 | 27,059,949 | |
| MetLife Inc. | United States | 671,905 | 36,444,127 | |
| T. Rowe Price Group Inc. | United States | 450,500 | 36,981,545 | |
| Wells Fargo & Co. | United States | 725,000 | 38,490,250 | |
| 273,792,836 | ||||
| Health Care 9.4% | ||||
| Bristol-Myers Squibb Co. | United States | 298,700 | 17,381,353 | |
| Eli Lilly & Co. | United States | 566,400 | 37,569,312 | |
| Johnson & Johnson | United States | 332,000 | 35,782,960 | |
| Pfizer Inc. | United States | 979,300 | 29,330,035 | |
| Roche Holding AG | Switzerland | 139,000 | 40,994,127 | |
| Sanofi, ADR | France | 659,200 | 30,481,408 | |
| 191,539,195 | ||||
| Industrials 14.3% | ||||
| The Boeing Co. | United States | 218,200 | 27,255,362 | |
| Caterpillar Inc. | United States | 327,900 | 33,252,339 | |
| General Electric Co. | United States | 1,228,500 | 31,707,585 | |
| Honeywell International Inc. | United States | 393,800 | 37,852,056 | |
| Lockheed Martin Corp. | United States | 254,900 | 48,576,293 | |
| franklintempleton.com | Annual Report | 67 | |||
FRANKLIN INVESTORS SECURITIES TRUST
STATEMENT OF INVESTMENTS
| Franklin Equity Income Fund (continued) | ||||
| Country | Shares | Value | ||
| Common Stocks (continued) | ||||
| Industrials (continued) | ||||
| Republic Services Inc. | United States | 1,216,500 | $ | 46,713,600 |
| United Parcel Service Inc., B | United States | 306,600 | 32,165,406 | |
| United Technologies Corp. | United States | 329,700 | 35,277,900 | |
| 292,800,541 | ||||
| Information Technology 12.6% | ||||
| CA Inc. | United States | 1,144,700 | 33,264,982 | |
| Cisco Systems Inc. | United States | 1,665,333 | 40,750,698 | |
| Intel Corp. | United States | 1,336,100 | 45,440,761 | |
| Maxim Integrated Products Inc. | United States | 1,226,000 | 35,970,840 | |
| Microsoft Corp. | United States | 1,034,100 | 48,550,995 | |
| Paychex Inc. | United States | 365,900 | 17,175,346 | |
| Seagate Technology PLC | United States | 585,200 | 36,768,116 | |
| 257,921,738 | ||||
| Materials 5.4% | ||||
| BHP Billiton PLC | Australia | 842,500 | 21,707,505 | |
| The Dow Chemical Co. | United States | 814,400 | 40,231,360 | |
| Freeport-McMoRan Inc., B | United States | 633,906 | 18,066,321 | |
| Potash Corp. of Saskatchewan Inc. | Canada | 858,600 | 29,338,362 | |
| 109,343,548 | ||||
| Telecommunication Services 2.0% | ||||
| Verizon Communications Inc. | United States | 810,271 | 40,716,118 | |
| Utilities 6.2% | ||||
| Dominion Resources Inc. | United States | 391,100 | 27,885,430 | |
| Duke Energy Corp. | United States | 419,690 | 34,477,533 | |
| PG&E Corp. | United States | 809,900 | 40,754,168 | |
| Xcel Energy Inc. | United States | 673,500 | 22,542,045 | |
| 125,659,176 | ||||
| Total Common Stocks (Cost $1,452,890,480) | 1,892,859,844 | |||
| aEquity-Linked Securities (Cost $34,171,000) 1.5% | ||||
| Consumer Discretionary 1.5% | ||||
| bBarclays Bank PLC into Amazon.com Inc., 3.00%, 144A | United States | 100,000 | 30,832,500 | |
| Convertible Preferred Stocks 5.4% | ||||
| Energy 0.9% | ||||
| bChesapeake Energy Corp., 5.75%, cvt. pfd., 144A | United States | 16,000 | 17,430,000 | |
| Financials 1.0% | ||||
| Bank of America Corp., 7.25%, cvt. pfd., L | United States | 18,000 | 20,577,780 | |
| Industrials 2.0% | ||||
| Genesee & Wyoming Inc., 5.00%, cvt. pfd. | United States | 68,800 | 8,519,504 | |
| Stanley Black & Decker Inc., 6.25%, cvt., pfd. | United States | 279,000 | 32,372,370 | |
| 40,891,874 |
68 | Annual Report
franklintempleton.com
FRANKLIN INVESTORS SECURITIES TRUST
STATEMENT OF INVESTMENTS
| Franklin Equity Income Fund (continued) | ||||
| Country | Shares | Value | ||
| Convertible Preferred Stocks (continued) | ||||
| Utilities 1.5% | ||||
| NextEra Energy Inc., 5.799%, cvt. pfd. | United States | 370,000 | $ | 20,516,500 |
| NextEra Energy Inc., 5.889%, cvt. pfd. | United States | 154,000 | 9,746,660 | |
| 30,263,160 | ||||
| Total Convertible Preferred Stocks (Cost $89,153,204) | 109,162,814 | |||
| Total Investments before Short Term Investments | ||||
| (Cost $1,576,214,684) | 2,032,855,158 | |||
| Short Term Investments (Cost $6,941,696) 0.3% | ||||
| Money Market Funds 0.3% | ||||
| c,dInstitutional Fiduciary Trust Money Market Portfolio | United States | 6,941,696 | 6,941,696 | |
| Total Investments (Cost $1,583,156,380) 99.9% | 2,039,796,854 | |||
| Other Assets, less Liabilities 0.1% | 1,563,930 | |||
| Net Assets 100.0% | $ | 2,041,360,784 |
See Abbreviations on page 102.
aSee Note 1(g) regarding equity-linked securities.
bSecurity was purchased pursuant to Rule 144A under the Securities Act of 1933 and may be sold in transactions exempt from registration only to qualified institutional buyers
or in a public offering registered under the Securities Act of 1933. These securities have been deemed liquid under guidelines approved by the Trust’s Board of Trustees. At
October 31, 2014, the aggregate value of these securities was $48,262,500, representing 2.36% of net assets.
cNon-income producing.
dSee Note 3(f) regarding investments in Institutional Fiduciary Trust Money Market Portfolio.
franklintempleton.com The accompanying notes are an integral part of these financial statements. | Annual Report | 69
| FRANKLIN INVESTORS SECURITIES TRUST | |||||||||||||||
| Financial Highlights | |||||||||||||||
| Franklin Real Return Fund | |||||||||||||||
| Year Ended October 31, | |||||||||||||||
| 2014 | 2013 | 2012 | 2011 | 2010 | |||||||||||
| Class A | |||||||||||||||
| Per share operating performance | |||||||||||||||
| (for a share outstanding throughout the year) | |||||||||||||||
| Net asset value, beginning of year | $ | 10.82 | $ | 10.94 | $ | 11.06 | $ | 11.14 | $ | 10.74 | |||||
| Income from investment operationsa: | |||||||||||||||
| Net investment incomeb | 0.14 | 0.15 | 0.17 | 0.31 | 0.17 | ||||||||||
| Net realized and unrealized gains (losses) | (0.06 | ) | (0.01 | ) | 0.01 | 0.03 | 0.47 | ||||||||
| Total from investment operations | 0.08 | 0.14 | 0.18 | 0.34 | 0.64 | ||||||||||
| Less distributions from net investment income and | |||||||||||||||
| net foreign currency gains | (0.24 | ) | (0.26 | ) | (0.30 | ) | (0.42 | ) | (0.24 | ) | |||||
| Net asset value, end of year | $ | 10.66 | $ | 10.82 | $ | 10.94 | $ | 11.06 | $ | 11.14 | |||||
| Total returnc | 0.75 | % | 1.34 | % | 1.67 | % | 3.03 | % | 6.07 | % | |||||
| Ratios to average net assets | |||||||||||||||
| Expenses before waiver and payments by affiliates | 1.10 | % | 1.08 | % | 1.06 | % | 1.05 | % | 1.07 | % | |||||
| Expenses net of waiver and payments by affiliates | 0.90 | %d | 0.90 | %d | 0.90 | % | 0.90 | % | 0.90 | %d | |||||
| Net investment income | 1.34 | % | 1.35 | % | 1.58 | % | 2.76 | % | 1.60 | % | |||||
| Supplemental data | |||||||||||||||
| Net assets, end of year (000’s) | $ | 248,313 | $ | 327,285 | $ | 411,419 | $ | 444,465 | $ | 388,239 | |||||
| Portfolio turnover rate | 33.02 | % | 27.91 | % | 18.64 | % | 37.60 | % | 20.08 | % | |||||
aThe amount shown for a share outstanding throughout the period may not correlate with the Statement of Operations for the period due to the timing of sales and
repurchases of the Fund shares in relation to income earned, adjustments to interest income for the inflation-indexed bonds, and/or fluctuating fair value of the investments
of the Fund.
bBased on average daily shares outstanding.
cTotal return does not reflect sales commissions or contingent deferred sales charges, if applicable.
dBenefit of expense reduction rounds to less than 0.01%.
70 | Annual Report | The accompanying notes are an integral part of these financial statements. franklintempleton.com
FRANKLIN INVESTORS SECURITIES TRUST
FINANCIAL HIGHLIGHTS
| Franklin Real Return Fund (continued) | |||||||||||||||
| Year Ended October 31, | |||||||||||||||
| 2014 | 2013 | 2012 | 2011 | 2010 | |||||||||||
| Class C | |||||||||||||||
| Per share operating performance | |||||||||||||||
| (for a share outstanding throughout the year) | |||||||||||||||
| Net asset value, beginning of year | $ | 10.76 | $ | 10.87 | $ | 11.00 | $ | 11.08 | $ | 10.69 | |||||
| Income from investment operationsa: | |||||||||||||||
| Net investment incomeb | 0.10 | 0.10 | 0.13 | 0.27 | 0.13 | ||||||||||
| Net realized and unrealized gains (losses) | (0.07 | ) | 0.01 | —c | 0.02 | 0.47 | |||||||||
| Total from investment operations | 0.03 | 0.11 | 0.13 | 0.29 | 0.60 | ||||||||||
| Less distributions from net investment income and | |||||||||||||||
| net foreign currency gains | (0.20 | ) | (0.22 | ) | (0.26 | ) | (0.37 | ) | (0.21 | ) | |||||
| Net asset value, end of year | $ | 10.59 | $ | 10.76 | $ | 10.87 | $ | 11.00 | $ | 11.08 | |||||
| Total returnd | 0.22 | % | 1.03 | % | 1.22 | % | 2.65 | % | 5.68 | % | |||||
| Ratios to average net assets | |||||||||||||||
| Expenses before waiver and payments by affiliates | 1.50 | % | 1.48 | % | 1.46 | % | 1.45 | % | 1.47 | % | |||||
| Expenses net of waiver and payments by affiliates | 1.30 | %e | 1.30 | %e | 1.30 | % | 1.30 | % | 1.30 | %e | |||||
| Net investment income | 0.94 | % | 0.95 | % | 1.18 | % | 2.36 | % | 1.20 | % | |||||
| Supplemental data | |||||||||||||||
| Net assets, end of year (000’s) | $ | 68,188 | $ | 83,666 | $ | 104,682 | $ | 115,126 | $ | 62,256 | |||||
| Portfolio turnover rate | 33.02 | % | 27.91 | % | 18.64 | % | 37.60 | % | 20.08 | % | |||||
aThe amount shown for a share outstanding throughout the period may not correlate with the Statement of Operations for the period due to the timing of sales and
repurchases of the Fund shares in relation to income earned, adjustments to interest income for the inflation-indexed bonds, and/or fluctuating fair value of the investments
of the Fund.
bBased on average daily shares outstanding.
cAmount rounds to less than $0.01 per share.
dTotal return does not reflect sales commissions or contingent deferred sales charges, if applicable.
eBenefit of expense reduction rounds to less than 0.01%.
franklintempleton.com The accompanying notes are an integral part of these financial statements. | Annual Report | 71
FRANKLIN INVESTORS SECURITIES TRUST
FINANCIAL HIGHLIGHTS
| Franklin Real Return Fund (continued) | ||||||
| Year Ended | ||||||
| October 31, | ||||||
| 2014 | 2013 | a | ||||
| Class R6 | ||||||
| Per share operating performance | ||||||
| (for a share outstanding throughout the year) | ||||||
| Net asset value, beginning of year | $ | 10.85 | $ | 11.01 | ||
| Income from investment operationsb: | ||||||
| Net investment incomec | 0.21 | 0.09 | ||||
| Net realized and unrealized gains (losses) | (0.10 | ) | (0.10 | ) | ||
| Total from investment operations | 0.11 | (0.01 | ) | |||
| Less distributions from net investment income | (0.28 | ) | (0.15 | ) | ||
| Net asset value, end of year | $ | 10.68 | $ | 10.85 | ||
| Total returnd | 1.04 | % | (0.06 | )% | ||
| Ratios to average net assetse | ||||||
| Expenses before waiver and payments by affiliates | 0.70 | % | 2.43 | % | ||
| Expenses net of waiver and payments by affiliatesf | 0.52 | % | 0.52 | % | ||
| Net investment income | 1.72 | % | 1.73 | % | ||
| Supplemental data | ||||||
| Net assets, end of year (000’s) | $ | 2,034 | $ | 5 | ||
| Portfolio turnover rate | 33.02 | % | 27.91 | % | ||
aFor the period May 1, 2013 (effective date) to October 31, 2013.
bThe amount shown for a share outstanding throughout the period may not correlate with the Statement of Operations for the period due to the timing of sales and
repurchases of the Fund shares in relation to income earned, adjustments to interest income for the inflation-indexed bonds, and/or fluctuating fair value of the investments
of the Fund.
cBased on average daily shares outstanding.
dTotal return is not annualized for periods less than one year.
eRatios are annualized for periods less than one year.
fBenefit of expense reduction rounds to less than 0.01%.
72 | Annual Report | The accompanying notes are an integral part of these financial statements. franklintempleton.com
FRANKLIN INVESTORS SECURITIES TRUST
FINANCIAL HIGHLIGHTS
| Franklin Real Return Fund (continued) | |||||||||||||||
| Year Ended October 31, | |||||||||||||||
| 2014 | 2013 | 2012 | 2011 | 2010 | |||||||||||
| Advisor Class | |||||||||||||||
| Per share operating performance | |||||||||||||||
| (for a share outstanding throughout the year) | |||||||||||||||
| Net asset value, beginning of year | $ | 10.85 | $ | 10.97 | $ | 11.08 | $ | 11.16 | $ | 10.78 | |||||
| Income from investment operationsa: | |||||||||||||||
| Net investment incomeb | 0.18 | 0.18 | 0.20 | 0.35 | 0.21 | ||||||||||
| Net realized and unrealized gains (losses) | (0.08 | ) | (0.01 | ) | 0.01 | 0.01 | 0.46 | ||||||||
| Total from investment operations | 0.10 | 0.17 | 0.21 | 0.36 | 0.67 | ||||||||||
| Less distributions from net investment income and | |||||||||||||||
| net foreign currency gains | (0.27 | ) | (0.29 | ) | (0.32 | ) | (0.44 | ) | (0.29 | ) | |||||
| Net asset value, end of year | $ | 10.68 | $ | 10.85 | $ | 10.97 | $ | 11.08 | $ | 11.16 | |||||
| Total return | 0.91 | % | 1.60 | % | 1.99 | % | 3.27 | % | 6.35 | % | |||||
| Ratios to average net assets | |||||||||||||||
| Expenses before waiver and payments by affiliates | 0.85 | % | 0.83 | % | 0.81 | % | 0.80 | % | 0.82 | % | |||||
| Expenses net of waiver and payments by affiliates | 0.65 | %c | 0.65 | %c | 0.65 | % | 0.65 | % | 0.65 | %c | |||||
| Net investment income | 1.59 | % | 1.60 | % | 1.83 | % | 3.01 | % | 1.85 | % | |||||
| Supplemental data | |||||||||||||||
| Net assets, end of year (000’s) | $ | 65,958 | $ | 28,042 | $ | 35,362 | $ | 45,575 | $ | 28,784 | |||||
| Portfolio turnover rate | 33.02 | % | 27.91 | % | 18.64 | % | 37.60 | % | 20.08 | % | |||||
aThe amount shown for a share outstanding throughout the period may not correlate with the Statement of Operations for the period due to the timing of sales and
repurchases of the Fund shares in relation to income earned, adjustments to interest income for the inflation-indexed bonds, and/or fluctuating fair value of the investments
of the Fund.
bBased on average daily shares outstanding.
cBenefit of expense reduction rounds to less than 0.01%.
franklintempleton.com The accompanying notes are an integral part of these financial statements. | Annual Report | 73
| FRANKLIN INVESTORS SECURITIES TRUST | ||||
| Statement of Investments, October 31, 2014 | ||||
| Franklin Real Return Fund | ||||
| Country | Shares | Value | ||
| Common Stocks and Other Equity Interests 16.2% | ||||
| Energy 4.8% | ||||
| Anadarko Petroleum Corp. | United States | 21,400 | $ | 1,964,092 |
| Chevron Corp. | United States | 18,300 | 2,195,085 | |
| Devon Energy Corp. | United States | 13,500 | 810,000 | |
| Exxon Mobil Corp. | United States | 26,777 | 2,589,604 | |
| Halliburton Co. | United States | 29,000 | 1,599,060 | |
| Marathon Oil Corp. | United States | 42,300 | 1,497,420 | |
| Noble Energy Inc. | United States | 11,800 | 680,034 | |
| Occidental Petroleum Corp. | United States | 16,500 | 1,467,345 | |
| Peabody Energy Corp. | United States | 62,400 | 650,832 | |
| Pioneer Natural Resources Co. | United States | 4,100 | 775,146 | |
| Schlumberger Ltd. | United States | 24,850 | 2,451,701 | |
| aSouthwestern Energy Co. | United States | 25,200 | 819,252 | |
| aWeatherford International PLC | United States | 61,500 | 1,009,830 | |
| 18,509,401 | ||||
| Materials 2.6% | ||||
| BHP Billiton Ltd., ADR | Australia | 19,100 | 1,135,304 | |
| The Dow Chemical Co. | United States | 38,100 | 1,882,140 | |
| Freeport-McMoRan Inc., B | United States | 55,046 | 1,568,811 | |
| Goldcorp Inc. | Canada | 104,000 | 1,953,120 | |
| Nucor Corp. | United States | 25,400 | 1,373,124 | |
| Potash Corp. of Saskatchewan Inc. | Canada | 37,700 | 1,288,209 | |
| Rio Tinto PLC, ADR | United Kingdom | 17,300 | 829,881 | |
| 10,030,589 | ||||
| Real Estate 8.8% | ||||
| SPDR Dow Jones REIT ETF | United States | 383,000 | 33,803,580 | |
| Total Common Stocks and Other Equity Interests | ||||
| (Cost $46,413,878) | 62,343,570 | |||
| Principal | ||||
| Amount* | ||||
| Corporate Bonds 6.1% | ||||
| Banks 0.3% | ||||
| bCIT Group Inc., secured note, 144A, 5.50%, 2/15/19 | United States | 1,200,000 | 1,284,000 | |
| Consumer Services 0.3% | ||||
| MGM Resorts International, senior note, | ||||
| 6.625%, 7/15/15 | United States | 300,000 | 308,610 | |
| 8.625%, 2/01/19 | United States | 500,000 | 581,250 | |
| 7.75%, 3/15/22 | United States | 200,000 | 231,000 | |
| 1,120,860 | ||||
| Diversified Financials 0.4% | ||||
| Ally Financial Inc., senior note, 7.50%, 9/15/20 | United States | 1,200,000 | 1,431,000 | |
| Energy 1.8% | ||||
| Chesapeake Energy Corp., senior note, | ||||
| 6.625%, 8/15/20 | United States | 1,000,000 | 1,132,500 | |
| 6.125%, 2/15/21 | United States | 200,000 | 223,000 | |
| CONSOL Energy Inc., senior note, | ||||
| 8.25%, 4/01/20 | United States | 100,000 | 105,875 | |
| 6.375%, 3/01/21 | United States | 400,000 | 416,000 | |
| b144A, 5.875%, 4/15/22 | United States | 300,000 | 305,625 | |
74 | Annual Report franklintempleton.com
FRANKLIN INVESTORS SECURITIES TRUST
STATEMENT OF INVESTMENTS
| Franklin Real Return Fund (continued) | ||||
| Principal | ||||
| Country | Amount* | Value | ||
| Corporate Bonds (continued) | ||||
| Energy (continued) | ||||
| Energy Transfer Equity LP, senior note, 7.50%, 10/15/20 | United States | 1,000,000 | $ | 1,155,000 |
| Linn Energy LLC/Finance Corp., senior note, 6.25%, 11/01/19 | United States | 1,000,000 | 925,000 | |
| Peabody Energy Corp., senior note, 6.25%, 11/15/21 | United States | 1,000,000 | 950,625 | |
| Sabine Pass Liquefaction LLC, first lien, 5.625%, 2/01/21 | United States | 1,000,000 | 1,052,500 | |
| Samson Investment Co., senior note, 9.75%, 2/15/20 | United States | 900,000 | 657,000 | |
| 6,923,125 | ||||
| Food, Beverage & Tobacco 0.2% | ||||
| Del Monte Corp., senior note, 7.625%, 2/15/19 | United States | 686,000 | 689,430 | |
| Health Care Equipment & Services 0.3% | ||||
| HCA Inc., senior secured note, 5.875%, 3/15/22 | United States | 1,200,000 | 1,320,000 | |
| Materials 1.0% | ||||
| ArcelorMittal, senior note, 6.75%, 2/25/22 | Luxembourg | 1,200,000 | 1,333,950 | |
| bFMG Resources (August 2006) Pty. Ltd., senior note, 144A, 6.875%, 2/01/18 | Australia | 355,556 | 364,000 | |
| Novelis Inc., senior note, | ||||
| 8.375%, 12/15/17 | Canada | 200,000 | 209,250 | |
| 8.75%, 12/15/20 | Canada | 600,000 | 657,750 | |
| Reynolds Group Issuer Inc./LLC/SA, senior note, 8.50%, 5/15/18 | United States | 1,200,000 | 1,249,500 | |
| 3,814,450 | ||||
| Media 0.3% | ||||
| CSC Holdings LLC, senior note, 6.75%, 11/15/21 | United States | 1,000,000 | 1,116,250 | |
| Pharmaceuticals, Biotechnology & Life Sciences 0.3% | ||||
| bValeant Pharmaceuticals International Inc., senior note, 144A, | ||||
| 7.50%, 7/15/21 | United States | 1,000,000 | 1,073,750 | |
| Software & Services 0.3% | ||||
| bFirst Data Corp., senior secured note, 144A, 7.375%, 6/15/19 | United States | 1,000,000 | 1,062,500 | |
| Telecommunication Services 0.9% | ||||
| Frontier Communications Corp., | ||||
| senior bond, 7.625%, 4/15/24 | United States | 600,000 | 648,000 | |
| senior note, 7.875%, 1/15/27 | United States | 400,000 | 418,000 | |
| Intelsat Jackson Holdings SA, senior note, 7.25%, 10/15/20 | Luxembourg | 1,000,000 | 1,070,000 | |
| bSprint Nextel Corp., senior note, 144A, 7.00%, 3/01/20 | United States | 1,200,000 | 1,344,600 | |
| 3,480,600 | ||||
| Total Corporate Bonds (Cost $22,161,982) | 23,315,965 | |||
| c,dSenior Floating Rate Interests 4.4% | ||||
| Automobiles & Components 0.2% | ||||
| Crowne Group LLC, Term Loan, 6.00%, 9/30/20 | United States | 240,200 | 237,798 | |
| eFRAM Group Holdings Inc. (Autoparts Holdings), Term Loan, | ||||
| 6.50%, 7/29/17 | United States | 173,067 | 173,689 | |
| Henniges Automotive Holdings Inc., Term Loans, 6.00%, 6/12/21 | United States | 177,059 | 177,944 | |
| UCI International Inc., Term Loan, 5.50%, 7/26/17 | United States | 83,704 | 83,774 | |
| 673,205 | ||||
| Capital Goods 0.2% | ||||
| Alfred Fueling Systems Inc. (Wayne Fueling), First Lien Initial Term Loan, | ||||
| 4.75%, 6/20/21 | United States | 67,431 | 66,757 | |
| Doncasters U.S. Finance LLC, Term B Loans, 4.50%, 4/09/20 | United States | 49,596 | 49,301 |
franklintempleton.com Annual Report | 75
FRANKLIN INVESTORS SECURITIES TRUST
STATEMENT OF INVESTMENTS
| Franklin Real Return Fund (continued) | ||||
| Principal | ||||
| Country | Amount* | Value | ||
| c,dSenior Floating Rate Interests (continued) | ||||
| Capital Goods (continued) | ||||
| eOnsite Rental Group Operations Pty. Ltd., Term B Loan, 5.50%, 7/30/21 | United States | 147,307 | $ | 145,466 |
| eSensus USA Inc., First Lien Term Loan, 4.50%, 5/09/17 | United States | 185,838 | 181,192 | |
| Signode Industrial Group U.S. Inc., Initial Term B Loan, 4.00%, 5/01/21 | United States | 186,201 | 183,176 | |
| TransDigm Inc., | ||||
| Tranche C Term Loan, 3.75%, 2/28/20 | United States | 113,995 | 112,357 | |
| Tranche D Term Loan, 3.75%, 6/04/21 | United States | 116,309 | 114,685 | |
| Wesco Distribution Inc., Tranche B-1 Loan, 3.75%, 12/12/19 | United States | 5,364 | 5,351 | |
| eWireCo Worldgroup Inc., Term Loan, 7.00%, 2/15/17 | United States | 7,452 | 7,477 | |
| 865,762 | ||||
| Commercial & Professional Services 0.2% | ||||
| Interactive Data Corp., Term Loan, 4.75%, 5/02/21 | United States | 755,083 | 756,027 | |
| Consumer Services 0.4% | ||||
| 24 Hour Fitness Worldwide Inc., Term Loan, 4.75%, 5/30/21 | United States | 201,804 | 200,668 | |
| eCannery Casino Resorts LLC, Term Loan, 6.00%, 10/02/18 | United States | 266,661 | 252,662 | |
| ClubCorp Club Operations Inc., Term B Loans, 4.50%, 7/24/20 | United States | 40,200 | 39,915 | |
| Diamond Resorts Corp., Term Loans, 5.50%, 5/09/21 | United States | 94,927 | 94,927 | |
| eFitness International LLC, Term B Loan, 5.50%, 7/01/20 | United States | 473,314 | 470,415 | |
| TGI Friday’s Inc., First Lien Initial Term Loan, 5.25%, 7/15/20 | United States | 26,376 | 26,376 | |
| eTravelport Finance Luxembourg S.A.R.L., Initial Term Loan, 6.00%, 9/02/21 | Luxembourg | 461,272 | 460,523 | |
| 1,545,486 | ||||
| Diversified Financials 0.1% | ||||
| Guggenheim Partners Investment Management Holdings LLC, Initial Term | ||||
| Loan, 4.25%, 7/22/20 | United States | 55,959 | 55,679 | |
| Trans Union LLC, 2014 Replacement Term Loan, 4.00%, 4/09/21 | United States | 385,264 | 380,207 | |
| 435,886 | ||||
| Energy 0.3% | ||||
| Citgo Petroleum Corp., Term B Loan, 4.50%, 7/29/21 | United States | 57,200 | 57,284 | |
| Drillships Ocean Ventures Inc. and Drillships Vent, Term Loan, 5.50%,7/25/21 | United States | 78,603 | 75,655 | |
| McJunkin Red Man Corp., 2013 Term Loan, 5.00%, 11/11/19 | United States | 145,125 | 145,197 | |
| OSG Bulk Ships Inc., Initial Term Loan, 5.25%, 8/05/19 | United States | 181,049 | 180,144 | |
| OSG International Inc., Initial Term Loan, (OIN), 5.75%, 8/05/19 | United States | 201,160 | 199,777 | |
| ePeabody Energy Corp., Term Loan, 5.50%, 9/24/20 | United States | 151,044 | 146,361 | |
| Utex Industries Inc., First Lien Initial Term Loan, 5.00%, 5/22/21 | United States | 346,991 | 345,257 | |
| 1,149,675 | ||||
| Food, Beverage & Tobacco 0.0%† | ||||
| eBig Heart Pet Brands (Del Monte Pet), Initial Term Loans, 3.50%, 2/24/20 | United States | 169,816 | 163,723 | |
| Health Care Equipment & Services 0.4% | ||||
| Community Health Systems Inc., 2021 Term D Loan, 4.25%, 1/27/21 | United States | 207,923 | 208,378 | |
| Connolly LLC, Initial Term Loan, 5.00%, 5/14/21 | United States | 283,728 | 282,841 | |
| Millennium Health LLC, Tranche B Term Loan, 5.25%, 4/16/21 | United States | 257,480 | 257,962 | |
| eSurgery Centers Holdings Inc., Term Loan, 6.50%, 11/03/20 | United States | 10,700 | 10,697 | |
| Truven Health Analytics Inc., New Tranche B Term Loan, 4.50%, 6/06/19 | United States | 182,584 | 178,704 | |
| U.S. Renal Care Inc., Tranche B-2 Term Loan, 4.25%, 7/03/19 | United States | 492,239 | 489,471 | |
| 1,428,053 |
76 | Annual Report
franklintempleton.com
FRANKLIN INVESTORS SECURITIES TRUST
STATEMENT OF INVESTMENTS
| Franklin Real Return Fund (continued) | ||||
| Principal | ||||
| Country | Amount* | Value | ||
| c,dSenior Floating Rate Interests (continued) | ||||
| Household & Personal Products 0.2% | ||||
| FGI Operating Co. LLC (Freedom Group), Term B Loans, 5.50%, 4/19/19 | United States | 707,756 | $ | 705,544 |
| Materials 0.9% | ||||
| Appvion Inc., Term Loan, 5.75%, 6/28/19 | United States | 147,627 | 146,705 | |
| Arysta Lifescience SPC LLC, Initial Term Loan, 4.50%, 5/29/20 | United States | 519,583 | 519,015 | |
| Axalta Coating Systems U.S. Holdings Inc., 2014 Specified Refinancing | ||||
| Term, 3.75%, 2/01/20 | United States | 231,605 | 228,275 | |
| AZ Chem US Inc., First Lien Initial Term Loan, 4.50%, 6/12/21 | United States | 231,201 | 231,249 | |
| Caraustar Industries Inc., Initial Term Loan, 7.50%, 5/01/19 | United States | 95,960 | 96,800 | |
| eCyanco Intermediate Corp., Initial Term Loan, 5.50%, 5/01/20 | United States | 469,880 | 463,810 | |
| eExopack Holdings SA, USD Term Loan, 5.25%, 5/08/19 | Luxembourg | 539,415 | 543,123 | |
| eMacDermid Holdings LLC, First Lien Tranche B Term Loan, 4.00%, 6/07/20 | United States | 445,273 | 436,228 | |
| OCI Beaumont LLC, Term B-3 Loan, 5.00%, 8/20/19 | United States | 156,140 | 157,117 | |
| Oxbow Carbon LLC, First Lien Tranche B Term Loan, 4.25%, 7/19/19 | United States | 64,265 | 63,462 | |
| Reynolds Group Holdings Inc., U.S. Term Loan, 4.00%, 12/01/18 | United States | 245,319 | 244,312 | |
| Tronox Pigments (Netherlands) BV, Term Loan, 4.00%, 3/19/20 | Netherlands | 138,808 | 137,613 | |
| Univar Inc., Term B Loan, 5.00%, 6/30/17 | United States | 63,951 | 63,632 | |
| 3,331,341 | ||||
| Media 0.3% | ||||
| Cumulus Media Holdings Inc., Term Loans, 4.25%, 12/23/20 | United States | 78,059 | 77,054 | |
| eRadio One Inc., Term Loan, 7.50%, 3/31/16 | United States | 73,189 | 73,738 | |
| William Morris Endeavor Entertainment LLC, Term Loans First Lien, | ||||
| 5.25%, 5/06/21 | United States | 953,411 | 940,699 | |
| 1,091,491 | ||||
| Retailing 0.7% | ||||
| BJ’s Wholesale Club Inc., 2013 (Nov) Replacement Loans, 4.50%, 9/26/19 | United States | 323,512 | 320,393 | |
| eEvergreen AcqCo. 1 LP (Savers), Term Loan, 5.00%, 7/09/19 | United States | 779,801 | 775,902 | |
| eHarbor Freight Tools USA Inc., Loans, 4.75%, 7/26/19 | United States | 366,992 | 367,451 | |
| The Men’s Wearhouse Inc., Tranche B Term Loan, 4.50%, 6/18/21 | United States | 216,897 | 216,625 | |
| Sears Roebuck Acceptance Corp., Term Loan, 5.50%, 6/30/18 | United States | 505,233 | 492,728 | |
| Sungard Availability Services Capital Inc., Tranche B Term Loan, | ||||
| 6.00%, 3/31/19 | United States | 509,091 | 458,818 | |
| 2,631,917 | ||||
| Semiconductors & Semiconductor Equipment 0.0%† | ||||
| M/A-COM Technology Solutions Holdings Inc., Initial Term Loan, | ||||
| 4.50%, 5/07/21 | United States | 97,256 | 97,256 | |
| Software & Services 0.3% | ||||
| BMC Software Finance Inc., Initial U.S. Term Loans, 5.00%, 9/10/20 | United States | 537,799 | 531,871 | |
| MoneyGram International Inc., Term Loan, 4.25%, 3/28/20 | United States | 704,961 | 685,850 | |
| eWorldpay U.S. Inc., Facility B2A-II Loan, 6.25%, 11/30/19 | United States | 90,776 | 91,078 | |
| 1,308,799 | ||||
| Technology Hardware & Equipment 0.1% | ||||
| Dell International LLC, Term B Loan, 4.50%, 4/29/20 | United States | 248,813 | 249,505 | |
| Presidio Inc., Term Loan, 5.00%, 3/31/17 | United States | 114,906 | 114,906 | |
| 364,411 |
franklintempleton.com Annual Report | 77
FRANKLIN INVESTORS SECURITIES TRUST
STATEMENT OF INVESTMENTS
| Franklin Real Return Fund (continued) | |||||
| Principal | |||||
| Country | Amount* | Value | |||
| c,dSenior Floating Rate Interests (continued) | |||||
| Telecommunication Services 0.0%† | |||||
| Intelsat Jackson Holdings SA, Tranche B-2 Term Loan, 3.75%, 6/30/19 | Luxembourg | 161,068 | $ | 160,061 | |
| Transportation 0.1% | |||||
| Global Tip Finance BV/Finance America LLC, Facility C Commitment, | |||||
| 7.00%, 10/16/20 | United States | 258,970 | 258,970 | ||
| Total Senior Floating Rate Interests | |||||
| (Cost $17,078,233) | 16,967,607 | ||||
| Foreign Government and Agency Securities 17.9% | |||||
| Government of Hungary, senior note, | �� | ||||
| 6.375%, 3/29/21 | Hungary | 620,000 | 704,645 | ||
| fReg S, 3.50%, 7/18/16 | Hungary | 60,000 | EUR | 78,376 | |
| fReg S, 4.375%, 7/04/17 | Hungary | 150,000 | EUR | 201,615 | |
| fReg S, 5.75%, 6/11/18 | Hungary | 435,000 | EUR | 616,349 | |
| fReg S, 3.875%, 2/24/20 | Hungary | 180,000 | EUR | 242,767 | |
| Government of Ireland, senior bond, 4.40%, 6/18/19 | Ireland | 1,200,000 | EUR | 1,768,187 | |
| Government of Malaysia, | |||||
| 3.741%, 2/27/15 | Malaysia | 14,275,000 | MYR | 4,346,055 | |
| 3.835%, 8/12/15 | Malaysia | 5,660,000 | MYR | 1,727,465 | |
| 4.72%, 9/30/15 | Malaysia | 2,580,000 | MYR | 793,892 | |
| 3.197%, 10/15/15 | Malaysia | 2,395,000 | MYR | 727,030 | |
| senior bond, 3.814%, 2/15/17 | Malaysia | 6,100,000 | MYR | 1,866,594 | |
| senior note, 3.172%, 7/15/16 | Malaysia | 8,700,000 | MYR | 2,632,051 | |
| Government of Mexico, 8.00%, 12/17/15 | Mexico | 1,273,000g MXN | 9,951,976 | ||
| Government of Poland, | |||||
| 6.25%, 10/24/15 | Poland | 11,600,000 | PLN | 3,593,344 | |
| 5.00%, 4/25/16 | Poland | 11,500,000 | PLN | 3,576,530 | |
| d FRN, 2.69%, 1/25/17 | Poland | 15,515,000 | PLN | 4,614,465 | |
| d FRN, 2.69%, 1/25/21 | Poland | 15,738,000 | PLN | 4,634,201 | |
| Korea Monetary Stabilization Bond, | |||||
| senior bond, 2.47%, 4/02/15 | South Korea | 407,700,000 | KRW | 380,309 | |
| senior bond, 2.80%, 8/02/15 | South Korea | 275,650,000 | KRW | 258,072 | |
| senior bond, 2.81%, 10/02/15 | South Korea | 175,000,000 | KRW | 164,053 | |
| senior note, 2.84%, 12/02/14 | South Korea | 2,223,570,000 | KRW | 2,071,645 | |
| senior note, 2.74%, 2/02/15 | South Korea | 700,000,000 | KRW | 652,923 | |
| senior note, 2.76%, 6/02/15 | South Korea | 379,500,000 | KRW | 354,821 | |
| Korea Treasury Bond, senior note, | |||||
| 3.25%, 12/10/14 | South Korea | 606,880,000 | KRW | 565,729 | |
| 3.25%, 6/10/15 | South Korea | 101,000,000 | KRW | 94,710 | |
| 2.75%, 12/10/15 | South Korea | 491,700,000 | KRW | 461,133 | |
| 2.75%, 6/10/16 | South Korea | 3,000,000,000 | KRW | 2,822,254 | |
| 3.00%, 12/10/16 | South Korea | 9,258,500,000 | KRW | 8,776,558 | |
| hMexican Udibonos, Index Linked, 5.00%, 6/16/16 | Mexico | 475,308i MXN | 3,807,264 | ||
| jNota Do Tesouro Nacional, Index Linked, 6.00%, | |||||
| 5/15/15 | Brazil | 2,100k BRL | 2,134,134 | ||
| 8/15/16 | Brazil | 1,343k BRL | 1,360,556 | ||
| 8/15/18 | Brazil | 1,270k BRL | 1,284,295 | ||
| 5/15/45 | Brazil | 1,680k BRL | 1,691,167 | ||
| Total Foreign Government and Agency Securities | |||||
| (Cost $72,079,490) | 68,955,165 | ||||
78 | Annual Report franklintempleton.com
FRANKLIN INVESTORS SECURITIES TRUST
STATEMENT OF INVESTMENTS
| Franklin Real Return Fund (continued) | |||||
| Principal | |||||
| Country | Amount* | Value | |||
| U.S. Government and Agency Securities 49.8% | |||||
| hU.S. Treasury Bond, Index Linked, 0.125%, 4/15/17 | United States | 38,748,605 | $ | 39,357,075 | |
| hU.S. Treasury Note, Index Linked, | |||||
| 1.625%, 1/15/15 | United States | 9,965,787 | 9,954,884 | ||
| 0.50%, 4/15/15 | United States | 29,086,587 | 29,034,318 | ||
| 1.875%, 7/15/15 | United States | 50,750,126 | 51,697,732 | ||
| 2.00%, 1/15/16 | United States | 39,548,779 | 40,846,454 | ||
| 1.625%, 1/15/18 | United States | 19,302,008 | 20,556,639 | ||
| Total U.S. Government and Agency Securities | |||||
| (Cost $192,538,095) | 191,447,102 | ||||
| Total Investments before Short Term Investments | |||||
| (Cost $350,271,678) | 363,029,409 | ||||
| Short Term Investments 5.0% | |||||
| Foreign Government and Agency Securities (Cost $252,546) 0.1% | |||||
| lBank of Negara Monetary Note, 11/06/14 | Malaysia | 805,000 | MYR | 244,578 | |
| Total Investments before Repurchase Agreements | |||||
| (Cost $350,524,224) | 363,273,987 | ||||
| Repurchase Agreements (Cost $19,001,232) 4.9% | |||||
| mJoint Repurchase Agreement, 0.078%, 11/03/14 | |||||
| (Maturity Value $19,001,356) | United States | 19,001,232 | 19,001,232 | ||
| BNP Paribas Securities Corp. (Maturity Value $4,153,316) | |||||
| Credit Suisse Securities (USA) LLC (Maturity Value $2,076,658) | |||||
| HSBC Securities (USA) Inc. (Maturity Value $8,722,003) | |||||
| Merrill Lynch, Pierce, Fenner & Smith Inc. (Maturity Value $4,049,379) | |||||
| Collateralized by U.S. Government Agency Securities, 0.115% - 5.50%, | |||||
| 11/06/14 - 9/12/19; U.S. Government Agency Securities, zero cpn., | |||||
| 6/01/17 - 10/09/19; U.S. Treasury Bond, 3.75%, 11/15/43; and | |||||
| U.S. Treasury Notes, 0.25% - 1.50%, 12/15/15 - 3/31/19 | |||||
| (valued at $19,385,422). | |||||
| Total Investments (Cost $369,525,456) 99.4% | 382,275,219 | ||||
| Other Assets, less Liabilities 0.6% | 2,218,520 | ||||
| Net Assets 100.0% | $ | 384,493,739 | |||
*The principal amount is stated in U.S. dollars unless otherwise indicated.
†Rounds to less than 0.1% of net assets.
aNon-income producing.
bSecurity was purchased pursuant to Rule 144A under the Securities Act of 1933 and may be sold in transactions exempt from registration only to qualified institutional buyers
or in a public offering registered under the Securities Act of 1933. These securities have been deemed liquid under guidelines approved by the Trust’s Board of Trustees. At
October 31, 2014, the aggregate value of these securities was $5,434,475, representing 1.41% of net assets.
cSee Note 1(h) regarding senior floating rate interests.
dThe coupon rate shown represents the rate at period end.
eA portion or all of the security purchased on a delayed delivery basis. See Note 1(d).
fSecurity was purchased pursuant to Regulation S under the Securities Act of 1933, which exempts from registration securities offered and sold outside of the United States.
Such a security cannot be sold in the United States without either an effective registration statement filed pursuant to the Securities Act of 1933, or pursuant to an exemption
from registration. These securities have been deemed liquid under guidelines approved by the Trust’s Board of Trustees. At October 31, 2014, the aggregate value of these
securities was $1,139,107, representing 0.30% of net assets.
franklintempleton.com Annual Report | 79
FRANKLIN INVESTORS SECURITIES TRUST
STATEMENT OF INVESTMENTS
Franklin Real Return Fund (continued)
gPrincipal amount is stated in 100 Mexican Peso Units.
hPrincipal amount of security is adjusted for inflation. See Note 1(j).
iPrincipal amount is stated in 100 Unidad de Inversion Units.
jRedemption price at maturity is adjusted for inflation. See Note 1(j).
kPrincipal amount is stated in 1,000 Brazilian Real Units.
lThe security is traded on a discount basis with no stated coupon rate.
mSee Note 1(c) regarding joint repurchase agreement.
At October 31, 2014, the fund had the following forward exchange contracts outstanding. See Note 1(e).
| Contract | Settlement | Unrealized | Unrealized | ||||||||
| Currency | Counterpartya | Type | Quantity | Amount | Date | Appreciation | Depreciation | ||||
| Euro | MSCO | Buy | 983,000 | $ | 1,350,799 | 11/13/14 | $ | — | $ | (118,506 | ) |
| Euro | MSCO | Sell | 3,683,000 | 4,949,842 | 11/13/14 | 332,818 | — | ||||
| Euro | DBAB | Sell | 7,044,000 | 9,693,248 | 1/09/15 | 859,405 | — | ||||
| Singapore Dollar | DBAB | Buy | 3,787,800 | 3,002,616 | 1/09/15 | — | (54,327 | ) | |||
| Chilean Peso | DBAB | Buy | 328,810,000 | 568,875 | 2/09/15 | — | (2,706 | ) | |||
| Euro | DBAB | Sell | 1,121,244 | 1,542,271 | 2/09/15 | 135,812 | — | ||||
| Swedish Krona | DBAB | Buy | 33,272,400 | 5,104,186 | 2/09/15 | — | (596,370 | ) | |||
| Singapore Dollar | DBAB | Buy | 4,395,600 | 3,506,382 | 3/09/15 | — | (84,994 | ) | |||
| Chilean Peso | JPHQ | Buy | 1,159,473,700 | 1,972,229 | 5/07/15 | 8,990 | — | ||||
| Euro | DBAB | Sell | 1,465,200 | 1,998,826 | 5/07/15 | 159,751 | — | ||||
| Unrealized appreciation (depreciation) | 1,496,776 | (856,904 | ) | ||||||||
| Net unrealized appreciation (depreciation) | $ | 639,872 | |||||||||
aMay be comprised of multiple contracts with the same counterparty, currency and settlement date.
See Abbreviations on page 102.
80 | Annual Report | The accompanying notes are an integral part of these financial statements. franklintempleton.com
FRANKLIN INVESTORS SECURITIES TRUST
| Financial Statements | ||||||||||
| Statements of Assets and Liabilities | ||||||||||
| October 31, 2014 | ||||||||||
| Franklin | ||||||||||
| Franklin | Convertible | Franklin Equity | Franklin Real | |||||||
| Balanced Fund | Securities Fund | Income Fund | Return Fund | |||||||
| Assets: | ||||||||||
| Investments in securities: | ||||||||||
| Cost - Unaffiliated issuers | $ | 2,252,737,290 | $ | 1,828,560,521 | $ | 1,576,214,684 | $ | 350,524,224 | ||
| Cost - Sweep Money Fund (Note 3f) | 95,445,564 | 39,603,650 | 6,941,696 | — | ||||||
| Cost - Repurchase agreements | — | — | — | 19,001,232 | ||||||
| Total cost of investments | $ | 2,348,182,854 | $ | 1,868,164,171 | $ | 1,583,156,380 | $ | 369,525,456 | ||
| Value - Unaffiliated issuers | $ | 2,461,251,168 | $ | 2,088,116,772 | $ | 2,032,855,158 | $ | 363,273,987 | ||
| Value - Sweep Money Fund (Note 3f) | 95,445,564 | 39,603,650 | 6,941,696 | — | ||||||
| Value - Repurchase agreements | — | — | — | 19,001,232 | ||||||
| Total value of investments | 2,556,696,732 | 2,127,720,422 | 2,039,796,854 | 382,275,219 | ||||||
| Cash | — | — | — | 207,357 | ||||||
| Restricted Cash (Note 1f) | — | — | — | 350,000 | ||||||
| Foreign currency, at value (cost $-, $-, $- and $974,626, | ||||||||||
| respectively) | — | — | — | 961,836 | ||||||
| Receivables: | ||||||||||
| Investment securities sold | 20,681,690 | 55,000 | — | 630,199 | ||||||
| Capital shares sold | 7,126,333 | 9,013,424 | 3,006,985 | 632,266 | ||||||
| Dividends and interest | 12,536,513 | 8,601,713 | 3,328,129 | 1,939,365 | ||||||
| Unrealized appreciation on forward exchange contracts | 321,039 | — | — | 1,496,776 | ||||||
| Other assets | 428 | 362 | 405 | 88 | ||||||
| Total assets | 2,597,362,735 | 2,145,390,921 | 2,046,132,373 | 388,493,106 | ||||||
| Liabilities: | ||||||||||
| Payables: | ||||||||||
| Investment securities purchased | — | — | — | 1,312,653 | ||||||
| Capital shares redeemed | 2,354,719 | 9,066,268 | 2,914,566 | 1,137,040 | ||||||
| Management fees | 1,370,062 | 818,349 | 786,087 | 165,615 | ||||||
| Distribution fees | 917,414 | 465,619 | 562,050 | 90,925 | ||||||
| Transfer agent fees | 446,247 | 498,173 | 376,938 | 21,623 | ||||||
| Distributions to shareholders | — | — | — | 13,696 | ||||||
| Due to brokers | — | — | — | 350,000 | ||||||
| Options written, at value (premiums received $406,518, $-, | ||||||||||
| $- and $-, respectively) | 162,500 | — | — | — | ||||||
| Unrealized depreciation on forward exchange contracts | 246,620 | — | — | 856,904 | ||||||
| Accrued expenses and other liabilities | 123,288 | 92,051 | 131,948 | 50,911 | ||||||
| Total liabilities | 5,620,850 | 10,940,460 | 4,771,589 | 3,999,367 | ||||||
| Net assets, at value | $ | 2,591,741,885 | $ | 2,134,450,461 | $ | 2,041,360,784 | $ | 384,493,739 | ||
| Net assets consist of: | ||||||||||
| Paid-in capital | $ | 2,349,273,913 | $ | 1,844,751,964 | $ | 1,472,925,941 | $ | 395,102,407 | ||
| Undistributed net investment income (distributions in excess | ||||||||||
| of net investment income) | 179,715 | (45,755,051 | ) | 18,204,426 | (7,702,543 | ) | ||||
| Net unrealized appreciation (depreciation) | 208,829,875 | 259,556,251 | 456,586,184 | 13,347,808 | ||||||
| Accumulated net realized gain (loss) | 33,458,382 | 75,897,297 | 93,644,233 | (16,253,933 | ) | |||||
| Net assets, at value | $ | 2,591,741,885 | $ | 2,134,450,461 | $ | 2,041,360,784 | $ | 384,493,739 | ||
franklintempleton.com The accompanying notes are an integral part of these financial statements. | Annual Report | 81
| FRANKLIN INVESTORS SECURITIES TRUST | ||||||||||
| FINANCIAL STATEMENTS | ||||||||||
| Statements of Assets and Liabilities (continued) | ||||||||||
| October 31, 2014 | ||||||||||
| Franklin | ||||||||||
| Franklin | Convertible | Franklin Equity | Franklin Real | |||||||
| Balanced Fund | Securities Fund | Income Fund | Return Fund | |||||||
| Class A: | ||||||||||
| Net assets, at value | $ | 2,053,623,156 | $ | 921,133,586 | $ | 1,762,317,580 | $ | 248,313,357 | ||
| Shares outstanding | 173,090,792 | 48,556,096 | 73,655,566 | 23,301,832 | ||||||
| Net asset value per sharea | $ | 11.86 | $ | 18.97 | $ | 23.93 | $ | 10.66 | ||
| Maximum offering price per share (net asset value per share | ||||||||||
| ÷ 94.25%, 94.25%, 94.25% and 95.75%, respectively) | $ | 12.58 | $ | 20.13 | $ | 25.39 | $ | 11.13 | ||
| Class C: | ||||||||||
| Net assets, at value | $ | 492,514,374 | $ | 333,033,873 | $ | 241,566,103 | $ | 68,187,815 | ||
| Shares outstanding | 41,838,818 | 17,782,999 | 10,152,671 | 6,437,131 | ||||||
| Net asset value and maximum offering price per sharea | $ | 11.77 | $ | 18.73 | $ | 23.79 | $ | 10.59 | ||
| Class R: | ||||||||||
| Net assets, at value | $ | 3,597,586 | — | $ | 7,305,060 | — | ||||
| Shares outstanding | 302,542 | — | 305,266 | — | ||||||
| Net asset value and maximum offering price per share | $ | 11.89 | — | $ | 23.93 | — | ||||
| Class R6: | ||||||||||
| Net assets, at value | $ | 512,823 | $ | 3,093,139 | $ | 5,987 | $ | 2,034,076 | ||
| Shares outstanding | 43,122 | 162,903 | 250 | 190,369 | ||||||
| Net asset value and maximum offering price per share | $ | 11.89 | $ | 18.99 | $ | 23.95 | $ | 10.68 | ||
| Advisor Class: | ||||||||||
| Net assets, at value | $ | 41,493,946 | $ | 877,189,863 | $ | 30,166,054 | $ | 65,958,491 | ||
| Shares outstanding | 3,491,309 | 46,217,686 | 1,259,259 | 6,175,775 | ||||||
| Net asset value and maximum offering price per share | $ | 11.88 | $ | 18.98 | $ | 23.96 | $ | 10.68 | ||
aRedemption price is equal to net asset value less contingent deferred sales charges, if applicable.
82 | Annual Report | The accompanying notes are an integral part of these financial statements. franklintempleton.com
FRANKLIN INVESTORS SECURITIES TRUST
FINANCIAL STATEMENTS
| Statements of Operations | ||||||||||||
| for the year ended October 31, 2014 | ||||||||||||
| Franklin | ||||||||||||
| Franklin | Convertible | Franklin Equity | Franklin Real | |||||||||
| Balanced Fund | Securities Fund | Income Fund | Return Fund | |||||||||
| Investment income: | ||||||||||||
| Dividends | $ | 54,244,450 | $ | 19,650,395 | $ | 74,160,208 | $ | 1,696,318 | ||||
| Interest | 30,062,709 | 21,033,747 | — | 6,100,527 | ||||||||
| Inflation principal adjustments | — | — | — | 1,293,235 | ||||||||
| Total investment income | 84,307,159 | 40,684,142 | 74,160,208 | 9,090,080 | ||||||||
| Expenses: | ||||||||||||
| Management fees (Note 3a) | 14,556,150 | 9,124,116 | 9,226,837 | 2,536,795 | ||||||||
| Distribution fees: (Note 3c) | ||||||||||||
| Class A | 5,260,251 | 2,335,903 | 4,298,033 | 710,498 | ||||||||
| Class C | 4,322,541 | 3,147,590 | 2,314,832 | 483,515 | ||||||||
| Class R | 17,338 | — | 33,529 | — | ||||||||
| Transfer agent fees: (Note 3e) | ||||||||||||
| Class A | 2,003,907 | 1,164,290 | 2,230,491 | 455,985 | ||||||||
| Class C | 493,996 | 392,144 | 300,336 | 119,325 | ||||||||
| Class R | 3,963 | — | 8,699 | — | ||||||||
| Class R6 | 116 | 78 | 75 | 97 | ||||||||
| Advisor Class | 69,120 | 857,951 | 30,207 | 73,144 | ||||||||
| Custodian fees (Note 4) | 21,493 | 16,577 | 22,112 | 50,107 | ||||||||
| Reports to shareholders | 293,867 | 209,656 | 291,592 | 71,643 | ||||||||
| Registration and filing fees | 280,983 | 215,351 | 139,853 | 71,710 | ||||||||
| Professional fees | 64,095 | 50,926 | 65,924 | 38,757 | ||||||||
| Trustees' fees and expenses | 21,266 | 18,153 | 20,435 | 4,537 | ||||||||
| Other | 53,965 | 49,587 | 34,698 | 26,262 | ||||||||
| Total expenses | 27,463,051 | 17,582,322 | 19,017,653 | 4,642,375 | ||||||||
| Expense reductions (Note 4) | (199 | ) | (162 | ) | (45 | ) | (485 | ) | ||||
| Expenses waived/paid by affiliates (Notes 3f and 3g) | (62,697 | ) | (58,440 | ) | (25,252 | ) | (813,182 | ) | ||||
| Net expenses | 27,400,155 | 17,523,720 | 18,992,356 | 3,828,708 | ||||||||
| Net investment income | 56,907,004 | 23,160,422 | 55,167,852 | 5,261,372 | ||||||||
| Realized and unrealized gains (losses): | ||||||||||||
| Net realized gain (loss) from: | ||||||||||||
| Investments | 44,404,314 | 82,062,069 | 93,398,465 | (4,831,040 | ) | |||||||
| Written options (Note 6) | 2,773,405 | — | — | — | ||||||||
| Foreign currency transactions | (39,258 | ) | — | 136,918 | (2,166,537 | ) | ||||||
| Net realized gain (loss) | 47,138,461 | 82,062,069 | 93,535,383 | (6,997,577 | ) | |||||||
| Net change in unrealized appreciation (depreciation) on: | ||||||||||||
| Investments | 78,350,335 | 37,746,132 | 54,472,404 | 2,103,435 | ||||||||
| Translation of other assets and liabilities denominated in | ||||||||||||
| foreign currencies | (5,146 | ) | — | (70,531 | ) | 2,200,802 | ||||||
| Net change in unrealized appreciation | ||||||||||||
| (depreciation) | 78,345,189 | 37,746,132 | 54,401,873 | 4,304,237 | ||||||||
| Net realized and unrealized gain (loss) | 125,483,650 | 119,808,201 | 147,937,256 | (2,693,340 | ) | |||||||
| Net increase (decrease) in net assets resulting from | ||||||||||||
| operations | $ | 182,390,654 | $ | 142,968,623 | $ | 203,105,108 | $ | 2,568,032 | ||||
franklintempleton.com The accompanying notes are an integral part of these financial statements. | Annual Report | 83
| FRANKLIN INVESTORS SECURITIES TRUST | ||||||||||||
| FINANCIAL STATEMENTS | ||||||||||||
| Statements of Changes in Net Assets | ||||||||||||
| Franklin | Franklin | |||||||||||
| Balanced Fund | Convertible Securities Fund | |||||||||||
| Year Ended October 31, | Year Ended October 31, | |||||||||||
| 2014 | 2013 | 2014 | 2013 | |||||||||
| Increase (decrease) in net assets: | ||||||||||||
| Operations: | ||||||||||||
| Net investment income | $ | 56,907,004 | $ | 30,588,789 | $ | 23,160,422 | $ | 25,374,035 | ||||
| Net realized gain (loss) from investments, written options | ||||||||||||
| and foreign currency transactions | 47,138,461 | 34,637,971 | 82,062,069 | 29,669,190 | ||||||||
| Net change in unrealized appreciation (depreciation) | ||||||||||||
| on investments and translation of other assets and | ||||||||||||
| liabilities denominated in foreign currencies | 78,345,189 | 88,446,229 | 37,746,132 | 184,240,411 | ||||||||
| Net increase (decrease) in net assets resulting from | ||||||||||||
| operations | 182,390,654 | 153,672,989 | 142,968,623 | 239,283,636 | ||||||||
| Distributions to shareholders from: | ||||||||||||
| Net investment income: | ||||||||||||
| Class A | (53,805,163 | ) | (31,627,258 | ) | (16,548,915 | ) | (19,664,656 | ) | ||||
| Class C | (10,368,963 | ) | (6,826,129 | ) | (3,385,775 | ) | (5,072,710 | ) | ||||
| Class R | (99,616 | ) | (84,629 | ) | — | — | ||||||
| Class R6 | (405,265 | ) | (92 | ) | (29,180 | ) | — | |||||
| Advisor Class | (2,049,327 | ) | (2,004,586 | ) | (13,433,835 | ) | (7,730,041 | ) | ||||
| Net realized gains: | ||||||||||||
| Class A | (21,130,494 | ) | (9,205,486 | ) | (3,610,981 | ) | — | |||||
| Class C | (5,535,467 | ) | (2,644,332 | ) | (1,182,145 | ) | — | |||||
| Class R | (49,346 | ) | (33,876 | ) | — | — | ||||||
| Class R6 | (77 | ) | — | — | — | |||||||
| Advisor Class | (1,029,638 | ) | (646,925 | ) | (1,752,124 | ) | — | |||||
| Total distributions to shareholders | (94,473,356 | ) | (53,073,313 | ) | (39,942,955 | ) | (32,467,407 | ) | ||||
| Capital share transactions: (Note 2) | ||||||||||||
| Class A | 631,528,743 | 651,592,294 | 19,418,004 | 119,798,228 | ||||||||
| Class C | 121,929,628 | 146,263,810 | 41,623,199 | 20,827,459 | ||||||||
| Class R | 211,518 | 673,732 | — | — | ||||||||
| Class R6 | (507,737 | ) | 5,000 | 3,034,117 | — | |||||||
| Advisor Class | (29,866,192 | ) | 49,958,689 | 462,191,003 | 146,517,178 | |||||||
| Total capital share transactions | 723,295,960 | 848,493,525 | 526,266,323 | 287,142,865 | ||||||||
| Net increase (decrease) in net assets | 811,213,258 | 949,093,201 | 629,291,991 | 493,959,094 | ||||||||
| Net assets: | ||||||||||||
| Beginning of year | 1,780,528,627 | 831,435,426 | 1,505,158,470 | 1,011,199,376 | ||||||||
| End of year | $ | 2,591,741,885 | $ | 1,780,528,627 | $ | 2,134,450,461 | $ | 1,505,158,470 | ||||
| Undistributed net investment income (distributions in excess | ||||||||||||
| of net investment income) included in net assets: | ||||||||||||
| End of year | $ | 179,715 | $ | (1,185,811 | ) | $ | (45,755,051 | ) | $ | (41,426,291 | ) | |
84 | Annual Report | The accompanying notes are an integral part of these financial statements.
franklintempleton.com
| FRANKLIN INVESTORS SECURITIES TRUST | ||||||||||||
| FINANCIAL STATEMENTS | ||||||||||||
| Statements of Changes in Net Assets (continued) | ||||||||||||
| Franklin | Franklin | |||||||||||
| Equity Income Fund | Real Return Fund | |||||||||||
| Year Ended October 31, | Year Ended October 31, | |||||||||||
| 2014 | 2013 | 2014 | 2013 | |||||||||
| Increase (decrease) in net assets: | ||||||||||||
| Operations: | ||||||||||||
| Net investment income | $ | 55,167,852 | $ | 34,516,211 | $ | 5,261,372 | $ | 6,459,975 | ||||
| Net realized gain (loss) from investments | ||||||||||||
| and foreign currency transactions | 93,535,383 | 118,457,716 | (6,997,577 | ) | 2,550,882 | |||||||
| Net change in unrealized appreciation (depreciation) on | ||||||||||||
| investments and translation of other assets and liabilities | ||||||||||||
| denominated in foreign currencies | 54,401,873 | 225,524,693 | 4,304,237 | (2,784,706 | ) | |||||||
| Net increase (decrease) in net assets | ||||||||||||
| resulting from operations | 203,105,108 | 378,498,620 | 2,568,032 | 6,226,151 | ||||||||
| Distributions to shareholders from: | ||||||||||||
| Net investment income: | ||||||||||||
| Class A | (37,460,224 | ) | (34,825,572 | ) | (6,315,367 | ) | (9,207,617 | ) | ||||
| Class B | — | (5,632 | ) | — | — | |||||||
| Class C | (3,335,356 | ) | (2,752,030 | ) | (1,348,226 | ) | (1,995,653 | ) | ||||
| Class R | (128,725 | ) | (111,174 | ) | — | — | ||||||
| Class R6 | (147 | ) | (66 | ) | (35,942 | ) | (69 | ) | ||||
| Advisor Class | (558,920 | ) | (316,984 | ) | (1,166,992 | ) | (819,980 | ) | ||||
| Net realized gains: | ||||||||||||
| Class A | (8,968,025 | ) | — | — | — | |||||||
| Class C | (1,168,619 | ) | — | — | — | |||||||
| Class R | (32,534 | ) | — | — | — | |||||||
| Class R6 | (30 | ) | — | — | — | |||||||
| Advisor Class | (108,872 | ) | — | — | — | |||||||
| Total distributions to shareholders | (51,761,452 | ) | (38,011,458 | ) | (8,866,527 | ) | (12,023,319 | ) | ||||
| Capital share transactions: (Note 2) | ||||||||||||
| Class A | (6,390,580 | ) | 29,106,749 | (74,942,273 | ) | (79,849,877 | ) | |||||
| Class B | — | (1,232,223 | ) | — | — | |||||||
| Class C | 15,710,603 | 38,897,785 | (14,361,649 | ) | (19,847,338 | ) | ||||||
| Class R | 945,497 | (169,938 | ) | — | — | |||||||
| Class R6 | — | 5,000 | 2,036,837 | 5,000 | ||||||||
| Advisor Class | 10,954,875 | 4,503,835 | 39,061,277 | (6,975,655 | ) | |||||||
| Total capital share transactions | 21,220,395 | 71,111,208 | (48,205,808 | ) | (106,667,870 | ) | ||||||
| Net increase (decrease) in net assets | 172,564,051 | 411,598,370 | (54,504,303 | ) | (112,465,038 | ) | ||||||
| Net assets: | ||||||||||||
| Beginning of year | 1,868,796,733 | 1,457,198,363 | 438,998,042 | 551,463,080 | ||||||||
| End of year | $ | 2,041,360,784 | $ | 1,868,796,733 | $ | 384,493,739 | $ | 438,998,042 | ||||
| Undistributed net investment income (distributions in excess | ||||||||||||
| of net investment income) included in net assets: | ||||||||||||
| End of year | $ | 18,204,426 | $ | 3,153,051 | $ | (7,702,543 | ) | $ | (5,189,503 | ) | ||
franklintempleton.com
The accompanying notes are an integral part of these financial statements. | Annual Report | 85
FRANKLIN INVESTORS SECURITIES TRUST
Notes to Financial Statements
1. Organization and Significant Accounting Policies
Franklin Investors Securities Trust (Trust) is registered under the Investment Company Act of 1940, as amended, (1940 Act) as an open-end management investment company, consisting of eight separate funds, four of which are included in this report (Funds). The financial statements of the remaining funds in the Trust are presented separately. Effective March 4, 2014, Franklin Convertible Securities Fund began offering a new class of shares, Class R6. Each class of shares differs by its initial sales load, contingent deferred sales charges, voting rights on matters affecting a single class, its exchange privilege and fees primarily due to differing arrangements for distribution and transfer agent fees.
| Class A, Class C, Class R, Class R6 & Advisor Class |
| Franklin Balanced Fund |
| Franklin Equity Income Fund |
| Class A, Class C, Class R6 & Advisor Class |
| Franklin Convertible Securities Fund |
| Franklin Real Return Fund |
The following summarizes the Funds’ significant accounting policies.
a. Financial Instrument Valuation
The Funds’ investments in financial instruments are carried at fair value daily. Fair value is the price that would be received to sell an asset or paid to transfer a liability in an orderly transaction between market participants on the measurement date. The Funds calculate the net asset value (NAV) per share at the close of the New York Stock Exchange (NYSE), generally at 4 p.m. Eastern time (NYSE close) on each day the NYSE is open for trading. Under compliance policies and procedures approved by the Trust’s Board of Trustees (the Board), the Funds’ administrator has responsibility for oversight of valuation, including leading the cross-functional Valuation and Liquidity Oversight Committee (VLOC). The VLOC provides administration and oversight of the Funds’ valuation policies and procedures, which are approved annually by the Board. Among other things, these procedures allow the Funds to utilize independent pricing services, quotations from securities and financial instrument dealers, and other market sources to determine fair value.
Equity securities, exchange traded funds, and derivative financial instruments (derivatives) listed on an exchange or on the NASDAQ National Market System are valued at the last quoted sale price or the official closing price of the day, respectively. Foreign equity securities are valued as of the close of trading on the foreign stock exchange on which the security is primarily traded or as of the NYSE close, whichever is earlier. The value is then converted into its U.S. dollar equivalent at the foreign exchange rate in effect at the NYSE close on the day that the value of the security is determined. Over-the-counter (OTC) securities are valued within the range of the most recent quoted bid and ask prices. Securities that trade in multiple markets or on multiple exchanges are valued according to the broadest and most representative market. Certain equity securities are valued based upon fundamental characteristics or relationships to similar securities. Investments in open-end mutual funds are valued at the closing net asset value.
Debt and certain preferred securities generally trade in the OTC market rather than on a securities exchange. The Funds’ pricing services use multiple valuation techniques to determine fair value. In instances where sufficient market activity exists, the pricing services may utilize a market-based approach through which quotes from market makers are used to determine fair value. In instances where sufficient market activity may not exist or is limited, the pricing services also utilize proprietary valuation models which may consider market characteristics such as benchmark yield curves, credit spreads, estimated default rates, anticipated market interest rate volatility, coupon rates, anticipated timing of principal repayments, underlying collateral, and other unique security features in order to estimate the relevant cash flows, which are then discounted to calculate the fair value. Securities denominated in a foreign currency are converted into their U.S. dollar equivalent at the foreign exchange rate in effect at the NYSE close on the date that the values of the foreign debt securities are determined. Repurchase agreements are valued at cost, which approximates fair value.
Certain derivatives trade in the OTC market. The Funds’ pricing services use various techniques including industry standard option pricing models and proprietary discounted cash flow models to determine the fair value of those instruments. The Funds’ net benefit or obligation under the derivative contract, as measured by the fair value of the contract, is included in net assets.
86 | Annual Report franklintempleton.com
FRANKLIN INVESTORS SECURITIES TRUST
NOTES TO FINANCIAL STATEMENTS
The Funds have procedures to determine the fair value of financial instruments for which market prices are not reliable or readily available. Under these procedures, the VLOC convenes on a regular basis to review such financial instruments and considers a number of factors, including significant unobservable valuation inputs, when arriving at fair value. The VLOC primarily employs a market-based approach which may use related or comparable assets or liabilities, recent transactions, market multiples, book values, and other relevant information for the investment to determine the fair value of the investment. An income-based valuation approach may also be used in which the anticipated future cash flows of the investment are discounted to calculate fair value. Discounts may also be applied due to the nature or duration of any restrictions on the disposition of the investments. Due to the inherent uncertainty of valuations of such investments, the fair values may differ significantly from the values that would have been used had an active market existed. The VLOC employs various methods for calibrating these valuation approaches including a regular review of key inputs and assumptions, transactional back-testing or disposition analysis, and reviews of any related market activity.
Trading in securities on foreign securities stock exchanges and OTC markets may be completed before the daily NYSE close. In addition, trading in certain foreign markets may not take place on every NYSE business day. Occasionally, events occur between the time at which trading in a foreign security is completed and the close of the NYSE that might call into question the reliability of the value of a portfolio security held by the fund. As a result, differences may arise between the value of the Funds’ portfolio securities as determined at the foreign market close and the latest indications of value at the close of the NYSE. In order to minimize the potential for these differences, the VLOC monitors price movements following the close of trading in foreign stock markets through a series of country specific market proxies (such as baskets of American Depositary Receipts, futures contracts and exchange traded funds). These price movements are measured against established trigger thresholds for each specific market proxy to assist in determining if an event has occurred that may call into question the reliability of the values of the foreign securities held by the Funds. If such an event occurs, the securities may be valued using fair value procedures, which may include the use of independent pricing services.
Also, when the last day of the reporting period is a non-business day, certain foreign markets may be open on those days that the NYSE is closed, which could result in differences between the value of the Funds’ portfolio securities on the last business day and the last calendar day of the reporting period. Any significant security valuation changes due to an open foreign market are adjusted and reflected by the Funds for financial reporting purposes.
b. Foreign Currency Translation
Portfolio securities and other assets and liabilities denominated in foreign currencies are translated into U.S. dollars based on the exchange rate of such currencies against U.S. dollars on the date of valuation. The Funds may enter into foreign currency exchange contracts to facilitate transactions denominated in a foreign currency. Purchases and sales of securities, income and expense items denominated in foreign currencies are translated into U.S. dollars at the exchange rate in effect on the transaction date. Portfolio securities and assets and liabilities denominated in foreign currencies contain risks that those currencies will decline in value relative to the U.S. dollar. Occasionally, events may impact the availability or reliability of foreign exchange rates used to convert the U.S. dollar equivalent value. If such an event occurs, the foreign exchange rate will be valued at fair value using procedures established and approved by the Board.
The Funds do not separately report the effect of changes in foreign exchange rates from changes in market prices on securities held. Such changes are included in net realized and unrealized gain or loss from investments on the Statements of Operations.
Realized foreign exchange gains or losses arise from sales of foreign currencies, currency gains or losses realized between the trade and settlement dates on securities transactions and the difference between the recorded amounts of dividends, interest, and foreign withholding taxes and the U.S. dollar equivalent of the amounts actually received or paid. Net unrealized foreign exchange gains and losses arise from changes in foreign exchange rates on foreign denominated assets and liabilities other than investments in securities held at the end of the reporting period.
c. Joint Repurchase Agreement
Franklin Real Return Fund enters into a joint repurchase agreement whereby its uninvested cash balance is deposited into a joint cash account with other funds managed by the investment manager or an affiliate of the investment manager and is used to invest in one or more repurchase agreements. The value and face amount of the joint repurchase agreement are allocated to
franklintempleton.com Annual Report | 87
FRANKLIN INVESTORS SECURITIES TRUST
NOTES TO FINANCIAL STATEMENTS
1. Organization and Significant Accounting
Policies (continued)
c. Joint Repurchase Agreement (continued)
the funds based on their pro-rata interest. A repurchase agreement is accounted for as a loan by the fund to the seller, collateralized by securities which are delivered to the fund’s custodian. The fair value, including accrued interest, of the initial collateralization is required to be at least 102% of the dollar amount invested by the funds, with the value of the underlying securities marked to market daily to maintain coverage of at least 100%. Repurchase agreements are subject to the terms of Master Repurchase Agreements (MRAs) with approved coun-terparties (sellers). The MRAs contain various provisions, including but not limited to events of default and maintenance of collateral for repurchase agreements. In the event of default by either the seller or the fund, certain MRAs may permit the non-defaulting party to net and close-out all transactions, if any, traded under such agreements. The fund may sell securities it holds as collateral and apply the proceeds towards the repurchase price and any other amounts owed by the seller to the fund in the event of default by the seller. This could involve costs or delays in addition to a loss on the securities if their value falls below the repurchase price owed by the seller. The joint repurchase agreement held by the fund at year end, as indicated in the Statement of Investments, had been entered into on October 31, 2014.
d. Securities Purchased on a Delayed Delivery Basis
Franklin Real Return Fund purchases securities on a delayed delivery basis, with payment and delivery scheduled for a future date. These transactions are subject to market fluctuations and are subject to the risk that the value at delivery may be more or less than the trade date purchase price. Although the Fund will generally purchase these securities with the intention of holding the securities, it may sell the securities before the settlement date. Sufficient assets have been segregated for these securities.
e. Derivative Financial Instruments
Franklin Balanced Fund and Franklin Real Return Fund invested in derivatives in order to manage risk or gain exposure to various other investments or markets. Derivatives are financial contracts based on an underlying or notional amount, require no initial investment or an initial net investment that is smaller than would normally be required to have a similar response to changes in market factors, and require or permit net settlement. Derivatives contain various risks including the potential inability of the counterparty to fulfill their obligations under the terms of the contract, the potential for an illiquid secondary market, and/or the potential for market movements which expose the fund to gains or losses in excess of the amounts shown on the Statements of Assets and Liabilities. Realized gain and loss and unrealized appreciation and depreciation on these contracts for the period are included in the Statements of Operations.
Derivative counterparty credit risk is managed through a formal evaluation of the creditworthiness of all potential counterparties. Franklin Balanced Fund and Franklin Real Return Fund attempts to reduce their exposure to counterparty credit risk on OTC derivatives, whenever possible, by entering into International Swaps and Derivatives Association (ISDA) master agreements with certain counterparties. These agreements contain various provisions, including but not limited to collateral requirements, events of default, or early termination. Termination events applicable to the counterparty include certain deteriorations in the credit quality of the counterparty. Termination events applicable to the funds include failure of the funds to maintain certain net asset levels and/or limit the decline in net assets over various periods of time. In the event of default or early termination, the ISDA master agreement gives the non-defaulting party the right to net and close-out all transactions traded, whether or not arising under the ISDA agreement, to one net amount payable by one counterparty to the other. However, absent an event of default or early termination, OTC derivative assets and liabilities are presented gross and not offset in the Statements of Assets and Liabilities. Early termination by the counterparty may result in an immediate payment by the funds of any net liability owed to that counter-party under the ISDA agreement.
Collateral requirements differ by type of derivative. Collateral or initial margin requirements are set by the broker or exchange clearing house for exchange traded and centrally cleared derivatives. Initial margin deposited is held at the exchange and can be in the form of cash and/or securities. For OTC derivatives traded under an ISDA master agreement, posting of collateral is required by either the fund or the applicable counterparty if the total net exposure of all OTC derivatives with the applicable counterparty exceeds the minimum transfer amount, which typically ranges from $100,000 to $250,000, and can vary depending on the counterparty and the type of the agreement. Generally, collateral is determined at the close of fund business each day and any additional collateral required due to changes in derivative values may be delivered by the fund or the counterparty within a few business days. Collateral pledged and/or
88 | Annual Report
franklintempleton.com
FRANKLIN INVESTORS SECURITIES TRUST
NOTES TO FINANCIAL STATEMENTS
received by the fund for OTC derivatives, if any, is held in segregated accounts with the fund’s custodian/counterparty broker and can be in the form of cash and/or securities. Unrestricted cash may be invested according to the funds’investment objectives.
Franklin Balanced Fund and Franklin Real Return Fund entered into OTC forward exchange contracts primarily to manage and/or gain exposure to certain foreign currencies. A forward exchange contract is an agreement between the fund and a counterparty to buy or sell a foreign currency at a specific exchange rate on a future date.
Franklin Balanced Fund purchased or wrote exchange traded option contracts primarily to manage exposure to equity price risk. An option is a contract entitling the holder to purchase or sell a specific amount of shares or units of an asset or notional amount of a swap (swaption), at a specified price. Options purchased are recorded as an asset while options written are recorded as a liability. Upon exercise of an option, the acquisition cost or sales proceeds of the underlying investment is adjusted by any premium received or paid. Upon expiration of an option, any premium received or paid is recorded as a realized gain or loss. Upon closing an option other than through expiration or exercise, the difference between the premium and the cost to close the position is recorded as a realized gain or loss.
See Notes 6 and 9 regarding investment transactions and other derivative information, respectively.
f. Restricted Cash
At October 31, 2014, Franklin Real Return Fund received restricted cash in connection with investments in certain derivative securities. Restricted cash is held in a segregated account with the fund’s custodian and is reflected in the Statements of Assets and Liabilities.
g. Equity-Linked Securities
Franklin Balanced Fund and Franklin Equity Income Fund invest in equity-linked securities. Equity-linked securities are hybrid financial instruments that generally combine both debt and equity characteristics into a single note form. Income received from equity-linked securities is recorded as realized gains in the Statements of Operations and may be based on the performance of an underlying equity security, an equity index, or an option position. The risks of investing in equity-linked securities include unfavorable price movements in the underlying security and the credit risk of the issuing financial institution. There may be no guarantee of a return of principal with equity-linked securities and the appreciation potential may be limited. Equity-linked securities may be more volatile and less liquid than other investments held by the funds.
h. Senior Floating Rate Interests
Franklin Real Return Fund invests in senior secured corporate loans that pay interest at rates which are periodically reset by reference to a base lending rate plus a spread. These base lending rates are generally the prime rate offered by a designated U.S. bank or the London InterBank Offered Rate (LIBOR). Senior secured corporate loans often require prepayment of principal from excess cash flows or at the discretion of the borrower. As a result, actual maturity may be substantially less than the stated maturity. Senior secured corporate loans in which the fund invests are generally readily marketable, but may be subject to certain restrictions on resale.
i. Income and Deferred Taxes
It is each fund’s policy to qualify as a regulated investment company under the Internal Revenue Code. Each fund intends to distribute to shareholders substantially all of its taxable income and net realized gains to relieve it from federal income and excise taxes. As a result, no provision for U.S. federal income taxes is required.
The Funds may be subject to foreign taxation related to income received, capital gains on the sale of securities and certain foreign currency transactions in the foreign jurisdictions in which the Funds invest. Foreign taxes, if any, are recorded based on the tax regulations and rates that exist in the foreign markets in which the Funds invest. When a capital gain tax is determined to apply the Funds record an estimated deferred tax liability in an amount that would be payable if the securities were disposed of on the valuation date.
Each fund recognizes the tax benefits of uncertain tax positions only when the position is “more likely than not” to be sustained upon examination by the tax authorities based on the technical merits of the tax position. As of October 31, 2014, and for all open tax years, each fund has determined that no liability for unrecognized tax benefits is required in each fund’s financial statements related to uncertain tax positions taken on a tax return (or expected to be taken on future tax returns). Open tax years are those that remain subject to examination and are based on each tax jurisdiction statute of limitation.
franklintempleton.com
Annual Report
| 89
FRANKLIN INVESTORS SECURITIES TRUST
NOTES TO FINANCIAL STATEMENTS
1. Organization and Significant Accounting
Policies (continued)
j. Security Transactions, Investment Income, Expenses and Distributions
Security transactions are accounted for on trade date. Realized gains and losses on security transactions are determined on a specific identification basis. Interest income and estimated expenses are accrued daily. Amortization of premium and accretion of discount on debt securities are included in interest income. Facility fees are recognized as income over the expected term of the loan. Dividend income is recorded on the ex-dividend date except that certain dividends from foreign securities are recognized as soon as the Funds are notified of the ex-dividend date. Distributions to shareholders are recorded on the ex-dividend date and are determined according to income tax regulations (tax basis). Distributable earnings determined on a tax basis may differ from earnings recorded in accordance with accounting principles generally accepted in the United States of America. These differences may be permanent or temporary. Permanent differences are reclassified among capital accounts to reflect their tax character. These reclassifications have no impact on net assets or the results of operations. Temporary differences are not reclassified, as they may reverse in subsequent periods.
Common expenses incurred by the Trust are allocated among the funds based on the ratio of net assets of each fund to the combined net assets of the Trust. Fund specific expenses are charged directly to the fund that incurred the expense.
Realized and unrealized gains and losses and net investment income, not including class specific expenses, are allocated daily to each class of shares based upon the relative proportion of net assets of each class. Differences in per share distributions, by class, are generally due to differences in class specific expenses.
Inflation-indexed bonds are adjusted for inflation through periodic increases or decreases in the security’s interest accruals, face amount, or principal redemption value, by amounts corresponding to the rate of inflation as measured by an index. Any increase or decrease in the face amount or principal redemption value will be included as inflation principal adjustments on the Statements of Operations.
k. Accounting Estimates
The preparation of financial statements in accordance with accounting principles generally accepted in the United States of America requires management to make estimates and assumptions that affect the reported amounts of assets and liabilities at the date of the financial statements and the amounts of income and expenses during the reporting period. Actual results could differ from those estimates.
l. Guarantees and Indemnifications
Under the Trust’s organizational documents, its officers and trustees are indemnified by the Trust against certain liabilities arising out of the performance of their duties to the Trust. Additionally, in the normal course of business, the Trust, on behalf of the Funds, enters into contracts with service providers that contain general indemnification clauses. The Trust’s maximum exposure under these arrangements is unknown as this would involve future claims that may be made against the Trust that have not yet occurred. Currently, the Trust expects the risk of loss to be remote.
90 | Annual Report
franklintempleton.com
FRANKLIN INVESTORS SECURITIES TRUST
NOTES TO FINANCIAL STATEMENTS
2. Shares of Beneficial Interest
At October 31, 2014, there were an unlimited number of shares authorized (without par value). Transactions in the Funds’ shares were as follows:
| Franklin | Franklin | |||||||||||
| Balanced Fund | Convertible Securities Fund | |||||||||||
| Shares | Amount | Shares | Amount | |||||||||
| Class A Shares: | ||||||||||||
| Year ended October 31, 2014 | ||||||||||||
| Shares sold | 70,233,522 | $ | 815,165,988 | 20,560,472 | $ | 383,527,012 | ||||||
| Shares issued in reinvestment of distributions | 6,361,863 | 73,139,209 | 1,027,227 | 18,842,876 | ||||||||
| Shares redeemed | (22,041,115 | ) | (256,776,454 | ) | (20,415,610 | ) | (382,951,884 | ) | ||||
| Net increase (decrease) | 54,554,270 | $ | 631,528,743 | 1,172,089 | $ | 19,418,004 | ||||||
| Year ended October 31, 2013 | ||||||||||||
| Shares sold | 72,046,795 | $ | 788,307,064 | 21,773,359 | $ | 361,514,992 | ||||||
| Shares issued in reinvestment of distributions | 3,617,566 | 39,268,649 | 1,132,494 | 18,217,413 | ||||||||
| Shares redeemed | (16,067,137 | ) | (175,983,419 | ) | (15,901,213 | ) | (259,934,177 | ) | ||||
| Net increase (decrease) | 59,597,224 | $ | 651,592,294 | 7,004,640 | $ | 119,798,228 | ||||||
| Class C Shares: | ||||||||||||
| Year ended October 31, 2014 | ||||||||||||
| Shares sold | 15,225,489 | $ | 175,593,130 | 4,373,788 | $ | 80,504,373 | ||||||
| Shares issued in reinvestment of distributions | 1,263,947 | 14,379,400 | 200,407 | 3,615,096 | ||||||||
| Shares redeemed | (5,890,178 | ) | (68,042,902 | ) | (2,305,848 | ) | (42,496,270 | ) | ||||
| Net increase (decrease) | 10,599,258 | $ | 121,929,628 | 2,268,347 | $ | 41,623,199 | ||||||
| Year ended October 31, 2013 | ||||||||||||
| Shares sold | 17,129,960 | $ | 186,336,571 | 3,482,839 | $ | 57,736,426 | ||||||
| Shares issued in reinvestment of distributions | 755,930 | 8,131,677 | 247,527 | 3,917,749 | ||||||||
| Shares redeemed | (4,436,380 | ) | (48,204,438 | ) | (2,559,313 | ) | (40,826,716 | ) | ||||
| Net increase (decrease) | 13,449,510 | $ | 146,263,810 | 1,171,053 | $ | 20,827,459 | ||||||
| Class R Shares: | ||||||||||||
| Year ended October 31, 2014 | ||||||||||||
| Shares sold | 49,487 | $ | 579,565 | |||||||||
| Shares issued in reinvestment of distributions | 12,967 | 148,963 | ||||||||||
| Shares redeemed | (43,956 | ) | (517,010 | ) | ||||||||
| Net increase (decrease) | 18,498 | $ | 211,518 | |||||||||
| Year ended October 31, 2013 | ||||||||||||
| Shares sold | 142,530 | $ | 1,569,808 | |||||||||
| Shares issued in reinvestment of distributions | 10,936 | 118,454 | ||||||||||
| Shares redeemed | (92,423 | ) | (1,014,530 | ) | ||||||||
| Net increase (decrease) | 61,043 | $ | 673,732 | |||||||||
| Class R6 Shares: | ||||||||||||
| Year ended October 31, 2014a | ||||||||||||
| Shares sold | 4,223,183 | $ | 50,203,110 | 161,378 | $ | 3,005,000 | ||||||
| Shares issued in reinvestment of distributions | 33,755 | 405,080 | 1,525 | 29,117 | ||||||||
| Shares redeemed | (4,214,267 | ) | (51,115,927 | ) | — | — | ||||||
| Net increase (decrease) | 42,671 | $ | (507,737 | ) | 162,903 | $ | 3,034,117 | |||||
| Year ended October 31, 2013b | ||||||||||||
| Shares sold | 451 | $ | 5,000 | |||||||||
franklintempleton.com
Annual Report | 91
| FRANKLIN INVESTORS SECURITIES TRUST | |||||||||||
| NOTES TO FINANCIAL STATEMENTS | |||||||||||
| 2. Shares of Beneficial Interest (continued) | |||||||||||
| Franklin | Franklin | ||||||||||
| Balanced Fund | Convertible Securities Fund | ||||||||||
| Shares | Amount | Shares | Amount | ||||||||
| Advisor Class Shares: | |||||||||||
| Year ended October 31, 2014 | |||||||||||
| Shares sold | 2,648,763 | $ | 30,742,430 | 37,218,867 | $ | 697,062,012 | |||||
| Shares issued in reinvestment of distributions | 251,541 | 2,876,344 | 692,532 | 12,858,748 | |||||||
| Shares redeemed | (5,366,832 | ) | (63,484,966 | ) | (13,426,115 | ) | (247,729,757 | ) | |||
| Net increase (decrease) | (2,466,528 | ) | $ | (29,866,192 | ) | 24,485,284 | $ | 462,191,003 | |||
| Year ended October 31, 2013 | |||||||||||
| Shares sold | 5,831,036 | $ | 62,809,047 | 13,996,546 | $ | 234,682,586 | |||||
| Shares issued in reinvestment of distributions | 229,105 | 2,491,186 | 353,318 | 5,730,074 | |||||||
| Shares redeemed | (1,394,879 | ) | (15,341,544 | ) | (5,791,840 | ) | (93,895,482 | ) | |||
| Net increase (decrease) | 4,665,262 | $ | 49,958,689 | 8,558,024 | $ | 146,517,178 | |||||
| aFor the period March 4, 2014 (effective date) to October 31, 2014 for Franklin Convertible Securities Fund. | |||||||||||
| bFor the period May 1, 2013 (effective date) to October 31, 2013 for Franklin Balanced Fund. | |||||||||||
| Franklin | Franklin | ||||||||||
| Equity Income Fund | Real Return Fund | ||||||||||
| Shares | Amount | Shares | Amount | ||||||||
| Class A Shares: | |||||||||||
| Year ended October 31, 2014 | |||||||||||
| Shares sold | 10,330,092 | $ | 237,602,884 | 3,579,355 | $ | 38,673,672 | |||||
| Shares issued in reinvestment of distributions | 1,983,644 | 45,135,334 | 557,168 | 6,020,961 | |||||||
| Shares redeemed | (12,525,875 | ) | (289,128,798 | ) | (11,073,134 | ) | (119,636,906 | ) | |||
| Net increase (decrease) | (212,139 | ) | $ | (6,390,580 | ) | (6,936,611 | ) | $ | (74,942,273 | ) | |
| Year ended October 31, 2013 | |||||||||||
| Shares sold | 16,399,279 | $ | 327,965,344 | 6,645,189 | $ | 72,182,703 | |||||
| Shares issued in reinvestment of distributions | 1,719,474 | 33,834,843 | 803,556 | 8,686,113 | |||||||
| Shares redeemed | (16,773,881 | ) | (332,693,438 | ) | (14,821,262 | ) | (160,718,693 | ) | |||
| Net increase (decrease) | 1,344,872 | $ | 29,106,749 | (7,372,517 | ) | $ | (79,849,877 | ) | |||
| Class B Shares: | |||||||||||
| Year ended October 31, 2013a | |||||||||||
| Shares sold | 2,366 | $ | 43,801 | ||||||||
| Shares issued in reinvestment of distributions | 248 | 4,470 | |||||||||
| Shares redeemed | (69,207 | ) | (1,280,494 | ) | |||||||
| Net increase (decrease) | (66,593 | ) | $ | (1,232,223 | ) | ||||||
| Class C Shares: | |||||||||||
| Year ended October 31, 2014 | |||||||||||
| Shares sold | 2,334,827 | $ | 53,392,570 | 859,860 | $ | 9,243,498 | |||||
| Shares issued in reinvestment of distributions | 190,661 | 4,300,491 | 120,299 | 1,292,542 | |||||||
| Shares redeemed | (1,823,609 | ) | (41,982,458 | ) | (2,320,740 | ) | (24,897,689 | ) | |||
| Net increase (decrease) | 701,879 | $ | 15,710,603 | (1,340,581 | ) | $ | (14,361,649 | ) | |||
| Year ended October 31, 2013 | |||||||||||
| Shares sold | 3,820,493 | $ | 76,212,146 | 1,981,038 | $ | 21,416,482 | |||||
| Shares issued in reinvestment of distributions | 133,468 | 2,614,204 | 175,915 | 1,890,751 | |||||||
| Shares redeemed | (2,024,825 | ) | (39,928,565 | ) | (4,007,609 | ) | (43,154,571 | ) | |||
| Net increase (decrease) | 1,929,136 | $ | 38,897,785 | (1,850,656 | ) | $ | (19,847,338 | ) | |||
92 | Annual Report
franklintempleton.com
FRANKLIN INVESTORS SECURITIES TRUST
NOTES TO FINANCIAL STATEMENTS
| Franklin | Franklin | |||||||||||
| Equity Income Fund | Real Return Fund | |||||||||||
| Shares | Amount | Shares | Amount | |||||||||
| Class R Shares: | ||||||||||||
| Year ended October 31, 2014 | ||||||||||||
| Shares sold | 93,752 | $ | 2,145,753 | |||||||||
| Shares issued in reinvestment of distributions | 6,533 | 148,655 | ||||||||||
| Shares redeemed | (58,667 | ) | (1,348,911 | ) | ||||||||
| Net increase (decrease) | 41,618 | $ | 945,497 | |||||||||
| Year ended October 31, 2013 | ||||||||||||
| Shares sold | 100,846 | $ | 1,993,196 | |||||||||
| Shares issued in reinvestment of distributions | 5,398 | 106,177 | ||||||||||
| Shares redeemed | (116,908 | ) | (2,269,311 | ) | ||||||||
| Net increase (decrease) | (10,664 | ) | $ | (169,938 | ) | |||||||
| Class R6 Shares: | ||||||||||||
| Year ended October 31, 2014 | ||||||||||||
| Shares sold | 220,110 | $ | 2,365,667 | |||||||||
| Shares issued in reinvestment of distributions | 1,720 | 18,859 | ||||||||||
| Shares redeemed | (31,915 | ) | (347,689 | ) | ||||||||
| Net increase (decrease) | 189,915 | $ | 2,036,837 | |||||||||
| Year ended October 31, 2013b | ||||||||||||
| Shares sold | 250 | $ | 5,000 | 454 | $ | 5,000 | ||||||
| Advisor Class Shares: | ||||||||||||
| Year ended October 31, 2014 | ||||||||||||
| Shares sold | 743,489 | $ | 17,291,317 | 5,138,314 | $ | 55,811,393 | ||||||
| Shares issued in reinvestment of distributions | 26,209 | 598,539 | 101,280 | 1,100,209 | ||||||||
| Shares redeemed | (300,655 | ) | (6,934,981 | ) | (1,648,547 | ) | (17,850,325 | ) | ||||
| Net increase (decrease) | 469,043 | $ | 10,954,875 | 3,591,047 | $ | 39,061,277 | ||||||
| Year ended October 31, 2013 | ||||||||||||
| Shares sold | 515,408 | $ | 10,636,771 | 1,308,746 | $ | 14,232,274 | ||||||
| Shares issued in reinvestment of distributions | 13,844 | 274,209 | 66,927 | 725,214 | ||||||||
| Shares redeemed | (323,317 | ) | (6,407,145 | ) | (2,015,897 | ) | (21,933,143 | ) | ||||
| Net increase (decrease) | 205,935 | $ | 4,503,835 | (640,224 | ) | $ | (6,975,655 | ) | ||||
aEffective March 1, 2013, all Class B shares were converted to Class A.
bFor the period May 1, 2013 (effective date) to October 31, 2013 for Franklin Real Return Fund.
3. Transactions with Affiliates
Franklin Resources, Inc. is the holding company for various subsidiaries that together are referred to as Franklin Templeton Investments. Certain officers and trustees of the Trust are also officers and/or directors of the following subsidiaries:
| Subsidiary | Affiliation |
| Franklin Advisers, Inc. (Advisers) | Investment manager |
| Franklin Templeton Services, LLC (FT Services) | Administrative manager |
| Franklin Templeton Distributors, Inc. (Distributors) | Principal underwriter |
| Franklin Templeton Investor Services, LLC (Investor Services) | Transfer agent |
franklintempleton.com Annual Report | 93
FRANKLIN INVESTORS SECURITIES TRUST
NOTES TO FINANCIAL STATEMENTS
| 3. | Transactions with Affiliates (continued) |
| a. | Management Fees |
Franklin Balanced Fund pays an investment management fee to Advisers based on the average daily net assets of the fund as follows:
| Annualized Fee Rate | Net Assets |
| 0.700% | Up to and including $250 million |
| 0.675% | Over $250 million, up to and including $500 million |
| 0.650% | Over $500 million, up to and including $1 billion |
| 0.625% | Over $1 billion, up to and including $2.5 billion |
| 0.600% | Over $2.5 billion, up to and including $5 billion |
| 0.575% | Over $5 billion, up to and including $10 billion |
| 0.550% | Over $10 billion, up to and including $15 billion |
| 0.525% | Over $15 billion, up to and including $20 billion |
| 0.500% | In excess of $20 billion |
Franklin Convertible Securities Fund and Franklin Equity Income Fund pay an investment management fee to Advisers based on the month-end net assets of each of the funds as follows:
| Annualized Fee Rate | Net Assets |
| 0.625% | Up to and including $100 million |
| 0.500% | Over $100 million, up to and including $250 million |
| 0.450% | Over $250 million, up to and including $7.5 billion |
| 0.440% | Over $7.5 billion, up to and including $10 billion |
| 0.430% | Over $10 billion, up to and including $12.5 billion |
| 0.420% | Over $12.5 billion, up to and including $15 billion |
| 0.400% | Over $15 billion, up to and including $17.5 billion |
| 0.380% | Over $17.5 billion, up to and including $20 billion |
| 0.360% | Over $20 billion, up to and including $35 billion |
| 0.355% | Over $35 billion, up to and including $50 billion |
| 0.350% | In excess of $50 billion |
Franklin Real Return Fund pays an investment management fee to Advisers based on the average daily net assets of the fund as follows:
| Annualized Fee Rate | Net Assets |
| 0.625% | Up to and including $500 million |
| 0.525% | Over $500 million, up to and including $1 billion |
| 0.480% | Over $1 billion, up to and including $1.5 billion |
| 0.435% | Over $1.5 billion, up to and including $6.5 billion |
| 0.415% | Over $6.5 billion, up to and including $11.5 billion |
| 0.400% | Over $11.5 billion, up to and including $16.5 billion |
| 0.390% | Over $16.5 billion, up to and including $19 billion |
| 0.380% | Over $19 billion, up to and including $21.5 billion |
| 0.370% | In excess of $21.5 billion |
94 | Annual Report franklintempleton.com
FRANKLIN INVESTORS SECURITIES TRUST
NOTES TO FINANCIAL STATEMENTS
b. Administrative Fees
Under an agreement with Advisers, FT Services provides administrative services to the Funds. The fee is paid by Advisers based on each of the Funds’ average daily net assets, and is not an additional expense of the Funds.
c. Distribution Fees
The Board has adopted distribution plans for each share class, with the exception of Class R6 and Advisor Class shares, pursuant to Rule 12b-1 under the 1940 Act. Distribution fees are not charged on shares held by affiliates. Under the Funds’ Class A reimbursement distribution plans, the Funds reimburse Distributors for costs incurred in connection with the servicing, sale and distribution of each fund’s shares up to the maximum annual plan rate for each class. Under the Class A reimbursement distribution plans, costs exceeding the maximum for the current plan year cannot be reimbursed in subsequent periods. In addition, under the Funds’ Class C and R compensation distribution plans, the Funds pay Distributors for costs incurred in connection with the servicing, sale and distribution of each fund’s shares up to the maximum annual plan rate for each class. The plan year, for purposes of monitoring compliance with the maximum annual plan rates, is February 1 through January 31 for each fund.
The maximum annual plan rates, based on the average daily net assets, for each class, are as follows:
| Franklin | ||||||||
| Franklin | Convertible | Franklin Equity | Franklin Real | |||||
| Balanced Fund | Securities Fund | Income Fund | Return Fund | |||||
| Reimbursement Plans: | ||||||||
| Class A | 0.35 | % | 0.25 | % | 0.25 | % | 0.25 | % |
| Compensation Plans: | ||||||||
| Class C | 1.00 | % | 1.00 | % | 1.00 | % | 0.65 | % |
| Class R | 0.50 | % | — | 0.50 | % | — |
The Board has set the current rate at 0.30% per year for Class A shares for Franklin Balanced Fund until further notice and approval by the Board.
d. Sales Charges/Underwriting Agreements
Front-end sales charges and contingent deferred sales charges (CDSC) do not represent expenses of the Funds. These charges are deducted from the proceeds of sales of fund shares prior to investment or from redemption proceeds prior to remittance, as applicable. Distributors has advised the Funds of the following commission transactions related to the sales and redemptions of the Funds’ shares for the year:
| Franklin | ||||||||
| Franklin | Convertible | Franklin Equity | Franklin Real | |||||
| Balanced Fund | Securities Fund | Income Fund | Return Fund | |||||
| Sales charges retained net of commissions paid to | ||||||||
| unaffiliated broker/dealers | $ | 2,480,504 | $ | 420,020 | $ | 740,379 | $ | 60,987 |
| CDSC retained | $ | 98,749 | $ | 32,797 | $ | 27,123 | $ | 8,835 |
| e. Transfer Agent Fees | ||||||||
Each class of shares, except for Class R6, pays transfer agent fees to Investor Services for its performance of shareholder servicing obligations and reimburses Investor Services for out of pocket expenses incurred, including shareholding servicing fees paid to third parties. These fees are allocated daily based upon their relative proportion of such classes’ aggregate net assets. Class R6 pays Investor Services transfer agent fees specific to that class.
franklintempleton.com
Annual Report
| 95
FRANKLIN INVESTORS SECURITIES TRUST
NOTES TO FINANCIAL STATEMENTS
| 3. | Transactions with Affiliates (continued) |
| e. | Transfer Agent Fees (continued) |
For the year ended October 31, 2014, the Funds paid transfer agent fees as noted in the Statements of Operations of which the following amounts were retained by Investor Services:
| Franklin | ||||||||
| Franklin | Convertible | Franklin Equity | Franklin Real | |||||
| Balanced Fund | Securities Fund | Income Fund | Return Fund | |||||
| Transfer agent fees | $ | 855,469 | $ | 736,107 | $ | 984,653 | $ | 270,738 |
| f. Investments in Institutional Fiduciary Trust Money Market Portfolio | ||||||||
The Funds except Franklin Real Return Fund, invest in Institutional Fiduciary Trust Money Market Portfolio (Sweep Money Fund), an affiliated open-end management investment company. Management fees paid by the Funds are waived on assets invested in the Sweep Money Fund, as noted on the Statements of Operations, in an amount not to exceed the management and administrative fees paid directly or indirectly by the Sweep Money Fund. Prior to November 1, 2013, the waiver was accounted for as a reduction to management fees.
g. Waiver and Expense Reimbursements
Advisers and Investor Services have contractually agreed in advance to waive or limit their respective fees and to assume as their own expense certain expenses otherwise payable by Franklin Real Return Fund so that the expenses (excluding distribution fees and acquired fund fees and expenses) for Class A, Class C and Advisor Class of the fund do not exceed 0.65%, and Class R6 does not exceed 0.52% based on the average net assets of each class (other than certain non-routine expenses or costs, including those relating to litigation, indemnification, reorganizations, and liquidations) until February 28, 2015.
Additionally, Investor Services has contractually agreed in advance to waive or limit its fees so that the Class R6 transfer agent fees do not exceed 0.01% until February 28, 2015. For Franklin Balanced Fund and Franklin Convertible Securities Fund, there were no Class R6 transfer agents fees waived during the year ended October 31, 2014.
4. Expense Offset Arrangement
The Funds have entered into an arrangement with their custodian whereby credits realized as a result of uninvested cash balances are used to reduce a portion of the Funds’ custodian expenses. During the year ended October 31, 2014, the custodian fees were reduced as noted in the Statements of Operations.
5. Income Taxes
For tax purposes, capital losses may be carried over to offset future capital gains. Capital loss carryforwards with no expiration, if any, must be fully utilized before those losses with expiration dates.
| At October 31, 2014, capital loss carryforwards were as follows: | |||
| Franklin Real | |||
| Return Fund | |||
| Capital loss carryforwards subject to expiration: | |||
| 2016 | $ | 1,161,482 | |
| 2017 | 1,207,907 | ||
| 2018 | 1,206,586 | ||
| Capital loss carryforwards not subject to expiration: | |||
| Short term | 359,718 | ||
| Long term | 12,290,884 | ||
| Total capital loss carryforwards | $ | 16,226,577 | |
| 96 | Annual Report | franklintempleton.com | ||
FRANKLIN INVESTORS SECURITIES TRUST
NOTES TO FINANCIAL STATEMENTS
The tax character of distributions paid during the years ended October 31, 2014 and 2013, was as follows:
| Franklin | Franklin Convertible | |||||||
| Balanced Fund | Securities Fund | |||||||
| 2014 | 2013 | 2014 | 2013 | |||||
| Distributions paid from: | ||||||||
| Ordinary income | $ | 71,799,480 | $ | 47,737,181 | $ | 33,397,705 | $ | 32,467,407 |
| Long term capital gain | 22,673,876 | 5,336,132 | 6,545,250 | — | ||||
| $ | 94,473,356 | $ | 53,073,313 | $ | 39,942,955 | $ | 32,467,407 | |
| Franklin | Franklin | |||||||
| Equity Income Fund | Real Return Fund | |||||||
| 2014 | 2013 | 2014 | 2013 | |||||
| Distributions paid from: | ||||||||
| Ordinary income | $ | 41,483,372 | $ | 38,011,458 | $ | 8,866,527 | $ | 12,023,319 |
| Long term capital gain | 10,278,080 | — | — | — | ||||
| $ | 51,761,452 | $ | 38,011,458 | $ | 8,866,527 | $ | 12,023,319 | |
At October 31, 2014, the cost of investments and net unrealized appreciation (depreciation) for income tax purposes were as follows:
| Franklin | ||||||||||||
| Franklin | Convertible | Franklin Equity | Franklin Real | |||||||||
| Balanced Fund | Securities Fund | Income Fund | Return Fund | |||||||||
| Cost of investments | $ | 2,352,070,287 | $ | 1,922,001,028 | $ | 1,580,705,240 | $ | 377,690,350 | ||||
| Unrealized appreciation | $ | 236,275,163 | $ | 317,061,573 | $ | 489,865,832 | $ | 21,251,492 | ||||
| Unrealized depreciation | (31,648,718 | ) | (111,342,179 | ) | (30,774,218 | ) | (16,666,623 | ) | ||||
| Net unrealized appreciation (depreciation) | $ | 204,626,445 | $ | 205,719,394 | $ | 459,091,614 | $ | 4,584,869 | ||||
| Undistributed ordinary income | $ | 1,238,447 | $ | 26,180,351 | $ | 41,466,638 | $ | 1,444,904 | ||||
| Undistributed long term capital gains | 35,354,951 | 58,114,170 | 68,321,945 | — | ||||||||
| Distributable earnings | $ | 36,593,398 | $ | 84,294,521 | $ | 109,788,583 | $ | 1,444,904 | ||||
Differences between income and/or capital gains as determined on a book basis and a tax basis are primarily due to differing treatments of bond discounts and premiums and foreign currency transactions.
6. Investment Transactions
Purchases and sales of investments (excluding short term securities) for the year ended October 31, 2014, were as follows:
| Franklin | ||||||||
| Franklin | Convertible | Franklin Equity | Franklin Real | |||||
| Balanced Fund | Securities Fund | Income Fund | Return Fund | |||||
| Purchases | $ | 1,480,424,218 | $ | 971,855,866 | $ | 463,885,479 | $ | 124,770,909 |
| Sales | $ | 871,798,530 | $ | 425,618,055 | $ | 393,007,274 | $ | 165,604,201 |
franklintempleton.com
Annual Report | 97
FRANKLIN INVESTORS SECURITIES TRUST
NOTES TO FINANCIAL STATEMENTS
6. Investment Transactions (continued)
Transactions in options written during the year ended October 31, 2014, were as follows:
| Number of | Premiums | ||||
| Contracts | Received | ||||
| Franklin Balanced Fund | |||||
| Options outstanding at October 31, 2013 | 200 | $ | 101,084 | ||
| Options written | 26,500 | 3,596,930 | |||
| Options expired | (17,120 | ) | (1,939,654 | ) | |
| Options exercised | (5,480 | ) | (411,681 | ) | |
| Options closed | (1,600 | ) | (940,161 | ) | |
| Options outstanding at October 31, 2014 | 2,500 | $ | 406,518 |
See Notes 1(e) and 9 regarding derivative financial instruments and other derivative information, respectively.
7. Credit Risk and Defaulted Securities
At October 31, 2014, Franklin Balanced Fund, Franklin Convertible Securities Fund and Franklin Real Return Fund had 8.01%, 78.29% and 11.02%, respectively, of their portfolio invested in high yield securities, senior secured floating rate notes, or other securities rated below investment grade. These securities may be more sensitive to economic conditions causing greater price volatility and are potentially subject to a greater risk of loss due to default than higher rated securities.
Franklin Convertible Securities Fund held a defaulted security and/or other securities for which the income has been deemed uncollectible. At October 31, 2014, the value of this security was $10,500,000, representing 0.49% of the fund’s net assets. The fund discontinues accruing income on securities for which income has been deemed uncollectible and provides an estimate for losses on interest receivable. The securities have been identified on the accompanying Statement of Investments.
8. Restricted Securities
Franklin Convertible Securities Fund invests in securities that are restricted under the Securities Act of 1933 (1933 Act) or which are subject to legal, contractual, or other agreed upon restrictions on resale. Restricted securities are often purchased in private placement transactions, and cannot be sold without prior registration unless the sale is pursuant to an exemption under the 1933 Act. Disposal of these securities may require greater effort and expense, and prompt sale at an acceptable price may be difficult. The fund may have registration rights for restricted securities. The issuer generally incurs all registration costs.
At October 31, 2014, Franklin Convertible Securities Fund held investments in restricted securities, excluding certain securities exempt from registration under the 1933 Act deemed to be liquid, as follows:
| Principal | Acquisition | |||||
| Amount | Issuer | Date | Cost | Value | ||
| $ | 14,000,000 | BearingPoint Liquidating Trust | 12/31/09 | $ | 18,900 | $ — |
98 | Annual Report
franklintempleton.com
FRANKLIN INVESTORS SECURITIES TRUST
NOTES TO FINANCIAL STATEMENTS
9. Other Derivative Information
At October 31, 2014, the funds’investments in derivative contracts are reflected on the Statements of Assets and Liabilities as follows:
| Asset Derivatives | Liability Derivatives | |||||
| Derivative Contracts | ||||||
| Not Accounted for as | Statements of Assets and | Statements of Assets and | ||||
| Hedging Instruments | Liabilities Location | Fair Value | Liabilities Location | Fair Value | ||
| Franklin Balanced Fund | ||||||
| Foreign exchange contracts | Unrealized appreciation on | Unrealized depreciation on forward | ||||
| forward exchange contracts | $ | 321,039 | exchange contracts | $ | 246,620 | |
| Equity contracts | Investments, at value | — | Options written, at value | 162,500 | ||
| Franklin Real Return Fund | ||||||
| Foreign exchange contracts | Unrealized appreciation on | Unrealized depreciation on forward | ||||
| forward exchange contracts | $ | 1,496,776 | exchange contracts | $ | 856,904 |
For the year ended October 31, 2014, the effect of derivative contracts on the funds’ Statements of Operations was as follows:
| Change in | |||||||
| Unrealized | |||||||
| Derivative Contracts | Realized | Appreciation | |||||
| Not Accounted for as | Gain (Loss) | (Depreciation) | |||||
| Hedging Instruments | Statements of Operations Locations | for the Year | for the Year | ||||
| Franklin Balanced Fund | |||||||
| Foreign exchange contracts | Net realized gain (loss) from foreign | ||||||
| currency transactions / Net change | |||||||
| in unrealized appreciation (depreciation) | |||||||
| on translation of other assets and liabilities | |||||||
| denominated in foreign currencies | $ | 2,154 | $ | (2,154 | ) | ||
| Equity contracts | Net realized gain (loss) from investments | ||||||
| and written options / Net change in unrealized | |||||||
| appreciation (depreciation) on investments | 2,773,405 | 167,534 | |||||
| Franklin Real Return Fund | |||||||
| Foreign exchange contracts | Net realized gain (loss) from foreign currency | ||||||
| transactions / Net change in unrealized appreciation | |||||||
| (depreciation) on translation of other assets and | |||||||
| liabilities denominated in foreign currencies | $ | (1,881,353 | ) | $ | 2,178,585 | ||
For the year ended October 31, 2014, the average month end fair value of derivatives represented 0.01% and 0.41%, respectively, of each fund’s average month end net assets. The average month end number of open derivative contracts for the period was 4 and 12, respectively, for each fund.
See Notes 1(e) and 6 regarding derivative financial instruments and investment transactions, respectively.
10. Credit Facility
The Funds, together with other U.S. registered and foreign investment funds (collectively, Borrowers), managed by Franklin Templeton Investments, are borrowers in a joint syndicated senior unsecured credit facility totaling $1.5 billion (Global Credit Facility) which matures on February 13, 2015. This Global Credit Facility provides a source of funds to the Borrowers for temporary and emergency purposes, including the ability to meet future unanticipated or unusually large redemption requests.
franklintempleton.com Annual Report | 99
FRANKLIN INVESTORS SECURITIES TRUST
NOTES TO FINANCIAL STATEMENTS
10. Credit Facility (continued)
Under the terms of the Global Credit Facility, the Funds shall, in addition to interest charged on any borrowings made by the Funds and other costs incurred by the Funds, pay their share of fees and expenses incurred in connection with the implementation and maintenance of the Global Credit Facility, based upon their relative share of the aggregate net assets of all of the Borrowers, including an annual commitment fee of 0.07% based upon the unused portion of the Global Credit Facility. These fees are reflected in other expenses on the Statements of Operations. During the year ended October 31, 2014, the Funds did not use the Global Credit Facility.
11. Fair Value Measurements
The Funds follow a fair value hierarchy that distinguishes between market data obtained from independent sources (observable inputs) and the Funds’ own market assumptions (unobservable inputs). These inputs are used in determining the value of the Funds’ financial instruments and are summarized in the following fair value hierarchy:
- Level 1 – quoted prices in active markets for identical financial instruments
- Level 2 – other significant observable inputs (including quoted prices for similar financial instruments, interest rates, prepayment speed, credit risk, etc.)
- Level 3 – significant unobservable inputs (including the Funds’ own assumptions in determining the fair value of financial instruments)
The input levels are not necessarily an indication of the risk or liquidity associated with financial instruments at that level.
For movements between the levels within the fair value hierarchy, the Funds have adopted a policy of recognizing the transfers as of the date of the underlying event which caused the movement.
A summary of inputs used as of October 31, 2014, in valuing the Funds’ assets and liabilities carried at fair value, is as follows:
| Level 1 | Level 2 | Level 3 | Total | |||||
| Franklin Balanced Fund | ||||||||
| Assets: | ||||||||
| Investments in Securities: | ||||||||
| Equity Investments:a | ||||||||
| Energy | $ | 169,062,750 | $ | 34,397,790 | $ | — | $ | 203,460,540 |
| Utilities | 210,210,615 | 6,560,500 | — | 216,771,115 | ||||
| Other Equity Investmentsb | 1,119,058,133 | — | — | 1,119,058,133 | ||||
| Equity-Linked Securities | — | 130,299,338 | — | 130,299,338 | ||||
| Corporate Bonds | — | 773,462,079 | — | 773,462,079 | ||||
| Short Term Investments | 113,645,527 | — | — | 113,645,527 | ||||
| Total Investments in Securities | $ | 1,611,977,025 | $ | 944,719,707 | $ | — | $ | 2,556,696,732 |
| Other Financial Instruments | ||||||||
| Forward Exchange Contracts | $ | — | $ | 321,039 | $ | — | $ | 321,039 |
| Liabilities: | ||||||||
| Other Financial Instruments | ||||||||
| Options Written | $ | 162,500 | $ | — | $ | — | $ | 162,500 |
| Forward Exchange Contracts | — | 246,620 | — | 246,620 | ||||
| Total Other Financial Instruments | $ | 162,500 | $ | 246,620 | $ | — | $ | 409,120 |
100 | Annual Report franklintempleton.com
| FRANKLIN INVESTORS SECURITIES TRUST | |||||||||||
| NOTES TO FINANCIAL STATEMENTS | |||||||||||
| Level 1 | Level 2 | Level 3 | Total | ||||||||
| Franklin Convertible Securities Fund | |||||||||||
| Assets: | |||||||||||
| Investments in Securities: | |||||||||||
| Equity Investments:a | |||||||||||
| Consumer Staples | $ | 48,174,999 | $ | 13,732,587 | $ | — | $ | 61,907,586 | |||
| Energy | 15,600,000 | 68,182,313 | — | 83,782,313 | |||||||
| Financials | 21,474,015 | 15,416,512 | — | 36,890,527 | |||||||
| Utilities | 78,287,720 | 26,242,000 | — | 104,529,720 | |||||||
| Other Equity Investmentsb | 141,226,246 | — | — | 141,226,246 | |||||||
| Convertible Bonds | — | 1,659,776,618 | —c | 1,659,776,618 | |||||||
| Escrows and Litigation Trusts | — | — | 3,762 | 3,762 | |||||||
| Short Term Investments | 39,603,650 | — | — | 39,603,650 | |||||||
| Total Investments in Securities | $ | 344,366,630 | $ | 1,783,350,030 | $ | 3,762 | c | $ | 2,127,720,422 | ||
| Franklin Equity Income Fund | |||||||||||
| Assets: | |||||||||||
| Investments in Securities | |||||||||||
| Equity Investments:a | |||||||||||
| Energy | $ | 137,183,698 | $ | 17,430,000 | $ | — | $ | 154,613,698 | |||
| Other Equity Investmentsb | 1,847,408,960 | — | — | 1,847,408,960 | |||||||
| Equity-Linked Securities | — | 30,832,500 | — | 30,832,500 | |||||||
| Short Term Investments | 6,941,696 | — | — | 6,941,696 | |||||||
| Total Investments in Securities | $ | 1,991,534,354 | $ | 48,262,500 | $ | — | $ | 2,039,796,854 | |||
| Franklin Real Return Fund | |||||||||||
| Assets: | |||||||||||
| Investments in Securities: | |||||||||||
| Equity Investmentsa,b | $ | 62,343,570 | $ | — | $ | — | $ | 62,343,570 | |||
| Corporate Bonds | — | 23,315,965 | — | 23,315,965 | |||||||
| Senior Floating Rate Interests | — | 16,967,607 | — | 16,967,607 | |||||||
| Foreign Government and Agency Securities | — | 68,955,165 | — | 68,955,165 | |||||||
| U.S. Government and Agency Securities | — | 191,447,102 | — | 191,447,102 | |||||||
| Short Term Investments | — | 19,245,810 | — | 19,245,810 | |||||||
| Total Investments in Securities | $ | 62,343,570 | $ | 319,931,649 | $ | — | $ | 382,275,219 | |||
| Other Financial Instruments | |||||||||||
| Forward Exchange Contracts | $ | — | $ | 1,496,776 | $ | — | $ | 1,496,776 | |||
| Liabilities: | |||||||||||
| Other Financial Instruments | |||||||||||
| Forward Exchange Contracts | $ | — | $ | 856,904 | $ | — | $ | 856,904 | |||
aIncludes common, preferred and convertible preferred stocks as well as other equity investments.
bFor detailed categories, see the accompanying Statement of Investments.
cIncludes a security determined to have no value at October 31, 2014.
A reconciliation of assets in which Level 3 inputs are used in determining fair value is presented when there are significant Level 3
financial instruments at the end of the year.
franklintempleton.com Annual Report | 101
FRANKLIN INVESTORS SECURITIES TRUST
NOTES TO FINANCIAL STATEMENTS
12. New Accounting Pronouncements
In June 2013, the Financial Accounting Standards Board (FASB) issued Accounting Standards Update (ASU) No. 2013-08, Investment Companies (Topic 946): Amendments to the Scope, Measurement, and Disclosure Requirements. The ASU modifies the criteria used in defining an investment company under U.S. Generally Accepted Accounting Principles and also sets forth certain measurement and disclosure requirements. Under the ASU, an entity that is registered under the 1940 Act automatically qualifies as an investment company. The ASU is effective for interim and annual reporting periods beginning after December 15, 2013. Management has reviewed the requirements and believes the adoption of this ASU will not have a material impact on the financial statements.
In June 2014, FASB issued ASU No. 2014-11, Transfers and Servicing (Topic 860), Repurchase-to-Maturity Transactions, Repurchase Financings, and Disclosures. The ASU changes the accounting for certain repurchase agreements and expands disclosure requirements related to repurchase agreements, securities lending, repurchase-to-maturity and similar transactions. The ASU is effective for interim and annual reporting periods beginning after December 15, 2014. Management is currently evaluating the impact, if any, of applying this provision.
13. Subsequent Events
The Funds have evaluated subsequent events through the issuance of the financial statements and determined that no events have occurred that require disclosure.
| Abbreviations | |||||
| Counterparty | Currency | Selected Portfolio | |||
| DBAB | Deutsche Bank AG | BRL | Brazilian Real | ADR | American Depositary Receipt |
| JPHQ | JP Morgan Chase & Co. | EUR | Euro | FRN | Floating Rate Note |
| MSCO | Morgan Stanley | KRW | South Korean Won | ETF | Exchange Traded Fund |
| MXN | Mexican Peso | REIT | Real Estate Investment Trust | ||
| MYR | Malaysian Ringgit | SPDR | S&P Depositary Receipt | ||
| PLN | Polish Zloty | ||||
102 | Annual Report
franklintempleton.com
FRANKLIN INVESTORS SECURITIES TRUST
Report of Independent Registered Public Accounting Firm
To the Board of Trustees and Shareholders of Franklin Investors Securities Trust
In our opinion, the accompanying statements of assets and liabilities, including the statements of investments, and the related statements of operations and of changes in net assets and the financial highlights present fairly, in all material respects, the financial position of Franklin Balanced Fund, Franklin Convertible Securities Fund, Franklin Equity Income Fund and Franklin Real Return Fund (the “Funds”) at October 31, 2014, the results of each of their operations for the year then ended, the changes in each of their net assets for each of the two years in the period then ended and the financial highlights for each of the periods presented, in conformity with accounting principles generally accepted in the United States of America. These financial statements and financial highlights (hereafter referred to as “financial statements”) are the responsibility of the Funds’ management. Our responsibility is to express an opinion on these financial statements based on our audits. We conducted our audits of these financial statements in accordance with the standards of the Public Company Accounting Oversight Board (United States). Those standards require that we plan and perform the audit to obtain reasonable assurance about whether the financial statements are free of material misstatement. An audit includes examining, on a test basis, evidence supporting the amounts and disclosures in the financial statements, assessing the accounting principles used and significant estimates made by management, and evaluating the overall financial statement presentation. We believe that our audits, which included confirmation of securities at October 31, 2014 by correspondence with the custodian, transfer agent and brokers, provide a reasonable basis for our opinion.
PricewaterhouseCoopers LLP
San Francisco, California
December 19, 2014
franklintempleton.com
Annual Report
| 103
FRANKLIN INVESTORS SECURITIES TRUST
Tax Information (unaudited)
Under Section 852(b)(3)(C) of the Internal Revenue Code (Code), the Funds hereby report the maximum amount allowable but no less than the following amounts as long term capital gain dividends for the fiscal year ended October 31, 2014.
| Franklin | Franklin | ||||
| Franklin | Convertible | Equity | |||
| Balanced Fund | Securities Fund | Income Fund | |||
| $ | 22,673,876 | $ | 6,545,249 | $ | 10,278,080 |
Under Section 871(k)(2)(C) of the Code, the Franklin Balanced Fund hereby reports the maximum amount allowable but no less than $4,670,761 as a short term capital gain dividend for purposes of the tax imposed under Section 871(a)(1)(A) of the Code for the fiscal year ended October 31, 2014.
Under Section 854(b)(1)(A) of the Code, the Funds hereby report the following percentage amounts of the ordinary income dividends as income qualifying for the dividends received deduction for the fiscal year ended October 31, 2014.
| Franklin | Franklin | Franklin | |||||
| Franklin | Convertible | Equity | Real | ||||
| Balanced Fund | Securities Fund | Income Fund | Return Fund | ||||
| 52.24 | % | 21.48 | % | 100 | % | 5.42 | % |
| Under Section 854(b) (1) (B) of the Code, the Funds hereby report the maximum amount allowable but no less than the following |
| amounts as qualified dividends for purposes of the maximum rate under Section 1(h)(11) of the Code for the fiscal year ended |
| October 31, 2014. |
| Franklin | Franklin | Franklin | |||||
| Franklin | Convertible | Equity | Real | ||||
| Balanced Fund | Securities Fund | Income Fund | Return Fund | ||||
| $ | 49,202,208 | $ | 7,386,708 | $ | 57,172,441 | $ | 685,960 |
Distributions, including qualified dividend income, paid during calendar year 2014 will be reported to shareholders on Form 1099-DIV by mid-February 2015. Shareholders are advised to check with their tax advisors for information on the treatment of these amounts on their individual income tax returns.
Under Section 871(k)(1)(C) of the Code, the Franklin Convertible Securities Fund hereby reports the maximum amount allowable but no less than $11,650,061 as interest related dividends for purposes of the tax imposed under Section 871(a)(1)(A) of the Code for the fiscal year ended October 31, 2014.
104 | Annual Report
franklintempleton.com
FRANKLIN INVESTORS SECURITIES TRUST
Board Members and Officers
The name, year of birth and address of the officers and board members, as well as their affiliations, positions held with the Trust, principal occupations during the past five years and number of portfolios overseen in the Franklin Templeton Investments fund complex are shown below. Generally, each board member serves until that person’s successor is elected and qualified.
| Independent Board Members | ||||
| Number of Portfolios in | ||||
| Name, Year of Birth | Length of | Fund Complex Overseen | Other Directorships Held | |
| and Address | Position | Time Served | by Board Member* | During at Least the Past 5 Years |
| Harris J. Ashton (1932) | Trustee | Since 1986 | 137 | Bar-S Foods (meat packing company) |
| One Franklin Parkway | (1981-2010). | |||
| San Mateo, CA 94403-1906 | ||||
| Principal Occupation During at Least the Past 5 Years: | ||||
| Director of various companies; and formerly, Director, RBC Holdings, Inc. (bank holding company) (until 2002); and President, Chief Executive | ||||
| Officer and Chairman of the Board, General Host Corporation (nursery and craft centers) (until 1998). | ||||
| Mary C. Choksi (1950) | Trustee | Since | 111 | Avis Budget Group Inc. (car rental), |
| One Franklin Parkway | October 2014 | Omnicom Group Inc. (advertising and | ||
| San Mateo, CA 94403-1906 | marketing communications services) | |||
| and H.J. Heinz Company (processed | ||||
| foods and allied products) (1998-2006). | ||||
| Principal Occupation During at Least the Past 5 Years: | ||||
| Founding Partner and Senior Managing Director, Strategic Investment Group (investment management group) (1987-present); director of | ||||
| various companies; and formerly, Founding Partner and Managing Director, Emerging Markets Management LLC (investment management | ||||
| firm) (1987-2011); Loan Officer/Senior Loan Officer/Senior Pension Investment Officer, World Bank Group (international financial institution) | ||||
| (1977-1987). | ||||
| Sam Ginn (1937) | Trustee | Since 2007 | 111 | ICO Global Communications |
| One Franklin Parkway | (Holdings) Limited (satellite company) | |||
| San Mateo, CA 94403-1906 | (2006-2010), Chevron Corporation | |||
| (global energy company) (1989-2009), | ||||
| Hewlett-Packard Company (technology | ||||
| company) (1996-2002), Safeway, Inc. | ||||
| (grocery retailer) (1991-1998) and | ||||
| TransAmerica Corporation (insurance | ||||
| company) (1989-1999). | ||||
| Principal Occupation During at Least the Past 5 Years: | ||||
| Private investor; and formerly, Chairman, First Responder Network Authority (FirstNet) (interoperable wireless broadband network) | ||||
| (2012-2014); Chairman of the Board, Vodafone AirTouch, PLC (wireless company) (1999-2000); Chairman of the Board and Chief | ||||
| Executive Officer, AirTouch Communications (cellular communications) (1993-1998) and Pacific Telesis Group (telephone holding | ||||
| company) (1988-1994). | ||||
| Edith E. Holiday (1952) | Trustee | Since 1998 | 137 | Hess Corporation (exploration and |
| One Franklin Parkway | refining of oil and gas), H.J. Heinz | |||
| San Mateo, CA 94403-1906 | Company (processed foods and | |||
| allied products) (1994-2013), RTI | ||||
| International Metals, Inc. (manufacture | ||||
| and distribution of titanium), Canadian | ||||
| National Railway (railroad) and White | ||||
| Mountains Insurance Group, Ltd. | ||||
| (holding company). | ||||
| Principal Occupation During at Least the Past 5 Years: | ||||
| Director or Trustee of various companies and trusts; and formerly, Assistant to the President of the United States and Secretary of the | ||||
| Cabinet (1990-1993); General Counsel to the United States Treasury Department (1989-1990); and Counselor to the Secretary and Assistant | ||||
| Secretary for Public Affairs and Public Liaison – United States Treasury Department (1988-1989). | ||||
franklintempleton.com Annual Report | 105
FRANKLIN INVESTORS SECURITIES TRUST
| Independent Board Members (continued) | ||||
| Number of Portfolios in | ||||
| Name, Year of Birth | Length of | Fund Complex Overseen | Other Directorships Held | |
| and Address | Position | Time Served | by Board Member* | During at Least the Past 5 Years |
| J. Michael Luttig (1954) | Trustee | Since 2009 | 137 | Boeing Capital Corporation |
| One Franklin Parkway | (aircraft financing) (2006-2013). | |||
| San Mateo, CA 94403-1906 | ||||
| Principal Occupation During at Least the Past 5 Years: | ||||
| Executive Vice President, General Counsel and member of the Executive Council, The Boeing Company (aerospace company); and formerly, | ||||
| Federal Appeals Court Judge, U.S. Court of Appeals for the Fourth Circuit (1991-2006). | ||||
| Frank A. Olson (1932) | Trustee | Since 2005 | 137 | Hess Corporation (exploration and |
| One Franklin Parkway | refining of oil and gas) (1998-2013). | |||
| San Mateo, CA 94403-1906 | ||||
| Principal Occupation During at Least the Past 5 Years: | ||||
| Director of various companies; and formerly, Chairman of the Board, The Hertz Corporation (car rental) (1980-2000) and Chief Executive | ||||
| Officer (1977-1999)); and Chairman of the Board, President and Chief Executive Officer, UAL Corporation (airlines) (June-December 1987). | ||||
| Larry D. Thompson (1945) | Trustee | Since 2007 | 137 | Cbeyond, Inc. (business communi- |
| One Franklin Parkway | cations provider) (2010-2012), | |||
| San Mateo, CA 94403-1906 | The Southern Company (energy | |||
| company) (December 2014; | ||||
| previously 2010-2012) and Graham | ||||
| Holdings Company (education and | ||||
| media organization) (2011-present). | ||||
| Principal Occupation During at Least the Past 5 Years: | ||||
| Executive Vice President – Government Affairs, General Counsel and Corporate Secretary, PepsiCo, Inc. (consumer products) (2012-present); | ||||
| and formerly, John A. Sibley Professor of Corporate and Business Law, University of Georgia School of Law (2011-2012); Senior Vice | ||||
| President – Government Affairs, General Counsel and Secretary, PepsiCo, Inc. (2004-2011); Senior Fellow of The Brookings Institution | ||||
| (2003-2004); Visiting Professor, University of Georgia School of Law (2004); and Deputy Attorney General, U.S. Department of Justice | ||||
| (2001-2003). | ||||
| John B. Wilson (1959) | Lead | Trustee since | 111 | None |
| One Franklin Parkway | Independent | 2007 and Lead | ||
| San Mateo, CA 94403-1906 | Trustee | Independent | ||
| Trustee since 2008 | ||||
| Principal Occupation During at Least the Past 5 Years: | ||||
| President, Staples Europe (office supplies) (2012-present); President and Founder, Hyannis Port Capital, Inc. (real estate and private equity | ||||
| investing); serves on private and non-profit boards; and formerly, Chief Operating Officer and Executive Vice President, Gap, Inc. (retail) | ||||
| (1996-2000); Chief Financial Officer and Executive Vice President – Finance and Strategy, Staples, Inc. (1992-1996); Senior Vice President – | ||||
| Corporate Planning, Northwest Airlines, Inc. (airlines) (1990-1992); and Vice President and Partner, Bain & Company (consulting firm) | ||||
| (1986-1990). | ||||
106 | Annual Report franklintempleton.com
FRANKLIN INVESTORS SECURITIES TRUST
| Interested Board Members and Officers | ||||
| Number of Portfolios in | ||||
| Name, Year of Birth | Length of | Fund Complex Overseen | Other Directorships Held | |
| and Address | Position | Time Served | by Board Member* | During at Least the Past 5 Years |
| **Gregory E. Johnson (1961) | Trustee | Since 2013 | 147 | None |
| One Franklin Parkway | ||||
| San Mateo, CA 94403-1906 | ||||
| Principal Occupation During at Least the Past 5 Years: | ||||
| Chairman of the Board, Member – Office of the Chairman, Director, President and Chief Executive Officer, Franklin Resources, Inc.; officer | ||||
| and/or director or trustee, as the case may be, of some of the other subsidiaries of Franklin Resources, Inc. and of 44 of the investment | ||||
| companies in Franklin Templeton Investments; and Vice Chairman, Investment Company Institute. | ||||
| **Rupert H. Johnson, Jr. (1940) Chairman of | Chairman of the | 137 | None | |
| One Franklin Parkway | the Board, | Board since 2013, | ||
| San Mateo, CA 94403-1906 | Trustee and | Trustee since 1987 | ||
| Vice President | and Vice President | |||
| since 1986 | ||||
| Principal Occupation During at Least the Past 5 Years: | ||||
| Vice Chairman, Member – Office of the Chairman and Director, Franklin Resources, Inc.; Director, Franklin Advisers, Inc.; Senior Vice | ||||
| President, Franklin Advisory Services, LLC; and officer and/or director or trustee, as the case may be, of some of the other subsidiaries of | ||||
| Franklin Resources, Inc. and of 41 of the investment companies in Franklin Templeton Investments. | ||||
| Alison E. Baur (1964) | Vice President | Since 2012 | Not Applicable | Not Applicable |
| One Franklin Parkway | ||||
| San Mateo, CA 94403-1906 | ||||
| Principal Occupation During at Least the Past 5 Years: | ||||
| Deputy General Counsel, Franklin Templeton Investments; and officer of some of the other subsidiaries of Franklin Resources, Inc. and of | ||||
| 46 of the investment companies in Franklin Templeton Investments. | ||||
| Mark Boyadjian (1964) | Vice President | Since 2003 | Not Applicable | Not Applicable |
| One Franklin Parkway | ||||
| San Mateo, CA 94403-1906 | ||||
| Principal Occupation During at Least the Past 5 Years: | ||||
| Senior Vice President, Franklin Advisers, Inc.; and officer of two of the investment companies in Franklin Templeton Investments. | ||||
| Laura F. Fergerson (1962) | Chief | Since 2009 | Not Applicable | Not Applicable |
| One Franklin Parkway | Executive | |||
| San Mateo, CA 94403-1906 | Officer – | |||
| Finance and | ||||
| Administration | ||||
| Principal Occupation During at Least the Past 5 Years: | ||||
| Senior Vice President, Franklin Templeton Services, LLC; and officer of 46 of the investment companies in Franklin Templeton Investments. | ||||
| Gaston Gardey (1967) | Treasurer, | Since 2009 | Not Applicable | Not Applicable |
| One Franklin Parkway | Chief Financial | |||
| San Mateo, CA 94403-1906 | Officer and | |||
| Chief | ||||
| Accounting | ||||
| Officer | ||||
| Principal Occupation During at Least the Past 5 Years: | ||||
| Director, Fund Accounting, Franklin Templeton Investments; and officer of 27 of the investment companies in Franklin Templeton Investments. | ||||
franklintempleton.com Annual Report | 107
| FRANKLIN INVESTORS SECURITIES TRUST | ||||
| Interested Board Members and Officers (continued) | ||||
| Number of Portfolios in | ||||
| Name, Year of Birth | Length of | Fund Complex Overseen | Other Directorships Held | |
| and Address | Position | Time Served | by Board Member* | During at Least the Past 5 Years |
| Aliya S. Gordon (1973) | Vice President | Since 2009 | Not Applicable | Not Applicable |
| One Franklin Parkway | ||||
| San Mateo, CA 94403-1906 | ||||
| Principal Occupation During at Least the Past 5 Years: | ||||
| Senior Associate General Counsel, Franklin Templeton Investments; officer of 46 of the investment companies in Franklin Templeton | ||||
| Investments; and formerly, Litigation Associate, Steefel, Levitt & Weiss, LLP (2000-2004). | ||||
| Steven J. Gray (1955) | Vice President | Since 2009 | Not Applicable | Not Applicable |
| One Franklin Parkway | ||||
| San Mateo, CA 94403-1906 | ||||
| Principal Occupation During at Least the Past 5 Years: | ||||
| Senior Associate General Counsel, Franklin Templeton Investments; Vice President, Franklin Templeton Distributors, Inc. and Franklin | ||||
| Alternative Strategies Advisers, LLC; and officer of 46 of the investment companies in Franklin Templeton Investments. | ||||
| Selena L. Holmes (1965) | Vice President | Since 2012 | Not Applicable | Not Applicable |
| 100 Fountain Parkway | – AML | |||
| St. Petersburg, FL 33716-1205 | Compliance | |||
| Principal Occupation During at Least the Past 5 Years: | ||||
| Director, Global Compliance Monitoring; Chief Compliance Officer, Franklin Alternative Strategies Advisers, LLC; Vice President, Franklin | ||||
| Templeton Companies, LLC; and officer of 46 of the investment companies in Franklin Templeton Investments. | ||||
| Richard Hsu (1973) | Vice President | Since 2010 | Not Applicable | Not Applicable |
| One Franklin Parkway | ||||
| San Mateo, CA 94403-1906 | ||||
| Principal Occupation During at Least the Past 5 Years: | ||||
| Vice President, Franklin Advisers, Inc.; and officer of three of the investment companies in Franklin Templeton Investments. | ||||
| Edward B. Jamieson (1948) | President and | President since | Not Applicable | Not Applicable |
| One Franklin Parkway | Chief Executive 1993 and Chief | |||
| San Mateo, CA 94403-1906 | Officer – | Executive Officer | ||
| Investment | – Investment | |||
| Management | Management since | |||
| 2002 | ||||
| Principal Occupation During at Least the Past 5 Years: | ||||
| President, Chief Investment Officer and Director, Franklin Advisers, Inc.; Executive Vice President, Franklin Templeton Institutional, LLC; and | ||||
| officer and/or trustee, as the case may be, of some of the other subsidiaries of Franklin Resources, Inc. and of 10 of the investment | ||||
| companies in Franklin Templeton Investments. | ||||
| Madeline Lam (1969) | Vice President | Since 2010 | Not Applicable | Not Applicable |
| One Franklin Parkway | ||||
| San Mateo, CA 94403-1906 | ||||
| Principal Occupation During at Least the Past 5 Years: | ||||
| Vice President, Franklin Advisers, Inc.; and officer of two of the investment companies in Franklin Templeton Investments. | ||||
| Kimberly H. Novotny (1972) | Vice President | Since 2013 | Not Applicable | Not Applicable |
| 300 S.E. 2nd Street | ||||
| Fort Lauderdale, FL 33301-1923 | ||||
| Principal Occupation During at Least the Past 5 Years: | ||||
| Associate General Counsel, Franklin Templeton Investments; Vice President and Secretary, Fiduciary Trust International of the South; Vice | ||||
| President, Templeton Investment Counsel, LLC; Assistant Secretary, Franklin Resources, Inc.; and officer of 46 of the investment companies | ||||
| in Franklin Templeton Investments. | ||||
| 108 | Annual Report | franklintempleton.com | |||
FRANKLIN INVESTORS SECURITIES TRUST
| Interested Board Members and Officers (continued) | ||||
| Number of Portfolios in | ||||
| Name, Year of Birth | Length of | Fund Complex Overseen | Other Directorships Held | |
| and Address | Position | Time Served | by Board Member* | During at Least the Past 5 Years |
| Robert C. Rosselot (1960) | Chief | Since 2013 | Not Applicable | Not Applicable |
| 300 S.E. 2nd Street | Compliance | |||
| Fort Lauderdale, FL 33301-1923 | Officer | |||
| Principal Occupation During at Least the Past 5 Years: | ||||
| Director, Global Compliance, Franklin Templeton Investments; Vice President, Franklin Templeton Companies, LLC; officer of 46 of the | ||||
| investment companies in Franklin Templeton Investments; and formerly, Senior Associate General Counsel, Franklin Templeton Investments | ||||
| (2007-2013); and Secretary and Vice President, Templeton Group of Funds (2004-2013). | ||||
| Karen L. Skidmore (1952) | Vice President | Since 2006 | Not Applicable | Not Applicable |
| One Franklin Parkway | and Secretary | |||
| San Mateo, CA 94403-1906 | ||||
| Principal Occupation During at Least the Past 5 Years: | ||||
| Senior Associate General Counsel, Franklin Templeton Investments; and officer of 46 of the investment companies in Franklin Templeton | ||||
| Investments. | ||||
| Craig S. Tyle (1960) | Vice President | Since 2005 | Not Applicable | Not Applicable |
| One Franklin Parkway | ||||
| San Mateo, CA 94403-1906 | ||||
| Principal Occupation During at Least the Past 5 Years: | ||||
| General Counsel and Executive Vice President, Franklin Resources, Inc.; and officer of some of the other subsidiaries of Franklin Resources, | ||||
| Inc. and of 46 of the investment companies in Franklin Templeton Investments. | ||||
| Lori A. Weber (1964) | Vice President | Since 2011 | Not Applicable | Not Applicable |
| 300 S.E. 2nd Street | ||||
| Fort Lauderdale, FL 33301-1923 | ||||
| Principal Occupation During at Least the Past 5 Years: | ||||
| Senior Associate General Counsel, Franklin Templeton Investments; Assistant Secretary, Franklin Resources, Inc.; Vice President and | ||||
| Secretary, Templeton Investment Counsel, LLC; Vice President, Fiduciary Trust International of the South; and officer of 46 of the investment | ||||
| companies in Franklin Templeton Investments. | ||||
*We base the number of portfolios on each separate series of the U.S. registered investment companies within the Franklin Templeton Investments fund complex. These
portfolios have a common investment manager or affiliated investment managers.
**Gregory E. Johnson is considered to be an interested person of the Fund under the federal securities laws due to his position as an officer and director of Franklin
Resources, Inc. (Resources), which is the parent company of the Fund’s investment manager and distributor. Rupert H. Johnson, Jr. is considered to be an interested
person of the Fund under the federal securities laws due to his position as officer and director and major shareholder of Resources.
Note 1: Rupert H. Johnson, Jr. is the uncle of Gregory E. Johnson.
Note 2: Officer information is current as of the date of this report. It is possible that after this date, information about officers may change.
The Sarbanes-Oxley Act of 2002 and Rules adopted by the Securities and Exchange Commission require the Fund to disclose whether the Fund’s Audit Committee
includes at least one member who is an audit committee financial expert within the meaning of such Act and Rules. The Fund’s Board has determined that there
is at least one such financial expert on the Audit Committee and has designated John B. Wilson as its audit committee financial expert. The Board believes that
Mr. Wilson qualifies as such an expert in view of his extensive business background and experience, including service as chief financial officer of Staples, Inc.
from 1992 to 1996. Mr. Wilson has been a Member and Chairman of the Fund’s Audit Committee since 2007. As a result of such background and experience, the
Board believes that Mr. Wilson has acquired an understanding of generally accepted accounting principles and financial statements, the general application of
such principles in connection with the accounting estimates, accruals and reserves, and analyzing and evaluating financial statements that present a breadth
and level of complexity of accounting issues generally comparable to those of the Fund, as well as an understanding of internal controls and procedures for
financial reporting and an understanding of audit committee functions. Mr. Wilson is an independent Board member as that term is defined under the relevant
Securities and Exchange Commission Rules and Releases.
The Statement of Additional Information (SAI) includes additional information about the board members and is available, without charge, upon request.
Shareholders may call (800) DIAL BEN/342-5236 to request the SAI.
franklintempleton.com Annual Report | 109
FRANKLIN INVESTORS SECURITIES TRUST
Shareholder Information
Proxy Voting Policies and Procedures
The Trust’s investment manager has established Proxy Voting Policies and Procedures (Policies) that the Trust uses to determine how to vote proxies relating to portfolio securities. Shareholders may view the Trust’s complete Policies online at franklintempleton.com. Alternatively, shareholders may request copies of the Policies free of charge by calling the Proxy Group collect at (954) 527-7678 or by sending a written request to: Franklin Templeton Companies, LLC, 300 S.E. 2nd Street, Fort Lauderdale, FL 33301, Attention: Proxy Group. Copies of the Trust’s proxy voting records are also made available online at franklintempleton.com and posted on the U.S. Securities and Exchange Commission’s website at sec.gov and reflect the most recent 12-month period ended June 30.
Quarterly Statement of Investments
The Trust files a complete statement of investments with the U.S. Securities and Exchange Commission for the first and third quarters for each fiscal year on Form N-Q. Shareholders may view the filed Form N-Q by visiting the Commission’s website at sec.gov. The filed form may also be viewed and copied at the Commission’s Public Reference Room in Washington, DC. Information regarding the operations of the Public Reference Room may be obtained by calling (800) SEC-0330.
Householding of Reports and Prospectuses
You will receive each Fund’s financial reports every six months as well as an annual updated summary prospectus (prospectus available upon request). To reduce Fund expenses, we try to identify related shareholders in a household and send only one copy of the financial reports and summary prospectus. This process, called “householding,” will continue indefinitely unless you instruct us otherwise. If you prefer not to have these documents householded, please call us at (800) 632-2301. At any time you may view current prospectuses/summary prospectuses and financial reports on our website. If you choose, you may receive these documents through electronic delivery.
110 | Annual Report
franklintempleton.com
This page intentionally left blank.
This page intentionally left blank.
| Contents | |
| Shareholder Letter | 1 |
| Annual Report | |
| Economic and Market Overview | 3 |
| Franklin Adjustable | |
| U.S. Government Securities Fund | 4 |
| Franklin Floating Rate | |
| Daily Access Fund | 14 |
| Franklin Low Duration | |
| Total Return Fund | 25 |
| Franklin Total Return Fund | 35 |
| Financial Highlights and | |
| Statements of Investments | 45 |
| Financial Statements | 123 |
| Notes to Financial Statements | 128 |
| Report of Independent Registered | |
| Public Accounting Firm | 152 |
| Tax Information | 153 |
| Board Members and Officers | 154 |
| Shareholder Information | 159 |
franklintempleton.com
| 1
Annual Report
Economic and Market Overview
The U.S. economy continued to grow during the 12-month period ended October 31, 2014, underpinned by manufacturing activity, consumer and business spending, and generally rising inventories. Economic activity expanded in the third quarter, resulting largely from increased federal defense spending and a narrower trade deficit. Except for a sharp rebound in March, retail sales missed consensus expectations for most of the period under review. In the housing market, home sales experienced some weather-related weakness early in 2014 but began to recover in May, and home prices stayed higher than a year earlier. The unemployment rate declined to 5.8% in October 2014 from 7.2% in October 2013.1 Inflation, as measured by the Consumer Price Index, remained low for the period.
In January 2014, the U.S. Federal Reserve Board (Fed) began reducing its bond purchases $10 billion a month, based on largely positive economic and employment data in late 2013. After further gradual reductions during the year, the Fed ended its asset purchase program in October based on its view that underlying economic strength could support ongoing progress in labor market conditions. The Fed reaffirmed it would maintain its near-zero interest rate policy for a “considerable time” and stated its actions to normalize monetary policy remained dependent on economic performance. Additionally, the Fed noted that although inflation might remain low in the near term, the likelihood of inflation running persistently below its 2% longer term goal had diminished somewhat since early 2014.
The 10-year Treasury yield rose from 2.57% at the beginning of the period to a high of 3.04% on December 31, 2013, mainly because of an improved economic environment and market uncertainty about the Fed’s plans. However, the yield declined to 2.35% at period-end as investors shifted to less risky assets following the crises in Ukraine and the Middle East, growth concerns about emerging markets, record-low bond yields, weak economic data in Europe and lower Treasury issuance.
The foregoing information reflects our analysis and opinions as of October 31, 2014. The information is not a complete analysis of every aspect of any market, country, industry, security or fund. Statements of fact are from sources considered reliable.
1. Source: Bureau of Labor Statistics.
franklintempleton.com Annual Report | 3
Franklin Adjustable U.S. Government Securities Fund
We are pleased to bring you Franklin Adjustable U.S. Government Securities Fund’s annual report for the fiscal year ended October 31, 2014. Franklin Limited Maturity U.S. Government Securities Fund merged into Franklin Adjustable U.S. Government Securities Fund on June 18, 2014. Franklin Limited Maturity U.S. Government Securities Fund’s former shareholders may receive the Fund’s annual report upon request and without charge by calling (800) 342-5236 or by downloading it from our website, franklintempleton.com.
Your Fund’s Goal and Main Investments
The Fund seeks to provide a high level of current income while providing lower volatility of principal than a fund that invests in fixed-rate securities by investing at least 80% of its net assets in adjustable-rate U.S. government mortgage securities, which are issued or guaranteed by the U.S. government, its agencies or instrumentalities.1 The Fund’s investments may include securities issued by Ginnie Mae (GNMA) and government-sponsored entities, such as Fannie Mae (FNMA) and Freddie Mac (FHLMC).2
Performance Overview
The Fund’s Class A shares delivered a +0.56% cumulative total return for the 12 months under review. In comparison, the Fund’s benchmark, the Barclays U.S. Government Index: 1-2 Year Component, posted a +0.53% total return.3 The index measures public obligations of the U.S. Treasury with one to two years to final maturity and publicly issued debt of U.S. government agencies, quasi-federal corporations, and corporate or foreign debt guaranteed by the U.S. government. You can find the Fund’s long-term performance data in the Performance Summary beginning on page 7.
Performance data represent past performance, which does not guarantee future results. Investment return and principal value will fluctuate, and you may have a gain or loss when you sell your shares. Current performance may differ from figures shown. Please visit franklintempleton.com or call (800) 342-5236 for most recent month-end performance.
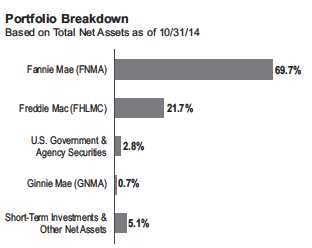
Investment Strategy
We employ a conservative investment strategy as we strive to produce solid performance in a variety of interest rate climates. We choose securities using a value-oriented approach, emphasizing the bonds’ economic fundamentals in relation to comparable securities as well as their historical prepayment performance.
Manager’s Discussion
Although U.S. growth contracted in the first quarter of 2014, data for the second quarter of 2014 indicated the economy had rebounded more strongly and broadly than originally estimated, driven by increased personal consumption, private inventory investment, exports, residential and nonresidential fixed investment, and local government spending. Economic activity expanded in the third quarter, underpinned by increased federal defense spending and a narrower trade deficit. Housing data continued to recover, after the effects subsided from 2013’s severe winter and higher mortgage rates. Consumer price inflation remained subdued for the period.
1. Securities owned by the Fund, but not shares of the Fund, are issued or guaranteed by the U.S. government, its agencies or instrumentalities, including government-
sponsored entities, as to timely payment of principal and interest.
2. Although U.S. government-sponsored entities may be chartered or sponsored by acts of Congress, their securities are neither issued nor guaranteed by the U.S.
government. Please see the Fund’s prospectus for a detailed discussion regarding various levels of credit support for government agency or instrumentality securities.
The Fund’s yield and share price are not guaranteed and will vary with market conditions.
3. Source: Morningstar.
The index is unmanaged and includes reinvested interest. One cannot invest directly in an index, and an index is not representative of the Fund’s portfolio.
The dollar value, number of shares or principal amount, and names of all portfolio holdings are listed in the Fund’s Statement of Investments (SOI).
The SOI begins on page 50.
4 | Annual Report franklintempleton.com
FRANKLIN ADJUSTABLE U.S. GOVERNMENT SECURITIES FUND
In a sign of more confidence in the economic outlook, the Federal Reserve Board (Fed) revised its quantitative easing policy by reducing its monthly asset purchases starting in January. After further gradual reductions during the year, the Fed ended its asset purchase program in October and reaffirmed it would maintain its low interest rate policy for a “considerable time.”
| Dividend Distributions* | |||||
| 11/1/13–10/31/14 | |||||
| Dividend per Share (cents) | |||||
| Advisor | |||||
| Month | Class A | Class A1** Class C | Class R6 | Class | |
| November | 0.9245 | — | 0.6476 | 1.1626 | 1.0992 |
| December | 0.9683 | — | 0.6626 | 1.2239 | 1.1603 |
| January | 0.9155 | — | 0.6233 | 1.1444 | 1.1017 |
| February | 0.9555 | — | 0.6866 | 1.1989 | 1.1226 |
| March | 0.8712 | — | 0.5771 | 1.1208 | 1.0553 |
| April | 0.8461 | — | 0.5595 | 1.0901 | 1.0259 |
| May | 0.7093 | — | 0.4236 | 0.9593 | 0.8888 |
| June | 0.6803 | 0.3152 | 0.3873 | 0.9356 | 0.8651 |
| July | 0.6896 | 0.8009 | 0.3945 | 0.9460 | 0.8749 |
| August | 0.6706 | 0.7755 | 0.3945 | 0.9100 | 0.8440 |
| September | 0.8860 | 1.0019 | 0.5813 | 1.1570 | 1.0774 |
| October | 0.7721 | 0.8958 | 0.4777 | 1.0938 | 0.9587 |
| Total | 9.8890 | 3.7893 | 6.4156 | 12.9424 | 12.0739 |
The Fund employed a conservative strategy that invested primarily in adjustable-rate mortgages (ARMs) that are either explicitly or implicitly backed by the U.S. government.1 These include securities issued or guaranteed by FNMA, FHLMC or GNMA. The Fund took a collateral-intensive research approach to analyze the prepayment behavior of individual ARM securities to identify those with the most attractive prepayment profiles and focused on seasoned ARMs. These securities have typically been through several interest rate cycles and therefore tend to be less sensitive to changes in interest rates, compared to newer issued counterparts. We have found such securities historically have experienced lower volatility than comparable maturity Treasuries and have provided more consistent income. We continued to focus on seasoned, post-reset FNMA and FHLMC ARM positions with average coupons below 3%.
As interest rates and mortgage rates have moved higher, and mortgage credit has remained constrained, actual prepayment levels have been relatively low. The Fund’s focus on seasoned, short duration, high-quality ARMs that tend to be less sensitive to interest rate changes benefited performance, as did the Fund’s post-reset LIBOR indexed securities.4
*Assumes shares were purchased and held for the entire accrual period. Since
dividends accrue daily, your actual distributions will vary depending on the date
you purchased your shares and any account activity. All Fund distributions will vary
depending upon current market conditions, and past distributions are not indicative
of future trends.
**Effective 6/18/14, the Fund began offering Class A1 shares.
4. The London Interbank Offered Rate (LIBOR) is the interest rate banks charge each other for loans. LIBOR is a widely used benchmark for short-term interest rates.
See www.franklintempletondatasources.com for additional data provider information.
franklintempleton.com Annual Report | 5
FRANKLIN ADJUSTABLE U.S. GOVERNMENT SECURITIES FUND
Thank you for your continued participation in Franklin Adjustable U.S. Government Securities Fund. We look forward to serving your future investment needs.


The foregoing information reflects our analysis, opinions and portfolio holdings as of October 31, 2014, the end of the reporting period. The way we implement our main investment strategies and the resulting portfolio holdings may change depending on factors such as market and economic conditions. These opinions may not be relied upon as investment advice or an offer for a particular security. The information is not a complete analysis of every aspect of any market, country, industry, security or the Fund. Statements of fact are from sources considered reliable, but the investment manager makes no representation or warranty as to their completeness or accuracy. Although historical performance is no guarantee of future results, these insights may help you understand our investment management philosophy.
CFA® is a trademark owned by CFA Institute.
6 | Annual Report franklintempleton.com
FRANKLIN ADJUSTABLE U.S. GOVERNMENT SECURITIES FUND
Performance Summary as of October 31, 2014
Your dividend income will vary depending on dividends or interest paid by securities in the Fund’s portfolio, adjusted for operating expenses of each class. Capital gain distributions are net profits realized from the sale of portfolio securities. The performance tables and graphs do not reflect any taxes that a shareholder would pay on Fund dividends, capital gain distributions, if any, or any realized gains on the sale of Fund shares. Total return reflects reinvestment of the Fund’s dividends and capital gain distributions, if any, and any unrealized gains or losses.
| Net Asset Value | ||||||
| Share Class (Symbol) | 10/31/14 | 10/31/13 | Change | |||
| A (FISAX) | $ | 8.67 | $ | 8.72 | -$ | 0.05 |
| C (FCSCX) | $ | 8.66 | $ | 8.71 | -$ | 0.05 |
| R6 (N/A) | $ | 8.68 | $ | 8.73 | -$ | 0.05 |
| Advisor (FAUZX) | $ | 8.68 | $ | 8.73 | -$ | 0.05 |
| 10/31/14 | 6/18/14 | |||||
| A1 (FAUGX) | $ | 8.67 | $ | 8.68 | -$ | 0.01 |
| Distributions | ||
| Dividend | ||
| Share Class | Income | |
| A(11/1/13-10/31/14) | $ | 0.098890 |
| A1(6/18/14-10/31/14) | $ | 0.037893 |
| C(11/1/13-10/31/14) | $ | 0.064156 |
| R6(11/1/13-10/31/14) | $ | 0.129424 |
| Advisor (11/1/13-10/31/14) | $ | 0.120739 |
franklintempleton.com Annual Report | 7
FRANKLIN ADJUSTABLE U.S. GOVERNMENT SECURITIES FUND
PERFORMANCE SUMMARY
Performance as of 10/31/141
Cumulative total return excludes sales charges. Average annual total returns include maximum sales charges. Class A/A1: 2.25% maximum initial sales charge; Class C: 1% contingent deferred sales charge in first year only;
Class R6/Advisor Class: no sales charges.
| Cumulative | Average Annual | Average Annual | Total Annual | ||||||||
| Share Class | Total Return2 | Total Return3 | Total Return (9/30/14)4 | Operating Expenses5 | |||||||
| A | 0.87 | % | |||||||||
| 1-Year | + | 0.56 | % | -1.69 | % | -1.68 | % | ||||
| 5-Year | + | 5.68 | % | + | 0.64 | % | + | 0.63 | % | ||
| 10-Year | + | 26.97 | % | + | 2.18 | % | + | 2.19 | % | ||
| A16 | 0.72 | % | |||||||||
| 1-Year | + | 0.62 | % | -1.63 | % | + | 0.62 | % | |||
| 5-Year | + | 5.74 | % | + | 0.66 | % | + | 1.10 | % | ||
| 10-Year | + | 27.04 | % | + | 2.19 | % | + | 2.42 | % | ||
| C | 1.27 | % | |||||||||
| 1-Year | + | 0.16 | % | -0.83 | % | -0.70 | % | ||||
| 5-Year | + | 3.47 | % | + | 0.68 | % | + | 0.71 | % | ||
| 10-Year | + | 22.03 | % | + | 2.01 | % | + | 2.01 | % | ||
| R6 | 0.54 | % | |||||||||
| 1-Year | + | 0.92 | % | + | 0.92 | % | + | 0.92 | % | ||
| Since Inception (9/20/13) | + | 1.21 | % | + | 1.09 | % | + | 1.06 | % | ||
| Advisor7 | 0.62 | % | |||||||||
| 1-Year | + | 0.82 | % | + | 0.82 | % | + | 0.83 | % | ||
| 5-Year | + | 7.01 | % | + | 1.36 | % | + | 1.35 | % | ||
| 10-Year | + | 29.19 | % | + | 2.59 | % | + | 2.59 | % |
| Distribution | 30-Day Standardized Yield9 | |||||
| Share Class | Rate8 | (with waiver) | (without waiver) | |||
| A | 1.02 | % | 0.40 | % | 0.40 | % |
| A1 | 1.19 | % | 0.57 | % | 0.57 | % |
| C | 0.65 | % | 0.01 | % | 0.01 | % |
| R6 | 1.48 | % | 0.85 | % | 0.85 | % |
| Advisor | 1.30 | % | 0.67 | % | 0.67 | % |
Performance data represent past performance, which does not guarantee future results. Investment return and principal value will fluctuate, and you may have a gain or loss when you sell your shares. Current performance may differ from figures shown. For most recent month-end performance, go to franklintempleton.com or call (800) 342-5236.
8 | Annual Report franklintempleton.com
FRANKLIN ADJUSTABLE U.S. GOVERNMENT SECURITIES FUND
PERFORMANCE SUMMARY
Total Return Index Comparison for a Hypothetical $10,000 Investment1
Total return represents the change in value of an investment over the periods shown. It includes any applicable maximum sales charge, Fund expenses, account fees and reinvested distributions. The unmanaged index includes reinvestment of any income or distributions. It differs from the Fund in composition and does not pay management fees or expenses. One cannot invest directly in an index.
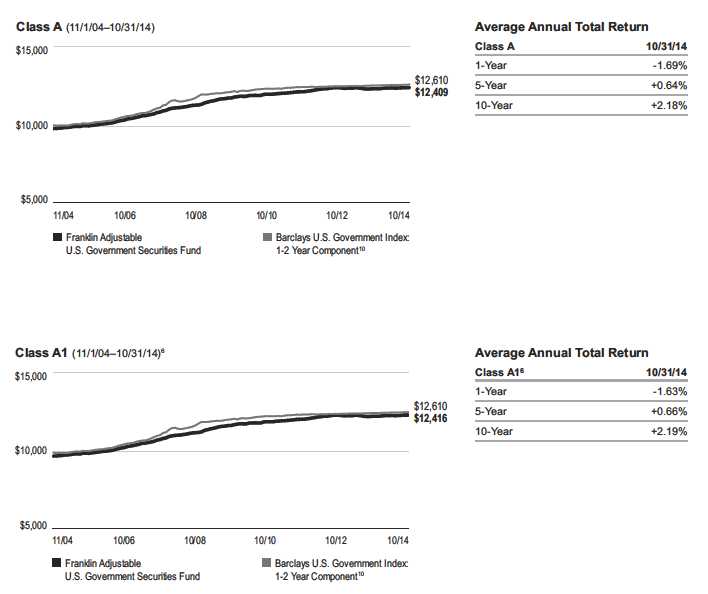
franklintempleton.com Annual Report | 9
FRANKLIN ADJUSTABLE U.S. GOVERNMENT SECURITIES FUND
PERFORMANCE SUMMARY
Total Return Index Comparison for a Hypothetical $10,000 Investment1 (continued)

10 | Annual Report franklintempleton.com
FRANKLIN ADJUSTABLE U.S. GOVERNMENT SECURITIES FUND
PERFORMANCE SUMMARY
Total Return Index Comparison for a Hypothetical $10,000 Investment1 (continued)
All investments involve risks, including possible loss of principal. Interest rate movements, unscheduled mortgage prepayments and other risk factors will affect the Fund’s share price and yield. Bond prices generally move in the opposite direction of interest rates. As prices of bonds in the Fund adjust to a rise in interest rates, the Fund’s share price may decline. Changes in the financial strength of a bond issuer or in a bond’s credit rating may affect its value. The Fund is actively managed but there is no guarantee that the manager’s investment decisions will produce the desired results. The Fund’s prospectus also includes a description of the main investment risks.
| Class A1: | Effective 6/18/14, Class A1 shares were established for shareholders of Franklin Limited Maturity U.S. Government Securities Fund Class A as a result of its |
| reorganization into this Fund on the same date. Class A1 shares are closed to new investors. | |
| Class C: | These shares have higher annual fees and expenses than Class A shares. |
| Class R6: | Shares are available to certain eligible investors as described in the prospectus. |
| Advisor Class: | Shares are available to certain eligible investors as described in the prospectus. |
1. The Fund has a fee waiver associated with its investments in a Franklin Templeton money fund, contractually guaranteed through at least its current fiscal year-end.
Fund investment results reflect the fee waiver, to the extent applicable; without this reduction, the results would have been lower.
2. Cumulative total return represents the change in value of an investment over the periods indicated.
3. Average annual total return represents the average annual change in value of an investment over the periods indicated.
4. In accordance with SEC rules, we provide standardized average annual total return information through the latest calendar quarter.
5. Figures are as stated in the Fund’s current prospectus. In periods of market volatility, assets may decline significantly, causing total annual Fund operating expenses to
become higher than the figures shown.
6. Performance for Class A1 has been calculated as follows: (a) for periods prior to 6/18/14, Franklin Adjustable U.S. Government Securities Fund’s Class A performance is
used, and (b) for periods after 6/18/14, actual Class A1 performance is used, reflecting all charges and fees applicable to that class.
7. Effective 5/15/08, the Fund began offering Advisor Class shares, which do not have sales charges or a Rule 12b-1 plan. Performance quotations for this class reflect the
following methods of calculation: (a) For periods prior to 5/15/08, a restated figure is used based upon the Fund’s Class A performance, excluding the effect of Class A’s
maximum initial sales charge, but reflecting the effect of the Class A Rule 12b-1 fees; and (b) for periods after 5/15/08, actual Advisor Class performance is used reflecting
all charges and fees applicable to that class. Since 5/15/08 (commencement of sales), the cumulative and average annual total returns of Advisor Class shares were
+13.51% and +1.98%.
8. Distribution rate is based on an annualization of the sum of the respective class’s past 30 days’ daily distributions and the maximum offering price (NAV for Classes C, R6
and Advisor) per share on 10/31/14.
9. The 30-day standardized yield for the 30 days ended 10/31/14 reflects an estimated yield to maturity (assuming all portfolio securities are held to maturity). It should be
regarded as an estimate of the Fund’s rate of investment income, and it may not equal the Fund’s actual income distribution rate (which reflects the Fund’s past dividends
paid to shareholders) or the income reported in the Fund’s financial statements.
10. Source: Morningstar. The Barclays U.S. Government Index: 1-2 Year Component includes public obligations of the U.S. Treasury with at least one year up to, but not
including, two years to final maturity and publicly issued debt of U.S. government agencies, quasi-federal corporations, and corporate or foreign debt guaranteed by the U.S.
government.
See www.franklintempletondatasources.com for additional data provider information.
franklintempleton.com Annual Report | 11
FRANKLIN ADJUSTABLE U.S. GOVERNMENT SECURITIES FUND
Your Fund’s Expenses
As a Fund shareholder, you can incur two types of costs:
- Transaction costs, including sales charges (loads) on Fund purchases; and
- Ongoing Fund costs, including management fees, distribu- tion and service (12b-1) fees, and other Fund expenses. All mutual funds have ongoing costs, sometimes referred to as operating expenses.
The following table shows ongoing costs of investing in the Fund and can help you understand these costs and compare them with those of other mutual funds. The table assumes a $1,000 investment held for the six months indicated.
Actual Fund Expenses
The first line (Actual) for each share class listed in the table provides actual account values and expenses. The “Ending Account Value” is derived from the Fund’s actual return, which includes the effect of Fund expenses.
You can estimate the expenses you paid during the period by following these steps. Of course, your account value and expenses will differ from those in this illustration:
| 1. | Divide your account value by $1,000. |
| If an account had an $8,600 value, then $8,600 ÷ $1,000 = 8.6. | |
| 2. | Multiply the result by the number under the heading “Expenses Paid During Period.” |
| If Expenses Paid During Period were $7.50, then 8.6 x $7.50 = $64.50. |
In this illustration, the estimated expenses paid this period are $64.50.
Hypothetical Example for Comparison with Other Funds
Information in the second line (Hypothetical) for each class in the table can help you compare ongoing costs of investing in the Fund with those of other mutual funds. This information may not be used to estimate the actual ending account balance or expenses you paid during the period. The hypothetical “Ending Account Value” is based on the actual expense ratio for each class and an assumed 5% annual rate of return before expenses, which does not represent the Fund’s actual return. The figure under the heading “Expenses Paid During Period” shows the hypothetical expenses your account would have incurred under this scenario. You can compare this figure with the 5% hypothetical examples that appear in shareholder reports of other funds.
Please note that expenses shown in the table are meant to highlight ongoing costs and do not reflect any transaction costs, such as sales charges. Therefore, the second line for each class is useful in comparing ongoing costs only, and will not help you compare total costs of owning different funds. In addition, if transaction costs were included, your total costs would have been higher. Please refer to the Fund prospectus for additional information on operating expenses.
12 | Annual Report
franklintempleton.com
FRANKLIN ADJUSTABLE U.S. GOVERNMENT SECURITIES FUND
YOUR FUND’S EXPENSES
| Beginning Account | Ending Account | Expenses Paid During | ||||
| Share Class | Value 5/1/14 | Value 10/31/14 | Period* 5/1/14–10/31/14 | |||
| A | ||||||
| Actual | $ | 1,000 | $ | 1,001.60 | $ | 4.69 |
| Hypothetical (5% return before expenses) | $ | 1,000 | $ | 1,020.52 | $ | 4.74 |
| A1 | ||||||
| Actual (6/18/14-10/31/14) | $ | 1,000 | $ | 1,003.20 | $ | 2.89 |
| Hypothetical (5% return before expenses) | $ | 1,000 | $ | 1,021.37 | $ | 3.97 |
| C | ||||||
| Actual | $ | 1,000 | $ | 999.60 | $ | 6.70 |
| Hypothetical (5% return before expenses) | $ | 1,000 | $ | 1,018.50 | $ | 6.77 |
| R6 | ||||||
| Actual | $ | 1,000 | $ | 1,003.50 | $ | 2.73 |
| Hypothetical (5% return before expenses) | $ | 1,000 | $ | 1,022.48 | $ | 2.75 |
| Advisor | ||||||
| Actual | $ | 1,000 | $ | 1,004.00 | $ | 3.43 |
| Hypothetical (5% return before expenses) | $ | 1,000 | $ | 1,021.78 | $ | 3.47 |
*Expenses are calculated using the most recent six-month expense ratio, annualized for each class (A: 0.93%; A1: 0.78%; C: 1.33%;
R6: 0.54%; and Advisor: 0.68%), multiplied by the average account value over the period, multiplied by 184/365 to reflect the one-half
year period for Class A1 Hypothetical expenses and Actual and Hypothetical expenses for Classes A, C, R6 and Advisor. The multiplier
is 135/365 for Actual Class A1 expenses to reflect the number of days since inception.
franklintempleton.com Annual Report | 13
Franklin Floating Rate Daily Access Fund
This annual report for Franklin Floating Rate Daily Access Fund covers the fiscal year ended October 31, 2014.
Your Fund’s Goals and Main Investments
The Fund seeks to provide a high level of current income and, secondarily, preservation of capital by investing at least 80% of its net assets in income-producing floating interest rate corporate loans and corporate debt securities.
Performance Overview
The Fund’s Class A shares delivered a +1.91% cumulative total return for the 12 months under review. In comparison, the Credit Suisse Leveraged Loan Index (CS LLI), which is designed to mirror the investable universe of the U.S. dollar-denominated leveraged loan market, posted a +3.77% total return.1 You can find the Fund’s long-term performance data in the Performance Summary beginning on page 18.
Performance data represent past performance, which does not guarantee future results. Investment return and principal value will fluctuate, and you may have a gain or loss when you sell your shares. Current performance may differ from figures shown. Please visit franklintempleton.com or call (800) 342-5236 for most recent month-end performance.
Corporate Loan Market Overview
Although technical conditions in the loan market remained strong at the beginning of the one-year period, the balance between supply and demand shifted as loan retail vehicles reported outflows, selling by crossover investors contributed to volatility, and new-issue volume related to mergers and acquisitions (M&A) increased. While loan prices declined, robust demand from the formation of new collateralized loan obligations (CLOs) managed to moderate further principal declines and provide liquidity to retail managers fulfilling redemptions. Despite weaker demand and growing investor concerns about global economic growth, the fundamental environment remained favorable, in our view, and issuers continued to report solid earnings.
What are corporate loans?
Corporate loans are typically floating rate loans to corporate borrowers made by a group, or syndicate, of banks and other financial institutions. These loans provide capital to companies for varied purposes, such as merger and acquisition activity, leveraged buyouts or refinancings. These loans are typically syndicated to a group of investors.
New CLO volume reached record levels during the period, helping to support overall demand amid persistent outflows from retail vehicles. Year-to-date CLO issuance for 2014 exceeded the annual record from 2006 despite the implementation of regulations that helped to constrain demand for AAA-rated CLO tranches from banks, which had been traditional buyers. However, investors such as asset managers, insurance companies and pension funds stepped in as incremental buyers during the period. Uncertainty surrounding additional regulations that could potentially constrain CLO issuance also led many managers to launch new vehicles prior to the implementation of the new rules. Although the new rules were announced toward the end of the period, they were not scheduled to come into effect until 2016, allowing CLO issuance to remain robust. Amid widening spreads in the loan market, CLO arrangers were able to take advantage of additional arbitrage opportunities, contributing to demand for higher coupon loans trading at discounts to par.
Inflows into loan retail vehicles continued at a strong pace at the beginning of the reporting period, but flows decelerated and turned increasingly negative as the period progressed. Concerns about slowing global growth, as well as U.S. Treasury yields reaching their lowest levels since 2013, led some investors to adjust expectations for higher interest rates and withdraw money from the asset class. Furthermore, volatile flows from the high yield bond market spilled over to the loan market, and some crossover investors sold loans to meet redemptions or tactically shifted loan allocations toward bonds in light of significantly wider spreads in the high yield market. Although outflows tapered at the end of the period following a rebound across risk assets, assets managed by loan retail vehicles continued to contract and reached their lowest levels since 2013. The increase in CLO activity and waning retail demand during the period also resulted in structured finance vehicles constituting a larger proportion of primary activity in the loan market.
1. Source: Credit Suisse Group.
The index is unmanaged and includes reinvested interest. One cannot invest directly in an index, and an index is not representative of the Fund’s portfolio.
See www.franklintempletondatasources.com for additional data provider information.
The dollar value, number of shares or principal amount, and names of all portfolio holdings are listed in the Fund’s Statement of Investments (SOI).
The SOI begins on page 57.
14 | Annual Report franklintempleton.com
FRANKLIN FLOATING RATE DAILY ACCESS FUND
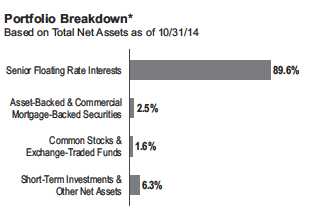
*Percentages reflect certain derivatives held in the portfolio (or their underlying
reference assets) and may not total 100% or may be negative due to rounding,
use of derivatives, unsettled trades or other factors.
The primary market launched a number of deals related to M&A during the period, bringing meaningful supply to the loan market. Although the deals followed an uptick in M&A transactions globally, the volume of new loans related to leveraged buyout (LBO) transactions was muted due to relatively high equity prices, making significantly leveraged transactions more challenging. Due to subdued demand from loan retail vehicles and new deals launching, repricing activity, including refinancing deals that tightened spreads, in particular, declined sharply as fewer loans traded at significant premiums to par compared to earlier in the period. While the more balanced technical environment dampened repricing activity, managers continued to launch a significant number of new loans without covenants.
Although the default rate by number of issuers declined during the period, the default rate by amount increased sharply as an electric utility that was one of the largest LBOs in loan market history filed for bankruptcy. Despite the rise in the default rate by volume, investors continued to expect a relatively benign default environment for loan issuers. Furthermore, fundamental conditions remained favorable, in our view, as issuers continued to report year-over-year earnings growth during the period, resulting in strong interest coverage.
Investment Strategy
We use a detailed credit analysis process to select corporate loan and corporate debt securities that meet our criteria. We conduct ongoing credit monitoring of our investments. To help manage the credit risk associated with investing in below-investment-grade securities, we seek to diversify the Fund by
investing in a large number of loans of companies that we have identified as having attractive risk/reward profiles, favorable capital structures, strong asset coverage and dominant market shares. This diversification potentially reduces credit risk by spreading assets across many different industries.
In addition, we seek to exploit market inefficiencies by assigning forward-looking credit-risk tiers to issuers based upon our forward-looking analysis of the issuers’ prospects in the near term. This independent analysis enables us to express differences between backward-looking rating assignments of credit-risk tiers and our analysts’ forward-looking assessment of credit risk, thereby allowing us to potentially take advantage of credit risks the market may be overstating or avoid uncompensated credit risks the market may not have adequately identified.
| Dividend Distributions* | ||||
| 11/1/13–10/31/14 | ||||
| Dividend per Share (cents) | ||||
| Month | Class A | Class C | Class R6 | Advisor Class |
| November | 2.6769 | 2.3859 | 2.9010 | 2.8612 |
| December | 2.9738 | 2.6529 | 3.2231 | 3.1770 |
| January | 2.6160 | 2.3048 | 2.8610 | 2.8147 |
| February | 2.4034 | 2.1228 | 2.6251 | 2.5821 |
| March | 2.6816 | 2.3716 | 2.9296 | 2.8794 |
| April | 2.6002 | 2.3002 | 2.8206 | 2.7915 |
| May | 2.7426 | 2.4420 | 2.9811 | 2.9330 |
| June | 2.7793 | 2.4683 | 3.0417 | 2.9760 |
| July | 2.8057 | 2.4943 | 3.0792 | 3.0021 |
| August | 2.7953 | 2.5051 | 3.0548 | 2.9783 |
| September | 3.1124 | 2.7933 | 3.4002 | 3.3147 |
| October | 3.2952 | 2.9910 | 3.5505 | 3.4841 |
| Total | 33.4824 | 29.8322 | 36.4679 | 35.7941 |
*Assumes shares were purchased and held for the entire accrual period. Since
dividends accrue daily, your actual distributions will vary depending on the date
you purchased your shares and any account activity. All Fund distributions will vary
depending upon current market conditions, and past distributions are not indicative
of future trends.
Manager’s Discussion
The top contributors to Fund performance during the year under review included issuers that benefited from strong price appreciation or muted principal declines amid a volatile market, which allowed term loans’ relatively attractive
franklintempleton.com Annual Report | 15
FRANKLIN FLOATING RATE DAILY ACCESS FUND
coupons to provide positive total returns. The term loans of iHeartCommunications, one of the largest U.S. radio companies, were among the top contributors during the period as the company heightened expectations that it could address its highly leveraged capital structure after extending the maturities of its shorter term loans and completing a debt exchange for its shorter dated high yield bonds. The first-lien and second-lien term loans of Arysta Lifescience, a large agrochemical company specializing in the development, formulation and distribution of crop protection products, also contributed to performance. Moreover, amid volatile loan prices toward the end of the period, investors supported the prices of the Arysta term loans following an announcement that the company would be acquired and its debt eventually repaid. The term loans of AdvancePierre Foods, a manufacturer of prepared food, also helped results for the year. Although the company’s term loans traded lower earlier in the period after it reported weaker results, we continued to invest in its second-lien term loan. These loans contributed to the Fund’s returns after the company reported improving results due to favorable pricing and cost savings.
However, our allocation toward loans in the upper tier of the market, including loans rated BB- and Ba3 and above, detracted from relative performance during the Fund’s fiscal year. At the beginning of the period, the Fund was overweighted in the upper tier, while also underweighted in the lower tier, including CCC-rated and distressed loans. Over the one-year period, lower tier loans generally had the highest returns, followed by the middle tier and then the upper tier, according to the CS LLI. In addition to our allocation based on credit tiers, a few loans detracted from relative performance after their issuers reported weaker results. Our weaker performers included gaming company Cannery Casino Resorts, which detracted from performance due to investor uncertainty surrounding its ability to sell assets and reduce debt. The term loan of Town Sports International, one of the largest U.S. fitness clubs, also underperformed the broader market after the company reported softer performance due to weaker membership trends amid heavy competition.
During the period, we continued to shift from the market’s upper tier to the middle tier (including loans rated B+ to B-) to potentially limit the spread duration of our overall portfolio. Due to relatively low yields within the upper tier resulting from lower spreads over the benchmark, we believed these loans were more susceptible to greater price declines as interest rates increased, which we expected to result in higher volatility
| Top 10 Holdings | ||
| 10/31/14 | ||
| Company | % of Total | |
| Sector/Industry | Net Assets | |
| Caesars Entertainment Resort Properties LLC | 1.9 | % |
| Casinos & Gaming, U.S. | ||
| MoneyGram International Inc. | 1.9 | % |
| Data Processing & Outsourced Services, U.S. | ||
| BMC Software Finance Inc. | 1.7 | % |
| Internet Software & Services, U.S. | ||
| William Morris Endeavor Entertainment LLC | 1.6 | % |
| Movies & Entertainment, U.S. | ||
| Sun Products Corp. | 1.3 | % |
| Household Products, U.S. | ||
| Alinta Energy Finance Pty. Ltd. | 1.2 | % |
| Electric Utilities, Australia | ||
| Arysta Lifescience SPC LLC | 1.2 | % |
| Diversified Chemicals, U.S. | ||
| Cannery Casino Resorts LLC | 1.2 | % |
| Casinos & Gaming, U.S. | ||
| Cyanco Intermediate Corp. | 1.2 | % |
| Commodity Chemicals, U.S. | ||
| Community Health Systems Inc. | 1.1 | % |
| Health Care Facilities, U.S. | ||
across credit markets. We believed this volatility could cause the risk premium over Treasury bond yields to widen and possibly lead investors to sell their lower yielding assets, including upper tier loans. We invested in a select number of higher yielding loans based on our favorable outlook on loan defaults and in an attempt to optimize income returns among loans with comparable credit risk within each credit tier. Our largest investments during the period included deals that launched in the primary market during a more restrained technical environment, resulting in what we viewed as relatively attractive income generation. We invested in the first-lien and second-lien term loans of Connolly, the largest U.S. provider of payment integrity services. The new deal, which financed the company’s acquisition of iHealth Technologies (not a Fund holding), provided relatively attractive income, in our view. We also based our investment decision on the company’s key role in providing audit services to medical insurance providers and its leading market position, strong free cash flow and the growing need for its services due to the increasing complexity of health care laws. Fitness International, one of the largest U.S. fitness club operators, was also a large Fund investment during the period due to what we viewed as the company’s strong market position, consistent organic membership growth and geographical diversity. We invested in the company’s term loan in the primary market as we believed it presented strong value
16 | Annual Report franklintempleton.com
FRANKLIN FLOATING RATE DAILY ACCESS FUND
relative to other loans in the middle tier, and we added to our position in the secondary market as technical conditions seemed to pressure loan prices.
What is spread duration?
Spread duration is a measure of a loan’s price sensitivity to a 100 basis-point change in its discount margin.
The Fund added a modest position in high yield bonds toward the end of the period through iBoxx High Yield Corporate Bond, an exchange-traded fund that seeks to track the high yield bond market, and High Yield Credit Default Index, an index of high yield bond credit default swaps providing synthetic exposure to the high yield bond market. We initiated the positions due to our view of relatively attractive opportunities in the high yield bond market after material spread widening in that asset class. We also invested in PowerShares Senior Loan Portfolio, an exchange-traded fund that seeks to track the leveraged loan market, to increase our credit exposure while allowing us to maintain sufficient liquidity for shareholders in the event of elevated redemption activity.
Thank you for your continued participation in Franklin Floating Rate Daily Access Fund. We look forward to serving your future investment needs.

The foregoing information reflects our analysis, opinions and portfolio holdings as of October 31, 2014, the end of the reporting period. The way we implement our main investment strategies and the resulting portfolio holdings may change depending on factors such as market and economic conditions. These opinions may not be relied upon as investment advice or an offer for a particular security. The information is not a complete analysis of every aspect of any market, country, industry, security or the Fund. Statements of fact are from sources considered reliable, but the investment manager makes no representation or warranty as to their completeness or accuracy. Although historical performance is no guarantee of future results, these insights may help you understand our investment management philosophy.
Mark Boyadjian is a senior vice president of Franklin Templeton Investments and head of Franklin Advisers’ Floating Rate Debt Group. Mr. Boyadjian was most recently responsible for Franklin Templeton Investments’ International Local Asset Management Groups in India and South Korea, as well as the Global Investment Risk Management and the Global Investment Performance departments. Since joining Franklin Templeton Investments in 1998, Mr. Boyadjian has held a variety of positions. Between 1999 and 2002, he was chief administrative officer for the Portfolio Management Group where he was responsible for managing the financial, legal, regulatory and technological requirements for the enterprises’ investment management groups. Concurrently, Mr. Boyadjian was the director of Global Portfolio Services with responsibility for introducing and managing enterprise-wide investment risk and portfolio analytics solutions. During the nine-year period prior to joining Franklin Templeton Investments, Mr. Boyadjian was a principal and fixed income portfolio manager at Scudder, Stevens & Clark, Inc.
franklintempleton.com Annual Report | 17
FRANKLIN FLOATING RATE DAILY ACCESS FUND
Performance Summary as of October 31, 2014
Your dividend income will vary depending on dividends or interest paid by securities in the Fund’s portfolio, adjusted for operating expenses of each class. Capital gain distributions are net profits realized from the sale of portfolio securities. The performance tables and graphs do not reflect any taxes that a shareholder would pay on Fund dividends, capital gain distributions, if any, or any realized gains on the sale of Fund shares. Total return reflects reinvestment of the Fund’s dividends and capital gain distributions, if any, and any unrealized gains or losses.
| Net Asset Value | ||||||
| Share Class (Symbol) | 10/31/14 | 10/31/13 | Change | |||
| A (FAFRX) | $ | 9.04 | $ | 9.20 | -$ | 0.16 |
| C (FCFRX) | $ | 9.05 | $ | 9.20 | -$ | 0.15 |
| R6 (N/A) | $ | 9.05 | $ | 9.21 | -$ | 0.16 |
| Advisor (FDAAX) | $ | 9.05 | $ | 9.20 | -$ | 0.15 |
| Distributions (11/1/13–10/31/14) | ||||||
| Dividend | ||||||
| Share Class | Income | |||||
| A | $ | 0.334824 | ||||
| C | $ | 0.298322 | ||||
| R6 | $ | 0.364679 | ||||
| Advisor | $ | 0.357941 | ||||
18 | Annual Report
franklintempleton.com
FRANKLIN FLOATING RATE DAILY ACCESS FUND
PERFORMANCE SUMMARY
Performance as of 10/31/141
Cumulative total return excludes sales charges. Average annual total returns include maximum sales charges. Class A: 2.25% maximum initial sales charge; Class C: 1% contingent deferred sales charge in first year only; Class R6/Advisor Class: no sales charges.
| Cumulative | Average Annual | Average Annual | Total AnnualOperating Expenses5 | ||||||||||
| Share Class | Total Return2 | Total Return3 | Total Return (9/30/14)4 | (with waiver) | (without waiver) | ||||||||
| A | 0.85 | % | 0.87 | % | |||||||||
| 1-Year | + | 1.91 | % | -0.36 | % | + | 0.32 | % | |||||
| 5-Year | + | 27.04 | % | + | 4.43 | % | + | 4.48 | % | ||||
| 10-Year | + | 41.23 | % | + | 3.28 | % | + | 3.32 | % | ||||
| C | 1.25 | % | 1.27 | % | |||||||||
| 1-Year | + | 1.62 | % | + | 0.64 | % | + | 1.22 | % | ||||
| 5-Year | + | 24.68 | % | + | 4.51 | % | + | 4.56 | % | ||||
| 10-Year | + | 35.89 | % | + | 3.11 | % | + | 3.16 | % | ||||
| R6 | 0.53 | % | 0.55 | % | |||||||||
| 1-Year | + | 2.36 | % | + | 2.36 | % | + | 2.95 | % | ||||
| Since Inception (5/1/13) | + | 4.20 | % | + | 2.78 | % | + | 2.90 | % | ||||
| Advisor | 0.60 | % | 0.62 | % | |||||||||
| 1-Year | + | 2.28 | % | + | 2.28 | % | + | 2.88 | % | ||||
| 5-Year | + | 28.63 | % | + | 5.16 | % | + | 5.21 | % | ||||
| 10-Year | + | 44.96 | % | + | 3.78 | % | + | 3.81 | % | ||||
| Distribution | 30-Day Standardized Yield7 | |||||
| Share Class | Rate6 | (with waiver) | (without waiver) | |||
| A | 4.20 | % | 4.31 | % | 4.29 | % |
| C | 3.90 | % | 3.99 | % | 3.98 | % |
| R6 | 4.63 | % | 4.78 | % | 4.77 | % |
| Advisor | 4.54 | % | 4.67 | % | 4.66 | % |
Performance data represent past performance, which does not guarantee future results. Investment return and principal value will fluctuate, and you may have a gain or loss when you sell your shares. Current performance may differ from figures shown. For most recent month-end performance, go to franklintempleton.com or call (800) 342-5236.
franklintempleton.com Annual Report | 19
FRANKLIN FLOATING RATE DAILY ACCESS FUND
PERFORMANCE SUMMARY
Total Return Index Comparison for a Hypothetical $10,000 Investment1
Total return represents the change in value of an investment over the periods shown. It includes any applicable maximum sales charge, Fund expenses, account fees and reinvested distributions. The unmanaged index includes reinvestment of any income or distributions. It differs from the Fund in composition and does not pay management fees or expenses. One cannot invest directly in an index.
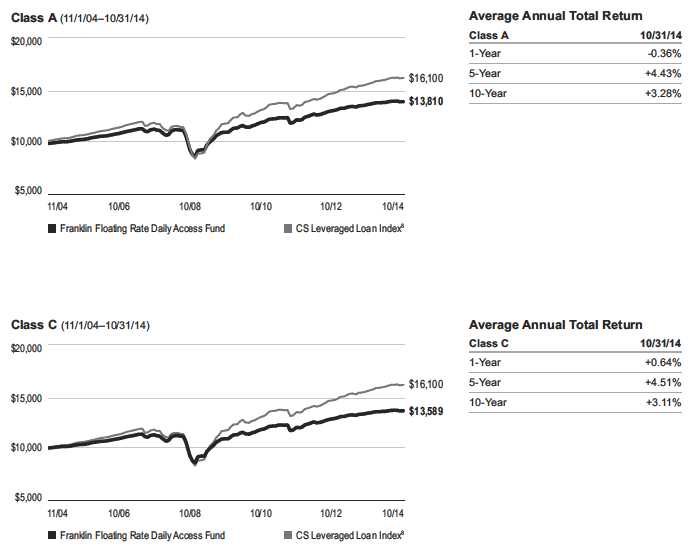
20 | Annual Report franklintempleton.com
FRANKLIN FLOATING RATE DAILY ACCESS FUND
PERFORMANCE SUMMARY
Total Return Index Comparison for a Hypothetical $10,000 Investment1 (continued)
franklintempleton.com Annual Report | 21
FRANKLIN FLOATING RATE DAILY ACCESS FUND
PERFORMANCE SUMMARY
All investments involve risks, including possible loss of principal. Investors should be aware that the Fund’s share price and yield will fluctuate with market conditions. The Fund should not be considered an alternative to money market funds or certificates of deposit (CDs). The floating rate loans and debt securities in which the Fund invests tend to be rated below investment grade. Investing in higher yielding, lower rated, floating rate loans and debt securities involves greater risk of default, which could result in loss of principal — a risk that may be heightened in a slowing economy. Interest earned on floating rate loans varies with changes in prevailing interest rates. Therefore, while floating rate loans offer higher interest income when interest rates rise, they will also generate less income when interest rates decline. Changes in the financial strength of a bond issuer or in a bond’s credit rating may affect its value. The Fund is actively managed but there is no guarantee that the manager’s investment decisions will produce the desired results. The Fund’s prospectus also includes a description of the main investment risks.
| Class C: | These shares have higher annual fees and expenses than Class A shares. |
| Class R6: | Shares are available to certain eligible investors as described in the prospectus. |
| Advisor Class: | Shares are available to certain eligible investors as described in the prospectus. |
1. The Fund has a fee waiver associated with its investments in a Franklin Templeton money fund, contractually guaranteed through at least its current fiscal year-end.
Fund investment results reflect the fee waiver; without this reduction, the results would have been lower.
2. Cumulative total return represents the change in value of an investment over the periods indicated.
3. Average annual total return represents the average annual change in value of an investment over the periods indicated.
4. In accordance with SEC rules, we provide standardized average annual total return information through the latest calendar quarter.
5. Figures are as stated in the Fund’s current prospectus. In periods of market volatility, assets may decline significantly, causing total annual Fund operating expenses to
become higher than the figures shown.
6. Distribution rate is based on an annualization of the sum of the respective class’s past 30 days’ daily distributions and the maximum offering price (NAV for Classes C, R6
and Advisor) per share on 10/31/14.
7. The 30-day standardized yield for the 30 days ended 10/31/14 reflects an estimated yield to maturity (assuming all portfolio securities are held to maturity). It should be
regarded as an estimate of the Fund’s rate of investment income, and it may not equal the Fund’s actual income distribution rate (which reflects the Fund’s past dividends
paid to shareholders) or the income reported in the Fund’s financial statements.
8. Source: Credit Suisse Group. The CS Leveraged Loan Index is designed to mirror the investable universe of the U.S. dollar-denominated leveraged loan market. Loans
must be below investment grade and rated no higher than Baa/BB+ or Ba1/BBB+ by Moody’s or Standard & Poor’s.
See www.franklintempletondatasources.com for additional data provider information.
22 | Annual Report franklintempleton.com
FRANKLIN FLOATING RATE DAILY ACCESS FUND
Your Fund’s Expenses
As a Fund shareholder, you can incur two types of costs:
- Transaction costs, including sales charges (loads) on Fund purchases; and
- Ongoing Fund costs, including management fees, distribu- tion and service (12b-1) fees, and other Fund expenses. All mutual funds have ongoing costs, sometimes referred to as operating expenses.
The following table shows ongoing costs of investing in the Fund and can help you understand these costs and compare them with those of other mutual funds. The table assumes a $1,000 investment held for the six months indicated.
Actual Fund Expenses
The first line (Actual) for each share class listed in the table provides actual account values and expenses. The “Ending Account Value” is derived from the Fund’s actual return, which includes the effect of Fund expenses.
You can estimate the expenses you paid during the period by following these steps. Of course, your account value and expenses will differ from those in this illustration:
| 1. | Divide your account value by $1,000. |
| If an account had an $8,600 value, then $8,600 ÷ $1,000 = 8.6. | |
| 2. | Multiply the result by the number under the heading “Expenses Paid During Period.” |
| If Expenses Paid During Period were $7.50, then 8.6 x $7.50 = $64.50. |
In this illustration, the estimated expenses paid this period are $64.50.
Hypothetical Example for Comparison with Other Funds
Information in the second line (Hypothetical) for each class in the table can help you compare ongoing costs of investing in the Fund with those of other mutual funds. This information may not be used to estimate the actual ending account balance or expenses you paid during the period. The hypothetical “Ending Account Value” is based on the actual expense ratio for each class and an assumed 5% annual rate of return before expenses, which does not represent the Fund’s actual return. The figure under the heading “Expenses Paid During Period” shows the hypothetical expenses your account would have incurred under this scenario. You can compare this figure with the 5% hypothetical examples that appear in shareholder reports of other funds.
Please note that expenses shown in the table are meant to highlight ongoing costs and do not reflect any transaction costs, such as sales charges. Therefore, the second line for each class is useful in comparing ongoing costs only, and will not help you compare total costs of owning different funds. In addition, if transaction costs were included, your total costs would have been higher. Please refer to the Fund prospectus for additional information on operating expenses.
franklintempleton.com Annual Report | 23
| FRANKLIN FLOATING RATE DAILY ACCESS FUND | ||||||
| YOUR FUND’S EXPENSES | ||||||
| Beginning Account | Ending Account | Expenses Paid During | ||||
| Share Class | Value 5/1/14 | Value 10/31/14 | Period* 5/1/14–10/31/14 | |||
| A | ||||||
| Actual | $ | 1,000 | $ | 1,006.00 | $ | 4.30 |
| Hypothetical (5% return before expenses) | $ | 1,000 | $ | 1,020.92 | $ | 4.33 |
| C | ||||||
| Actual | $ | 1,000 | $ | 1,004.00 | $ | 6.31 |
| Hypothetical (5% return before expenses) | $ | 1,000 | $ | 1,018.90 | $ | 6.36 |
| R6 | ||||||
| Actual | $ | 1,000 | $ | 1,007.70 | $ | 2.58 |
| Hypothetical (5% return before expenses) | $ | 1,000 | $ | 1,022.63 | $ | 2.60 |
| Advisor | ||||||
| Actual | $ | 1,000 | $ | 1,007.30 | $ | 3.04 |
| Hypothetical (5% return before expenses) | $ | 1,000 | $ | 1,022.18 | $ | 3.06 |
*Expenses are calculated using the most recent six-month expense ratio, net of expense waivers annualized for each class (A: 0.85%;
C: 1.25%; R6: 0.51%; and Advisor: 0.60%), multiplied by the average account value over the period, multiplied by 184/365 to reflect the
one-half year period.
24 | Annual Report franklintempleton.com
Franklin Low Duration Total Return Fund
We are pleased to bring you Franklin Low Duration Total Return Fund’s annual report for the fiscal year ended October 31, 2014.
Your Fund’s Goal and Main Investments
The Fund seeks a high level of current income as is consistent with prudent investing, while seeking capital preservation. The Fund invests primarily in investment-grade debt securities, including government and corporate debt securities and mortgage- and asset-backed securities, targeting an estimated average portfolio duration of three years or less.
What is duration?
Duration is a measure of a bond’s price sensitivity to interest rate changes. In general, a portfolio of securities with a lower duration can be expected to be less sensitive to interest rate changes than a portfolio with a higher duration.
Performance Overview
The Fund’s Class A shares delivered a +1.32% cumulative total return for the 12 months under review. In comparison, the Fund’s benchmark, the Barclays U.S. Government/Credit Index: 1-3 Year Component, posted a +0.70% total return.1 The index tracks public obligations of the U.S. Treasury with one to three years to final maturity and publicly issued debt of U.S. government agencies, quasi-federal corporations, and corporate or foreign debt guaranteed by the U.S. government. You can find more of the Fund’s performance data in the Performance Summary beginning on page 28.
Performance data represent past performance, which does not guarantee future results. Investment return and principal value will fluctuate, and you may have a gain or loss when you sell your shares. Current performance may differ from figures shown. Please visit franklintempleton.com or call (800) 342-5236 for most recent month-end performance.
Investment Strategy
We seek to invest in a combination of fixed income securities, primarily from across the investment-grade debt universe. We analyze securities using proprietary and nonproprietary research to help us identify attractive investment opportunities across the entire fixed income opportunity set, on a relative basis. When making investment decisions, we evaluate business cycles, yield curves, and values between and within markets.
Through a low duration portfolio, we seek to position the Fund to be less affected by interest rate changes than a fund with a higher duration. In addition, we may use derivative transactions, such as forwards, futures contracts and swap agreements to obtain net long or short exposures to select currencies, interest rates, countries, duration or credit risks.
What is a currency forward contract?
A currency forward contract, also called a currency forward, is an agreement between the Fund and a counterparty to buy or sell a foreign currency at a specific exchange rate on a future date.
What is a futures contract?
A futures contract is an agreement between the Fund and a counterparty made through a U.S. or foreign futures exchange to buy or sell an asset at a specific price on a future date.
What are swap agreements?
Swap agreements, such as interest rate, currency and credit default swaps, are contracts between the Fund and, typically, a brokerage firm, bank or other financial institution (the swap counterparty). In a basic swap transaction, the Fund agrees with its counterparty to exchange the returns (or differentials in rates of return) earned or realized on a particular “notional amount” of underlying instruments. The notional amount is the set amount selected by the parties as the basis on which to calculate the obligations that they have agreed to exchange. The parties typically do not actually exchange the notional amount. Instead, they agree to exchange the returns that would be earned or realized if the notional amount were invested in given instruments or at given interest rates.
Manager’s Discussion
Although growth contracted in the first quarter of 2014, data for the second quarter of 2014 indicated the economy had rebounded more strongly and broadly than originally estimated, driven by increased personal consumption, private inventory investment, exports, residential and nonresidential fixed investment, and local government spending. Economic activity expanded in the third quarter, underpinned by increased federal defense spending and a narrower trade deficit. Housing data continued to recover, after the effects subsided from 2013’s severe winter and higher mortgage rates. Consumer price inflation remained subdued for the period.
1. Source: Morningstar.
The index is unmanaged and includes reinvested interest. One cannot invest directly in an index, and an index is not representative of the Fund’s portfolio.
See www.franklintempletondatasources.com for additional data provider information.
The dollar value, number of shares or principal amount, and names of all portfolio holdings are listed in the Fund’s Statement of Investments (SOI).
The SOI begins on page 71.
franklintempleton.com Annual Report | 25
FRANKLIN LOW DURATION TOTAL RETURN FUND
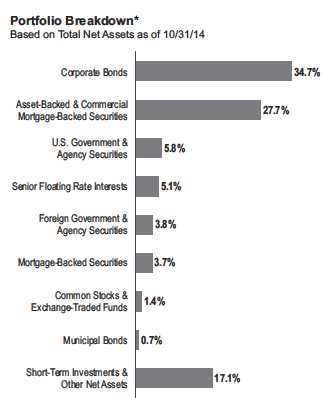
*Percentages reflect certain derivatives held in the portfolio (or their underlying
reference assets) and may not total 100% or may be negative due to rounding,
use of derivatives, unsettled trades or other factors.
In a sign of more confidence in the economic outlook, the Federal Reserve Board (Fed) revised its quantitative easing policy by reducing its monthly asset purchases starting in January. After further gradual reductions during the year, the Fed ended its asset purchase program in October and reaffirmed it would maintain its low interest rate policy for a “considerable time.”
Most fixed income sectors delivered positive performance during the period and outperformed similar-duration U.S. Treasuries. Investors’ continued search for yield helped high yield bonds post among the best absolute performance during the period, as measured by the Barclays U.S. Corporate High Yield Index, which tracks below-investment-grade bonds. Several other major fixed income sectors delivered positive returns as well, including U.S. dollar-denominated emerging market bonds, U.S. investment-grade corporate bonds, commercial mortgage-backed securities (CMBS), asset-backed securities (ABS), mortgage-backed securities and U.S. agency debentures.
| Dividend Distributions* | ||||
| 11/1/13–10/31/14 | ||||
| Dividend per Share (cents) | ||||
| Month | Class A | Class C | Class R6 | Advisor Class |
| November | 1.3840 | 1.1494 | 1.6042 | 1.5348 |
| December** | 4.0621 | 3.7271 | 4.3677 | 4.2765 |
| January | 1.6969 | 1.3829 | 1.9825 | 1.8969 |
| February | 1.6274 | 1.3608 | 1.8789 | 1.7980 |
| March | 1.3555 | 1.0715 | 1.6401 | 1.5402 |
| April | 0.9812 | 0.7027 | 1.2517 | 1.1585 |
| May | 1.0355 | 0.7463 | 1.3135 | 1.2205 |
| June | 1.2627 | 0.9266 | 1.5844 | 1.4764 |
| July | 1.1982 | 0.8755 | 1.5079 | 1.4038 |
| August | 1.3374 | 1.0148 | 1.6470 | 1.5427 |
| September | 1.4268 | 1.0821 | 1.7583 | 1.6468 |
| October | 0.9225 | 0.6557 | 1.1783 | 1.0921 |
| Total | 18.2902 | 14.6954 | 21.7145 | 20.5872 |
*Assumes shares were purchased and held for the entire accrual period, which
differs from the calendar month. Since dividends accrue daily, your actual
distributions will vary depending on the date you purchased your shares and any
account activity. All Fund distributions will vary depending upon current market
conditions, and past distributions are not indicative of future trends.
**Includes an additional 2.02 cent per share distribution to meet excise tax
requirements.
During the period, the Fund’s corporate credit holdings, particularly high yield bonds, provided a strong boost to performance. Our security selection in sovereign emerging market securities also aided returns. The Fund’s adjustable-rate mortgage securities and CMBS also helped performance, as did foreign currency positions. In contrast, for many of our non-U.S. dollar-denominated bonds, yield curve movements in non-U.S. markets had a negative impact on performance.
At period-end, we were overweighted compared to the benchmark in many of the credit sectors, including corporate credit and securitized products, based on our belief that valuations remained relatively attractive on a longer term basis. Over the period, we increased our allocations to ABS and CMBS. We decreased our exposure to high yield and other forms of corporate credit as well as select forms of foreign debt that became less attractive to us. We reduced our exposure to certain Treasury positions as we believed the two-year part of the yield curve might continue to experience volatility in the near term. We maintained significant exposure to international bonds and currencies.
26 | Annual Report franklintempleton.com
FRANKLIN LOW DURATION TOTAL RETURN FUND
The portfolio utilized derivatives, including credit default and currency swaps, currency forwards, Treasury futures, and currency, interest rate swap and credit default swap options, principally as a tool for efficient portfolio management and to manage overall portfolio risk. These derivative transactions may provide the same, or similar, net long or short exposure to select currencies, interest rates, countries, duration or credit risks in a less expensive way than by directly purchasing securities. In those markets where portfolio securities are readily available, the cost difference in normal market conditions may be small.
What is an option?
An option is a contract to buy or sell a specific financial product known as the option’s underlying instrument at a specific price. The buyer of an option has the right, but not the obligation, to buy or sell the underlying instrument at or until a specified expiration date. Conversely, the seller (“writer”) of an option who opens a transaction is obligated to buy or sell the underlying instrument should the option holder exercise that right.
Thank you for your continued participation in Franklin Low Duration Total Return Fund. We look forward to serving your future investment needs.

The foregoing information reflects our analysis, opinions and portfolio holdings as of October 31, 2014, the end of the reporting period. The way we implement our main investment strategies and the resulting portfolio holdings may change depending on factors such as market and economic conditions. These opinions may not be relied upon as investment advice or an offer for a particular security. The information is not a complete analysis of every aspect of any market, country, industry, security or the Fund. Statements of fact are from sources considered reliable, but the investment manager makes no representation or warranty as to their completeness or accuracy. Although historical performance is no guarantee of future results, these insights may help you understand our investment management philosophy.
franklintempleton.com Annual Report | 27
FRANKLIN LOW DURATION TOTAL RETURN FUND
Performance Summary as of October 31, 2014
Your dividend income will vary depending on dividends or interest paid by securities in the Fund’s portfolio, adjusted for operating expenses of each class. Capital gain distributions are net profits realized from the sale of portfolio securities. The performance tables and graphs do not reflect any taxes that a shareholder would pay on Fund dividends, capital gain distributions, if any, or any realized gains on the sale of Fund shares. Total return reflects reinvestment of the Fund’s dividends and capital gain distributions, if any, and any unrealized gains or losses.
| Net Asset Value | ||||||
| Share Class (Symbol) | 10/31/14 | 10/31/13 | Change | |||
| A (FLDAX) | $ | 10.11 | $ | 10.16 | -$ | 0.05 |
| C (FLDCX) | $ | 10.11 | $ | 10.16 | -$ | 0.05 |
| R6 (FLRRX) | $ | 10.14 | $ | 10.19 | -$ | 0.05 |
| Advisor (FLDZX) | $ | 10.14 | $ | 10.19 | -$ | 0.05 |
| Distributions (11/1/13–10/31/14) | ||||||
| Dividend | ||||||
| Share Class | Income | |||||
| A | $ | 0.182902 | ||||
| C | $ | 0.146954 | ||||
| R6 | $ | 0.217145 | ||||
| Advisor | $ | 0.205872 | ||||
28 | Annual Report
franklintempleton.com
FRANKLIN LOW DURATION TOTAL RETURN FUND
PERFORMANCE SUMMARY
Performance as of 10/31/141
Cumulative total return excludes sales charges. Average annual total returns include maximum sales charges. Class A: 2.25% maximum initial sales charge; Class C: 1% contingent deferred sales charge in first year only; Class R6/Advisor Class: no sales charges.
| Cumulative | Average Annual | Average Annual | Total Annual Operating Expenses5 | ||||||||||
| Share Class | Total Return2 | Total Return3 | Total Return (9/30/14)4 | (with waiver) | (without waiver) | ||||||||
| A | 0.80 | % | 0.98 | % | |||||||||
| 1-Year | + | 1.32 | % | -0.92 | % | -0.62 | % | ||||||
| 5-Year | + | 13.20 | % | + | 2.05 | % | + | 2.11 | % | ||||
| Since Inception (11/17/04) | + | 38.92 | % | + | 3.12 | % | + | 3.14 | % | ||||
| C | 1.20 | % | 1.38 | % | |||||||||
| 1-Year | + | 0.96 | % | -0.03 | % | + | 0.37 | % | |||||
| Since Inception (10/1/12) | + | 2.11 | % | + | 1.01 | % | + | 1.02 | % | ||||
| R6 | 0.44 | % | 0.62 | % | |||||||||
| 1-Year | + | 1.66 | % | + | 1.66 | % | + | 2.08 | % | ||||
| Since Inception (5/1/13) | + | 2.10 | % | + | 1.39 | % | + | 1.39 | % | ||||
| Advisor6 | 0.55 | % | 0.73 | % | |||||||||
| 1-Year | + | 1.54 | % | + | 1.54 | % | + | 1.97 | % | ||||
| 5-Year | + | 14.69 | % | + | 2.78 | % | + | 2.85 | % | ||||
| Since Inception (11/17/04) | + | 41.34 | % | + | 3.54 | % | + | 3.56 | % | ||||
| Distribution | 30-Day Standardized Yield8 | |||||
| Share Class | Rate7 | (with waiver) | (without waiver) | |||
| A | 1.07 | % | 0.86 | % | 0.73 | % |
| C | 0.78 | % | 0.48 | % | 0.33 | % |
| R6 | 1.39 | % | 1.27 | % | 1.14 | % |
| Advisor | 1.29 | % | 1.14 | % | 1.01 | % |
Performance data represent past performance, which does not guarantee future results. Investment return and principal value will fluctuate, and you may have a gain or loss when you sell your shares. Current performance may differ from figures shown. For most recent month-end performance, go to franklintempleton.com or call (800) 342-5236.
franklintempleton.com Annual Report | 29
FRANKLIN LOW DURATION TOTAL RETURN FUND
PERFORMANCE SUMMARY
Total Return Index Comparison for a Hypothetical $10,000 Investment1
Total return represents the change in value of an investment over the periods shown. It includes any applicable maximum sales charge, Fund expenses, account fees and reinvested distributions. The unmanaged index includes reinvestment of any income or distributions. It differs from the Fund in composition and does not pay management fees or expenses. One cannot invest directly in an index.
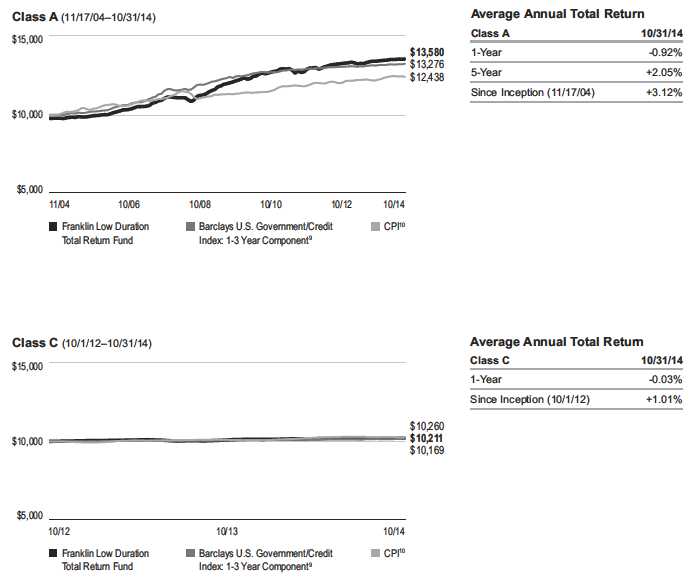
30 | Annual Report franklintempleton.com
FRANKLIN LOW DURATION TOTAL RETURN FUND
PERFORMANCE SUMMARY
Total Return Index Comparison for a Hypothetical $10,000 Investment1 (continued)
franklintempleton.com Annual Report | 31
FRANKLIN LOW DURATION TOTAL RETURN FUND
PERFORMANCE SUMMARY
All investments involve risks, including possible loss of principal. Interest rate movements and mortgage prepayments will affect the Fund’s share price and yield. Bond prices generally move in the opposite direction of interest rates. As prices of bonds in the Fund adjust to a rise in interest rates, the Fund’s share price may decline. Changes in the financial strength of a bond issuer or in a bond’s credit rating may affect its value. Derivatives, including currency management strategies, involve costs and can create economic leverage in the portfolio that may result in significant volatility and cause the Fund to participate in losses (as well as enable gains) on an amount that exceeds the Fund’s initial investment. The Fund may not achieve the anticipated benefits and may realize losses when a counterparty fails to perform as promised. Some derivatives are particularly sensitive to changes in interest rates. Foreign securities involve special risks, including currency fluctuations and economic and political uncertainty. The Fund is actively managed but there is no guarantee that the manager’s investment decisions will produce the desired results. The Fund’s prospectus also includes a description of the main investment risks.
| Class C: | These shares have higher annual fees and expenses than Class A shares. |
| Class R6: | Shares are available to certain eligible investors as described in the prospectus. |
| Advisor Class: | Shares are available to certain eligible investors as described in the prospectus. |
1. The Fund has an expense reduction contractually guaranteed through at least 2/28/15 and a fee waiver associated with its investments in a Franklin Templeton money
fund, contractually guaranteed through at least its current fiscal year-end. Fund investment results reflect the expense reduction and fee waiver, to the extent applicable;
without these reductions, the results would have been lower.
2. Cumulative total return represents the change in value of an investment over the periods indicated.
3. Average annual total return represents the average annual change in value of an investment over the periods indicated.
4. In accordance with SEC rules, we provide standardized average annual total return information through the latest calendar quarter.
5. Figures are as stated in the Fund’s current prospectus. In periods of market volatility, assets may decline significantly, causing total annual Fund operating expenses to
become higher than the figures shown.
6. Effective 5/15/08, the Fund began offering Advisor Class shares, which do not have sales charges or a Rule 12b-1 plan. Performance quotations for this class reflect the
following methods of calculation: (a) For periods prior to 5/15/08, a restated figure is used based upon the Fund’s Class A performance, excluding the effect of Class A’s
maximum initial sales charge, but reflecting the effect of the Class A Rule 12b-1 fees; and (b) for periods after 5/15/08, actual Advisor Class performance is used reflecting
all charges and fees applicable to that class. Since 5/15/08 (commencement of sales), the cumulative and average annual total returns of Advisor Class shares were
+24.18% and +3.41%.
7. Distribution rate is based on an annualization of the sum of the respective class’s past 30 days’ daily distributions and the maximum offering price (NAV for Classes C,
R6 and Advisor) per share on 10/31/14.
8. The 30-day standardized yield for the 30 days ended 10/31/14 reflects an estimated yield to maturity (assuming all portfolio securities are held to maturity). It should be
regarded as an estimate of the Fund’s rate of investment income, and it may not equal the Fund’s actual income distribution rate (which reflects the Fund’s past dividends
paid to shareholders) or the income reported in the Fund’s financial statements.
9. Source: Morningstar. The Barclays U.S. Government/Credit Index: 1-3 Year Component includes dollar-denominated investment grade corporate debt and non-native
currency agency and local authority debt, sovereign, supranational, and taxable municipal debt, public obligations of the U.S. Treasury with at least one year up to, but not
including, three years to final maturity, and publicly issued debt of U.S. government agencies, quasi-federal corporations, and corporate or foreign debt guaranteed by the
U.S. government.
10. Source: Bureau of Labor Statistics, bls.gov/cpi. The Consumer Price Index (CPI) is a commonly used measure of the inflation rate.
See www.franklintempletondatasources.com for additional data provider information.
32 | Annual Report franklintempleton.com
FRANKLIN LOW DURATION TOTAL RETURN FUND
Your Fund’s Expenses
As a Fund shareholder, you can incur two types of costs:
- Transaction costs, including sales charges (loads) on Fund purchases; and
- Ongoing Fund costs, including management fees, distribu- tion and service (12b-1) fees, and other Fund expenses. All mutual funds have ongoing costs, sometimes referred to as operating expenses.
The following table shows ongoing costs of investing in the Fund and can help you understand these costs and compare them with those of other mutual funds. The table assumes a $1,000 investment held for the six months indicated.
Actual Fund Expenses
The first line (Actual) for each share class listed in the table provides actual account values and expenses. The “Ending Account Value” is derived from the Fund’s actual return, which includes the effect of Fund expenses.
You can estimate the expenses you paid during the period by following these steps. Of course, your account value and expenses will differ from those in this illustration:
| 1. | Divide your account value by $1,000. |
| If an account had an $8,600 value, then $8,600 ÷ $1,000 = 8.6. | |
| 2. | Multiply the result by the number under the heading “Expenses Paid During Period.” |
| If Expenses Paid During Period were $7.50, then 8.6 x $7.50 = $64.50. |
In this illustration, the estimated expenses paid this period are $64.50.
Hypothetical Example for Comparison with Other Funds
Information in the second line (Hypothetical) for each class in the table can help you compare ongoing costs of investing in the Fund with those of other mutual funds. This information may not be used to estimate the actual ending account balance or expenses you paid during the period. The hypothetical “Ending Account Value” is based on the actual expense ratio for each class and an assumed 5% annual rate of return before expenses, which does not represent the Fund’s actual return. The figure under the heading “Expenses Paid During Period” shows the hypothetical expenses your account would have incurred under this scenario. You can compare this figure with the 5% hypothetical examples that appear in shareholder reports of other funds.
Please note that expenses shown in the table are meant to highlight ongoing costs and do not reflect any transaction costs, such as sales charges. Therefore, the second line for each class is useful in comparing ongoing costs only, and will not help you compare total costs of owning different funds. In addition, if transaction costs were included, your total costs would have been higher. Please refer to the Fund prospectus for additional information on operating expenses.
franklintempleton.com
Annual Report
| 33
| FRANKLIN LOW DURATION TOTAL RETURN FUND | ||||||
| YOUR FUND’S EXPENSES | ||||||
| Beginning Account | Ending Account | Expenses Paid During | ||||
| Share Class | Value 5/1/14 | Value 10/31/14 | Period* 5/1/14–10/31/14 | |||
| A | ||||||
| Actual | $ | 1,000 | $ | 1,005.10 | $ | 4.04 |
| Hypothetical (5% return before expenses) | $ | 1,000 | $ | 1,021.17 | $ | 4.08 |
| C | ||||||
| Actual | $ | 1,000 | $ | 1,003.30 | $ | 6.06 |
| Hypothetical (5% return before expenses) | $ | 1,000 | $ | 1,019.16 | $ | 6.11 |
| R6 | ||||||
| Actual | $ | 1,000 | $ | 1,006.90 | $ | 2.12 |
| Hypothetical (5% return before expenses) | $ | 1,000 | $ | 1,023.09 | $ | 2.14 |
| Advisor | ||||||
| Actual | $ | 1,000 | $ | 1,006.30 | $ | 2.78 |
| Hypothetical (5% return before expenses) | $ | 1,000 | $ | 1,022.43 | $ | 2.80 |
*Expenses are calculated using the most recent six-month expense ratio, net of expense waivers, annualized for each class (A: 0.80%;
C: 1.20%; R6: 0.42%; and Advisor: 0.55%), multiplied by the average account value over the period, multiplied by 184/365 to reflect the
one-half year period.
34 | Annual Report franklintempleton.com
Franklin Total Return Fund
We are pleased to bring you Franklin Total Return Fund’s annual report for the fiscal year ended October 31, 2014.
Your Fund’s Goals and Main Investments
The Fund seeks to provide investors with high current income consistent with preservation of capital. Capital appreciation over the long term is a secondary goal. The Fund invests at least 80% of its assets in investment-grade debt securities. The Fund currently focuses on government and corporate debt securities and mortgage- and asset-backed securities.
Performance Overview
The Fund’s Class A shares produced a +4.80% cumulative total return for the 12 months under review. In comparison, the Fund’s benchmark, the Barclays U.S. Aggregate Index, which measures the U.S. investment-grade, fixed-rate, taxable bond market with index components for government and corporate, mortgage pass-through and asset-backed securities, generated a +4.14% total return.1 You can find the Fund’s long-term performance data in the Performance Summary beginning on page 38.
Performance data represent past performance, which does not guarantee future results. Investment return and principal value will fluctuate, and you may have a gain or loss when you sell your shares. Current performance may differ from figures shown. Please visit franklintempleton.com or call (800) 342-5236 for most recent month-end performance.
Investment Strategy
We seek to invest in a combination of fixed income securities, predominantly from across the investment-grade debt universe. We analyze securities using proprietary and nonproprietary research to help us identify attractive investment opportunities, across the entire fixed income opportunity set, on a relative basis. The Fund may also invest up to 20% of its total assets in noninvestment-grade debt securities. In addition, we may use derivative transactions, such as currency and cross-currency forwards, futures contracts and swap agreements, to obtain net long or short exposures to select currencies, interest rates, countries, duration or credit risks.
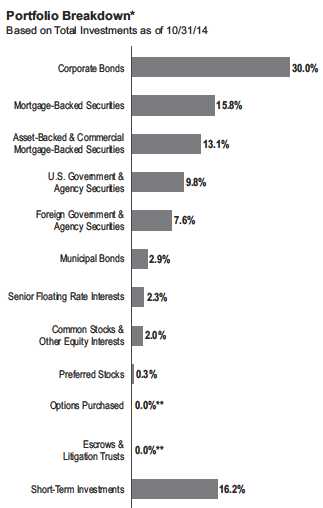
*Percentages reflect certain derivatives held in the portfolio (or their underlying
reference assets) and may not total 100% or may be negative due to rounding,
use of derivatives, unsettled trades or other factors.
**Rounds to less than 0.1% of total investments.
What is a currency forward contract?
A currency forward contract, also called a currency forward, is an agreement between the Fund and a counterparty to buy or sell a foreign currency at a specific exchange rate on a future date.
1. Source: Morningstar.
The index is unmanaged and includes reinvested interest. One cannot invest directly in an index, and an index is not representative of the Fund’s portfolio.
See www.franklintempletondatasources.com for additional data provider information.
The dollar value, number of shares or principal amount, and names of all portfolio holdings are listed in the Fund’s Statement of Investments (SOI).
The SOI begins on page 100.
franklintempleton.com Annual Report | 35
FRANKLIN TOTAL RETURN FUND
What is a futures contract?
A futures contract is an agreement between the Fund and a counterparty made through a U.S. or foreign futures exchange to buy or sell an asset at a specific price on a future date.
What are swap agreements?
Swap agreements, such as interest rate, currency and credit default swaps, are contracts between the Fund and, typically, a brokerage firm, bank or other financial institution (the swap counterparty). In a basic swap transaction, the Fund agrees with its counterparty to exchange the returns (or differentials in rates of return) earned or realized on a particular “notional amount” of underlying instruments. The notional amount is the set amount selected by the parties as the basis on which to calculate the obligations that they have agreed to exchange. The parties typically do not actually exchange the notional amount. Instead, they agree to exchange the returns that would be earned or realized if the notional amount were invested in given instruments or at given interest rates.
What is duration?
Duration is a measure of a bond’s price sensitivity to interest rate changes. In general, a portfolio of securities with a lower duration can be expected to be less sensitive to interest rate changes than a portfolio with a higher duration.
Manager’s Discussion
Although growth contracted in the first quarter of 2014, data for the second quarter of 2014 indicated the economy had rebounded more strongly and broadly than originally estimated, driven by increased personal consumption, private inventory investment, exports, residential and nonresidential fixed investment, and local government spending. Economic activity expanded in the third quarter, underpinned by increased federal defense spending and a narrower trade deficit. Housing data continued to recover, after the effects subsided from 2013’s severe winter and higher mortgage rates. Consumer price inflation remained subdued for the period.
In a sign of more confidence in the economic outlook, the Federal Reserve Board (Fed) revised its quantitative easing policy by reducing its monthly asset purchases starting in January. After further gradual reductions during the year, the Fed ended its asset purchase program in October and reaffirmed it would maintain its low interest rate policy for a “considerable time.”
Most fixed income sectors delivered positive performance during the period and outperformed similar-duration U.S. Treasuries. Investors’ continued search for yield helped high yield bonds post among the best absolute performance during the period, as measured by the Barclays U.S. Corporate High Yield Index, which tracks below-investment-grade bonds. Several other major fixed income sectors delivered positive returns as well, including U.S. dollar-denominated emerging market bonds, U.S. investment-grade corporate bonds, commercial mortgage-backed securities (CMBS), asset-backed securities (ABS), mortgage-backed securities (MBS) and U.S. agency debentures.
| Dividend Distributions* | |||||
| 11/1/13–10/31/14 | |||||
| Dividend per Share (cents) | |||||
| Advisor | |||||
| Month | Class A | Class C | Class R | Class R6 | Class |
| November | 3.1726 | 2.8505 | 2.9730 | 3.4738 | 3.3784 |
| December** 10.1921 | 9.8496 | 9.9776 | 10.5182 | 10.4106 | |
| January | 3.0305 | 2.7034 | 2.8255 | 3.3330 | 3.2412 |
| February | 2.0258 | 1.7503 | 1.8540 | 2.2939 | 2.2003 |
| March | 2.3745 | 2.0663 | 2.1813 | 2.6844 | 2.5714 |
| April | 1.7399 | 1.5177 | 1.6012 | 2.0083 | 1.8817 |
| May | 2.3341 | 2.0121 | 2.1351 | 2.6011 | 2.5410 |
| June | 2.5341 | 2.1874 | 2.3175 | 2.8703 | 2.7560 |
| July | 1.8046 | 1.4914 | 1.6088 | 2.1179 | 2.0034 |
| August*** | 1.4409 | 1.1168 | 1.2383 | 1.8082 | 1.6460 |
| September | 1.9728 | 1.6098 | 1.7430 | 2.4191 | 2.1924 |
| October | 1.4393 | 1.1584 | 1.2640 | 1.7273 | 1.6172 |
| Total | 34.0612 | 30.3137 | 31.7193 | 37.8555 | 36.4396 |
*Assumes shares were purchased and held for the entire accrual period. Since
dividends accrue daily, your actual distributions will vary depending on the date
you purchased your shares and any account activity. All Fund distributions will vary
depending upon current market conditions, and past distributions are not indicative
of future trends.
**Includes an additional 7.02 cent per share distribution to meet excise tax
requirements.
***The decline in the distribution reflects a change in the tax treatment of certain
security transactions.
During the period, the Fund’s taxable municipal bond holdings provided a particularly strong boost to performance. Our allocation to corporate credit holdings such as high yield and investment-grade bonds aided results as did our security
36 | Annual Report franklintempleton.com
FRANKLIN TOTAL RETURN FUND
selection within those sectors. The Fund’s allocation to sovereign emerging market positions also aided returns. Foreign currencies also contributed to Fund performance. In contrast, for many of our non-U.S. dollar-denominated bonds, yield curve movements in non-U.S. markets had a negative impact on results.
At period-end, we were slightly overweighted compared to the benchmark in many of the credit sectors, including corporate credit and securitized products, based on our belief that valuations remained relatively attractive on a longer term basis. Over the period, we decreased our exposure to U.S. Treasury securities, fixed-rate MBS and high yield corporate securities as yield spreads had become less attractive to us. We increased our exposure to ABS and currency forwards, and maintained significant exposure to international bonds and currencies.
The portfolio utilized derivatives, including credit default and currency swaps, currency forwards, Treasury futures, and currency, interest rate swap and credit default swap options, principally as a tool for efficient portfolio management and to manage overall portfolio risk. These derivative transactions may provide the same, or similar, net long or short exposure to select currencies, interest rates, countries, duration or credit risks in a less expensive way than by directly purchasing securities. In those markets where portfolio securities are readily available, the cost difference in normal market conditions may be small.
What is an option?
An option is a contract to buy or sell a specific financial product known as the option’s underlying instrument at a specific price. The buyer of an option has the right, but not the obligation, to buy or sell the underlying instrument at or until a specified expiration date. Conversely, the seller (“writer”) of an option who opens a transaction is obligated to buy or sell the underlying instrument should the option holder exercise that right.
Thank you for your continued participation in Franklin Total Return Fund. We look forward to serving your future investment needs.

The foregoing information reflects our analysis, opinions and portfolio holdings as of October 31, 2014, the end of the reporting period. The way we implement our main investment strategies and the resulting portfolio holdings may change depending on factors such as market and economic conditions. These opinions may not be relied upon as investment advice or an offer for a particular security. The information is not a complete analysis of every aspect of any market, country, industry, security or the Fund. Statements of fact are from sources considered reliable, but the investment manager makes no representation or warranty as to their completeness or accuracy. Although historical performance is no guarantee of future results, these insights may help you understand our investment management philosophy.
franklintempleton.com Annual Report | 37
FRANKLIN TOTAL RETURN FUND
Performance Summary as of October 31, 2014
Your dividend income will vary depending on dividends or interest paid by securities in the Fund’s portfolio, adjusted for operating expenses of each class. Capital gain distributions are net profits realized from the sale of portfolio securities. The performance tables and graphs do not reflect any taxes that a shareholder would pay on Fund dividends, capital gain distributions, if any, or any realized gains on the sale of Fund shares. Total return reflects reinvestment of the Fund’s dividends and capital gain distributions, if any, and any unrealized gains or losses.
| Net Asset Value | ||||||
| Share Class (Symbol) | 10/31/14 | 10/31/13 | Change | |||
| A (FKBAX) | $ | 10.18 | $ | 10.05 | +$ | 0.13 |
| C (FCTLX) | $ | 10.16 | $ | 10.03 | +$ | 0.13 |
| R (FTRRX) | $ | 10.17 | $ | 10.04 | +$ | 0.13 |
| R6 (FRERX) | $ | 10.20 | $ | 10.07 | +$ | 0.13 |
| Advisor (FBDAX) | $ | 10.20 | $ | 10.07 | +$ | 0.13 |
| Distributions (11/1/13–10/31/14) | ||||||
| Share Class | Dividend Income | |||||
| A | $ | 0.340612 | ||||
| C | $ | 0.303137 | ||||
| R | $ | 0.317193 | ||||
| R6 | $ | 0.378555 | ||||
| Advisor | $ | 0.364396 | ||||
38 | Annual Report
franklintempleton.com
FRANKLIN TOTAL RETURN FUND
PERFORMANCE SUMMARY
Performance as of 10/31/141
Cumulative total return excludes sales charges. Average annual total returns include maximum sales charges. Class A: 4.25%
maximum initial sales charge; Class C: 1% contingent deferred sales charge in first year only; Class R/R6/Advisor Class: no
sales charges.
| Cumulative | Average Annual | Average Annual | Total Annual Operating Expenses5 | ||||||||||
| Share Class | Total Return2 | Total Return3 | Total Return (9/30/14)4 | (with waiver) | (without waiver) | ||||||||
| A | 0.89 | % | 0.93 | % | |||||||||
| 1-Year | + | 4.80 | % | + | 0.30 | % | + | 0.92 | % | ||||
| 5-Year | + | 32.00 | % | + | 4.79 | % | + | 4.83 | % | ||||
| 10-Year | + | 61.94 | % | + | 4.49 | % | + | 4.52 | % | ||||
| C | 1.29 | % | 1.33 | % | |||||||||
| 1-Year | + | 4.42 | % | + | 3.42 | % | + | 4.00 | % | ||||
| 5-Year | + | 29.47 | % | + | 5.30 | % | + | 5.35 | % | ||||
| 10-Year | + | 55.53 | % | + | 4.52 | % | + | 4.55 | % | ||||
| R | 1.14 | % | 1.18 | % | |||||||||
| 1-Year | + | 4.56 | % | + | 4.56 | % | + | 5.14 | % | ||||
| 5-Year | + | 30.36 | % | + | 5.45 | % | + | 5.49 | % | ||||
| 10-Year | + | 57.96 | % | + | 4.68 | % | + | 4.71 | % | ||||
| R6 | 0.48 | % | 0.52 | % | |||||||||
| 1-Year | + | 5.18 | % | + | 5.18 | % | + | 5.88 | % | ||||
| Since Inception (5/1/13) | + | 3.16 | % | + | 2.09 | % | + | 1.75 | % | ||||
| Advisor | 0.64 | % | 0.68 | % | |||||||||
| 1-Year | + | 5.03 | % | + | 5.03 | % | + | 5.73 | % | ||||
| 5-Year | + | 33.65 | % | + | 5.97 | % | + | 6.04 | % | ||||
| 10-Year | + | 65.84 | % | + | 5.19 | % | + | 5.23 | % | ||||
| Distribution | 30-Day Standardized Yield7 | |||||
| Share Class | Rate6 | (with waiver) | (without waiver) | |||
| A | 1.62 | % | 1.72 | % | 1.68 | % |
| C | 1.37 | % | 1.38 | % | 1.34 | % |
| R | 1.49 | % | 1.54 | % | 1.50 | % |
| R6 | 2.03 | % | 2.21 | % | 2.19 | % |
| Advisor | 1.90 | % | 2.06 | % | 2.01 | % |
Performance data represent past performance, which does not guarantee future results. Investment return and principal value will fluctuate, and you may have a gain or loss when you sell your shares. Current performance may differ from figures shown. For most recent month-end performance, go to franklintempleton.com or call (800) 342-5236.
franklintempleton.com Annual Report | 39
FRANKLIN TOTAL RETURN FUND
PERFORMANCE SUMMARY
Total Return Index Comparison for a Hypothetical $10,000 Investment1
Total return represents the change in value of an investment over the periods shown. It includes any applicable maximum sales charge, Fund expenses, account fees and reinvested distributions. The unmanaged index includes reinvestment of any income or distributions. It differs from the Fund in composition and does not pay management fees or expenses. One cannot invest directly in an index.
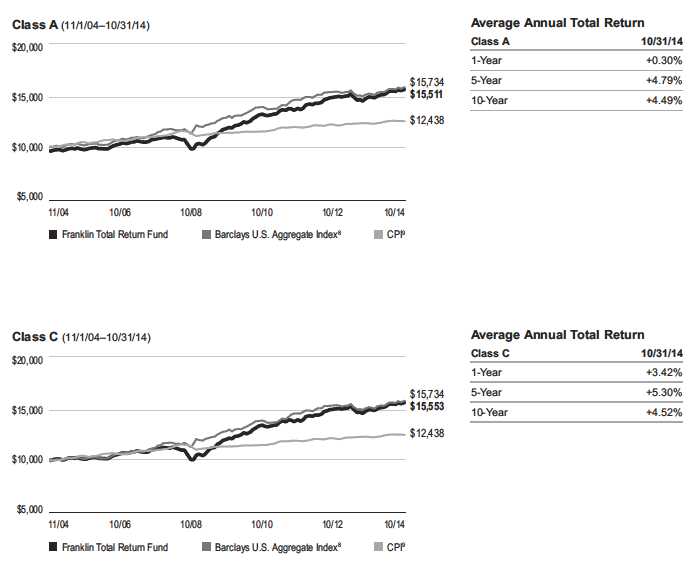
40 | Annual Report franklintempleton.com
FRANKLIN TOTAL RETURN FUND
PERFORMANCE SUMMARY
Total Return Index Comparison for a Hypothetical $10,000 Investment1 (continued)
franklintempleton.com Annual Report | 41
FRANKLIN TOTAL RETURN FUND
PERFORMANCE SUMMARY
Total Return Index Comparison for a Hypothetical $10,000 Investment1 (continued)

All investments involve risks, including possible loss of principal. Interest rate movements and mortgage prepayments will affect the Fund’s share price and yield. Bond prices generally move in the opposite direction of interest rates. Thus, as prices of bonds in the Fund adjust to a rise in interest rates, the Fund’s share price may decline. Changes in the financial strength of a bond issuer or in a bond’s credit rating may affect its value. The risks associated with higher yielding, lower rated securities (commonly called junk bonds) include higher risk of default and loss of principal. Investment in foreign securities also involves special risks, including currency fluctuations, and political and economic uncertainty. Derivatives, including currency management strategies, involve costs and can create economic leverage in the portfolio that may result in significant volatility and cause the Fund to participate in losses (as well as enable gains) on an amount that exceeds the Fund’s initial investment. The Fund may not achieve the anticipated benefits and may realize losses when a counterparty fails to perform as promised. The Fund is actively managed but there is no guarantee that the manager’s investment decisions will produce the desired results. The Fund’s prospectus also includes a description of the main investment risks.
| Class C: | These shares have higher annual fees and expenses than Class A shares. |
| Class R: | Shares are available to certain eligible investors as described in the prospectus. These shares have higher annual fees and expenses than Class A shares. |
| Class R6: | Shares are available to certain eligible investors as described in the prospectus. |
| Advisor Class: | Shares are available to certain eligible investors as described in the prospectus. |
1. The Fund has an expense reduction contractually guaranteed through at least 2/28/15 and a fee waiver associated with its investments in a Franklin Templeton money
fund, contractually guaranteed through at least its current fiscal year-end. Fund investment results reflect the expense reduction and fee waiver, to the extent applicable;
without these reductions, the results would have been lower.
2. Cumulative total return represents the change in value of an investment over the periods indicated.
3. Average annual total return represents the average annual change in value of an investment over the periods indicated.
4. In accordance with SEC rules, we provide standardized average annual total return information through the latest calendar quarter.
5. Figures are as stated in the Fund’s current prospectus. In periods of market volatility, assets may decline significantly, causing total annual Fund operating expenses to
become higher than the figures shown.
6. Distribution rate is based on an annualization of the sum of the respective class’s past 30 days’ daily distributions and the maximum offering price (NAV for Classes C, R,
R6 and Advisor) per share on 10/31/14.
7. The 30-day standardized yield for the 30 days ended 10/31/14 reflects an estimated yield to maturity (assuming all portfolio securities are held to maturity). It should be
regarded as an estimate of the Fund’s rate of investment income, and it may not equal the Fund’s actual income distribution rate (which reflects the Fund’s past dividends
paid to shareholders) or the income reported in the Fund’s financial statements.
8. Source: Morningstar. The Barclays U.S. Aggregate Index is a market capitalization-weighted index representing the U.S. investment-grade, fixed-rate, taxable bond
market with index components for government and corporate, mortgage pass-through and asset-backed securities. All issues included are SEC registered, taxable, dollar
denominated and nonconvertible, must have at least one year to final maturity and must be rated investment grade (Baa3/BBB-/BBB- or higher) using the middle rating of
Moody’s, Standard & Poor’s and Fitch, respectively.
9. Source: Bureau of Labor Statistics, bls.gov/cpi. The Consumer Price Index (CPI), is a commonly used measure of the inflation rate.
See www.franklintempletondatasources.com for additional data provider information.
42 | Annual Report franklintempleton.com
FRANKLIN TOTAL RETURN FUND
Your Fund’s Expenses
As a Fund shareholder, you can incur two types of costs:
- Transaction costs, including sales charges (loads) on Fund purchases; and
- Ongoing Fund costs, including management fees, distribu- tion and service (12b-1) fees, and other Fund expenses. All mutual funds have ongoing costs, sometimes referred to as operating expenses.
The following table shows ongoing costs of investing in the Fund and can help you understand these costs and compare them with those of other mutual funds. The table assumes a $1,000 investment held for the six months indicated.
Actual Fund Expenses
The first line (Actual) for each share class listed in the table provides actual account values and expenses. The “Ending Account Value” is derived from the Fund’s actual return, which includes the effect of Fund expenses.
You can estimate the expenses you paid during the period by following these steps. Of course, your account value and expenses will differ from those in this illustration:
| 1. | Divide your account value by $1,000. |
| If an account had an $8,600 value, then $8,600 ÷ $1,000 = 8.6. | |
| 2. | Multiply the result by the number under the heading “Expenses Paid During Period.” |
| If Expenses Paid During Period were $7.50, then 8.6 x $7.50 = $64.50. |
In this illustration, the estimated expenses paid this period are $64.50.
Hypothetical Example for Comparison with Other Funds
Information in the second line (Hypothetical) for each class in the table can help you compare ongoing costs of investing in the Fund with those of other mutual funds. This information may not be used to estimate the actual ending account balance or expenses you paid during the period. The hypothetical “Ending Account Value” is based on the actual expense ratio for each class and an assumed 5% annual rate of return before expenses, which does not represent the Fund’s actual return. The figure under the heading “Expenses Paid During Period” shows the hypothetical expenses your account would have incurred under this scenario. You can compare this figure with the 5% hypothetical examples that appear in shareholder reports of other funds.
Please note that expenses shown in the table are meant to highlight ongoing costs and do not reflect any transaction costs, such as sales charges. Therefore, the second line for each class is useful in comparing ongoing costs only, and will not help you compare total costs of owning different funds. In addition, if transaction costs were included, your total costs would have been higher. Please refer to the Fund prospectus for additional information on operating expenses.
franklintempleton.com Annual Report | 43
| FRANKLIN TOTAL RETURN FUND | ||||||
| YOUR FUND’S EXPENSES | ||||||
| Beginning Account | Ending Account | Expenses Paid During | ||||
| Share Class | Value 5/1/14 | Value 10/31/14 | Period* 5/1/14–10/31/14 | |||
| A | ||||||
| Actual | $ | 1,000 | $ | 1,024.50 | $ | 4.49 |
| Hypothetical (5% return before expenses) | $ | 1,000 | $ | 1,020.77 | $ | 4.48 |
| C | ||||||
| Actual | $ | 1,000 | $ | 1,022.60 | $ | 6.53 |
| Hypothetical (5% return before expenses) | $ | 1,000 | $ | 1,018.75 | $ | 6.51 |
| R | ||||||
| Actual | $ | 1,000 | $ | 1,023.30 | $ | 5.76 |
| Hypothetical (5% return before expenses) | $ | 1,000 | $ | 1,019.51 | $ | 5.75 |
| R6 | ||||||
| Actual | $ | 1,000 | $ | 1,026.50 | $ | 2.40 |
| Hypothetical (5% return before expenses) | $ | 1,000 | $ | 1,022.84 | $ | 2.40 |
| Advisor | ||||||
| Actual | $ | 1,000 | $ | 1,025.70 | $ | 3.22 |
| Hypothetical (5% return before expenses) | $ | 1,000 | $ | 1,022.03 | $ | 3.21 |
*Expenses are calculated using the most recent six-month expense ratio, net of expense waivers, annualized for each class (A: 0.88%;
C: 1.28%; R: 1.13%; R6: 0.47%; and Advisor: 0.63%), multiplied by the average account value over the period, multiplied by 184/365 to
reflect the one-half year period.
44 | Annual Report franklintempleton.com
| FRANKLIN INVESTORS SECURITIES TRUST | |||||||||||||||
| Financial Highlights | |||||||||||||||
| Franklin Adjustable U.S. Government Securities Fund | |||||||||||||||
| Year Ended October 31, | |||||||||||||||
| 2014 | 2013 | 2012 | 2011 | 2010 | |||||||||||
| Class A | |||||||||||||||
| Per share operating performance | |||||||||||||||
| (for a share outstanding throughout the year) | |||||||||||||||
| Net asset value, beginning of year | $ | 8.72 | $ | 8.90 | $ | 8.84 | $ | 8.90 | $ | 8.96 | |||||
| Income from investment operationsa: | |||||||||||||||
| Net investment income | 0.043 | 0.048 | 0.078 | 0.103 | 0.109 | ||||||||||
| Net realized and unrealized gains (losses) | 0.006 | (0.098 | ) | 0.117 | 0.011 | 0.073 | |||||||||
| Total from investment operations | 0.049 | (0.050 | ) | 0.195 | 0.114 | 0.182 | |||||||||
| Less distributions from net investment income | (0.099 | ) | (0.130 | ) | (0.135 | ) | (0.174 | ) | (0.242 | ) | |||||
| Net asset value, end of year | $ | 8.67 | $ | 8.72 | $ | 8.90 | $ | 8.84 | $ | 8.90 | |||||
| Total returnb | 0.56 | % | (0.56 | )% | 2.22 | % | 1.30 | % | 2.06 | % | |||||
| Ratios to average net assets | |||||||||||||||
| Expenses | 0.93 | %c | 0.87 | % | 0.87 | % | 0.86 | % | 0.86 | % | |||||
| Net investment income | 0.48 | % | 0.63 | % | 0.91 | % | 1.16 | % | 1.24 | % | |||||
| Supplemental data | |||||||||||||||
| Net assets, end of year (000’s) | $ | 1,058,838 | $ | 1,105,674 | $ | 1,308,971 | $ | 1,470,029 | $ | 1,536,981 | |||||
| Portfolio turnover rate | 14.18 | % | 8.66 | % | 9.69 | % | 19.65 | % | 43.37 | % | |||||
aThe amount shown for a share outstanding throughout the period may not correlate with the Statement of Operations for the period due to the timing of sales and
repurchases of the Fund shares in relation to income earned and/or fluctuating fair value of the investments of the Fund.
bTotal return does not reflect sales commissions or contingent deferred sales charges, if applicable.
cBenefit of waiver and payments by affiliates and expense reduction rounds to less than 0.01%.
franklintempleton.com The accompanying notes are an integral part of these financial statements. | Annual Report | 45
FRANKLIN INVESTORS SECURITIES TRUST
FINANCIAL HIGHLIGHTS
| Franklin Adjustable U.S. Government Securities Fund (continued) | |||
| Period Ended | |||
| October 31, | |||
| 2014 | a | ||
| Class A1 | |||
| Per share operating performance | |||
| (for a share outstanding throughout the year) | |||
| Net asset value, beginning of year | $ | 8.68 | |
| Income from investment operations: | |||
| Net investment incomeb | 0.018 | ||
| Net realized and unrealized gains (losses) | 0.010 | ||
| Total from investment operations | 0.028 | ||
| Less distributions from net investment income | (0.038 | ) | |
| Net asset value, end of year | $ | 8.67 | |
| Total returnc | 0.32 | % | |
| Ratios to average net assetsd | |||
| Expensese | 0.78 | % | |
| Net investment income | 0.63 | % | |
| Supplemental data | |||
| Net assets, end of year (000’s) | $ | 253,021 | |
| Portfolio turnover rate | 14.18 | % | |
aFor the period June 18, 2014 (effective date) to October 31, 2014.
bThe amount shown for a share outstanding throughout the period may not correlate with the Statement of Operations for the period due to the timing of sales and
repurchases of the Fund shares in relation to income earned and/or fluctuating fair value of the investments of the Fund.
cTotal return is not annualized for periods less than one year and does not reflect sales commissions or contingent deferred sales charges, if applicable.
dRatios are annualized for periods less than one year.
eBenefit of waiver and payments by affiliates and expense reduction rounds to less than 0.01%.
46 | Annual Report | The accompanying notes are an integral part of these financial statements. franklintempleton.com
| FRANKLIN INVESTORS SECURITIES TRUST | |||||||||||||||
| FINANCIAL HIGHLIGHTS | |||||||||||||||
| Franklin Adjustable U.S. Government Securities Fund (continued) | |||||||||||||||
| Year Ended October 31, | |||||||||||||||
| 2014 | 2013 | 2012 | 2011 | 2010 | |||||||||||
| Class C | |||||||||||||||
| Per share operating performance | |||||||||||||||
| (for a share outstanding throughout the year) | |||||||||||||||
| Net asset value, beginning of year | $ | 8.71 | $ | 8.90 | $ | 8.83 | $ | 8.89 | $ | 8.96 | |||||
| Income from investment operationsa: | |||||||||||||||
| Net investment income (loss) | (0.004 | ) | 0.006 | 0.042 | 0.064 | 0.087 | |||||||||
| Net realized and unrealized gains (losses) | 0.018 | (0.101 | ) | 0.128 | 0.015 | 0.049 | |||||||||
| Total from investment operations | 0.014 | (0.095 | ) | 0.170 | 0.079 | 0.136 | |||||||||
| Less distributions from net investment income | (0.064 | ) | (0.095 | ) | (0.100 | ) | (0.139 | ) | (0.206 | ) | |||||
| Net asset value, end of year | $ | 8.66 | $ | 8.71 | $ | 8.90 | $ | 8.83 | $ | 8.89 | |||||
| Total returnb | 0.16 | % | (1.07 | )% | 1.93 | % | 0.89 | % | 1.53 | % | |||||
| Ratios to average net assets | |||||||||||||||
| Expenses | 1.33 | %c | 1.27 | % | 1.27 | % | 1.26 | % | 1.26 | % | |||||
| Net investment income | 0.08 | % | 0.23 | % | 0.51 | % | 0.76 | % | 0.84 | % | |||||
| Supplemental data | |||||||||||||||
| Net assets, end of year (000’s) | $ | 428,031 | $ | 603,067 | $ | 794,201 | $ | 856,366 | $ | 956,002 | |||||
| Portfolio turnover rate | 14.18 | % | 8.66 | % | 9.69 | % | 19.65 | % | 43.37 | % | |||||
aThe amount shown for a share outstanding throughout the period may not correlate with the Statement of Operations for the period due to the timing of sales and
repurchases of the Fund shares in relation to income earned and/or fluctuating fair value of the investments of the Fund.
bTotal return does not reflect sales commissions or contingent deferred sales charges, if applicable.
cBenefit of waiver and payments by affiliates and expense reduction rounds to less than 0.01%.
franklintempleton.com The accompanying notes are an integral part of these financial statements. | Annual Report | 47
FRANKLIN INVESTORS SECURITIES TRUST
FINANCIAL HIGHLIGHTS
| Franklin Adjustable U.S. Government Securities Fund (continued) | ||||||
| Year Ended | ||||||
| October 31, | ||||||
| 2014 | 2013 | a | ||||
| Class R6 | ||||||
| Per share operating performance | ||||||
| (for a share outstanding throughout the year) | ||||||
| Net asset value, beginning of year | $ | 8.73 | $ | 8.72 | ||
| Income from investment operationsb: | ||||||
| Net investment income | 0.088 | c | 0.008 | |||
| Net realized and unrealized gains (losses) | (0.009 | ) | 0.018 | |||
| Total from investment operations | 0.079 | 0.026 | ||||
| Less distributions from net investment income | (0.129 | ) | (0.016 | ) | ||
| Net asset value, end of year | $ | 8.68 | $ | 8.73 | ||
| Total returnd | 0.92 | % | 0.30 | % | ||
| Ratios to average net assetse | ||||||
| Expenses | 0.56 | %f | 0.53 | % | ||
| Net investment income | 0.85 | % | 0.97 | % | ||
| Supplemental data | ||||||
| Net assets, end of year (000’s) | $ | 7,193 | $ | 335 | ||
| Portfolio turnover rate | 14.18 | % | 8.66 | % | ||
aFor the period September 20, 2013 (effective date) to October 31, 2013.
bThe amount shown for a share outstanding throughout the period may not correlate with the Statement of Operations for the period due to the timing of sales and
repurchases of the Fund shares in relation to income earned and/or fluctuating fair value of the investments of the Fund.
cBased on average daily shares outstanding.
dTotal return is not annualized for periods less than one year.
eRatios are annualized for periods less than one year.
fBenefit of waiver and payments by affiliates and expense reduction rounds to less than 0.01%.
48 | Annual Report | The accompanying notes are an integral part of these financial statements. franklintempleton.com
| FRANKLIN INVESTORS SECURITIES TRUST | |||||||||||||||
| FINANCIAL HIGHLIGHTS | |||||||||||||||
| Franklin Adjustable U.S. Government Securities Fund (continued) | |||||||||||||||
| Year Ended October 31, | |||||||||||||||
| 2014 | 2013 | 2012 | 2011 | 2010 | |||||||||||
| Advisor Class | |||||||||||||||
| Per share operating performance | |||||||||||||||
| (for a share outstanding throughout the year) | |||||||||||||||
| Net asset value, beginning of year | $ | 8.73 | $ | 8.91 | $ | 8.85 | $ | 8.91 | $ | 8.97 | |||||
| Income from investment operationsa: | |||||||||||||||
| Net investment income | 0.068 | 0.073 | 0.107 | 0.139 | 0.181 | ||||||||||
| Net realized and unrealized gains (losses) | 0.003 | (0.101 | ) | 0.111 | (0.002 | ) | 0.024 | ||||||||
| Total from investment operations | 0.071 | (0.028 | ) | 0.218 | 0.137 | 0.205 | |||||||||
| Less distributions from net investment income | (0.121 | ) | (0.152 | ) | (0.158 | ) | (0.197 | ) | (0.265 | ) | |||||
| Net asset value, end of year | $ | 8.68 | $ | 8.73 | $ | 8.91 | $ | 8.85 | $ | 8.91 | |||||
| Total return | 0.82 | % | (0.31 | )% | 2.48 | % | 1.55 | % | 2.31 | % | |||||
| Ratios to average net assets | |||||||||||||||
| Expenses | 0.68 | %b | 0.62 | % | 0.62 | % | 0.61 | % | 0.61 | % | |||||
| Net investment income | 0.73 | % | 0.88 | % | 1.16 | % | 1.41 | % | 1.49 | % | |||||
| Supplemental data | |||||||||||||||
| Net assets, end of year (000’s) | $ | 416,854 | $ | 411,228 | $ | 437,540 | $ | 489,675 | $ | 368,400 | |||||
| Portfolio turnover rate | 14.18 | % | 8.66 | % | 9.69 | % | 19.65 | % | 43.37 | % | |||||
aThe amount shown for a share outstanding throughout the period may not correlate with the Statement of Operations for the period due to the timing of sales and
repurchases of the Fund shares in relation to income earned and/or fluctuating fair value of the investments of the Fund.
bBenefit of waiver and payments by affiliates and expense reduction rounds to less than 0.01%.
franklintempleton.com The accompanying notes are an integral part of these financial statements. | Annual Report | 49
| FRANKLIN INVESTORS SECURITIES TRUST | ||||
| Statement of Investments, October 31, 2014 | ||||
| Franklin Adjustable U.S. Government Securities Fund | ||||
| Principal | ||||
| Amount | Value | |||
| Mortgage-Backed Securities 92.1% | ||||
| aFederal Home Loan Mortgage Corp. (FHLMC) Adjustable Rate 21.7% | ||||
| FHLMC, 1.845%, 9/01/35 | $ | 18,767,121 | $ | 19,623,260 |
| FHLMC, 1.904%, 4/01/36 | 10,777,682 | 11,351,257 | ||
| FHLMC, 2.03%, 4/01/35 | 14,807,167 | 15,620,431 | ||
| FHLMC, 2.111%, 1/01/36 | 9,662,834 | 10,199,301 | ||
| FHLMC, 2.166%, 9/01/36 | 9,523,962 | 10,144,720 | ||
| FHLMC, 0.799% - 2.208%, 11/01/16 - 4/01/42 | 20,353,973 | 21,391,421 | ||
| FHLMC, 2.215% - 2.266%, 6/01/18 - 7/01/38 | 13,161,894 | 13,999,310 | ||
| FHLMC, 2.266% - 2.30%, 10/01/22 - 4/01/40 | 19,993,081 | 21,325,060 | ||
| FHLMC, 2.319%, 11/01/37 | 12,012,440 | 12,892,220 | ||
| FHLMC, 2.301% - 2.328%, 1/01/22 - 3/01/39 | 12,731,683 | 13,597,684 | ||
| FHLMC, 2.33%, 12/01/35 | 11,197,258 | 11,968,534 | ||
| FHLMC, 2.342%, 9/01/37 | 24,052,906 | 25,810,386 | ||
| FHLMC, 2.328% - 2.353%, 11/01/17 - 9/01/37 | 18,729,098 | 20,019,828 | ||
| FHLMC, 2.353% - 2.364%, 5/01/23 - 6/01/41 | 15,885,363 | 16,999,974 | ||
| FHLMC, 2.372%, 11/01/36 | 10,561,564 | 11,302,839 | ||
| FHLMC, 2.378%, 9/01/38 | 10,810,102 | 11,563,953 | ||
| FHLMC, 2.365% - 2.379%, 5/01/25 - 11/01/41 | 20,033,625 | 21,405,244 | ||
| FHLMC, 2.38% - 2.408%, 11/01/17 - 10/01/41 | 19,909,415 | 21,251,494 | ||
| FHLMC, 2.41% - 2.441%, 4/01/28 - 5/01/42 | 14,703,812 | 15,739,912 | ||
| FHLMC, 2.506%, 9/01/37 | 15,870,968 | 17,022,696 | ||
| FHLMC, 2.442% - 2.51%, 1/01/19 - 7/01/41 | 19,369,417 | 20,702,621 | ||
| FHLMC, 2.515%, 6/01/37 | 20,280,576 | 21,793,240 | ||
| FHLMC, 2.537%, 1/01/37 | 9,954,253 | 10,738,996 | ||
| FHLMC, 2.512% - 2.644%, 11/01/18 - 5/01/41 | 20,240,738 | 21,597,421 | ||
| FHLMC, 3.382%, 11/01/40 | 17,096,530 | 18,128,810 | ||
| FHLMC, 3.529%, 7/01/38 | 23,000,001 | 24,466,338 | ||
| FHLMC, 2.647% - 3.593%, 3/01/17 - 7/01/41 | 17,415,959 | 18,546,232 | ||
| FHLMC, 3.659% - 6.635%, 8/01/17 - 7/01/40 | 9,251,234 | 9,733,061 | ||
| 468,936,243 | ||||
| aFederal National Mortgage Association (FNMA) Adjustable Rate 69.7% | ||||
| FNMA, 0.848% - 1.665%, 6/01/15 - 11/01/44 | 20,787,626 | 21,534,115 | ||
| FNMA, 1.678% - 1.792%, 10/01/18 - 6/01/37 | 20,482,609 | 21,407,006 | ||
| FNMA, 1.849%, 1/01/35 | 14,497,699 | 15,479,028 | ||
| FNMA, 1.793% - 1.85%, 12/01/15 - 2/01/39 | 19,354,730 | 20,221,593 | ||
| FNMA, 1.893%, 12/01/34 | 21,635,159 | 22,991,673 | ||
| FNMA, 1.85% - 1.895%, 8/01/17 - 7/01/37 | 20,330,097 | 21,445,431 | ||
| FNMA, 1.895% - 1.91%, 2/01/17 - 1/01/37 | 15,380,100 | 16,237,767 | ||
| FNMA, 1.922%, 3/01/35 | 11,319,927 | 12,115,955 | ||
| FNMA, 1.925%, 5/01/35 | 9,937,254 | 10,572,080 | ||
| FNMA, 1.91% - 1.926%, 11/01/16 - 11/01/40 | 20,435,351 | 21,588,069 | ||
| FNMA, 1.933%, 1/01/36 | 8,784,871 | �� | 9,344,639 | |
| FNMA, 1.926% - 1.94%, 1/01/18 - 11/01/35 | 20,314,716 | 21,439,862 | ||
| FNMA, 1.94% - 1.971%, 10/01/15 - 10/01/37 | 20,156,093 | 21,433,448 | ||
| FNMA, 1.971% - 1.988%, 3/01/19 - 12/01/43 | 20,347,196 | 21,580,301 | ||
| FNMA, 2.01%, 2/01/36 | 19,946,869 | 21,127,549 | ||
| FNMA, 1.988% - 2.016%, 7/01/17 - 5/01/38 | 18,810,152 | 19,926,731 | ||
| FNMA, 2.016% - 2.03%, 7/01/33 - 8/01/37 | 19,042,896 | 20,046,982 | ||
| FNMA, 2.03% - 2.055%, 3/01/18 - 9/01/43 | 20,462,673 | 21,541,627 | ||
| FNMA, 2.076%, 1/01/36 | 16,610,289 | 17,714,180 | ||
50 | Annual Report
franklintempleton.com
FRANKLIN INVESTORS SECURITIES TRUST
STATEMENT OF INVESTMENTS
| Franklin Adjustable U.S. Government Securities Fund (continued) | ||||
| Principal | ||||
| Amount | Value | |||
| Mortgage-Backed Securities (continued) | ||||
| aFederal National Mortgage Association (FNMA) Adjustable Rate (continued) | ||||
| FNMA, 2.055% - 2.088%, 2/01/16 - 4/01/38 | $ | 18,648,016 | $ | 19,718,560 |
| FNMA, 2.089%, 5/01/39 | 17,325,609 | 18,254,676 | ||
| FNMA, 2.089% - 2.105%, 12/01/17 - 3/01/38 | 16,881,032 | 17,943,781 | ||
| FNMA, 2.107% - 2.114%, 6/01/18 - 3/01/36 | 15,288,342 | 16,242,889 | ||
| FNMA, 2.122%, 8/01/39 | 14,827,774 | 15,752,682 | ||
| FNMA, 2.124%, 11/01/34 | 11,294,461 | 12,052,292 | ||
| FNMA, 2.114% - 2.13%, 10/01/16 - 5/01/38 | 19,633,035 | 20,816,833 | ||
| FNMA, 2.13% - 2.144%, 7/01/19 - 9/01/36 | 17,141,404 | 18,220,154 | ||
| FNMA, 2.144% - 2.155%, 6/01/19 - 5/01/37 | 19,997,369 | 21,292,780 | ||
| FNMA, 2.166%, 2/01/36 | 12,383,020 | 13,193,191 | ||
| FNMA, 2.155% - 2.178%, 4/01/22 - 7/01/42 | 19,132,164 | 20,393,387 | ||
| FNMA, 2.187%, 2/01/36 | 12,528,005 | 13,359,091 | ||
| FNMA, 2.178% - 2.19%, 6/01/18 - 8/01/39 | 19,132,187 | 20,371,991 | ||
| FNMA, 2.191% - 2.195%, 1/01/29 - 3/01/39 | 18,930,250 | 20,218,142 | ||
| FNMA, 2.196% - 2.204%, 7/01/17 - 1/01/37 | 19,445,408 | 20,733,827 | ||
| FNMA, 2.204% - 2.214%, 8/01/18 - 12/01/39 | 20,054,284 | 21,401,138 | ||
| FNMA, 2.225%, 1/01/38 | 20,251,121 | 21,729,619 | ||
| FNMA, 2.214% - 2.225%, 4/01/19 - 7/01/38 | 19,729,300 | 20,987,963 | ||
| FNMA, 2.225% - 2.24%, 2/01/26 - 3/01/41 | 19,180,789 | 20,435,271 | ||
| FNMA, 2.24% - 2.249%, 11/01/20 - 9/01/38 | 17,398,905 | 18,466,843 | ||
| FNMA, 2.251%, 1/01/39 | 11,455,264 | 12,204,453 | ||
| FNMA, 2.252%, 3/01/35 | 17,938,942 | 19,132,231 | ||
| FNMA, 2.249% - 2.254%, 10/01/18 - 5/01/48 | 19,952,986 | 21,164,459 | ||
| FNMA, 2.255% - 2.27%, 7/01/25 - 9/01/39 | 19,855,495 | 21,134,390 | ||
| FNMA, 2.274%, 9/01/36 | 12,400,420 | 13,267,315 | ||
| FNMA, 2.27% - 2.277%, 9/01/25 - 11/01/37 | 15,655,966 | 16,759,530 | ||
| FNMA, 2.277%, 1/01/38 | 11,490,649 | 12,394,939 | ||
| FNMA, 2.277% - 2.284%, 12/01/19 - 1/01/42 | 18,443,922 | 19,677,815 | ||
| FNMA, 2.284% - 2.292%, 9/01/17 - 9/01/39 | 19,407,063 | 20,726,593 | ||
| FNMA, 2.294%, 12/01/36 | 15,334,233 | 16,363,923 | ||
| FNMA, 2.299%, 1/01/38 | 13,684,060 | 14,534,447 | ||
| FNMA, 2.292% - 2.30%, 4/01/19 - 11/01/41 | 18,984,797 | 20,299,907 | ||
| FNMA, 2.301%, 3/01/38 | 10,098,329 | 10,835,453 | ||
| FNMA, 2.307%, 11/01/34 | 10,944,926 | 11,692,941 | ||
| FNMA, 2.30% - 2.313%, 12/01/19 - 3/01/38 | 19,945,970 | 21,293,936 | ||
| FNMA, 2.318%, 10/01/35 | 9,140,471 | 9,762,384 | ||
| FNMA, 2.314% - 2.323%, 7/01/22 - 5/01/38 | 20,116,797 | 21,387,800 | ||
| FNMA, 2.323% - 2.329%, 10/01/18 - 11/01/42 | 18,268,432 | 19,495,545 | ||
| FNMA, 2.329% - 2.334%, 9/01/24 - 3/01/38 | 17,670,258 | 18,818,557 | ||
| FNMA, 2.334% - 2.343%, 2/01/18 - 3/01/38 | 17,852,681 | 18,983,808 | ||
| FNMA, 2.346%, 5/01/38 | 9,014,626 | 9,683,994 | ||
| FNMA, 2.349%, 9/01/35 | 9,255,335 | 9,955,749 | ||
| FNMA, 2.35%, 11/01/37 | 19,257,998 | 20,583,802 | ||
| FNMA, 2.343% - 2.355%, 7/01/18 - 5/01/38 | 14,970,993 | 15,953,650 | ||
| FNMA, 2.36%, 1/01/37 | 12,569,241 | 13,446,375 | ||
| FNMA, 2.355% - 2.362%, 12/01/31 - 3/01/38 | 20,201,654 | 21,613,160 | ||
| FNMA, 2.362% - 2.375%, 12/01/18 - 5/01/45 | 20,216,568 | 21,517,501 | ||
| FNMA, 2.38%, 2/01/37 | 11,147,300 | 11,987,448 | ||
| FNMA, 2.375% - 2.393%, 1/01/19 - 2/01/43 | 20,240,495 | 21,581,356 | ||
| FNMA, 2.408%, 1/01/36 | 10,645,207 | 11,447,909 | ||
| FNMA, 2.393% - 2.414%, 3/01/19 - 5/01/48 | 20,263,331 | 21,390,823 | ||
| franklintempleton.com | Annual Report | 51 | |||
FRANKLIN INVESTORS SECURITIES TRUST
STATEMENT OF INVESTMENTS
| Franklin Adjustable U.S. Government Securities Fund (continued) | ||||
| Principal | ||||
| Amount | Value | |||
| Mortgage-Backed Securities (continued) | ||||
| aFederal National Mortgage Association (FNMA) Adjustable Rate (continued) | ||||
| FNMA, 2.414% - 2.425%, 10/01/17 - 8/01/37 | $ | 17,751,815 | $ | 18,934,363 |
| FNMA, 2.435%, 3/01/35 | 8,790,947 | 9,467,016 | ||
| FNMA, 2.437%, 6/01/35 | 9,133,884 | 9,863,395 | ||
| FNMA, 2.425% - 2.440%, 10/01/18 - 7/01/38 | 20,123,820 | 21,490,160 | ||
| FNMA, 2.445%, 7/01/46 | 14,178,346 | 15,258,589 | ||
| FNMA, 2.467%, 1/01/36 | 11,113,033 | 11,960,778 | ||
| FNMA, 2.44% - 2.474%, 7/01/17 - 3/01/47 | 20,157,798 | 21,471,241 | ||
| FNMA, 2.474% - 2.50%, 5/01/17 - 1/01/45 | 20,118,150 | 21,484,195 | ||
| FNMA, 2.502% - 2.625%, 5/01/16 - 1/01/42 | 20,405,726 | 21,467,743 | ||
| FNMA, 2.626% - 2.805%, 6/01/17 - 10/01/41 | 18,917,250 | 19,925,508 | ||
| FNMA, 2.807% - 3.00%, 11/01/16 - 1/01/41 | 20,489,381 | 21,581,941 | ||
| FNMA, 3.00% - 3.397%, 3/01/16 - 11/01/46 | 17,817,477 | 18,856,460 | ||
| FNMA, 3.598%, 3/01/41 | 19,329,438 | 20,704,942 | ||
| FNMA, 3.615%, 5/01/40 | 11,630,566 | 12,486,347 | ||
| FNMA, 3.40% - 8.125%, 11/01/15 - 3/01/50 | 14,390,741 | 15,184,115 | ||
| 1,508,562,132 | ||||
| Federal National Mortgage Association (FNMA) Fixed Rate 0.0%† | ||||
| FNMA 15 Year, 7.50%, 1/01/15 | 278 | 278 | ||
| aGovernment National Mortgage Association (GNMA) Adjustable Rate 0.7% | ||||
| GNMA, 1.625% - 3.00%, 3/20/16 - 5/20/36 | 15,564,751 | 16,112,191 | ||
| Total Mortgage-Backed Securities (Cost $1,957,238,773) | 1,993,610,844 | |||
| U.S. Government and Agency Securities 2.8% | ||||
| U.S. Treasury Note, | ||||
| 1.375%, 11/30/15 | 30,000,000 | 30,384,360 | ||
| 4.125%, 5/15/15 | 15,000,000 | 15,324,615 | ||
| 4.25%, 8/15/15 - 10/31/15 | 14,000,000 | 14,323,906 | ||
| Total U.S. Government and Agency Securities (Cost $59,913,221) | 60,032,881 | |||
| Total Investments before Short Term Investments (Cost $2,017,151,994) | 2,053,643,725 | |||
| Shares | ||||
| Short Term Investments (Cost $104,425,477) 4.8% | ||||
| Money Market Funds 4.8% | ||||
| b,cInstitutional Fiduciary Trust Money Market Portfolio | 104,425,477 | 104,425,477 | ||
| Total Investments (Cost $2,121,577,471) 99.7% | 2,158,069,202 | |||
| Other Assets, less Liabilities 0.3% | 5,867,426 | |||
| Net Assets 100.0% | $ | 2,163,936,628 | ||
See Abbreviations on page 151.
†Rounds to less than 0.1% of net assets.
aThe coupon rate shown represents the rate at period end.
bNon-income producing.
cSee Note 3(f) regarding investments in Institutional Fiduciary Trust Money Market Portfolio.
52 | Annual Report | The accompanying notes are an integral part of these financial statements. franklintempleton.com
| FRANKLIN INVESTORS SECURITIES TRUST | |||||||||||||||
| Financial Highlights | |||||||||||||||
| Franklin Floating Rate Daily Access Fund | |||||||||||||||
| Year Ended October 31, | |||||||||||||||
| 2014 | 2013 | 2012 | 2011 | 2010 | |||||||||||
| Class A | |||||||||||||||
| Per share operating performance | |||||||||||||||
| (for a share outstanding throughout the year) | |||||||||||||||
| Net asset value, beginning of year | $ | 9.20 | $ | 9.11 | $ | 8.89 | $ | 9.11 | $ | 8.73 | |||||
| Income from investment operationsa: | |||||||||||||||
| Net investment income | 0.335 | 0.333 | 0.403 | 0.418 | 0.370 | ||||||||||
| Net realized and unrealized gains (losses) | (0.160 | ) | 0.088 | 0.225 | (0.220 | ) | 0.376 | ||||||||
| Total from investment operations | 0.175 | 0.421 | 0.628 | 0.198 | 0.746 | ||||||||||
| Less distributions from net investment income | (0.335 | ) | (0.331 | ) | (0.408 | ) | (0.418 | ) | (0.366 | ) | |||||
| Net asset value, end of year | $ | 9.04 | $ | 9.20 | $ | 9.11 | $ | 8.89 | $ | 9.11 | |||||
| Total returnb | 1.91 | % | 4.69 | % | 7.22 | % | 2.17 | % | 8.69 | % | |||||
| Ratios to average net assets | |||||||||||||||
| Expenses before waiver and payments by affiliates | 0.84 | % | 0.83 | % | 0.90 | % | 0.89 | % | 0.95 | % | |||||
| Expenses net of waiver and payments by affiliates | 0.82 | %c | 0.83 | %c,d | 0.90 | % | 0.89 | %c | 0.95 | %c | |||||
| Net investment income | 3.64 | % | 3.60 | % | 4.52 | % | 4.56 | % | 4.15 | % | |||||
| Supplemental data | |||||||||||||||
| Net assets, end of year (000’s) | $ | 1,874,867 | $ | 1,991,138 | $ | 1,295,166 | $ | 1,246,489 | $ | 1,082,656 | |||||
| Portfolio turnover rate | 83.93 | % | 42.72 | % | 80.88 | % | 126.99 | % | 82.13 | % | |||||
aThe amount shown for a share outstanding throughout the period may not correlate with the Statement of Operations for the period due to the timing of sales and
repurchases of the Fund shares in relation to income earned and/or fluctuating fair value of the investments of the Fund.
bTotal return does not reflect sales commissions or contingent deferred sales charges, if applicable.
cBenefit of expense reduction rounds to less than 0.01%.
dBenefit of waiver and payments by affiliates rounds to less than 0.01%.
franklintempleton.com The accompanying notes are an integral part of these financial statements. | Annual Report | 53
FRANKLIN INVESTORS SECURITIES TRUST
FINANCIAL HIGHLIGHTS
| Franklin Floating Rate Daily Access Fund (continued) | |||||||||||||||
| Year Ended October 31, | |||||||||||||||
| 2014 | 2013 | 2012 | 2011 | 2010 | |||||||||||
| Class C | |||||||||||||||
| Per share operating performance | |||||||||||||||
| (for a share outstanding throughout the year) | |||||||||||||||
| Net asset value, beginning of year | $ | 9.20 | $ | 9.11 | $ | 8.89 | $ | 9.11 | $ | 8.73 | |||||
| Income from investment operationsa: | |||||||||||||||
| Net investment income | 0.298 | 0.296 | 0.368 | 0.380 | 0.334 | ||||||||||
| Net realized and unrealized gains (losses) | (0.150 | ) | 0.088 | 0.224 | (0.219 | ) | 0.376 | ||||||||
| Total from investment operations | 0.148 | 0.384 | 0.592 | 0.161 | 0.710 | ||||||||||
| Less distributions from net investment income | (0.298 | ) | (0.294 | ) | (0.372 | ) | (0.381 | ) | (0.330 | ) | |||||
| Net asset value, end of year | $ | 9.05 | $ | 9.20 | $ | 9.11 | $ | 8.89 | $ | 9.11 | |||||
| Total returnb | 1.62 | % | 4.28 | % | 6.79 | % | 1.76 | % | 8.26 | % | |||||
| Ratios to average net assets | |||||||||||||||
| Expenses before waiver and payments by affiliates | 1.24 | % | 1.23 | % | 1.30 | % | 1.29 | % | 1.35 | % | |||||
| Expenses net of waiver and payments by affiliates | 1.22 | %c | 1.23 | %c,d | 1.30 | % | 1.29 | %c | 1.35 | %c | |||||
| Net investment income | 3.24 | % | 3.20 | % | 4.12 | % | 4.16 | % | 3.75 | % | |||||
| Supplemental data | |||||||||||||||
| Net assets, end of year (000’s) | $ | 742,602 | $ | 765,839 | $ | 431,818 | $ | 423,309 | $ | 272,602 | |||||
| Portfolio turnover rate | 83.93 | % | 42.72 | % | 80.88 | % | 126.99 | % | 82.13 | % | |||||
aThe amount shown for a share outstanding throughout the period may not correlate with the Statement of Operations for the period due to the timing of sales and
repurchases of the Fund shares in relation to income earned and/or fluctuating fair value of the investments of the Fund.
bTotal return does not reflect sales commissions or contingent deferred sales charges, if applicable.
cBenefit of expense reduction rounds to less than 0.01%.
dBenefit of waiver and payments by affiliates rounds to less than 0.01%.
54 | Annual Report | The accompanying notes are an integral part of these financial statements. franklintempleton.com
FRANKLIN INVESTORS SECURITIES TRUST
FINANCIAL HIGHLIGHTS
| Franklin Floating Rate Daily Access Fund (continued) | ||||||
| Year Ended | ||||||
| October 31, | ||||||
| 2014 | 2013 | a | ||||
| Class R6 | ||||||
| Per share operating performance | ||||||
| (for a share outstanding throughout the year) | ||||||
| Net asset value, beginning of year | $ | 9.21 | $ | 9.21 | ||
| Income from investment operationsb: | ||||||
| Net investment income | 0.364 | 0.175 | ||||
| Net realized and unrealized gains (losses) | (0.159 | ) | (0.001 | ) | ||
| Total from investment operations | 0.205 | 0.174 | ||||
| Less distributions from net investment income | (0.365 | ) | (0.174 | ) | ||
| Net asset value, end of year | $ | 9.05 | $ | 9.21 | ||
| Total returnc | 2.36 | % | 1.80 | % | ||
| Ratios to average net assetsd | ||||||
| Expenses before waiver and payments by affiliates | 0.52 | % | 0.51 | % | ||
| Expenses net of waiver and payments by affiliates | 0.50 | %e | 0.51 | %e,f | ||
| Net investment income | 3.96 | % | 3.92 | % | ||
| Supplemental data | ||||||
| Net assets, end of year (000’s) | $ | 465 | $ | 1,339 | ||
| Portfolio turnover rate | 83.93 | % | 42.72 | % | ||
aFor the period May 1, 2013 (effective date) to October 31, 2013.
bThe amount shown for a share outstanding throughout the period may not correlate with the Statement of Operations for the period due to the timing of sales and
repurchases of the Fund shares in relation to income earned and/or fluctuating fair value of the investments of the Fund.
cTotal return is not annualized for periods less than one year.
dRatios are annualized for periods less than one year.
eBenefit of expense reduction rounds to less than 0.01%.
fBenefit of waiver and payments by affiliates rounds to less than 0.01%.
franklintempleton.com The accompanying notes are an integral part of these financial statements. | Annual Report | 55
FRANKLIN INVESTORS SECURITIES TRUST
FINANCIAL HIGHLIGHTS
| Franklin Floating Rate Daily Access Fund (continued) | |||||||||||||||
| Year Ended October 31, | |||||||||||||||
| 2014 | 2013 | 2012 | 2011 | 2010 | |||||||||||
| Advisor Class | |||||||||||||||
| Per share operating performance | |||||||||||||||
| (for a share outstanding throughout the year) | |||||||||||||||
| Net asset value, beginning of year | $ | 9.20 | $ | 9.11 | $ | 8.89 | $ | 9.11 | $ | 8.73 | |||||
| Income from investment operationsa: | |||||||||||||||
| Net investment income | 0.358 | 0.355 | 0.426 | 0.442 | 0.393 | ||||||||||
| Net realized and unrealized gains (losses) | (0.150 | ) | 0.089 | 0.225 | (0.221 | ) | 0.375 | ||||||||
| Total from investment operations | 0.208 | 0.444 | 0.651 | 0.221 | 0.768 | ||||||||||
| Less distributions from net investment income | (0.358 | ) | (0.354 | ) | (0.431 | ) | (0.441 | ) | (0.388 | ) | |||||
| Net asset value, end of year | $ | 9.05 | $ | 9.20 | $ | 9.11 | $ | 8.89 | $ | 9.11 | |||||
| Total return | 2.28 | % | 4.95 | % | 7.49 | % | 2.43 | % | 8.84 | % | |||||
| Ratios to average net assets | |||||||||||||||
| Expenses before waiver and payments by affiliates | 0.59 | % | 0.58 | % | 0.65 | % | 0.64 | % | 0.70 | % | |||||
| Expenses net of waiver and payments by affiliates | 0.57 | %b | 0.58 | %b,c | 0.65 | % | 0.64 | %b | 0.70 | %b | |||||
| Net investment income | 3.89 | % | 3.85 | % | 4.77 | % | 4.81 | % | 4.40 | % | |||||
| Supplemental data | |||||||||||||||
| Net assets, end of year (000’s) | $ | 2,019,477 | $ | 2,374,914 | $ | 739,974 | $ | 524,938 | $ | 273,158 | |||||
| Portfolio turnover rate | 83.93 | % | 42.72 | % | 80.88 | % | 126.99 | % | 82.13 | % | |||||
aThe amount shown for a share outstanding throughout the period may not correlate with the Statement of Operations for the period due to the timing of sales and
repurchases of the Fund shares in relation to income earned and/or fluctuating fair value of the investments of the Fund.
bBenefit of expense reduction rounds to less than 0.01%.
cBenefit of waiver and payments by affiliates rounds to less than 0.01%.
56 | Annual Report | The accompanying notes are an integral part of these financial statements. franklintempleton.com
FRANKLIN INVESTORS SECURITIES TRUST
| Statement of Investments, October 31, 2014 | |||||
| Franklin Floating Rate Daily Access Fund | |||||
| Country | Shares | Value | |||
| Common Stocks and Exchange Traded Funds 1.6% | |||||
| Broadcasting 0.0%† | |||||
| aCumulus Media Inc., A | United States | 5,725 | $ | 22,098 | |
| Diversified Financial Services 1.6% | |||||
| iShares iBoxx High Yield Corporate Bond, ETF | United States | 260,500 | 24,104,065 | ||
| PowerShares Senior Loan Portfolio, ETF | United States | 2,125,000 | 51,807,500 | ||
| 75,911,565 | |||||
| Health Care Distributors 0.0% | |||||
| a,bRoTech Medical Corp. | United States | 26,267 | — | ||
| Total Common Stocks and Exchange Traded Funds | |||||
| (Cost $75,202,413) | 75,933,663 | ||||
| Principal | |||||
| Amount* | |||||
| c,dSenior Floating Rate Interests 89.6% | |||||
| Aerospace & Defense 2.8% | |||||
| CAMP International Holding Co., | |||||
| 2013 Replacement Term Loan, 4.75%, 5/31/19 | United States | $ | 24,456,738 | 24,410,882 | |
| Second Lien 2013 Replacement Term Loan, 8.25%, 11/30/19 | United States | 11,741,031 | 11,814,413 | ||
| Doncasters U.S. Finance LLC, | |||||
| Second Lien Term Loan, 9.50%, 10/09/20 | United States | 10,788,940 | 10,775,454 | ||
| Term B Loans, 4.50%, 4/09/20 | United States | 16,516,308 | 16,418,251 | ||
| eErickson Inc., Purchase Price Notes, 6.00%, 11/02/20 | United States | 810,222 | 694,441 | ||
| Fly Funding II S.A.R.L., Loans, 4.50%, 8/09/19 | Luxembourg | 21,333,429 | 21,341,749 | ||
| TransDigm Inc., | |||||
| Tranche C Term Loan, 3.75%, 2/28/20 | United States | 39,429,567 | 38,862,767 | ||
| Tranche D Term Loan, 3.75%, 6/04/21 | United States | 6,408,900 | 6,319,445 | ||
| 130,637,402 | |||||
| Agricultural Products 0.1% | |||||
| Allflex Holdings III Inc., Second Lien Initial Term Loan, 8.00%, 7/17/21 | United States | 2,287,774 | 2,264,896 | ||
| Airlines 0.4% | |||||
| Air Canada, Term Loan, 5.50%, 9/26/19 | Canada | 16,480,514 | 16,631,591 | ||
| Apparel Retail 0.5% | |||||
| The Men’s Wearhouse Inc., Tranche B Term Loan, 4.50%, 6/18/21 | United States | 20,845,000 | 20,818,944 | ||
| Application Software 0.2% | |||||
| CCC Information Services Inc., Term Loan, 4.00%, 12/20/19 | United States | 10,071,241 | 9,922,267 | ||
| Auto Parts & Equipment 4.6% | |||||
| Affinia Group Inc., Tranche B-2 Term Loan, 4.75%, 4/25/20 | United States | 22,531,697 | 22,447,204 | ||
| Crowne Group LLC, Term Loan, 6.00%, 9/30/20 | United States | 25,400,000 | 25,146,000 | ||
| CS Intermediate HoldCo 2 LLC, Term Loans, 4.00%, 4/04/21 | United States | 8,521,125 | 8,446,565 | ||
| Federal-Mogul Holdings Corp., Tranche C Term Loans, 4.75%, 4/15/21 | United States | 35,710,500 | 35,536,911 | ||
| FRAM Group Holdings Inc. (Autoparts Holdings), Term Loan, 6.50%, 7/29/17 | United States | 11,639,603 | 11,681,436 | ||
| Gates Global LLC, Initial Dollar Term Loans, 4.25%, 7/03/21 | United States | 22,075,231 | 21,860,395 | ||
| Henniges Automotive Holdings Inc., Term Loans, 6.00%, 6/12/21 | United States | 20,305,550 | 20,407,078 | ||
| TI Group Automotive Systems LLC, Term Loan, 4.25%, 7/02/21 | United States | 25,251,700 | 25,062,312 | ||
| Tower Automotive Holdings USA LLC, Initial Term Loan, 4.00%, 4/23/20 | United States | 21,375,713 | 21,144,150 | ||
| UCI International Inc., Term Loan, 5.50%, 7/26/17 | United States | 11,547,922 | 11,557,542 | ||
| Veyance Technologies Inc. (Goodyear), Term Loan, 5.25%, 9/08/17 | United States | 11,301,714 | 11,264,633 | ||
| 214,554,226 | |||||
franklintempleton.com Annual Report | 57
FRANKLIN INVESTORS SECURITIES TRUST
STATEMENT OF INVESTMENTS
| Franklin Floating Rate Daily Access Fund (continued) | |||||
| Principal | |||||
| Country | Amount* | Value | |||
| c,dSenior Floating Rate Interests (continued) | |||||
| Broadcasting 4.6% | |||||
| AP NMT Acquisition BV, Second Lien Dollar Term B Loan, 10.00%, 8/13/22 | Netherlands | $ | 16,000,000 | $ | 15,560,000 |
| Cumulus Media Holdings Inc., Term Loans, 4.25%, 12/23/20 | United States | 40,209,701 | 39,692,001 | ||
| Grande Communications Networks LLC, Initial Term Loan, 4.50%, 5/31/20 | United States | 17,194,380 | 17,162,141 | ||
| Gray Television Inc., Term Loan B, 3.75%, 6/13/21 | United States | 19,633,268 | 19,457,393 | ||
| iHeartCommunications Inc., | |||||
| Tranche C Term Loan, 3.804%, 1/29/16 | United States | 49,173 | 48,599 | ||
| Tranche D Term Loan, 6.904%, 1/30/19 | United States | 23,889,566 | 22,629,391 | ||
| Tranche E Term Loan, 7.654%, 7/30/19 | United States | 10,331,493 | 10,011,217 | ||
| Media General Inc., Term B Loan, 4.25%, 7/31/20 | United States | �� | 18,578,826 | 18,497,544 | |
| Radio One Inc., Term Loan, 7.50%, 3/31/16 | United States | 35,051,909 | 35,314,798 | ||
| Univision Communications Inc., Replacement First-Lien Term Loan, 4.00%, | |||||
| 3/01/20 | United States | 35,645,047 | 35,336,860 | ||
| 213,709,944 | |||||
| Building Products 0.6% | |||||
| Quikrete Holdings Inc., | |||||
| First Lien Initial Loan, 4.00%, 9/26/20 | United States | 25,833,858 | 25,607,811 | ||
| Second Lien Initial Loan, 7.00%, 3/26/21 | United States | 2,448,462 | 2,469,886 | ||
| 28,077,697 | |||||
| Cable & Satellite 0.4% | |||||
| Virgin Media Bristol LLC, B Facility, 3.50%, 6/07/20 | United States | 17,260,000 | 17,055,038 | ||
| Casinos & Gaming 5.8% | |||||
| Caesars Entertainment Resort Properties LLC, Term B Loans, 7.00%, | |||||
| 10/11/20 | United States | 93,851,450 | 89,909,689 | ||
| fCannery Casino Resorts LLC, | |||||
| Second Lien Term Loan, 10.00%, 10/02/19 | United States | 16,523,000 | 15,077,238 | ||
| Term Loan, 6.00%, 10/02/18 | United States | 42,845,159 | 40,595,788 | ||
| CCM Merger Inc. (MotorCity Casino), Term Loans, 4.50%, 8/08/21 | United States | 13,381,621 | 13,348,167 | ||
| CityCenter Holdings LLC, Term B Loan, 4.25%, 10/16/20 | United States | 19,877,482 | 19,788,034 | ||
| fROC Finance LLC, Funded Term B Loans, 5.00%, 4/08/19 | United States | 40,299,328 | 38,586,606 | ||
| Scientific Games International Inc., Term Loan B, 4.25%, 10/18/20 | United States | 36,127,000 | 35,472,198 | ||
| Tropicana Entertainment Inc., Term Loans, 4.00%, 11/27/20 | United States | 15,899,400 | 15,621,161 | ||
| 268,398,881 | |||||
| Coal & Consumable Fuels 1.5% | |||||
| fBowie Resource Holdings LLC, First Lien Initial Term Loan, 6.75%, 8/16/20 | United States | 6,819,191 | 6,819,191 | ||
| Foresight Energy LLC, Term Loans, 5.50%, 8/23/20 | United States | 15,014,465 | 15,127,074 | ||
| fPeabody Energy Corp., Term Loan, 4.25%, 9/24/20 | United States | 47,507,549 | 46,034,815 | ||
| 67,981,080 | |||||
| Commodity Chemicals 1.3% | |||||
| AI Chem & CY U.S. Acquico Inc., | |||||
| Tranche B-1 Term Loan, 4.50%, 10/03/19 | Luxembourg | 2,931,886 | 2,920,891 | ||
| Tranche B-2 Term Loan, 4.50%, 10/03/19 | Luxembourg | 1,521,214 | 1,515,510 | ||
| fCyanco Intermediate Corp., Initial Term Loan, 5.50%, 5/01/20 | United States | 54,604,673 | 53,899,345 | ||
| 58,335,746 | |||||
| Communications Equipment 0.5% | |||||
| CIENA Corp., Term Loan, 3.75%, 7/15/19 | United States | 13,905,229 | 13,818,321 | ||
| Presidio Inc., Term Loan, 5.00%, 3/31/17 | United States | 11,221,734 | 11,221,734 | ||
| 25,040,055 |
58 | Annual Report franklintempleton.com
FRANKLIN INVESTORS SECURITIES TRUST
STATEMENT OF INVESTMENTS
| Franklin Floating Rate Daily Access Fund (continued) | |||||
| Principal | |||||
| Country | Amount* | Value | |||
| c,dSenior Floating Rate Interests (continued) | |||||
| Computer & Electronics Retail 0.6% | |||||
| Sungard Availability Services Capital Inc., Tranche B Term Loan, 6.00%, | |||||
| 3/31/19 | United States | $ | 33,143,450 | $ | 29,870,534 |
| Construction Machinery & Heavy Trucks 0.2% | |||||
| Doosan Infracore International and Doosan Holdings Europe, Tranche B Term | |||||
| Loan, 4.50%, 5/28/21 | United States | 11,321,625 | 11,345,208 | ||
| Data Processing & Outsourced Services 2.7% | |||||
| MoneyGram International Inc., Term Loan, 4.25%, 3/28/20 | United States | 89,630,140 | 87,200,267 | ||
| Safenet Inc., | |||||
| First Lien Initial Term Loan, 6.75%, 3/05/20 | United States | 11,671,350 | 11,656,761 | ||
| Second Lien Initial Term Loan, 9.75%, 3/05/21 | United States | 5,632,940 | 5,682,228 | ||
| Worldpay U.S. Inc., | |||||
| Additional Term Facility, 4.50%, 11/30/19 | United States | 3,445,200 | 3,427,974 | ||
| Facility B2A-II Loan, 5.25%, 11/30/19 | United States | 6,910,000 | 6,933,031 | ||
| Facility C2 Loan, 4.75%, 11/30/19 | United States | 8,760,000 | 8,773,692 | ||
| 123,673,953 | |||||
| Department Stores 0.3% | |||||
| Hudson’s Bay Co., First Lien Initial Term Loan, 4.75%, 11/04/20 | Canada | 14,817,000 | 14,860,992 | ||
| Diversified Chemicals 2.8% | |||||
| Arysta Lifescience SPC LLC, | |||||
| Initial Term Loan, 4.50%, 5/29/20 | United States | 18,671,851 | 18,651,424 | ||
| Second Lien Initial Term Loan, 8.25%, 11/30/20 | United States | 38,447,797 | 38,952,425 | ||
| fOCI Beaumont LLC, Term B-3 Loan, 5.00%, 8/20/19 | United States | 22,806,701 | 22,949,471 | ||
| OXEA GmbH, | |||||
| First Lien Tranche B-2 Term Loan, 4.25%, 1/15/20 | Luxembourg | 8,919,900 | 8,719,202 | ||
| Second Lien Term Loan, 8.25%, 7/15/20 | Luxembourg | 40,515,474 | 39,413,453 | ||
| 128,685,975 | |||||
| Diversified Metals & Mining 0.5% | |||||
| Atkore International Inc., | |||||
| Initial Term Loan, 4.50%, 4/09/21 | United States | 9,765,525 | 9,692,284 | ||
| Second Lien Initial Term Loan, 7.75%, 10/09/21 | United States | 12,510,459 | 12,369,716 | ||
| 22,062,000 | |||||
| Diversified Support Services 1.3% | |||||
| AlixPartners LLP, | |||||
| 2014 Jan Replacement Term B2 Loans, 4.00%, 7/10/20 | United States | 21,902,102 | 21,628,326 | ||
| Second Lien 2013 Recapitalization Term Loan, 9.00%, 7/10/21 | United States | 11,548,950 | 11,751,057 | ||
| Interactive Data Corp., Term Loan, 4.75%, 5/02/21 | United States | 27,796,531 | 27,831,277 | ||
| 61,210,660 | |||||
| Drug Retail 0.2% | |||||
| Rite Aid Corp., | |||||
| Tranche 1 Term Loan, 5.75%, 8/21/20 | United States | 2,780,000 | 2,799,691 | ||
| Tranche 2 Term Loan, 4.875%, 6/21/21 | United States | 4,740,000 | 4,753,333 | ||
| 7,553,024 | |||||
| Electric Utilities 1.3% | |||||
| fAlinta Energy Finance Pty. Ltd., | |||||
| gDelayed Draw Term Commitments, 6.375%, 8/13/18 | Australia | 956,245 | 966,206 | ||
| Term B Loans, 6.375%, 8/13/19 | Australia | 56,315,494 | 56,902,133 | ||
| 57,868,339 | |||||
| franklintempleton.com | Annual Report | 59 | ||||
FRANKLIN INVESTORS SECURITIES TRUST
STATEMENT OF INVESTMENTS
| Franklin Floating Rate Daily Access Fund (continued) | |||||
| Principal | |||||
| Country | Amount* | Value | |||
| c,dSenior Floating Rate Interests (continued) | |||||
| Electronic Equipment & Instruments 0.0%† | |||||
| Oberthur Technologies of America Corp., Tranche B-2 Term Loan, 4.50%, | |||||
| 10/18/19 | United States | $ | 1,310,894 | $ | 1,296,693 |
| Food Distributors 0.7% | |||||
| AdvancePierre Foods Inc., | |||||
| Loans, 5.75%, 7/10/17 | United States | 8,734,376 | 8,701,621 | ||
| Second Lien Term Loan, 9.50%, 10/10/17 | United States | 24,560,081 | 24,391,231 | ||
| 33,092,852 | |||||
| Food Retail 0.1% | |||||
| Pantry Inc., Term Loan, 4.75%, 8/03/19 | United States | 3,121,411 | 3,133,116 | ||
| Forest Products 1.5% | |||||
| Appvion Inc., Term Loan, 5.75%, 6/28/19 | United States | 38,906,908 | 38,663,739 | ||
| Caraustar Industries Inc., Initial Term Loan, 7.50%, 5/01/19 | United States | 31,062,740 | 31,334,539 | ||
| 69,998,278 | |||||
| Health Care Equipment 1.1% | |||||
| Carestream Health Inc., | |||||
| Second Lien Loan, 9.50%, 12/07/19 | United States | 16,729,461 | 16,610,966 | ||
| Term Loan, 5.00%, 6/07/19 | United States | 19,940,647 | 19,990,498 | ||
| Kinetic Concepts Inc., Dollar Term E-1 Loan, 4.00%, 5/04/18 | United States | 13,068,535 | 12,995,024 | ||
| 49,596,488 | |||||
| Health Care Facilities 1.6% | |||||
| Community Health Systems Inc., 2021 Term D Loan, 4.25%, 1/27/21 | United States | 52,277,752 | 52,392,136 | ||
| Iasis Healthcare LLC, Term B-2 Loan, 4.50%, 5/03/18 | United States | 13,066,765 | 13,079,022 | ||
| United Surgical Partners International Inc., | |||||
| Extended Term Loan, 4.25%, 4/03/17 | United States | 5,248,071 | 5,220,125 | ||
| New Tranche B Term Loan, 4.75%, 4/03/19 | United States | 5,071,061 | 5,081,330 | ||
| 75,772,613 | |||||
| Health Care Services 4.6% | |||||
| Connolly LLC, | |||||
| Second Lien Initial Term Loan, 8.00%, 5/14/22 | United States | 21,642,500 | 21,804,819 | ||
| Initial Term Loan, 5.00%, 5/14/21 | United States | 20,787,900 | 20,722,938 | ||
| Dialysis Newco Inc., | |||||
| Second Lien Term Loan B, 7.75%, 10/22/21 | United States | 3,806,667 | 3,816,183 | ||
| Term Loan B, 4.50%, 4/23/21 | United States | 15,612,810 | 15,495,713 | ||
| Millennium Health LLC, Tranche B Term Loan, 5.25%, 4/16/21 | United States | 47,429,847 | 47,518,778 | ||
| National Mentor Holdings Inc., Initial Tranche B Term Loan, 4.75%, 1/31/21 | United States | 27,281,765 | 27,111,254 | ||
| Surgery Centers Holdings Inc., | |||||
| First Lien Term Loan, 7.00%, 4/11/19 | United States | 11,214,395 | 11,214,395 | ||
| Incremental Second Lien Term Loan, 10.75%, 4/10/20 | United States | 3,140,000 | 3,202,800 | ||
| fSecond Lien Term Loan, 9.75%, 11/03/21 | United States | 12,120,000 | 11,934,419 | ||
| fTerm Loan, 6.50%, 11/03/20 | United States | 11,670,000 | 11,666,359 | ||
| U.S. Renal Care Inc., | |||||
| Incremental Tranche B-1 Term Loan (Second), 8.50%, 1/03/20 | United States | 2,489,852 | 2,502,301 | ||
| Tranche B-2 Term Loan, 4.25%, 7/03/19 | United States | 35,939,620 | 35,737,460 | ||
| 212,727,419 | |||||
| Health Care Supplies 0.2% | |||||
| Alere Inc., B Term Loan, 4.25%, 6/30/17 | United States | 11,353,121 | 11,326,158 |
60 | Annual Report franklintempleton.com
FRANKLIN INVESTORS SECURITIES TRUST
STATEMENT OF INVESTMENTS
| Franklin Floating Rate Daily Access Fund (continued) | |||||
| Principal | |||||
| Country | Amount* | Value | |||
| c,dSenior Floating Rate Interests (continued) | |||||
| Health Care Technology 0.6% | |||||
| Truven Health Analytics Inc., New Tranche B Term Loan, 4.50%, 6/06/19 | United States | $ | 27,843,007 | $ | 27,251,344 |
| Home Improvement Retail 0.5% | |||||
| fHarbor Freight Tools USA Inc., Loans, 4.75%, 7/26/19 | United States | 24,729,936 | 24,760,848 | ||
| Hotels, Resorts & Cruise Lines 0.8% | |||||
| Diamond Resorts Corp., Term Loans, 5.50%, 5/09/21 | United States | 14,294,072 | 14,294,072 | ||
| Four Seasons Holdings Inc., Second Lien Term Loan, 6.25%, 12/27/20 | Canada | 5,873,389 | 5,917,440 | ||
| Station Casinos LLC, B Term Loan, 4.25%, 3/01/20 | United States | 17,388,162 | 17,170,810 | ||
| 37,382,322 | |||||
| Household Products 1.3% | |||||
| Sun Products Corp., Tranche B Term Loan, 5.50%, 3/23/20 | United States | 65,879,314 | 59,291,382 | ||
| Industrial Conglomerates 0.3% | |||||
| Mirion Technologies Inc., Term Loan, 5.75%, 3/30/18 | United States | 7,505,293 | 7,495,911 | ||
| Unifrax I LLC, New Term Dollar Loans, 4.25%, 11/28/18 | United States | 6,070,476 | 6,024,947 | ||
| 13,520,858 | |||||
| Industrial Machinery 4.2% | |||||
| Alfred Fueling Systems Inc. (Wayne Fueling), | |||||
| First Lien Initial Term Loan, 4.75%, 6/20/21 | United States | 16,239,300 | 16,076,907 | ||
| Second Lien Initial Term Loan, 8.50%, 6/20/22 | United States | 23,842,353 | 23,603,929 | ||
| Douglas Dynamics LLC, Term Loan, 5.75%, 4/18/18 | United States | 4,338,408 | 4,332,985 | ||
| Husky Injection Molding Systems Ltd., Initial Term Loan, 4.25%, 6/30/21 | United States | 19,055,643 | 18,760,872 | ||
| Milacron LLC, Term B Loan, 4.00%, 3/28/20 | United States | 13,906,310 | 13,558,652 | ||
| Navistar Inc., Tranche B Term Loan, 5.75%, 8/17/17 | United States | 28,258,604 | 28,382,235 | ||
| Onsite Rental Group Operations Pty. Ltd., Term B Loan, 5.50%, 7/30/21 | United States | 36,228,571 | 35,775,714 | ||
| RBS Global Inc. (Rexnord), Term B Loan, 4.00%, 8/21/20 | United States | 19,844,438 | 19,583,980 | ||
| Sensus USA Inc., | |||||
| First Lien Term Loan, 4.50%, 5/09/17 | United States | 14,477,072 | 14,115,145 | ||
| Second Lien Term Loan, 8.50%, 5/09/18 | United States | 15,314,541 | 15,008,250 | ||
| WireCo Worldgroup Inc., Term Loan, 6.00%, 2/15/17 | United States | 5,838,107 | 5,858,178 | ||
| 195,056,847 | |||||
| Insurance Brokers 0.4% | |||||
| HUB International Ltd., Initial Term Loan, 4.25%, 10/02/20 | United States | 17,261,839 | 17,041,750 | ||
| Integrated Telecommunication Services 1.4% | |||||
| Genesys Telecom Holdings U.S. Inc., Dollar Term Loan, 4.00%, 2/08/20 | United States | 8,699,406 | 8,590,664 | ||
| Integra Telecom Holdings Inc., | |||||
| fFirst Lien Term Loan, 5.25%, 2/22/19 | United States | 20,492,282 | 20,492,282 | ||
| Second Lien Initial Loan, 9.75%, 2/24/20 | United States | 8,213,247 | 8,315,913 | ||
| LTS Buyer LLC, | |||||
| First Lien Term B Loan, 4.00%, 4/11/20 | United States | 7,119,376 | 7,013,653 | ||
| Second Lien Initial Loan, 8.00%, 4/11/21 | United States | 7,417,489 | 7,389,674 | ||
| Zayo Group LLC, Term Loan, 4.00%, 7/02/19 | United States | 13,603,070 | 13,501,047 | ||
| 65,303,233 | |||||
| Internet Software & Services 1.7% | |||||
| BMC Software Finance Inc., Initial U.S. Term Loans, 5.00%, 9/10/20 | United States | 79,768,388 | 78,889,101 | ||
| Investment Banking & Brokerage 0.6% | |||||
| Guggenheim Partners Investment Management Holdings LLC, Initial Term Loan, | |||||
| 4.25%, 7/22/20 | United States | 28,647,486 | 28,504,249 | ||
| franklintempleton.com | Annual Report | 61 | ||||
FRANKLIN INVESTORS SECURITIES TRUST
STATEMENT OF INVESTMENTS
| Franklin Floating Rate Daily Access Fund (continued) | |||||
| Principal | |||||
| Country | Amount* | Value | |||
| c,dSenior Floating Rate Interests (continued) | |||||
| Leisure Facilities 3.0% | |||||
| 24 Hour Fitness Worldwide Inc., Term Loan, 4.75%, 5/30/21 | United States | $ | 33,453,705 | $ | 33,265,361 |
| ClubCorp Club Operations Inc., Term B Loans, 4.50%, 7/24/20 | United States | 18,394,113 | 18,263,827 | ||
| fFitness International LLC, Term B Loan, 5.50%, 7/01/20 | United States | 50,970,677 | 50,658,482 | ||
| Planet Fitness Holdings LLC, Term Loan, 4.75%, 3/31/21 | United States | 11,736,342 | 11,787,688 | ||
| fTown Sports International LLC, Initial Term Loan, 4.50%, 11/15/20 | United States | 29,474,964 | 24,562,460 | ||
| 138,537,818 | |||||
| Life Sciences Tools & Services 0.2% | |||||
| Pharmaceutical Product Development LLC, Term Loan, 4.00%, 12/05/18 | United States | 7,718,046 | 7,672,702 | ||
| Marine 0.6% | |||||
| Navios Maritime Partners LP, Initial Term Loan, 5.25%, 6/27/18 | Marshall Islands | 29,568,378 | 29,814,771 | ||
| Metal & Glass Containers 1.1% | |||||
| CD&R Millennium U.S. Acquico LLC, | |||||
| Initial Dollar Term Loan, 4.50%, 7/31/21 | United States | 6,240,000 | 6,181,500 | ||
| Second Lien Initial Term Loan, 8.25%, 7/31/22 | United States | 22,149,800 | 21,955,989 | ||
| Prescrix Inc., | |||||
| First Lien Term Loan B, 4.25%, 5/02/21 | United States | 10,963,810 | 10,881,582 | ||
| Second Lien Term Loan, 8.00%, 5/02/22 | United States | 11,679,053 | 11,617,014 | ||
| 50,636,085 | |||||
| Movies & Entertainment 1.9% | |||||
| William Morris Endeavor Entertainment LLC, | |||||
| Term Loans First Lien, 5.25%, 5/06/21 | United States | 35,240,811 | 34,770,945 | ||
| Term Loans Second Lien, 8.25%, 5/06/22 | United States | 41,391,290 | 40,459,986 | ||
| Zuffa LLC, Initial Term Loan, 3.75%, 2/25/20 | United States | 12,688,254 | 12,397,477 | ||
| 87,628,408 | |||||
| Oil & Gas Drilling 1.3% | |||||
| Drillships Financing Holding Inc., Tranche B-1 Term Loan, 6.00%, 3/31/21 | Marshall Islands | 35,705,885 | 34,292,539 | ||
| Drillships Ocean Ventures Inc. and Drillships Vent, Term Loan, 5.50%, 7/25/21 | United States | 15,561,000 | 14,977,463 | ||
| Offshore Group Investment Ltd. (Vantage Delaware), Loans, 5.75%, 3/28/19 | United States | 13,642,250 | 12,278,025 | ||
| 61,548,027 | |||||
| Oil & Gas Equipment & Services 0.5% | |||||
| McJunkin Red Man Corp., 2013 Term Loan, 5.00%, 11/11/19 | United States | 25,011,670 | 25,024,176 | ||
| Oil & Gas Exploration & Production 1.8% | |||||
| Fieldwood Energy LLC, Second Lien Loans, 8.375%, 9/30/20 | United States | 5,530,000 | 5,344,745 | ||
| Obsidian Natural Gas Trust, Term Loan, 7.00%, 11/02/15 | United States | 4,448,684 | 4,426,441 | ||
| Samson Investment Co., Second Lien Tranche I Term Loan, 5.00%, 9/25/18 | United States | 27,720,000 | 25,779,600 | ||
| UTEX Industries Inc., | |||||
| First Lien Initial Term Loan, 5.00%, 5/22/21 | United States | 34,344,597 | 34,172,875 | ||
| Second Lien Initial Term Loan, 8.25%, 5/22/22 | United States | 12,147,156 | 12,071,236 | ||
| 81,794,897 | |||||
| Oil & Gas Refining & Marketing 0.1% | |||||
| Citgo Petroleum Corp., Term B Loan, 5.75%, 7/29/21 | United States | 6,829,616 | 6,839,574 | ||
| Oil & Gas Storage & Transportation 1.3% | |||||
| OSG Bulk Ships Inc., Initial Term Loan, 5.25%, 8/05/19 | United States | 24,508,575 | 24,386,032 | ||
| OSG International Inc., Initial Term Loan, (OIN), 5.25%, 8/05/19 | United States | 18,154,500 | 18,029,688 | ||
| Southcross Energy Partners LP, Initial Term Loan, 5.25%, 8/04/21 | United States | 9,705,675 | 9,681,411 | ||
| Southcross Holdings Borrower LP, Term Loan, 6.00%, 8/04/21 | United States | 9,715,650 | 9,624,566 | ||
| 61,721,697 |
62 | Annual Report franklintempleton.com
FRANKLIN INVESTORS SECURITIES TRUST
STATEMENT OF INVESTMENTS
| Franklin Floating Rate Daily Access Fund (continued) | ||||||
| Principal | ||||||
| Country | Amount* | Value | ||||
| c,dSenior Floating Rate Interests (continued) | ||||||
| Other Diversified Financial Services 0.7% | ||||||
| Asurion LLC, | ||||||
| Incremental Tranche B-1 Term Loan, 5.00%, 5/24/19 | United States | $ | 28,940,993 | $ | 28,983,941 | |
| Second Lien Term Loan, 8.50%, 3/03/21 | United States | 4,870,000 | 4,959,793 | |||
| 33,943,734 | ||||||
| Packaged Foods & Meats 1.1% | ||||||
| fBig Heart Pet Brands (Del Monte Pet), Initial Term Loans, 3.50%, 2/24/20 | United States | 28,605,432 | 27,579,068 | |||
| CSM Bakery Supplies LLC (U.S. Acquisition), Second Lien Term Loan, 8.75%, | ||||||
| 7/03/21 | United States | 11,591,497 | 11,345,177 | |||
| CSM Bakery Supplies LLC, Term Loans, 5.00%, 7/03/20 | United States | 4,624,795 | 4,592,038 | |||
| JBS USA LLC, Incremental Term Loan, 3.75%, 9/18/20 | United States | 5,593,300 | 5,542,541 | |||
| 49,058,824 | ||||||
| Paper Packaging 2.3% | ||||||
| Clondalkin Acquisition BV, | ||||||
| Other Term Loan, 4.50%, 5/29/20 | Netherlands | 32,088,598 | 31,687,490 | |||
| Second Lien Term Loan, 10.00%, 11/30/20 | Netherlands | 9,606,960 | 9,654,995 | |||
| Exopack Holdings SA, USD Term Loan, 5.25%, 5/08/19 | Luxembourg | 42,431,829 | 42,723,548 | |||
| Reynolds Group Holdings Inc., U.S. Term Loan, 4.00%, 12/01/18 | United States | 21,013,729 | 20,927,489 | |||
| 104,993,522 | ||||||
| Personal Products 1.3% | ||||||
| FGI Operating Co. LLC (Freedom Group), Term B Loans, 5.50%, 4/19/19 | United States | 41,775,600 | 41,645,051 | |||
| Revlon Consumer Products Corp., Acquisition Term Loans, 4.00%, 10/09/19 | United States | 18,609,375 | 18,415,521 | |||
| 60,060,572 | ||||||
| Pharmaceuticals 1.2% | ||||||
| Akorn Inc., Loans, 4.50%, 4/16/21 | United States | 31,664,347 | 31,518,945 | |||
| fCatalent Pharma Solutions Inc., Dollar Term Loan, 4.50%, 5/20/21 | United States | 4,491,051 | 4,491,855 | |||
| Valeant Pharmaceuticals International Inc., | ||||||
| Series C-2 Tranche B Term Loan, 3.50%, 12/11/19 | Canada | 9,440,848 | 9,368,352 | |||
| Series D-2 Tranche B Term Loan, 3.50%, 2/13/19 | Canada | 12,551,417 | 12,464,260 | |||
| 57,843,412 | ||||||
| Publishing 1.0% | ||||||
| Cengage Learning Acquisitions Inc., Original Term Loans, 7.00%, 3/31/20 | United States | 46,371,975 | 46,505,294 | |||
| Restaurants 0.8% | ||||||
| TGI Friday’s Inc., | ||||||
| First Lien Initial Term Loan, 5.25%, 7/15/20 | United States | 24,350,639 | 24,350,639 | |||
| fSecond Lien Initial Term Loan, 9.25%, 7/15/21 | United States | 14,114,552 | 14,026,336 | |||
| 38,376,975 | ||||||
| Retail REITs 0.1% | ||||||
| Capital Automotive LP, Second Lien Term Loan, 6.00%, 4/30/20 | United States | 4,896,250 | 4,969,694 | |||
| Semiconductors 1.3% | ||||||
| Freescale Semiconductor Inc., | ||||||
| Tranche B-4 Term Loan, 4.25%, 2/28/20 | United States | 20,237,075 | 19,993,603 | |||
| Tranche B-5 Term Loan, 5.00%, 1/15/21 | United States | 23,284,091 | 23,293,800 | |||
| M/A-COM Technology Solutions Holdings Inc., Initial Term Loan, 4.50%, | ||||||
| 5/07/21 | United States | 16,478,700 | 16,478,700 | |||
| 59,766,103 |
franklintempleton.com Annual Report | 63
FRANKLIN INVESTORS SECURITIES TRUST
STATEMENT OF INVESTMENTS
| Franklin Floating Rate Daily Access Fund (continued) | |||||
| Principal | |||||
| Country | Amount* | Value | |||
| c,dSenior Floating Rate Interests (continued) | |||||
| Specialized Consumer Services 1.0% | |||||
| Koosharem LLC, Term Loans, 7.50%, 5/16/20 | United States | $ | 15,361,500 | $ | 15,246,289 |
| Travelport Finance Luxembourg S.A.R.L., Initial Term Loan, 6.00%, 9/02/21 | Luxembourg | 32,750,000 | 32,696,781 | ||
| 47,943,070 | |||||
| Specialized Finance 0.6% | |||||
| Trans Union LLC, 2014 Replacement Term Loan, 4.00%, 4/09/21 | United States | 30,377,350 | 29,978,647 | ||
| Specialty Chemicals 4.1% | |||||
| Axalta Coating Systems U.S. Holdings Inc., 2014 Specified Refinancing Term, | |||||
| 3.75%, 2/01/20 | United States | 23,266,849 | 22,932,388 | ||
| AZ Chem US Inc., | |||||
| First Lien Initial Term Loan, 4.50%, 6/12/21 | United States | 18,442,110 | 18,445,946 | ||
| Second Lien Initial Term Loan, 7.50%, 6/12/22 | United States | 10,343,756 | 10,360,999 | ||
| CeramTec Acquisition Corp., Initial Dollar Term B-2 Loan, 4.25%, 8/30/20 | United States | 1,468,986 | 1,461,641 | ||
| CeramTec GmbH, Dollar Term B-3 Loan, 4.25%, 8/30/20 | Germany | 4,459,928 | 4,437,628 | ||
| Faenza Acquisition GmbH, Initial Dollar Term B-1 Loan, 4.25%, 8/30/20 | Germany | 14,815,355 | 14,741,278 | ||
| fMacDermid Holdings LLC, First Lien Tranche B Term Loan, 4.00%, 6/07/20 | United States | 20,043,522 | 19,636,398 | ||
| Nexeo Solutions LLC, | |||||
| Term B-2 Loan, 5.00%, 9/09/17 | United States | 6,458,200 | 6,385,545 | ||
| Term B-3 Loan, 5.00%, 9/09/17 | United States | 5,548,075 | 5,485,659 | ||
| Oxbow Carbon LLC, | |||||
| First Lien Tranche B Term Loan, 4.25%, 7/19/19 | United States | 24,110,042 | 23,808,667 | ||
| Second Lien Initial Term Loan, 8.00%, 1/19/20 | United States | 16,364,314 | 16,037,028 | ||
| Solenis International LP and Solenis Holdings, | |||||
| First Lien Term Loan, 4.25%, 7/31/21 | United States | 10,066,786 | 9,884,325 | ||
| Second Lien Term Loan, 7.75%, 7/31/22 | United States | 7,800,000 | 7,640,100 | ||
| Sonneborn LLC, Initial U.S. Term Loan, 6.50%, 3/30/18 | United States | 6,767,674 | 6,788,823 | ||
| Sonneborn Refined Products BV, Initial BV Term Loan, 6.50%, 3/30/18 | Netherlands | 1,194,295 | 1,198,028 | ||
| Univar Inc., Term B Loan, 5.00%, 6/30/17 | United States | 23,157,300 | 23,041,514 | ||
| 192,285,967 | |||||
| Specialty Stores 2.9% | |||||
| 99 Cents Only Stores, Tranche B-2 Loan, 4.50%, 1/13/19 | United States | 18,085,406 | 17,955,426 | ||
| Academy Ltd., Initial Term Loans, 4.50%, 8/03/18 | United States | 12,521,092 | 12,471,008 | ||
| BJ’s Wholesale Club Inc., | |||||
| 2013 (Nov) Replacement Loans, 4.50%, 9/26/19 | United States | 1,105,474 | 1,094,813 | ||
| Second Lien 2013 (Nov) Replacement Loans, 8.50%, 3/26/20 | United States | 35,190,476 | 35,296,048 | ||
| Evergreen AcqCo. 1 LP (Savers), Term Loan, 5.00%, 7/09/19 | United States | 51,335,344 | 51,078,668 | ||
| Leslie’s Poolmart Inc., Tranche B Term Loan, 4.25%, 10/16/19 | United States | 14,591,683 | 14,342,414 | ||
| 132,238,377 | |||||
| Steel 0.3% | |||||
| fWalter Energy Inc., B Term Loan, 7.25%, 4/01/18 | United States | 14,171,429 | 12,293,714 | ||
| Systems Software 1.8% | |||||
| Blue Coat Systems Inc., | |||||
| Second Lien Loans, 9.50%, 6/28/20 | United States | 12,027,143 | 12,057,211 | ||
| Term Loan, 4.00%, 5/31/19 | United States | 9,429,249 | 9,272,092 | ||
| Vertafore Inc., | |||||
| New Term Loan, 4.25%, 10/03/19 | United States | 6,711,287 | 6,681,925 | ||
| Second Lien Term Loan, 9.75%, 10/27/17 | United States | 14,748,238 | 14,868,067 |
64 | Annual Report
franklintempleton.com
FRANKLIN INVESTORS SECURITIES TRUST
STATEMENT OF INVESTMENTS
| Franklin Floating Rate Daily Access Fund (continued) | |||||
| Principal | |||||
| Country | Amount* | Value | |||
| c,dSenior Floating Rate Interests (continued) | |||||
| Systems Software (continued) | |||||
| Websense Inc., | |||||
| First Lien Term Loan, 4.50%, 6/25/20 | United States | $ | 18,371,890 | $ | 18,176,688 |
| Second Lien Term Loan, 8.25%, 12/24/20 | United States | 22,205,846 | 22,178,089 | ||
| 83,234,072 | |||||
| Technology Hardware, Storage & Peripherals 0.9% | |||||
| Dell International LLC, Term B Loan, 4.50%, 4/29/20 | United States | 39,513,902 | 39,623,909 | ||
| Tires & Rubber 0.5% | |||||
| The Goodyear Tire & Rubber Co., Second Lien Term Loan, 4.75%, 4/30/19 | United States | 24,325,000 | 24,416,219 | ||
| Trucking 1.1% | |||||
| Global Tip Finance BV/Finance America LLC, Facility C Commitment, 7.00%, | |||||
| 10/16/20 | United States | 19,247,464 | 19,247,464 | ||
| Hertz Corp., | |||||
| Credit Linked Deposit, 3.75%, 3/11/18 | United States | 18,350,000 | 18,258,250 | ||
| Tranche B-1 Term Loan, 3.75%, 3/11/18 | United States | 12,291,075 | 12,187,375 | ||
| 49,693,089 | |||||
| Total Senior Floating Rate Interests (Cost $4,188,383,488) | 4,152,947,352 | ||||
| Asset-Backed Securities and Commercial Mortgage-Backed | |||||
| Securities 2.5% | |||||
| Other Diversified Financial Services 2.5% | |||||
| hApidos CDO, 2013-14A, C2, 144A, 4.85%, 4/15/25 | United States | 3,540,000 | 3,433,021 | ||
| d,hAtrium IX, 9A, C, 144A, FRN, 3.488%, 2/28/24 | Cayman Islands | 2,500,000 | 2,479,050 | ||
| d,hAtrium XI, 11A, C, 144A, FRN, 3.435%, 10/23/25 | Cayman Islands | 29,700,000 | 29,400,030 | ||
| d,f,hBallyrock CDO Ltd. LLC, 2014-1A, B, 144A, FRN, 3.431%, 10/20/26 | Cayman Islands | 5,200,000 | 5,132,452 | ||
| d,hCarlyle Global Market Strategies CLO 2014-4 Ltd., 2014-4A, C, 144A, FRN, | |||||
| 3.383%, 10/15/26 | Cayman Islands | 6,500,000 | 6,394,830 | ||
| d,hCatamaran CLO Ltd., | |||||
| 2013-1A, C, 144A, FRN, 2.834%, 1/27/25 | Cayman Islands | 3,500,000 | 3,320,695 | ||
| 2014-2A, B, 144A, FRN, 3.233%, 10/18/26 | United States | 13,240,000 | 12,708,414 | ||
| d,hCent CLO LP, | |||||
| 2013-17A, D, 144A, FRN, 3.233%, 1/30/25 | Cayman Islands | 3,850,000 | 3,759,794 | ||
| 2014-22A, B, 144A, FRN, 3.433%, 11/07/26 | Cayman Islands | 7,400,000 | 7,400,000 | ||
| d,hEaton Vance CDO Ltd., 2014-1A, | |||||
| A, 144A, FRN, 1.685%, 7/15/26 | Cayman Islands | 6,510,000 | 6,507,005 | ||
| B, 144A, FRN, 2.285%, 7/15/26 | United States | 6,510,000 | 6,322,512 | ||
| C, 144A, FRN, 3.235%, 7/15/26 | United States | 5,630,000 | 5,496,344 | ||
| hEmerson Park CLO Ltd., 2013-1A, C2, 144A, 5.64%, 7/15/25 | United States | 3,600,000 | 3,642,480 | ||
| hHighbridge Loan Management Ltd., 2013-2A, B2, 144A, 5.80%, 10/20/24 | United States | 3,500,000 | 3,536,365 | ||
| d,hING Investment Management CLO Ltd., | |||||
| 2013-1A, B, 144A, FRN, 3.131%, 4/15/24 | Cayman Islands | 3,850,000 | 3,715,982 | ||
| 2013-1A, C, 144A, FRN, 3.731%, 4/15/24 | Cayman Islands | 3,850,000 | 3,625,853 | ||
| 2013-2A, B, 144A, FRN, 2.914%, 4/25/25 | United States | 3,850,000 | 3,716,136 | ||
| d,f,hLimerock CLO III LLC, 2014-3A, B, 144A, FRN, 3.429%, 10/20/26 | Cayman Islands | 6,700,000 | 6,613,885 | ||
| Total Asset-Backed Securities and Commercial | |||||
| Mortgage-Backed Securities (Cost $118,731,302) | 117,204,848 | ||||
| Total Investments before Short Term Investments | |||||
| (Cost $4,382,317,203) | 4,346,085,863 |
franklintempleton.com Annual Report | 65
FRANKLIN INVESTORS SECURITIES TRUST
STATEMENT OF INVESTMENTS
| Franklin Floating Rate Daily Access Fund (continued) | ||||
| Country | Shares | Value | ||
| Short Term Investments (Cost $190,030,253) 4.1% | ||||
| Money Market Funds 4.1% | ||||
| a,iInstitutional Fiduciary Trust Money Market Portfolio | United States | 190,030,253 | $ | 190,030,253 |
| Total Investments (Cost $4,572,347,456) 97.8% | 4,536,116,116 | |||
| Other Assets, less Liabilities 2.2% | 101,296,043 | |||
| Net Assets 100.0% | $ | 4,637,412,159 |
†Rounds to less than 0.1% of net assets.
*The principal amount is stated in U.S. dollars unless otherwise indicated.
aNon-income producing.
bSee Note 8 regarding restricted securities.
cSee Note 1(i) regarding senior floating rate interests.
dThe coupon rate shown represents the rate at period end.
eSecurity has been deemed illiquid because it may not be able to be sold within seven days. At October 31, 2014, the value of this security was $694,441, representing
0.01% of net assets.
fA portion or all of the security purchased on a when-issued or delayed delivery basis. See Note 1(c).
gSee Note 9 regarding unfunded loan commitments.
hSecurity was purchased pursuant to Rule 144A under the Securities Act of 1933 and may be sold in transactions exempt from registration only to qualified institutional
buyers or in a public offering registered under the Securities Act of 1933. These securities have been deemed liquid under guidelines approved by the Trust’s Board of
Trustees. At October 31, 2014, the aggregate value of these securities was $117,204,848, representing 2.53% of net assets.
iSee Note 3(f) regarding investments in Institutional Fiduciary Trust Money Market Portfolio.
At October 31, 2014, the Fund had the following credit default swap contracts outstanding. See Note 1(d).
| Credit Default Swap Contracts | |||||||||||||||
| Upfront | |||||||||||||||
| Periodic | Premiums | ||||||||||||||
| Notional | Payment | Expiration | Paid | Unrealized | Unrealized | Market | |||||||||
| Description | Exchange | Amounta | Rate | Date | (Received) | Appreciation | Depreciation | Value | Ratingb | ||||||
| Centrally Cleared Swaps | |||||||||||||||
| Contracts to Sell Protectionc | |||||||||||||||
| Traded Index | |||||||||||||||
| CDX.NA.HY.23 | ICE | $ | 24,700,000 | 5.00 | % | 12/20/19 | $ | 1,500,769 | $ | 367,810 | $ | — | $ | 1,868,579 | Non |
| Investment | |||||||||||||||
| Grade | |||||||||||||||
| Centrally Cleared Swaps unrealized appreciation (depreciation) | 367,810 | — | |||||||||||||
| Net unrealized appreciation (depreciation) | $ | 367,810 | |||||||||||||
aIn U.S. dollars unless otherwise indicated. For contracts to sell protection, the notional amount is equal to the maximum potential amount of the future payments and no
recourse provisions have been entered into in association with the contracts.
bBased on Standard and Poor's (S&P) Rating for single name swaps and internal ratings for index swaps. Internal ratings based on mapping into equivalent ratings from
external vendors.
cThe fund enters contracts to sell protection to create a long credit position. Performance triggers include failure to pay or bankruptcy of the underlying securities for traded
index swaps.
See Note 10 regarding other derivative information.
See Abbreviations on page 151.
66 | Annual Report | The accompanying notes are an integral part of these financial statements. franklintempleton.com
| FRANKLIN INVESTORS SECURITIES TRUST | |||||||||||||||
| Financial Highlights | |||||||||||||||
| Franklin Low Duration Total Return Fund | |||||||||||||||
| Year Ended October 31, | |||||||||||||||
| 2014 | 2013 | 2012 | 2011 | 2010 | |||||||||||
| Class A | |||||||||||||||
| Per share operating performance | |||||||||||||||
| (for a share outstanding throughout the year) | |||||||||||||||
| Net asset value, beginning of year | $ | 10.16 | $ | 10.29 | $ | 10.27 | $ | 10.44 | $ | 10.19 | |||||
| Income from investment operationsa: | |||||||||||||||
| Net investment income | 0.144 | 0.166 | 0.169 | 0.214 | 0.240 | ||||||||||
| Net realized and unrealized gains (losses) | (0.011 | ) | (0.032 | ) | 0.158 | (0.111 | ) | 0.334 | |||||||
| Total from investment operations | 0.133 | 0.134 | 0.327 | 0.103 | 0.574 | ||||||||||
| Less distributions from: | |||||||||||||||
| Net investment income and net foreign currency gains | (0.183 | ) | (0.264 | ) | (0.307 | ) | (0.233 | ) | (0.292 | ) | |||||
| Net realized gains | — | — | — | (0.040 | ) | (0.032 | ) | ||||||||
| Total distributions | (0.183 | ) | (0.264 | ) | (0.307 | ) | (0.273 | ) | (0.324 | ) | |||||
| Net asset value, end of year | $ | 10.11 | $ | 10.16 | $ | 10.29 | $ | 10.27 | $ | 10.44 | |||||
| Total returnb | 1.32 | % | 1.32 | % | 3.26 | % | 0.99 | % | 5.74 | % | |||||
| Ratios to average net assets | |||||||||||||||
| Expenses before waiver and payments by affiliates | 0.93 | % | 0.98 | % | 1.01 | % | 1.03 | % | 1.06 | % | |||||
| Expenses net of waiver and payments by affiliates | 0.80 | %c | 0.80 | %c | 0.89 | % | 0.90 | % | 0.90 | %c | |||||
| Net investment income | 1.24 | % | 1.25 | % | 1.47 | % | 1.95 | % | 2.15 | % | |||||
| Supplemental data | |||||||||||||||
| Net assets, end of year (000’s) | $ | 1,589,854 | $ | 1,296,612 | $ | 904,878 | $ | 636,622 | $ | 369,836 | |||||
| Portfolio turnover rate | 78.63 | % | 64.86 | % | 51.42 | % | 75.51 | % | 49.84 | % | |||||
aThe amount shown for a share outstanding throughout the period may not correlate with the Statement of Operations for the period due to the timing of sales and
repurchases of the Fund shares in relation to income earned and/or fluctuating fair value of the investments of the Fund.
bTotal return does not reflect sales commissions or contingent deferred sales charges, if applicable.
cBenefit of expense reduction rounds to less than 0.01%.
franklintempleton.com The accompanying notes are an integral part of these financial statements. | Annual Report | 67
FRANKLIN INVESTORS SECURITIES TRUST
FINANCIAL HIGHLIGHTS
| Franklin Low Duration Total Return Fund (continued) | |||||||||
| Year Ended October 31, | |||||||||
| 2014 | 2013 | 2012a | |||||||
| Class C | |||||||||
| Per share operating performance | |||||||||
| (for a share outstanding throughout the year) | |||||||||
| Net asset value, beginning of year | $ | 10.16 | $ | 10.29 | $ | 10.29 | |||
| Income from investment operationsb: | |||||||||
| Net investment income | 0.098 | 0.189 | 0.013 | ||||||
| Net realized and unrealized gains (losses) | (0.001 | ) | (0.090 | ) | 0.005 | ||||
| Total from investment operations | 0.097 | 0.099 | 0.018 | ||||||
| Less distributions from net investment income and net foreign currency gains | (0.147 | ) | (0.229 | ) | (0.018 | ) | |||
| Net asset value, end of year | $ | 10.11 | $ | 10.16 | $ | 10.29 | |||
| Total returnc | 0.96 | % | 0.97 | % | 0.17 | % | |||
| Ratios to average net assetsd | |||||||||
| Expenses before waiver and payments by affiliates | 1.33 | % | 1.38 | % | 1.41 | % | |||
| Expenses net of waiver and payments by affiliates | 1.20 | %e | 1.20 | %e | 1.29 | % | |||
| Net investment income | 0.84 | % | 0.84 | % | 1.07 | % | |||
| Supplemental data | |||||||||
| Net assets, end of year (000’s) | $ | 165,952 | $ | 114,200 | $ | 1,034 | |||
| Portfolio turnover rate | 78.63 | % | 64.86 | % | 51.42 | % | |||
aFor the period October 1, 2012 (effective date) to October 31, 2012.
bThe amount shown for a share outstanding throughout the period may not correlate with the Statement of Operations for the period due to the timing of sales and
repurchases of the Fund shares in relation to income earned and/or fluctuating fair value of the investments of the Fund.
cTotal return does not reflect sales commissions or contingent deferred sales charges, if applicable, and is not annualized for periods less than one year.
dRatios are annualized for periods less than one year.
eBenefit of expense reduction rounds to less than 0.01%.
68 | Annual Report | The accompanying notes are an integral part of these financial statements. franklintempleton.com
FRANKLIN INVESTORS SECURITIES TRUST
FINANCIAL HIGHLIGHTS
| Franklin Low Duration Total Return Fund (continued) | ||||||
| Year Ended | ||||||
| October 31, | ||||||
| 2014 | 2013 | a | ||||
| Class R6 | ||||||
| Per share operating performance | ||||||
| (for a share outstanding throughout the year) | ||||||
| Net asset value, beginning of year | $ | 10.19 | $ | 10.27 | ||
| Income from investment operationsb: | ||||||
| Net investment income | 0.164 | c | 0.089 | |||
| Net realized and unrealized gains (losses) | 0.003 | (0.046 | ) | |||
| Total from investment operations | 0.167 | 0.043 | ||||
| Less distributions from net investment income and net foreign currency gains | (0.217 | ) | (0.123 | ) | ||
| Net asset value, end of year | $ | 10.14 | $ | 10.19 | ||
| Total returnd | 1.66 | % | 0.43 | % | ||
| Ratios to average net assetse | ||||||
| Expenses before waiver and payments by affiliates | 0.55 | % | 0.62 | % | ||
| Expenses net of waiver and payments by affiliatesf | 0.42 | % | 0.43 | % | ||
| Net investment income | 1.62 | % | 1.61 | % | ||
| Supplemental data | ||||||
| Net assets, end of year (000’s) | $ | 418,539 | $ | 943 | ||
| Portfolio turnover rate | 78.63 | % | 64.86 | % | ||
aFor the period May 1, 2013 (effective date) to October 31, 2013.
bThe amount shown for a share outstanding throughout the period may not correlate with the Statement of Operations for the period due to the timing of sales and
repurchases of the Fund shares in relation to income earned and/or fluctuating fair value of the investments of the Fund.
cBased on average daily shares outstanding.
dTotal return is not annualized for periods less than one year.
eRatios are annualized for periods less than one year.
fBenefit of expense reduction rounds to less than 0.01%.
franklintempleton.com The accompanying notes are an integral part of these financial statements. | Annual Report | 69
FRANKLIN INVESTORS SECURITIES TRUST
FINANCIAL HIGHLIGHTS
| Franklin Low Duration Total Return Fund (continued) | |||||||||||||||
| Year Ended October 31, | |||||||||||||||
| 2014 | 2013 | 2012 | 2011 | 2010 | |||||||||||
| Advisor Class | |||||||||||||||
| Per share operating performance | |||||||||||||||
| (for a share outstanding throughout the year) | |||||||||||||||
| Net asset value, beginning of year | $ | 10.19 | $ | 10.31 | $ | 10.29 | $ | 10.46 | $ | 10.20 | |||||
| Income from investment operationsa: | |||||||||||||||
| Net investment income | 0.166 | 0.231 | 0.202 | 0.249 | 0.248 | ||||||||||
| Net realized and unrealized gains (losses) | (0.010 | ) | (0.064 | ) | 0.146 | (0.122 | ) | 0.363 | |||||||
| Total from investment operations | 0.156 | 0.167 | 0.348 | 0.127 | 0.611 | ||||||||||
| Less distributions from: | |||||||||||||||
| Net investment income and net foreign currency gains | (0.206 | ) | (0.287 | ) | (0.328 | ) | (0.257 | ) | (0.319 | ) | |||||
| Net realized gains | — | — | — | (0.040 | ) | (0.032 | ) | ||||||||
| Total distributions | (0.206 | ) | �� | (0.287 | ) | (0.328 | ) | (0.297 | ) | (0.351 | ) | ||||
| Net asset value, end of year | $ | 10.14 | $ | 10.19 | $ | 10.31 | $ | 10.29 | $ | 10.46 | |||||
| Total return | 1.54 | % | 1.64 | % | 3.46 | % | 1.22 | % | 6.11 | % | |||||
| Ratios to average net assets | |||||||||||||||
| Expenses before waiver and payments by affiliates | 0.68 | % | 0.73 | % | 0.76 | % | 0.78 | % | 0.81 | % | |||||
| Expenses net of waiver and payments by affiliates | 0.55 | %b | 0.55 | %b | 0.64 | % | 0.65 | % | 0.65 | %b | |||||
| Net investment income | 1.49 | % | 1.50 | % | 1.72 | % | 2.20 | % | 2.40 | % | |||||
| Supplemental data | |||||||||||||||
| Net assets, end of year (000’s) | $ | 198,694 | $ | 156,129 | $ | 70,442 | $ | 49,682 | $ | 16,200 | |||||
| Portfolio turnover rate | 78.63 | % | 64.86 | % | 51.42 | % | 75.51 | % | 49.84 | % | |||||
aThe amount shown for a share outstanding throughout the period may not correlate with the Statement of Operations for the period due to the timing of sales and
repurchases of the Fund shares in relation to income earned and/or fluctuating fair value of the investments of the Fund.
bBenefit of expense reduction rounds to less than 0.01%.
70 | Annual Report | The accompanying notes are an integral part of these financial statements. franklintempleton.com
FRANKLIN INVESTORS SECURITIES TRUST
| Statement of Investments, October 31, 2014 | |||||
| Franklin Low Duration Total Return Fund | |||||
| Country | Shares/Units | Value | |||
| Common Stocks and Exchange Traded Funds 1.4% | |||||
| Diversified Financials 1.4% | |||||
| PowerShares Senior Loan Portfolio, ETF | United States | 1,365,000 | $ | 33,278,700 | |
| Materials 0.0%† | |||||
| NewPage Holdings Inc. | United States | 1,000 | 92,000 | ||
| Total Common Stocks and Exchange Traded Funds | |||||
| (Cost $33,775,986) | 33,370,700 | ||||
| Principal | |||||
| Amount* | |||||
| Corporate Bonds 34.7% | |||||
| Automobiles & Components 0.8% | |||||
| Ford Motor Credit Co. LLC, senior note, | |||||
| 7.00%, 4/15/15 | United States | 6,200,000 | 6,371,399 | ||
| 2.375%, 1/16/18 | United States | 3,000,000 | 3,031,041 | ||
| aFRN, 0.753%, 9/08/17 | United States | 4,000,000 | 3,993,816 | ||
| bHyundai Capital America, senior note, 144A, | |||||
| 1.45%, 2/06/17 | South Korea | 4,000,000 | 4,038,780 | ||
| 4.00%, 6/08/17 | South Korea | 700,000 | 741,097 | ||
| 18,176,133 | |||||
| Banks 8.9% | |||||
| bANZ New Zealand International Ltd./London, senior note, 144A, 1.40%, | |||||
| 4/27/17 | New Zealand | 2,500,000 | 2,504,038 | ||
| Australia & New Zealand Banking Group Ltd., senior note, 1.25%, | |||||
| 1/10/17 | Australia | 11,000,000 | 11,046,640 | ||
| cBanca Monte Dei Paschi Di Siena SpA, secured note, Reg S, 2.875%, | |||||
| 4/16/21 | Italy | 6,300,000 | EUR | 8,626,737 | |
| Banco Comercial Portugues SA, 4.75%, 6/22/17 | Portugal | 4,500,000 | EUR | 6,195,743 | |
| Banco Popolare Societa Cooperativa, | |||||
| secured note, 3.625%, 3/31/17 | Italy | 3,000,000 | EUR | 4,037,197 | |
| csenior note, Reg S, 4.75%, 3/31/16 | Italy | 3,000,000 | EUR | 3,990,248 | |
| Banco Santander Totta SA, secured note, 1.50%, 4/03/17 | Portugal | 4,000,000 | EUR | 5,134,336 | |
| Bank of America Corp., senior note, | |||||
| 2.65%, 4/01/19 | United States | 5,500,000 | 5,555,671 | ||
| aFRN, 1.271%, 1/15/19 | United States | 12,671,000 | 12,840,361 | ||
| Bank of Ireland Mortgage Bank, secured note, 2.75%, 3/22/18 | Ireland | 5,200,000 | EUR | 7,031,997 | |
| BB&T Corp., senior note, | |||||
| 2.05%, 6/19/18 | United States | 1,000,000 | 1,007,954 | ||
| aFRN, 0.90%, 2/01/19 | United States | 2,000,000 | 2,018,792 | ||
| BNP Paribas SA, senior note, 2.70%, 8/20/18 | France | 3,500,000 | 3,579,415 | ||
| CIT Group Inc., | |||||
| 4.25%, 8/15/17 | United States | 5,500,000 | 5,665,000 | ||
| senior note, 5.00%, 5/15/17 | United States | 500,000 | 525,000 | ||
| senior note, 5.25%, 3/15/18 | United States | 2,000,000 | 2,115,000 | ||
| senior note, 3.875%, 2/19/19 | United States | 3,100,000 | 3,127,125 | ||
| aCitigroup Inc., sub. note, FRN, 0.502%, 6/09/16 | United States | 11,200,000 | 11,109,403 | ||
| Depfa ACS Bank, secured bond, | |||||
| 1.65%, 12/20/16 | Ireland | 250,000,000 | JPY | 2,265,468 | |
| 2.125%, 10/13/17 | Ireland | 3,500,000 | CHF | 3,808,504 | |
| bThe Export-Import Bank of China, senior note, 144A, 2.50%, 7/31/19 | China | 8,000,000 | 8,011,760 | ||
| First Horizon National Corp., senior note, 5.375%, 12/15/15 | United States | 2,000,000 | 2,091,494 | ||
| bHSBC Bank Brasil SA, senior note, 144A, 4.00%, 5/11/16 | Brazil | 3,000,000 | 3,101,145 | ||
franklintempleton.com Annual Report | 71
FRANKLIN INVESTORS SECURITIES TRUST
STATEMENT OF INVESTMENTS
| Franklin Low Duration Total Return Fund (continued) | |||||
| Principal | |||||
| Country | Amount* | Value | |||
| Corporate Bonds (continued) | |||||
| Banks (continued) | |||||
| a,bING Bank NV, senior note, 144A, FRN, | |||||
| 1.874%, 9/25/15 | Netherlands | 3,800,000 | $ | 3,850,198 | |
| 0.925%, 10/01/19 | Netherlands | 5,000,000 | 5,010,300 | ||
| Intesa Sanpaolo SpA, senior note, | |||||
| 2.375%, 1/13/17 | Italy | 1,500,000 | 1,518,398 | ||
| aFRN, 0.348%, 5/18/17 | Italy | 2,150,000 | EUR | 2,664,989 | |
| a,cReg S, FRN, 1.588%, 7/29/15 | Italy | 4,400,000 | EUR | 5,563,659 | |
| JPMorgan Chase & Co., senior note, | |||||
| 4.75%, 3/01/15 | United States | 750,000 | 760,624 | ||
| 2.20%, 10/22/19 | United States | 11,000,000 | 10,880,485 | ||
| aFRN, 1.134%, 1/25/18 | United States | 8,000,000 | 8,109,424 | ||
| aJPMorgan Chase Bank NA, sub. note, FRN, 0.564%, 6/13/16 | United States | 1,500,000 | 1,496,367 | ||
| PNC Funding Corp., senior note, 2.70%, 9/19/16 | United States | 1,200,000 | 1,236,810 | ||
| Regions Financial Corp., senior note, | |||||
| 7.75%, 11/10/14 | United States | 282,000 | 282,288 | ||
| 2.00%, 5/15/18 | United States | 4,500,000 | 4,467,541 | ||
| aRoyal Bank of Canada, senior note, FRN, 0.603%, 3/08/16 | Canada | 3,000,000 | 3,009,855 | ||
| The Royal Bank of Scotland PLC, sub. note, 6.934%, 4/09/18 | United Kingdom | 2,500,000 | EUR | 3,580,309 | |
| aSvenska Handelsbanken AB, senior note, FRN, 0.725%, 6/17/19 | Sweden | 5,300,000 | 5,321,014 | ||
| U.S. Bank NA, sub. note, 3.778% to 4/29/18, FRN thereafter, 4/29/20 | United States | 3,000,000 | 3,043,227 | ||
| a,cUniCredit SpA, senior note, Reg S, FRN, | |||||
| 1.634%, 7/24/15 | Italy | 4,200,000 | EUR | 5,311,266 | |
| 1.03%, 4/10/17 | Italy | 3,400,000 | EUR | 4,291,882 | |
| aUnion Bank NA, senior note, FRN, 0.985%, 9/26/16 | United States | 2,400,000 | 2,419,694 | ||
| aWachovia Corp., sub. note, FRN, 0.601%, 10/15/16 | United States | 14,723,000 | 14,715,079 | ||
| a,cYorkshire Building Society, secured note, Reg S, FRN, 2.315%, 3/23/16 | United Kingdom | 4,868,000 | GBP | 7,944,960 | |
| 210,867,397 | |||||
| Capital Goods 0.7% | |||||
| The Boeing Co., senior note, 0.95%, 5/15/18 | United States | 1,500,000 | 1,466,503 | ||
| John Deere Capital Corp., senior note, | |||||
| 1.30%, 3/12/18 | United States | 1,700,000 | 1,680,464 | ||
| 1.95%, 12/13/18 | United States | 3,750,000 | 3,759,765 | ||
| USG Corp., senior note, 6.30%, 11/15/16 | United States | 9,220,000 | 9,773,200 | ||
| 16,679,932 | |||||
| Commercial & Professional Services 0.0%† | |||||
| Republic Services Inc., senior note, 3.80%, 5/15/18 | United States | 1,035,000 | 1,101,293 | ||
| Consumer Durables & Apparel 0.5% | |||||
| Centex Corp., senior note, 6.50%, 5/01/16 | United States | 5,000,000 | 5,362,500 | ||
| D.R. Horton Inc., | |||||
| senior bond, 5.625%, 1/15/16 | United States | 2,400,000 | 2,511,000 | ||
| senior note, 4.75%, 5/15/17 | United States | 1,500,000 | 1,575,000 | ||
| senior note, 3.75%, 3/01/19 | United States | 2,000,000 | 2,007,500 | ||
| KB Home, senior note, 4.75%, 5/15/19 | United States | 1,000,000 | 995,000 | ||
| 12,451,000 | |||||
| Consumer Services 0.2% | |||||
| Carnival Corp., senior note, 3.95%, 10/15/20 | United States | 3,400,000 | 3,562,605 | ||
| Yum! Brands Inc., senior note, 4.25%, 9/15/15 | United States | 750,000 | 771,423 | ||
| 4,334,028 |
72 | Annual Report franklintempleton.com
FRANKLIN INVESTORS SECURITIES TRUST
STATEMENT OF INVESTMENTS
| Franklin Low Duration Total Return Fund (continued) | |||||
| Principal | |||||
| Country | Amount* | Value | |||
| Corporate Bonds (continued) | |||||
| Diversified Financials 4.7% | |||||
| American Express Credit Corp., senior note, 1.55%, 9/22/17 | United States | 4,600,000 | $ | 4,617,002 | |
| bBayer US Finance LLC, senior note, 144A, 2.375%, 10/08/19 | Germany | 8,700,000 | 8,724,656 | ||
| Capital One Bank USA NA, senior note, 2.30%, 6/05/19 | United States | 8,100,000 | 8,061,970 | ||
| aCredit Suisse New York, senior note, FRN, 0.725%, 5/26/17 | Switzerland | 5,400,000 | 5,410,314 | ||
| aFifth Third Bank, senior note, FRN, 0.741%, 11/18/16 | United States | 11,000,000 | 11,057,134 | ||
| cGE Capital European Funding, senior note, Reg S, 2.00%, 2/27/15 | United States | 3,000,000 | EUR | 3,783,251 | |
| General Electric Capital Corp., senior note, 3.35%, 10/17/16 | United States | 2,000,000 | 2,096,044 | ||
| General Motors Financial Co. Inc., senior note, 2.625%, 7/10/17 | United States | 4,000,000 | 4,058,748 | ||
| The Goldman Sachs Group Inc., senior note, | |||||
| 3.30%, 5/03/15 | United States | 1,000,000 | 1,013,529 | ||
| aFRN, 1.334%, 11/15/18 | United States | 5,000,000 | 5,056,140 | ||
| bHutchison Whampoa International 14 Ltd., 144A, 1.625%, 10/31/17 | Hong Kong | 4,700,000 | 4,688,884 | ||
| International Lease Finance Corp., senior note, 8.625%, 9/15/15 | United States | 8,325,000 | 8,751,656 | ||
| Irish Life & Permanent PLC, senior note, 4.00%, 3/10/15 | Ireland | 2,000,000 | EUR | 2,538,776 | |
| Morgan Stanley, senior note, | |||||
| 4.50%, 2/23/16 | United States | 2,000,000 | EUR | 2,638,555 | |
| aFRN, 1.514%, 4/25/18 | United States | 7,000,000 | 7,162,274 | ||
| Navient LLC, senior note, | |||||
| 8.45%, 6/15/18 | United States | 800,000 | 917,200 | ||
| 5.50%, 1/15/19 | United States | 2,500,000 | 2,598,450 | ||
| bPrudential Covered Trust, secured note, 144A, 2.997%, 9/30/15 | United States | 11,289,750 | 11,503,397 | ||
| a,bSeven and Seven Ltd., senior note, 144A, FRN, 1.395%, 9/11/19 | South Korea | 2,000,000 | 2,003,693 | ||
| Springleaf Finance Corp., senior note, I, 5.40%, 12/01/15 | United States | 7,000,000 | 7,245,000 | ||
| bStone Street Trust, senior note, 144A, 5.902%, 12/15/15 | United States | 2,000,000 | 2,091,706 | ||
| bWoori Bank, sub. note, 144A, 4.75%, 4/30/24 | South Korea | 5,300,000 | 5,495,994 | ||
| 111,514,373 | |||||
| Energy 4.2% | |||||
| bBG Energy Capital PLC, senior note, 144A, 2.875%, 10/15/16 | United Kingdom | 3,500,000 | 3,621,223 | ||
| BP Capital Markets PLC, senior note, 0.70%, 11/06/15 | United Kingdom | 4,000,000 | 4,006,860 | ||
| aCanadian Natural Resources Ltd., senior note, FRN, 0.608%, 3/30/16 | Canada | 6,000,000 | 6,005,892 | ||
| Chesapeake Energy Corp., senior note, | |||||
| 6.50%, 8/15/17 | United States | 1,000,000 | 1,090,000 | ||
| aFRN, 3.481%, 4/15/19 | United States | 2,500,000 | 2,507,975 | ||
| CNOOC Nexen Finance 2014 ULC, senior note, 1.625%, 4/30/17 | China | 10,800,000 | 10,809,580 | ||
| bCNPC General Capital Ltd., senior note, 144A, | |||||
| 1.95%, 4/16/18 | Hong Kong | 1,500,000 | 1,481,858 | ||
| aFRN, 1.133%, 5/14/17 | Hong Kong | 7,500,000 | 7,517,700 | ||
| bCNPC HK Overseas Capital Ltd., senior note, 144A, 3.125%, 4/28/16 | China | 2,000,000 | 2,049,656 | ||
| EnLink Midstream Partners LP, senior note, 2.70%, 4/01/19 | United States | 2,700,000 | 2,728,229 | ||
| Ensco PLC, senior note, 3.25%, 3/15/16 | United States | 2,000,000 | 2,057,000 | ||
| Enterprise Products Operating LLC, senior note, | |||||
| 1.25%, 8/13/15 | United States | 3,800,000 | 3,814,706 | ||
| 2.55%, 10/15/19 | United States | 5,500,000 | 5,504,119 | ||
| Kinder Morgan Energy Partners LP, senior note, | |||||
| 3.50%, 3/01/16 | United States | 2,000,000 | 2,061,312 | ||
| 2.65%, 2/01/19 | United States | 4,500,000 | 4,506,435 | ||
| Kinder Morgan Finance Co. LLC, | |||||
| senior bond, 5.70%, 1/05/16 | United States | 8,500,000 | 8,898,437 | ||
| bsenior secured note, 144A, 6.00%, 1/15/18 | United States | 2,500,000 | 2,753,125 |
franklintempleton.com Annual Report | 73
FRANKLIN INVESTORS SECURITIES TRUST
STATEMENT OF INVESTMENTS
| Franklin Low Duration Total Return Fund (continued) | |||||
| Principal | |||||
| Country | Amount* | Value | |||
| Corporate Bonds (continued) | |||||
| Energy (continued) | |||||
| Linn Energy LLC/Finance Corp., senior note, 6.50%, 5/15/19 | United States | 2,000,000 | $ | 1,880,000 | |
| bLUKOIL International Finance BV, senior note, 144A, 3.416%, 4/24/18 | Russia | 2,300,000 | 2,195,442 | ||
| Peabody Energy Corp., senior note, 7.375%, 11/01/16 | United States | 3,000,000 | 3,105,000 | ||
| aPetrobras Global Finance BV, senior note, FRN, 3.115%, 3/17/20 | Brazil | 5,100,000 | 5,150,643 | ||
| bPetrofac Ltd., senior note, 144A, 3.40%, 10/10/18 | United Kingdom | 1,300,000 | 1,340,469 | ||
| bSinopec Group Overseas Development 2013 Ltd., senior note, 144A, | |||||
| 2.50%, 10/17/18 | China | 2,800,000 | 2,808,960 | ||
| bSinopec Group Overseas Development 2014 Ltd., senior note, 144A, | |||||
| 1.75%, 4/10/17 | China | 4,300,000 | 4,301,612 | ||
| aStatoil ASA, senior note, FRN, 0.694%, 11/08/18 | Norway | 6,900,000 | 6,924,288 | ||
| bWoodside Finance Ltd., 144A, 4.50%, 11/10/14 | Australia | 1,000,000 | 1,000,592 | ||
| 100,121,113 | |||||
| Food & Staples Retailing 1.1% | |||||
| CVS Health Corp., senior note, 1.20%, 12/05/16 | United States | 10,000,000 | 10,023,370 | ||
| The Kroger Co., senior note, 1.20%, 10/17/16 | United States | 5,000,000 | 5,009,985 | ||
| Sysco Corp., senior note, 1.45%, 10/02/17 | United States | 7,700,000 | 7,744,167 | ||
| bTesco PLC, senior note, 144A, 2.00%, 12/05/14 | United Kingdom | 3,800,000 | 3,802,850 | ||
| bWoolworths Ltd., senior note, 144A, 2.55%, 9/22/15 | Australia | 260,000 | 264,288 | ||
| 26,844,660 | |||||
| Food, Beverage & Tobacco 2.6% | |||||
| Anheuser-Busch InBev Worldwide Inc., senior note, 1.375%, 7/15/17 | Belgium | 1,200,000 | 1,202,419 | ||
| Bunge Ltd. Finance Corp., 4.10%, 3/15/16 | United States | 2,000,000 | 2,083,640 | ||
| Coca-Cola Femsa SAB de CV, senior note, 2.375%, 11/26/18 | Mexico | 5,500,000 | 5,568,557 | ||
| Constellation Brands Inc., senior note, | |||||
| 8.375%, 12/15/14 | United States | 5,000,000 | 5,042,250 | ||
| 7.25%, 5/15/17 | United States | 6,600,000 | 7,371,375 | ||
| Dean Foods Co., senior note, 7.00%, 6/01/16 | United States | 6,864,000 | 7,327,320 | ||
| bHeineken NV, senior note, 144A, 0.80%, 10/01/15 | Netherlands | 4,500,000 | 4,509,180 | ||
| Ingredion Inc., senior note, 3.20%, 11/01/15 | United States | 1,500,000 | 1,533,346 | ||
| bJapan Tobacco Inc., senior note, 144A, 2.10%, 7/23/18 | Japan | 5,000,000 | 5,067,975 | ||
| Kraft Foods Group Inc., senior note, | |||||
| 1.625%, 6/04/15 | United States | 1,000,000 | 1,006,302 | ||
| 2.25%, 6/05/17 | United States | 7,000,000 | 7,148,897 | ||
| Lorillard Tobacco Co., senior note, 3.50%, 8/04/16 | United States | 8,000,000 | 8,299,976 | ||
| aMondelez International Inc., senior note, FRN, 0.76%, 2/01/19 | United States | 500,000 | 501,148 | ||
| Reynolds American Inc., senior note, 1.05%, 10/30/15 | United States | 1,000,000 | 1,002,194 | ||
| Tyson Foods Inc., senior note, 2.65%, 8/15/19 | United States | 3,900,000 | 3,941,504 | ||
| 61,606,083 | |||||
| Health Care Equipment & Services 0.6% | |||||
| Aetna Inc., senior note, 1.50%, 11/15/17 | United States | 1,000,000 | 999,160 | ||
| Alere Inc, senior note, 8.625%, 10/01/18 | United States | 2,000,000 | 2,092,500 | ||
| Baxter International Inc., senior note, 1.85%, 6/15/18 | United States | 4,200,000 | 4,202,369 | ||
| Edwards Lifesciences Corp., senior note, 2.875%, 10/15/18 | United States | 1,600,000 | 1,632,449 | ||
| HCA Inc., senior secured note, first lien, 4.25%, 10/15/19 | United States | 1,100,000 | 1,119,250 | ||
| Laboratory Corp. of America Holdings, 2.20%, 8/23/17 | United States | 1,000,000 | 1,015,498 | ||
| Medco Health Solutions Inc., senior note, 2.75%, 9/15/15 | United States | 1,500,000 | 1,526,079 | ||
| bTenet Healthcare Corp., senior note, 144A, 5.00%, 3/01/19 | United States | 1,500,000 | 1,505,625 | ||
| 14,092,930 |
74 | Annual Report franklintempleton.com
FRANKLIN INVESTORS SECURITIES TRUST
STATEMENT OF INVESTMENTS
| Franklin Low Duration Total Return Fund (continued) | ||||
| Principal | ||||
| Country | Amount* | Value | ||
| Corporate Bonds (continued) | ||||
| Household & Personal Products 0.1% | ||||
| Colgate-Palmolive Co., senior note, 0.90%, 5/01/18 | United States | 2,200,000 | $ | 2,153,558 |
| Insurance 1.3% | ||||
| bMetropolitan Life Global Funding I, secured note, 144A, 1.30%, 4/10/17 | United States | 10,000,000 | 10,027,910 | |
| bNew York Life Global Funding, secured note, 144A, 2.10%, 1/02/19 | United States | 10,000,000 | 10,030,210 | |
| aPrudential Financial Inc., senior note, FRN, 1.014%, 8/15/18 | United States | 10,000,000 | 10,098,700 | |
| 30,156,820 | ||||
| Materials 1.1% | ||||
| ArcelorMittal, senior note, | ||||
| 4.25%, 3/01/16 | Luxembourg | 2,000,000 | 2,055,000 | |
| 5.00%, 2/25/17 | Luxembourg | 1,500,000 | 1,571,250 | |
| bCemex SAB de CV, senior secured note, 144A, 9.00%, 1/11/18 | Mexico | 2,000,000 | 2,113,750 | |
| bFMG Resources (August 2006) Pty. Ltd., senior note, 144A, | ||||
| 6.00%, 4/01/17 | Australia | 800,000 | 818,500 | |
| 6.875%, 2/01/18 | Australia | 888,889 | 910,000 | |
| bGlencore Funding LLC, 144A, 3.125%, 4/29/19 | Switzerland | 5,000,000 | 5,058,250 | |
| bIncitec Pivot Ltd., senior note, 144A, 4.00%, 12/07/15 | Australia | 2,000,000 | 2,070,252 | |
| bIneos Group Holdings SA, senior note, 144A, 5.875%, 2/15/19 | Switzerland | 2,000,000 | 2,006,250 | |
| Reynolds Group Issuer Inc./LLC/SA, senior note, 8.50%, 5/15/18 | United States | 3,000,000 | 3,123,750 | |
| Tenneco Packaging Inc., senior note, 8.125%, 6/15/17 | United States | 2,100,000 | 2,278,500 | |
| bXstrata Finance Canada Ltd., secured note, 144A, 2.05%, 10/23/15 | Switzerland | 3,000,000 | 3,027,735 | |
| 25,033,237 | ||||
| Media 0.9% | ||||
| DIRECTV Holdings LLC/DIRECTV Financing Co. Inc., senior note, 2.40%, | ||||
| 3/15/17 | United States | 2,900,000 | 2,971,975 | |
| DISH DBS Corp., senior note, 7.125%, 2/01/16 | United States | 5,500,000 | 5,864,375 | |
| The New York Times Co., senior note, 6.625%, 12/15/16 | United States | 2,000,000 | 2,170,000 | |
| Time Warner Inc., | ||||
| 3.15%, 7/15/15 | United States | 1,000,000 | 1,018,089 | |
| senior note, 2.10%, 6/01/19 | United States | 4,500,000 | 4,439,223 | |
| Viacom Inc., senior note, | ||||
| 2.50%, 9/01/18 | United States | 2,500,000 | 2,540,787 | |
| 2.20%, 4/01/19 | United States | 3,200,000 | 3,178,189 | |
| 22,182,638 | ||||
| Pharmaceuticals, Biotechnology & Life Sciences 1.1% | ||||
| aAbbVie Inc., senior note, FRN, 0.997%, 11/06/15 | United States | 7,000,000 | 7,040,964 | |
| Amgen Inc., senior note, | ||||
| 2.125%, 5/15/17 | United States | 2,500,000 | 2,551,217 | |
| aFRN, 0.835%, 5/22/19 | United States | 6,200,000 | 6,223,535 | |
| Celgene Corp., senior note, | ||||
| 2.45%, 10/15/15 | United States | 2,000,000 | 2,033,720 | |
| 2.30%, 8/15/18 | United States | 3,000,000 | 3,022,335 | |
| Life Technologies Corp., senior note, 3.50%, 1/15/16 | United States | 2,000,000 | 2,060,020 | |
| Zoetis Inc., senior note, | ||||
| 1.15%, 2/01/16 | United States | 1,800,000 | 1,804,725 | |
| 1.875%, 2/01/18 | United States | 1,200,000 | 1,193,632 | |
| 25,930,148 |
franklintempleton.com Annual Report | 75
FRANKLIN INVESTORS SECURITIES TRUST
STATEMENT OF INVESTMENTS
| Franklin Low Duration Total Return Fund (continued) | |||||
| Principal | |||||
| Country | Amount* | Value | |||
| Corporate Bonds (continued) | |||||
| Real Estate 0.8% | |||||
| American Tower Corp., senior note, 3.40%, 2/15/19 | United States | 5,100,000 | $ | 5,221,666 | |
| Boston Properties LP, senior note, 3.70%, 11/15/18 | United States | 4,900,000 | 5,201,066 | ||
| Duke Realty LP, senior note, 7.375%, 2/15/15 | United States | 400,000 | 407,337 | ||
| HCP Inc., senior note, 3.75%, 2/01/19 | United States | 5,500,000 | 5,801,515 | ||
| Hospitality Properties Trust, senior note, 5.625%, 3/15/17 | United States | 3,000,000 | 3,254,019 | ||
| 19,885,603 | |||||
| Retailing 0.1% | |||||
| bEdcon Pty. Ltd., secured note, 144A, 9.50%, 3/01/18 | South Africa | 1,500,000 | EUR | 1,562,958 | |
| bExperian Finance PLC, 144A, 2.375%, 6/15/17 | United Kingdom | 1,000,000 | 1,019,185 | ||
| 2,582,143 | |||||
| Semiconductors & Semiconductor Equipment 0.2% | |||||
| Maxim Integrated Products Inc., senior note, 2.50%, 11/15/18 | United States | 5,200,000 | 5,191,352 | ||
| Software & Services 0.5% | |||||
| aOracle Corp., senior note, FRN, 0.811%, 1/15/19 | United States | 12,000,000 | 12,107,688 | ||
| Technology Hardware & Equipment 1.7% | |||||
| bAlcatel-Lucent USA Inc., senior note, 144A, 4.625%, 7/01/17 | France | 10,000,000 | 10,125,000 | ||
| aApple Inc., FRN, 0.489%, 5/03/18 | United States | 13,000,000 | 13,029,302 | ||
| Dell Inc., senior note, | |||||
| 2.30%, 9/10/15 | United States | 1,500,000 | 1,506,450 | ||
| 3.10%, 4/01/16 | United States | 5,000,000 | 5,056,250 | ||
| Juniper Networks Inc., senior note, 3.10%, 3/15/16 | United States | 2,000,000 | 2,050,278 | ||
| a,bNBCUniversal Enterprise Inc., 144A, FRN, 0.916%, 4/15/18 | United States | 7,500,000 | 7,577,108 | ||
| 39,344,388 | |||||
| Telecommunication Services 0.9% | |||||
| Embarq Corp., senior note, 7.082%, 6/01/16 | United States | 3,000,000 | 3,259,386 | ||
| bSprint Nextel Corp., senior note, 144A, 9.00%, 11/15/18 | United States | 3,500,000 | 4,125,625 | ||
| Telefonica Emisiones SAU, senior note, | |||||
| 4.949%, 1/15/15 | Spain | 1,500,000 | 1,512,280 | ||
| 3.192%, 4/27/18 | Spain | 2,300,000 | 2,387,193 | ||
| bTelefonica Movil Chile SA, senior note, 144A, 2.875%, 11/09/15 | Chile | 2,000,000 | 2,034,850 | ||
| bVerizon Communications Inc., senior note, 144A, 2.625%, 2/21/20 | United States | 8,824,000 | 8,787,654 | ||
| 22,106,988 | |||||
| Transportation 0.2% | |||||
| bAviation Capital Group Corp., senior note, 144A, 3.875%, 9/27/16 | United States | 3,700,000 | 3,802,912 | ||
| Utilities 1.5% | |||||
| DPL Inc., senior note, 6.50%, 10/15/16 | United States | 1,049,000 | 1,125,053 | ||
| Duke Energy Corp., senior note, 2.10%, 6/15/18 | United States | 5,100,000 | 5,165,097 | ||
| bGDF Suez, senior note, 144A, 1.625%, 10/10/17 | France | 1,000,000 | 1,006,710 | ||
| Georgia Power Co., senior note, 12D, 0.625%, 11/15/15 | United States | 1,000,000 | 1,001,012 | ||
| bKorea Western Power Co. Ltd., senior note, 144A, 3.125%, 5/10/17 | South Korea | 5,200,000 | 5,378,828 | ||
| bNGL Energy Partners LP/NGL Energy Finance Corp., senior note, 144A, | |||||
| 5.125%, 7/15/19 | United States | 2,000,000 | 2,015,000 | ||
| PPL Energy Supply LLC, senior note, 6.20%, 5/15/16 | United States | 8,000,000 | 8,378,664 | ||
| The Southern Co., senior note, 2.45%, 9/01/18 | United States | 7,000,000 | 7,167,979 | ||
| bState Grid Overseas Investment 2013 Ltd., senior note, 144A, 1.75%, | |||||
| 5/22/18 | China | 2,000,000 | 1,973,350 |
76 | Annual Report franklintempleton.com
FRANKLIN INVESTORS SECURITIES TRUST
STATEMENT OF INVESTMENTS
| Franklin Low Duration Total Return Fund (continued) | ||||
| Principal | ||||
| Country | Amount* | Value | ||
| Corporate Bonds (continued) | ||||
| Utilities (continued) | ||||
| bState Grid Overseas Investment 2014 Ltd., senior note, 144A, 2.75%, | ||||
| 5/07/19 | China | 2,200,000 | $ | 2,220,363 |
| Virginia Electric & Power Co., senior note, 1.20%, 1/15/18 | United States | 900,000 | 893,409 | |
| 36,325,465 | ||||
| Total Corporate Bonds (Cost $822,178,047) | 824,591,882 | |||
| a,dSenior Floating Rate Interests 5.1% | ||||
| Automobiles & Components 0.2% | ||||
| Crowne Group LLC, Term Loan, 6.00%, 9/30/20 | United States | 1,712,700 | 1,695,573 | |
| eFRAM Group Holdings Inc. (Autoparts Holdings), Term Loan, 6.50%, | ||||
| 7/29/17 | United States | 1,222,289 | 1,226,682 | |
| Henniges Automotive Holdings Inc., Term Loans, 6.00%, 6/12/21 | United States | 1,276,523 | 1,282,906 | |
| UCI International Inc., Term Loan, 5.50%, 7/26/17 | United States | 604,528 | 605,032 | |
| 4,810,193 | ||||
| Capital Goods 0.2% | ||||
| Alfred Fueling Systems Inc. (Wayne Fueling), First Lien Initial Term Loan, | ||||
| 4.75%, 6/20/21 | United States | 478,202 | 473,420 | |
| Doncasters U.S. Finance LLC, Term B Loans, 4.50%, 4/09/20 | United States | 321,869 | 319,958 | |
| eOnsite Rental Group Operations Pty. Ltd., Term B Loan, 5.50%, 9/30/20 | United States | 1,057,286 | 1,044,070 | |
| eSensus USA Inc., First Lien Term Loan, 4.50%, 5/09/17 | United States | 1,342,165 | 1,308,611 | |
| Signode Industrial Group U.S. Inc., Initial Term B Loan, 4.00%, 5/01/21 | United States | 1,217,313 | 1,197,531 | |
| TransDigm Inc., | ||||
| Tranche C Term Loan, 3.75%, 2/28/20 | United States | 905,992 | 892,968 | |
| Tranche D Term Loan, 3.75%, 6/04/21 | United States | 757,103 | 746,535 | |
| Wesco Distribution Inc., Tranche B-1 Loan, 3.75%, 12/12/19 | United States | 56,897 | 56,755 | |
| eWireCo Worldgroup Inc., Term Loan, 3.29%, 2/15/17 | United States | 53,819 | 54,004 | |
| 6,093,852 | ||||
| Commercial & Professional Services 0.2% | ||||
| Interactive Data Corp., Term Loan, 4.75%, 5/02/21 | United States | 4,912,509 | 4,918,649 | |
| Consumer Services 0.5% | ||||
| 24 Hour Fitness Worldwide Inc., Term Loan, 4.75%, 5/30/21 | United States | 1,411,883 | 1,403,935 | |
| eCannery Casino Resorts LLC, Term Loan, 6.00%, 10/02/18 | United States | 1,925,887 | 1,824,778 | |
| ClubCorp Club Operations Inc., Term B Loans, 4.50%, 7/24/20 | United States | 285,500 | 283,478 | |
| Diamond Resorts Corp., Term Loans, 5.50%, 5/09/21 | United States | 641,403 | 641,403 | |
| eFitness International LLC, Term B Loan, 5.50%, 7/01/20 | United States | 3,433,616 | 3,412,585 | |
| TGI Friday’s Inc., First Lien Initial Term Loan, 5.25%, 7/15/20 | United States | 189,592 | 189,592 | |
| eTravelport Finance Luxembourg S.A.R.L., Initial Term Loan, 6.00%, | ||||
| 9/02/21 | Luxembourg | 3,298,381 | 3,293,021 | |
| 11,048,792 | ||||
| Diversified Financials 0.2% | ||||
| Guggenheim Partners Investment Management Holdings LLC, Initial Term | ||||
| Loan, 4.25%, 7/22/20 | United States | 408,169 | 406,128 | |
| Trans Union LLC, 2014 Replacement Term Loan, 4.00%, 4/09/21 | United States | 3,988,259 | 3,935,913 | |
| 4,342,041 | ||||
| Energy 0.3% | ||||
| Citgo Petroleum Corp., Term B Loan, 4.50%, 7/29/21 | United States | 418,300 | 418,910 | |
| Drillships Ocean Ventures Inc. and Drillships Vent, Term Loan, 5.50%, | ||||
| 7/25/21 | United States | 564,785 | 543,605 |
franklintempleton.com Annual Report | 77
FRANKLIN INVESTORS SECURITIES TRUST
STATEMENT OF INVESTMENTS
| Franklin Low Duration Total Return Fund (continued) | ||||
| Principal | ||||
| Country | Amount* | Value | ||
| a,dSenior Floating Rate Interests (continued) | ||||
| Energy (continued) | ||||
| OSG Bulk Ships Inc., Initial Term Loan, 5.25%, 8/05/19 | United States | 1,309,776 | $ | 1,303,227 |
| OSG International Inc., Initial Term Loan, (OIN), 5.75%, 8/05/19 | United States | 1,458,509 | 1,448,482 | |
| ePeabody Energy Corp., Term Loan, 3.27%, 9/24/20 | United States | 1,090,870 | 1,057,052 | |
| Utex Industries Inc., First Lien Initial Term Loan, 5.00%, 5/22/21 | United States | 2,409,564 | 2,397,516 | |
| 7,168,792 | ||||
| Food, Beverage & Tobacco 0.1% | ||||
| eBig Heart Pet Brands (Del Monte Pet), Initial Term Loans, 3.50%, | ||||
| 2/24/20 | United States | 1,361,694 | 1,312,837 | |
| Health Care Equipment & Services 0.4% | ||||
| Community Health Systems Inc., 2021 Term D Loan, 4.25%, 1/27/21 | United States | 3,972,261 | 3,980,953 | |
| Connolly LLC, Initial Term Loan, 5.00%, 5/14/21 | United States | 1,969,832 | 1,963,676 | |
| Millennium Health LLC, Tranche B Term Loan, 5.25%, 4/16/21 | United States | 1,665,966 | 1,669,089 | |
| eSurgery Centers Holdings Inc., Term Loan, 3.28%, 11/03/20 | United States | 78,000 | 77,976 | |
| Truven Health Analytics Inc., New Tranche B Term Loan, 4.50%, 6/06/19 | United States | 725,402 | 709,987 | |
| U.S. Renal Care Inc., Tranche B-2 Term Loan, 4.25%, 7/03/19 | United States | 2,218,196 | 2,205,719 | |
| 10,607,400 | ||||
| Household & Personal Products 0.2% | ||||
| FGI Operating Co. LLC (Freedom Group), Term B Loans, 5.50%, | ||||
| 4/19/19 | United States | 4,636,402 | 4,621,913 | |
| Materials 1.0% | ||||
| Appvion Inc., Term Loan, 5.75%, 6/28/19 | United States | 1,066,197 | 1,059,533 | |
| Arysta Lifescience SPC LLC, Initial Term Loan, 4.50%, 5/29/20 | United States | 3,752,541 | 3,748,435 | |
| Axalta Coating Systems U.S. Holdings Inc., 2014 Specified Refinancing | ||||
| Term, 3.75%, 2/01/20 | United States | 1,042,221 | 1,027,239 | |
| AZ Chem US Inc., First Lien Initial Term Loan, 4.50%, 6/12/21 | United States | 1,669,923 | 1,670,271 | |
| Caraustar Industries Inc., Initial Term Loan, 7.50%, 5/01/19 | United States | 693,045 | 699,109 | |
| eCyanco Intermediate Corp., Initial Term Loan, 5.50%, 5/01/20 | United States | 3,463,339 | 3,418,603 | |
| eExopack Holdings SA, USD Term Loan, 5.25%, 5/08/19 | Luxembourg | 3,579,822 | 3,604,433 | |
| eMacDermid Holdings LLC, First Lien Tranche B Term Loan, 4.00%, | ||||
| 6/07/20 | United States | 2,098,384 | 2,055,762 | |
| OCI Beaumont LLC, Term B-3 Loan, 5.00%, 8/20/19 | United States | 932,382 | 938,219 | |
| Oxbow Carbon LLC, First Lien Tranche B Term Loan, 4.25%, 7/19/19 | United States | 698,340 | 689,611 | |
| Reynolds Group Holdings Inc., U.S. Term Loan, 4.00%, 12/01/18 | United States | 3,920,698 | 3,904,607 | |
| Tronox Pigments (Netherlands) BV, Term Loan, 4.00%, 3/19/20 | Netherlands | 499,916 | 495,612 | |
| Univar Inc., Term B Loan, 5.00%, 6/30/17 | United States | 461,872 | 459,563 | |
| 23,770,997 | ||||
| Media 0.3% | ||||
| Cumulus Media Holdings Inc., Term Loans, 4.25%, 12/23/20 | United States | 507,622 | 501,086 | |
| eRadio One Inc., Term Loan, 7.50%, 3/31/16 | United States | 502,796 | 506,567 | |
| William Morris Endeavor Entertainment LLC, Term Loans First Lien, 5.25%, | ||||
| 5/06/21 | United States | 6,117,767 | 6,036,199 | |
| 7,043,852 | ||||
| Retailing 0.9% | ||||
| BJ’s Wholesale Club Inc., 2013 (Nov) Replacement Loans, 4.50%, | ||||
| 9/26/19 | United States | 3,115,974 | 3,085,927 | |
| eEvergreen AcqCo. 1 LP (Savers), Term Loan, 5.00%, 7/09/19 | United States | 4,988,696 | 4,963,752 | |
| eHarbor Freight Tools USA Inc., Loans, 4.75%, 7/26/19 | United States | 3,127,249 | 3,131,158 | |
| The Men’s Wearhouse Inc., Tranche B Term Loan, 4.50%, 6/18/21 | United States | 1,403,138 | 1,401,384 |
78 | Annual Report franklintempleton.com
FRANKLIN INVESTORS SECURITIES TRUST
STATEMENT OF INVESTMENTS
| Franklin Low Duration Total Return Fund (continued) | ||||||
| Principal | ||||||
| Country | Amount* | Value | ||||
| a,dSenior Floating Rate Interests (continued) | ||||||
| Retailing (continued) | ||||||
| Party City Holdings Inc., 2014 Replacement Term Loan, 4.00%, 7/27/19 | United States | 1,414,204 | $ | 1,388,572 | ||
| Sears Roebuck Acceptance Corp., Term Loan, 5.50%, 6/30/18 | United States | 3,440,459 | 3,355,308 | |||
| Sungard Availability Services Capital Inc., Tranche B Term Loan, 6.00%, | ||||||
| 3/31/19 | United States | 3,465,307 | 3,123,108 | |||
| 20,449,209 | ||||||
| Semiconductors & Semiconductor Equipment 0.0%† | ||||||
| M/A-COM Technology Solutions Holdings Inc., Initial Term Loan, 4.50%, | ||||||
| 5/07/21 | United States | 619,547 | 619,547 | |||
| Software & Services 0.4% | ||||||
| BMC Software Finance Inc., Initial U.S. Term Loans, 5.00%, 9/10/20 | United States | 4,042,188 | 3,997,631 | |||
| MoneyGram International Inc., Term Loan, 4.25%, 3/28/20 | United States | 5,091,384 | 4,953,357 | |||
| eWorldpay U.S. Inc., Facility B2A-II Loan, 3.28%, 11/30/19 | United States | 595,777 | 597,763 | |||
| 9,548,751 | ||||||
| Technology Hardware & Equipment 0.1% | ||||||
| Dell International LLC, Term B Loan, 4.50%, 4/29/20 | United States | 1,566,491 | 1,570,852 | |||
| Presidio Inc., Term Loan, 5.00%, 3/31/17 | United States | 829,880 | 829,880 | |||
| 2,400,732 | ||||||
| Telecommunication Services 0.1% | ||||||
| Intelsat Jackson Holdings SA, Tranche B-2 Term Loan, 3.75%, 6/30/19 | Luxembourg | 1,900,449 | 1,888,572 | |||
| Transportation 0.0%† | ||||||
| Global Tip Finance BV/Finance America LLC, Facility C Commitment, | ||||||
| 7.00%, 10/16/20 | United States | 1,087,852 | 1,087,852 | |||
| Total Senior Floating Rate Interests | ||||||
| (Cost $122,692,056) | 121,733,981 | |||||
| Foreign Government and Agency Securities 3.8% | ||||||
| aThe Export-Import Bank of Korea, senior note, FRN, 0.98%, 1/14/17 | South Korea | 1,300,000 | 1,305,831 | |||
| Government of Hungary, | ||||||
| 7.75%, 8/24/15 | Hungary | 4,100,000 | HUF | 17,481 | ||
| 5.50%, 12/22/16 | Hungary | 750,880,000 | HUF | 3,274,111 | ||
| A, 8.00%, 2/12/15 | Hungary | 12,870,000 | HUF | 53,273 | ||
| A, 6.75%, 11/24/17 | Hungary | 3,910,000 | HUF | 17,863 | ||
| A, 5.50%, 12/20/18 | Hungary | 428,710,000 | HUF | 1,911,935 | ||
| Government of Malaysia, | ||||||
| 3.741%, 2/27/15 | Malaysia | 7,255,000 | MYR | 2,208,801 | ||
| 3.835%, 8/12/15 | Malaysia | 9,860,000 | MYR | 3,009,330 | ||
| 4.72%, 9/30/15 | Malaysia | 28,450,000 | MYR | 8,754,352 | ||
| 3.197%, 10/15/15 | Malaysia | 3,055,000 | MYR | 927,381 | ||
| senior note, 3.172%, 7/15/16 | Malaysia | 5,550,000 | MYR | 1,679,067 | ||
| Government of Mexico, | ||||||
| 9.50%, 12/18/14 | Mexico | 451,300 | f MXN | 3,378,132 | ||
| 6.00%, 6/18/15 | Mexico | 4,060 | f MXN | 30,678 | ||
| 8.00%, 12/17/15 | Mexico | 1,156,900 | f MXN | 9,044,337 | ||
| 6.25%, 6/16/16 | Mexico | 42,500 | f MXN | 329,273 | ||
| 7.25%, 12/15/16 | Mexico | 749,000 | f MXN | 5,960,002 |
franklintempleton.com Annual Report | 79
FRANKLIN INVESTORS SECURITIES TRUST
STATEMENT OF INVESTMENTS
| Franklin Low Duration Total Return Fund (continued) | |||||
| Principal | |||||
| Country | Amount* | Value | |||
| Foreign Government and Agency Securities (continued) | |||||
| Government of Poland, | |||||
| 5.50%, 4/25/15 | Poland | 1,754,000 | PLN | $ | 529,948 |
| 6.25%, 10/24/15 | Poland | 403,000 | PLN | 124,838 | |
| 5.00%, 4/25/16 | Poland | 23,225,000 | PLN | 7,223,036 | |
| aFRN, 2.69%, 1/25/17 | Poland | 1,338,000 | PLN | 397,947 | |
| aFRN, 2.69%, 1/25/21 | Poland | 1,356,000 | PLN | 399,287 | |
| Strip, 7/25/15 | Poland | 4,579,000 | PLN | 1,343,104 | |
| Strip, 1/25/16 | Poland | 11,786,000 | PLN | 3,427,599 | |
| bGovernment of Serbia, senior note, 144A, 5.25%, 11/21/17 | Serbia | 1,800,000 | 1,869,822 | ||
| Government of Singapore, senior note, 1.125%, 4/01/16 | Singapore | 2,010,000 | SGD | 1,580,230 | |
| Government of Sri Lanka, | |||||
| A, 11.75%, 3/15/15 | Sri Lanka | 80,000 | LKR | 624 | |
| A, 6.50%, 7/15/15 | Sri Lanka | 2,060,000 | LKR | 15,803 | |
| A, 11.00%, 8/01/15 | Sri Lanka | 13,400,000 | LKR | 105,992 | |
| A, 6.40%, 8/01/16 | Sri Lanka | 1,500,000 | LKR | 11,435 | |
| A, 8.00%, 11/15/18 | Sri Lanka | 3,780,000 | LKR | 29,611 | |
| A, 9.00%, 5/01/21 | Sri Lanka | 4,890,000 | LKR | 39,865 | |
| C, 8.50%, 4/01/18 | Sri Lanka | 2,890,000 | LKR | 23,019 | |
| D, 8.50%, 6/01/18 | Sri Lanka | 1,960,000 | LKR | 15,613 | |
| Government of the Philippines, | |||||
| senior bond, 7.00%, 1/27/16 | Philippines | 3,500,000 | PHP | 81,710 | |
| senior note, 1.625%, 4/25/16 | Philippines | 19,230,000 | PHP | 425,589 | |
| Korea Monetary Stabilization Bond, | |||||
| senior bond, 2.47%, 4/02/15 | South Korea | 4,510,200,000 | KRW | 4,207,181 | |
| senior bond, 2.80%, 8/02/15 | South Korea | 6,330,230,000 | KRW | 5,926,563 | |
| senior bond, 2.81%, 10/02/15 | South Korea | 1,860,000,000 | KRW | 1,743,653 | |
| senior note, 2.84%, 12/02/14 | South Korea | 1,517,560,000 | KRW | 1,413,873 | |
| senior note, 2.74%, 2/02/15 | South Korea | 1,789,480,000 | KRW | 1,669,132 | |
| senior note, 2.76%, 6/02/15 | South Korea | 1,334,100,000 | KRW | 1,247,344 | |
| bKorea National Oil Corp., senior note, 144A, 2.875%, 11/09/15 | South Korea | 2,000,000 | 2,038,110 | ||
| Korea Treasury Bond, senior note, | |||||
| 3.25%, 12/10/14 | South Korea | 636,530,000 | KRW | 593,368 | |
| 3.25%, 6/10/15 | South Korea | 420,970,000 | KRW | 394,752 | |
| 2.75%, 12/10/15 | South Korea | 2,527,740,000 | KRW | 2,370,599 | |
| 2.75%, 6/10/16 | South Korea | 4,800,000,000 | KRW | 4,515,607 | |
| 3.00%, 12/10/16 | South Korea | 1,590,000,000 | KRW | 1,507,234 | |
| Letra Tesouro Nacional, Strip, 1/01/15 | Brazil | 10 | gBRL | 3,964 | |
| hNota Do Tesouro Nacional, Index Linked, 6.00%, | |||||
| 8/15/16 | Brazil | 789 | gBRL | 799,314 | |
| 5/15/17 | Brazil | 150 | gBRL | 152,660 | |
| 8/15/18 | Brazil | 1,810 | gBRL | 1,830,373 | |
| Total Foreign Government and Agency Securities | |||||
| (Cost $92,809,367) | 89,960,646 | ||||
| U.S. Government and Agency Securities 5.8% | |||||
| U.S. Treasury Bond, 11.25%, 2/15/15 | United States | 3,000,000 | 3,094,452 | ||
| U.S. Treasury Note, | |||||
| 4.125%, 5/15/15 | United States | 15,000,000 | 15,324,615 | ||
| 2.125%, 5/31/15 | United States | 44,200,000 | 44,721,428 |
80 | Annual Report franklintempleton.com
FRANKLIN INVESTORS SECURITIES TRUST
STATEMENT OF INVESTMENTS
| Franklin Low Duration Total Return Fund (continued) | ||||
| Principal | ||||
| Country | Amount* | Value | ||
| U.S. Government and Agency Securities (continued) | ||||
| U.S. Treasury Note, (continued) | ||||
| 1.875%, 6/30/15 | United States | 30,000,000 | $ | 30,353,910 |
| 0.25%, 7/15/15 | United States | 5,000,000 | 5,005,860 | |
| 4.25%, 8/15/15 | United States | 34,000,000 | 35,099,696 | |
| iIndex Linked, 0.125%, 4/15/16 | United States | 3,232,887 | 3,269,761 | |
| Total U.S. Government and Agency Securities | ||||
| (Cost $136,731,431) | 136,869,722 | |||
| Asset-Backed Securities and Commercial | ||||
| Mortgage-Backed Securities 27.7% | ||||
| Banks 10.4% | ||||
| Banc of America Commercial Mortgage Trust, | ||||
| 2006-1, AJ, 5.46%, 9/10/45 | United States | 8,350,000 | 8,700,658 | |
| 2006-4, AJ, 5.695%, 7/10/46 | United States | 7,087,000 | 7,354,534 | |
| 2006-4, AM, 5.675%, 7/10/46 | United States | 6,710,000 | 7,214,870 | |
| Bear Stearns Commercial Mortgage Securities Inc., | ||||
| a2006-PW11, AJ, FRN, 5.605%, 3/11/39 | United States | 5,382,000 | 5,589,907 | |
| a2006-PW12, AJ, FRN, 5.751%, 9/11/38 | United States | 1,770,000 | 1,832,786 | |
| 2006-PW13, AJ, 5.611%, 9/11/41 | United States | 7,000,000 | 7,248,395 | |
| a2007-PW16, AM, FRN, 5.706%, 6/11/40 | United States | 2,100,000 | 2,303,457 | |
| Bear Stearns Commercial Mortgage Securities Trust, | ||||
| a2005-T20, A3, FRN, 5.137%, 10/12/42 | United States | 514,390 | 514,499 | |
| a2005-T20, E, FRN, 5.288%, 10/12/42 | United States | 2,000,000 | 2,006,845 | |
| 2006-PW13, A4, 5.54%, 9/11/41 | United States | 3,433,267 | 3,643,536 | |
| a2007-PW16, A4, FRN, 5.706%, 6/11/40 | United States | 1,710,000 | 1,881,935 | |
| Capital One Multi-Asset Execution Trust, | ||||
| 2006-A6, A3, 5.05%, 12/17/18 | United States | 6,100,000 | 6,443,012 | |
| a2006-A11, A11, FRN, 0.243%, 6/17/19 | United States | 12,000,000 | 11,959,278 | |
| a2007-A1, A1, FRN, 0.203%, 11/15/19 | United States | 12,220,000 | 12,163,293 | |
| a2007-A2, A2, FRN, 0.233%, 12/16/19 | United States | 11,390,000 | 11,343,170 | |
| aCD Commercial Mortgage Trust, 2005-CD1, AJ, FRN, 5.219%, 7/15/44 | United States | 3,258,000 | 3,363,804 | |
| Citibank Credit Card Issuance Trust, | ||||
| 2003-A7, A7, 4.15%, 7/07/17 | United States | 2,900,000 | 2,972,948 | |
| 2005-A9, A9, 5.10%, 11/20/17 | United States | 6,200,000 | 6,497,033 | |
| a2006-A3, A3, FRN, 5.30%, 3/15/18 | United States | 2,160,000 | 2,296,101 | |
| a2008-A6, A6, FRN, 1.357%, 5/22/17 | United States | 5,780,000 | 5,813,495 | |
| a2013-A1, A1, FRN, 0.253%, 4/24/17 | United States | 11,540,000 | 11,537,115 | |
| a2013-A11, A11, FRN, 0.393%, 2/07/18 | United States | 9,620,000 | 9,625,089 | |
| a2013-A12, A12, FRN, 0.467%, 11/07/18 | United States | 6,200,000 | 6,210,955 | |
| a2014-A9, A9, FRN, 0.353%, 5/09/18 | United States | 2,180,000 | 2,179,123 | |
| Citigroup Commercial Mortgage Trust, | ||||
| j2006-C5, AJ, 5.482%, 10/15/49 | United States | 1,850,000 | 1,857,838 | |
| a2007-C6, AM, FRN, 5.706%, 6/10/17 | United States | 7,000,000 | 7,555,723 | |
| aCitigroup/Deutsche Bank Commercial Mortgage Trust, 2005-CD1, E, FRN, | ||||
| 5.219%, 7/15/44 | United States | 3,495,000 | 3,496,569 | |
| aCountrywide Asset-Backed Certificates, | ||||
| 2001-BC3, A, FRN, 0.632%, 12/25/31 | United States | 1,808 | 1,396 | |
| 2002-3, 1A1, FRN, 0.892%, 5/25/32 | United States | 1,795 | 1,709 | |
| 2004-1, M1, FRN, 0.902%, 3/25/34 | United States | 543,632 | 522,164 | |
| 2004-7, MV3, FRN, 1.202%, 12/25/34 | United States | 797,297 | 794,557 | |
| 2004-14, M1, FRN, 0.662%, 6/25/35 | United States | 716,807 | 715,715 |
franklintempleton.com
Annual Report
| 81
FRANKLIN INVESTORS SECURITIES TRUST
STATEMENT OF INVESTMENTS
| Franklin Low Duration Total Return Fund (continued) | ||||
| Principal | ||||
| Country | Amount* | Value | ||
| Asset-Backed Securities and Commercial | ||||
| Mortgage-Backed Securities (continued) | ||||
| Banks (continued) | ||||
| Credit Suisse First Boston Mortgage Securities Corp., | ||||
| j2004-6, 3A1, 5.00%, 9/25/19 | United States | 2,109,988 | $ | 2,212,590 |
| a2004-AR3, 5A1, FRN, 0.267%, 4/25/34 | United States | 2,570,700 | 2,636,419 | |
| aGranite Master Issuer PLC, 2006-3, A3, FRN, 0.237%, 12/20/54 | United Kingdom | 1,224,693 | 1,215,507 | |
| aGreenwich Capital Commercial Funding Corp., 2006-GG7, | ||||
| AJ, FRN, 5.82%, 7/10/38 | United States | 6,800,000 | 7,029,884 | |
| AM, FRN, 6.014%, 7/10/38 | United States | 660,000 | 703,540 | |
| aImpac Secured Assets CMN Owner Trust, 2004-4, M1, FRN, 0.662%, | ||||
| 2/25/35 | United States | 1,120,000 | 1,081,298 | |
| JP Morgan Chase Commercial Mortgage Securities Trust, | ||||
| 2004-LN2, A2, 5.115%, 7/15/41 | United States | 174,729 | 175,907 | |
| 2006-CB17, AM, 5.464%, 12/12/43 | United States | 2,350,000 | 2,458,808 | |
| a2006-LDP7, AJ, FRN, 5.873%, 4/15/45 | United States | 7,000,000 | 7,143,516 | |
| LB-UBS Commercial Mortgage Trust, | ||||
| 2005-C3, A5, 4.739%, 7/15/30 | United States | 2,256,946 | 2,279,097 | |
| a2006-C1, AJ, FRN, 5.276%, 2/15/41 | United States | 967,000 | 994,163 | |
| a2006-C4, AJ, FRN, 5.857%, 6/15/38 | United States | 4,000,000 | 4,204,840 | |
| aMerrill Lynch Mortgage Investors Inc., 2003-A, 1A, FRN, 0.892%, | ||||
| 3/25/28 | United States | 842,705 | 828,030 | |
| aMerrill Lynch Mortgage Trust, 2005-CKI1, AJ, FRN, 5.282%, 11/12/37 | United States | 1,750,000 | 1,811,519 | |
| aMLCC Mortgage Investors Inc., 2005-1, 2A2, FRN, 2.297%, 4/25/35 | United States | 894,561 | 872,395 | |
| aMorgan Stanley ABS Capital I Inc. Trust, 2005-WMC, M2, FRN, 0.887%, | ||||
| 1/25/35 | United States | 566,060 | 547,809 | |
| Morgan Stanley Capital I Trust, | ||||
| 2005-T17, A5, 4.78%, 12/13/41 | United States | 1,996,720 | 1,995,878 | |
| a2006-HQ8, A4, FRN, 5.417%, 3/12/44 | United States | 3,253,495 | 3,369,298 | |
| a2006-HQ8, AJ, FRN, 5.497%, 3/12/44 | United States | 7,000,000 | 7,241,188 | |
| aWachovia Bank Commercial Mortgage Trust, | ||||
| b2003-C7, F, 144A, FRN, 5.004%, 10/15/35 | United States | 1,500,000 | 1,514,957 | |
| 2005-C17, B, FRN, 5.287%, 3/15/42 | United States | 3,000,000 | 3,037,050 | |
| 2006-C23, AJ, FRN, 5.515%, 1/18/45 | United States | 8,000,000 | 8,322,180 | |
| 2006-C23, AM, FRN, 5.466%, 1/15/45 | United States | 2,730,000 | 2,866,073 | |
| 2006-C25, AJ, FRN, 5.86%, 5/15/43 | United States | 5,700,000 | 5,933,438 | |
| 2006-C27, AM, FRN, 5.795%, 7/17/45 | United States | 2,755,000 | 2,936,133 | |
| 2006-C28, AM, FRN, 5.603%, 10/15/48 | United States | 7,330,000 | 7,877,130 | |
| aWells Fargo Mortgage Backed Securities Trust, | ||||
| 2004-I, 2A1, FRN, 2.654%, 6/25/34 | United States | 2,645,796 | 2,646,880 | |
| 2004-V, 2A1, FRN, 2.632%, 10/25/34 | United States | 2,401,429 | 2,432,395 | |
| 2004-W, A9, FRN, 2.762%, 11/25/34 | United States | 242,332 | 249,397 | |
| 2005-AR, 1A1, FRN, 2.61%, 2/25/35 | United States | 2,984,112 | 3,001,670 | |
| 2005-AR10, 2A3, FRN, 2.616%, 6/25/35 | United States | 1,334,517 | 1,326,036 | |
| 2005-AR9, 2A2, FRN, 2.641%, 10/25/33 | United States | 316,249 | 313,117 | |
| 246,899,651 | ||||
| Diversified Financials 17.0% | ||||
| aAames Mortgage Investment Trust, 2005-4, M1, FRN, 0.857%, 10/25/35 | United States | 415,852 | 416,304 | |
| bABSC Manufactured Housing Contract Resecuritization Trust, 2004-0K1, | ||||
| A4, 144A, 5.019%, 4/16/30 | United States | 1,715,529 | 1,739,692 | |
| aAmerican Express Credit Account Master Trust, | ||||
| 2005-2, A, FRN, 0.253%, 10/16/17 | United States | 1,200,000 | 1,199,726 | |
| 2008-6, A, FRN, 1.353%, 2/15/18 | United States | 8,850,000 | 8,916,158 | |
| 82 | Annual Report | franklintempleton.com | |||
FRANKLIN INVESTORS SECURITIES TRUST
STATEMENT OF INVESTMENTS
| Franklin Low Duration Total Return Fund (continued) | ||||
| Principal | ||||
| Country | Amount* | Value | ||
| Asset-Backed Securities and Commercial | ||||
| Mortgage-Backed Securities (continued) | ||||
| Diversified Financials (continued) | ||||
| aAmerican Express Credit Account Master Trust, (continued) | ||||
| 2012-1, A, FRN, 0.423%, 1/15/20 | United States | 11,890,000 | $ | 11,907,894 |
| 2012-3, A, FRN, 0.303%, 3/15/18 | United States | 2,480,000 | 2,481,107 | |
| aAmerican Home Mortgage Investment Trust, 2004-3, 4A, FRN, 1.833%, | ||||
| 10/25/34 | United States | 5,087,481 | 5,036,975 | |
| a,bAmerican Residential Properties Trust, 2014-SFR1, B, 144A, FRN, 1.904%, | ||||
| 9/17/31 | United States | 9,300,000 | 9,174,031 | |
| aAmeriquest Mortgage Securities Inc. Asset-Backed Pass-Through | ||||
| Certificates, | ||||
| 2004-R4, M1, FRN, 0.977%, 6/25/34 | United States | 1,685,473 | 1,649,898 | |
| 2004-R7, A1, FRN, 0.592%, 8/25/34 | United States | 1,392,136 | 1,392,517 | |
| a,bAnthracite Ltd., 2004-1A, BFL, 144A, FRN, 0.703%, 3/23/39 | Cayman Islands | 341,971 | 341,362 | |
| bApidos CDO, 2013-14A, C2, 144A, 4.85%, 4/15/25 | United States | 1,900,000 | 1,842,582 | |
| a,bARCap REIT Inc., 2004-RR3, A2, 144A, FRN, 4.76%, 9/21/45 | United States | 6,228,225 | 6,325,334 | |
| bARCap Resecuritization Trust, 2004-A1, A, 144A, 4.73%, 4/21/24 | United States | 3,257,339 | 3,300,397 | |
| a,bARES CLO Ltd., 2007-3RA, B, 144A, FRN, 0.599%, 4/16/21 | United States | 3,700,000 | 3,547,264 | |
| a,b,jARES XI CLO Ltd., 2007-11A, A1C, 144A, FRN, 0.50%, 10/11/21 | United States | 2,540,246 | 2,491,727 | |
| aArgent Securities Inc., 2005-W2, A2C, FRN, 0.512%, 10/25/35 | United States | 1,155,000 | 1,075,275 | |
| a,bAtrium XI, 11A, C, 144A, FRN, 3.435%, 10/23/25 | Cayman Islands | 6,750,000 | 6,681,825 | |
| a,bBabson CLO Inc., 2007-1A, A1, 144A, FRN, 0.456%, 1/18/21 | United States | 3,238,882 | 3,217,926 | |
| aBank of America Credit Card Trust, 2014-A2, A, FRN, 0.423%, 9/16/19 | United States | 9,620,000 | 9,623,083 | |
| aBayview Financial Acquisition Trust, 2004-D, M1, FRN, 0.782%, 8/28/44 | United States | 1,083,514 | 1,085,661 | |
| aBear Stearns Alt-A Trust, | ||||
| 2004-10, 1A3, FRN, 1.152%, 9/25/34 | United States | 3,702,024 | 3,710,113 | |
| 2004-13, A2, FRN, 1.032%, 11/25/34 | United States | 178,077 | 171,244 | |
| a,bCatamaran CLO Ltd., 2014-2A, B, 144A, FRN, 3.233%, 10/18/26 | United States | 2,609,300 | 2,504,537 | |
| a,bCent CDO XI Ltd., 2006-11A, B, 144A, FRN, 1.033%, 4/25/19 | United States | 1,280,000 | 1,219,072 | |
| a,bCent CLO LP, 2014-22A, B, 144A, FRN, 3.433%, 11/07/26 | Cayman Islands | 4,050,000 | 4,050,000 | |
| Chase Funding Mortgage Loan Asset-Backed Certificates, 2004-2, | ||||
| 1A6, 5.351%, 2/25/35 | United States | 191,771 | 192,773 | |
| a2A2, FRN, 0.652%, 2/25/35 | United States | 13,246 | 12,187 | |
| aChase Issuance Trust, | ||||
| 2007-A2, A2, FRN, 0.203%, 4/15/19 | United States | 6,468,000 | 6,438,406 | |
| 2007-A8, A, FRN, 0.173%, 3/15/17 | United States | 600,000 | 599,788 | |
| 2007-B1, B1, FRN, 0.403%, 4/15/19 | United States | 9,400,000 | 9,346,881 | |
| 2007-C1, C1, FRN, 0.613%, 4/15/19 | United States | 3,800,000 | 3,776,830 | |
| 2012-A6, A, FRN, 0.283%, 8/15/17 | United States | 10,620,000 | 10,612,375 | |
| 2012-A9, A9, FRN, 0.303%, 10/16/17 | United States | 7,620,000 | 7,622,694 | |
| 2013-A3, A3, FRN, 0.433%, 4/15/20 | United States | 6,147,000 | 6,148,039 | |
| 2014-A3, A3, FRN, 0.353%, 5/15/18 | United States | 11,780,000 | 11,780,289 | |
| 2014-A5, A5, FRN, 0.523%, 4/15/21 | United States | 7,310,000 | 7,333,418 | |
| a,bChatham Light CLO Ltd., 2005-2A, A2, 144A, FRN, 0.639%, 8/03/19 | United States | 2,580,000 | 2,571,125 | |
| a,bColony American Homes, 2014-1A, A, 144A, FRN, 1.40%, 5/17/31 | United States | 4,823,443 | 4,826,875 | |
| bColony MFM Trust, 2014-1, A, 144A, 2.543%, 4/20/22 | United States | 12,000,000 | 12,000,000 | |
| bColumbusNova CLO IV Ltd., 2007-2A, B, 144A, 1.481%, 10/15/21 | United States | 760,000 | 747,202 | |
| aCommercial Mortgage Trust, 2007-C9, A1A, FRN, 6.01%, 12/10/49 | United States | 8,843,540 | 9,664,839 | |
| bCountryplace Manufactured Housing Contract Trust, | ||||
| 2005-A3, 144A, 4.80%, 12/15/35 | United States | 112,436 | 114,758 | |
| 2007-1, A3, 144A, 5.593%, 7/15/37 | United States | 136,272 | 140,286 |
franklintempleton.com
Annual Report
| 83
FRANKLIN INVESTORS SECURITIES TRUST
STATEMENT OF INVESTMENTS
| Franklin Low Duration Total Return Fund (continued) | ||||
| Principal | ||||
| Country | Amount* | Value | ||
| Asset-Backed Securities and Commercial | ||||
| Mortgage-Backed Securities (continued) | ||||
| Diversified Financials (continued) | ||||
| aCountrywide Home Loans, | ||||
| 04-11, 2A1, FRN, 2.243%, 7/25/34 | United States | 4,368,329 | $ | 4,338,939 |
| 2004-6, 1A1, FRN, 2.687%, 5/25/34 | United States | 3,603,900 | 3,601,496 | |
| bCrest Ltd., | ||||
| 2003-2A, C2, 144A, 5.709%, 12/28/38 | United States | 722,392 | 726,910 | |
| a2004-1A, B1, 144A, FRN, 0.723%, 1/28/40 | United States | 3,300,691 | 3,254,852 | |
| bCT CDO III Ltd., 2005-3A, C, 144A, 5.471%, 6/25/35 | United States | 2,500,000 | 2,498,837 | |
| a,bCT CDO IV Ltd., 2006-4A, A1, 144A, FRN, 0.467%, 10/20/43 | United States | 4,366,697 | 4,313,315 | |
| Discover Card Execution Note Trust, | ||||
| a2010-A2, A2, FRN, 0.733%, 3/15/18 | United States | 5,000,000 | 5,019,797 | |
| 2012-A3, A3, 0.86%, 11/15/17 | United States | 5,805,000 | 5,819,304 | |
| a2012-A5, A5, FRN, 0.353%, 1/16/18 | United States | 11,983,000 | 11,984,708 | |
| a2013-A6, A6, FRN, 0.603%, 4/15/21 | United States | 5,520,000 | 5,541,660 | |
| a2014-A1, A1, FRN, 0.583%, 7/15/21 | United States | 7,690,000 | 7,714,170 | |
| a,bEaton Vance CDO Ltd., 2014-1A, | ||||
| B, 144A, FRN, 2.285%, 7/15/26 | United States | 858,000 | 833,290 | |
| C, 144A, FRN, 3.235%, 7/15/26 | United States | 739,600 | 722,042 | |
| bEmerson Park CLO Ltd., 2013-1A, C2, 144A, 5.64%, 7/15/25 | United States | 630,000 | 637,434 | |
| a,bFairfield Street Solar, 2004-1A, A1, 144A, FRN, 0.588%, 11/28/39 | Cayman Islands | 1,004,238 | 965,150 | |
| a,jFirst Horizon Alternative Mortgage Securities Trust, 04-AA5, 2A1, FRN, | ||||
| 2.092%, 12/25/34 | United States | 3,616,162 | 3,544,177 | |
| Ford Credit Auto Owner Trust, | ||||
| 2012-A, A4, 1.15%, 6/15/17 | United States | 3,470,000 | 3,488,087 | |
| 2012-D, A3, 0.51%, 4/15/17 | United States | 5,739,284 | 5,739,993 | |
| bG-Force LLC, | ||||
| a2005-RR2, A3FL, 144A, FRN, 0.452%, 12/25/39 | United States | 2,075,556 | 2,015,469 | |
| 2005-RRA, B, 144A, 5.09%, 8/22/36 | United States | 1,842,473 | 1,860,123 | |
| a,bGleneagles CLO Ltd., 2005-1A, A2, 144A, FRN, 0.64%, 11/01/17 | United States | 2,000,000 | 1,980,140 | |
| jGMAC Commercial Mortgage Securities Inc., 2005-C1, B, 4.936%, | ||||
| 5/10/43 | United States | 1,615,000 | 401,716 | |
| Green Tree Financial Corp., 1999-3, A7, 6.74%, 2/01/31 | United States | 147,186 | 147,701 | |
| aGSAA Home Equity Trust, | ||||
| 05-5, M3, FRN, 1.097%, 2/25/35 | United States | 5,950,000 | 5,615,628 | |
| FRN, 0.522%, 6/25/35 | United States | 801,800 | 771,755 | |
| aGSAMP Trust, 2005-HE3, M2, FRN, 1.157%, 6/25/35 | United States | 1,950,111 | 1,893,246 | |
| aGSR Mortgage Loan Trust, 2005-AR1, 1A1, FRN, 2.865%, 1/25/35 | United States | 1,167,393 | 1,154,926 | |
| bHighbridge Loan Management Ltd., 2013-2A, B2, 144A, 5.80%, | ||||
| 10/20/24 | United States | 570,000 | 575,922 | |
| a,bHilton USA Trust, 2013-HLF, AFL, 144A, FRN, 1.152%, 11/05/30 | United States | 7,035,000 | 7,038,644 | |
| a,bInvitation Homes Trust, 2014-SFR2, B, 144A, FRN, 1.754%, 9/17/31 | United States | 8,500,000 | 8,372,602 | |
| a,bJefferies & Co., 2009-R2, 4A, 144A, FRN, 2.538%, 5/26/37 | United States | 2,484,784 | 2,504,156 | |
| aJP Morgan Chase Commercial Mortgage Securities Trust, | ||||
| 2005-LDP5, A, FRN, 5.393%, 12/15/44 | United States | 1,150,000 | 1,164,211 | |
| 2006-LDP7, A4, FRN, 5.873%, 4/15/45 | United States | 880,000 | 928,286 | |
| aJP Morgan Mortgage Acquisition Corp., 2006-ACC1, A4, FRN, 0.302%, | ||||
| 5/25/36 | United States | 270,065 | 266,572 | |
| aJP Morgan Mortgage Trust, 2004-A1, 5A1, FRN, 2.556%, 2/25/34 | United States | 151,751 | 151,016 | |
| a,bKildare Securities Ltd., 2007-1A, A2, 144A, FRN, 0.354%, 12/10/43 | Ireland | 1,662,081 | 1,658,478 | |
| a,bLandmark IX CDO Ltd., 2007-9A, C, 144A, FRN, 0.931%, 4/15/21 | United States | 1,040,000 | 1,001,198 |
84 | Annual Report
franklintempleton.com
FRANKLIN INVESTORS SECURITIES TRUST
STATEMENT OF INVESTMENTS
| Franklin Low Duration Total Return Fund (continued) | |||||
| Principal | |||||
| Country | Amount* | Value | |||
| Asset-Backed Securities and Commercial | |||||
| Mortgage-Backed Securities (continued) | |||||
| Diversified Financials (continued) | |||||
| a,bLB-UBS Commercial Mortgage Trust, | |||||
| 2001-C3, E, 144A, FRN, 6.95%, 6/15/36 | United States | 700,000 | $ | 710,413 | |
| 2004-C7, H, 144A, FRN, 5.239%, 10/15/36 | United States | 980,000 | 1,010,473 | ||
| a,bLNR CDO Ltd., 2003-1A, DFL, 144A, FRN, 2.253%, 7/23/36 | Cayman Islands | 105,628 | 105,632 | ||
| aLong Beach Mortgage Loan Trust, 2005-WL2, M1, FRN, 0.622%, | |||||
| 8/25/35 | United States | 1,410,139 | 1,400,325 | ||
| a,bMach One Trust Commercial Mortgage-Backed, 2004-1A, | |||||
| F, 144A, FRN, 5.923%, 5/28/40 | United States | 296,229 | 301,264 | ||
| G, 144A, FRN, 6.82%, 5/28/40 | United States | 3,500,000 | 3,490,515 | ||
| aMASTR Adjustable Rate Mortgages Trust, 2007-1, I2A2, FRN, 0.312%, | |||||
| 1/25/47 | United States | 2,021,885 | 1,993,964 | ||
| MASTR Alternative Loan Trust, | |||||
| 2003-1, 3A1, 5.00%, 2/25/18 | United States | 950,141 | 978,868 | ||
| 2003-6, 2A1, 5.00%, 8/25/18 | United States | 2,114,568 | 2,196,768 | ||
| 2003-9, 1A1, 5.50%, 12/25/18 | United States | 903,713 | 935,983 | ||
| 2004-4, 5A1, 5.50%, 4/25/19 | United States | 2,391,854 | 2,501,823 | ||
| a2004-11, 2A1, FRN, 5.561%, 11/25/19 | United States | 2,199,519 | 2,305,451 | ||
| aMASTR ARM Trust, 2007-3, 12A2, FRN, 0.352%, 5/25/47 | United States | 864,747 | 850,196 | ||
| Mercedes-Benz Auto Lease Trust, 2013-A, A4, 0.72%, 12/17/18 | United States | 1,150,000 | 1,150,095 | ||
| aMerrill Lynch Mortgage Investors Trust Inc., | |||||
| 2003-E, A1, FRN, 0.772%, 10/25/28 | United States | 1,573,115 | 1,552,895 | ||
| 2003-G, A2, FRN, 1.002%, 1/25/29 | United States | 1,464,997 | 1,428,945 | ||
| aML-CFC Commercial Mortgage Trust, 2006-3, A1A, FRN, 5.409%, | |||||
| 7/12/46 | United States | 3,041,098 | 3,251,578 | ||
| a,bN-Star Real Estate CDO IV Ltd., 2005-4A, A, 144A, FRN, 0.502%, | |||||
| 7/27/40 | Cayman Islands | 530,065 | 520,286 | ||
| a,bN-Star Real Estate CDO Ltd., 2006-6A, A1, 144A, FRN, 0.565%, | |||||
| 6/16/41 | Cayman Islands | 3,240,437 | 3,138,862 | ||
| aNew York Mortgage Trust, 2005-3, M1, FRN, 0.602%, 2/25/36 | United States | 763,123 | 704,349 | ||
| a,bNewcastle CDO Ltd., 2004-5A, 1, 144A, FRN, 0.576%, 12/24/39 | United States | 1,160,049 | 1,139,802 | ||
| aOwnit Mortgage Loan Asset-Backed Certificates, 2005-2, M4, FRN, | |||||
| 1.082%, 3/25/36 | United States | 3,007,814 | 2,963,072 | ||
| aPark Place Securities Inc. Asset-Backed Pass-Through Certificates, | |||||
| 2004-MCW1, M1, FRN, 1.09%, 10/25/34 | United States | 398,619 | 397,553 | ||
| 2004-WHQ2, M2, FRN, 1.097%, 2/25/35 | United States | 2,531,189 | 2,550,236 | ||
| aPark Place Securities Inc., 2005-WCW1, M1, FRN, 0.602%, 9/25/35 | United States | 1,895,000 | 1,883,871 | ||
| a,bPegasus 2006-1 Ltd., 2006-1A, A1, 144A, FRN, 0.552%, 7/25/49 | United States | 2,900,000 | 2,669,450 | ||
| aRAAC, 04-SP1, AII, FRN, 0.852%, 3/25/34 | United States | 994,229 | 955,215 | ||
| aResidential Funding Mortgage Securities II, 2004-HI3, A5, FRN, 5.48%, | |||||
| 6/25/34 | United States | 624,202 | 648,853 | ||
| a,bResource Capital Corp. Ltd., 2014-CRE2, A, 144A, FRN, 1.207%, | |||||
| 4/15/32 | Cayman Islands | 3,236,000 | 3,242,067 | ||
| a,bSeawall SPC, 2006-1A, C1, 144A, FRN, 1.403%, 4/15/46 | United States | 1,000,000 | 997,700 | ||
| aSequoia Mortgage Trust, 2003-4, | |||||
| 1A1, FRN, 0.777%, 7/20/33 | United States | 465,879 | 439,843 | ||
| 1A2, FRN, 0.987%, 7/20/33 | United States | 413,896 | 390,772 |
franklintempleton.com Annual Report | 85
FRANKLIN INVESTORS SECURITIES TRUST
STATEMENT OF INVESTMENTS
| Franklin Low Duration Total Return Fund (continued) | |||||
| Principal | |||||
| Country | Amount* | Value | |||
| Asset-Backed Securities and Commercial | |||||
| Mortgage-Backed Securities (continued) | |||||
| Diversified Financials (continued) | |||||
| a,bSilver Bay Realty Trust, 2014-1, | |||||
| A, 144A, FRN, 1.154%, 9/17/31 | United States | 1,244,794 | $ | 1,236,302 | |
| B, 144A, FRN, 1.604%, 9/17/31 | United States | 540,000 | 528,181 | ||
| aStructured Asset Investment Loan Trust, 2004-BNC2, A2, FRN, 1.192%, | |||||
| 12/25/34 | United States | 3,430,171 | 3,379,515 | ||
| aStructured Asset Mortgage Investments Trust, | |||||
| 2003-AR1, A1, FRN, 0.897%, 10/19/33 | United States | 536,241 | 508,539 | ||
| 2003-AR2, A1, FRN, 0.897%, 12/19/33 | United States | 1,269,388 | 1,227,985 | ||
| aStructured Asset Mortgage Investments II Trust, 2004-AR6, A1A, FRN, | |||||
| 0.857%, 2/19/35 | United States | 2,831,444 | 2,679,755 | ||
| aStructured Asset Securities Corp., 2006-WF1, A5, FRN, 0.452%, 2/25/36 | United States | 1,408,639 | 1,387,064 | ||
| a,cTalisman 6 Finance, Reg S, FRN, 0.262%, 10/22/16 | Germany | 3,307,680 | EUR | 4,045,632 | |
| aThornburg Mortgage Securities Trust, | |||||
| 2004-3, A, FRN, 0.892%, 9/25/44 | United States | 2,077,784 | 2,023,457 | ||
| 2007-4, 1A1, FRN, 2.341%, 9/25/37 | United States | 1,332,911 | 1,313,884 | ||
| a,bTrade MAPS Ltd., 2013-1A, A, 144A, FRN, 0.852%, 12/10/18 | Ireland | 8,500,000 | 8,522,185 | ||
| Vanderbilt Acquisition Loan Trust, 2002-1, M1, 7.33%, 5/07/32 | United States | 358,856 | 391,042 | ||
| a,bVeritas CLO Ltd., 2006-2A, A2, 144A, FRN, 0.56%, 7/11/21 | United States | 2,000,000 | 1,963,400 | ||
| a,bWachovia Bank Commercial Mortgage Trust, 2007-WHL8, A2, 144A, FRN, | |||||
| 0.293%, 6/15/20 | United States | 6,160,000 | 6,034,499 | ||
| WaMu Mortgage Pass-Through Certificates, | |||||
| a2005-AR8, 2A1A, FRN, 0.442%, 7/25/45 | United States | 1,979,382 | 1,905,907 | ||
| 2005-AR13, A1A1, 0.442%, 10/25/45 | United States | 7,003,089 | 6,743,530 | ||
| a2005-AR19, A1A1, FRN, 0.422%, 12/25/45 | United States | 5,215,505 | 5,052,192 | ||
| aWells Fargo Home Equity Trust Mortgage Pass-Through Certificates, | |||||
| 2004-1, A3, FRN, 0.522%, 4/25/34 | United States | 1,980,000 | 1,887,176 | ||
| a,bWest CLO Ltd., 2014-1A, | |||||
| A2, 144A, FRN, 2.333%, 7/18/26 | United States | 1,360,000 | 1,360,000 | ||
| B, 144A, FRN, 3.083%, 7/18/26 | United States | 3,590,000 | 3,506,712 | ||
| 403,780,495 | |||||
| Real Estate 0.3% | |||||
| a,bAmerican Homes 4 Rent, 2014-SFR1, A, 144A, FRN, 1.25%, 6/17/31 | United States | 3,171,017 | 3,152,905 | ||
| aCitigroup Mortgage Loan Trust Inc., 2006-WFH3, A3, FRN, 0.302%, | |||||
| 10/25/36 | United States | 332,811 | 332,641 | ||
| aNovastar Home Equity Loan, 2004-4, M4, FRN, 1.802%, 3/25/35 | United States | 2,000,000 | 1,970,779 | ||
| 5,456,325 | |||||
| Total Asset-Backed Securities and Commercial | |||||
| Mortgage-Backed Securities (Cost $653,663,480) | 656,136,471 | ||||
| Mortgage-Backed Securities 3.7% | |||||
| aFederal Home Loan Mortgage Corp. (FHLMC) Adjustable Rate 0.8% | |||||
| FHLMC, 1.78% - 6.345%, 11/01/17 - 9/01/41 | United States | 18,538,581 | 19,621,306 | ||
| Federal Home Loan Mortgage Corp. (FHLMC) Fixed Rate 0.1% | |||||
| FHLMC Gold 15 Year, 5.00%, 10/01/23 | United States | 261,978 | 282,890 | ||
| FHLMC Gold 15 Year, 6.00%, 6/01/23 | United States | 100,281 | 112,092 | ||
| FHLMC Gold 30 Year, 5.00%, 1/01/39 | United States | 375,334 | 414,751 | ||
| 809,733 |
86 | Annual Report
franklintempleton.com
FRANKLIN INVESTORS SECURITIES TRUST
STATEMENT OF INVESTMENTS
| Franklin Low Duration Total Return Fund (continued) | ||||
| Principal | ||||
| Country | Amount* | Value | ||
| Mortgage-Backed Securities (continued) | ||||
| aFederal National Mortgage Association (FNMA) Adjustable Rate 2.2% | ||||
| FNMA, 1.195% - 2.234%, 3/01/17 - 10/01/44 | United States | 19177138 | $ | 20,184,502 |
| FNMA, 2.233% - 2.493%, 5/01/18 - 10/1/43 | United States | 18,529,885 | 19,647,799 | |
| FNMA, 2.497% - 6.141%, 8/01/15 - 3/01/50 | United States | 12,001,247 | 12,714,568 | |
| 52,546,869 | ||||
| Federal National Mortgage Association (FNMA) Fixed Rate 0.6% | ||||
| FNMA 15 Year, 3.50%, 10/01/25 | United States | 2,504,815 | 2,651,437 | |
| FNMA 15 Year, 4.00%, 12/01/25 | United States | 4,071,091 | 4,363,716 | |
| FNMA 15 Year, 4.50%, 5/01/16 - 6/01/25 | United States | 5,958,692 | 6,312,475 | |
| FNMA 30 Year, 4.50%, 1/01/24 | United States | 158,044 | 171,186 | |
| FNMA 30 Year, 5.00%, 3/01/38 | United States | 99,425 | 110,089 | |
| 13,608,903 | ||||
| aGovernment National Mortgage Association (GNMA) Adjustable | ||||
| Rate 0.0%† | ||||
| GNMA, 1.625%, 4/20/26 - 9/20/26 | United States | 38,052 | 39,309 | |
| Total Mortgage-Backed Securities (Cost $85,597,968) | 86,626,120 | |||
| Municipal Bonds 0.7% | ||||
| Acalanes UHSD, GO, Contra Costa County, Refunding, 1.427%, | ||||
| 8/01/18 | United States | 1,000,000 | 989,250 | |
| Alabama State Public School and College Authority Revenue, Capital | ||||
| Improvement Bonds, Pre-Refunded, 5.00%, 12/01/25 | United States | 1,500,000 | 1,699,620 | |
| Arkansas State GO, Four-Lane Highway Construction and Improvement | ||||
| Bonds, 3.25%, 6/15/22 | United States | 765,000 | 829,857 | |
| aCalifornia State Judgement Trust COP, FRN, 1.583%, 6/01/15 | United States | 540,000 | 531,517 | |
| California State Public Works Board Lease Revenue, Various Capital | ||||
| Projects, Series E, 3.183%, 12/01/14 | United States | 3,035,000 | 3,040,736 | |
| Colorado State ISD, GO, Mitchell and Scurry Counties, School Building, | ||||
| PSF Guarantee, 5.00%, 8/15/43 | United States | 350,000 | 396,718 | |
| Florida State Hurricane Catastrophe Fund Finance Corp. Revenue, | ||||
| Series A, 2.107%, 7/01/18 | United States | 2,000,000 | 2,027,860 | |
| Minnesota State GO, Series C, 2.50%, 8/01/18 | United States | 1,500,000 | 1,553,775 | |
| Puerto Rico Sales Tax FICO Sales Tax Revenue, Refunding, Series A, | ||||
| NATL RE, FGIC Insured, zero cpn., 8/01/45 | United States | 4,305,000 | 569,508 | |
| Rhode Island State and Providence Plantations GO, Consolidated Capital | ||||
| Development Loan of 2012, Refunding, Series A, 5.00%, 8/01/19 | United States | 2,500,000 | 2,931,275 | |
| Riverside County RDA Tax Allocation, Housing, Series A-T, | ||||
| 6.00%, 10/01/15 | United States | 1,075,000 | 1,094,372 | |
| 6.25%, 10/01/16 | United States | 1,140,000 | 1,174,200 | |
| Total Municipal Bonds (Cost $16,401,511) | 16,838,688 | |||
| Shares | ||||
| Escrows and Litigation Trusts (Cost $—) 0.0% | ||||
| k,lNewPage Corp., Litigation Trust | United States | 500,000 | — | |
franklintempleton.com
Annual Report
| 87
FRANKLIN INVESTORS SECURITIES TRUST
STATEMENT OF INVESTMENTS
| Franklin Low Duration Total Return Fund (continued) | |||||
| Notional | |||||
| Counterparty | Amount* | Value | |||
| Options Purchased 0.0%† | |||||
| Calls – Over-the-Counter | |||||
| Credit Default Swaptions 0.0%† | |||||
| Buy protection on CDX.NA.HY.22, Premium Rate 5.00%, Strike Price $106, | |||||
| Expires 12/17/14 | CITI | 10,600,000 | m | $ | 73,290 |
| Buy protection on CDX.NA.HY.22, Premium Rate 5.00%, Strike Price $106, | |||||
| Expires 12/17/14 | FBCO | 5,300,000 | m | 36,645 | |
| Buy protection on CDX.NA.IG.22, Premium Rate 1.00%, Strike Price $80, | |||||
| Expires 12/17/14 | FBCO | 32,000,000 | m | 14,752 | |
| Buy Protection on CDX.NA.IG.23, Premium Rate 1.00%, Strike Price $75, | |||||
| Expires 3/18/15 | FBCO | 35,000,000 | m | 107,240 | |
| 231,927 | |||||
| Currency Options 0.0%† | |||||
| USD/KRW, December Strike Price 1,068 KRW, Expires 12/15/14 | BZWS | 2,100,000 | m | 31,492 | |
| USD/MXN, December Strike Price 13.80 MXN, Expires 12/15/14 | CITI | 1,600,000 | m | 6,090 | |
| USD/MYR, December Strike Price 3.37 MYR, Expires 12/15/14 | CITI | 1,600,000 | m | 5,998 | |
| 43,580 | |||||
| Total Options Purchased (Cost $544,215) | 275,507 | ||||
| Total Investments before Short Term Investments | |||||
| (Cost $1,964,394,061) | 1,966,403,717 | ||||
| Principal | |||||
| Country | Amount* | ||||
| Short Term Investments 15.8% | |||||
| Foreign Government and Agency Securities 0.0%† | |||||
| nBank of Negara Monetary Note, 11/06/14 | Malaysia | 290,000 | MYR | 88,109 | |
| nPhilippine Treasury Bill, 11/05/14 | Philippines | 1,090,000 | PHP | 24,237 | |
| Total Foreign Government and Agency Securities | |||||
| (Cost $116,107) | 112,346 | ||||
| U.S. Government and Agency Securities 10.2% | |||||
| nU.S. Treasury Bills, | |||||
| 11/06/14 | United States | 83,900,000 | 83,900,000 | ||
| 12/04/14 | United States | 50,000,000 | 50,000,100 | ||
| 1/02/15 | United States | 24,750,000 | 24,749,901 | ||
| 1/15/15 | United States | 50,000,000 | 49,999,250 | ||
| 11/20/14 - 2/05/15 | United States | 33,500,000 | 33,499,458 | ||
| Total U.S. Government and Agency Securities | |||||
| (Cost $242,145,103) | 242,148,709 | ||||
| Municipal Bonds 0.3% | |||||
| oUniversity of California Revenues, | |||||
| Series Y-1, Monthly VRDN and Put, 0.652%, 7/01/41 | United States | 7,600,000 | 7,628,880 | ||
| Series Y-2, Monthly VRDN and Put, 0.752%, 7/01/41 | United States | 390,000 | 391,482 | ||
| Total Municipal Bonds (Cost $7,990,000) | 8,020,362 | ||||
| Total Investments before Money Market Funds | |||||
| (Cost $2,214,645,271) | 2,216,685,134 | ||||
88 | Annual Report franklintempleton.com
FRANKLIN INVESTORS SECURITIES TRUST
STATEMENT OF INVESTMENTS
| Franklin Low Duration Total Return Fund (continued) | ||||||
| Country | Shares | Value | ||||
| Short Term Investments (continued) | ||||||
| Money Market Funds (Cost $126,569,007) 5.3% | ||||||
| k,pInstitutional Fiduciary Trust Money Market Portfolio | United States | 126,569,007 | $ | 126,569,007 | ||
| Total Investments (Cost $2,341,214,278) 98.7% | 2,343,254,141 | |||||
| Options Written (0.0)%† | (24,473 | ) | ||||
| Other Assets, less Liabilities 1.3% | 29,809,496 | |||||
| Net Assets 100.0% | $ | 2,373,039,164 | ||||
| Notional | ||||||
| Counterparty | Amount* | |||||
| qOptions Written (0.0)%† | ||||||
| Calls – Over-the-Counter | ||||||
| Currency Options (0.0)%† | ||||||
| USD/KRW, December Strike Price 1,085 KRW, Expires 12/15/14 | CITI | 2,100,000 | m | $ | (17,275 | ) |
| USD/MXN, December Strike Price 14 MXN, Expires 12/15/14 | BZWS | 1,600,000 | m | (3,225 | ) | |
| USD/MYR, December Strike Price 3.4 MYR, Expires 12/15/14 | CITI | 1,600,000 | m | (3,973 | ) | |
| Total Options Written (Premiums received $20,765) | $ | (24,473 | ) | |||
†Rounds to less than 0.1% of net assets.
*The principal/notional amount is stated in U.S. dollars unless otherwise indicated.
aThe coupon rate shown represents the rate at period end.
bSecurity was purchased pursuant to Rule 144A under the Securities Act of 1933 and may be sold in transactions exempt from registration only to qualified institutional buy-
ers or in a public offering registered under the Securities Act of 1933. These securities have been deemed liquid under guidelines approved by the Trust’s Board of Trustees.
At October 31, 2014, the aggregate value of these securities was $350,526,697, representing 14.77% of net assets.
cSecurity was purchased pursuant to Regulation S under the Securities Act of 1933, which exempts from registration securities offered and sold outside of the United States.
Such a security cannot be sold in the United States without either an effective registration statement filed pursuant to the Securities Act of 1933, or pursuant to an exemption
from registration. These securities have been deemed liquid under guidelines approved by the Trust’s Board of Trustees. At October 31, 2014, the aggregate value of these
securities was $43,557,635, representing 1.84% of net assets.
dSee Note 1(i) regarding senior floating rate interests.
eA portion or all of the security purchased on a when-issued or delayed delivery basis. See Note 1(c).
fPrincipal amount is stated in 100 Mexican Peso Units.
gPrincipal amount is stated in 1,000 Brazilian Real Units.
hRedemption price at maturity is adjusted for inflation. See Note 1(k).
iPrincipal amount of security is adjusted for inflation. See Note 1(k).
jThe bond pays interest and/or principal based upon the issuer’s ability to pay, which may be less than the stated interest rate or principal paydown.
kNon-income producing.
lSecurity has been deemed illiquid because it may not be able to be sold within seven days.
mAmount represents notional amount under the terms of the option.
nThe security is traded on a discount basis with no stated coupon rate.
oVariable rate demand notes (VRDNs) are tax-exempt obligations which contain a floating or variable interest rate adjustment formula and an unconditional right of demand
to receive payment of the principal balance plus accrued interest at specified dates. The coupon rate shown represents the rate at period end.
pSee Note 3(f) regarding investments in Institutional Fiduciary Trust Money Market Portfolio.
qSee Note 1(d) regarding written options.
franklintempleton.com Annual Report | 89
FRANKLIN INVESTORS SECURITIES TRUST
STATEMENT OF INVESTMENTS
Franklin Low Duration Total Return Fund (continued)
At October 31, 2014, the fund had the following financial futures contracts outstanding. See Note 1(d).
| Financial Futures Contracts | |||||||||||||
| Number of | Notional Expiration | Unrealized | Unrealized | ||||||||||
| Description | Type | Contracts | Value | Date | Appreciation | Depreciation | |||||||
| Interest Rate Contracts | |||||||||||||
| CME Ultra Long Term U.S. Treasury Bond | Short | 17 | $ | 2,665,813 | 12/19/14 | $ | — | $ | (20,187 | ) | |||
| U.S. Treasury 5 Yr. Note | Short | 360 | 42,994,687 | 12/31/14 | — | (243,408 | ) | ||||||
| U.S. Treasury 10 Yr. Note | Short | 430 | 54,334,531 | 12/19/14 | — | (236,231 | ) | ||||||
| U.S. Treasury 30 Yr. Note | Short | 5 | 705,469 | 12/19/14 | — | (4,427 | ) | ||||||
| Net unrealized appreciation (depreciation) | $ | (504,253 | ) | ||||||||||
| At October 31, 2014, the fund had the following forward exchange contracts outstanding. See Note 1(d). | |||||||||||||
| Forward Exchange Contracts | |||||||||||||
| Contract | Settlement | Unrealized | Unrealized | ||||||||||
| Currency | Counterpartya Type | Quantity | Amount* | Date | Appreciation | Depreciation | |||||||
| Euro | DBAB | Buy | 82,500 | 105,023 | 11/03/14 | $ | — | $ | (1,607 | ) | |||
| Euro | DBAB | Sell | 82,500 | 110,938 | 11/03/14 | 7,522 | — | ||||||
| Japanese Yen | JPHQ | Sell | 55,436,000 | 560,582 | 11/13/14 | 66,584 | — | ||||||
| Euro | MSCO | Sell | 150,590 | 202,662 | 11/17/14 | 13,877 | — | ||||||
| Singapore Dollar | MSCO | Buy | 2,682,949 | 2,152,645 | 11/17/14 | — | (64,347 | ) | |||||
| Euro | DBAB | Sell | 893,017 | 1,210,752 | 11/18/14 | 91,227 | — | ||||||
| Euro | JPHQ | Sell | 2,600,000 | 3,531,032 | 11/18/14 | 271,557 | — | ||||||
| Malaysian Ringgit | DBAB | Buy | 93,480 | 28,686 | 11/19/14 | — | (320 | ) | |||||
| Japanese Yen | JPHQ | Sell | 172,318,944 | 1,727,482 | 11/20/14 | 191,842 | — | ||||||
| Malaysian Ringgit | HSBC | Buy | 48,000 | 14,742 | 11/20/14 | — | (178 | ) | |||||
| Euro | DBAB | Sell | 761,324 | 1,031,595 | 11/28/14 | 77,104 | — | ||||||
| Euro | MSCO | Sell | 827,000 | 1,120,387 | 12/04/14 | 83,514 | — | ||||||
| Japanese Yen | DBAB | Sell | 340,400,000 | 3,306,941 | 12/22/14 | 271,919 | — | ||||||
| Malaysian Ringgit | DBAB | Buy | 134,200 | 40,060 | 1/07/15 | 521 | — | ||||||
| British Pound | DBAB | Sell | 3,387,851 | 5,542,186 | 1/09/15 | 125,222 | — | ||||||
| Canadian Dollar | BZWS | Buy | 789,000 | 713,923 | 1/09/15 | — | (14,973 | ) | |||||
| Canadian Dollar | CITI | Buy | 259,000 | 231,271 | 1/09/15 | — | (1,831 | ) | |||||
| Canadian Dollar | DBAB | Buy | 977,000 | 879,503 | 1/09/15 | — | (14,010 | ) | |||||
| Chilean Peso | BZWS | Buy | 315,400,000 | 544,262 | 1/09/15 | 387 | — | ||||||
| Euro | BZWS | Sell | 140,843 | 193,858 | 1/09/15 | 17,227 | — | ||||||
| Euro | CITI | Sell | 352,000 | 476,992 | 1/09/15 | 35,550 | — | ||||||
| Euro | DBAB | Buy | 2,773,052 | 3,858,979 | 1/09/15 | — | (381,309 | ) | |||||
| Euro | DBAB | Sell | 16,020,696 | 21,778,193 | 1/09/15 | 1,686,722 | — | ||||||
| Euro | JPHQ | Sell | 66,188 | 91,066 | 1/09/15 | 8,060 | — | ||||||
| Japanese Yen | BZWS | Sell | 76,810,000 | 752,083 | 1/09/15 | 67,073 | — | ||||||
| Japanese Yen | CITI | Sell | 153,390,000 | 1,500,496 | 1/09/15 | 132,527 | — | ||||||
| Japanese Yen | DBAB | Buy | 726,784,000 | 6,801,909 | 1/09/15 | — | (320,272 | ) | |||||
| Japanese Yen | DBAB | Sell | 4,894,210,920 | 47,145,998 | 1/09/15 | 3,498,232 | — | ||||||
| Japanese Yen | GSCO | Sell | 51,310,000 | 501,148 | 1/09/15 | 43,553 | — | ||||||
| Japanese Yen | HSBC | Sell | 77,220,000 | 764,577 | 1/09/15 | 75,910 | — | ||||||
| Japanese Yen | JPHQ | Sell | 179,653,000 | 1,766,988 | 1/09/15 | 164,798 | — | ||||||
| Malaysian Ringgit | DBAB | Buy | 462,000 | 136,699 | 1/09/15 | 2,987 | — | ||||||
| Singapore Dollar | DBAB | Buy | 757,560 | 600,523 | 1/09/15 | — | (10,865 | ) | |||||
| Euro | DBAB | Sell | 1,727,000 | 2,251,851 | 2/06/15 | 85,592 | — | ||||||
90 | Annual Report
franklintempleton.com
FRANKLIN INVESTORS SECURITIES TRUST
STATEMENT OF INVESTMENTS
| Franklin Low Duration Total Return Fund (continued) | |||||||||||
| Forward Exchange Contracts (continued) | |||||||||||
| Contract | Settlement | Unrealized | Unrealized | ||||||||
| Currency | Counterpartya Type | Quantity | Amount* | Date | Appreciation | Depreciation | |||||
| British Pound | DBAB | Sell | 1,615,576 | 2,677,252 | 2/09/15 | $ | 94,797 | $ | — | ||
| Canadian Dollar | BZWS | Buy | 165,000 | 147,668 | 2/09/15 | — | (1,615 | ) | |||
| Canadian Dollar | HSBC | Buy | 276,000 | 246,994 | 2/09/15 | — | (2,688 | ) | |||
| Chilean Peso | JPHQ | Buy | 191,826,250 | 327,237 | 2/09/15 | 3,064 | — | ||||
| Euro | DBAB | Sell | 9,451,274 | 13,104,439 | 2/09/15 | 1,249,006 | — | ||||
| Euro | JPHQ | Sell | 923,800 | 1,284,486 | 2/09/15 | 125,695 | — | ||||
| Singapore Dollar | DBAB | Buy | 429,000 | 338,729 | 2/09/15 | — | (4,812 | ) | |||
| Singapore Dollar | HSBC | Buy | 490,000 | 386,934 | 2/09/15 | — | (5,538 | ) | |||
| Singapore Dollar | JPHQ | Buy | 304,000 | 240,085 | 2/09/15 | — | (3,463 | ) | |||
| Canadian Dollar | DBAB | Buy | 1,250,640 | 1,140,055 | 3/09/15 | — | (33,841 | ) | |||
| Chilean Peso | JPHQ | Buy | 29,522,000 | 51,477 | 3/09/15 | — | (768 | ) | |||
| Chilean Peso | MSCO | Buy | 62,760,000 | 111,025 | 3/09/15 | — | (3,224 | ) | |||
| Euro | DBAB | Sell | 18,780,307 | 25,599,186 | 3/09/15 | 2,037,029 | — | ||||
| Euro | GSCO | Sell | 420,000 | 575,631 | 3/09/15 | 48,690 | — | ||||
| Japanese Yen | DBAB | Sell | 557,380,500 | 5,456,175 | 3/09/15 | 482,164 | — | ||||
| Japanese Yen | HSBC | Sell | 99,540,000 | 973,782 | 3/09/15 | 85,497 | — | ||||
| Japanese Yen | JPHQ | Sell | 292,080,000 | 2,856,749 | 3/09/15 | 250,255 | — | ||||
| Japanese Yen | MSCO | Sell | 211,800,000 | 2,085,939 | 3/09/15 | 195,856 | — | ||||
| Singapore Dollar | DBAB | Buy | 6,113,400 | 4,878,059 | 3/09/15 | — | (119,594 | ) | |||
| Singapore Dollar | HSBC | Buy | 369,000 | 295,332 | 3/09/15 | — | (8,115 | ) | |||
| Swedish Krona | DBAB | Buy | 40,000,000 | 4,385,580 | EUR | 3/09/15 | — | (82,566 | ) | ||
| Swiss Franc | DBAB | Buy | 462,938 | 512,099 | 4/16/15 | — | (29,994 | ) | |||
| Swiss Franc | DBAB | Sell | 462,938 | 521,150 | 4/16/15 | 39,045 | — | ||||
| Chilean Peso | CITI | Buy | 47,586,000 | 79,909 | 5/07/15 | 1,402 | — | ||||
| Chilean Peso | MSCO | Buy | 614,647,000 | 1,061,750 | 5/07/15 | — | (11,488 | ) | |||
| Euro | BZWS | Sell | 54,017 | 70,460 | 5/07/15 | 2,660 | — | ||||
| Euro | CITI | Sell | 39,262 | 52,592 | 5/07/15 | 3,312 | — | ||||
| Euro | DBAB | Sell | 30,838,974 | 41,350,565 | 5/07/15 | 2,642,429 | — | ||||
| Euro | HSBC | Sell | 6,000 | 7,685 | 5/07/15 | 154 | — | ||||
| Euro | JPHQ | Sell | 29,904 | 40,071 | 5/07/15 | 2,536 | — | ||||
| Japanese Yen | DBAB | Sell | 305,837,300 | 2,898,636 | 5/07/15 | 167,466 | — | ||||
| Philippine Peso | JPHQ | Buy | 94,860,000 | 2,154,685 | 5/07/15 | — | (53,616 | ) | |||
| Euro | DBAB | Sell | 4,600,000 | 6,061,420 | 6/05/15 | 285,973 | — | ||||
| Chilean Peso | DBAB | Buy | 457,429,000 | 771,967 | 6/18/15 | 6,425 | — | ||||
| Euro | DBAB | Sell | 82,500 | 105,163 | 6/18/15 | 1,568 | — | ||||
| Japanese Yen | DBAB | Sell | 431,200,000 | 4,001,113 | 6/18/15 | 148,192 | — | ||||
| Singapore Dollar | DBAB | Buy | 2,163,000 | 1,700,605 | 6/18/15 | — | (16,922 | ) | |||
| Euro | DBAB | Sell | 82,500 | 110,798 | 11/03/15 | 7,002 | — | ||||
| Euro | DBAB | Sell | 1,727,000 | 2,259,908 | 2/05/16 | 83,911 | — | ||||
| Euro | DBAB | Sell | 2,360,000 | 3,106,468 | 3/01/16 | 131,730 | — | ||||
| Euro | DBAB | Sell | 2,300,000 | 3,021,510 | 4/07/16 | 120,713 | — | ||||
| Euro | DBAB | Sell | 3,300,000 | 4,453,350 | 8/05/16 | 283,462 | — | ||||
| Japanese Yen | JPHQ | Sell | 258,876,041 | 2,538,000 | 9/02/16 | 203,765 | — | ||||
| Euro | DBAB | Buy | 2,082,500 | 2,764,519 | 11/03/16 | — | (129,328 | ) | |||
| Euro | DBAB | Sell | 2,082,500 | 2,795,756 | 11/03/16 | 160,565 | — | ||||
| Unrealized appreciation (depreciation) | 15,883,870 | (1,317,284 | ) | ||||||||
| Net unrealized appreciation (depreciation) | $ | 14,566,586 | |||||||||
| *In U.S. dollars unless otherwise indicated. | |||||||||||
| aMay be comprised of multiple contracts using the same currency and settlement date. | |||||||||||
franklintempleton.com
Annual Report
| 91
FRANKLIN INVESTORS SECURITIES TRUST
STATEMENT OF INVESTMENTS
Franklin Low Duration Total Return Fund (continued)
At October 31, 2014, the fund had the following credit default swap contracts outstanding. See Note 1(d).
| Credit Default Swap Contracts | |||||||||||||||||
| Upfront | |||||||||||||||||
| Periodic | Premiums | ||||||||||||||||
| Counter- | Notional | Payment | Expiration | Paid | Unrealized | Unrealized | Market | ||||||||||
| Description | party | Amounta | Rate | Date (Received) | Appreciation | Depreciation | Value | Ratingb | |||||||||
| OTC Swaps | |||||||||||||||||
| Contracts to Buy Protection | |||||||||||||||||
| Single Name | |||||||||||||||||
| Alcatel-Lucent USA Inc. | GSCO | 10,000,000 | 5.00 | % | 9/20/17 | $ | (864,945 | ) | $ | — | $ | (32,530 | ) | $ | (897,475 | ) | |
| Bank of America Corp. | FBCO | 2,000,000 | 1.00 | % | 9/20/17 | 2,772 | — | (32,756 | ) | (29,984 | ) | ||||||
| Centex Corp. | FBCO | 1,000,000 | 5.00 | % | 6/20/16 | (40,998 | ) | — | (40,112 | ) | (81,110 | ) | |||||
| Centex Corp. | JPHQ | 4,000,000 | 5.00 | % | 6/20/16 | (196,292 | ) | — | (128,145 | ) | (324,437 | ) | |||||
| CIT Group Inc. | MSCO | 5,000,000 | 5.00 | % | 9/20/17 | (473,845 | ) | — | (109,201 | ) | (583,046 | ) | |||||
| Constellation Brands Inc. | DBAB | 6,600,000 | 5.00 | % | 6/20/17 | (630,789 | ) | — | (128,270 | ) | (759,059 | ) | |||||
| Constellation Brands Inc. | GSCO | 5,000,000 | 5.00 | % | 12/20/14 | (29,873 | ) | — | (2,551 | ) | (32,424 | ) | |||||
| D.R. Horton Inc. | CITI | 1,500,000 | 5.00 | % | 6/20/17 | (108,032 | ) | — | (61,142 | ) | (169,174 | ) | |||||
| D.R. Horton Inc. | JPHQ | 2,400,000 | 5.00 | % | 3/20/16 | (128,487 | ) | — | (27,572 | ) | (156,059 | ) | |||||
| Dean Foods Co. | DBAB | 4,255,000 | 5.00 | % | 6/20/16 | (225,161 | ) | — | (43,158 | ) | (268,319 | ) | |||||
| Dean Foods Co. | JPHQ | 2,609,000 | 5.00 | % | 6/20/16 | (126,562 | ) | — | (37,960 | ) | (164,522 | ) | |||||
| Dell Inc. | GSCO | 1,500,000 | 1.00 | % | 9/20/15 | (7,388 | ) | — | (874 | ) | (8,262 | ) | |||||
| Dell Inc. | GSCO | 5,000,000 | 5.00 | % | 6/20/16 | (339,749 | ) | — | (24,900 | ) | (364,649 | ) | |||||
| DISH DBS Corp. | BZWS | 3,500,000 | 5.00 | % | 3/20/16 | (209,487 | ) | — | (3,082 | ) | (212,569 | ) | |||||
| DISH DBS Corp. | JPHQ | 2,000,000 | 5.00 | % | 3/20/16 | (107,949 | ) | — | (13,518 | ) | (121,467 | ) | |||||
| DPL Inc. | JPHQ | 1,049,000 | 5.00 | % | 12/20/16 | (85,399 | ) | 5,250 | — | (80,149 | ) | ||||||
| Embarq Corp. | BZWS | 3,000,000 | 5.00 | % | 6/20/16 | (126,917 | ) | — | (108,903 | ) | (235,820 | ) | |||||
| First Data Corp. | BZWS | 2,450,000 | 5.00 | % | 3/20/15 | (22,983 | ) | — | (19,960 | ) | (42,943 | ) | |||||
| First Data Corp. | DBAB | 650,000 | 5.00 | % | 3/20/15 | (6,019 | ) | — | (5,374 | ) | (11,393 | ) | |||||
| Ford Motor Credit Co. LLC | GSCO | 5,000,000 | 5.00 | % | 6/20/15 | (140,475 | ) | — | (14,769 | ) | (155,244 | ) | |||||
| Government of Ireland | MSCO | 2,000,000 EUR 1.00 | % | 3/20/15 | 64,998 | — | (72,766 | ) | (7,768 | ) | |||||||
| Hospitality Properties Trust | BOFA | 3,000,000 | 5.00 | % | 3/20/17 | (276,457 | ) | — | (40,714 | ) | (317,171 | ) | |||||
| International Lease Finance | |||||||||||||||||
| Corp. | DBAB | 8,325,000 | 5.00 | % | 9/20/15 | (318,515 | ) | 8,878 | — | (309,637 | ) | ||||||
| Kinder Morgan Inc. | GSCO | 8,500,000 | 5.00 | % | 3/20/16 | (514,332 | ) | — | (48,923 | ) | (563,255 | ) | |||||
| Lennar Corp. | CITI | 1,800,000 | 5.00 | % | 9/20/19 | (198,481 | ) | — | (76,467 | ) | (274,948 | ) | |||||
| Lennar Corp. | CITI | 2,700,000 | 5.00 | % | 12/20/19 | (350,468 | ) | — | (68,893 | ) | (419,361 | ) | |||||
| The New York Times Co. | GSCO | 2,000,000 | 5.00 | % | 12/20/16 | (73,955 | ) | — | (124,314 | ) | (198,269 | ) | |||||
| Pactiv LLC | BZWS | 2,100,000 | 5.00 | % | 6/20/17 | (131,853 | ) | — | (65,506 | ) | (197,359 | ) | |||||
| PPL Energy Supply LLC | JPHQ | 8,000,000 | 5.00 | % | 6/20/16 | (559,401 | ) | — | (14,865 | ) | (574,266 | ) | |||||
| Springleaf Finance Corp. | GSCO | 7,000,000 | 5.00 | % | 12/20/15 | (135,240 | ) | — | (191,272 | ) | (326,512 | ) | |||||
| Tenet Healthcare Corp | BZWS | 5,600,000 | 5.00 | % | 12/20/16 | (362,301 | ) | — | (129,425 | ) | (491,726 | ) | |||||
| USG Corp. | GSCO | 9,220,000 | 5.00 | % | 12/20/16 | (528,196 | ) | — | (178,374 | ) | (706,570 | ) | |||||
| Contracts to Sell Protectionc | |||||||||||||||||
| Single Name | |||||||||||||||||
| Anadarko Petroleum Corp. | BZWS | 4,300,000 | 1.00 | % | 9/20/19 | 98,725 | — | (69,911 | ) | 28,814 | BBB | ||||||
| Bank of America Corp. | FBCO | 2,000,000 | 1.00 | % | 9/20/17 | (2,772 | ) | 33,530 | — | 30,758 | A- | ||||||
| Beazer Homes USA Inc. | CITI | 1,800,000 | 5.00 | % | 9/20/19 | 35,830 | 16,436 | — | 52,266 | CCC | |||||||
| Beazer Homes USA Inc. | CITI | 2,700,000 | 5.00 | % | 12/20/19 | 79,083 | — | (21,456 | ) | 57,627 | CCC | ||||||
| Berkshire Hathaway Inc. | BOFA | 2,700,000 | 1.00 | % | 9/20/15 | 11,963 | 10,013 | — | 21,976 | AA | |||||||
| Berkshire Hathaway Inc. | BZWS | 5,000,000 | 1.00 | % | 9/20/17 | (42,557 | ) | 138,919 | — | 96,362 | AA | ||||||
| Berkshire Hathaway Inc. | GSCO | 1,400,000 | 1.00 | % | 9/20/17 | (388 | ) | 27,369 | — | 26,981 | AA | ||||||
| First Data Corp. | BZWS | 2,600,000 | 5.00 | % | 3/20/16 | 21,208 | 131,833 | — | 153,041 | B- | |||||||
| First Data Corp. | DBAB | 500,000 | 5.00 | % | 3/20/16 | (1,221 | ) | 30,652 | — | 29,431 | B- | ||||||
| Ford Motor Credit Co. LLC | BZWS | 4,000,000 | 5.00 | % | 3/20/19 | 692,282 | 2,269 | — | 694,551 | BBB- | |||||||
| 92 | Annual Report | franklintempleton.com | ||||||||||||||||
| FRANKLIN INVESTORS SECURITIES TRUST | ||||||||||||||||||
| STATEMENT OF INVESTMENTS | ||||||||||||||||||
| Franklin Low Duration Total Return Fund (continued) | ||||||||||||||||||
| Credit Default Swap Contracts (continued) | ||||||||||||||||||
| Upfront | ||||||||||||||||||
| Periodic | Premiums | |||||||||||||||||
| Counter- | Notional | Payment | Expiration | Paid | Unrealized | Unrealized | Market | |||||||||||
| Description | party | Amounta | Rate | Date | (Received) | Appreciation | Depreciation | Value | Ratingb | |||||||||
| OTC Swaps (continued) | ||||||||||||||||||
| Contracts to Sell Protectionc (continued) | ||||||||||||||||||
| Single Name (continued) | ||||||||||||||||||
| Government of Lithuania | FBCO | 250,000 | 1.00 | % | 6/20/16 | $ | (3,675 | ) | $ | 6,184 | $ | — | $ | 2,509 | BBB | |||
| Government of Portugal | DBAB | 3,700,000 | 1.00 | % | 9/20/19 | (195,510 | ) | 62,722 | — | (132,788 | ) | NR | ||||||
| Government of Portugal | JPHQ | 5,300,000 | 1.00 | % | 9/20/19 | (246,727 | ) | 56,516 | — | (190,211 | ) | NR | ||||||
| PSEG Power LLC | JPHQ | 5,500,000 | 1.00 | % | 6/20/19 | (19,141 | ) | 39,253 | — | 20,112 | BBB+ | |||||||
| PSEG Power LLC | JPHQ | 2,100,000 | 1.00 | % | 9/20/19 | (16,276 | ) | 18,597 | — | 2,321 | BBB+ | |||||||
| Tate & Lyle International Finance | ||||||||||||||||||
| PLC | CITI | 3,000,000 EUR 1.00% | 9/20/19 | 64,223 | — | (44,587 | ) | 19,636 | BBB | |||||||||
| Tenet Healthcare Corp. | BZWS | 4,000,000 | 5.00 | % | 12/20/18 | 222,016 | 245,472 | — | 467,488 | CCC+ | ||||||||
| Traded Index | ||||||||||||||||||
| CMBX.NA.AM.2 | FBCO | 8,000,000 | 0.50 | % | 3/15/49 | (112,362 | ) | 27,468 | — | (84,894 | ) | Investment | ||||||
| Grade | ||||||||||||||||||
| LCDX.NA.21 | FBCO | 1,287,000 | 2.50 | % | 12/20/18 | 41,048 | 9,867 | — | 50,915 | Non | ||||||||
| Investment | ||||||||||||||||||
| Grade | ||||||||||||||||||
| MCDX.NA.21 | CITI | 4,350,000 | 1.00 | % | 12/20/18 | (67,879 | ) | 58,142 | — | (9,737 | ) | Investment | ||||||
| Grade | ||||||||||||||||||
| MCDX.NA.23 | CITI | 4,500,000 | 1.00 | % | 12/20/19 | 30,516 | 21,007 | — | 51,523 | Investment | ||||||||
| Grade | ||||||||||||||||||
| OTC Swaps unrealized appreciation (depreciation) | 950,377 | (1,982,250 | ) | |||||||||||||||
| Net unrealized appreciation (depreciation) | $ | (1,031,873 | ) | |||||||||||||||
aIn U.S. dollars unless otherwise indicated. For contracts to sell protection, the notional amount is equal to the maximum potential amount of the future payments and no
recourse provisions have been entered into in association with the contracts.
bBased on Standard and Poor’s (S&P) Rating for single name swaps and internal ratings for index swaps. Internal ratings based on mapping into equivalent ratings from
external vendors.
cThe fund enters contracts to sell protection to create a long credit position. Performance triggers include default, bankruptcy or restructuring for single name swaps, and
failure to pay or bankruptcy of the underlying securities for traded index swaps.
franklintempleton.com
Annual Report
| 93
FRANKLIN INVESTORS SECURITIES TRUST
STATEMENT OF INVESTMENTS
Franklin Low Duration Total Return Fund (continued)
At October 31, 2014, the fund had the following cross-currency swap contracts outstanding. See Note 1(d).
| Cross-Currency Swap Contracts | ||||||||
| Expiration | Notional | Unrealized | Unrealized | |||||
| Description | Counterparty | Date | Amount | Appreciation | Depreciation | |||
| Receive Fixed semi-annual 4.50% | CITI | 1/01/16 | 2,747,819 | USD | $ | 56,314 | $ | — |
| Pay Fixed annual 4.00% | 16,000,000 | DKK | ||||||
| Receive Fixed semi-annual 2.47% | DBAB | 1/04/16 | 2,953,953 | USD | 92,912 | — | ||
| Pay Fixed annual 2.00% | 17,000,000 | DKK | ||||||
| Receive Float quarterly 3-month USD BBA | ||||||||
| LIBOR + 2.18% | CITI | 10/13/17 | 3,922,448 | USD | 281,212 | — | ||
| Pay Fixed annual 2.125% | 3,500,000 | CHF | ||||||
| Net unrealized appreciation (depreciation) | $ | 430,438 | ||||||
| See Note 10 regarding other derivative information. |
See Abbreviations on page 151.
94 | Annual Report | The accompanying notes are an integral part of these financial statements. franklintempleton.com
| FRANKLIN INVESTORS SECURITIES TRUST | |||||||||||||||
| Financial Highlights | |||||||||||||||
| Franklin Total Return Fund | |||||||||||||||
| Year Ended October 31, | |||||||||||||||
| 2014 | 2013 | 2012 | 2011 | 2010 | |||||||||||
| Class A | |||||||||||||||
| Per share operating performance | |||||||||||||||
| (for a share outstanding throughout the year) | |||||||||||||||
| Net asset value, beginning of year | $ | 10.05 | $ | 10.53 | $ | 10.32 | $ | 10.33 | $ | 9.65 | |||||
| Income from investment operationsa: | |||||||||||||||
| Net investment income | 0.257 | 0.236 | 0.297 | 0.353 | 0.401 | ||||||||||
| Net realized and unrealized gains (losses) | 0.214 | (0.205 | ) | 0.472 | 0.074 | 0.710 | |||||||||
| Total from investment operations | 0.471 | 0.031 | 0.769 | 0.427 | 1.111 | ||||||||||
| Less distributions from: | |||||||||||||||
| Net investment income and net foreign currency gains | (0.341 | ) | (0.351 | ) | (0.447 | ) | (0.380 | ) | (0.431 | ) | |||||
| Net realized gains | — | (0.160 | ) | (0.112 | ) | (0.057 | ) | — | |||||||
| Total distributions | (0.341 | ) | (0.511 | ) | (0.559 | ) | (0.437 | ) | (0.431 | ) | |||||
| Net asset value, end of year | $ | 10.18 | $ | 10.05 | $ | 10.53 | $ | 10.32 | $ | 10.33 | |||||
| Total returnb | 4.80 | % | 0.30 | % | 7.74 | % | 4.26 | % | 11.81 | % | |||||
| Ratios to average net assets | |||||||||||||||
| Expenses before waiver and payments by affiliates | 0.93 | % | 0.91 | % | 0.92 | % | 0.93 | % | 0.95 | % | |||||
| Expenses net of waiver and payments by affiliates | 0.88 | %c | 0.88 | %c | 0.88 | % | 0.88 | %c | 0.87 | %c | |||||
| Net investment income | 2.46 | % | 2.36 | % | 2.69 | % | 3.45 | % | 4.14 | % | |||||
| Supplemental data | |||||||||||||||
| Net assets, end of year (000’s) | $ | 3,213,446 | $ | 3,019,228 | $ | 3,134,211 | $ | 2,245,312 | $ | 1,867,411 | |||||
| Portfolio turnover rate | 273.96 | % | 371.54 | % | 314.62 | % | 255.55 | % | 131.91 | % | |||||
| Portfolio turnover rate excluding mortgage dollar rollsd | 85.03 | % | 156.49 | % | 122.04 | % | 98.96 | % | 53.26 | % | |||||
aThe amount shown for a share outstanding throughout the period may not correlate with the Statement of Operations for the period due to the timing of sales and
repurchases of the Fund shares in relation to income earned and/or fluctuating fair value of the investments of the Fund.
bTotal return does not reflect sales commissions or contingent deferred sales charges, if applicable.
cBenefit of expense reduction rounds to less than 0.01%.
dSee Note 1(h) regarding mortgage dollar rolls.
franklintempleton.com The accompanying notes are an integral part of these financial statements. | Annual Report | 95
FRANKLIN INVESTORS SECURITIES TRUST
FINANCIAL HIGHLIGHTS
| Franklin Total Return Fund (continued) | |||||||||||||||
| Year Ended October 31, | |||||||||||||||
| 2014 | 2013 | 2012 | 2011 | 2010 | |||||||||||
| Class C | |||||||||||||||
| Per share operating performance | |||||||||||||||
| (for a share outstanding throughout the year) | |||||||||||||||
| Net asset value, beginning of year | $ | 10.03 | $ | 10.51 | $ | 10.31 | $ | 10.32 | $ | 9.65 | |||||
| Income from investment operationsa: | |||||||||||||||
| Net investment income | 0.201 | 0.174 | 0.253 | 0.313 | 0.357 | ||||||||||
| Net realized and unrealized gains (losses) | 0.232 | (0.182 | ) | 0.467 | 0.076 | 0.706 | |||||||||
| Total from investment operations | 0.433 | (0.008 | ) | 0.720 | 0.389 | 1.063 | |||||||||
| Less distributions from: | |||||||||||||||
| Net investment income and net foreign currency gains | (0.303 | ) | (0.312 | ) | (0.408 | ) | (0.342 | ) | (0.393 | ) | |||||
| Net realized gains | — | (0.160 | ) | (0.112 | ) | (0.057 | ) | — | |||||||
| Total distributions | (0.303 | ) | (0.472 | ) | (0.520 | ) | (0.399 | ) | (0.393 | ) | |||||
| Net asset value, end of year | $ | 10.16 | $ | 10.03 | $ | 10.51 | $ | 10.31 | $ | 10.32 | |||||
| Total returnb | 4.42 | % | (0.08 | )% | 7.25 | % | 3.88 | % | 11.40 | % | |||||
| Ratios to average net assets | |||||||||||||||
| Expenses before waiver and payments by affiliates | 1.33 | % | 1.31 | % | 1.32 | % | 1.33 | % | 1.35 | % | |||||
| Expenses net of waiver and payments by affiliates | 1.28 | %c | 1.28 | %c | 1.28 | % | 1.28 | %c | 1.27 | %c | |||||
| Net investment income | 2.06 | % | 1.96 | % | 2.29 | % | 3.05 | % | 3.74 | % | |||||
| Supplemental data | |||||||||||||||
| Net assets, end of year (000’s) | $ | 432,767 | $ | 455,720 | $ | 571,206 | $ | 394,777 | $ | 366,888 | |||||
| Portfolio turnover rate | 273.96 | % | 371.54 | % | 314.62 | % | 255.55 | % | 131.91 | % | |||||
| Portfolio turnover rate excluding mortgage dollar rollsd | 85.03 | % | 156.49 | % | 122.04 | % | 98.96 | % | 53.26 | % | |||||
aThe amount shown for a share outstanding throughout the period may not correlate with the Statement of Operations for the period due to the timing of sales and
repurchases of the Fund shares in relation to income earned and/or fluctuating fair value of the investments of the Fund.
bTotal return does not reflect sales commissions or contingent deferred sales charges, if applicable.
cBenefit of expense reduction rounds to less than 0.01%.
dSee Note 1(h) regarding mortgage dollar rolls.
96 | Annual Report | The accompanying notes are an integral part of these financial statements. franklintempleton.com
FRANKLIN INVESTORS SECURITIES TRUST
FINANCIAL HIGHLIGHTS
| Franklin Total Return Fund (continued) | |||||||||||||||
| Year Ended October 31, | |||||||||||||||
| 2014 | 2013 | 2012 | 2011 | 2010 | |||||||||||
| Class R | |||||||||||||||
| Per share operating performance | |||||||||||||||
| (for a share outstanding throughout the year) | |||||||||||||||
| Net asset value, beginning of year | $ | 10.04 | $ | 10.52 | $ | 10.32 | $ | 10.33 | $ | 9.65 | |||||
| Income from investment operationsa: | |||||||||||||||
| Net investment income | 0.209 | 0.204 | 0.255 | 0.330 | 0.390 | ||||||||||
| Net realized and unrealized gains (losses) | 0.238 | (0.197 | ) | 0.480 | 0.073 | 0.698 | |||||||||
| Total from investment operations | 0.447 | 0.007 | 0.735 | 0.403 | 1.088 | ||||||||||
| Less distributions from: | |||||||||||||||
| Net investment income and net foreign currency gains | (0.317 | ) | (0.327 | ) | (0.423 | ) | (0.356 | ) | (0.408 | ) | |||||
| Net realized gains | — | (0.160 | ) | (0.112 | ) | (0.057 | ) | — | |||||||
| Total distributions | (0.317 | ) | (0.487 | ) | (0.535 | ) | (0.413 | ) | (0.408 | ) | |||||
| Net asset value, end of year | $ | 10.17 | $ | 10.04 | $ | 10.52 | $ | 10.32 | $ | 10.33 | |||||
| Total return | 4.56 | % | 0.06 | % | 7.39 | % | 4.02 | % | 11.55 | % | |||||
| Ratios to average net assets | |||||||||||||||
| Expenses before waiver and payments by affiliates | 1.18 | % | 1.16 | % | 1.17 | % | 1.18 | % | 1.20 | % | |||||
| Expenses net of waiver and payments by affiliates | 1.13 | %b | 1.13 | %b | 1.13 | % | 1.13 | %b | 1.12 | %b | |||||
| Net investment income | 2.21 | % | 2.11 | % | 2.44 | % | 3.20 | % | 3.89 | % | |||||
| Supplemental data | |||||||||||||||
| Net assets, end of year (000’s) | $ | 59,307 | $ | 65,601 | $ | 87,235 | $ | 84,708 | $ | 86,750 | |||||
| Portfolio turnover rate | 273.96 | % | 371.54 | % | 314.62 | % | 255.55 | % | 131.91 | % | |||||
| Portfolio turnover rate excluding mortgage dollar rollsc | 85.03 | % | 156.49 | % | 122.04 | % | 98.96 | % | 53.26 | % | |||||
aThe amount shown for a share outstanding throughout the period may not correlate with the Statement of Operations for the period due to the timing of sales and
repurchases of the Fund shares in relation to income earned and/or fluctuating fair value of the investments of the Fund.
bBenefit of expense reduction rounds to less than 0.01%.
cSee Note 1(h) regarding mortgage dollar rolls.
franklintempleton.com The accompanying notes are an integral part of these financial statements. | Annual Report | 97
FRANKLIN INVESTORS SECURITIES TRUST
FINANCIAL HIGHLIGHTS
| Franklin Total Return Fund (continued) | ||||||
| Year Ended | ||||||
| October 31, | ||||||
| 2014 | 2013a | |||||
| Class R6 | ||||||
| Per share operating performance | ||||||
| (for a share outstanding throughout the year) | ||||||
| Net asset value, beginning of year | $ | 10.07 | $ | 10.44 | ||
| Income from investment operationsb: | ||||||
| Net investment income | 0.317 | c | 0.145 | |||
| Net realized and unrealized gains (losses) | 0.191 | (0.348 | ) | |||
| Total from investment operations | 0.508 | (0.203 | ) | |||
| Less distributions from net investment income and net foreign currency gains | (0.378 | ) | (0.167 | ) | ||
| Net asset value, end of year | $ | 10.20 | $ | 10.07 | ||
| Total returnd | 5.18 | % | (1.92 | )% | ||
| Ratios to average net assetse | ||||||
| Expenses before waiver and payments by affiliates | 0.50 | % | 0.50 | % | ||
| Expenses net of waiver and payments by affiliatesf | 0.48 | % | 0.49 | % | ||
| Net investment income | 2.86 | % | 2.75 | % | ||
| Supplemental data | ||||||
| Net assets, end of year (000’s) | $ | 26,123 | $ | 329,806 | ||
| Portfolio turnover rate | 273.96 | % | 371.54 | % | ||
| Portfolio turnover rate excluding mortgage dollar rollsg | 85.03 | % | 156.49 | % | ||
aFor the period May 1, 2013 (effective date) to October 31, 2013.
bThe amount shown for a share outstanding throughout the period may not correlate with the Statement of Operations for the period due to the timing of sales and
repurchases of the Fund shares in relation to income earned and/or fluctuating fair value of the investments of the Fund.
cBased on average daily shares outstanding.
dTotal return is not annualized for periods less than one year.
eRatios are annualized for periods less than one year.
fBenefit of expenses reduction rounds to less than 0.01%.
gSee Note 1(h) regarding mortgage dollar rolls.
98 | Annual Report | The accompanying notes are an integral part of these financial statements. franklintempleton.com
FRANKLIN INVESTORS SECURITIES TRUST
FINANCIAL HIGHLIGHTS
| Franklin Total Return Fund (continued) | |||||||||||||||
| Year Ended October 31, | |||||||||||||||
| 2014 | 2013 | 2012 | 2011 | 2010 | |||||||||||
| Advisor Class | |||||||||||||||
| Per share operating performance | |||||||||||||||
| (for a share outstanding throughout the year) | |||||||||||||||
| Net asset value, beginning of year | $ | 10.07 | $ | 10.55 | $ | 10.34 | $ | 10.35 | $ | 9.67 | |||||
| Income from investment operationsa: | |||||||||||||||
| Net investment income | 0.288 | 0.242 | 0.319 | 0.380 | 0.431 | ||||||||||
| Net realized and unrealized gains (losses) | 0.206 | (0.186 | ) | 0.474 | 0.071 | 0.705 | |||||||||
| Total from investment operations | 0.494 | 0.056 | 0.793 | 0.451 | 1.136 | ||||||||||
| Less distributions from: | |||||||||||||||
| Net investment income and net foreign currency gains | (0.364 | ) | (0.376 | ) | (0.471 | ) | (0.404 | ) | (0.456 | ) | |||||
| Net realized gains | — | (0.160 | ) | (0.112 | ) | (0.057 | ) | — | |||||||
| Total distributions | (0.364 | ) | (0.536 | ) | (0.583 | ) | (0.461 | ) | (0.456 | ) | |||||
| Net asset value, end of year | $ | 10.20 | $ | 10.07 | $ | 10.55 | $ | 10.34 | $ | 10.35 | |||||
| Total return | 5.03 | % | 0.54 | % | 7.98 | % | 4.50 | % | 12.17 | % | |||||
| Ratios to average net assets | |||||||||||||||
| Expenses before waiver and payments by affiliates | 0.68 | % | 0.66 | % | 0.67 | % | 0.68 | % | 0.70 | % | |||||
| Expenses net of waiver and payments by affiliates | 0.63 | %b | 0.63 | %b | 0.63 | % | 0.63 | %b | 0.62 | %b | |||||
| Net investment income | 2.71 | % | 2.61 | % | 2.94 | % | 3.70 | % | 4.39 | % | |||||
| Supplemental data | |||||||||||||||
| Net assets, end of year (000’s) | $ | 1,281,151 | $ | 1,148,451 | $ | 1,482,994 | $ | 1,158,243 | $ | 972,218 | |||||
| Portfolio turnover rate | 273.96 | % | 371.54 | % | 314.62 | % | 255.55 | % | 131.91 | % | |||||
| Portfolio turnover rate excluding mortgage dollar rollsc | 85.03 | % | 156.49 | % | 122.04 | % | 98.96 | % | 53.26 | % | |||||
aThe amount shown for a share outstanding throughout the period may not correlate with the Statement of Operations for the period due to the timing of sales and
repurchases of the Fund shares in relation to income earned and/or fluctuating fair value of the investments of the Fund.
bBenefit of expense reduction rounds to less than 0.01%.
cSee Note 1(h) regarding mortgage dollar rolls.
franklintempleton.com The accompanying notes are an integral part of these financial statements. | Annual Report | 99
| FRANKLIN INVESTORS SECURITIES TRUST | |||||
| Statement of Investments, October 31, 2014 | |||||
| Franklin Total Return Fund | |||||
| Shares/Units/ | |||||
| Country | Warrants | Value | |||
| Common Stocks and Other Equity Interests 2.3% | |||||
| Automobiles & Components 0.0%† | |||||
| General Motors Co. | United States | 4,667 | $ | 146,544 | |
| aGeneral Motors Co., wts., 7/10/16 | United States | 4,244 | 91,967 | ||
| aGeneral Motors Co., wts., 7/10/19 | United States | 4,244 | 60,562 | ||
| 299,073 | |||||
| Consumer Services 0.1% | |||||
| a,b,cTurtle Bay Resort | United States | 1,550,568 | 2,093,266 | ||
| Diversified Financials 2.2% | |||||
| PowerShares Senior Loan Portfolio, ETF | United States | 4,520,000 | 110,197,600 | ||
| Materials 0.0%† | |||||
| NewPage Holdings Inc. | United States | 5,000 | 460,000 | ||
| Total Common Stocks and Other Equity Interests | |||||
| (Cost $114,724,293) | 113,049,939 | ||||
| Preferred Stocks 0.4% | |||||
| Banks 0.3% | |||||
| U.S. Bancorp, 6.00%, pfd., G | United States | 640,000 | 17,318,400 | ||
| Diversified Financials 0.1% | |||||
| Citigroup Capital XIII, 8.75%, pfd. | United States | 93,000 | 2,475,660 | ||
| Total Preferred Stocks (Cost $18,325,000) | 19,794,060 | ||||
| Principal | |||||
| Amount* | |||||
| Corporate Bonds 34.2% | |||||
| Automobiles & Components 0.5% | |||||
| Ford Motor Credit Co. LLC, senior note, | |||||
| 1.684%, 9/08/17 | United States | 9,200,000 | 9,163,292 | ||
| 5.00%, 5/15/18 | United States | 3,000,000 | 3,281,085 | ||
| 8.125%, 1/15/20 | United States | 5,000,000 | 6,255,545 | ||
| 5.75%, 2/01/21 | United States | 1,000,000 | 1,145,544 | ||
| 5.875%, 8/02/21 | United States | 1,175,000 | 1,359,529 | ||
| dHyundai Capital America, senior note, 144A, 4.00%, 6/08/17 | South Korea | 4,400,000 | 4,658,324 | ||
| 25,863,319 | |||||
| Banks 7.4% | |||||
| eBanca Monte Dei Paschi Di Siena SpA, secured note, Reg S, 2.875%, | |||||
| 4/16/21 | Italy | 9,600,000 | EUR | 13,145,504 | |
| Banco Comercial Portugues SA, 4.75%, 6/22/17 | Portugal | 5,400,000 | EUR | 7,434,892 | |
| dBanco do Brasil SA/Cayman, sub. note, 144A, 5.875%, 1/26/22 | Brazil | 8,500,000 | 8,745,183 | ||
| eBanco Popolare Societa Cooperativa, senior note, Reg S, 4.75%, | |||||
| 3/31/16 | Italy | 9,700,000 | EUR | 12,901,800 | |
| Banco Santander Totta SA, secured note, 1.50%, 4/03/17 | Portugal | 3,000,000 | EUR | 3,850,752 | |
| Bank of America Corp., | |||||
| fjunior sub. bond, M, 8.125% to 5/15/18, FRN thereafter, Perpetual | United States | 6,000,000 | 6,540,000 | ||
| senior note, 4.75%, 8/01/15 | United States | 8,000,000 | 8,230,688 | ||
| senior note, 5.625%, 10/14/16 | United States | 8,400,000 | 9,141,560 | ||
| Bank of Ireland Mortgage Bank, secured note, 2.75%, 3/22/18 | Ireland | 4,800,000 | EUR | 6,491,074 | |
| eBarclays Bank PLC, senior sub. note, Reg S, 6.00%, 1/14/21 | United Kingdom | 8,000,000 | EUR | 12,111,015 | |
| Barclays PLC, sub. note, 4.375%, 9/11/24 | United Kingdom | 500,000 | 485,938 | ||
| BB&T Corp., sub. bond, 5.25%, 11/01/19 | United States | 6,800,000 | 7,677,547 | ||
| 100 | Annual Report | franklintempleton.com | ||||
FRANKLIN INVESTORS SECURITIES TRUST
STATEMENT OF INVESTMENTS
| Franklin Total Return Fund (continued) | |||||
| Principal | |||||
| Country | Amount* | Value | |||
| Corporate Bonds (continued) | |||||
| Banks (continued) | |||||
| dBPCE SA, sub. bond, 144A, 4.50%, 3/15/25 | France | 12,500,000 | $ | 12,172,312 | |
| CIT Group Inc., senior note, 5.00%, | |||||
| 5/15/17 | United States | 22,500,000 | 23,625,000 | ||
| 8/15/22 | United States | 6,000,000 | 6,300,000 | ||
| Citigroup Inc., | |||||
| senior note, 8.125%, 7/15/39 | United States | 4,400,000 | 6,643,586 | ||
| sub. note, 3.50%, 5/15/23 | United States | 20,000,000 | 19,594,400 | ||
| Depfa ACS Bank, secured bond, 1.65%, 12/20/16 | Ireland | 520,000,000 | JPY | 4,712,174 | |
| Discover Bank, sub. note, 8.70%, 11/18/19 | United States | 948,000 | 1,178,561 | ||
| dHSBC Bank Brasil SA, senior note, 144A, 4.00%, 5/11/16 | Brazil | 7,500,000 | 7,752,863 | ||
| HSBC Holdings PLC, | |||||
| fjunior sub. bond, 5.625% to 1/17/20, FRN thereafter, Perpetual | United Kingdom | 9,500,000 | 9,653,805 | ||
| sub. note, 6.50%, 9/15/37 | United Kingdom | 3,000,000 | 3,763,497 | ||
| eHSBK (Europe) BV, senior note, Reg S, 7.25%, 5/03/17 | Kazakhstan | 3,850,000 | 4,096,419 | ||
| Intesa Sanpaolo SpA, | |||||
| senior note, 2.375%, 1/13/17 | Italy | 24,500,000 | 24,800,492 | ||
| dsub. note, 144A, 5.017%, 6/26/24 | Italy | 9,750,000 | 9,530,625 | ||
| JPMorgan Chase & Co., | |||||
| fjunior sub. bond, V, 5.00% to 7/30/19, FRN thereafter, Perpetual | United States | 6,500,000 | 6,426,875 | ||
| fjunior sub. note, X, 6.10% to 10/01/24, FRN thereafter, Perpetual | United States | 10,400,000 | 10,452,000 | ||
| senior note, 4.25%, 10/15/20 | United States | 9,000,000 | 9,667,269 | ||
| senior note, 3.25%, 9/23/22 | United States | 11,400,000 | 11,431,042 | ||
| JPMorgan Chase Bank NA, sub. note, 6.00%, 10/01/17 | United States | 3,000,000 | 3,358,842 | ||
| Merrill Lynch & Co. Inc., senior note, 6.875%, 4/25/18 | United States | 12,000,000 | 13,892,172 | ||
| dMizuho Financial Group Cayman 3 Ltd., sub. note, 144A, 4.60%, | |||||
| 3/27/24 | Japan | 8,700,000 | 9,095,024 | ||
| dOversea-Chinese Banking Corp. Ltd., 144A, sub. bond, 4.00% to 10/14/19, | |||||
| FRN thereafter, 10/15/24 | Singapore | 9,300,000 | 9,477,770 | ||
| Regions Financial Corp., senior note, 7.75%, 11/10/14 | United States | 1,269,000 | 1,270,294 | ||
| Royal Bank of Scotland Group PLC, sub. note, 6.125%, 12/15/22 | United Kingdom | 1,100,000 | 1,193,500 | ||
| The Royal Bank of Scotland PLC, sub. note, 6.934%, 4/09/18 | United Kingdom | 4,000,000 | EUR | 5,728,495 | |
| dShinhan Bank, senior note, 144A, 1.875%, 7/30/18 | South Korea | 10,000,000 | 9,891,200 | ||
| SVB Financial Group, senior note, 5.375%, 9/15/20 | United States | 6,000,000 | 6,778,146 | ||
| gUniCredit SpA, senior note, 6.00% to 10/30/14, FRN thereafter, | |||||
| 10/31/17 | Italy | 9,500,000 | EUR | 12,185,414 | |
| f,gWachovia Capital Trust III, junior sub. bond, FRN, 5.57%, Perpetual | United States | 15,600,000 | 15,171,000 | ||
| Wells Fargo & Co., | |||||
| fjunior sub. bond, S, 5.90% to 6/15/24, FRN thereafter, Perpetual | United States | 5,500,000 | 5,668,300 | ||
| hsub. bond, 4.65%, 11/04/44 | United States | 10,000,000 | 10,007,320 | ||
| 372,274,350 | |||||
| Capital Goods 0.6% | |||||
| General Electric Co., senior note, 2.70%, 10/09/22 | United States | 7,600,000 | 7,506,064 | ||
| NBCUniversal Media LLC, senior bond, 4.45%, 1/15/43 | United States | 8,100,000 | 8,316,472 | ||
| dSydney Airport Finance Co. Pty. Ltd., 144A, 3.90%, 3/22/23 | Australia | 14,000,000 | 14,391,580 | ||
| 30,214,116 | |||||
| Consumer Durables & Apparel 0.9% | |||||
| Centex Corp., senior note, 6.50%, 5/01/16 | United States | 19,795,000 | 21,230,137 | ||
| D.R. Horton Inc., senior bond, 5.625%, 1/15/16 | United States | 7,000,000 | 7,323,750 | ||
| Lennar Corp., senior note, 5.60%, 5/31/15 | United States | 7,692,000 | 7,893,915 | ||
| franklintempleton.com | Annual Report | 101 | ||||
FRANKLIN INVESTORS SECURITIES TRUST
STATEMENT OF INVESTMENTS
| Franklin Total Return Fund (continued) | |||||
| Principal | |||||
| Country | Amount* | Value | |||
| Corporate Bonds (continued) | |||||
| Consumer Durables & Apparel (continued) | |||||
| The Ryland Group Inc., senior note, 5.375%, 1/15/15 | United States | 4,750,000 | $ | 4,779,688 | |
| Toll Brothers Finance Corp., senior note, 5.15%, 5/15/15 | United States | 2,010,000 | 2,055,225 | ||
| 43,282,715 | |||||
| Consumer Services 0.1% | |||||
| Yum! Brands Inc., senior note, 5.30%, 9/15/19 | United States | 3,000,000 | 3,336,582 | ||
| Diversified Financials 2.5% | |||||
| American Express Centurion Bank, senior note, 5.95%, 6/12/17 | United States | 800,000 | 896,337 | ||
| Capital One Bank USA NA, sub. bond, 3.375%, 2/15/23 | United States | 6,000,000 | 5,950,422 | ||
| Commonwealth Edison Co., secured bond, 6.45%, 1/15/38 | United States | 700,000 | 936,307 | ||
| Deutsche Bank AG, sub. bond, 4.296% to 5/24/23, FRN thereafter, | |||||
| 5/24/28 | Germany | 10,000,000 | 9,712,500 | ||
| Discover Financial Services, senior note, 3.85%, 11/21/22 | United States | 3,052,000 | 3,091,987 | ||
| General Electric Capital Corp., senior note, | |||||
| 5.625%, 5/01/18 | United States | 500,000 | 565,776 | ||
| A, 8.50%, 4/06/18 | United States | 135,000,000 | MXN | 11,228,901 | |
| General Motors Financial Co. Inc., senior note, 4.375%, 9/25/21 | United States | 12,500,000 | 13,110,625 | ||
| dHutchison Whampoa International 11 Ltd., senior note, 144A, 3.50%, | |||||
| 1/13/17 | Hong Kong | 9,500,000 | 9,924,888 | ||
| Irish Life & Permanent PLC, senior note, 4.00%, 3/10/15 | Ireland | 10,000,000 | EUR | 12,693,880 | |
| Morgan Stanley, | |||||
| senior note, 6.00%, 4/28/15 | United States | 2,140,000 | 2,195,512 | ||
| senior note, 5.50%, 1/26/20 | United States | 10,000,000 | 11,286,060 | ||
| senior sub. bond, 4.35%, 9/08/26 | United States | 12,500,000 | 12,545,025 | ||
| Navient LLC, senior note, | |||||
| 8.45%, 6/15/18 | United States | 3,400,000 | 3,898,100 | ||
| 5.50%, 1/15/19 | United States | 1,400,000 | 1,455,132 | ||
| dPrudential Covered Trust, secured note, 144A, 2.997%, 9/30/15 | United States | 12,660,000 | 12,899,578 | ||
| dWoori Bank, sub.note, 144A, 4.75%, 4/30/24 | South Korea | 11,750,000 | 12,184,515 | ||
| 124,575,545 | |||||
| Energy 5.6% | |||||
| Anadarko Petroleum Corp., senior note, 6.45%, 9/15/36 | United States | 2,260,000 | 2,794,605 | ||
| Apache Corp., senior bond, 4.25%, 1/15/44 | United States | 19,800,000 | 18,434,750 | ||
| CGG SA, senior note, 6.50%, 6/01/21 | France | 3,000,000 | 2,422,500 | ||
| Chesapeake Energy Corp., senior note, | |||||
| 6.625%, 8/15/20 | United States | 2,000,000 | 2,265,000 | ||
| 5.75%, 3/15/23 | United States | 3,000,000 | 3,300,000 | ||
| CNOOC Finance 2013 Ltd., senior note, 3.00%, 5/09/23 | China | 14,000,000 | 13,284,320 | ||
| CNOOC Nexen Finance 2014 ULC, senior note, 4.25%, 4/30/24 | China | 11,100,000 | 11,485,447 | ||
| dCNPC General Capital Ltd., senior bond, 144A, 3.95%, 4/19/22 | Hong Kong | 14,000,000 | 14,331,254 | ||
| El Paso Pipeline Partners Operating Co. LLC, senior note, 4.30%, | |||||
| 5/01/24 | United States | 15,900,000 | 15,999,375 | ||
| dEnable Midstream Partners LP, senior note, 144A, 3.90%, 5/15/24 | United States | 9,700,000 | 9,715,016 | ||
| Energy Transfer Equity LP, senior note, 7.50%, 10/15/20 | United States | 6,000,000 | 6,930,000 | ||
| Energy Transfer Partners LP, senior note, 5.20%, 2/01/22 | United States | 6,000,000 | 6,572,826 | ||
| Ensco PLC, senior bond, 5.75%, 10/01/44 | United States | 7,600,000 | 7,927,788 | ||
| Enterprise Products Operating LLC, | |||||
| junior sub. note, 7.034% to 1/15/18, FRN thereafter, 1/15/68 | United States | 3,500,000 | 3,896,560 | ||
| senior note, 3.35%, 3/15/23 | United States | 17,000,000 | 16,876,580 |
102 | Annual Report franklintempleton.com
FRANKLIN INVESTORS SECURITIES TRUST
STATEMENT OF INVESTMENTS
| Franklin Total Return Fund (continued) | ||||
| Principal | ||||
| Country | Amount* | Value | ||
| Corporate Bonds (continued) | ||||
| Energy (continued) | ||||
| Freeport-McMoran Oil & Gas LLC / FCX Oil & Gas Inc., senior note, | ||||
| 6.125%, 6/15/19 | United States | 374,000 | $ | 409,998 |
| 6.625%, 5/01/21 | United States | 2,284,000 | 2,503,721 | |
| 6.75%, 2/01/22 | United States | 322,000 | 357,420 | |
| 6.875%, 2/15/23 | United States | 658,000 | 745,804 | |
| d,iGaz Capital SA, (OJSC Gazprom), loan participation, | ||||
| senior bond, 144A, 6.212%, 11/22/16 | Russia | 2,800,000 | 2,922,500 | |
| senior note, 144A, 3.85%, 2/06/20 | Russia | 10,000,000 | 9,323,200 | |
| Kinder Morgan Energy Partners LP, | ||||
| senior bond, 3.45%, 2/15/23 | United States | 9,700,000 | 9,333,214 | |
| senior note, 4.25%, 9/01/24 | United States | 10,000,000 | 9,971,590 | |
| Kinder Morgan Finance Co. LLC, | ||||
| senior bond, 5.70%, 1/05/16 | United States | 19,426,000 | 20,336,594 | |
| dsenior secured note, 144A, 6.00%, 1/15/18 | United States | 5,000,000 | 5,506,250 | |
| Kinder Morgan Inc., senior note, 7.00%, 6/15/17 | United States | 1,100,000 | 1,229,250 | |
| Linn Energy LLC/Finance Corp., senior note, 6.25%, 11/01/19 | United States | 5,000,000 | 4,625,000 | |
| dLUKOIL International Finance BV, senior note, 144A, 4.563%, 4/24/23 | Russia | 19,000,000 | 17,327,145 | |
| Peabody Energy Corp., senior note, 6.25%, 11/15/21 | United States | 6,000,000 | 5,703,750 | |
| gPetrobras Global Finance BV, senior note, FRN, 3/17/20 | Brazil | 14,400,000 | 14,542,992 | |
| dPetrofac Ltd., senior note, 144A, 3.40%, 10/10/18 | United Kingdom | 7,600,000 | 7,836,588 | |
| dSinopec Group Overseas Development 2014 Ltd., senior note, 144A, | ||||
| 4.375%, 4/10/24 | China | 14,000,000 | 14,683,480 | |
| Sunoco Logistics Partners Operations LP, senior note, 4.25%, 4/01/24 | United States | 9,300,000 | 9,555,648 | |
| Transcontinental Gas Pipe Line Corp., senior note, 6.05%, 6/15/18 | United States | 550,000 | 625,464 | |
| Weatherford International Ltd., senior bond, 5.95%, 4/15/42 | United States | 4,900,000 | 5,203,927 | |
| 278,979,556 | ||||
| Food & Staples Retailing 0.8% | ||||
| dCencosud SA, senior note, 144A, 4.875%, 1/20/23 | Chile | 17,000,000 | 17,134,385 | |
| CVS Health Corp., | ||||
| 2.75%, 12/01/22 | United States | 9,400,000 | 9,146,623 | |
| senior note, 5.75%, 6/01/17 | United States | 362,000 | 402,048 | |
| The Kroger Co., senior note, 4.00%, 2/01/24 | United States | 15,400,000 | 16,013,058 | |
| 42,696,114 | ||||
| Food, Beverage & Tobacco 1.6% | ||||
| Altria Group Inc., | ||||
| senior bond, 4.00%, 1/31/24 | United States | 4,000,000 | 4,146,808 | |
| senior note, 9.70%, 11/10/18 | United States | 1,879,000 | 2,423,964 | |
| Bunge Ltd. Finance Corp., | ||||
| 4.10%, 3/15/16 | United States | 8,000,000 | 8,334,560 | |
| senior note, 5.10%, 7/15/15 | United States | 680,000 | 700,669 | |
| Constellation Brands Inc., senior note, 7.25%, 5/15/17 | United States | 7,000,000 | 7,818,125 | |
| Dean Foods Co., senior note, 7.00%, 6/01/16 | United States | 11,506,000 | 12,282,655 | |
| dHeineken NV, senior bond, 144A, 2.75%, 4/01/23 | Netherlands | 10,000,000 | 9,607,150 | |
| Lorillard Tobacco Co., senior note, 2.30%, 8/21/17 | United States | 16,000,000 | 16,178,208 | |
| Mondelez International Inc., senior bond, 4.00%, 2/01/24 | United States | 8,400,000 | 8,681,896 | |
| Tyson Foods Inc., senior bond, 3.95%, 8/15/24 | United States | 12,000,000 | 12,257,880 | |
| 82,431,915 |
franklintempleton.com
Annual Report
| 103
FRANKLIN INVESTORS SECURITIES TRUST
STATEMENT OF INVESTMENTS
| Franklin Total Return Fund (continued) | |||||
| Principal | |||||
| Country | Amount* | Value | |||
| Corporate Bonds (continued) | |||||
| Health Care Equipment & Services 1.0% | |||||
| DENTSPLY International Inc., senior note, 4.125%, 8/15/21 | United States | 15,000,000 | $ | 15,820,245 | |
| Express Scripts Holding Co., senior note, 4.75%, 11/15/21 | United States | 10,000,000 | 10,994,740 | ||
| HCA Holdings Inc., senior note, 6.25%, 2/15/21 | United States | 2,000,000 | 2,157,500 | ||
| HCA Inc., senior note, | |||||
| 6.50%, 2/15/16 | United States | 5,054,000 | 5,350,922 | ||
| 5.875%, 5/01/23 | United States | 5,000,000 | 5,387,500 | ||
| Medco Health Solutions Inc., | |||||
| 7.125%, 3/15/18 | United States | 4,500,000 | 5,241,348 | ||
| senior note, 4.125%, 9/15/20 | United States | 3,500,000 | 3,751,209 | ||
| 48,703,464 | |||||
| Insurance 2.2% | |||||
| Aflac Inc., senior bond, 3.625%, 6/15/23 | United States | 17,500,000 | 17,777,865 | ||
| The Allstate Corp., junior sub. note, 5.75% to 8/14/23, FRN thereafter, | |||||
| 8/15/53 | United States | 4,750,000 | 5,061,719 | ||
| CNA Financial Corp., senior note, 5.85%, 12/15/14 | United States | 10,000,000 | 10,057,050 | ||
| d,fThe Dai-ichi Life Insurance Co. Ltd., sub. bond, 144A, 5.10% to 10/28/24, | |||||
| FRN thereafter, Perpetual | Japan | 9,000,000 | 9,248,445 | ||
| dLiberty Mutual Group Inc., senior note, 144A, 4.95%, 5/01/22 | United States | 12,000,000 | 13,022,064 | ||
| MetLife Inc., junior sub. note, 6.40% to 12/15/36, FRN thereafter, | |||||
| 12/15/66 | United States | 4,000,000 | 4,515,000 | ||
| dMitsui Sumitomo Insurance Co. Ltd., junior sub. note, 144A, 7.00% to | |||||
| 3/15/22, FRN thereafter, 3/15/72 | Japan | 3,400,000 | 3,956,206 | ||
| dNippon Life Insurance Co., sub. bond, 144A, 5.10% to10/16/24, | |||||
| FRN thereafter, 10/16/44 | Japan | 12,300,000 | 12,878,592 | ||
| Prudential Financial Inc., junior sub. note, 5.875%, 9/15/42 | United States | 7,000,000 | 7,455,000 | ||
| dTeachers Insurance & Annuity Assn. of America, sub. bond, 144A, 4.90%, | |||||
| 9/15/44 | United States | 20,400,000 | 21,713,229 | ||
| dTIAA Asset Management Finance LLC, senior note, 144A, 2.95%, | |||||
| 11/01/19 | United States | 5,800,000 | 5,817,760 | ||
| 111,502,930 | |||||
| Materials 1.8% | |||||
| dAlpek SA de CV, senior note, 144A, 4.50%, 11/20/22 | Mexico | 10,500,000 | 10,713,570 | ||
| ArcelorMittal, senior note, 6.00%, 3/01/21 | Luxembourg | 6,000,000 | 6,445,860 | ||
| dCemex Finance LLC, senior secured note, 144A, 9.375%, 10/12/22 | Mexico | 1,000,000 | 1,157,500 | ||
| dCemex SAB de CV, | |||||
| first lien, 144A, 5.70%, 1/11/25 | Mexico | 3,000,000 | 2,940,000 | ||
| senior secured note, 144A, 9.00%, 1/11/18 | Mexico | 1,000,000 | 1,056,875 | ||
| dFMG Resources (August 2006) Pty. Ltd., senior note, 144A, 6.875%, | |||||
| 4/01/22 | Australia | 6,000,000 | 6,217,500 | ||
| dGlencore Funding LLC, senior note, 144A, 4.125%, 5/30/23 | Switzerland | 15,000,000 | 14,961,780 | ||
| LYB International Finance BV, senior note, 4.00%, 7/15/23 | Netherlands | 6,600,000 | 6,853,869 | ||
| Lyondellbasell Industries NV, senior note, 5.75%, 4/15/24 | United States | 11,800,000 | 13,794,826 | ||
| Reliance Steel & Aluminum Co., senior note, 4.50%, 4/15/23 | United States | 5,600,000 | 5,719,347 | ||
| dRPM U.K. GP, 144A, 6.70%, 11/01/15 | United States | 1,000,000 | 1,047,676 | ||
| Tenneco Packaging Inc., senior note, 8.125%, 6/15/17 | United States | 12,000,000 | 13,020,000 | ||
| dXstrata Finance Canada Ltd., senior note, 144A, 4.95%, 11/15/21 | Switzerland | 7,000,000 | 7,510,055 | ||
| 91,438,858 |
104 | Annual Report franklintempleton.com
FRANKLIN INVESTORS SECURITIES TRUST
STATEMENT OF INVESTMENTS
| Franklin Total Return Fund (continued) | |||||
| Principal | |||||
| Country | Amount* | Value | |||
| Corporate Bonds (continued) | |||||
| Media 1.2% | |||||
| DISH DBS Corp., senior note, 7.125%, 2/01/16 | United States | 11,000,000 | $ | 11,728,750 | |
| Gannett Co. Inc., senior note, 6.375%, 9/01/15 | United States | 3,000,000 | 3,120,000 | ||
| iHeartCommunications Inc., senior secured bond, first lien, 9.00%, | |||||
| 3/01/21 | United States | 3,500,000 | 3,513,125 | ||
| The New York Times Co., senior note, 6.625%, 12/15/16 | United States | 11,700,000 | 12,694,500 | ||
| News America Inc., | |||||
| 3.00%, 9/15/22 | United States | 13,400,000 | 13,196,106 | ||
| senior bond, 7.90%, 12/01/95 | United States | 500,000 | 664,757 | ||
| senior deb., 7.25%, 5/18/18 | United States | 2,000,000 | 2,363,970 | ||
| senior note, 6.90%, 8/15/39 | United States | 1,800,000 | 2,367,760 | ||
| Time Warner Inc., | |||||
| 7.70%, 5/01/32 | United States | 550,000 | 768,518 | ||
| 6.10%, 7/15/40 | United States | 8,600,000 | 10,275,168 | ||
| Viacom Inc., senior bond, 4.25%, 9/01/23 | United States | 1,000,000 | 1,032,629 | ||
| 61,725,283 | |||||
| Pharmaceuticals, Biotechnology & Life Sciences 1.0% | |||||
| AbbVie Inc., senior note, 2.90%, 11/06/22 | United States | 15,000,000 | 14,653,050 | ||
| PerkinElmer Inc., senior note, 5.00%, 11/15/21 | United States | 13,200,000 | 14,344,361 | ||
| Zoetis Inc., senior bond, 3.25%, 2/01/23 | United States | 20,000,000 | 19,841,720 | ||
| 48,839,131 | |||||
| Real Estate 1.9% | |||||
| American Tower Corp., senior bond, | |||||
| 3.50%, 1/31/23 | United States | 17,700,000 | 16,986,832 | ||
| 5.00%, 2/15/24 | United States | 4,400,000 | 4,664,317 | ||
| Digital Realty Trust LP, 5.875%, 2/01/20 | United States | 6,400,000 | 7,159,238 | ||
| ERP Operating LP, 5.75%, 6/15/17 | United States | 2,000,000 | 2,225,096 | ||
| HCP Inc., senior bond, 3.875%, 8/15/24 | United States | 17,000,000 | 17,046,920 | ||
| Health Care REIT Inc., senior note, 4.125%, 4/01/19 | United States | 13,000,000 | 13,944,021 | ||
| Healthcare Realty Trust Inc., senior note, 6.50%, 1/17/17 | United States | 5,000,000 | 5,532,450 | ||
| Realty Income Corp., senior bond, 4.125%, 10/15/26 | United States | 12,500,000 | 12,726,025 | ||
| Senior Housing Properties Trust, senior note, 6.75%, 12/15/21 | United States | 14,500,000 | 16,614,085 | ||
| 96,898,984 | |||||
| Retailing 0.7% | |||||
| Bed Bath & Beyond Inc, senior bond, 5.165%, 8/01/44 | United States | 18,600,000 | 18,624,906 | ||
| dEdcon Pty. Ltd., secured note, 144A, 9.50%, 3/01/18 | South Africa | 3,500,000 | EUR | 3,646,901 | |
| dTiffany & Co., senior bond, 144A, 3.80%, 10/01/24 | United States | 10,300,000 | 10,466,458 | ||
| 32,738,265 | |||||
| Semiconductors & Semiconductor Equipment 0.4% | |||||
| Maxim Integrated Products Inc., senior note, 3.375%, 3/15/23 | United States | 22,000,000 | 21,504,186 | ||
| Software & Services 0.1% | |||||
| dFirst Data Corp., senior secured bond, 144A, 8.25%, 1/15/21 | United States | 6,000,000 | 6,540,000 |
franklintempleton.com Annual Report | 105
FRANKLIN INVESTORS SECURITIES TRUST
STATEMENT OF INVESTMENTS
| Franklin Total Return Fund (continued) | ||||
| Principal | ||||
| Country | Amount* | Value | ||
| Corporate Bonds (continued) | ||||
| Technology Hardware & Equipment 0.6% | ||||
| Dell Inc., senior note, 3.10%, 4/01/16 | United States | 15,000,000 | $ | 15,168,750 |
| Juniper Networks Inc., | ||||
| senior bond, 4.50%, 3/15/24 | United States | 4,500,000 | 4,640,224 | |
| senior note, 4.60%, 3/15/21 | United States | 5,000,000 | 5,316,805 | |
| Seagate Technology HDD Holdings, senior bond, 6.80%, 10/01/16 | United States | 2,346,000 | 2,557,140 | |
| 27,682,919 | ||||
| Telecommunication Services 1.7% | ||||
| Embarq Corp., senior note, 7.082%, 6/01/16 | United States | 22,500,000 | 24,445,395 | |
| Frontier Communications Corp., senior note, | ||||
| 8.75%, 4/15/22 | United States | 3,000,000 | 3,480,000 | |
| 7.125%, 1/15/23 | United States | 2,000,000 | 2,140,000 | |
| Intelsat Jackson Holdings SA, senior bond, 6.625%, 12/15/22 | Luxembourg | 5,000,000 | 5,287,500 | |
| Sprint Nextel Corp., senior note, 6.00%, 11/15/22 | United States | 7,000,000 | 7,008,750 | |
| Telefonica Emisiones SAU, senior note, | ||||
| 4.949%, 1/15/15 | Spain | 1,500,000 | 1,512,281 | |
| 4.57%, 4/27/23 | Spain | 9,000,000 | 9,561,555 | |
| Verizon Communications Inc., senior bond, | ||||
| 6.40%, 9/15/33 | United States | 10,255,000 | 12,513,182 | |
| d144A, 4.862%, 8/21/46 | United States | 10,656,000 | 10,893,458 | |
| Verizon New York Inc., senior deb., B, 7.375%, 4/01/32 | United States | 1,000,000 | 1,262,296 | |
| dWind Acquisition Finance SA, senior note, 144A, 7.375%, 4/23/21 | Italy | 5,000,000 | 4,893,750 | |
| 82,998,167 | ||||
| Transportation 0.2% | ||||
| dAviation Capital Group Corp., 144A, 7.125%, 10/15/20 | United States | 6,000,000 | 6,905,118 | |
| Burlington Northern and Santa Fe 99-2 Trust, secured bond, 7.57%, | ||||
| 1/02/21 | United States | 162,810 | 185,177 | |
| dDP World Ltd., 144A, 6.85%, 7/02/37 | United Arab | |||
| Emirates | 3,700,000 | 4,257,257 | ||
| Union Pacific Railroad Co. 1998 Pass Trust, 98-B, 6.85%, 1/02/19 | United States | 357,993 | 395,110 | |
| Union Pacific Railroad Co. 2005 Pass Trust, 05-1, 5.082%, 1/02/29 | United States | 220,000 | 247,117 | |
| 11,989,779 | ||||
| Utilities 1.4% | ||||
| Dominion Resources Inc., senior note, 8.875%, 1/15/19 | United States | 3,650,000 | 4,601,040 | |
| DPL Inc., senior note, 6.50%, 10/15/16 | United States | 875,000 | 938,438 | |
| d,fEDF SA, sub. note, 144A, 5.25% to 1/29/23, FRN thereafter, Perpetual | France | 24,000,000 | 24,961,440 | |
| dEnogex LLC, senior note, 144A, 6.25%, 3/15/20 | United States | 5,000,000 | 5,749,940 | |
| Georgia Power Co., senior note, 4.30%, 3/15/42 | United States | 9,000,000 | 9,331,074 | |
| MidAmerican Energy Co., senior note, 5.95%, 7/15/17 | United States | 2,200,000 | 2,483,277 | |
| PPL Energy Supply LLC, senior note, 6.20%, 5/15/16 | United States | 11,400,000 | 11,939,596 | |
| dState Grid Overseas Investment 2013 Ltd., senior note, 144A, 3.125%, | ||||
| 5/22/23 | China | 10,400,000 | 10,097,568 | |
| 70,102,373 | ||||
| Total Corporate Bonds (Cost $1,667,262,401) | 1,716,318,551 | |||
| g,jSenior Floating Rate Interests 2.6% | ||||
| Automobiles & Components 0.0%† | ||||
| FRAM Group Holdings Inc. (Autoparts Holdings), Second Lien Term Loan, | ||||
| 10.50%, 1/29/18 | United States | 509,924 | 504,824 |
106 | Annual Report franklintempleton.com
FRANKLIN INVESTORS SECURITIES TRUST
STATEMENT OF INVESTMENTS
| Franklin Total Return Fund (continued) | ||||
| Principal | ||||
| Country | Amount* | Value | ||
| g,jSenior Floating Rate Interests (continued) | ||||
| Capital Goods 0.1% | ||||
| kErickson Inc., Purchase Price Notes, 3.25%, 11/02/20 | United States | 15,682 | $ | 13,441 |
| Sensus USA Inc., Second Lien Term Loan, 8.50%, 5/09/18 | United States | 156,142 | 153,019 | |
| TransDigm Inc., Tranche C Term Loan, 3.75%, 2/28/20 | United States | 4,600,140 | 4,534,013 | |
| Wesco Distribution Inc., Tranche B-1 Loan, 3.75%, 12/12/19 | United States | 63,997 | 63,837 | |
| 4,764,310 | ||||
| Commercial & Professional Services 0.1% | ||||
| Interactive Data Corp., Term Loan, 4.75%, 5/02/21 | United States | 4,826,970 | 4,833,004 | |
| Consumer Services 0.1% | ||||
| c,lTurtle Bay Holdings LLC, Term Loan B, PIK, 5.00%, 6/30/16 | United States | 4,000,881 | 3,840,846 | |
| Diversified Financials 0.2% | ||||
| Guggenheim Partners Investment Management Holdings LLC, Initial Term | ||||
| Loan, 4.25%, 7/22/20 | United States | 1,661,366 | 1,653,059 | |
| Trans Union LLC, 2014 Replacement Term Loan, 4.00%, 4/09/21 | United States | 6,995,583 | 6,903,766 | |
| 8,556,825 | ||||
| Energy 0.0%† | ||||
| Bowie Resource Holdings LLC, Second Lien Initial Term Loan, 11.75%, | ||||
| 2/16/21 | United States | 263,184 | 266,473 | |
| Food & Staples Retailing 0.0%† | ||||
| AdvancePierre Foods Inc., Second Lien Term Loan, 9.50%, 10/10/17 | United States | 226,800 | 225,241 | |
| Food, Beverage & Tobacco 0.1% | ||||
| Big Heart Pet Brands (Del Monte Pet), Initial Term Loans, 3.50%, | ||||
| 2/24/20 | United States | 3,648,691 | 3,517,776 | |
| Health Care Equipment & Services 0.2% | ||||
| Carestream Health Inc., Second Lien Loan, 9.50%, 12/07/19 | United States | 534,954 | 531,164 | |
| Community Health Systems Inc., 2021 Term D Loan, 4.25%, 1/27/21 | United States | 7,310,750 | 7,326,746 | |
| Surgery Centers Holdings Inc., Incremental Second Lien Term Loan, | ||||
| 10.75%, 4/10/20 | United States | 3,700 | 3,774 | |
| U.S. Renal Care Inc., Tranche B-2 Term Loan, 4.25%, 7/03/19 | United States | 2,494,973 | 2,480,939 | |
| 10,342,623 | ||||
| Household & Personal Products 0.1% | ||||
| FGI Operating Co. LLC (Freedom Group), Term B Loans, 5.50%, | ||||
| 4/19/19 | United States | 7,667,011 | 7,643,051 | |
| Materials 0.7% | ||||
| Arysta Lifescience SPC LLC, | ||||
| Initial Term Loan, 4.50%, 5/29/20 | United States | 8,331,054 | 8,321,940 | |
| Second Lien Initial Term Loan, 8.25%, 11/30/20 | United States | 1,568,007 | 1,588,587 | |
| Axalta Coating Systems U.S. Holdings Inc., 2014 Specified Refinancing | ||||
| Term, 3.75%, 2/01/20 | United States | 2,925,167 | 2,883,118 | |
| Exopack Holdings SA, USD Term Loan, 5.25%, 5/08/19 | Luxembourg | 1,316,884 | 1,325,937 | |
| MacDermid Holdings LLC, First Lien Tranche B Term Loan, 4.00%, | ||||
| 6/07/20 | United States | 5,257,938 | 5,151,139 | |
| OCI Beaumont LLC, Term B-3 Loan, 5.00%, 8/20/19 | United States | 1,079,717 | 1,086,476 | |
| Oxbow Carbon LLC, First Lien Tranche B Term Loan, 4.25%, 7/19/19 | United States | 1,357,154 | 1,340,190 | |
| OXEA GmbH, Second Lien Term Loan, 8.25%, 7/15/20 | Luxembourg | 322,548 | 313,775 | |
| Reynolds Group Holdings Inc., U.S. Term Loan, 4.00%, 12/01/18 | United States | 12,151,871 | 12,102,000 | |
| Tronox Pigments (Netherlands) BV, Term Loan, 4.00%, 3/19/20 | Netherlands | 1,244,647 | 1,233,929 | |
| 35,347,091 |
franklintempleton.com Annual Report | 107
FRANKLIN INVESTORS SECURITIES TRUST
STATEMENT OF INVESTMENTS
| Franklin Total Return Fund (continued) | |||||
| Principal | |||||
| Country | Amount* | Value | |||
| g,jSenior Floating Rate Interests (continued) | |||||
| Media 0.0%† | |||||
| Cumulus Media Holdings Inc., Term Loans, 4.25%, 12/23/20 | United States | 930,430 | $ | 918,451 | |
| NEP/NCP Holdco Inc., Second Lien Term Loan, 9.50%, 7/22/20 | United States | 146,822 | 146,822 | ||
| Radio One Inc., Term Loan, 7.50%, 3/31/16 | United States | 17,686 | 17,819 | ||
| 1,083,092 | |||||
| Retailing 0.4% | |||||
| BJ’s Wholesale Club Inc., 2013 (Nov) Replacement Loans, 4.50%, | |||||
| 9/26/19 | United States | 7,352,527 | 7,281,627 | ||
| Evergreen AcqCo. 1 LP (Savers), Term Loan, 5.00%, 7/09/19 | United States | 4,062,441 | 4,042,129 | ||
| Harbor Freight Tools USA Inc., Loans, 4.75%, 7/26/19 | United States | 2,605,014 | 2,608,270 | ||
| Party City Holdings Inc., 2014 Replacement Term Loan, 4.00%, 7/27/19 | United States | 2,187,547 | 2,147,897 | ||
| Sears Roebuck Acceptance Corp., Term Loan, 5.50%, 6/30/18 | United States | 4,961,021 | 4,838,236 | ||
| 20,918,159 | |||||
| Software & Services 0.3% | |||||
| BMC Software Finance Inc., Initial U.S. Term Loans, 5.00%, 9/10/20 | United States | 9,497,362 | 9,392,672 | ||
| MoneyGram International Inc., Term Loan, 4.25%, 3/28/20 | United States | 7,931,473 | 7,716,451 | ||
| Vertafore Inc., Second Lien Term Loan, 9.75%, 10/27/17 | United States | 467,548 | 471,346 | ||
| 17,580,469 | |||||
| Technology Hardware & Equipment 0.1% | |||||
| Dell International LLC, Term B Loan, 4.50%, 4/29/20 | United States | 4,396,618 | 4,408,858 | ||
| Telecommunication Services 0.1% | |||||
| Intelsat Jackson Holdings SA, Tranche B-2 Term Loan, 3.75%, 6/30/19 | Luxembourg | 3,488,055 | 3,466,255 | ||
| Transportation 0.1% | |||||
| Global Tip Finance BV/Finance America LLC, Facility C Commitment, | |||||
| 7.00%, 10/16/20 | United States | 2,869,949 | 2,869,949 | ||
| Total Senior Floating Rate Interests | |||||
| (Cost $130,941,084) | 130,168,846 | ||||
| Foreign Government and Agency Securities 8.7% | |||||
| The Export-Import Bank of Korea, senior note, | |||||
| 1.25%, 11/20/15 | South Korea | 5,000,000 | 5,026,225 | ||
| 4.00%, 1/29/21 | South Korea | 6,500,000 | 6,916,617 | ||
| eGovernment of Ghana, Reg S, 8.50%, 10/04/17 | Ghana | 300,000 | 318,536 | ||
| Government of Hungary, | |||||
| 7.75%, 8/24/15 | Hungary | 28,900,000 | HUF | 123,219 | |
| 5.50%, 12/22/16 | Hungary | 3,092,050,000 | HUF | 13,482,469 | |
| 6.00%, 1/11/19 | Hungary | 1,820,000 | EUR | 2,631,617 | |
| A, 8.00%, 2/12/15 | Hungary | 91,860,000 | HUF | 380,236 | |
| A, 6.75%, 11/24/17 | Hungary | 1,457,960,000 | HUF | 6,660,588 | |
| A, 5.50%, 12/20/18 | Hungary | 205,390,000 | HUF | 915,986 | |
| esenior note, Reg S, 3.50%, 7/18/16 | Hungary | 115,000 | EUR | 150,221 | |
| esenior note, Reg S, 4.375%, 7/04/17 | Hungary | 215,000 | EUR | 288,981 | |
| esenior note, Reg S, 5.75%, 6/11/18 | Hungary | 695,000 | EUR | 984,741 | |
| esenior note, Reg S, 3.875%, 2/24/20 | Hungary | 285,000 | EUR | 384,380 | |
| eGovernment of Iceland, senior note, Reg S, 2.50%, 7/15/20 | Iceland | 2,300,000 | EUR | 2,948,524 | |
| Government of Ireland, | |||||
| 4.50%, 4/18/20 | Ireland | 3,243,000 | EUR | 4,869,177 | |
| 5.00%, 10/18/20 | Ireland | 2,107,000 | EUR | 3,273,674 | |
| senior bond, 5.40%, 3/13/25 | Ireland | 10,374,640 | EUR | 17,195,151 | |
| 108 | Annual Report | franklintempleton.com | ||||
FRANKLIN INVESTORS SECURITIES TRUST
STATEMENT OF INVESTMENTS
| Franklin Total Return Fund (continued) | |||||
| Principal | |||||
| Country | Amount* | Value | |||
| Foreign Government and Agency Securities (continued) | |||||
| dGovernment of Lithuania, 144A, | |||||
| 6.75%, 1/15/15 | Lithuania | 3,720,000 | $ | 3,768,286 | |
| 7.375%, 2/11/20 | Lithuania | 4,670,000 | 5,668,890 | ||
| Government of Malaysia, | |||||
| 3.741%, 2/27/15 | Malaysia | 40,550,000 | MYR | 12,345,537 | |
| 3.835%, 8/12/15 | Malaysia | 48,200,000 | MYR | 14,710,924 | |
| 4.72%, 9/30/15 | Malaysia | 58,720,000 | MYR | 18,068,736 | |
| 3.197%, 10/15/15 | Malaysia | 30,200,000 | MYR | 9,167,565 | |
| senior note, 3.172%, 7/15/16 | Malaysia | 37,000,000 | MYR | 11,193,779 | |
| Government of Mexico, | |||||
| 9.50%, 12/18/14 | Mexico | 1,828,490 | mMXN | 13,686,863 | |
| 6.00%, 6/18/15 | Mexico | 43,520 | mMXN | 328,848 | |
| 8.00%, 12/17/15 | Mexico | 3,235,540 | mMXN | 25,294,592 | |
| 6.25%, 6/16/16 | Mexico | 501,510 | mMXN | 3,885,504 | |
| 7.25%, 12/15/16 | Mexico | 2,974,390 | mMXN | 23,668,051 | |
| Government of Peru, senior bond, 7.84%, 8/12/20 | Peru | 4,279,000 | PEN | 1,702,989 | |
| Government of Poland, | |||||
| 5.50%, 4/25/15 | Poland | 13,215,000 | PLN | 3,992,737 | |
| 5.00%, 4/25/16 | Poland | 18,390,000 | PLN | 5,719,338 | |
| gFRN, 2.69%, 1/25/17 | Poland | 859,000 | PLN | 255,483 | |
| gFRN, 2.69%, 1/25/21 | Poland | 871,000 | PLN | 256,474 | |
| Strip, 1/25/16 | Poland | 102,440,000 | PLN | 29,791,552 | |
| dGovernment of Portugal, 144A, 5.125%, 10/15/24 | Portugal | 12,100,000 | 12,482,420 | ||
| Government of Russia, senior bond, | |||||
| d144A, 7.50%, 3/31/30 | Russia | 3,698,785 | 4,202,652 | ||
| eReg S, 7.50%, 3/31/30 | Russia | 6,104,600 | 6,936,199 | ||
| dGovernment of Serbia, senior note, 144A, 4.875%, 2/25/20 | Serbia | 6,000,000 | 6,118,590 | ||
| Government of Singapore, senior note, 1.125%, 4/01/16 | Singapore | 750,000 | SGD | 589,638 | |
| Government of Sri Lanka, | |||||
| A, 11.75%, 3/15/15 | Sri Lanka | 1,400,000 | LKR | 10,926 | |
| A, 6.50%, 7/15/15 | Sri Lanka | 35,020,000 | LKR | 268,653 | |
| A, 11.00%, 8/01/15 | Sri Lanka | 241,800,000 | LKR | 1,912,610 | |
| A, 6.40%, 8/01/16 | Sri Lanka | 23,800,000 | LKR | 181,433 | |
| A, 8.00%, 11/15/18 | Sri Lanka | 86,100,000 | LKR | 674,480 | |
| A, 9.00%, 5/01/21 | Sri Lanka | 89,150,000 | LKR | 726,783 | |
| B, 6.40%, 10/01/16 | Sri Lanka | 18,900,000 | LKR | 143,639 | |
| B, 8.50%, 7/15/18 | Sri Lanka | 18,990,000 | LKR | 151,039 | |
| C, 8.50%, 4/01/18 | Sri Lanka | 50,980,000 | LKR | 406,060 | |
| D, 8.50%, 6/01/18 | Sri Lanka | 65,480,000 | LKR | 521,609 | |
| Government of the Philippines, | |||||
| senior bond, 7.00%, 1/27/16 | Philippines | 17,100,000 | PHP | 399,210 | |
| senior note, 1.625%, 4/25/16 | Philippines | 118,200,000 | PHP | 2,615,946 | |
| dGovernment of Ukraine, senior note, 144A, 7.95%, 2/23/21 | Ukraine | 2,370,000 | 2,104,287 | ||
| nGovernment of Uruguay, senior bond, Index Linked, 4.375%, 12/15/28 | Uruguay | 202,128,081 | UYU | 9,183,305 | |
| dGovernment of Vietnam, 144A, | |||||
| 6.875%, 1/15/16 | Vietnam | 150,000 | 158,703 | ||
| 6.75%, 1/29/20 | Vietnam | 5,120,000 | 5,768,960 | ||
| Korea Monetary Stabilization Bond, | |||||
| senior bond, 2.47%, 4/02/15 | South Korea | 4,101,900,000 | KRW | 3,826,313 | |
| senior bond, 2.80%, 8/02/15 | South Korea | 20,907,710,000 | KRW | 19,574,463 | |
| senior bond, 2.81%, 10/02/15 | South Korea | 6,242,000,000 | KRW | 5,851,550 |
franklintempleton.com Annual Report | 109
FRANKLIN INVESTORS SECURITIES TRUST
STATEMENT OF INVESTMENTS
| Franklin Total Return Fund (continued) | |||||
| Principal | |||||
| Country | Amount* | Value | |||
| Foreign Government and Agency Securities (continued) | |||||
| Korea Monetary Stabilization Bond, (continued) | |||||
| senior note, 2.84%, 12/02/14 | South Korea | 2,278,170,000 | KRW | $ | 2,122,514 |
| senior note, 2.74%, 2/02/15 | South Korea | 17,030,680,000 | KRW | 15,885,311 | |
| senior note, 2.76%, 6/02/15 | South Korea | 24,098,900,000 | KRW | 22,531,753 | |
| Korea Treasury Bond, senior note, | |||||
| 3.25%, 12/10/14 | South Korea | 3,998,620,000 | KRW | 3,727,481 | |
| 3.25%, 6/10/15 | South Korea | 3,634,290,000 | KRW | 3,407,949 | |
| 2.75%, 12/10/15 | South Korea | 2,942,150,000 | KRW | 2,759,246 | |
| 2.75%, 6/10/16 | South Korea | 2,400,000,000 | KRW | 2,257,803 | |
| 3.00%, 12/10/16 | South Korea | 37,100,000,000 | KRW | 35,168,797 | |
| Letra Tesouro Nacional, Strip, 1/01/15 | Brazil | 27 | o BRL | 10,702 | |
| pNota Do Tesouro Nacional, Index Linked, 6.00%, | |||||
| 5/15/15 | Brazil | 840 | o BRL | 853,654 | |
| 8/15/18 | Brazil | 13,695 | o BRL | 13,849,152 | |
| dPeru Enhanced Pass-Through Finance Ltd., senior secured bond, A-1, | |||||
| 144A, zero cpn., 5/31/18 | Peru | 580,958 | 544,871 | ||
| Total Foreign Government and Agency Securities | |||||
| (Cost $439,368,509) | 437,985,191 | ||||
| U.S. Government and Agency Securities 3.7% | |||||
| U.S. Treasury Bond, | |||||
| 5.00%, 5/15/37 | United States | 18,000,000 | 24,388,596 | ||
| 3.50%, 2/15/39 | United States | 43,000,000 | 46,923,750 | ||
| 2.875%, 5/15/43 | United States | 53,000,000 | 51,024,902 | ||
| nU.S. Treasury Note, Index Linked, | |||||
| 2.00%, 1/15/16 | United States | 8,329,213 | 8,602,511 | ||
| 0.125%, 4/15/16 | United States | 53,881,451 | 54,496,023 | ||
| Total U.S. Government and Agency Securities | |||||
| (Cost $180,641,452) | 185,435,782 | ||||
| Asset-Backed Securities and Commercial | |||||
| Mortgage-Backed Securities 15.0% | |||||
| Banks 7.4% | |||||
| Banc of America Commercial Mortgage Trust, | |||||
| 2006-4, AJ, 5.695%, 7/10/46 | United States | 20,562,000 | 21,338,216 | ||
| 2006-4, AM, 5.675%, 7/10/46 | United States | 7,350,000 | 7,903,025 | ||
| g2007-3, AM, FRN, 5.598%, 6/10/49 | United States | 17,730,000 | 19,203,461 | ||
| Bear Stearns Commercial Mortgage Securities Inc., | |||||
| g2006-PW11, AJ, FRN, 5.605%, 3/11/39 | United States | 19,594,000 | 20,350,916 | ||
| g2006-PW12, AJ, FRN, 5.751%, 9/11/38 | United States | 3,286,000 | 3,402,563 | ||
| 2006-PW13, AJ, 5.611%, 9/11/41 | United States | 18,023,000 | 18,662,546 | ||
| g2007-PW16, AM, FRN, 5.706%, 6/11/40 | United States | 11,110,000 | 12,186,387 | ||
| gCapital One Multi-Asset Execution Trust, | |||||
| 2007-A1, A1, FRN, 0.203%, 11/15/19 | United States | 4,400,000 | 4,379,582 | ||
| 2007-A2, A2, FRN, 0.233%, 12/16/19 | United States | 26,136,000 | 26,028,542 | ||
| gCitibank Credit Card Issuance Trust, | |||||
| 2013-A12, A12, FRN, 0.467%, 11/07/18 | United States | 7,050,000 | 7,062,457 | ||
| 2013-A7, A7, FRN, 0.582%, 9/10/20 | United States | 11,130,000 | 11,185,516 | ||
| 2014-A9, A9, FRN, 0.353%, 5/09/18 | United States | 5,000,000 | 4,997,988 | ||
| Citigroup Commercial Mortgage Trust, 2006-C5, AJ, 5.482%, 10/15/49 | United States | 15,876,000 | 15,943,259 |
110 | Annual Report franklintempleton.com
FRANKLIN INVESTORS SECURITIES TRUST
STATEMENT OF INVESTMENTS
| Franklin Total Return Fund (continued) | |||||
| Principal | |||||
| Country | Amount* | Value | |||
| Asset-Backed Securities and Commercial | |||||
| Mortgage-Backed Securities (continued) | |||||
| Banks (continued) | |||||
| gCountrywide Asset-Backed Certificates, 2004-1, M1, FRN, 0.902%, | |||||
| 3/25/34 | United States | 2,934,231 | $ | 2,818,355 | |
| qCredit Suisse First Boston Mortgage Securities Corp., 2004-6, 3A1, 5.00%, | |||||
| 9/25/19 | United States | 1,532,906 | 1,607,447 | ||
| d,g,qCredit Suisse Mortgage Capital Certificates, 2009-15R, 3A1, 144A, FRN, | |||||
| 5.371%, 3/26/36 | United States | 7,979,993 | 8,202,447 | ||
| FHLMC, 2643, OG, 5.00%, 7/15/32 | United States | 1,184,985 | 1,192,201 | ||
| gFNMA, 2005-122, FN, FRN, 0.502%, 1/25/36 | United States | 1,054,980 | 1,051,922 | ||
| Greenwich Capital Commercial Funding Corp., | |||||
| g2006-GG7, AJ, FRN, 5.82%, 7/10/38 | United States | 18,910,000 | 19,549,281 | ||
| g2006-GG7, AM, FRN, 6.014%, 7/10/38 | United States | 4,685,000 | 4,994,067 | ||
| 2007-GG9, A4, 5.444%, 3/10/39 | United States | 22,885,000 | 24,650,120 | ||
| JP Morgan Chase Commercial Mortgage Securities Trust, | |||||
| g,q2006-CB14, B, FRN, 5.537%, 12/12/44 | United States | 8,000,000 | 3,210,506 | ||
| 2006-CB17, AM, 5.464%, 12/12/43 | United States | 16,790,000 | 17,567,397 | ||
| g2006-LDP7, AJ, FRN, 5.873%, 4/15/45 | United States | 18,983,000 | 19,372,195 | ||
| gLB-UBS Commercial Mortgage Trust, 2006-C4, AJ, FRN, 5.857%, | |||||
| 6/15/38 | United States | 11,540,000 | 12,130,963 | ||
| gMerrill Lynch Mortgage Investors Inc., 2003-A, 1A, FRN, 0.892%, | |||||
| 3/25/28 | United States | 2,451,967 | 2,409,267 | ||
| gMerrill Lynch Mortgage Trust, 2005-CKI1, AJ, FRN, 5.282%, 11/12/37 | United States | 8,000,000 | 8,281,228 | ||
| gMorgan Stanley ABS Capital I Inc. Trust, | |||||
| 2003-HE1, M1, FRN, 1.352%, 5/25/33 | United States | 4,024,449 | 3,796,851 | ||
| 2005-WMC, M2, FRN, 0.887%, 1/25/35 | United States | 3,396,361 | 3,286,854 | ||
| Morgan Stanley Capital I Trust, | |||||
| d2005-RR6, AJ, 144A, 5.233%, 5/24/43 | United States | 4,733,988 | 4,682,696 | ||
| g2006-HQ8, AJ, FRN, 5.497%, 3/12/44 | United States | 14,956,000 | 15,471,316 | ||
| g2007-IQ16, AM, FRN, 6.099%, 12/12/49 | United States | 21,470,000 | 23,841,898 | ||
| gWachovia Bank Commercial Mortgage Trust, | |||||
| 2006-C23, AJ, FRN, 5.515%, 1/18/45 | United States | 7,675,000 | 7,984,091 | ||
| FRN, 5.727%, 5/15/16 | United States | 6,683,000 | 6,731,619 | ||
| qWells Fargo Mortgage Backed Securities Trust, | |||||
| g2004-I, 2A1, FRN, 2.654%, 6/25/34 | United States | 1,577,158 | 1,577,804 | ||
| g2004-W, A9, FRN, 2.762%, 11/25/34 | United States | 2,550,186 | 2,624,535 | ||
| 2007-3, 3A1, 5.50%, 4/25/37 | United States | 605,864 | 626,849 | ||
| kWeyerhaeuser Mortgage Co., 1984-A, 7.43%, 1/01/24 | United States | 18,967 | 18,967 | ||
| 370,325,334 | |||||
| Diversified Financials 7.4% | |||||
| gAames Mortgage Investment Trust, 2005-4, M1, FRN, 0.857%, | |||||
| 10/25/35 | United States | 2,238,857 | 2,241,289 | ||
| gAmerican Express Credit Account Master Trust, | |||||
| 2008-2, A, FRN, 1.413%, 9/15/20 | United States | 15,550,000 | 16,030,130 | ||
| 2008-6, A, FRN, 1.353%, 2/15/18 | United States | 2,827,000 | 2,848,133 | ||
| 2012-1, A, FRN, 0.423%, 1/15/20 | United States | 8,160,000 | 8,172,281 | ||
| 2012-3, A, FRN, 0.303%, 3/15/18 | United States | 5,630,000 | 5,632,514 | ||
| gAmerican Express Credit Account Secured Note Trust, 2012-4, A, FRN, | |||||
| 0.393%, 5/15/20 | United States | 11,193,000 | 11,187,141 | ||
| gAmerican Home Mortgage Investment Trust, 2004-3, 4A, FRN, 1.833%, | |||||
| 10/25/34 | United States | 2,991,923 | 2,962,221 |
franklintempleton.com Annual Report | 111
| FRANKLIN INVESTORS SECURITIES TRUST | ||||
| STATEMENT OF INVESTMENTS | ||||
| Franklin Total Return Fund (continued) | ||||
| Principal | ||||
| Country | Amount* | Value | ||
| Asset-Backed Securities and Commercial | ||||
| Mortgage-Backed Securities (continued) | ||||
| Diversified Financials (continued) | ||||
| gAmeriquest Mortgage Securities Inc. Asset-Backed Pass-Through | ||||
| Certificates, 2004-R4, M1, FRN, 0.977%, 6/25/34 | United States | 9,076,327 | $ | 8,884,753 |
| gAmortizing Residential Collateral Trust, 2002-BC1, M1, FRN, 1.427%, | ||||
| 1/25/32 | United States | 51,394 | 37,079 | |
| dApidos CDO, 2013-14A, C2, 144A, 4.85%, 4/15/25 | United States | 8,740,000 | 8,475,877 | |
| d,gARES CLO Funds, 2007-12A, B, 144A, FRN, 1.235%, 11/25/20 | United States | 1,090,000 | 1,073,094 | |
| d,gARES CLO Ltd., 2007-3RA, B, 144A, FRN, 0.599%, 4/16/21 | United States | 9,780,000 | 9,376,282 | |
| d,gARES XI CLO Ltd., 2007-11A, A1C, 144A, FRN, 0.50%, 10/11/21 | United States | 5,343,276 | 5,241,219 | |
| gArgent Securities Inc., 2005-W2, A2C, FRN, 0.512%, 10/25/35 | United States | 6,225,000 | 5,795,313 | |
| d,gAtrium CDO Corp., 10A, C, 144A, FRN, 2.829%, 7/16/25 | United States | 4,650,000 | 4,456,839 | |
| d,gAtrium IX, 9A, C, 144A, FRN, 3.488%, 2/28/24 | United States | 3,500,000 | 3,470,670 | |
| d,gBabson CLO Inc., 2007-1A, A1, 144A, FRN, 0.456%, 1/18/21 | United States | 6,807,650 | 6,763,604 | |
| d,g,hBallyrock CDO Ltd. LLC, 2014-1A, B, 144A, FRN, 3.431%, 10/20/26 | Cayman Islands | 10,000,000 | 9,870,100 | |
| gBayview Financial Acquisition Trust, 2004-D, M1, FRN, 0.782%, 8/28/44 | United States | 5,825,030 | 5,836,576 | |
| gBear Stearns Alt-A Trust, 2004-13, A2, FRN, 1.032%, 11/25/34 | United States | 1,636,653 | 1,573,849 | |
| d,gBridgeport CLO Ltd., 2006-1A, B, 144A, FRN, 0.881%, 7/21/20 | United States | 2,000,000 | 1,903,500 | |
| d,gCatamaran CLO Ltd., 2014-2A, B, 144A, FRN, 3.233%, 10/18/26 | United States | 5,497,000 | 5,276,295 | |
| d,gCent CDO Ltd., 2007-15A, | ||||
| A2B, 144A, FRN, 0.575%, 3/11/21 | United States | 5,686,824 | 5,325,483 | |
| B, 144A, FRN, 0.955%, 3/11/21 | United States | 6,000,000 | 5,581,140 | |
| d,gCent CDO XI Ltd., 2006-11A, B, 144A, FRN, 1.033%, 4/25/19 | United States | 2,680,000 | 2,552,432 | |
| d,gCent CLO LP, 2013-20A, A, 144A, FRN, 1.714%, 1/25/26 | United States | 3,000,000 | 2,987,400 | |
| gChase Funding Mortgage Loan Asset-Backed Certificates, 2004-2, 2A2, | ||||
| FRN, 0.652%, 2/25/35 | United States | 675,545 | 621,546 | |
| gChase Issuance Trust, | ||||
| 2012-A6, A, FRN, 0.283%, 8/15/17 | United States | 2,210,000 | 2,208,413 | |
| 2012-A9, A9, FRN, 0.303%, 10/16/17 | United States | 2,210,000 | 2,210,781 | |
| 2013-A6, A6, FRN, 0.573%, 7/15/20 | United States | 17,443,000 | 17,503,789 | |
| 2014-A3, A3, FRN, 0.353%, 5/15/18 | United States | 22,980,000 | 22,980,563 | |
| d,gChatham Light CLO Ltd., 2005-2A, A2, 144A, FRN, 0.639%, 8/03/19 | United States | 5,410,000 | 5,391,390 | |
| d,gCIFC Funding Ltd., 2007-3A, A1J, 144A, FRN, 0.634%, 7/26/21 | United States | 1,420,000 | 1,363,512 | |
| d,gColony American Homes, 2014-1A, A, 144A, FRN, 1.40%, 5/17/31 | United States | 10,102,489 | 10,109,676 | |
| dColony MFM Trust, 2014-1, A, 144A, 2.543%, 4/20/22 | United States | 25,050,000 | 25,050,000 | |
| dColumbusNova CLO IV Ltd., 2007-2A, B, 144A, 1.481%, 10/15/21 | United States | 1,590,000 | 1,563,224 | |
| d,gColumbusNova CLO Ltd., 2007-2A, A2, 144A, FRN, 1.231%, 10/15/21 | United States | 690,000 | 674,082 | |
| dCountryplace Manufactured Housing Contract Trust, 2005-A3, 144A, | ||||
| 4.80%, 12/15/35 | United States | 609,463 | 622,049 | |
| d,gCT CDO IV Ltd., 2006-4A, A1, 144A, FRN, 0.467%, 10/20/43 | United States | 12,537,962 | 12,384,685 | |
| d,gDLJ Mortgage Acceptance Corp., 1997-CF1, S, 144A, IO, FRN, 0.829%, | ||||
| 5/15/30 | United States | 2,164 | 6 | |
| d,gEaton Vance CDO Ltd., 2014-1A, | ||||
| B, 144A, FRN, 2.285%, 7/15/26 | United States | 1,813,400 | 1,761,174 | |
| C, 144A, FRN, 3.235%, 7/15/26 | United States | 1,558,600 | 1,521,599 | |
| dEmerson Park CLO Ltd., 2013-1A, C2, 144A, 5.64%, 7/15/25 | United States | 2,920,000 | 2,954,456 | |
| dG-Force LLC, 2005-RRA, C, 144A, 5.20%, 8/22/36 | United States | 9,275,000 | 8,967,858 | |
| d,gGleneagles CLO Ltd., 2005-1A, A2, 144A, FRN, 0.64%, 11/01/17 | United States | 4,700,000 | 4,653,329 | |
| qGMAC Commercial Mortgage Securities Inc., 2005-C1, B, 4.936%, | ||||
| 5/10/43 | United States | 10,285,000 | 2,558,295 | |
112 | Annual Report
franklintempleton.com
FRANKLIN INVESTORS SECURITIES TRUST
STATEMENT OF INVESTMENTS
| Franklin Total Return Fund (continued) | |||||
| Principal | |||||
| Country | Amount* | Value | |||
| Asset-Backed Securities and Commercial | |||||
| Mortgage-Backed Securities (continued) | |||||
| Diversified Financials (continued) | |||||
| Green Tree Financial Corp., | |||||
| 1996-9, M1, 7.63%, 8/15/27 | United States | 3,994,830 | $ | 4,396,998 | |
| 1999-3, A7, 6.74%, 2/01/31 | United States | 552,378 | 554,311 | ||
| Greenpoint Manufactured Housing, 1999-3, 1A7, 7.27%, 6/15/29 | United States | 15,889,973 | 16,039,529 | ||
| gGSAA Home Equity Trust, 05-5, M3, FRN, 1.097%, 2/25/35 | United States | 3,550,000 | 3,350,501 | ||
| dHighbridge Loan Management Ltd., 2013-2A, B2, 144A, 5.80%, | |||||
| 10/20/24 | United States | 2,620,000 | 2,647,222 | ||
| gHome Equity Mortgage Trust, 2004-4, M3, FRN, 1.127%, 12/25/34 | United States | 3,775,334 | 3,433,749 | ||
| g,qJP Morgan Chase Commercial Mortgage Securities Trust, 2006-CB16, B, | |||||
| FRN, 5.672%, 5/12/45 | United States | 6,745,000 | 5,178,783 | ||
| gJP Morgan Mortgage Acquisition Corp., 2006-ACC1, A4, FRN, 0.302%, | |||||
| 5/25/36 | United States | 1,456,064 | 1,437,232 | ||
| d,gKatonah Ltd., 2007-IA, A2L, 144A, FRN, 1.731%, 4/23/22 | United States | 5,416,684 | 5,400,542 | ||
| d,gLandmark IX CDO Ltd., 2007-9A, C, 144A, FRN, 0.931%, 4/15/21 | United States | 2,190,000 | 2,108,291 | ||
| dLegacy Benefits Insurance Settlements LLC, 2004-1, A, 144A, 5.35%, | |||||
| 2/10/39 | United States | 1,515,036 | 1,443,072 | ||
| Lehman ABS Corp., 2003-1, A1, 5.50%, 12/25/33 | United States | 3,930,634 | 4,025,449 | ||
| g,qLong Beach Mortgage Loan Trust, 2005-WL2, M1, FRN, 0.622%, | |||||
| 8/25/35 | United States | 2,018,042 | 2,003,996 | ||
| d,gMountain View CLO II Ltd., 2006-2A, C, 144A, FRN, 0.93%, 1/12/21 | United States | 4,000,000 | 3,769,280 | ||
| d,gNewcastle CDO Ltd., 2004-5A, 1, 144A, FRN, 0.576%, 12/24/39 | United States | 2,341,922 | 2,301,047 | ||
| d,gPegasus 2006-1 Ltd., 2006-1A, A1, 144A, FRN, 0.552%, 7/25/49 | United States | 6,430,000 | 5,918,815 | ||
| Residential Asset Securities Corp., | |||||
| 2001-KS2, AI5, 7.514%, 6/25/31 | United States | 8,615 | 8,728 | ||
| 2004-KS1, AI4, 4.213%, 4/25/32 | United States | 169,105 | 169,009 | ||
| g2005-AHL2, A2, FRN, 0.412%, 10/25/35 | United States | 42,309 | 42,368 | ||
| gSLM Student Loan Trust, 2005-4, A2, FRN, 0.314%, 4/26/21 | United States | 54,275 | 54,244 | ||
| gStructured Asset Securities Corp., | |||||
| 2002-1A, 2A1, FRN, 1.743%, 2/25/32 | United States | 26,895 | 24,116 | ||
| 2006-WF1, A5, FRN, 0.452%, 2/25/36 | United States | 7,575,575 | 7,459,543 | ||
| e,gTalisman 6 Finance, Reg S, FRN, 0.262%, 10/22/16 | Germany | 12,558,768 | EUR | 15,360,661 | |
| d,gVeritas CLO Ltd., 2006-2A, A2, 144A, FRN, 0.56%, 7/11/21 | United States | 1,300,000 | 1,276,210 | ||
| d,gWest CLO Ltd., 2014-1A, | |||||
| A2, 144A, FRN, 2.333%, 7/18/26 | United States | 2,860,000 | 2,860,000 | ||
| B, 144A, FRN, 3.083%, 7/18/26 | United States | 7,540,000 | 7,365,072 | ||
| d,gWestchester CLO Ltd., 2007-1A, A1A, 144A, FRN, 0.465%, 8/01/22 | United States | 3,442,858 | 3,415,005 | ||
| 370,699,414 | |||||
| Real Estate 0.2% | |||||
| d,gAmerican Homes 4 Rent, 2014-SFR1, A, 144A, FRN, 1.25%, 6/17/31 | United States | 2,425,480 | 2,411,626 | ||
| d,gCitigroup Mortgage Loan Trust Inc., 2013-A, A, 144A, FRN, 3.00%, | |||||
| 5/25/42 | United States | 6,192,028 | 6,271,602 | ||
| 8,683,228 | |||||
| Total Asset-Backed Securities and Commercial | |||||
| Mortgage-Backed Securities (Cost $725,738,947) | 749,707,976 |
franklintempleton.com Annual Report | 113
| FRANKLIN INVESTORS SECURITIES TRUST | ||||
| STATEMENT OF INVESTMENTS | ||||
| Franklin Total Return Fund (continued) | ||||
| Principal | ||||
| Country | Amount* | Value | ||
| Mortgage-Backed Securities 18.1% | ||||
| gFederal Home Loan Mortgage Corp. (FHLMC) Adjustable Rate 0.1% | ||||
| FHLMC, 1.926% - 3.275%, 11/01/27 – 10/01/36 | United States | 4,076,357 | $ | 4,253,038 |
| Federal Home Loan Mortgage Corp. (FHLMC) Fixed Rate 2.0% | ||||
| FHLMC 30 Year, 6.00%, 6/01/37 | United States | 108,804 | 122,800 | |
| FHLMC 30 Year, 6.50%, 8/01/25 - 11/01/31 | United States | 164,612 | 188,645 | |
| FHLMC 30 Year, 7.00%, 7/01/31 | United States | 7,367 | 7,888 | |
| FHLMC 30 Year, 8.00%, 2/01/30 | United States | 47,336 | 55,986 | |
| FHLMC 30 Year, 8.50%, 10/01/24 | United States | 8,354 | 10,219 | |
| FHLMC Gold 15 Year, 5.00%, 10/01/17 - 9/01/18 | United States | 85,044 | 89,741 | |
| FHLMC Gold 15 Year, 5.50%, 11/01/22 | United States | 252,788 | 267,441 | |
| FHLMC Gold 15 Year, 6.00%, 2/01/17 - 9/01/22 | United States | 797,465 | 875,378 | |
| hFHLMC Gold 30 Year, 4.00%, 11/01/39 | United States | 47,700,000 | 50,606,720 | |
| FHLMC Gold 30 Year, 4.50%, 3/01/39 | United States | 3,896,944 | 4,222,755 | |
| FHLMC Gold 30 Year, 5.00%, 8/01/33 - 2/01/39 | United States | 29,675,493 | 32,796,909 | |
| FHLMC Gold 30 Year, 5.50%, 1/01/35 - 12/01/37 | United States | 2,893,164 | 3,223,919 | |
| FHLMC Gold 30 Year, 6.00%, 5/01/33 - 4/01/38 | United States | 3,148,302 | 3,557,140 | |
| FHLMC Gold 30 Year, 6.50%, 4/01/28 - 3/01/39 | United States | 2,304,841 | 2,650,336 | |
| FHLMC Gold 30 Year, 7.00%, 1/01/28 - 7/01/32 | United States | 149,251 | 172,612 | |
| FHLMC Gold 30 Year, 7.50%, 3/01/32 | United States | 30,375 | 34,862 | |
| FHLMC Gold 30 Year, 8.50%, 8/01/30 | United States | 4,923 | 5,655 | |
| FHLMC Gold 30 Year, 9.00%, 1/01/22 | United States | 11,761 | 11,921 | |
| FHLMC Gold 30 Year, 10.00%, 10/01/30 | United States | 24,276 | 24,765 | |
| 98,925,692 | ||||
| gFederal National Mortgage Association (FNMA) Adjustable Rate 0.2% | ||||
| FNMA, 1.737% - 4.733%, 6/01/17 - 10/01/36 | United States | 9,255,355 | 9,824,229 | |
| Federal National Mortgage Association (FNMA) Fixed Rate 14.7% | ||||
| hFNMA 15 Year, 3.00%, 11/01/27 | United States | 226,700,000 | 235,130,413 | |
| FNMA 15 Year, 4.50%, 3/01/19 - 6/01/19 | United States | 233,057 | 245,815 | |
| FNMA 15 Year, 5.00%, 6/01/18 - 7/01/18 | United States | 177,412 | 187,342 | |
| FNMA 15 Year, 5.50%, 6/01/16 - 12/01/23 | United States | 551,708 | 597,558 | |
| FNMA 15 Year, 6.00%, 5/01/17 - 9/01/22 | United States | 114,066 | 122,394 | |
| FNMA 15 Year, 6.50%, 4/01/16 - 9/01/16 | United States | 2,993 | 3,045 | |
| hFNMA 30 Year, 3.00%, 10/01/42 | United States | 175,000,000 | 175,041,008 | |
| hFNMA 30 Year, 3.50%, 11/01/42 | United States | 16,000,000 | 16,546,242 | |
| hFNMA 30 Year, 4.00%, 11/01/40 | United States | 253,000,000 | 268,634,621 | |
| FNMA 30 Year, 5.00%, 6/01/36 - 5/01/39 | United States | 4,080,523 | 4,518,575 | |
| FNMA 30 Year, 5.50%, 6/01/33 - 8/01/37 | United States | 13,645,721 | 15,376,401 | |
| FNMA 30 Year, 6.00%, 9/01/32 - 9/01/38 | United States | 19,475,832 | 22,083,758 | |
| FNMA 30 Year, 6.50%, 5/01/28 - 5/01/37 | United States | 471,946 | 537,940 | |
| FNMA 30 Year, 7.00%, 11/01/25 | United States | 4,638 | 4,744 | |
| FNMA 30 Year, 7.50%, 1/01/30 | United States | 20,542 | 25,170 | |
| FNMA 30 Year, 8.50%, 4/01/30 - 5/01/32 | United States | 121,862 | 147,202 | |
| FNMA 30 Year, 9.00%, 11/01/26 - 5/01/27 | United States | 132,817 | 147,630 | |
| 739,349,858 | ||||
| gGovernment National Mortgage Association (GNMA) Adjustable | ||||
| Rate 0.0%† | ||||
| GNMA, 1.625%, 1/20/23 - 10/20/26 | United States | 69,701 | 72,138 | |
114 | Annual Report
franklintempleton.com
FRANKLIN INVESTORS SECURITIES TRUST
STATEMENT OF INVESTMENTS
| Franklin Total Return Fund (continued) | ||||
| Principal | ||||
| Country | Amount* | Value | ||
| Mortgage-Backed Securities (continued) | ||||
| Government National Mortgage Association (GNMA) Fixed Rate 1.1% | ||||
| GNMA I SF 30 Year, 6.00%, 1/15/39 | United States | 394,824 | $ | 445,379 |
| GNMA I SF 30 Year, 6.50%, 10/15/31 - 7/15/38 | United States | 82,287 | 94,155 | |
| GNMA I SF 30 Year, 7.00%, 10/15/27 - 6/15/31 | United States | 61,159 | 71,307 | |
| GNMA I SF 30 Year, 7.50%, 2/15/17 - 5/15/26 | United States | 173,370 | 182,056 | |
| GNMA I SF 30 Year, 8.00%, 8/15/16 - 5/15/17 | United States | 39,201 | 39,555 | |
| GNMA I SF 30 Year, 9.00%, 9/15/25 - 1/15/31 | United States | 2,243 | 2,363 | |
| hGNMA II SF 30 Year, 3.50%, 11/01/42 | United States | 50,000,000 | 52,313,476 | |
| GNMA II SF 30 Year, 6.00%, 5/20/31 | United States | 9,012 | 10,387 | |
| GNMA II SF 30 Year, 6.50%, 3/20/28 - 7/20/38 | United States | 978,889 | 1,118,414 | |
| GNMA II SF 30 Year, 7.50%, 8/20/30 - 1/20/33 | United States | 86,717 | 102,511 | |
| GNMA II SF 30 Year, 8.00%, 7/20/27 | United States | 53,698 | 55,381 | |
| 54,434,984 | ||||
| Total Mortgage-Backed Securities | ||||
| (Cost $896,518,175) | 906,859,939 | |||
| Municipal Bonds 3.3% | ||||
| Alabama Federal Aid Highway Finance Authority Federal Highway | ||||
| Revenue, Grant Anticipation Bond, 5.00%, 9/01/25 | United States | 14,000,000 | 16,417,940 | |
| Arkansas State GO, Four-Lane Highway Construction and Improvement | ||||
| Bonds, 3.25%, 6/15/22 | United States | 13,800,000 | 14,969,964 | |
| California State GO, Various Purpose, 6.00%, 11/01/39 | United States | 2,385,000 | 2,896,559 | |
| gCalifornia State Judgement Trust COP, FRN, 1.583%, 6/01/15 | United States | 1,000,000 | 984,290 | |
| Chicago Transit Authority Sales and Transfer Tax Receipts Revenue, | ||||
| Pension Funding, Series A, 6.899%, 12/01/40 | United States | 800,000 | 991,848 | |
| Coachella Valley USD, GO, Riverside and Imperial Counties, Election of | ||||
| 2005, Series D, AGMC Insured, 5.00%, 8/01/37 | United States | 6,395,000 | 7,131,832 | |
| Colorado State ISD, GO, Mitchell and Scurry Counties, School Building, | ||||
| PSF Guarantee, 5.00%, 8/15/38 | United States | 2,600,000 | 2,987,738 | |
| Connecticut State GO, Series B, 5.00%, 4/15/18 | United States | 650,000 | 740,896 | |
| Evansville Local Public Improvement Bond Bank Revenue, Sewage Works | ||||
| Project, Series A, 5.00%, 7/01/36 | United States | 1,355,000 | 1,525,418 | |
| Florida Hurricane Catastrophe Fund Finance Corp. Revenue, Series A, | ||||
| 2.995%, 7/01/20 | United States | 16,800,000 | 17,020,080 | |
| Illinois State GO, 5.877%, 3/01/19 | United States | 9,200,000 | 10,220,188 | |
| Massachusetts State GO, Consolidated Loan of 2014, Series A, 4.50%, | ||||
| 12/01/43 | United States | 4,950,000 | 5,302,489 | |
| Minnesota State GO, Various Purpose, Refunding, Series F, 4.00%, | ||||
| 10/01/24 | United States | 5,760,000 | 6,564,269 | |
| Nassau County GO, General Improvement Bonds, Series B, 5.00%, | ||||
| 4/01/39 | United States | 7,700,000 | 8,540,455 | |
| 4/01/43 | United States | 8,150,000 | 8,921,479 | |
| New Jersey EDA Revenue, School Facilities Construction, Refunding, | ||||
| Series NN, 5.00%, 3/01/30 | United States | 3,300,000 | 3,607,197 | |
| New York City Municipal Water Finance Authority Water and Sewer System | ||||
| Revenue, Second General Resolution, Fiscal 2014, Refunding, Series BB, | ||||
| 5.00%, 6/15/46 | United States | 4,865,000 | 5,437,854 | |
| New York State Urban Development Corp. Revenue, State Personal | ||||
| Income Tax, General Purpose, Series C, 5.00%, 3/15/29 | United States | 20,725,000 | 24,304,622 |
franklintempleton.com Annual Report | 115
FRANKLIN INVESTORS SECURITIES TRUST
STATEMENT OF INVESTMENTS
| Franklin Total Return Fund (continued) | |||||
| Principal | |||||
| Country | Amount* | Value | |||
| Municipal Bonds (continued) | |||||
| Puerto Rico Electric Power Authority Power Revenue, Series A, 6.75%, | |||||
| 7/01/36 | United States | 12,000,000 | $ | 6,000,120 | |
| Puerto Rico Sales Tax FICO Revenue, Capital Appreciation, Refunding, | |||||
| Series A, zero cpn., 8/01/26 | United States | 10,300,000 | 3,736,943 | ||
| Puerto Rico Sales Tax FICO Sales Tax Revenue, | |||||
| first subordinate, Series A, 6.50%, 8/01/44 | United States | 13,200,000 | 10,687,512 | ||
| Capital Appreciation, Series A, zero cpn., 8/01/25 | United States | 7,450,000 | 2,935,672 | ||
| South Carolina State Public Service Authority Revenue, Refunding, | |||||
| Series B, 5.00%, 12/01/38 | United States | 4,500,000 | 5,013,270 | ||
| Total Municipal Bonds (Cost $163,009,430) | 166,938,635 | ||||
| Shares | |||||
| Escrows and Litigation Trusts 0.0%† | |||||
| a,kComfort Co. Inc., Escrow Account | United States | 716 | — | ||
| aMotors Liquidation Co., Escrow Account, cvt. pfd., C | United States | 43,500 | 435 | ||
| aMotors Liquidation Co., GUC Trust, Escrow Account | United States | 1,113 | 25,710 | ||
| a,kNewPage Corp., Litigation Trust | United States | 2,500,000 | — | ||
| Total Escrows and Litigation Trusts (Cost $47,628) | 26,145 | ||||
| Notional | |||||
| Counterparty | Amount* | ||||
| Options Purchased 0.0%† | |||||
| Calls – Over-the-Counter | |||||
| Credit Default Swaptions 0.0%† | |||||
| Buy protection on CDX.NA.HY.22, Premium Rate 5.00%, Strike Price $106, | |||||
| Expires 12/17/14 | CITI | 24,000,000 | r | $ | 165,940 |
| Buy protection on CDX.NA.HY.22, Premium Rate 5.00%, Strike Price $106, | |||||
| Expires 12/17/14 | FBCO | 12,000,000 | r | 82,970 | |
| Buy protection on CDX.NA.IG.22, Premium Rate 1.00%, Strike Price $80, | |||||
| Expires 12/17/14 | FBCO | 71,000,000 | r | 32,731 | |
| Buy Protection on CDX.NA.IG.23, Premium Rate 1.00%, Strike Price $75, | |||||
| Expires 3/18/15 | FBCO | 75,000,000 | r | 229,800 | |
| 511,441 | |||||
| Currency Options 0.0%† | |||||
| USD/KRW, December Strike Price 1,068 KRW, Expires 12/15/14 | BZWS | 9,500,000 | r | 142,462 | |
| USD/MXN, December Strike Price 13.80 MXN, Expires 12/15/14 | CITI | 7,200,000 | r | 27,403 | |
| USD/MYR, December Strike Price 3.37 MYR, Expires 12/15/14 | CITI | 7,200,000 | r | 26,993 | |
| 196,858 | |||||
| Interest Rate Swaptions 0.0%† | |||||
| Pay fixed 3.10%, receive float 3-month USD LIBOR+29bps, | |||||
| Expires 12/29/14 | HSBC | 251,000,000 | r | 130,771 | |
| Total Options Purchased (Cost $3,569,778) | 839,070 | ||||
| Total Investments before Short Term Investments | |||||
| (Cost $4,340,146,697) | 4,427,124,134 | ||||
116 | Annual Report franklintempleton.com
FRANKLIN INVESTORS SECURITIES TRUST
STATEMENT OF INVESTMENTS
| Franklin Total Return Fund (continued) | ||||||
| Principal | ||||||
| Country | Amount* | Value | ||||
| Short Term Investments 26.0% | ||||||
| Foreign Government and Agency Securities 0.0%† | ||||||
| sBank of Negara Monetary Note, 11/06/14 | Malaysia | 4,185,000 | MYR | $ | 1,271,500 | |
| sPhilippine Treasury Bill, 11/05/14 | Philippines | 1,620,000 | PHP | 36,022 | ||
| Total Foreign Government and Agency Securities | ||||||
| (Cost $1,350,288) | 1,307,522 | |||||
| U.S. Government and Agency Securities 7.5% | ||||||
| sU.S. Treasury Bills, | ||||||
| 11/06/14 | United States | 134,200,000 | 134,200,000 | |||
| 1/02/15 | United States | 60,000,000 | 59,999,760 | |||
| 1/15/15 | United States | 55,000,000 | 54,999,175 | |||
| 11/20/14 - 2/05/15 | United States | 125,000,000 | 124,999,025 | |||
| Total U.S. Government and Agency Securities | ||||||
| (Cost $374,192,758) | 374,197,960 | |||||
| Total Investments before Money Market Funds | ||||||
| (Cost $4,715,689,743) | 4,802,629,616 | |||||
| Shares | ||||||
| Money Market Funds (Cost $925,721,636) 18.5% | ||||||
| a,tInstitutional Fiduciary Trust Money Market Portfolio | United States | 925,721,636 | 925,721,636 | |||
| Total Investments (Cost $5,641,411,379) 114.3% | 5,728,351,252 | |||||
| Options Written (0.0)%† | (110,540 | ) | ||||
| Other Assets, less Liabilities (14.3)% | (715,446,765 | ) | ||||
| Net Assets 100.0% | $ | 5,012,793,947 | ||||
| Notional | ||||||
| Counterparty | Amount* | |||||
| uOptions Written (0.0)%† | ||||||
| Calls – Over-the-Counter | ||||||
| Currency Options (0.0)%† | ||||||
| USD/KRW, December Strike Price 1,085 KRW, Expires, 12/15/14 | CITI | 9,500,000 | r | $ | (78,147 | ) |
| USD/MXN, December Strike Price 14 MXN, Expires, 12/15/14 | BZWS | 7,200,000 | r | (14,515 | ) | |
| USD/MYR, December Strike Price 3.4 MYR, Expires, 12/15/14 | CITI | 7,200,000 | r | (17,878 | ) | |
| Total Options Written (Premiums Received $93,655) | $ | (110,540 | ) | |||
†Rounds to less than 0.1% of net assets.
*The principal/notional amount is stated in U.S. dollars unless otherwise indicated.
aNon-income producing.
bThe security is owned by FT Holdings Corporation I, a wholly-owned subsidiary of the Fund. See Note 1(g).
cAt October 31, 2014, pursuant to the Fund’s policies and the requirements of applicable securities law, the Fund may be restricted from trading these securities for a limited
or extended period of time.
dSecurity was purchased pursuant to Rule 144A under the Securities Act of 1933 and may be sold in transactions exempt from registration only to qualified institutional buy-
ers or in a public offering registered under the Securities Act of 1933. These securities have been deemed liquid under guidelines approved by the Trust’s Board of Trustees.
At October 31, 2014, the aggregate value of these securities was $680,025,533, representing 13.57% of net assets.
eSecurity was purchased pursuant to Regulation S under the Securities Act of 1933, which exempts from registration securities offered and sold outside of the United States.
Such a security cannot be sold in the United States without either an effective registration statement filed pursuant to the Securities Act of 1933, or pursuant to an exemption
from registration. These securities have been deemed liquid under guidelines approved by the Trust’s Board of Trustees. At October 31, 2014, the aggregate value of these
securities was $69,626,981, representing 1.39% of net assets.
franklintempleton.com Annual Report | 117
FRANKLIN INVESTORS SECURITIES TRUST
STATEMENT OF INVESTMENTS
Franklin Total Return Fund (continued)
fPerpetual security with no stated maturity date.
gThe coupon rate shown represents the rate at period end.
hSecurity purchased on a when-issued or to-be-announced (TBA) basis. See Note 1(c).
iSee Note 1(f) regarding loan participation notes.
jSee Note 1(i) regarding senior floating rate interests.
kSecurity has been deemed illiquid because it may not be able to be sold within seven days. At October 31, 2014, the aggregate value of these securities was $32,408,
representing less than 0.01% of net assets.
lIncome may be received in additional securities and/or cash.
mPrincipal amount is stated in 100 Mexican Peso Units.
nPrincipal amount of security is adjusted for inflation. See Note 1(k).
oPrincipal amount is stated in 1,000 Brazilian Real Units.
pRedemption price at maturity is adjusted for inflation. See Note 1(k).
qThe bond pays interest and/or principal based upon the issuer’s ability to pay, which may be less than the stated interest rate or principal paydown.
rAmount represents notional amount under the terms of the option.
sThe security is traded on a discount basis with no stated coupon rate.
tSee Note 3(f) regarding investments in Institutional Fiduciary Trust Money Market Portfolio.
uSee Note 1(d) regarding written options.
At October 31, 2014, the fund had the following financial futures contracts outstanding. See Note 1(d).
| Financial Futures Contracts | ||||||||||
| Number of | Notional | Expiration | Unrealized | Unrealized | ||||||
| Description | Type | Contracts | Value | Date | Appreciation | Depreciation | ||||
| Interest Rate Contracts | ||||||||||
| U.S. Treasury 2 Yr. Note | Short | 1,019 | $ | 223,734,188 | 12/31/14 | $ | — | $ | (639,422 | ) |
| U.S. Treasury 5 Yr. Note | Short | 3,623 | 432,693,758 | 12/31/14 | — | (2,449,280 | ) | |||
| U.S. Treasury 10 Yr. Note | Short | 350 | 44,225,781 | 12/19/14 | — | (525,875 | ) | |||
| Net unrealized appreciation (depreciation) | $ | (3,614,577 | ) |
At October 31, 2014, the fund had the following forward exchange contracts outstanding. See Note 1(d).
| Forward Exchange Contracts | ||||||||||
| Contract | Settlement | Unrealized | Unrealized | |||||||
| Currency | Counterpartya Type | Quantity | Amount* | Date | Appreciation | Depreciation | ||||
| Euro | DBAB | Sell | 961,000 | 1,301,050 | 11/10/14 | $ | 96,359 | $ | — | |
| Euro | JPHQ | Sell | 78,316 | 104,430 | 11/12/14 | 6,253 | — | |||
| Japanese Yen | JPHQ | Sell | 857,065,000 | 8,666,852 | 11/13/14 | 1,029,421 | — | |||
| Euro | MSCO | Sell | 1,183,360 | 1,592,548 | 11/17/14 | 109,045 | — | |||
| Singapore Dollar | MSCO | Buy | 14,102,839 | 11,315,312 | 11/17/14 | — | (338,237 | ) | ||
| Malaysian Ringgit | DBAB | Buy | 1,339,880 | 411,170 | 11/19/14 | — | (4,592 | ) | ||
| Euro | DBAB | Sell | 233,000 | 315,331 | 11/20/14 | 23,228 | — | |||
| Euro | JPHQ | Sell | 888,264 | 1,202,367 | 11/20/14 | 88,786 | — | |||
| Japanese Yen | JPHQ | Sell | 2,236,935,360 | 22,425,080 | 11/20/14 | 2,490,372 | — | |||
| Malaysian Ringgit | HSBC | Buy | 790,000 | 242,629 | 11/20/14 | — | (2,928 | ) | ||
| Euro | MSCO | Sell | 4,438,000 | 6,012,425 | 12/04/14 | 448,169 | — | |||
| Euro | DBAB | Sell | 159,550 | 219,405 | 12/18/14 | 19,346 | — | |||
| Malaysian Ringgit | DBAB | Buy | 2,028,100 | 605,403 | 1/07/15 | 7,876 | — | |||
| Canadian Dollar | BZWS | Buy | 8,841,000 | 7,999,734 | 1/09/15 | — | (167,777 | ) | ||
| Canadian Dollar | CITI | Buy | 2,898,000 | 2,587,731 | 1/09/15 | — | (20,486 | ) | ||
| Canadian Dollar | DBAB | Buy | 7,846,000 | 7,077,107 | 1/09/15 | — | (126,589 | ) | ||
118 | Annual Report franklintempleton.com
| FRANKLIN INVESTORS SECURITIES TRUST | |||||||||||
| STATEMENT OF INVESTMENTS | |||||||||||
| Franklin Total Return Fund (continued) | |||||||||||
| Forward Exchange Contracts (continued) | |||||||||||
| Contract | Settlement | Unrealized | Unrealized | ||||||||
| Currency | Counterpartya Type | Quantity | Amount* | Date | Appreciation | Depreciation | |||||
| Canadian Dollar | DBAB | Sell | 3,143,000 | 2,827,710 | 1/09/15 | $ | 43,428 | $ | — | ||
| Chilean Peso | BZWS | Buy | 1,862,800,000 | 3,214,495 | 1/09/15 | 2,285 | — | ||||
| Euro | BZWS | Sell | 2,472,961 | 3,403,808 | 1/09/15 | 302,481 | — | ||||
| Euro | CITI | Sell | 2,584,200 | 3,501,824 | 1/09/15 | 260,992 | — | ||||
| Euro | DBAB | Buy | 3,132,237 | 4,358,821 | 1/09/15 | — | (430,699 | ) | |||
| Euro | DBAB | Sell | 22,752,696 | 30,970,795 | 1/09/15 | 2,436,759 | — | ||||
| Euro | JPHQ | Sell | 1,062,724 | 1,462,175 | 1/09/15 | 129,419 | — | ||||
| Japanese Yen | BZWS | Sell | 716,900,000 | 7,019,508 | 1/09/15 | 626,019 | — | ||||
| Japanese Yen | CITI | Sell | 1,431,560,000 | 14,003,848 | 1/09/15 | 1,236,847 | — | ||||
| Japanese Yen | DBAB | Sell | 14,747,964,120 | 142,590,432 | 1/09/15 | 11,064,493 | — | ||||
| Japanese Yen | GSCO | Sell | 478,870,000 | 4,677,150 | 1/09/15 | 406,471 | — | ||||
| Japanese Yen | HSBC | Sell | 720,750,000 | 7,136,351 | 1/09/15 | 708,526 | — | ||||
| Japanese Yen | JPHQ | Sell | 1,676,801,000 | 16,492,272 | 1/09/15 | 1,538,152 | — | ||||
| Malaysian Ringgit | DBAB | Buy | 21,721,000 | 6,426,902 | 1/09/15 | 140,426 | — | ||||
| Malaysian Ringgit | DBAB | Sell | 9,816,000 | 2,992,774 | 1/09/15 | 24,914 | — | ||||
| Singapore Dollar | DBAB | Buy | 12,305,600 | 9,708,066 | 1/09/15 | — | (129,823 | ) | |||
| Euro | DBAB | Sell | 8,374,000 | 10,924,894 | 2/06/15 | 420,986 | — | ||||
| Canadian Dollar | BZWS | Buy | 1,848,000 | 1,653,884 | 2/09/15 | — | (18,092 | ) | |||
| Canadian Dollar | HSBC | Buy | 3,103,000 | 2,776,897 | 2/09/15 | — | (30,219 | ) | |||
| Chilean Peso | DBAB | Buy | 225,860,000 | 390,761 | 2/09/15 | — | (1,859 | ) | |||
| Chilean Peso | JPHQ | Buy | 824,603,750 | 1,406,694 | 2/09/15 | 13,169 | — | ||||
| Euro | DBAB | Sell | 53,496,190 | 73,777,245 | 2/09/15 | 6,673,008 | — | ||||
| Euro | JPHQ | Sell | 6,587,400 | 9,159,359 | 2/09/15 | 896,295 | — | ||||
| Singapore Dollar | DBAB | Buy | 2,965,200 | 2,341,255 | 2/09/15 | — | (33,260 | ) | |||
| Singapore Dollar | HSBC | Buy | 3,390,000 | 2,676,953 | 2/09/15 | — | (38,310 | ) | |||
| Singapore Dollar | JPHQ | Buy | 2,117,000 | 1,671,905 | 2/09/15 | — | (24,116 | ) | |||
| Chilean Peso | JPHQ | Buy | 562,321,000 | 980,507 | 3/09/15 | — | (14,624 | ) | |||
| Chilean Peso | MSCO | Buy | 1,195,400,000 | 2,114,707 | 3/09/15 | — | (61,402 | ) | |||
| Euro | DBAB | Sell | 13,480,249 | 18,345,980 | 3/09/15 | 1,433,384 | — | ||||
| Euro | GSCO | Sell | 1,024,000 | 1,403,443 | 3/09/15 | 118,712 | — | ||||
| Euro | JPHQ | Sell | 11,680,000 | 16,112,151 | 3/09/15 | 1,458,184 | — | ||||
| Japanese Yen | DBAB | Sell | 6,090,340,000 | 59,818,144 | 3/09/15 | 5,468,530 | — | ||||
| Japanese Yen | HSBC | Sell | 452,730,000 | 4,428,977 | 3/09/15 | 388,857 | — | ||||
| Japanese Yen | JPHQ | Sell | 1,328,470,000 | 12,993,376 | 3/09/15 | 1,138,237 | — | ||||
| Singapore Dollar | DBAB | Buy | 3,192,500 | 2,556,229 | 3/09/15 | — | (71,294 | ) | |||
| Singapore Dollar | HSBC | Buy | 2,551,000 | 2,041,715 | 3/09/15 | — | (56,102 | ) | |||
| Singapore Dollar | JPHQ | Buy | 15,450,000 | 12,362,967 | 3/09/15 | — | (337,206 | ) | |||
| Singapore Dollar | MSCO | Buy | 8,200,000 | 6,528,143 | 3/09/15 | — | (145,538 | ) | |||
| Swedish Krona | DBAB | Buy | 188,676,100 | 20,686,354 | EUR | 3/09/15 | — | (389,457 | ) | ||
| Swiss Franc | DBAB | Buy | 13,270,875 | 14,680,171 | 4/16/15 | — | (859,839 | ) | |||
| Swiss Franc | DBAB | Sell | 13,270,875 | 14,914,055 | 4/16/15 | 1,093,722 | — | ||||
| Chilean Peso | CITI | Buy | 906,403,000 | 1,522,087 | 5/07/15 | 26,705 | — | ||||
| Chilean Peso | MSCO | Buy | 3,670,729,000 | 6,340,869 | 5/07/15 | — | (68,608 | ) | |||
| Euro | BZWS | Sell | 1,973,970 | 2,600,266 | 5/07/15 | 122,599 | — | ||||
| Euro | CITI | Sell | 615,870 | 824,967 | 5/07/15 | 51,946 | — | ||||
| Euro | DBAB | Sell | 65,571,692 | 86,315,843 | 5/07/15 | 4,012,262 | — | ||||
| Euro | HSBC | Sell | 267,000 | 341,979 | 5/07/15 | 6,849 | — | ||||
| Euro | JPHQ | Sell | 3,445,999 | 4,617,570 | 5/07/15 | 292,257 | — | ||||
| Japanese Yen | DBAB | Sell | 117,763,200 | 1,092,220 | 5/07/15 | 40,578 | — | ||||
| Philippine Peso | JPHQ | Buy | 566,370,000 | 12,864,736 | 5/07/15 | — | (320,118 | ) | |||
| Euro | DBAB | Sell | 31,500,000 | 41,507,550 | 6/05/15 | 1,958,290 | — | ||||
| franklintempleton.com | Annual Report | 119 | ||||||||||
FRANKLIN INVESTORS SECURITIES TRUST
STATEMENT OF INVESTMENTS
| Franklin Total Return Fund (continued) | ||||||||||
| Forward Exchange Contracts (continued) | ||||||||||
| Contract | Settlement | Unrealized | Unrealized | |||||||
| Currency | Counterpartya Type | Quantity | Amount* | Date | Appreciation | Depreciation | ||||
| Chilean Peso | DBAB | Buy | 651,808,600 | 1,100,006 | 6/18/15 | $ | 9,155 | $ | — | |
| Euro | DBAB | Sell | 3,725,791 | 4,749,266 | 6/18/15 | 70,810 | — | |||
| Euro | DBAB | Sell | 1,710,278 | 2,198,391 | 6/22/15 | 50,719 | — | |||
| Euro | DBAB | Sell | 8,374,000 | 10,963,814 | 2/05/16 | 412,683 | — | |||
| Euro | DBAB | Sell | 10,260,000 | 13,583,727 | 8/05/16 | 619,167 | — | |||
| Japanese Yen | JPHQ | Sell | 538,462,167 | 5,279,041 | 9/02/16 | 423,833 | — | |||
| Unrealized appreciation (depreciation) | 50,441,004 | (3,691,175 | ) | |||||||
| Net unrealized appreciation (depreciation) | $ | 46,749,829 | ||||||||
*In U.S. dollars unless otherwise indicated.
aMay be comprised of multiple contracts using the same currency and settlement date.
At October 31, 2014, the fund had the following credit default swap contracts outstanding. See Note 1(d).
| Credit Default Swap Contracts | ||||||||||||||||||
| Upfront | ||||||||||||||||||
| Periodic | Premiums | |||||||||||||||||
| Counter- | Notional | Payment | Expiration | Paid | Unrealized | Unrealized | Market | |||||||||||
| Description | party | Amounta | Rate | Date (Received) | Appreciation | Depreciation | Value | Ratingb | ||||||||||
| OTC Swaps | ||||||||||||||||||
| Contracts to Buy Protection | ||||||||||||||||||
| Single Name | ||||||||||||||||||
| Bank of America Corp. | FBCO | 20,000,000 | 1.00 | % | 9/20/17 | $ | 173,770 | $ | — | $ | (478,256 | ) | $ | (304,486 | ) | |||
| Centex Corp. | FBCO | 7,795,000 | 5.00 | % | 6/20/16 | (319,576 | ) | — | (312,671 | ) | (632,247 | ) | ||||||
| Centex Corp. | JPHQ | 12,000,000 | 5.00 | % | 6/20/16 | (588,876 | ) | — | (384,436 | ) | (973,312 | ) | ||||||
| CIT Group Inc. | GSCO | 22,500,000 | 5.00 | % | 6/20/17 | (1,861,068 | ) | — | (418,405 | ) | (2,279,473 | ) | ||||||
| CNA Financial Corp. | GSCO | 10,000,000 | 5.00 | % | 12/20/14 | (44,792 | ) | — | (23,224 | ) | (68,016 | ) | ||||||
| Constellation Brands Inc. | BZWS | 5,000,000 | 5.00 | % | 6/20/17 | (403,324 | ) | — | (171,720 | ) | (575,044 | ) | ||||||
| Constellation Brands Inc. | DBAB | 2,000,000 | 5.00 | % | 6/20/17 | (162,437 | ) | — | (67,581 | ) | (230,018 | ) | ||||||
| D.R. Horton Inc. | JPHQ | 7,000,000 | 5.00 | % | 3/20/16 | (374,753 | ) | — | (80,418 | ) | (455,171 | ) | ||||||
| Dean Foods Co. | JPHQ | 11,506,000 | 5.00 | % | 6/20/16 | (558,156 | ) | — | (167,409 | ) | (725,565 | ) | ||||||
| Dell Inc. | GSCO | 15,000,000 | 5.00 | % | 6/20/16 | (1,019,247 | ) | — | (74,701 | ) | (1,093,948 | ) | ||||||
| DISH DBS Corp. | GSCO | 5,000,000 | 5.00 | % | 3/20/16 | (269,873 | ) | — | (33,796 | ) | (303,669 | ) | ||||||
| DISH DBS Corp. | JPHQ | 6,000,000 | 5.00 | % | 3/20/16 | (323,847 | ) | — | (40,555 | ) | (364,402 | ) | ||||||
| DPL Inc. | MSCO | 875,000 | 5.00 | % | 12/20/16 | (61,266 | ) | — | (5,589 | ) | (66,855 | ) | ||||||
| El Paso Corp. | GSCO | 1,100,000 | 5.00 | % | 6/20/17 | (109,479 | ) | — | (30,768 | ) | (140,247 | ) | ||||||
| Embarq Corp. | BZWS | 8,500,000 | 5.00 | % | 6/20/16 | (359,600 | ) | — | (308,558 | ) | (668,158 | ) | ||||||
| Embarq Corp. | DBAB | 1,500,000 | 5.00 | % | 6/20/16 | (65,452 | ) | — | (52,459 | ) | (117,911 | ) | ||||||
| Embarq Corp. | GSCO | 10,000,000 | 5.00 | % | 6/20/16 | (478,586 | ) | — | (307,482 | ) | (786,068 | ) | ||||||
| First Data Corp. | BZWS | 13,100,000 | 5.00 | % | 3/20/15 | (121,262 | ) | — | (108,351 | ) | (229,613 | ) | ||||||
| First Data Corp. | DBAB | 3,900,000 | 5.00 | % | 3/20/15 | (36,117 | ) | — | (32,241 | ) | (68,358 | ) | ||||||
| Gannett Co. Inc. | GSCO | 3,000,000 | 5.00 | % | 9/20/15 | (126,097 | ) | — | (1,025 | ) | (127,122 | ) | ||||||
| Government of Ireland | MSCO | 10,000,000 | EUR | 1.00 | % | 3/20/15 | 324,963 | — | (363,804 | ) | (38,841 | ) | ||||||
| HCA Inc. | GSCO | 5,054,000 | 5.00 | % | 3/20/16 | (220,730 | ) | — | (92,667 | ) | (313,397 | ) | ||||||
| Kinder Morgan Inc. | GSCO | 19,426,000 | 5.00 | % | 3/20/16 | (1,163,414 | ) | — | (123,856 | ) | (1,287,270 | ) | ||||||
| Lennar Corp. | CITI | 4,150,000 | 5.00 | % | 9/20/19 | (457,608 | ) | — | (176,298 | ) | (633,906 | ) | ||||||
| Lennar Corp. | CITI | 6,200,000 | 5.00 | % | 12/20/19 | (804,777 | ) | — | (158,198 | ) | (962,975 | ) | ||||||
| Lennar Corp. | GSCO | 7,692,000 | 5.00 | % | 6/20/15 | (14,420 | ) | — | (219,041 | ) | (233,461 | ) | ||||||
| The New York Times Co. | GSCO | 11,700,000 | 5.00 | % | 12/20/16 | (450,113 | ) | — | (709,762 | ) | (1,159,875 | ) | ||||||
| Pactiv LLC | UBSW | 12,000,000 | 5.00 | % | 6/20/17 | 462,231 | — | (1,589,999 | ) | (1,127,768 | ) | |||||||
| PPL Energy Supply LLC | JPHQ | 11,400,000 | 5.00 | % | 6/20/16 | (799,170 | ) | — | (19,158 | ) | (818,328 | ) | ||||||
120 | Annual Report franklintempleton.com
FRANKLIN INVESTORS SECURITIES TRUST
STATEMENT OF INVESTMENTS
| Franklin Total Return Fund (continued) | |||||||||||||||||
| Credit Default Swap Contracts (continued) | |||||||||||||||||
| Upfront | |||||||||||||||||
| Periodic | Premiums | ||||||||||||||||
| Counter- | Notional | Payment | Expiration | Paid | Unrealized | Unrealized | Market | ||||||||||
| Description | party | Amounta | Rate | Date | (Received) | Appreciation | Depreciation | Value | Rating | ||||||||
| OTC Swaps (continued) | |||||||||||||||||
| Contracts to Buy Protection (continued) | |||||||||||||||||
| Single Name (continued) | |||||||||||||||||
| The Ryland Group Inc. | GSCO | 4,750,000 | 5.00 | % | 3/20/15 | (3,981 | ) | $ | — | $ | (82,851 | ) | $ | (86,832 | ) | ||
| Seagate Technology HDD | |||||||||||||||||
| Holdings | GSCO | 2,346,000 | 5.00 | % | 12/20/16 | (212,061 | ) | — | (20,252 | ) | (232,313 | ) | |||||
| Tenet Healthcare Corp | BZWS | 13,160,000 | 5.00 | % | 12/20/16 | (851,407 | ) | — | (304,149 | ) | (1,155,556 | ) | |||||
| Toll Brothers Inc. | FBCO | 2,010,000 | 5.00 | % | 6/20/15 | (36,063 | ) | — | (26,515 | ) | (62,578 | ) | |||||
| Contracts to Sell Protectionc | |||||||||||||||||
| Single Name | |||||||||||||||||
| Anadarko Petroleum Corp. | BZWS | 10,000,000 | 1.00 | % | 9/20/19 | 229,593 | — | (162,586 | ) | 67,007 | BBB | ||||||
| Bank of America Corp. | FBCO | 20,000,000 | 1.00 | % | 9/20/17 | (173,769 | ) | 481,349 | — | 307,580 | A- | ||||||
| Beazer Homes USA Inc. | CITI | 4,150,000 | 5.00 | % | 9/20/19 | 82,607 | 37,893 | — | 120,500 | CCC | |||||||
| Beazer Homes USA Inc. | CITI | 6,200,000 | 5.00 | % | 12/20/19 | 181,598 | — | (49,269 | ) | 132,329 | CCC | ||||||
| Berkshire Hathaway Finance | |||||||||||||||||
| Corp. | FBCO | 14,300,000 | 1.00 | % | 3/20/18 | (57,410 | ) | 357,298 | — | 299,888 | AA | ||||||
| Berkshire Hathaway Inc. | DBAB | 10,000,000 | 1.00 | % | 9/20/17 | (57,596 | ) | 250,320 | — | 192,724 | AA | ||||||
| Citigroup Inc. | FBCO | 2,500,000 | 1.00 | % | 9/20/20 | 11,991 | 12,558 | — | 24,549 | A- | |||||||
| First Data Corp. | BZWS | 14,000,000 | 5.00 | % | 3/20/16 | 109,894 | 714,169 | — | 824,063 | B- | |||||||
| First Data Corp. | DBAB | 3,000,000 | 5.00 | % | 3/20/16 | (7,328 | ) | 183,913 | — | 176,585 | B- | ||||||
| Freeport-McMoRan Inc. | DBAB | 6,500,000 | 1.00 | % | 3/20/23 | (393,492 | ) | — | (153,703 | ) | (547,195 | ) | BBB | ||||
| Government of Poland | GSCO | 5,300,000 | 1.00 | % | 12/20/19 | 94,824 | — | (3,537 | ) | 91,287 | A- | ||||||
| Prudential Financial Inc. | BOFA | 8,800,000 | 1.00 | % | 12/20/21 | (185,806 | ) | 250,642 | — | 64,836 | A | ||||||
| PSEG Power LLC | JPHQ | 11,700,000 | 1.00 | % | 6/20/19 | (40,718 | ) | 83,502 | — | 42,784 | BBB+ | ||||||
| PSEG Power LLC | JPHQ | 5,700,000 | 1.00 | % | 9/20/19 | (44,179 | ) | 50,478 | — | 6,299 | BBB+ | ||||||
| Republic of Portugal | DBAB | 8,500,000 | 1.00 | % | 9/20/19 | (449,144 | ) | 144,089 | — | (305,055 | ) | NR | |||||
| Tate & Lyle International | |||||||||||||||||
| Finance PLC | CITI | 7,200,000 | EUR | 1.00 | % | 9/20/19 | 154,135 | — | (107,008 | ) | 47,127 | BBB | |||||
| Tenet Healthcare Corp. | BZWS | 9,400,000 | 5.00 | % | 12/20/18 | 521,738 | 576,860 | — | 1,098,598 | CCC+ | |||||||
| Valero Energy Corp. | GSCO | 9,000,000 | 1.00 | % | 9/20/19 | 37,310 | 3,784 | — | 41,094 | BBB | |||||||
| Traded Index | |||||||||||||||||
| CMBX.NA.AM.2 | FBCO | 17,080,000 | 0.50 | % | 3/15/49 | (239,893 | ) | 58,644 | — | (181,249 | ) | Investment | |||||
| Grade | |||||||||||||||||
| LCDX.NA.21 | FBCO | 7,029,000 | 2.50 | % | 12/20/18 | 224,186 | 53,890 | — | 278,076 | Non | |||||||
| Investment | |||||||||||||||||
| Grade | |||||||||||||||||
| MCDX.NA.23 | CITI | 10,400,000 | 1.00 | % | 12/20/19 | 70,526 | 48,551 | — | 119,077 | Investment | |||||||
| Grade | |||||||||||||||||
| MCDX.NA.23 | GSCO | 19,100,000 | 1.00 | % | 12/20/24 | (479,156 | ) | 111,617 | — | (367,539 | ) | Investment | |||||
| Grade | |||||||||||||||||
| OTC Swaps unrealized appreciation (depreciation) | 3,419,557 | (7,462,298 | ) | ||||||||||||||
| Net unrealized appreciation (depreciation) | $ | (4,042,741 | ) | ||||||||||||||
aIn U.S. dollars unless otherwise indicated. For contracts to sell protection, the notional amount is equal to the maximum potential amount of the future payments and no
recourse provisions have been entered into in association with the contracts.
bBased on Standard and Poor’s (S&P) Rating for single name swaps and internal ratings for index swaps. Internal ratings based on mapping into equivalent ratings from
external vendors.
cThe fund enters contracts to sell protection to create a long credit position. Performance triggers include default, bankruptcy or restructuring for single name swaps,
and failure to pay or bankruptcy of the underlying securities for traded index swaps.
franklintempleton.com Annual Report | 121
FRANKLIN INVESTORS SECURITIES TRUST
STATEMENT OF INVESTMENTS
Franklin Total Return Fund (continued)
At October 31, 2014, the fund had the following cross-currency swap contracts outstanding. See Note 1(d).
| Cross Currency Swap Contracts | ||||||||
| Expiration | Notional | Unrealized | Unrealized | |||||
| Description | Counterparty | Date | Amount | Appreciation | Depreciation | |||
| Receive Fixed semi-annual 4.50% | CITI | 1/01/16 | 15,456,481 | USD | $ | 316,769 | $ | — |
| Pay Fixed annual 4.00% | 90,000,000 | DKK | ||||||
| Receive Fixed semi-annual 2.47% | DBAB | 1/04/16 | 15,638,575 | USD | 491,889 | — | ||
| Pay Fixed annual 2.00% | 90,000,000 | DKK | ||||||
| Net unrealized appreciation (depreciation) | $ | 808,658 | ||||||
| See Note 10 regarding other derivative information. | ||||||||
See Abbreviations on page 151.
122 | Annual Report | The accompanying notes are an integral part of these financial statements. franklintempleton.com
FRANKLIN INVESTORS SECURITIES TRUST
Financial Statements
Statements of Assets and Liabilities
October 31, 2014
| Franklin | Franklin | Franklin | |||||||
| Adjustable | Floating Rate | Low Duration | Franklin | ||||||
| U.S. Government | Daily Access | Total Return | Total Return | ||||||
| Securities Fund | Fund | Fund | Fund | ||||||
| Assets: | |||||||||
| Investments in securities: | |||||||||
| Cost - Unaffiliated issuers | $ | 2,017,151,994 | $ | 4,382,317,203 | $ | 2,214,645,271 | $ | 4,715,689,743 | |
| Cost- Sweep Money Fund (Note 3f) | 104,425,477 | 190,030,253 | 126,569,007 | 925,721,636 | |||||
| Total cost of investments | $ | 2,121,577,471 | $ | 4,572,347,456 | $ | 2,341,214,278 | $ | 5,641,411,379 | |
| Value - Unaffiliated issuers | $ | 2,053,643,725 | $ | 4,346,085,863 | $ | 2,216,685,134 | $ | 4,802,629,616 | |
| Value- Sweep Money Fund (Note 3f) | 104,425,477 | 190,030,253 | 126,569,007 | 925,721,636 | |||||
| Total value of investments | 2,158,069,202 | 4,536,116,116 | 2,343,254,141 | 5,728,351,252 | |||||
| Cash | 15,921 | 7,467,202 | 1,150,241 | 2,880,543 | |||||
| Restricted cash (Note 1e) | — | — | 3,770,000 | 20,745,000 | |||||
| Foreign currency, at value (cost $-, $-, $9,210,820 and | |||||||||
| $12,559,514) | — | — | 9,158,606 | 12,507,809 | |||||
| Receivables: | |||||||||
| Investment securities sold | 5,622,328 | 240,268,343 | 8,048,894 | 9,442,333 | |||||
| Capital shares sold | 4,886,737 | 8,675,684 | 6,023,180 | 16,588,942 | |||||
| Interest | 4,942,300 | 17,144,081 | 10,362,979 | 32,889,452 | |||||
| Due from brokers | — | — | 6,025,650 | 14,521,970 | |||||
| Variation margin | — | 111,437 | 185,184 | 730,664 | |||||
| Swaps(premiums paid $–, $1,517,568, $1,970,093 and | |||||||||
| $5,534,482) | — | 1,500,769 | 1,364,664 | 2,679,366 | |||||
| Unrealized appreciation on forward exchange contracts | — | — | 15,883,870 | 50,441,004 | |||||
| Unrealized appreciation on swap contracts | — | 367,810 | 1,380,815 | 4,228,215 | |||||
| Unrealized appreciation on unfunded loan commitments | |||||||||
| (Note 9) | — | 50,790 | 526 | — | |||||
| Other assets | 520 | 1,178 | 446 | 973 | |||||
| Total assets | 2,173,537,008 | 4,811,703,410 | 2,406,609,196 | 5,896,007,523 | |||||
| Liabilities: | |||||||||
| Payables: | |||||||||
| Investment securities purchased | — | 144,050,736 | 10,553,260 | 818,646,818 | |||||
| Capital shares redeemed | 6,984,649 | 19,720,500 | 5,840,250 | 11,904,312 | |||||
| Management fees | 918,576 | 1,925,660 | 705,636 | 1,851,659 | |||||
| Distribution fees | 483,943 | 817,397 | 425,990 | 936,278 | |||||
| Transfer agent fees | 823,237 | 851,482 | 249,586 | 1,137,104 | |||||
| Distributions to shareholders | 304,343 | 6,300,752 | 272,378 | 419,852 | |||||
| OTC Swaps (premiums received $–, $–, $11,540,100 and | |||||||||
| $23,857,820) | — | — | 8,029,057 | 14,426,043 | |||||
| Options written, at value (premiums received $–, $–, | |||||||||
| $20,765 and $93,655) | — | — | 24,473 | 110,540 | |||||
| Due to brokers | — | 413,482 | 3,770,000 | 21,655,000 | |||||
| Unrealized depreciation on forward exchange contracts | — | — | 1,317,284 | 3,691,175 | |||||
| Unrealized depreciation on swap contracts | — | — | 1,982,250 | 7,462,298 | |||||
| Unrealized depreciation on unfunded loan commitments | |||||||||
| (Note 9) | — | — | — | 1,905 | |||||
| Accrued expenses and other liabilities | 85,632 | 211,242 | 399,868 | 970,592 | |||||
| Total liabilities | 9,600,380 | 174,291,251 | 33,570,032 | 883,213,576 | |||||
| Net assets, at value | $ | 2,163,936,628 | $ | 4,637,412,159 | $ | 2,373,039,164 | $ | 5,012,793,947 |
franklintempleton.com The accompanying notes are an integral part of these financial statements. | Annual Report | 123
| FRANKLIN INVESTORS SECURITIES TRUST | |||||||||||||
| FINANCIAL STATEMENTS | |||||||||||||
| Statements of Assets and Liabilities (continued) | |||||||||||||
| October 31, 2014 | |||||||||||||
| Franklin | Franklin | Franklin | |||||||||||
| Adjustable | Floating Rate | Low Duration | Franklin | ||||||||||
| U.S. Government | Daily Access | Total Return | Total Return | ||||||||||
| Securities Fund | Fund | Fund | Fund | ||||||||||
| Net assets consist of: | |||||||||||||
| Paid-in capital | $ | 2,264,663,357 | $ | 4,912,350,514 | $ | 2,391,726,723 | $ | 4,921,287,095 | |||||
| Undistributed net investment income (distributions in excess | |||||||||||||
| of net investment income) | (2,438,195 | ) | 1,192,488 | (7,245,931 | ) | 14,253,570 | |||||||
| Net unrealized appreciation (depreciation) | 36,491,731 | (35,812,740 | ) | 15,397,389 | 126,512,373 | ||||||||
| Accumulated net realized gain (loss) | (134,780,265 | ) | (240,318,103 | ) | (26,839,017 | ) | (49,259,091 | ) | |||||
| Net assets, at value | $ | 2,163,936,628 | $ | 4,637,412,159 | $ | 2,373,039,164 | $ | 5,012,793,947 | |||||
| Class A: | |||||||||||||
| Net assets, at value | $ | 1,058,837,662 | $ | 1,874,867,416 | $ | 1,589,853,800 | $ | 3,213,446,294 | |||||
| Shares outstanding | 122,143,791 | 207,286,404 | 157,201,116 | 315,760,487 | |||||||||
| Net asset value per sharea | $ | 8.67 | $ | 9.04 | $ | 10.11 | $ | 10.18 | |||||
| Maximum offering price per share (net asset value per | |||||||||||||
| share ÷ 97.75%, 97.75%, 97.75% and 95.75%, | |||||||||||||
| respectively) | $ | 8.87 | $ | 9.25 | $ | 10.34 | $ | 10.63 | |||||
| Class A1: | |||||||||||||
| Net assets, at value | $ | 253,021,206 | |||||||||||
| Shares outstanding | 29,190,070 | ||||||||||||
| Net asset value per sharea | $ | 8.67 | |||||||||||
| Maximum offering price per share (net asset value per | |||||||||||||
| share ÷ 97.75%) | $ | 8.87 | |||||||||||
| Class C: | |||||||||||||
| Net assets, at value | $ | 428,030,738 | $ | 742,602,014 | $ | 165,952,064 | $ | 432,767,286 | |||||
| Shares outstanding | 49,409,839 | 82,083,891 | 16,421,519 | 42,615,983 | |||||||||
| Net asset value and maximum offering price per sharea | $ | 8.66 | $ | 9.05 | $ | 10.11 | $ | 10.16 | |||||
| Class R: | |||||||||||||
| Net assets, at value | $ | 59,307,003 | |||||||||||
| Shares outstanding | 5,833,234 | ||||||||||||
| Net asset value and maximum offering price per share | $ | 10.17 | |||||||||||
| Class R6: | |||||||||||||
| Net assets, at value | $ | 7,192,585 | $ | 465,238 | $ | 418,538,962 | $ | 26,122,804 | |||||
| Shares outstanding | 828,342 | 51,433 | 41,274,401 | 2,560,496 | |||||||||
| Net asset value and maximum offering price per share | $ | 8.68 | $ | 9.05 | $ | 10.14 | $ | 10.20 | |||||
| Advisor Class: | |||||||||||||
| Net assets, at value | $ | 416,854,437 | $ | 2,019,477,491 | $ | 198,694,338 | $ | 1,281,150,560 | |||||
| Shares outstanding | 48,037,462 | 223,175,530 | 19,589,142 | 125,591,836 | |||||||||
| Net asset value and maximum offering price per share | $ | 8.68 | $ | 9.05 | $ | 10.14 | $ | 10.20 | |||||
aRedemption price is equal to net asset value less contingent deferred sales charges, if applicable.
124 | Annual Report | The accompanying notes are an integral part of these financial statements. franklintempleton.com
FRANKLIN INVESTORS SECURITIES TRUST
FINANCIAL STATEMENTS
Statements of Operations
for the year ended October 31, 2014
| Franklin | Franklin | Franklin | ||||||||||
| Adjustable | Floating Rate | Low Duration | Franklin | |||||||||
| U.S. Government | Daily Access | Total Return | Total Return | |||||||||
| Securities Fund | Fund | Fund | Fund | |||||||||
| Investment income: | ||||||||||||
| Dividends | $ | — | $ | 82,323 | $ | 812,349 | $ | 1,886,134 | ||||
| Interest | 41,736,233 | 239,865,177 | 43,025,092 | 156,307,634 | ||||||||
| Paydown gain (loss) | (12,735,243 | ) | — | (928,624 | ) | 998,446 | ||||||
| Total investment income | 29,000,990 | 239,947,500 | 42,908,817 | 159,192,214 | ||||||||
| Expenses: | ||||||||||||
| Management fees (Note 3a) | 10,232,061 | 25,945,257 | 10,750,496 | 22,358,362 | ||||||||
| Distribution fees: (Note 3c) | ||||||||||||
| Class A | 2,623,724 | 5,111,345 | 3,494,728 | 7,680,121 | ||||||||
| Class A1 | 98,095 | — | — | — | ||||||||
| Class C | 3,270,988 | 5,146,053 | 923,539 | 2,747,017 | ||||||||
| Class R | — | — | — | 289,438 | ||||||||
| Transfer agent fees: (Note 3e) | ||||||||||||
| Class A | 1,351,434 | 1,755,275 | 1,812,677 | 5,446,386 | ||||||||
| Class A1 | 128,483 | — | — | — | ||||||||
| Class C | 648,088 | 679,348 | 184,036 | 749,976 | ||||||||
| Class R | — | — | — | 102,708 | ||||||||
| Class R6 | 343 | 125 | 174 | 224 | ||||||||
| Advisor Class | 505,073 | 2,186,906 | 226,247 | 2,094,050 | ||||||||
| Custodian fees (Note 4) | 20,877 | 41,293 | 73,637 | 276,604 | ||||||||
| Reports to shareholders | 221,739 | 397,529 | 242,374 | 665,928 | ||||||||
| Registration and filing fees | 194,645 | 520,898 | 260,655 | 264,621 | ||||||||
| Professional fees | 106,746 | 135,810 | 103,744 | 132,107 | ||||||||
| Trustees’ fees and expenses | 21,755 | 56,106 | 20,343 | 51,322 | ||||||||
| Other | 570,139 | 104,718 | 189,954 | 216,425 | ||||||||
| Total expenses | 19,994,190 | 42,080,663 | 18,282,604 | 43,075,289 | ||||||||
| Expense reductions (Note 4) | (429 | ) | (2,111 | ) | (3,138 | ) | (7,156 | ) | ||||
| Expenses waived/paid by affiliates (Note 3f and 3g) | (59,784 | ) | (1,038,279 | ) | (2,867,545 | ) | (2,378,248 | ) | ||||
| Net expenses | 19,933,977 | 41,040,273 | 15,411,921 | 40,689,885 | ||||||||
| Net investment income | 9,067,013 | 198,907,227 | 27,496,896 | 118,502,329 | ||||||||
| Realized and unrealized gains (losses): | ||||||||||||
| Net realized gain (loss) from: | ||||||||||||
| Investments | 3,915,694 | (8,448,457 | ) | 4,500,523 | 88,372,543 | |||||||
| Written options | — | — | 85,891 | 534,152 | ||||||||
| Foreign currency transactions | — | — | (2,704,474 | ) | 598,854 | |||||||
| Futures contracts | — | — | (3,313,368 | ) | (2,675,034 | ) | ||||||
| Swap contracts | — | 135,170 | 51,899 | 1,820,902 | ||||||||
| Net realized gain (loss) | 3,915,694 | (8,313,287 | ) | (1,379,529 | ) | 88,651,417 | ||||||
| Net change in unrealized appreciation (depreciation) on: | ||||||||||||
| Investments | (2,629,298 | ) | (81,149,255 | ) | (15,051,806 | ) | (37,942,182 | ) | ||||
| Translation of other assets and liabilities denominated in foreign | ||||||||||||
| currencies | — | — | 17,347,411 | 49,256,072 | ||||||||
| Net change in unrealized appreciation | ||||||||||||
| (depreciation) | (2,629,298 | ) | (81,149,255 | ) | 2,295,605 | 11,313,890 | ||||||
| Net realized and unrealized gain (loss) | 1,286,396 | (89,462,542 | ) | 916,076 | 99,965,307 | |||||||
| Net increase (decrease) in net assets resulting from operations | $ | 10,353,409 | $ | 109,444,685 | $ | 28,412,972 | $ | 218,467,636 |
franklintempleton.com The accompanying notes are an integral part of these financial statements. | Annual Report | 125
FRANKLIN INVESTORS SECURITIES TRUST
FINANCIAL STATEMENTS
| Statements of Changes in Net Assets | ||||||||||||
| Franklin Adjustable U.S. | Franklin Floating Rate | |||||||||||
| Government Securities Fund | Daily Access Fund | |||||||||||
| Year Ended October 31, | Year Ended October 31, | |||||||||||
| 2014 | 2013 | 2014 | 2013 | |||||||||
| Increase (decrease) in net assets: | ||||||||||||
| Operations: | ||||||||||||
| Net investment income | $ | 9,067,013 | $ | 13,269,907 | $ | 198,907,227 | $ | 128,558,953 | ||||
| Net realized gain (loss) from investments, and swap | ||||||||||||
| contracts | 3,915,694 | 110,010 | (8,313,287 | ) | 12,460,763 | |||||||
| Net change in unrealized appreciation (depreciation) on | ||||||||||||
| investments | (2,629,298 | ) | (29,487,215 | ) | (81,149,255 | ) | 19,570,761 | |||||
| Net increase (decrease) in net assets resulting from | ||||||||||||
| operations | 10,353,409 | (16,107,298 | ) | 109,444,685 | 160,590,477 | |||||||
| Distributions to shareholders from: | ||||||||||||
| Net investment income: | ||||||||||||
| Class A | (11,928,926 | ) | (18,086,171 | ) | (74,547,275 | ) | (55,556,299 | ) | ||||
| Class A1 | (1,177,522 | ) | — | — | — | |||||||
| Class B | — | — | — | (5,580 | ) | |||||||
| Class C | (3,781,138 | ) | (7,767,042 | ) | (25,713,482 | ) | (17,521,045 | ) | ||||
| Class R6 | (16,641 | ) | (923 | ) | (41,968 | ) | (22,904 | ) | ||||
| Advisor Class | (5,442,375 | ) | (7,625,283 | ) | (98,835,459 | ) | (54,186,611 | ) | ||||
| Total distributions to shareholders | (22,346,602 | ) | (33,479,419 | ) | (199,138,184 | ) | (127,292,439 | ) | ||||
| Capital share transactions: (Note 2) | ||||||||||||
| Class A | (40,535,806 | ) | (177,843,919 | ) | (82,128,941 | ) | 680,448,978 | |||||
| Class A1 | 253,376,829 | — | — | — | ||||||||
| Class B | — | — | — | (982,012 | ) | |||||||
| Class C | (172,020,740 | ) | (176,136,786 | ) | (9,898,411 | ) | 328,563,566 | |||||
| Class R6 | 6,866,077 | 335,003 | (858,754 | ) | 1,338,251 | |||||||
| Advisor Class | 7,939,064 | (17,175,253 | ) | (313,238,514 | ) | 1,622,626,406 | ||||||
| Total capital share transactions | 55,625,424 | (370,820,955 | ) | (406,124,620 | ) | 2,631,995,189 | ||||||
| Net increase (decrease) in net assets | 43,632,231 | (420,407,672 | ) | (495,818,119 | ) | 2,665,293,227 | ||||||
| Net assets: | ||||||||||||
| Beginning of year | 2,120,304,397 | 2,540,712,069 | 5,133,230,278 | 2,467,937,051 | ||||||||
| End of year | $ | 2,163,936,628 | $ | 2,120,304,397 | $ | 4,637,412,159 | $ | 5,133,230,278 | ||||
| Undistributed net investment income (distributions in excess | ||||||||||||
| of net investment income) included in net assets: | ||||||||||||
| End of year | $ | (2,438,195 | ) | $ | (4,276 | ) | $ | 1,192,488 | $ | 1,190,304 | ||
126 | Annual Report | The accompanying notes are an integral part of these financial statements. franklintempleton.com
| FRANKLIN INVESTORS SECURITIES TRUST | ||||||||||||
| FINANCIAL STATEMENTS | ||||||||||||
| Statements of Changes in Net Assets (continued) | ||||||||||||
| Franklin Low Duration | Franklin | |||||||||||
| Total Return Fund | Total Return Fund | |||||||||||
| Year Ended October 31, | Year Ended October 31, | |||||||||||
| 2014 | 2013 | 2014 | 2013 | |||||||||
| Increase (decrease) in net assets: | ||||||||||||
| Operations: | ||||||||||||
| Net investment income | $ | 27,496,896 | $ | 15,257,459 | $ | 118,502,329 | $ | 129,524,067 | ||||
| Net realized gain (loss) from investments, written options, | ||||||||||||
| foreign currency transactions, futures contracts and | ||||||||||||
| swap contracts | (1,379,529 | ) | 4,558,920 | 88,651,417 | (16,844,640 | ) | ||||||
| Net change in unrealized appreciation (depreciation) on | ||||||||||||
| investments and translation of other assets and liabilities | ||||||||||||
| denominated in foreign currencies and deferred taxes | 2,295,605 | (2,001,605 | ) | 11,313,890 | (109,352,294 | ) | ||||||
| Net increase (decrease) in net assets resulting from | ||||||||||||
| operations | 28,412,972 | 17,814,774 | 218,467,636 | 3,327,133 | ||||||||
| Distributions to shareholders from: | ||||||||||||
| Net investment income and net foreign currency gains: | ||||||||||||
| Class A | (24,898,289 | ) | (27,565,094 | ) | (102,897,067 | ) | (110,647,887 | ) | ||||
| Class B | — | — | — | (18,270 | ) | |||||||
| Class C | (1,997,803 | ) | (859,335 | ) | (12,913,703 | ) | (17,086,352 | ) | ||||
| Class R | — | — | (1,884,664 | ) | (2,380,507 | ) | ||||||
| Class R6 | (8,217,276 | ) | (9,638 | ) | (1,155,656 | ) | (6,378,823 | ) | ||||
| Advisor Class | (3,503,516 | ) | (2,487,587 | ) | (42,392,733 | ) | (50,711,612 | ) | ||||
| Net realized gains: | ||||||||||||
| Class A | — | — | — | (49,900,210 | ) | |||||||
| Class B | — | — | — | (20,442 | ) | |||||||
| Class C | — | — | — | (9,134,397 | ) | |||||||
| Class R | — | — | — | (1,213,587 | ) | |||||||
| Advisor Class | — | — | — | (22,947,325 | ) | |||||||
| Total distributions to shareholders | (38,616,884 | ) | (30,921,654 | ) | (161,243,823 | ) | (270,439,412 | ) | ||||
| Capital share transactions: (Note 2) | ||||||||||||
| Class A | 299,933,209 | 403,766,790 | 155,465,903 | 43,627,860 | ||||||||
| Class B | — | — | — | (2,386,299 | ) | |||||||
| Class C | 52,495,559 | 113,372,096 | (27,632,362 | ) | (86,547,995 | ) | ||||||
| Class R | — | — | (6,823,750 | ) | (18,039,553 | ) | ||||||
| Class R6 | 419,577,578 | 947,088 | (301,532,836 | ) | 347,214,126 | |||||||
| Advisor Class | 43,352,531 | 86,552,020 | 117,287,658 | (276,012,050 | ) | |||||||
| Total capital share transactions | 815,358,877 | 604,637,994 | (63,235,387 | ) | 7,856,089 | |||||||
| Net increase (decrease) in net assets | 805,154,965 | 591,531,114 | (6,011,574 | ) | (259,256,190 | ) | ||||||
| Net assets: | ||||||||||||
| Beginning of year | 1,567,884,199 | 976,353,085 | 5,018,805,521 | 5,278,061,711 | ||||||||
| End of year | $ | 2,373,039,164 | $ | 1,567,884,199 | $ | 5,012,793,947 | $ | 5,018,805,521 | ||||
| Undistributed net investment income (distributions in excess | ||||||||||||
| of net investment income) included in net assets: | ||||||||||||
| End of year | $ | (7,245,931 | ) | $ | (6,281,762 | ) | $ | 14,253,570 | $ | (23,610,608 | ) | |
franklintempleton.com The accompanying notes are an integral part of these financial statements. | Annual Report | 127
FRANKLIN INVESTORS SECURITIES TRUST
Notes to Financial Statements
1. Organization and Significant Accounting Policies
Franklin Investors Securities Trust (Trust) is registered under the Investment Company Act of 1940, as amended, (1940 Act) as an open-end management investment company, consisting of eight separate funds, four of which are included in this report (Funds). The financial statements of the remaining funds in the Trust are presented separately. The classes of shares offered within each of the Funds are indicated below. Effective June 18, 2014, the Franklin Adjustable U.S. Securities Fund began offering a new class of shares, Class A1. Effective March 1, 2013, all Class B shares were converted to Class A. Each class of shares differs by its initial sales load, contingent deferred sales charges, voting rights on matters affecting a single class, its exchange privilege and fees primarily due to differing arrangements for distribution and transfer agent fees.
| Class A, Class A1, Class C, Class R6 & Advisor Class |
| Franklin Adjustable U.S. Government Securities Fund |
| Class A, Class C, Class R6 & Advisor Class |
| Franklin Floating Rate Daily Access Fund |
| Franklin Low Duration Total Return Fund |
| Class A, Class C, Class R, Class R6 & Advisor Class |
| Franklin Total Return Fund |
The following summarizes the Funds’ significant accounting policies.
a. Financial Instrument Valuation
The Funds’ investments in financial instruments are carried at fair value daily. Fair value is the price that would be received to sell an asset or paid to transfer a liability in an orderly transaction between market participants on the measurement date. The Funds’ calculate the net asset value (NAV) per share at the close of the New York Stock Exchange (NYSE), generally at 4 p.m. Eastern time (NYSE close) on each day the NYSE is open for trading. Under compliance policies and procedures approved by the Trust’s Board of Trustees (the Board), the Funds’ administrator has responsibility for oversight of valuation, including leading the cross-functional Valuation and Liquidity Oversight Committee (VLOC). The VLOC provides administration and oversight of the Funds’ valuation policies and procedures, which are approved annually by the Board. Among other things, these procedures allow the Funds to utilize independent pricing services, quotations from securities and financial instrument dealers, and other market sources to determine fair value.
Equity securities, exchange traded funds and derivative financial instruments (derivatives) listed on an exchange or on the NASDAQ National Market System are valued at the last quoted sale price or the official closing price of the day, respectively. Over-the-counter (OTC) securities are valued within the range of the most recent quoted bid and ask prices. Securities that trade in multiple markets or on multiple exchanges are valued according to the broadest and most representative market. Certain equity securities are valued based upon fundamental characteristics or relationships to similar securities. Investments in open-end mutual funds are valued at the closing NAV.
Debt securities generally trade in the OTC market rather than on a securities exchange. The Funds’ pricing services use multiple valuation techniques to determine fair value. In instances where sufficient market activity exists, the pricing services may utilize a market-based approach through which quotes from market makers are used to determine fair value. In instances where sufficient market activity may not exist or is limited, the pricing services also utilize proprietary valuation models which may consider market characteristics such as benchmark yield curves, credit spreads, estimated default rates, anticipated market interest rate volatility, coupon rates, anticipated timing of principal repayments, underlying collateral, and other unique security features in order to estimate the relevant cash flows, which are then discounted to calculate the fair value. Securities denominated in a foreign currency are converted into their U.S. dollar equivalent at the foreign exchange rate in effect at the NYSE close on the date that the values of the foreign debt securities are determined.
Certain derivatives trade in the OTC market. The Funds’ pricing services use various techniques including industry standard option pricing models and proprietary discounted cash flow models to determine the fair value of those instruments. The Funds’ net benefit or obligation under the derivative contract, as measured by the fair value of the contract, is included in net assets.
The Funds have procedures to determine the fair value of financial instruments for which market prices are not reliable or readily available. Under these procedures, the VLOC convenes on a regular basis to review such financial instruments and considers a number of factors, including significant unobservable valuation inputs, when arriving at fair value. The VLOC primarily employs a market-based approach which may use related or comparable assets or liabilities, recent transactions, market multiples, book values, and other relevant information
128 | Annual Report franklintempleton.com
FRANKLIN INVESTORS SECURITIES TRUST
NOTES TO FINANCIAL STATEMENTS
for the investment to determine the fair value of the investment. An income-based valuation approach may also be used in which the anticipated future cash flows of the investment are discounted to calculate fair value. Discounts may also be applied due to the nature or duration of any restrictions on the disposition of the investments. Due to the inherent uncertainty of valuations of such investments, the fair values may differ significantly from the values that would have been used had an active market existed. The VLOC employs various methods for calibrating these valuation approaches including a regular review of key inputs and assumptions, transactional back-testing or disposition analysis, and reviews of any related market activity.
b. Foreign Currency Translation
Portfolio securities and other assets and liabilities denominated in foreign currencies are translated into U.S. dollars based on the exchange rate of such currencies against U.S. dollars on the date of valuation. The Funds may enter into foreign currency exchange contracts to facilitate transactions denominated in a foreign currency. Purchases and sales of securities, income and expense items denominated in foreign currencies are translated into U.S. dollars at the exchange rate in effect on the transaction date. Portfolio securities and assets and liabilities denominated in foreign currencies contain risks that those currencies will decline in value relative to the U.S. dollar. Occasionally, events may impact the availability or reliability of foreign exchange rates used to convert the U.S. dollar equivalent value. If such an event occurs, the foreign exchange rate will be valued at fair value using procedures established and approved by the Board.
The Funds do not separately report the effect of changes in foreign exchange rates from changes in market prices on securities held. Such changes are included in net realized and unrealized gain or loss from investments on the Statements of Operations.
Realized foreign exchange gains or losses arise from sales of foreign currencies, currency gains or losses realized between the trade and settlement dates on securities transactions and the difference between the recorded amounts of dividends, interest, and foreign withholding taxes and the U.S. dollar equivalent of the amounts actually received or paid. Net unrealized foreign exchange gains and losses arise from changes in foreign exchange rates on foreign denominated assets and liabilities other than investments in securities held at the end of the reporting period.
c. Securities Purchased on a When-Issued, Delayed Delivery, and TBA Basis
The Funds purchase securities on a when-issued, delayed delivery, and to-be-announced (TBA) basis, with payment and delivery scheduled for a future date. These transactions are subject to market fluctuations and are subject to the risk that the value at delivery may be more or less than the trade date purchase price. Although the Funds will generally purchase these securities with the intention of holding the securities, they may sell the securities before the settlement date. Sufficient assets have been segregated for these securities and collateral has been pledged and/or received for open TBA trades.
d. Derivative Financial Instruments
The Franklin Floating Rate Daily Access Fund, Franklin Low Duration Total Return Fund and Franklin Total Return Fund invested in derivatives in order to manage risk or gain exposure to various other investments or markets. Derivatives are financial contracts based on an underlying or notional amount, require no initial investment or an initial net investment that is smaller than would normally be required to have a similar response to changes in market factors, and require or permit net settlement. Derivatives contain various risks including the potential inability of the counterparty to fulfill their obligations under the terms of the contract, the potential for an illiquid secondary market, and/or the potential for market movements which expose the fund to gains or losses in excess of the amounts shown on the Statements of Assets and Liabilities. Realized gain and loss and unrealized appreciation and depreciation on these contracts for the period are included in the Statements of Operations.
Derivative counterparty credit risk is managed through a formal evaluation of the creditworthiness of all potential coun-terparties. The Franklin Low Duration Total Return Fund and Franklin Total Return Fund attempt to reduce its exposure to counterparty credit risk on OTC derivatives, whenever possible, by entering into International Swaps and Derivatives Association (ISDA) master agreements with certain counterpar-ties. These agreements contain various provisions, including but not limited to collateral requirements, events of default, or early termination. Termination events applicable to the coun-terparty include certain deteriorations in the credit quality of the counterparty. Termination events applicable to the funds
franklintempleton.com Annual Report | 129
FRANKLIN INVESTORS SECURITIES TRUST
NOTES TO FINANCIAL STATEMENTS
1. Organization and Significant Accounting
Policies (continued)
d. Derivative Financial Instruments (continued)
include failure of the funds to maintain certain net asset levels and/or limit the decline in net assets over various periods of time. In the event of default or early termination, the ISDA master agreement gives the non-defaulting party the right to net and close-out all transactions traded, whether or not arising under the ISDA agreement, to one net amount payable by one counterparty to the other. However, absent an event of default or early termination, OTC derivative assets and liabilities are presented gross and not offset in the Statements of Assets and Liabilities. Early termination by the counterparty may result in an immediate payment by the funds of any net liability owed to that counterparty under the ISDA agreement.
Collateral requirements differ by type of derivative. Collateral or initial margin requirements are set by the broker or exchange clearing house for exchange traded and centrally cleared derivatives. Initial margin deposited is held at the exchange and can be in the form of cash and/or securities. For OTC derivatives traded under an ISDA master agreement, posting of collateral is required by either the fund or the applicable counterparty if the total net exposure of all OTC derivatives with the applicable counterparty exceeds the minimum transfer amount, which typically ranges from $100,000 to $250,000, and can vary depending on the counterparty and the type of the agreement. Generally, collateral is determined at the close of fund business each day and any additional collateral required due to changes in derivative values may be delivered by the fund or the coun-terparty within a few business days. Collateral pledged and/or received by the fund for OTC derivatives, if any, is held in segregated accounts with the fund’s custodian/counterparty broker and can be in the form of cash and/or securities. Unrestricted cash may be invested according to the funds’ investment objectives.
The Franklin Low Duration Total Return Fund and Franklin Total Return Fund entered into exchange traded financial futures contracts primarily to manage and/or gain exposure to interest rate risk. A futures contract is an agreement between the fund and a counterparty to buy or sell an asset for a specified price on a future date. Required initial margins are pledged by the fund, and the daily change in fair value is accounted for as a variation margin payable or receivable on the Statements of Assets and Liabilities.
The Franklin Low Duration Total Return Fund and Franklin Total Return Fund entered into OTC forward exchange contracts primarily to manage and/or gain exposure to certain foreign currencies. A forward exchange contract is an agreement between the fund and a counterparty to buy or sell a foreign currency at a specific exchange rate on a future date.
The Funds except Franklin Adjustable U.S. Government Securities Fund entered into credit default swap contracts primarily to manage and/or gain exposure to credit risk. A credit default swap is an agreement between the fund and a counterparty whereby the buyer of the contract receives credit protection and the seller of the contract guarantees the credit worthiness of a referenced debt obligation. These agreements may be privately negotiated in the over-the-counter market (“OTC credit default swaps”) or may be executed in a multilateral trade facility platform, such as a registered exchange (“centrally cleared credit default swaps”). The underlying referenced debt obligation may be a single issuer of corporate or sovereign debt, a credit index, or a tranche of a credit index. In the event of a default of the underlying referenced debt obligation, the buyer is entitled to receive the notional amount of the credit default swap contract from the seller in exchange for the referenced debt obligation, a net settlement amount equal to the notional amount of the credit default swap less the recovery value of the referenced debt obligation, or other agreed upon amount. For centrally cleared credit default swaps, required initial margins are pledged by the fund, and the daily change in fair value is accounted for as a variation margin payable or receivable on the Statements of Assets and Liabilities. Over the term of the contract, the buyer pays the seller a periodic stream of payments, provided that no event of default has occurred. Such periodic payments are accrued daily as an unrealized appreciation or depreciation until the payments are made, at which time they are realized. Payments received or paid to initiate a credit default swap contract are reflected on the Statements of Assets and Liabilities and represent compensating factors between stated terms of the credit default swap agreement and prevailing market conditions (credit spreads and other relevant factors). These upfront payments are amortized over the term of the contract as a realized gain or loss on the Statements of Operations.
The Franklin Low Duration Total Return Fund and Franklin Total Return Fund entered into OTC cross currency swap contracts primarily to manage and/or gain exposure to interest rate risk and certain foreign currencies. A cross currency swap is an
130 | Annual Report
franklintempleton.com
FRANKLIN INVESTORS SECURITIES TRUST
NOTES TO FINANCIAL STATEMENTS
agreement between the fund and a counterparty to exchange cash flows (determined using either a fixed or floating rate) based on the notional amounts of two different currencies. The notional amounts are typically determined based on the spot exchange rates at the opening of the contract. Cross currency swaps may require the exchange of notional amounts at the opening and/or closing of the contract. Over the term of the contract, contractually required payments to be paid and to be received are accrued daily and recorded as unrealized depreciation and appreciation until the payments are made, at which time they are realized. Payments received or paid to initiate a cross currency swap contract are reflected on the Statements of Assets and Liabilities and represent compensating factors between stated terms of the cross currency swap contract and prevailing market conditions (interest rate spreads and other relevant factors). These upfront payments are amortized over the term of the contract as a realized gain or loss on the Statements of Operations.
The Franklin Low Duration Total Return Fund and Franklin Total Return Fund purchased or wrote OTC option contracts primarily to manage and/or gain exposure to interest rate, foreign exchange rate and credit risk. An option is a contract entitling the holder to purchase or sell a specific amount of shares or units of an asset or notional amount of a swap (swap-tion), at a specified price. Options purchased are recorded as an asset while options written are recorded as a liability. Upon exercise of an option, the acquisition cost or sales proceeds of the underlying investment is adjusted by any premium received or paid. Upon expiration of an option, any premium received or paid is recorded as a realized gain or loss. Upon closing an option other than through expiration or exercise, the difference between the premium and the cost to close the position is recorded as a realized gain or loss.
See Notes 6 and 10 regarding investment transactions and other derivative information, respectively.
e. Restricted Cash
At October 31, 2014, the Franklin Low Duration Total Return Fund and Franklin Total Return received restricted cash in connection with investments in certain derivative securities. Restricted cash is held in a segregated account with the fund’s custodian and is reflected in the Statement of Assets and Liabilities.
f. Loan Participation Notes
Franklin Total Return Fund invests in loan participation notes (“Participations”). Participations are loans originally issued to a borrower by one or more financial institutions (the “Lender”) and subsequently sold to other investors, such as the fund. Participations typically result in the fund having a contractual relationship only with the Lender and not with the borrower. The fund has the right to receive from the Lender any payments of principal, interest and fees which the Lender received from the borrower. The fund generally has no rights to either enforce compliance by the borrower with the terms of the loan agreement or to any collateral relating to the original loan. As a result, the fund assumes the credit risk of both the borrower and the Lender that is selling the Participation. The Participations may also involve interest rate risk and liquidity risk, including the potential default or insolvency of the borrower and/or the Lender.
g. FT Holdings Corporation I (FT Subsidiary)
The Franklin Total Return Fund invests in certain financial instruments through its investment in the FT subsidiary. The FT subsidiary is a Delaware Corporation, is a wholly-owned subsidiary of the fund, and is able to invest in certain financial instruments consistent with the investment objective of the fund. At October 31, 2014, the FT subsidiary’s investment, Turtle Bay Resort, as well as any other assets and liabilities of the FT subsidiary are reflected in the fund’s Statement of Investments and Statement of Assets and Liabilities. The financial statements have been consolidated and include the accounts of the fund and the FT subsidiary. All intercompany transactions and balances have been eliminated.
h. Mortgage Dollar Rolls
The Franklin Total Return Fund enters into mortgage dollar rolls, typically on a TBA basis. Mortgage dollar rolls are agreements between the fund and a financial institution to simultaneously sell and repurchase mortgage-backed securities at a future date. Gains or losses are realized on the initial sale, and the difference between the repurchase price and the sale price is recorded as an unrealized gain or loss to the fund upon entering into the mortgage dollar roll. In addition, the fund may invest the cash proceeds that are received from the initial sale. During the period between the sale and repurchase, the fund is not entitled to principal and interest paid on the mortgage backed securities. The risks of mortgage dollar roll transactions include the potential inability of the counterparty to fulfill its obligations.
franklintempleton.com Annual Report | 131
FRANKLIN INVESTORS SECURITIES TRUST
NOTES TO FINANCIAL STATEMENTS
1. Organization and Significant Accounting
Policies (continued)
i. Senior Floating Rate Interests
The Funds except Franklin Adjustable U.S. Government Securities Fund, invest in senior secured corporate loans that pay interest at rates which are periodically reset by reference to a base lending rate plus a spread. These base lending rates are generally the prime rate offered by a designated U.S. bank or the London InterBank Offered Rate (LIBOR). Senior secured corporate loans often require prepayment of principal from excess cash flows or at the discretion of the borrower. As a result, actual maturity may be substantially less than the stated maturity. Senior secured corporate loans in which the funds invest are generally readily marketable, but may be subject to certain restrictions on resale.
j. Income and Deferred Taxes
It is each fund’s policy to qualify as a regulated investment company under the Internal Revenue Code. Each fund intends to distribute to shareholders substantially all of its taxable income and net realized gains to relieve it from federal income and excise taxes. As a result, no provision for U.S. federal income taxes is required.
The Funds may be subject to foreign taxation related to income received, capital gains on the sale of securities and certain foreign currency transactions in the foreign jurisdictions in which it invests. Foreign taxes, if any, are recorded based on the tax regulations and rates that exist in the foreign markets in which the Funds invest. When a capital gain tax is determined to apply the Funds record an estimated deferred tax liability in an amount that would be payable if the securities were disposed of on the valuation date.
Each fund recognizes the tax benefits of uncertain tax positions only when the position is “more likely than not” to be sustained upon examination by the tax authorities based on the technical merits of the tax position. As of October 31, 2014, and for all open tax years, each fund has determined that no liability for unrecognized tax benefits is required in each fund’s financial statements related to uncertain tax positions taken on a tax return (or expected to be taken on future tax returns). Open tax years are those that remain subject to examination and are based on each tax jurisdiction statute of limitation.
k. Security Transactions, Investment Income, Expenses and Distributions
Security transactions are accounted for on trade date. Realized gains and losses on security transactions are determined on a specific identification basis. Interest income and estimated expenses are accrued daily. Amortization of premium and accretion of discount on debt securities are included in interest income. Paydown gains and losses are recorded separately on the Statements of Operations. Facility fees are recognized as income over the expected term of the loan. Dividend income is recorded on the ex-dividend date. Dividends from net investment income are normally declared daily; these dividends may be reinvested or paid monthly to shareholders. Distributions from realized capital gains and other distributions, if any, are recorded on the ex-dividend date. Distributions to shareholders are determined according to income tax regulations (tax basis). Distributable earnings determined on a tax basis may differ from earnings recorded in accordance with accounting principles generally accepted in the United States of America. These differences may be permanent or temporary. Permanent differences are reclassified among capital accounts to reflect their tax character. These reclassifications have no impact on net assets or the results of operations. Temporary differences are not reclassified, as they may reverse in subsequent periods.
Common expenses incurred by the Trust are allocated among the funds based on the ratio of net assets of each fund to the combined net assets of the Trust. Fund specific expenses are charged directly to the fund that incurred the expense.
Net investment income, not including class specific expenses, is allocated daily to each class of shares based upon the relative value of the settled shares of each class. Realized and unrealized gains and losses are allocated daily to each class of shares based upon the relative proportion of net assets of each class. Differences in per share distributions, by class, are generally due to differences in class specific expenses.
Inflation-indexed bonds are adjusted for inflation through periodic increases or decreases in the security’s interest accruals, face amount, or principal redemption value, by amounts corresponding to the rate of inflation as measured by an index. Any increase or decrease in the face amount or principal redemption value will be included as interest income on the Statements of Operations.
132 | Annual Report franklintempleton.com
FRANKLIN INVESTORS SECURITIES TRUST
NOTES TO FINANCIAL STATEMENTS
l. Accounting Estimates
The preparation of financial statements in accordance with accounting principles generally accepted in the United States of America requires management to make estimates and assumptions that affect the reported amounts of assets and liabilities at the date of the financial statements and the amounts of income and expenses during the reporting period. Actual results could differ from those estimates.
m. Guarantees and Indemnifications
Under the Trust’s organizational documents, its officers and trustees are indemnified by the Trust against certain liabilities arising out of the performance of their duties to the Trust. Additionally, in the normal course of business, the Trust, on behalf of the Funds, enters into contracts with service providers that contain general indemnification clauses. The Trust’s maximum exposure under these arrangements is unknown as this would involve future claims that may be made against the Trust that have not yet occurred. Currently, the Trust expects the risk of loss to be remote.
2. Shares of Beneficial Interest
At October 31, 2014, there were an unlimited number of shares authorized (without par value). Transactions in the Funds’ shares were as follows:
| Franklin Adjustable | |||||||||||
| U.S. Government | Franklin Floating Rate | ||||||||||
| Securities Fund | Daily Access Fund | ||||||||||
| Shares | Amount | Shares | Amount | ||||||||
| Class A Shares: | |||||||||||
| Year ended October 31, 2014 | |||||||||||
| Shares sold | 56,726,333 | $ | 493,156,230 | 62,743,683 | $ | 576,216,697 | |||||
| Shares issued in reinvestment of distributions | 1,211,754 | 10,533,553 | 7,278,949 | 66,675,264 | |||||||
| Shares redeemed | (62,585,334 | ) | (544,225,589 | ) | (79,152,310 | ) | (725,020,902 | ) | |||
| Net increase (decrease) | (4,647,247 | ) | $ | (40,535,806 | ) | (9,129,678 | ) | $ | (82,128,941 | ) | |
| Year ended October 31, 2013 | |||||||||||
| Shares sold | 58,683,667 | $ | 516,864,025 | 111,771,482 | $ | 1,025,150,562 | |||||
| Shares issued in reinvestment of distributions | 1,873,818 | 16,478,937 | 5,384,136 | 49,375,120 | |||||||
| Shares redeemed | (80,814,990 | ) | (711,186,881 | ) | (42,975,982 | ) | (394,076,704 | ) | |||
| Net increase (decrease) | (20,257,505 | ) | $ | (177,843,919 | ) | 74,179,636 | $ | 680,448,978 | |||
| Class A1 Shares: | |||||||||||
| Year ended October 31, 2014a | |||||||||||
| Shares sold | 479, 762 | $ | 4,165,394 | ||||||||
| Shares issued in reinvestment of distributions | 127,369 | 1,104,946 | |||||||||
| Shares issued on reorganization (Note 11) | 32,861,221 | 285,235,398 | |||||||||
| Shares redeemed | (4,278,282 | ) | (37,128,909 | ||||||||
| Net increase (decrease) | 29,190,070 | $ | 253,376,829 | ||||||||
| Class B Shares: | |||||||||||
| Year ended October 31, 2013b | |||||||||||
| Shares sold | 105 | $ | 968 | ||||||||
| Shares issued in reinvestment of distributions | 514 | 4,688 | |||||||||
| Shares redeemed | (108,136 | ) | (987,668 | ) | |||||||
| Net increase (decrease) | (107,517 | ) | $ | (982,012 | ) | ||||||
franklintempleton.com Annual Report | 133
FRANKLIN INVESTORS SECURITIES TRUST
NOTES TO FINANCIAL STATEMENTS
| 2. Shares of Beneficial Interest (continued) | |||||||||||
| Franklin Adjustable | |||||||||||
| U.S. Government | Franklin Floating Rate | ||||||||||
| Securities Fund | Daily Access Fund | ||||||||||
| Shares | Amount | Shares | Amount | ||||||||
| Class C Shares: | |||||||||||
| Year ended October 31, 2014 | |||||||||||
| Shares sold | 5,880,151 | $ | 51,098,838 | 23,556,769 | $ | 216,418,991 | |||||
| Shares issued in reinvestment of distributions | 399,478 | 3,470,678 | 2,500,639 | 22,916,196 | |||||||
| Shares redeemed | (26,069,904 | ) | (226,590,256 | ) | (27,193,901 | ) | (249,233,598 | ) | |||
| Net increase (decrease) | (19,790,275 | ) | $ | (172,020,740 | ) | (1,136,493 | ) | $ | (9,898,411 | ) | |
| Year ended October 31, 2013 | |||||||||||
| Shares sold | 18,407,162 | $ | 161,947,362 | 49,309,560 | $ | 452,404,650 | |||||
| Shares issued in reinvestment of distributions | 804,967 | 7,077,571 | 1,690,332 | 15,505,956 | |||||||
| Shares redeemed | (39,286,186 | ) | (345,161,719 | ) | (15,191,334 | ) | (139,347,040 | ) | |||
| Net increase (decrease) | (20,074,057 | ) | $ | (176,136,786 | ) | 35,808,558 | $ | 328,563,566 | |||
| Class R6 Shares: | |||||||||||
| Year ended October 31, 2014 | |||||||||||
| Shares sold | 944,164 | $ | 8,206,447 | 32,816 | $ | 300,925 | |||||
| Shares issued in reinvestment of distributions | 1,906 | 16,566 | 4,573 | 41,968 | |||||||
| Shares issued on reorganization (Note 11) | 73 | 634 | — | — | |||||||
| Shares redeemed | (156,214 | ) | (1,357,570 | ) | (131,382 | ) | (1,201,647 | ) | |||
| Net increase (decrease) | 789,929 | $ | 6,866,077 | (93,993 | ) | $ | (858,754 | ) | |||
| Year ended October 31, 2013c,d | |||||||||||
| Shares solde | 61,218 | $ | 534,089 | 143,480 | $ | 1,320,392 | |||||
| Shares issued in reinvestment of distributions | 105 | 914 | 2,490 | 22,856 | |||||||
| Shares redeemed | (22,910 | ) | (200,000 | ) | (544 | ) | (4,997 | ) | |||
| Net increase (decrease) | 38,413 | $ | 335,003 | 145,426 | $ | 1,338,251 | |||||
| Advisor Class Shares: | |||||||||||
| Year ended October 31, 2014 | |||||||||||
| Shares sold | 19,026,464 | $ | 165,565,812 | 116,221,189 | $ | 1,068,319,332 | |||||
| Shares issued in reinvestment of distributions | 500,990 | 4,358,956 | 3,385,525 | 31,034,838 | |||||||
| Shares issued on reorganization (Note 11) | 5,945,834 | 51,669,297 | — | — | |||||||
| Shares redeemed | (24,545,150 | ) | (213,655,001 | ) | (154,435,901 | ) | (1,412,592,684 | ) | |||
| Net increase (decrease) | 928,138 | $ | 7,939,064 | (34,829,187 | ) | $ | (313,238,514 | ) | |||
| Year ended October 31, 2013 | |||||||||||
| Shares sold | 32,961,207 | $ | 290,617,087 | 218,350,995 | $ | 2,004,137,448 | |||||
| Shares issued in reinvestment of distributions | 710,814 | 6,256,791 | 2,052,234 | 18,830,897 | |||||||
| Shares redeemede | (35,664,185 | ) | (314,049,131 | ) | (43,625,153 | ) | (400,341,939 | ) | |||
| Net increase (decrease) | (1,992,164 | ) | $ | (17,175,253 | ) | 176,778,076 | $ | 1,622,626,406 | |||
aFor the period June 18, 2014 (effective date) to October 31, 2014 for the Franklin Adjustable U.S. Government Securities Fund.
bEffective March 1, 2013, all Class B shares were converted to Class A.
cFor the period September 20, 2013 (effective date) to October 31, 2013 for the Franklin Adjustable U.S. Government Securities Fund.
dFor the period May 1, 2013 (effective date) to October 31, 2013 for the Franklin Floating Rate Daily Access Fund.
eEffective September 20, 2013, a portion of Advisor Class shares were exchanged into Class R6 for the Franklin Adjustable U.S. Government Securities Fund.
134 | Annual Report franklintempleton.com
| FRANKLIN INVESTORS SECURITIES TRUST | ||||||||||
| NOTES TO FINANCIAL STATEMENTS | ||||||||||
| Franklin Low Duration | ||||||||||
| Total Return Fund | Franklin Total Return Fund | |||||||||
| Shares | Amount | Shares | Amount | |||||||
| Class A Shares: | ||||||||||
| Year ended October 31, 2014 | ||||||||||
| Shares sold | 77,018,825 | $ | 780,315,075 | 92,296,531 | $ | 928,904,095 | ||||
| Shares issued in reinvestment of distributions | 2,326,807 | 23,575,249 | 9,547,433 | 95,480,955 | ||||||
| Shares redeemed | (49,716,506 | ) | (503,957,115 | ) | (86,470,305 | ) | (868,919,147 | ) | ||
| Net increase (decrease) | 29,629,126 | $ | 299,933,209 | 15,373,659 | $ | 155,465,903 | ||||
| Year ended October 31, 2013 | ||||||||||
| Shares sold | 93,059,954 | $ | 948,807,053 | 104,353,356 | $ | 1,070,043,749 | ||||
| Shares issued in reinvestment of distributions | 2,556,783 | 26,081,916 | 14,537,885 | 148,833,317 | ||||||
| Shares redeemed | (56,020,675 | ) | (571,122,179 | ) | (116,163,430 | ) | (1,175,249,206 | ) | ||
| Net increase (decrease) | 39,596,062 | $ | 403,766,790 | 2,727,811 | $ | 43,627,860 | ||||
| Class B Shares: | ||||||||||
| Year ended October 31, 2013a | ||||||||||
| Shares sold | 10,042 | $ | 105,055 | |||||||
| Shares issued in reinvestment of distributions | 3,034 | 31,389 | ||||||||
| Shares redeemed | (242,685 | ) | (2,522,743 | ) | ||||||
| Net increase (decrease) | (229,609 | ) | $ | (2,386,299 | ) | |||||
| Class C Shares: | ||||||||||
| Year ended October 31, 2014 | ||||||||||
| Shares sold | 10,574,750 | $ | 107,125,166 | 9,336,837 | $ | 93,844,642 | ||||
| Shares issued in reinvestment of distributions | 176,213 | 1,784,721 | 1,173,668 | 11,698,857 | ||||||
| Shares redeemed | (5,569,257 | ) | (56,414,328 | ) | (13,316,301 | ) | (133,175,861 | ) | ||
| Net increase (decrease) | 5,181,706 | $ | 52,495,559 | (2,805,796 | ) | $ | (27,632,362 | ) | ||
| Year ended October 31, 2013 | ||||||||||
| Shares sold | 12,828,853 | $ | 130,531,803 | 16,149,279 | $ | 166,169,898 | ||||
| Shares issued in reinvestment of distributions | 79,814 | 811,175 | 2,278,059 | 23,306,939 | ||||||
| Shares redeemed | (1,769,298 | ) | (17,970,882 | ) | (27,335,243 | ) | (276,024,832 | ) | ||
| Net increase (decrease) | 11,139,369 | $ | 113,372,096 | (8,907,905 | ) | $ | (86,547,995 | ) | ||
| Class R Shares: | ||||||||||
| Year ended October 31, 2014 | ||||||||||
| Shares sold | 1,646,059 | $ | 16,541,833 | |||||||
| Shares issued in reinvestment of distributions | 178,820 | 1,784,140 | ||||||||
| Shares redeemed | (2,522,745 | ) | (25,149,723 | ) | ||||||
| Net increase (decrease) | (697,866 | ) | $ | (6,823,750 | ) | |||||
| Year ended October 31, 2013 | ||||||||||
| Shares sold | 1,804,973 | $ | 18,449,066 | |||||||
| Shares issued in reinvestment of distributions | 332,414 | 3,404,066 | ||||||||
| Shares redeemed | (3,895,041 | ) | (39,892,685 | ) | ||||||
| Net increase (decrease) | (1,757,654 | ) | $ | (18,039,553 | ) | |||||
franklintempleton.com Annual Report | 135
FRANKLIN INVESTORS SECURITIES TRUST
NOTES TO FINANCIAL STATEMENTS
| 2. Shares of Beneficial Interest (continued) | |||||||||||
| Franklin Low Duration | |||||||||||
| Total Return Fund | Franklin Total Return Fund | ||||||||||
| Shares | Amount | Shares | Amount | ||||||||
| Class R6 Shares: | |||||||||||
| Year ended October 31, 2014 | |||||||||||
| Shares sold | 43,247,917 | $ | 440,572,603 | 2,714,332 | $ | 27,312,171 | |||||
| Shares issued in reinvestment of distributions | 808,495 | 8,209,754 | 97,701 | 978,007 | |||||||
| Shares redeemed | (2,874,545 | ) | (29,204,779 | ) | (32,991,314 | ) | (329,823,014 | ) | |||
| Net increase (decrease) | 41,181,867 | $ | 419,577,578 | (30,179,281 | ) | $ | (301,532,836 | ) | |||
| Year ended October 31, 2013b | |||||||||||
| Shares soldc | 91,591 | $ | 937,500 | 43,110,952 | $ | 449,289,948 | |||||
| Shares issued in reinvestment of distributions | 943 | 9,588 | 637,392 | 6,378,894 | |||||||
| Shares redeemed | — | — | (11,008,567 | ) | (108,454,716 | ) | |||||
| Net increase (decrease) | 92,534 | $ | 947,088 | 32,739,777 | $ | 347,214,126 | |||||
| Advisor Class Shares: | |||||||||||
| Year ended October 31, 2014 | |||||||||||
| Shares sold | 14,828,530 | $ | 150,675,321 | 32,191,963 | $ | 324,690,560 | |||||
| Shares issued in reinvestment of distributions | 234,320 | 2,380,850 | 3,762,761 | 37,724,042 | |||||||
| Shares redeemed | (10,796,013 | ) | (109,703,640 | ) | (24,377,626 | ) | (245,126,944 | ) | |||
| Net increase (decrease) | 4,266,837 | $ | 43,352,531 | 11,577,098 | $ | 117,287,658 | |||||
| Year ended October 31, 2013 | |||||||||||
| Shares sold | 12,660,371 | $ | 129,188,243 | 39,027,914 | $ | 400,656,520 | |||||
| Shares issued in reinvestment of distributions | 149,750 | 1,530,372 | 6,500,478 | 66,796,194 | |||||||
| Shares redeemedc | (4,321,381 | ) | (44,166,595 | ) | (72,073,519 | ) | (743,464,764 | ) | |||
| Net increase (decrease) | 8,488,740 | $ | 86,552,020 | (26,545,127 | ) | $ | (276,012,050 | ) | |||
aEffective March 1, 2013, all Class B shares were converted to Class A.
bFor the period May 1, 2013 (effective date) to October 31, 2013.
cEffective May 1, 2013, a portion of Advisor Class shares were exchanged into Class R6 for the Franklin Total Return Fund.
3. Transactions with Affiliates
Franklin Resources, Inc. is the holding company for various subsidiaries that together are referred to as Franklin Templeton Investments. Certain officers and trustees of the Trust are also officers and/or directors of the following subsidiaries:
| Subsidiary | Affiliation |
| Franklin Advisers, Inc. (Advisers) | Investment manager |
| Franklin Templeton Institutional, LLC (FT Institutional) | Investment manager |
| Franklin Advisers, Inc. (Advisers) | Administrative manager |
| Franklin Templeton Services, LLC (FT Services) | Administrative manager |
| Franklin Templeton Distributors, Inc. (Distributors) | Principal underwriter |
| Franklin Templeton Investor Services, LLC (Investor Services) | Transfer agent |
136 | Annual Report franklintempleton.com
FRANKLIN INVESTORS SECURITIES TRUST
NOTES TO FINANCIAL STATEMENTS
a. Management Fees
The Franklin Adjustable U.S. Government Securities Fund pays an investment management fee to Advisers based on the average daily net assets of the Fund as follows:
| Annualized Fee Rate | Net Assets |
| 0.500% | Up to and including $5 billion |
| 0.440% | Over $5 billion, up to and including $10 billion |
| 0.410% | Over $10 billion, up to and including $15 billion |
| 0.380% | In excess of $15 billion |
The Franklin Floating Rate Daily Access Fund pays an investment management fee to Advisers based on the average daily net assets of the fund as follows:
| Annualized Fee Rate | Net Assets |
| 0.650% | Up to and including $500 million |
| 0.550% | Over $500 million, up to and including $1 billion |
| 0.500% | Over $1 billion, up to and including $1.5 billion |
| 0.450% | Over $1.5 billion, up to and including $6.5 billion |
| 0.425% | Over $6.5 billion, up to and including $11.5 billion |
| 0.400% | Over $11.5 billion, up to and including $16.5 billion |
| 0.390% | Over $16.5 billion, up to and including $19 billion |
| 0.380% | Over $19 billion, up to and including $21.5 billion |
| 0.370% | In excess of $21.5 billion |
The Franklin Low Duration Total Return Fund and Franklin Total Return Fund pay an investment management fee to Advisers based on the average daily net assets of the funds as follows:
| Annualized Fee Rate | Net Assets |
| 0.625% | Up to and including $500 million |
| 0.525% | Over $500 million, up to and including $1 billion |
| 0.480% | Over $1 billion, up to and including $1.5 billion |
| 0.435% | Over $1.5 billion, up to and including $6.5 billion |
| 0.415% | Over $6.5 billion, up to and including $11.5 billion |
| 0.400% | Over $11.5 billion, up to and including $16.5 billion |
| 0.390% | Over $16.5 billion, up to and including $19 billion |
| 0.380% | Over $19 billion, up to and including $21.5 billion |
| 0.370% | In excess of $21.5 billion |
Under a subadvisory agreement, FT Institutional, an affiliate of Advisers, provides subadvisory services to the Franklin Total Return Fund. The subadvisory fee is paid by Advisers based on average daily net assets, and is not an additional expense of the fund.
b. Administrative Fees
Under an agreement with Advisers, FT Services provides administrative services to the Funds. The fee is paid by Advisers based on the Funds’ average daily net assets, and is not an additional expense of the Funds.
franklintempleton.com Annual Report | 137
FRANKLIN INVESTORS SECURITIES TRUST
NOTES TO FINANCIAL STATEMENTS
| 3. | Transactions with Affiliates (continued) |
| c. | Distribution Fees |
The Board has adopted distribution plans for each share class, with the exception of Class R6 and Advisor Class shares, pursuant to Rule 12b-1 under the 1940 Act. Distribution fees are not charged on shares held by affiliates. Under the Funds’ Class A and A1 reimbursement distribution plans, the Funds reimburse Distributors for costs incurred in connection with the servicing, sale and distribution of each fund’s shares up to the maximum annual plan rate for each class. Under the Class A and A1 reimbursement distribution plans, costs exceeding the maximum for the current plan year cannot be reimbursed in subsequent periods. In addition, under the funds’ Class C and R compensation distribution plans, the funds pays Distributors for costs incurred in connection with the servicing, sale and distribution of each fund’s shares up to the maximum annual plan rate for each class. The plan year, for purposes of monitoring compliance with the maximum annual plan rates, is February 1 through January 31 for each fund.
The maximum annual plan rates, based on the average daily net assets, for each class, are as follows:
| Franklin | Franklin | Franklin | ||||||
| Adjustable | Floating | Low Duration | Franklin | |||||
| U.S. Government | Rate Daily | Total Return | Total Return | |||||
| Securities Fund | Access Fund | Fund | Fund | |||||
| Reimbursement Plans: | ||||||||
| Class A | 0.25 | % | 0.25 | % | 0.25 | % | 0.25 | % |
| Class A1 | 0.10 | % | — | — | — | |||
| Compensation Plans: | ||||||||
| Class C | 0.65 | % | 0.65 | % | 0.65 | % | 0.65 | % |
| Class R | — | — | — | 0.50 | % |
d. Sales Charges/Underwriting Agreements
Front-end sales charges and contingent deferred sales charges (CDSC) do not represent expenses of the Funds. These charges are deducted from the proceeds of sales of fund shares prior to investment or from redemption proceeds prior to remittance, as applicable. Distributors has advised the Funds of the following commission transactions related to the sales and redemptions of the Funds’ shares for the year:
| Franklin | Franklin | Franklin | ||||||
| Adjustable | Floating | Low Duration | Franklin | |||||
| U.S. Government | Rate Daily | Total Return | Total Return | |||||
| Securities Fund | Access Fund | Fund | Fund | |||||
| Sales charges retained net of commissions paid to unaffiliated | ||||||||
| broker/dealers | $ | 153,123 | $ | 313,052 | $ | 612,522 | $ | 2,378,531 |
| CDSC retained | $ | 65,540 | $ | 233,136 | $ | 115,580 | $ | 65,083 |
| e. Transfer Agent Fees | ||||||||
Each class of shares, except for Class R6, pays transfer agent fees to Investor Services for its performance of shareholder servicing obligations and reimburses Investor Services for out of pocket expenses incurred, including shareholding servicing fees paid to third parties. These fees are allocated daily based upon their relative proportion of such classes’ aggregate net assets. Class R6 pays Investor Services transfer agent fees specific to that class.
138 | Annual Report franklintempleton.com
FRANKLIN INVESTORS SECURITIES TRUST
NOTES TO FINANCIAL STATEMENTS
For the year ended October 31, 2014, the Funds paid transfer agent fees as noted in the Statements of Operations of which the following amounts were retained by Investor Services:
| Franklin | Franklin | Franklin | ||||||
| Adjustable | Floating | Low Duration | Franklin | |||||
| U.S. Government | Rate Daily | Total Return | Total Return | |||||
| Securities Fund | Access Fund | Fund | Fund | |||||
| Transfer agent fees | $ | 936,381 | $ | 1,409,837 | $ | 720,825 | $ | 3,044,216 |
f. Investments in Institutional Fiduciary Trust Money Market Portfolio
The Funds invest in Institutional Fiduciary Trust Money Market Portfolio (Sweep Money Fund), an affiliated open-end management investment company. Management fees paid by the Funds are waived on assets invested in the Sweep Money Fund, as noted on the Statements of Operations, in an amount not to exceed the management and administrative fees paid directly or indirectly by the Sweep Money Fund. Prior to November 1, 2013, the waiver was accounted for as a reduction to management fees.
g. Waiver and Expense Reimbursements
Advisers and Investor Services have contractually agreed in advance to waive or limit their respective fees and to assume as their own expense certain expenses otherwise payable by the Franklin Low Duration Total Return Fund and Franklin Total Return Fund so that the expenses (excluding distribution fees, and, acquired fund fees and expenses) for Class A, Class C, Class R and Advisor Class of the funds do not exceed 0.55% and 0.63%, respectively, and Class R6 does not exceed 0.44% and 0.47%, respectively based on the average net assets of each class (other than certain non-routine expenses or costs, including those relating to litigation, indemnification, reorganizations, and liquidations) until February 28, 2015.
Investor Services has contractually agreed in advance to waive or limit its fees so that the Class R6 transfer agent fees do not exceed 0.01% until February 28, 2015.
Additionally, effective November 1, 2012, Advisers has voluntarily agreed to waive or limit a portion of its investment management fees for the Franklin Floating Rate Daily Access Fund and Franklin Total Return Fund based on the average daily net assets of each of the funds as follows:
| Annualized Waiver Rate | Net Assets |
| 0.015% | Over $2.5 billion, up to and including $5 billion |
| 0.025% | In excess of $5 billion |
Advisers may discontinue this waiver at any time.
h. Other Affiliated Transactions
At October 31, 2014, one or more of the funds in Franklin Fund Allocator Series owned a percentage of each fund’s outstanding shares:
| Franklin | Franklin | ||||
| Floating Rate | Low Duration | Franklin | |||
| Daily Access | Total Return | Total Return | |||
| Fund | Fund | Fund | |||
| 0.01 | % | 17.48 | % | 0.01 | % |
franklintempleton.com Annual Report | 139
FRANKLIN INVESTORS SECURITIES TRUST
NOTES TO FINANCIAL STATEMENTS
4. Expense Offset Arrangement
The Funds have entered into an arrangement with their custodian whereby credits realized as a result of uninvested cash balances are used to reduce a portion of the Funds’ custodian expenses. During the year ended October 31, 2014, the custodian fees were reduced as noted in the Statements of Operations.
5. Income Taxes
For tax purposes, capital losses may be carried over to offset future capital gains. Capital loss carryforwards with no expiration, if any, must be fully utilized before those losses with expiration dates.
| At October 31, 2014, capital loss carryforwards were as follows: | |||||||||
| Franklin | Franklin | Franklin | |||||||
| Adjustable | Floating | Low Duration | Franklin | ||||||
| U.S. Government | Rate Daily | Total Return | Total Return | ||||||
| Securities Fund | Access Fund | Fund | Fund | ||||||
| Capital loss carryforwards subject to expiration: | |||||||||
| 2015 | $ | 3,215,296 | $ | 15,799,002 | $ | — | $ | — | |
| 2016 | 1,492,446 | 91,562,953 | — | 1,260,827 | |||||
| 2017 | 4,398,245 | 113,325,538 | — | — | |||||
| 2018 | 39,689,305 | — | — | — | |||||
| 2019 | 21,934,757 | 10,282,409 | 5,327,487 | — | |||||
| Capital loss carryforwards not subject to expiration: | |||||||||
| Short term | 14,491,283 | 9,252,777 | 6,220,177 | 39,132,140 | |||||
| Long term | 49,558,936 | — | 15,582,855 | 9,045,914 | |||||
| Total capital loss carryforwards | $ | 134,780,266 | a | $ | 240,222,679 | $ | 27,130,519 | $ | 49,438,881 |
aIncludes $21,214,088 from the merged Franklin Limited Maturity U.S. Government Securities Fund, which may be carried over to offset future capital gains, subject to
certain limitations.
On October 31, 2014, the Franklin Adjustable U.S. Government Securities Fund had expired capital loss carryforwards of $3,962,540, which were reclassified to paid-in capital.
During the year ended October 31, 2014, the Franklin Total Return Fund utilized $8,674,602 of capital loss carryforwards.
The tax character of distributions paid during the years ended October 31, 2014 and 2013, was as follows:
| Franklin | Franklin | |||||||
| Adjustable U.S. Government | Floating Rate | |||||||
| Securities Fund | Daily Access Fund | |||||||
| 2014 | 2013 | 2014 | 2013 | |||||
| Distributions paid from: | ||||||||
| Ordinary income | $ | 22,346,602 | $ | 33,479,419 | $ | 199,138,184 | $ | 127,292,439 |
| Franklin | Franklin | |||||||
| Low Duration Total Return Fund | Total Return Fund | |||||||
| 2014 | 2013 | 2014 | 2013 | |||||
| Distributions paid from: | ||||||||
| Ordinary income | $ | 38,616,884 | $ | 30,921,654 | $ | 161,243,823 | $ | 230,495,713 |
| Long term capital gain | — | — | — | 39,943,699 | ||||
| $ | 38,616,884 | $ | 30,921,654 | $ | 161,243,823 | $ | 270,439,412 | |
140 | Annual Report franklintempleton.com
FRANKLIN INVESTORS SECURITIES TRUST
NOTES TO FINANCIAL STATEMENTS
At October 31, 2014, the cost of investments, net unrealized appreciation (depreciation), and undistributed ordinary income for income tax purposes were as follows:
| Franklin | Franklin | Franklin | ||||||||||
| Adjustable | Floating | Low Duration | Franklin | |||||||||
| U.S. Government | Rate Daily | Total Return | Total Return | |||||||||
| Securities Fund | Access Fund | Fund | Fund | |||||||||
| Cost of investments | $ | 2,124,012,332 | $ | 4,572,084,273 | $ | 2,353,281,435 | $ | 5,656,417,535 | ||||
| Unrealized appreciation | $ | 39,816,567 | $ | 14,207,494 | $ | 15,432,826 | $ | 137,287,002 | ||||
| Unrealized depreciation | (5,759,697 | ) | (50,175,651 | ) | (25,460,120 | ) | (65,353,285 | ) | ||||
| Net unrealized appreciation (depreciation) | $ | 34,056,870 | $ | (35,968,157 | ) | $ | (10,027,294 | ) | $ | 71,933,717 | ||
| Distributable earnings – undistributed ordinary | ||||||||||||
| income | $ | 301,020 | $ | 7,134,630 | $ | 19,384,773 | $ | 76,851,927 | ||||
Differences between income and/or capital gains as determined on a book basis and a tax basis are primarily due to differing treatment of foreign currency transactions, mortgage dollar rolls, paydown losses, bond discounts and premiums, and wash sales.
| 6. Investment Transactions | ||||||||||||||
| Purchases and sales (excluding short term securities) for the year ended October 31, 2014, were as follows: | ||||||||||||||
| Franklin | Franklin | Franklin | ||||||||||||
| Adjustable | Floating | Low Duration | Franklin | |||||||||||
| U.S. Government | Rate Daily | Total Return | Total Return | |||||||||||
| Securities Fund | Access Fund | Fund | Fund | |||||||||||
| Purchases | $ | 276,862,261 | $ | 4,018,227,402 | $ | 2,017,828,916 | $ | 13,273,998,971 | ||||||
| Sales | $ | 558,255,351 | $ | 4,236,290,562 | $ | 1,507,932,303 | $ | 14,756,621,323 | ||||||
| Transactions in options written during the year ended October 31, 2014, were as follows: | ||||||||||||||
| Franklin Low Duration | Franklin | |||||||||||||
| Total Return Fund | Total Return Fund | |||||||||||||
| Notional | Premiums | Notional | Premiums | |||||||||||
| Amount* | Received | Amount* | Received | |||||||||||
| Options outstanding at October 31, 2013 | — | $ | — | — | $ | — | ||||||||
| Options written | 50,800,000 | 192,206 | 171,250,000 | 883,457 | ||||||||||
| Options expired | — | — | (22,350,000 | ) | (160,920 | ) | ||||||||
| Options exercised | — | — | — | — | ||||||||||
| Options closed | (45,500,000 | ) | (171,441 | ) | (125,000,000 | ) | (628,882 | ) | ||||||
| Options outstanding at October 31, 2014 | 5,300,000 | $ | 20,765 | 23,900,000 | $ | 93,655 | ||||||||
| *The notional amount is stated in U.S. dollars unless otherwise indicated. | ||||||||||||||
See Notes 1(d) and 10 regarding derivative financial instruments and other derivative information, respectively.
7. Credit Risk
At October 31, 2014, the Franklin Floating Rate Daily Access Fund, Franklin Low Duration Total Return Fund and Franklin Total Return Fund had 93.23%, 21.46%, and 17.30%, respectively, of their portfolio invested in high yield securities, senior secured floating rate notes, or other securities rated below investment grade. These securities may be more sensitive to economic conditions causing greater price volatility and are potentially subject to a greater risk of loss due to default than higher rated securities.
franklintempleton.com
Annual Report
| 141
FRANKLIN INVESTORS SECURITIES TRUST
NOTES TO FINANCIAL STATEMENTS
8. Restricted Securities
The Franklin Floating Rate Daily Access Fund invests in securities that are restricted under the Securities Act of 1933 (1933 Act) or which are subject to legal, contractual, or other agreed upon restrictions on resale. Restricted securities are often purchased in private placement transactions, and cannot be sold without prior registration unless the sale is pursuant to an exemption under the 1933 Act. Disposal of these securities may require greater effort and expense, and prompt sale at an acceptable price may be difficult. The fund may have registration rights for restricted securities. The issuer generally incurs all registration costs.
At October 31, 2014, the Franklin Floating Rate Daily Access Fund held investments in restricted securities, excluding certain securities exempt from registration under the 1933 Act deemed to be liquid, as follows:
| Acquisition | ||||
| Shares | Issuer | Date | Cost | Value |
| 26,267 | RoTech Medical Corp. (Value is 0.00% of Net Assets) | 12/03/10 | $ — | $ — |
9. Unfunded Loan Commitments
The Funds, except Franklin Adjustable U.S. Government Securities Fund, enter into certain credit agreements, all or a portion of which may be unfunded. The funds are obligated to fund these loan commitments at the borrowers’ discretion. Funded portions of credit agreements are presented on the Statements of Investments.
| At October 31, 2014, unfunded commitments were as follows: | ||
| Unfunded | ||
| Borrower | Commitment | |
| Franklin Floating Rate Daily Access Fund | ||
| Alinta Energy Finance Pty. Ltd., Delayed Draw Term Commitments | $ | 2,427,664 |
| Franklin Low Duration Total Return Fund | ||
| BMC Software Finance Inc., Initial US Revolving Commitment | $ | 3,492,917 |
| Franklin Total Return Fund | ||
| BMC Software Finance Inc., Initial US Revolving Commitment | $ | 7,629,911 |
| Patriot Coal Corp., Reimbursement Obligation | 27,601 | |
| $ | 7,657,512 | |
Unfunded loan commitments and funded portions of credit agreements are marked to market daily and any unrealized appreciation or depreciation is included in the Statements of Assets and Liabilities and the Statements of Operations.
10. Other Derivative Information
At October 31, 2014, the funds’ investments in derivative contracts are reflected on the Statements of Assets and Liabilities as follows:
| Asset Derivatives | Liability Derivatives | ||||
| Derivative Contracts | |||||
| Not Accounted for as | Statement of Assets and | Fair Value | Statement of Assets and | Fair Value | |
| Hedging Instruments | Liabilities Location | Amount | Liabilities Location | Amount | |
| Franklin Floating Rate | |||||
| Daily Access Fund | |||||
| Credit contracts | Unrealized appreciation on swap | Unrealized depreciation on swap | |||
| contracts / Net assets consist of – | contracts / Net assets consist of – | ||||
| net unrealized appreciation | net unrealized appreciation | ||||
| (depreciation) | $ | 367,810 | (depreciation) | $ — |
142 | Annual Report franklintempleton.com
FRANKLIN INVESTORS SECURITIES TRUST
NOTES TO FINANCIAL STATEMENTS
| Asset Derivatives | Liability Derivatives | |||||||
| Derivative Contracts | ||||||||
| Not Accounted for as | Statement of Assets and | Fair Value | Statement of Assets and | Fair Value | ||||
| Hedging Instruments | Liabilities Location | Amount | Liabilities Location | Amount | ||||
| Franklin Low Duration | ||||||||
| Total Return Fund | ||||||||
| Interest rate contracts | Unrealized appreciation on swap | Net assets consist of – net | ||||||
| contracts / Variation margin / Net | unrealized appreciation | |||||||
| assets consist of – net unrealized | (depreciation) | $ | 504,253 | a | ||||
| appreciation (depreciation) | $ | 430,438 | a | |||||
| Foreign exchange contracts | Investments, at value / Unrealized | Options written, at value / | ||||||
| appreciation on forward exchange | Unrealized depreciation on forward | |||||||
| contracts / Net assets consist of – | exchange contracts / Net assets | |||||||
| net unrealized appreciation | consist of – net unrealized | |||||||
| (depreciation) | 15,927,450 | (depreciation) | 1,341,757 | |||||
| Credit contracts | Investments, at value / Unrealized | Unrealized depreciation on swap | ||||||
| appreciation on swap contracts / | contracts / Net assets consist of – | |||||||
| Net assets consist of – net | net unrealized appreciation | |||||||
| unrealized appreciation | (depreciation) | 1,982,250 | ||||||
| (depreciation) | 1,182,304 | |||||||
| Franklin Total Return Fund | ||||||||
| Interest rate contracts | Unrealized appreciation on swap | Net assets consist of – net | ||||||
| contracts / Investments, at value / | unrealized appreciation | |||||||
| Variation margin / Net assets consist | (depreciation) | $ | 3,614,577 | a | ||||
| of – net unrealized appreciation | ||||||||
| (depreciation) | $ | 939,429 | ||||||
| Foreign exchange contracts | Investments, at value / Unrealized | Options written, at value / | ||||||
| appreciation on forward exchange | Unrealized depreciation on forward | |||||||
| contracts / Net assets consist of – | exchange contracts / Net assets | |||||||
| net unrealized appreciation | consist of – net unrealized | |||||||
| (depreciation) | 50,637,862 | appreciation (depreciation) | 3,801,715 | |||||
| Credit contracts | Investments, at value / Unrealized | Unrealized depreciation on swap | ||||||
| appreciation on swap contracts / | contracts / Net assets consist of – | |||||||
| Net assets consist of – net | net unrealized appreciation | |||||||
| unrealized appreciation | (depreciation) | 7,462,298 | ||||||
| (depreciation) | 3,930,998 | |||||||
aIncludes cumulative appreciation (depreciation) of futures contracts and credit default swaps as reported in the Statements of Investments. Only current day’s variation
margin is separately reported within the Statements of Assets and Liabilities.
For the year ended October 31, 2014, the effect of derivative contracts on the funds’ Statements of Operations was as follows:
| Change in | |||||
| Unrealized | |||||
| Derivative Contracts | Realized | Appreciation | |||
| Not Accounted for as | Gain (Loss) | (Depreciation) | |||
| Hedging Instruments | Statement of Operations Locations | for the Year | for the Year | ||
| Franklin Floating Rate Daily Access Fund | |||||
| Credit contracts | Net realized gain (loss) from swap contracts / Net change | ||||
| in unrealized appreciation (depreciation) on investments | $ | 135,170 | $ | 367,810 |
franklintempleton.com Annual Report | 143
FRANKLIN INVESTORS SECURITIES TRUST
NOTES TO FINANCIAL STATEMENTS
| 10. Other Derivative Information (continued) | |||||||
| Change in | |||||||
| Unrealized | |||||||
| Derivative Contracts | Realized | Appreciation | |||||
| Not Accounted for as | Gain (Loss) | (Depreciation) | |||||
| Hedging Instruments | Statement of Operations Locations | for the Year | for the Year | ||||
| Franklin Low Duration Total Return Fund | |||||||
| Interest rate contracts | Net realized gain (loss) from futures / swap | ||||||
| contracts / Net change in unrealized appreciation | |||||||
| (depreciation) on investments | $ | (3,577,325 | ) | $ | 1,155,500 | ||
| Foreign exchange contracts | Net realized gain (loss) from investments, written | ||||||
| options, and foreign currency transactions / Net | |||||||
| change in unrealized appreciation (depreciation) | |||||||
| on translation of other assets and liabilities | |||||||
| denominated in foreign currencies | (2,949,460 | ) | 17,793,346 | ||||
| Credit contracts | Net realized gain (loss) from investments, written | ||||||
| options, and swap contracts / Net change in unrealized | |||||||
| appreciation (depreciation) on investments | (153,075 | ) | (248,929 | ) | |||
| Franklin Total Return Fund | |||||||
| Interest rate contracts | Net realized gain (loss) from futures / swap contracts / | ||||||
| Net change in unrealized appreciation (depreciation) | |||||||
| on investments | $ | (2,854,376 | ) | $ | (3,439,844 | ) | |
| Foreign exchange contracts | Net realized gain (loss) from investments, written | ||||||
| options, and foreign currency transactions / Net | |||||||
| change in unrealized appreciation (depreciation) | |||||||
| on translation of other assets and liabilities | |||||||
| denominated in foreign currencies | (3,397,551 | ) | 51,462,274 | ||||
| Credit contracts | Net realized gain (loss) from investments, written | ||||||
| options, and swap contracts / Net change in | |||||||
| unrealized appreciation (depreciation) on | |||||||
| investments | (259,039 | ) | 1,000,223 | ||||
For the year ended October 31, 2014, the average month end fair value of derivatives for the Franklin Floating Rate Daily Access Fund, Franklin Low Duration Total Return Fund, and Franklin Total Return Fund represented 0.00%, 0.46%, and 0.83% of average month end net assets and the average month end number of open derivative contracts for the year was 0, 224, and 234, respectively.
See Notes 1(d) and 6 regarding derivative financial instruments and investment transactions, respectively.
| At October 31, 2014, the funds’ OTC derivative assets and liabilities, are as follows: | ||||
| Gross and Net Amounts of Assets and Liabilities | ||||
| Presented in the Statements of Assets and Liabilities | ||||
| Assetsa | Liabilitiesa | |||
| Derivatives | ||||
| Franklin Low Duration Total Return Fund | ||||
| Forward exchange contracts | $ | 15,883,870 | $ | 1,317,284 |
| Options purchased | 275,507 | — | ||
| Options written | — | 24,473 | ||
| Swap Contracts | 2,745,479 | 10,011,307 | ||
| Total | $ | 18,904,856 | $ | 11,353,064 |
| Franklin Total Return Fund | ||||
| Forward exchange contracts | $ | 50,441,004 | $ | 3,691,175 |
| Options purchased | 839,070 | — | ||
| Options written | — | 110,540 | ||
| Swap Contracts | 6,907,581 | 21,888,341 | ||
| Total | $ | 58,187,655 | $ | 25,690,056 |
aAbsent an event of default or early termination, OTC derivative assets and liabilities are presented gross and not offset in the Statements of Assets and Liabilities.
144 | Annual Report franklintempleton.com
FRANKLIN INVESTORS SECURITIES TRUST
NOTES TO FINANCIAL STATEMENTS
At October 31, 2014, the funds’ OTC derivative assets which may be offset against the funds’ OTC derivative liabilities and collateral received from the counterparty, is as follows:
| Amounts Not Offset in the | ||||||||||||||
| Statements of Assets and Liabilities | ||||||||||||||
| Gross and | ||||||||||||||
| Net Amounts of | Financial | Financial | ||||||||||||
| Assets Presented in | Instruments | Instruments | Cash | Net Amount | ||||||||||
| the Statements of | Available for | Collateral | Collateral | (Not less | ||||||||||
| Assets and Liabilities | Offset | Receiveda,b | Receivedb | than zero) | ||||||||||
| Franklin Low Duration Total Return Fund | ||||||||||||||
| Counterparty | ||||||||||||||
| BOFA | $ | 21,976 | $ | (21,976 | ) | $ | — | $ | — | $ | — | |||
| BZWS | 1,671,563 | (1,312,698 | ) | (199,866 | ) | — | 158,999 | |||||||
| CITI | 900,932 | (900,932 | ) | — | — | — | ||||||||
| DBAB | 13,983,689 | (2,699,457 | ) | (3,784,679 | ) | (3,770,000 | ) | 3,729,553 | ||||||
| FBCO | 279,506 | (232,675 | ) | — | — | 46,831 | ||||||||
| GSCO | 119,612 | (119,612 | ) | — | — | — | ||||||||
| HSBC | 161,561 | (16,519 | ) | — | — | 145,042 | ||||||||
| JPHQ | 1,407,772 | (1,407,772 | ) | — | — | — | ||||||||
| MSCO | 358,245 | (358,245 | ) | — | — | — | ||||||||
| Total | $ | 18,904,856 | $ | (7,069,886 | ) | $ | (3,984,545 | ) | $ | (3,770,000 | ) | $ | 4,080,425 | |
| Amounts Not Offset in the | ||||||||||||||
| Statements of Assets and Liabilities | ||||||||||||||
| Gross and | ||||||||||||||
| Net Amounts of | Financial | Financial | ||||||||||||
| Assets Presented in | Instruments | Instruments | Cash | Net Amount | ||||||||||
| the Statements of | Available for | Collateral | Collateral | (Not less | ||||||||||
| Assets and Liabilities | Offset | Receiveda,b | Receivedb | than zero) | ||||||||||
| Franklin Total Return Fund | ||||||||||||||
| Counterparty | ||||||||||||||
| BOFA | $ | 250,642 | $ | (185,806 | ) | $ | (64,836 | ) | $ | — | $ | — | ||
| BZWS | 3,348,100 | (2,991,341 | ) | — | — | 356,759 | ||||||||
| CITI | 2,688,905 | (1,869,669 | ) | — | — | 819,236 | ||||||||
| DBAB | 37,190,334 | (3,524,962 | ) | (4,188,223 | ) | (18,170,000 | ) | 11,307,149 | ||||||
| FBCO | 1,719,187 | (1,644,153 | ) | — | — | 75,034 | ||||||||
| GSCO | 772,718 | (772,718 | ) | — | — | — | ||||||||
| HSBC | 1,235,003 | (127,559 | ) | (769,108 | ) | — | 338,336 | |||||||
| JPHQ | 9,638,358 | (4,117,739 | ) | (3,353,955 | ) | — | 2,166,664 | |||||||
| MSCO | 882,177 | (882,177 | ) | — | — | — | ||||||||
| UBSW | 462,231 | (462,231 | ) | — | — | — | ||||||||
| Total | $ | 58,187,655 | $ | (16,578,355 | ) | $ | (8,376,122 | ) | $ | (18,170,000 | ) | $ | 15,063,178 | |
aAt October 31, 2014, the Fund received United Kingdom Treasury Notes and U.S. Treasury Bonds and Notes as collateral for derivatives.
bIn some instances, the collateral amounts disclosed in the table above were adjusted due to the requirement to limit the collateral amounts to avoid the effect of
overcollateralization. Actual collateral received and/or pledged may be more than the amounts disclosed herein.
franklintempleton.com Annual Report | 145
FRANKLIN INVESTORS SECURITIES TRUST
NOTES TO FINANCIAL STATEMENTS
10. Other Derivative Information (continued)
At October 31, 2014, the funds’ OTC derivative liabilities which may be offset against the funds’ OTC derivative assets and collateral pledged to the counterparty, is as follows:
| Amounts Not Offset in the | ||||||||||||
| Statements of Assets and Liabilities | ||||||||||||
| Gross and | ||||||||||||
| Net Amounts of | Financial | Financial | ||||||||||
| Liabilities Presented in | Instruments | Instruments | Cash | Net Amount | ||||||||
| the Statements of | Available for | Collateral | Collateral | (Not less | ||||||||
| Assets and Liabilities | Offset | Pledged | Pledgeda | than zero) | ||||||||
| Franklin Low Duration Total Return Fund | ||||||||||||
| Counterparty | ||||||||||||
| BOFA | $ | 317,171 | $ | (21,976 | ) | $ | — | $ | (295,195 | ) | $ | — |
| BZWS | 1,312,698 | (1,312,698 | ) | — | — | — | ||||||
| CITI | 1,020,484 | (900,932 | ) | — | — | 119,552 | ||||||
| DBAB | 2,699,457 | (2,699,457 | ) | — | — | — | ||||||
| FBCO | 232,675 | (232,675 | ) | — | — | — | ||||||
| GSCO | 3,253,048 | (119,612 | ) | — | (3,133,436 | ) | — | |||||
| HSBC | 16,519 | (16,519 | ) | — | — | — | ||||||
| JPHQ | 1,766,141 | (1,407,772 | ) | — | (358,369 | ) | — | |||||
| MSCO | 734,871 | (358,245 | ) | — | (376,626 | ) | — | |||||
| Total | $ | 11,353,064 | $ | (7,069,886 | ) | $ | — | $ | (4,163,626 | ) | $ | 119,552 |
| Amounts Not Offset in the | ||||||||||||
| Statements of Assets and Liabilities | ||||||||||||
| Gross and | ||||||||||||
| Net Amounts of | Financial | Financial | ||||||||||
| Liabilities Presented in | Instruments | Instruments | Cash | Net Amount | ||||||||
| the Statements of | Available for | Collateral | Collateral | (Not less | ||||||||
| Assets and Liabilities | Offset | Pledged | Pledgeda | than zero) | ||||||||
| Franklin Total Return Fund | ||||||||||||
| Counterparty | ||||||||||||
| BOFA | $ | 185,806 | $ | (185,806 | ) | $ | — | $ | — | $ | — | |
| BZWS | 2,991,341 | (2,991,341 | ) | — | — | — | ||||||
| CITI | 1,869,669 | (1,869,669 | ) | — | — | — | ||||||
| DBAB | 3,524,962 | (3,524,962 | ) | — | — | — | ||||||
| FBCO | 1,644,153 | (1,644,153 | ) | — | — | — | ||||||
| GSCO | 8,594,384 | (772,718 | ) | — | (7,821,666 | ) | — | |||||
| HSBC | 127,559 | (127,559 | ) | — | — | — | ||||||
| JPHQ | 4,117,739 | (4,117,739 | ) | — | — | — | ||||||
| MSCO | 1,044,444 | (882,177 | ) | — | (162,267 | ) | — | |||||
| UBSW | 1,589,999 | (462,231 | ) | — | (1,127,768 | ) | — | |||||
| Total | $ | 25,690,056 | $ | (16,578,355 | ) | $ | — | $ | (9,111,701 | ) | $ | — |
aIn some instances, the collateral amounts disclosed in the table above were adjusted due to the requirement to limit the collateral amounts to avoid the effect of
overcollateralization. Actual collateral received and/or pledged may be more than the amounts disclosed herein.
146 | Annual Report franklintempleton.com
FRANKLIN INVESTORS SECURITIES TRUST
NOTES TO FINANCIAL STATEMENTS
11. Reorganization
On June 18, 2014, the Franklin Adjustable U.S. Government Securities Fund (Surviving Fund), pursuant to a plan of reorganization approved on May 30, 2014 by shareholders of Franklin Limited Maturity U.S. Government Securities Fund (Acquired Fund), acquired 100% of the Acquired Fund’s net assets, primarily made up of investment securities, which included $2,097,543 of unrealized appreciation (depreciation), through a tax-free exchange of 38,807,128 shares of the Surviving Fund (valued at $336,905,329). Immediately after the completion of the reorganization, the combined net assets of the Surviving Fund were $2,285,620,454.
The primary purpose for the reorganization was to combine the Acquired Fund with a larger fund that has generally similar goals and investment policies. The estimated cost of the reorganization was $194,753 of which the Surviving Fund and the Acquired Fund each paid 25% and Advisers paid 50%. The allocated portion of the Surviving Fund’s reorganization expenses are included with other expenses in the Statement of Operations.
Assuming the reorganization had been completed on November 1, 2012, the Surviving Fund’s pro forma results of operations would have been as follows:
| Net Increase | ||||||||
| Net | Net Realized | (Decrease) in | ||||||
| Investment | and Unrealized | Net Assets from | ||||||
| Period | Income | Gain (Loss) | Operations | |||||
| For the period November 1, 2012 through October 31, 2013 | $ | 15,962,697 | $ | (33,488,657 | ) | $ | (17,525,960 | ) |
| For the period November 1, 2013 through October 31, 2014 | $ | 10,460,196 | $ | 1,259,718 | $ | 11,719,914 | ||
Subsequent to the reorganization, the Surviving Fund has been managed as a single entity. Accordingly, it is impracticable to identify the amounts of investment income and net investment income attributable to the Acquired Fund’s assets after the completion of the reorganization.
12. Credit Facility
The Funds, together with other U.S. registered and foreign investment funds (collectively, Borrowers), managed by Franklin Templeton Investments, are borrowers in a joint syndicated senior unsecured credit facility totaling $1.5 billion (Global Credit Facility) which matures on February 13, 2015. This Global Credit Facility provides a source of funds to the Borrowers for temporary and emergency purposes, including the ability to meet future unanticipated or unusually large redemption requests.
Under the terms of the Global Credit Facility, the Funds shall, in addition to interest charged on any borrowings made by the Funds and other costs incurred by the Funds, pay their share of fees and expenses incurred in connection with the implementation and maintenance of the Global Credit Facility, based upon their relative share of the aggregate net assets of all of the Borrowers, including an annual commitment fee of 0.07% based upon the unused portion of the Global Credit Facility. These fees are reflected in other expenses on the Statements of Operations. During the year ended October 31, 2014, the Funds did not use the Global Credit Facility.
franklintempleton.com Annual Report | 147
FRANKLIN INVESTORS SECURITIES TRUST
NOTES TO FINANCIAL STATEMENTS
13. Fair Value Measurements
The Funds follow a fair value hierarchy that distinguishes between market data obtained from independent sources (observable inputs) and the Funds’ own market assumptions (unobservable inputs). These inputs are used in determining the value of the Funds’ financial instruments and are summarized in the following fair value hierarchy:
- Level 1 – quoted prices in active markets for identical financial instruments
- Level 2 – other significant observable inputs (including quoted prices for similar financial instruments, interest rates, prepayment speed, credit risk, etc.)
- Level 3 – significant unobservable inputs (including the Funds’ own assumptions in determining the fair value of financial instruments)
The input levels are not necessarily an indication of the risk or liquidity associated with financial instruments at that level.
For movements between the levels within the fair value hierarchy, the Funds have adopted a policy of recognizing the transfers as of the date of the underlying event which caused the movement.
A summary of inputs used as of October 31, 2014, in valuing the Funds’ assets and liabilities carried at fair value, is as follows:
| Level 1 | Level 2 | Level 3 | Total | |||||
| Franklin Adjustable U.S. Government Securities Fund | ||||||||
| Assets: | ||||||||
| Investments in Securities: | ||||||||
| Mortgage-Backed Securities | $ | — | $ | 1,993,610,845 | $ | — | $ | 1,993,610,845 |
| U.S. Government and Agency Securities | — | 60,032,881 | — | 60,032,881 | ||||
| Short Term Investments | 104,425,477 | — | — | 104,425,477 | ||||
| Total Investments in Securities | $ | 104,425,477 | $ | 2,053,643,726 | $ | — | $ | 2,158,069,203 |
| Franklin Floating Rate Daily Access Fund | ||||||||
| Assets: | ||||||||
| Investments in Securities: | ||||||||
| Equity Investments: | ||||||||
| Health Care Distributors | $ | — | $ | — | $ | —a | $ | — |
| Other Equity Investmentsb,c | 75,933,663 | — | — | 75,933,663 | ||||
| Senior Floating Rate Interests | — | 4,152,252,911 | 694,441 | 4,152,947,352 | ||||
| Asset-Backed Securities and Commercial Mortgage-Backed | ||||||||
| Securities | — | 98,058,511 | 19,146,337 | 117,204,848 | ||||
| Short Term Investments | 190,030,253 | — | — | 190,030,253 | ||||
| Total Investments in Securities | $ | 265,963,916 | $ | 4,250,311,422 | $ | 19,840,778 | $ | 4,536,116,116 |
| Other Financial Instruments | ||||||||
| Swap Contracts | $ | — | $ | 367,810 | $ | — | $ | 367,810 |
| Unfunded Loan Commitments | — | 50,790 | — | 50,790 | ||||
| Total Other Financial Instruments | $ | — | $ | 418,600 | $ | — | $ | 418,600 |
148 | Annual Report franklintempleton.com
FRANKLIN INVESTORS SECURITIES TRUST
NOTES TO FINANCIAL STATEMENTS
| Level 1 | Level 2 | Level 3 | Total | ||||||
| Franklin Low Duration Total Return Fund | |||||||||
| Assets: | |||||||||
| Investments in Securities: | |||||||||
| Equity Investmentsb | $ | 33,370,700 | $ | — | $ | — | $ | 33,370,700 | |
| Corporate Bonds | — | 824,591,882 | — | 824,591,882 | |||||
| Senior Floating Rate Interests | — | 121,733,981 | — | 121,733,981 | |||||
| Foreign Government and Agency Securities | — | 89,960,646 | — | 89,960,646 | |||||
| U.S. Government and Agency Securities | — | 136,869,722 | — | 136,869,722 | |||||
| Asset-Backed Securities and Commercial Mortgage-Backed | |||||||||
| Securities | — | 652,086,471 | 4,050,000 | 656,136,471 | |||||
| Mortgage-Backed Securities | — | 86,626,120 | — | 86,626,120 | |||||
| Municipal Bonds | — | 16,838,688 | — | 16,838,688 | |||||
| Escrows and Litigation Trusts | — | — | —a | — | |||||
| Options Purchased | — | 275,507 | — | 275,507 | |||||
| Short Term Investments | 368,717,716 | 8,132,708 | — | 376,850,424 | |||||
| Total Investments in Securities | $ | 402,088,416 | $ | 1,937,115,725 | $ | 4,050,000 | $ | 2,343,254,141 | |
| Other Financial Instruments | |||||||||
| Forward Exchange Contracts | $ | — | $ | 15,883,870 | $ | — | $ | 15,883,870 | |
| Swap Contracts | — | 1,380,815 | — | 1,380,815 | |||||
| Unfunded Loan Commitments | — | 526 | — | 526 | |||||
| Total Other Financial Instruments | $ | — | $ | 17,265,211 | $ | — | $ | 17,265,211 | |
| Liabilities: | |||||||||
| Other Financial Instruments | |||||||||
| Options Written | $ | — | $ | 24,473 | $ | — | $ | 24,473 | |
| Futures Contracts | 504,253 | — | — | 504,253 | |||||
| Forward Exchange Contracts | — | 1,317,284 | — | 1,317,284 | |||||
| Swap Contracts | — | 1,982,250 | — | 1,982,250 | |||||
| Total Other Financial Instruments | $ | 504,253 | $ | 3,324,007 | $ | — | $ | 3,828,260 | |
| Franklin Total Return Fund | |||||||||
| Assets: | |||||||||
| Investments in Securities: | |||||||||
| Equity Investments:b | |||||||||
| Consumer Services | $ | — | $ | 2,093,266 | — | $ | 2,093,266 | ||
| All Other Equity Investmentsc | 130,750,733 | — | — | 130,750,733 | |||||
| Corporate Bonds | — | 1,716,318,551 | — | 1,716,318,551 | |||||
| Senior Floating Rate Interests | — | 130,155,405 | 13,441 | 130,168,846 | |||||
| Foreign Government and Agency Securities | — | 437,985,191 | — | 437,985,191 | |||||
| U.S. Government and Agency Securities | — | 185,435,782 | — | 185,435,782 | |||||
| Asset-Backed Securities and Commercial Mortgage-Backed | |||||||||
| Securities | — | 738,375,831 | 11,332,145 | 749,707,976 | |||||
| Mortgage-Backed Securities | — | 906,859,939 | — | 906,859,939 | |||||
| Municipal Bonds | — | 166,938,635 | — | 166,938,635 | |||||
| Escrows and Litigation Trusts | 25,710 | — | 435 | a | 26,145 | ||||
| Options Purchased | — | 839,070 | — | 839,070 | |||||
| Short Term Investments | 1,299,919,596 | 1,307,522 | — | 1,301,227,118 | |||||
| Total Investments in Securities | $ | 1,430,696,039 | $ | 4,286,309,192 | $ | 11,346,021 | $ | 5,728,351,252 | |
| Other Financial Instruments | |||||||||
| Forward Exchange Contracts | $ | — | $ | 50,441,004 | $ | — | $ | 50,441,004 | |
| Swap Contracts | — | 4,228,215 | — | 4,228,215 | |||||
| Total Other Financial Instruments | $ | — | $ | 54,669,219 | $ | — | $ | 54,669,219 | |
franklintempleton.com Annual Report | 149
FRANKLIN INVESTORS SECURITIES TRUST
NOTES TO FINANCIAL STATEMENTS
| 13. Fair Value Measurements (continued) | ||||||||
| Level 1 | Level 2 | Level 3 | Total | |||||
| Franklin Total Return Fund (continued) | ||||||||
| Liabilities: | ||||||||
| Other Financial Instruments | ||||||||
| Options Written | $ | — | $ | 110,540 | $ | — | $ | 110,540 |
| Futures Contracts | 3,614,577 | — | — | 3,614,577 | ||||
| Forward Exchange Contracts | — | 3,691,175 | — | 3,691,175 | ||||
| Swap Contracts | — | 7,462,298 | — | 7,462,298 | ||||
| Unfunded Loan Commitments | — | 1,905 | — | 1,905 | ||||
| Total Other Financial Instruments | $ | 3,614,577 | $ | 11,265,918 | $ | — | $ | 14,880,495 |
aIncludes securities determined to have no value at October 31, 2014.
bIncludes common, preferred stocks as well as other equity investments.
cFor detailed categories, see the accompanying Statements of Investments.
A reconciliation of assets in which Level 3 inputs are used in determining fair value is presented when there are significant Level 3 financial instruments at the end of the year.
14. New Accounting Pronouncements
In June 2013, the Financial Accounting Standards Board (FASB) issued Accounting Standards Update (ASU) No. 2013-08, Investment Companies (Topic 946): Amendments to the Scope, Measurement, and Disclosure Requirements. The ASU modifies the criteria used in defining an investment company under U.S. Generally Accepted Accounting Principles and also sets forth certain measurement and disclosure requirements. Under the ASU, an entity that is registered under the 1940 Act automatically qualifies as an investment company. The ASU is effective for interim and annual reporting periods beginning after December 15, 2013. Management has reviewed the requirements and believes the adoption of this ASU will not have a material impact on the financial statements.
In June 2014, FASB issued ASU No. 2014-11, Transfers and Servicing (Topic 860), Repurchase-to-Maturity Transactions, Repurchase Financings, and Disclosures. The ASU changes the accounting for certain repurchase agreements and expands disclosure requirements related to repurchase agreements, securities lending, repurchase-to-maturity and similar transactions. The ASU is effective for interim and annual reporting periods beginning after December 15, 2014. Management is currently evaluating the impact, if any, of applying this provision.
15. Subsequent Events
The Funds have evaluated subsequent events through the issuance of the financial statements and determined that no events have occurred that require disclosure.
150 | Annual Report franklintempleton.com
FRANKLIN INVESTORS SECURITIES TRUST
NOTES TO FINANCIAL STATEMENTS
| Abbreviations | |||||
| Counterparty | Currency | Selected Portfolio | |||
| BOFA | Bank of America, N.A. | BRL | Brazilian Real | AGMC | Assured Guaranty Municipal Corp. |
| BZWS | Barclays Bank PLC | CHF | Swiss Franc | CDO | Collateralized Debt Obligation |
| CITI | Citigroup, Inc. | DKK | Danish Krone | CLO | Collateralized Loan Obligation |
| DBAB | Deutsche Bank AG | EUR | Euro | COP | Certificate of Participation |
| FBCO | Credit Suisse Group AG | GBP | British Pound | EDA | Economic Development Authority |
| GSCO | The Goldman Sachs Group, Inc. | HUF | Hungarian Forint | ETF | Exchange Traded Fund |
| HSBC | HSBC Bank USA, N.A. | JPY | Japanese Yen | FGIC | Financial Guaranty Insurance Co. |
| ICE | Intercontinental Exchange | KRW South Korean Won | FICO | Financing Corp. | |
| JPHQ | JP Morgan Chase & Co. | LKR | Sri Lankan Rupee | FRN | Floating Rate Note |
| MSCO Morgan Stanley | MXN | Mexican Peso | GO | General Obligation | |
| UBSW UBS AG | MYR | Malaysian Ringgit | GP | Graduated Payment | |
| PEN | Peruvian Nuevo Sol | IO | Interest Only | ||
| PHP | Philippine Peso | ISD | Independent School District | ||
| PLN | Polish Zloty | LIBOR | London InterBank Offered Rate | ||
| SGD | Singapore Dollar | MFM | Multi-Family Mortgage | ||
| UYU | Uruguayan Peso | NATL RE | National Public Finance Guarantee Corp. | ||
| Reinsured | |||||
| PIK | Payment-In-Kind | ||||
| PSF | Permanent School Fund | ||||
| REIT | Real Estate Investment Trust | ||||
| SF | Single Family | ||||
| UHSD | Unified/Union High School District | ||||
| USD | Unified/Union School District | ||||
franklintempleton.com Annual Report | 151
FRANKLIN INVESTORS SECURITIES TRUST
Report of Independent Registered Public Accounting Firm
To the Board of Trustees and Shareholders of Franklin Investors Securities Trust
In our opinion, the accompanying statements of assets and liabilities, including the statements of investments, and the related statements of operations and of changes in net assets and the financial highlights present fairly, in all material respects, the financial position of Franklin Adjustable U.S. Government Securities Fund, Franklin Floating Rate Daily Access Fund, Franklin Low Duration Total Return Fund, and Franklin Total Return Fund (separate portfolios constituting Franklin Investors Securities Trust, hereafter referred to as the “Funds”) at October 31, 2014, the results of each of their operations for the year then ended, the changes in each of their net assets for each of the two years in the period then ended and the financial highlights for each of the periods presented, in conformity with accounting principles generally accepted in the United States of America. These financial statements and financial highlights (hereafter referred to as “financial statements”) are the responsibility of the Funds’ management. Our responsibility is to express an opinion on these financial statements based on our audits. We conducted our audits of these financial statements in accordance with the standards of the Public Company Accounting Oversight Board (United States). Those standards require that we plan and perform the audit to obtain reasonable assurance about whether the financial statements are free of material misstatement. An audit includes examining, on a test basis, evidence supporting the amounts and disclosures in the financial statements, assessing the accounting principles used and significant estimates made by management, and evaluating the overall financial statements presentation. We believe that our audits, which included confirmation of securities at October 31, 2014 by correspondence with the custodian, transfer agent and brokers, provide a reasonable basis for our opinion.
PricewaterhouseCoopers LLP
San Francisco, California
December 19, 2014
152 | Annual Report
franklintempleton.com
FRANKLIN INVESTORS SECURITIES TRUST
Tax Information (unaudited)
Under Section 871(k)(1)(C) of the Internal Revenue Code (Code), the Funds hereby report the maximum amount allowable but no less than the following amounts as interest related dividends for purposes of the tax imposed under Section 871(a)(1)(A) of the Code for the fiscal year ended October 31, 2014:
| Franklin Adjustable | Franklin | Franklin | |||||
| U.S. Government | Floating Rate | Low Duration | Franklin Total | ||||
| Securities Fund | Daily Access Fund | Total Return Fund | Return Fund | ||||
| $ | 22,346,130 | $ | 173,544,860 | $ | 34,625,033 | $ | 102,397,865 |
franklintempleton.com Annual Report | 153
FRANKLIN INVESTORS SECURITIES TRUST
Board Members and Officers
The name, year of birth and address of the officers and board members, as well as their affiliations, positions held with the Trust, principal occupations during at least the past five years and number of portfolios overseen in the Franklin Templeton Investments fund complex are shown below. Generally, each board member serves until that person’s successor is elected and qualified.
| Independent Board Members | ||||
| Number of Portfolios in | ||||
| Name, Year of Birth | Length of | Fund Complex Overseen | Other Directorships Held | |
| and Address | Position | Time Served | by Board Member* | During at Least the Past 5 Years |
| Harris J. Ashton (1932) | Trustee | Since 1986 | 137 | Bar-S Foods (meat packing company) |
| One Franklin Parkway | (1981-2010). | |||
| San Mateo, CA 94403-1906 | ||||
| Principal Occupation During at Least the Past 5 Years: | ||||
| Director of various companies; and formerly, Director, RBC Holdings, Inc. (bank holding company) (until 2002); and President, Chief Executive | ||||
| Officer and Chairman of the Board, General Host Corporation (nursery and craft centers) (until 1998). | ||||
| Mary C. Choksi (1950) | Trustee | Since | 111 | Avis Budget Group Inc. (car rental), |
| One Franklin Parkway | October 2014 | Omnicom Group Inc. (advertising and | ||
| San Mateo, CA 94403-1906 | marketing communications services) | |||
| and H.J. Heinz Company (processed | ||||
| foods and allied products) (1998-2006). | ||||
| Principal Occupation During at Least the Past 5 Years: | ||||
| Founding Partner and Senior Managing Director, Strategic Investment Group (investment management group) (1987-present); director of | ||||
| various companies; and formerly, Founding Partner and Managing Director, Emerging Markets Management LLC (investment management | ||||
| firm) (1987-2011); Loan Officer/Senior Loan Officer/Senior Pension Investment Officer, World Bank Group (international financial institution) | ||||
| (1977-1987). | ||||
| Sam Ginn (1937) | Trustee | Since 2007 | 111 | ICO Global Communications |
| One Franklin Parkway | (Holdings) Limited (satellite company) | |||
| San Mateo, CA 94403-1906 | (2006-2010), Chevron Corporation | |||
| (global energy company) (1989-2009), | ||||
| Hewlett-Packard Company (technology | ||||
| company) (1996-2002), Safeway, Inc. | ||||
| (grocery retailer) (1991-1998) and | ||||
| TransAmerica Corporation (insurance | ||||
| company) (1989-1999). | ||||
| Principal Occupation During at Least the Past 5 Years: | ||||
| Private investor; and formerly, Chairman, First Responder Network Authority (FirstNet) (interoperable wireless broadband network) | ||||
| (2012-2014); Chairman of the Board, Vodafone AirTouch, PLC (wireless company) (1999-2000); Chairman of the Board and Chief | ||||
| Executive Officer, AirTouch Communications (cellular communications) (1993-1998) and Pacific Telesis Group (telephone holding | ||||
| company) (1988-1994). | ||||
| Edith E. Holiday (1952) | Trustee | Since 1998 | 137 | Hess Corporation (exploration and |
| One Franklin Parkway | refining of oil and gas), H.J. Heinz | |||
| San Mateo, CA 94403-1906 | Company (processed foods and | |||
| allied products) (1994-2013), RTI | ||||
| International Metals, Inc. (manufacture | ||||
| and distribution of titanium), Canadian | ||||
| National Railway (railroad) and White | ||||
| Mountains Insurance Group, Ltd. | ||||
| (holding company). | ||||
| Principal Occupation During at Least the Past 5 Years: | ||||
| Director or Trustee of various companies and trusts; and formerly, Assistant to the President of the United States and Secretary of the | ||||
| Cabinet (1990-1993); General Counsel to the United States Treasury Department (1989-1990); and Counselor to the Secretary and Assistant | ||||
| Secretary for Public Affairs and Public Liaison – United States Treasury Department (1988-1989). | ||||
| 154 | Annual Report | franklintempleton.com | |||
FRANKLIN INVESTORS SECURITIES TRUST
| Independent Board Members (continued) | ||||
| Number of Portfolios in | ||||
| Name, Year of Birth | Length of | Fund Complex Overseen | Other Directorships Held | |
| and Address | Position | Time Served | by Board Member* | During at Least the Past 5 Years |
| J. Michael Luttig (1954) | Trustee | Since 2009 | 137 | Boeing Capital Corporation |
| One Franklin Parkway | (aircraft financing) (2006-2013). | |||
| San Mateo, CA 94403-1906 | ||||
| Principal Occupation During at Least the Past 5 Years: | ||||
| Executive Vice President, General Counsel and member of the Executive Council, The Boeing Company (aerospace company); and formerly, | ||||
| Federal Appeals Court Judge, U.S. Court of Appeals for the Fourth Circuit (1991-2006). | ||||
| Frank A. Olson (1932) | Trustee | Since 2005 | 137 | Hess Corporation (exploration and |
| One Franklin Parkway | refining of oil and gas) (1998-2013). | |||
| San Mateo, CA 94403-1906 | ||||
| Principal Occupation During at Least the Past 5 Years: | ||||
| Director of various companies; and formerly, Chairman of the Board, The Hertz Corporation (car rental) (1980-2000) and Chief Executive | ||||
| Officer (1977-1999)); and Chairman of the Board, President and Chief Executive Officer, UAL Corporation (airlines) (June-December 1987). | ||||
| Larry D. Thompson (1945) | Trustee | Since 2007 | 137 | Cbeyond, Inc. (business communi- |
| One Franklin Parkway | cations provider) (2010-2012), | |||
| San Mateo, CA 94403-1906 | The Southern Company (energy | |||
| company) (December 2014; previously | ||||
| 2010-2012) and Graham Holdings | ||||
| Company (education and media | ||||
| organization) (2011-present). | ||||
| Principal Occupation During at Least the Past 5 Years: | ||||
| Executive Vice President – Government Affairs, General Counsel and Corporate Secretary, PepsiCo, Inc. (consumer products) (2012-present); | ||||
| and formerly, John A. Sibley Professor of Corporate and Business Law, University of Georgia School of Law (2011-2012); Senior Vice | ||||
| President – Government Affairs, General Counsel and Secretary, PepsiCo, Inc. (2004-2011); Senior Fellow of The Brookings Institution | ||||
| (2003-2004); Visiting Professor, University of Georgia School of Law (2004); and Deputy Attorney General, U.S. Department of Justice | ||||
| (2001-2003). | ||||
| John B. Wilson (1959) | Lead | Trustee since | 111 | None |
| One Franklin Parkway | Independent | 2007 and Lead | ||
| San Mateo, CA 94403-1906 | Trustee | Independent | ||
| Trustee since 2008 | ||||
| Principal Occupation During at Least the Past 5 Years: | ||||
| President, Staples Europe (office supplies) (2012-present); President and Founder, Hyannis Port Capital, Inc. (real estate and private equity | ||||
| investing); serves on private and non-profit boards; and formerly, Chief Operating Officer and Executive Vice President, Gap, Inc. (retail) | ||||
| (1996-2000); Chief Financial Officer and Executive Vice President – Finance and Strategy, Staples, Inc. (1992-1996); Senior Vice President – | ||||
| Corporate Planning, Northwest Airlines, Inc. (airlines) (1990-1992); and Vice President and Partner, Bain & Company (consulting firm) | ||||
| (1986-1990). | ||||
franklintempleton.com Annual Report | 155
| FRANKLIN INVESTORS SECURITIES TRUST | ||||
| Interested Board Members and Officers | ||||
| Number of Portfolios in | ||||
| Name, Year of Birth | Length of | Fund Complex Overseen | Other Directorships Held | |
| and Address | Position | Time Served | by Board Member* | During at Least the Past 5 Years |
| **Gregory E. Johnson (1961) | Trustee | Since 2013 | 147 | None |
| One Franklin Parkway | ||||
| San Mateo, CA 94403-1906 | ||||
| Principal Occupation During at Least the Past 5 Years: | ||||
| Chairman of the Board, Member – Office of the Chairman, Director, President and Chief Executive Officer, Franklin Resources, Inc.; officer | ||||
| and/or director or trustee, as the case may be, of some of the other subsidiaries of Franklin Resources, Inc. and of 44 of the investment | ||||
| companies in Franklin Templeton Investments; and Vice Chairman, Investment Company Institute. | ||||
| **Rupert H. Johnson, Jr. (1940) Chairman of | Chairman of the | 137 | None | |
| One Franklin Parkway | the Board, | Board since | ||
| San Mateo, CA 94403-1906 | Trustee and | 2013, Trustee | ||
| Vice President | since 1987 and | |||
| Vice President | ||||
| since 1986 | ||||
| Principal Occupation During at Least the Past 5 Years: | ||||
| Vice Chairman, Member – Office of the Chairman and Director, Franklin Resources, Inc.; Director, Franklin Advisers, Inc.; Senior Vice | ||||
| President, Franklin Advisory Services, LLC; and officer and/or director or trustee, as the case may be, of some of the other subsidiaries of | ||||
| Franklin Resources, Inc. and of 41 of the investment companies in Franklin Templeton Investments. | ||||
| Alison E. Baur (1964) | Vice President | Since 2012 | Not Applicable | Not Applicable |
| One Franklin Parkway | ||||
| San Mateo, CA 94403-1906 | ||||
| Principal Occupation During at Least the Past 5 Years: | ||||
| Deputy General Counsel, Franklin Templeton Investments; and officer of some of the other subsidiaries of Franklin Resources, Inc. and of | ||||
| 46 of the investment companies in Franklin Templeton Investments. | ||||
| Mark Boyadjian (1964) | Vice President | Since 2003 | Not Applicable | Not Applicable |
| One Franklin Parkway | ||||
| San Mateo, CA 94403-1906 | ||||
| Principal Occupation During at Least the Past 5 Years: | ||||
| Senior Vice President, Franklin Advisers, Inc.; and officer of two of the investment companies in Franklin Templeton Investments. | ||||
| Laura F. Fergerson (1962) | Chief | Since 2009 | Not Applicable | Not Applicable |
| One Franklin Parkway | Executive | |||
| San Mateo, CA 94403-1906 | Officer – | |||
| Finance and | ||||
| Administration | ||||
| Principal Occupation During at Least the Past 5 Years: | ||||
| Senior Vice President, Franklin Templeton Services, LLC; and officer of 46 of the investment companies in Franklin Templeton Investments. | ||||
| Gaston Gardey (1967) | Treasurer, | Since 2009 | Not Applicable | Not Applicable |
| One Franklin Parkway | Chief Financial | |||
| San Mateo, CA 94403-1906 | Officer and | |||
| Chief | ||||
| Accounting | ||||
| Officer | ||||
| Principal Occupation During at Least the Past 5 Years: | ||||
| Director, Fund Accounting, Franklin Templeton Investments; and officer of 27 of the investment companies in Franklin Templeton Investments. | ||||
156 | Annual Report franklintempleton.com
FRANKLIN INVESTORS SECURITIES TRUST
| Interested Board Members and Officers (continued) | ||||
| Number of Portfolios in | ||||
| Name, Year of Birth | Length of | Fund Complex Overseen | Other Directorships Held | |
| and Address | Position | Time Served | by Board Member* | During at Least the Past 5 Years |
| Aliya S. Gordon (1973) | Vice President | Since 2009 | Not Applicable | Not Applicable |
| One Franklin Parkway | ||||
| San Mateo, CA 94403-1906 | ||||
| Principal Occupation During at Least the Past 5 Years: | ||||
| Senior Associate General Counsel, Franklin Templeton Investments; officer of 46 of the investment companies in Franklin Templeton | ||||
| Investments; and formerly, Litigation Associate, Steefel, Levitt & Weiss, LLP (2000-2004). | ||||
| Steven J. Gray (1955) | Vice President | Since 2009 | Not Applicable | Not Applicable |
| One Franklin Parkway | ||||
| San Mateo, CA 94403-1906 | ||||
| Principal Occupation During at Least the Past 5 Years: | ||||
| Senior Associate General Counsel, Franklin Templeton Investments; Vice President, Franklin Templeton Distributors, Inc. and Franklin | ||||
| Alternative Strategies Advisers, LLC; and officer of 46 of the investment companies in Franklin Templeton Investments. | ||||
| Selena L. Holmes (1965) | Vice President | Since 2012 | Not Applicable | Not Applicable |
| 100 Fountain Parkway | – AML | |||
| St. Petersburg, FL 33716-1205 | Compliance | |||
| Principal Occupation During at Least the Past 5 Years: | ||||
| Director, Global Compliance Monitoring; Chief Compliance Officer, Franklin Alternative Strategies Advisers, LLC; Vice President, Franklin | ||||
| Templeton Companies, LLC; and officer of 46 of the investment companies in Franklin Templeton Investments. | ||||
| Richard Hsu (1973) | Vice President | Since 2010 | Not Applicable | Not Applicable |
| One Franklin Parkway | ||||
| San Mateo, CA 94403-1906 | ||||
| Principal Occupation During at Least the Past 5 Years: | ||||
| Vice President, Franklin Advisers, Inc.; and officer of three of the investment companies in Franklin Templeton Investments. | ||||
| Edward B. Jamieson (1948) | President and | President since | Not Applicable | Not Applicable |
| One Franklin Parkway | Chief Executive 1993 and Chief | |||
| San Mateo, CA 94403-1906 | Officer – | Executive Officer | ||
| Investment | – Investment | |||
| Management | Management since | |||
| 2002 | ||||
| Principal Occupation During at Least the Past 5 Years: | ||||
| President, Chief Investment Officer and Director, Franklin Advisers, Inc.; Executive Vice President, Franklin Templeton Institutional, LLC; and | ||||
| officer and/or trustee, as the case may be, of some of the other subsidiaries of Franklin Resources, Inc. and of 10 of the investment | ||||
| companies in Franklin Templeton Investments. | ||||
| Madeline Lam (1969) | Vice President | Since 2010 | Not Applicable | Not Applicable |
| One Franklin Parkway | ||||
| San Mateo, CA 94403-1906 | ||||
| Principal Occupation During at Least the Past 5 Years: | ||||
| Vice President, Franklin Advisers, Inc.; and officer of two of the investment companies in Franklin Templeton Investments. | ||||
| Kimberly H. Novotny (1972) | Vice President | Since 2013 | Not Applicable | Not Applicable |
| 300 S.E. 2nd Street | ||||
| Fort Lauderdale, FL 33301-1923 | ||||
| Principal Occupation During at Least the Past 5 Years: | ||||
| Associate General Counsel, Franklin Templeton Investments; Vice President and Secretary, Fiduciary Trust International of the South; Vice | ||||
| President, Templeton Investment Counsel, LLC; Assistant Secretary, Franklin Resources, Inc.; and officer of 46 of the investment companies | ||||
| in Franklin Templeton Investments. | ||||
franklintempleton.com Annual Report | 157
FRANKLIN INVESTORS SECURITIES TRUST
| Interested Board Members and Officers (continued) | ||||
| Number of Portfolios in | ||||
| Name, Year of Birth | Length of | Fund Complex Overseen | Other Directorships Held | |
| and Address | Position | Time Served | by Board Member* | During at Least the Past 5 Years |
| Robert C. Rosselot (1960) | Chief | Since 2013 | Not Applicable | Not Applicable |
| 300 S.E. 2nd Street | Compliance | |||
| Fort Lauderdale, FL 33301-1923 | Officer | |||
| Principal Occupation During at Least the Past 5 Years: | ||||
| Director, Global Compliance, Franklin Templeton Investments; Vice President, Franklin Templeton Companies, LLC; officer of 46 of the | ||||
| investment companies in Franklin Templeton Investments; and formerly, Senior Associate General Counsel, Franklin Templeton Investments | ||||
| (2007-2013); and Secretary and Vice President, Templeton Group of Funds (2004-2013). | ||||
| Karen L. Skidmore (1952) | Vice President | Since 2006 | Not Applicable | Not Applicable |
| One Franklin Parkway | and Secretary | |||
| San Mateo, CA 94403-1906 | ||||
| Principal Occupation During at Least the Past 5 Years: | ||||
| Senior Associate General Counsel, Franklin Templeton Investments; and officer of 46 of the investment companies in Franklin Templeton | ||||
| Investments. | ||||
| Craig S. Tyle (1960) | Vice President | Since 2005 | Not Applicable | Not Applicable |
| One Franklin Parkway | ||||
| San Mateo, CA 94403-1906 | ||||
| Principal Occupation During at Least the Past 5 Years: | ||||
| General Counsel and Executive Vice President, Franklin Resources, Inc.; and officer of some of the other subsidiaries of Franklin Resources, | ||||
| Inc. and of 46 of the investment companies in Franklin Templeton Investments. | ||||
| Lori A. Weber (1964) | Vice President | Since 2011 | Not Applicable | Not Applicable |
| 300 S.E. 2nd Street | ||||
| Fort Lauderdale, FL 33301-1923 | ||||
| Principal Occupation During at Least the Past 5 Years: | ||||
| Senior Associate General Counsel, Franklin Templeton Investments; Assistant Secretary, Franklin Resources, Inc.; Vice President and | ||||
| Secretary, Templeton Investment Counsel, LLC; Vice President, Fiduciary Trust International of the South; and officer of 46 of the investment | ||||
| companies in Franklin Templeton Investments. | ||||
*We base the number of portfolios on each separate series of the U.S. registered investment companies within the Franklin Templeton Investments fund complex. These
portfolios have a common investment manager or affiliated investment managers.
**Gregory E. Johnson is considered to be an interested person of the Fund under the federal securities laws due to his position as an officer and director of Franklin
Resources, Inc. (Resources), which is the parent company of the Fund’s investment manager and distributor. Rupert H. Johnson, Jr. is considered to be an interested
person of the Fund under the federal securities laws due to his position as officer and director and major shareholder of Resources.
Note 1: Rupert H. Johnson, Jr. is the uncle of Gregory E. Johnson.
Note 2: Officer information is current as of the date of this report. It is possible that after this date, information about officers may change.
The Sarbanes-Oxley Act of 2002 and Rules adopted by the Securities and Exchange Commission require the Fund to disclose whether the Fund’s Audit Committee
includes at least one member who is an audit committee financial expert within the meaning of such Act and Rules. The Fund’s Board has determined that there
is at least one such financial expert on the Audit Committee and has designated John B. Wilson as its audit committee financial expert. The Board believes that
Mr. Wilson qualifies as such an expert in view of his extensive business background and experience, including service as chief financial officer of Staples, Inc.
from 1992 to 1996. Mr. Wilson has been a Member and Chairman of the Fund’s Audit Committee since 2007. As a result of such background and experience, the
Board believes that Mr. Wilson has acquired an understanding of generally accepted accounting principles and financial statements, the general application of
such principles in connection with the accounting estimates, accruals and reserves, and analyzing and evaluating financial statements that present a breadth
and level of complexity of accounting issues generally comparable to those of the Fund, as well as an understanding of internal controls and procedures for
financial reporting and an understanding of audit committee functions. Mr. Wilson is an independent Board member as that term is defined under the relevant
Securities and Exchange Commission Rules and Releases.
The Statement of Additional Information (SAI) includes additional information about the board members and is available, without charge, upon request.
Shareholders may call (800) DIAL BEN/342-5236 to request the SAI.
158 | Annual Report franklintempleton.com
FRANKLIN INVESTORS SECURITIES TRUST
Shareholder Information
Proxy Voting Policies and Procedures
The Trust’s investment manager has established Proxy Voting Policies and Procedures (Policies) that the Trust uses to determine how to vote proxies relating to portfolio securities. Shareholders may view the Trust’s complete Policies online at franklintempleton.com. Alternatively, shareholders may request copies of the Policies free of charge by calling the Proxy Group collect at (954) 527-7678 or by sending a written request to: Franklin Templeton Companies, LLC, 300 S.E. 2nd Street, Fort Lauderdale, FL 33301, Attention: Proxy Group. Copies of the Trust’s proxy voting records are also made available online at franklintempleton.com and posted on the U.S. Securities and Exchange Commission’s website at sec.gov and reflect the most recent 12-month period ended June 30.
Quarterly Statement of Investments
The Trust files a complete statement of investments with the U.S. Securities and Exchange Commission for the first and third quarters for each fiscal year on Form N-Q. Shareholders may view the filed Form N-Q by visiting the Commission’s website at sec.gov. The filed form may also be viewed and copied at the Commission’s Public Reference Room in Washington, DC. Information regarding the operations of the Public Reference Room may be obtained by calling (800) SEC-0330.
Householding of Reports and Prospectuses
You will receive each Fund’s financial reports every six months as well as an annual updated summary prospectus (prospectus available upon request). To reduce Fund expenses, we try to identify related shareholders in a household and send only one copy of the financial reports and summary prospectus. This process, called “householding,” will continue indefinitely unless you instruct us otherwise. If you prefer not to have these documents householded, please call us at (800) 632-2301. At any time you may view current prospectuses/summary prospectuses and financial reports on our website. If you choose, you may receive these documents through electronic delivery.
franklintempleton.com Annual Report | 159
This page intentionally left blank.
Item 2. Code of Ethics.
(a) The Registrant has adopted a code of ethics that applies to its principal executive officers and principal financial and accounting officer.
(c) N/A
(d) N/A
(f) Pursuant to Item 12(a)(1), the Registrant is attaching as an exhibit a copy of its code of ethics that applies to its principal executive officers and principal financial and accounting officer.
Item 3. Audit Committee Financial Expert.
(a)(1) The Registrant has an audit committee financial expert serving on its audit committee.
(2) The audit committee financial expert is John B. Wilson and he is "independent" as defined under the relevant Securities and Exchange Commission Rules and Releases.
Item 4. Principal Accountant Fees and Services.
(a) Audit Fees
The aggregate fees paid to the principal accountant for professional services rendered by the principal accountant for the audit of the registrant’s annual financial statements or for services that are normally provided by the principal accountant in connection with statutory and regulatory filings or engagements were $414,918 for the fiscal year ended October 31, 2014 and $448,751 for the fiscal year ended October 31, 2013.
(b) Audit-Related Fees
There were no fees paid to the principal accountant for assurance and related services rendered by the principal accountant to the registrant that are reasonably related to the performance of the audit of the registrant's financial statements and are not reported under paragraph (a) of Item 4.
There were no fees paid to the principal accountant for assurance and related services rendered by the principal accountant to the registrant's investment adviser and any entity controlling, controlled by or under common control with the investment adviser that provides ongoing services to the registrant that are reasonably related to the performance of the audit of their financial statements.
(c) Tax Fees
There were no fees paid to the principal accountant for professional services rendered by the principal accountant to the registrant for tax compliance, tax advice and tax planning.
The aggregate fees paid to the principal accountant for professional services rendered by the principal accountant to the registrant’s investment adviser and any entity controlling, controlled by or under common control with the investment adviser that provides ongoing services to the registrant for tax compliance, tax advice and tax planning were $0 for the fiscal year ended October 31, 2014 and $6,930 for the fiscal year ended October 31, 2013. The services for which these fees were paid included technical tax consultation for capital gain tax and withholding tax reporting for foreign governments and requirements on local country’s self-certification forms.
(d) All Other Fees
The aggregate fees paid to the principal accountant for products and services rendered by the principal accountant to the registrant not reported in paragraphs (a)-(c) of Item 4 were $6,276 for the fiscal year ended October 31, 2014 and $0 for the fiscal year ended October 31, 2013. The services for which these fees were paid include review of materials provided to the fund Board in connection with the investment management contract renewal process.
The aggregate fees paid to the principal accountant for products and services rendered by the principal accountant to the registrant’s investment adviser and any entity controlling, controlled by or under common control with the investment adviser that provides ongoing services to the registrant not reported in paragraphs (a)-(c) of Item 4 were $189,039 for the fiscal year ended October 31, 2014 and $49,359 for the fiscal year ended October 31, 2013. The services for which these fees were paid include preparation and review of materials provided to the fund Board in connection with the investment management contract renewal process and certifying assets under management. Other services include compliance examination for Investment Advisor Act rule 204-2 and 206-4(2).
(e) (1) The registrant’s audit committee is directly responsible for approving the services to be provided by the auditors, including:
(i) pre-approval of all audit and audit related services;
(ii) pre-approval of all non-audit related services to be provided to the Fund by the auditors;
(iii) pre-approval of all non-audit related services to be provided to the registrant by the auditors to the registrant’s investment adviser or to any entity that controls, is controlled by or is under common control with the registrant’s investment adviser and that provides ongoing services to the registrant where the non-audit services relate directly to the operations or financial reporting of the registrant; and
(iv) establishment by the audit committee, if deemed necessary or appropriate, as an alternative to committee pre-approval of services to be provided by the auditors, as required by paragraphs (ii) and (iii) above, of policies and procedures to permit such services to be pre-approved by other means, such as through establishment of guidelines or by action of a designated member or members of the committee; provided the policies and procedures are detailed as to the particular service and the committee is informed of each service and such policies and procedures do not include delegation of audit committee responsibilities, as contemplated under the Securities Exchange Act of 1934, to management; subject, in the case of (ii) through (iv), to any waivers, exceptions or exemptions that may be available under applicable law or rules.
(e) (2) None of the services provided to the registrant described in paragraphs (b)-(d) of Item 4 were approved by the audit committee pursuant to paragraph (c)(7)(i)(C) of Rule 2-01 of regulation S-X.
(f) No disclosures are required by this Item 4(f).
(g) The aggregate non-audit fees paid to the principal accountant for services rendered by the principal accountant to the registrant and the registrant’s investment adviser and any entity controlling, controlled by or under common control with the investment adviser that provides ongoing services to the registrant were $195,315 for the fiscal year ended October 31, 2014 and $56,289 for the fiscal year ended October 31, 2013.
(h) The registrant’s audit committee of the board has considered whether the provision of non-audit services that were rendered to the registrant’s investment adviser (not including any sub-adviser whose role is primarily portfolio management and is subcontracted with or overseen by another investment adviser), and any entity controlling, controlled by, or under common control with the investment adviser that provides ongoing services to the registrant that were not pre-approved pursuant to paragraph (c)(7)(ii) of Rule 2-01 of Regulation S-X is compatible with maintaining the principal accountant’s independence.
Item 5. Audit Committee of Listed Registrants. N/A
Item 6. Schedule of Investments. N/A
Item 7. Disclosure of Proxy Voting Policies and Procedures for Closed-End Management Investment Companies. N/A
Item 8. Portfolio Managers of Closed-End Management Investment Companies. N/A
Item 9. Purchases of Equity Securities by Closed-End Management Investment Company and Affiliated Purchasers. N/A
Item 10. Submission of Matters to a Vote of Security Holders.
There have been no changes to the procedures by which shareholders may recommend nominees to the Registrant's Board of Trustees that would require disclosure herein.
Item 11. Controls and Procedures.
(a) Evaluation of Disclosure Controls and Procedures. The Registrant maintains disclosure controls and procedures that are designed to ensure that information required to be disclosed in the Registrant’s filings under the Securities Exchange Act of 1934 and the Investment Company Act of 1940 is recorded, processed, summarized and reported within the periods specified in the rules and forms of the Securities and Exchange Commission. Such information is accumulated and communicated to the Registrant’s management, including its principal executive officer and principal financial officer, as appropriate, to allow timely decisions regarding required disclosure. The Registrant’s management, including the principal executive officer and the principal financial officer, recognizes that any set of controls and procedures, no matter how well designed and operated, can provide only reasonable assurance of achieving the desired control objectives.
Within 90 days prior to the filing date of this Shareholder Report on Form N-CSR, the Registrant had carried out an evaluation, under the supervision and with the participation of the Registrant’s management, including the Registrant’s principal executive officer and the Registrant’s principal financial officer, of the effectiveness of the design and operation of the Registrant’s disclosure controls and procedures. Based on such evaluation, the Registrant’s principal executive officer and principal financial officer concluded that the Registrant’s disclosure controls and procedures are effective.
(b) Changes in Internal Controls. There have been no changes in the Registrant’s internal controls or in other factors that could materially affect the internal controls over financial reporting subsequent to the date of their evaluation in connection with the preparation of this Shareholder Report on Form N-CSR.
Item 12. Exhibits.
(a) (1) Code of Ethics
(a) (2) Certifications pursuant to Section 302 of the Sarbanes-Oxley Act of 2002 of Laura F. Fergerson, Chief Executive Officer - Finance and Administration, and Gaston Gardey, Chief Financial Officer and Chief Accounting Officer
(b) Certifications pursuant to Section 906 of the Sarbanes-Oxley Act of 2002 of Laura F. Fergerson, Chief Executive Officer - Finance and Administration, and Gaston Gardey, Chief Financial Officer and Chief Accounting Officer
SIGNATURES
Pursuant to the requirements of the Securities Exchange Act of 1934 and the Investment Company Act of 1940, the registrant has duly caused this report to be signed on its behalf by the undersigned, thereunto duly authorized.
FRANKLIN INVESTORS SECURITIES TRUST
By /s/Laura F. Fergerson
Laura F. Fergerson
Chief Executive Officer - Finance and Administration
Date December 26, 2014
Pursuant to the requirements of the Securities Exchange Act of 1934 and the Investment Company Act of 1940, this report has been signed below by the following persons on behalf of the registrant and in the capacities and on the dates indicated.
By /s/Laura F. Fergerson
Laura F. Fergerson
Chief Executive Officer - Finance and Administration
Date December 26, 2014
By /s/Gaston Gardey
Gaston Gardey
Chief Financial Officer and Chief Accounting Officer
Date December 26, 2014