UNITED STATES
SECURITIES AND EXCHANGE COMMISSION
Washington, DC 20549
FORM N-CSR
CERTIFIED SHAREHOLDER REPORT OF REGISTERED MANAGEMENT INVESTMENT COMPANIES
Investment Company Act file numbe 811-04986
Franklin Investors Securities Trust
(Exact name of registrant as specified in charter)
One Franklin Parkway, San Mateo, CA 94403-1906
(Address of principal executive offices) (Zip code)
Craig S. Tyle, One Franklin Parkway, San Mateo, CA 94403-1906
(Name and address of agent for service)
Registrant's telephone number, including area code: 650 312-2000
Date of fiscal year end: 10/31
Date of reporting period: 10/31/16
Item 1. Reports to Stockholders.

| |
| Contents | |
| |
| Annual Report | |
| Economic and Market Overview | 3 |
| Franklin Balanced Fund | 4 |
| Franklin Convertible Securities Fund | 12 |
| Franklin Equity Income Fund | 19 |
| Franklin Real Return Fund | 27 |
| Financial Highlights and Statements of Investments | 33 |
| Financial Statements | 71 |
| Notes to Financial Statements | 76 |
| Report of Independent Registered | |
| Public Accounting Firm | 94 |
| Tax Information | 95 |
| Board Members and Officers | 96 |
| Shareholder Information | 101 |
Visit franklintempleton.com for fund updates, to access your account, or to find helpful financial planning tools.
2 Annual Report
franklintempleton.com
Annual Report
Economic and Market Overview
The U.S. economy expanded during the 12 months under review. The economy grew at a faster pace in 2016’s third quarter than in 2016’s second and first quarters and 2015’s fourth quarter, mainly due to personal consumption expenditures, exports, private inventory investment, federal government spending and nonresidential fixed investment. Manufacturing conditions generally contracted during the first half of the period but generally expanded in the second half. The services sector, although volatile, continued to grow throughout the period. The unemployment rate decreased slightly from 5.0% in October 2015 to 4.9% at period-end.1 Monthly retail sales grew for most of the review period, and rose to the highest level in April in more than a year, due to a broad-based increase across most retail categories. Inflation, as measured by the Consumer Price Index (CPI), rose slightly in October, led by an increase in gasoline and shelter prices.
After maintaining a near-zero interest rate for seven years to support the U.S. economy’s recovery, the U.S. Federal Reserve (Fed) raised its target range for the federal funds rate to 0.25%–0.50% at its December 2015 meeting and maintained the rate through period-end. The Fed noted at its September meeting that although the case for raising interest rates has strengthened, it will wait for further evidence of continued progress toward its objectives.
U.S. equity markets rose during the review period, benefiting from mostly upbeat economic data and better corporate earnings in the U.S., signs of improvement in the Chinese and European economies, and ongoing expansionary monetary policies from key central banks. A rally in crude oil prices and the Fed’s decision to keep interest rates unchanged at its September meeting further boosted investor confidence. However, the U.K.’s historic vote to leave the European Union (also known as "Brexit") and global growth concerns weighed on market sentiment. The broad U.S. stock market ended the 12-month period higher, as measured by the Standard & Poor’s® 500 Index.
The foregoing information reflects our analysis and opinions as of October 31, 2016. The information is not a complete analysis of every aspect of any market, country, industry, security or fund. Statements of fact are from sources considered reliable.
1. Source: Bureau of Labor Statistics.
franklintempleton.com
Annual Report
3
Franklin Balanced Fund
We are pleased to bring you Franklin Balanced Fund’s annual report for the fiscal year ended October 31, 2016.
Your Fund’s Goal and Main Investments
The Fund seeks both income and capital appreciation by investing in a combination of stocks, convertible securities and debt securities. The Fund normally invests at least 25% of its total assets in equity securities (primarily common and preferred stock) and at least 25% of its total assets in debt securities, including bonds, notes, debentures and money market securities.
| | |
| Portfolio Composition* | | |
| 10/31/16 | | |
| | % of Total | |
| | Net Assets | |
| Stocks | 63.2 | % |
| Common Stocks | 49.3 | % |
| Equity-Linked Securities | 8.7 | % |
| Convertible Preferred Stocks | 4.4 | % |
| Preferred Stocks | 0.4 | % |
| Options Purchased | 0.4 | % |
| Bonds | 32.7 | % |
| Corporate Bonds | 32.2 | % |
| Convertible Bonds | 0.5 | % |
| Short-Term Investments & Other Net Assets | 4.1 | % |
*Percentages reflect certain derivatives held in the portfolio (or their underlying
reference assets) and may not total 100% or may be negative due to rounding, use
of derivatives, unsettled trades or other factors. The composition may not match the
SOI.
Performance Overview
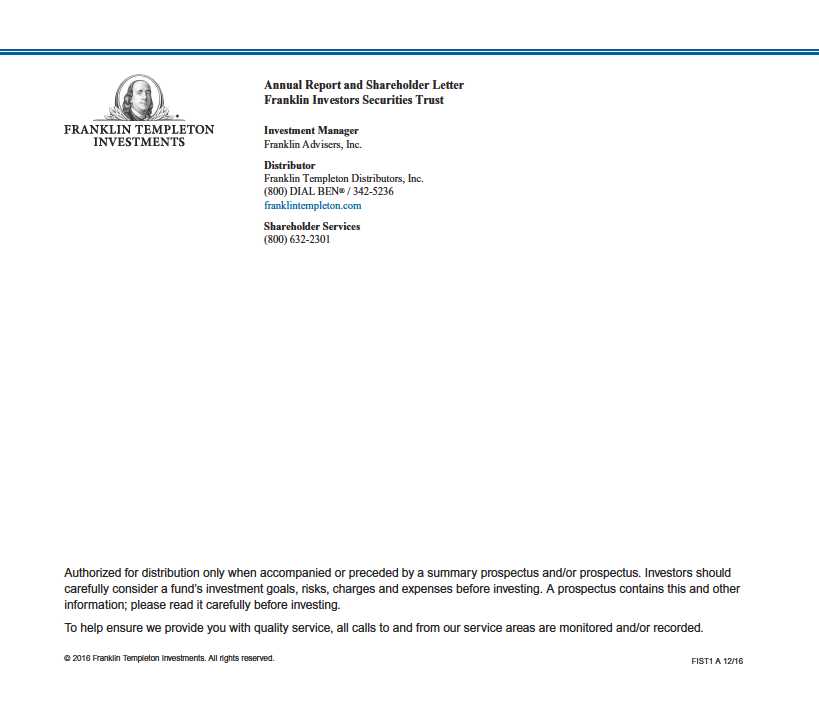
For the 12 months under review, the Fund’s Class A shares delivered a cumulative total return of +5.54%. In comparison, the Fund’s equity benchmark, the Standard & Poor’s 500 Index (S&P 500®), which is a broad measure of U.S. stock performance, posted a +4.51% total return.1 The Fund’s fixed income benchmark, the Bloomberg Barclays U.S. Aggregate Bond Index, which tracks the U.S. investment-grade, taxable bond market, posted a +4.37% return.1 You can find the Fund’s long-term performance data in the Performance Summary beginning on page 8.
Performance data represent past performance, which does not guarantee future results. Investment return and principal value will fluctuate, and you may have a gain or loss when you sell your shares. Current performance may differ from figures shown. For most recent month-end performance, go to franklintempleton.com or call (800) 342-5236.
Investment Strategy
We apply a bottom-up approach to investing in individual securities. We will assess the market price of a company’s securities relative to our evaluation of the company’s long-term earnings, asset value and cash flow potential. We also consider a company’s price/earnings ratio, profit margins and liquidation value. In determining an optimal mix of equity and fixed income investments for the Fund, we assess changing economic, market and industry conditions. We may sell securities for a number of possible reasons, including the achievement of certain stock prices or credit spreads, changes in the fundamental outlook or risk/reward profile of a security, less attractive values relative to market peers, or broad economic conditions affecting certain fixed income sectors. For purposes of pursuing the Fund’s investment goal, we may enter into various equity-related transactions involving derivative instruments. We may also invest in equity-linked notes, which are hybrid derivative-type instruments specially designed to combine the characteristics of one or more reference securities (usually a single stock, a stock index or a basket of stocks) and a related equity derivative, such as a put or call option.
What is an equity-linked note?
An equity-linked note is a derivative instrument whose return is determined by the performance of a single equity security, a basket of equity securities, or an equity index. The purchase of equity-linked notes may involve investment in related equity derivatives, such as put and call options.
Manager’s Discussion
During the 12 months under review, we continued to strategically shift the Fund’s asset mix, seeking to manage risks, and our equity and fixed income holdings increased. The Fund’s equity weighting rose to 63.2% from 60.9% of total net assets, and the Fund’s fixed income weighting rose to 32.7%
1. Source: Morningstar.
The indexes are unmanaged and include reinvestment of any income or distributions. They do not reflect any fees, expenses or sales charges. One cannot invest directly in an
index, and an index is not representative of the Fund’s portfolio.
The dollar value, number of shares or principal amount, and names of all portfolio holdings are listed in the Fund’s Statement of Investments (SOI).
The SOI begins on page 38.
4 Annual Report
franklintempleton.com
FRANKLIN BALANCED FUND
What are put and call options?
A put option is a contract giving the owner the right, but not the obligation, to sell a specified amount of an underlying security at a specified price within a specified time. Put options are most commonly used to protect against the decline of a stock price below a certain price. Conversely, a call option gives the holder the right to buy shares at a specified price within a specified time, regardless of the price in the future before the expiration date. If the stock price rises, the holder of the call option has the right to buy at the agreed-upon price, which could be lower.
| | | | | |
| Dividend Distributions* | | | |
| 11/1/15–10/31/16 | | | | |
| | | Dividend per Share (cents) | |
| | | | | | Advisor |
| Month | Class A | Class C | Class R | Class R6 | Class |
| November | 3.00 | 2.29 | 2.76 | 3.29 | 3.23 |
| December | 3.45 | 2.76 | 3.21 | 3.76 | 3.67 |
| January | 3.00 | 2.31 | 2.76 | 3.31 | 3.22 |
| February | 3.00 | 2.31 | 2.76 | 3.31 | 3.22 |
| March | 3.00 | 2.35 | 2.89 | 3.33 | 3.22 |
| April | 3.00 | 2.35 | 2.89 | 3.33 | 3.22 |
| May | 3.00 | 2.35 | 2.89 | 3.33 | 3.22 |
| June | 3.00 | 2.31 | 2.70 | 3.33 | 3.23 |
| July | 3.00 | 2.31 | 2.70 | 3.33 | 3.23 |
| August | 3.00 | 2.31 | 2.70 | 3.33 | 3.23 |
| September | 3.00 | 2.27 | 2.75 | 3.34 | 3.24 |
| October | 2.91 | 2.18 | 2.66 | 3.25 | 3.15 |
| Total | 36.36 | 28.10 | 33.67 | 40.24 | 39.08 |
*The distribution amount is the sum of the dividend payments to shareholders for
the period shown and includes only estimated tax-basis net investment income. All
Fund distributions will vary depending upon current market conditions, and past
distributions are not indicative of future trends.
from 27.6%. Our cash position fell during the period to 4.1% from 11.5% of total net assets.
Consistent with the Fund’s long-term strategy, performance was supported by healthy diversification across asset classes and positive overall contributions from the Fund’s equity and fixed income positions.
In equities, the information technology (IT) and energy sectors were strong contributors to performance. During the period, the IT sector surged ahead of all other equity sectors and helped lift the broader market to its fourth consecutive quarterly gain. After barely budging through the first half of 2016, technology-related companies have moved higher since June, dominating the equity-sector leaderboard and topping the S&P 500 Index by the widest margin since the bull market began more than seven years ago. Aided by reports of rising corporate profits among technology firms—in particular those focused on
mobile and cloud platforms—IT led all other sectors in terms of upside earnings surprises. Large-capitalization companies held by the Fund enjoyed strong returns, aided by their dividend component. We believe that part of the allure for investors was valuations, as IT-related companies appeared to be attractively priced, while still offering growth potential. The Fund’s semiconductor holdings performed well, benefiting from a stabilizing business environment and improved profitability, with key contributors including Texas Instruments and Analog Devices. Microsoft, a software and IT services company, was another strong contributor that benefited over the past year from investors gaining greater confidence in their ability to be relevant in the cloud-computing era with their key productivity and server software franchises. Specifically, its productivity suite moved rapidly to Office 365, while its server franchise found new growth opportunities with the company’s Azure platform. In addition, the company executed well on various cost containment and capital return initiatives, expanded share repurchases and had a solid dividend. Within energy, Chevron and Anadarko Petroleum were among the top contributors as oil prices rebounded and the companies took steps to lower their costs, while Anadarko also endeavored to strengthen its balance sheet.
| | |
| Top Five Equity Holdings | | |
| 10/31/16 | | |
| Company | % of Total | |
| Sector/Industry | Net Assets | |
| Microsoft Corp. | 1.8 | % |
| Information Technology | | |
| Texas Instruments | 1.8 | % |
| Information Technology | | |
| JPMorgan Chase & Co. | 1.8 | % |
| Financials | | |
| General Electric Co. | 1.8 | % |
| Industrials | | |
| Wells Fargo & Co. | 1.7 | % |
| Financials | | |
The industrials and financials sectors were also strong contributors to Fund performance. Within industrials, a position in defense contractor Raytheon posted strong returns as did our position in waste management company Republic Services. Within financials, financial services firm JPMorgan Chase also benefited performance. Individual equity positions that significantly contributed to Fund performance included health care company Johnson & Johnson, a convertible preferred stock position in clean energy utility NextEra Energy and a new position in German chemicals company BASF.
In contrast, the consumer discretionary sector detracted from equity Fund performance. Within the sector, shares in
franklintempleton.com
Annual Report
5
FRANKLIN BALANCED FUND
automobile manufacturer Ford Motor declined as global auto sales plateaued, while upscale fashion retailer Nordstrom and discount general merchandise retailer Target experienced weakness as foot traffic softened amid a continued shift to online shopping. Health care was another detractor from the Fund’s performance, particularly our new position in Teva Pharmaceutical Industries, as increased competition in the generics market led to pricing pressure, and election year rhetoric about drug prices raised investor concerns about future revenues. Additionally, our convertible preferred stock position in Allergan declined as Pfizer canceled its planned acquisition of Allergan after the U.S. government issued new rules to deter tax inversion mergers.
Individual equity positions that detracted from Fund performance included fertilizer company Mosaic, an equity-linked security in plastics, chemicals and refining company LyondellBasell Industries,2 a new position in global hygiene company Kimberly-Clark, and financial services companies Wells Fargo and T. Rowe Price Group.
During the period, our fixed income positions exceeded the return of the benchmark Barclays U.S. Aggregate Bond Index.
Our fixed income holdings in the consumer non-cyclical, banking and communications sectors delivered positive performance during the period.3 In consumer non-cyclical, our new positions in natural and organic foods retailer Whole Foods Market and beverage and brewing company Anheuser-Busch InBev Finance, which completed a large bond offering in January 2016, aided performance. In banking, nearly every position aided performance, with Morgan Stanley, Bank of America and Citigroup as notable contributors. Themes across the banking industry continued to focus on costs, strong credit quality and robust capital levels. The only detractor was a Deutsche Bank position that we have exited completely. In other financials, Nippon Life Insurance also added to performance. In communications, our new position in global satellite service provider Dish Network and positions in telecommunications providers Verizon Communications and Sprint boosted results.
Our energy sector fixed income holdings also aided performance, especially our pipeline industry positions in Energy Transfer Partners, Kinder Morgan Energy Partners and Williams Partners.4 These companies benefited from cost cutting as well as strong cash flows and bounced back nicely with oil prices during the period. The only detractors were our positions in NGL Energy Partners and Linn Energy, which were sold by period-end. The consumer cyclical sector also delivered positive performance, and key contributors included fast food restaurants owner and franchiser Yum! Brands and discount retailer Dollar General.5
Individual fixed income holdings that contributed to Fund performance included positions in iron ore explorer and producer FMG Resources (Australia), data storage company Western Digital, a new position in defense contractor Lockheed Martin, industrial conglomerate General Electric and Diamond 1 and 2 Finance companies that issued notes for technology companies Dell and EMC. Individual fixed income positions that detracted from Fund performance included insurer MetLife2 and hospital manager and operator Community Health Systems.
| | |
| Top Five Fixed Income Holdings | | |
| 10/31/16 | | |
| Company | % of Total | |
| Sector/Industry | Net Assets | |
| Morgan Stanley | 1.3 | % |
| Financials | | |
| JPMorgan Chase & Co. | 1.2 | % |
| Financials | | |
| Weatherford International Ltd. | 0.9 | % |
| Energy | | |
| Bank of America Corp. | 0.8 | % |
| Financials | | |
| Citigroup Inc. | 0.8 | % |
| Financials | | |
The Fund used derivative instruments during the period, such as equity options. The goal of these instruments is to enhance Fund returns, to lower volatility, or to more efficiently enter and exit stock positions at prices the Fund deems attractive. These positions did not have a material impact on performance. We were comfortable with the Fund’s declining cash position
2. Not held at period-end.
3. Consumer non-cyclical companies are in consumer staples and health care in the fixed income section of the SOI. Banking companies are in financials in the fixed Income
section of the SOI. Communications companies are in consumer discretionary and telecommunication services in the fixed income section of the SOI.
4. Energy companies are in energy and utilities in the fixed income section of the SOI.
5. Consumer cyclical companies are in consumer discretionary, consumer staples and health care in the fixed income section of the SOI.
See www.franklintempletondatasources.com for additional data provider information.
6 Annual Report
franklintempleton.com
FRANKLIN BALANCED FUND
during the period as we were able to invest opportunistically at times when the market retreated.
Thank you for your continued participation in Franklin Balanced Fund. We look forward to serving your future investment needs.

The foregoing information reflects our analysis, opinions and portfolio holdings as of October 31, 2016, the end of the reporting period. The way we implement our main investment strategies and the resulting portfolio holdings may change depending on factors such as market and economic conditions. These opinions may not be relied upon as investment advice or an offer for a particular security. The information is not a complete analysis of every aspect of any market, country, industry, security or the Fund. Statements of fact are from sources considered reliable, but the investment manager makes no representation or warranty as to their completeness or accuracy. Although historical performance is no guarantee of future results, these insights may help you understand our investment management philosophy.
CFA® is a trademark owned by CFA Institute.
franklintempleton.com
Annual Report
7
FRANKLIN BALANCED FUND
Performance Summary as of October 31, 2016
The performance tables and graphs do not reflect any taxes that a shareholder would pay on Fund dividends, capital gain distributions, if any, or any realized gains on the sale of Fund shares. Total return reflects reinvestment of the Fund’s dividends and capital gain distributions, if any, and any unrealized gains or losses. Your dividend income will vary depending on dividends or interest paid by securities in the Fund’s portfolio, adjusted for operating expenses of each class. Capital gain distributions are net profits realized from the sale of portfolio securities.
Performance as of 10/31/161
Cumulative total return excludes sales charges. Average annual total returns include maximum sales charges. Sales charges will vary depending on the size of the investment and the class of share purchased. The maximum is 5.75% and the minimum is 0%. Class A: 5.75% maximum initial sales charge; Advisor Class: no sales charges. For other share classes, visit franklintempleton.com.
| | | | | | |
| | Cumulative | | Average Annual | | Average Annual | |
| Share Class | Total Return2 | | Total Return3 | | Total Return (9/30/16)4 | |
| A | | | | | | |
| 1-Year | +5.54 | % | -0.56 | % | +6.17 | % |
| 5-Year | +44.86 | % | +6.43 | % | +8.35 | % |
| 10-Year | +68.40 | % | +4.73 | % | +5.06 | % |
| Advisor | | | | | | |
| 1-Year | +5.79 | % | +5.79 | % | +12.92 | % |
| 5-Year | +46.85 | % | +7.99 | % | +9.97 | % |
| 10-Year | +73.45 | % | +5.66 | % | +5.99 | % |
| |
| |
| | Distribution | | 30-Day Standardized Yield6 | |
| Share Class | Rate5 | | (with waiver) (without waiver) | |
| A | 2.91 | % | 2.25 | % | 2.24 | % |
| Advisor | 3.33 | % | 2.63 | % | 2.63 | % |
Performance data represent past performance, which does not guarantee future results. Investment return and principal value will fluctuate, and you may have a gain or loss when you sell your shares. Current performance may differ from figures shown. For most recent month-end performance, go to franklintempleton.com or call (800) 342-5236.
See page 10 for Performance Summary footnotes.
8 Annual Report
franklintempleton.com
FRANKLIN BALANCED FUND
PERFORMANCE SUMMARY
Total Return Index Comparison for a Hypothetical $10,000 Investment1
Total return represents the change in value of an investment over the periods shown. It includes any applicable maximum sales charge, Fund expenses, account fees and reinvested distributions. The unmanaged indexes include reinvestment of any income or distributions. They differ from the Fund in composition and do not pay management fees or expenses. One cannot invest directly in an index.
See page 10 for Performance Summary footnotes.
franklintempleton.com
Annual Report
9
| | | | | | | | |
| FRANKLIN BALANCED FUND | | | | | | | | |
| PERFORMANCE SUMMARY | | | | | | | | |
| |
| |
| |
| Net Asset Value | | | | | | | | |
| Share Class (Symbol) | | 10/31/16 | | | 10/31/15 | | | Change |
| A (FBLAX) | $ | 11.65 | | $ | 11.40 | | +$ | 0.25 |
| C (FBMCX) | $ | 11.55 | | $ | 11.31 | | +$ | 0.24 |
| R (N/A) | $ | 11.67 | | $ | 11.42 | | +$ | 0.25 |
| R6 (FBFRX) | $ | 11.67 | | $ | 11.42 | | +$ | 0.25 |
| Advisor (FBFZX) | $ | 11.67 | | $ | 11.42 | | +$ | 0.25 |
| |
| |
| Distributions8 (11/1/15–10/31/16) | | | | | | | | |
| | | Dividend | | | Long-Term | | | |
| Share Class | | Income | | | Capital Gain | | | Total |
| A | $ | 0.3636 | | $ | 0.0009 | | $ | 0.3645 |
| C | $ | 0.2810 | | $ | 0.0009 | | $ | 0.2819 |
| R | $ | 0.3367 | | $ | 0.0009 | | $ | 0.3376 |
| R6 | $ | 0.4024 | | $ | 0.0009 | | $ | 0.4033 |
| Advisor | $ | 0.3908 | | $ | 0.0009 | | $ | 0.3917 |
| |
| |
| Total Annual Operating Expenses9 | | | | | | |
| Share Class | | With Waiver | | | Without Waiver | | | |
| A | | 1.03 | % | | 1.04 | % | | |
| Advisor | | 0.78 | % | | 0.79 | % | | |
Each class of shares is available to certain eligible investors and has different annual fees and expenses, as described in the prospectus.
All investments involve risks, including possible loss of principal. The Fund’s share price and yield will be affected by interest rate movements. Bond prices
generally move in the opposite direction of interest rates. As the prices of bonds in the Fund adjust to a rise in interest rates, the Fund’s share price may decline.
Stock prices fluctuate, sometimes rapidly and dramatically, due to factors affecting individual companies, particular industries or sectors, or general market
conditions. The Fund is actively managed but there is no guarantee that the manager’s investment decisions will produce the desired results. The Fund’s
prospectus also includes a description of the main investment risks.
1. The Fund has a fee waiver associated with any investment it makes in a Franklin Templeton money fund and/or other Franklin Templeton Fund, contractually guaranteed
through its current fiscal year-end. Fund investment results reflect the fee waiver; without this reduction, the results would have been lower.
2. Cumulative total return represents the change in value of an investment over the periods indicated.
3. Average annual total return represents the average annual change in value of an investment over the periods indicated. Return for less than one year, ifany,hasnotbeen
annualized.
4. In accordance with SEC rules, we provide standardized average annual total return information through the latest calendar quarter.
5. Distribution rate is based on an annualization of the respective class’s October dividend and the maximum offering price (NAV for Advisor Class) per share on 10/31/16.
6. The Fund’s 30-day standardized yield is calculated over a trailing 30-day period using the yield to maturity on bonds and/or the dividends accrued on stocks. It may not equal
the Fund’s actual income distribution rate, which reflects the Fund’s past dividends paid to shareholders.
7. Source: Morningstar. The S&P 500 is a market capitalization-weighted index of 500 stocks designed to measure total U.S. equity market performance. The Bloomberg
Barclays U.S. Aggregate Bond Index is a market capitalization-weighted index representing the U.S. investment-grade, fixed-rate, taxable bond market with index components
for government and corporate, mortgage pass-through and asset-backed securities. All issues included are SEC registered, taxable, dollar denominated and nonconvertible,
must have at least one year to final maturity and must be rated investment grade (Baa3/BBB-/BBB- or higher) using the middle rating of Moody’s, S&P and Fitch, respectively.
8. The distribution amount is the sum of the dividend payments to shareholders for the period shown and includes only estimated tax-basis net investment income and capital
gain.
9. Figures are as stated in the Fund’s current prospectus and may differ from the expense ratios disclosed in the Your Fund’s Expenses and Financial Highlights sections in this
report. In periods of market volatility, assets may decline significantly, causing total annual Fund operating expenses to become higher than the figures shown.
See www.franklintempletondatasources.com for additional data provider information.
10 Annual Report
franklintempleton.com
FRANKLIN BALANCED FUND
Your Fund’s Expenses
As a Fund shareholder, you can incur two types of costs: (1) transaction costs, including sales charges (loads) on Fund purchases and redemptions; and (2) ongoing Fund costs, including management fees, distribution and service (12b-1) fees, and other Fund expenses. All mutual funds have ongoing costs, sometimes referred to as operating expenses. The table below shows ongoing costs of investing in the Fund and can help you understand these costs and compare them with those of other mutual funds. The table assumes a $1,000 investment held for the six months indicated.
Actual Fund Expenses
The table below provides information about actual account values and actual expenses in the columns under the heading “Actual.” In these columns the Fund’s actual return, which includes the effect of Fund expenses, is used to calculate the “Ending Account Value” for each class of shares. You can estimate the expenses you paid during the period by following these steps (of course, your account value and expenses will differ from those in this illustration): Divide your account value by $1,000 (if your account had an $8,600 value, then $8,600 ÷ $1,000 = 8.6). Then multiply the result by the number in the row for your class of shares under the headings “Actual” and “Expenses Paid During Period” (if Actual Expenses Paid During Period were $7.50, then 8.6 x $7.50 = $64.50). In this illustration, the actual expenses paid this period are $64.50.
Hypothetical Example for Comparison with Other Funds
Under the heading “Hypothetical” in the table, information is provided about hypothetical account values and hypothetical expenses based on the Fund’s actual expense ratio and an assumed rate of return of 5% per year before expenses, which is not the Fund’s actual return. This information may not be used to estimate the actual ending account balance or expenses you paid for the period, but it can help you compare ongoing costs of investing in the Fund with those of other funds. To do so, compare this 5% hypothetical example for the class of shares you hold with the 5% hypothetical examples that appear in the shareholder reports of other funds.
Please note that expenses shown in the table are meant to highlight ongoing costs and do not reflect any transactional costs. Therefore, information under the heading “Hypothetical” is useful in comparing ongoing costs only, and will not help you compare total costs of owning different funds. In addition, if transactional costs were included, your total costs would have been higher.
| | | | | | | | | | | | |
| | | | | | | Actual | | Hypothetical | | |
| | | | | (actual return after expenses) | | (5% annual return before expenses) | | |
| | | | | | | Expenses | | | | Expenses | Net | |
| | | Beginning | | Ending | | Paid During | | Ending | | Paid During | Annualized | |
| Share | | Account | | Account | | Period | | Account | | Period | Expense | |
| Class | | Value 5/1/16 | | Value 10/31/16 | | 5/1/16–10/31/161,2 | | Value 10/31/16 | | 5/1/16–10/31/161,2 | Ratio2 | |
| A | $ | 1,000 | $ | 1,034.70 | $ | 5.22 | $ | 1,020.01 | $ | 5.18 | 1.02 | % |
| C | $ | 1,000 | $ | 1,032.60 | $ | 9.04 | $ | 1,016.24 | $ | 8.97 | 1.77 | % |
| R | $ | 1,000 | $ | 1,034.70 | $ | 6.50 | $ | 1,018.75 | $ | 6.44 | 1.27 | % |
| R6 | $ | 1,000 | $ | 1,038.70 | $ | 3.38 | $ | 1,021.82 | $ | 3.35 | 0.66 | % |
| Advisor | $ | 1,000 | $ | 1,038.10 | $ | 3.94 | $ | 1,021.27 | $ | 3.91 | 0.77 | % |
1. Expenses are equal to the annualized expense ratio for the six-month period as indicated above–in the far right column–multiplied by the simple average account value
over the period indicated, and then multiplied by 184/366 to reflect the one-half year period.
2. Reflects expenses after fee waivers and expense reimbursements. Does not include acquired fund fees and expenses.
franklintempleton.com
Annual Report
11
Franklin Convertible Securities Fund
We are pleased to bring you Franklin Convertible Securities Fund’s annual report for the fiscal year ended October 31, 2016.
Your Fund’s Goal and Main Investments
The Fund seeks to maximize total return, consistent with reasonable risk, by seeking to optimize capital appreciation and high current income under varying market conditions and investing at least 80% of its net assets in convertible securities.

Performance Overview
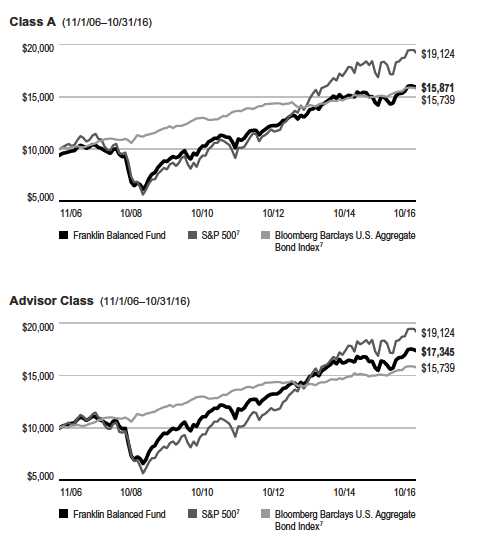
For the 12 months under review, the Fund’s Class A shares delivered a +6.41% cumulative total return. In comparison, the Fund’s benchmark, the BofA Merrill Lynch (BofAML) All Total Return Alternatives U.S. Convertibles Index, which tracks the domestic convertible securities market, posted a +2.35% total return.1 You can find the Fund’s long-term performance data in the Performance Summary beginning on page 15.
Performance data represent past performance, which does not guarantee future results. Investment return and principal value will fluctuate, and you may have a gain or loss when you sell your shares. Current performance may differ from figures shown. For most recent month-end performance, go to franklintempleton.com or call (800) 342-5236.
Investment Strategy
When choosing convertible securities for the Fund, we attempt to maintain a balance in the portfolio between the equity and debt characteristics of convertible securities with an emphasis on the equity features. We also consider the company’s long-term earnings, asset value and cash flow potential. Some of the convertible securities in which the Fund may invest have been structured to provide enhanced yield, increased equity exposure or enhanced downside protection. These securities typically provide a benefit to the issuer in exchange for the enhanced features, such as a conversion premium that is paid by the Fund. We may invest in convertible securities of companies of any capitalization size, but we generally seek to make the portfolio representative of the entire convertible securities market.
Manager’s Discussion
Most sectors the Fund invested in rose in value during the 12 months under review and supported performance. The information technology, consumer staples and utilities sectors contributed most to Fund returns during the period. Within information technology, Chinese online and mobile commerce company Alibaba Group Holding (shown as Mandatory Exchangeable Trust in the SOI),2 semiconductor processing systems manufacturer LAM Research and semiconductor products manufacturer Microchip Technology appreciated significantly. During the period, Alibaba increased its transparency in terms of results for its core commerce, media and cloud-computing business segments. The improved transparency proved to be a positive catalyst for the stock, enabling analysts to better value the core businesses, and it led to a revaluation of Alibaba based on a sum-of-the-parts approach. LAM Research benefited from strong semiconductor capital expenditure trends in the NAND flash memory and semiconductor fabrication markets in 2016. The company’s etch and deposition tools are increasingly being used in the conversion of NAND memory chips to 3D architecture, as well as in advanced logic chips. Regarding Microchip Technology, in addition to strong execution in its core microcontroller and analog product segments, the company acquired Supertex, Micrel and Atmel. In our opinion, each of these transactions added solid value and expanded the company’s product lines, and the market reacted positively to the increased scale and breadth. We believe Microchip Technology remains one of the best managed, most profitable companies in the semiconductor industry.
1. Source: BofA Merrill Lynch.
The index is unmanaged and includes reinvested dividends. It does not reflect any fees, expenses or sales charges. One cannot invest directly in an index, and an index is not
representative of the Fund’s portfolio.
2. New position during the period.
The dollar value, number of shares or principal amount, and names of all portfolio holdings are listed in the Fund’s Statement of Investments (SOI).
The SOI begins on page 49.
12 Annual Report
franklintempleton.com
FRANKLIN CONVERTIBLE SECURITIES FUND
| | |
| Top 10 Holdings | | |
| 10/31/16 | | |
| Company | % of Total | |
| Sector/Industry | Net Assets | |
| Liberty Media Corp. | 2.9 | % |
| Consumer Discretionary | | |
| Novellus Systems Inc. | 2.3 | % |
| Information Technology | | |
| Microchip Technology Inc. | 2.3 | % |
| Information Technology | | |
| T-Mobile U.S. Inc. | 2.3 | % |
| Telecommunication Services | | |
| Proofpoint Inc. | 2.2 | % |
| Information Technology | | |
| Trulia Inc. | 2.2 | % |
| Information Technology | | |
| Dish Network Corp. | 2.2 | % |
| Consumer Discretionary | | |
| Mandatory Exchangeable Trust | 2.2 | % |
| Information Technology | | |
| ServiceNow Inc. | 2.2 | % |
| Information Technology | | |
| Post Holdings Inc. | 2.2 | % |
| Consumer Staples | | |
Among consumer staples holdings, food products manufacturer Tyson Foods and cereal maker Post Holdings had significant gains during the reporting period. Tyson Foods continued to benefit from meat and protein, a category that has been expanding at a relatively high growth rate and that generally responds well to innovation. The company has successfully introduced value-added products to its portfolio to further distance itself from its commodity-protein past, creating a less volatile and higher margin business. We believe the company deserves a higher valuation than it has historically received as the more margin-stable prepared foods business becomes a larger percentage of its portfolio and as the company continues to reduce its commodity exposure to chicken. Post Holdings benefited from solid sales growth momentum across its businesses and the realization of synergies from recent acquisitions. Each of the company’s business segments are distinct platforms that we believe Post can continue to build. We believe the active nutrition segment has a particularly favorable growth profile and operates in a very fragmented category with many acquisition opportunities to drive incremental growth. Post generates strong free cash flow given its relatively high-margin profile and modest capital and working capital requirements.
In the utilities sector, our convertible preferred stock position in diversified energy company Black Hills helped the Fund’s results.2 The company benefited from a lower interest-rate environment, which drove the value of regulated utilities higher. Black Hills also benefited from integration efforts around its SourceGas acquisition.
Elsewhere, Anacor Pharmaceuticals, a new position in the health care sector, boosted the Fund’s performance.3 Anacor, which focuses on discovering, developing and commercializing novel small-molecule therapeutics derived from its boron chemistry platform, was acquired by Pfizer, another Fund holding, in June at a significant premium. In the telecommunication services sector, T-Mobile benefited results. The company is the only U.S. wireless carrier that has consistently gained market share, and new subscribers have been driving earnings growth. We believe the company continues to be a takeover target as more competitors look to enter the wireless industry. In the consumer discretionary sector, Jarden was a significant contributor to performance, largely due to stronger-than-expected operating results and its eventual sale to Newell in early 2016.
In contrast, the health care, energy and industrials sectors detracted from the Fund’s performance during the reporting period. In the health care sector, biotechnology company Novavax, which focuses on vaccines, hindered results.2 The company’s shares experienced significant volatility during the reporting period. In September, the stock price fell after the company’s lead vaccine candidate for respiratory syncytial virus failed in a study on its effectiveness in older patients. Pharmaceutical company Allergan’s shares declined after the U.S. Treasury passed new tax rules that forced the company to terminate its planned merger with Pfizer. Allergan’s dramatic number of acquisitions and divestitures made investors cautious about its outlook as an independent company. Shares of generic drug manufacturer Teva Pharmaceutical Industries fell in value amid general pricing pressures in the pharmaceutical sector and price competition among its generic products.2 Furthermore, its acquisition of Allergan’s Actavis generics division, which occurred in August, took longer than expected to close due to U.S. regulatory delays. In addition, the generics sector outlook has diminished since the acquisition due to price competition, and there is investor concern that the company may lose its patent exclusivity on Copaxone depending on a pending court decision.
3. Not held at period-end.
See www.franklintempletondatasources.com for additional data provider information.
franklintempleton.com
Annual Report
13
FRANKLIN CONVERTIBLE SECURITIES FUND
Energy sector detractors included Rex Energy3 and Cobalt International Energy. Rex Energy’s shares continued to sink as lower natural gas prices and reduced natural gas liquid prices restricted cash flow and prevented growth. The company made several moves during the period to avert restructuring, including selling its non-core Illinois oil assets and signing a joint venture to continue natural gas drilling in Pennsylvania. The company’s relatively higher leverage metrics and debt holders selling converted equity for liquidity kept pressure on the shares. Shares of Cobalt fell as the government of Angola officially backed out of its agreement to purchase Cobalt’s interests in several offshore oil discoveries. The continued delays in closing the sale also led to a change in the company’s senior management, which is now focused on reselling the Angolan properties and reducing its interests in its Gulf of Mexico offshore U.S. discoveries. The company has significant cash and no near-term debt maturities, but we believe it needs to conserve cash for development of the offshore discoveries and will likely need to restructure its convertible bonds that mature in 2021.
In the industrials sector, medical waste manager Stericycle suffered from increased competition that reduced revenues and profitability of the company’s industrial and manufacturing waste business.
Thank you for your continued participation in Franklin Convertible Securities Fund. We look forward to serving your future investment needs.

The foregoing information reflects our analysis, opinions and portfolio holdings as of October 31, 2016, the end of the reporting period. The way we implement our main investment strategies and the resulting portfolio holdings may change depending on factors such as market and economic conditions. These opinions may not be relied upon as investment advice or an offer for a particular security. The information is not a complete analysis of every aspect of any market, country, industry, security or the Fund. Statements of fact are from sources considered reliable, but the investment manager makes no representation or warranty as to their completeness or accuracy. Although historical performance is no guarantee of future results, these insights may help you understand our investment management philosophy.
14 Annual Report
franklintempleton.com
FRANKLIN CONVERTIBLE SECURITIES FUND
Performance Summary as of October 31, 2016
The performance table and graphs do not reflect any taxes that a shareholder would pay on Fund dividends, capital gain distributions, if any, or any realized gains on the sale of Fund shares. Total return reflects reinvestment of the Fund’s dividends and capital gain distributions, if any, and any unrealized gains or losses.
Performance as of 10/31/161
Cumulative total return excludes sales charges. Average annual total returns include maximum sales charges. Sales charges will vary depending on the size of the investment and the class of share purchased. The maximum is 5.75% and the minimum is 0%. Class A: 5.75% maximum initial sales charge; Advisor Class: no sales charges. For other share classes, visit franklintempleton.com.
| | | | | | |
| | Cumulative | | Average Annual | | Average Annual | |
| Share Class | Total Return2 | | Total Return3 | | Total Return(9/30/16)4 | |
| A | | | | | | |
| 1-Year | +6.41 | % | +0.28 | % | +6.27 | % |
| 5-Year | +54.29 | % | +7.77 | % | +9.91 | % |
| 10-Year | +79.27 | % | +5.38 | % | +5.84 | % |
| Advisor5 | | | | | | |
| 1-Year | +6.68 | % | +6.68 | % | +13.02 | % |
| 5-Year | +56.16 | % | +9.32 | % | +11.51 | % |
| 10-Year | +83.16 | % | +6.24 | % | +6.70 | % |
| |
| |
| | Distribution | | 30-Day Standardized Yield7 | |
| Share Class | Rate6 | | (with waiver) (without waiver) | |
| A | 2.60 | % | 1.58 | % | 1.58 | % |
| Advisor | 3.00 | % | 1.93 | % | 1.92 | % |
Performance data represent past performance, which does not guarantee future results. Investment return and principal value will fluctuate, and you may have a gain or loss when you sell your shares. Current performance may differ from figures shown. For most recent month-end performance, go to franklintempleton.com or call (800) 342-5236.
See page 17 for Performance Summary footnotes.
franklintempleton.com
Annual Report
15
FRANKLIN CONVERTIBLE SECURITIES FUND
PERFORMANCE SUMMARY
Total Return Index Comparison for a Hypothetical $10,000 Investment1
Total return represents the change in value of an investment over the periods shown. It includes any applicable maximum sales charge, Fund expenses, account fees and reinvested distributions. The unmanaged index includes reinvestment of any income or distributions. It differs from the Fund in composition and does not pay management fees or expenses. One cannot invest directly in an index.
See page 17 for Performance Summary footnotes.
16 Annual Report
franklintempleton.com
FRANKLIN CONVERTIBLE SECURITIES FUND
PERFORMANCE SUMMARY
Total Annual Operating Expenses9
| | |
| Share Class | | |
| A | 0.86 | % |
| Advisor | 0.61 | % |
Each class of shares is available to certain eligible investors and has different annual fees and expenses, as described in the prospectus.
All investments involve risks, including possible loss of principal. The Fund may invest in high yielding, fixed income securities. High yields reflect the higher
credit risk associated with these lower rated securities and, in some cases, the lower market prices for these instruments. Interest rate movements may affect the
Fund’s share price and yield. Bond prices generally move in the opposite direction of interest rates. As prices of bonds in the Fund adjust to a rise in interest
rates, the Fund’s share price may decline. The Fund may also invest in foreign securities, which involve special risks, including political uncertainty and currency
volatility. The Fund is actively managed but there is no guarantee that the manager’s investment decisions will produce the desired results. The Fund’s prospectus
also includes a description of the main investment risks.
1. The Fund has a fee waiver associated with any investment it makes in a Franklin Templeton money fund and/or other Franklin Templeton fund, contractually guaranteed
through its current fiscal year-end. Fund investment results reflect the fee waiver; without this waiver, the results would have been lower.
2. Cumulative total return represents the change in value of an investment over the periods indicated.
3. Average annual total return represents the average annual change in value of an investment over the periods indicated. Return for less than one year, ifany,hasnotbeen
annualized.
4. In accordance with SEC rules, we provide standardized average annual total return information through the latest calendar quarter.
5. Effective 5/15/08, the Fund began offering Advisor Class shares, which do not have sales charges or a Rule 12b-1 plan. Performance quotations for this class reflect the
following methods of calculation: (a) For periods prior to 5/15/08, a restated figure is used based upon the Fund’s Class A performance, excluding the effect of Class A’s
maximum initial sales charge, but reflecting the effect of the Class A Rule 12b-1 fees; and (b) for periods after 5/15/08 actual Advisor Class performance is used reflecting all
charges and fees applicable to that class. Since 5/15/08 (commencement of sales), the cumulative and average annual total returns of Advisor Class shares were +71.92% and
+6.61%.
6. Distribution rate is based on the sum of the respective class’s past four quarterly dividends and the maximum offering price (NAV for Advisor Class) per share on 10/31/16.
7. The Fund’s 30-day standardized yield is calculated over a trailing 30-day period using the yield to maturity on bonds and/or the dividends accrued on stocks. It may not equal
the Fund’s actual income distribution rate, which reflects the Fund’s past dividends paid to shareholders.
8. Source: BofA Merrill Lynch. The BofAMLAll Total Return Alternatives U.S. Convertibles Index comprises domestic securities of all quality grades that are convertible into U.S.
dollar-denominated common stock, ADRs or cash equivalents and have a delta (measure of equity sensitivity) that indicates the security likely has a balance between the debt
and equity characteristics of the security.
9. Figures are as stated in the Fund’s current prospectus and may differ from the expense ratios disclosed in the Your Fund’s Expenses and Financial Highlights sections in this
report. In periods of market volatility, assets may decline significantly, causing total annual Fund operating expenses to become higher than the figures shown.
See www.franklintempletondatasources.com for additional data provider information.
franklintempleton.com
Annual Report
17
FRANKLIN CONVERTIBLE SECURITIES FUND
Your Fund’s Expenses
As a Fund shareholder, you can incur two types of costs: (1) transaction costs, including sales charges (loads) on Fund purchases and redemptions; and (2) ongoing Fund costs, including management fees, distribution and service (12b-1) fees, and other Fund expenses. All mutual funds have ongoing costs, sometimes referred to as operating expenses. The table below shows ongoing costs of investing in the Fund and can help you understand these costs and compare them with those of other mutual funds. The table assumes a $1,000 investment held for the six months indicated.
Actual Fund Expenses
The table below provides information about actual account values and actual expenses in the columns under the heading “Actual.” In these columns the Fund’s actual return, which includes the effect of Fund expenses, is used to calculate the “Ending Account Value” for each class of shares. You can estimate the expenses you paid during the period by following these steps (of course, your account value and expenses will differ from those in this illustration): Divide your account value by $1,000 (if your account had an $8,600 value, then $8,600 ÷ $1,000 = 8.6). Then multiply the result by the number in the row for your class of shares under the headings “Actual” and “Expenses Paid During Period” (if Actual Expenses Paid During Period were $7.50, then 8.6 x $7.50 = $64.50). In this illustration, the actual expenses paid this period are $64.50.
Hypothetical Example for Comparison with Other Funds
Under the heading “Hypothetical” in the table, information is provided about hypothetical account values and hypothetical expenses based on the Fund’s actual expense ratio and an assumed rate of return of 5% per year before expenses, which is not the Fund’s actual return. This information may not be used to estimate the actual ending account balance or expenses you paid for the period, but it can help you compare ongoing costs of investing in the Fund with those of other funds. To do so, compare this 5% hypothetical example for the class of shares you hold with the 5% hypothetical examples that appear in the shareholder reports of other funds.
Please note that expenses shown in the table are meant to highlight ongoing costs and do not reflect any transactional costs. Therefore, information under the heading “Hypothetical” is useful in comparing ongoing costs only, and will not help you compare total costs of owning different funds. In addition, if transactional costs were included, your total costs would have been higher.
| | | | | | | | | | | | |
| | | | | | | Actual | | Hypothetical | | |
| | | | | (actual return after expenses) | | (5% annual return before expenses) | | |
| | | | | | | Expenses | | | | Expenses | Net | |
| | | Beginning | | Ending | | Paid During | | Ending | | Paid During | Annualized | |
| Share | | Account | | Account | | Period | | Account | | Period | Expense | |
| Class | | Value 5/1/16 | | Value 10/31/16 | | 5/1/16–10/31/161,2 | | Value 10/31/16 | | 5/1/16–10/31/161,2 | Ratio2 | |
| A | $ | 1,000 | $ | 1,063.40 | $ | 4.36 | $ | 1,020.91 | $ | 4.27 | 0.84 | % |
| C | $ | 1,000 | $ | 1,059.10 | $ | 8.23 | $ | 1,017.14 | $ | 8.06 | 1.59 | % |
| R6 | $ | 1,000 | $ | 1,065.00 | $ | 2.49 | $ | 1,022.72 | $ | 2.44 | 0.48 | % |
| Advisor | $ | 1,000 | $ | 1,064.70 | $ | 3.06 | $ | 1,022.17 | $ | 3.00 | 0.59 | % |
1. Expenses are equal to the annualized expense ratio for the six-month period as indicated above–in the far right column–multiplied by the simple average account value
over the period indicated, and then multiplied by 184/366 to reflect the one-half year period.
2. Reflects expenses after fee waivers and expense reimbursements. Does not include acquired fund fees and expenses.
18 Annual Report
franklintempleton.com
Franklin Equity Income Fund
This annual report for Franklin Equity Income Fund covers the fiscal year ended October 31, 2016.
Your Fund’s Goal and Main Investments
The Fund seeks to maximize total return, emphasizing high current income and long-term capital appreciation, consistent with reasonable risk, by investing at least 80% of its net assets in equity securities including securities convertible into common stocks.
Performance Overview
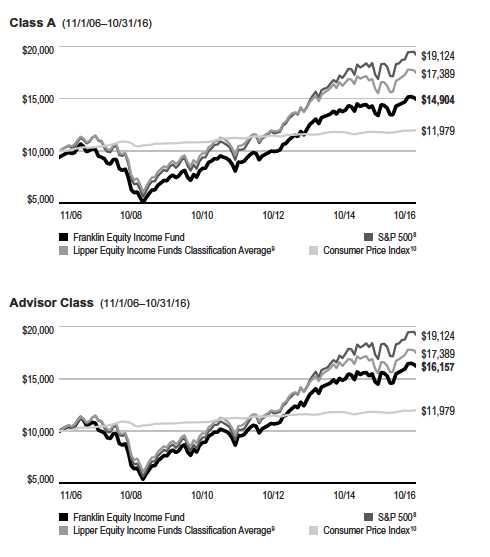
For the 12 months under review, the Fund’s Class A shares delivered a +3.31% cumulative total return. In comparison, the Fund’s benchmark, the Standard & Poor’s 500 Index (S&P 500), which tracks the broad U.S. stock market, generated a +4.51% total return.1 The Fund’s peers, as measured by the Lipper Equity Income Funds Classification Average, which consists of funds chosen by Lipper that seek relatively high current income and growth of income by investing at least 60% of their portfolios in stocks, posted a +4.70% total return.2 You can find the Fund’s long-term performance data in the Performance Summary beginning on page 23.
Performance data represent past performance, which does not guarantee future results. Investment return and principal value will fluctuate, and you may have a gain or loss when you sell your shares. Current performance may differ from figures shown. For most recent month-end performance, go to franklintempleton.com or call (800) 342-5236.
Investment Strategy
We seek to invest in a broadly diversified portfolio of equity securities that we consider to be financially strong, with a focus on “blue chip” companies. We apply a bottom-up approach to investing in individual securities. We will assess the market price of a company’s securities relative to our evaluation of the company’s long-term earnings, asset value and cash flow potential. We also consider a company’s price/earnings ratio, profit margins, balance sheet and liquidations value. We consider dividend yield in selecting stocks for the Fund because we believe that, over time, dividend income can contribute significantly to total return and can be a more consistent source
of investment return than capital appreciation. We seek to take advantage of price dislocations that result from the market’s short-term focus and choose to invest in those companies that, in our opinion, offer the best trade-off between growth opportunity, business and financial risk, and valuation.
Manager’s Discussion
Most of the sectors the Fund invested in increased in value during the 12-month reporting period and supported performance. The industrials, information technology and energy sectors contributed most to Fund returns during the period. In the industrials sector, Illinois Tool Works, Republic
1. Source: Morningstar.
2. Source: Lipper, a Thomson Reuters Company. For the 12-month period ended 10/31/16, this category consisted of 508 funds. Lipper calculations do not include sales
charges, or expense subsidization by a fund’s manager. The Fund’s performance relative to the average may have differed if these and other factors had been considered.
The indexes are unmanaged and include reinvestment of any income or distributions. They do not include any fees, expenses or sales charges. One cannot invest directly in an
index, and an index is not representative of the Fund’s portfolio.
The dollar value, number of shares or principal amount, and names of all portfolio holdings are listed in the Fund’s Statement of Investments (SOI).
The SOI begins on page 58.
franklintempleton.com
Annual Report
19
| | | | | |
| FRANKLIN EQUITY INCOME FUND | | |
| |
| |
| |
| Dividend Distributions* | | | |
| 11/1/15–10/31/16 | | | | |
| | | Dividend per Share (cents) | |
| | | | | | Advisor |
| Month | Class A | Class C | Class R | Class R6 | Class |
| November | 3.90 | 2.48 | 3.40 | 4.60 | 4.38 |
| December** | 14.11 | 12.71 | 13.63 | 14.81 | 14.58 |
| March | 12.96 | 10.16 | 12.09 | 14.38 | 13.92 |
| June | 14.22 | 10.42 | 12.85 | 16.14 | 15.53 |
| September | 14.73 | 10.60 | 13.46 | 16.94 | 16.37 |
| Total | 59.92 | 46.37 | 55.43 | 66.87 | 64.78 |
*The distribution amount is the sum of the dividend payments to shareholders for
the period shown and includes only estimated tax-basis net investment income. All
Fund distributions will vary depending upon current market conditions, and past
distributions are not indicative of future trends.
**Includes an additional 10.21 cent per share distribution to meet excise tax
requirements.
Services and Raytheon helped performance. Industrial products and equipment manufacturer Illinois Tool Works posted strong earnings results for most of the period amid expanding operating margins, and it raised earnings guidance. A recent acquisition by the company’s original equipment manufacturing division also supported its stock. Shares of waste management company Republic Services rose in value as the company experienced strong trends in its commercial and industrial waste collection businesses. Pricing continued to improve, helped by industry consolidation, and recycling headwinds abated as renewable cardboard prices moved modestly higher over the summer. Defense contractor Raytheon’s shares increased during the period. The company experienced strong overseas demand for its missile protection systems and radios. Shares of Lockheed Martin, another defense contractor holding, benefited from similarly strong demand across its product offering. Finally, the uncertain geopolitical backdrop led defense stocks to trade at a premium to the market and historical levels.
Information technology holding Microsoft, a software and information technology services company and the Fund’s largest holding at period-end, benefited over the past year from investors gaining greater confidence in the company’s ability to be relevant in the cloud-computing era with its key productivity and server software franchises. Specifically, its productivity suite moved rapidly to Office 365, while its server franchise found new growth opportunities with the company’s Azure platform. In addition, the company executed well on various cost containment and capital return initiatives, with expanded share repurchases and a solid and growing dividend.
Semiconductor manufacturer Texas Instruments also helped the Fund’s results, as the company continued to improve its gross and operating profit margins, while its embedded processing division accelerated its revenue growth rate.3 The company continued to surpass market expectations with its effective execution, and it has committed to returning 100% of its free cash flow to investors, which has attracted many to the stock, leading to its strong performance. Semiconductor company Avago Technologies (named Broadcom as of period-end) continued to execute well, delivering superior growth and profitability in its wireless, networking and enterprise storage business segments. In addition, the company announced and completed its acquisition of Broadcom during the reporting period. The market reacted positively to the transaction, and as Avago increased projections from its initial asset and earnings growth targets surrounding its expansion, the shares continued to benefit.
In the energy sector, major oil and gas company Chevron boosted results. The company’s shares recovered over the past year along with oil and natural gas fundamentals and amid progress in its project delivery and cost reduction initiatives. During the period, commodity prices stabilized at healthier levels, and Chevron made advances in delivering its Gorgon and Wheatstone liquid natural gas projects in Australia, while cost reductions helped move the company toward a better balance between cash flow and spending in a lower commodity price environment.
Elsewhere, in the consumer staples sector, The Kraft Heinz Company helped the Fund’s results during the reporting period. Kraft Heinz is a leading U.S. packaged food company, and is in the process of realigning the consolidated entity’s cost structure which has resulted in unprecedented margin expansion. Management has proven its ability to create more sustainable growth than many investors and competitors had expected despite structural category impediments and global economic challenges. We also believe there is a high probability of incremental upside potential from large merger-and-acquisition activity as the company leverages what its management describes as “an operating model that can be scaled.” In the utilities sector, NextEra Energy benefited Fund results as valuations of utilities generally moved higher with lower long-term interest rates. In addition, the company delivered on expanded renewable development opportunities following the passage of tax credit extensions in December 2015. Financial services company JPMorgan Chase, the Fund’s largest holding in the financials sector at period-end, also contributed to
3. New position during the period.
20 Annual Report
franklintempleton.com
FRANKLIN EQUITY INCOME FUND
relative performance. The company experienced improved fixed income trading results and strong earnings. Its shares were further supported by investors’ demand for higher quality banks.
In contrast, the health care and consumer discretionary sectors detracted from the Fund’s relative performance during the reporting period. In health care, shares of pharmaceutical company Allergan declined after the U.S. Department of the Treasury passed new tax rules that forced the company to terminate its planned merger with Pfizer. Allergan’s dramatic number of acquisitions and divestitures made investors cautious about its outlook as an independent company. France-based pharmaceutical firm Sanofi suffered amid pricing and competitive challenges to its dominant U.S. insulin franchise and the company’s difficulty in replacing these lost profits from its pipeline.4 Shares of generic drug manufacturer Teva Pharmaceutical Industries fell in value amid general pricing pressures in the pharmaceutical sector and price competition among its generic products.3 Furthermore, its acquisition of Allergan’s Actavis generics division, which occurred in August, took longer than expected to close due to U.S. regulatory delays. In addition, the generics sector outlook has diminished since the acquisition due to price competition, and there is investor concern that the company may lose its patent exclusivity on Copaxone depending on a pending court decision.
In the consumer discretionary sector, hotel operator Starwood Hotels & Resorts Worldwide declined in value as the lodging group experienced weakness in late 2015 and early 2016.4 During that time, revenue-per-available-room expectations declined, corporate travel was slowing and investors began to digest the impact of competition from alternative accommodations (e.g., Airbnb5). During the period, the company received an initial takeover bid from Marriott5 that was viewed as disappointing by investors though a takeover was ultimately completed at higher values. Automobile manufacturer Ford Motor also hindered results. The company suffered from negative sentiment toward the auto business cycle in North America, where investors seemed to believe demand had peaked and, as a result, declining earnings and profits would be experienced across the industry. Sportswear maker NIKE underperformed primarily because growth decelerated.4 The company’s sales growth during the period were negatively impacted by one-time factors including sports retailer bankruptcies, tough comparisons from a robust 2015 and unfavorable weather causing excess inventory.
Elsewhere, Wells Fargo, in the financials sector, detracted from results. The company’s shares declined following an account-opening scandal, as well as the resignation of its chief executive officer in the scandal’s aftermath. Also in the financials sector, MetLife, like other insurance companies, suffered as the outlook for interest rates deteriorated at the start of the reporting period.4 We have started to see this trend reverse as interest rates recently began to move higher, although they were still below where yields started the year. The company is in the process of separating into two standalone businesses, as first disclosed earlier in 2016. The process resulted in a pause in share repurchases and created above-average, near-term uncertainty, which recently has begun to be clarified by management but created what we view as a temporary overhang on the stock relative to its peers.
In the consumer staples sector, CVS Health hindered results. During the reporting period, scrutiny on pharmacy benefits managers intensified due to an increased focus on prescription drug pricing. We believe these headwinds are largely transient, and we expect CVS Health’s integrated delivery model will be successful over the long term.
4. Not held at period-end.
5. Not a Fund holding.
See www.franklintempletondatasources.com for additional data provider information.
franklintempleton.com
Annual Report
21
FRANKLIN EQUITY INCOME FUND
Thank you for your continued participation in Franklin Equity Income Fund. We look forward to serving your future investment needs.

The foregoing information reflects our analysis, opinions and portfolio holdings as of October 31, 2016, the end of the reporting period. The way we implement our main investment strategies and the resulting portfolio holdings may change depending on factors such as market and economic conditions. These opinions may not be relied upon as investment advice or an offer for a particular security. The information is not a complete analysis of every aspect of any market, country, industry, security or the Fund. Statements of fact are from sources considered reliable, but the investment manager makes no representation or warranty as to their completeness or accuracy. Although historical performance is no guarantee of future results, these insights may help you understand our investment management philosophy.
22 Annual Report
franklintempleton.com
FRANKLIN EQUITY INCOME FUND
Performance Summary as of October 31, 2016
The performance table and graphs do not reflect any taxes that a shareholder would pay on Fund dividends, capital gain distributions, if any, or any realized gains on the sale of Fund shares. Total return reflects reinvestment of the Fund’s dividends and capital gain distributions, if any, and any unrealized gains or losses.
Performance as of 10/31/161
Cumulative total return excludes sales charges. Average annual total returns include maximum sales charges. Sales charges will vary depending on the size of the investment and the class of share purchased. The maximum is 5.75% and the minimum is 0%. Class A: 5.75% maximum initial sales charge; Advisor Class: no sales charges. For other share classes, visit franklintempleton.com.
| | | | | | |
| | Cumulative | | Average Annual | | Average Annual | |
| Share Class | Total Return2 | | Total Return3 | | Total Return(9/30/16)4 | |
| A | | | | | | |
| 1-Year | +3.31 | % | -2.62 | % | +6.39 | % |
| 5-Year | +67.06 | % | +9.51 | % | +12.08 | % |
| 10-Year | +58.11 | % | +4.07 | % | +4.51 | % |
| Advisor5 | | | | | | |
| 1-Year | +3.53 | % | +3.53 | % | +13.13 | % |
| 5-Year | +69.18 | % | +11.09 | % | +13.70 | % |
| 10-Year | +61.57 | % | +4.91 | % | +5.36 | % |
| |
| |
| | Distribution | | 30-Day Standardized Yield7 | |
| Share Class | Rate6 | | (with waiver) (without waiver) | |
| A | 2.47 | % | 1.85 | % | 1.84 | % |
| Advisor | 2.91 | % | 2.20 | % | 2.19 | % |
Performance data represent past performance, which does not guarantee future results. Investment return and principal value will fluctuate, and you may have a gain or loss when you sell your shares. Current performance may differ from figures shown. For most recent month-end performance, go to franklintempleton.com or call (800) 342-5236.
See page 25 for Performance Summary footnotes.
franklintempleton.com
Annual Report
23
FRANKLIN EQUITY INCOME FUND
PERFORMANCE SUMMARY
Total Return Index Comparison for a Hypothetical $10,000 Investment1
Total return represents the change in value of an investment over the periods shown. It includes any applicable maximum sales charge, Fund expenses, account fees and reinvested distributions. The unmanaged indexes include reinvestment of any income or distributions. They differ from the Fund in composition and do not pay management fees or expenses. One cannot invest directly in an index.
See page 25 for Performance Summary footnotes.
24 Annual Report
franklintempleton.com
| | | | | |
| | | | | | FRANKLIN EQUITY INCOME FUND |
| | | | | | PERFORMANCE SUMMARY |
| |
| Total Annual Operating Expenses11 | | | | |
| Share Class | With Waiver | | Without Waiver | | |
| A | 0.86 | % | 0.86 | % | |
| Advisor | 0.61 | % | 0.61 | % | |
Each class of shares is available to certain eligible investors and has different annual fees and expenses, as described in the prospectus.
All investments involve risks, including possible loss of principal. Stock prices fluctuate, sometimes rapidly and dramatically, due to factors affecting individual
companies, particular industries or sectors, or general market conditions. Convertible securities are subject to the risks of stocks when the underlying stock price
is high relative to the conversion price and debt securities when the underlying stock price is low relative to the conversion price. The Fund’s investment in
foreign securities also involves special risks, including currency fluctuations and economic as well as political uncertainty. The Fund is actively managed but
there is no guarantee that the manager’s investment decisions will produce the desired results. The Fund’s prospectus also includes a description of the main
investment risks.
1. The Fund has a fee waiver associated with any investment it makes in a Franklin Templeton money fund and/or other Franklin Templeton Fund, contractually guaranteed its
current fiscal year-end. Fund investment results reflect the fee waiver; without this waiver, the results would have been lower.
2. Cumulative total return represents the change in value of an investment over the periods indicated.
3. Average annual total return represents the average annual change in value of an investment over the periods indicated. Return for less than one year, ifany,hasnotbeen
annualized.
4. In accordance with SEC rules, we provide standardized average annual total return information through the latest calendar quarter.
5. Effective 5/15/08, the Fund began offering Advisor Class shares, which do not have sales charges or a Rule 12b-1 plan. Performance quotations for this class reflect the
following methods of calculation: (a) For periods prior to 5/15/08, a restated figure is used based upon the Fund’s Class A performance, excluding the effect of Class A’s
maximum initial sales charge, but reflecting the effect of the Class A Rule 12b-1 fees; and (b) for periods after 5/15/08, actual Advisor Class performance is used reflecting all
charges and fees applicable to that class. Since 5/15/08 (commencement of sales), the cumulative and average annual total returns of Advisor Class shares were +61.36% and
+5.82%.
6. Distribution rate is based on an annualization of the respective class’s current quarterly dividend and the maximum offering price (NAV for Advisor Class) per share on
10/31/16.
7. The Fund’s 30-day standardized yield is calculated over a trailing 30-day period using the yield to maturity on bonds and/or the dividends accrued on stocks. It may not equal
the Fund’s actual income distribution rate, which reflects the Fund’s past dividends paid to shareholders.
8. Source: Morningstar: The S&P 500 is a market capitalization-weighted index of 500 stocks designed to measure total U.S. equity market performance.
9. Source: Lipper, a Thomson Reuters Company. The Lipper Equity Income Funds Classification Average is an equally weighted average calculation of performance figures for
all funds within the Lipper Equity Income Funds classification in the Lipper Open-End underlying funds universe. Lipper Equity Income Funds seek relatively high current
income and growth of income through investing 60% or more of their portfolios in equities. For the one-year period ended 10/31/16, there were 508 funds in this category.
Lipper calculations do not include sales charges or expense subsidization by a fund’s manager. The Fund’s performance relative to the average may have differed if these or
other factors had been considered.
10. Source: Bureau of Labor Statistics, bls.gov/cpi. The Consumer Price Index (CPI), is a commonly used measure of the inflation rate.
11. Figures are as stated in the Fund’s current prospectus and may differ from the expense ratios disclosed in the Your Fund’s Expenses and Financial Highlights sections in
this report. In periods of market volatility, assets may decline significantly, causing total annual Fund operating expenses to become higher than the figures shown.
See www.franklintempletondatasources.com for additional data provider information.
franklintempleton.com
Annual Report
25
FRANKLIN EQUITY INCOME FUND
Your Fund’s Expenses
As a Fund shareholder, you can incur two types of costs: (1) transaction costs, including sales charges (loads) on Fund purchases and redemptions; and (2) ongoing Fund costs, including management fees, distribution and service (12b-1) fees, and other Fund expenses. All mutual funds have ongoing costs, sometimes referred to as operating expenses. The table below shows ongoing costs of investing in the Fund and can help you understand these costs and compare them with those of other mutual funds. The table assumes a $1,000 investment held for the six months indicated.
Actual Fund Expenses
The table below provides information about actual account values and actual expenses in the columns under the heading “Actual.” In these columns the Fund’s actual return, which includes the effect of Fund expenses, is used to calculate the “Ending Account Value” for each class of shares. You can estimate the expenses you paid during the period by following these steps (of course, your account value and expenses will differ from those in this illustration): Divide your account value by $1,000 (if your account had an $8,600 value, then $8,600 ÷ $1,000 = 8.6). Then multiply the result by the number in the row for your class of shares under the headings “Actual” and “Expenses Paid During Period” (if Actual Expenses Paid During Period were $7.50, then 8.6 x $7.50 = $64.50). In this illustration, the actual expenses paid this period are $64.50.
Hypothetical Example for Comparison with Other Funds
Under the heading “Hypothetical” in the table, information is provided about hypothetical account values and hypothetical expenses based on the Fund’s actual expense ratio and an assumed rate of return of 5% per year before expenses, which is not the Fund’s actual return. This information may not be used to estimate the actual ending account balance or expenses you paid for the period, but it can help you compare ongoing costs of investing in the Fund with those of other funds. To do so, compare this 5% hypothetical example for the class of shares you hold with the 5% hypothetical examples that appear in the shareholder reports of other funds.
Please note that expenses shown in the table are meant to highlight ongoing costs and do not reflect any transactional costs. Therefore, information under the heading “Hypothetical” is useful in comparing ongoing costs only, and will not help you compare total costs of owning different funds. In addition, if transactional costs were included, your total costs would have been higher.
| | | | | | | | | | | | |
| | | | | | | Actual | | Hypothetical | | |
| | | | | (actual return after expenses) | | (5% annual return before expenses) | | |
| | | | | | | Expenses | | | | Expenses | Net | |
| | | Beginning | | Ending | | Paid During | | Ending | | Paid During | Annualized | |
| Share | | Account | | Account | | Period | | Account | | Period | Expense | |
| Class | | Value 5/1/16 | | Value 10/31/16 | | 5/1/16–10/31/161,2 | | Value 10/31/16 | | 5/1/16–10/31/161,2 | Ratio2 | |
| A | $ | 1,000 | $ | 1,033.70 | $ | 4.40 | $ | 1,020.81 | $ | 4.37 | 0.86 | % |
| C | $ | 1,000 | $ | 1,029.30 | $ | 8.21 | $ | 1,017.04 | $ | 8.16 | 1.61 | % |
| R | $ | 1,000 | $ | 1,032.50 | $ | 5.57 | $ | 1,019.66 | $ | 5.53 | 1.09 | % |
| R6 | $ | 1,000 | $ | 1,035.50 | $ | 2.46 | $ | 1,022.72 | $ | 2.44 | 0.48 | % |
| Advisor | $ | 1,000 | $ | 1,034.50 | $ | 3.12 | $ | 1,022.07 | $ | 3.10 | 0.61 | % |
1. Expenses are equal to the annualized expense ratio for the six-month period as indicated above–in the far right column–multiplied by the simple average account value
over the period indicated, and then multiplied by 184/366 to reflect the one-half year period.
2. Reflects expenses after fee waivers and expense reimbursements. Does not include acquired fund fees and expenses.
26 Annual Report
franklintempleton.com
Franklin Real Return Fund
This annual report for Franklin Real Return Fund covers the fiscal year ended October 31, 2016.
Your Fund’s Goal and Main Investments
The Fund seeks to achieve total return that exceeds the rate of inflation over an economic cycle. The Fund will generally invest its assets in inflation-indexed securities structured to provide protection against inflation, as well as in investment-grade and high yield fixed income securities and short-term non-dollar-denominated debt securities to achieve the highest level of real return (total return less the rate of inflation) consistent with an acceptable level of risk.

*Percentages reflect certain derivatives held in the portfolio (or their underlying
reference assets) and may not total 100% or may be negative due to rounding, use
of derivatives, unsettled trades or other factors.
**In the SOI, the natural resources sector comprises energy and materials.
***Includes Senior Floating Rate Interests.
Performance Overview
For the 12 months under review, the Fund’s Class A shares had a +2.77% cumulative total return. In comparison, the Barclays U.S. TIPS Index, which tracks the universe of inflation-protected notes issued by the U.S. Treasury that have at least one year to final maturity, posted a +5.89% total return.1 Also for comparison, the Consumer Price Index for All Urban Consumers - Non-Seasonally Adjusted (CPI-NSA), a measure of the average change in prices of all goods and services purchased for consumption by urban householders, rose 1.64% for the same period.2 You can find more of the Fund’s performance data in the Performance Summary beginning on page 29.
Performance data represent past performance, which does not guarantee future results. Investment return and principal value will fluctuate, and you may have a gain or loss when you sell your shares. Current performance may differ from figures shown. For most recent month-end performance, go to franklintempleton.com or call (800) 342-5236.
Investment Strategy
Under normal market conditions, we will allocate the Fund’s assets among securities in various market sectors based on our assessment of changing economic, global market, industry and issuer conditions. When making our investment decisions, we use a “top-down” analysis of macroeconomic trends combined with a “bottom-up” fundamental analysis of market sectors, industries and issuers to try to take advantage of varying sector reactions to economic events. We will evaluate such criteria as country risk, business cycles, yield curves and values between and within markets.
What is the yield curve?
The yield curve is a line that plots the interest rates, at a set point in time, of bonds having equal credit quality but differing maturity dates. The most frequently reported yield curve compares three-month, two-year and 30-year U.S. Treasury debt.
Manager’s Discussion
U.S. economic indicators were generally encouraging during the reporting period. Steady growth in the services sector created new jobs and slightly boosted employment levels. Retail sales grew for most of the period. Low energy prices pulled inflation lower. In this environment, home sales and prices grew.
At period-end, slightly more than half of total net assets were invested in Treasury Inflation Protected Securities (TIPS). For
1. Source: Morningstar.
The indexes are unmanaged and include reinvestment of any income or distributions. They do not reflect any fees, expenses or sales charges. One cannot invest directly in an
index, and an index is not representative of the Fund’s portfolio.
2. Source: Bureau of Labor Statistics, bls.gov/cpi.
See www.franklintempletondatasources.com for additional data provider information.
The dollar value, number of shares or principal amount, and names of all portfolio holdings are listed in the Fund’s Statement of Investments (SOI).
The SOI begins on page 65.
franklintempleton.com
Annual Report
27
FRANKLIN REAL RETURN FUND
diversification, we also allocated the Fund’s assets to foreign government and agency securities, management investment companies, common stocks, corporate bonds, senior secured floating rate loans and short-term investments. We employed a non-U.S. dollar strategy to help hedge against potential U.S. dollar weakness versus certain currencies and concentrated our TIPS holdings in shorter maturities.
| | | | |
| Dividend Distributions* | | | |
| 11/1/15–10/31/16 | | | | |
| | Dividend per Share (cents) |
| | | | | Advisor |
| Month | Class A | Class C | Class R6 | Class |
| November** | — | — | — | — |
| December | 8.60 | 4.27 | 13.19 | 11.21 |
| January** | — | — | — | — |
| February** | — | — | — | — |
| March** | — | — | — | — |
| April** | — | — | — | — |
| May** | — | — | — | — |
| June** | — | — | — | — |
| July** | — | — | — | — |
| August** | — | — | — | — |
| September** | — | — | — | — |
| October** | — | — | — | — |
| Total | 8.60 | 4.27 | 13.19 | 11.21 |
*The distribution amount is the sum of the dividend payments to shareholders for
the period shown and includes only estimated tax-basis net investment income. All
Fund distributions will vary depending upon current market conditions, and past
distributions are not indicative of future trends.
**The Fund paid no dividends due to negative inflation adjustments for TIPS, which
are the Fund’s primary investments.
During the period, we increased the Fund’s allocations to TIPS, natural resources and loans. In contrast, we decreased the Fund’s allocation to foreign government debt securities and high yield corporate credit securities. The Fund’s heaviest allocations were in TIPS and foreign government debt securities.
The Fund’s investments in TIPS, foreign government bonds and high yield corporate bonds helped results. In contrast, the Fund’s foreign currency exposure hindered Fund performance.
Thank you for your continued participation in Franklin Real Return Fund. We look forward to serving your future investment needs.

The foregoing information reflects our analysis, opinions and portfolio holdings as of October 31, 2016, the end of the reporting period. The way we implement our main investment strategies and the resulting portfolio holdings may change depending on factors such as market and economic conditions. These opinions may not be relied upon as investment advice or an offer for a particular security. The information is not a complete analysis of every aspect of any market, country, industry, security or the Fund. Statements of fact are from sources considered reliable, but the investment manager makes no representation or warranty as to their completeness or accuracy. Although historical performance is no guarantee of future results, these insights may help you understand our investment management philosophy.
28 Annual Report
franklintempleton.com
FRANKLIN REAL RETURN FUND
Performance Summary as of October 31, 2016
The performance table and graphs do not reflect any taxes that a shareholder would pay on Fund dividends, capital gain distributions, if any, or any realized gains on the sale of Fund shares. Total return reflects reinvestment of the Fund’s dividends and capital gain distributions, if any, and any unrealized gains or losses.
Performance as of 10/31/161
Cumulative total return excludes sales charges. Average annual total returns include maximum sales charges. Sales charges will vary depending on the size of the investment and the class of share purchased. The maximum is 4.25% and the minimum is 0%. Class A: 4.25% maximum initial sales charge; Advisor Class: no sales charges. For other share classes, visit franklintempleton.com.
| | | | | | |
| | Cumulative | | Average Annual | | Average Annual | |
| Share Class | Total Return2 | | Total Return3 | | Total Return(9/30/16)4 | |
| A | | | | | | |
| 1-Year | +2.77 | % | -1.59 | % | +0.64 | % |
| 5-Year | -0.05 | % | -0.87 | % | +0.08 | % |
| 10-Year | +27.14 | % | +1.98 | % | +2.09 | % |
| Advisor | | | | | | |
| 1-Year | +3.04 | % | +3.04 | % | +5.35 | % |
| 5-Year | +1.21 | % | +0.24 | % | +1.21 | % |
| 10-Year | +30.34 | % | +2.69 | % | +2.79 | % |
| | | | | | |
| | Distribution | | 30-Day Standardized Yield6 | |
| Share Class | Rate5 | | (with waiver) | | (without waiver) | |
| |
| A | 0.00 | % | 1.81 | % | 1.61 | % |
| |
| Advisor | 0.00 | % | 2.15 | % | 1.93 | % |
Performance data represent past performance, which does not guarantee future results. Investment return and principal value will fluctuate, and you may have a gain or loss when you sell your shares. Current performance may differ from figures shown. For most recent month-end performance, go to franklintempleton.com or call (800) 342-5236.
See page 31 for Performance Summary footnotes.
franklintempleton.com
Annual Report
29
FRANKLIN REAL RETURN FUND
PERFORMANCE SUMMARY
Total Return Index Comparison for a Hypothetical $10,000 Investment1
Total return represents the change in value of an investment over the periods shown. It includes any applicable maximum sales charge, Fund expenses, account fees and reinvested distributions. The unmanaged indexes include reinvestment of any income or distributions. They differ from the Fund in composition and do not pay management fees or expenses. One cannot invest directly in an index.
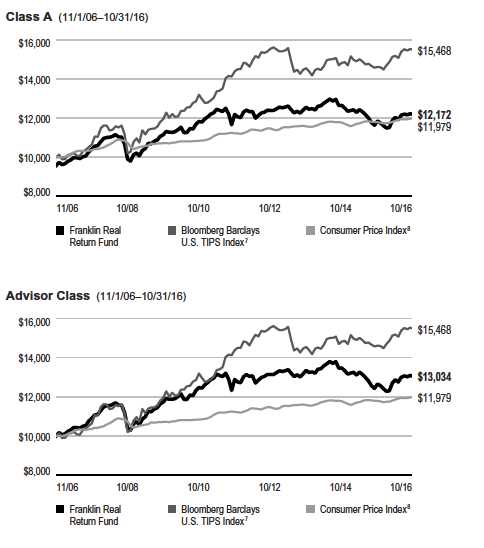
See page 31 for Performance Summary footnotes.
30 Annual Report
franklintempleton.com
| | | | | |
| | | | | | FRANKLIN REAL RETURN FUND |
| | | | | | PERFORMANCE SUMMARY |
| |
| Total Annual Operating Expenses9 | | | | |
| Share Class | With Waiver | | Without Waiver | | |
| A | 0.92 | % | 1.12 | % | |
| Advisor | 0.67 | % | 0.87 | % | |
Each class of shares is available to certain eligible investors and has different annual fees and expenses, as described in the prospectus.
All investments involve risks, including possible loss of principal. Interest rate movements will affect the Fund’s share price and yield. Bond prices generally
move in the opposite direction of interest rates. As prices of bonds in a Fund adjust to a rise in interest rates, the Fund’s share price may decline. Foreign
securities involve special risks, including currency fluctuations and economic and political uncertainties. Changes in the financial strength of a bond issuer or in
a bond’s credit rating may affect its value. Stock prices fluctuate, sometimes rapidly and dramatically, due to factors affecting individual companies, particular
industries or sectors, or general market conditions. The Fund is actively managed but there is no guarantee that the manager’s investment decisions will produce
the desired results. The Fund’s prospectus also includes a description of the main investment risks.
1. The Fund has an expense reduction contractually guaranteed through 2/28/17. Fund investment results reflect the expense reduction; without this reduction, the results
would have been lower.
2. Cumulative total return represents the change in value of an investment over the periods indicated.
3. Average annual total return represents the average annual change in value of an investment over the periods indicated. Return for less than one year, ifany,hasnotbeen
annualized.
4. In accordance with SEC rules, we provide standardized average annual total return information through the latest calendar quarter.
5. Distribution rate is based on an annualization of the respective class’s October dividend and the maximum offering price (NAV for Advisor Class) per share on 10/31/16.
6. The Fund’s 30-day standardized yield is calculated over a trailing 30-day period using the yield to maturity on bonds and/or the dividends accrued on stocks. It may not equal
the Fund’s actual income distribution rate, which reflects the Fund’s past dividends paid to shareholders.
7. Source: Morningstar. The Barclays U.S. TIPS Index comprises U.S. TIPS rated investment grade (Baa3/BBB- or better) with at least one year to final maturity and at least
$250 million par amount outstanding.
8. Source: Bureau of Labor Statistics, bls.gov/cpi. The Consumer Price Index (CPI), is a commonly used measure of the inflation rate.
9. Figures are as stated in the Fund’s current prospectus and may differ from the expense ratios disclosed in the Your Fund’s Expenses and Financial Highlights sections in this
report. In periods of market volatility, assets may decline significantly, causing total annual Fund operating expenses to become higher than the figures shown.
See www.franklintempletondatasources.com for additional data provider information.
franklintempleton.com
Annual Report
31
FRANKLIN REAL RETURN FUND
Your Fund’s Expenses
As a Fund shareholder, you can incur two types of costs: (1) transaction costs, including sales charges (loads) on Fund purchases and redemptions; and (2) ongoing Fund costs, including management fees, distribution and service (12b-1) fees, and other Fund expenses. All mutual funds have ongoing costs, sometimes referred to as operating expenses. The table below shows ongoing costs of investing in the Fund and can help you understand these costs and compare them with those of other mutual funds. The table assumes a $1,000 investment held for the six months indicated.
Actual Fund Expenses
The table below provides information about actual account values and actual expenses in the columns under the heading “Actual.” In these columns the Fund’s actual return, which includes the effect of Fund expenses, is used to calculate the “Ending Account Value” for each class of shares. You can estimate the expenses you paid during the period by following these steps (of course, your account value and expenses will differ from those in this illustration): Divide your account value by $1,000 (if your account had an $8,600 value, then $8,600 ÷ $1,000 = 8.6). Then multiply the result by the number in the row for your class of shares under the headings “Actual” and “Expenses Paid During Period” (if Actual Expenses Paid During Period were $7.50, then 8.6 x $7.50 = $64.50). In this illustration, the actual expenses paid this period are $64.50.
Hypothetical Example for Comparison with Other Funds
Under the heading “Hypothetical” in the table, information is provided about hypothetical account values and hypothetical expenses based on the Fund’s actual expense ratio and an assumed rate of return of 5% per year before expenses, which is not the Fund’s actual return. This information may not be used to estimate the actual ending account balance or expenses you paid for the period, but it can help you compare ongoing costs of investing in the Fund with those of other funds. To do so, compare this 5% hypothetical example for the class of shares you hold with the 5% hypothetical examples that appear in the shareholder reports of other funds.
Please note that expenses shown in the table are meant to highlight ongoing costs and do not reflect any transactional costs. Therefore, information under the heading “Hypothetical” is useful in comparing ongoing costs only, and will not help you compare total costs of owning different funds. In addition, if transactional costs were included, your total costs would have been higher.
| | | | | | | | | | | | |
| | | | | | | Actual | | Hypothetical | | |
| | | | | (actual return after expenses) | | (5% annual return before expenses) | | |
| | | | | | | Expenses | | | | Expenses | Net | |
| | | Beginning | | Ending | | Paid During | | Ending | | Paid During | Annualized | |
| Share | | Account | | Account | | Period | | Account | | Period | Expense | |
| Class | | Value 5/1/16 | | Value 10/31/16 | | 5/1/16–10/31/161,2 | | Value 10/31/16 | | 5/1/16–10/31/161,2 | Ratio2 | |
| A | $ | 1,000 | $ | 1,012.00 | $ | 4.55 | $ | 1,020.61 | $ | 4.57 | 0.90 | % |
| C | $ | 1,000 | $ | 1,010.10 | $ | 6.57 | $ | 1,018.60 | $ | 6.60 | 1.30 | % |
| R6 | $ | 1,000 | $ | 1,015.00 | $ | 2.63 | $ | 1,022.52 | $ | 2.64 | 0.52 | % |
| Advisor | $ | 1,000 | $ | 1,013.00 | $ | 3.29 | $ | 1,021.87 | $ | 3.30 | 0.65 | % |
1. Expenses are equal to the annualized expense ratio for the six-month period as indicated above–in the far right column–multiplied by the simple average account value
over the period indicated, and then multiplied by 184/366 to reflect the one-half year period.
2. Reflects expenses after fee waivers and expense reimbursements. Does not include acquired fund fees and expenses.
32 Annual Report
franklintempleton.com
| | | | | | | | | | | | | | | |
| | | FRANKLIN INVESTORS SECURITIES TRUST | |
| |
| |
| |
| Financial Highlights | | | | | | | | | | | | | | | |
| Franklin Balanced Fund | | | | | | | | | | | | | | | |
| | | | | | Year Ended October 31, | | | | |
| | | 2016 | | | 2015 | | | 2014 | | | 2013 | | | 2012 | |
| Class A | | | | | | | | | | | | | | | |
| Per share operating performance | | | | | | | | | | | | | | | |
| (for a share outstanding throughout the year) | | | | | | | | | | | | | | | |
| Net asset value, beginning of year | $ | 11.40 | | $ | 11.86 | | $ | 11.43 | | $ | 10.64 | | $ | 9.87 | |
| Income from investment operationsa: | | | | | | | | | | | | | | | |
| Net investment incomeb | | 0.30 | | | 0.30 | | | 0.31 | c | | 0.27 | | | 0.30 | |
| Net realized and unrealized gains (losses) | | 0.31 | | | (0.24 | ) | | 0.65 | | | 1.02 | | | 0.83 | |
| Total from investment operations | | 0.61 | | | 0.06 | | | 0.96 | | | 1.29 | | | 1.13 | |
| Less distributions from: | | | | | | | | | | | | | | | |
| Net investment income | | (0.36 | ) | | (0.36 | ) | | (0.36 | ) | | (0.36 | ) | | (0.36 | ) |
| Net realized gains | | (—)d | | | (0.16 | ) | | (0.17 | ) | | (0.14 | ) | | (—)d | |
| Total distributions | | (0.36 | ) | | (0.52 | ) | | (0.53 | ) | | (0.50 | ) | | (0.36 | ) |
| Net asset value, end of year. | $ | 11.65 | | $ | 11.40 | | $ | 11.86 | | $ | 11.43 | | $ | 10.64 | |
| |
| Total returne | | 5.54 | % | | 0.51 | % | | 8.66 | % | | 12.51 | % | | 11.70 | % |
| |
| Ratios to average net assets | | | | | | | | | | | | | | | |
| Expenses before waiver and payments by affiliates | | 1.02 | % | | 1.06 | % | | 1.09 | % | | 1.12 | % | | 1.15 | % |
| Expenses net of waiver and payments by affiliates | | 1.01 | %f | | 1.06 | %f,g | | 1.09 | %f,g | | 1.10 | %f | | 1.01 | % |
| Net investment income | | 2.62 | % | | 2.56 | % | | 2.64 | %c | | 2.51 | % | | 2.95 | % |
| |
| Supplemental data | | | | | | | | | | | | | | | |
| Net assets, end of year (000’s) | $ | 2,532,459 | | $ | 2,371,133 | | $ | 2,053,623 | | $ | 1,354,710 | | $ | 627,287 | |
| Portfolio turnover rate | | 46.03 | % | | 69.23 | % | | 40.54 | % | | 58.52 | % | | 58.59 | % |
aThe amount shown for a share outstanding throughout the period may not correlate with the Statement of Operations for the period due to the timing of sales and
repurchases of the Fund’s shares in relation to income earned and/or fluctuating fair value of the investments of the Fund.
bBased on average daily shares outstanding.
cNet investment income per share includes approximately $0.03 per share related to income received in the form of a special dividend in connection with certain Fund
holdings. Excluding this amount, the ratio of net investment income to average net assets would have been 2.39%.
dAmount rounds to less than $0.01 per share.
eTotal return does not reflect sales commissions or contingent deferred sales charges, if applicable.
fBenefit of expense reduction rounds to less than 0.01%.
gBenefit of waiver and payments by affiliates rounds to less than 0.01%.
franklintempleton.com
The accompanying notes are an integral part of these financial statements. | Annual Report 33
| | | | | | | | | | | | | | | |
| FRANKLIN INVESTORS SECURITIES TRUST | | | | | | | | | | | | | | | |
| FINANCIAL HIGHLIGHTS | | | | | | | | | | | | | | | |
| |
| |
| Franklin Balanced Fund (continued) | | | | | | | | | | | | | | | |
| | | | | | Year Ended October 31, | | | | |
| | | 2016 | | | 2015 | | | 2014 | | | 2013 | | | 2012 | |
| Class C | | | | | | | | | | | | | | | |
| Per share operating performance | | | | | | | | | | | | | | | |
| (for a share outstanding throughout the year) | | | | | | | | | | | | | | | |
| Net asset value, beginning of year | $ | 11.31 | | $ | 11.77 | | $ | 11.34 | | $ | 10.57 | | $ | 9.81 | |
| Income from investment operationsa: | | | | | | | | | | | | | | | |
| Net investment incomeb | | 0.21 | | | 0.21 | | | 0.23 | c | | 0.20 | | | 0.23 | |
| Net realized and unrealized gains (losses) | | 0.31 | | | (0.23 | ) | | 0.65 | | | 0.99 | | | 0.82 | |
| Total from investment operations | | 0.52 | | | (0.02 | ) | | 0.88 | | | 1.19 | | | 1.05 | |
| Less distributions from: | | | | | | | | | | | | | | | |
| Net investment income | | (0.28 | ) | | (0.28 | ) | | (0.28 | ) | | (0.28 | ) | | (0.29 | ) |
| Net realized gains | | (—)d | | | (0.16 | ) | | (0.17 | ) | | (0.14 | ) | | (—)d | |
| Total distributions | | (0.28 | ) | | (0.44 | ) | | (0.45 | ) | | (0.42 | ) | | (0.29 | ) |
| Net asset value, end of year. | $ | 11.55 | | $ | 11.31 | | $ | 11.77 | | $ | 11.34 | | $ | 10.57 | |
| |
| Total returne | | 4.73 | % | | (0.20 | )% | | 7.97 | % | | 11.62 | % | | 10.91 | % |
| |
| Ratios to average net assets | | | | | | | | | | | | | | | |
| Expenses before waiver and payments by affiliates | | 1.77 | % | | 1.77 | % | | 1.79 | % | | 1.82 | % | | 1.85 | % |
| Expenses net of waiver and payments by affiliates | | 1.76 | %f | | 1.77 | %f,g | | 1.79 | %f,g | | 1.80 | %f | | 1.71 | % |
| Net investment income | | 1.87 | % | | 1.85 | % | | 1.94 | %c | | 1.81 | % | | 2.25 | % |
| |
| Supplemental data | | | | | | | | | | | | | | | |
| Net assets, end of year (000’s) | $ | 630,110 | | $ | 563,419 | | $ | 492,514 | | $ | 354,359 | | $ | 187,991 | |
| Portfolio turnover rate | | 46.03 | % | | 69.23 | % | | 40.54 | % | | 58.52 | % | | 58.59 | % |
aThe amount shown for a share outstanding throughout the period may not correlate with the Statement of Operations for the period due to the timing of sales and
repurchases of the Fund’s shares in relation to income earned and/or fluctuating fair value of the investments of the Fund.
bBased on average daily shares outstanding.
cNet investment income per share includes approximately $0.03 per share related to income received in the form of a special dividend in connection with certain Fund
holdings. Excluding this amount, the ratio of net investment income to average net assets would have been 1.69%.
dAmount rounds to less than $0.01 per share.
eTotal return does not reflect sales commissions or contingent deferred sales charges, if applicable.
fBenefit of expense reduction rounds to less than 0.01%.
gBenefit of waiver and payments by affiliates rounds to less than 0.01%.
34 Annual Report | The accompanying notes are an integral part of these financial statements.
franklintempleton.com
| | | | | | | | | | | | | | | |
| | | FRANKLIN INVESTORS SECURITIES TRUST | |
| | | | | | | | | FINANCIAL HIGHLIGHTS | |
| |
| |
| Franklin Balanced Fund (continued) | | | | | | | | | | | | | | | |
| | | | | | Year Ended October 31, | | | | | | | |
| | | 2016 | | | 2015 | | | 2014 | | | 2013 | | | 2012 | |
| Class R | | | | | | | | | | | | | | | |
| Per share operating performance | | | | | | | | | | | | | | | |
| (for a share outstanding throughout the year) | | | | | | | | | | | | | | | |
| Net asset value, beginning of year | $ | 11.42 | | $ | 11.89 | | $ | 11.45 | | $ | 10.66 | | $ | 9.89 | |
| Income from investment operationsa: | | | | | | | | | | | | | | | |
| Net investment incomeb | | 0.27 | | | 0.27 | | | 0.29 | c | | 0.26 | | | 0.29 | |
| Net realized and unrealized gains (losses) | | 0.32 | | | (0.24 | ) | | 0.66 | | | 1.01 | | | 0.82 | |
| Total from investment operations | | 0.59 | | | 0.03 | | | 0.95 | | | 1.27 | | | 1.11 | |
| Less distributions from: | | | | | | | | | | | | | | | |
| Net investment income | | (0.34 | ) | | (0.34 | ) | | (0.34 | ) | | (0.34 | ) | | (0.34 | ) |
| Net realized gains | | (—)d | | | (0.16 | ) | | (0.17 | ) | | (0.14 | ) | | (—)d | |
| Total distributions | | (0.34 | ) | | (0.50 | ) | | (0.51 | ) | | (0.48 | ) | | (0.34 | ) |
| Net asset value, end of year. | $ | 11.67 | | $ | 11.42 | | $ | 11.89 | | $ | 11.45 | | $ | 10.66 | |
| |
| Total return | | 5.28 | % | | 0.21 | % | | 8.51 | % | | 12.26 | % | | 11.46 | % |
| |
| Ratios to average net assets | | | | | | | | | | | | | | | |
| Expenses before waiver and payments by affiliates | | 1.27 | % | | 1.27 | % | | 1.29 | % | | 1.32 | % | | 1.35 | % |
| Expenses net of waiver and payments by affiliates | | 1.26 | %e | | 1.27 | %e,f | | 1.29 | %e,f | | 1.30 | %e | | 1.21 | % |
| Net investment income | | 2.37 | % | | 2.35 | % | | 2.44 | %c | | 2.31 | % | | 2.75 | % |
| |
| Supplemental data | | | | | | | | | | | | | | | |
| Net assets, end of year (000’s) | $ | 4,482 | | $ | 4,699 | | $ | 3,598 | | $ | 3,253 | | $ | 2,378 | |
| Portfolio turnover rate | | 46.03 | % | | 69.23 | % | | 40.54 | % | | 58.52 | % | | 58.59 | % |
aThe amount shown for a share outstanding throughout the period may not correlate with the Statement of Operations for the period due to the timing of sales and
repurchases of the Fund’s shares in relation to income earned and/or fluctuating fair value of the investments of the Fund.
bBased on average daily shares outstanding.
cNet investment income per share includes approximately $0.03 per share related to income received in the form of a special dividend in connection with certain Fund
holdings. Excluding this amount, the ratio of net investment income to average net assets would have been 2.19%.
dAmount rounds to less than $0.01 per share.
eBenefit of expense reduction rounds to less than 0.01%.
fBenefit of waiver and payments by affiliates rounds to less than 0.01%.
franklintempleton.com
The accompanying notes are an integral part of these financial statements. | Annual Report 35
| | | | | | | | | | | | |
| FRANKLIN INVESTORS SECURITIES TRUST | | | | | | | | | | | | |
| FINANCIAL HIGHLIGHTS | | | | | | | | | | | | |
| |
| |
| Franklin Balanced Fund (continued) | | | | | | | | | | | | |
| | | | | | Year Ended October 31, | | | | |
| | | 2016 | | | 2015 | | | 2014 | | | 2013 | a |
| Class R6 | | | | | | | | | | | | |
| Per share operating performance | | | | | | | | | | | | |
| (for a share outstanding throughout the year) | | | | | | | | | | | | |
| Net asset value, beginning of year | $ | 11.42 | | $ | 11.89 | | $ | 11.45 | | $ | 11.08 | |
| Income from investment operationsb: | | | | | | | | | | | | |
| Net investment incomec | | 0.34 | | | 0.35 | | | 0.37 | d | | 0.19 | |
| Net realized and unrealized gains (losses) | | 0.31 | | | (0.25 | ) | | 0.65 | | | 0.38 | |
| Total from investment operations | | 0.65 | | | 0.10 | | | 1.02 | | | 0.57 | |
| Less distributions from: | | | | | | | | | | | | |
| Net investment income. | | (0.40 | ) | | (0.41 | ) | | (0.41 | ) | | (0.20 | ) |
| Net realized gains | | (—)e | | | (0.16 | ) | | (0.17 | ) | | — | |
| Total distributions | | (0.40 | ) | | (0.57 | ) | | (0.58 | ) | | (0.20 | ) |
| Net asset value, end of year | $ | 11.67 | | $ | 11.42 | | $ | 11.89 | | $ | 11.45 | |
| |
| Total returnf | | 5.90 | % | | 0.81 | % | | 9.29 | % | | 5.15 | % |
| |
| Ratios to average net assetsg | | | | | | | | | | | | |
| Expenses before waiver and payments by affiliates | | 0.73 | % | | 0.70 | % | | 0.68 | % | | 1.82 | % |
| Expenses net of waiver and payments by affiliatesh | | 0.66 | % | | 0.67 | % | | 0.68 | %i | | 0.70 | % |
| Net investment income | | 2.97 | % | | 2.95 | % | | 3.05 | %d | | 2.91 | % |
| |
| Supplemental data | | | | | | | | | | | | |
| Net assets, end of year (000’s) | $ | 233 | | $ | 221 | | $ | 513 | | $ | 5 | |
| Portfolio turnover rate | | 46.03 | % | | 69.23 | % | | 40.54 | % | | 58.52 | % |
aFor the period May 1, 2013 (effective date) to October 31, 2013.
bThe amount shown for a share outstanding throughout the period may not correlate with the Statement of Operations for the period due to the timing of sales and
repurchases of the Fund’s shares in relation to income earned and/or fluctuating fair value of the investments of the Fund.
cBased on average daily shares outstanding.
dNet investment income per share includes approximately $0.03 per share related to income received in the form of a special dividend in connection with certain Fund
holdings. Excluding this amount, the ratio of net investment income to average net assets would have been 2.80%.
eAmount rounds to less than $0.01 per share.
fTotal return is not annualized for periods less than one year.
gRatios are annualized for periods less than one year.
hBenefit of expense reduction rounds to less than 0.01%.
iBenefit of waiver and payments by affiliates rounds to less than 0.01%.
36 Annual Report | The accompanying notes are an integral part of these financial statements.
franklintempleton.com
| | | | | | | | | | | | | | | |
| | | FRANKLIN INVESTORS SECURITIES TRUST | |
| | | | | | | | | FINANCIAL HIGHLIGHTS | |
| |
| |
| Franklin Balanced Fund (continued) | | | | | | | | | | | | | | | |
| | | | | | Year Ended October 31, | | | | | | | |
| | | 2016 | | | 2015 | | | 2014 | | | 2013 | | | 2012 | |
| Advisor Class | | | | | | | | | | | | | | | |
| Per share operating performance | | | | | | | | | | | | | | | |
| (for a share outstanding throughout the year) | | | | | | | | | | | | | | | |
| Net asset value, beginning of year | $ | 11.42 | | $ | 11.88 | | $ | 11.45 | | $ | 10.66 | | $ | 9.89 | |
| Income from investment operationsa: | | | | | | | | | | | | | | | |
| Net investment incomeb | | 0.29 | | | 0.33 | | | 0.35 | c | | 0.30 | | | 0.34 | |
| Net realized and unrealized gains (losses) | | 0.35 | | | (0.24 | ) | | 0.65 | | | 1.02 | | | 0.82 | |
| Total from investment operations | | 0.64 | | | 0.09 | | | 1.00 | | | 1.32 | | | 1.16 | |
| Less distributions from: | | | | | | | | | | | | | | | |
| Net investment income | | (0.39 | ) | | (0.39 | ) | | (0.40 | ) | | (0.39 | ) | | (0.39 | ) |
| Net realized gains | | (—)d | | | (0.16 | ) | | (0.17 | ) | | (0.14 | ) | | (—)d | |
| Total distributions | | (0.39 | ) | | (0.55 | ) | | (0.57 | ) | | (0.53 | ) | | (0.39 | ) |
| Net asset value, end of year. | $ | 11.67 | | $ | 11.42 | | $ | 11.88 | | $ | 11.45 | | $ | 10.66 | |
| |
| Total return | | 5.79 | % | | 0.81 | % | | 8.97 | % | | 12.82 | % | | 12.01 | % |
| |
| Ratios to average net assets | | | | | | | | | | | | | | | |
| Expenses before waiver and payments by affiliates | | 0.77 | % | | 0.77 | % | | 0.79 | % | | 0.82 | % | | 0.85 | % |
| Expenses net of waiver and payments by affiliates | | 0.76 | %e | | 0.77 | %e,f | | 0.79 | %e,f | | 0.80 | %e | | 0.71 | % |
| Net investment income | | 2.87 | % | | 2.85 | % | | 2.94 | %c | | 2.81 | % | | 3.25 | % |
| |
| Supplemental data | | | | | | | | | | | | | | | |
| Net assets, end of year (000’s) | $ | 138,111 | | $ | 54,881 | | $ | 41,494 | | $ | 68,201 | | $ | 13,779 | |
| Portfolio turnover rate | | 46.03 | % | | 69.23 | % | | 40.54 | % | | 58.52 | % | | 58.59 | % |
aThe amount shown for a share outstanding throughout the period may not correlate with the Statement of Operations for the period due to the timing of sales and
repurchases of the Fund’s shares in relation to income earned and/or fluctuating fair value of the investments of the Fund.
bBased on average daily shares outstanding.
cNet investment income per share includes approximately $0.03 per share related to income received in the form of a special dividend in connection with certain Fund
holdings. Excluding this amount, the ratio of net investment income to average net assets would have been 2.69%.
dAmount rounds to less than $0.01 per share.
eBenefit of expense reduction rounds to less than 0.01%.
fBenefit of waiver and payments by affiliates rounds to less than 0.01%.
franklintempleton.com
The accompanying notes are an integral part of these financial statements. | Annual Report 37
| | | | |
| FRANKLIN INVESTORS SECURITIES TRUST | | | | |
| |
| |
| |
| |
| Statement of Investments, October 31, 2016 | | | | |
| Franklin Balanced Fund | | | | |
| | Country | Shares | | Value |
| |
| Common Stocks 49.3% | | | | |
| Consumer Discretionary 5.7% | | | | |
| Ford Motor Co | United States | 3,500,000 | $ | 41,090,000 |
| General Motors Co | United States | 1,000,000 | | 31,600,000 |
| Lowe’s Cos. Inc | United States | 600,000 | | 39,990,000 |
| a Nordstrom Inc | United States | 500,000 | | 26,000,000 |
| a Target Corp | United States | 750,000 | | 51,547,500 |
| | | | | 190,227,500 |
| Consumer Staples 6.7% | | | | |
| a Anheuser-Busch InBev SA/NV, ADR | Belgium | 200,000 | | 23,098,000 |
| The Coca-Cola Co | United States | 1,200,000 | | 50,880,000 |
| a Diageo PLC, ADR | United Kingdom | 197,800 | | 21,269,434 |
| Kimberly-Clark Corp | United States | 300,000 | | 34,323,000 |
| a Philip Morris International Inc | United States | 300,000 | | 28,932,000 |
| Reynolds American Inc | United States | 400,000 | | 22,032,000 |
| Walgreens Boots Alliance Inc | United States | 500,000 | | 41,365,000 |
| | | | | 221,899,434 |
| Energy 4.6% | | | | |
| Anadarko Petroleum Corp | United States | 200,000 | | 11,888,000 |
| a Chevron Corp | United States | 500,000 | | 52,375,000 |
| Occidental Petroleum Corp | United States | 400,000 | | 29,164,000 |
| Royal Dutch Shell PLC, A, ADR | United Kingdom | 719,264 | | 35,826,540 |
| Total SA, B, ADR | France | 500,000 | | 23,870,000 |
| | | | | 153,123,540 |
| Financials 8.8% | | | | |
| Bank of America Corp | United States | 1,496,715 | | 24,695,796 |
| a BlackRock Inc | United States | 100,000 | | 34,124,000 |
| a The Charles Schwab Corp | United States | 800,000 | | 25,360,000 |
| a JPMorgan Chase & Co | United States | 850,000 | | 58,871,000 |
| T. Rowe Price Group Inc | United States | 400,000 | | 25,604,000 |
| The Toronto-Dominion Bank | Canada | 750,000 | | 34,035,000 |
| U.S. Bancorp | United States | 750,000 | | 33,570,000 |
| Wells Fargo & Co | United States | 1,200,000 | | 55,212,000 |
| | | | | 291,471,796 |
| Health Care 4.7% | | | | |
| Amgen Inc | United States | 175,000 | | 24,703,000 |
| AstraZeneca PLC, ADR | United Kingdom | 985,000 | | 27,895,200 |
| Johnson & Johnson. | United States | 300,000 | | 34,797,000 |
| Pfizer Inc | United States | 1,250,000 | | 39,637,500 |
| Teva Pharmaceutical Industries Ltd., ADR | Israel | 687,400 | | 29,379,476 |
| | | | | 156,412,176 |
| Industrials 5.7% | | | | |
| General Dynamics Corp | United States | 100,000 | | 15,074,000 |
| General Electric Co | United States | 2,000,000 | | 58,200,000 |
| Northrop Grumman Corp | United States | 125,000 | | 28,625,000 |
| Raytheon Co | United States | 360,000 | | 49,179,600 |
| Republic Services Inc | United States | 700,000 | | 36,841,000 |
| | | | | 187,919,600 |
38 Annual Report
franklintempleton.com
FRANKLIN INVESTORS SECURITIES TRUST
STATEMENT OF INVESTMENTS
| | | | |
| Franklin Balanced Fund (continued) | | | | |
| | Country | Shares | | Value |
| |
| Common Stocks (continued) | | | | |
| Information Technology 6.5% | | | | |
| a Analog Devices Inc | United States | 600,000 | $ | 38,460,000 |
| Apple Inc | United States | 120,000 | | 13,624,800 |
| a Intel Corp | United States | 500,000 | | 17,435,000 |
| a Microsoft Corp | United States | 1,000,000 | | 59,920,000 |
| Oracle Corp | United States | 440,000 | | 16,904,800 |
| a QUALCOMM Inc | United States | 500,000 | | 34,360,000 |
| a Texas Instruments Inc | United States | 465,000 | | 32,945,250 |
| | | | | 213,649,850 |
| Materials 3.3% | | | | |
| BASF SE | Germany | 400,000 | | 35,256,519 |
| The Dow Chemical Co | United States | 800,000 | | 43,048,000 |
| The Mosaic Co | United States | 1,250,000 | | 29,412,500 |
| | | | | 107,717,019 |
| Real Estate 0.7% | | | | |
| Host Hotels & Resorts Inc | United States | 1,500,000 | | 23,220,000 |
| Telecommunication Services 2.0% | | | | |
| Rogers Communications Inc., B | Canada | 790,000 | | 31,781,700 |
| Verizon Communications Inc | United States | 700,000 | | 33,670,000 |
| | | | | 65,451,700 |
| Utilities 0.6% | | | | |
| Dominion Resources Inc | United States | 270,480 | | 20,340,096 |
| Total Common Stocks (Cost $1,526,468,732) | | | | 1,631,432,711 |
| |
| b Equity-Linked Securities 8.7% | | | | |
| Energy 2.3% | | | | |
| c Credit Suisse New York into Schlumberger Ltd., 7.50%, 144A | United States | 320,000 | | 24,822,784 |
| c Royal Bank of Canada into Anadarko Petroleum Corp., 7.50%, 144A | United States | 475,000 | | 26,875,880 |
| c Wells Fargo Bank National Assn. into Halliburton Co., 8.00%, 144A | United States | 550,000 | | 25,111,680 |
| | | | | 76,810,344 |
| Industrials 3.3% | | | | |
| c Merrill Lynch International & Co. CV into Union Pacific Corp., 5.75%, 144A | United States | 386,000 | | 34,059,984 |
| c Merrill Lynch International & Co. CV into United Technologies Corp., 5.00%, 144A | United States | 354,000 | | 36,172,605 |
| c Wells Fargo Bank National Assn. into The Boeing Co., 7.00%, 144A | United States | 275,000 | | 38,068,250 |
| | | | | 108,300,839 |
| Information Technology 3.1% | | | | |
| c Citigroup Inc. into Cisco Systems Inc., 7.50%, 144A | United States | 1,442,000 | | 42,504,248 |
| c JPMorgan Chase & Co. into Oracle Corp., 6.00%, 144A | United States | 865,000 | | 33,573,158 |
| c Royal Bank of Canada into Texas Instruments Inc., 6.00%, 144A | United States | 400,000 | | 26,589,640 |
| | | | | 102,667,046 |
| Total Equity-Linked Securities (Cost $276,081,600) | | | | 287,778,229 |
| |
| Convertible Preferred Stocks 4.4% | | | | |
| Energy 0.7% | | | | |
| Hess Corp., 8.00%, cvt. pfd | United States | 400,000 | | 23,660,000 |
| Health Care 0.8% | | | | |
| Allergan PLC, 5.50%, cvt. pfd | United States | 35,102 | | 26,993,438 |
| Real Estate 1.2% | | | | |
| American Tower Corp., 5.50%, cvt. pfd | United States | 350,000 | | 38,412,500 |
franklintempleton.com
Annual Report
39
FRANKLIN INVESTORS SECURITIES TRUST
STATEMENT OF INVESTMENTS
| | | | | |
| Franklin Balanced Fund (continued) | | | | | |
| | Country | | Shares | | Value |
| |
| Convertible Preferred Stocks (continued) | | | | | |
| Utilities 1.7% | | | | | |
| Dominion Resources Inc., 6.375%, cvt. pfd., A | United States | | 438,900 | $ | 22,045,947 |
| Great Plains Energy Inc., 7.00%, cvt. pfd | United States | | 324,000 | | 17,168,760 |
| NextEra Energy Inc., 6.371%, cvt. pfd | United States | | 260,000 | | 15,867,800 |
| | | | | | 55,082,507 |
| Total Convertible Preferred Stocks (Cost $140,522,483) | | | | | 144,148,445 |
| |
| Preferred Stocks 0.4% | | | | | |
| Financials 0.4% | | | | | |
| Morgan Stanley, 6.375%, pfd., I | United States | | 310,000 | | 8,556,000 |
| U.S. Bancorp, 6.00%, pfd., G | United States | | 180,000 | | 4,609,800 |
| Total Preferred Stocks (Cost $12,250,000) | | | | | 13,165,800 |
| |
| |
| | | | Principal | | |
| | | | Amount* | | |
| |
| Convertible Bonds (Cost $15,000,000) 0.5% | | | | | |
| Energy 0.5% | | | | | |
| Weatherford International Ltd., cvt., senior note, 5.875%, 7/01/21 | United States | $ | 15,000,000 | | 15,946,875 |
| Corporate Bonds 32.2% | | | | | |
| Consumer Discretionary 3.4% | | | | | |
| c Charter Communications Operating LLC/Capital, senior secured note, first lien, 144A, | | | | | |
| 4.908%, 7/23/25 | United States | | 20,000,000 | | 21,616,660 |
| DISH DBS Corp., | | | | | |
| 7.75%, 7/01/26 | United States | | 10,000,000 | | 11,006,300 |
| senior note, 5.875%, 7/15/22. | United States | | 12,000,000 | | 12,480,000 |
| Dollar General Corp., senior bond, 3.25%, 4/15/23 | United States | | 15,000,000 | | 15,363,165 |
| Ford Motor Credit Co. LLC, senior note, 2.551%, 10/05/18 | United States | | 5,000,000 | | 5,062,465 |
| c Sirius XM Radio Inc., senior bond, 144A, 5.375%, 4/15/25 | United States | | 15,000,000 | | 15,375,000 |
| Tiffany & Co., senior bond, 4.90%, 10/01/44. | United States | | 7,000,000 | | 6,867,644 |
| Trinity Acquisition PLC, senior note, 4.625%, 8/15/23 | United States | | 7,000,000 | | 7,336,991 |
| Yum! Brands Inc., senior bond, 3.875%, 11/01/23 | United States | | 17,950,000 | | 17,882,621 |
| | | | | | 112,990,846 |
| Consumer Staples 4.0% | | | | | |
| Anheuser-Busch InBev Finance Inc., senior bond, 4.90%, 2/01/46 | Belgium | | 15,000,000 | | 17,249,385 |
| CVS Health Corp., senior note, 3.875%, 7/20/25. | United States | | 10,000,000 | | 10,673,680 |
| Kraft Foods Group Inc., senior bond, 3.50%, 6/06/22. | United States | | 10,000,000 | | 10,573,540 |
| Kraft Heinz Foods Co., senior bond, 3.00%, 6/01/26 | United States | | 20,000,000 | | 19,849,660 |
| Mondelez International Inc., senior bond, 4.00%, 2/01/24 | United States | | 15,000,000 | | 16,669,260 |
| Reynolds American Inc., | | | | | |
| senior note, 2.30%, 8/21/17 | United States | | 6,100,000 | | 6,147,275 |
| senior note, 4.45%, 6/12/25 | United States | | 15,000,000 | | 16,500,585 |
| Tyson Foods Inc., senior bond, 3.95%, 8/15/24. | United States | | 12,100,000 | | 12,868,616 |
| Whole Foods Market Inc., senior note, 5.20%, 12/03/25. | United States | | 20,000,000 | | 21,579,820 |
| | | | | | 132,111,821 |
| Energy 3.3% | | | | | |
| Anadarko Petroleum Corp., senior note, 8.70%, 3/15/19 | United States | | 7,215,000 | | 8,274,220 |
| Antero Resources Corp., senior note, 5.625%, 6/01/23 | United States | | 10,000,000 | | 10,250,000 |
| Energy Transfer Partners LP, senior bond, 3.60%, 2/01/23 | United States | | 15,000,000 | | 14,981,385 |
| EOG Resources Inc., senior bond, 2.625%, 3/15/23 | United States | | 5,500,000 | | 5,492,960 |
| Ferrellgas LP/Ferrellgas Finance Corp., senior note, 6.75%, 6/15/23 | United States | | 18,800,000 | | 17,625,000 |
40 Annual Report
franklintempleton.com
FRANKLIN INVESTORS SECURITIES TRUST
STATEMENT OF INVESTMENTS
| | | | | |
| Franklin Balanced Fund (continued) | | | | | |
| | | | Principal | | |
| | Country | | Amount* | | Value |
| |
| Corporate Bonds (continued) | | | | | |
| Energy (continued) | | | | | |
| Oceaneering International Inc., senior note, 4.65%, 11/15/24 | United States | $ | 9,400,000 | $ | 9,550,842 |
| c Sabine Pass Liquefaction LLC, senior secured bond, 144A, 5.00%, 3/15/27 | United States | | 8,200,000 | | 8,364,000 |
| Weatherford International Ltd., | | | | | |
| senior bond, 5.95%, 4/15/42 | United States | | 4,000,000 | | 3,040,000 |
| senior note, 5.125%, 9/15/20. | United States | | 10,000,000 | | 9,550,000 |
| The Williams Cos. Inc., senior bond, 3.70%, 1/15/23 | United States | | 5,000,000 | | 4,862,500 |
| Williams Partners LP, senior note, 3.60%, 3/15/22 | United States | | 15,000,000 | | 15,287,805 |
| | | | | | 107,278,712 |
| Financials 8.5% | | | | | |
| d Bank of America Corp., | | | | | |
| junior sub. bond, AA, 6.10% to 3/17/25, FRN thereafter, Perpetual | United States | | 15,000,000 | | 15,690,150 |
| junior sub. bond, M, 8.125% to 5/15/18, FRN thereafter, Perpetual | United States | | 10,000,000 | | 10,300,000 |
| Capital One Bank USA NA, senior note, 2.30%, 6/05/19 | United States | | 10,000,000 | | 10,108,790 |
| e Capital One NA, FRN, 1.617%, 9/13/19 | United States | | 15,000,000 | | 15,029,130 |
| Citigroup Inc., | | | | | |
| d junior sub. bond, P, 5.95% to 5/15/25, FRN thereafter, Perpetual | United States | | 15,000,000 | | 15,356,250 |
| sub. bond, 4.125%, 7/25/28 | United States | | 10,000,000 | | 10,277,380 |
| Compass Bank, sub. note, 3.875%, 4/10/25 | United States | | 15,000,000 | | 14,631,540 |
| JPMorgan Chase & Co., | | | | | |
| d junior sub. bond, I, 7.90% to 4/30/19, FRN thereafter, Perpetual | United States | | 10,000,000 | | 10,320,000 |
| d junior sub. bond, V, 5.00% to 7/30/19, FRN thereafter, Perpetual | United States | | 13,000,000 | | 12,711,556 |
| senior note, 2.295%, 8/15/21. | United States | | 15,000,000 | | 15,021,525 |
| c Liberty Mutual Group Inc., senior note, 144A, 4.95%, 5/01/22 | United States | | 7,100,000 | | 7,969,345 |
| c Mizuho Bank Ltd., senior note, 144A, 2.45%, 4/16/19 | Japan | | 12,000,000 | | 12,154,572 |
| Morgan Stanley, | | | | | |
| d junior sub. bond, 5.55% to 7/15/20, FRN thereafter, Perpetual | United States | | 10,900,000 | | 11,172,500 |
| senior note, 2.50%, 4/21/21 | United States | | 15,000,000 | | 15,124,215 |
| senior sub. bond, 4.35%, 9/08/26. | United States | | 15,000,000 | | 15,964,290 |
| Navient Corp., senior note, 6.125%, 3/25/24. | United States | | 15,000,000 | | 13,800,000 |
| c Nippon Life Insurance Co., sub. bond, 144A, 5.10% to 10/16/24, FRN thereafter, | | | | | |
| 10/16/44. | Japan | | 15,000,000 | | 16,447,875 |
| d PNC Financial Services Group Inc., junior sub. note, 4.85% to 6/01/23, FRN | | | | | |
| thereafter, Perpetual | United States | | 12,000,000 | | 11,880,000 |
| Prudential Financial Inc., | | | | | |
| 3.50%, 5/15/24 | United States | | 10,000,000 | | 10,502,930 |
| junior sub. note, 5.875%, 9/15/42 | United States | | 5,000,000 | | 5,481,250 |
| Royal Bank of Scotland Group PLC, | | | | | |
| sub. note, 6.125%, 12/15/22 | United Kingdom | | 4,000,000 | | 4,230,740 |
| sub. note, 5.125%, 5/28/24 | United Kingdom | | 10,400,000 | | 10,312,432 |
| d Wells Fargo & Co., junior sub. bond, 5.875% to 6/15/25, FRN thereafter, Perpetual | United States | | 15,000,000 | | 16,110,930 |
| | | | | | 280,597,400 |
| Health Care 3.2% | | | | | |
| Actavis Funding SCS, senior bond, 4.75%, 3/15/45 | United States | | 12,000,000 | | 12,649,224 |
| c AMAG Pharmaceuticals Inc., senior note, 144A, 7.875%, 9/01/23 | United States | | 16,000,000 | | 15,080,000 |
| Baxalta Inc., senior note, 4.00%, 6/23/25 | United States | | 11,900,000 | | 12,482,505 |
| Biogen Inc., senior note, 3.625%, 9/15/22 | United States | | 10,000,000 | | 10,673,540 |
| Celgene Corp., senior bond, 4.00%, 8/15/23 | United States | | 10,000,000 | | 10,667,850 |
| CHS/Community Health Systems Inc., senior note, 8.00%, 11/15/19 | United States | | 10,000,000 | | 8,750,000 |
| Edwards Lifesciences Corp., senior note, 2.875%, 10/15/18 | United States | | 10,000,000 | | 10,229,450 |
| HCA Inc., senior secured note, first lien, 5.00%, 3/15/24 | United States | | 12,000,000 | | 12,570,000 |
franklintempleton.com
Annual Report
41
FRANKLIN INVESTORS SECURITIES TRUST
STATEMENT OF INVESTMENTS
| | | | | |
| Franklin Balanced Fund (continued) | | | | | |
| | | | Principal | | |
| | Country | | Amount* | | Value |
| |
| Corporate Bonds (continued) | | | | | |
| Health Care (continued) | | | | | |
| c Valeant Pharmaceuticals International Inc., | | | | | |
| senior bond, 144A, 6.125%, 4/15/25 | United States | $ | 6,300,000 | $ | 4,866,750 |
| senior note, 144A, 5.875%, 5/15/23 | United States | | 8,300,000 | | 6,432,500 |
| | | | | | 104,401,819 |
| Industrials 1.1% | | | | | |
| c Air Canada 2013-1A Pass Through Trust, first lien, 144A, 4.125%, 11/15/26 | Canada | | 6,165,349 | | 6,527,563 |
| d General Electric Co., junior sub. bond, 5.00% to 1/21/21, FRN thereafter, Perpetual | United States | | 9,876,000 | | 10,474,980 |
| Lockheed Martin Corp., senior bond, 3.55%, 1/15/26 | United States | | 15,000,000 | | 15,917,190 |
| United Rentals North America Inc., senior bond, 5.875%, 9/15/26. | United States | | 4,300,000 | | 4,401,480 |
| | | | | | 37,321,213 |
| Information Technology 1.9% | | | | | |
| c Diamond 1 Finance Corp./Diamond 2 Finance Corp., | | | | | |
| senior note, 144A, 5.875%, 6/15/21 | United States | | 2,700,000 | | 2,833,852 |
| senior note, 144A, 7.125%, 6/15/24 | United States | | 2,700,000 | | 2,960,596 |
| senior secured note, first lien, 144A, 4.42%, 6/15/21 | United States | | 18,000,000 | | 18,839,592 |
| c Microsemi Corp., senior note, 144A, 9.125%, 4/15/23 | United States | | 5,500,000 | | 6,366,250 |
| Oracle Corp., senior note, 2.50%, 10/15/22 | United States | | 10,000,000 | | 10,175,480 |
| c Western Digital Corp., senior secured note, 144A, 7.375%, 4/01/23 | United States | | 20,000,000 | | 21,950,000 |
| | | | | | 63,125,770 |
| Materials 0.9% | | | | | |
| Crown Americas LLC/Crown Americas Capital Corp. IV, senior bond, 4.50%, 1/15/23 . | United States | | 5,000,000 | | 5,150,000 |
| c FMG Resources (August 2006) Pty. Ltd., senior secured note, 144A, 9.75%, 3/01/22 . | Australia | | 12,500,000 | | 14,610,063 |
| Freeport-McMoRan Inc., senior bond, 3.875%, 3/15/23 | United States | | 7,000,000 | | 6,405,000 |
| Reliance Steel & Aluminum Co., senior note, 4.50%, 4/15/23 | United States | | 4,000,000 | | 4,108,064 |
| | | | | | 30,273,127 |
| Real Estate 2.1% | | | | | |
| HCP Inc., senior bond, 3.875%, 8/15/24 | United States | | 21,700,000 | | 22,318,493 |
| Healthcare Trust of America Holdings LP, senior note, 3.375%, 7/15/21 | United States | | 10,000,000 | | 10,312,750 |
| Prologis LP, senior note, 4.25%, 8/15/23 | United States | | 12,000,000 | | 13,184,352 |
| Realty Income Corp., senior bond, 3.875%, 7/15/24 | United States | | 15,000,000 | | 15,886,755 |
| Senior Housing Properties Trust, senior note, 6.75%, 12/15/21. | United States | | 7,000,000 | | 7,994,714 |
| | | | | | 69,697,064 |
| Telecommunication Services 1.4% | | | | | |
| AT&T Inc., senior note, 3.95%, 1/15/25 | United States | | 11,700,000 | | 12,138,516 |
| Sprint Corp., senior note, 7.625%, 2/15/25 | United States | | 10,000,000 | | 9,646,880 |
| Telefonica Emisiones SAU, senior note, 4.57%, 4/27/23. | Spain | | 10,000,000 | | 10,993,350 |
| Verizon Communications Inc., senior bond, 6.55%, 9/15/43 | United States | | 11,000,000 | | 14,478,222 |
| | | | | | 47,256,968 |
| Utilities 2.4% | | | | | |
| Alabama Power Co., senior note, 2.80%, 4/01/25 | United States | | 7,000,000 | | 7,172,781 |
| c,f Calpine Corp., senior secured bond, 144A, 5.25%, 6/01/26 | United States | | 15,000,000 | | 15,262,500 |
| c,d EDF SA, sub. note, 144A, 5.25% to 1/29/23, FRN thereafter, Perpetual | France | | 10,000,000 | | 9,944,250 |
| c Enogex LLC, senior note, 144A, 6.25%, 3/15/20 | United States | | 5,000,000 | | 5,402,790 |
| c InterGen NV, secured bond, 144A, 7.00%, 6/30/23 | Netherlands | | 10,000,000 | | 8,525,000 |
| Kinder Morgan Energy Partners LP, senior note, 4.30%, 5/01/24 | United States | | 12,900,000 | | 13,360,040 |
| PSEG Power LLC, senior note, 3.00%, 6/15/21. | United States | | 20,000,000 | | 20,485,580 |
| | | | | | 80,152,941 |
| Total Corporate Bonds (Cost $1,025,969,670) | | | | | 1,065,207,681 |
42 Annual Report
franklintempleton.com
FRANKLIN INVESTORS SECURITIES TRUST
STATEMENT OF INVESTMENTS
| | | | | |
| Franklin Balanced Fund (continued) | | | | | |
| | | Number of | | | |
| | | Contracts | | Value | |
| Options Purchased (Cost $12,854,000) 0.4% | | | | | |
| Puts - Exchange-Traded | | | | | |
| Financials 0.4% | | | | | |
| S&P 500 Index, November Strike Price $2150, Expires 11/18/16 | | 3,000 | $ | 12,900,000 | |
| Total Investments before Short Term Investments | | | | | |
| (Cost $3,009,146,485) | | | | 3,170,579,741 | |
| |
| |
| | Country | Shares | | | |
| Short Term Investments (Cost $120,863,963) 3.7% | | | | | |
| Money Market Funds 3.7% | | | | | |
| g,h Institutional Fiduciary Trust Money Market Portfolio | United States | 120,863,963 | | 120,863,963 | |
| Total Investments (Cost $3,130,010,448) 99.6%. | | | | 3,291,443,704 | |
| Options Written (0.1)% | | | | (3,151,230 | ) |
| Other Assets, less Liabilities 0.5% | | | | 17,102,444 | |
| Net Assets 100.0% | | | $ | 3,305,394,918 | |
| |
| |
| | | Number of | | | |
| | | Contracts | | | |
| i Options Written (0.1)% | | | | | |
| Calls - Exchange-Traded | | | | | |
| Consumer Discretionary (0.0)%† | | | | | |
| Nordstrom Inc., December Strike Price $60, Expires 12/16/16 | | 5,000 | | (300,000 | ) |
| Target Corp., December Strike Price $72.50, Expires 12/16/16 | | 4,000 | | (248,000 | ) |
| | | | | (548,000 | ) |
| Consumer Staples (0.0)%† | | | | | |
| Anheuser-Busch InBev SA/NV, December Strike Price $130, Expires 12/16/16. | | 2,000 | | (48,000 | ) |
| Diageo PLC, December Strike Price $115, Expires 12/16/16 | | 1,978 | | (69,230 | ) |
| Philip Morris International Inc., December Strike Price $100, Expires 12/16/16 | | 3,000 | | (210,000 | ) |
| | | | | (327,230 | ) |
| Energy (0.0)%† | | | | | |
| Chevron Corp., December Strike Price $105, Expires 12/16/16. | | 2,500 | | (575,000 | ) |
| Financials (0.0)%† | | | | | |
| BlackRock Inc., December Strike Price $360, Expires 12/16/16 | | 1,000 | | (240,000 | ) |
| The Charles Schwab Corp., December Strike Price $33, Expires 12/16/16. | | 4,000 | | (312,000 | ) |
| JPMorgan Chase & Co., December Strike Price $72.50, Expires 12/16/16 | | 4,000 | | (172,000 | ) |
| | | | | (724,000 | ) |
| Information Technology (0.1)% | | | | | |
| Analog Devices Inc., November Strike Price $65, Expires 11/18/16 | | 3,000 | | (312,000 | ) |
| Intel Corp., December Strike Price $37, Expires 12/16/16 | | 2,500 | | (40,000 | ) |
| Microsoft Corp., December Strike Price $62.50, Expires 12/16/16 | | 5,000 | | (195,000 | ) |
| QUALCOMM Inc., December Strike price $72.50, Expires 12/16/16 | | 2,500 | | (290,000 | ) |
| Texas Instruments Inc., December Strike Price $75, Expires 12/16/16 | | 4,000 | | (140,000 | ) |
| | | | | (977,000 | ) |
| Total Options Written (Premiums received $2,871,309) | | | $ | (3,151,230 | ) |
franklintempleton.com
Annual Report
43
FRANKLIN INVESTORS SECURITIES TRUST
STATEMENT OF INVESTMENTS
Franklin Balanced Fund (continued)
See Abbreviations on page 93.
†Rounds to less than 0.1% of net assets.
*The principal amount is stated in U.S. dollars unless otherwise indicated.
aA portion or all of the security is held in connection with written option contracts open at year end.
bSee Note 1(g) regarding equity-linked securities.
cSecurity was purchased pursuant to Rule 144A under the Securities Act of 1933 and may be sold in transactions exempt from registration only to qualified institutional buyers
or in a public offering registered under the Securities Act of 1933. These securities have been deemed liquid under guidelines approved by the Trust’s Board of Trustees. At
October 31, 2016, the aggregate value of these securities was $509,307,387, representing 15.4% of net assets.
dPerpetual security with no stated maturity date.
eThe coupon rate shown represents the rate at period end.
fAt October 31, 2016, pursuant to the Fund’s policies and the requirements of applicable securities law, the Fund is restricted from trading this security at year end.
gNon-income producing.
hSee Note 3(f) regarding investments in affiliated management investment companies.
iSee Note 1(e) regarding written options.
44 Annual Report | The accompanying notes are an integral part of these financial statements.
franklintempleton.com
| | | | | | | | | | | | | | | |
| | | | | | FRANKLIN INVESTORS SECURITIES TRUST | |
| |
| |
| |
| Financial Highlights | | | | | | | | | | | | | | | |
| Franklin Convertible Securities Fund | | | | | | | | | | | | | | | |
| | | | | | Year Ended October 31, | | | | |
| | | 2016 | | | 2015 | | | 2014 | | | 2013 | | | 2012 | |
| Class A | | | | | | | | | | | | | | | |
| Per share operating performance | | | | | | | | | | | | | | | |
| (for a share outstanding throughout the year) | | | | | | | | | | | | | | | |
| Net asset value, beginning of year | $ | 18.00 | | $ | 18.97 | | $ | 17.82 | | $ | 14.93 | | $ | 14.37 | |
| Income from investment operationsa: | | | | | | | | | | | | | | | |
| Net investment incomeb | | 0.25 | | | 0.24 | | | 0.23 | | | 0.37 | | | 0.41 | |
| Net realized and unrealized gains (losses) | | 0.85 | | | (0.14 | ) | | 1.32 | | | 2.99 | | | 0.67 | |
| Total from investment operations | | 1.10 | | | 0.10 | | | 1.55 | | | 3.36 | | | 1.08 | |
| Less distributions from: | | | | | | | | | | | | | | | |
| Net investment income | | (0.50 | ) | | (0.39 | ) | | (0.33 | ) | | (0.47 | ) | | (0.52 | ) |
| Net realized gains | | (0.36 | ) | | (0.68 | ) | | (0.07 | ) | | — | | | — | |
| Total distributions | | (0.86 | ) | | (1.07 | ) | | (0.40 | ) | | (0.47 | ) | | (0.52 | ) |
| Net asset value, end of year. | $ | 18.24 | | $ | 18.00 | | $ | 18.97 | | $ | 17.82 | | $ | 14.93 | |
| |
| Total returnc | | 6.41 | % | | 0.66 | % | | 8.85 | % | | 22.92 | % | | 7.66 | % |
| |
| Ratios to average net assets | | | | | | | | | | | | | | | |
| Expenses before waiver and payments by affiliates | | 0.86 | % | | 0.86 | % | | 0.88 | % | | 0.88 | % | | 0.90 | % |
| Expenses net of waiver and payments by affiliates | | 0.85 | %d | | 0.86 | %d,e | | 0.88 | %d,e | | 0.88 | %d | | 0.90 | % |
| Net investment income | | 1.44 | % | | 1.33 | % | | 1.23 | % | | 2.25 | % | | 2.84 | % |
| |
| Supplemental data | | | | | | | | | | | | | | | |
| Net assets, end of year (000’s) | $ | 768,553 | | $ | 818,082 | | $ | 921,134 | | $ | 844,498 | | $ | 602,804 | |
| Portfolio turnover rate | | 28.03 | % | | 17.30 | % | | 23.05 | % | | 34.69 | % | | 12.82 | % |
aThe amount shown for a share outstanding throughout the period may not correlate with the Statement of Operations for the period due to the timing of sales and
repurchases of the Fund’s shares in relation to income earned and/or fluctuating fair value of the investments of the Fund.
bBased on average daily shares outstanding.
cTotal return does not reflect sales commissions or contingent deferred sales charges, if applicable.
dBenefit of expense reduction rounds to less than 0.01%.
eBenefit of waiver and payments by affiliates rounds to less than 0.01%.
franklintempleton.com
The accompanying notes are an integral part of these financial statements. | Annual Report 45
| | | | | | | | | | | | | | | |
| FRANKLIN INVESTORS SECURITIES TRUST | | | | | | | | | | | | | | | |
| FINANCIAL HIGHLIGHTS | | | | | | | | | | | | | | | |
| |
| |
| Franklin Convertible Securities Fund (continued) | | | | | | | | | | | | | | | |
| | | | | | Year Ended October 31, | | | | |
| | | 2016 | | | 2015 | | | 2014 | | | 2013 | | | 2012 | |
| Class C | | | | | | | | | | | | | | | |
| Per share operating performance | | | | | | | | | | | | | | | |
| (for a share outstanding throughout the year) | | | | | | | | | | | | | | | |
| Net asset value, beginning of year | $ | 17.75 | | $ | 18.73 | | $ | 17.60 | | $ | 14.75 | | $ | 14.21 | |
| Income from investment operationsa: | | | | | | | | | | | | | | | |
| Net investment incomeb | | 0.12 | | | 0.11 | | | 0.09 | | | 0.24 | | | 0.30 | |
| Net realized and unrealized gains (losses) | | 0.84 | | | (0.16 | ) | | 1.31 | | | 2.97 | | | 0.65 | |
| Total from investment operations | | 0.96 | | | (0.05 | ) | | 1.40 | | | 3.21 | | | 0.95 | |
| Less distributions from: | | | | | | | | | | | | | | | |
| Net investment income | | (0.37 | ) | | (0.25 | ) | | (0.20 | ) | | (0.36 | ) | | (0.41 | ) |
| Net realized gains | | (0.36 | ) | | (0.68 | ) | | (0.07 | ) | | — | | | — | |
| Total distributions | | (0.73 | ) | | (0.93 | ) | | (0.27 | ) | | (0.36 | ) | | (0.41 | ) |
| Net asset value, end of year. | $ | 17.98 | | $ | 17.75 | | $ | 18.73 | | $ | 17.60 | | $ | 14.75 | |
| |
| Total returnc | | 5.65 | % | | (0.15 | )% | | 8.01 | % | | 22.11 | % | | 6.79 | % |
| |
| Ratios to average net assets | | | | | | | | | | | | | | | |
| Expenses before waiver and payments by affiliates | | 1.61 | % | | 1.61 | % | | 1.63 | % | | 1.63 | % | | 1.65 | % |
| Expenses net of waiver and payments by affiliates | | 1.60 | %d | | 1.61 | %d,e | | 1.63 | %d,e | | 1.63 | %d | | 1.65 | % |
| Net investment income | | 0.69 | % | | 0.58 | % | | 0.48 | % | | 1.50 | % | | 2.09 | % |
| |
| Supplemental data | | | | | | | | | | | | | | | |
| Net assets, end of year (000’s) | $ | 293,038 | | $ | 311,951 | | $ | 333,034 | | $ | 273,132 | | $ | 211,630 | |
| Portfolio turnover rate | | 28.03 | % | | 17.30 | % | | 23.05 | % | | 34.69 | % | | 12.82 | % |
aThe amount shown for a share outstanding throughout the period may not correlate with the Statement of Operations for the period due to the timing of sales and
repurchases of the Fund’s shares in relation to income earned and/or fluctuating fair value of the investments of the Fund.
bBased on average daily shares outstanding.
cTotal return does not reflect sales commissions or contingent deferred sales charges, if applicable.
dBenefit of expense reduction rounds to less than 0.01%.
eBenefit of waiver and payments by affiliates rounds to less than 0.01%.
46 Annual Report | The accompanying notes are an integral part of these financial statements.
franklintempleton.com
| | | | | | | | | |
| | | FRANKLIN INVESTORS SECURITIES TRUST | |
| | | FINANCIAL HIGHLIGHTS | |
| |
| |
| Franklin Convertible Securities Fund (continued) | | | | | | | | | |
| | | Year Ended October 31, | | | | |
| | | 2016 | | | 2015 | | | 2014 | a |
| Class R6 | | | | | | | | | |
| Per share operating performance | | | | | | | | | |
| (for a share outstanding throughout the year) | | | | | | | | | |
| Net asset value, beginning of year | $ | 18.09 | | $ | 18.99 | | $ | 19.21 | |
| Income from investment operationsb: | | | | | | | | | |
| Net investment incomec | | 0.33 | | | 0.30 | | | 0.19 | |
| Net realized and unrealized gains (losses) | | 0.84 | | | (0.14 | ) | | (0.17 | ) |
| Total from investment operations. | | 1.17 | | | 0.16 | | | 0.02 | |
| Less distributions from: | | | | | | | | | |
| Net investment income | | (0.57 | ) | | (0.38 | ) | | (0.24 | ) |
| Net realized gains | | (0.36 | ) | | (0.68 | ) | | — | |
| Total distributions | | (0.93 | ) | | (1.06 | ) | | (0.24 | ) |
| Net asset value, end of year | $ | 18.33 | | $ | 18.09 | | $ | 18.99 | |
| |
| Total returnd | | 6.78 | % | | 0.99 | % | | 0.11 | % |
| |
| Ratios to average net assetse | | | | | | | | | |
| Expenses before waiver and payments by affiliates | | 0.50 | % | | 0.50 | % | | 0.51 | % |
| Expenses net of waiver and payments by affiliatesf | | 0.49 | % | | 0.50 | %g | | 0.51 | %g |
| Net investment income. | | 1.80 | % | | 1.69 | % | | 1.60 | % |
| |
| Supplemental data | | | | | | | | | |
| Net assets, end of year (000’s) | $ | 7,154 | | $ | 5 | | $ | 3,093 | |
| Portfolio turnover rate | | 28.03 | % | | 17.30 | % | | 23.05 | % |
aFor the period March 4, 2014 (effective date) to October 31, 2014.
bThe amount shown for a share outstanding throughout the period may not correlate with the Statement of Operations for the period due to the timing of sales and
repurchases of the Fund’s shares in relation to income earned and/or fluctuating fair value of the investments of the Fund.
cBased on average daily shares outstanding.
dTotal return is not annualized for periods less than one year.
eRatios are annualized for periods less than one year.
fBenefit of expense reduction rounds to less than 0.01%.
gBenefit of waiver and payments by affiliates rounds to less than 0.01%.
franklintempleton.com
The accompanying notes are an integral part of these financial statements. | Annual Report 47
| | | | | | | | | | | | | | | |
| FRANKLIN INVESTORS SECURITIES TRUST | | | | | | | | | | | | | | | |
| FINANCIAL HIGHLIGHTS | | | | | | | | | | | | | | | |
| |
| |
| Franklin Convertible Securities Fund (continued) | | | | | | | | | | | | | | | |
| | | | | | Year Ended October 31, | | | | |
| | | 2016 | | | 2015 | | | 2014 | | | 2013 | | | 2012 | |
| Advisor Class | | | | | | | | | | | | | | | |
| Per share operating performance | | | | | | | | | | | | | | | |
| (for a share outstanding throughout the year) | | | | | | | | | | | | | | | |
| Net asset value, beginning of year | $ | 18.00 | | $ | 18.98 | | $ | 17.83 | | $ | 14.94 | | $ | 14.38 | |
| Income from investment operationsa: | | | | | | | | | | | | | | | |
| Net investment incomeb | | 0.30 | | | 0.29 | | | 0.28 | | | 0.41 | | | 0.45 | |
| Net realized and unrealized gains (losses) | | 0.85 | | | (0.15 | ) | | 1.32 | | | 2.99 | | | 0.66 | |
| Total from investment operations | | 1.15 | | | 0.14 | | | 1.60 | | | 3.40 | | | 1.11 | |
| Less distributions from: | | | | | | | | | | | | | | | |
| Net investment income | | (0.55 | ) | | (0.44 | ) | | (0.38 | ) | | (0.51 | ) | | (0.55 | ) |
| Net realized gains | | (0.36 | ) | | (0.68 | ) | | (0.07 | ) | | — | | | — | |
| Total distributions | | (0.91 | ) | | (1.12 | ) | | (0.45 | ) | | (0.51 | ) | | (0.55 | ) |
| Net asset value, end of year. | $ | 18.24 | | $ | 18.00 | | $ | 18.98 | | $ | 17.83 | | $ | 14.94 | |
| |
| Total return | | 6.68 | % | | 0.87 | % | | 9.13 | % | | 23.21 | % | | 7.93 | % |
| |
| Ratios to average net assets | | | | | | | | | | | | | | | |
| Expenses before waiver and payments by affiliates | | 0.61 | % | | 0.61 | % | | 0.63 | % | | 0.63 | % | | 0.65 | % |
| Expenses net of waiver and payments by affiliates | | 0.60 | %c | | 0.61 | %c,d | | 0.63 | %c,d | | 0.63 | %c | | 0.65 | % |
| Net investment income | | 1.69 | % | | 1.58 | % | | 1.48 | % | | 2.50 | % | | 3.09 | % |
| |
| Supplemental data | | | | | | | | | | | | | | | |
| Net assets, end of year (000’s) | $ | 1,080,346 | | $ | 899,441 | | $ | 877,190 | | $ | 387,528 | | $ | 196,765 | |
| Portfolio turnover rate | | 28.03 | % | | 17.30 | % | | 23.05 | % | | 34.69 | % | | 12.82 | % |
aThe amount shown for a share outstanding throughout the period may not correlate with the Statement of Operations for the period due to the timing of sales and
repurchases of the Fund’s shares in relation to income earned and/or fluctuating fair value of the investments of the Fund.
bBased on average daily shares outstanding.
cBenefit of expense reduction rounds to less than 0.01%.
dBenefit of waiver and payments by affiliates rounds to less than 0.01%.
48 Annual Report | The accompanying notes are an integral part of these financial statements.
franklintempleton.com
FRANKLIN INVESTORS SECURITIES TRUST
| | | | |
| Statement of Investments, October 31, 2016 | | | |
| Franklin Convertible Securities Fund | | | | |
| | Country | Shares | | Value |
| |
| Common Stocks 2.3% | | | | |
| Consumer Discretionary 0.9% | | | | |
| Newell Brands Inc | United States | 403,856 | $ | 19,393,165 |
| Utilities 1.4% | | | | |
| Dominion Resources Inc | United States | 410,049 | | 30,835,685 |
| Total Common Stocks (Cost $45,673,673) | | | | 50,228,850 |
| |
| Convertible Preferred Stocks 24.0% | | | | |
| Consumer Staples 4.3% | | | | |
| Post Holdings Inc., 2.50%, cvt. pfd | United States | 231,200 | | 33,596,250 |
| Post Holdings Inc., 5.25%, cvt. pfd | United States | 95,200 | | 12,811,540 |
| Tyson Foods Inc., 4.75%, cvt. pfd | United States | 600,000 | | 46,242,000 |
| | | | | 92,649,790 |
| Energy 1.2% | | | | |
| McDermott International Inc., 6.25%, cvt. pfd | United States | 960,000 | | 17,913,600 |
| a Sanchez Energy Corp., 6.50%, cvt. pfd., B. | United States | 236,000 | | 6,787,100 |
| | | | | 24,700,700 |
| Financials 1.1% | | | | |
| Wintrust Financial Corp., 5.00%, cvt. pfd | United States | 17,800 | | 24,312,575 |
| Health Care 3.1% | | | | |
| Allergan PLC, 5.50%, cvt. pfd | United States | 45,500 | | 34,989,500 |
| Teva Pharmaceutical Industries Ltd., 7.00%, cvt. pfd | Israel | 42,500 | | 32,215,000 |
| | | | | 67,204,500 |
| Industrials 4.4% | | | | |
| Arconic Inc., 5.375%, cvt. pfd | United States | 750,000 | | 23,175,000 |
| Stanley Black & Decker Inc., 6.25%, cvt. pfd | United States | 389,900 | | 45,649,492 |
| Stericycle Inc., 5.25%, cvt. pfd | United States | 380,000 | | 25,638,600 |
| | | | | 94,463,092 |
| Information Technology 2.2% | | | | |
| b Mandatory Exchangeable Trust, 5.75%, cvt. pfd., 144A | China | 375,000 | | 46,895,625 |
| Telecommunication Services 3.3% | | | | |
| Frontier Communications Corp., 11.125%, cvt. pfd | United States | 267,060 | | 22,302,181 |
| T-Mobile U.S. Inc., 5.50%, cvt. pfd | United States | 600,000 | | 49,590,000 |
| | | | | 71,892,181 |
| Utilities 4.4% | | | | |
| Black Hills Corp., 7.75%, cvt. pfd | United States | 606,000 | | 41,486,760 |
| Dominion Resources Inc., 6.375%, cvt. pfd., A | United States | 185,200 | | 9,302,596 |
| Exelon Corp., 6.50%, cvt. pfd | United States | 500,000 | | 23,850,000 |
| Great Plains Energy Inc., 7.00%, cvt. pfd | United States | 370,000 | | 19,606,300 |
| | | | | 94,245,656 |
| Total Convertible Preferred Stocks (Cost $499,158,223) | | | 516,364,119 |
franklintempleton.com
Annual Report
49
FRANKLIN INVESTORS SECURITIES TRUST
STATEMENT OF INVESTMENTS
| | | | | |
| Franklin Convertible Securities Fund (continued) | | | | | |
| | | | Principal | | |
| | Country | | Amount* | | Value |
| |
| Convertible Bonds 68.9% | | | | | |
| Consumer Discretionary 12.9% | | | | | |
| Ctrip.com International Ltd., | | | | | |
| cvt., senior note, 1.25%, 10/15/18 | China | $ | 19,200,000 | $ | 24,216,768 |
| b cvt., senior note, 144A, 1.25%, 9/15/22 | China | | 20,000,000 | | 19,750,000 |
| b Dish Network Corp., cvt., senior bond, 144A, 3.375%, 8/15/26 | United States | | 41,250,000 | | 47,463,281 |
| b GNC Holdings Inc., cvt., senior note, 144A, 1.50%, 8/15/20 | United States | | 5,000,000 | | 3,911,375 |
| b Liberty Interactive LLC, cvt., senior bond, 144A, 1.75%, 9/30/46 | United States | | 37,000,000 | | 37,244,940 |
| Liberty Media Corp., | | | | | |
| b cvt., senior bond, 144A, 2.25%, 9/30/46 | United States | | 39,000,000 | | 40,291,875 |
| cvt., senior note, 1.375%, 10/15/23 | United States | | 21,200,000 | | 21,796,250 |
| The Priceline Group Inc., cvt., senior note, 0.35%, 6/15/20 | United States | | 35,000,000 | | 45,018,750 |
| Shutterfly Inc., cvt., 0.25%, 5/15/18 | United States | | 37,465,000 | | 37,675,741 |
| | | | | | 277,368,980 |
| Energy 0.3% | | | | | |
| Cobalt International Energy Inc., cvt., senior bond, 3.125%, 5/15/24 | United States | | 20,000,000 | | 6,750,000 |
| Health Care 11.7% | | | | | |
| BioMarin Pharmaceutical Inc., cvt., senior sub. note, 1.50%, 10/15/20. | United States | | 28,200,000 | | 32,994,000 |
| Brookdale Senior Living Inc., cvt., senior note, 2.75%, 6/15/18 | United States | | 26,200,000 | | 25,594,125 |
| Depomed Inc., cvt., senior note, 2.50%, 9/01/21 | United States | | 16,000,000 | | 21,270,000 |
| Fluidigm Corp., cvt., senior bond, 2.75%, 2/01/34 | United States | | 14,418,000 | | 9,056,306 |
| Illumina Inc., cvt., senior note, 0.50%, 6/15/21 | United States | | 33,000,000 | | 33,144,375 |
| Impax Laboratories Inc., cvt., senior note, 2.00%, 6/15/22 | United States | | 45,000,000 | | 39,262,500 |
| Jazz Investments I Ltd., cvt., senior note, 1.875%, 8/15/21. | United States | | 35,000,000 | | 34,868,750 |
| b Novavax Inc., cvt., senior note, 144A, 3.75%, 2/01/23 | United States | | 34,000,000 | | 15,801,296 |
| b Nuvasive Inc., cvt., senior note, 144A, 2.25%, 3/15/21. | United States | | 12,000,000 | | 14,280,000 |
| Pacira Pharmaceuticals Inc., cvt., senior note, 3.25%, 2/01/19 | United States | | 5,880,000 | | 8,371,650 |
| Spectranetics Corp., cvt., senior note, 2.625%, 6/01/34 | United States | | 17,000,000 | | 16,723,750 |
| | | | | | 251,366,752 |
| Industrials 0.9% | | | | | |
| The KEYW Holding Corp., cvt., senior note, 2.50%, 7/15/19. | United States | | 20,000,000 | | 19,162,500 |
| Information Technology 39.4% | | | | | |
| b Blackhawk Network Holdings Inc., senior note, cvt., 144A, 1.50%, 1/15/22 | United States | | 42,700,000 | | 43,207,063 |
| Bottomline Technologies (de) Inc., cvt., senior note, 1.50%, 12/01/17 | United States | | 21,400,000 | | 21,814,625 |
| Electronics for Imaging Inc., cvt., senior note, 0.75%, 9/01/19 | United States | | 22,000,000 | | 23,320,000 |
| b Inphi Corp., cvt., senior note, 144A, 0.75%, 9/01/21 | United States | | 9,600,000 | | 9,594,000 |
| b Integrated Device Technology Inc., cvt., senior note, 144A, 0.875%, 11/15/22 | United States | | 4,700,000 | | 4,573,688 |
| Intel Corp., | | | | | |
| cvt., junior sub. bond, 3.25%, 8/01/39. | United States | | 8,000,000 | | 13,730,040 |
| b cvt., junior sub. bond, 144A, 2.95%, 12/15/35 | United States | | 19,000,000 | | 24,759,375 |
| cvt., junior sub. deb., 2.95%, 12/15/35 | United States | | 2,000,000 | | 2,606,250 |
| Mercadolibre Inc., cvt., 2.25%, 7/01/19 | Argentina | | 5,000,000 | | 7,265,625 |
| Microchip Technology Inc., cvt., senior sub. bond, 1.625%, 2/15/25. | United States | | 40,000,000 | | 49,850,000 |
| Micron Technology Inc., | | | | | |
| cvt., senior bond, 2.125%, 2/15/33. | United States | | 11,800,000 | | 20,244,375 |
| cvt., senior bond, G, 3.00%, 11/15/43 | United States | | 20,000,000 | | 17,737,500 |
| NetSuite Inc., cvt., senior note, 0.25%, 6/01/18. | United States | | 36,300,000 | | 38,160,375 |
| Novellus Systems Inc., cvt., senior note, 2.625%, 5/15/41 | United States | | 17,600,000 | | 50,193,000 |
| NXP Semiconductors NV, senior note, cvt., 1.00%, 12/01/19 | Netherlands | | 35,000,000 | | 40,337,500 |
| Palo Alto Networks Inc., cvt., zero cpn., 7/01/19 | United States | | 28,750,000 | | 42,675,781 |
50 Annual Report
franklintempleton.com
FRANKLIN INVESTORS SECURITIES TRUST
STATEMENT OF INVESTMENTS
| | | | | |
| Franklin Convertible Securities Fund (continued) | | | | | |
| | | | Principal | | |
| | Country | | Amount* | | Value |
| |
| Convertible Bonds (continued) | | | | | |
| Information Technology (continued) | | | | | |
| Proofpoint Inc., | | | | | |
| cvt., 0.75%, 6/15/20 | United States | $ | 12,500,000 | $ | 15,046,875 |
| cvt., senior note, 1.25%, 12/15/18 | United States | | 16,375,000 | | 33,138,906 |
| Red Hat Inc., cvt., senior note, 0.25%, 10/01/19 | United States | | 29,250,000 | | 36,361,406 |
| Salesforce.com Inc., cvt., senior note, 0.25%, 4/01/18 | United States | | 35,200,000 | | 43,406,000 |
| ServiceNow Inc., cvt., zero cpn., 11/01/18 | United States | | 35,500,000 | | 46,482,812 |
| Take-Two Interactive Software Inc., cvt., senior note, 1.00%, 7/01/18 | United States | | 16,400,000 | | 33,907,000 |
| Trulia Inc., cvt., 2.75%, 12/15/20 | United States | | 32,000,000 | | 47,720,000 |
| Twitter Inc., cvt., senior note, 1.00%, 9/15/21 | United States | | 35,000,000 | | 32,396,875 |
| VeriSign Inc., cvt., junior sub. bond, 3.25%, 8/15/37 | United States | | 11,000,000 | | 27,094,375 |
| Viavi Solutions Inc., cvt., senior bond, 0.625%, 8/15/33 | United States | | 39,900,000 | | 39,850,125 |
| Workday Inc., cvt., senior note, 1.50%, 7/15/20 | United States | | 9,166,500 | | 11,509,687 |
| Xilinx Inc., cvt., senior note, 2.625%, 6/15/17 | United States | | 19,270,000 | | 34,011,550 |
| Yahoo! Inc., cvt., zero cpn., 12/01/18 | United States | | 35,100,000 | | 35,692,313 |
| | | | | | 846,687,121 |
| Materials 2.0% | | | | | |
| B2Gold Corp., cvt., senior sub. note, 3.25%, 10/01/18 | Canada | | 13,900,000 | | 14,873,000 |
| Cemex SAB de CV, cvt., sub. note, 3.75%, 3/15/18 | Mexico | | 24,000,000 | | 28,035,000 |
| | | | | | 42,908,000 |
| Real Estate 1.7% | | | | | |
| Forest City Enterprises Inc., | | | | | |
| cvt., senior note, 4.25%, 8/15/18 | United States | | 17,110,000 | | 19,312,912 |
| cvt., senior note, A, 3.625%, 8/15/20 | United States | | 15,250,000 | | 16,155,469 |
| | | | | | 35,468,381 |
| Total Convertible Bonds (Cost $1,320,537,216) | | | | | 1,479,711,734 |
| |
| |
| | | | Shares | | |
| |
| Escrows and Litigation Trusts (Cost $22,362) 0.0% | | | | | |
| c,d Motors Liquidation Co., Escrow Account | United States | | 376,200 | | — |
| Total Investments before Short Term Investments | | | | | |
| (Cost $1,865,391,474) | | | | | 2,046,304,703 |
| |
| Short Term Investments (Cost $98,515,365) 4.6% | | | | | |
| Money Market Funds 4.6% | | | | | |
| c,e Institutional Fiduciary Trust Money Market Portfolio. | United States | | 98,515,365 | | 98,515,365 |
| Total Investments (Cost $1,963,906,839) 99.8% | | | | | 2,144,820,068 |
| Other Assets, less Liabilities 0.2% | | | | | 4,271,323 |
| Net Assets 100.0% | | | | $ | 2,149,091,391 |
franklintempleton.com
Annual Report
51
FRANKLIN INVESTORS SECURITIES TRUST
STATEMENT OF INVESTMENTS
Franklin Convertible Securities Fund (continued)
See Abbreviations on page 93.
*The principal amount is stated in U.S. dollars unless otherwise indicated.
aAt October 31, 2016, pursuant to the Fund’s policies and the requirements of applicable securities law, the Fund is restricted from trading this security at year end.
bSecurity was purchased pursuant to Rule 144A under the Securities Act of 1933 and may be sold in transactions exempt from registration only to qualified institutional buyers
or in a public offering registered under the Securities Act of 1933. These securities have been deemed liquid under guidelines approved by the Trust’s Board of Trustees. At
October 31, 2016, the aggregate value of these securities was $307,772,518, representing 14.3% of net assets.
cNon-income producing.
dSecurity has been deemed illiquid because it may not be able to be sold within seven days.
eSee Note 3(f) regarding investments in affiliated management investment companies.
52 Annual Report | The accompanying notes are an integral part of these financial statements.
franklintempleton.com
| | | | | | | | | | | | | | | |
| | | FRANKLIN INVESTORS SECURITIES TRUST | |
| |
| |
| |
| Financial Highlights | | | | | | | | | | | | | | | |
| Franklin Equity Income Fund | | | | | | | | | | | | | | | |
| | | | | | Year Ended October 31, | | | | |
| | | 2016 | | | 2015 | | | 2014 | | | 2013 | | | 2012 | |
| Class A | | | | | | | | | | | | | | | |
| Per share operating performance | | | | | | | | | | | | | | | |
| (for a share outstanding throughout the year) | | | | | | | | | | | | | | | |
| Net asset value, beginning of year | $ | 22.99 | | $ | 23.93 | | $ | 22.16 | | $ | 18.01 | | $ | 16.58 | |
| Income from investment operationsa: | | | | | | | | | | | | | | | |
| Net investment incomeb | | 0.47 | | | 0.55 | | | 0.66 | c | | 0.44 | | | 0.41 | |
| Net realized and unrealized gains (losses) | | 0.24 | | | 0.26 | | | 1.73 | | | 4.19 | | | 1.46 | |
| Total from investment operations | | 0.71 | | | 0.81 | | | 2.39 | | | 4.63 | | | 1.87 | |
| Less distributions from: | | | | | | | | | | | | | | | |
| Net investment income | | (0.60 | ) | | (0.69 | ) | | (0.50 | ) | | (0.48 | ) | | (0.44 | ) |
| Net realized gains | | (0.60 | ) | | (1.06 | ) | | (0.12 | ) | | — | | | — | |
| Total distributions | | (1.20 | ) | | (1.75 | ) | | (0.62 | ) | | (0.48 | ) | | (0.44 | ) |
| Net asset value, end of year. | $ | 22.50 | | $ | 22.99 | | $ | 23.93 | | $ | 22.16 | | $ | 18.01 | |
| |
| Total returnd | | 3.31 | % | | 3.72 | % | | 10.99 | % | | 26.07 | % | | 11.43 | % |
| |
| Ratios to average net assets | | | | | | | | | | | | | | | |
| Expenses | | 0.87 | %e,f | | 0.86 | %e,f | | 0.87 | %e,f | | 0.91 | %f | | 0.95 | % |
| Net investment income | | 2.13 | % | | 2.37 | % | | 2.87 | %c | | 2.19 | % | | 2.36 | % |
| |
| Supplemental data | | | | | | | | | | | | | | | |
| Net assets, end of year (000’s) | $ | 1,700,712 | | $ | 1,790,392 | | $ | 1,762,318 | | $ | 1,637,089 | | $ | 1,305,791 | |
| Portfolio turnover rate | | 50.05 | % | | 34.09 | % | | 20.15 | % | | 33.18 | % | | 19.71 | % |
aThe amount shown for a share outstanding throughout the period may not correlate with the Statement of Operations for the period due to the timing of sales and
repurchases of the Fund’s shares in relation to income earned and/or fluctuating fair value of the investments of the Fund.
bBased on average daily shares outstanding.
cNet investment income per share includes approximately $0.17 per share related to income received in the form of a special dividend in connection with certain Fund
holdings. Excluding this amount, the ratio of net investment income to average net assets would have been 2.15%.
dTotal return does not reflect sales commissions or contingent deferred sales charges, if applicable.
eBenefit of waiver and payments by affiliates rounds to less than 0.01%.
fBenefit of expense reduction rounds to less than 0.01%.
franklintempleton.com
The accompanying notes are an integral part of these financial statements. | Annual Report 53
| | | | | | | | | | | | | | | |
| FRANKLIN INVESTORS SECURITIES TRUST | | | | | | | | | | | | | | | |
| FINANCIAL HIGHLIGHTS | | | | | | | | | | | | | | | |
| |
| |
| Franklin Equity Income Fund (continued) | | | | | | | | | | | | | | | |
| | | | | | Year Ended October 31, | | | | |
| | | 2016 | | | 2015 | | | 2014 | | | 2013 | | | 2012 | |
| Class C | | | | | | | | | | | | | | | |
| Per share operating performance | | | | | | | | | | | | | | | |
| (for a share outstanding throughout the year) | | | | | | | | | | | | | | | |
| Net asset value, beginning of year | $ | 22.85 | | $ | 23.79 | | $ | 22.04 | | $ | 17.91 | | $ | 16.50 | |
| Income from investment operationsa: | | | | | | | | | | | | | | | |
| Net investment incomeb | | 0.30 | | | 0.37 | | | 0.49 | c | | 0.28 | | | 0.28 | |
| Net realized and unrealized gains (losses) | | 0.23 | | | 0.27 | | | 1.71 | | | 4.18 | | | 1.45 | |
| Total from investment operations | | 0.53 | | | 0.64 | | | 2.20 | | | 4.46 | | | 1.73 | |
| Less distributions from: | | | | | | | | | | | | | | | |
| Net investment income | | (0.46 | ) | | (0.52 | ) | | (0.33 | ) | | (0.33 | ) | | (0.32 | ) |
| Net realized gains | | (0.60 | ) | | (1.06 | ) | | (0.12 | ) | | — | | | — | |
| Total distributions | | (1.06 | ) | | (1.58 | ) | | (0.45 | ) | | (0.33 | ) | | (0.32 | ) |
| Net asset value, end of year. | $ | 22.32 | | $ | 22.85 | | $ | 23.79 | | $ | 22.04 | | $ | 17.91 | |
| |
| Total returnd | | 2.51 | % | | 2.96 | % | | 10.14 | % | | 25.18 | % | | 10.56 | % |
| |
| Ratios to average net assets | | | | | | | | | | | | | | | |
| Expenses | | 1.62 | %e,f | | 1.61 | %e,f | | 1.62 | %e,f | | 1.66 | %f | | 1.70 | % |
| Net investment income | | 1.38 | % | | 1.62 | % | | 2.12 | %c | | 1.44 | % | | 1.61 | % |
| |
| Supplemental data | | | | | | | | | | | | | | | |
| Net assets, end of year (000’s) | $ | 257,156 | | $ | 250,347 | | $ | 241,566 | | $ | 208,325 | | $ | 134,746 | |
| Portfolio turnover rate | | 50.05 | % | | 34.09 | % | | 20.15 | % | | 33.18 | % | | 19.71 | % |
aThe amount shown for a share outstanding throughout the period may not correlate with the Statement of Operations for the period due to the timing of sales and
repurchases of the Fund’s shares in relation to income earned and/or fluctuating fair value of the investments of the Fund.
bBased on average daily shares outstanding.
cNet investment income per share includes approximately $0.17 per share related to income received in the form of a special dividend in connection with certain Fund
holdings. Excluding this amount, the ratio of net investment income to average net assets would have been 1.40%.
dTotal return does not reflect sales commissions or contingent deferred sales charges, if applicable.
eBenefit of waiver and payments by affiliates rounds to less than 0.01%.
fBenefit of expense reduction rounds to less than 0.01%.
54 Annual Report | The accompanying notes are an integral part of these financial statements.
franklintempleton.com
| | | | | | | | | | | | | | | |
| | | FRANKLIN INVESTORS SECURITIES TRUST | |
| | | | | | | | | FINANCIAL HIGHLIGHTS | |
| |
| |
| Franklin Equity Income Fund (continued) | | | | | | | | | | | | | | | |
| | | | | | Year Ended October 31, | | | | | | | |
| | | 2016 | | | 2015 | | | 2014 | | | 2013 | | | 2012 | |
| Class R | | | | | | | | | | | | | | | |
| Per share operating performance | | | | | | | | | | | | | | | |
| (for a share outstanding throughout the year) | | | | | | | | | | | | | | | |
| Net asset value, beginning of year | $ | 22.99 | | $ | 23.93 | | $ | 22.17 | | $ | 18.01 | | $ | 16.58 | |
| Income from investment operationsa: | | | | | | | | | | | | | | | |
| Net investment incomeb | | 0.41 | | | 0.50 | | | 0.61 | c | | 0.39 | | | 0.37 | |
| Net realized and unrealized gains (losses) | | 0.24 | | | 0.25 | | | 1.72 | | | 4.20 | | | 1.46 | |
| Total from investment operations | | 0.65 | | | 0.75 | | | 2.33 | | | 4.59 | | | 1.83 | |
| Less distributions from: | | | | | | | | | | | | | | | |
| Net investment income | | (0.55 | ) | | (0.63 | ) | | (0.45 | ) | | (0.43 | ) | | (0.40 | ) |
| Net realized gains | | (0.60 | ) | | (1.06 | ) | | (0.12 | ) | | — | | | — | |
| Total distributions | | (1.15 | ) | | (1.69 | ) | | (0.57 | ) | | (0.43 | ) | | (0.40 | ) |
| Net asset value, end of year. | $ | 22.49 | | $ | 22.99 | | $ | 23.93 | | $ | 22.17 | | $ | 18.01 | |
| |
| Total return | | 3.05 | % | | 3.45 | % | | 10.67 | % | | 25.81 | % | | 11.16 | % |
| |
| Ratios to average net assets | | | | | | | | | | | | | | | |
| Expenses | | 1.11 | %d,e | | 1.11 | %d,e | | 1.12 | %d,e | | 1.16 | %e | | 1.20 | % |
| Net investment income | | 1.89 | % | | 2.12 | % | | 2.62 | %c | | 1.94 | % | | 2.11 | % |
| |
| Supplemental data | | | | | | | | | | | | | | | |
| Net assets, end of year (000’s) | $ | 6,395 | | $ | 6,265 | | $ | 7,305 | | $ | 5,844 | | $ | 4,940 | |
| Portfolio turnover rate | | 50.05 | % | | 34.09 | % | | 20.15 | % | | 33.18 | % | | 19.71 | % |
aThe amount shown for a share outstanding throughout the period may not correlate with the Statement of Operations for the period due to the timing of sales and
repurchases of the Fund’s shares in relation to income earned and/or fluctuating fair value of the investments of the Fund.
bBased on average daily shares outstanding.
cNet investment income per share includes approximately $0.17 per share related to income received in the form of a special dividend in connection with certain Fund
holdings. Excluding this amount, the ratio of net investment income to average net assets would have been 1.90%.
dBenefit of waiver and payments by affiliates rounds to less than 0.01%.
eBenefit of expense reduction rounds to less than 0.01%.
franklintempleton.com
The accompanying notes are an integral part of these financial statements. | Annual Report 55
| | | | | | | | | | | | |
| FRANKLIN INVESTORS SECURITIES TRUST | | | | | | | | | | | | |
| FINANCIAL HIGHLIGHTS | | | | | | | | | | | | |
| |
| |
| Franklin Equity Income Fund (continued) | | | | | | | | | | | | |
| | | | | | Year Ended October 31, | | | | |
| | | 2016 | | | 2015 | | | 2014 | | | 2013 | a |
| Class R6 | | | | | | | | | | | | |
| Per share operating performance | | | | | | | | | | | | |
| (for a share outstanding throughout the year) | | | | | | | | | | | | |
| Net asset value, beginning of year | $ | 23.01 | | $ | 23.95 | | $ | 22.18 | | $ | 20.00 | |
| Income from investment operationsb: | | | | | | | | | | | | |
| Net investment incomec | | 0.43 | | | 0.63 | | | 0.75 | d | | 0.26 | |
| Net realized and unrealized gains (losses) | | 0.37 | | | 0.27 | | | 1.73 | | | 2.18 | |
| Total from investment operations | | 0.80 | | | 0.90 | | | 2.48 | | | 2.44 | |
| Less distributions from: | | | | | | | | | | | | |
| Net investment income. | | (0.67 | ) | | (0.78 | ) | | (0.59 | ) | | (0.26 | ) |
| Net realized gains | | (0.60 | ) | | (1.06 | ) | | (0.12 | ) | | — | |
| Total distributions | | (1.27 | ) | | (1.84 | ) | | (0.71 | ) | | (0.26 | ) |
| Net asset value, end of year | $ | 22.54 | | $ | 23.01 | | $ | 23.95 | | $ | 22.18 | |
| |
| Total returne | | 3.72 | % | | 4.10 | % | | 11.38 | % | | 12.30 | % |
| |
| Ratios to average net assetsf | | | | | | | | | | | | |
| Expenses before waiver and payments by affiliates | | 0.49 | % | | 2.89 | % | | 1.78 | % | | 2.16 | % |
| Expenses net of waiver and payments by affiliatesg | | 0.49 | %h | | 0.48 | % | | 0.50 | % | | 0.51 | % |
| Net investment income | | 2.51 | % | | 2.75 | % | | 3.24 | %d | | 2.59 | % |
| |
| Supplemental data | | | | | | | | | | | | |
| Net assets, end of year (000’s) | $ | 10,537 | | $ | 6 | | $ | 6 | | $ | 6 | |
| Portfolio turnover rate | | 50.05 | % | | 34.09 | % | | 20.15 | % | | 33.18 | % |
aFor the period May 1, 2013 (effective date) to October 31, 2013.
bThe amount shown for a share outstanding throughout the period may not correlate with the Statement of Operations for the period due to the timing of sales and
repurchases of the Fund’s shares in relation to income earned and/or fluctuating fair value of the investments of the Fund.
cBased on average daily shares outstanding.
dNet investment income per share includes approximately $0.17 per share related to income received in the form of a special dividend in connection with certain Fund
holdings. Excluding this amount, the ratio of net investment income to average net assets would have been 2.51%.
eTotal return is not annualized for periods less than one year.
fRatios are annualized for periods less than one year.
gBenefit of expense reduction rounds to less than 0.01%.
hBenefit of waiver and payments by affiliates rounds to less than 0.01%.
56 Annual Report | The accompanying notes are an integral part of these financial statements.
franklintempleton.com
| | | | | | | | | | | | | | | |
| | | FRANKLIN INVESTORS SECURITIES TRUST | |
| | | | | | | | | FINANCIAL HIGHLIGHTS | |
| |
| |
| Franklin Equity Income Fund (continued) | | | | | | | | | | | | | | | |
| | | | | | Year Ended October 31, | | | | | | | |
| | | 2016 | | | 2015 | | | 2014 | | | 2013 | | | 2012 | |
| Advisor Class | | | | | | | | | | | | | | | |
| Per share operating performance | | | | | | | | | | | | | | | |
| (for a share outstanding throughout the year) | | | | | | | | | | | | | | | |
| Net asset value, beginning of year | $ | 23.02 | | $ | 23.96 | | $ | 22.19 | | $ | 18.02 | | $ | 16.59 | |
| Income from investment operationsa: | | | | | | | | | | | | | | | |
| Net investment incomeb | | 0.45 | | | 0.60 | | | 0.71 | c | | 0.48 | | | 0.45 | |
| Net realized and unrealized gains (losses) | | 0.31 | | | 0.27 | | | 1.74 | | | 4.22 | | | 1.46 | |
| Total from investment operations | | 0.76 | | | 0.87 | | | 2.45 | | | 4.70 | | | 1.91 | |
| Less distributions from: | | | | | | | | | | | | | | | |
| Net investment income | | (0.65 | ) | | (0.75 | ) | | (0.56 | ) | | (0.53 | ) | | (0.48 | ) |
| Net realized gains | | (0.60 | ) | | (1.06 | ) | | (0.12 | ) | | — | | | — | |
| Total distributions | | (1.25 | ) | | (1.81 | ) | | (0.68 | ) | | (0.53 | ) | | (0.48 | ) |
| Net asset value, end of year. | $ | 22.53 | | $ | 23.02 | | $ | 23.96 | | $ | 22.19 | | $ | 18.02 | |
| |
| Total return | | 3.53 | % | | 3.98 | % | | 11.25 | % | | 26.48 | % | | 11.69 | % |
| |
| Ratios to average net assets | | | | | | | | | | | | | | | |
| Expenses | | 0.62 | %d,e | | 0.61 | %d,e | | 0.62 | %d,e | | 0.66 | %e | | 0.70 | % |
| Net investment income | | 2.38 | % | | 2.62 | % | | 3.12 | %c | | 2.44 | % | | 2.61 | % |
| |
| Supplemental data | | | | | | | | | | | | | | | |
| Net assets, end of year (000’s) | $ | 80,422 | | $ | 34,577 | | $ | 30,166 | | $ | 17,534 | | $ | 10,527 | |
| Portfolio turnover rate | | 50.05 | % | | 34.09 | % | | 20.15 | % | | 33.18 | % | | 19.71 | % |
aThe amount shown for a share outstanding throughout the period may not correlate with the Statement of Operations for the period due to the timing of sales and
repurchases of the Fund’s shares in relation to income earned and/or fluctuating fair value of the investments of the Fund.
bBased on average daily shares outstanding.
cNet investment income per share includes approximately $0.17 per share related to income received in the form of a special dividend in connection with certain Fund
holdings. Excluding this amount, the ratio of net investment income to average net assets would have been 2.40%.
dBenefit of waiver and payments by affiliates rounds to less than 0.01%.
eBenefit of expense reduction rounds to less than 0.01%.
franklintempleton.com
The accompanying notes are an integral part of these financial statements. | Annual Report 57
| | | | |
| FRANKLIN INVESTORS SECURITIES TRUST | | | | |
| |
| |
| |
| |
| Statement of Investments, October 31, 2016 | | | | |
| Franklin Equity Income Fund | | | | |
| | Country | Shares | | Value |
| |
| Common Stocks 85.3% | | | | |
| Consumer Discretionary 6.3% | | | | |
| Ford Motor Co | United States | 1,456,700 | $ | 17,101,658 |
| Lowe’s Cos. Inc | United States | 440,000 | | 29,326,000 |
| Mattel Inc | United States | 675,000 | | 21,282,750 |
| Newell Brands Inc | United States | 460,000 | | 22,089,200 |
| Target Corp | United States | 582,900 | | 40,062,717 |
| | | | | 129,862,325 |
| Consumer Staples 10.2% | | | | |
| Anheuser-Busch InBev SA/NV, ADR | Belgium | 224,100 | | 25,881,309 |
| CVS Health Corp | United States | 406,000 | | 34,144,600 |
| Kimberly-Clark Corp | United States | 184,000 | | 21,051,440 |
| The Kraft Heinz Co | United States | 491,100 | | 43,683,345 |
| PepsiCo Inc | United States | 505,500 | | 54,189,600 |
| Reynolds American Inc | United States | 561,500 | | 30,927,420 |
| | | | | 209,877,714 |
| Energy 8.7% | | | | |
| Anadarko Petroleum Corp | United States | 193,200 | | 11,483,808 |
| BP PLC, ADR. | United Kingdom | 355,000 | | 12,620,250 |
| Chevron Corp | United States | 502,800 | | 52,668,300 |
| ConocoPhillips | United States | 310,000 | | 13,469,500 |
| Exxon Mobil Corp | United States | 367,234 | | 30,597,937 |
| Royal Dutch Shell PLC, A, ADR | United Kingdom | 243,900 | | 12,148,659 |
| Schlumberger Ltd | United States | 283,000 | | 22,139,090 |
| Suncor Energy Inc | Canada | 775,000 | | 23,265,500 |
| | | | | 178,393,044 |
| Financials 15.8% | | | | |
| Arthur J. Gallagher & Co | United States | 669,300 | | 32,280,339 |
| BB&T Corp | United States | 620,000 | | 24,304,000 |
| BlackRock Inc | United States | 118,000 | | 40,266,320 |
| JPMorgan Chase & Co | United States | 1,030,300 | | 71,358,578 |
| Morgan Stanley | United States | 956,000 | | 32,092,920 |
| T. Rowe Price Group Inc | United States | 350,500 | | 22,435,505 |
| U.S. Bancorp | United States | 1,076,800 | | 48,197,568 |
| Wells Fargo & Co | United States | 1,145,000 | | 52,681,450 |
| | | | | 323,616,680 |
| Health Care 7.2% | | | | |
| AstraZeneca PLC, ADR | United Kingdom | 650,000 | | 18,408,000 |
| Eli Lilly & Co | United States | 525,400 | | 38,795,536 |
| Johnson & Johnson | United States | 144,000 | | 16,702,560 |
| Medtronic PLC | United States | 493,000 | | 40,435,860 |
| Pfizer Inc | United States | 1,044,300 | | 33,114,753 |
| | | | | 147,456,709 |
| Industrials 14.7% | | | | |
| Deere & Co | United States | 217,500 | | 19,205,250 |
| General Electric Co | United States | 1,770,500 | | 51,521,550 |
| Illinois Tool Works Inc | United States | 302,700 | | 34,377,639 |
| Lockheed Martin Corp | United States | 166,100 | | 40,923,718 |
| Nielsen Holdings PLC | United States | 449,600 | | 20,240,992 |
| Raytheon Co | United States | 293,500 | | 40,095,035 |
| Republic Services Inc | United States | 643,500 | | 33,867,405 |
| United Parcel Service Inc., B | United States | 266,600 | | 28,728,816 |
58 Annual Report
franklintempleton.com
FRANKLIN INVESTORS SECURITIES TRUST
STATEMENT OF INVESTMENTS
| | | | |
| Franklin Equity Income Fund (continued) | | | | |
| | Country | Shares | | Value |
| |
| Common Stocks (continued) | | | | |
| Industrials (continued) | | | | |
| United Technologies Corp | United States | 329,700 | $ | 33,695,340 |
| | | | | 302,655,745 |
| Information Technology 13.1% | | | | |
| Apple Inc | United States | 340,500 | | 38,660,370 |
| Broadcom Ltd | Singapore | 42,000 | | 7,151,760 |
| Cisco Systems Inc | United States | 1,590,333 | | 48,791,416 |
| Intel Corp | United States | 586,518 | | 20,451,883 |
| Microsoft Corp | United States | 1,348,100 | | 80,778,152 |
| Oracle Corp | United States | 838,000 | | 32,195,960 |
| Texas Instruments Inc | United States | 583,000 | | 41,305,550 |
| | | | | 269,335,091 |
| Materials 3.7% | | | | |
| BASF SE | Germany | 336,500 | | 29,659,546 |
| The Dow Chemical Co | United States | 305,400 | | 16,433,574 |
| International Paper Co | United States | 682,600 | | 30,737,478 |
| | | | | 76,830,598 |
| Real Estate 1.1% | | | | |
| Host Hotels & Resorts Inc | United States | 1,483,000 | | 22,956,840 |
| Telecommunication Services 1.6% | | | | |
| Rogers Communications Inc., B | Canada | 362,700 | | 14,591,421 |
| Verizon Communications Inc | United States | 388,000 | | 18,662,800 |
| | | | | 33,254,221 |
| Utilities 2.9% | | | | |
| Dominion Resources Inc | United States | 421,100 | | 31,666,720 |
| Xcel Energy Inc | United States | 673,500 | | 27,983,925 |
| | | | | 59,650,645 |
| Total Common Stocks (Cost $1,398,427,171) | | | | 1,753,889,612 |
| |
| a Equity-Linked Securities 6.8% | | | | |
| Energy 1.5% | | | | |
| b JPMorgan Chase & Co. into Anadarko Petroleum Corp., 9.00%, 144A | United States | 272,000 | | 15,562,779 |
| b JPMorgan Chase & Co. into Schlumberger Ltd., 7.00%, 144A | United States | 205,000 | | 16,032,312 |
| | | | | 31,595,091 |
| Financials 1.5% | | | | |
| b The Goldman Sachs Group Inc. into The Charles Schwab Corp., 7.00%, 144A | United States | 1,000,000 | | 31,205,400 |
| Health Care 1.0% | | | | |
| b Merrill Lynch International & Co. CV into Gilead Sciences Inc., 7.25%, 144A | United States | 284,000 | | 21,140,250 |
| Information Technology 2.8% | | | | |
| b Barclays Bank PLC into Broadcom Ltd., 9.00%, 144A | Singapore | 160,000 | | 26,034,400 |
| b UBS AG into Intel Corp., 7.00%, 144A | United States | 845,000 | | 30,231,650 |
| | | | | 56,266,050 |
| Total Equity-Linked Securities (Cost $135,957,020) | | | | 140,206,791 |
franklintempleton.com
Annual Report
59
FRANKLIN INVESTORS SECURITIES TRUST
STATEMENT OF INVESTMENTS
| | | | |
| Franklin Equity Income Fund (continued) | | | | |
| | Country | Shares | | Value |
| Convertible Preferred Stocks 5.1% | | | | |
| Health Care 1.8% | | | | |
| Allergan PLC, 5.50%, cvt. pfd | United States | 41,700 | $ | 32,067,300 |
| Teva Pharmaceutical Industries Ltd., 7.00%, cvt. pfd | Israel | 5,900 | | 4,472,200 |
| | | | | 36,539,500 |
| Industrials 1.6% | | | | |
| Stanley Black & Decker Inc., 6.25%, cvt. pfd | United States | 279,000 | | 32,665,320 |
| Utilities 1.7% | | | | |
| NextEra Energy Inc., 6.371%, cvt. pfd | United States | 575,000 | | 35,092,250 |
| Total Convertible Preferred Stocks (Cost $105,915,193) | | | | 104,297,070 |
| Total Investments before Short Term Investments | | | | |
| (Cost $1,640,299,384) | | | | 1,998,393,473 |
| |
| Short Term Investments (Cost $50,191,472) 2.5% | | | | |
| Money Market Funds 2.5% | | | | |
| c,d Institutional Fiduciary Trust Money Market Portfolio. | United States | 50,191,472 | | 50,191,472 |
| Total Investments (Cost $1,690,490,856) 99.7% | | | | 2,048,584,945 |
| Other Assets, less Liabilities 0.3% | | | | 6,636,216 |
| Net Assets 100.0% | | | $ | 2,055,221,161 |
See Abbreviations on page 93.
aSee Note 1(g) regarding equity-linked securities.
bSecurity was purchased pursuant to Rule 144A under the Securities Act of 1933 and may be sold in transactions exempt from registration only to qualified institutional buyers
or in a public offering registered under the Securities Act of 1933. These securities have been deemed liquid under guidelines approved by the Trust’s Board of Trustees. At
October 31, 2016, the aggregate value of these securities was $140,206,791, representing 6.8% of net assets.
cNon-income producing.
dSee Note 3(f) regarding investments in affiliated management investment companies.
60 Annual Report | The accompanying notes are an integral part of these financial statements.
franklintempleton.com
| | | | | | | | | | | | | | | |
| | | | | | FRANKLIN INVESTORS SECURITIES TRUST | |
| |
| |
| |
| Financial Highlights | | | | | | | | | | | | | | | |
| Franklin Real Return Fund | | | | | | | | | | | | | | | |
| | | | | | Year Ended October 31, | | | | |
| | | 2016 | | | 2015 | | | 2014 | | | 2013 | | | 2012 | |
| Class A | | | | | | | | | | | | | | | |
| Per share operating performance | | | | | | | | | | | | | | | |
| (for a share outstanding throughout the year) | | | | | | | | | | | | | | | |
| Net asset value, beginning of year | $ | 9.92 | | $ | 10.66 | | $ | 10.82 | | $ | 10.94 | | $ | 11.06 | |
| Income from investment operationsa: | | | | | | | | | | | | | | | |
| Net investment incomeb | | 0.12 | | | 0.05 | | | 0.14 | | | 0.15 | | | 0.17 | |
| Net realized and unrealized gains (losses) | | 0.15 | | | (0.72 | ) | | (0.06 | ) | | (0.01 | ) | | 0.01 | |
| Total from investment operations | | 0.27 | | | (0.67 | ) | | 0.08 | | | 0.14 | | | 0.18 | |
| Less distributions from: | | | | | | | | | | | | | | | |
| Net investment income and net foreign currency gains | | (0.09 | ) | | (0.07 | ) | | (0.24 | ) | | (0.26 | ) | | (0.30 | ) |
| Tax return of capital. | | (0.01 | ) | | — | | | — | | | — | | | — | |
| Total distributions | | (0.10 | ) | | (0.07 | ) | | (0.24 | ) | | (0.26 | ) | | (0.30 | ) |
| Net asset value, end of year. | $ | 10.09 | | $ | 9.92 | | $ | 10.66 | | $ | 10.82 | | $ | 10.94 | |
| |
| Total returnc | | 2.77 | % | | (6.32 | )% | | 0.75 | % | | 1.34 | % | | 1.67 | % |
| |
| Ratios to average net assets | | | | | | | | | | | | | | | |
| Expenses before waiver and payments by affiliates | | 1.12 | % | | 1.10 | % | | 1.10 | % | | 1.08 | % | | 1.06 | % |
| Expenses net of waiver and payments by affiliates | | 0.90 | %d | | 0.90 | %d | | 0.90 | %d | | 0.90 | %d | | 0.90 | % |
| Net investment income | | 1.18 | % | | 0.43 | % | | 1.34 | % | | 1.35 | % | | 1.58 | % |
| |
| Supplemental data | | | | | | | | | | | | | | | |
| Net assets, end of year (000’s) | $ | 161,541 | | $ | 185,743 | | $ | 248,313 | | $ | 327,285 | | $ | 411,419 | |
| Portfolio turnover rate | | 31.82 | % | | 26.57 | % | | 33.02 | % | | 27.91 | % | | 18.64 | % |
aThe amount shown for a share outstanding throughout the period may not correlate with the Statement of Operations for the period due to the timing of sales and
repurchases of the Fund’s shares in relation to income earned, adjustments to interest income for the inflation-indexed bonds, and/or fluctuating fair value of the investments
of the Fund.
bBased on average daily shares outstanding.
cTotal return does not reflect sales commissions or contingent deferred sales charges, if applicable.
dBenefit of expense reduction rounds to less than 0.01%.
franklintempleton.com
The accompanying notes are an integral part of these financial statements. | Annual Report 61
| | | | | | | | | | | | | | | |
| FRANKLIN INVESTORS SECURITIES TRUST | | | | | | | | | | | | | | | |
| FINANCIAL HIGHLIGHTS | | | | | | | | | | | | | | | |
| |
| |
| Franklin Real Return Fund (continued) | | | | | | | | | | | | | | | |
| | | | | | Year Ended October 31, | | | | | | | |
| | | 2016 | | | 2015 | | | 2014 | | | 2013 | | | 2012 | |
| Class C | | | | | | | | | | | | | | | |
| Per share operating performance | | | | | | | | | | | | | | | |
| (for a share outstanding throughout the year) | | | | | | | | | | | | | | | |
| Net asset value, beginning of year | $ | 9.82 | | $ | 10.59 | | $ | 10.76 | | $ | 10.87 | | $ | 11.00 | |
| Income from investment operationsa: | | | | | | | | | | | | | | | |
| Net investment incomeb | | 0.08 | | | —c | | | 0.10 | | | 0.10 | | | 0.13 | |
| Net realized and unrealized gains (losses) | | 0.16 | | | (0.71 | ) | | (0.07 | ) | | 0.01 | | | —c | |
| Total from investment operations | | 0.24 | | | (0.71 | ) | | 0.03 | | | 0.11 | | | 0.13 | |
| Less distributions from: | | | | | | | | | | | | | | | |
| Net investment income and net foreign currency gains | | (0.05 | ) | | (0.06 | ) | | (0.20 | ) | | (0.22 | ) | | (0.26 | ) |
| Tax return of capital. | | (0.01 | ) | | — | | | — | | | — | | | — | |
| Total distributions | | (0.06 | ) | | (0.06 | ) | | (0.20 | ) | | (0.22 | ) | | (0.26 | ) |
| Net asset value, end of year. | $ | 10.00 | | $ | 9.82 | | $ | 10.59 | | $ | 10.76 | | $ | 10.87 | |
| |
| Total returnd | | 2.44 | % | | (6.70 | )% | | 0.22 | % | | 1.03 | % | | 1.22 | % |
| |
| Ratios to average net assets | | | | | | | | | | | | | | | |
| Expenses before waiver and payments by affiliates | | 1.52 | % | | 1.50 | % | | 1.50 | % | | 1.48 | % | | 1.46 | % |
| Expenses net of waiver and payments by affiliates | | 1.30 | %e | | 1.30 | %e | | 1.30 | %e | | 1.30 | %e | | 1.30 | % |
| Net investment income | | 0.78 | % | | 0.04 | % | | 0.94 | % | | 0.95 | % | | 1.18 | % |
| |
| Supplemental data | | | | | | | | | | | | | | | |
| Net assets, end of year (000’s) | $ | 39,568 | | $ | 48,084 | | $ | 68,188 | | $ | 83,666 | | $ | 104,682 | |
| Portfolio turnover rate | | 31.82 | % | | 26.57 | % | | 33.02 | % | | 27.91 | % | | 18.64 | % |
aThe amount shown for a share outstanding throughout the period may not correlate with the Statement of Operations for the period due to the timing of sales and
repurchases of the Fund’s shares in relation to income earned, adjustments to interest income for the inflation-indexed bonds, and/or fluctuating fair value of the investments
of the Fund.
bBased on average daily shares outstanding.
cAmount rounds to less than $0.01 per share.
dTotal return does not reflect sales commissions or contingent deferred sales charges, if applicable.
eBenefit of expense reduction rounds to less than 0.01%.
62 Annual Report | The accompanying notes are an integral part of these financial statements.
franklintempleton.com
| | | | | | | | | | | | |
| | | FRANKLIN INVESTORS SECURITIES TRUST | |
| | | | | | FINANCIAL HIGHLIGHTS | |
| |
| |
| Franklin Real Return Fund (continued) | | | | | | | | | | | | |
| | | | | | Year Ended October 31, | | | | |
| | | 2016 | | | 2015 | | | 2014 | | | 2013 | a |
| Class R6 | | | | | | | | | | | | |
| Per share operating performance | | | | | | | | | | | | |
| (for a share outstanding throughout the year) | | | | | | | | | | | | |
| Net asset value, beginning of year | $ | 9.98 | | $ | 10.68 | | $ | 10.85 | | $ | 11.01 | |
| Income from investment operationsb: | | | | | | | | | | | | |
| Net investment incomec | | 0.16 | | | 0.10 | | | 0.21 | | | 0.09 | |
| Net realized and unrealized gains (losses) | | 0.16 | | | (0.72 | ) | | (0.10 | ) | | (0.10 | ) |
| Total from investment operations | | 0.32 | | | (0.62 | ) | | 0.11 | | | (0.01 | ) |
| Less distributions from: | | | | | | | | | | | | |
| Net investment income and net foreign currency gains | | (0.14 | ) | | (0.08 | ) | | (0.28 | ) | | (0.15 | ) |
| Tax return of capital | | (0.01 | ) | | — | | | — | | | — | |
| Total distributions | | (0.15 | ) | | (0.08 | ) | | (0.28 | ) | | (0.15 | ) |
| Net asset value, end of year | $ | 10.15 | | $ | 9.98 | | $ | 10.68 | | $ | 10.85 | |
| |
| Total returnd | | 3.25 | % | | (5.87 | )% | | 1.04 | % | | (0.06 | )% |
| |
| Ratios to average net assetse | | | | | | | | | | | | |
| Expenses before waiver and payments by affiliates | | 0.71 | % | | 0.71 | % | | 0.70 | % | | 2.43 | % |
| Expenses net of waiver and payments by affiliatesf | | 0.50 | % | | 0.50 | % | | 0.52 | % | | 0.52 | % |
| Net investment income | | 1.58 | % | | 0.83 | % | | 1.72 | % | | 1.73 | % |
| |
| Supplemental data | | | | | | | | | | | | |
| Net assets, end of year (000’s) | $ | 5,326 | | $ | 1,730 | | $ | 2,034 | | $ | 5 | |
| Portfolio turnover rate | | 31.82 | % | | 26.57 | % | | 33.02 | % | | 27.91 | % |
aFor the period May 1, 2013 (effective date) to October 31, 2013.
bThe amount shown for a share outstanding throughout the period may not correlate with the Statement of Operations for the period due to the timing of sales and
repurchases of the Fund’s shares in relation to income earned, adjustments to interest income for the inflation-indexed bonds, and/or fluctuating fair value of the investments
of the Fund.
cBased on average daily shares outstanding.
dTotal return is not annualized for periods less than one year.
eRatios are annualized for periods less than one year.
fBenefit of expense reduction rounds to less than 0.01%.
franklintempleton.com
The accompanying notes are an integral part of these financial statements. | Annual Report 63
| | | | | | | | | | | | | | | |
| FRANKLIN INVESTORS SECURITIES TRUST | | | | | | | | | | | | | | | |
| FINANCIAL HIGHLIGHTS | | | | | | | | | | | | | | | |
| |
| |
| Franklin Real Return Fund (continued) | | | | | | | | | | | | | | | |
| | | | | | Year Ended October 31, | | | | | | | |
| | | 2016 | | | 2015 | | | 2014 | | | 2013 | | | 2012 | |
| Advisor Class | | | | | | | | | | | | | | | |
| Per share operating performance | | | | | | | | | | | | | | | |
| (for a share outstanding throughout the year) | | | | | | | | | | | | | | | |
| Net asset value, beginning of year | $ | 9.96 | | $ | 10.68 | | $ | 10.85 | | $ | 10.97 | | $ | 11.08 | |
| Income from investment operationsa: | | | | | | | | | | | | | | | |
| Net investment incomeb | | 0.14 | | | 0.05 | | | 0.18 | | | 0.18 | | | 0.20 | |
| Net realized and unrealized gains (losses) | | 0.16 | | | (0.70 | ) | | (0.08 | ) | | (0.01 | ) | | 0.01 | |
| Total from investment operations | | 0.30 | | | (0.65 | ) | | 0.10 | | | 0.17 | | | 0.21 | |
| Less distributions from: | | | | | | | | | | | | | | | |
| Net investment income and net foreign currency gains | | (0.12 | ) | | (0.07 | ) | | (0.27 | ) | | (0.29 | ) | | (0.32 | ) |
| Tax return of capital. | | (0.01 | ) | | — | | | — | | | — | | | — | |
| Total distributions | | (0.13 | ) | | (0.07 | ) | | (0.27 | ) | | (0.29 | ) | | (0.32 | ) |
| Net asset value, end of year. | $ | 10.13 | | $ | 9.96 | | $ | 10.68 | | $ | 10.85 | | $ | 10.97 | |
| |
| Total return | | 3.04 | % | | (6.08 | )% | | 0.91 | % | | 1.60 | % | | 1.99 | % |
| |
| Ratios to average net assets | | | | | | | | | | | | | | | |
| Expenses before waiver and payments by affiliates | | 0.87 | % | | 0.85 | % | | 0.85 | % | | 0.83 | % | | 0.81 | % |
| Expenses net of waiver and payments by affiliates | | 0.65 | %c | | 0.65 | %c | | 0.65 | %c | | 0.65 | %c | | 0.65 | % |
| Net investment income | | 1.43 | % | | 0.68 | % | | 1.59 | % | | 1.60 | % | | 1.83 | % |
| |
| Supplemental data | | | | | | | | | | | | | | | |
| Net assets, end of year (000’s) | $ | 35,215 | | $ | 37,758 | | $ | 65,958 | | $ | 28,042 | | $ | 35,362 | |
| Portfolio turnover rate | | 31.82 | % | | 26.57 | % | | 33.02 | % | | 27.91 | % | | 18.64 | % |
aThe amount shown for a share outstanding throughout the period may not correlate with the Statement of Operations for the period due to the timing of sales and
repurchases of the Fund’s shares in relation to income earned, adjustments to interest income for the inflation-indexed bonds, and/or fluctuating fair value of the investments
of the Fund.
bBased on average daily shares outstanding.
cBenefit of expense reduction rounds to less than 0.01%.
64 Annual Report | The accompanying notes are an integral part of these financial statements.
franklintempleton.com
FRANKLIN INVESTORS SECURITIES TRUST
| | | | |
| Statement of Investments, October 31, 2016 | | | | |
| Franklin Real Return Fund | | | | |
| | Country | Shares | | Value |
| |
| Common Stocks 8.4% | | | | |
| Energy 5.4% | | | | |
| Anadarko Petroleum Corp | United States | 23,700 | $ | 1,408,728 |
| Canadian Natural Resources Ltd | Canada | 33,700 | | 1,068,627 |
| Chevron Corp | United States | 13,700 | | 1,435,075 |
| Exxon Mobil Corp | United States | 15,277 | | 1,272,880 |
| Halliburton Co | United States | 33,300 | | 1,531,800 |
| Noble Energy Inc | United States | 27,400 | | 944,478 |
| Occidental Petroleum Corp | United States | 18,200 | | 1,326,962 |
| Pioneer Natural Resources Co | United States | 4,700 | | 841,394 |
| Royal Dutch Shell PLC, A, ADR | United Kingdom | 19,800 | | 986,238 |
| Schlumberger Ltd | United States | 20,850 | | 1,631,095 |
| a Weatherford International PLC | United States | 119,400 | | 575,508 |
| | | | | 13,022,785 |
| Materials 3.0% | | | | |
| Agrium Inc | Canada | 8,800 | | 808,016 |
| BHP Billiton PLC, ADR | Australia | 32,700 | | 988,848 |
| The Dow Chemical Co | United States | 26,600 | | 1,431,346 |
| a Freeport-McMoRan Inc., B | United States | 53,046 | | 593,054 |
| Goldcorp Inc | Canada | 101,600 | | 1,544,320 |
| Nucor Corp | United States | 21,000 | | 1,025,850 |
| Rio Tinto PLC, ADR | United Kingdom | 27,700 | | 965,345 |
| | | | | 7,356,779 |
| Total Common Stocks (Cost $21,881,836) | | | | 20,379,564 |
| |
| Management Investment Companies 9.0% | | | | |
| Diversified Financials 1.7% | | | | |
| b Franklin Lower Tier Floating Rate Fund | United States | 280,073 | | 2,909,964 |
| b Franklin Middle Tier Floating Rate Fund | United States | 105,222 | | 1,058,531 |
| | | | | 3,968,495 |
| Real Estate 7.3% | | | | |
| SPDR Dow Jones REIT ETF | United States | 193,000 | | 17,728,980 |
| Total Management Investment Companies | | | | |
| (Cost $13,170,253) | | | | 21,697,475 |
| |
| |
| | | Principal | | |
| | | Amount* | | |
| |
| Corporate Bonds 4.0% | | | | |
| Consumer Services 0.1% | | | | |
| MGM Resorts International, senior note, 7.75%, 3/15/22. | United States | 200,000 | | 231,938 |
| Energy 1.4% | | | | |
| c Chesapeake Energy Corp., secured note, second lien, 144A, 8.00%, | | | | |
| 12/15/22 | United States | 425,000 | | 433,500 |
| CONSOL Energy Inc., | | | | |
| senior note, 5.875%, 4/15/22 | United States | 300,000 | | 277,620 |
| senior note, 8.00%, 4/01/23 | United States | 600,000 | | 597,000 |
| Energy Transfer Equity LP, senior note, first lien, 7.50%, 10/15/20 | United States | 1,000,000 | | 1,095,000 |
| Sabine Pass Liquefaction LLC, first lien, 5.625%, 2/01/21 | United States | 1,000,000 | | 1,060,000 |
| | | | | 3,463,120 |
franklintempleton.com
Annual Report
65
FRANKLIN INVESTORS SECURITIES TRUST
STATEMENT OF INVESTMENTS
| | | | |
| Franklin Real Return Fund (continued) | | | | |
| | | Principal | | |
| | Country | Amount* | | Value |
| |
| Corporate Bonds (continued) | | | | |
| Health Care Equipment & Services 0.4% | | | | |
| HCA Inc., senior secured bond, first lien, 5.875%, 3/15/22. | United States | 1,000,000 | $ | 1,102,500 |
| Materials 0.3% | | | | |
| c Novelis Corp., senior bond, 144A, 5.875%, 9/30/26 | United States | 700,000 | | 710,500 |
| Media 0.6% | | | | |
| c Altice U.S. Finance I Corp., senior secured bond, 144A, 5.50%, 5/15/26 | United States | 300,000 | | 306,750 |
| CSC Holdings LLC, senior note, 6.75%, 11/15/21 | United States | 1,000,000 | | 1,055,000 |
| | | | | 1,361,750 |
| Pharmaceuticals, Biotechnology & Life Sciences 0.4% | | | | |
| c Valeant Pharmaceuticals International Inc., senior note, 144A, 7.50%, | | | | |
| 7/15/21 | United States | 1,000,000 | | 883,750 |
| Telecommunication Services 0.8% | | | | |
| Intelsat Jackson Holdings SA, senior note, 7.25%, 10/15/20 | Luxembourg | 1,000,000 | | 755,000 |
| c Sprint Communications Inc., senior note, 144A, 7.00%, 3/01/20 | United States | 1,000,000 | | 1,090,000 |
| | | | | 1,845,000 |
| Total Corporate Bonds (Cost $9,830,853) | | | | 9,598,558 |
| |
| d,e Senior Floating Rate Interests 2.5% | | | | |
| Automobiles & Components 0.1% | | | | |
| TI Group Automotive Systems LLC, Initial U.S. Term Loan, 4.50%, 6/25/22 . | United States | 147,817 | | 148,308 |
| Capital Goods 0.0%† | | | | |
| f Harsco Corp., Initial Term Loan, 7.50%, 11/01/23 | United States | 29,373 | | 29,740 |
| Leidos (Abacus Innovations Corp.), B Term Loan, 3.284%, 8/16/23 | United States | 22,748 | | 22,954 |
| | | | | 52,694 |
| Commercial & Professional Services 0.0%† | | | | |
| KAR Auction Services Inc., Tranche B-3 Term Loan, 4.375%, 3/09/23 | United States | 91,718 | | 92,903 |
| Consumer Services 0.0%† | | | | |
| Aristocrat Technologies Inc., Term B-1 Loans, 3.631%, 10/20/21 | United States | 17,873 | | 17,978 |
| Prime Security Services Borrower LLC, Term B-1 Loans, 4.75%, 5/02/22 | United States | 99,452 | | 100,272 |
| | | | | 118,250 |
| Diversified Financials 0.0%† | | | | |
| First Eagle Investment Management, Initial Term Loans, 4.838%, 12/01/22 . | United States | 46,568 | | 46,509 |
| Russell Investments US Institutional Holdco Inc., Initial Term Loan, 6.75%, | | | | |
| 6/01/23 | United States | 35,087 | | 35,219 |
| | | | | 81,728 |
| Energy 0.2% | | | | |
| g Bowie Resource Holdings LLC, First Lien Initial Term Loan, 6.75%, | | | | |
| 8/16/20 | United States | 209,136 | | 173,583 |
| Fieldwood Energy LLC, Loans, 3.875%, 10/01/18. | United States | 364,913 | | 336,632 |
| McDermott Finance LLC, Term Loan, 8.25% - 8.484%, 4/16/19 | United States | 10,119 | | 10,221 |
| | | | | 520,436 |
| Health Care Equipment & Services 0.1% | | | | |
| Carestream Health Inc., Term Loan, 5.00%, 6/07/19 | United States | 68,970 | | 64,303 |
| Community Health Systems Inc., 2018 Term F Loans, 4.083%, 12/31/18 | United States | 186,558 | | 182,793 |
| | | | | 247,096 |
| Household & Personal Products 0.0%† | | | | |
| f Spectrum Brands Inc., Term Loans, 5.00%, 6/23/22 | United States | 3,724 | | 3,765 |
66 Annual Report
franklintempleton.com
FRANKLIN INVESTORS SECURITIES TRUST
STATEMENT OF INVESTMENTS
| | | | |
| Franklin Real Return Fund (continued) | | | | |
| | | Principal | | |
| | Country | Amount* | | Value |
| |
| d,e Senior Floating Rate Interests (continued) | | | | |
| Materials 0.4% | | | | |
| The Chemours Co. LLC, Tranche B Term Loan, 3.75%, 5/12/22 | United States | 267,934 | $ | 265,521 |
| Cyanco Intermediate Corp., Initial Term Loan, 5.50%, 5/01/20 | United States | 58,859 | | 59,006 |
| FMG America Finance Inc. (Fortescue Metals Group), Loans, 3.75%, | | | | |
| 6/30/19 | Australia | 385,639 | | 385,820 |
| g OCI Beaumont LLC, Term B-3 Loan, 7.75%, 8/20/19 | United States | 231,794 | | 228,027 |
| | | | | 938,374 |
| Media 0.6% | | | | |
| f Altice U.S. Finance I Corp., 2016 Refinancing Term Loans, 5.50%, 1/01/25 . | United States | 25,189 | | 25,315 |
| f AMC Entertainment Holdings Inc., | | | | |
| 2016 Incremental Term Loan, 5.25%, 12/15/23 | United States | 9,791 | | 9,760 |
| Initial Term Loans, 5.25%, 12/15/22. | United States | 15,317 | | 15,317 |
| Charter Communications Operating LLC (CCO Safari), Term A Loan, | | | | |
| 2.54%, 5/18/21 | United States | 136,500 | | 135,903 |
| CSC Holdings Inc. (Cablevision), 2016 Extended Term Loans, 3.876%, | | | | |
| 10/11/24 | United States | 121,389 | | 121,971 |
| f Lions Gate Entertainment Corp., Term Loan A, 5.00%, 10/12/21 | United States | 67,950 | | 67,270 |
| f Live Nation Entertainment Inc., Term B-2 Loans, 5.00%, 10/31/23 | United States | 9,791 | | 9,815 |
| Radio One Inc., Term Loan B, 5.04%, 12/31/18 | United States | 938,494 | | 940,841 |
| UPC Financing Partnership, Facility AN, 4.08%, 8/31/24 | Netherlands | 30,895 | | 31,092 |
| | | | | 1,357,284 |
| Pharmaceuticals, Biotechnology & Life Sciences 0.3% | | | | |
| Endo Luxembourg Finance Co. I S.A.R.L. and Endo LLC, 2015 Incremental | | | | |
| Term B Loans, 3.75%, 9/25/22 | United States | 244,519 | | 244,481 |
| Grifols Worldwide Operations USA Inc., U.S. Tranche B Term Loan, 3.46%, | | | | |
| 2/27/21 | United States | 226,763 | | 229,030 |
| f RPI Finance Trust, Term A-2 Term Loan A, 4.75%, 10/14/20 | United States | 38,312 | | 38,114 |
| Valeant Pharmaceuticals International Inc., | | | | |
| Series C-2 Tranche B Term Loan, 5.25%, 12/11/19 | United States | 75,737 | | 75,793 |
| Series D-2 Tranche B Term Loan, 5.00%, 2/13/19 | United States | 155,168 | | 155,155 |
| | | | | 742,573 |
| Retailing 0.1% | | | | |
| Ascena Retail Group Inc., Tranche B Term Loan, 5.25%, 8/21/22 | United States | 230,352 | | 225,073 |
| Dollar Tree Inc., Term A-1 Loans, 2.25%, 7/06/20 | United States | 71,383 | | 71,271 |
| PetSmart Inc., Tranche B-2 Loans, 4.00%, 3/11/22 | United States | 49,622 | | 49,777 |
| | | | | 346,121 |
| Semiconductors & Semiconductor Equipment 0.3% | | | | |
| Avago Technologies Cayman Finance Ltd., Term B-3 Loans, 3.535%, | | | | |
| 2/01/23 | Singapore | 149,154 | | 150,879 |
| MACOM Technology Solutions Holdings Inc., Initial Term Loan, 4.628%, | | | | |
| 5/07/21 | United States | 121,311 | | 122,675 |
| MKS Instruments Inc., Tranche B-1 Term Loans, 4.25%, 5/01/23 | United States | 57,239 | | 57,859 |
| ON Semiconductor Corp., 2016 Replacement Term Loans, 3.777%, | | | | |
| 3/31/23 | United States | 313,121 | | 315,302 |
| | | | | 646,715 |
| Software & Services 0.1% | | | | |
| f Global Payments Inc., Delayed Draw Term Loan (A-2), 4.75%, 10/31/21 | United States | 140,200 | | 140,007 |
| f Rackspace Hosting Inc., Term B Loan, 6.50%, 11/03/23 | United States | 48,955 | | 49,300 |
| | | | | 189,307 |
franklintempleton.com
Annual Report
67
FRANKLIN INVESTORS SECURITIES TRUST
STATEMENT OF INVESTMENTS
| | | | | | |
| Franklin Real Return Fund (continued) | | | | | | |
| | | Principal | | | | |
| | Country | Amount* | | | | Value |
| |
| d,e Senior Floating Rate Interests (continued) | | | | | | |
| Technology Hardware & Equipment 0.1% | | | | | | |
| Ciena Corp., Term Loan, 3.75%, 7/15/19 | United States | 32,432 | | | $ | 32,594 |
| Dell International LLC, Term A-3 Loan, 2.54%, 12/31/18 | United States | 104,097 | | | | 104,146 |
| Western Digital Corp., Term Loan B-1, 4.50%, 4/29/23 | United States | 67,328 | | | | 68,191 |
| Zebra Technologies Corp., Refinancing Term Loan, 4.089%, 10/27/21 | United States | 55,216 | | | | 55,860 |
| | | | | | | 260,791 |
| Telecommunication Services 0.0%† | | | | | | |
| Consolidated Communications Inc., Initial Term Loan, 4.00%, 10/05/23 | United States | 24,568 | | | | 24,752 |
| Global Tel*Link Corp., Term Loan, 5.00%, 5/23/20 | United States | 26,806 | | | | 26,119 |
| | | | | | | 50,871 |
| Transportation 0.1% | | | | | | |
| Air Canada, Term Loan, 3.614%, 10/06/23 | Canada | 6,423 | | | | 6,452 |
| Navios Maritime Midstream Partners LP, Initial Term Loan, 5.50%, 6/18/20 . | Marshall Islands | 85,921 | | | | 84,418 |
| Navios Maritime Partners LP, Initial Term Loan, 5.25%, 6/27/18 | Marshall Islands | 6,575 | | | | 6,036 |
| XPO Logistics Inc., Refinancing Term Loans, 4.25%, 10/30/21. | United States | 123,302 | | | | 124,273 |
| | | | | | | 221,179 |
| Utilities 0.1% | | | | | | |
| EFS Cogen Holdings I LLC (Linden), Term B Advance, 5.25%, 6/28/23. | United States | 16,472 | | | | 16,657 |
| NRG Energy Inc., Term Loans, 3.50%, 6/30/23 | United States | 119,700 | | | | 120,089 |
| | | | | | | 136,746 |
| Total Senior Floating Rate Interests (Cost $6,114,911) | | | | | | 6,155,141 |
| |
| Foreign Government and Agency Securities 13.2% | | | | | | |
| Government of Hungary, | | | | | | |
| h senior bond, Reg S, 3.875%, 2/24/20. | Hungary | 180,000 | | EUR | | 221,810 |
| senior note, 6.375%, 3/29/21 | Hungary | 620,000 | | | | 717,433 |
| h senior note, Reg S, 4.375%, 7/04/17 | Hungary | 150,000 | | EUR | | 169,710 |
| h senior note, Reg S, 5.75%, 6/11/18 | Hungary | 435,000 | | EUR | | 521,334 |
| Government of Indonesia, senior bond, FR53, 8.25%, 7/15/21 | Indonesia | 58,500,000,000 | | IDR | | 4,718,826 |
| Government of Malaysia, | | | | | | |
| senior bond, 3.814%, 2/15/17 | Malaysia | 6,100,000 | | MYR | | 1,460,190 |
| senior note, 3.58%, 9/28/18 | Malaysia | 18,000,000 | | MYR | | 4,349,135 |
| Government of Mexico, | | | | | | |
| M, 4.75%, 6/14/18 | Mexico | 1,124,000 | i | MXN | | 5,894,556 |
| senior note, M, 5.00%, 6/15/17 | Mexico | 750,000 | i | MXN | | 3,971,966 |
| d Government of Poland, | | | | | | |
| FRN, 1.79%, 1/25/17 | Poland | 4,515,000 | | PLN | | 1,151,829 |
| FRN, 1.79%, 1/25/21 | Poland | 9,388,000 | | PLN | | 2,358,309 |
| Nota Do Tesouro Nacional, | | | | | | |
| 10.00%, 1/01/21 | Brazil | 17,200 | j | BRL | | 5,176,432 |
| k Index Linked, 6.00%, 8/15/18 | Brazil | 1,270 | j | BRL | | 1,167,148 |
| Total Foreign Government and Agency Securities | | | | | | |
| (Cost $32,587,349) | | | | | | 31,878,678 |
| |
| U.S. Government and Agency Securities 55.6% | | | | | | |
| l U.S. Treasury Note, | | | | | | |
| Index Linked, 2.375%, 1/15/17 | United States | 3,582,810 | | | | 3,607,467 |
| Index Linked, 0.125%, 4/15/17 | United States | 39,233,569 | | | | 39,326,788 |
| Index Linked, 2.625%, 7/15/17 | United States | 15,106,624 | | | | 15,538,960 |
| Index Linked, 1.625%, 1/15/18 | United States | 33,339,058 | | | | 34,313,358 |
| Index Linked, 1.375%, 7/15/18 | United States | 971,677 | | | | 1,011,556 |
68 Annual Report
franklintempleton.com
FRANKLIN INVESTORS SECURITIES TRUST
STATEMENT OF INVESTMENTS
| | | | |
| Franklin Real Return Fund (continued) | | | | |
| | | Principal | | |
| | Country | Amount* | | Value |
| |
| U.S. Government and Agency Securities (continued) | | | | |
| l U.S. Treasury Note, (continued) | | | | |
| Index Linked, 2.125%, 1/15/19 | United States | 38,139,891 | $ | 40,545,832 |
| Total U.S. Government and Agency Securities | | | | |
| (Cost $133,637,383) | | | | 134,343,961 |
| Total Investments before Short Term Investments | | | | |
| (Cost $217,222,585) | | | | 224,053,377 |
| |
| Short Term Investments (Cost $15,773,046) 6.5% | | | | |
| Repurchase Agreements 6.5% | | | | |
| m Joint Repurchase Agreement, 0.309%, 11/01/16 | | | | |
| (Maturity Value $15,773,182) | | | | |
| BNP Paribas Securities Corp. (Maturity Value $6,219,208) | | | | |
| Deutsche Bank Securities Inc. (Maturity Value $2,401,782) | | | | |
| HSBC Securities (USA) Inc. (Maturity Value $6,219,208) | | | | |
| Merrill Lynch, Pierce, Fenner & Smith Inc. (Maturity Value $932,984) | | | | |
| Collateralized by U.S. Government Agency Securities, 0.00% - | | | | |
| 2.375%, 4/28/17 - 9/10/21; and U.S. Treasury Note, 0.00% - 2.375%, | | | | |
| 1/15/17 - 6/30/21 (valued at $16,097,382) | United States | 15,773,046 | | 15,773,046 |
| Total Investments (Cost $232,995,631) 99.2% | | | | 239,826,423 |
| Other Assets, less Liabilities 0.8% | | | | 1,823,916 |
| Net Assets 100.0%. | | | $ | 241,650,339 |
†Rounds to less than 0.1% of net assets.
*The principal amount is stated in U.S. dollars unless otherwise indicated.
aNon-income producing.
bSee Note 3(f) regarding investments in affiliated management investment companies.
cSecurity was purchased pursuant to Rule 144A under the Securities Act of 1933 and may be sold in transactions exempt from registration only to qualified institutional buyers
or in a public offering registered under the Securities Act of 1933. These securities have been deemed liquid under guidelines approved by the Trust’s Board of Trustees. At
October 31, 2016, the aggregate value of these securities was $3,424,500, representing 1.4% of net assets.
dThe coupon rate shown represents the rate at period end.
eSee Note 1(h) regarding senior floating rate interests.
fSecurity purchased on a delayed delivery basis. See Note 1(d).
gAt October 31, 2016, pursuant to the Fund’s policies and the requirements of applicable securities law, the Fund is restricted from trading these securities at year end.
hSecurity was purchased pursuant to Regulation S under the Securities Act of 1933, which exempts from registration securities offered and sold outside of the United States.
Such a security cannot be sold in the United States without either an effective registration statement filed pursuant to the Securities Act of 1933, or pursuant to an exemption
from registration. These securities have been deemed liquid under guidelines approved by the Trust’s Board of Trustees. At October 31, 2016, the aggregate value of these
securities was $912,854, representing 0.4% of net assets.
iPrincipal amount is stated in 100 Mexican Peso Units.
jPrincipal amount is stated in 1,000 Brazilian Real Units.
kRedemption price at maturity is adjusted for inflation. See Note 1(j).
lPrincipal amount of security is adjusted for inflation. See Note 1(j).
mSee Note 1(c) regarding joint repurchase agreement.
franklintempleton.com
Annual Report
69
FRANKLIN INVESTORS SECURITIES TRUST
STATEMENT OF INVESTMENTS
| | | | | | | | | |
| Franklin Real Return Fund (continued) | | | | | | | | |
| |
| At October 31, 2016, the Fund had the following forward exchange contracts outstanding. See Note 1(e). | | |
| Forward Exchange Contracts | | | | | | | | |
| | | | | Contract | Settlement | | Unrealized | | Unrealized |
| Currency | Counterpartya Type | Quantity | | Amount | Date | | Appreciation | | Depreciation |
| OTC Forward Exchange Contracts | | | | | | | | | |
| Chilean Peso | DBAB Buy | 328,810,000 | $ | 487,849 | 5/18/17 | $ | 7,599 | $ | — |
| Euro | DBAB Sell | 3,072,361 | | 3,448,664 | 5/18/17 | | 44,836 | | — |
| Euro | JPHQ Sell | 1,150,100 | | 1,276,369 | 5/18/17 | | 2,189 | | — |
| Total Forward Exchange Contracts | | | | | | $ | 54,624 | $ | — |
| Net unrealized appreciation (depreciation) | | | | | $ | 54,624 | | |
aMay be comprised of multiple contracts with the same counterparty, currency and settlement date.
See Abbreviations on page 93.
70 Annual Report | The accompanying notes are an integral part of these financial statements.
franklintempleton.com
| | | | | | | | | | | |
| | | | | | FRANKLIN INVESTORS SECURITIES TRUST | |
| |
| |
| |
| |
| Financial Statements | | | | | | | | | | | |
| |
| |
| Statements of Assets and Liabilities | | | | | | | | | | | |
| October 31, 2016 | | | | | | | | | | | |
| |
| | | | | | Franklin | | | | | | |
| | | Franklin | | | Convertible | | | Franklin Equity | | Franklin Real | |
| | | Balanced Fund | | | Securities Fund | | | Income Fund | | Return Fund | |
| Assets: | | | | | | | | | | | |
| Investments in securities: | | | | | | | | | | | |
| Cost - Unaffiliated issuers | $ | 3,009,146,485 | | $ | 1,865,391,474 | | $ | 1,640,299,384 | $ | 213,413,710 | |
| Cost - Non-controlled affiliates (Note 3f) | | 120,863,963 | | | 98,515,365 | | | 50,191,472 | | 3,808,875 | |
| Cost - Repurchase agreements | | — | | | — | | | — | | 15,773,046 | |
| Total cost of investments | $ | 3,130,010,448 | | $ | 1,963,906,839 | | $ | 1,690,490,856 | $ | 232,995,631 | |
| Value - Unaffiliated issuers | $ | 3,170,579,741 | | $ | 2,046,304,703 | | $ | 1,998,393,473 | $ | 220,084,882 | |
| Value - Non-controlled affiliates (Note 3f) | | 120,863,963 | | | 98,515,365 | | | 50,191,472 | | 3,968,495 | |
| Value - Repurchase agreements | | — | | | — | | | — | | 15,773,046 | |
| Total value of investments | | 3,291,443,704 | | | 2,144,820,068 | | | 2,048,584,945 | | 239,826,423 | |
| Cash | | 261,414 | | | — | | | — | | 260,449 | |
| Restricted Cash (Note 1f) | | — | | | — | | | — | | 90,000 | |
| Foreign currency, at value (cost $—, $—, $— and | | | | | | | | | | | |
| $1,368,541, respectively) | | — | | | — | | | — | | 1,370,190 | |
| Receivables: | | | | | | | | | | | |
| Investment securities sold | | 7,809,250 | | | — | | | 10,083,575 | | — | |
| Capital shares sold | | 6,473,025 | | | 5,135,226 | | | 3,924,226 | | 489,315 | |
| Dividends and interest | | 17,859,676 | | | 6,377,095 | | | 2,328,593 | | 1,230,026 | |
| Unrealized appreciation on OTC forward exchange | | | | | | | | | | | |
| contracts | | — | | | — | | | — | | 54,624 | |
| Other assets | | 632 | | | 414 | | | 415 | | 53 | |
| Total assets | | 3,323,847,701 | | | 2,156,332,803 | | | 2,064,921,754 | | 243,321,080 | |
| Liabilities: | | | | | | | | | | | |
| Payables: | | | | | | | | | | | |
| Investment securities purchased | | — | | | — | | | — | | 387,260 | |
| Capital shares redeemed | | 11,765,248 | | | 5,498,725 | | | 7,852,584 | | 980,226 | |
| Management fees | | 1,767,959 | | | 806,740 | | | 779,969 | | 96,349 | |
| Distribution fees | | 1,081,393 | | | 414,257 | | | 589,060 | | 56,532 | |
| Transfer agent fees | | 532,477 | | | 415,876 | | | 370,373 | | 11,736 | |
| Options written, at value (premiums received $2,871,309, | | | | | | | | | | | |
| $—, $— and $—, respectively) | | 3,151,230 | | | — | | | — | | — | |
| Due to brokers | | — | | | — | | | — | | 90,000 | |
| Deferred tax | | — | | | — | | | — | | 19,001 | |
| Accrued expenses and other liabilities | | 154,476 | | | 105,814 | | | 108,607 | | 29,637 | |
| Total liabilities | | 18,452,783 | | | 7,241,412 | | | 9,700,593 | | 1,670,741 | |
| Net assets, at value | $ | 3,305,394,918 | | $ | 2,149,091,391 | | $ | 2,055,221,161 | $ | 241,650,339 | |
| Net assets consist of: | | | | | | | | | | | |
| Paid-in capital | $ | 3,108,375,826 | | $ | 1,942,452,858 | | $ | 1,614,529,801 | $ | 266,194,524 | |
| Undistributed net investment income | | — | | | — | | | 2,339,414 | | — | |
| Distributions in excess of net investment income | | (1,700,359 | ) | | (14,288,410 | ) | | — | | (4,592,709 | ) |
| Net unrealized appreciation (depreciation) | | 161,143,940 | | | 180,913,229 | | | 358,075,277 | | 6,868,214 | |
| Accumulated net realized gain (loss) | | 37,575,511 | | | 40,013,714 | | | 80,276,669 | | (26,819,690 | ) |
| Net assets, at value | $ | 3,305,394,918 | | $ | 2,149,091,391 | | $ | 2,055,221,161 | $ | 241,650,339 | |
franklintempleton.com
The accompanying notes are an integral part of these financial statements. | Annual Report 71
| | | | | | | | | | | | |
| FRANKLIN INVESTORS SECURITIES TRUST | | | | | | | | | | | | |
| FINANCIAL STATEMENTS | | | | | | | | | | | | |
| |
| |
| Statements of Assets and Liabilities (continued) | | | | | | | | | | | | |
| October 31, 2016 | | | | | | | | | | | | |
| |
| | | | | | | Franklin | | | | | | |
| | | | Franklin | | | Convertible | | | Franklin Equity | | | Franklin Real |
| | | | Balanced Fund | | | Securities Fund | | | Income Fund | | | Return Fund |
| Class A: | | | | | | | | | | | | |
| Net assets, at value | $ | | 2,532,459,079 | $ | | 768,553,298 | $ | | 1,700,711,940 | $ | | 161,541,031 |
| Shares outstanding | | | 217,469,171 | | | 42,146,638 | | | 75,601,648 | | | 16,011,039 |
| Net asset value per sharea | | $ | 11.65 | | $ | 18.24 | | $ | 22.50 | | $ | 10.09 |
| Maximum offering price per share (net asset value per | | | | | | | | | | | | |
| share ÷ 94.25%, 94.25%, 94.25% and 95.75%, | | | | | | | | | | | | |
| respectively) | | $ | 12.36 | | $ | 19.35 | | $ | 23.87 | | $ | 10.54 |
| Class C: | | | | | | | | | | | | |
| Net assets, at value | $ | | 630,109,931 | $ | | 293,038,458 | $ | | 257,155,685 | $ | | 39,568,377 |
| Shares outstanding | | | 54,569,430 | | | 16,301,040 | | | 11,519,310 | | | 3,956,730 |
| Net asset value and maximum offering price per sharea | | $ | 11.55 | | $ | 17.98 | | $ | 22.32 | | $ | 10.00 |
| Class R: | | | | | | | | | | | | |
| Net assets, at value | $ | | 4,481,723 | | | | $ | | 6,394,594 | | | |
| Shares outstanding | | | 383,986 | | | | | | 284,309 | | | |
| Net asset value and maximum offering price per share | | $ | 11.67 | | | | | $ | 22.49 | | | |
| Class R6: | | | | | | | | | | | | |
| Net assets, at value | $ | | 233,391 | $ | | 7,154,043 | $ | | 10,536,879 | $ | | 5,325,717 |
| Shares outstanding | | | 20,004 | | | 390,187 | | | 467,537 | | | 524,934 |
| Net asset value and maximum offering price per share | | $ | 11.67 | | $ | 18.33 | | $ | 22.54 | | $ | 10.15 |
| Advisor Class: | | | | | | | | | | | | |
| Net assets, at value | $ | | 138,110,794 | $ | | 1,080,345,592 | $ | | 80,422,063 | $ | | 35,215,214 |
| Shares outstanding | | | 11,836,886 | | | 59,228,496 | | | 3,569,284 | | | 3,476,275 |
| Net asset value and maximum offering price per share | | $ | 11.67 | | $ | 18.24 | | $ | 22.53 | | $ | 10.13 |
aRedemption price is equal to net asset value less contingent deferred sales charges, if applicable.
72 Annual Report | The accompanying notes are an integral part of these financial statements.
franklintempleton.com
| | | | | | | | | | | | |
| | | | | | FRANKLIN INVESTORS SECURITIES TRUST | |
| | | | | | | | | FINANCIAL STATEMENTS | |
| |
| |
| Statements of Operations | | | | | | | | | | | | |
| for the year ended October 31, 2016 | | | | | | | | | | | | |
| |
| | | | | | Franklin | | | | | | | |
| | | Franklin | | | Convertible | | | Franklin Equity | | Franklin Real | |
| | | Balanced Fund | | | Securities Fund | | | Income Fund | | Return Fund | |
| Investment income: | | | | | | | | | | | | |
| Dividends: | | | | | | | | | | | | |
| Unaffiliated issuers | $ | 67,303,400 | | $ | 26,143,298 | | $ | 61,717,031 | | $ | 1,205,943 | |
| Non-controlled affiliates (Note 3f) | | — | | | — | | | — | | | 306,013 | |
| Interest | | 47,589,529 | | | 20,705,855 | | | 79 | | | 2,132,227 | |
| Inflation principal adjustments. | | — | | | — | | | — | | | 1,551,955 | |
| Total investment income. | | 114,892,929 | | | 46,849,153 | | | 61,717,110 | | | 5,196,138 | |
| Expenses: | | | | | | | | | | | | |
| Management fees (Note 3a) | | 20,051,202 | | | 9,513,458 | | | 9,562,563 | | | 1,559,115 | |
| Distribution fees: (Note 3c) | | | | | | | | | | | | |
| Class A | | 6,194,756 | | | 1,880,874 | | | 4,373,249 | | | 420,354 | |
| Class C | | 6,005,474 | | | 2,961,378 | | | 2,511,522 | | | 280,172 | |
| Class R | | 22,161 | | | — | | | 30,044 | | | — | |
| Transfer agent fees: (Note 3e) | | | | | | | | | | | | |
| Class A | | 2,834,405 | | | 936,871 | | | 2,257,578 | | | 280,060 | |
| Class C | | 689,986 | | | 368,784 | | | 324,107 | | | 71,797 | |
| Class R | | 5,071 | | | — | | | 7,903 | | | — | |
| Class R6 | | 174 | | | 265 | | | 156 | | | 164 | |
| Advisor Class | | 93,802 | | | 1,240,566 | | | 65,569 | | | 57,511 | |
| Custodian fees (Note 4) | | 29,272 | | | 17,597 | | | 23,405 | | | 19,653 | |
| Reports to shareholders | | 381,324 | | | 204,170 | | | 315,741 | | | 47,641 | |
| Registration and filing fees | | 289,084 | | | 147,708 | | | 163,700 | | | 67,077 | |
| Professional fees | | 70,476 | | | 58,587 | | | 58,230 | | | 34,709 | |
| Trustees’ fees and expenses | | 33,361 | | | 22,312 | | | 22,347 | | | 2,850 | |
| Other. | | 69,164 | | | 48,576 | | | 42,439 | | | 21,522 | |
| Total expenses | | 36,769,712 | | | 17,401,146 | | | 19,758,553 | | | 2,862,625 | |
| Expense reductions (Note 4) | | (270 | ) | | (2,018 | ) | | (215 | ) | | (319 | ) |
| Expenses waived/paid by affiliates (Note 3f and | | | | | | | | | | | | |
| 3g) | | (395,756 | ) | | (200,345 | ) | | (151,586 | ) | | (545,274 | ) |
| Net expenses | | 36,373,686 | | | 17,198,783 | | | 19,606,752 | | | 2,317,032 | |
| Net investment income | | 78,519,243 | | | 29,650,370 | | | 42,110,358 | | | 2,879,106 | |
| Realized and unrealized gains (losses): | | | | | | | | | | | | |
| Net realized gain (loss) from: | | | | | | | | | | | | |
| Investments | | 59,482,377 | | | 70,272,718 | | | 92,883,533 | | | (17,964,281 | ) |
| Written options | | 10,717,079 | | | — | | | 1,315,173 | | | — | |
| Foreign currency transactions | | 30,048 | | | — | | | (188,213 | ) | | 395,621 | |
| Net realized gain (loss) | | 70,229,504 | | | 70,272,718 | | | 94,010,493 | | | (17,568,660 | ) |
| Net change in unrealized appreciation (depreciation) on: | | | | | | | | | | | | |
| Investments | | 23,605,648 | | | 35,403,730 | | | (69,781,289 | ) | | 20,747,881 | |
| Translation of other assets and liabilities | | | | | | | | | | | | |
| denominated in foreign currencies | | (9,395 | ) | | — | | | (6,980 | ) | | 58,649 | |
| Written options | | (922,509 | ) | | — | | | — | | | — | |
| Change in deferred taxes on unrealized appreciation. | | — | | | — | | | — | | | (19,001 | ) |
| Net change in unrealized appreciation | | | | | | | | | | | | |
| (depreciation) | | 22,673,744 | | | 35,403,730 | | | (69,788,269 | ) | | 20,787,529 | |
| Net realized and unrealized gain (loss) | | 92,903,248 | | | 105,676,448 | | | 24,222,224 | | | 3,218,869 | |
| Net increase (decrease) in net assets resulting from | | | | | | | | | | | | |
| operations | $ | 171,422,491 | | $ | 135,326,818 | | $ | 66,332,582 | | $ | 6,097,975 | |
franklintempleton.com
The accompanying notes are an integral part of these financial statements. | Annual Report 73
| | | | | | | | | | | | |
| FRANKLIN INVESTORS SECURITIES TRUST | | | | | | | | | | | | |
| FINANCIAL STATEMENTS | | | | | | | | | | | | |
| |
| |
| Statements of Changes in Net Assets | | | | | | | | | | | | |
| |
| | | Franklin | | | Franklin | |
| | | Balanced Fund | | | Convertible Securities Fund | |
| | | Year Ended October 31, | | | Year Ended October 31, | |
| | | 2016 | | | 2015 | | | 2016 | | | 2015 | |
| Increase (decrease) in net assets: | | | | | | | | | | | | |
| Operations: | | | | | | | | | | | | |
| Net investment income | $ | 78,519,243 | | $ | 69,887,156 | | $ | 29,650,370 | | $ | 28,248,902 | |
| Net realized gain (loss) | | 70,229,504 | | | 5,876,467 | | | 70,272,718 | | | 89,937,146 | |
| Net change in unrealized appreciation (depreciation) | | 22,673,744 | | | (70,359,679 | ) | | 35,403,730 | | | (114,046,752 | ) |
| Net increase (decrease) in net assets resulting | | | | | | | | | | | | |
| from operations | | 171,422,491 | | | 5,403,944 | | | 135,326,818 | | | 4,139,296 | |
| Distributions to shareholders from: | | | | | | | | | | | | |
| Net investment income: | | | | | | | | | | | | |
| Class A | | (79,181,917 | ) | | (70,156,845 | ) | | (21,449,948 | ) | | (18,571,018 | ) |
| Class C | | (15,011,956 | ) | | (13,270,654 | ) | | (6,322,161 | ) | | (4,490,159 | ) |
| Class R | | (131,468 | ) | | (129,500 | ) | | — | | | — | |
| Class R6 | | (8,352 | ) | | (11,849 | ) | | (89,054 | ) | | (50,746 | ) |
| Advisor Class | | (2,775,337 | ) | | (1,708,745 | ) | | (28,889,795 | ) | | (21,965,450 | ) |
| Net realized gains: | | | | | | | | | | | | |
| Class A | | (196,452 | ) | | (27,941,174 | ) | | (15,784,677 | ) | | (33,348,512 | ) |
| Class C | | (49,077 | ) | | (6,796,815 | ) | | (6,225,597 | ) | | (12,006,606 | ) |
| Class R | | (340 | ) | | (50,807 | ) | | — | | | — | |
| Class R6 | | (18 | ) | | (6,909 | ) | | (98 | ) | | (110,660 | ) |
| Advisor Class | | (10,279 | ) | | (575,222 | ) | | (15,633,159 | ) | | (30,219,160 | ) |
| Total distributions to shareholders | | (97,365,196 | ) | | (120,648,520 | ) | | (94,394,489 | ) | | (120,762,311 | ) |
| Capital share transactions: (Note 2) | | | | | | | | | | | | |
| Class A | | 102,305,345 | | | 408,259,572 | | | (54,566,518 | ) | | (55,036,014 | ) |
| Class C | | 53,175,745 | | | 93,503,518 | | | (21,791,985 | ) | | (4,278,396 | ) |
| Class R | | (287,996 | ) | | 1,269,988 | | | — | | | — | |
| Class R6 | | 5,265 | | | (284,447 | ) | | 6,867,487 | | | (3,003,286 | ) |
| Advisor Class | | 81,786,363 | | | 15,106,961 | | | 148,171,070 | | | 73,969,258 | |
| Total capital share transactions | | 236,984,722 | | | 517,855,592 | | | 78,680,054 | | | 11,651,562 | |
| Net increase (decrease) in net assets | | 311,042,017 | | | 402,611,016 | | | 119,612,383 | | | (104,971,453 | ) |
| Net assets: | | | | | | | | | | | | |
| Beginning of year | | 2,994,352,901 | | | 2,591,741,885 | | | 2,029,479,008 | | | 2,134,450,461 | |
| End of year | $ | 3,305,394,918 | | $ | 2,994,352,901 | | $ | 2,149,091,391 | | $ | 2,029,479,008 | |
| Distributions in excess of net investment income included | | | | | | | | | | | | |
| in net assets: | | | | | | | | | | | | |
| End of year | $ | (1,700,359 | ) | $ | (305,284 | ) | $ | (14,288,410 | ) | $ | (10,070,008 | ) |
74 Annual Report | The accompanying notes are an integral part of these financial statements.
franklintempleton.com
| | | | | | | | | | | | | | | |
| | | | | | FRANKLIN INVESTORS SECURITIES TRUST | |
| | | | | | | | | | FINANCIAL STATEMENTS | |
| |
| |
| Statements of Changes in Net Assets (continued) | | | | | | | | | | | | | | | |
| |
| | | Franklin | | | | Franklin | | |
| | | Equity Income Fund | | | | Real Return Fund | |
| | | Year Ended October 31, | | | | Year Ended October 31, | |
| | | 2016 | | | | 2015 | | | | 2016 | | | | 2015 | |
| Increase (decrease) in net assets: | | | | | | | | | | | | | | | |
| Operations: | | | | | | | | | | | | | | | |
| Net investment income. | $ | 42,110,358 | | | $ | 47,416,333 | | | $ | 2,879,106 | | | $ | 1,310,527 | |
| Net realized gain (loss) | | 94,010,493 | | | | 54,413,447 | | | | (17,568,660 | ) | | | 4,458,658 | |
| Net change in unrealized appreciation (depreciation) | | (69,788,269 | ) | | | (28,722,638 | ) | | | 20,787,529 | | | | (27,267,123 | ) |
| Net increase (decrease) in net assets resulting from | | | | | | | | | | | | | | | |
| operations | | 66,332,582 | | | | 73,107,142 | | | | 6,097,975 | | | | (21,497,938 | ) |
| Distributions to shareholders from: | | | | | | | | | | | | | | | |
| Net investment income: | | | | | | | | | | | | | | | |
| Class A | | (47,097,269 | ) | | | (52,888,906 | ) | | | (1,562,108 | ) | | | (1,588,071 | ) |
| Class C | | (5,251,049 | ) | | | (5,529,325 | ) | | | (215,455 | ) | | | (394,395 | ) |
| Class R | | (152,076 | ) | | | (193,924 | ) | | | — | | | | — | |
| Class R6 | | (180,060 | ) | | | (195 | ) | | | (21,887 | ) | | | (13,635 | ) |
| Advisor Class | | (1,422,902 | ) | | | (1,042,538 | ) | | | (429,016 | ) | | | (472,365 | ) |
| Net realized gains: | | | | | | | | | | | | | | | |
| Class A | | (46,499,582 | ) | | | (78,681,119 | ) | | | — | | | | — | |
| Class C | | (6,537,589 | ) | | | (10,878,951 | ) | | | — | | | | — | |
| Class R | | (161,343 | ) | | | (327,751 | ) | | | — | | | | — | |
| Class R6 | | (149 | ) | | | (266 | ) | | | — | | | | — | |
| Advisor Class | | (889,611 | ) | | | (1,523,577 | ) | | | — | | | | — | |
| Tax return of capital: | | | | | | | | | | | | | | | |
| Class A | | — | | | | — | | | | (243,513 | ) | | | — | |
| Class C | | — | | | | — | | | | (62,428 | ) | | | — | |
| Class R6 | | — | | | | — | | | | (3,525 | ) | | | — | |
| Advisor Class | | — | | | | — | | | | (50,006 | ) | | | — | |
| Total distributions to shareholders. | | (108,191,630 | ) | | | (151,066,552 | ) | | | (2,587,938 | ) | | | (2,468,466 | ) |
| Capital share transactions: (Note 2) | | | | | | | | | | | | | | | |
| Class A | | (53,673,051 | ) | | | 95,079,558 | | | | (26,641,058 | ) | | | (46,641,225 | ) |
| Class C | | 12,513,162 | | | | 18,093,330 | | | | (9,129,554 | ) | | | (15,672,201 | ) |
| Class R | | 252,727 | | | | (751,079 | ) | | | — | | | | — | |
| Class R6 | | 9,967,087 | | | | — | | | | 3,570,373 | | | | (174,433 | ) |
| Advisor Class | | 46,433,315 | | | | 5,763,786 | | | | (2,973,664 | ) | | | (24,725,271 | ) |
| Total capital share transactions | | 15,493,240 | | | | 118,185,595 | | | | (35,173,903 | ) | | | (87,213,130 | ) |
| Net increase (decrease) in net assets | | (26,365,808 | ) | | | 40,226,185 | | | | (31,663,866 | ) | | (111,179,534 | ) |
| Net assets: | | | | | | | | | | | | | | | |
| Beginning of year | | 2,081,586,969 | | | | 2,041,360,784 | | | | 273,314,205 | | | 384,493,739 | |
| End of year | $ | 2,055,221,161 | | $ | 2,081,586,969 | | $ | 241,650,339 | | $ | 273,314,205 | |
| Undistributed net investment income included in net assets: | | | | | | | | | | | | | | | |
| End of year | $ | 2,339,414 | | | $ | 6,313,216 | | | $ | — | | | $ | — | |
| Distributions in excess of net investment income included in | | | | | | | | | | | | | | | |
| net assets: | | | | | | | | | | | | | | | |
| End of year | $ | — | | | $ | — | | | $ | (4,592,709 | ) | | $ | (4,413,356 | ) |
franklintempleton.com
The accompanying notes are an integral part of these financial statements. | Annual Report 75
FRANKLIN INVESTORS SECURITIES TRUST
Notes to Financial Statements
1. Organization and Significant Accounting Policies
Franklin Investors Securities Trust (Trust) is registered under the Investment Company Act of 1940 (1940 Act) as an open-end management investment company, consisting of eight separate funds, four of which are included in this report (Funds) and applies the specialized accounting and reporting guidance in U.S. Generally Accepted Accounting Principles (U.S. GAAP). The financial statements of the remaining funds in the Trust are presented separately. The classes of shares offered within each of the Funds are indicated below. Each class of shares differs by its initial sales load, contingent deferred sales charges, voting rights on matters affecting a single class, its exchange privilege and fees primarily due to differing arrangements for distribution and transfer agent fees.
Class A, Class C, Class R, Class R6 & Advisor Class
Franklin Balanced Fund Franklin Equity Income Fund
Class A, Class C, Class R6 & Advisor Class
Franklin Convertible Securities Fund Franklin Real Return Fund
The following summarizes the Funds’ significant accounting policies.
a. Financial Instrument Valuation
The Funds’ investments in financial instruments are carried at fair value daily. Fair value is the price that would be received to sell an asset or paid to transfer a liability in an orderly transaction between market participants on the measurement date. The Funds calculate the net asset value (NAV) per share as of 4 p.m. Eastern time each day the New York Stock Exchange (NYSE) is open for trading. Under compliance policies and procedures approved by the Trust’s Board of Trustees (the Board), the Funds’ administrator has responsibility for oversight of valuation, including leading the cross-functional Valuation Committee (VC). The VC provides administration and oversight of the Funds’ valuation policies and procedures, which are approved annually by the Board. Among other things, these procedures allow the Funds to utilize independent pricing services, quotations from securities and financial instrument dealers, and other market sources to determine fair value.
Equity securities, exchange traded funds and derivative financial instruments listed on an exchange or on the NASDAQ National Market System are valued at the last quoted sale price or the official closing price of the day, respectively. Foreign equity securities are valued as of the close of trading on the foreign stock exchange on which the security is primarily traded or as of 4 p.m. Eastern time, whichever is earlier. The value is then converted into its U.S. dollar equivalent at the foreign exchange rate in effect at 4 p.m. Eastern time on the day that the value of the security is determined. Over-the-counter (OTC) securities are valued within the range of the most recent quoted bid and ask prices. Securities that trade in multiple markets or on multiple exchanges are valued according to the broadest and most representative market. Certain equity securities are valued based upon fundamental characteristics or relationships to similar securities.
Debt and certain preferred securities generally trade in the OTC market rather than on a securities exchange. The Funds’ pricing services use multiple valuation techniques to determine fair value. In instances where sufficient market activity exists, the pricing services may utilize a market-based approach through which quotes from market makers are used to determine fair value. In instances where sufficient market activity may not exist or is limited, the pricing services also utilize proprietary valuation models which may consider market characteristics such as benchmark yield curves, credit spreads, estimated default rates, anticipated market interest rate volatility, coupon rates, anticipated timing of principal repayments, underlying collateral, and other unique security features in order to estimate the relevant cash flows, which are then discounted to calculate the fair value. Securities denominated in a foreign currency are converted into their U.S. dollar equivalent at the foreign exchange rate in effect at 4 p.m. Eastern time on the date that the values of the foreign debt securities are determined.
Investments in open-end mutual funds are valued at the closing NAV. Investments in repurchase agreements are valued at cost, which approximates fair value.
Certain derivative financial instruments trade in the OTC market. The Funds’ pricing services use various techniques including industry standard option pricing models and proprietary discounted cash flow models to determine the fair value of those instruments. The Funds’ net benefit or obligation under the derivative contract, as measured by the fair value of the contract, is included in net assets.
76 Annual Report
franklintempleton.com
FRANKLIN INVESTORS SECURITIES TRUST
NOTES TO FINANCIAL STATEMENTS
The Funds have procedures to determine the fair value of financial instruments for which market prices are not reliable or readily available. Under these procedures, the VC convenes on a regular basis to review such financial instruments and considers a number of factors, including significant unobservable valuation inputs, when arriving at fair value. The VC primarily employs a market-based approach which may use related or comparable assets or liabilities, recent transactions, market multiples, book values, and other relevant information for the investment to determine the fair value of the investment. An income-based valuation approach may also be used in which the anticipated future cash flows of the investment are discounted to calculate fair value. Discounts may also be applied due to the nature or duration of any restrictions on the disposition of the investments. Due to the inherent uncertainty of valuations of such investments, the fair values may differ significantly from the values that would have been used had an active market existed. The VC employs various methods for calibrating these valuation approaches including a regular review of key inputs and assumptions, transactional back-testing or disposition analysis, and reviews of any related market activity.
Trading in securities on foreign securities stock exchanges and OTC markets may be completed before 4 p.m. Eastern time. In addition, trading in certain foreign markets may not take place on every NYSE business day. Occasionally, events occur between the time at which trading in a foreign security is completed and the close of the NYSE that might call into question the reliability of the value of a portfolio security held by the Fund. As a result, differences may arise between the value of the Funds’ portfolio securities as determined at the foreign market close and the latest indications of value at the close of the NYSE. In order to minimize the potential for these differences, the VC monitors price movements following the close of trading in foreign stock markets through a series of country specific market proxies (such as baskets of American Depositary Receipts, futures contracts and exchange traded funds). These price movements are measured against established trigger thresholds for each specific market proxy to assist in determining if an event has occurred that may call into question the reliability of the values of the foreign securities held by the Funds. If such an event occurs, the securities may be valued using fair value procedures, which may include the use of independent pricing services.
When the last day of the reporting period is a non-business day, certain foreign markets may be open on those days that the NYSE is closed, which could result in differences between the value of the Funds’ portfolio securities on the last business day and the last calendar day of the reporting period. Any significant security valuation changes due to an open foreign market are adjusted and reflected by the Funds for financial reporting purposes.
b. Foreign Currency Translation
Portfolio securities and other assets and liabilities denominated in foreign currencies are translated into U.S. dollars based on the exchange rate of such currencies against U.S. dollars on the date of valuation. The Funds may enter into foreign currency exchange contracts to facilitate transactions denominated in a foreign currency. Purchases and sales of securities, income and expense items denominated in foreign currencies are translated into U.S. dollars at the exchange rate in effect on the transaction date. Portfolio securities and assets and liabilities denominated in foreign currencies contain risks that those currencies will decline in value relative to the U.S. dollar. Occasionally, events may impact the availability or reliability of foreign exchange rates used to convert the U.S. dollar equivalent value. If such an event occurs, the foreign exchange rate will be valued at fair value using procedures established and approved by the Board.
The Funds do not separately report the effect of changes in foreign exchange rates from changes in market prices on securities held. Such changes are included in net realized and unrealized gain or loss from investments in the Statements of Operations.
Realized foreign exchange gains or losses arise from sales of foreign currencies, currency gains or losses realized between the trade and settlement dates on securities transactions and the difference between the recorded amounts of dividends, interest, and foreign withholding taxes and the U.S. dollar equivalent of the amounts actually received or paid. Net unrealized foreign exchange gains and losses arise from changes in foreign exchange rates on foreign denominated assets and liabilities other than investments in securities held at the end of the reporting period.
c. Joint Repurchase Agreement
Certain or all Funds enter into a joint repurchase agreement whereby their uninvested cash balance is deposited into a joint cash account with other funds managed by the investment
franklintempleton.com
Annual Report
77
FRANKLIN INVESTORS SECURITIES TRUST
NOTES TO FINANCIAL STATEMENTS
1. Organization and Significant Accounting
Policies (continued)
c. Joint Repurchase Agreement (continued)
manager or an affiliate of the investment manager and is used to invest in one or more repurchase agreements. The value and face amount of the joint repurchase agreement are allocated to the funds based on their pro-rata interest. A repurchase agreement is accounted for as a loan by the Fund to the seller, collateralized by securities which are delivered to the Funds’ custodian. The fair value, including accrued interest, of the initial collateralization is required to be at least 102% of the dollar amount invested by the funds, with the value of the underlying securities marked to market daily to maintain coverage of at least 100%. Repurchase agreements are subject to the terms of Master Repurchase Agreements (MRAs) with approved counterparties (sellers). The MRAs contain various provisions, including but not limited to events of default and maintenance of collateral for repurchase agreements. In the event of default by either the seller or the Funds, certain MRAs may permit the non-defaulting party to net and close-out all transactions, if any, traded under such agreements. The Funds may sell securities it holds as collateral and apply the proceeds towards the repurchase price and any other amounts owed by the seller to the Funds in the event of default by the seller. This could involve costs or delays in addition to a loss on the securities if their value falls below the repurchase price owed by the seller. The joint repurchase agreement held by the Funds at year end, as indicated in the Statements of Investments, had been entered into on October 31, 2016.
d. Securities Purchased on a Delayed Delivery Basis
Certain or all Funds purchase securities on a delayed delivery basis, with payment and delivery scheduled for a future date. These transactions are subject to market fluctuations and are subject to the risk that the value at delivery may be more or less than the trade date purchase price. Although the Funds will generally purchase these securities with the intention of holding the securities, they may sell the securities before the settlement date. Sufficient assets have been segregated for these securities.
e. Derivative Financial Instruments
Certain or all Funds invested in derivative financial instruments in order to manage risk or gain exposure to various other investments or markets. Derivatives are financial contracts based on an underlying or notional amount, require no initial investment or an initial net investment that is smaller than would normally be required to have a similar response to changes in market factors, and require or permit net settlement. Derivatives contain various risks including the potential inability of the counterparty to fulfill their obligations under the terms of the contract, the potential for an illiquid secondary market, and/or the potential for market movements which expose the Fund to gains or losses in excess of the amounts shown in the Statements of Assets and Liabilities. Realized gain and loss and unrealized appreciation and depreciation on these contracts for the period are included in the Statements of Operations.
Derivative counterparty credit risk is managed through a formal evaluation of the creditworthiness of all potential counter-parties. Certain or all Funds attempt to reduce their exposure to counterparty credit risk on OTC derivatives, whenever possible, by entering into International Swaps and Derivatives Association (ISDA) master agreements with certain counterparties. These agreements contain various provisions, including but not limited to collateral requirements, events of default, or early termination. Termination events applicable to the counterparty include certain deteriorations in the credit quality of the counterparty. Termination events applicable to the Funds include failure of the Funds to maintain certain net asset levels and/or limit the decline in net assets over various periods of time. In the event of default or early termination, the ISDA master agreement gives the non-defaulting party the right to net and close-out all transactions traded, whether or not arising under the ISDA agreement, to one net amount payable by one counterparty to the other. However, absent an event of default or early termination, OTC derivative assets and liabilities are presented gross and not offset in the Statements of Assets and Liabilities. Early termination by the counterparty may result in an immediate payment by the Funds of any net liability owed to that counterparty under the ISDA agreement. At October 31, 2016, Franklin Real Return Fund had no OTC derivatives in a net liability position for such contracts.
Collateral requirements differ by type of derivative. Collateral or initial margin requirements are set by the broker or exchange clearing house for exchange traded and centrally cleared derivatives. Initial margin deposited is held at the exchange and can be in the form of cash and/or securities. For OTC derivatives traded under an ISDA master agreement, posting of collateral is required by either the Fund or the applicable counterparty if the total net exposure of all OTC derivatives
78 Annual Report
franklintempleton.com
FRANKLIN INVESTORS SECURITIES TRUST
NOTES TO FINANCIAL STATEMENTS
with the applicable counterparty exceeds the minimum transfer amount, which typically ranges from $100,000 to $250,000, and can vary depending on the counterparty and the type of the agreement. Generally, collateral is determined at the close of Fund business each day and any additional collateral required due to changes in derivative values may be delivered by the Fund or the counterparty within a few business days. Collateral pledged and/or received by the Fund for OTC derivatives, if any, is held in segregated accounts with the Fund’s custodian/counterparty broker and can be in the form of cash and/or securities. Unrestricted cash may be invested according to the Funds’ investment objectives. To the extent that the amounts due to the Fund from its counterparties are not subject to collateralization or are not fully collateralized, the Fund bears the risk of loss from counterparty non-performance.
Certain or all Funds entered into OTC forward exchange contracts primarily to manage and/or gain exposure to certain foreign currencies. A forward exchange contract is an agreement between the Fund and a counterparty to buy or sell a foreign currency at a specific exchange rate on a future date.
Certain or all Funds purchased or wrote exchange traded option contracts primarily to manage and/or gain exposure to equity price risk. An option is a contract entitling the holder to purchase or sell a specific amount of shares or units of an asset or notional amount of a swap (swaption), at a specified price. When an option is purchased or written, an amount equal to the premium paid or received is recorded as an asset or liability, respectively. Upon exercise of an option, the acquisition cost or sales proceeds of the underlying investment is adjusted by any premium received or paid. Upon expiration of an option, any premium received or paid is recorded as a realized gain or loss. Upon closing an option other than through expiration or exercise, the difference between the premium received or paid and the cost to close the position is recorded as a realized gain or loss.
See Notes 6 and 8 regarding investment transactions and other derivative information, respectively.
f. Restricted Cash
At October 31, 2016, certain or all Funds held restricted cash in connection with investments in certain derivative securities. Restricted cash is held in a segregated account with the Fund’s custodian and is reflected in the Statements of Assets and Liabilities.
g. Equity-Linked Securities
Certain or all Funds invest in equity-linked securities. Equity-linked securities are hybrid financial instruments that generally combine both debt and equity characteristics into a single note form. Income received from equity-linked securities is recorded as realized gains in the Statements of Operations and may be based on the performance of an underlying equity security, an equity index, or an option position. The risks of investing in equity-linked securities include unfavorable price movements in the underlying security and the credit risk of the issuing financial institution. There may be no guarantee of a return of principal with equity-linked securities and the appreciation potential may be limited. Equity-linked securities may be more volatile and less liquid than other investments held by the Funds.
h. Senior Floating Rate Interests
Certain or all Funds invest in senior secured corporate loans that pay interest at rates which are periodically reset by reference to a base lending rate plus a spread. These base lending rates are generally the prime rate offered by a designated U.S. bank or the London InterBank Offered Rate (LIBOR). Senior secured corporate loans often require prepayment of principal from excess cash flows or at the discretion of the borrower. As a result, actual maturity may be substantially less than the stated maturity. Senior secured corporate loans in which the Funds invest are generally readily marketable, but may be subject to certain restrictions on resale.
i. Income and Deferred Taxes
It is each Fund’s policy to qualify as a regulated investment company under the Internal Revenue Code. Each Fund intends to distribute to shareholders substantially all of its taxable income and net realized gains to relieve it from federal income and excise taxes. As a result, no provision for U.S. federal income taxes is required.
The Funds may be subject to foreign taxation related to income received, capital gains on the sale of securities and certain foreign currency transactions in the foreign jurisdictions in which the Funds invest. Foreign taxes, if any, are recorded based on the tax regulations and rates that exist in the foreign markets in which the Funds invest. When a capital gain tax is determined to apply, the Funds record an estimated deferred tax liability in an amount that would be payable if the securities were disposed of on the valuation date. As a result of several
franklintempleton.com
Annual Report
79
FRANKLIN INVESTORS SECURITIES TRUST
NOTES TO FINANCIAL STATEMENTS
1. Organization and Significant Accounting
Policies (continued)
i. Income and Deferred Taxes (continued)
court cases, in certain countries across the European Union, certain or all Funds filed additional tax reclaims for previously withheld taxes on dividends earned in those countries (EU reclaims). These additional filings are subject to various administrative proceedings by the local jurisdictions’ tax authorities within the European Union, as well as a number of related judicial proceedings. Income recognized, if any, for EU reclaims is reflected as other income in the Statements of Operations and any related receivable, if any, is reflected as European Union tax reclaims in the Statements of Assets and Liabilities. When uncertainty exists as to the ultimate resolution of these proceedings, the likelihood of receipt of these EU reclaims, and the potential timing of payment, no amounts are reflected in the financial statements.
Each Fund may recognize an income tax liability related to its uncertain tax positions under U.S. GAAP when the uncertain tax position has a less than 50% probability that it will be sustained upon examination by the tax authorities based on its technical merits. As of October 31, 2016, each Fund has determined that no tax liability is required in its financial statements related to uncertain tax positions for any open tax years (or expected to be taken in future tax years). Open tax years are those that remain subject to examination and are based on each tax jurisdiction’s statute of limitation.
j. Security Transactions, Investment Income, Expenses and Distributions
Security transactions are accounted for on trade date. Realized gains and losses on security transactions are determined on a specific identification basis. Interest income and estimated expenses are accrued daily. Amortization of premium and accretion of discount on debt securities are included in interest income. Facility fees are recognized as income over the expected term of the loan. Dividend income is recorded on the ex-dividend date except for certain dividends from securities where the dividend rate is not available. In such cases, the dividend is recorded as soon as the information is received by the Funds. Distributions to shareholders are recorded on the ex-dividend date and are determined according to income tax regulations (tax basis). Distributable earnings determined on a tax basis may differ from earnings recorded in accordance with
U.S. GAAP. These differences may be permanent or temporary. Permanent differences are reclassified among capital accounts to reflect their tax character. These reclassifications have no impact on net assets or the results of operations. Temporary differences are not reclassified, as they may reverse in subsequent periods.
Common expenses incurred by the Trust are allocated among the Funds based on the ratio of net assets of each Fund to the combined net assets of the Trust. Fund specific expenses are charged directly to the Fund that incurred the expense.
Realized and unrealized gains and losses and net investment income, not including class specific expenses, are allocated daily to each class of shares based upon the relative proportion of net assets of each class. Differences in per share distributions, by class, are generally due to differences in class specific expenses.
Inflation-indexed bonds are adjusted for inflation through periodic increases or decreases in the security’s interest accruals, face amount, or principal redemption value, by amounts corresponding to the rate of inflation as measured by an index. Any increase or decrease in the face amount or principal redemption value will be included as inflation principal adjustments in the Statements of Operations.
k. Accounting Estimates
The preparation of financial statements in accordance with U.S. GAAP requires management to make estimates and assumptions that affect the reported amounts of assets and liabilities at the date of the financial statements and the amounts of income and expenses during the reporting period. Actual results could differ from those estimates.
l. Guarantees and Indemnifications
Under the Trust’s organizational documents, its officers and trustees are indemnified by the Trust against certain liabilities arising out of the performance of their duties to the Trust. Additionally, in the normal course of business, the Trust, on behalf of the Funds, enters into contracts with service providers that contain general indemnification clauses. The Trust’s maximum exposure under these arrangements is unknown as this would involve future claims that may be made against the Trust that have not yet occurred. Currently, the Trust expects the risk of loss to be remote.
80 Annual Report
franklintempleton.com
FRANKLIN INVESTORS SECURITIES TRUST
NOTES TO FINANCIAL STATEMENTS
2. Shares of Beneficial Interest
At October 31, 2016, there were an unlimited number of shares authorized (without par value). Transactions in the Funds’ shares were as follows:
| | | | | | | | | | | |
| | Franklin | | | Franklin | |
| | Balanced Fund | | Convertible Securities Fund | |
| | Shares | | | Amount | | Shares | | | Amount | |
| Class A Shares: | | | | | | | | | | | |
| Year ended October 31, 2016 | | | | | | | | | | | |
| Shares sold | 59,288,525 | | $ | 669,112,660 | | 9,476,768 | | $ | 168,154,565 | |
| Shares issued in reinvestment of distributions | 6,894,113 | | | | 77,791,246 | | 2,018,714 | | | 35,174,653 | |
| Shares redeemed | (56,715,686 | ) | | (644,598,561 | ) | (14,805,915 | ) | | (257,895,736 | ) |
| Net increase (decrease) | 9,466,952 | | $ | 102,305,345 | | (3,310,433 | ) | $ | (54,566,518 | ) |
| Year ended October 31, 2015 | | | | | | | | | | | |
| Shares sold | 58,341,044 | | $ | 678,734,826 | | 15,996,161 | | $ | 295,084,541 | |
| Shares issued in reinvestment of distributions | 8,328,938 | | | | 96,129,984 | | 2,736,597 | | | 48,590,091 | |
| Shares redeemed | (31,758,555 | ) | | (366,605,238 | ) | (21,831,783 | ) | | (398,710,646 | ) |
| Net increase (decrease) | 34,911,427 | | $ | 408,259,572 | | (3,099,025 | ) | $ | (55,036,014 | ) |
| Class C Shares: | | | | | | | | | | | |
| Year ended October 31, 2016 | | | | | | | | | | | |
| Shares sold | 17,111,710 | | $ | 191,037,224 | | 1,949,088 | | $ | 33,909,433 | |
| Shares issued in reinvestment of distributions | 1,240,417 | | | | 13,880,631 | | 589,732 | | | 10,122,973 | |
| Shares redeemed | (13,610,128 | ) | | (151,742,110 | ) | (3,808,818 | ) | | (65,824,391 | ) |
| Net increase (decrease) | 4,741,999 | | | $ | 53,175,745 | | (1,269,998 | ) | $ | (21,791,985 | ) |
| Year ended October 31, 2015 | | | | | | | | | | | |
| Shares sold | 16,412,206 | | $ | 189,653,141 | | 2,203,232 | | $ | 39,873,587 | |
| Shares issued in reinvestment of distributions | 1,614,671 | | | | 18,479,927 | | 751,799 | | | 13,156,989 | |
| Shares redeemed | (10,038,264 | ) | | (114,629,550 | ) | (3,166,992 | ) | | (57,308,972 | ) |
| Net increase (decrease) | 7,988,613 | | | $ | 93,503,518 | | (211,961 | ) | $ | (4,278,396 | ) |
| Class R Shares: | | | | | | | | | | | |
| Year ended October 31, 2016 | | | | | | | | | | | |
| Shares sold | 132,632 | | | $ | 1,496,201 | | | | | | |
| Shares issued in reinvestment of distributions | 11,661 | | | | 131,808 | | | | | | |
| Shares redeemed | (171,599 | ) | | | (1,916,005 | ) | | | | | |
| Net increase (decrease) | (27,306 | ) | | $ | (287,996 | ) | | | | | |
| Year ended October 31, 2015 | | | | | | | | | | | |
| Shares sold | 163,363 | | | $ | 1,900,373 | | | | | | |
| Shares issued in reinvestment of distributions | 15,593 | | | | 180,307 | | | | | | |
| Shares redeemed | (70,206 | ) | | | (810,692 | ) | | | | | |
| Net increase (decrease) | 108,750 | | | $ | 1,269,988 | | | | | | |
franklintempleton.com
Annual Report
81
| | | | | | | | | | | | |
| FRANKLIN INVESTORS SECURITIES TRUST | | | | | | | | | | | | |
| NOTES TO FINANCIAL STATEMENTS | | | | | | | | | | | | |
| |
| |
| |
| |
| 2. Shares of Beneficial Interest (continued) | | | | | | | | | | | | |
| |
| | Franklin | | | Franklin | |
| | Balanced Fund | | Convertible Securities Fund | |
| | Shares | | | Amount | | Shares | | | | Amount | |
| Class R6 Shares: | | | | | | | | | | | | |
| Year ended October 31, 2016 | | | | | | | | | | | | |
| Shares sold | 3,047 | | | $ | 34,245 | | 788,664 | | | $ | 13,994,019 | |
| Shares issued in reinvestment of distributions | 740 | | | | 8,369 | | 4,845 | | | | 88,899 | |
| Shares redeemed | (3,180 | ) | | | (37,349 | ) | (403,594 | ) | | | (7,215,431 | ) |
| Net increase (decrease) | 607 | | | $ | 5,265 | | 389,915 | | | $ | 6,867,487 | |
| Year ended October 31, 2015 | | | | | | | | | | | | |
| Shares sold | 4,434 | | | $ | 51,485 | | 272 | | | $ | 5,000 | |
| Shares issued in reinvestment of distributions | 1,610 | | | | 18,640 | | 9,077 | | | | 161,165 | |
| Shares redeemed | (29,769 | ) | | | (354,572 | ) | (171,980 | ) | | | (3,169,451 | ) |
| Net increase (decrease) | (23,725 | ) | | $ | (284,447 | ) | (162,631 | ) | | $ | (3,003,286 | ) |
| Advisor Class Shares: | | | | | | | | | | | | |
| Year ended October 31, 2016 | | | | | | | | | | | | |
| Shares sold | 14,391,414 | | $ | 167,114,896 | | 44,182,146 | | $ | 748,163,852 | |
| Shares issued in reinvestment of distributions | 204,315 | | | | 2,323,814 | | 2,236,760 | | | | 39,111,889 | |
| Shares redeemed | (7,564,701 | ) | | (87,652,347 | ) | (37,152,701 | ) | | (639,104,671 | ) |
| Net increase (decrease) | 7,031,028 | | | $ | 81,786,363 | | 9,266,205 | | $ | 148,171,070 | |
| Year ended October 31, 2015 | | | | | | | | | | | | |
| Shares sold | 3,112,842 | | | $ | 35,919,601 | | 31,770,692 | | $ | 581,733,680 | |
| Shares issued in reinvestment of distributions | 172,717 | | | | 1,998,279 | | 2,529,808 | | | | 45,025,673 | |
| Shares redeemed | (1,971,010 | ) | | (22,810,919 | ) | (30,555,895 | ) | | (552,790,095 | ) |
| Net increase (decrease) | 1,314,549 | | | $ | 15,106,961 | | 3,744,605 | | | $ | 73,969,258 | |
| |
| |
| | Franklin | | Franklin | |
| | Equity Income Fund | | Real Return Fund | |
| | Shares | | | | Amount | | Shares | | | | Amount | |
| Class A Shares: | | | | | | | | | | | | |
| Year ended October 31, 2016 | | | | | | | | | | | | |
| Shares sold | 10,955,507 | | $ | 240,824,766 | | 2,920,637 | | $ | 28,866,525 | |
| Shares issued in reinvestment of distributions | 4,189,138 | | | | 91,549,334 | | 182,566 | | | | 1,756,283 | |
| Shares redeemed | (17,422,052 | ) | | | (386,047,151 | ) | (5,823,642 | ) | | | (57,263,866 | ) |
| Net increase (decrease) | (2,277,407 | ) | $ | (53,673,051 | ) | (2,720,439 | ) | $ | (26,641,058 | ) |
| Year ended October 31, 2015 | | | | | | | | | | | | |
| Shares sold | 10,456,818 | | $ | 240,034,722 | | 2,322,585 | | $ | 23,857,606 | |
| Shares issued in reinvestment of distributions | 5,707,305 | | | | 128,177,676 | | 145,574 | | | | 1,511,730 | |
| Shares redeemed | (11,940,634 | ) | | | (273,132,840 | ) | (7,038,513 | ) | | | (72,010,561 | ) |
| Net increase (decrease) | 4,223,489 | | $ | 95,079,558 | | (4,570,354 | ) | $ | (46,641,225 | ) |
82 Annual Report
franklintempleton.com
FRANKLIN INVESTORS SECURITIES TRUST
NOTES TO FINANCIAL STATEMENTS
| | | | | | | | | | | |
| | Franklin | | | Franklin | |
| | Equity Income Fund | | Real Return Fund | |
| | Shares | | Amount | | Shares | | | | Amount | |
| Class C Shares: | | | | | | | | | | | |
| Year ended October 31, 2016 | | | | | | | | | | | |
| Shares sold | 2,665,652 | | $ | 58,334,909 | | 625,724 | | | $ | 6,130,419 | |
| Shares issued in reinvestment of distributions | 516,181 | | | 11,198,526 | | 28,218 | | | | 269,761 | |
| Shares redeemed | (2,617,595 | ) | (57,020,273 | ) | (1,591,824 | ) | | (15,529,734 | ) |
| Net increase (decrease) | 564,238 | | $ | 12,513,162 | | (937,882 | ) | $ | (9,129,554 | ) |
| Year ended October 31, 2015 | | | | | | | | | | | |
| Shares sold | 2,326,522 | | $ | 53,166,635 | | 468,524 | | | $ | 4,780,847 | |
| Shares issued in reinvestment of distributions | 703,433 | | | 15,672,536 | | 36,785 | | | | 379,592 | |
| Shares redeemed | (2,227,554 | ) | (50,745,841 | ) | (2,047,828 | ) | | (20,832,640 | ) |
| Net increase (decrease) | 802,401 | | $ | 18,093,330 | | (1,542,519 | ) | $ | (15,672,201 | ) |
| Class R Shares: | | | | | | | | | | | |
| Year ended October 31, 2016 | | | | | | | | | | | |
| Shares sold | 83,578 | | $ | 1,810,529 | | | | | | | |
| Shares issued in reinvestment of distributions | 12,662 | | | 276,699 | | | | | | | |
| Shares redeemed | (84,438 | ) | | (1,834,501 | ) | | | | | | |
| Net increase (decrease) | 11,802 | | $ | 252,727 | | | | | | | |
| Year ended October 31, 2015 | | | | | | | | | | | |
| Shares sold | 58,721 | | $ | 1,354,831 | | | | | | | |
| Shares issued in reinvestment of distributions | 21,048 | | | 472,310 | | | | | | | |
| Shares redeemed | (112,528 | ) | | (2,578,220 | ) | | | | | | |
| Net increase (decrease) | (32,759 | ) | $ | (751,079 | ) | | | | | | |
| Class R6 Shares: | | | | | | | | | | | |
| Year ended October 31, 2016 | | | | | | | | | | | |
| Shares sold | 537,262 | | $ | 11,541,244 | | 414,897 | | | $ | 4,196,219 | |
| Shares issued in reinvestment of distributions | 84 | | | 1,876 | | 9 | | | | 93 | |
| Shares redeemed | (70,059 | ) | | (1,576,033 | ) | (63,409 | ) | | | (625,939 | ) |
| Net increase (decrease) | 467,287 | | $ | 9,967,087 | | 351,497 | | | $ | 3,570,373 | |
| Year ended October 31, 2015 | | | | | | | | | | | |
| Shares sold | — | | $ | — | | 34,529 | | | $ | 354,907 | |
| Shares issued in reinvestment of distributions | — | | | — | | 4 | | | | 41 | |
| Shares redeemed | — | | | — | | (51,465 | ) | | | (529,381 | ) |
| Net increase (decrease) | — | | $ | — | | (16,932 | ) | | $ | (174,433 | ) |
| Advisor Class Shares: | | | | | | | | | | | |
| Year ended October 31, 2016 | | | | | | | | | | | |
| Shares sold | 4,153,049 | | $ | 93,471,028 | | 1,852,276 | | $ | 18,341,311 | |
| Shares issued in reinvestment of distributions | 95,903 | | | 2,107,308 | | 47,451 | | | | 457,432 | |
| Shares redeemed | (2,181,835 | ) | (49,145,021 | ) | (2,214,965 | ) | | (21,772,407 | ) |
| Net increase (decrease) | 2,067,117 | | $ | 46,433,315 | | (315,238 | ) | $ | (2,973,664 | ) |
| Year ended October 31, 2015 | | | | | | | | | | | |
| Shares sold | 762,782 | | $ | 17,712,527 | | 3,343,973 | | $ | 34,412,614 | |
| Shares issued in reinvestment of distributions | 96,069 | | | 2,160,788 | | 43,881 | | | | 456,992 | |
| Shares redeemed | (615,943 | ) | (14,109,529 | ) | (5,772,116 | ) | | (59,594,877 | ) |
| Net increase (decrease) | 242,908 | | $ | 5,763,786 | | (2,384,262 | ) | $ | (24,725,271 | ) |
franklintempleton.com
Annual Report
83
FRANKLIN INVESTORS SECURITIES TRUST
NOTES TO FINANCIAL STATEMENTS
3. Transactions with Affiliates
Franklin Resources, Inc. is the holding company for various subsidiaries that together are referred to as Franklin Templeton Investments. Certain officers and trustees of the Trust are also officers and/or directors of the following subsidiaries:
| |
| Subsidiary | Affiliation |
| Franklin Advisers, Inc. (Advisers) | Investment manager |
| Franklin Templeton Services, LLC (FT Services) | Administrative manager |
| Franklin Templeton Distributors, Inc. (Distributors) | Principal underwriter |
| Franklin Templeton Investor Services, LLC (Investor Services) | Transfer agent |
a. Management Fees
Franklin Balanced Fund pays an investment management fee to Advisers based on the average daily net assets of the Fund as follows:
| | |
| Annualized Fee Rate | | Net Assets |
| 0.700 | % | Up to and including $250 million |
| 0.675 | % | Over $250 million, up to and including $500 million |
| 0.650 | % | Over $500 million, up to and including $1 billion |
| 0.625 | % | Over $1 billion, up to and including $2.5 billion |
| 0.600 | % | Over $2.5 billion, up to and including $5 billion |
| 0.575 | % | Over $5 billion, up to and including $10 billion |
| 0.550 | % | Over $10 billion, up to and including $15 billion |
| 0.525 | % | Over $15 billion, up to and including $20 billion |
| 0.500 | % | In excess of $20 billion |
Franklin Convertible Securities Fund and Franklin Equity Income Fund pay an investment management fee to Advisers based on the month-end net assets of each of the Funds as follows:
| | |
| Annualized Fee Rate | | Net Assets |
| 0.625 | % | Up to and including $100 million |
| 0.500 | % | Over $100 million, up to and including $250 million |
| 0.450 | % | Over $250 million, up to and including $7.5 billion |
| 0.440 | % | Over $7.5 billion, up to and including $10 billion |
| 0.430 | % | Over $10 billion, up to and including $12.5 billion |
| 0.420 | % | Over $12.5 billion, up to and including $15 billion |
| 0.400 | % | Over $15 billion, up to and including $17.5 billion |
| 0.380 | % | Over $17.5 billion, up to and including $20 billion |
| 0.360 | % | Over $20 billion, up to and including $35 billion |
| 0.355 | % | Over $35 billion, up to and including $50 billion |
| 0.350 | % | In excess of $50 billion |
84 Annual Report
franklintempleton.com
FRANKLIN INVESTORS SECURITIES TRUST
NOTES TO FINANCIAL STATEMENTS
Franklin Real Return Fund pays an investment management fee to Advisers based on the average daily net assets of the Fund as follows:
| | |
| Annualized Fee Rate | | Net Assets |
| 0.625 | % | Up to and including $500 million |
| 0.525 | % | Over $500 million, up to and including $1 billion |
| 0.480 | % | Over $1 billion, up to and including $1.5 billion |
| 0.435 | % | Over $1.5 billion, up to and including $6.5 billion |
| 0.415 | % | Over $6.5 billion, up to and including $11.5 billion |
| 0.400 | % | Over $11.5 billion, up to and including $16.5 billion |
| 0.390 | % | Over $16.5 billion, up to and including $19 billion |
| 0.380 | % | Over $19 billion, up to and including $21.5 billion |
| 0.370 | % | In excess of $21.5 billion |
For the year ended October 31, 2016, each Fund’s effective investment management fee rate based on average daily net assets was as follows:
| | | | | | | |
| | | Franklin | | | | | |
| Franklin | | Convertible | | Franklin Equity | | Franklin Real | |
| Balanced Fund | | Securities Fund | | Income Fund | | Return Fund | |
| |
| 0.633 | % | 0.465 | % | 0.464 | % | 0.625 | % |
b. Administrative Fees
Under an agreement with Advisers, FT Services provides administrative services to the Funds. The fee is paid by Advisers based on each of the Funds’ average daily net assets, and is not an additional expense of the Funds.
c. Distribution Fees
The Board has adopted distribution plans for each share class, with the exception of Class R6 and Advisor Class shares, pursuant to Rule 12b-1 under the 1940 Act. Under the Funds’ Class A reimbursement distribution plans, the Funds reimburse Distributors for costs incurred in connection with the servicing, sale and distribution of each Fund’s shares up to the maximum annual plan rate for each class. Under the Class A reimbursement distribution plans, costs exceeding the maximum for the current plan year cannot be reimbursed in subsequent periods. In addition, under the Funds’ Class C and R compensation distribution plans, the Funds pay Distributors for costs incurred in connection with the servicing, sale and distribution of each Fund’s shares up to the maximum annual plan rate for each class. The plan year, for purposes of monitoring compliance with the maximum annual plan rates, is February 1 through January 31 for each Fund.
The maximum annual plan rates, based on the average daily net assets, for each class, are as follows:
| | | | | | | | |
| | | | Franklin | | | | | |
| | Franklin | | Convertible | | Franklin Equity | | Franklin Real | |
| | Balanced Fund | | Securities Fund | | Income Fund | | Return Fund | |
| |
| Reimbursement Plans: | | | | | | | | |
| Class A | 0.35 | % | 0.25 | % | 0.25 | % | 0.25 | % |
| Compensation Plans: | | | | | | | | |
| Class C. | 1.00 | % | 1.00 | % | 1.00 | % | 0.65 | % |
| Class R. | 0.50 | % | — | | 0.50 | % | — | |
For Franklin Balanced Fund, the Board has set the current rate at 0.25% per year for Class A shares until further notice and approval by the Board.
franklintempleton.com
Annual Report
85
FRANKLIN INVESTORS SECURITIES TRUST
NOTES TO FINANCIAL STATEMENTS
| 3. | Transactions with Affiliates (continued) |
| d. | Sales Charges/Underwriting Agreements |
Front-end sales charges and contingent deferred sales charges (CDSC) do not represent expenses of the Funds. These charges are deducted from the proceeds of sales of fund shares prior to investment or from redemption proceeds prior to remittance, as applicable. Distributors has advised the Funds of the following commission transactions related to the sales and redemptions of the Funds’ shares for the year:
| | | | | | | | |
| | | | | Franklin | | | | |
| | | Franklin | | Convertible | | Franklin Equity | | Franklin Real |
| | | Balanced Fund | | Securities Fund | | Income Fund | | Return Fund |
| |
| Sales charges retained net of commissions paid to | | | | | | | | |
| unaffiliated brokers/dealers | $ | 1,481,042 | $ | 155,984 | $ | 591,142 | $ | 30,136 |
| CDSC retained | $ | 96,741 | $ | 17,036 | $ | 25,587 | $ | 5,405 |
e. Transfer Agent Fees
Each class of shares, except for Class R6, pays transfer agent fees to Investor Services for its performance of shareholder servicing obligations and reimburses Investor Services for out of pocket expenses incurred, including shareholder servicing fees paid to third parties. These fees are allocated daily based upon their relative proportion of such classes’ aggregate net assets. Class R6 pays Investor Services transfer agent fees specific to that class.
For the year ended October 31, 2016, the Funds paid transfer agent fees as noted in the Statements of Operations of which the following amounts were retained by Investor Services:
| | | | | | | | |
| | | | | Franklin | | | | |
| | | Franklin | | Convertible | | Franklin Equity | | Franklin Real |
| | | Balanced Fund | | Securities Fund | | Income Fund | | Return Fund |
| |
| Transfer agent fees | $ | 1,208,879 | $ | 793,228 | $ | 991,467 | $ | 196,708 |
f. Investments in Affiliated Management Investment Companies
Certain or all Funds invest in one or more affiliated management investment companies for purposes other than exercising a controlling influence over the management or policies. Management fees paid by the Funds are waived on assets invested in the affiliated management investment companies, as noted in the Statements of Operations, in an amount not to exceed the management and administrative fees paid directly or indirectly by each affiliate. Prior to November 1, 2013, the waiver was accounted for as a reduction to management fees. During the year ended October 31, 2016, certain or all Funds held investments in affiliated
| | | | | | | | | | | | | |
| management investment companies as follows: | | | | | | | | | | | |
| |
| | | | | | | | | | | | | % of | |
| | | | | | | | | | | | | Affiliated | |
| | Number of | | | | Number of | | | | | | | Fund Shares | |
| | Shares Held | | | | Shares | | Value | | | | | Outstanding | |
| | at Beginning | Gross | Gross | | Held at End | | at End | | Investment | | Realized | Held at End | |
| | of Year | Additions | Reductions | | of Year | | of Year | | Income | | Gain (Loss) | of Year | |
| |
| Franklin Balanced Fund | | | | | | | | | | | | | |
| Non-Controlled Affiliates | | | | | | | | | | | | | |
| Institutional Fiduciary Trust | | | | | | | | | | | | | |
| Money Market Portfolio | 229,883,180 | 1,244,451,556 | (1,353,470,773 | ) | 120,863,963 | $ | 120,863,963 | $ | – | $ | – | 0.7 | % |
| |
| Franklin Convertible | | | | | | | | | | | | | |
| Securities Fund | | | | | | | | | | | | | |
| Non-Controlled Affiliates | | | | | | | | | | | | | |
| Institutional Fiduciary Trust | | | | | | | | | | | | | |
| Money Market Portfolio | 65,178,257 | 475,797,447 | (442,460,339 | ) | 98,515,365 | $ | 98,515,365 | $ | – | $ | – | 0.6 | % |
86 Annual Report
franklintempleton.com
FRANKLIN INVESTORS SECURITIES TRUST
NOTES TO FINANCIAL STATEMENTS
| | | | | | | | | | | | | | |
| | | | | | | | | | | | | | % of | |
| | | | | | | | | | | | | | Affiliated | |
| | Number of | | | | | Number of | | | | | | | Fund Shares | |
| | Shares Held | | | | | Shares | | Value | | | | | Outstanding | |
| | at Beginning | Gross | | Gross | | Held at End | | at End | | Investment | | Realized | Held at End | |
| | of Year | Additions | | Reductions | | of Year | | of Year | | Income | | Gain (Loss) | of Year | |
| |
| Franklin Equity Income Fund | | | | | | | | | | | | | | |
| Non-Controlled Affiliates | | | | | | | | | | | | | | |
| Institutional Fiduciary Trust | | | | | | | | | | | | | | |
| Money Market Portfolio | 45,153,270 | 598,291,457 | | (593,253,255 | ) | 50,191,472 | $ | 50,191,472 | $ | – | $ | – | 0.3 | % |
| |
| Franklin Real Return Fund | | | | | | | | | | | | | | |
| Non-Controlled Affiliates | | | | | | | | | | | | | | |
| Franklin Lower Tier Floating | | | | | | | | | | | | | | |
| RateFund | – | 280,073 | a | – | | 280,073 | $ | 2,909,964 | $ | 247,744 | $ | – | 0.6 | % |
| Franklin Middle Tier Floating | | | | | | | | | | | | | | |
| RateFund | – | 105,222 | b | – | | 105,222 | | 1,058,531 | | 58,269 | | – | 0.3 | % |
| |
| Total | | | | | | | $ | 3,968,495 | $ | 306,013 | $ | – | | |
aThe Fund purchased shares of the affiliate through an in-kind transfer of securities. The securities transferred had a market value of $2,519,518 and a cost basis of
$2,868,716 on the date of the transfer.
bThe Fund purchased shares of the affiliate through an in-kind transfer of securities. The securities transferred had a market value of $983,344 and a cost basis of $1,046,227
on the date of the transfer.
g. Waiver and Expense Reimbursements
Advisers and Investor Services have contractually agreed in advance to waive or limit their respective fees and to assume as their own expense certain expenses otherwise payable by Franklin Real Return Fund so that the expenses (excluding distribution fees, and acquired fund fees and expenses) for Class A, Class C, and Advisor Class of the Fund do not exceed 0.65% and Class R6 does not exceed 0.50% based on the average net assets of each class (other than certain non-routine expenses or costs, including those relating to litigation, indemnification, reorganizations, and liquidations) until February 28, 2017. Total expenses waived or paid are not subject to recapture subsequent to the Fund’s fiscal year end.
Additionally, Investor Services has contractually agreed in advance to waive or limit its fees so that the Class R6 transfer agent fees do not exceed 0.01% until February 28, 2017. For Franklin Equity Income Fund there were no Class R6 transfer agent fees waived during the year ended October 31, 2016.
4. Expense Offset Arrangement
The Funds have entered into an arrangement with their custodian whereby credits realized as a result of uninvested cash balances are used to reduce a portion of the Funds’ custodian expenses. During the year ended October 31, 2016, the custodian fees were reduced as noted in the Statements of Operations.
5. Income Taxes
For tax purposes, capital losses may be carried over to offset future capital gains. Capital loss carryforwards with no expiration, if any, must be fully utilized before those losses with expiration dates.
franklintempleton.com
Annual Report
87
FRANKLIN INVESTORS SECURITIES TRUST
NOTES TO FINANCIAL STATEMENTS
5. Income Taxes (continued)
At October 31, 2016, the capital loss carryforwards were as follows:
| | |
| | | Franklin Real |
| | | Return Fund |
| Capital loss carryforwards subject to expiration: | | |
| 2017 | $ | 1,207,907 |
| 2018 | | 1,206,586 |
| Capital loss carryforwards not subject to expiration: | | |
| Short term | | 842,781 |
| Long term | | 23,558,304 |
| Total capital loss carryforwards | $ | 26,815,578 |
During the year ended October 31, 2016, Franklin Balanced Fund utilized $10,087,871 of capital loss carryforwards.
On October 31, 2016, the Franklin Real Return Fund had expired capital loss carryforwards of $1,161,482, which were reclassified to paid-in capital.
The tax character of distributions paid during the years ended October 31, 2016 and 2015, was as follows:
| | | | | | | | | |
| | | Franklin | | Franklin | |
| | | Balanced Fund | | Convertible Securities Fund |
| | | 2016 | | 2015 | | 2016 | | | 2015 |
| Distributions paid from: | | | | | | | | | |
| Ordinary income | $ | 97,109,030 | $ | 85,303,669 | $ | 56,750,958 | $ | 62,644,614 |
| Long term capital gain | | 256,166 | | 35,344,851 | | 37,643,531 | | 58,117,697 |
| | $ | 97,365,196 | $ | 120,648,520 | $ | 94,394,489 | $ | 120,762,311 |
| |
| | | Franklin | | Franklin | |
| | | Equity Income Fund | | Real Return Fund |
| | | 2016 | | 2015 | | 2016 | | | 2015 |
| Distributions paid from: | | | | | | | | | |
| Ordinary income | $ | 54,103,356 | $ | 82,741,067 | $ | 1,966,064 | | $ | 2,468,466 |
| Long term capital gain | | 54,088,274 | | 68,325,485 | | — | | | — |
| | $ | 108,191,630 | | 151,066,552 | | 1,966,064 | | | 2,468,466 |
| Return of capital | | — | | — | | 359,472 | | | — |
| | $ | 108,191,630 | $ | 151,066,552 | $ | 2,325,536 | | $ | 2,468,466 |
88 Annual Report
franklintempleton.com
FRANKLIN INVESTORS SECURITIES TRUST
NOTES TO FINANCIAL STATEMENTS
At October 31, 2016, the cost of investments, net unrealized appreciation (depreciation), undistributed ordinary income and undistributed long term capital gains for income tax purposes were as follows:
| | | | | | | | | | | | |
| | | | | | Franklin | | | | | | | |
| | | Franklin | | | Convertible | | | Franklin Equity | | | Franklin Real | |
| | | Balanced Fund | | | Securities Fund | | | Income Fund | | | Return Fund | |
| Cost of investments | $ | 3,142,044,156 | | $ | 1,991,191,167 | | $ | 1,690,664,910 | | $ | 237,510,096 | |
| |
| Unrealized appreciation. | $ | 254,109,828 | | $ | 306,271,707 | | $ | 396,700,623 | | $ | 14,145,605 | |
| Unrealized depreciation. | | (104,710,280 | ) | | (152,642,806 | ) | | (38,780,588 | ) | | (11,829,278 | ) |
| Net unrealized appreciation (depreciation) | $ | 149,399,548 | | $ | 153,628,901 | | $ | 357,920,035 | | $ | 2,316,327 | |
| |
| Undistributed ordinary income | $ | — | | $ | 49,872,471 | | $ | 3,874,637 | | $ | — | |
| Undistributed long term capital gains | | 48,132,615 | | | 4,025,727 | | | 80,276,666 | | | — | |
| Distributable earnings | $ | 48,132,615 | | $ | 53,898,198 | | $ | 84,151,303 | | $ | — | |
Differences between income and/or capital gains as determined on a book basis and a tax basis are primarily due to differing treatments of foreign currency transactions, bond discounts and premiums and wash sales.
The Funds utilized a tax accounting practice to treat a portion of the proceeds from capital shares redeemed as a distribution from realized capital gains.
6. Investment Transactions
Purchases and sales of investments (excluding short term securities) for the year ended October 31, 2016, were as follows:
| | | | | | | | | | |
| | | | | Franklin | | | | | | |
| | | Franklin | | Convertible | | Franklin Equity | | | Franklin Real | |
| | | Balanced Fund | | Securities Fund | | Income Fund | | | Return Fund | |
| Purchases | $ | 1,787,927,506 | $ | 551,498,434 | $ | 979,874,135 | | $ | 74,876,607 | |
| Sales | $ | 1,353,208,086 | $ | 577,025,780 | $ | 1,046,637,123 | | $ | 106,106,103 | |
| |
| Transactions in options written during the year ended October 31, 2016, were as follows: | | | | | | |
| |
| | | | | | | Number of | | | | |
| | | | | | | Contracts | | | Premiums | |
| Franklin Balanced Fund | | | | | | | | | | |
| Options outstanding at October 31, 2015 | | | | | | 10,000 | | $ | 1,094,838 | |
| Options written | | | | | | 155,165 | | | 15,926,096 | |
| Options expired | | | | | | (68,337 | ) | | (9,439,787 | ) |
| Options exercised | | | | | | (49,860 | ) | | (4,338,636 | ) |
| Options closed | | | | | | (2,490 | ) | | (371,202 | ) |
| Options outstanding at October 31, 2016 | | | | | | 44,478 | | $ | 2,871,309 | |
| |
| Franklin Equity Income Fund | | | | | | | | | | |
| Options outstanding at October 31, 2015 | | | | | | — | | $ | — | |
| Options written | | | | | | 21,798 | | | 2,196,288 | |
| Options expired | | | | | | (11,480 | ) | | (564,541 | ) |
| Options exercised | | | | | | (2,378 | ) | | (368,724 | ) |
| Options closed | | | | | | (7,940 | ) | | (1,263,023 | ) |
| Options outstanding at October 31, 2016 | | | | | | — | | $ | — | |
See Notes 1(e) and 8 regarding derivative financial instruments and other derivative information, respectively.
franklintempleton.com
Annual Report
89
FRANKLIN INVESTORS SECURITIES TRUST
NOTES TO FINANCIAL STATEMENTS
7. Credit Risk
At October 31, 2016, Franklin Balanced Fund, Franklin Convertible Securities Fund and Franklin Real Return Fund had 9.6%, 54.7% and 8.7%, respectively, of their portfolio invested in high yield securities, senior secured floating rate notes, or other securities rated below investment grade and unrated securities, if any. These securities may be more sensitive to economic conditions causing greater price volatility and are potentially subject to a greater risk of loss due to default than higher rated securities.
8. Other Derivative Information
At October 31, 2016, the Funds’ investments in derivative contracts are reflected in the Statements of Assets and Liabilities as follows:
| | | | | | | |
| | Asset Derivatives | | | | Liability Derivatives | | |
| Derivative Contracts | Statement of | | | | Statement of | | |
| Not Accounted for as | Assets and Liabilities | | | | Assets and Liabilities | | |
| Hedging Instruments | Location | | Fair Value | | Location | | Fair Value |
| Franklin Balanced Fund | | | | | | | |
| Equity contracts | Investments in securities, at value | $ | 12,900,000 | a | Options written, at value | $ | 3,151,230 |
| |
| Franklin Real Return Fund | | | | | | | |
| Foreign exchange contracts | Unrealized appreciation on OTC | $ | 54,624 | | Unrealized depreciation on OTC | $ | — |
| | forward exchange contracts | | | | forward exchange contracts | | |
| aPurchased option contracts are included in investments in securities, at value in the Statement of Assets and Liabilities. | | |
For the year ended October 31, 2016, the effect of derivative contracts in the Funds’ Statements of Operations was as follows:
| | | | | | | | |
| | | | | | | | Net Change in | |
| | | | | | | | Unrealized | |
| Derivative Contracts | | | Net Realized | | | | Appreciation | |
| Not Accounted for as | Statement of | | Gain (Loss) for | | Statement of | | (Depreciation) | |
| Hedging Instruments | Operations Locations | | the Year | | Operations Locations | | for the Year | |
| | Net realized gain (loss) from: | | | | Net change in unrealized | | | |
| | | | | | appreciation (depreciation) on: | | | |
| Franklin Balanced Fund | | | | | | | | |
| Equity contracts. | Investments | $ | (8,276,205 | )a | Investments | $ | 46,000 | a |
| | Written options | | 10,717,079 | | Written options | | (922,509 | ) |
| Franklin Equity Income Fund | | | | | | | | |
| Equity contracts. | Written options | $ | 1,315,173 | | Written options | $ | — | |
| Franklin Real Return Fund | | | | | | | | |
| Foreign exchange contracts | Foreign currency transactions | $ | 489,523 | b | Translation of other assets and | $ | 46,518 | b |
| | | | | | liabilities denominated in foreign | | | |
| | | | | | currencies | | | |
aPurchased option contracts are included in net realized gain (loss) from investments and net change in unrealized appreciation (depreciation) on investments in the
Statement of Operations.
bForward exchange contracts are included in net realized gain (loss) from foreign currency transactions and net change in unrealized appreciation (depreciation) on
translation of other assets and liabilities denominated in foreign currencies in the Statements of Operations.
90 Annual Report
franklintempleton.com
FRANKLIN INVESTORS SECURITIES TRUST
NOTES TO FINANCIAL STATEMENTS
For the year ended October 31, 2016, the average month end fair value of derivatives, as a percentage of average month end net assets, and the average month end number of open derivative contracts for the year were as follows:
| | | | | | |
| | Franklin | | Franklin Equity | | Franklin Real | |
| | Balanced Fund | | Income Fund | | Return Fund | |
| Average month end fair value of derivatives | 0.1 | % | 0.0 | %a | 0.1 | % |
| Average month end number of open derivatives | 6 | | —b | | 7 | |
aAmount rounds to less than 0.1%.
bRounds to less than 1.
See Note 1(e) regarding derivative financial instruments.
9. Credit Facility
The Funds, together with other U.S. registered and foreign investment funds (collectively, Borrowers), managed by Franklin Templeton Investments, are borrowers in a joint syndicated senior unsecured credit facility totaling $2 billion (Global Credit Facility) which matures on February 10, 2017. This Global Credit Facility provides a source of funds to the Borrowers for temporary and emergency purposes, including the ability to meet future unanticipated or unusually large redemption requests.
Under the terms of the Global Credit Facility, the Funds shall, in addition to interest charged on any borrowings made by the Funds and other costs incurred by the Funds, pay their share of fees and expenses incurred in connection with the implementation and maintenance of the Global Credit Facility, based upon their relative share of the aggregate net assets of all of the Borrowers, including an annual commitment fee of 0.07% based upon the unused portion of the Global Credit Facility. Effective February 12, 2016, the annual commitment fee is 0.15%. These fees are reflected in other expenses in the Statements of Operations. During the year ended October 31, 2016, the Funds did not use the Global Credit Facility.
10. Fair Value Measurements
The Funds follow a fair value hierarchy that distinguishes between market data obtained from independent sources (observable inputs) and the Funds’ own market assumptions (unobservable inputs). These inputs are used in determining the value of the Funds’ financial instruments and are summarized in the following fair value hierarchy:
- Level 1 – quoted prices in active markets for identical financial instruments
- Level 2 – other significant observable inputs (including quoted prices for similar financial instruments, interest rates, prepayment speed, credit risk, etc.)
- Level 3 – significant unobservable inputs (including the Funds’ own assumptions in determining the fair value of financial instruments)
The input levels are not necessarily an indication of the risk or liquidity associated with financial instruments at that level.
For movements between the levels within the fair value hierarchy, the Funds have adopted a policy of recognizing the transfers as of the date of the underlying event which caused the movement.
franklintempleton.com
Annual Report
91
FRANKLIN INVESTORS SECURITIES TRUST
NOTES TO FINANCIAL STATEMENTS
10. Fair Value Measurements (continued)
A summary of inputs used as of October 31, 2016, in valuing the Funds’ assets and liabilities carried at fair value, is as follows:
| | | | | | | | |
| | | Level 1 | | Level 2 | | Level 3 | | Total |
| Franklin Balanced Fund | | | | | | | | |
| Assets: | | | | | | | | |
| Investments in Securities: | | | | | | | | |
| Equity Investmentsa,b | $ | 1,788,746,956 | $ | — | $ | — | $ | 1,788,746,956 |
| Equity-Linked Securities | | — | | 287,778,229 | | — | | 287,778,229 |
| Convertible Bonds | | — | | 15,946,875 | | — | | 15,946,875 |
| Corporate Bonds | | — | | 1,065,207,681 | | — | | 1,065,207,681 |
| Options Purchased | | 12,900,000 | | — | | — | | 12,900,000 |
| Short Term Investments | | 120,863,963 | | — | | — | | 120,863,963 |
| Total Investments in Securities | $ | 1,922,510,919 | $ | 1,368,932,785 | $ | — | $ | 3,291,443,704 |
| |
| Liabilities: | | | | | | | | |
| Other Financial Instruments: | | | | | | | | |
| Options Written | $ | 3,151,230 | $ | — | $ | — | $ | 3,151,230 |
| |
| Franklin Convertible Securities Fund | | | | | | | | |
| Assets: | | | | | | | | |
| Investments in Securities: | | | | | | | | |
| Equity Investments:a | | | | | | | | |
| Consumer Staples | $ | 46,242,000 | $ | 46,407,790 | $ | — | $ | 92,649,790 |
| Energy. | | — | | 24,700,700 | | — | | 24,700,700 |
| Financials | | — | | 24,312,575 | | — | | 24,312,575 |
| Information Technology | | — | | 46,895,625 | | — | | 46,895,625 |
| All Other Equity Investmentsb | | 378,034,279 | | — | | — | | 378,034,279 |
| Convertible Bonds | | — | | 1,479,711,734 | | — | | 1,479,711,734 |
| Escrows and Litigation Trusts | | — | | — | | —c | | — |
| Short Term Investments | | 98,515,365 | | — | | — | | 98,515,365 |
| Total Investments in Securities | $ | 522,791,644 | $ | 1,622,028,424 | $ | — | $ | 2,144,820,068 |
| |
| Franklin Equity Income Fund | | | | | | | | |
| Assets: | | | | | | | | |
| Investments in Securities: | | | | | | | | |
| Equity Investmentsa,b | $ | 1,858,186,682 | $ | — | $ | — | $ | 1,858,186,682 |
| Equity-Linked Securities | | — | | 140,206,791 | | — | | 140,206,791 |
| Short Term Investments | | 50,191,472 | | — | | — | | 50,191,472 |
| Total Investments in Securities | $ | 1,908,378,154 | $ | 140,206,791 | $ | — | $ | 2,048,584,945 |
| |
| Franklin Real Return Fund | | | | | | | | |
| Assets: | | | | | | | | |
| Investments in Securities: | | | | | | | | |
| Equity Investmentsa,b | $ | 42,077,039 | $ | — | $ | — | $ | 42,077,039 |
| Corporate Bonds | | — | | 9,598,558 | | — | | 9,598,558 |
| Senior Floating Rate Interests | | — | | 6,155,141 | | — | | 6,155,141 |
| Foreign Government and Agency Securities | | — | | 31,878,678 | | — | | 31,878,678 |
| U.S. Government and Agency Securities | | — | | 134,343,961 | | — | | 134,343,961 |
| Short Term Investments | | — | | 15,773,046 | | — | | 15,773,046 |
| Total Investments in Securities | $ | 42,077,039 | $ | 197,749,384 | $ | — | $ | 239,826,423 |
| |
| Other Financial Instruments: | | | | | | | | |
| Forward Exchange Contracts | $ | — | $ | 54,624 | $ | — | $ | 54,624 |
aIncludes common, preferred, convertible preferred stocks and management investment companies.
bFor detailed categories, see the accompanying Statement of Investments.
cIncludes securities determined to have no value at October 31, 2016.
92 Annual Report
franklintempleton.com
FRANKLIN INVESTORS SECURITIES TRUST
NOTES TO FINANCIAL STATEMENTS
11. Subsequent Events
The Funds have evaluated subsequent events through the issuance of the financial statements and determined that no events have occurred that require disclosure.
| | | | | |
| Abbreviations | | | | |
| |
| Counterparty | Currency | Selected Portfolio |
| DBAB | Deutsche Bank AG | BRL | Brazilian Real | ADR | American Depositary Receipt |
| JPHQ | JP Morgan Chase & Co. | EUR | Euro | ETF | Exchange Traded Fund |
| | | IDR | Indonesian Rupiah | FRN | Floating Rate Note |
| | | MXN | Mexican Peso | REIT | Real Estate Investment Trust |
| | | MYR | Malaysian Ringgit | SPDR | S&P Depositary Receipt |
| | | PLN | Polish Zloty | | |
franklintempleton.com
Annual Report
93
FRANKLIN INVESTORS SECURITIES TRUST
Report of Independent Registered Public Accounting Firm
To the Board of Trustees and Shareholders of Franklin Investors Securities Trust
In our opinion, the accompanying statements of assets and liabilities, including the statements of investments, and the related statements of operations and of changes in net assets and the financial highlights present fairly, in all material respects, the financial position of Franklin Balanced Fund, Franklin Convertible Securities Fund, Franklin Equity Income Fund and Franklin Real Return Fund, (hereafter referred to as the "Funds") as of October 31, 2016, the results of each of their operations for the year then ended, the changes in each of their net assets for each of the two years in the period then ended and the financial highlights for each of the periods presented, in conformity with accounting principles generally accepted in the United States of America. These financial statements and financial highlights (hereafter referred to as "financial statements") are the responsibility of the Funds’ management. Our responsibility is to express an opinion on these financial statements based on our audits. We conducted our audits of these financial statements in accordance with the standards of the Public Company Accounting Oversight Board (United States). Those standards require that we plan and perform the audit to obtain reasonable assurance about whether the financial statements are free of material misstatement. An audit includes examining, on a test basis, evidence supporting the amounts and disclosures in the financial statements, assessing the accounting principles used and significant estimates made by management, and evaluating the overall financial statement presentation. We believe that our audits, which included confirmation of securities as of October 31, 2016 by correspondence with the custodian, transfer agent and brokers, provide a reasonable basis for our opinion.
PricewaterhouseCoopers LLP
San Francisco, California
December 16, 2016
94 Annual Report
franklintempleton.com
FRANKLIN INVESTORS SECURITIES TRUST
Tax Information (unaudited)
Under Section 852(b)(3)(C) of the Internal Revenue Code (Code), the Funds hereby report the maximum amount allowable but no less than the following amounts as long term capital gain dividends for the fiscal year ended October 31, 2016:
| | | | | |
| | | | Franklin | | Franklin |
| | Franklin | | Convertible | | Equity |
| | Balanced Fund | | Securities Fund | | Income Fund |
| |
| $ | 4,505,278 | $ | 45,018,104 | $ | 61,952,260 |
Under Section 871(k)(2)(C) of the Code, Franklin Equity Income Fund hereby reports the maximum amount allowable but no less than $61,040 as short term capital gain dividends for purposes of the tax imposed under Section 871(a)(1)(A) of the Code for the fiscal year ended October 31, 2016.
Under Section 854(b)(1)(A) of the Code, the Funds hereby report the following percentage amounts of the ordinary income dividends as income qualifying for the dividends received deduction for the fiscal year ended October 31, 2016:
| | | | | | | |
| | | Franklin | | Franklin | | Franklin | |
| Franklin | | Convertible | | Equity | | Real | |
| Balanced Fund | | Securities Fund | | Income Fund | | Return Fund | |
| |
| 47.39 | % | 17.40 | % | 81.47 | % | 13.16 | % |
Under Section 854(b)(1)(B) of the Code, the Funds hereby report the maximum amount allowable but no less than the following amounts as qualified dividends for purposes of the maximum rate under Section 1(h)(11) of the Code for the fiscal year ended October 31, 2016:
| | | | | | | |
| | | | Franklin | | Franklin | | Franklin |
| | Franklin | | Convertible | | Equity | | Real |
| | Balanced Fund | | Securities Fund | | Income Fund | | Return Fund |
| |
| $ | 61,504,456 | $ | 14,676,827 | $ | 58,165,126 | $ | 529,616 |
Distributions, including qualified dividend income, paid during calendar year 2016 will be reported to shareholders on Form 1099-DIV by mid-February 2017. Shareholders are advised to check with their tax advisors for information on the treatment of these amounts on their individual income tax returns.
Under Section 871(k)(1)(C) of the Code, Franklin Convertible Securites Fund hereby reports the maximum amount allowable but no less than $13,138,778 as interest related dividends for purposes of the tax imposed under Section 871(a)(1)(A) of the Code for the fiscal year ended October 31, 2016.
franklintempleton.com
Annual Report
95
FRANKLIN INVESTORS SECURITIES TRUST
Board Members and Officers
The name, year of birth and address of the officers and board members, as well as their affiliations, positions held with the Trust, principal occupations during at least the past five years and number of U.S. registered portfolios overseen in the Franklin Templeton Investments fund complex, are shown below. Generally, each board member serves until that person’s successor is elected and qualified.
| | | | |
| Independent Board Members | | | |
| |
| | | | Number of Portfolios in | |
| Name, Year of Birth | | Length of | Fund Complex Overseen | Other Directorships Held |
| and Address | Position | Time Served | by Board Member* | During at Least the Past 5 Years |
| |
| Harris J. Ashton (1932) | Trustee | Since 1986 | 143 | Bar-S Foods (meat packing company) |
| One Franklin Parkway | | | | (1981-2010). |
| San Mateo, CA 94403-1906 | | | | |
| Principal Occupation During at Least the Past 5 Years: | | |
| Director of various companies; and formerly, Director, RBC Holdings, Inc. (bank holding company) (until 2002); and President, Chief Executive |
| Officer and Chairman of the Board, General Host Corporation (nursery and craft centers) (until 1998). | |
| |
| Mary C. Choksi (1950) | Trustee | Since 2014 | 137 | Avis Budget Group Inc. (car rental) |
| One Franklin Parkway | | | | (2007-present), Omnicom Group Inc. |
| San Mateo, CA 94403-1906 | | | | (advertising and marketing |
| | | | | communications services) |
| | | | | (2011-present) and H.J. Heinz |
| | | | | Company (processed foods and allied |
| | | | | products) (1998-2006). |
| Principal Occupation During at Least the Past 5 Years: | | |
| Senior Advisor, Strategic Investment Group (investment management group) (2015-present); director of various companies; and formerly, |
| Founding Partner and Senior Managing Director, Strategic Investment Group (1987–2015); Founding Partner and Managing Director, Emerging |
| Markets Management LLC (investment management firm) (1987-2011); and Loan Officer/Senior Loan Officer/Senior Pension Investment |
| Officer, World Bank Group (international financial institution) (1977-1987). | |
| |
| Edith E. Holiday (1952) | Trustee | Since 1998 | 143 | Hess Corporation (exploration and |
| One Franklin Parkway | | | | refining of oil and gas) (1993-present), |
| San Mateo, CA 94403-1906 | | | | Canadian National Railway (railroad) |
| | | | | (2001-present), White Mountains |
| | | | | Insurance Group, Ltd. (holding |
| | | | | company) (2004-present), RTI |
| | | | | International Metals, Inc. (manufacture |
| | | | | and distribution of titanium) |
| | | | | (1999-2015) and H.J. Heinz Company |
| | | | | (processed foods and allied products) |
| | | | | (1994-2013). |
| Principal Occupation During at Least the Past 5 Years: | | |
| Director or Trustee of various companies and trusts; and formerly, Assistant to the President of the United States and Secretary of the |
| Cabinet (1990-1993); General Counsel to the United States Treasury Department (1989-1990); and Counselor to the Secretary and Assistant |
| Secretary for Public Affairs and Public Liaison-United States Treasury Department (1988-1989). | |
| |
| J. Michael Luttig (1954) | Trustee | Since 2009 | 143 | Boeing Capital Corporation (aircraft |
| One Franklin Parkway | | | | financing) (2006-2013). |
| San Mateo, CA 94403-1906 | | | | |
| Principal Occupation During at Least the Past 5 Years: | | |
| Executive Vice President, General Counsel and member of the Executive Council, The Boeing Company (aerospace company) (2006-present); |
| and formerly, Federal Appeals Court Judge, U.S. Court of Appeals for the Fourth Circuit (1991-2006). | |
96 Annual Report
franklintempleton.com
FRANKLIN INVESTORS SECURITIES TRUST
| | | | |
| Independent Board Members (continued) | | |
| |
| |
| |
| | | | Number of Portfolios in | |
| Name, Year of Birth | | Length of | Fund Complex Overseen | Other Directorships Held |
| and Address | Position | Time Served | by Board Member* | During at Least the Past 5 Years |
| |
| Larry D. Thompson (1945) | Trustee | Since 2007 | 143 | The Southern Company (energy |
| One Franklin Parkway | | | | company) (2014-present; previously |
| San Mateo, CA 94403-1906 | | | | 2010-2012), Graham Holdings |
| | | | | Company (education and media |
| | | | | organization) (2011-present) and |
| | | | | Cbeyond, Inc. (business |
| | | | | communications provider) |
| | | | | (2010-2012). |
| Principal Occupation During at Least the Past 5 Years: | | |
| Director of various companies; John A. Sibley Professor of Corporate and Business Law, University of Georgia School of Law (2015-present; |
| previously 2011-2012); and formerly, Executive Vice President - Government Affairs, General Counsel and Corporate Secretary, PepsiCo, Inc. |
| (consumer products) (2012-2014); Senior Vice President - Government Affairs, General Counsel and Secretary, PepsiCo, Inc. (2004-2011); |
| Senior Fellow of The Brookings Institution (2003-2004); Visiting Professor, University of Georgia School of Law (2004); and Deputy Attorney |
| General, U.S. Department of Justice (2001-2003). | | | |
| |
| John B. Wilson (1959) | Lead | Trustee | 117 | None |
| One Franklin Parkway | Independent | since 2007 | | |
| San Mateo, CA 94403-1906 | Trustee | and Lead | | |
| | | Independent | | |
| | | Trustee | | |
| | | since 2008 | | |
| Principal Occupation During at Least the Past 5 Years: | | |
| President, Staples Europe (office supplies) (2012-present); President and Founder, Hyannis Port Capital, Inc. (real estate and private equity |
| investing); serves on private and non-profit boards; and formerly, Chief Operating Officer and Executive Vice President, Gap, Inc. (retail) |
| (1996-2000); Chief Financial Officer and Executive Vice President – Finance and Strategy, Staples, Inc. (1992-1996); Senior Vice President – |
| Corporate Planning, Northwest Airlines, Inc. (airlines) (1990-1992); and Vice President and Partner, Bain & Company (consulting firm) |
| (1986-1990). | | | | |
| |
| |
| Interested Board Members and Officers | | |
| |
| | | | Number of Portfolios in | |
| Name, Year of Birth | | Length of | Fund Complex Overseen | Other Directorships Held |
| and Address | Position | Time Served | by Board Member* | During at Least the Past 5 Years |
| |
| **Gregory E. Johnson (1961) | Trustee | Since 2013 | 159 | None |
| One Franklin Parkway | | | | |
| San Mateo, CA 94403-1906 | | | | |
| Principal Occupation During at Least the Past 5 Years: | | |
| Chairman of the Board, Member - Office of the Chairman, Director and Chief Executive Officer, Franklin Resources, Inc.; officer and/or director |
| or trustee, as the case may be, of some of the other subsidiaries of Franklin Resources, Inc. and of 44 of the investment companies in Franklin |
| Templeton Investments; Vice Chairman, Investment Company Institute; and formerly, President, Franklin Resources, Inc. (1994-2015). |
| |
| **Rupert H. Johnson, Jr. (1940) | Chairman of | Chairman of the | 143 | None |
| One Franklin Parkway | the Board, | Board since 2013, | | |
| San Mateo, CA 94403-1906 | Trustee and | Trustee since 1987 | | |
| | Vice President | and Vice President | | |
| | | since 1986 | | |
| Principal Occupation During at Least the Past 5 Years: | | |
| Vice Chairman, Member - Office of the Chairman and Director, Franklin Resources, Inc.; Director, Franklin Advisers, Inc.; Senior Vice |
| President, Franklin Advisory Services, LLC; and officer and/or director or trustee, as the case may be, of some of the other subsidiaries of |
| Franklin Resources, Inc. and of 42 of the investment companies in Franklin Templeton Investments. | |
| |
| Alison E. Baur (1964) | Vice President | Since 2012 | Not Applicable | Not Applicable |
| One Franklin Parkway | | | | |
| San Mateo, CA 94403-1906 | | | | |
| Principal Occupation During at Least the Past 5 Years: | | |
| Deputy General Counsel, Franklin Templeton Investments; and officer of some of the other subsidiaries of Franklin Resources, Inc. and of 45 |
| of the investment companies in Franklin Templeton Investments. | | |
franklintempleton.com
Annual Report
97
FRANKLIN INVESTORS SECURITIES TRUST
| | | | |
| Interested Board Members and Officers (continued) | |
| |
| |
| |
| | | | Number of Portfolios in | |
| Name, Year of Birth | | Length of | Fund Complex Overseen | Other Directorships Held |
| and Address | Position | Time Served | by Board Member* | During at Least the Past 5 Years |
| |
| Mark Boyadjian (1964) | Vice President | Since 2003 | Not Applicable | Not Applicable |
| One Franklin Parkway | | | | |
| San Mateo, CA 94403-1906 | | | | |
| Principal Occupation During at Least the Past 5 Years: | | |
| Senior Vice President, Franklin Advisers, Inc.; and officer of two of the investment companies in Franklin Templeton Investments. |
| |
| Laura F. Fergerson (1962) | Chief Executive Since 2009 | Not Applicable | Not Applicable |
| One Franklin Parkway | Officer – | | | |
| San Mateo, CA 94403-1906 | Finance and | | | |
| | Administration | | | |
| Principal Occupation During at Least the Past 5 Years: | | |
| Senior Vice President, Franklin Templeton Services, LLC; Vice President, Franklin Advisers, Inc. and Franklin Templeton Institutional, LLC; and |
| officer of 45 of the investment companies in Franklin Templeton Investments. | |
| |
| Gaston Gardey (1967) | Treasurer, | Since 2009 | Not Applicable | Not Applicable |
| One Franklin Parkway | Chief Financial | | | |
| San Mateo, CA 94403-1906 | Officer and | | | |
| | Chief | | | |
| | Accounting | | | |
| | Officer | | | |
| Principal Occupation During at Least the Past 5 Years: | | |
| Treasurer, U.S. Fund Administration & Reporting, Franklin Templeton Investments; and officer of 27 of the investment companies in Franklin |
| Templeton Investments. | | | | |
| |
| Aliya S. Gordon (1973) | Vice President | Since 2009 | Not Applicable | Not Applicable |
| One Franklin Parkway | | | | |
| San Mateo, CA 94403-1906 | | | | |
| Principal Occupation During at Least the Past 5 Years: | | |
| Senior Associate General Counsel, Franklin Templeton Investments; and officer of 45 of the investment companies in Franklin Templeton |
| Investments. | | | | |
| |
| Steven J. Gray (1955) | Vice President | Since 2009 | Not Applicable | Not Applicable |
| One Franklin Parkway | | | | |
| San Mateo, CA 94403-1906 | | | | |
| Principal Occupation During at Least the Past 5 Years: | | |
| Senior Associate General Counsel, Franklin Templeton Investments; Vice President, Franklin Templeton Distributors, Inc. and Franklin |
| Alternative Strategies Advisers, LLC; and officer of 45 of the investment companies in Franklin Templeton Investments. |
| |
| Richard Hsu (1973) | Vice President | Since 2010 | Not Applicable | Not Applicable |
| One Franklin Parkway | | | | |
| San Mateo, CA 94403-1906 | | | | |
| Principal Occupation During at Least the Past 5 Years: | | |
| Vice President, Franklin Advisers, Inc.; and officer of three of the investment companies in Franklin Templeton Investments. |
| |
| Edward B. Jamieson (1948) | President and | President since | Not Applicable | Not Applicable |
| One Franklin Parkway | Chief Executive 1993 and Chief | | |
| San Mateo, CA 94403-1906 | Officer – | Executive Officer | | |
| | Investment | – Investment | | |
| | Management | Management since | | |
| | | 2002 | | |
| Principal Occupation During at Least the Past 5 Years: | | |
| President, Chief Investment Officer and Director, Franklin Advisers, Inc.; Executive Vice President, Franklin Templeton Institutional, LLC; and |
| officer and/or trustee, as the case may be, of some of the other subsidiaries of Franklin Resources, Inc. and of 10 of the investment |
| companies in Franklin Templeton Investments. | | | |
98 Annual Report
franklintempleton.com
FRANKLIN INVESTORS SECURITIES TRUST
| | | | |
| Interested Board Members and Officers (continued) | |
| |
| |
| |
| | | | Number of Portfolios in | |
| Name, Year of Birth | | Length of | Fund Complex Overseen | Other Directorships Held |
| and Address | Position | Time Served | by Board Member* | During at Least the Past 5 Years |
| |
| Madeline Lam (1969) | Vice President | Since 2010 | Not Applicable | Not Applicable |
| One Franklin Parkway | | | | |
| San Mateo, CA 94403-1906 | | | | |
| Principal Occupation During at Least the Past 5 Years: | | |
| Vice President, Franklin Advisers, Inc.; and officer of two of the investment companies in Franklin Templeton Investments. |
| |
| Robert Lim (1948) | Vice | Since May | Not Applicable | Not Applicable |
| One Franklin Parkway | President | 2016 | | |
| San Mateo, CA 94403-1906 | – AML | | | |
| | Compliance | | | |
| Principal Occupation During at Least the Past 5 Years: | | |
| Vice President, Franklin Templeton Companies, LLC; Chief Compliance Officer, Franklin Templeton Distributors, Inc. and Franklin Templeton |
| Investor Services, LLC; and officer of 45 of the investment companies in Franklin Templeton Investments. |
| |
| Kimberly H. Novotny (1972) | Vice President | Since 2013 | Not Applicable | Not Applicable |
| 300 S.E. 2nd Street | | | | |
| Fort Lauderdale, FL 33301-1923 | | | | |
| Principal Occupation During at Least the Past 5 Years: | | |
| Associate General Counsel, Franklin Templeton Investments; Vice President and Corporate Secretary, Fiduciary Trust International of the |
| South; Vice President, Templeton Investment Counsel, LLC; Assistant Secretary, Franklin Resources, Inc.; and officer of 45 of the investment |
| companies in Franklin Templeton Investments. | | | |
| |
| Robert C. Rosselot (1960) | Chief | Since 2013 | Not Applicable | Not Applicable |
| 300 S.E. 2nd Street | Compliance | | | |
| Fort Lauderdale, FL 33301-1923 | Officer | | | |
| Principal Occupation During at Least the Past 5 Years: | | |
| Director, Global Compliance, Franklin Templeton Investments; Vice President, Franklin Templeton Companies, LLC; officer of 45 of the |
| investment companies in Franklin Templeton Investments; and formerly, Senior Associate General Counsel, Franklin Templeton Investments |
| (2007-2013); and Secretary and Vice President, Templeton Group of Funds (2004-2013). | |
| |
| Karen L. Skidmore (1952) | Vice President | Since 2006 | Not Applicable | Not Applicable |
| One Franklin Parkway | and Secretary | | | |
| San Mateo, CA 94403-1906 | | | | |
| Principal Occupation During at Least the Past 5 Years: | | |
| Senior Associate General Counsel, Franklin Templeton Investments; and officer of 45 of the investment companies in Franklin Templeton |
| Investments. | | | | |
| |
| Navid J. Tofigh (1972) | Vice President | Since 2015 | Not Applicable | Not Applicable |
| One Franklin Parkway | | | | |
| San Mateo, CA 94403-1906 | | | | |
| Principal Occupation During at Least the Past 5 Years: | | |
| Associate General Counsel, Franklin Templeton Investments; and officer of 45 of the investment companies in Franklin Templeton Investments. |
| |
| Craig S. Tyle (1960) | Vice President | Since 2005 | Not Applicable | Not Applicable |
| One Franklin Parkway | | | | |
| San Mateo, CA 94403-1906 | | | | |
| Principal Occupation During at Least the Past 5 Years: | | |
| General Counsel and Executive Vice President, Franklin Resources, Inc.; and officer of some of the other subsidiaries of Franklin Resources, |
| Inc. and of 45 of the investment companies in Franklin Templeton Investments. | |
| |
| Lori A. Weber (1964) | Vice President | Since 2011 | Not Applicable | Not Applicable |
| 300 S.E. 2nd Street | | | | |
| Fort Lauderdale, FL 33301-1923 | | | | |
| Principal Occupation During at Least the Past 5 Years: | | |
| Senior Associate General Counsel, Franklin Templeton Investments; Assistant Secretary, Franklin Resources, Inc.; Vice President and |
| Secretary, Templeton Investment Counsel, LLC; and officer of 45 of the investment companies in Franklin Templeton Investments. |
franklintempleton.com
Annual Report
99
FRANKLIN INVESTORS SECURITIES TRUST
Interested Board Members and Officers (continued)
*We base the number of portfolios on each separate series of the U.S. registered investment companies within the Franklin Templeton Investments fund complex. These
portfolios have a common investment manager or affiliated investment managers.
**Gregory E. Johnson is considered to be an interested person of the Fund under the federal securities laws due to his position as an officer and director ofFranklin
Resources, Inc. (Resources), which is the parent company of the Fund’s investment manager and distributor. Rupert H. Johnson, Jr. is considered to be an interested person
of the Fund under the federal securities laws due to his position as officer and director and major shareholder of Resources.
Note 1: Rupert H. Johnson, Jr. is the uncle of Gregory E. Johnson.
Note 2: Officer information is current as of the date of this report. It is possible that after this date, information about officers may change.
The Sarbanes-Oxley Act of 2002 and Rules adopted by the U.S. Securities and Exchange Commission require the Fund to disclose whether the Fund’s Audit
Committee includes at least one member who is an audit committee financial expert within the meaning of such Act and Rules. The Fund’s Board has determined
that there is at least one such financial expert on the Audit Committee and has designated each of Ann Torre Bates and David W. Niemiec as an audit committee
financial expert. The Board believes that Ms. Bates and Mr. Niemiec qualify as such an expert in view of their extensive business background and experience. Ms.
Bates has served as a member of the Fund Audit Committee since 2008. She currently serves as a director of Ares Capital Corporation (2010-present) and United
Natural Foods, Inc. (2013-present) and was formerly a director of Navient Corporation from 2014 to 2016, SLM Corporation from 1997 to 2014 and Allied Capital
Corporation from 2003 to 2010, Executive Vice President and Chief Financial Officer of NHP Incorporated from 1995 to 1997 and Vice President and Treasurer of
US Airways, Inc. until 1995. Mr. Niemiec has served as a member of the Fund Audit Committee since 2006, currently serves as an Advisor to Saratoga Partners
and was formerly its Managing Director from 1998 to 2001. Mr. Niemiec was formerly a director of Emeritus Corporation from 1999 to 2010 and OSI Pharmaceu-
ticals, Inc. from 2006 to 2010, Managing Director of SBC Warburg Dillon Read from 1997 to 1998, and was Vice Chairman from 1991 to 1997 and Chief Financial
Officer from 1982 to 1997 of Dillon, Read & Co. Inc. As a result of such background and experience, the Board believes that Ms. Bates and Mr. Niemiec have each
acquired an understanding of generally accepted accounting principles and financial statements, the general application of such principles in connection with
the accounting estimates, accruals and reserves, and analyzing and evaluating financial statements that present a breadth and level of complexity of accounting
issues generally comparable to those of the Fund, as well as an understanding of internal controls and procedures for financial reporting and an understanding
of audit committee functions. Ms. Bates and Mr. Niemiec are independent Board members as that term is defined under the applicable U.S. Securities and
Exchange Commission Rules and Releases.
The Statement of Additional Information (SAI) includes additional information about the board members and is available, without charge, upon request.
Shareholders may call (800) DIAL BEN/342-5236 to request the SAI.
100 Annual Report
franklintempleton.com
FRANKLIN INVESTORS SECURITIES TRUST
Shareholder Information
Proxy Voting Policies and Procedures
The Trust’s investment manager has established Proxy Voting
Policies and Procedures (Policies) that the Trust uses to
determine how to vote proxies relating to portfolio securities.
Shareholders may view the Trust’s complete Policies online at
franklintempleton.com. Alternatively, shareholders may request
copies of the Policies free of charge by calling the Proxy Group
collect at (954) 527-7678 or by sending a written request
to: Franklin Templeton Companies, LLC, 300 S.E. 2nd Street,
Fort Lauderdale, FL 33301, Attention: Proxy Group. Copies of
the Trust’s proxy voting records are also made available online
at franklintempleton.com and posted on the U.S. Securities and
Exchange Commission’s website at sec.gov and reflect the
most recent 12-month period ended June 30.
Quarterly Statement of Investments
The Trust files a complete statement of investments with the
U.S. Securities and Exchange Commission for the first and
third quarters for each fiscal year on Form N-Q. Shareholders
may view the filed Form N-Q by visiting the Commission’s
website at sec.gov. The filed form may also be viewed and
copied at the Commission’s Public Reference Room in
Washington, DC. Information regarding the operations of the
Public Reference Room may be obtained by calling (800)
SEC-0330.
Householding of Reports and Prospectuses
You will receive each Fund’s financial reports every six
months as well as an annual updated summary prospectus
(prospectus available upon request). To reduce Fund expenses,
we try to identify related shareholders in a household and send
only one copy of the financial reports and summary prospectus.
This process, called “householding,” will continue indefinitely
unless you instruct us otherwise. If you prefer not to have these
documents householded, please call us at (800) 632-2301. At
any time you may view current prospectuses/summary
prospectuses and financial reports on our website. If you
choose, you may receive these documents through electronic
delivery.
franklintempleton.com
Annual Report
101
This page intentionally left blank.
This page intentionally left blank.
This page intentionally left blank.
| |
| Contents | |
| |
| Annual Report | |
| Economic and Market Overview | 3 |
| Franklin Adjustable U.S. Government Securities Fund | 4 |
| Franklin Floating Rate Daily Access Fund | 11 |
| Franklin Low Duration Total Return Fund | 19 |
| Franklin Total Return Fund | 26 |
| Financial Highlights and Statements of Investments | 33 |
| Financial Statements | 108 |
| Notes to Financial Statements | 114 |
| Report of Independent Registered | |
| Public Accounting Firm | 141 |
| Tax Information | 142 |
| Board Members and Officers | 143 |
| Shareholder Information | 148 |
Visit franklintempleton.com for fund updates, to access your account, or to find helpful financial planning tools.
2 Annual Report
franklintempleton.com
Annual Report
Economic and Market Overview
The U.S. economy expanded during the 12 months under review. The economy grew at a faster pace in 2016’s third quarter than in 2016’s second and first quarters and 2015’s fourth quarter, mainly due to personal consumption expenditures, exports, private inventory investment, federal government spending and nonresidential fixed investment. Manufacturing conditions generally contracted during the first half of the period but generally expanded in the second half. The services sector, although volatile, continued to grow throughout the period. The unemployment rate decreased slightly from 5.0% in October 2015 to 4.9% at period-end.1 Monthly retail sales grew for most of the review period, and rose to the highest level in April in more than a year, due to a broad-based increase across most retail categories. Inflation, as measured by the Consumer Price Index (CPI), rose slightly in October, led by an increase in gasoline and shelter prices.
After maintaining a near-zero interest rate for seven years to support the U.S. economy’s recovery, the U.S. Federal Reserve (Fed) raised its target range for the federal funds rate to 0.25%–0.50% at its December 2015 meeting and maintained the rate through period-end. The Fed noted at its September meeting that although the case for raising interest rates has strengthened, it will wait for further evidence of continued progress toward its objectives.
The 10-year Treasury yield, which moves inversely to price, shifted throughout the period. It rose from 2.16% on October 30, 2015, to a period high of 2.36% in November 2015. However, negative interest rates in Japan and Europe, and central banks’ purchases of government bonds, pushed down the Treasury yield. The U.K.’s historic referendum to leave the European Union in June 2016 (also known as the “Brexit”) also boosted safe haven buying by investors. The Treasury yield reached a period low of 1.37% in early July, and ended the period at 1.84%. The yields rose toward period-end, due to positive economic data and signals from the Fed on the possibility of an increase in interest rates in the near term.
The foregoing information reflects our analysis and opinions as of October 31, 2016. The information is not a complete analysis of every aspect of any market, country, industry, security or fund. Statements of fact are from sources considered reliable.
1. Source: Bureau of Labor Statistics.
franklintempleton.com
Annual Report
3
Franklin Adjustable U.S. Government Securities Fund
This annual report for Franklin Adjustable U.S. Government Securities Fund covers the fiscal year ended October 31, 2016.
Your Fund’s Goal and Main Investments
The Fund seeks to provide a high level of current income while providing lower volatility of principal than a fund that invests in fixed-rate securities by investing at least 80% of its net assets in adjustable-rate U.S. government mortgage securities, which are issued or guaranteed by the U.S. government, its agencies or instrumentalities.1 The Fund’s investments may include securities issued by Ginnie Mae (GNMA) and government-sponsored entities, such as Fannie Mae (FNMA) and Freddie Mac (FHLMC).2
Performance Overview
The Fund’s Class A shares had a -0.32% cumulative total return for the 12 months under review. In comparison, the Fund’s benchmark, the Bloomberg Barclays U.S. Government Index: 1-2 Year Component, posted a +0.71% total return.3 The index measures public obligations of the U.S. Treasury with one to two years to final maturity and publicly issued debt of U.S. government agencies, quasi-federal corporations, and corporate or foreign debt guaranteed by the U.S. government. You can find the Fund’s long-term performance data in the Performance Summary beginning on page 7.
Performance data represent past performance, which does not guarantee future results. Investment return and principal value will fluctuate, and you may have a gain or loss when you sell your shares. Current performance may differ from figures shown. For most recent month-end performance, go to franklintempleton.com or call (800) 342-5236.
Investment Strategy
We employ a conservative investment strategy as we strive to produce solid performance in a variety of interest rate climates. We choose securities using a value-oriented approach, emphasizing the bonds’ economic fundamentals in relation to comparable securities as well as their historical prepayment performance.
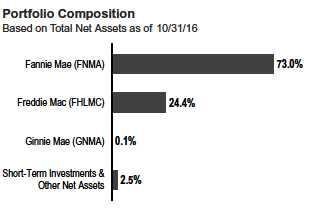
Manager’s Discussion
U.S. economic indicators were generally encouraging during the reporting period. Steady growth in the services sector created new jobs and slightly boosted employment levels. Retail sales grew for most of the period. Low energy prices pulled inflation lower. In this environment, home sales and prices grew.
The Fund employed a conservative strategy that invested primarily in adjustable-rate mortgage securities (ARMs) that are either explicitly or implicitly backed by the U.S. government.1 During the period, the Fund invested predominantly in securities issued or guaranteed by FNMA and FHLMC. The Fund took a collateral-intensive research approach to analyze the prepayment behavior of individual ARMs to identify those with the most attractive prepayment profiles and focused on seasoned ARMs. Such securities have typically been through several interest-rate cycles and therefore tend to be less sensitive to changes in interest rates, compared to newer issued counterparts. We have found such securities historically to have experienced lower volatility than comparable maturity Treasuries and have provided more consistent income. We continued to focus on seasoned, post-reset FNMA and FHLMC ARM positions with average coupons below 3%.
Although mortgage rates remained low, mortgage credit has remained constrained, and actual prepayment levels have been
1. Securities owned by the Fund, but not shares of the Fund, are issued or guaranteed by the U.S. government, its agencies or instrumentalities, including government-
sponsored entities, as to timely payment of principal and interest.
2. Although U.S. government-sponsored entities may be chartered by acts of Congress, their securities are neither issued nor guaranteed by the U.S. Government. Please see
the Fund’s prospectus for a detailed discussion regarding various levels of credit support for government agency or instrumentality securities. The Fund’s yield and share price
are not guaranteed and will vary with market conditions.
3. Source: Morningstar.
The index is unmanaged and includes reinvested interest. It does not reflect any fees, expenses or sales charges. One cannot invest directly in an index, and an index is not
representative of the Fund’s portfolio.
The dollar value, number of shares or principal amount, and names of all portfolio holdings are listed in the Fund’s Statement of Investments (SOI).
The SOI begins on page 38.
4 Annual Report
franklintempleton.com
FRANKLIN ADJUSTABLE U.S. GOVERNMENT SECURITIES FUND
| | | | | |
| Dividend Distributions* | | | |
| 11/1/15–10/31/16 | | | | |
| | | Dividend per Share (cents) | |
| | | | | | Advisor |
| Month | Class A | Class A1 | Class C | Class R6 | Class |
| November | 0.9537 | 1.0662 | 0.6656 | 1.2213 | 1.1371 |
| December | 0.8931 | 1.0056 | 0.6055 | 1.1725 | 1.0728 |
| January | 0.8438 | 0.9473 | 0.5740 | 1.1090 | 1.0132 |
| February | 1.0446 | 1.1549 | 0.7567 | 1.3027 | 1.2254 |
| March | 0.9869 | 1.0968 | 0.7002 | 1.2371 | 1.1669 |
| April | 0.9874 | 1.0928 | 0.7185 | 1.2242 | 1.1563 |
| May | 1.0561 | 1.1692 | 0.7606 | 1.3196 | 1.2414 |
| June | 1.0433 | 1.1493 | 0.7662 | 1.2933 | 1.2171 |
| July | 0.9923 | 1.0944 | 0.7269 | 1.2306 | 1.1597 |
| August | 1.1558 | 1.2721 | 0.8518 | 1.4227 | 1.3465 |
| September | 1.1178 | 1.2248 | 0.8437 | 1.3596 | 1.2905 |
| October | 1.1374 | 1.2450 | 0.8520 | 1.3719 | 1.3169 |
| Total | 12.2122 | 13.5184 | 8.8217 | 15.2645 | 14.3438 |
*The distribution amount is the sum of the dividend payments to shareholders for
the period shown and includes only estimated tax-basis net investment income.
Assumes shares were purchased and held for the entire accrual period. Since
dividends accrue daily, your actual distributions will vary depending on the date you
purchased your shares and any account activity. All Fund distributions will vary
depending upon current market conditions, and past distributions are not indicative
of future trends.
relatively low. The Fund’s London Interbank Offered Rate (LIBOR) indexed ARMs detracted from value, while ARMs indexed to U.S. Treasuries were generally additive.4
Thank you for your continued participation in Franklin Adjustable U.S. Government Securities Fund. We look forward to serving your future investment needs.

CFA® is a trademark owned by CFA Institute.
4. The London Interbank Offered Rate (LIBOR) is the interest rate banks charge each other for loans. LIBOR is a widely used benchmark for short-term interest rates.
See www.franklintempletondatasources.com for additional data provider information.
franklintempleton.com Annual Report 5
FRANKLIN ADJUSTABLE U.S. GOVERNMENT SECURITIES FUND
The foregoing information reflects our analysis, opinions and portfolio holdings as of October 31, 2016, the end of the reporting period. The way we implement our main investment strategies and the resulting portfolio holdings may change depending on factors such as market and economic conditions. These opinions may not be relied upon as investment advice or an offer for a particular security. The information is not a complete analysis of every aspect of any market, country, industry, security or the Fund. Statements of fact are from sources considered reliable, but the investment manager makes no representation or warranty as to their completeness or accuracy. Although historical performance is no guarantee of future results, these insights may help you understand our investment management philosophy.
6 Annual Report
franklintempleton.com
FRANKLIN ADJUSTABLE U.S. GOVERNMENT SECURITIES FUND
Performance Summary as of October 31, 2016
The performance tables and graphs do not reflect any taxes that a shareholder would pay on Fund dividends, capital gain distributions, if any, or any realized gains on the sale of Fund shares. Total return reflects reinvestment of the Fund’s dividends and capital gain distributions, if any, and any unrealized gains or losses.
Performance as of 10/31/161
Cumulative total return excludes sales charges. Average annual total returns include maximum sales charges. Sales charges will vary depending on the size of the investment and the class of share purchased. The maximum is 2.25% and the minimum is 0%. Class A: 2.25% maximum initial sales charge; Advisor Class: no sales charges. For other share classes, visit franklintempleton.com.
| | | | | | |
| | Cumulative | | Average Annual | | Average Annual | |
| Share Class | Total Return2 | | Total Return3 | | Total Return (9/30/16)4 | |
| A | | | | | | |
| 1-Year | -0.32 | % | -2.60 | % | -2.75 | % |
| 5-Year | +1.64 | % | -0.12 | % | -0.14 | % |
| 10-Year | +19.51 | % | +1.57 | % | +1.59 | % |
| Advisor5 | | | | | | |
| 1-Year | +0.05 | % | +0.05 | % | -0.11 | % |
| 5-Year | +2.93 | % | +0.58 | % | +0.56 | % |
| 10-Year | +22.21 | % | +2.03 | % | +2.04 | % |
| | | | | | |
| | Distribution | | 30-Day Standardized Yield7 | |
| Share Class | Rate6 | | (with waiver) | | (without waiver) | |
| |
| A | 1.56 | % | 0.50 | % | 0.49 | % |
| |
| Advisor | 1.84 | % | 0.76 | % | 0.75 | % |
Performance data represent past performance, which does not guarantee future results. Investment return and principal value will fluctuate, and you may have a gain or loss when you sell your shares. Current performance may differ from figures shown. For most recent month-end performance, go to franklintempleton.com or call (800) 342-5236.
See page 9 for Performance Summary footnotes.
franklintempleton.com
Annual Report
7
FRANKLIN ADJUSTABLE U.S. GOVERNMENT SECURITIES FUND
PERFORMANCE SUMMARY
Total Return Index Comparison for a Hypothetical $10,000 Investment1
Total return represents the change in value of an investment over the periods shown. It includes any applicable maximum sales charge, Fund expenses, account fees and reinvested distributions. The unmanaged index includes reinvestment of any income or distributions. It differs from the Fund in composition and does not pay management fees or expenses. One cannot invest directly in an index.

See page 9 for Performance Summary footnotes.
8 Annual Report
franklintempleton.com
FRANKLIN ADJUSTABLE U.S. GOVERNMENT SECURITIES FUND
PERFORMANCE SUMMARY
Total Annual Operating Expenses9
| | |
| Share Class | | |
| A | 0.91 | % |
| Advisor5 | 0.66 | % |
Each class of shares is available to certain eligible investors and has different annual fees and expenses, as described in the prospectus.
All investments involve risks, including possible loss of principal. Interest rate movements, unscheduled mortgage prepayments and other risk factors will affect
the Fund’s share price and yield. Bond prices generally move in the opposite direction of interest rates. As prices of bonds in the Fund adjust to a rise in interest
rates, the Fund’s share price may decline. Changes in the financial strength of a bond issuer or in a bond’s credit rating may affect its value. The Fund is actively
managed but there is no guarantee that the manager’s investment decisions will produce the desired results. The Fund’s prospectus also includes a description
of the main investment risks.
1. The Fund has a fee waiver associated with any investment it makes in a Franklin Templeton money fund and/or other Franklin Templeton fund, contractually guaranteed
through its current fiscal year-end. Fund investment results reflect the fee waiver; without this waiver, the results would have been lower.
2. Cumulative total return represents the change in value of an investment over the periods indicated.
3. Average annual total return represents the average annual change in value of an investment over the periods indicated. Return for less than one year, ifany,hasnotbeen
annualized.
4. In accordance with SEC rules, we provide standardized average annual total return information through the latest calendar quarter.
5. Effective 5/15/08, the Fund began offering Advisor Class shares, which do not have sales charges or a Rule 12b-1 plan. Performance quotations for this class reflect the
following methods of calculation: (a) For periods prior to 5/15/08, a restated figure is used based upon the Fund’s Class A performance, excluding the effect of Class A’s
maximum initial sales charge, but reflecting the effect of the Class A Rule 12b-1 fees; and (b) for periods after 5/15/08 actual Advisor Class performance is used reflecting all
charges and fees applicable to that class. Since 5/15/08 (commencement of sales), the cumulative and average annual total returns of Advisor Class shares were +13.44% and
+1.50%.
6. Distribution rate is based on an annualization of the sum of the respective class’s past 30 days’ daily distributions and the maximum offering price (NAV for Advisor Class) per
share on 10/31/16.
7. The Fund’s 30-day standardized yield is calculated over a trailing 30-day period using the yield to maturity on bonds and/or the dividends accrued on stocks. It may not equal
the Fund’s actual income distribution rate, which reflects the Fund’s past dividends paid to shareholders
8. Source: Morningstar. The Bloomberg Barclays U.S. Government Index: 1-2 Year Component includes public obligations of the U.S. Treasury with at least one year up to, but
not including, two years to final maturity and publicly issued debt of U.S. government agencies, quasi-federal corporations, and corporate or foreign debt guaranteed by the U.S.
government.
9. Figures are as stated in the Fund’s current prospectus and may differ from the expense ratios disclosed in the Your Fund’s Expenses and Financial Highlights sections in this
report. In periods of market volatility, assets may decline significantly, causing total annual Fund operating expenses to become higher than the figures shown.
See www.franklintempletondatasources.com for additional data provider information.
franklintempleton.com
Annual Report
9
FRANKLIN ADJUSTABLE U.S. GOVERNMENT SECURITIES FUND
Your Fund’s Expenses
As a Fund shareholder, you can incur two types of costs: (1) transaction costs, including sales charges (loads), as applicable, on Fund purchases and redemptions; and (2) ongoing Fund costs, including management fees, distribution and service (12b-1) fees, and other Fund expenses. All mutual funds have ongoing costs, sometimes referred to as operating expenses. The table below shows ongoing costs of investing in the Fund and can help you understand these costs and compare them with those of other mutual funds. The table assumes a $1,000 investment held for the six months indicated.
Actual Fund Expenses
The table below provides information about actual account values and actual expenses in the columns under the heading “Actual.” In these columns the Fund’s actual return, which includes the effect of Fund expenses, is used to calculate the “Ending Account Value” for each class of shares. You can estimate the expenses you paid during the period by following these steps (of course, your account value and expenses will differ from those in this illustration): Divide your account value by $1,000 (if your account had an $8,600 value, then $8,600 ÷ $1,000 = 8.6). Then multiply the result by the number in the row for your class of shares under the headings “Actual” and “Expenses Paid During Period” (if Actual Expenses Paid During Period were $7.50, then 8.6 x $7.50 = $64.50). In this illustration, the actual expenses paid this period are $64.50.
Hypothetical Example for Comparison with Other Funds
Under the heading “Hypothetical” in the table, information is provided about hypothetical account values and hypothetical expenses based on the Fund’s actual expense ratio and an assumed rate of return of 5% per year before expenses, which is not the Fund’s actual return. This information may not be used to estimate the actual ending account balance or expenses you paid for the period, but it can help you compare ongoing costs of investing in the Fund with those of other funds. To do so, compare this 5% hypothetical example for the class of shares you hold with the 5% hypothetical examples that appear in the shareholder reports of other funds.
Please note that expenses shown in the table are meant to highlight ongoing costs and do not reflect any transactional costs. Therefore, information under the heading “Hypothetical” is useful in comparing ongoing costs only, and will not help you compare total costs of owning different funds. In addition, if transactional costs were included, your total costs would have been higher.
| | | | | | | | | | | | |
| | | | | | | Actual | | Hypothetical | | |
| | | | | (actual return after expenses) | | (5% annual return before expenses) | | |
| | | | | | | Expenses | | | | Expenses | Net | |
| | | Beginning | | Ending | | Paid During | | Ending | | Paid During | Annualized | |
| Share | | Account | | Account | | Period | | Account | | Period | Expense | |
| Class | | Value 5/1/16 | | Value 10/31/16 | | 5/1/16–10/31/161,2 | | Value 10/31/16 | | 5/1/16–10/31/161,2 | Ratio2 | |
| A | $ | 1,000 | $ | 1,004.20 | $ | 4.58 | $ | 1,020.56 | $ | 4.62 | 0.91 | % |
| A1 | $ | 1,000 | $ | 1,004.90 | $ | 3.83 | $ | 1,021.32 | $ | 3.86 | 0.76 | % |
| C | $ | 1,000 | $ | 1,003.30 | $ | 6.65 | $ | 1,018.50 | $ | 6.70 | 1.32 | % |
| R6 | $ | 1,000 | $ | 1,005.90 | $ | 2.77 | $ | 1,022.37 | $ | 2.80 | 0.55 | % |
| Advisor | $ | 1,000 | $ | 1,005.40 | $ | 3.33 | $ | 1,021.82 | $ | 3.35 | 0.66 | % |
1. Expenses are equal to the annualized expense ratio for the six-month period as indicated above–in the far right column–multiplied by the simple average account value
over the period indicated, and then multiplied by 184/366 to reflect the one-half year period.
2. Reflects expenses after fee waivers and expense reimbursements. Does not include acquired fund fees and expenses.
10 Annual Report
franklintempleton.com
Franklin Floating Rate Daily Access Fund
We are pleased to bring you Franklin Floating Rate Daily Access Fund’s annual report for the fiscal year ended October 31, 2016.
Your Fund’s Goal and Main Investments
The Fund seeks to provide a high level of current income and, secondarily, preservation of capital by investing at least 80% of its net assets in income-producing floating interest rate corporate loans and corporate debt securities made to or issued by U.S. companies, non-U.S. entities and U.S. subsidiaries of non-U.S. entities.
What are corporate loans?
Corporate loans are typically floating rate loans to corporate borrowers made by a group, or syndicate, of banks and other financial institutions. These loans provide capital to companies for varied purposes, such as merger and acquisition activity, leveraged buyouts or refinancings. These loans are typically syndicated to a group of investors.
Performance Overview
The Fund’s Class A shares delivered a +7.60% cumulative total return for the 12 months under review. In comparison, the Credit Suisse Leveraged Loan Index (CS LLI), which is designed to mirror the investable universe of the U.S. dollar-denominated leveraged loan market, posted a +6.30% total return.1 You can find more of the Fund’s performance data in the Performance Summary beginning on page 15.
Performance data represent past performance, which does not guarantee future results. Investment return and principal value will fluctuate, and you may have a gain or loss when you sell your shares. Current performance may differ from figures shown. For most recent month-end performance, go to franklintempleton.com or call (800) 342-5236.
Corporate Loan Market Overview
Although weaker technical conditions and falling commodity prices initially contributed to significant volatility within the loan market during the period under review, oil prices eventually rebounded and continued accommodative policies from central banks eventually helped to improve investor sentiment across risk assets. Although flows from loan retail
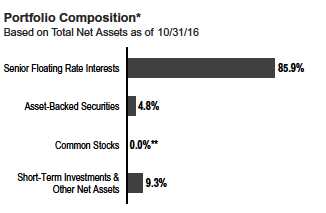
*Figures reflect certain derivatives held in the portfolio (or their underlying reference
assets) and may not total 100% or may be negative due to rounding, use of any
derivatives, unsettled trades or other factors.
**Rounds to less than 0.1% of net assets.
vehicles remained mixed and collateralized-loan-obligation (CLO) formation was relatively slower, restrained new issuance and repayment activity helped to contribute to stronger bids, especially for loans trading at steeper discounts to par. The rally was largely driven by lower rated loans, while higher rated loans generally underperformed.
Within the primary market, the number of transactions was initially muted during bouts of volatility, but eventually stronger demand led to an increase in refinancing transactions. Among these refinancing deals were repricing transactions (refinancing deals that tighten spreads), which were largely absent from the market earlier in the period. However, issuers were increasingly able to launch these deals to lower interest costs as more loans traded above par. The robust technical environment also led to more deals and structures that are more common in periods of high demand, including deals to finance dividends.
Amid volatility in the credit markets, outflows from loan retail vehicles were elevated, but eventually moderated. Following the Federal Reserve’s (Fed’s) modest rate increase toward the end of 2015, U.S. central bank action remained on hold, but the three-month London Interbank Offered Rate (LIBOR) reached the highest level since 2009 due to regulatory changes for money market funds. For a large portion of the market with no or low LIBOR floors, the increase in the rate was sufficient to increase coupons and generate floating rate income. Moreover,
1. Source: Credit Suisse Group.
The index is unmanaged and includes reinvestment of any income or distributions. It does not reflect any fees, expenses or sales charges. One cannot invest directly in an
index, and an index is not representative of the Fund’s portfolio.
See www.franklintempletondatasources.com for additional data provider information.
The dollar value, number of shares or principal amount, and names of all portfolio holdings are listed in the Fund’s Statement of Investments (SOI).
The SOI begins on page 45.
franklintempleton.com
Annual Report
11
FRANKLIN FLOATING RATE DAILY ACCESS FUND
as more investors speculated that the Fed could increase rates later in 2016 and possibly lead to further increases in LIBOR, flows into retail vehicles improved.
Although CLO issuance was restrained at the beginning of the period, volume eventually increased as investor sentiment improved. Interest from banks and investors outside the U.S. contributed to meaningfully tighter liability spreads, especially for the highest rated tranches, which contributed to the arbitrage necessary for new vehicles. With tighter spreads, more CLOs also refinanced deals to further lower liability costs. However, the market for new CLO vehicles remained relatively low compared to last year’s pace, as investors faced a number of headwinds. As net new supply was relatively weak, managers faced difficulty in sourcing collateral, while repricing transactions among loans contributed to still challenging arbitrage conditions. Moreover, pending risk retention regulations expected to take effect at the end of 2016 helped to limit CLO formation from a broad number of managers.
| | | | |
| Dividend Distributions* | | | |
| 11/1/15–10/31/16 | | | | |
| | Dividend per Share (cents) |
| | | | | Advisor |
| Month | Class A | Class C | Class R6 | Class |
| November | 3.5984 | 3.3100 | 3.8109 | 3.7837 |
| December | 3.4873 | 3.2060 | 3.7189 | 3.6649 |
| January | 3.2374 | 2.9759 | 3.4630 | 3.4029 |
| February | 3.4696 | 3.1942 | 3.7110 | 3.6437 |
| March | 3.4825 | 3.2031 | 3.7328 | 3.6589 |
| April | 3.2063 | 2.9396 | 3.4497 | 3.3746 |
| May | 3.5747 | 3.2777 | 3.7139 | 3.7598 |
| June | 3.2429 | 2.9634 | 3.4863 | 3.4195 |
| July | 3.0085 | 2.7375 | 3.2460 | 3.1795 |
| August | 3.5184 | 3.2064 | 3.7946 | 3.7163 |
| September | 2.9919 | 2.7060 | 3.2396 | 3.1724 |
| October | 3.1203 | 2.8225 | 3.3696 | 3.3083 |
| Total | 39.9382 | 36.5423 | 42.7363 | 42.0845 |
*The distribution amount is the sum of the dividend payments to shareholders for
the period shown and includes only estimated tax-basis net investment income.
Assumes shares were purchased and held for the entire accrual period. Since
dividends accrue daily, your actual distributions will vary depending on the date you
purchased your shares and any account activity. All Fund distributions will vary
depending upon current market conditions, and past distributions are not indicative
of future trends.
The default rate increased during the period following the defaults of issuers that were disproportionately concentrated in the energy sector and metals and mining industry. As a result, the default rate by principal amount reached the highest level in a year. Nonetheless, the default rate remained below its historical average, while loan issuers continued to report year-over-year earnings growth.
Investment Strategy
We use a detailed credit analysis process to select corporate loan and corporate debt securities that meet our criteria. We conduct ongoing credit monitoring of our investments. To help manage the credit risk associated with investing in securities rated below investment grade (or if unrated, of comparable quality), we seek to diversify the Fund by investing in a large number of loans of companies that we have identified as having attractive risk/reward profiles, favorable capital structures, strong asset coverage and dominant market shares. This diversification potentially reduces credit risk by spreading assets across many different industries.
In addition, we seek to exploit market inefficiencies by assigning forward-looking credit-risk tiers to issuers based upon our forward-looking analysis of the issuers’ prospects in the near term. This independent analysis enables us to express differences between backward-looking rating assignments of credit-risk tiers and our analysts’ forward-looking assessment of credit risk, thereby allowing us to potentially take advantage of credit risks the market may be overstating or avoid uncompensated credit risks the market may not have adequately identified.
Manager’s Discussion
During the 12-month period under review, the Fund outperformed its benchmark, the CS LLI. The Fund maintained an overweighting in the upper tier of the market throughout the period, which detracted from performance as upper tier loan in the index returned +5.30%, middle tier returned +6.21%, and lower tier returned +12.99%, according to the CS LLI. However, our selection across credit tiers contributed to outperformance compared to the index. This selection included an overweighted allocation to the metals and mining industry and investments in the energy sector that detracted from performance toward the end of 2015, but some of these issuers within these sectors rebounded significantly in 2016 and contributed to performance.
The top contributors included holdings across all credit tiers that had traded at what we considered significant discounts to par at the beginning of the period, but appreciated after benefiting from the technical environment. These issuers included companies within the metals and mining industry, which was a strong performing industry in the index. Peabody Energy, a coal producer, contributed to relative performance as the price of metallurgical coal improved and the company
12 Annual Report
franklintempleton.com
FRANKLIN FLOATING RATE DAILY ACCESS FUND
| | |
| Top 10 Holdings | | |
| 10/31/16 | | |
| Company | % of Total | |
| Sector/Industry | Net Assets | |
| Valeant Pharmaceuticals International Inc. | 2.8 | % |
| Pharmaceuticals | | |
| Alinta Energy Finance Pty. Ltd. (Australia) | 2.5 | % |
| Electric Utilities | | |
| Caraustar Industries Inc. | 2.3 | % |
| Forest Products | | |
| Community Health Systems Inc. | 2.1 | % |
| Health Care Facilities | | |
| The Chemours Co. LLC | 2.0 | % |
| Diversified Chemicals | | |
| NRG Energy Inc. | 2.0 | % |
| Independent Power Producers & Energy Traders | | |
| Cyanco Intermediate Corp. | 1.9 | % |
| Commodity Chemicals | | |
| Fieldwood Energy LLC | 1.8 | % |
| Oil & Gas Exploration & Production | | |
| FMG America Finance Inc. (Australia) | 1.6 | % |
| Diversified Metals & Mining | | |
| Navistar Inc. | 1.6 | % |
| Industrial Machinery | | |
worked toward reaching an agreement for its reorganization plan. Furthermore, the price of the term loan of FMG America (Fortescue), a producer of iron ore, rebounded after increases in the price of iron ore combined with previous efforts to reduce costs and allowed the company to continue to generate free cash flow and pay down debt.
Top detractors from Fund performance during the period reported weaker-than-expected results and all faced credit issues specific to each company. The term loan of radio broadcaster Cumulus Media declined after the company reported weak results due to weaker trends in digital and political advertising and license fees. Furthermore, coal producer Bowie Resource reported results that were lower than expected due to a decline in tons of coal sold. The term loan also declined after the company announced that its debt would not be refinanced due to the termination of an agreement to purchase assets from Peabody Energy.
Our purchases during the period primarily included upper tier loans, including non-institutional loans such as Term Loan A, which are typically held by banks and usually come with covenants and faster amortization schedules. Our purchases were focused on loans trading below par and targeted loans with relatively shorter years to maturity, which we believe would fare relatively better amid a period of increased credit risk as our loans would be closer to refinancing or repayment. Our sells included names in the middle and lower tiers, which we believed provided less attractive relative value given issuer-specific credit risks. During the period, while our weighting in the lower tier increased due to elevated downgrade activity by credit rating agencies, we continued to increase our overweighting in the upper tier and reduce our weighting in the middle tier.
During the period, we employed the use of BKLN, an ETF that seeks to track the loan market to gain liquid exposure to credit as well as to provide liquidity during elevated investor redemptions. We also bought protection in HYCDX to help offset heightened volatility in the credit markets but unwound the position prior to the period-end.
Thank you for your continued participation in Franklin Floating Rate Daily Access Fund. We look forward to serving your future investment needs.

franklintempleton.com
Annual Report
13
FRANKLIN FLOATING RATE DAILY ACCESS FUND
The foregoing information reflects our analysis, opinions and portfolio holdings as of October 31, 2016, the end of the reporting period. The way we implement our main investment strategies and the resulting portfolio holdings may change depending on factors such as market and economic conditions. These opinions may not be relied upon as investment advice or an offer for a particular security. The information is not a complete analysis of every aspect of any market, country, industry, security or the Fund. Statements of fact are from sources considered reliable, but the investment manager makes no representation or warranty as to their completeness or accuracy. Although historical performance is no guarantee of future results, these insights may help you understand our investment management philosophy.
14 Annual Report
franklintempleton.com
FRANKLIN FLOATING RATE DAILY ACCESS FUND
Performance Summary as of October 31, 2016
The performance tables and graphs do not reflect any taxes that a shareholder would pay on Fund dividends, capital gain distributions, if any, or any realized gains on the sale of Fund shares. Total return reflects reinvestment of the Fund’s dividends and capital gain distributions, if any, and any unrealized gains or losses.
Performance as of 10/31/161
Cumulative total return excludes sales charges. Average annual total returns include maximum sales charges. Sales charges will vary depending on the size of the investment and the class of share purchased. The maximum is 2.25% and the minimum is 0%. Class A: 2.25% maximum initial sales charge; Advisor Class: no sales charges. For other share classes, visit franklintempleton.com.
| | | | | | |
| | Cumulative | | Average Annual | | Average Annual | |
| Share Class | Total Return2 | | Total Return3 | | Total Return (9/30/16)4 | |
| A | | | | | | |
| 1-Year | +7.60 | % | +5.16 | % | +4.13 | % |
| 5-Year | +22.65 | % | +3.71 | % | +4.03 | % |
| 10-Year | +37.87 | % | +3.03 | % | +3.02 | % |
| Advisor | | | | | | |
| 1-Year | +8.00 | % | +8.00 | % | +6.80 | % |
| 5-Year | +24.33 | % | +4.45 | % | +4.77 | % |
| 10-Year | +41.24 | % | +3.51 | % | +3.50 | % |
| |
| |
| | Distribution | | 30-Day Standardized Yield6 | |
| Share Class | Rate5 | | (with waiver) (without waiver) | |
| A | 4.07 | % | 4.75 | % | 4.66 | % |
| Advisor | 4.41 | % | 5.11 | % | 5.03 | % |
Performance data represent past performance, which does not guarantee future results. Investment return and principal value will fluctuate, and you may have a gain or loss when you sell your shares. Current performance may differ from figures shown. For most recent month-end performance, go to franklintempleton.com or call (800) 342-5236.
See page 17 for Performance Summary footnotes.
franklintempleton.com
Annual Report
15
FRANKLIN FLOATING RATE DAILY ACCESS FUND
PERFORMANCE SUMMARY
Total Return Index Comparison for a Hypothetical $10,000 Investment1
Total return represents the change in value of an investment over the periods shown. It includes any applicable maximum sales charge, Fund expenses, account fees and reinvested distributions. The unmanaged index includes reinvestment of any income or distributions. It differs from the Fund in composition and does not pay management fees or expenses. One cannot invest directly in an index.

See page 17 for Performance Summary footnotes.
16 Annual Report
franklintempleton.com
| | | | |
| | | | FRANKLIN FLOATING RATE DAILY ACCESS FUND | |
| | | | PERFORMANCE SUMMARY | |
| |
| Total Annual Operating Expenses8 | | | |
| Share Class | With Waiver | | Without Waiver | |
| A | 0.85 | % | 0.86 | % |
| Advisor | 0.60 | % | 0.61 | % |
Each class of shares is available to certain eligible investors and has different annual fees and expenses, as described in the prospectus
All investments involve risks, including possible loss of principal. Investors should be aware that the Fund’s share price and yield will fluctuate with market
conditions. The Fund should not be considered an alternative to money market funds or certificates of deposit (CDs). The floating rate loans and debt securities in
which the Fund invests tend to be rated below investment grade. Investing in higher yielding, lower rated, floating rate loans and debt securities involves greater
risk of default, which could result in loss of principal—a risk that may be heightened in a slowing economy. Interest earned on floating rate loans varies with
changes in prevailing interest rates. Therefore, while floating rate loans offer higher interest income when interest rates rise, they will also generate less income
when interest rates decline. Changes in the financial strength of a bond issuer or in a bond’s credit rating may affect its value. The Fund is actively managed but
there is no guarantee that the manager’s investment decisions will produce the desired results. The Fund’s prospectus also includes a description of the main
investment risks.
1. The Fund has a fee waiver associated with any investment it makes in a Franklin Templeton money fund and/or other Franklin Templeton fund, contractually guaranteed
through its current fiscal year-end. Fund investment results reflect the fee waiver; without this waiver, the results would have been lower.
2. Cumulative total return represents the change in value of an investment over the periods indicated.
3. Average annual total return represents the average annual change in value of an investment over the periods indicated. Return for less than one year, ifany,hasnotbeen
annualized.
4. In accordance with SEC rules, we provide standardized average annual total return information through the latest calendar quarter.
5. Distribution rate is based on an annualization of the sum of the respective class’s past 30 days’ daily distributions and the maximum offering price (NAV for Advisor Class) per
share on 10/31/16.
6. The Fund’s 30-day standardized yield is calculated over a trailing 30-day period using the yield to maturity on bonds and/or the dividends accrued on stocks. It may not equal
the Fund’s actual income distribution rate, which reflects the Fund’s past dividends paid to shareholders.
7. Source: Credit Suisse Group. The CS LLI is designed to mirror the investable universe of the U.S. dollar-denominated leveraged loan market. Loans must be below
investment grade and rated no higher than Baa/BB+ or Ba1/BBB+ by Moody’s or S&P.
8. Figures are as stated in the Fund’s current prospectus and may differ from the expense ratios disclosed in the Your Fund’s Expenses and Financial Highlights sections in this
report. In periods of market volatility, assets may decline significantly, causing total annual Fund operating expenses to become higher than the figures shown.
See www.franklintempletondatasources.com for additional data provider information.
franklintempleton.com
Annual Report
17
FRANKLIN FLOATING RATE DAILY ACCESS FUND
Your Fund’s Expenses
As a Fund shareholder, you can incur two types of costs: (1) transaction costs, including sales charges (loads) on Fund purchases and redemptions; and (2) ongoing Fund costs, including management fees, distribution and service (12b-1) fees, and other Fund expenses. All mutual funds have ongoing costs, sometimes referred to as operating expenses. The table below shows ongoing costs of investing in the Fund and can help you understand these costs and compare them with those of other mutual funds. The table assumes a $1,000 investment held for the six months indicated.
Actual Fund Expenses
The table below provides information about actual account values and actual expenses in the columns under the heading “Actual.” In these columns the Fund’s actual return, which includes the effect of Fund expenses, is used to calculate the “Ending Account Value” for each class of shares. You can estimate the expenses you paid during the period by following these steps (of course, your account value and expenses will differ from those in this illustration): Divide your account value by $1,000 (if your account had an $8,600 value, then $8,600 ÷ $1,000 = 8.6). Then multiply the result by the number in the row for your class of shares under the headings “Actual” and “Expenses Paid During Period” (if Actual Expenses Paid During Period were $7.50, then 8.6 x $7.50 = $64.50). In this illustration, the actual expenses paid this period are $64.50.
Hypothetical Example for Comparison with Other Funds
Under the heading “Hypothetical” in the table, information is provided about hypothetical account values and hypothetical expenses based on the Fund’s actual expense ratio and an assumed rate of return of 5% per year before expenses, which is not the Fund’s actual return. This information may not be used to estimate the actual ending account balance or expenses you paid for the period, but it can help you compare ongoing costs of investing in the Fund with those of other funds. To do so, compare this 5% hypothetical example for the class of shares you hold with the 5% hypothetical examples that appear in the shareholder reports of other funds.
Please note that expenses shown in the table are meant to highlight ongoing costs and do not reflect any transactional costs. Therefore, information under the heading “Hypothetical” is useful in comparing ongoing costs only, and will not help you compare total costs of owning different funds. In addition, if transactional costs were included, your total costs would have been higher.
| | | | | | | | | | | | |
| | | | | | | Actual | | Hypothetical | | |
| | | | | (actual return after expenses) | | (5% annual return before expenses) | | |
| | | | | | | Expenses | | | | Expenses | Net | |
| | | Beginning | | Ending | | Paid During | | Ending | | Paid During | Annualized | |
| Share | | Account | | Account | | Period | | Account | | Period | Expense | |
| Class | | Value 5/1/16 | | Value 10/31/16 | | 5/1/16–10/31/161,2 | | Value 10/31/16 | | 5/1/16–10/31/161,2 | Ratio2 | |
| A | $ | 1,000 | $ | 1,063.50 | $ | 4.37 | $ | 1,020.81 | $ | 4.46 | 0.86 | % |
| C | $ | 1,000 | $ | 1,061.40 | $ | 6.39 | $ | 1,018.80 | $ | 6.53 | 1.26 | % |
| R6 | $ | 1,000 | $ | 1,065.20 | $ | 2.59 | $ | 1,022.57 | $ | 2.65 | 0.51 | % |
| Advisor | $ | 1,000 | $ | 1,066.10 | $ | 3.10 | $ | 1,022.07 | $ | 3.17 | 0.61 | % |
1. Expenses are equal to the annualized expense ratio for the six-month period as indicated above–in the far right column–multiplied by the simple average account value
over the period indicated, and then multiplied by 184/366 to reflect the one-half year period.
2. Reflects expenses after fee waivers and expense reimbursements. Does not include acquired fund fees and expenses.
18 Annual Report
franklintempleton.com
Franklin Low Duration Total Return Fund
We are pleased to bring you Franklin Low Duration Total Return Fund’s annual report for the fiscal year ended October 31, 2016.
Your Fund’s Goal and Main Investments
The Fund seeks a high level of current income as is consistent with prudent investing, while seeking capital preservation. The Fund invests primarily in investment-grade debt securities and investments, including government and corporate debt securities and mortgage- and asset-backed securities, targeting an estimated average portfolio duration of three years or less.
What is duration?
Duration is a measure of a bond’s price sensitivity to interest rate changes. In general, a portfolio of securities with a lower duration can be expected to be less sensitive to interest rate changes than a portfolio with a higher duration.
Performance Overview
The Fund’s Class A shares delivered a +1.88% cumulative total return for the 12 months under review. In comparison, the Fund’s benchmark, the Bloomberg Barclays U.S. Government/Credit Index: 1-3 Year Component, posted a +0.70% total return.1 The index measures public obligations of the U.S. Treasury with one to three years to final maturity and publicly issued debt of U.S. government agencies, quasi-federal corporations, and corporate or foreign debt guaranteed by the U.S. government. You can find more of the Fund’s performance data in the Performance Summary beginning on page 22.
Performance data represent past performance, which does not guarantee future results. Investment return and principal value will fluctuate, and you may have a gain or loss when you sell your shares. Current performance may differ from figures shown. For most recent month-end performance, go to franklintempleton.com or call (800) 342-5236.
Investment Strategy
We seek to invest in a combination of fixed income securities, primarily from across the investment-grade debt universe. We analyze securities using proprietary and nonproprietary research to help us identify attractive investment opportunities across the entire fixed income opportunity set, on a relative basis. When making investment decisions, we evaluate
Portfolio Composition*
Based on Total Net Assets as of 10/31/16
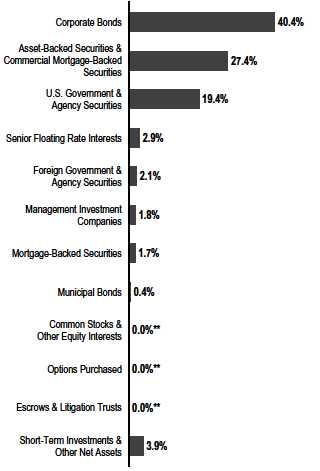
*Figures reflect certain derivatives held in the portfolio (or their underlying reference
assets) and may not total 100% or may be negative due to rounding, use of
derivatives, unsettled trades or other factors.
**Rounds to less than 0.1% of total net assets.
business cycles, yield curves, and values between and within markets. Through a low duration portfolio, we seek to position the Fund to be less affected by interest rate changes than a fund with a higher duration. In addition, we may use derivative transactions, such as forwards, futures contracts and swap
1. Source: Morningstar.
The index is unmanaged and includes reinvested interest. It does not reflect any fees, expenses or sales charges. One cannot invest directly in an index, and an index is not
representative of the Fund’s portfolio.
See www.franklintempletondatasources.com for additional data provider information.
The dollar value, number of shares or principal amount, and names of all portfolio holdings are listed in the Fund’s Statement of Investments (SOI).
The SOI begins on page 56.
franklintempleton.com
Annual Report
19
FRANKLIN LOW DURATION TOTAL RETURN FUND
agreements to obtain net long or short exposures to select currencies, interest rates, countries, duration or credit risks.
What is the yield curve?
The yield curve is a line that plots the interest rates, at a set point in time, of bonds having equal credit quality but differing maturity dates. The most frequently reported yield curve compares three-month, two-year and 30-year U.S. Treasury debt.
What is a currency forward contract?
A currency forward contract is an agreement between the Fund and a counterparty to buy or sell a foreign currency in exchange for another currency at a specific exchange rate on a future date.
What is a futures contract?
A futures contract is an agreement between the Fund and a counterparty made through a U.S. or foreign futures exchange to buy or sell an underlying instrument or asset at a specific priceonafuturedate.
What are swap agreements?
Swap agreements, such as interest rate, fixed income total return, currency, inflation index and credit default swaps, are contracts between the Fund and another party (the swap counterparty). In a basic swap transaction, the Fund agrees with the swap counterparty to exchange the returns (or differentials in rates of return) earned or realized on a particular “notional amount” of underlying instruments. The notional amount is the set amount selected by the parties as the basis on which to calculate the obligations that they have agreed to exchange. The parties typically do not actually exchange the notional amount. Instead, they agree to exchange the returns that would be earned or realized if the notional amount were invested in given instruments or at given interest rates.
Manager’s Discussion
U.S. economic indicators were generally encouraging during the reporting period. Steady growth in the services sector created new jobs and slightly boosted employment levels. Retail sales grew for most of the period. Low energy prices pulled inflation lower. In this environment, home sales and prices grew.
From a perspective of excess returns over Treasuries, high yield corporate credit performed well. Other major fixed income sectors that delivered positive excess returns, as measured by Bloomberg Barclays indexes, included emerging markets, corporate loans and U.S. investment-grade corporate bonds.
During the period, the Fund’s senior secured floating rate loans and high yield corporate credit exposure benefited performance. Our exposure to non-agency residential mortgage-backed securities and commercial mortgage-backed securities (CMBS) also contributed to results. In contrast, the Fund’s exposure to foreign currency and investment-grade corporate bonds detracted from results. Our exposure to non-U.S. yield curves also hurt Fund performance.
| | | | |
| Dividend Distributions* | | | |
| 11/1/15–10/31/16 | | | | |
| | Dividend per Share (cents) |
| | | | | Advisor |
| Month | Class A | Class C | Class R6 | Class |
| November | 2.1509 | 1.8126 | 2.4784 | 2.3689 |
| December** | 8.5987 | 8.2618 | 8.9311 | 8.8224 |
| January | 1.1178 | 0.9466 | 1.2845 | 1.2292 |
| February | 0.9289 | 0.7290 | 1.1237 | 1.0577 |
| March | 1.2919 | 1.0006 | 1.5989 | 1.4766 |
| April | 0.6957 | 0.5351 | 0.8688 | 0.7998 |
| May | 1.0150 | 0.7992 | 1.2467 | 1.1533 |
| June | 0.4961 | 0.3982 | 0.6001 | 0.5587 |
| July | 0.6996 | 0.5908 | 0.8389 | 0.7833 |
| August | 0.4161 | 0.3397 | 0.4977 | 0.4652 |
| September | 0.9898 | 0.8009 | 1.2224 | 1.1228 |
| October | 1.8268 | 1.4891 | 1.9105 | 2.0440 |
| Total | 20.2273 | 17.7036 | 22.6017 | 21.8819 |
*The distribution amount is the sum of the dividend payments to shareholders for
the period shown and includes only estimated tax-basis net investment income.
Assumes shares were purchased and held for the entire accrual period. Since
dividends accrue daily, your actual distributions will vary depending on the date you
purchased your shares and any account activity. All Fund distributions will vary
depending upon current market conditions, and past distributions are not indicative
of future trends.
**Includes an additional 4.36 cent per share distribution to meet excise tax
requirements.
At period-end, we were overweighted compared to the benchmark in many of the credit sectors, including corporate credit and securitized products, based on our belief that valuations remained relatively attractive on a longer term basis. Over the period, we increased our exposure to Treasury inflation protected securities, certain Treasury positions and floating rate loans. We decreased our exposures to CMBS, asset-backed securities and select international bonds.
During the period, the portfolio utilized derivatives, including credit default and currency swaps, currency forwards, Treasury futures, interest rate swaps and currency and credit default swap options, principally as a tool for efficient portfolio management and to manage overall portfolio risk. These derivative transactions may provide the same, or similar, net long or short exposure to select currencies, interest rates,
20 Annual Report
franklintempleton.com
FRANKLIN LOW DURATION TOTAL RETURN FUND
countries, duration or credit risks in a less expensive way than by directly purchasing securities. In those markets where portfolio securities are readily available, the cost difference in normal market conditions may be small.
Thank you for your continued participation in Franklin Low Duration Total Return Fund. We look forward to serving your future investment needs.

The foregoing information reflects our analysis, opinions and portfolio holdings as of October 31, 2016, the end of the reporting period. The way we implement our main investment strategies and the resulting portfolio holdings may change depending on factors such as market and economic conditions. These opinions may not be relied upon as investment advice or an offer for a particular security. The information is not a complete analysis of every aspect of any market, country, industry, security or the Fund. Statements of fact are from sources considered reliable, but the investment manager makes no representation or warranty as to their completeness or accuracy. Although historical performance is no guarantee of future results, these insights may help you understand our investment management philosophy.
franklintempleton.com
Annual Report
21
FRANKLIN LOW DURATION TOTAL RETURN FUND
Performance Summary as of October 31, 2016
The performance tables and graphs do not reflect any taxes that a shareholder would pay on Fund dividends, capital gain distributions, if any, or any realized gains on the sale of Fund shares. Total return reflects reinvestment of the Fund’s dividends and capital gain distributions, if any, and any unrealized gains or losses.
Performance as of 10/31/161
Cumulative total return excludes sales charges. Average annual total returns include maximum sales charges. Sales charges will vary depending on the size of the investment and the class of share purchased. The maximum is 2.25% and the minimum is 0%. Class A: 2.25% maximum initial sales charge; Advisor Class: no sales charges. For other share classes, visit franklintempleton.com.
| | | | | | |
| | Cumulative | | Average Annual | | Average Annual | |
| Share Class | Total Return2 | | Total Return3 | | Total Return (9/30/16)4 | |
| A | | | | | | |
| 1-Year | +1.88 | % | -0.43 | % | -0.28 | % |
| 5-Year | +7.98 | % | +1.08 | % | +1.27 | % |
| 10-Year | +35.02 | % | +2.81 | % | +2.86 | % |
| Advisor5 | | | | | | |
| 1-Year | +2.14 | % | +2.14 | % | +2.31 | % |
| 5-Year | +9.37 | % | +1.81 | % | +1.99 | % |
| 10-Year | +38.13 | % | +3.28 | % | +3.32 | % |
| | | | | | |
| | Distribution | | 30-Day Standardized Yield7 | |
| Share Class | Rate6 | | (with waiver) | | (without waiver) | |
| |
| A | 2.17 | % | 1.25 | % | 1.09 | % |
| |
| Advisor | 2.47 | % | 1.52 | % | 1.37 | % |
Performance data represent past performance, which does not guarantee future results. Investment return and principal value will fluctuate, and you may have a gain or loss when you sell your shares. Current performance may differ from figures shown. For most recent month-end performance, go to franklintempleton.com or call (800) 342-5236.
See page 24 for Performance Summary footnotes.
22 Annual Report
franklintempleton.com
FRANKLIN LOW DURATION TOTAL RETURN FUND
PERFORMANCE SUMMARY
Total Return Index Comparison for a Hypothetical $10,000 Investment1
Total return represents the change in value of an investment over the periods shown. It includes any applicable maximum sales charge, Fund expenses, account fees and reinvested distributions. The unmanaged indexes include reinvestment of any income or distributions. They differ from the Fund in composition and do not pay management fees or expenses. One cannot invest directly in an index.
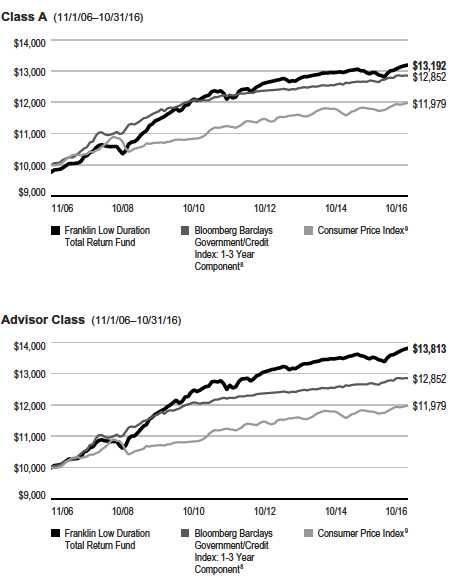
See page 24 for Performance Summary footnotes.
franklintempleton.com
Annual Report
23
| | | | |
| FRANKLIN LOW DURATION TOTAL RETURN FUND | | | |
| PERFORMANCE SUMMARY | | | | |
| |
| Total Annual Operating Expenses10 | | | |
| Share Class | With Waiver | | Without Waiver | |
| A | 0.82 | % | 0.97 | % |
| Advisor5 | 0.57 | % | 0.72 | % |
Each class of shares is available to certain eligible investors and has different annual fees and expenses, as described in the prospectus
All investments involve risks, including possible loss of principal. Investors should be aware that the Fund’s share price and yield will fluctuate with market
conditions. The Fund should not be considered an alternative to money market funds or certificates of deposit (CDs). The floating rate loans and debt securities in
which the Fund invests tend to be rated below investment grade. Investing in higher yielding, lower rated, floating rate loans and debt securities involves greater
risk of default, which could result in loss of principal—a risk that may be heightened in a slowing economy. Interest earned on floating rate loans varies with
changes in prevailing interest rates. Therefore, while floating rate loans offer higher interest income when interest rates rise, they will also generate less income
when interest rates decline. Changes in the financial strength of a bond issuer or in a bond’s credit rating may affect its value. The Fund is actively managed but
there is no guarantee that the manager’s investment decisions will produce the desired results. The Fund’s prospectus also includes a description of the main
investment risks.
1. The Fund has an expense reduction contractually guaranteed through 2/28/17. The Fund also has a fee waiver associated with any investments it makes in a Franklin
Templeton money fund and/or other Franklin Templeton fund, contractually guaranteed through its current fiscal year-end. Fund investment results reflect the expense reduction
and fee waiver; without these reductions, the results would have been lower.
2. Cumulative total return represents the change in value of an investment over the periods indicated.
3. Average annual total return represents the average annual change in value of an investment over the periods indicated. Return for less than one year, ifany,hasnotbeen
annualized.
4. In accordance with SEC rules, we provide standardized average annual total return information through the latest calendar quarter.
5. Effective 5/15/08, the Fund began offering Advisor class shares, which do not have sales charges or a Rule 12b-1 plan. Performance quotations for this class reflect the
following methods of calculation: (a) For periods prior to 5/15/08, a restated figure is used based upon the Fund’s Class A performance, excluding the effect of Class A’s
maximum initial sales charge, but reflecting the effect of the Class A Rule 12b-1 fees; and (b) for periods after 5/15/08 actual Advisor Class performance is used reflecting all
charges and fees applicable to that class. Since 5/15/08 (commencement of sales), the cumulative and average annual total returns of Advisor Class shares were +27.19% and
+2.88%.
6. Distribution rate is based on an annualization of the sum of the respective class’s past 30 days’ daily distributions and the maximum offering price (NAV for Advisor Class) per
share on 10/31/16.
7. The Fund’s 30-day standardized yield is calculated over a trailing 30-day period using the yield to maturity on bonds and/or the dividends accrued on stocks. It may not equal
the Fund’s actual income distribution rate, which reflects the Fund’s past dividends paid to shareholders.
8. Source: Morningstar. The Bloomberg Barclays U.S. Government/Credit Index: 1-3 Year Component includes dollar-denominated investment grade corporate debt and
non-native currency agency and local authority debt, sovereign, supranational, and taxable municipal debt, public obligations of the U.S. Treasury with at least one year up to,
but not including, three years to final maturity, and publicly issued debt of U.S. government agencies, quasi-federal corporations, and corporate or foreign debt guaranteed by
the U.S. government.
9. Source: Bureau of Labor Statistics, bls.gov/cpi. The Consumer Price Index (CPI) is a commonly used measure of the inflation rate.
10. Figures are as stated in the Fund’s current prospectus and may differ from the expense ratios disclosed in the Your Fund’s Expenses and Financial Highlights sections in
this report. In periods of market volatility, assets may decline significantly, causing total annual Fund operating expenses to become higher than the figures shown.
See www.franklintempletondatasources.com for additional data provider information.
24 Annual Report
franklintempleton.com
FRANKLIN LOW DURATION TOTAL RETURN FUND
Your Fund’s Expenses
As a Fund shareholder, you can incur two types of costs: (1) transaction costs, including sales charges (loads) on Fund purchases and redemptions; and (2) ongoing Fund costs, including management fees, distribution and service (12b-1) fees, and other Fund expenses. All mutual funds have ongoing costs, sometimes referred to as operating expenses. The table below shows ongoing costs of investing in the Fund and can help you understand these costs and compare them with those of other mutual funds. The table assumes a $1,000 investment held for the six months indicated.
Actual Fund Expenses
The table below provides information about actual account values and actual expenses in the columns under the heading “Actual.” In these columns the Fund’s actual return, which includes the effect of Fund expenses, is used to calculate the “Ending Account Value” for each class of shares. You can estimate the expenses you paid during the period by following these steps (of course, your account value and expenses will differ from those in this illustration): Divide your account value by $1,000 (if your account had an $8,600 value, then $8,600 ÷ $1,000 = 8.6). Then multiply the result by the number in the row for your class of shares under the headings “Actual” and “Expenses Paid During Period” (if Actual Expenses Paid During Period were $7.50, then 8.6 x $7.50 = $64.50). In this illustration, the actual expenses paid this period are $64.50.
Hypothetical Example for Comparison with Other Funds
Under the heading “Hypothetical” in the table, information is provided about hypothetical account values and hypothetical expenses based on the Fund’s actual expense ratio and an assumed rate of return of 5% per year before expenses, which is not the Fund’s actual return. This information may not be used to estimate the actual ending account balance or expenses you paid for the period, but it can help you compare ongoing costs of investing in the Fund with those of other funds. To do so, compare this 5% hypothetical example for the class of shares you hold with the 5% hypothetical examples that appear in the shareholder reports of other funds.
Please note that expenses shown in the table are meant to highlight ongoing costs and do not reflect any transactional costs. Therefore, information under the heading “Hypothetical” is useful in comparing ongoing costs only, and will not help you compare total costs of owning different funds. In addition, if transactional costs were included, your total costs would have been higher.
| | | | | | | | | | | | |
| | | | | | | Actual | | Hypothetical | | |
| | | | | (actual return after expenses) | | (5% annual return before expenses) | | |
| | | | | | | Expenses | | | | Expenses | Net | |
| | | Beginning | | Ending | | Paid During | | Ending | | Paid During | Annualized | |
| Share | | Account | | Account | | Period | | Account | | Period | Expense | |
| Class | | Value 5/1/16 | | Value 10/31/16 | | 5/1/16–10/31/161,2 | | Value 10/31/16 | | 5/1/16–10/31/161,2 | Ratio2 | |
| A | $ | 1,000 | $ | 1,014.80 | $ | 4.05 | $ | 1,021.11 | $ | 4.06 | 0.80 | % |
| C | $ | 1,000 | $ | 1,012.70 | $ | 6.07 | $ | 1,019.10 | $ | 6.09 | 1.20 | % |
| R6 | $ | 1,000 | $ | 1,016.60 | $ | 2.13 | $ | 1,023.03 | $ | 2.14 | 0.42 | % |
| Advisor | $ | 1,000 | $ | 1,016.40 | $ | 2.79 | $ | 1,022.77 | $ | 2.80 | 0.55 | % |
1. Expenses are equal to the annualized expense ratio for the six-month period as indicated above–in the far right column–multiplied by the simple average account value
over the period indicated, and then multiplied by 184/366 to reflect the one-half year period.
2. Reflects expenses after fee waivers and expense reimbursements. Does not include acquired fund fees and expenses.
franklintempleton.com
Annual Report
25
Franklin Total Return Fund
This annual report for Franklin Total Return Fund covers the fiscal year ended October 31, 2016.
Your Fund’s Goal and Main Investments
The Fund seeks to provide high current income, consistent with preservation of capital. Capital appreciation over the long term is a secondary goal. The Fund invests at least 80% of its assets in investment-grade debt securities and investments. The Fund currently focuses on government and corporate debt securities and mortgage- and asset-backed securities.
Performance Overview
The Fund’s Class A shares produced a +3.53% cumulative total return for the 12 months under review. In comparison, the Fund’s benchmark, the Bloomberg Barclays U.S. Aggregate Bond Index posted a +4.14% total return.1 The index measures the U.S. investment-grade, fixed-rate, taxable bond market with index components for government and corporate, mortgage pass-through and asset-backed securities. You can find the Fund’s long-term performance data in the Performance Summary beginning on page 29.
Performance data represent past performance, which does not guarantee future results. Investment return and principal value will fluctuate, and you may have a gain or loss when you sell your shares. Current performance may differ from figures shown. For most recent month-end performance, go to franklintempleton.com or call (800) 342-5236.
Investment Strategy
We seek to invest in a combination of fixed income securities, predominantly from across the investment-grade debt universe. We analyze securities using proprietary and nonproprietary research to help us identify attractive investment opportunities, across the entire fixed income opportunity set, on a relative basis. The Fund may also invest up to 20% of its total assets in noninvestment-grade debt securities. In addition, we may use derivative transactions, such as currency and cross-currency forwards, futures contracts and swap agreements, to obtain net long or short exposures to select currencies, interest rates, countries, duration or credit risks.

*Figures reflect certain derivatives held in the portfolio (or their underlying reference
assets) and may not total 100% or may be negative due to rounding, use of
derivatives, unsettled trades or other factors.
**Rounds to less than 0.1% of total net assets.
What is a currency forward contract?
A currency forward contract is an agreement between the Fund and a counterparty to buy or sell a foreign currency in exchange for another currency at a specific exchange rate on a future date.
1. Source: Morningstar.
The index is unmanaged and includes reinvested interest. It does not reflect any fees, expenses or sales charges. One cannot invest directly in an index, and an index is not
representative of the Fund’s portfolio.
See www.franklintempletondatasources.com for additional data provider information.
The dollar value, number of shares or principal amounts, and names of all portfolio holdings are listed in the Fund’s Consolidated Statement of
Investments (SOI). The Consolidated SOI begins on page 84.
26 Annual Report
franklintempleton.com
FRANKLIN TOTAL RETURN FUND
What is a futures contract?
A futures contract is an agreement between the Fund and a counterparty made through a U.S. or foreign futures exchange to buy or sell an underlying instrument or asset at a specific priceonafuturedate.
What are swap agreements?
Swap agreements, such as interest rate, fixed income total return, currency, inflation index and credit default swaps, are contracts between the Fund and another party (the swap counterparty). In a basic swap transaction, the Fund agrees with the swap counterparty to exchange the returns (or differentials in rates of return) earned or realized on a particular “notional amount” of underlying instruments. The notional amount is the set amount selected by the parties as the basis on which to calculate the obligations that they have agreed to exchange. The parties typically do not actually exchange the notional amount. Instead, they agree to exchange the returns that would be earned or realized if the notional amount were invested in given instruments or at given interest rates.
Manager’s Discussion
U.S. economic indicators were generally encouraging during the reporting period. Steady growth in the services sector created new jobs and slightly boosted employment levels. Retail sales grew for most of the period. Low energy prices pulled inflation lower. In this environment, home sales and prices grew.
From a perspective of excess returns over Treasuries, high yield corporate credit performed well. Other major fixed income sectors that delivered positive excess returns, as measured by Bloomberg Barclays indexes, included emerging markets, corporate loans and U.S. investment-grade corporate bonds.
During the period, the Fund’s exposure to non-U.S. yield curves contributed to performance. The Fund’s exposure to senior secured floating rate loans, below investment-grade corporate bonds and residential mortgage-backed securities also aided results. In contrast, the Fund’s defensive U.S. yield curve positioning was a detractor as yield curve movements had a negative impact on the Fund relative to its benchmark. The Fund’s exposure to foreign currencies and investment-grade corporate bonds also detracted from performance.
At period-end, we were overweighted compared to the benchmark in many of the credit sectors, including corporate credit and most securitized products, based on our belief that valuations remained relatively attractive on a longer term basis. Over the period, we increased our exposure to certain Treasury positions, Treasury inflation protected securities and corporate
| | | | | |
| Dividend Distributions* | | | |
| 11/1/15–10/31/16 | | | | |
| | | Dividend per Share (cents) | |
| | | | | | Advisor |
| Month | Class A | Class C | Class R | Class R6 | Class |
| November | 3.2070 | 2.8646 | 2.9920 | 3.5813 | 3.4054 |
| December** | 17.0009 | 16.6524 | 16.7844 | 17.3772 | 17.2315 |
| January | 0.8366 | 0.7061 | 0.7543 | 0.9691 | 0.9200 |
| February | 1.1923 | 1.0145 | 1.0814 | 1.3752 | 1.3066 |
| March | 1.2066 | 0.9925 | 1.0730 | 1.4147 | 1.3433 |
| April | 0.4785 | 0.4025 | 0.4303 | 0.5533 | 0.5282 |
| May | 0.8027 | 0.6610 | 0.7144 | 0.9401 | 0.8931 |
| June | 0.4234 | 0.3573 | 0.3822 | 0.4871 | 0.4657 |
| July | 0.5174 | 0.3967 | 0.4423 | 0.6347 | 0.5951 |
| August | 0.4150 | 0.3371 | 0.3664 | 0.4860 | 0.4647 |
| September | 0.6227 | 0.5322 | 0.5666 | 0.7085 | 0.6801 |
| October | 1.1194 | 0.9745 | 1.0341 | 1.2494 | 1.2106 |
| Total | 27.8225 | 25.8914 | 26.6214 | 29.7766 | 29.0443 |
*The distribution amount is the sum of the dividend payments to shareholders for
the period shown and includes only estimated tax-basis net investment income.
Assumes shares were purchased and held for the entire accrual period. Since
dividends accrue daily, your actual distributions will vary depending on the date you
purchased your shares and any account activity. All Fund distributions will vary
depending upon current market conditions, and past distributions are not indicative
of future trends.
**Includes an additional 10.5 cent per share distribution to meet excise tax
requirements.
What is the yield curve?
The yield curve is a line that plots the interest rates, at a set point in time, of bonds having equal credit quality but differing maturity dates. The most frequently reported yield curve compares three-month, two-year and 30-year U.S. Treasury debt.
loans. We decreased our exposure to international bonds, commercial mortgage-backed securities and municipal bonds as we found better relative opportunities.
During the period, the portfolio utilized derivatives, including credit default and currency swaps, currency forwards, Treasury futures, interest rate swaps, inflation index swaps, and currency and credit default swap options, principally as a tool for efficient portfolio management and to manage overall portfolio risk. These derivative transactions may provide the same, or similar, net long or short exposure to select currencies, interest rates, countries, duration or credit risks in a less expensive way than by directly purchasing securities. In those markets where portfolio securities are readily available, the cost difference in normal market conditions may be small.
franklintempleton.com
Annual Report
27
FRANKLIN TOTAL RETURN FUND
What is an option?
An option is a contract to buy or sell a specific financial product known as the option’s underlying instrument at a specific price. The buyer of an option has the right, but not the obligation, to buy or sell the underlying instrument at or until a specified expiration date. Conversely, the seller (“writer”) of an option who opens a transaction is obligated to buy or sell the underlying instrument should the option holder exercise that right.
Thank you for your continued participation in Franklin Total Return Fund. We look forward to serving your future investment needs.

The foregoing information reflects our analysis, opinions and portfolio holdings as of October 31, 2016, the end of the reporting period. The way we implement our main investment strategies and the resulting portfolio holdings may change depending on factors such as market and economic conditions. These opinions may not be relied upon as investment advice or an offer for a particular security. The information is not a complete analysis of every aspect of any market, country, industry, security or the Fund. Statements of fact are from sources considered reliable, but the investment manager makes no representation or warranty as to their completeness or accuracy. Although historical performance is no guarantee of future results, these insights may help you understand our investment management philosophy.
28 Annual Report
franklintempleton.com
FRANKLIN TOTAL RETURN FUND
Performance Summary as of October 31, 2016
The performance tables and graphs do not reflect any taxes that a shareholder would pay on Fund dividends, capital gain distributions, if any, or any realized gains on the sale of Fund shares. Total return reflects reinvestment of the Fund’s dividends and capital gain distributions, if any, and any unrealized gains or losses.
Performance as of 10/31/161
Cumulative total return excludes sales charges. Average annual total returns include maximum sales charges. Sales charges will vary depending on the size of the investment and the class of share purchased. The maximum is 4.25% and the minimum is 0%. Class A: 4.25% maximum initial sales charge; Advisor Class: no sales charges. For other share classes, visit franklintempleton.com.
| | | | | | |
| | Cumulative | | Average Annual | | Average Annual | |
| Share Class | Total Return2 | | Total Return3 | | Total Return (9/30/16)4 | |
| A | | | | | | |
| 1-Year | +3.53 | % | -0.88 | % | +0.50 | % |
| 5-Year | +17.19 | % | +2.33 | % | +2.75 | % |
| 10-Year | +56.76 | % | +4.15 | % | +4.29 | % |
| Advisor | | | | | | |
| 1-Year | +3.75 | % | +3.75 | % | +5.24 | % |
| 5-Year | +18.70 | % | +3.49 | % | +3.88 | % |
| 10-Year | +60.85 | % | +4.87 | % | +5.01 | % |
| |
| |
| | Distribution | | 30-Day Standardized Yield6 | |
| Share Class | Rate5 | | (with waiver) (without waiver) | |
| A | 1.30 | % | 2.15 | % | 2.13 | % |
| Advisor | 1.46 | % | 2.50 | % | 2.48 | % |
Performance data represent past performance, which does not guarantee future results. Investment return and principal value will fluctuate, and you may have a gain or loss when you sell your shares. Current performance may differ from figures shown. For most recent month-end performance, go to franklintempleton.com or call (800) 342-5236.
See page 31 for Performance Summary footnotes.
franklintempleton.com
Annual Report
29
FRANKLIN TOTAL RETURN FUND
PERFORMANCE SUMMARY
Total Return Index Comparison for a Hypothetical $10,000 Investment1
Total return represents the change in value of an investment over the periods shown. It includes any applicable maximum sales charge, Fund expenses, account fees and reinvested distributions. The unmanaged indexes include reinvestment of any income or distributions. They differ from the Fund in composition and do not pay management fees or expenses. One cannot invest directly in an index.
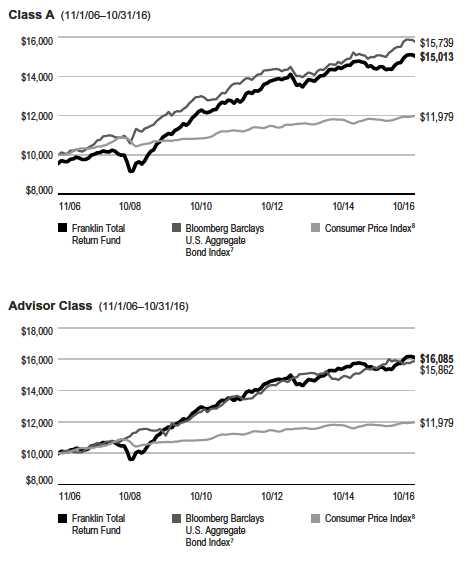
See page 31 for Performance Summary footnotes.
30 Annual Report
franklintempleton.com
| | | | | |
| | | | | | FRANKLIN TOTAL RETURN FUND |
| | | | | | PERFORMANCE SUMMARY |
| |
| Total Annual Operating Expenses9 | | | | |
| Share Class | With Waiver | | Without Waiver | | |
| A | 0.91 | % | 0.94 | % | |
| Advisor | 0.66 | % | 0.69 | % | |
Each class of shares is available to certain eligible investors and has different annual fees and expenses, as described in the prospectus.
All investments involve risks, including possible loss of principal. Interest rate movements and mortgage prepayments will affect the Fund’s share price and yield.
Bond prices generally move in the opposite direction of interest rates. Thus, as prices of bonds in the Fund adjust to a rise in interest rates, the Fund’s share price
may decline. Changes in the financial strength of a bond issuer or in a bond’s credit rating may affect its value. The risks associated with higher yielding, lower
rated securities include higher risk of default and loss of principal. Investment in foreign securities also involves special risks, including currency fluctuations,
and political and economic uncertainty. Derivatives, including currency management strategies, involve costs and can create economic leverage in the portfolio
which may result in significant volatility and cause the Fund to participate in losses (as well as gains) on an amount that exceeds the Fund’s initial investment. The
Fund may not achieve the anticipated benefits and may realize losses when a counterparty fails to perform as promised. The Fund is actively managed but there is
no guarantee that the manager’s investment decisions will produce the desired results. The Fund’s prospectus also includes a description of the main investment
risks.
1. The Fund has an expense reduction contractually guaranteed through 2/28/17. The Fund also has a fee waiver associated with any investments it makes in a Franklin
Templeton money fund and/or other Franklin Templeton fund, contractually guaranteed through its current fiscal year-end. Fund investment results reflect the expense reduction
and fee waiver; without these reductions, the results would have been lower.
2. Cumulative total return represents the change in value of an investment over the periods indicated.
3. Average annual total return represents the average annual change in value of an investment over the periods indicated. Return for less than one year, ifany,hasnotbeen
annualized.
4. In accordance with SEC rules, we provide standardized average annual total return information through the latest calendar quarter.
5. Distribution rate is based on an annualization of the sum of the respective class’s past 30 days’ daily distributions and the maximum offering price (NAV for Advisor Class) per
share on 10/31/16.
6. The Fund’s 30-day standardized yield is calculated over a trailing 30-day period using the yield to maturity on bonds and/or the dividends accrued on stocks. It may not equal
the Fund’s actual income distribution rate, which reflects the Fund’s past dividends paid to shareholders.
7. Source: Morningstar. The Bloomberg Barclays U.S. Aggregate Bond Index is a market capitalization-weighted index representing the U.S. investment-grade, fixed-rate,
taxable bond market with index components for government and corporate, mortgage pass-through and asset-backed securities. All issues included are SEC registered,
taxable, dollar denominated and nonconvertible, must have at least one year to final maturity and must be rated investment grade (Baa3/BBB-/BBB- or higher) using the middle
rating of Moody’s, Standard & Poor’s and Fitch, respectively.
8. Source: Bureau of Labor Statistics, bls.gov/cpi. The Consumer Price Index (CPI), is a commonly used measure of the inflation rate.
9. Figures are as stated in the Fund’s current prospectus and may differ from the expense ratios disclosed in the Your Fund’s Expenses and Financial Highlights sections in this
report. In periods of market volatility, assets may decline significantly, causing total annual Fund operating expenses to become higher than the figures shown.
See www.franklintempletondatasources.com for additional data provider information.
franklintempleton.com
Annual Report
31
FRANKLIN TOTAL RETURN FUND
Your Fund’s Expenses
As a Fund shareholder, you can incur two types of costs: (1) transaction costs, including sales charges (loads) on Fund purchases and redemptions; and (2) ongoing Fund costs, including management fees, distribution and service (12b-1) fees, and other Fund expenses. All mutual funds have ongoing costs, sometimes referred to as operating expenses. The table below shows ongoing costs of investing in the Fund and can help you understand these costs and compare them with those of other mutual funds. The table assumes a $1,000 investment held for the six months indicated.
Actual Fund Expenses
The table below provides information about actual account values and actual expenses in the columns under the heading “Actual.” In these columns the Fund’s actual return, which includes the effect of Fund expenses, is used to calculate the “Ending Account Value” for each class of shares. You can estimate the expenses you paid during the period by following these steps (of course, your account value and expenses will differ from those in this illustration): Divide your account value by $1,000 (if your account had an $8,600 value, then $8,600 ÷ $1,000 = 8.6). Then multiply the result by the number in the row for your class of shares under the headings “Actual” and “Expenses Paid During Period” (if Actual Expenses Paid During Period were $7.50, then 8.6 x $7.50 = $64.50). In this illustration, the actual expenses paid this period are $64.50.
Hypothetical Example for Comparison with Other Funds
Under the heading “Hypothetical” in the table, information is provided about hypothetical account values and hypothetical expenses based on the Fund’s actual expense ratio and an assumed rate of return of 5% per year before expenses, which is not the Fund’s actual return. This information may not be used to estimate the actual ending account balance or expenses you paid for the period, but it can help you compare ongoing costs of investing in the Fund with those of other funds. To do so, compare this 5% hypothetical example for the class of shares you hold with the 5% hypothetical examples that appear in the shareholder reports of other funds.
Please note that expenses shown in the table are meant to highlight ongoing costs and do not reflect any transactional costs. Therefore, information under the heading “Hypothetical” is useful in comparing ongoing costs only, and will not help you compare total costs of owning different funds. In addition, if transactional costs were included, your total costs would have been higher.
| | | | | | | | | | | | |
| | | | | | | Actual | | Hypothetical | | |
| | | | | (actual return after expenses) | | (5% annual return before expenses) | | |
| | | | | | | Expenses | | | | Expenses | Net | |
| | | Beginning | | Ending | | Paid During | | Ending | | Paid During | Annualized | |
| Share | | Account | | Account | | Period | | Account | | Period | Expense | |
| Class | | Value 5/1/16 | | Value 10/31/16 | | 5/1/16–10/31/161,2 | | Value 10/31/16 | | 5/1/16–10/31/161,2 | Ratio2 | |
| A | $ | 1,000 | $ | 1,022.50 | $ | 4.27 | $ | 1,020.91 | $ | 4.27 | 0.84 | % |
| C | $ | 1,000 | $ | 1,020.90 | $ | 6.30 | $ | 1,018.90 | $ | 6.29 | 1.24 | % |
| R | $ | 1,000 | $ | 1,021.10 | $ | 5.54 | $ | 1,019.66 | $ | 5.53 | 1.09 | % |
| R6 | $ | 1,000 | $ | 1,025.00 | $ | 2.34 | $ | 1,022.82 | $ | 2.34 | 0.46 | % |
| Advisor | $ | 1,000 | $ | 1,023.80 | $ | 3.00 | $ | 1,022.17 | $ | 3.00 | 0.59 | % |
1. Expenses are equal to the annualized expense ratio for the six-month period as indicated above–in the far right column–multiplied by the simple average account value
over the period indicated, and then multiplied by 184/366 to reflect the one-half year period.
2. Reflects expenses after fee waivers and expense reimbursements. Does not include acquired fund fees and expenses.
32 Annual Report
franklintempleton.com
| | | | | | | | | | | | | | | | | | |
| | | | | | FRANKLIN INVESTORS SECURITIES TRUST | |
| |
| |
| |
| Financial Highlights | | | | | | | | | | | | | | | | | | |
| Franklin Adjustable U.S. Government Securities Fund | | | | | | | | | | | | | | | | | | |
| | | | | | Year Ended October 31, | | | | | | |
| | | 2016 | | | 2015 | | | | 2014 | | | | 2013 | | | | 2012 | |
| Class A | | | | | | | | | | | | | | | | | | |
| Per share operating performance | | | | | | | | | | | | | | | | | | |
| (for a share outstanding throughout the year) | | | | | | | | | | | | | | | | | | |
| Net asset value, beginning of year | $ | 8.55 | | $ | 8.67 | | | $ | 8.72 | | | $ | 8.90 | | | $ | 8.84 | |
| Income from investment operationsa: | | | | | | | | | | | | | | | | | | |
| Net investment income | | 0.025 | | | 0.019 | | | | 0.043 | | | | 0.048 | | | | 0.078 | |
| Net realized and unrealized gains (losses) | | (0.053 | ) | | (0.040 | ) | | | 0.006 | | | | (0.098 | ) | | | 0.117 | |
| Total from investment operations | | (0.028 | ) | | (0.021 | ) | | | 0.049 | | | | (0.050 | ) | | | 0.195 | |
| Less distributions from net investment income | | (0.122 | ) | | (0.099 | ) | | | (0.099 | ) | | | (0.130 | ) | | | (0.135 | ) |
| Net asset value, end of year. | $ | 8.40 | | $ | 8.55 | | | $ | 8.67 | | | $ | 8.72 | | | $ | 8.90 | |
| |
| Total returnb | | (0.32 | )% | | (0.24 | )% | | | 0.56 | % | | (0.56 | )% | | | 2.22 | % |
| |
| Ratios to average net assets | | | | | | | | | | | | | | | | | | |
| Expenses before waiver and payments by affiliates | | 0.92 | % | | 0.91 | % | | | 0.93 | % | | | 0.87 | % | | | 0.87 | % |
| Expenses net of waiver and payments by affiliates | | 0.91 | %c | | 0.91 | %c,d | | | 0.93 | %c,d | | | 0.87 | % | | | 0.87 | % |
| Net investment income | | 0.43 | % | | 0.39 | % | | | 0.48 | % | | | 0.63 | % | | | 0.91 | % |
| |
| Supplemental data | | | | | | | | | | | | | | | | | | |
| Net assets, end of year (000’s) | $ | 667,671 | | $ | 848,918 | | $ | 1,058,838 | | $ | 1,105,674 | | $ | 1,308,971 | |
| Portfolio turnover rate | | 11.49 | % | | 9.98 | % | | 14.18 | % | | | 8.66 | % | | | 9.69 | % |
aThe amount shown for a share outstanding throughout the period may not correlate with the Statement of Operations for the period due to the timing of sales and
repurchases of the Fund’s shares in relation to income earned and/or fluctuating fair value of the investments of the Fund.
bTotal return does not reflect sales commissions or contingent deferred sales charges, if applicable.
cBenefit of expense reduction rounds to less than 0.01%.
dBenefit of waiver and payments by affiliates rounds to less than 0.01%.
franklintempleton.com
The accompanying notes are an integral part of these financial statements. | Annual Report 33
| | | | | | | | | | | |
| FRANKLIN INVESTORS SECURITIES TRUST | | | | | | | | | | | |
| FINANCIAL HIGHLIGHTS | | | | | | | | | | | |
| |
| |
| Franklin Adjustable U.S. Government Securities Fund (continued) | | | | | | | | | | | |
| | | Year Ended October 31, | | |
| | | 2016 | | | | 2015 | | | | 2014 | a |
| Class A1 | | | | | | | | | | | |
| Per share operating performance | | | | | | | | | | | |
| (for a share outstanding throughout the year) | | | | | | | | | | | |
| Net asset value, beginning of year | $ | 8.54 | | | $ | 8.67 | | | $ | 8.68 | |
| Income from investment operationsb: | | | | | | | | | | | |
| Net investment income | | 0.049 | | | | 0.046 | | | | 0.018 | |
| Net realized and unrealized gains (losses) | | (0.054 | ) | | | (0.062 | ) | | | 0.010 | |
| Total from investment operations. | | (0.005 | ) | | | (0.016 | ) | | | 0.028 | |
| Less distributions from net investment income | | (0.135 | ) | | | (0.114 | ) | | | (0.038 | ) |
| Net asset value, end of year | $ | 8.40 | | | $ | 8.54 | | | $ | 8.67 | |
| |
| Total returnc | | (0.05 | )% | | (0.19 | )% | | | 0.32 | % |
| |
| Ratios to average net assetsd | | | | | | | | | | | |
| Expenses before waiver and payments by affiliates | | 0.77 | % | | | 0.75 | % | | | 0.78 | % |
| Expenses net of waiver and payments by affiliates | | 0.76 | %e | | | 0.75 | %e,f | | | 0.78 | %e,f |
| Net investment income. | | 0.58 | % | | | 0.55 | % | | | 0.63 | % |
| |
| Supplemental data | | | | | | | | | | | |
| Net assets, end of year (000’s) | $ | 160,469 | | $ | 198,670 | | $ | 253,021 | |
| Portfolio turnover rate | | 11.49 | % | | | 9.98 | % | | 14.18 | % |
aFor the period June 18, 2014 (effective date) to October 31, 2014.
bThe amount shown for a share outstanding throughout the period may not correlate with the Statement of Operations for the period due to the timing of sales and
repurchases of the Fund’s shares in relation to income earned and/or fluctuating fair value of the investments of the Fund.
cTotal return does not reflect sales commissions or contingent deferred sales charges, if applicable, and is not annualized for periods less than one year.
dRatios are annualized for periods less than one year.
eBenefit of expense reduction rounds to less than 0.01%.
fBenefit of waiver and payments by affiliates rounds to less than 0.01%.
34 Annual Report | The accompanying notes are an integral part of these financial statements.
franklintempleton.com
| | | | | | | | | | | | | | | | | | | |
| | | | | | | FRANKLIN INVESTORS SECURITIES TRUST | |
| | | | | | | | | | | FINANCIAL HIGHLIGHTS | |
| |
| |
| Franklin Adjustable U.S. Government Securities Fund (continued) | | | | | | | | | | | | | | | | |
| | | | | | | Year Ended October 31, | | | | | | |
| | | | 2016 | | | 2015 | | | | 2014 | | | | 2013 | | | | 2012 | |
| Class C | | | | | | | | | | | | | | | | | | | |
| Per share operating performance | | | | | | | | | | | | | | | | | | | |
| (for a share outstanding throughout the year) | | | | | | | | | | | | | | | | | | | |
| Net asset value, beginning of year | | $ | 8.54 | | $ | 8.66 | | | $ | 8.71 | | | $ | 8.90 | | | $ | 8.83 | |
| Income from investment operationsa: | | | | | | | | | | | | | | | | | | | |
| Net investment income (loss) | | | (0.011 | ) | | (0.013 | ) | | | (0.004 | ) | | | 0.006 | | | | 0.042 | |
| Net realized and unrealized gains (losses) | | | (0.041 | ) | | (0.043 | ) | | | 0.018 | | | | (0.101 | ) | | | 0.128 | |
| Total from investment operations | | | (0.052 | ) | | (0.056 | ) | | | 0.014 | | | | (0.095 | ) | | | 0.170 | |
| Less distributions from net investment income | | | (0.088 | ) | | (0.064 | ) | | | (0.064 | ) | | | (0.095 | ) | | | (0.100 | ) |
| Net asset value, end of year. | | $ | 8.40 | | $ | 8.54 | | | $ | 8.66 | | | $ | 8.71 | | | $ | 8.90 | |
| |
| Total returnb | | (0.61 | )% | | (0.65 | )% | | | 0.16 | % | | (1.07 | )% | | | 1.93 | % |
| |
| Ratios to average net assets | | | | | | | | | | | | | | | | | | | |
| Expenses before waiver and payments by affiliates | | | 1.32 | % | | 1.31 | % | | | 1.33 | % | | | 1.27 | % | | | 1.27 | % |
| Expenses net of waiver and payments by affiliates | | | 1.31 | %c | | 1.31 | %c,d | | | 1.33 | %c,d | | | 1.27 | % | | | 1.27 | % |
| Net investment income (loss) | | | 0.03 | % | | (0.01 | )% | | | 0.08 | % | | | 0.23 | % | | | 0.51 | % |
| |
| Supplemental data | | | | | | | | | | | | | | | | | | | |
| Net assets, end of year (000’s) | $ | 266,186 | | $ | 336,254 | | $ | 428,031 | | $ | 603,067 | | $ | 794,201 | |
| Portfolio turnover rate | | 11.49 | % | | 9.98 | % | | 14.18 | % | | | 8.66 | % | | | 9.69 | % |
aThe amount shown for a share outstanding throughout the period may not correlate with the Statement of Operations for the period due to the timing of sales and
repurchases of the Fund’s shares in relation to income earned and/or fluctuating fair value of the investments of the Fund.
bTotal return does not reflect sales commissions or contingent deferred sales charges, if applicable.
cBenefit of expense reduction rounds to less than 0.01%.
dBenefit of waiver and payments by affiliates rounds to less than 0.01%.
franklintempleton.com
The accompanying notes are an integral part of these financial statements. | Annual Report 35
| | | | | | | | | | | | |
| FRANKLIN INVESTORS SECURITIES TRUST | | | | | | | | | | | | |
| FINANCIAL HIGHLIGHTS | | | | | | | | | | | | |
| |
| |
| Franklin Adjustable U.S. Government Securities Fund (continued) | | | | | | | | | | | | |
| | | | | | Year Ended October 31, | | | | |
| | | 2016 | | | 2015 | | | 2014 | | | 2013 | a |
| Class R6 | | | | | | | | | | | | |
| Per share operating performance | | | | | | | | | | | | |
| (for a share outstanding throughout the year) | | | | | | | | | | | | |
| Net asset value, beginning of year | $ | 8.55 | | $ | 8.68 | | $ | 8.73 | | $ | 8.72 | |
| Income from investment operationsb: | | | | | | | | | | | | |
| Net investment income. | | 0.066 | | | 0.013 | | | 0.088 | c | | 0.008 | |
| Net realized and unrealized gains (losses) | | (0.053 | ) | | (0.010 | ) | | (0.009 | ) | | 0.018 | |
| Total from investment operations | | 0.013 | | | 0.003 | | | 0.079 | | | 0.026 | |
| Less distributions from net investment income | | (0.153 | ) | | (0.133 | ) | | (0.129 | ) | | (0.016 | ) |
| Net asset value, end of year | $ | 8.41 | | $ | 8.55 | | $ | 8.68 | | $ | 8.73 | |
| |
| Total returnd | | 0.15 | % | | 0.03 | % | | 0.92 | % | | 0.30 | % |
| |
| Ratios to average net assetse | | | | | | | | | | | | |
| Expenses before waiver and payments by affiliates | | 0.56 | % | | 0.53 | % | | 0.56 | % | | 0.53 | % |
| Expenses net of waiver and payments by affiliates | | 0.55 | %f | | 0.53 | %f,g | | 0.56 | %f,g | | 0.53 | % |
| Net investment income | | 0.79 | % | | 0.77 | % | | 0.85 | % | | 0.97 | % |
| |
| Supplemental data | | | | | | | | | | | | |
| Net assets, end of year (000’s) | $ | 2,374 | | $ | 2,176 | | $ | 7,193 | | $ | 335 | |
| Portfolio turnover rate | | 11.49 | % | | 9.98 | % | | 14.18 | % | | 8.66 | % |
aFor the period September 20, 2013 (effective date) to October 31, 2013.
bThe amount shown for a share outstanding throughout the period may not correlate with the Statement of Operations for the period due to the timing of sales and
repurchases of the Fund’s shares in relation to income earned and/or fluctuating fair value of the investments of the Fund.
cBased on average daily shares outstanding.
dTotal return is not annualized for periods less than one year.
eRatios are annualized for periods less than one year.
fBenefit of expense reduction rounds to less than 0.01%.
gBenefit of waiver and payments by affiliates rounds to less than 0.01%.
36 Annual Report | The accompanying notes are an integral part of these financial statements.
franklintempleton.com
| | | | | | | | | | | | | | | | | | | |
| | | | | | | FRANKLIN INVESTORS SECURITIES TRUST | |
| | | | | | | | | | | FINANCIAL HIGHLIGHTS | |
| |
| |
| Franklin Adjustable U.S. Government Securities Fund (continued) | | | | | | | | | | | | | | | | |
| | | | | | | Year Ended October 31, | | | | | | |
| | | | 2016 | | | 2015 | | | | 2014 | | | | 2013 | | | | 2012 | |
| Advisor Class | | | | | | | | | | | | | | | | | | | |
| Per share operating performance | | | | | | | | | | | | | | | | | | | |
| (for a share outstanding throughout the year) | | | | | | | | | | | | | | | | | | | |
| Net asset value, beginning of year | | $ | 8.55 | | $ | 8.68 | | | $ | 8.73 | | | $ | 8.91 | | | $ | 8.85 | |
| Income from investment operationsa: | | | | | | | | | | | | | | | | | | | |
| Net investment income | | | 0.046 | | | 0.040 | | | | 0.068 | | | | 0.073 | | | | 0.107 | |
| Net realized and unrealized gains (losses) | | | (0.043 | ) | | (0.049 | ) | | | 0.003 | | | | (0.101 | ) | | | 0.111 | |
| Total from investment operations | | | 0.003 | | | (0.009 | ) | | | 0.071 | | | | (0.028 | ) | | | 0.218 | |
| Less distributions from net investment income | | | (0.143 | ) | | (0.121 | ) | | | (0.121 | ) | | | (0.152 | ) | | | (0.158 | ) |
| Net asset value, end of year. | | $ | 8.41 | | $ | 8.55 | | | $ | 8.68 | | | $ | 8.73 | | | $ | 8.91 | |
| |
| Total return | | | 0.05 | % | | (0.11 | )% | | | 0.82 | % | | (0.31 | )% | | | 2.48 | % |
| |
| Ratios to average net assets | | | | | | | | | | | | | | | | | | | |
| Expenses before waiver and payments by affiliates | | | 0.67 | % | | 0.66 | % | | | 0.68 | % | | | 0.62 | % | | | 0.62 | % |
| Expenses net of waiver and payments by affiliates | | | 0.66 | %b | | 0.66 | %b,c | | | 0.68 | %b,c | | | 0.62 | % | | | 0.62 | % |
| Net investment income | | | 0.68 | % | | 0.64 | % | | | 0.73 | % | | | 0.88 | % | | | 1.16 | % |
| |
| Supplemental data | | | | | | | | | | | | | | | | | | | |
| Net assets, end of year (000’s) | $ | 227,599 | | $ | 308,683 | | $ | 416,854 | | $ | 411,228 | | $ | 437,540 | |
| Portfolio turnover rate | | 11.49 | % | | 9.98 | % | | 14.18 | % | | | 8.66 | % | | | 9.69 | % |
aThe amount shown for a share outstanding throughout the period may not correlate with the Statement of Operations for the period due to the timing of sales and
repurchases of the Fund’s shares in relation to income earned and/or fluctuating fair value of the investments of the Fund.
bBenefit of expense reduction rounds to less than 0.01%.
cBenefit of waiver and payments by affiliates rounds to less than 0.01%.
franklintempleton.com
The accompanying notes are an integral part of these financial statements. | Annual Report 37
| | | | |
| FRANKLIN INVESTORS SECURITIES TRUST | | | | |
| |
| |
| |
| |
| Statement of Investments, October 31, 2016 | | | | |
| Franklin Adjustable U.S. Government Securities Fund | | | | |
| | | Principal | | |
| | | Amount | | Value |
| |
| Mortgage-Backed Securities 97.5% | | | | |
| a Federal Home Loan Mortgage Corp. (FHLMC) Adjustable Rate 24.4% | | | | |
| FHLMC, 2.361%, 1/01/36 | $ | 6,809,008 | $ | 7,232,498 |
| FHLMC, 2.594%, 9/01/35 | | 11,193,783 | | 11,745,011 |
| FHLMC, 1.94% - 2.657%, 2/01/18 - 5/01/37 | | 11,461,137 | | 12,103,866 |
| FHLMC, 2.67% - 2.689%, 2/01/36 - 4/01/37 | | 12,179,120 | | 12,902,187 |
| FHLMC, 2.708%, 12/01/35. | | 6,040,446 | | 6,356,706 |
| FHLMC, 2.739%, 4/01/38 | | 6,809,650 | | 7,177,336 |
| FHLMC, 2.754%, 4/01/34 | | 11,645,091 | | 12,352,108 |
| FHLMC, 2.696% - 2.764%, 8/01/33 - 8/01/37 | | 11,615,880 | | 12,304,989 |
| FHLMC, 2.767%, 12/01/35. | | 6,291,831 | | 6,674,498 |
| FHLMC, 2.801%, 9/01/37 | | 38,396,231 | | 40,850,721 |
| FHLMC, 2.775% - 2.809%, 12/01/34 - 11/01/37 | | 12,098,610 | | 12,824,944 |
| FHLMC, 2.821%, 12/01/35. | | 6,998,125 | | 7,434,849 |
| FHLMC, 2.824%, 3/01/37 | | 6,293,799 | | 6,661,089 |
| FHLMC, 2.814% - 2.83%, 11/01/35 - 12/01/37 | | 10,254,584 | | 10,859,211 |
| FHLMC, 2.845%, 11/01/35. | | 5,625,302 | | 5,951,038 |
| FHLMC, 2.83% - 2.847%, 11/01/36 - 10/01/38 | | 11,331,640 | | 11,979,955 |
| FHLMC, 2.847% - 2.877%, 4/01/34 - 4/01/40 | | 11,272,073 | | 11,940,249 |
| FHLMC, 2.91%, 11/01/37 | | 7,839,275 | | 8,264,881 |
| FHLMC, 2.92%, 9/01/36 | | 6,865,053 | | 7,315,344 |
| FHLMC, 2.933%, 7/01/35 | | 15,800,723 | | 16,866,234 |
| FHLMC, 2.881% - 2.949%, 6/01/35 - 5/01/40 | | 12,189,998 | | 12,915,406 |
| FHLMC, 2.952% - 2.977%, 8/01/34 - 9/01/37 | | 9,209,933 | | 9,784,734 |
| FHLMC, 2.982%, 9/01/38 | | 7,348,092 | | 7,803,172 |
| FHLMC, 3.007%, 10/01/41. | | 7,744,304 | | 8,155,117 |
| FHLMC, 2.994% - 3.03%, 6/01/35 - 11/01/41 | | 12,251,482 | | 12,953,242 |
| FHLMC, 3.046%, 11/01/40. | | 8,758,658 | | 9,298,031 |
| FHLMC, 3.086%, 6/01/37 | | 14,224,395 | | 15,105,917 |
| FHLMC, 3.126%, 1/01/37 | | 6,867,076 | | 7,300,720 |
| FHLMC, 3.058% - 4.018%, 8/01/34 - 9/01/37 | | 9,365,595 | | 9,964,961 |
| | | | | 323,079,014 |
| a Federal National Mortgage Association (FNMA) Adjustable Rate 73.0% | | | | |
| FNMA, 1.24% - 1.943%, 7/01/17 - 11/01/44 | | 11,552,581 | | 11,878,891 |
| FNMA, 1.943% - 2.18%, 2/01/17 - 3/01/43 | | 12,015,526 | | 12,497,572 |
| FNMA, 2.281%, 1/01/36 | | 6,964,297 | | 7,297,575 |
| FNMA, 2.18% - 2.325%, 7/01/17 - 11/01/42 | | 11,601,496 | | 12,073,459 |
| FNMA, 2.327% - 2.40%, 11/01/17 - 2/01/43 | | 12,482,674 | | 12,987,691 |
| FNMA, 2.40% - 2.45%, 10/01/17 - 2/01/37 | | 12,059,992 | | 12,594,488 |
| FNMA, 2.455%, 12/01/34 | | 10,668,008 | | 11,201,308 |
| FNMA, 2.451% - 2.474%, 5/01/19 - 12/01/39 | | 12,397,770 | | 12,916,383 |
| FNMA, 2.475% - 2.495%, 9/01/19 - 4/01/37 | | 12,097,443 | | 12,676,822 |
| FNMA, 2.495% - 2.511%, 5/01/17 - 9/01/38 | | 12,516,816 | | 13,112,083 |
| FNMA, 2.537%, 3/01/35 | | 5,586,742 | | 5,883,090 |
| FNMA, 2.511% - 2.543%, 2/01/17 - 12/01/39 | | 12,460,318 | | 13,093,300 |
| FNMA, 2.543% - 2.58%, 5/01/18 - 1/01/42 | | 12,459,701 | | 13,087,482 |
| FNMA, 2.58% - 2.597%, 9/01/19 - 1/01/38 | | 11,012,183 | | 11,587,781 |
| FNMA, 2.601%, 2/01/36 | | 13,216,324 | | 13,879,098 |
| FNMA, 2.607%, 3/01/38 | | 7,400,697 | | 7,831,602 |
| FNMA, 2.598% - 2.612%, 2/01/18 - 12/01/37 | | 11,552,984 | | 12,156,041 |
| FNMA, 2.612% - 2.624%, 3/01/18 - 11/01/37 | | 12,393,755 | | 13,066,427 |
| FNMA, 2.624% - 2.638%, 6/01/19 - 1/01/39 | | 12,424,674 | | 13,074,551 |
| FNMA, 2.638% - 2.65%, 12/01/18 - 7/01/38 | | 12,625,433 | | 13,223,926 |
38 Annual Report
franklintempleton.com
FRANKLIN INVESTORS SECURITIES TRUST
STATEMENT OF INVESTMENTS
| | | | |
| Franklin Adjustable U.S. Government Securities Fund (continued) | | | | |
| | | Principal | | |
| | | Amount | | Value |
| |
| Mortgage-Backed Securities (continued) | | | | |
| a Federal National Mortgage Association (FNMA) Adjustable Rate (continued) | | | | |
| FNMA, 2.651%, 5/01/39 | $ | 11,072,921 | $ | 11,676,237 |
| FNMA, 2.66%, 1/01/38 | | 9,034,442 | | 9,494,322 |
| FNMA, 2.65% - 2.664%, 5/01/22 - 4/01/38 | | 7,944,270 | | 8,331,660 |
| FNMA, 2.664% - 2.669%, 2/01/19 - 4/01/36 | | 12,650,607 | | 13,210,059 |
| FNMA, 2.67% - 2.672%, 9/01/25 - 1/01/38 | | 9,405,351 | | 9,911,861 |
| FNMA, 2.672% - 2.675%, 9/01/22 - 10/01/37 | | 9,135,746 | | 9,630,180 |
| FNMA, 2.675% - 2.682%, 10/01/18 - 7/01/40 | | 12,028,424 | | 12,736,228 |
| FNMA, 2.682% - 2.696%, 9/01/20 - 1/01/41 | | 12,473,057 | | 13,116,992 |
| FNMA, 2.696% - 2.702%, 10/01/22 - 9/01/39 | | 10,148,972 | | 10,720,549 |
| FNMA, 2.702% - 2.722%, 12/01/19 - 5/01/38 | | 12,550,377 | | 13,208,684 |
| FNMA, 2.722% - 2.731%, 3/01/18 - 2/01/41 | | 12,135,488 | | 12,773,736 |
| FNMA, 2.739%, 2/01/36 | | 8,103,507 | | 8,547,551 |
| FNMA, 2.731% - 2.74%, 12/01/20 - 9/01/39 | | 11,362,116 | | 11,947,603 |
| FNMA, 2.749%, 10/01/35 | | 5,763,395 | | 6,098,829 |
| FNMA, 2.74% - 2.754%, 6/01/17 - 3/01/41 | | 11,564,846 | | 12,188,647 |
| FNMA, 2.755% - 2.768%, 12/01/17 - 3/01/38 | | 8,809,080 | | 9,313,285 |
| FNMA, 2.768% - 2.773%, 6/01/19 - 8/01/37 | | 10,121,076 | | 10,693,208 |
| FNMA, 2.774%, 5/01/36 | | 29,595,373 | | 31,378,249 |
| FNMA, 2.773% - 2.782%, 10/01/18 - 3/01/40 | | 9,430,570 | | 9,951,657 |
| FNMA, 2.794%, 1/01/39 | | 8,145,455 | | 8,575,072 |
| FNMA, 2.782% - 2.795%, 1/01/18 - 4/01/40 | | 10,822,274 | | 11,427,107 |
| FNMA, 2.796%, 1/01/36 | | 7,877,532 | | 8,318,614 |
| FNMA, 2.795% - 2.80%, 12/01/17 - 8/01/37 | | 10,363,831 | | 10,923,165 |
| FNMA, 2.80%, 11/01/34 | | 8,321,258 | | 8,766,198 |
| FNMA, 2.80% - 2.808%, 1/01/19 - 5/01/38 | | 11,182,856 | | 11,762,925 |
| FNMA, 2.813%, 3/01/35 | | 11,945,730 | | 12,638,389 |
| FNMA, 2.808% - 2.824%, 1/01/18 - 9/01/39 | | 9,569,386 | | 10,089,259 |
| FNMA, 2.824% - 2.829%, 3/01/19 - 4/01/40 | | 11,514,686 | | 12,202,374 |
| FNMA, 2.831%, 2/01/36 | | 7,627,716 | | 8,052,567 |
| FNMA, 2.829% - 2.837%, 3/01/24 - 7/01/42 | | 12,358,383 | | 13,068,785 |
| FNMA, 2.838% - 2.845%, 9/01/23 - 5/01/39 | | 11,584,190 | | 12,276,176 |
| FNMA, 2.852%, 3/01/37 | | 8,546,643 | | 9,023,771 |
| FNMA, 2.845% - 2.859%, 3/01/19 - 9/01/37 | | 12,112,178 | | 12,807,670 |
| FNMA, 2.86% - 2.867%, 8/01/28 - 1/01/42 | | 12,397,081 | | 13,069,762 |
| FNMA, 2.871%, 9/01/37 | | 5,683,323 | | 6,022,763 |
| FNMA, 2.875%, 8/01/35 | | 5,598,425 | | 5,938,457 |
| FNMA, 2.88%, 9/01/39 | | 5,671,105 | | 6,001,399 |
| FNMA, 2.867% - 2.881%, 8/01/19 - 10/01/38 | | 11,321,704 | | 11,921,824 |
| FNMA, 2.881% - 2.901%, 2/01/24 - 5/01/38 | | 11,323,988 | | 11,927,401 |
| FNMA, 2.906%, 3/01/41 | | 9,934,197 | | 10,523,747 |
| FNMA, 2.902% - 2.916%, 4/01/18 - 7/01/42 | | 12,530,921 | | 13,212,155 |
| FNMA, 2.917%, 9/01/36 | | 6,601,270 | | 6,920,619 |
| FNMA, 2.923%, 12/01/36 | | 10,237,567 | | 10,846,240 |
| FNMA, 2.929%, 7/01/40 | | 7,912,348 | | 8,387,172 |
| FNMA, 2.917% - 2.937%, 6/01/19 - 11/01/39 | | 10,906,994 | | 11,498,014 |
| FNMA, 2.937% - 2.942%, 8/01/33 - 8/01/39 | | 11,238,313 | | 11,908,729 |
| FNMA, 2.947%, 2/01/43 | | 7,073,140 | | 7,485,476 |
| FNMA, 2.942% - 2.95%, 11/01/24 - 9/01/36 | | 11,845,730 | | 12,531,759 |
| FNMA, 2.955%, 5/01/40 | | 7,538,725 | | 8,003,171 |
| FNMA, 2.95% - 2.97%, 1/01/19 - 4/01/41. | | 12,408,001 | | 13,084,071 |
| FNMA, 2.972%, 11/01/35 | | 5,453,059 | | 5,751,956 |
franklintempleton.com
Annual Report
39
FRANKLIN INVESTORS SECURITIES TRUST
STATEMENT OF INVESTMENTS
| | | | |
| Franklin Adjustable U.S. Government Securities Fund (continued) | | | | |
| | | Principal | | |
| | | Amount | | Value |
| |
| Mortgage-Backed Securities (continued) | | | | |
| a Federal National Mortgage Association (FNMA) Adjustable Rate (continued) | | | | |
| FNMA, 2.972% - 2.98%, 8/01/22 - 5/01/48 | $ | 11,922,182 | $ | 12,642,595 |
| FNMA, 2.987%, 6/01/35 | | 6,239,596 | | 6,598,132 |
| FNMA, 2.98% - 2.997%, 11/01/25 - 4/01/44 | | 12,195,545 | | 12,883,531 |
| FNMA, 2.998% - 3.014%, 12/01/16 - 10/01/41 | | 12,512,629 | | 13,217,257 |
| FNMA, 3.014% - 3.027%, 8/01/26 - 8/01/37 | | 12,470,483 | | 13,166,898 |
| FNMA, 3.038%, 1/01/37 | | 8,598,442 | | 9,120,843 |
| FNMA, 3.028% - 3.05%, 5/01/18 - 11/01/37 | | 12,058,988 | | 12,750,959 |
| FNMA, 3.059%, 11/01/34 | | 7,352,879 | | 7,789,208 |
| FNMA, 3.05% - 3.066%, 7/01/17 - 5/01/48 | | 11,465,845 | | 12,102,427 |
| FNMA, 3.067%, 1/01/36 | | 7,252,290 | | 7,708,716 |
| FNMA, 3.067% - 3.106%, 9/01/17 - 3/01/47 | | 10,677,028 | | 11,243,472 |
| FNMA, 3.107% - 3.193%, 6/01/17 - 10/01/40 | | 12,097,981 | | 12,785,823 |
| FNMA, 3.334%, 4/01/34 | | 29,280,214 | | 31,116,247 |
| FNMA, 3.199% - 3.633%, 7/01/17 - 11/01/46 | | 12,451,095 | | 13,155,505 |
| FNMA, 3.634% - 7.67%, 7/01/17 - 3/01/38 | | 4,333,534 | | 4,461,055 |
| | | | | 966,758,562 |
| a Government National Mortgage Association (GNMA) Adjustable Rate 0.1% | | | | |
| GNMA, 1.875% - 2.125%, 9/20/33 - 5/20/36. | | 1,515,940 | | 1,559,734 |
| Total Mortgage-Backed Securities (Cost $1,282,882,940) | | | | 1,291,397,310 |
| |
| |
| | | Shares | | |
| |
| Short Term Investments (Cost $26,812,763) 2.0% | | | | |
| Money Market Funds 2.0% | | | | |
| b,c Institutional Fiduciary Trust Money Market Portfolio. | | 26,812,763 | | 26,812,763 |
| Total Investments (Cost $1,309,695,703) 99.5% | | | | 1,318,210,073 |
| Other Assets, less Liabilities 0.5% | | | | 6,087,946 |
| Net Assets 100.0% | | | $ | 1,324,298,019 |
See Abbreviations on page 140.
aThe coupon rate shown represents the rate at period end.
bNon-income producing.
cSee Note 3(f) regarding investments in affiliated management investment companies.
40 Annual Report | The accompanying notes are an integral part of these financial statements.
franklintempleton.com
| | | | | | | | | | | | | | | | | | |
| | | | | | FRANKLIN INVESTORS SECURITIES TRUST | |
| |
| |
| |
| Financial Highlights | | | | | | | | | | | | | | | | | | |
| Franklin Floating Rate Daily Access Fund | | | | | | | | | | | | | | | | | | |
| | | | | | Year Ended October 31, | | | | | | |
| | | 2016 | | | 2015 | | | | 2014 | | | | 2013 | | | | 2012 | |
| Class A | | | | | | | | | | | | | | | | | | |
| Per share operating performance | | | | | | | | | | | | | | | | | | |
| (for a share outstanding throughout the year) | | | | | | | | | | | | | | | | | | |
| Net asset value, beginning of year | $ | 8.61 | | $ | 9.04 | | | $ | 9.20 | | | $ | 9.11 | | | $ | 8.89 | |
| Income from investment operationsa: | | | | | | | | | | | | | | | | | | |
| Net investment income | | 0.401 | | | 0.406 | | | | 0.335 | | | | 0.333 | | | | 0.403 | |
| Net realized and unrealized gains (losses) | | 0.228 | | | (0.434 | ) | | | (0.160 | ) | | | 0.088 | | | | 0.225 | |
| Total from investment operations | | 0.629 | | | (0.028 | ) | | | 0.175 | | | | 0.421 | | | | 0.628 | |
| Less distributions from net investment income | | (0.399 | ) | | (0.402 | ) | | | (0.335 | ) | | | (0.331 | ) | | | (0.408 | ) |
| Net asset value, end of year. | $ | 8.84 | | $ | 8.61 | | | $ | 9.04 | | | $ | 9.20 | | | $ | 9.11 | |
| |
| Total returnb | | 7.60 | % | | (0.37 | )% | | | 1.91 | % | | | 4.69 | % | | | 7.22 | % |
| |
| Ratios to average net assets | | | | | | | | | | | | | | | | | | |
| Expenses before waiver and payments by affiliates | | 0.88 | % | | 0.85 | % | | | 0.84 | % | | | 0.83 | % | | | 0.90 | % |
| Expenses net of waiver and payments by affiliates | | 0.86 | %c | | 0.84 | %c | | | 0.82 | %c | | | 0.83 | %c,d | | | 0.90 | % |
| Net investment income | | 4.72 | % | | 4.55 | % | | | 3.64 | % | | | 3.60 | % | | | 4.52 | % |
| |
| Supplemental data | | | | | | | | | | | | | | | | | | |
| Net assets, end of year (000’s) | $ | 1,359,862 | | $ | 1,553,100 | | $ | 1,874,867 | | $ | 1,991,138 | | $ | 1,295,166 | |
| Portfolio turnover rate | | 34.10 | % | | 46.72 | % | | 83.93 | % | | 42.72 | % | | 80.88 | % |
aThe amount shown for a share outstanding throughout the period may not correlate with the Statement of Operations for the period due to the timing of sales and
repurchases of the Fund’s shares in relation to income earned and/or fluctuating fair value of the investments of the Fund.
bTotal return does not reflect sales commissions or contingent deferred sales charges, if applicable.
cBenefit of expense reduction rounds to less than 0.01%.
dBenefit of waiver and payments by affiliates rounds to less than 0.01%.
franklintempleton.com
The accompanying notes are an integral part of these financial statements. | Annual Report 41
| | | | | | | | | | | | | | | | | |
| FRANKLIN INVESTORS SECURITIES TRUST | | | | | | | | | | | | | | | | | |
| FINANCIAL HIGHLIGHTS | | | | | | | | | | | | | | | | | |
| |
| |
| Franklin Floating Rate Daily Access Fund (continued) | | | | | | | | | | | | | | | | | |
| | | | | | Year Ended October 31, | | | | | |
| | | 2016 | | | 2015 | | | | 2014 | | | | 2013 | | | 2012 | |
| Class C | | | | | | | | | | | | | | | | | |
| Per share operating performance | | | | | | | | | | | | | | | | | |
| (for a share outstanding throughout the year) | | | | | | | | | | | | | | | | | |
| Net asset value, beginning of year | $ | 8.61 | | $ | 9.05 | | | $ | 9.20 | | | $ | 9.11 | | $ | 8.89 | |
| Income from investment operationsa: | | | | | | | | | | | | | | | | | |
| Net investment income | | 0.366 | | | 0.369 | | | | 0.298 | | | | 0.296 | | | 0.368 | |
| Net realized and unrealized gains (losses) | | 0.229 | | | (0.443 | ) | | | (0.150 | ) | | | 0.088 | | | 0.224 | |
| Total from investment operations | | 0.595 | | | (0.074 | ) | | | 0.148 | | | | 0.384 | | | 0.592 | |
| Less distributions from net investment income | | (0.365 | ) | | (0.366 | ) | | | (0.298 | ) | | | (0.294 | ) | | (0.372 | ) |
| Net asset value, end of year. | $ | 8.84 | | $ | 8.61 | | | $ | 9.05 | | | $ | 9.20 | | $ | 9.11 | |
| |
| Total returnb | | 7.18 | % | | (0.87 | )% | | | 1.62 | % | | | 4.28 | % | | 6.79 | % |
| |
| Ratios to average net assets | | | | | | | | | | | | | | | | | |
| Expenses before waiver and payments by affiliates | | 1.28 | % | | 1.25 | % | | | 1.24 | % | | | 1.23 | % | | 1.30 | % |
| Expenses net of waiver and payments by affiliates | | 1.26 | %c | | 1.24 | %c | | | 1.22 | %c | | | 1.23 | %c,d | | 1.30 | % |
| Net investment income | | 4.32 | % | | 4.15 | % | | | 3.24 | % | | | 3.20 | % | | 4.12 | % |
| |
| Supplemental data | | | | | | | | | | | | | | | | | |
| Net assets, end of year (000’s) | $ | 551,726 | | $ | 627,805 | | $ | 742,602 | | $ | 765,839 | | $ | 431,818 | |
| Portfolio turnover rate | | 34.10 | % | | 46.72 | % | | 83.93 | % | | 42.72 | % | | 80.88 | % |
aThe amount shown for a share outstanding throughout the period may not correlate with the Statement of Operations for the period due to the timing of sales and
repurchases of the Fund’s shares in relation to income earned and/or fluctuating fair value of the investments of the Fund.
bTotal return does not reflect sales commissions or contingent deferred sales charges, if applicable.
cBenefit of expense reduction rounds to less than 0.01%.
dBenefit of waiver and payments by affiliates rounds to less than 0.01%.
42 Annual Report | The accompanying notes are an integral part of these financial statements.
franklintempleton.com
| | | | | | | | | | | | | |
| | | FRANKLIN INVESTORS SECURITIES TRUST | |
| | | | | | | FINANCIAL HIGHLIGHTS | |
| |
| |
| Franklin Floating Rate Daily Access Fund (continued) | | | | | | | | | | | | | |
| | | | | Year Ended October 31, | | | | |
| | | 2016 | | | | 2015 | | | 2014 | | | 2013 | a |
| Class R6 | | | | | | | | | | | | | |
| Per share operating performance | | | | | | | | | | | | | |
| (for a share outstanding throughout the year) | | | | | | | | | | | | | |
| Net asset value, beginning of year | $ | 8.60 | | $ | | 9.05 | | $ | 9.21 | | $ | 9.21 | |
| Income from investment operationsb: | | | | | | | | | | | | | |
| Net investment income. | | 0.422 | | | | 0.437 | | | 0.364 | | | 0.175 | |
| Net realized and unrealized gains (losses) | | 0.245 | | | | (0.457 | ) | | (0.159 | ) | | (0.001 | ) |
| Total from investment operations | | 0.667 | | | | (0.020 | ) | | 0.205 | | | 0.174 | |
| Less distributions from net investment income | | (0.427 | ) | | | (0.430 | ) | | (0.365 | ) | | (0.174 | ) |
| Net asset value, end of year | $ | 8.84 | | $ | | 8.60 | | $ | 9.05 | | $ | 9.21 | |
| |
| Total returnc | | 7.96 | % | (0.16 | )% | | 2.36 | % | | 1.80 | % |
| |
| Ratios to average net assetsd | | | | | | | | | | | | | |
| Expenses before waiver and payments by affiliates | | 0.53 | % | | | 0.72 | % | | 0.52 | % | | 0.51 | % |
| Expenses net of waiver and payments by affiliates | | 0.51 | %e | | | 0.51 | %e | | 0.50 | %e | | 0.51 | %e,f |
| Net investment income | | 5.07 | % | | | 4.88 | % | | 3.96 | % | | 3.92 | % |
| |
| Supplemental data | | | | | | | | | | | | | |
| Net assets, end of year (000’s) | $ | 12,333 | | | $ | 7 | | $ | 465 | | $ | 1,339 | |
| Portfolio turnover rate | | 34.10 | % | 46.72 | % | | 83.93 | % | | 42.72 | % |
aFor the period May 1, 2013 (effective date) to October 31, 2013.
bThe amount shown for a share outstanding throughout the period may not correlate with the Statement of Operations for the period due to the timing of sales and
repurchases of the Fund’s shares in relation to income earned and/or fluctuating fair value of the investments of the Fund.
cTotal return is not annualized for periods less than one year.
dRatios are annualized for periods less than one year.
eBenefit of expense reduction rounds to less than 0.01%.
fBenefit of waiver and payments by affiliates rounds to less than 0.01%.
franklintempleton.com
The accompanying notes are an integral part of these financial statements. | Annual Report 43
| | | | | | | | | | | | | | | | | |
| FRANKLIN INVESTORS SECURITIES TRUST | | | | | | | | | | | | | | | | | |
| FINANCIAL HIGHLIGHTS | | | | | | | | | | | | | | | | | |
| |
| |
| Franklin Floating Rate Daily Access Fund (continued) | | | | | | | | | | | | | | | | | |
| | | �� | | | Year Ended October 31, | | | | | |
| | | 2016 | | | 2015 | | | | 2014 | | | | 2013 | | | 2012 | |
| Advisor Class | | | | | | | | | | | | | | | | | |
| Per share operating performance | | | | | | | | | | | | | | | | | |
| (for a share outstanding throughout the year) | | | | | | | | | | | | | | | | | |
| Net asset value, beginning of year | $ | 8.61 | | $ | 9.05 | | | $ | 9.20 | | | $ | 9.11 | | $ | 8.89 | |
| Income from investment operationsa: | | | | | | | | | | | | | | | | | |
| Net investment income | | 0.422 | | | 0.427 | | | | 0.358 | | | | 0.355 | | | 0.426 | |
| Net realized and unrealized gains (losses) | | 0.239 | | | (0.443 | ) | | | (0.150 | ) | | | 0.089 | | | 0.225 | |
| Total from investment operations | | 0.661 | | | (0.016 | ) | | | 0.208 | | | | 0.444 | | | 0.651 | |
| Less distributions from net investment income | | (0.421 | ) | | (0.424 | ) | | | (0.358 | ) | | | (0.354 | ) | | (0.431 | ) |
| Net asset value, end of year. | $ | 8.85 | | $ | 8.61 | | | $ | 9.05 | | | $ | 9.20 | | $ | 9.11 | |
| |
| Total return | | 8.00 | % | | (0.23 | )% | | | 2.28 | % | | | 4.95 | % | | 7.49 | % |
| |
| Ratios to average net assets | | | | | | | | | | | | | | | | | |
| Expenses before waiver and payments by affiliates | | 0.63 | % | | 0.60 | % | | | 0.59 | % | | | 0.58 | % | | 0.65 | % |
| Expenses net of waiver and payments by affiliates | | 0.61 | %b | | 0.59 | %b | | | 0.57 | %b | | | 0.58 | %b,c | | 0.65 | % |
| Net investment income | | 4.97 | % | | 4.80 | % | | | 3.89 | % | | | 3.85 | % | | 4.77 | % |
| |
| Supplemental data | | | | | | | | | | | | | | | | | |
| Net assets, end of year (000’s) | $ | 1,108,692 | | $ | 1,405,281 | | $ | 2,019,477 | | $ | 2,374,914 | | $ | 739,974 | |
| Portfolio turnover rate | | 34.10 | % | | 46.72 | % | | 83.93 | % | | 42.72 | % | | 80.88 | % |
aThe amount shown for a share outstanding throughout the period may not correlate with the Statement of Operations for the period due to the timing of sales and
repurchases of the Fund’s shares in relation to income earned and/or fluctuating fair value of the investments of the Fund.
bBenefit of expense reduction rounds to less than 0.01%.
cBenefit of waiver and payments by affiliates rounds to less than 0.01%.
44 Annual Report | The accompanying notes are an integral part of these financial statements.
franklintempleton.com
FRANKLIN INVESTORS SECURITIES TRUST
| | | | | |
| Statement of Investments, October 31, 2016 | | | | | |
| Franklin Floating Rate Daily Access Fund | | | | | |
| | Country | | Shares | | Value |
| |
| Common Stocks (Cost $13,170,468) 0.0%† | | | | | |
| Coal & Consumable Fuels 0.0%† | | | | | |
| a,b Warrior Met Coal LLC, A. | United States | | 6,893 | $ | 1,550,925 |
| |
| |
| | | | Principal | | |
| | | | Amount* | | |
| |
| Corporate Bonds (Cost $532,432) 0.0%† | | | | | |
| Aerospace & Defense 0.0%† | | | | | |
| c,d Erickson Air-Crane Inc., Purchase Price Notes, 6.00%, 11/02/20. | United States | $ | 532,431 | | 55,695 |
| e,f Senior Floating Rate Interests 85.9% | | | | | |
| Aerospace & Defense 1.7% | | | | | |
| Delos Finance S.A.R.L. (ILFC), Loans, 3.588%, 3/06/21. | United States | | 23,200,000 | | 23,391,400 |
| Doncasters U.S. Finance LLC, | | | | | |
| Second Lien Term Loan, 9.50%, 10/09/20 | United States | | 6,608,226 | | 6,244,773 |
| Term B Loans, 4.50%, 4/09/20 | United States | | 18,580,788 | | 18,470,474 |
| Leidos (Abacus Innovations Corp.), B Term Loan, 3.284%, 8/16/23 | United States | | 3,327,433 | | 3,357,590 |
| | | | | | 51,464,237 |
| Agricultural Products 0.1% | | | | | |
| Allflex Holdings III Inc., Second Lien Initial Term Loan, 8.00%, 7/19/21. | United States | | 2,287,774 | | 2,284,915 |
| Air Freight & Logistics 0.5% | | | | | |
| XPO Logistics Inc., Refinancing Term Loans, 4.25%, 10/30/21 | United States | | 15,014,771 | | 15,133,012 |
| Airlines 2.1% | | | | | |
| g Air Canada, Term Loan, 3.614%, 10/06/23 | Canada | | 17,986,185 | | 18,064,874 |
| American Airlines Inc., | | | | | |
| 2015 Term Loans, 3.25%, 6/27/20 | United States | | 4,285,738 | | 4,296,787 |
| Class B Term Loans, 3.50%, 4/28/23 | United States | | 14,768,712 | | 14,804,482 |
| Flying Fortress Inc. (ILFC), New Loan, 3.588%, 4/30/20 | United States | | 11,584,329 | | 11,680,259 |
| U.S. Airways Inc., Tranche B1 Term Loan, 3.50%, 5/23/19 | United States | | 14,489,807 | | 14,528,292 |
| | | | | | 63,374,694 |
| Aluminum 0.5% | | | | | |
| Novelis Inc., Initial Term Loan, 4.00% - 4.088%, 6/02/22. | Canada | | 15,168,825 | | 15,233,292 |
| Apparel Retail 1.7% | | | | | |
| g Ascena Retail Group Inc., Tranche B Term Loan, 5.25%, 8/21/22 | United States | | 45,831,722 | | 44,781,396 |
| The Men’s Wearhouse Inc., Tranche B Term Loan, 4.50%, 6/18/21 | United States | | 8,069,109 | | 7,974,903 |
| | | | | | 52,756,299 |
| Auto Parts & Equipment 1.7% | | | | | |
| FRAM Group Holdings Inc. (Autoparts Holdings), Term Loan, 7.00%, 7/29/17. | United States | | 15,736,445 | | 15,260,418 |
| TI Group Automotive Systems LLC, Initial U.S. Term Loan, 4.50%, 6/25/22 | United States | | 36,523,701 | | 36,645,142 |
| | | | | | 51,905,560 |
| Broadcasting 4.5% | | | | | |
| Cumulus Media Holdings Inc., Term Loans, 4.25%, 12/23/20 | United States | | 23,059,275 | | 16,026,196 |
| Gray Television Inc., Term Loan B, 3.938%, 6/13/21. | United States | | 26,898,307 | | 27,089,958 |
| Media General Inc., Term B Loan, 4.00%, 7/31/20 | United States | | 35,678,497 | | 35,732,657 |
| g Nexstar Broadcasting Group Inc., Term Loan B, 5.75%, 9/30/23 | United States | | 14,052,229 | | 14,125,005 |
| Radio One Inc., Term Loan B, 5.04%, 12/31/18 | United States | | 40,487,500 | | 40,588,719 |
| Sinclair Television Group Inc., Incremental Term Loan B-1, 3.50%, 7/31/21 | United States | | 2,958,312 | | 2,974,952 |
| | | | | | 136,537,487 |
franklintempleton.com
Annual Report
45
FRANKLIN INVESTORS SECURITIES TRUST
STATEMENT OF INVESTMENTS
| | | | | |
| Franklin Floating Rate Daily Access Fund (continued) | | | | | |
| | | | Principal | | |
| | Country | | Amount* | | Value |
| |
| e,f Senior Floating Rate Interests (continued) | | | | | |
| Cable & Satellite 2.9% | | | | | |
| Charter Communications Operating LLC (CCO Safari), Term A Loan, 2.54%, | | | | | |
| 5/18/21 | United States | $ | 29,221,330 | $ | 29,093,487 |
| CSC Holdings Inc. (Cablevision), 2016 Extended Term Loans, 3.876%, 10/11/24 . | United States | | 26,938,469 | | 27,067,558 |
| g UPC Financing Partnership, Facility AN, 4.08%, 8/31/24 | Netherlands | | 8,649,087 | | 8,704,225 |
| Virgin Media Bristol LLC, F Facility, 3.50%, 6/30/23 | United States | | 24,326,626 | | 24,445,729 |
| | | | | | 89,310,999 |
| Casinos & Gaming 2.2% | | | | | |
| Aristocrat Technologies Inc., Term B-1 Loans, 3.631%, 10/20/21 | United States | | 7,559,055 | | 7,603,465 |
| Boyd Gaming Corp., Term A Loan, 3.034%, 9/15/21 | United States | | 5,065,198 | | 5,042,506 |
| h Cannery Casino Resorts LLC, Second Lien Term Loan, PIK (all cash), 12.50% , | | | | | |
| 10/02/19 | United States | | 6,616,106 | | 6,654,698 |
| Jack Ohio Finance LLC, Funded Term B Loans, 6.25%, 6/20/19 | United States | | 39,485,200 | | 39,518,091 |
| Penn National Gaming Inc., Term A Facility Loans, 2.54%, 10/30/18 | United States | | 6,494,485 | | 6,482,307 |
| | | | | | 65,301,067 |
| Coal & Consumable Fuels 2.5% | | | | | |
| i Bowie Resource Holdings LLC, | | | | | |
| First Lien Initial Term Loan, 6.75%, 8/16/20 | United States | | 28,787,853 | | 23,893,918 |
| Second Lien Initial Term Loan, 11.75%, 2/16/21. | United States | | 4,464,778 | | 3,683,442 |
| Foresight Energy LLC, Term Loans, 6.50%, 8/23/20. | United States | | 39,247,004 | | 37,284,654 |
| Peabody Energy Corp., Commitment (DIP Facility), 10.00%, 4/18/17 | United States | | 4,436,015 | | 4,637,485 |
| Westmoreland Coal Co., Term Loan, 7.50%, 12/16/20 | United States | | 7,980,370 | | 6,404,247 |
| | | | | | 75,903,746 |
| Commodity Chemicals 2.0% | | | | | |
| Cyanco Intermediate Corp., Initial Term Loan, 5.50%, 5/01/20 | United States | | 58,961,412 | | 59,108,815 |
| Communications Equipment 1.3% | | | | | |
| Ciena Corp., | | | | | |
| 2016 Term Loans, 4.25%, 4/25/21 | United States | | 6,565,231 | | 6,598,057 |
| Term Loan, 3.75%, 7/15/19 | United States | | 13,626,427 | | 13,694,559 |
| g CommScope Inc., Tranche 5 Term Loan, 5.00%, 12/29/22 | United States | | 19,363,995 | | 19,493,252 |
| | | | | | 39,785,868 |
| Construction & Engineering 0.1% | | | | | |
| Ventia Pty. Ltd., Refinancing Term B Loans, 5.00%, 5/21/22 | Australia | | 3,862,974 | | 3,906,433 |
| Data Processing & Outsourced Services 2.0% | | | | | |
| g Global Payments Inc., Delayed Draw Term Loan (A-2), 4.75%, 10/31/21 | United States | | 29,647,089 | | 29,606,176 |
| MoneyGram International Inc., Term Loan, 4.25%, 3/27/20 | United States | | 30,991,566 | | 30,255,516 |
| | | | | | 59,861,692 |
| Diversified Chemicals 3.9% | | | | | |
| The Chemours Co. LLC, Tranche B Term Loan, 3.75%, 5/12/22 | United States | | 62,632,794 | | 62,012,782 |
| Ineos U.S. Finance LLC, 2018 Dollar Term Loans, 3.75%, 5/04/18 | United States | | 24,164,535 | | 24,234,395 |
| i OCI Beaumont LLC, Term B-3 Loan, 7.75%, 8/20/19 | United States | | 31,032,685 | | 30,528,404 |
| | | | | | 116,775,581 |
| Diversified Metals & Mining 1.6% | | | | | |
| FMG America Finance Inc. (Fortescue Metals Group), Loans, 3.75%, 6/30/19 | Australia | | 49,640,303 | | 49,663,585 |
| Diversified Real Estate Activities 0.1% | | | | | |
| g Realogy Group LLC, Term Loan A, 2.526%, 10/23/20 | United States | | 4,044,625 | | 4,047,052 |
46 Annual Report
franklintempleton.com
FRANKLIN INVESTORS SECURITIES TRUST
STATEMENT OF INVESTMENTS
| | | | | |
| Franklin Floating Rate Daily Access Fund (continued) | | | | | |
| | | | Principal | | |
| | Country | | Amount* | | Value |
| |
| e,f Senior Floating Rate Interests (continued) | | | | | |
| Electric Utilities 2.6% | | | | | |
| Alinta Energy Finance Pty. Ltd., | | | | | |
| Delayed Draw Term Commitments, 6.375%, 8/13/18 | Australia | $ | 4,723,809 | $ | 4,735,619 |
| Term B Loans, 6.375%, 8/13/19 | Australia | | 71,105,627 | | 71,283,391 |
| EFS Cogen Holdings I LLC (Linden), Term B Advance, 5.25%, 6/28/23 | United States | | 3,231,473 | | 3,267,827 |
| | | | | | 79,286,837 |
| Electronic Equipment & Instruments 0.0%† | | | | | |
| Zebra Technologies Corp., Refinancing Term Loan, 4.089%, 10/27/21 | United States | | 568,101 | | 574,729 |
| Forest Products 2.9% | | | | | |
| Appvion Inc., Term Loan, 6.25%, 6/28/19 | United States | | 19,632,956 | | 18,945,803 |
| Caraustar Industries Inc., | | | | | |
| Term Loan B, 8.00%, 5/01/19. | United States | | 30,815,550 | | 31,154,521 |
| Term Loan C, 8.00%, 5/01/19 | United States | | 36,992,922 | | 37,399,844 |
| | | | | | 87,500,168 |
| General Merchandise Stores 0.4% | | | | | |
| Dollar Tree Inc., | | | | | |
| Term A-1 Loans, 2.25%, 7/06/20 | United States | | 10,482,777 | | 10,466,319 |
| Term B-3 Loans, 3.00%, 7/06/22 | United States | | 2,392,014 | | 2,418,924 |
| | | | | | 12,885,243 |
| Health Care Distributors 0.5% | | | | | |
| Team Health Inc., New Tranche B Term Loan, 3.838%, 11/23/22 | United States | | 14,987,047 | | 15,068,921 |
| Health Care Equipment 1.3% | | | | | |
| Carestream Health Inc., | | | | | |
| Second Lien Loan, 9.50%, 12/07/19 | United States | | 16,900,077 | | 15,041,068 |
| Term Loan, 5.00%, 6/07/19 | United States | | 6,704,803 | | 6,251,028 |
| Mallinckrodt International Finance SA, Initial Term B Loan, 3.338%, 3/19/21. | Luxembourg | | 17,602,019 | | 17,596,528 |
| | | | | | 38,888,624 |
| Health Care Facilities 3.0% | | | | | |
| Amsurg Corp., Initial Term Loan, 3.50%, 7/16/21 | United States | | 28,969,347 | | 29,010,078 |
| Community Health Systems Inc., 2018 Term F Loans, 4.083%, 12/31/18 | United States | | 64,540,508 | | 63,238,145 |
| | | | | | 92,248,223 |
| Health Care Services 0.2% | | | | | |
| DaVita Healthcare Partners Inc., Tranche A Term Loan, 2.284%, 6/24/19 | United States | | 7,343,750 | | 7,355,684 |
| Household Products 0.3% | | | | | |
| Spectrum Brands Inc., | | | | | |
| Initial Term Loans, 3.50% - 5.25%, 6/23/22 | United States | | 8,363,331 | | 8,422,402 |
| g Term Loans, 5.00%, 6/23/22 | United States | | 711,861 | | 719,572 |
| | | | | | 9,141,974 |
| Independent Power Producers & Energy Traders 3.9% | | | | | |
| Calpine Construction Finance Co. LP, Term B-1 Loan, 3.09%, 5/03/20 | United States | | 29,692,983 | | 29,572,370 |
| i Calpine Corp., | | | | | |
| Term Loan (B5), 3.59%, 5/27/22. | United States | | 19,412,307 | | 19,480,561 |
| Term Loan (B6), 4.00%, 1/15/23. | United States | | 8,932,500 | | 8,990,561 |
| NRG Energy Inc., Term Loans, 3.50%, 6/30/23 | United States | | 59,458,523 | | 59,651,763 |
| | | | | | 117,695,255 |
franklintempleton.com
Annual Report
47
FRANKLIN INVESTORS SECURITIES TRUST
STATEMENT OF INVESTMENTS
| | | | | |
| Franklin Floating Rate Daily Access Fund (continued) | | | | | |
| | | | Principal | | |
| | Country | | Amount* | | Value |
| |
| e,f Senior Floating Rate Interests (continued) | | | | | |
| Industrial Machinery 4.1% | | | | | |
| Alfred Fueling Systems Inc. (Wayne Fueling), | | | | | |
| First Lien Initial Term Loan, 4.50%, 6/18/21 | United States | $ | 14,810,671 | $ | 14,829,184 |
| Second Lien Initial Term Loan, 8.50%, 6/20/22. | United States | | 23,842,353 | | 24,021,171 |
| g Harsco Corp., Initial Term Loan, 7.50%, 11/01/23 | United States | | 3,196,453 | | 3,236,408 |
| Navistar Inc., Tranche B Term Loans, 6.50%, 8/07/20 | United States | | 47,730,838 | | 48,088,820 |
| Onsite Rental Group Operations Pty. Ltd., Term B Loan, 5.50%, 7/30/21 | Australia | | 40,866,351 | | 32,897,412 |
| | | | | | 123,072,995 |
| Integrated Telecommunication Services 1.0% | | | | | |
| Global Tel*Link Corp., | | | | | |
| g Second Lien Term Loan, 9.00%, 11/20/20 | United States | | 3,209,595 | | 3,099,265 |
| Term Loan, 5.00%, 5/23/20 | United States | | 7,453,634 | | 7,262,635 |
| Intelsat Jackson Holdings SA, Tranche B-2 Term Loan, 3.75%, 6/30/19 | Luxembourg | | 3,467,350 | | 3,322,155 |
| Zayo Group LLC, 2021 Term Loans, 3.75%, 5/06/21 | United States | | 15,074,368 | | 15,074,368 |
| | | | | | 28,758,423 |
| Internet Software & Services 1.4% | | | | | |
| BMC Software Finance Inc., Initial U.S. Term Loans, 5.00%, 9/10/20 | United States | | 35,874,942 | | 35,452,657 |
| g Rackspace Hosting Inc., Term B Loan, 6.50%, 11/03/23. | United States | | 5,327,421 | | 5,365,001 |
| | | | | | 40,817,658 |
| IT Consulting & Other Services 0.9% | | | | | |
| Sungard Availability Services Capital Inc., Tranche B Term Loan, 6.00%, 3/29/19 . | United States | | 30,116,931 | | 28,661,289 |
| Leisure Facilities 2.4% | | | | | |
| 24 Hour Fitness Worldwide Inc., Term Loan, 4.75%, 5/28/21. | United States | | 28,234,148 | | 27,740,050 |
| Fitness International LLC, Term B Loan, 6.00%, 7/01/20 | United States | | 45,745,851 | | 45,831,625 |
| | | | | | 73,571,675 |
| Leisure Products 0.8% | | | | | |
| Scientific Games International Inc., Term B-1 Loan, 6.00%, 10/18/20. | United States | | 24,827,455 | | 24,991,490 |
| Marine 1.3% | | | | | |
| Navios Maritime Partners LP, Initial Term Loan, 5.25%, 6/27/18. | Marshall Islands | | 41,154,391 | | 37,784,875 |
| Metal & Glass Containers 0.7% | | | | | |
| CD&R Millennium U.S. Acquico LLC, Second Lien Initial Term Loan, 8.75%, | | | | | |
| 7/31/22 | United States | | 22,149,800 | | 21,872,928 |
| Movies & Entertainment 1.1% | | | | | |
| g AMC Entertainment Holdings Inc., 2016 Incremental Term Loan, 5.25%, | | | | | |
| 12/15/23 | United States | | 1,066,907 | | 1,063,525 |
| g Lions Gate Entertainment Corp., Term Loan A, 5.00%, 10/12/21 | United States | | 15,000,000 | | 14,850,000 |
| g Live Nation Entertainment Inc., Term B-2 Loans, 5.00%, 10/31/23 | United States | | 6,854,958 | | 6,872,095 |
| Regal Cinemas Corp., Term Loan, 3.50%, 4/01/22. | United States | | 11,500,111 | | 11,576,783 |
| | | | | | 34,362,403 |
| Oil & Gas Equipment & Services 0.4% | | | | | |
| g McDermott Finance LLC, Term Loan, 8.25% - 8.484%, 4/16/19 | United States | | 10,472,292 | | 10,577,015 |
| Oil & Gas Exploration & Production 3.2% | | | | | |
| Fieldwood Energy LLC, Loans, 3.875%, 10/01/18 | United States | | 59,783,683 | | 55,150,447 |
| d,i Samson Investment Co., Second Lien Tranche I Term Loan, 5.00%, 9/25/18 | United States | | 27,720,000 | | 6,722,100 |
| UTEX Industries Inc., First Lien Initial Term Loan, 5.00%, 5/21/21 | United States | | 42,452,829 | | 36,297,169 |
| | | | | | 98,169,716 |
48 Annual Report
franklintempleton.com
FRANKLIN INVESTORS SECURITIES TRUST
STATEMENT OF INVESTMENTS
| | | | | |
| Franklin Floating Rate Daily Access Fund (continued) | | | | | |
| | | | Principal | | |
| | Country | | Amount* | | Value |
| |
| e,f Senior Floating Rate Interests (continued) | | | | | |
| Oil & Gas Storage & Transportation 1.2% | | | | | |
| OSG Bulk Ships Inc., Initial Term Loan, 5.25%, 8/05/19 | United States | $ | 22,164,896 | $ | 21,998,659 |
| OSG International Inc., Initial Term Loan, 5.75%, 8/05/19 | United States | | 13,358,947 | | 13,350,598 |
| | | | | | 35,349,257 |
| Packaged Foods & Meats 1.0% | | | | | |
| CSM Bakery Supplies LLC, | | | | | |
| Second Lien Term Loan, 8.75%, 7/03/21 | United States | | 11,591,497 | | 10,475,815 |
| g Term Loans, 5.00%, 7/03/20 | United States | | 5,663,804 | | 5,523,982 |
| JBS USA LLC, | | | | | |
| Incremental Term Loan, 3.75%, 9/18/20 | United States | | 7,120,900 | | 7,120,900 |
| Initial Term Loan, 3.75%, 5/25/18 | United States | | 7,654,383 | | 7,663,951 |
| | | | | | 30,784,648 |
| Personal Products 1.4% | | | | | |
| FGI Operating Co. LLC (Freedom Group), Term B Loans, 5.50%, 4/19/19 | United States | | 46,282,918 | | 43,621,650 |
| Pharmaceuticals 5.9% | | | | | |
| Endo Luxembourg Finance Co. I S.A.R.L. and Endo, 2014 Term A Loans, | | | | | |
| 3.063%, 2/28/19 | United States | | 12,139,860 | | 12,200,559 |
| Endo Luxembourg Finance Co. I S.A.R.L. and Endo LLC, 2015 Incremental Term | | | | | |
| B Loans, 3.75%, 9/25/22. | United States | | 37,529,574 | | 37,523,719 |
| Grifols Worldwide Operations USA Inc., U.S. Tranche B Term Loan, 3.46%, | | | | | |
| 2/27/21 | United States | | 33,346,085 | | 33,679,546 |
| g Horizon Pharma Inc., Incremental Term B-1 Loan, 7.00%, 5/07/21 | United States | | 1,065,484 | | 1,071,478 |
| g RPI Finance Trust, Term A-2 Term Loan A, 4.75%, 10/14/20. | United States | | 9,411,460 | | 9,362,803 |
| Valeant Pharmaceuticals International Inc., | | | | | |
| g Series A-3 Tranche A Term Loan, 4.29%, 10/20/18. | United States | | 21,300,633 | | 21,269,576 |
| Series C-2 Tranche B Term Loan, 5.25%, 12/11/19 | United States | | 39,421,014 | | 39,450,580 |
| g Series D-2 Tranche B Term Loan, 5.00%, 2/13/19 | United States | | 19,126,268 | | 19,124,566 |
| Series F-1 Tranche B Term Loan, 5.50%, 4/01/22. | United States | | 3,724,808 | | 3,731,095 |
| | | | | | 177,413,922 |
| Restaurants 0.3% | | | | | |
| KFC Holding Co./Pizza Hut Holdings LLC/Taco Bell of America LLC (Yum | | | | | |
| Brands), Term B Loans, 3.286%, 6/16/23 | United States | | 9,134,640 | | 9,237,404 |
| Semiconductor Equipment 0.1% | | | | | |
| MKS Instruments Inc., Tranche B-1 Term Loans, 4.25%, 5/01/23. | United States | | 3,544,489 | | 3,582,887 |
| Semiconductors 3.0% | | | | | |
| Avago Technologies Cayman Finance Ltd., Term B-3 Loans, 3.535%, 2/01/23 | Singapore | | 26,235,875 | | 26,539,241 |
| MACOM Technology Solutions Holdings Inc., Initial Term Loan, 4.628%, 5/07/21 . | United States | | 20,222,645 | | 20,450,150 |
| NXP BV/NXP Funding LLC, Tranche F Loan, 3.405%, 12/07/20 | United States | | 18,570,157 | | 18,655,746 |
| g ON Semiconductor Corp., 2016 Replacement Term Loans, 3.777%, 3/31/23 | United States | | 25,591,427 | | 25,769,645 |
| | | | | | 91,414,782 |
| Specialized Consumer Services 1.1% | | | | | |
| Avis Budget Car Rental LLC, Extended Tranche B Term Loan, 3.34%, 3/15/22 | United States | | 7,020,237 | | 7,082,542 |
| Sabre GLBL Inc., Incremental Term A Loan, 3.338%, 7/18/21 | United States | | 27,606,250 | | 27,545,240 |
| | | | | | 34,627,782 |
franklintempleton.com
Annual Report
49
FRANKLIN INVESTORS SECURITIES TRUST
STATEMENT OF INVESTMENTS
| | | | | |
| Franklin Floating Rate Daily Access Fund (continued) | | | | | |
| | | | Principal | | |
| | Country | | Amount* | | Value |
| |
| e,f Senior Floating Rate Interests (continued) | | | | | |
| Specialty Chemicals 1.3% | | | | | |
| Axalta Coating Systems U.S. Holdings Inc., 2014 Specified Refinancing Term, | | | | | |
| 3.75%, 2/01/20 | United States | $ | 12,704,080 | $ | 12,812,599 |
| Oxbow Carbon LLC, | | | | | |
| Second Lien Initial Term Loan, 8.00%, 1/17/20. | United States | | 16,364,314 | | 16,037,027 |
| Tranche B Term Loan, 4.25%, 7/19/19 | United States | | 3,949,562 | | 3,966,841 |
| Solenis International LP and Solenis Holdings 3 LLC, Second Lien Term Loan, | | | | | |
| 7.75%, 7/31/22 | United States | | 7,800,000 | | 7,658,625 |
| | | | | | 40,475,092 |
| Specialty Stores 4.1% | | | | | |
| 99 Cents Only Stores, Tranche B-2 Loan, 4.50%, 1/11/19. | United States | | 26,618,117 | | 20,861,950 |
| BJ’s Wholesale Club Inc., Second Lien 2013 (Nov) Replacement Loans, 8.50%, | | | | | |
| 3/26/20 | United States | | 26,670,289 | | 26,830,311 |
| Evergreen AcqCo. 1 LP (Savers), Term Loan, 5.00%, 7/09/19. | United States | | 46,062,867 | | 42,723,309 |
| PetSmart Inc., Tranche B-2 Loans, 4.00%, 3/11/22 | United States | | 32,218,078 | | 32,318,760 |
| | | | | | 122,734,330 |
| Technology Distributors 1.3% | | | | | |
| Dell International LLC, Term A-3 Loan, 2.54%, 12/31/18. | United States | | 37,924,006 | | 37,941,792 |
| Technology Hardware, Storage & Peripherals 0.3% | | | | | |
| Western Digital Corp., Term Loan B-1, 4.50%, 4/29/23 | United States | | 8,273,374 | | 8,379,380 |
| Tires & Rubber 0.3% | | | | | |
| The Goodyear Tire & Rubber Co., Second Lien Loans, 3.86%, 4/30/19 | United States | | 9,160,418 | | 9,230,761 |
| Trucking 0.8% | | | | | |
| The Hertz Corp., Tranche B-1 Term Loan, 3.50%, 6/30/23 | United States | | 23,304,567 | | 23,481,426 |
| Total Senior Floating Rate Interests | | | | | |
| (Cost $2,648,826,612) | | | | | 2,603,915,572 |
| |
| Asset-Backed Securities 4.8% | | | | | |
| Other Diversified Financial Services 4.8% | | | | | |
| j Apidos CDO, 2013-14A, C2, 144A, 4.85%, 4/15/25 | United States | | 3,540,000 | | 3,568,001 |
| e,j Atrium IX, 9A, C, 144A, FRN, 4.079%, 2/28/24 | United States | | 2,500,000 | | 2,503,575 |
| e,j Ballyrock CLO LLC, 2014-1A, B, 144A, FRN, 4.081%, 10/20/26 | United States | | 5,200,000 | | 5,228,184 |
| e,j Carlyle Global Market Strategies CLO Ltd., | | | | | |
| 2014-2A, A, 144A, FRN, 2.287%,5/15/25 | United States | | 5,000,000 | | 5,018,500 |
| 2014-4A, C, 144A, FRN, 4.03%,10/15/26 | United States | | 6,500,000 | | 6,519,435 |
| e,j Catamaran CLO Ltd., | | | | | |
| 2013-1A, C, 144A, FRN, 3.486%,1/27/25 | United States | | 3,500,000 | | 3,457,895 |
| 2014-2A, B, 144A, FRN, 3.882%,10/18/26. | United States | | 13,240,000 | | 13,248,209 |
| e,j Cent CLO LP, | | | | | |
| 2013-17A, B, 144A, FRN, 3.887%,1/30/25. | United States | | 3,850,000 | | 3,887,153 |
| 2014-22A, B, 144A, FRN, 3.988%,11/07/26 | United States | | 7,400,000 | | 7,470,522 |
| e,j Cumberland Park CLO Ltd., 2015-2A, C, 144A, FRN, 3.731%, 7/20/26 | United States | | 3,850,000 | | 3,842,300 |
| e,j Eaton Vance CDO Ltd., | | | | | |
| 2014-1A, A, 144A, FRN, 2.33%,7/15/26 | United States | | 6,510,000 | | 6,510,391 |
| 2014-1A, B, 144A, FRN, 2.93%,7/15/26 | United States | | 6,510,000 | | 6,518,007 |
| 2014-1A, C, 144A, FRN, 3.88%,7/15/26 | United States | | 5,630,000 | | 5,626,903 |
| j Emerson Park CLO Ltd., 2013-1A, C2, 144A, 5.64%, 7/15/25 | United States | | 3,600,000 | | 3,639,816 |
| j Flatiron CLO Ltd., 2014-1A, A1, 144A, 2.26%, 7/17/26 | United States | | 16,400,000 | | 16,401,312 |
| j Highbridge Loan Management Ltd., 2013-2A, B2, 144A, 5.80%, 10/20/24 | United States | | 3,500,000 | | 3,559,045 |
| e,j Limerock CLO III LLC, 2014-3A, B, 144A, FRN, 4.081%, 10/20/26 | United States | | 6,700,000 | | 6,703,953 |
| e,j Madison Park Funding Ltd., 2016-21A, A1, 144A, FRN, 2.21%, 7/25/29 | United States | | 17,200,000 | | 17,193,636 |
50 Annual Report
franklintempleton.com
FRANKLIN INVESTORS SECURITIES TRUST
STATEMENT OF INVESTMENTS
| | | | | | |
| Franklin Floating Rate Daily Access Fund (continued) | | | | | | |
| | | | Principal | | | |
| | Country | | Amount* | | Value | |
| |
| Asset-Backed Securities (continued) | | | | | | |
| Other Diversified Financial Services (continued) | | | | | | |
| e,j Magnetite XIV Ltd., 2015-14A, A, 144A, FRN, 2.272%, 7/18/28. | United States | $ | 3,140,000 | $ | 3,143,203 | |
| e,j Octagon Investment Partners 24 Ltd., 2015-1A, A1, 144A, FRN, 2.261%, 5/21/27 . | United States | | 3,300,000 | | 3,297,525 | |
| e,j Octagon Investment Partners XVII Ltd., 2013-1A, A1, 144A, FRN, 2.212%, | | | | | | |
| 10/25/25 | United States | | 2,820,000 | | 2,819,295 | |
| e,j Voya CLO Ltd., | | | | | | |
| 2013-1A, B, 144A, FRN, 3.78%,4/15/24 | United States | | 3,850,000 | | 3,842,377 | |
| 2013-2A, B, 144A, FRN, 3.562%,4/25/25 | United States | | 3,850,000 | | 3,791,480 | |
| 2015-1A, A1, 144A, FRN, 2.362%,4/18/27 | United States | | 6,900,000 | | 6,899,724 | |
| e,j Ziggurat CLO I Ltd., 2014-1A, C, 144A, FRN, 3.98%, 10/17/26 | United States | | 1,340,000 | | 1,341,246 | |
| Total Asset-Backed Securities (Cost $145,308,501) | | | | | 146,031,687 | |
| Total Investments before Short Term Investments | | | | | | |
| (Cost $2,807,838,013) | | | | | 2,751,553,879 | |
| | | | Shares | | | |
| |
| Short Term Investments (Cost $301,294,963) 10.0% | | | | | | |
| Money Market Funds 10.0% | | | | | | |
| a,k Institutional Fiduciary Trust Money Market Portfolio | United States | | 301,294,963 | | 301,294,963 | |
| Total Investments (Cost $3,109,132,976) 100.7% | | | | | 3,052,848,842 | |
| Other Assets, less Liabilities (0.7)% | | | | | (20,235,019 | ) |
| Net Assets 100.0% | | | | $ | 3,032,613,823 | |
See Abbreviations on page 140.
†Rounds to less than 0.1% of net assets.
*The principal amount is stated in U.S. dollars unless otherwise indicated.
aNon-income producing.
bSee Note 8 regarding restricted securities.
cSecurity has been deemed illiquid because it may not be able to be sold within seven days.
dSee Note 7 regarding defaulted securities.
eThe coupon rate shown represents the rate at period end.
fSee Note 1(i) regarding senior floating rate interests.
gA portion or all of the security purchased on a delayed delivery basis. See Note 1(c).
hIncome may be received in additional securities and/or cash.
iAt October 31, 2016, pursuant to the Fund’s policies and the requirements of applicable securities law, the Fund is restricted from trading these securities at year end.
jSecurity was purchased pursuant to Rule 144A under the Securities Act of 1933 and may be sold in transactions exempt from registration only to qualified institutional buyers
or in a public offering registered under the Securities Act of 1933. These securities have been deemed liquid under guidelines approved by the Trust’s Board of Trustees. At
October 31, 2016, the aggregate value of these securities was $146,031,687 representing 4.8% of net assets.
kSee Note 3(f) regarding investments in affiliated management investment companies.
franklintempleton.com
The accompanying notes are an integral part of these financial statements. | Annual Report 51
| | | | | | | | | | | | | | | |
| FRANKLIN INVESTORS SECURITIES TRUST | | | | | | | | | | | | | | | |
| |
| |
| |
| Financial Highlights | | | | | | | | | | | | | | | |
| Franklin Low Duration Total Return Fund | | | | | | | | | | | | | | | |
| | | | | | Year Ended October 31, | | | | |
| | | 2016 | | | 2015 | | | 2014 | | | 2013 | | | 2012 | |
| Class A | | | | | | | | | | | | | | | |
| Per share operating performance | | | | | | | | | | | | | | | |
| (for a share outstanding throughout the year) | | | | | | | | | | | | | | | |
| Net asset value, beginning of year | $ | 9.91 | | $ | 10.11 | | $ | 10.16 | | $ | 10.29 | | $ | 10.27 | |
| Income from investment operationsa: | | | | | | | | | | | | | | | |
| Net investment income | | 0.151 | | | 0.134 | | | 0.144 | | | 0.166 | | | 0.169 | |
| Net realized and unrealized gains (losses) | | 0.031 | | | (0.135 | ) | | (0.011 | ) | | (0.032 | ) | | 0.158 | |
| Total from investment operations | | 0.182 | | | (0.001 | ) | | 0.133 | | | 0.134 | | | 0.327 | |
| Less distributions from net investment income and net foreign | | | | | | | | | | | | | | | |
| currency gains | | (0.202 | ) | | (0.199 | ) | | (0.183 | ) | | (0.264 | ) | | (0.307 | ) |
| Net asset value, end of year. | $ | 9.89 | | $ | 9.91 | | $ | 10.11 | | $ | 10.16 | | $ | 10.29 | |
| |
| Total returnb | | 1.88 | % | | (0.02 | )% | | 1.32 | % | | 1.32 | % | | 3.26 | % |
| |
| Ratios to average net assets | | | | | | | | | | | | | | | |
| Expenses before waiver and payments by affiliates | | 0.95 | % | | 0.96 | % | | 0.93 | % | | 0.98 | % | | 1.01 | % |
| Expenses net of waiver and payments by affiliates | | 0.80 | %c | | 0.80 | %c | | 0.80 | %c | | 0.80 | %c | | 0.89 | % |
| Net investment income | | 1.57 | % | | 1.27 | % | | 1.24 | % | | 1.25 | % | | 1.47 | % |
| |
| Supplemental data | | | | | | | | | | | | | | | |
| Net assets, end of year (000’s) | $ | 1,524,437 | | $ | 1,656,001 | | $ | 1,589,854 | | $ | 1,296,612 | | $ | 904,878 | |
| Portfolio turnover rate | | 44.76 | % | | 41.28 | % | | 78.63 | % | | 64.86 | % | | 51.42 | % |
aThe amount shown for a share outstanding throughout the period may not correlate with the Statement of Operations for the period due to the timing of sales and
repurchases of the Fund’s shares in relation to income earned and/or fluctuating fair value of the investments of the Fund.
bTotal return does not reflect sales commissions or contingent deferred sales charges, if applicable.
cBenefit of expense reduction rounds to less than 0.01%.
52 Annual Report | The accompanying notes are an integral part of these financial statements.
franklintempleton.com
| | | | | | | | | | | | | | | |
| | | | | | FRANKLIN INVESTORS SECURITIES TRUST | |
| | | | | | | | | FINANCIAL HIGHLIGHTS | |
| |
| |
| Franklin Low Duration Total Return Fund (continued) | | | | | | | | | | | | | | | |
| | | | | | Year Ended October 31, | | | | |
| | | 2016 | | | 2015 | | | 2014 | | | 2013 | | | 2012 | a |
| Class C | | | | | | | | | | | | | | | |
| Per share operating performance | | | | | | | | | | | | | | | |
| (for a share outstanding throughout the year) | | | | | | | | | | | | | | | |
| Net asset value, beginning of year | $ | 9.90 | | $ | 10.11 | | $ | 10.16 | | $ | 10.29 | | $ | 10.29 | |
| Income from investment operationsb: | | | | | | | | | | | | | | | |
| Net investment income | | 0.113 | | | 0.104 | | | 0.098 | | | 0.189 | | | 0.013 | |
| Net realized and unrealized gains (losses) | | 0.024 | | | (0.145 | ) | | (0.001 | ) | | (0.090 | ) | | 0.005 | |
| Total from investment operations | | 0.137 | | | (0.041 | ) | | 0.097 | | | 0.099 | | | 0.018 | |
| Less distributions from net investment income and net foreign | | | | | | | | | | | | | | | |
| currency gains | | (0.177 | ) | | (0.169 | ) | | (0.147 | ) | | (0.229 | ) | | (0.018 | ) |
| Net asset value, end of year. | $ | 9.86 | | $ | 9.90 | | $ | 10.11 | | $ | 10.16 | | $ | 10.29 | |
| |
| Total returnc | | 1.41 | % | | (0.41 | )% | | 0.96 | % | | 0.97 | % | | 0.17 | % |
| |
| Ratios to average net assetsd | | | | | | | | | | | | | | | |
| Expenses before waiver and payments by affiliates | | 1.35 | % | | 1.36 | % | | 1.33 | % | | 1.38 | % | | 1.41 | % |
| Expenses net of waiver and payments by affiliates | | 1.20 | %e | | 1.20 | %e | | 1.20 | %e | | 1.20 | %e | | 1.29 | % |
| Net investment income | | 1.17 | % | | 0.87 | % | | 0.84 | % | | 0.84 | % | | 1.07 | % |
| |
| Supplemental data | | | | | | | | | | | | | | | |
| Net assets, end of year (000’s) | $ | 218,066 | | $ | 211,354 | | $ | 165,952 | | $ | 114,200 | | $ | 1,034 | |
| Portfolio turnover rate | | 44.76 | % | | 41.28 | % | | 78.63 | % | | 64.86 | % | | 51.42 | % |
aFor the period October 1, 2012 (effective date) to October 31, 2012.
bThe amount shown for a share outstanding throughout the period may not correlate with the Statement of Operations for the period due to the timing of sales and
repurchases of the Fund’s shares in relation to income earned and/or fluctuating fair value of the investments of the Fund.
cTotal return does not reflect sales commissions or contingent deferred sales charges, if applicable, and is not annualized for periods less than one year.
dRatios are annualized for periods less than one year.
eBenefit of expense reduction rounds to less than 0.01%.
franklintempleton.com
The accompanying notes are an integral part of these financial statements. | Annual Report 53
| | | | | | | | | | | | |
| FRANKLIN INVESTORS SECURITIES TRUST | | | | | | | | | | | | |
| FINANCIAL HIGHLIGHTS | | | | | | | | | | | | |
| |
| |
| Franklin Low Duration Total Return Fund (continued) | | | | | | | | | | | | |
| | | | | | Year Ended October 31, | | | | |
| | | 2016 | | | 2015 | | | 2014 | | | 2013 | a |
| Class R6 | | | | | | | | | | | | |
| Per share operating performance | | | | | | | | | | | | |
| (for a share outstanding throughout the year) | | | | | | | | | | | | |
| Net asset value, beginning of year | $ | 9.95 | | $ | 10.14 | | $ | 10.19 | | $ | 10.27 | |
| Income from investment operationsb: | | | | | | | | | | | | |
| Net investment income. | | 0.195 | | | 0.165 | | | 0.164 | c | | 0.089 | |
| Net realized and unrealized gains (losses) | | 0.021 | | | (0.130 | ) | | 0.003 | | | (0.046 | ) |
| Total from investment operations | | 0.216 | | | 0.035 | | | 0.167 | | | 0.043 | |
| Less distributions from net investment income and net foreign currency gains | | (0.226 | ) | | (0.228 | ) | | (0.217 | ) | | (0.123 | ) |
| Net asset value, end of year | $ | 9.94 | | $ | 9.95 | | $ | 10.14 | | $ | 10.19 | |
| |
| Total returnd | | 2.22 | % | | 0.37 | % | | 1.66 | % | | 0.43 | % |
| |
| Ratios to average net assetse | | | | | | | | | | | | |
| Expenses before waiver and payments by affiliates | | 0.53 | % | | 0.54 | % | | 0.55 | % | | 0.62 | % |
| Expenses net of waiver and payments by affiliatesf | | 0.42 | % | | 0.42 | % | | 0.42 | % | | 0.43 | % |
| Net investment income | | 1.95 | % | | 1.65 | % | | 1.62 | % | | 1.61 | % |
| |
| Supplemental data | | | | | | | | | | | | |
| Net assets, end of year (000’s) | $ | 553,233 | | $ | 508,675 | | $ | 418,539 | | $ | 943 | |
| Portfolio turnover rate | | 44.76 | % | | 41.28 | % | | 78.63 | % | | 64.86 | % |
aFor the period May 1, 2013 (effective date) to October 31, 2013.
bThe amount shown for a share outstanding throughout the period may not correlate with the Statement of Operations for the period due to the timing of sales and
repurchases of the Fund’s shares in relation to income earned and/or fluctuating fair value of the investments of the Fund.
cBased on average daily shares outstanding.
dTotal return is not annualized for periods less than one year.
eRatios are annualized for periods less than one year.
fBenefit of expense reduction rounds to less than 0.01%.
54 Annual Report | The accompanying notes are an integral part of these financial statements.
franklintempleton.com
| | | | | | | | | | | | | | | |
| | | | | | FRANKLIN INVESTORS SECURITIES TRUST | |
| | | | | | | | | FINANCIAL HIGHLIGHTS | |
| |
| |
| Franklin Low Duration Total Return Fund (continued) | | | | | | | | | | | | | | | |
| | | | | | Year Ended October 31, | | | | |
| | | 2016 | | | 2015 | | | 2014 | | | 2013 | | | 2012 | |
| Advisor Class | | | | | | | | | | | | | | | |
| Per share operating performance | | | | | | | | | | | | | | | |
| (for a share outstanding throughout the year) | | | | | | | | | | | | | | | |
| Net asset value, beginning of year | $ | 9.95 | | $ | 10.14 | | $ | 10.19 | | $ | 10.31 | | $ | 10.29 | |
| Income from investment operationsa: | | | | | | | | | | | | | | | |
| Net investment income | | 0.184 | | | 0.134 | | | 0.166 | | | 0.231 | | | 0.202 | |
| Net realized and unrealized gains (losses) | | 0.025 | | | (0.106 | ) | | (0.010 | ) | | (0.064 | ) | | 0.146 | |
| Total from investment operations | | 0.209 | | | 0.028 | | | 0.156 | | | 0.167 | | | 0.348 | |
| Less distributions from net investment income and net foreign | | | | | | | | | | | | | | | |
| currency gains | | (0.219 | ) | | (0.218 | ) | | (0.206 | ) | | (0.287 | ) | | (0.328 | ) |
| Net asset value, end of year. | $ | 9.94 | | $ | 9.95 | | $ | 10.14 | | $ | 10.19 | | $ | 10.31 | |
| |
| Total return | | 2.14 | % | | 0.27 | % | | 1.54 | % | | 1.64 | % | | 3.46 | % |
| |
| Ratios to average net assets | | | | | | | | | | | | | | | |
| Expenses before waiver and payments by affiliates | | 0.70 | % | | 0.71 | % | | 0.68 | % | | 0.73 | % | | 0.76 | % |
| Expenses net of waiver and payments by affiliates | | 0.55 | %b | | 0.55 | %b | | 0.55 | %b | | 0.55 | %b | | 0.64 | % |
| Net investment income | | 1.82 | % | | 1.52 | % | | 1.49 | % | | 1.50 | % | | 1.72 | % |
| |
| Supplemental data | | | | | | | | | | | | | | | |
| Net assets, end of year (000’s) | $ | 224,887 | | $ | 150,464 | | $ | 198,694 | | $ | 156,129 | | $ | 70,442 | |
| Portfolio turnover rate | | 44.76 | % | | 41.28 | % | | 78.63 | % | | 64.86 | % | | 51.42 | % |
aThe amount shown for a share outstanding throughout the period may not correlate with the Statement of Operations for the period due to the timing of sales and
repurchases of the Fund’s shares in relation to income earned and/or fluctuating fair value of the investments of the Fund.
bBenefit of expense reduction rounds to less than 0.01%.
franklintempleton.com
The accompanying notes are an integral part of these financial statements. | Annual Report 55
| | | | | |
| FRANKLIN INVESTORS SECURITIES TRUST | | | | | |
| |
| |
| |
| |
| Statement of Investments, October 31, 2016 | | | | | |
| Franklin Low Duration Total Return Fund | | | | | |
| | | Shares/ | | | |
| | Country | Warrants | | | Value |
| |
| Common Stocks and Other Equity Interests 0.0%† | | | | | |
| Energy 0.0%† | | | | | |
| a,b Halcon Resources Corp | United States | 98,168 | | $ | 786,358 |
| a Halcon Resources Corp., wts., 9/09/20 | United States | 8,753 | | | 22,145 |
| | | | | | 808,503 |
| Materials 0.0%† | | | | | |
| a Verso Corp., A | United States | 1,387 | | | 8,516 |
| a Verso Corp., wts., 7/25/23 | United States | 146 | | | — |
| | | | | | 8,516 |
| Total Common Stocks and Other Equity Interests | | | | | |
| (Cost $1,895,611) | | | | | 817,019 |
| |
| c Management Investment Companies 1.8% | | | | | |
| Diversified Financials 1.8% | | | | | |
| Franklin Lower Tier Floating Rate Fund | United States | 1,893,663 | | | 19,675,161 |
| Franklin Middle Tier Floating Rate Fund | United States | 2,389,308 | | | 24,036,434 |
| Total Management Investment Companies | | | | | |
| (Cost $41,451,172) | | | | | 43,711,595 |
| |
| |
| | | Principal | | | |
| | | Amount* | | | |
| |
| Corporate Bonds 40.4% | | | | | |
| Automobiles & Components 1.2% | | | | | |
| Delphi Automotive PLC, senior note, 3.15%, 11/19/20 | United Kingdom | 10,500,000 | | | 10,837,732 |
| Fiat Chrysler Automobiles NV, senior note, 4.50%, 4/15/20 | United Kingdom | 4,000,000 | | | 4,100,000 |
| Ford Motor Credit Co. LLC, | | | | | |
| senior note, 2.597%, 11/04/19 | United States | 4,000,000 | | | 4,049,076 |
| senior note, 3.157%, 8/04/20 | United States | 11,300,000 | | | 11,609,880 |
| | | | | | 30,596,688 |
| Banks 11.5% | | | | | |
| d ANZ New Zealand International Ltd. of London, senior note, 144A, | | | | | |
| 2.85%, 8/06/20 | New Zealand | 7,500,000 | | | 7,706,475 |
| e Banca Monte dei Paschi di Siena SpA, secured note, Reg S, 2.875%, | | | | | |
| 4/16/21 | Italy | 6,300,000 | EUR | | 7,580,644 |
| Banco Comercial Portugues SA, 4.75%, 6/22/17 | Portugal | 4,500,000 | EUR | | 5,086,620 |
| Bank of America Corp., | | | | | |
| senior note, 2.65%, 4/01/19 | United States | 9,300,000 | | | 9,478,430 |
| f senior note, FRN, 1.92%, 1/15/19 | United States | 12,671,000 | | | 12,762,548 |
| e Bankinter SA, senior note, Reg S, 1.75%, 6/10/19 | Spain | 6,400,000 | EUR | | 7,322,362 |
| Barclays PLC, senior note, 3.25%, 1/12/21 | United Kingdom | 7,000,000 | | | 7,099,995 |
| BB&T Corp., | | | | | |
| senior note, 2.05%, 6/19/18 | United States | 1,000,000 | | | 1,010,572 |
| f senior note, FRN, 1.417%, 2/01/19 | United States | 2,000,000 | | | 2,007,268 |
| CIT Group Inc., | | | | | |
| senior note, 5.25%, 3/15/18 | United States | 500,000 | | | 519,080 |
| senior note, 3.875%, 2/19/19 | United States | 3,100,000 | | | 3,155,211 |
| Citigroup Inc., | | | | | |
| senior note, 2.40%, 2/18/20 | United States | 11,300,000 | | | 11,422,639 |
| f senior note, FRN, 1.763%, 6/07/19 | United States | 5,000,000 | | | 5,024,845 |
56 Annual Report
franklintempleton.com
FRANKLIN INVESTORS SECURITIES TRUST
STATEMENT OF INVESTMENTS
| | | | | |
| Franklin Low Duration Total Return Fund (continued) | | | | | |
| | | Principal | | | |
| | Country | Amount* | | | Value |
| |
| Corporate Bonds (continued) | | | | | |
| Banks (continued) | | | | | |
| Depfa ACS Bank, | | | | | |
| secured bond, 1.65%, 12/20/16 | Ireland | 550,000,000 | JPY | $ | 5,254,198 |
| secured bond, 2.125%, 10/13/17 | Ireland | 5,000,000 | CHF | | 5,166,768 |
| f Deutsche Bank AG, senior note, FRN, 2.121%, 8/20/20 | Germany | 7,500,000 | | | 7,219,537 |
| d The Export-Import Bank of China, senior note, 144A, 2.50%, 7/31/19 | China | 8,000,000 | | | 8,174,360 |
| f The Goldman Sachs Group Inc., senior note, FRN, 2.05%, 9/15/20 | United States | 20,000,000 | | | 20,156,700 |
| HSBC Holdings PLC, senior note, 3.40%, 3/08/21 | United Kingdom | 3,300,000 | | | 3,407,151 |
| HSBC USA Inc., senior note, 2.00%, 8/07/18 | United States | 7,500,000 | | | 7,535,040 |
| Industrial and Commercial Bank of China Ltd./New York, 3.231%, | | | | | |
| 11/13/19 | China | 5,400,000 | | | 5,594,076 |
| d,f ING Bank NV, senior note, 144A, FRN, 1.536%, 10/01/19 | Netherlands | 5,000,000 | | | 5,007,200 |
| Intesa Sanpaolo SpA, | | | | | |
| senior note, 2.375%, 1/13/17 | Italy | 1,500,000 | | | 1,502,228 |
| senior note, 3.875%, 1/16/18 | Italy | 5,900,000 | | | 6,011,068 |
| senior note, 3.875%, 1/15/19 | Italy | 10,100,000 | | | 10,404,212 |
| e,f senior note, Reg S, FRN, 0.00%, 5/18/17 | Italy | 2,150,000 | EUR | | 2,360,042 |
| JPMorgan Chase & Co., | | | | | |
| senior note, 2.20%, 10/22/19 | United States | 17,400,000 | | | 17,645,949 |
| senior note, 2.40%, 6/07/21 | United States | 2,600,000 | | | 2,623,959 |
| f senior note, FRN, 1.782%, 1/25/18 | United States | 8,000,000 | | | 8,041,704 |
| National Australia Bank of New York, senior note, 1.875%, 7/23/18 | Australia | 7,600,000 | | | 7,645,524 |
| d Norddeutsche Landesbank Girozentrale, secured note, 144A, 2.00%, | | | | | |
| 2/05/19 | Germany | 6,500,000 | | | 6,583,785 |
| Regions Financial Corp., senior note, 2.00%, 5/15/18 | United States | 4,500,000 | | | 4,519,755 |
| Royal Bank of Canada, secured note, 2.10%, 10/14/20 | Canada | 6,300,000 | | | 6,392,440 |
| The Royal Bank of Scotland PLC, sub. note, 6.934%, 4/09/18 | United Kingdom | 2,500,000 | EUR | | 2,972,217 |
| d The Toronto-Dominion Bank, secured note, 144A, 2.25%, 3/15/21 | Canada | 12,700,000 | | | 12,905,848 |
| e,f UniCredit SpA, senior note, Reg S, FRN, 0.646%, 4/10/17 | Italy | 3,400,000 | EUR | | 3,742,105 |
| e Unione di Banche Italiane SpA, senior note, Reg S, 2.875%, 2/18/19 | Italy | 5,800,000 | EUR | | 6,751,567 |
| Wells Fargo & Co., | | | | | |
| senior note, 2.50%, 3/04/21 | United States | 2,600,000 | | | 2,634,715 |
| f senior note, FRN, 1.762%, 7/22/20 | United States | 17,600,000 | | | 17,662,410 |
| d Westpac Banking Corp., | | | | | |
| secured note, 144A, 2.10%, 2/25/22 | Australia | 9,700,000 | | | 9,796,466 |
| senior secured note, 144A, 2.25%, 11/09/20 | Australia | 6,300,000 | | | 6,401,713 |
| d Woori Bank, sub. note, 144A, 4.75%, 4/30/24 | South Korea | 5,300,000 | | | 5,624,201 |
| | | | | | 289,913,627 |
| Capital Goods 0.8% | | | | | |
| CNH Industrial Capital LLC, senior note, 3.875%, 10/15/21 | United States | 2,800,000 | | | 2,786,000 |
| John Deere Capital Corp., | | | | | |
| senior note, 1.30%, 3/12/18 | United States | 1,700,000 | | | 1,700,471 |
| senior note, 1.95%, 3/04/19 | United States | 3,750,000 | | | 3,792,473 |
| Lockheed Martin Corp., senior note, 1.85%, 11/23/18. | United States | 4,200,000 | | | 4,242,260 |
| United Technologies Corp., senior note, 4.50%, 4/15/20 | United States | 7,500,000 | | | 8,217,367 |
| | | | | | 20,738,571 |
| Commercial & Professional Services 0.0%† | | | | | |
| Republic Services Inc., senior note, 3.80%, 5/15/18 | United States | 1,035,000 | | | 1,072,421 |
franklintempleton.com
Annual Report
57
FRANKLIN INVESTORS SECURITIES TRUST
STATEMENT OF INVESTMENTS
| | | | |
| Franklin Low Duration Total Return Fund (continued) | | | | |
| | | Principal | | |
| | Country | Amount* | | Value |
| |
| Corporate Bonds (continued) | | | | |
| Consumer Durables & Apparel 0.4% | | | | |
| Beazer Homes USA Inc., senior note, 5.75%, 6/15/19 | United States | 4,500,000 | $ | 4,668,750 |
| KB Home, senior note, 4.75%, 5/15/19 | United States | 4,200,000 | | 4,315,500 |
| | | | | 8,984,250 |
| Consumer Services 0.6% | | | | |
| d International Game Technology PLC, senior note, 144A, 5.625%, | | | | |
| 2/15/20 | United States | 3,800,000 | | 4,042,250 |
| Marriott International Inc., senior note, 2.875%, 3/01/21 | United States | 10,000,000 | | 10,301,000 |
| | | | | 14,343,250 |
| Diversified Financials 3.4% | | | | |
| AerCap Ireland Capital Ltd./AerCap Global Aviation Trust, senior note, | | | | |
| 4.25%, 7/01/20 | Netherlands | 3,700,000 | | 3,849,554 |
| American Express Credit Corp., senior note, 1.55%, 9/22/17 | United States | 4,600,000 | | 4,607,185 |
| f Bank of New York Mellon Corp., senior note, FRN, 1.674%, 8/17/20 | United States | 6,400,000 | | 6,488,173 |
| Capital One Bank USA NA, senior note, 2.30%, 6/05/19 | United States | 11,900,000 | | 12,029,460 |
| f Credit Suisse New York, senior note, FRN, 1.315%, 5/26/17 | Switzerland | 5,400,000 | | 5,401,134 |
| d Hutchison Whampoa International 14 Ltd., 144A, 1.625%, 10/31/17 | Hong Kong | 4,700,000 | | 4,705,852 |
| International Lease Finance Corp., senior note, 8.75%, 3/15/17. | United States | 8,000,000 | | 8,206,272 |
| d Lincoln Finance Ltd., senior secured note, 144A, 7.375%, 4/15/21 | Netherlands | 400,000 | | 431,500 |
| f Morgan Stanley, senior note, FRN, 2.026%, 1/27/20. | United States | 22,400,000 | | 22,633,722 |
| Navient Corp., senior note, 5.50%, 1/15/19 | United States | 3,400,000 | | 3,477,520 |
| PHH Corp., senior note, 7.375%, 9/01/19 | United States | 1,800,000 | | 1,885,500 |
| d Pricoa Global Funding I, secured note, 144A, 2.55%, 11/24/20 | United States | 5,600,000 | | 5,727,288 |
| d Protective Life Global Funding, senior secured note, 144A, 1.722%, | | | | |
| 4/15/19 | United States | 4,300,000 | | 4,304,635 |
| d,f Seven and Seven Ltd., senior note, 144A, FRN, 2.235%, 9/11/19 | South Korea | 1,200,000 | | 1,200,000 |
| | | | | 84,947,795 |
| Energy 2.7% | | | | |
| d California Resources Corp., secured note, second lien, 144A, 8.00%, | | | | |
| 12/15/22 | United States | 1,656,000 | | 1,130,220 |
| CNOOC Nexen Finance 2014 ULC, senior note, 1.625%, 4/30/17 | China | 6,800,000 | | 6,803,148 |
| d CNPC General Capital Ltd., | | | | |
| senior note, 144A, 1.95%, 4/16/18 | China | 1,500,000 | | 1,502,678 |
| f senior note, 144A, FRN, 1.717%, 5/14/17 | China | 7,500,000 | | 7,507,425 |
| Enable Midstream Partners LP, senior note, 2.40%, 5/15/19 | United States | 3,700,000 | | 3,652,248 |
| Energy Transfer Partners LP, senior note, 4.15%, 10/01/20 | United States | 2,600,000 | | 2,715,684 |
| d,g Energy XXI Gulf Coast Inc., senior secured note, second lien, 144A, | | | | |
| 11.00%, 3/15/20. | United States | 3,000,000 | | 1,365,000 |
| EnLink Midstream Partners LP, senior note, 2.70%, 4/01/19 | United States | 800,000 | | 800,015 |
| Ensco PLC, senior note, 4.70%, 3/15/21 | United States | 2,000,000 | | 1,855,000 |
| d Kinder Morgan Finance Co. LLC, senior secured note, 144A, 6.00%, | | | | |
| 1/15/18 | United States | 2,500,000 | | 2,616,787 |
| Kinder Morgan Inc., senior note, 3.05%, 12/01/19 | United States | 500,000 | | 512,681 |
| d,g Linn Energy LLC/Finance Corp., senior secured note, second lien, 144A, | | | | |
| 12.00%, 12/15/20 | United States | 225,000 | | 158,625 |
| d LUKOIL International Finance BV, senior note, 144A, 3.416%, 4/24/18 | Russia | 2,300,000 | | 2,328,233 |
| f Petrobras Global Finance BV, senior note, FRN, 3.737%, 3/17/20 | Brazil | 5,100,000 | | 5,042,625 |
| d Petrofac Ltd., senior note, 144A, 3.40%, 10/10/18 | United Kingdom | 1,300,000 | | 1,311,894 |
| h Sanchez Energy Corp., senior note, 7.75%, 6/15/21. | United States | 1,900,000 | | 1,776,500 |
| d Sinopec Group Overseas Development 2015 Ltd., senior note, 144A, | | | | |
| 2.50%, 4/28/20 | China | 7,400,000 | | 7,519,991 |
58 Annual Report
franklintempleton.com
FRANKLIN INVESTORS SECURITIES TRUST
STATEMENT OF INVESTMENTS
| | | | |
| Franklin Low Duration Total Return Fund (continued) | | | | |
| | | Principal | | |
| | Country | Amount* | | Value |
| |
| Corporate Bonds (continued) | | | | |
| Energy (continued) | | | | |
| f Statoil ASA, senior note, FRN, 1.248%, 11/08/18. | Norway | 6,900,000 | $ | 6,909,384 |
| Transocean Inc., senior bond, 7.375%, 4/15/18 | United States | 7,000,000 | | 7,122,500 |
| Weatherford International Ltd., senior note, 7.75%, 6/15/21 | United States | 3,600,000 | | 3,649,500 |
| Williams Partners LP, senior note, 4.125%, 11/15/20 | United States | 1,700,000 | | 1,775,575 |
| | | | | 68,055,713 |
| Food & Staples Retailing 0.5% | | | | |
| The Kroger Co., senior note, 2.60%, 2/01/21 | United States | 7,500,000 | | 7,652,820 |
| Walgreens Boots Alliance Inc., senior note, 1.75%, 11/17/17. | United States | 5,900,000 | | 5,927,459 |
| | | | | 13,580,279 |
| Food, Beverage & Tobacco 1.9% | | | | |
| Anheuser-Busch InBev Finance Inc., senior note, 2.65%, 2/01/21 | Belgium | 6,500,000 | | 6,656,390 |
| Coca-Cola Femsa SAB de CV, senior note, 2.375%, 11/26/18 | Mexico | 5,500,000 | | 5,545,023 |
| Constellation Brands Inc., senior note, 7.25%, 5/15/17 | United States | 6,600,000 | | 6,822,750 |
| d Imperial Brands Finance PLC, senior note, 144A, 2.95%, 7/21/20 | United Kingdom | 6,000,000 | | 6,180,000 |
| d JBS USA LLC/Finance Inc., senior note, 144A, 7.25%, 6/01/21 | United States | 2,500,000 | | 2,581,250 |
| Kraft Heinz Foods Co., | | | | |
| senior note, 2.25%, 6/05/17 | United States | 7,000,000 | | 7,038,017 |
| senior note, 2.00%, 7/02/18 | United States | 6,400,000 | | 6,448,538 |
| f Mondelez International Inc., senior note, FRN, 1.277%, 2/01/19 | United States | 500,000 | | 500,137 |
| Reynolds American Inc., senior note, 2.30%, 6/12/18 | United States | 6,200,000 | | 6,284,270 |
| | | | | 48,056,375 |
| Health Care Equipment & Services 2.0% | | | | |
| Aetna Inc., senior note, 1.50%, 11/15/17. | United States | 1,000,000 | | 1,002,653 |
| Becton, Dickinson and Co., senior note, 2.675%, 12/15/19 | United States | 5,900,000 | | 6,084,847 |
| CHS/Community Health Systems Inc., senior note, 7.125%, 7/15/20 | United States | 3,800,000 | | 3,097,000 |
| Edwards Lifesciences Corp., senior note, 2.875%, 10/15/18 | United States | 1,600,000 | | 1,636,712 |
| Express Scripts Holding Co., senior note, 3.30%, 2/25/21 | United States | 4,300,000 | | 4,506,860 |
| HCA Inc., senior secured note, first lien, 4.25%, 10/15/19 | United States | 4,000,000 | | 4,160,000 |
| Stryker Corp., senior note, 2.00%, 3/08/19 | United States | 10,100,000 | | 10,198,748 |
| Tenet Healthcare Corp., | | | | |
| senior note, 5.00%, 3/01/19 | United States | 10,600,000 | | 10,308,500 |
| senior note, 5.50%, 3/01/19 | United States | 3,000,000 | | 2,947,500 |
| Zimmer Holdings Inc., senior note, 2.70%, 4/01/20. | United States | 7,500,000 | | 7,632,757 |
| | | | | 51,575,577 |
| Household & Personal Products 0.6% | | | | |
| Avon Products Inc., senior note, 6.60%, 3/15/20 | United States | 10,000,000 | | 10,306,250 |
| Colgate-Palmolive Co., senior note, 0.90%, 5/01/18 | United States | 2,200,000 | | 2,194,493 |
| Procter & Gamble Co., senior note, 1.70%, 11/03/21 | United States | 3,200,000 | | 3,193,440 |
| | | | | 15,694,183 |
| Insurance 2.0% | | | | |
| d Jackson National Life Global Funding, secured note, 144A, 2.25%, | | | | |
| 4/29/21 | United States | 7,600,000 | | 7,654,963 |
| d Metropolitan Life Global Funding I, | | | | |
| secured note, 144A, 1.30%, 4/10/17 | United States | 10,000,000 | | 10,014,380 |
| senior secured bond, 144A, 3.875%, 4/11/22 | United States | 5,900,000 | | 6,387,493 |
| d New York Life Global Funding, | | | | |
| secured note, 144A, 2.10%, 1/02/19 | United States | 10,000,000 | | 10,145,070 |
| secured note, 144A, 2.15%, 6/18/19 | United States | 6,400,000 | | 6,514,567 |
franklintempleton.com
Annual Report
59
FRANKLIN INVESTORS SECURITIES TRUST
STATEMENT OF INVESTMENTS
| | | | | |
| Franklin Low Duration Total Return Fund (continued) | | | | | |
| | | Principal | | | |
| | Country | Amount* | | | Value |
| |
| Corporate Bonds (continued) | | | | | |
| Insurance (continued) | | | | | |
| f Prudential Financial Inc., senior note, FRN, 1.597%, 8/15/18 | United States | 5,700,000 | | $ | 5,691,114 |
| d TIAA Asset Management Finance LLC, senior note, 144A, 2.95%, | | | | | |
| 11/01/19 | United States | 4,200,000 | | | 4,322,896 |
| | | | | | 50,730,483 |
| Materials 0.8% | | | | | |
| e Arkema SA, senior note, Reg S, 1.50%, 1/20/25 | France | 2,000,000 | EUR | | 2,309,697 |
| d BlueScope Steel Ltd./BlueScope Steel Finance, senior note, 144A, | | | | | |
| 6.50%, 5/15/21 | Australia | 4,000,000 | | | 4,240,000 |
| Freeport-McMoRan Copper & Gold Inc., senior note, 2.30%, 11/14/17 | United States | 3,500,000 | | | 3,482,500 |
| Owens-Illinois Inc., senior note, 7.80%, 5/15/18 | United States | 7,400,000 | | | 8,010,500 |
| Reynolds Group Holdings Inc., senior note, 8.125%, 6/15/17. | United States | 2,100,000 | | | 2,176,125 |
| | | | | | 20,218,822 |
| Media 1.3% | | | | | |
| CBS Corp., senior note, 2.30%, 8/15/19 | United States | 11,437,000 | | | 11,590,496 |
| CSC Holdings LLC, | | | | | |
| senior bond, 7.625%, 7/15/18. | United States | 3,500,000 | | | 3,762,500 |
| senior note, 8.625%, 2/15/19 | United States | 3,000,000 | | | 3,354,360 |
| d,f NBCUniversal Enterprise Inc., 144A, FRN, 1.565%, 4/15/18 | United States | 7,500,000 | | | 7,553,557 |
| The New York Times Co., senior note, 6.625%, 12/15/16 | United States | 2,000,000 | | | 2,012,600 |
| Time Warner Inc., senior note, 2.10%, 6/01/19 | United States | 4,500,000 | | | 4,537,233 |
| | | | | | 32,810,746 |
| Pharmaceuticals, Biotechnology & Life Sciences 1.9% | | | | | |
| AbbVie Inc., senior note, 1.80%, 5/14/18 | United States | 8,600,000 | | | 8,632,663 |
| Actavis Funding SCS, senior note, 2.35%, 3/12/18. | United States | 6,200,000 | | | 6,263,265 |
| Amgen Inc., | | | | | |
| senior note, 2.125%, 5/15/17 | United States | 2,500,000 | | | 2,514,468 |
| f senior note, FRN, 1.411%, 5/22/19 | United States | 6,200,000 | | | 6,209,567 |
| Baxalta Inc., senior note, 2.00%, 6/22/18 | United States | 10,200,000 | | | 10,253,927 |
| Biogen Inc., senior note, 2.90%, 9/15/20 | United States | 7,500,000 | | | 7,742,587 |
| Celgene Corp., senior note, 2.30%, 8/15/18 | United States | 3,000,000 | | | 3,038,706 |
| d Valeant Pharmaceuticals International Inc., senior note, 144A, 5.375%, | | | | | |
| 3/15/20 | United States | 3,800,000 | | | 3,249,000 |
| | | | | | 47,904,183 |
| Real Estate 0.6% | | | | | |
| American Tower Corp., senior note, 3.40%, 2/15/19 | United States | 3,600,000 | | | 3,733,060 |
| Boston Properties LP, senior note, 3.70%, 11/15/18 | United States | 4,900,000 | | | 5,086,964 |
| HCP Inc., senior note, 3.75%, 2/01/19 | United States | 5,500,000 | | | 5,690,152 |
| | | | | | 14,510,176 |
| Retailing 0.7% | | | | | |
| Dollar General Corp., senior note, 1.875%, 4/15/18 | United States | 8,200,000 | | | 8,237,662 |
| d,g Edcon Ltd., secured note, 144A, 9.50%, 3/01/18 | South Africa | 1,500,000 | EUR | | 411,619 |
| d Experian Finance PLC, 144A, 2.375%, 6/15/17 | United Kingdom | 1,000,000 | | | 1,004,820 |
| Toys R Us Inc., senior bond, 7.375%, 10/15/18 | United States | 8,250,000 | | | 7,940,625 |
| | | | | | 17,594,726 |
| Semiconductors & Semiconductor Equipment 0.2% | | | | | |
| Maxim Integrated Products Inc., senior note, 2.50%, 11/15/18. | United States | 5,200,000 | | | 5,277,636 |
60 Annual Report
franklintempleton.com
FRANKLIN INVESTORS SECURITIES TRUST
STATEMENT OF INVESTMENTS
| | | | | |
| Franklin Low Duration Total Return Fund (continued) | | | | | |
| | | Principal | | | |
| | Country | Amount* | | | Value |
| |
| Corporate Bonds (continued) | | | | | |
| Software & Services 1.4% | | | | | |
| Alibaba Group Holding Ltd., senior note, 2.50%, 11/28/19. | China | 11,900,000 | | $ | 12,088,318 |
| Fiserv Inc., senior note, 2.70%, 6/01/20 | United States | 11,300,000 | | | 11,575,607 |
| f Oracle Corp., senior note, FRN, 1.46%, 1/15/19 | United States | 12,000,000 | | | 12,103,068 |
| | | | | | 35,766,993 |
| Technology Hardware & Equipment 1.5% | | | | | |
| f Apple Inc., FRN, 1.009%, 5/03/18 | United States | 7,300,000 | | | 7,318,308 |
| d Diamond 1 Finance Corp./Diamond 2 Finance Corp., senior secured | | | | | |
| note, first lien, 144A, 3.48%, 6/01/19 | United States | 6,400,000 | | | 6,571,098 |
| d,f Hewlett Packard Enterprise Co., senior note, 144A, FRN, 3.038%, | | | | | |
| 10/05/18 | United States | 8,100,000 | | | 8,293,493 |
| Juniper Networks Inc., | | | | | |
| senior note, 3.125%, 2/26/19 | United States | 7,500,000 | | | 7,718,880 |
| senior note, 3.30%, 6/15/20 | United States | 500,000 | | | 519,343 |
| d Sanmina Corp., senior note, first lien, 144A, 4.375%, 6/01/19 | United States | 6,500,000 | | | 6,792,500 |
| | | | | | 37,213,622 |
| Telecommunication Services 1.4% | | | | | |
| AT&T Inc., senior note, 2.45%, 6/30/20 | United States | 7,400,000 | | | 7,450,771 |
| CenturyLink Inc., senior note, 5.625%, 4/01/20 | United States | 3,800,000 | | | 4,080,250 |
| Intelsat Jackson Holdings SA, senior note, 7.25%, 10/15/20 | Luxembourg | 2,500,000 | | | 1,887,500 |
| d Sprint Communications Inc., senior note, 144A, 9.00%, 11/15/18. | United States | 1,000,000 | | | 1,102,500 |
| d Sprint Spectrum Co. LLC/Sprint Spectrum Co. II LLC, 144A, 3.36%, | | | | | |
| 9/20/21 | United States | 2,500,000 | | | 2,528,125 |
| Telefonica Emisiones S.A.U., senior note, 3.192%, 4/27/18 | Spain | 2,300,000 | | | 2,349,611 |
| T-Mobile USA Inc., senior note, 6.633%, 4/28/21 | United States | 1,800,000 | | | 1,884,375 |
| Verizon Communications Inc., | | | | | |
| senior note, 2.625%, 2/21/20 | United States | 8,824,000 | | | 9,007,407 |
| f senior note, FRN, 2.606%, 9/14/18 | United States | 4,800,000 | | | 4,929,989 |
| | | | | | 35,220,528 |
| Transportation 0.5% | | | | | |
| FedEx Corp., senior note, 0.50%, 4/09/20 | United States | 7,100,000 | EUR | | 7,862,052 |
| XPO CNW Inc., senior bond, 7.25%, 1/15/18 | United States | 3,275,000 | | | 3,406,000 |
| | | | | | 11,268,052 |
| Utilities 2.5% | | | | | |
| Dominion Resources Inc., senior note, 2.50%, 12/01/19 | United States | 9,500,000 | | | 9,743,561 |
| Duke Energy Corp., senior note, 2.10%, 6/15/18 | United States | 5,100,000 | | | 5,151,571 |
| d Engie SA, senior note, 144A, 1.625%, 10/10/17. | France | 1,000,000 | | | 1,002,155 |
| Kinder Morgan Energy Partners LP, senior note, 5.95%, 2/15/18 | United States | 3,400,000 | | | 3,575,756 |
| d Korea Western Power Co. Ltd., senior note, 144A, 3.125%, 5/10/17 | South Korea | 5,200,000 | | | 5,242,068 |
| PSEG Power LLC, senior note, 3.00%, 6/15/21 | United States | 7,700,000 | | | 7,886,948 |
| Sempra Energy, senior note, 2.85%, 11/15/20 | United States | 9,600,000 | | | 9,891,014 |
| The Southern Co., | | | | | |
| senior note, 2.45%, 9/01/18 | United States | 7,000,000 | | | 7,120,428 |
| senior note, 2.35%, 7/01/21 | United States | 6,500,000 | | | 6,572,735 |
franklintempleton.com
Annual Report
61
FRANKLIN INVESTORS SECURITIES TRUST
STATEMENT OF INVESTMENTS
| | | | | |
| Franklin Low Duration Total Return Fund (continued) | | | | | |
| | | Principal | | | |
| | Country | Amount* | | | Value |
| |
| Corporate Bonds (continued) | | | | | |
| Utilities (continued) | | | | | |
| d State Grid Overseas Investment 2013 Ltd., senior note, 144A, 1.75%, | | | | | |
| 5/22/18 | China | 2,000,000 | | $ | 2,001,920 |
| d State Grid Overseas Investment 2014 Ltd., senior note, 144A, 2.75%, | | | | | |
| 5/07/19 | China | 2,200,000 | | | 2,255,350 |
| e Veolia Environnement SA, senior bond, Reg S, 4.625%, 3/30/27 | France | 1,000,000 | EUR | | 1,508,989 |
| Virginia Electric & Power Co., senior note, 1.20%, 1/15/18 | United States | 900,000 | | | 899,006 |
| | | | | | 62,851,501 |
| Total Corporate Bonds (Cost $1,013,907,613) | | | | | 1,018,926,197 |
| |
| f,i Senior Floating Rate Interests 2.9% | | | | | |
| Automobiles & Components 0.1% | | | | | |
| TI Group Automotive Systems LLC, Initial U.S. Term Loan, 4.50%, | | | | | |
| 6/25/22 | United States | 1,605,201 | | | 1,610,539 |
| Capital Goods 0.0%† | | | | | |
| j Harsco Corp., Initial Term Loan, 7.50%, 11/01/23 | United States | 135,558 | | | 137,252 |
| Leidos (Abacus Innovations Corp.), B Term Loan, 3.284%, 8/16/23 | United States | 212,319 | | | 214,244 |
| | | | | | 351,496 |
| Commercial & Professional Services 0.0%† | | | | | |
| KAR Auction Services Inc., Tranche B-3 Term Loan, 4.375%, 3/09/23 | United States | 908,841 | | | 920,580 |
| Consumer Services 0.2% | | | | | |
| Aristocrat Technologies Inc., Term B-1 Loans, 3.631%, 10/20/21 | United States | 165,520 | | | 166,492 |
| Fitness International LLC, Term B Loan, 6.00%, 7/01/20 | United States | 4,309,037 | | | 4,317,117 |
| Prime Security Services Borrower LLC, Term B-1 Loans, 4.75%, 5/02/22 . | United States | 870,078 | | | 877,256 |
| | | | | | 5,360,865 |
| Diversified Financials 0.1% | | | | | |
| First Eagle Investment Management, Initial Term Loans, 4.838%, | | | | | |
| 12/01/22 | United States | 894,750 | | | 893,632 |
| Russell Investments US Institutional Holdco Inc., Initial Term Loan, | | | | | |
| 6.75%, 6/01/23 | United States | 605,256 | | | 607,525 |
| | | | | | 1,501,157 |
| Energy 0.4% | | | | | |
| h Bowie Resource Holdings LLC, First Lien Initial Term Loan, 6.75%, | | | | | |
| 8/16/20 | United States | 2,184,980 | | | 1,813,533 |
| Fieldwood Energy LLC, Loans, 3.875%, 10/01/18 | United States | 4,636,382 | | | 4,277,063 |
| McDermott Finance LLC, Term Loan, 8.25% - 8.484%, 4/16/19 | United States | 139,141 | | | 140,532 |
| OSG Bulk Ships Inc., Initial Term Loan, 5.25%, 8/05/19 | United States | 1,081,968 | | | 1,073,853 |
| OSG International Inc., Initial Term Loan, 5.75%, 8/05/19 | United States | 1,788,577 | | | 1,787,460 |
| | | | | | 9,092,441 |
| Health Care Equipment & Services 0.1% | | | | | |
| Carestream Health Inc., Term Loan, 5.00%, 6/07/19 | United States | 650,294 | | | 606,283 |
| Community Health Systems Inc., 2018 Term F Loans, 4.083%, 12/31/18 . | United States | 1,887,968 | | | 1,849,870 |
| | | | | | 2,456,153 |
| Household & Personal Products 0.0%† | | | | | |
| j Spectrum Brands Inc., Term Loans, 5.00%, 6/23/22 | United States | 34,447 | | | 34,820 |
62 Annual Report
franklintempleton.com
FRANKLIN INVESTORS SECURITIES TRUST
STATEMENT OF INVESTMENTS
| | | | |
| Franklin Low Duration Total Return Fund (continued) | | | | |
| | | Principal | | |
| | Country | Amount* | | Value |
| |
| f,i Senior Floating Rate Interests (continued) | | | | |
| Materials 0.4% | | | | |
| The Chemours Co. LLC, Tranche B Term Loan, 3.75%, 5/12/22. | United States | 3,691,368 | $ | 3,658,127 |
| Cyanco Intermediate Corp., Initial Term Loan, 5.50%, 5/01/20 | United States | 578,776 | | 580,222 |
| FMG America Finance Inc. (Fortescue Metals Group), Loans, 3.75%, | | | | |
| 6/30/19 | Australia | 2,867,728 | | 2,869,073 |
| Novelis Inc., Initial Term Loan, 4.00% - 4.088%, 6/02/22 | Canada | 1,740,007 | | 1,747,402 |
| h OCI Beaumont LLC, Term B-3 Loan, 7.75%, 8/20/19 | United States | 1,534,123 | | 1,509,194 |
| | | | | 10,364,018 |
| Media 0.4% | | | | |
| j Altice U.S. Finance I Corp., 2016 Refinancing Term Loans, 5.50%, | | | | |
| 1/01/25 | United States | 116,386 | | 116,968 |
| j AMC Entertainment Holdings Inc., | | | | |
| 2016 Incremental Term Loan, 5.25%, 12/15/23 | United States | 45,186 | | 45,043 |
| Initial Term Loans, 5.25%, 12/15/22 | United States | 70,690 | | 70,689 |
| Charter Communications Operating LLC (CCO Safari), Term A Loan, | | | | |
| 2.54%, 5/18/21 | United States | 1,306,500 | | 1,300,784 |
| CSC Holdings Inc. (Cablevision), 2016 Extended Term Loans, 3.876%, | | | | |
| 10/11/24 | United States | 1,249,724 | | 1,255,712 |
| j Lions Gate Entertainment Corp., Term Loan A, 5.00%, 10/12/21 | United States | 314,357 | | 311,214 |
| j Live Nation Entertainment Inc., Term B-2 Loans, 5.00%, 10/31/23 | United States | 45,186 | | 45,299 |
| Radio One Inc., Term Loan B, 5.04%, 12/31/18 | United States | 6,842,717 | | 6,859,823 |
| UPC Financing Partnership, Facility AN, 4.08%, 8/31/24. | Netherlands | 286,447 | | 288,273 |
| | | | | 10,293,805 |
| Pharmaceuticals, Biotechnology & Life Sciences 0.4% | | | | |
| Endo Luxembourg Finance Co. I S.A.R.L. and Endo LLC, 2015 | | | | |
| Incremental Term B Loans, 3.75%, 9/25/22 | United States | 3,306,929 | | 3,306,413 |
| Grifols Worldwide Operations USA Inc., U.S. Tranche B Term Loan, | | | | |
| 3.46%, 2/27/21 | United States | 1,689,161 | | 1,706,052 |
| j RPI Finance Trust, Term A-2 Term Loan A, 4.75%, 10/14/20 | United States | 354,354 | | 352,522 |
| Valeant Pharmaceuticals International Inc., | | | | |
| j Series A-3 Tranche A Term Loan, 4.29%, 10/20/18 | United States | 2,767,575 | | 2,763,540 |
| Series C-2 Tranche B Term Loan, 5.25%, 12/11/19 | United States | 714,240 | | 714,775 |
| Series D-2 Tranche B Term Loan, 5.00%, 2/13/19. | United States | 1,231,650 | | 1,231,541 |
| Series F-1 Tranche B Term Loan, 5.50%, 4/01/22 | United States | 377,828 | | 378,466 |
| | | | | 10,453,309 |
| Retailing 0.2% | | | | |
| Ascena Retail Group Inc., Tranche B Term Loan, 5.25%, 8/21/22 | United States | 3,261,781 | | 3,187,031 |
| Dollar Tree Inc., Term A-1 Loans, 2.25%, 7/06/20 | United States | 520,077 | | 519,260 |
| PetSmart Inc., Tranche B-2 Loans, 4.00%, 3/11/22 | United States | 704,011 | | 706,211 |
| | | | | 4,412,502 |
| Semiconductors & Semiconductor Equipment 0.2% | | | | |
| Avago Technologies Cayman Finance Ltd., Term B-3 Loans, 3.535%, | | | | |
| 2/01/23 | Singapore | 1,430,820 | | 1,447,365 |
| MACOM Technology Solutions Holdings Inc., Initial Term Loan, 4.628%, | | | | |
| 5/07/21 | United States | 847,939 | | 857,477 |
| MKS Instruments Inc., Tranche B-1 Term Loans, 4.25%, 5/01/23 | United States | 215,591 | | 217,927 |
| ON Semiconductor Corp., 2016 Replacement Term Loans, 3.777%, | | | | |
| 3/31/23 | United States | 2,914,264 | | 2,934,559 |
| | | | | 5,457,328 |
franklintempleton.com
Annual Report
63
FRANKLIN INVESTORS SECURITIES TRUST
STATEMENT OF INVESTMENTS
| | | | | | |
| Franklin Low Duration Total Return Fund (continued) | | | | | | |
| | | Principal | | | | |
| | Country | Amount* | | | | Value |
| |
| f,i Senior Floating Rate Interests (continued) | | | | | | |
| Software & Services 0.2% | | | | | | |
| j Global Payments Inc., Delayed Draw Term Loan (A-2), 4.75%, 10/31/21 . | United States | 647,481 | | | $ | 646,587 |
| MoneyGram International Inc., Term Loan, 4.25%, 3/27/20 | United States | 4,984,047 | | | | 4,865,677 |
| j Rackspace Hosting Inc., Term B Loan, 6.50%, 11/03/23 | United States | 225,930 | | | | 227,524 |
| | | | | | | 5,739,788 |
| Technology Hardware & Equipment 0.1% | | | | | | |
| Ciena Corp., Term Loan, 3.75%, 7/15/19 | United States | 234,231 | | | | 235,403 |
| Dell International LLC, Term A-3 Loan, 2.54%, 12/31/18 | United States | 923,168 | | | | 923,601 |
| Western Digital Corp., Term Loan B-1, 4.50%, 4/29/23 | United States | 640,092 | | | | 648,293 |
| Zebra Technologies Corp., Refinancing Term Loan, 4.089%, 10/27/21 | United States | 478,537 | | | | 484,120 |
| | | | | | | 2,291,417 |
| Telecommunication Services 0.0%† | | | | | | |
| Consolidated Communications Inc., Initial Term Loan, 4.00%, 10/05/23 | United States | 227,279 | | | | 228,984 |
| Global Tel*Link Corp., Term Loan, 5.00%, 5/23/20 | United States | 268,059 | | | | 261,190 |
| | | | | | | 490,174 |
| Transportation 0.1% | | | | | | |
| Air Canada, Term Loan, 3.614%, 10/06/23 | Canada | 46,797 | | | | 47,002 |
| Navios Maritime Midstream Partners LP, Initial Term Loan, 5.50%, | | | | | | |
| 6/18/20 | Marshall Islands | 1,221,994 | | | | 1,200,609 |
| Navios Maritime Partners LP, Initial Term Loan, 5.25%, 6/27/18 | Marshall Islands | 63,867 | | | | 58,638 |
| XPO Logistics Inc., Refinancing Term Loans, 4.25%, 10/30/21 | United States | 121,362 | | | | 122,318 |
| | | | | | | 1,428,567 |
| Utilities 0.0%† | | | | | | |
| EFS Cogen Holdings I LLC (Linden), Term B Advance, 5.25%, 6/28/23 | United States | 164,717 | | | | 166,570 |
| NRG Energy Inc., Term Loans, 3.50%, 6/30/23 | United States | 1,147,125 | | | | 1,150,853 |
| | | | | | | 1,317,423 |
| Total Senior Floating Rate Interests | | | | | | |
| (Cost $73,317,364) | | | | | | 73,576,382 |
| |
| Foreign Government and Agency Securities 2.1% | | | | | | |
| The Export-Import Bank of Korea, senior note, 2.25%, 1/21/20 | South Korea | 11,200,000 | | | | 11,326,504 |
| Government of Hungary, | | | | | | |
| 5.50%, 12/22/16 | Hungary | 750,880,000 | | HUF | | 2,686,659 |
| A, 6.75%, 11/24/17 | Hungary | 3,910,000 | | HUF | | 14,830 |
| A, 5.50%, 12/20/18 | Hungary | 428,710,000 | | HUF | | 1,674,713 |
| Government of Malaysia, | | | | | | |
| senior bond, 4.24%, 2/07/18 | Malaysia | 4,000,000 | | MYR | | 972,863 |
| senior bond, 3.26%, 3/01/18 | Malaysia | 2,400,000 | | MYR | | 576,830 |
| senior note, 4.012%, 9/15/17 | Malaysia | 29,800,000 | | MYR | | 7,197,180 |
| senior note, 3.58%, 9/28/18 | Malaysia | 5,200,000 | | MYR | | 1,256,417 |
| Government of Mexico, | | | | | | |
| 7.25%, 12/15/16 | Mexico | 894,000 | k | MXN | | 4,749,955 |
| 7.75%, 12/14/17 | Mexico | 930,000 | k | MXN | | 5,071,518 |
| M, 4.75%, 6/14/18 | Mexico | 720,000 | k | MXN | | 3,775,872 |
| senior note, 8.50%, 12/13/18 | Mexico | 1,060,000 | k | MXN | | 5,946,940 |
64 Annual Report
franklintempleton.com
FRANKLIN INVESTORS SECURITIES TRUST
STATEMENT OF INVESTMENTS
| | | | | |
| Franklin Low Duration Total Return Fund (continued) | | | | | |
| | | Principal | | | |
| | Country | Amount* | | | Value |
| |
| Foreign Government and Agency Securities (continued) | | | | | |
| d Government of Serbia, senior note, 144A, 5.25%, 11/21/17 | Serbia | 1,800,000 | | $ | 1,855,125 |
| Korea Monetary Stabilization Bond, senior note, 1.96%, 2/02/17 | South Korea | 2,800,000,000 | KRW | | 2,451,794 |
| Korea Treasury Bond, senior note, 3.00%, 12/10/16 | South Korea | 1,590,000,000 | KRW | | 1,392,723 |
| l Nota Do Tesouro Nacional, | | | | | |
| Index Linked, 6.00%, 5/15/17 | Brazil | 150m BRL | | 137,740 |
| Index Linked, 6.00%, 8/15/18 | Brazil | 1,810m BRL | | 1,663,416 |
| Total Foreign Government and Agency Securities | | | | | |
| (Cost $57,922,017) | | | | | 52,751,079 |
| |
| U.S. Government and Agency Securities 19.4% | | | | | |
| n U.S. Treasury Bond, Index Linked, 0.125%, 7/15/22 | United States | 14,243,372 | | | 14,580,171 |
| U.S. Treasury Note, | | | | | |
| 1.50%, 12/31/18 | United States | 50,000,000 | | | 50,630,850 |
| 1.375%, 2/28/19 | United States | 40,000,000 | | | 40,414,840 |
| 1.50%, 2/28/19 | United States | 76,000,000 | | | 77,006,392 |
| 1.625%, 3/31/19 | United States | 80,000,000 | | | 81,317,200 |
| 3.125%, 5/15/19 | United States | 42,000,000 | | | 44,291,142 |
| 3.375%, 11/15/19 | United States | 25,000,000 | | | 26,762,700 |
| n Index Linked, 1.875%, 7/15/19 | United States | 23,958,059 | | | 25,695,018 |
| n Index Linked, 1.375%, 1/15/20 | United States | 24,346,350 | | | 25,830,966 |
| n Index Linked, 0.125%, 1/15/22 | United States | 38,307,452 | | | 39,094,288 |
| n Index Linked, 0.125%, 1/15/23 | United States | 52,170,469 | | | 52,965,859 |
| n Index Linked, 0.125%, 7/15/24 | United States | 10,143,019 | | | 10,255,880 |
| Total U.S. Government and Agency Securities | | | | | |
| (Cost $486,705,601) | | | | | 488,845,306 |
| |
| Asset-Backed Securities and Commercial Mortgage- | | | | | |
| Backed Securities 27.4% | | | | | |
| Automobiles & Components 0.0%† | | | | | |
| f Countrywide Asset-Backed Certificates, | | | | | |
| 2001-BC3, A, FRN, 0.774%, 12/25/31 | United States | 1,471 | | | 1,132 |
| 2002-3, 1A1, FRN, 1.274%, 5/25/32 | United States | 1,659 | | | 1,596 |
| | | | | | 2,728 |
| Banks 2.5% | | | | | |
| Banc of America Commercial Mortgage Trust, | | | | | |
| 2006-1, AJ, 5.46%, 9/10/45 | United States | 261,687 | | | 261,551 |
| f 2006-1, D, FRN, 5.785%, 9/10/45 | United States | 1,776,000 | | | 1,773,119 |
| o 2006-4, AJ, 5.695%, 7/10/46 | United States | 2,434,420 | | | 2,418,422 |
| Bear Stearns Commercial Mortgage Securities Trust, | | | | | |
| f 2005-T20, E, FRN, 5.291%, 10/12/42 | United States | 2,000,000 | | | 1,984,830 |
| f 2006-PW11, AJ, FRN, 5.569%, 3/11/39. | United States | 5,382,000 | | | 5,175,039 |
| 2006-PW13, AJ, 5.611%, 9/11/41 | United States | 954,117 | | | 958,288 |
| f 2007-PW16, A4, FRN, 5.90%, 6/11/40 | United States | 1,146,794 | | | 1,161,913 |
| f 2007-PW16, AM, FRN, 5.90%, 6/11/40 | United States | 2,100,000 | | | 2,143,259 |
| f CD Commercial Mortgage Trust, 2005-CD1, E, FRN, 5.45%, 7/15/44. | United States | 3,495,000 | | | 3,490,756 |
| f Citibank Credit Card Issuance Trust, | | | | | |
| 2006-A8, A8, FRN, 0.92%, 12/17/18 | United States | 6,230,000 | | | 6,230,064 |
| 2013-A12, A12, FRN, 1.018%, 11/07/18 | United States | 6,200,000 | | | 6,200,190 |
| Citigroup Commercial Mortgage Trust, | | | | | |
| 2006-C5, AJ, 5.482%, 10/15/49 | United States | 1,219,000 | | | 1,144,399 |
| f 2007-C6, AM, FRN, 5.90%, 12/10/49 | United States | 5,200,000 | | | 5,276,465 |
franklintempleton.com
Annual Report
65
FRANKLIN INVESTORS SECURITIES TRUST
STATEMENT OF INVESTMENTS
| | | | |
| Franklin Low Duration Total Return Fund (continued) | | | | |
| | | Principal | | |
| | Country | Amount* | | Value |
| |
| Asset-Backed Securities and Commercial Mortgage- | | | | |
| Backed Securities (continued) | | | | |
| Banks (continued) | | | | |
| f Commercial Mortgage Trust, 2006-GG7, AJ, FRN, 5.951%, 7/10/38 | United States | 4,448,000 | $ | 4,105,775 |
| Credit Suisse First Boston Mortgage Securities Corp., 2004-6, 3A1, | | | | |
| 5.00%, 9/25/19 | United States | 881,845 | | 906,292 |
| f CWABS Asset-Backed Certificates Trust, 2004-7, MV3, FRN, 1.584%, | | | | |
| 12/25/34 | United States | 451,790 | | 450,916 |
| f CWABS Inc. Asset-Backed Certificates, 2004-1, M1, FRN, 1.284%, | | | | |
| 3/25/34 | United States | 330,582 | | 320,839 |
| f,o Greenwich Capital Commercial Funding Corp., 2006-GG7, AM, FRN, | | | | |
| 5.951%, 7/10/38. | United States | 287,239 | | 286,907 |
| f Impac Secured Assets CMN Owner Trust, 2004-4, M1, FRN, 1.299%, | | | | |
| 2/25/35 | United States | 1,120,000 | | 1,105,627 |
| f LB-UBS Commercial Mortgage Trust, | | | | |
| 2006-C1, AJ, FRN, 5.276%, 2/15/41 | United States | 1,892,198 | | 1,891,642 |
| 2006-C4, AJ, FRN, 6.078%, 6/15/38 | United States | 138,240 | | 138,549 |
| f Merrill Lynch Mortgage Investors Trust, | | | | |
| 2003-A, 1A, FRN, 1.274%, 3/25/28 | United States | 521,358 | | 497,213 |
| 2005-1, 2A2, FRN, 2.681%, 4/25/35 | United States | 553,371 | | 538,408 |
| 2006-3, 2A1, FRN, 2.893%, 10/25/36 | United States | 2,910,101 | | 2,856,372 |
| f Morgan Stanley ABS Capital I Inc. Trust, 2005-WMC, M2, FRN, 1.269%, | | | | |
| 1/25/35 | United States | 354,617 | | 350,260 |
| Morgan Stanley Capital I Trust, | | | | |
| d 2005-RR6, B, 144A, 5.306%, 5/24/43 | United States | 2,684,273 | | 2,625,031 |
| f 2006-HQ8, AJ, FRN, 5.589%, 3/12/44 | United States | 2,434,148 | | 2,445,922 |
| 2007-IQ13, A1A, 5.312%, 3/15/44 | United States | 2,163,192 | | 2,174,741 |
| f Wachovia Bank Commercial Mortgage Trust, | | | | |
| d 2003-C7, F, 144A, FRN, 6.116%, 10/15/35. | United States | 540,327 | | 542,370 |
| 2006-C27, AM, FRN, 5.795%, 7/15/45 | United States | 651,159 | | 650,547 |
| 2006-C28, AM, FRN, 5.603%, 10/15/48. | United States | 1,122,901 | | 1,121,598 |
| f Wells Fargo Mortgage Backed Securities Trust, | | | | |
| 2005-AR, 1A1, FRN, 2.766%, 2/25/35 | United States | 1,893,969 | | 1,922,002 |
| 2005-AR9, 2A2, FRN, 3.072%, 10/25/33 | United States | 198,106 | | 195,663 |
| | | | | 63,344,969 |
| Diversified Financials 24.7% | | | | |
| f American Express Credit Account Master Trust, | | | | |
| 2008-2, A, FRN, 1.795%, 9/15/20 | United States | 2,900,000 | | 2,941,548 |
| 2012-1, A, FRN, 0.805%, 1/15/20 | United States | 11,890,000 | | 11,903,621 |
| f American Home Mortgage Investment Trust, | | | | |
| 2004-3, 4A, FRN, 2.745%, 10/25/34 | United States | 3,311,524 | | 3,239,410 |
| 2005-1, 6A, FRN, 3.248%, 6/25/45 | United States | 1,611,009 | | 1,602,092 |
| f,o Ameriquest Mortgage Securities Inc. Asset-Backed Pass-Through | | | | |
| Certificates, 2004-R4, M1, FRN, 1.359%, 6/25/34 | United States | 1,116,857 | | 1,099,761 |
| d Apidos CDO, 2013-14A, C2, 144A, 4.85%, 4/15/25 | United States | 1,900,000 | | 1,915,029 |
| d,f ARCap REIT Inc., 2004-RR3, A2, 144A, FRN, 4.76%, 9/21/45 | United States | 3,397,075 | | 3,439,640 |
| d,f Ares IIIR/IVR CLO Ltd., | | | | |
| 2007-3RA, A2, 144A, FRN, 1.10%, 4/16/21 | United States | 1,102,314 | | 1,095,094 |
| 2007-3RA, B, 144A, FRN, 1.25%, 4/16/21 | United States | 3,700,000 | | 3,624,298 |
66 Annual Report
franklintempleton.com
FRANKLIN INVESTORS SECURITIES TRUST
STATEMENT OF INVESTMENTS
| | | | |
| Franklin Low Duration Total Return Fund (continued) | | | | |
| | | Principal | | |
| | Country | Amount* | | Value |
| |
| Asset-Backed Securities and Commercial Mortgage- | | | | |
| Backed Securities (continued) | | | | |
| Diversified Financials (continued) | | | | |
| f Argent Securities Inc. Asset-Backed Pass-Through Certificates, | | | | |
| 2005-W2, A2C, FRN, 0.894%, 10/25/35 | United States | 796,279 | $ | 768,921 |
| d,f Atrium IX, 9A, A, 144A, FRN, 2.129%, 2/28/24 | United States | 3,370,000 | | 3,374,954 |
| d,f Atrium X, 10A, A, 144A, FRN, 2.00%, 7/16/25 | United States | 1,390,000 | | 1,386,317 |
| d,f Atrium XI, 11A, C, 144A, FRN, 4.082%, 10/23/25 | Cayman Islands | 6,750,000 | | 6,756,075 |
| d BAMLL Commercial Mortgage Securities Trust, 2012-PARK, A, 144A, | | | | |
| 2.959%, 12/10/30 | United States | 3,200,000 | | 3,320,481 |
| f Bank of America Credit Card Trust, 2014-A2, A, FRN, 0.805%, 9/16/19 | United States | 9,620,000 | | 9,626,534 |
| f Bear Stearns ALT-A Trust, | | | | |
| 2004-10, 1A3, FRN, 1.534%, 9/25/34 | United States | 1,362,491 | | 1,353,319 |
| 2004-13, A2, FRN, 1.414%, 11/25/34 | United States | 108,461 | | 104,230 |
| d,f BlueMountain CLO Ltd., | | | | |
| 2011-1A, B, 144A, FRN, 2.818%, 8/16/22 | Cayman Islands | 1,200,000 | | 1,203,948 |
| 2011-1A, C, 144A, FRN, 3.818%, 8/16/22 | Cayman Islands | 700,000 | | 703,360 |
| 2013-3A, A, 144A, FRN, 2.287%, 10/29/25 | United States | 1,448,215 | | 1,448,258 |
| d,f Burnham Park CLO Ltd., 2016-1A, A, 144A, FRN, 2.318%, 10/20/29 | Cayman Islands | 2,240,000 | | 2,240,224 |
| f Capital One Multi-Asset Execution Trust, | | | | |
| 2007-A2, A2, FRN, 0.615%, 12/16/19 | United States | 11,390,000 | | 11,390,437 |
| 2007-A5, A5, FRN, 0.575%, 7/15/20 | United States | 10,200,000 | | 10,200,900 |
| d,f Carlyle Global Market Strategies CLO Ltd., 2012-4A, AR, 144A, FRN, | | | | |
| 2.33%, 1/20/29 | United States | 2,800,000 | | 2,804,060 |
| d,f Catamaran CLO Ltd., 2014-2A, B, 144A, FRN, 3.882%, 10/18/26 | United States | 3,011,300 | | 3,013,167 |
| d,f Cent CLO, 2013-17A, A1, 144A, FRN, 2.187%, 1/30/25 | United States | 8,916,000 | | 8,900,843 |
| d,f Cent CLO 20 Ltd., 2013-20A, A, 144A, FRN, 2.362%, 1/25/26. | United States | 1,000,000 | | 1,002,210 |
| d,f Cent CLO 21 Ltd., | | | | |
| 2014-21A, A2A, 144A, FRN, 2.886%, 7/27/26 | Cayman Islands | 3,260,000 | | 3,270,725 |
| 2014-21A, B, 144A, FRN, 3.686%, 7/27/26 | United States | 780,000 | | 773,175 |
| d,f Cent CLO LP, 2014-22A, B, 144A, FRN, 3.988%, 11/07/26 | United States | 4,050,000 | | 4,088,596 |
| d Centerline REIT Inc., 2004-RR3, B, 144A, 5.04%, 9/21/45 | United States | 2,227,000 | | 2,041,046 |
| f Chase Funding Trust, 2004-2, 2A2, FRN, 1.034%, 2/26/35 | United States | 12,256 | | 11,256 |
| Chase Issuance Trust, | | | | |
| f 2007-A2, A2, FRN, 0.585%, 4/15/19 | United States | 6,468,000 | | 6,466,864 |
| f 2007-B1, B1, FRN, 0.785%, 4/15/19 | United States | 9,400,000 | | 9,396,401 |
| f 2007-C1, C1, FRN, 0.995%, 4/15/19 | United States | 3,800,000 | | 3,799,221 |
| f 2013-A3, A3, FRN, 0.815%, 4/15/20 | United States | 6,147,000 | | 6,155,238 |
| f 2014-A5, A5, FRN, 0.905%, 4/15/21 | United States | 7,310,000 | | 7,335,244 |
| 2015-A2, A2, 1.59%, 2/18/20 | United States | 8,200,000 | | 8,246,268 |
| 2015-A7, A7, 1.62%, 7/15/20 | United States | 5,005,000 | | 5,040,134 |
| d,f CIFC Funding Ltd., 2007-3A, A1J, 144A, FRN, 1.284%, 7/26/21 | United States | 4,673,974 | | 4,646,631 |
| d,f Colony American Homes, | | | | |
| 2014-1A, A, 144A, FRN, 1.685%, 5/17/31 | United States | 4,549,119 | | 4,561,277 |
| 2014-1A, C, 144A, FRN, 2.385%, 5/17/31 | United States | 700,000 | | 700,540 |
| d Colony MFM Trust, 2014-1, A, 144A, 2.543%, 4/20/50 | United States | 5,771,040 | | 5,753,807 |
| d COMM Mortgage Trust, 2012-9W57, A, 144A, 2.365%, 2/10/29 | United States | 7,805,000 | | 7,809,128 |
| f Commercial Mortgage Trust, | | | | |
| 2007-C9, A1A, FRN, 6.007%, 12/10/49 | United States | 7,625,710 | | 7,778,158 |
| d 2014-BBG, A, 144A, FRN, 1.335%, 3/15/29 | United States | 6,600,000 | | 6,546,674 |
franklintempleton.com
Annual Report
67
FRANKLIN INVESTORS SECURITIES TRUST
STATEMENT OF INVESTMENTS
| | | | |
| Franklin Low Duration Total Return Fund (continued) | | | | |
| | | Principal | | |
| | Country | Amount* | | Value |
| |
| Asset-Backed Securities and Commercial Mortgage- | | | | |
| Backed Securities (continued) | | | | |
| Diversified Financials (continued) | | | | |
| f Conseco Finance Securitizations Corp., 2002-2, M1, FRN, 7.424%, | | | | |
| 3/01/33 | United States | 985,000 | $ | 1,100,376 |
| Conseco Financial Corp., | | | | |
| f 1997-3, A7, FRN, 7.64%, 3/15/28 | United States | 1,514,337 | | 1,574,715 |
| 1998-6, A8, 6.66%, 6/01/30 | United States | 8,003,387 | | 8,585,318 |
| d Core Industrial Trust, 2015-CALW, A, 144A, 3.04%, 2/10/34 | United States | 5,290,000 | | 5,533,498 |
| d,f Cornerstone CLO Ltd., 2007-1A, B, 144A, FRN, 1.83%, 7/15/21 | United States | 995,000 | | 985,538 |
| d CountryPlace Manufactured Housing Contract Trust, | | | | |
| 2005-1, A3, 144A, 4.80%, 12/15/35 | United States | 742 | | 741 |
| 2007-1, A3, 144A, 5.593%, 7/15/37 | United States | 28,601 | | 28,662 |
| f Countrywide Home Loans, | | | | |
| 2004-11, 2A1, FRN, 2.634%, 7/25/34 | United States | 2,510,332 | | 2,509,199 |
| 2004-6, 1A1, FRN, 3.019%, 5/25/34 | United States | 2,335,370 | | 2,318,071 |
| d,f CSMC Trust, 2014-IVR3, A1, 144A, FRN, 3.50%, 7/25/44. | United States | 3,452,236 | | 3,541,729 |
| Discover Card Execution Note Trust, | | | | |
| f 2012-A4, A4, FRN, 0.905%, 11/15/19 | United States | 10,500,000 | | 10,517,636 |
| f 2013-A6, A6, FRN, 0.985%, 4/15/21 | United States | 5,520,000 | | 5,544,153 |
| f 2014-A1, A1, FRN, 0.965%, 7/15/21 | United States | 7,690,000 | | 7,722,819 |
| 2014-A5, A, 1.39%, 4/15/20 | United States | 2,060,000 | | 2,065,349 |
| d,f Dryden 33 Senior Loan Fund, 2014-33A, A, 144A, FRN, 2.36%, 7/15/26 . | United States | 6,535,000 | | 6,532,909 |
| d,f Dryden Senior Loan Fund, 2015-38A, A, 144A, FRN, 2.31%, 7/15/27 | Cayman Islands | 9,642,857 | | 9,646,136 |
| d,f Eaton Vance CDO Ltd., | | | | |
| 2014-1A, A, 144A, FRN, 2.33%, 7/15/26 | United States | 5,266,000 | | 5,266,316 |
| 2014-1A, B, 144A, FRN, 2.93%, 7/15/26 | United States | 858,000 | | 859,055 |
| 2014-1A, C, 144A, FRN, 3.88%, 7/15/26 | United States | 739,600 | | 739,193 |
| d Emerson Park CLO Ltd., 2013-1A, C2, 144A, 5.64%, 7/15/25 | United States | 630,000 | | 636,968 |
| f Fannie Mae Connecticut Avenue Securities, | | | | |
| 2013-C01, M1, FRN, 2.534%, 10/25/23 | United States | 4,519,747 | | 4,560,701 |
| 2014-C02, 2M1, FRN, 1.484%, 5/25/24 | United States | 589,064 | | 589,129 |
| 2015-C02, 2M1, FRN, 1.734%, 5/25/25 | United States | 822,428 | | 823,290 |
| f FHLMC Structured Agency Credit Risk Debt Notes, | | | | |
| 2014-DN3, M2, FRN, 2.934%, 8/25/24 | United States | 1,183,054 | | 1,186,784 |
| 2014-DN4, M2, FRN, 2.934%, 10/25/24 | United States | 3,579,486 | | 3,587,755 |
| 2014-HQ1, M2, FRN, 3.034%, 8/25/24 | United States | 6,833,031 | | 6,898,798 |
| 2014-HQ3, M2, FRN, 3.184%, 10/25/24 | United States | 7,719,583 | | 7,780,900 |
| 2015-DN1, M2, FRN, 2.934%, 1/25/25 | United States | 7,185,724 | | 7,218,368 |
| 2015-DN1, M3, FRN, 4.684%, 1/25/25 | United States | 9,400,000 | | 9,824,938 |
| 2015-DNA1, M2, FRN, 2.384%, 10/25/27 | United States | 10,530,000 | | 10,680,726 |
| 2015-DNA2, M2, FRN, 3.134%, 12/25/27 | United States | 10,445,000 | | 10,588,353 |
| 2015-HQ1, M1, FRN, 1.584%, 3/25/25 | United States | 83,737 | | 83,741 |
| 2015-HQ1, M2, FRN, 2.734%, 3/25/25 | United States | 11,000,000 | | 11,129,870 |
| 2015-HQA1, M2, FRN, 3.184%, 3/25/28 | United States | 12,750,000 | | 12,977,317 |
| 2015-HQA2, M2, FRN, 3.334%, 5/25/28 | United States | 12,520,000 | | 12,843,306 |
| 2016-HQ1, M1, FRN, 2.284%, 9/25/28 | United States | 4,265,942 | | 4,280,132 |
| f First Horizon Alternative Mortgage Securities Trust, 2004-AA5, 2A1, | | | | |
| FRN, 2.485%, 12/25/34. | United States | 1,836,476 | | 1,784,587 |
| d,f Flagship CLO VIII Ltd., 2014-8A, A, 144A, FRN, 2.44%, 1/16/26 | Cayman Islands | 5,545,000 | | 5,563,631 |
| d,f Galaxy CLO Ltd., 2014-17A, AR, 144A, FRN, 2.28%, 7/15/26 | Cayman Islands | 1,710,000 | | 1,711,847 |
| d,f Galaxy XV CLO Ltd., 2013-15A, A, 144A, FRN, 2.13%, 4/15/25 | United States | 10,063,000 | | 10,054,950 |
| d G-Force LLC, 2005-RRA, B, 144A, 5.09%, 8/22/36 | United States | 1,102,733 | | 1,099,673 |
68 Annual Report
franklintempleton.com
FRANKLIN INVESTORS SECURITIES TRUST
STATEMENT OF INVESTMENTS
| | | | |
| Franklin Low Duration Total Return Fund (continued) | | | | |
| | | Principal | | |
| | Country | Amount* | | Value |
| |
| Asset-Backed Securities and Commercial Mortgage- | | | | |
| Backed Securities (continued) | | | | |
| Diversified Financials (continued) | | | | |
| o GMAC Commercial Mortgage Securities Inc. Trust, 2005-C1, B, 4.936%, | | | | |
| 5/10/43 | United States | 1,431,075 | $ | 241,180 |
| f Greenpoint Manufactured Housing, 1999-5, M1A, FRN, 8.30%, 10/15/26 . | United States | 975,703 | | 1,077,942 |
| f GSAA Home Equity Trust, | | | | |
| o 2005-5, M3, FRN, 1.479%, 2/25/35. | United States | 5,950,000 | | 5,717,795 |
| 2005-6, A3, FRN, 0.904%, 6/25/35 | United States | 426,820 | | 424,229 |
| f GSAMP Trust, 2005-HE3, M2, FRN, 1.539%, 6/25/35 | United States | 1,059,792 | | 1,048,291 |
| f GSR Mortgage Loan Trust, 2005-AR1, 1A1, FRN, 3.334%, 1/25/35 | United States | 547,125 | | 523,993 |
| d Highbridge Loan Management Ltd., 2013-2A, B2, 144A, 5.80%, | | | | |
| 10/20/24 | United States | 570,000 | | 579,616 |
| d,f Invitation Homes Trust, | | | | |
| 2014-SFR1, B, 144A, FRN, 2.035%, 6/17/31 | United States | 1,130,000 | | 1,130,796 |
| 2014-SFR2, A, 144A, FRN, 1.645%, 9/17/31 | United States | 4,412,920 | | 4,409,676 |
| 2014-SFR2, B, 144A, FRN, 2.145%, 9/17/31 | United States | 8,500,000 | | 8,507,012 |
| 2015-SFR1, A, 144A, FRN, 1.985%, 3/17/32 | United States | 2,387,374 | | 2,403,653 |
| 2015-SFR2, A, 144A, FRN, 1.881%, 6/17/32 | United States | 7,957,982 | | 7,999,170 |
| 2015-SFR3, A, 144A, FRN, 1.835%, 8/17/32 | United States | 4,293,105 | | 4,314,726 |
| f IXIS Real Estate Capital Trust, 2005-HE4, A3, FRN, 1.214%, 2/25/36 | United States | 502,262 | | 500,718 |
| d,f Jay Park CLO Ltd., 2016-1A, A2, 144A, FRN, 2.611%, 10/20/27 | United States | 17,290,000 | | 17,286,369 |
| d,f Jefferies & Co., 2009-R2, 4A, 144A, FRN, 2.881%, 5/26/37 | United States | 1,216,771 | | 1,222,794 |
| JP Morgan Chase Commercial Mortgage Securities Trust, | | | | |
| 2004-LN2, A2, 5.115%, 7/15/41 | United States | 36,572 | | 36,555 |
| f 2005-LDP5, E, FRN, 5.717%, 12/15/44 | United States | 1,150,000 | | 1,146,576 |
| f 2005-LPD5, F, FRN, 5.717%, 12/15/44 | United States | 7,850,000 | | 7,805,412 |
| 2006-CB17, AM, 5.464%, 12/12/43. | United States | 2,350,000 | | 2,348,115 |
| f JP Morgan Mortgage Trust, 2004-A1, 5A1, FRN, 2.797%, 2/25/34 | United States | 109,194 | | 107,892 |
| d,f,o LB-UBS Commercial Mortgage Trust, 2001-C3, E, 144A, FRN, 6.95%, | | | | |
| 6/15/36 | United States | 700,000 | | 699,528 |
| f Lehman XS Trust, 2005-4, 1A4, FRN, 1.094%, 10/25/35 | United States | 971,357 | | 881,565 |
| d LNR CDO Ltd., | | | | |
| f 2002-1A, DFL, 144A, FRN, 1.924%, 7/24/37 | United States | 671,286 | | 673,112 |
| 2002-1A, DFX, 144A, 6.727%, 7/24/37 | United States | 886,097 | | 887,621 |
| d,f Mach One ULC, | | | | |
| 2004-1A, K, 144A, FRN, 5.45%, 5/28/40 | United States | 4,293,400 | | 4,332,651 |
| 2004-1A, L, 144A, FRN, 5.45%, 5/28/40 | United States | 3,470,500 | | 3,448,150 |
| 2004-1A, M, 144A, FRN, 5.45%, 5/28/40 | United States | 640,000 | | 629,590 |
| f Madison Avenue Manufactured Housing Contract Trust, 2-A, B1, FRN, | | | | |
| 200, 3.784%, 3/25/32 | United States | 1,816,871 | | 1,843,083 |
| f Manufactured Housing Contract Trust Pass Through Certificates, 2001-1, | | | | |
| IIM2, FRN, 1.976%, 4/20/32 | United States | 7,707,993 | | 7,272,046 |
| MASTR Alternative Loan Trust, | | | | |
| 2003-1, 3A1, 5.00%, 2/25/18 | United States | 232,966 | | 235,922 |
| 2003-6, 2A1, 5.00%, 8/25/18 | United States | 652,871 | | 661,083 |
| 2003-9, 1A1, 5.50%, 12/25/18 | United States | 271,062 | | 272,626 |
| f 2004-11, 2A1, FRN, 5.553%, 11/25/19 | United States | 983,173 | | 1,006,702 |
| 2004-4, 5A1, 5.50%, 4/25/19 | United States | 802,157 | | 818,016 |
| f MASTR ARM Trust, 2007-3, 12A2, FRN, 0.734%, 5/25/47 | United States | 250,738 | | 250,573 |
| f Merrill Lynch Mortgage Investors Trust, | | | | |
| 2003-G, A2, FRN, 1.638%, 1/25/29. | United States | 977,966 | | 933,158 |
| 2005-A10, A, FRN, 0.744%, 2/25/36 | United States | 3,751,922 | | 3,457,857 |
franklintempleton.com
Annual Report
69
FRANKLIN INVESTORS SECURITIES TRUST
STATEMENT OF INVESTMENTS
| | | | |
| Franklin Low Duration Total Return Fund (continued) | | | | |
| | | Principal | | |
| | Country | Amount* | | Value |
| |
| Asset-Backed Securities and Commercial Mortgage- | | | | |
| Backed Securities (continued) | | | | |
| Diversified Financials (continued) | | | | |
| f Merrill Lynch Mortgage Investors Trust Inc., 2003-E, A1, FRN, 1.154%, | | | | |
| 10/25/28 | United States | 996,879 | $ | 956,818 |
| f Merrill Lynch Mortgage Trust, 2005-CKI1, D, FRN, 5.525%, 11/12/37 | United States | 2,676,411 | | 2,617,580 |
| f New York Mortgage Trust, 2005-3, M1, FRN, 1.209%, 2/25/36 | United States | 495,008 | | 440,975 |
| f Novastar Home Equity Loan, 2004-4, M4, FRN, 2.184%, 3/25/35 | United States | 1,294,368 | | 1,288,304 |
| d,f NZCG Funding Ltd., 2015-2A, A1, 144A, FRN, 2.436%, 4/27/27 | United States | 8,101,875 | | 8,115,891 |
| d OBP Depositor LLC Trust, 2010-OBP, A, 144A, 4.646%, 7/15/45 | United States | 1,700,000 | | 1,852,161 |
| d,f Octagon Investment Partners XVII Ltd., 2013-1A, A1, 144A, FRN, | | | | |
| 2.212%, 10/25/25 | United States | 7,510,000 | | 7,508,122 |
| d,f Octagon Investment Partners XXIII Ltd., | | | | |
| 2015-1A, A1, 144A, FRN, 2.30%, 7/15/27 | United States | 4,160,328 | | 4,158,997 |
| 2015-1A, A2, 144A, FRN, 2.30%, 7/15/27 | United States | 3,949,678 | | 3,946,755 |
| f Ownit Mortgage Loan Asset-Backed Certificates, 2005-2, M4, FRN, | | | | |
| 1.464%, 3/25/36. | United States | 1,234,548 | | 1,229,507 |
| f Park Place Securities Inc. Asset-Backed Pass-Through Certificates, | | | | |
| 2004-WHQ2, M2, FRN, 1.479%, 2/25/35. | United States | 1,209,616 | | 1,215,226 |
| d,f Progress Residential Trust, 2015-SFR1, A, 144A, FRN, 1.928%, 2/17/32 . | United States | 10,016,059 | | 10,063,391 |
| f RAAC, 2004-SP1, AII, FRN, 1.234%, 3/25/34 | United States | 634,779 | | 605,391 |
| f Residential Funding Mortgage Securities II, 2004-HI3, A5, FRN, 5.48%, | | | | |
| 6/25/34 | United States | 349,990 | | 363,057 |
| d,f Resource Capital Corp. Ltd., | | | | |
| 2014-CRE2, A, 144A, FRN, 1.585%, 4/15/32 | United States | 1,631,176 | | 1,625,012 |
| 2015-CRE4, A, 144A, FRN, 1.935%, 8/15/32 | United States | 1,395,789 | | 1,393,033 |
| d,f Silver Bay Realty Trust, | | | | |
| 2014-1, A, 144A, FRN, 1.525%, 9/17/31 | United States | 1,176,517 | | 1,170,697 |
| 2014-1, B, 144A, FRN, 1.975%, 9/17/31 | United States | 540,000 | | 535,417 |
| f Structured ARM Loan Trust, 2004-12, 3A1, FRN, 3.15%, 9/25/34 | United States | 3,771,132 | | 3,753,912 |
| f Structured Asset Investment Loan Trust, 2004-BNC2, A2, FRN, 1.574%, | | | | |
| 12/25/34 | United States | 1,203,926 | | 1,201,706 |
| f Structured Asset Mortgage Investments II Trust, 2004-AR6, A1A, FRN, | | | | |
| 1.228%, 2/19/35. | United States | 2,082,344 | | 1,952,284 |
| f Structured Asset Mortgage Investments Trust, | | | | |
| 2003-AR1, A1, FRN, 1.268%, 10/19/33 | United States | 415,641 | | 389,563 |
| 2003-AR2, A1, FRN, 1.268%, 12/19/33 | United States | 869,921 | | 838,587 |
| d,f SWAY Residential 2014-1 Trust, 2014-1, A, 144A, FRN, 1.835%, 1/17/32. | United States | 6,213,273 | | 6,224,272 |
| f Thornburg Mortgage Securities Trust, | | | | |
| 2003-4, A1, FRN, 1.174%, 9/25/43 | United States | 2,499,008 | | 2,419,121 |
| 2004-3, A, FRN, 1.274%, 9/25/44 | United States | 1,352,451 | | 1,244,521 |
| 2005-1, A3, FRN, 2.373%, 4/25/45 | United States | 409,637 | | 411,320 |
| d Towd Point Mortgage Trust, 2016-1, A1, 144A, 3.50%, 2/25/55 | United States | 12,002,209 | | 12,438,532 |
| d,f Trade MAPS Ltd., 2013-1A, A, 144A, FRN, 1.23%, 12/10/18 | Ireland | 8,500,000 | | 8,491,755 |
| d,f Treman Park CLO Ltd., 2015-1A, A, 144A, FRN, 2.381%, 4/20/27 | Cayman Islands | 3,300,000 | | 3,314,619 |
| d,f Tricon American Homes Trust, 2015-SFR1, A, 144A, FRN, 1.785%, | | | | |
| 5/17/32 | United States | 7,830,031 | | 7,837,088 |
| Vanderbilt Acquisition Loan Trust, 2002-1, M1, 7.33%, 5/07/32 | United States | 235,446 | | 249,756 |
| d,f Voya CLO Ltd., | | | | |
| 2012-4A, A2R, 144A, FRN, 2.41%, 10/15/28 | Cayman Islands | 7,660,000 | | 7,665,592 |
| 2014-4A, A1, 144A, FRN, 2.381%, 10/14/26 | Cayman Islands | 6,450,000 | | 6,454,837 |
| 2015-1A, A1, 144A, FRN, 2.362%, 4/18/27 | United States | 5,280,000 | | 5,279,789 |
70 Annual Report
franklintempleton.com
FRANKLIN INVESTORS SECURITIES TRUST
STATEMENT OF INVESTMENTS
| | | | |
| Franklin Low Duration Total Return Fund (continued) | | | | |
| | | Principal | | |
| | Country | Amount* | | Value |
| |
| Asset-Backed Securities and Commercial Mortgage- | | | | |
| Backed Securities (continued) | | | | |
| Diversified Financials (continued) | | | | |
| f WaMu Mortgage Pass-Through Certificates, | | | | |
| 2005-AR19, A1A1, FRN, 0.804%, 12/25/45 | United States | 3,881,268 | $ | 3,748,393 |
| 2005-AR8, 1A1A, FRN, 0.824%, 7/25/45 | United States | 1,480,591 | | 1,416,836 |
| f Wells Fargo Mortgage Backed Securities Trust, | | | | |
| 2004-W, A9, FRN, 2.99%, 11/25/34 | United States | 151,471 | | 153,679 |
| 2005-AR10, 2A3, FRN, 2.981%, 6/25/35 | United States | 818,973 | | 817,202 |
| d,f West CLO Ltd., | | | | |
| 2014-1A, A2, 144A, FRN, 2.982%, 7/18/26 | United States | 1,360,000 | | 1,360,150 |
| 2014-1A, B, 144A, FRN, 3.732%, 7/18/26 | United States | 3,590,000 | | 3,555,823 |
| | | | | 623,297,755 |
| Real Estate 0.2% | | | | |
| d,f American Homes 4 Rent, | | | | |
| 2014-SFR1, A, 144A, FRN, 1.535%, 6/17/31 | United States | 2,911,638 | | 2,904,658 |
| 2014-SFR1, C, 144A, FRN, 2.285%, 6/17/31 | United States | 492,000 | | 489,841 |
| | | | | 3,394,499 |
| Total Asset-Backed Securities and Commercial | | | | |
| Mortgage-Backed Securities (Cost $689,792,977) | | | | 690,039,951 |
| |
| Mortgage-Backed Securities 1.7% | | | | |
| f Federal Home Loan Mortgage Corp. (FHLMC) Adjustable Rate 0.2% | | | | |
| FHLMC, 2.81% - 3.086%, 10/01/36 - 6/01/37 | United States | 3,526,261 | | 3,739,206 |
| Federal Home Loan Mortgage Corp. (FHLMC) Fixed Rate 0.0%† | | | | |
| FHLMC Gold 15 Year, 5.00%, 10/01/23 | United States | 167,115 | | 177,664 |
| FHLMC Gold 15 Year, 6.00%, 6/01/23 | United States | 53,294 | | 57,785 |
| FHLMC Gold 30 Year, 5.00%, 1/01/39 | United States | 199,303 | | 220,470 |
| | | | | 455,919 |
| f Federal National Mortgage Association (FNMA) Adjustable Rate | | | | |
| 1.3% | | | | |
| FNMA, 1.60% - 2.942%, 3/01/17 - 10/01/44 | United States | 22,549,940 | | 23,665,143 |
| FNMA, 2.947% - 5.927%, 3/01/17 - 10/01/38 | United States | 9,111,974 | | 9,626,617 |
| | | | | 33,291,760 |
| Federal National Mortgage Association (FNMA) Fixed Rate 0.2% | | | | |
| FNMA 15 Year, 4.00%, 12/01/25 | United States | 2,286,941 | | 2,432,335 |
| FNMA 15 Year, 4.50%, 5/01/23 - 6/01/25 | United States | 1,704,650 | | 1,822,890 |
| FNMA 30 Year, 3.50%, 10/01/25 | United States | 1,476,181 | | 1,555,937 |
| FNMA 30 Year, 5.00%, 3/01/38 | United States | 48,815 | | 54,013 |
| | | | | 5,865,175 |
| f Government National Mortgage Association (GNMA) Adjustable | | | | |
| Rate 0.0%† | | | | |
| GNMA, 1.875% - 2.125%, 4/20/26 - 9/20/26 | United States | 28,786 | | 29,775 |
| Total Mortgage-Backed Securities (Cost $43,041,110) | | | | 43,381,835 |
franklintempleton.com
Annual Report
71
FRANKLIN INVESTORS SECURITIES TRUST
STATEMENT OF INVESTMENTS
| | | | | | |
| | Franklin Low Duration Total Return Fund (continued) | | | | | |
| | | | | Principal | | |
| | | | Country | Amount* | | Value |
| |
| | Municipal Bonds 0.4% | | | | | |
| | Industry Public Facilities Authority Tax Allocation Revenue, | | | | | |
| | Transportation District, Industrial Redevelopment Project No. 2, | | | | | |
| | Refunding, Series B, AGMC Insured, 3.389%, 1/01/20 | | United States | 5,900,000 | $ | 6,261,611 |
| | p Texas State GO, Transportation Commission-Highway Improvement, | | | | | |
| | Series A, 5.00%, 4/01/21. | | United States | 2,685,000 | | 3,122,064 |
| | f University of California Revenue, Series Y-2, Monthly FRN, 1.027%, | | | | | |
| | 7/01/41 | | United States | 390,000 | | 390,039 |
| | Total Municipal Bonds (Cost $9,411,044) | | | | | 9,773,714 |
| |
| |
| | | | | Shares | | |
| |
| | Escrows and Litigation Trusts (Cost $—) 0.0% | | | | | |
| | a,q NewPage Corp., Litigation Trust. | | United States | 500,000 | | — |
| |
| |
| | | | | Notional | | |
| | | | Counterparty | Amount* | | |
| |
| | Options Purchased 0.0%† | | | | | |
| |
| | Puts - Over-the-Counter | | | | | |
| | Credit Default Swaptions 0.0%† | | | | | |
| | Buy protection on CDX.NA.HY.26, Premium Rate 5.00%, Strike Price | | | | | |
| $103.50, Expires 11/16/16. | | CITI | 17,400,000 | | 30,519 |
| | Buy protection on CDX.NA.IG.27, Premium Rate 1.00%, Strike Price $85, | | | | | |
| | Expires 11/16/16 | | JPHQ | 8,700,000 | | 2,245 |
| | Buy protection on CDX.NA.IG.27, Premium Rate 1.00%, Strike Price $90, | | | | | |
| | Expires 11/16/16 | | CITI | 17,400,000 | | 3,028 |
| | Total Options Purchased (Cost $184,614) | | | | | 35,792 |
| | Total Investments before Short Term Investments | | | | | |
| | (Cost $2,417,629,123) | | | | | 2,421,858,870 |
| |
| |
| | | | | Principal | | |
| | | | Country | Amount* | | |
| |
| | Short Term Investments 3.7% | | | | | |
| | Corporate Bonds (Cost $2,914,127) 0.1% | | | | | |
| | AT&T Inc., senior note, 2.40%, 3/15/17 | | United States | 2,900,000 | | 2,915,040 |
| | Total Investments before Money Market Funds | | | | | |
| | (Cost $2,420,543,250) | | | | | 2,424,773,910 |
| |
| |
| | | | | Shares | | |
| | Money Market Funds (Cost $89,753,463) 3.6% | | | | | |
| | a,c Institutional Fiduciary Trust Money Market Portfolio | | United States | 89,753,463 | | 89,753,463 |
| | Total Investments (Cost $2,510,296,713) 99.8% | | | | | 2,514,527,373 |
| | Other Assets, less Liabilities 0.2% | | | | | 6,094,688 |
| | Net Assets 100.0% | | | | $ | 2,520,622,061 |
72 Annual Report
franklintempleton.com
FRANKLIN INVESTORS SECURITIES TRUST
STATEMENT OF INVESTMENTS
Franklin Low Duration Total Return Fund (continued)
†Rounds to less than 0.1% of net assets.
*The principal/notional amount is stated in U.S. dollars unless otherwise indicated.
aNon-income producing.
bSee Note 8 regarding restricted securities.
cSee Note 3(f) regarding investments in affiliated management investment companies.
dSecurity was purchased pursuant to Rule 144A under the Securities Act of 1933 and may be sold in transactions exempt from registration only to qualified institutional buyers
or in a public offering registered under the Securities Act of 1933. These securities have been deemed liquid under guidelines approved by the Trust’s Board of Trustees. At
October 31, 2016, the aggregate value of these securities was $522,655,075, representing 20.7% of net assets.
eSecurity was purchased pursuant to Regulation S under the Securities Act of 1933, which exempts from registration securities offered and sold outside of the United States.
Such a security cannot be sold in the United States without either an effective registration statement filed pursuant to the Securities Act of 1933, or pursuant to an exemption
from registration. These securities have been deemed liquid under guidelines approved by the Trust’s Board of Trustees. At October 31, 2016, the aggregate value of these
securities was $31,575,406, representing 1.3% of net assets.
fThe coupon rate shown represents the rate at period end.
gSee Note 7 regarding defaulted securities.
hAt October 31, 2016, pursuant to the Fund’s policies and the requirements of applicable securities law, the Fund is restricted from trading these securities at year end.
iSee Note 1(i) regarding senior floating rate interests.
jA portion or all of the security purchased on a delayed delivery basis. See Note 1(c).
kPrincipal amount is stated in 100 Mexican Peso Units.
lRedemption price at maturity is adjusted for inflation. See Note 1(k).
mPrincipal amount is stated in 1,000 Brazilian Real Units.
nPrincipal amount of security is adjusted for inflation. See Note 1(k).
oThe bond pays interest and/or principal based upon the issuer’s ability to pay, which may be less than the stated interest rate or principal paydown.
pSecurity purchased on a when-issued basis. See Note 1(c).
qSecurity has been deemed illiquid because it may not be able to be sold within seven days.
franklintempleton.com
Annual Report
73
FRANKLIN INVESTORS SECURITIES TRUST
STATEMENT OF INVESTMENTS
Franklin Low Duration Total Return Fund (continued)
At October 31, 2016, the Fund had the following financial futures contracts outstanding. See Note 1(d).
Financial Futures Contracts
| | | | | | | | | | | | | | |
| | | | Number of | | | Notional | Expiration | | Unrealized | | Unrealized | |
| Description | | Type | Contracts | | | Value | Date | | Appreciation | | Depreciation | |
| Interest Rate Contracts | | | | | | | | | | | | | | |
| Canadian 10 Yr. Bond | | Long | 49 | $ | | 5,281,446 | 12/19/16 | | $ | | — | $ | (60,736 | ) |
| CME Ultra Long Term U.S. Treasury Bond | Short | 15 | | | 2,639,063 | 12/20/16 | | | | 174,334 | | — | |
| U.S. Treasury 2 Yr. Note | | Long | 1,296 | | | 282,710,250 | 12/30/16 | | | | — | | (60,256 | ) |
| U.S. Treasury 5 Yr. Note | | Short | 1,815 | | | 219,246,328 | 12/30/16 | | | | 737,801 | | — | |
| U.S. Treasury 10 Yr. Note | | Short | 111 | | | 14,388,375 | 12/20/16 | | | | 152,331 | | — | |
| U.S. Treasury 30 Yr. Bond | | Short | 3 | | | 488,156 | 12/20/16 | | | | 23,617 | | — | |
| Total Financial Futures Contracts | | | | | | | | $ | 1,088,083 | $ | (120,992 | ) |
| Net unrealized appreciation (depreciation) | | | | | | | | | $ | 967,091 | | | |
| |
| |
| At October 31, 2016, the Fund had the following forward exchange contracts outstanding. See Note 1(d). | | | | | |
| |
| Forward Exchange Contracts | | | | | | | | | | | | | |
| | | | | | | Contract | Settlement | | Unrealized | | Unrealized | |
| Currency | Counterpartya Type | Quantity | | | Amount | Date | | Appreciation | | Depreciation | |
| OTC Forward Exchange Contracts | | | | | | | | | | | | | | |
| Euro | DBAB | Buy | 2,082,500 | | $ | 2,764,519 | 11/03/16 | | $ | | — | $ | (478,390 | ) |
| Euro | DBAB | Sell | 2,082,500 | | | 2,795,756 | 11/03/16 | | | | 509,627 | | — | |
| Australian Dollar | DBAB | Sell | 3,410,144 | | | 2,502,705 | 12/15/16 | | | | — | | (89,224 | ) |
| Euro | DBAB | Buy | 2,250,000 | | | 2,534,850 | 12/15/16 | | | | — | | (60,035 | ) |
| Euro | DBAB | Sell | 18,899,102 | | | 21,234,818 | 12/15/16 | | | | 447,357 | | — | |
| Euro | JPHQ | Sell | 2,600,000 | | | 2,934,100 | 12/15/16 | | | | 74,313 | | — | |
| Euro | MSCO | Sell | 977,590 | | | 1,111,080 | 12/15/16 | | | | 35,811 | | — | |
| Japanese Yen | DBAB | Sell | 1,072,725,000 | | | 10,197,684 | 12/15/16 | | | | — | | (50,014 | ) |
| Japanese Yen | JPHQ | Sell | 227,754,944 | | | 2,162,771 | 12/15/16 | | | | — | | (12,963 | ) |
| Japanese Yen | JPHQ | Sell | 545,000,000 | | | 5,362,247 | 12/15/16 | | | | 155,884 | | — | |
| Malaysian Ringgit | DBAB | Buy | 227,680 | | | 55,397 | 12/15/16 | | | | — | | (1,201 | ) |
| Malaysian Ringgit | HSBK | Buy | 48,000 | | | 11,650 | 12/15/16 | | | | — | | (225 | ) |
| Mexican Peso | JPHQ | Sell | 70,500,000 | | | 3,541,556 | 12/15/16 | | | | — | | (174,901 | ) |
| South Korean Won. | JPHQ | Sell | 4,500,000,000 | | | 3,842,705 | 12/15/16 | | | | — | | (90,904 | ) |
| Japanese Yen | DBAB | Sell | 177,500,000 | | | 1,773,191 | 4/27/17 | | | | 67,472 | | — | |
| Japanese Yen | JPHQ | Sell | 177,500,000 | | | 1,772,634 | 4/27/17 | | | | 66,914 | | — | |
| Australian Dollar | DBAB | Sell | 3,360,000 | | | 2,532,432 | 5/18/17 | | | | — | | (12,588 | ) |
| Australian Dollar | JPHQ | Sell | 11,750,000 | | | 8,908,850 | 5/18/17 | | | | 8,854 | | — | |
| Brazilian Real | JPHQ | Buy | 7,500,000 | | | 2,202,643 | 5/18/17 | | | | 16,326 | | — | |
| Canadian Dollar | JPHQ | Sell | 1,350,000 | | | 1,028,611 | 5/18/17 | | | | 20,720 | | — | |
| Euro | BZWS | Sell | 194,860 | | | 218,055 | 5/18/17 | | | | 2,172 | | — | |
| Euro | CITI | Sell | 391,262 | | | 439,112 | 5/18/17 | | | | 5,638 | | — | |
| Euro | DBAB | Buy | 558,065 | | | 613,425 | 5/18/17 | | | | 4,848 | | — | |
| Euro | DBAB | Sell | 46,977,626 | | | 52,731,446 | 5/18/17 | | | | 685,562 | | — | |
| Euro | GSCO | Sell | 420,000 | | | 471,912 | 5/18/17 | | | | 6,600 | | — | |
| Euro | HSBK | Sell | 6,000 | | | 6,659 | 5/18/17 | | | | 12 | | — | |
| Euro | JPHQ | Sell | 6,167,765 | | | 6,862,323 | 5/18/17 | | | | 29,138 | | — | |
| Hungarian Forint | DBAB | Sell | 900,000,000 | | | 3,220,266 | 5/18/17 | | | | 8,102 | | — | |
| Hungarian Forint | JPHQ | Sell | 430,000,000 | | | 1,547,375 | 5/18/17 | | | | 12,674 | | — | |
| Indian Rupee | DBAB | Buy | 135,900,000 | | | 1,955,396 | 5/18/17 | | | | 26,107 | | — | |
74 Annual Report
franklintempleton.com
FRANKLIN INVESTORS SECURITIES TRUST
STATEMENT OF INVESTMENTS
| | | | | | | | | | | |
| Franklin Low Duration Total Return Fund (continued) | | | | | | | | |
| |
| Forward Exchange Contracts (continued) | | | | | | | | | | |
| |
| | | | | | Contract | Settlement | | Unrealized | | Unrealized | |
| Currency | Counterpartya Type | Quantity | | Amount | Date | | Appreciation | | Depreciation | |
| OTC Forward Exchange Contracts (continued) | | | | | | | | | | |
| Indian Rupee | JPHQ | Buy | 78,000,000 | $ | 1,130,435 | 5/18/17 | $ | 6,851 | $ | — | |
| Indonesian Rupiah. | JPHQ | Buy | 41,430,000,000 | | 3,058,693 | 5/18/17 | | 23,386 | | — | |
| Japanese Yen | JPHQ | Sell | 863,000,000 | | 8,605,354 | 5/18/17 | | 303,824 | | — | |
| Philippine Peso | JPHQ | Buy | 94,860,000 | | 1,925,309 | 5/18/17 | | 10,937 | | — | |
| Total Forward Exchange Contracts | | | | | | | $ | 2,529,129 | $ | (970,445 | ) |
| Net unrealized appreciation (depreciation) | | | | | | $ | 1,558,684 | | | |
| | | | | | | | | | | | | | | | | | | | |
| aMay be comprised of multiple contracts with the same counterparty, currency and settlement date. | | | | | | | | | | | |
| |
| |
| At October 31, 2016, the Fund had the following credit default swap contracts outstanding. See Note 1(d). | | | | | |
| |
| Credit Default Swap Contracts | | | | | | | | | | | | | | | | | |
| | | | | | | | | Unamortized | | | | | | | | | | | |
| | Periodic | | Counter- | | | | | | Upfront | | | | | | | | | | | |
| | Payment | | party/ | Notional | | Expiration | | | Payments | | | Unrealized | | Unrealized | | | | | |
| Description | Rate | | Exchange | Amounta | | Date | | | (Receipts) | | Appreciation | | Depreciation | | | Value | | Ratingb |
| Centrally Cleared Swap Contracts | | | | | | | | | | | | | | | | | | | |
| Contracts to Sell Protectionc | | | | | | | | | | | | | | | | | | | |
| Traded Index | | | | | | | | | | | | | | | | | | | | |
| CDX.NA.IG.26 | 1.00 | % | ICE | 31,500,000 | | 6/20/21 | | $ | 336,764 | | $ | 98,003 | | $ | – | | $ | 434,767 | | Investment |
| | | | | | | | | | | | | | | | | | | | | Grade |
| ITRX.EUR.25 | 1.00 | % | ICE | 11,100,000 | EUR | 6/20/21 | | | 113,951 | | | 86,502 | | | – | | | 200,453 | | Investment |
| | | | | | | | | | | | | | | | | | | | | Grade |
| ITRX.EUR.SN- | | | | | | | | | | | | | | | | | | | | |
| RFIN.26 | 1.00 | % | ICE | 16,350,000 | EUR | 12/20/21 | | | (14,625 | ) | | 61,531 | | | – | | | 46,906 | | Investment |
| | | | | | | | | | | | | | | | | | | | | Grade |
| TotalCentrallyClearedSwapContracts | | | | | $ | 436,090 | | $ | 246,036 | | $ | – | | $ | 682,126 | | |
| OTC Swap Contracts | | | | | | | | | | | | | | | | | | | | |
| Contracts to Buy Protection | | | | | | | | | | | | | | | | | | | |
| Single Name | | | | | | | | | | | | | | | | | | | | |
| TheAESCorp | 5.00 | % | JPHQ | 9,950,000 | | 6/20/21 | $ | (1,068,068 | ) | $ | – | $ | (284,089 | ) | $ | (1,352,157 | ) | |
| Avon Products Inc | 5.00 | % | GSCO | 10,000,000 | | 3/20/20 | | | 1,019,549 | | | – | | (1,792,564 | ) | | (773,015 | ) | |
| Bank of America | | | | | | | | | | | | | | | | | | | | |
| Corp | 1.00 | % | FBCO | 2,000,000 | | 9/20/17 | | | 851 | | | – | | (16,183 | ) | | (15,332 | ) | |
| Beazer Homes | | | | | | | | | | | | | | | | | | | | |
| USAInc | 5.00 | % | CITI | 1,500,000 | | 6/20/19 | | | (48,355 | ) | | – | | (60,991 | ) | | (109,346 | ) | |
| Beazer Homes | | | | | | | | | | | | | | | | | | | | |
| USAInc | 5.00 | % | GSCO | 3,000,000 | | 6/20/19 | | | (93,153 | ) | | – | | (125,540 | ) | | (218,693 | ) | |
| Constellation | | | | | | | | | | | | | | | | | | | | |
| BrandsInc | 5.00 | % | DBAB | 6,600,000 | | 6/20/17 | | | (151,966 | ) | | – | | (92,246 | ) | | (244,212 | ) | |
| CSC Holdings LLC | 5.00 | % | GSCO | 3,500,000 | | 9/20/18 | | | (135,981 | ) | | – | | (141,290 | ) | | (277,271 | ) | |
| CSC Holdings LLC | 5.00 | % | GSCO | 3,000,000 | | 3/20/19 | | | (85,197 | ) | | – | | (179,318 | ) | | (264,515 | ) | |
| DPLInc | 5.00 | % | JPHQ | 471,000 | | 12/20/16 | | | (2,455 | ) | | – | | (3,165 | ) | | (5,620 | ) | |
| Hospitality Properties | | | | | | | | | | | | | | | | | | | | |
| Trust | 5.00 | % | BOFA | 3,000,000 | | 3/20/17 | | | (44,436 | ) | | – | | (27,329 | ) | | (71,765 | ) | |
franklintempleton.com
Annual Report
75
FRANKLIN INVESTORS SECURITIES TRUST
STATEMENT OF INVESTMENTS
| | | | | | | | | | | | | | | | | | |
| Franklin Low Duration Total Return Fund (continued) | | | | | | | | | | | | |
| |
| Credit Default Swap Contracts (continued) | | | | | | | | | | | | | | |
| |
| | | | | | | | | Unamortized | | | | | | | | | | |
| | Periodic | | Counter- | | | | | Upfront | | | | | | | | | | |
| | Payment | | party/ | Notional | | Expiration | | Payments | | | Unrealized | | Unrealized | | | | | |
| Description | Rate | | Exchange | Amounta | | Date | | (Receipts) | | | Appreciation | | Depreciation | | | Value | | Ratingb |
| OTC Swap Contracts (continued) | | | | | | | | | | | | | | | | | |
| Contracts to Buy Protection (continued) | | | | | | | | | | | | | | | |
| Single Name (continued) | | | | | | | | | | | | | | | | | |
| International Lease | | | | | | | | | | | | | | | | | | |
| Finance Corp | 5.00 | % | GSCO | 8,000,000 | | 3/20/17 | $ | (113,578 | ) | $ | – | $ | (74,447 | ) | $ | (188,025 | ) | |
| Kinder Morgan Energy | | | | | | | | | | | | | | | | | | |
| Partners LP | 5.00 | % | CITI | 3,400,000 | | 3/20/18 | | (175,934 | ) | | – | | (66,343 | ) | | (242,277 | ) | |
| LennarCorp | 5.00 | % | CITI | 2,700,000 | | 12/20/19 | | (213,905 | ) | | – | | (109,758 | ) | | (323,663 | ) | |
| LennarCorp | 5.00 | % | GSCO | 3,200,000 | | 12/20/20 | | (268,181 | ) | | – | | (167,798 | ) | | (435,979 | ) | |
| The New York Times | | | | | | | | | | | | | | | | | | |
| Co | 5.00 | % | GSCO | 2,000,000 | | 12/20/16 | | (4,734 | ) | | – | | (18,770 | ) | | (23,504 | ) | |
| OlinCorp | 1.00 | % | CITI | 1,430,000 | | 6/20/21 | | 103,607 | | | – | | (19,734 | ) | | 83,873 | | |
| OlinCorp | 1.00 | % | GSCO | 3,570,000 | | 6/20/21 | | 265,958 | | | – | | (56,087 | ) | | 209,871 | | |
| Owens-Illinois Inc | 5.00 | % | CITI | 7,400,000 | | 6/20/18 | | (469,688 | ) | | – | | (154,000 | ) | | (623,688 | ) | |
| PactivLLC | 5.00 | % | BZWS | 2,100,000 | | 6/20/17 | | (31,765 | ) | | – | | (42,925 | ) | | (74,690 | ) | |
| PHHCorp | 5.00 | % | GSCO | 1,800,000 | | 9/20/19 | | 13,394 | | | – | | (80,076 | ) | | (66,682 | ) | |
| RiteAidCorp | 5.00 | % | JPHQ | 6,300,000 | | 12/20/20 | | (938,916 | ) | | 15,484 | | – | | | (923,432 | ) | |
| SanminaCorp | 5.00 | % | GSCO | 6,500,000 | | 6/20/19 | | (753,355 | ) | | – | | (36,817 | ) | | (790,172 | ) | |
| Tenet Healthcare | | | | | | | | | | | | | | | | | | |
| Corp | 5.00 | % | BZWS | 4,000,000 | | 12/20/16 | | (16,568 | ) | | – | | (29,509 | ) | | (46,077 | ) | |
| Tenet Healthcare | | | | | | | | | | | | | | | | | | |
| Corp | 5.00 | % | DBAB | 3,000,000 | | 3/20/19 | | (187,366 | ) | | 36,588 | | – | | | (150,778 | ) | |
| Tenet Healthcare | | | | | | | | | | | | | | | | | | |
| Corp | 5.00 | % | GSCO | 9,100,000 | | 3/20/19 | | (620,097 | ) | | 162,736 | | – | | | (457,361 | ) | |
| Toys R Us Inc | 5.00 | % | CITI | 2,000,000 | | 12/20/18 | | 287,585 | | | – | | (228,974 | ) | | 58,611 | | |
| Toys R Us Inc | 5.00 | % | DBAB | 2,250,000 | | 12/20/18 | | 354,503 | | | – | | (288,565 | ) | | 65,938 | | |
| Toys R Us Inc | 5.00 | % | GSCO | 4,000,000 | | 12/20/18 | | 866,280 | | | – | | (749,058 | ) | | 117,222 | | |
| Transocean Inc | 5.00 | % | MSCO | 7,000,000 | | 6/20/18 | | (139,094 | ) | | – | | (156,382 | ) | | (295,476 | ) | |
| XPOCNWInc | 5.00 | % | JPHQ | 3,275,000 | | 3/20/18 | | (109,457 | ) | | – | | (13,578 | ) | | (123,035 | ) | |
| Contracts to Sell Protectionc | | | | | | | | | | | | | | | | | |
| Single Name | | | | | | | | | | | | | | | | | | |
| American Tower | | | | | | | | | | | | | | | | | | |
| Corp | 1.00 | % | GSCO | 6,500,000 | | 3/20/21 | | (106,732 | ) | | 3,460 | | – | | | (103,272 | ) | BBB- |
| Bank of America | | | | | | | | | | | | | | | | | | |
| Corp | 1.00 | % | FBCO | 2,000,000 | | 9/20/17 | | (851 | ) | | 16,183 | | – | | | 15,332 | | BBB+ |
| Beazer Homes | | | | | | | | | | | | | | | | | | |
| USAInc | 5.00 | % | CITI | 2,700,000 | | 12/20/19 | | 48,267 | | | 131,150 | | – | | | 179,417 | | B- |
| Beazer Homes | | | | | | | | | | | | | | | | | | |
| USAInc | 5.00 | % | GSCO | 3,200,000 | | 12/20/20 | | (308,402 | ) | | 429,480 | | – | | | 121,078 | | B- |
| dCalpineCorp | 5.00 | % | JPHQ | 9,950,000 | | 6/20/21 | | 543,716 | | | 149,763 | | – | | | 693,479 | | B |
| Electricite de France | | | | | | | | | | | | | | | | | | |
| SA | 1.00 | % | BZWS | 5,300,000 | EUR | 9/20/20 | | 105,937 | | | – | | (3,530 | ) | | 102,407 | | A- |
| EngieSA | 1.00 | % | BZWS | 4,300,000 | EUR | 9/20/20 | | 106,149 | | | 20,705 | | – | | | 126,854 | | A- |
| Enterprise Products | | | | | | | | | | | | | | | | | | |
| Operating LLC | 1.00 | % | MSCO | 3,500,000 | | 12/20/19 | | (15,880 | ) | | 33,385 | | – | | | 17,505 | | BBB+ |
76 Annual Report
franklintempleton.com
FRANKLIN INVESTORS SECURITIES TRUST
STATEMENT OF INVESTMENTS
| | | | | | | | | | | | | | | | | | |
| Franklin Low Duration Total Return Fund (continued) | | | | | | | | | | | | |
| |
| Credit Default Swap Contracts (continued) | | | | | | | | | | | | | | |
| |
| | | | | | | | | Unamortized | | | | | | | | | | |
| | Periodic | | Counter- | | | | | Upfront | | | | | | | | | | |
| | Payment | | party/ | Notional | | Expiration | | Payments | | | Unrealized | | Unrealized | | | | | |
| Description | Rate | | Exchange | Amounta | | Date | | (Receipts) | | | Appreciation | | Depreciation | | | Value | | Ratingb |
| OTC Swap Contracts (continued) | | | | | | | | | | | | | | | | | |
| Contracts to Sell Protectionc (continued) | | | | | | | | | | | | | | | |
| Single Name (continued) | | | | | | | | | | | | | | | | | |
| Government of | | | | | | | | | | | | | | | | | | |
| Mexico | 1.00 | % | CITI | 2,500,000 | | 6/20/20 | $ | (21,752 | ) | $ | 13,011 | | $ – | | $ | (8,741 | ) | BBB+ |
| iHeartCommunica- | | | | | | | | | | | | | | | | | | |
| tionsInc | 5.00 | % | BZWS | 2,400,000 | | 6/20/18 | | (278,153 | ) | | – | | (499,358 | ) | | (777,511 | ) | CC |
| OrangeSA | 1.00 | % | CITI | 5,300,000 | EUR | 9/20/20 | | 85,741 | | | 52,111 | | – | | | 137,852 | | BBB+ |
| Tenet Healthcare | | | | | | | | | | | | | | | | | | |
| Corp | 5.00 | % | BZWS | 4,000,000 | | 12/20/18 | | 114,608 | | | 106,632 | | – | | | 221,240 | | CCC+ |
| Traded Index | | | | | | | | | | | | | | | | | | |
| MCDX.NA.27 | 1.00 | % | CITI | 6,500,000 | | 12/20/21 | | 66,703 | | | – | | (19,939 | ) | | 46,764 | | Investment |
| | | | | | | | | | | | | | | | | | | Grade |
| TotalOTCSwapContracts | | | | | | $ | (2,421,171 | ) | $ | 1,170,688 | $ | (5,538,363 | ) | $ | (6,788,846 | ) | |
| TotalCreditDefaultSwapContracts | | | | $ | (1,985,081 | ) | $ | 1,416,724 | $ | (5,538,363 | ) | $ | (6,106,720 | ) | |
| Netunrealizedappreciation(depreciation) | | | | | | | | | $ | (4,121,639 | ) | | | | |
aIn U.S. dollars unless otherwise indicated. For contracts to sell protection, the notional amount is equal to the maximum potential amount of the future payments and no
recourse provisions have been entered into in association with the contracts.
bBased on Standard and Poor’s (S&P) Rating for single name swaps and internal ratings for index swaps. Internal ratings based on mapping into equivalent ratings from
external vendors.
cThe Fund enters contracts to sell protection to create a long credit position. Performance triggers include default, bankruptcy or restructuring for single name swaps, and
failure to pay or bankruptcy of the underlying securities for traded index swaps.
dAt October 31, 2016, pursuant to the Fund’s policies and the requirements of applicable securities law, the Fund is restricted from trading these contracts at year end.
| | | | | | | | |
| At October 31, 2016, the Fund had the following cross-currency swap contracts outstanding. See Note 1(d). | | | | |
| |
| Cross Currency Swap Contracts | | | | | | | | |
| | | Notional | | Expiration | | Unrealized | | Unrealized |
| Description | Counterparty | Amount | | Date | | Appreciation | | Depreciation |
| OTC Swap Contracts | | | | | | | | |
| Receive Floating Quarterly 3-month USD BBA LIBOR + 2.18% | CITI | 3,922,448 | USD | 10/13/17 | $ | 353,537 | $ | — |
| Pay Fixed Annual 2.125% | | 3,500,000 | CHF | | | | | |
| Receive Floating Quarterly 3-month USD BBA LIBOR + 3.29% | JPHQ | 1,562,500 | USD | 10/13/17 | | 53,247 | | — |
| Pay Fixed Annual 2.125% | | 1,500,000 | CHF | | | | | |
| Receive Fixed Semi-Annual 2.393% | JPHQ | 7,916,500 | USD | 4/09/20 | | 122,532 | | — |
| Pay Fixed Annual 0.50%. | | 7,100,000 | EUR | | | | | |
| Net unrealized appreciation (depreciation) | | | | | $ | 529,316 | | |
franklintempleton.com
Annual Report
77
FRANKLIN INVESTORS SECURITIES TRUST
STATEMENT OF INVESTMENTS
| | | | | | | | | | |
| Franklin Low Duration Total Return Fund (continued) | | | | | | | |
| |
| At October 31, 2016, the Fund had the following interest rate swap contracts outstanding. See Note 1(d). | | | | |
| |
| Interest Rate Swap Contracts | | | | | | | | | | |
| | | | | | | Unamortized | | | | |
| | | | | | | Upfront | | | | |
| | | | Notional | Expiration | | Payments/ Unrealized | Unrealized | | | |
| Description | Exchange | | Amount | Date | | (Receipts) Appreciation | Depreciation | | Value | |
| |
| Centrally Cleared Swap Contract | | | | | | | | | | |
| Receive Floating rate 3-month USD BBA | | | | | | | | | | |
| LIBOR + 0.661% | | | | | | | | | | |
| Pay Fixed Semi-Annual 1.75%. | LCH | $ | 38,280,000 | 3/15/24 | $ | (847,227) $347,110 | $— | $ | (500,117 | ) |
See Notes 6 and 10 regarding investment transactions and other derivative information, respectively.
See Abbreviations on page 140.
78 Annual Report | The accompanying notes are an integral part of these financial statements.
franklintempleton.com
| | | | | | | | | | | | | | | |
| | | | | | FRANKLIN INVESTORS SECURITIES TRUST | |
| |
| |
| |
| Consolidated Financial Highlights | | | | | | | | | | | | | | | |
| Franklin Total Return Fund | | | | | | | | | | | | | | | |
| | | | | | Year Ended October 31, | | | | |
| | | 2016 | | | 2015 | | | 2014 | | | 2013 | | | 2012 | |
| Class A | | | | | | | | | | | | | | | |
| Per share operating performance | | | | | | | | | | | | | | | |
| (for a share outstanding throughout the year) | | | | | | | | | | | | | | | |
| Net asset value, beginning of year | $ | 9.87 | | $ | 10.18 | | $ | 10.05 | | $ | 10.53 | | $ | 10.32 | |
| Income from investment operationsa: | | | | | | | | | | | | | | | |
| Net investment income | | 0.231 | | | 0.217 | | | 0.257 | | | 0.236 | | | 0.297 | |
| Net realized and unrealized gains (losses) | | 0.107 | | | (0.220 | ) | | 0.214 | | | (0.205 | ) | | 0.472 | |
| Total from investment operations | | 0.338 | | | (0.003 | ) | | 0.471 | | | 0.031 | | | 0.769 | |
| Less distributions from: | | | | | | | | | | | | | | | |
| Net investment income and net foreign currency gains | | (0.278 | ) | | (0.307 | ) | | (0.341 | ) | | (0.351 | ) | | (0.447 | ) |
| Net realized gains | | — | | | — | | | — | | | (0.160 | ) | | (0.112 | ) |
| Total distributions | | (0.278 | ) | | (0.307 | ) | | (0.341 | ) | | (0.511 | ) | | (0.559 | ) |
| Net asset value, end of year. | $ | 9.93 | | $ | 9.87 | | $ | 10.18 | | $ | 10.05 | | $ | 10.53 | |
| |
| Total returnb | | 3.53 | % | | (0.05 | )% | | 4.80 | % | | 0.30 | % | | 7.74 | % |
| |
| Ratios to average net assets | | | | | | | | | | | | | | | |
| Expenses before waiver and payments by affiliates | | 0.90 | % | | 0.91 | % | | 0.93 | % | | 0.91 | % | | 0.92 | % |
| Expenses net of waiver and payments by affiliates | | 0.85 | %c | | 0.87 | %c | | 0.88 | %c | | 0.88 | %c | | 0.88 | % |
| Net investment income | | 2.32 | % | | 2.08 | % | | 2.46 | % | | 2.36 | % | | 2.69 | % |
| |
| Supplemental data | | | | | | | | | | | | | | | |
| Net assets, end of year (000’s) | $ | 3,623,035 | | $ | 3,527,479 | | $ | 3,213,446 | | $ | 3,019,228 | | $ | 3,134,211 | |
| Portfolio turnover rate | | 287.38 | % | | 294.80 | % | | 273.96 | % | | 371.54 | % | | 314.62 | % |
| Portfolio turnover rate excluding mortgage dollar rollsd | | 146.15 | % | | 95.06 | % | | 85.03 | % | | 156.49 | % | | 122.04 | % |
aThe amount shown for a share outstanding throughout the period may not correlate with the Consolidated Statement of Operations for the period due to the timing of sales
and repurchases of the Fund’s shares in relation to income earned and/or fluctuating fair value of the investments of the Fund.
bTotal return does not reflect sales commissions or contingent deferred sales charges, if applicable.
cBenefit of expense reduction rounds to less than 0.01%.
dSee Note 1(h) regarding mortgage dollar rolls.
franklintempleton.com
The accompanying notes are an integral part of these financial statements. | Annual Report 79
| | | | | | | | | | | | | | | |
| FRANKLIN INVESTORS SECURITIES TRUST | | | | | | | | | | | | | | | |
| CONSOLIDATED FINANCIAL HIGHLIGHTS | | | | | | | | | | | | | | | |
| |
| |
| Franklin Total Return Fund (continued) | | | | | | | | | | | | | | | |
| | | | | | Year Ended October 31, | | | | |
| | | 2016 | | | 2015 | | | 2014 | | | 2013 | | | 2012 | |
| Class C | | | | | | | | | | | | | | | |
| Per share operating performance | | | | | | | | | | | | | | | |
| (for a share outstanding throughout the year) | | | | | | | | | | | | | | | |
| Net asset value, beginning of year | $ | 9.84 | | $ | 10.16 | | $ | 10.03 | | $ | 10.51 | | $ | 10.31 | |
| Income from investment operationsa: | | | | | | | | | | | | | | | |
| Net investment income | | 0.189 | | | 0.172 | | | 0.201 | | | 0.174 | | | 0.253 | |
| Net realized and unrealized gains (losses) | | 0.100 | | | (0.214 | ) | | 0.232 | | | (0.182 | ) | | 0.467 | |
| Total from investment operations | | 0.289 | | | (0.042 | ) | | 0.433 | | | (0.008 | ) | | 0.720 | |
| Less distributions from: | | | | | | | | | | | | | | | |
| Net investment income and net foreign currency gains | | (0.259 | ) | | (0.278 | ) | | (0.303 | ) | | (0.312 | ) | | (0.408 | ) |
| Net realized gains | | — | | | — | | | — | | | (0.160 | ) | | (0.112 | ) |
| Total distributions | | (0.259 | ) | | (0.278 | ) | | (0.303 | ) | | (0.472 | ) | | (0.520 | ) |
| Net asset value, end of year. | $ | 9.87 | | $ | 9.84 | | $ | 10.16 | | $ | 10.03 | | $ | 10.51 | |
| |
| Total returnb | | 3.13 | % | | (0.43 | )% | | 4.42 | % | | (0.08 | )% | | 7.25 | % |
| |
| Ratios to average net assets | | | | | | | | | | | | | | | |
| Expenses before waiver and payments by affiliates | | 1.30 | % | | 1.31 | % | | 1.33 | % | | 1.31 | % | | 1.32 | % |
| Expenses net of waiver and payments by affiliates | | 1.25 | %c | | 1.27 | %c | | 1.28 | %c | | 1.28 | %c | | 1.28 | % |
| Net investment income | | 1.92 | % | | 1.68 | % | | 2.06 | % | | 1.96 | % | | 2.29 | % |
| |
| Supplemental data | | | | | | | | | | | | | | | |
| Net assets, end of year (000’s) | $ | 449,274 | | $ | 444,253 | | $ | 432,767 | | $ | 455,720 | | $ | 571,206 | |
| Portfolio turnover rate | | 287.38 | % | | 294.80 | % | | 273.96 | % | | 371.54 | % | | 314.62 | % |
| Portfolio turnover rate excluding mortgage dollar rollsd | | 146.15 | % | | 95.06 | % | | 85.03 | % | | 156.49 | % | | 122.04 | % |
aThe amount shown for a share outstanding throughout the period may not correlate with the Consolidated Statement of Operations for the period due to the timing of sales
and repurchases of the Fund’s shares in relation to income earned and/or fluctuating fair value of the investments of the Fund.
bTotal return does not reflect sales commissions or contingent deferred sales charges, if applicable.
cBenefit of expense reduction rounds to less than 0.01%.
dSee Note 1(h) regarding mortgage dollar rolls.
80 Annual Report | The accompanying notes are an integral part of these financial statements.
franklintempleton.com
| | | | | | | | | | | | | | | |
| | | | | | FRANKLIN INVESTORS SECURITIES TRUST | |
| | | | | | CONSOLIDATED FINANCIAL HIGHLIGHTS | |
| |
| |
| Franklin Total Return Fund (continued) | | | | | | | | | | | | | | | |
| | | | | | Year Ended October 31, | | | | |
| | | 2016 | | | 2015 | | | 2014 | | | 2013 | | | 2012 | |
| Class R | | | | | | | | | | | | | | | |
| Per share operating performance | | | | | | | | | | | | | | | |
| (for a share outstanding throughout the year) | | | | | | | | | | | | | | | |
| Net asset value, beginning of year | $ | 9.85 | | $ | 10.17 | | $ | 10.04 | | $ | 10.52 | | $ | 10.32 | |
| Income from investment operationsa: | | | | | | | | | | | | | | | |
| Net investment income | | 0.199 | | | 0.198 | | | 0.209 | | | 0.204 | | | 0.255 | |
| Net realized and unrealized gains (losses) | | 0.117 | | | (0.229 | ) | | 0.238 | | | (0.197 | ) | | 0.480 | |
| Total from investment operations | | 0.316 | | | (0.031 | ) | | 0.447 | | | 0.007 | | | 0.735 | |
| Less distributions from: | | | | | | | | | | | | | | | |
| Net investment income and net foreign currency gains | | (0.266 | ) | | (0.289 | ) | | (0.317 | ) | | (0.327 | ) | | (0.423 | ) |
| Net realized gains | | — | | | — | | | — | | | (0.160 | ) | | (0.112 | ) |
| Total distributions | | (0.266 | ) | | (0.289 | ) | | (0.317 | ) | | (0.487 | ) | | (0.535 | ) |
| Net asset value, end of year. | $ | 9.90 | | $ | 9.85 | | $ | 10.17 | | $ | 10.04 | | $ | 10.52 | |
| |
| Total return | | 3.31 | % | | (0.32 | )% | | 4.56 | % | | 0.06 | % | | 7.39 | % |
| |
| Ratios to average net assets | | | | | | | | | | | | | | | |
| Expenses before waiver and payments by affiliates | | 1.15 | % | | 1.16 | % | | 1.18 | % | | 1.16 | % | | 1.17 | % |
| Expenses net of waiver and payments by affiliates | | 1.10 | %b | | 1.12 | %b | | 1.13 | %b | | 1.13 | %b | | 1.13 | % |
| Net investment income | | 2.07 | % | | 1.83 | % | | 2.21 | % | | 2.11 | % | | 2.44 | % |
| |
| Supplemental data | | | | | | | | | | | | | | | |
| Net assets, end of year (000’s) | $ | 58,715 | | $ | 70,506 | | $ | 59,307 | | $ | 65,601 | | $ | 87,235 | |
| Portfolio turnover rate | | 287.38 | % | | 294.80 | % | | 273.96 | % | | 371.54 | % | | 314.62 | % |
| Portfolio turnover rate excluding mortgage dollar rollsc | | 146.15 | % | | 95.06 | % | | 85.03 | % | | 156.49 | % | | 122.04 | % |
aThe amount shown for a share outstanding throughout the period may not correlate with the Consolidated Statement of Operations for the period due to the timing of sales
and repurchases of the Fund’s shares in relation to income earned and/or fluctuating fair value of the investments of the Fund.
bBenefit of expense reduction rounds to less than 0.01%.
cSee Note 1(h) regarding mortgage dollar rolls.
franklintempleton.com
The accompanying notes are an integral part of these financial statements. | Annual Report 81
| | | | | | | | | | | | |
| FRANKLIN INVESTORS SECURITIES TRUST | | | | | | | | | | | | |
| CONSOLIDATED FINANCIAL HIGHLIGHTS | | | | | | | | | | | | |
| |
| |
| Franklin Total Return Fund (continued) | | | | | | | | | | | | |
| | | | | | Year Ended October 31, | | | | |
| | | 2016 | | | 2015 | | | 2014 | | | 2013 | a |
| Class R6 | | | | | | | | | | | | |
| Per share operating performance | | | | | | | | | | | | |
| (for a share outstanding throughout the year) | | | | | | | | | | | | |
| Net asset value, beginning of year | $ | 9.91 | | $ | 10.20 | | $ | 10.07 | | $ | 10.44 | |
| Income from investment operationsb: | | | | | | | | | | | | |
| Net investment income. | | 0.195 | | | 0.255 | c | | 0.317 | c | | 0.145 | |
| Net realized and unrealized gains (losses) | | 0.173 | | | (0.209 | ) | | 0.191 | | | (0.348 | ) |
| Total from investment operations | | 0.368 | | | 0.046 | | | 0.508 | | | (0.203 | ) |
| Less distributions from net investment income and net foreign currency gains | | (0.298 | ) | | (0.336 | ) | | (0.378 | ) | | (0.167 | ) |
| Net asset value, end of year | $ | 9.98 | | $ | 9.91 | | $ | 10.20 | | $ | 10.07 | |
| |
| Total returnd | | 3.94 | % | | 0.44 | % | | 5.18 | % | | (1.92 | )% |
| |
| Ratios to average net assetse | | | | | | | | | | | | |
| Expenses before waiver and payments by affiliates | | 0.51 | % | | 0.50 | % | | 0.50 | % | | 0.50 | % |
| Expenses net of waiver and payments by affiliatesf | | 0.46 | % | | 0.46 | % | | 0.48 | % | | 0.49 | % |
| Net investment income | | 2.71 | % | | 2.49 | % | | 2.86 | % | | 2.75 | % |
| |
| Supplemental data | | | | | | | | | | | | |
| Net assets, end of year (000’s) | $ | 93,892 | | $ | 68,848 | | $ | 26,123 | | $ | 329,806 | |
| Portfolio turnover rate | | 287.38 | % | | 294.80 | % | | 273.96 | % | | 371.54 | % |
| Portfolio turnover rate excluding mortgage dollar rollsg | | 146.15 | % | | 95.06 | % | | 85.03 | % | | 156.49 | % |
aFor the period May 1, 2013 (effective date) to October 31, 2013.
bThe amount shown for a share outstanding throughout the period may not correlate with the Consolidated Statement of Operations for the period due to the timing of sales
and repurchases of the Fund’s shares in relation to income earned and/or fluctuating fair value of the investments of the Fund.
cBased on average daily shares outstanding.
dTotal return is not annualized for periods less than one year.
eRatios are annualized for periods less than one year.
fBenefit of expense reduction rounds to less than 0.01%.
gSee Note 1(h) regarding mortgage dollar rolls.
82 Annual Report | The accompanying notes are an integral part of these financial statements.
franklintempleton.com
| | | | | | | | | | | | | | | |
| | | | | | FRANKLIN INVESTORS SECURITIES TRUST | |
| | | | | | CONSOLIDATED FINANCIAL HIGHLIGHTS | |
| |
| |
| Franklin Total Return Fund (continued) | | | | | | | | | | | | | | | |
| | | | | | Year Ended October 31, | | | | |
| | | 2016 | | | 2015 | | | 2014 | | | 2013 | | | 2012 | |
| Advisor Class | | | | | | | | | | | | | | | |
| Per share operating performance | | | | | | | | | | | | | | | |
| (for a share outstanding throughout the year) | | | | | | | | | | | | | | | |
| Net asset value, beginning of year | $ | 9.91 | | $ | 10.20 | | $ | 10.07 | | $ | 10.55 | | $ | 10.34 | |
| Income from investment operationsa: | | | | | | | | | | | | | | | |
| Net investment income | | 0.218 | | | 0.127 | | | 0.288 | | | 0.242 | | | 0.319 | |
| Net realized and unrealized gains (losses) | | 0.142 | | | (0.092 | ) | | 0.206 | | | (0.186 | ) | | 0.474 | |
| Total from investment operations | | 0.360 | | | 0.035 | | | 0.494 | | | 0.056 | | | 0.793 | |
| Less distributions from: | | | | | | | | | | | | | | | |
| Net investment income and net foreign currency gains | | (0.290 | ) | | (0.325 | ) | | (0.364 | ) | | (0.376 | ) | | (0.471 | ) |
| Net realized gains | | — | | | — | | | — | | | (0.160 | ) | | (0.112 | ) |
| Total distributions | | (0.290 | ) | | (0.325 | ) | | (0.364 | ) | | (0.536 | ) | | (0.583 | ) |
| Net asset value, end of year. | $ | 9.98 | | $ | 9.91 | | $ | 10.20 | | $ | 10.07 | | $ | 10.55 | |
| |
| Total return | | 3.75 | % | | 0.33 | % | | 5.03 | % | | 0.54 | % | | 7.98 | % |
| |
| Ratios to average net assets | | | | | | | | | | | | | | | |
| Expenses before waiver and payments by affiliates | | 0.65 | % | | 0.66 | % | | 0.68 | % | | 0.66 | % | | 0.67 | % |
| Expenses net of waiver and payments by affiliates | | 0.60 | %b | | 0.62 | %b | | 0.63 | %b | | 0.63 | %b | | 0.63 | % |
| Net investment income | | 2.57 | % | | 2.33 | % | | 2.71 | % | | 2.61 | % | | 2.94 | % |
| |
| Supplemental data | | | | | | | | | | | | | | | |
| Net assets, end of year (000’s) | $ | 740,046 | | $ | 526,749 | | $ | 1,281,151 | | $ | 1,148,451 | | $ | 1,482,994 | |
| Portfolio turnover rate | | 287.38 | % | | 294.80 | % | | 273.96 | % | | 371.54 | % | | 314.62 | % |
| Portfolio turnover rate excluding mortgage dollar rollsc | | 146.15 | % | | 95.06 | % | | 85.03 | % | | 156.49 | % | | 122.04 | % |
aThe amount shown for a share outstanding throughout the period may not correlate with the Consolidated Statement of Operations for the period due to the timing of sales
and repurchases of the Fund’s shares in relation to income earned and/or fluctuating fair value of the investments of the Fund.
bBenefit of expense reduction rounds to less than 0.01%.
cSee Note 1(h) regarding mortgage dollar rolls.
franklintempleton.com
The accompanying notes are an integral part of these financial statements. | Annual Report 83
FRANKLIN INVESTORS SECURITIES TRUST
| | | | | |
| Consolidated Statement of Investments, October 31, 2016 | | | | |
| Franklin Total Return Fund | | | | | |
| | | Shares/ | | | |
| | Country | Warrants | | | Value |
| |
| Common Stocks and Other Equity Interests 0.2% | | | | | |
| Consumer Services 0.1% | | | | | |
| a,b,c Turtle Bay Resort | United States | 1,550,568 | | $ | 5,378,919 |
| Energy 0.1% | | | | | |
| a,d Halcon Resources Corp | United States | 229,059 | | | 1,834,837 |
| a Halcon Resources Corp., wts., 9/09/20 | United States | 20,425 | | | 51,675 |
| | | | | | 1,886,512 |
| Materials 0.0%† | | | | | |
| a Verso Corp., A | United States | 6,954 | | | 42,697 |
| a Verso Corp., wts., 7/25/23 | United States | 732 | | | — |
| | | | | | 42,697 |
| Total Common Stocks and Other Equity Interests | | | | | |
| (Cost $6,177,308) | | | | | 7,308,128 |
| |
| e Management Investment Companies 1.8% | | | | | |
| Diversified Financials 1.8% | | | | | |
| Franklin Liberty Investment Grade Corporate ETF. | United States | 400,000 | | | 9,888,000 |
| Franklin Liberty Short Duration U.S. Government ETF | United States | 500,000 | | | 48,780,000 |
| Franklin Lower Tier Floating Rate Fund | United States | 997,589 | | | 10,364,951 |
| Franklin Middle Tier Floating Rate Fund. | United States | 1,889,310 | | | 19,006,460 |
| Total Management Investment Companies | | | | | |
| (Cost $87,329,310) | | | | | 88,039,411 |
| |
| Preferred Stocks 0.4% | | | | | |
| Banks 0.3% | | | | | |
| U.S. Bancorp, 6.00%, pfd., G | United States | 640,000 | | | 16,390,400 |
| Diversified Financials 0.1% | | | | | |
| f Citigroup Capital XIII, 7.149%, pfd | United States | 93,000 | | | 2,418,930 |
| Total Preferred Stocks (Cost $18,325,000) | | | | | 18,809,330 |
| |
| |
| | | Principal | | | |
| | | Amount* | | | |
| |
| Corporate Bonds 37.5% | | | | | |
| Automobiles & Components 0.6% | | | | | |
| Delphi Corp., senior bond, 4.15%, 3/15/24 | United Kingdom | 5,100,000 | | | 5,471,300 |
| Fiat Chrysler Automobiles NV, senior note, 4.50%, 4/15/20 | United Kingdom | 6,000,000 | | | 6,150,000 |
| Ford Motor Credit Co. LLC, senior note, 3.096%, 5/04/23 | United States | 18,200,000 | | | 18,236,127 |
| | | | | | 29,857,427 |
| Banks 8.2% | | | | | |
| Banco Comercial Portugues SA, 4.75%, 6/22/17 | Portugal | 5,400,000 | EUR | | 6,103,944 |
| Bank of America Corp., | | | | | |
| senior bond, 3.875%, 8/01/25 | United States | 6,000,000 | | | 6,329,064 |
| senior note, 3.50%, 4/19/26 | United States | 20,400,000 | | | 20,967,344 |
| g Bankinter SA, senior note, Reg S, 1.75%, 6/10/19. | Spain | 12,500,000 | EUR | | 14,301,488 |
| g Barclays Bank PLC, senior sub. note, Reg S, 6.00%, 1/14/21 | United Kingdom | 8,000,000 | EUR | | 10,181,319 |
| Barclays PLC, sub. note, 4.375%, 9/11/24 | United Kingdom | 500,000 | | | 503,183 |
| Capital One Financial Corp., senior note, 3.20%, 2/05/25. | United States | 9,700,000 | | | 9,841,290 |
| CIT Group Inc., senior note, 5.00%, 8/15/22 | United States | 7,000,000 | | | 7,509,460 |
84 Annual Report
franklintempleton.com
FRANKLIN INVESTORS SECURITIES TRUST
CONSOLIDATED STATEMENT OF INVESTMENTS
| | | | | |
| Franklin Total Return Fund (continued) | | | | | |
| | | Principal | | | |
| | Country | Amount* | | | Value |
| |
| Corporate Bonds (continued) | | | | | |
| Banks (continued) | | | | | |
| Citigroup Inc., | | | | | |
| senior note, 3.40%, 5/01/26 | United States | 20,000,000 | | $ | 20,384,380 |
| senior note, 8.125%, 7/15/39. | United States | 4,400,000 | | | 6,736,695 |
| Depfa ACS Bank, | | | | | |
| secured bond, 1.65%, 12/20/16 | Ireland | 720,000,000 | JPY | | 6,878,223 |
| secured bond, 2.125%, 10/13/17 | Ireland | 12,250,000 | CHF | | 12,658,581 |
| HSBC Holdings PLC, | | | | | |
| senior note, 3.60%, 5/25/23 | United Kingdom | 12,700,000 | | | 13,125,640 |
| senior note, 4.30%, 3/08/26 | United Kingdom | 14,800,000 | | | 15,785,532 |
| Intesa Sanpaolo SpA, | | | | | |
| senior note, 2.375%, 1/13/17. | Italy | 24,500,000 | | | 24,536,382 |
| senior note, 3.875%, 1/16/18. | Italy | 4,300,000 | | | 4,380,948 |
| h sub. note, 144A, 5.71%, 1/15/26 | Italy | 17,500,000 | | | 16,753,887 |
| JPMorgan Chase & Co., | | | | | |
| i junior sub. bond, X, 6.10% to 10/01/24, FRN thereafter, | | | | | |
| Perpetual | United States | 10,400,000 | | | 10,942,360 |
| senior bond, 3.30%, 4/01/26 | United States | 22,000,000 | | | 22,450,318 |
| senior bond, 3.20%, 6/15/26 | United States | 10,800,000 | | | 10,929,319 |
| senior note, 2.40%, 6/07/21 | United States | 10,000,000 | | | 10,092,150 |
| senior note, 3.25%, 9/23/22 | United States | 11,400,000 | | | 11,864,185 |
| h Norddeutsche Landesbank Girozentrale, secured note, 144A, | | | | | |
| 2.00%, 2/05/19 | Germany | 7,000,000 | | | 7,090,230 |
| Royal Bank of Canada, secured note, 2.10%, 10/14/20 | Canada | 11,500,000 | | | 11,668,739 |
| Royal Bank of Scotland Group PLC, sub. note, 6.125%, 12/15/22 | United Kingdom | 3,100,000 | | | 3,278,824 |
| The Royal Bank of Scotland PLC, sub. note, 6.934%, 4/09/18 | United Kingdom | 4,000,000 | EUR | | 4,755,547 |
| h Shinhan Bank, senior note, 144A, 1.875%, 7/30/18 | South Korea | 10,000,000 | | | 10,020,700 |
| SVB Financial Group, senior note, 3.50%, 1/29/25 | United States | 6,000,000 | | | 5,998,044 |
| j UniCredit SpA, senior note, FRN, 1.688%, 10/31/17 | Italy | 9,500,000 | EUR | | 10,559,637 |
| g Unione di Banche Italiane SpA, senior note, Reg S, 2.875%, | | | | | |
| 2/18/19 | Italy | 12,000,000 | EUR | | 13,968,760 |
| Wells Fargo & Co., | | | | | |
| i junior sub. bond, S, 5.90% to 6/15/24, FRN thereafter, | | | | | |
| Perpetual | United States | 5,500,000 | | | 5,761,250 |
| senior note, 2.50%, 3/04/21 | United States | 10,000,000 | | | 10,133,520 |
| senior note, 3.00%, 4/22/26 | United States | 31,200,000 | | | 31,082,002 |
| sub. bond, 4.65%, 11/04/44 | United States | 10,000,000 | | | 10,371,060 |
| h Westpac Banking Corp., senior secured note, 144A, 2.25%, | | | | | |
| 11/09/20. | Australia | 10,800,000 | | | 10,974,366 |
| h Woori Bank, sub. note, 144A, 4.75%, 4/30/24 | South Korea | 9,750,000 | | | 10,346,408 |
| | | | | | 409,264,779 |
| Capital Goods 1.2% | | | | | |
| h Amcor Finance USA Inc., senior note, 144A, 3.625%, 4/28/26 | Australia | 11,800,000 | | | 12,048,626 |
| CNH Industrial Capital LLC, senior note, 3.875%, 10/15/21 | United States | 3,400,000 | | | 3,383,000 |
| h Cortes NP Acquisition Corp., senior note, 144A, 9.25%, 10/15/24 | United States | 4,100,000 | | | 4,315,250 |
| k,l Erickson Air-Crane Inc., Purchase Price Notes, 6.00%, 11/02/20 | United States | 10,305 | | | 1,078 |
| General Electric Co., senior note, A, 8.50%, 4/06/18 | United States | 135,000,000 | MXN | | 7,382,589 |
| Lockheed Martin Corp., senior bond, 4.70%, 5/15/46 | United States | 13,900,000 | | | 15,859,886 |
| h Sydney Airport Finance Co. Pty. Ltd., 144A, 3.90%, 3/22/23 | Australia | 5,800,000 | | | 6,142,374 |
| United Technologies Corp., senior note, 1.125%, 12/15/21 | United States | 10,500,000 | EUR | | 11,981,037 |
| | | | | | 61,113,840 |
franklintempleton.com
Annual Report
85
FRANKLIN INVESTORS SECURITIES TRUST
CONSOLIDATED STATEMENT OF INVESTMENTS
| | | | | |
| Franklin Total Return Fund (continued) | | | | | |
| | | | Principal | | |
| | | Country | Amount* | | Value |
| |
| Corporate Bonds (continued) | | | | | |
| Commercial & Professional Services 0.1% | | | | | |
| Republic Services Inc., senior note, 2.90%, 7/01/26 | | United States | 4,500,000 | $ | 4,505,512 |
| Consumer Durables & Apparel 0.4% | | | | | |
| Beazer Homes USA Inc., senior note, 5.75%, 6/15/19 | | United States | 13,500,000 | | 14,006,250 |
| PulteGroup Inc., senior bond, 5.00%, 1/15/27. | | United States | 4,900,000 | | 4,881,625 |
| | | | | | 18,887,875 |
| Consumer Services 0.6% | | | | | |
| h KFC Holding Co./Pizza Hut Holdings LLC/Taco Bell of | | | | | |
| America LLC, | | | | | |
| senior note, 144A, 5.00%, 6/01/24 | | United States | 2,300,000 | | 2,369,000 |
| senior note, 144A, 5.25%, 6/01/26 | | United States | 2,300,000 | | 2,403,500 |
| Marriott International Inc., senior bond, 3.75%, 10/01/25 | | United States | 18,400,000 | | 19,343,276 |
| Yum! Brands Inc., senior note, 5.30%, 9/15/19 | | United States | 3,000,000 | | 3,243,750 |
| | | | | | 27,359,526 |
| Diversified Financials 3.4% | | | | | |
| AerCap Ireland Capital Ltd./AerCap Global Aviation Trust, senior | | | | | |
| note, 4.25%, 7/01/20 | | Netherlands | 6,000,000 | | 6,242,520 |
| American Airlines Pass Through Trust, first lien, 2016-2, AA, | | | | | |
| 3.20%, 6/15/28 | | United States | 6,600,000 | | 6,723,750 |
| American Express Centurion Bank, senior note, 5.95%, 6/12/17 | | United States | 800,000 | | 822,331 |
| Capital One Bank USA NA, sub. bond, 3.375%, 2/15/23 | | United States | 6,000,000 | | 6,139,158 |
| Discover Financial Services, senior note, 3.85%, 11/21/22 | | United States | 3,052,000 | | 3,154,276 |
| GE Capital International Funding Co., senior bond, 3.373%, | | | | | |
| 11/15/25 | . | United States | 17,000,000 | | 18,110,270 |
| The Goldman Sachs Group Inc., | | | | | |
| senior note, 3.75%, 5/22/25 | | United States | 7,700,000 | | 8,027,496 |
| senior note, 3.75%, 2/25/26 | | United States | 21,300,000 | | 22,228,978 |
| h Hutchison Whampoa International 11 Ltd., senior note, 144A, | | | | | |
| 3.50%, 1/13/17 | | Hong Kong | 9,500,000 | | 9,539,900 |
| International Lease Finance Corp., senior note, 8.75%, 3/15/17 | | United States | 12,000,000 | | 12,309,408 |
| Morgan Stanley, | | | | | |
| senior bond, 4.30%, 1/27/45 | | United States | 10,000,000 | | 10,526,400 |
| senior note, 3.875%, 1/27/26. | | United States | 20,500,000 | | 21,651,465 |
| h MSCI Inc., senior note, 144A, 4.75%, 8/01/26 | | United States | 1,100,000 | | 1,111,000 |
| Navient Corp., | | | | | |
| senior note, 6.625%, 7/26/21. | | United States | 2,200,000 | | 2,222,000 |
| senior note, 7.25%, 9/25/23 | | United States | 4,000,000 | | 3,995,000 |
| PHH Corp., senior note, 7.375%, 9/01/19. | | United States | 5,400,000 | | 5,656,500 |
| Springleaf Finance Corp., | | | | | |
| senior note, 6.00%, 6/01/20 | | United States | 1,200,000 | | 1,215,000 |
| senior note, 7.75%, 10/01/21. | | United States | 1,000,000 | | 1,041,650 |
| h Three Gorges Finance I Cayman Islands Ltd., senior note, 144A, | | | | | |
| 3.70%, 6/10/25 | | China | 12,800,000 | | 13,503,872 |
| h Transurban Finance Co. Pty. Ltd., senior secured bond, 144A, | | | | | |
| 4.125%, 2/02/26 | | Australia | 8,200,000 | | 8,707,957 |
| United Airlines Pass Through Trust, first lien, 2016-1, AA, 3.10%, | | | | | |
| 1/07/30 | | United States | 6,300,000 | | 6,468,651 |
| | | | | | 169,397,582 |
86 Annual Report
franklintempleton.com
FRANKLIN INVESTORS SECURITIES TRUST
CONSOLIDATED STATEMENT OF INVESTMENTS
| | | | |
| Franklin Total Return Fund (continued) | | | | |
| | | Principal | | |
| | Country | Amount* | | Value |
| |
| Corporate Bonds (continued) | | | | |
| Energy 4.3% | | | | |
| Anadarko Petroleum Corp., senior note, 6.45%, 9/15/36 | United States | 2,260,000 | $ | 2,691,911 |
| h California Resources Corp., secured note, second lien, 144A, | | | | |
| 8.00%, 12/15/22 | United States | 4,000,000 | | 2,730,000 |
| h Calumet Specialty Products Partners LP/Calumet Finance Corp., | | | | |
| senior note, 144A, 11.50%, 1/15/21 | United States | 2,100,000 | | 2,378,250 |
| Canadian Natural Resources Ltd., senior note, 5.70%, 5/15/17 | Canada | 5,400,000 | | 5,517,261 |
| CGG SA, senior note, 6.50%, 6/01/21 | France | 2,100,000 | | 1,071,000 |
| h Cheniere Corpus Christi Holdings LLC, senior secured note, 144A, | | | | |
| 7.00%, 6/30/24 | United States | 2,300,000 | | 2,449,500 |
| CNOOC Finance 2013 Ltd., senior note, 3.00%, 5/09/23 | China | 14,000,000 | | 14,016,520 |
| Enable Midstream Partners LP, | | | | |
| senior bond, 5.00%, 5/15/44 | United States | 1,200,000 | | 1,031,076 |
| senior note, 3.90%, 5/15/24 | United States | 3,600,000 | | 3,394,098 |
| Energy Transfer Equity LP, senior note, first lien, 7.50%, 10/15/20 | United States | 6,000,000 | | 6,570,000 |
| Energy Transfer Partners LP, senior bond, 5.15%, 2/01/43 | United States | 6,000,000 | | 5,585,520 |
| h,l Energy XXI Gulf Coast Inc., senior secured note, second lien, | | | | |
| 144A, 11.00%, 3/15/20 | United States | 6,000,000 | | 2,730,000 |
| EnLink Midstream Partners LP, senior bond, 5.05%, 4/01/45 | United States | 6,200,000 | | 5,550,823 |
| Ensco PLC, senior bond, 5.75%, 10/01/44 | United States | 3,700,000 | | 2,488,250 |
| Enterprise Products Operating LLC, senior bond, 4.45%, 2/15/43 | United States | 6,000,000 | | 5,786,484 |
| Exxon Mobil Corp., senior note, 2.709%, 3/06/25 | United States | 21,500,000 | | 21,889,773 |
| h,m Gaz Capital SA (OJSC Gazprom), loan participation, senior note, | | | | |
| 144A, 3.85%, 2/06/20 | Russia | 10,000,000 | | 10,040,550 |
| h,l Linn Energy LLC/Finance Corp., senior secured note, second lien, | | | | |
| 144A, 12.00%, 12/15/20. | United States | 1,000,000 | | 705,000 |
| h LUKOIL International Finance BV, senior note, 144A, 4.563%, | | | | |
| 4/24/23 | Russia | 6,000,000 | | 6,110,460 |
| MPLX LP, 4.00%, 2/15/25. | United States | 4,600,000 | | 4,556,889 |
| Oceaneering International Inc., senior note, 4.65%, 11/15/24 | United States | 7,900,000 | | 8,026,771 |
| j Petrobras Global Finance BV, senior note, FRN, 3.737%, 3/17/20 | Brazil | 14,400,000 | | 14,238,000 |
| h Petrofac Ltd., senior note, 144A, 3.40%, 10/10/18 | United Kingdom | 7,600,000 | | 7,669,532 |
| h Sabine Pass Liquefaction LLC, senior secured bond, 144A, 5.00%, | | | | |
| 3/15/27 | United States | 3,700,000 | | 3,774,000 |
| c Sanchez Energy Corp., senior note, 6.125%, 1/15/23 | United States | 3,000,000 | | 2,580,000 |
| h Sinopec Group Overseas Development 2014 Ltd., senior note, | | | | |
| 144A, 4.375%, 4/10/24 | China | 9,300,000 | | 10,161,459 |
| h Sinopec Group Overseas Development 2015 Ltd., senior note, | | | | |
| 144A, 3.25%, 4/28/25 | China | 16,400,000 | | 16,536,202 |
| Sunoco Logistics Partners Operations LP, senior note, 4.25%, | | | | |
| 4/01/24 | United States | 9,300,000 | | 9,747,107 |
| Transcontinental Gas Pipe Line Corp., senior note, 6.05%, 6/15/18 . | United States | 550,000 | | 583,100 |
| Transocean Inc., senior bond, 7.375%, 4/15/18 | United States | 13,000,000 | | 13,227,500 |
| Valero Energy Corp., senior bond, 4.90%, 3/15/45 | United States | 6,700,000 | | 6,595,004 |
| Weatherford International Ltd., | | | | |
| senior bond, 5.95%, 4/15/42 | United States | 2,400,000 | | 1,824,000 |
| senior note, 7.75%, 6/15/21 | United States | 1,600,000 | | 1,622,000 |
| senior note, 8.25%, 6/15/23 | United States | 2,000,000 | | 2,075,000 |
| h Woodside Finance Ltd., senior note, 144A, 3.70%, 9/15/26 | Australia | 9,500,000 | | 9,518,193 |
| | | | | 215,471,233 |
franklintempleton.com
Annual Report
87
FRANKLIN INVESTORS SECURITIES TRUST
CONSOLIDATED STATEMENT OF INVESTMENTS
| | | | | | |
| Franklin Total Return Fund (continued) | | | | | | |
| | | | Principal | | | |
| | | Country | Amount* | | | Value |
| |
| Corporate Bonds (continued) | | | | | | |
| Food & Staples Retailing 0.6% | | | | | | |
| h Cencosud SA, senior note, 144A, 4.875%, 1/20/23 | | Chile | 10,200,000 | | $ | 10,780,533 |
| The Kroger Co., senior note, 4.00%, 2/01/24 | | United States | 15,400,000 | | | 16,598,875 |
| | | | | | | 27,379,408 |
| Food, Beverage & Tobacco 1.4% | | | | | | |
| Anheuser-Busch InBev Finance Inc., senior bond, 3.65%, 2/01/26 . | | Belgium | 17,000,000 | | | 17,928,353 |
| Bunge Ltd. Finance Corp., senior note, 3.25%, 8/15/26 | | United States | 12,000,000 | | | 12,040,764 |
| Constellation Brands Inc., senior note, 7.25%, 5/15/17 | | United States | 5,000,000 | | | 5,168,750 |
| Kraft Heinz Foods Co., senior note, 3.50%, 7/15/22. | | United States | 21,400,000 | | | 22,580,403 |
| Reynolds American Inc., senior bond, 5.70%, 8/15/35 | | United States | 9,300,000 | | | 11,286,917 |
| | | | | | | 69,005,187 |
| Health Care Equipment & Services 0.9% | | | | | | |
| Express Scripts Holding Co., senior bond, 3.50%, 6/15/24 | | United States | 14,500,000 | | | 14,998,336 |
| HCA Inc., senior bond, 5.875%, 5/01/23 | | United States | 8,000,000 | | | 8,500,000 |
| Medco Health Solutions Inc., senior note, 4.125%, 9/15/20 | | United States | 3,500,000 | | | 3,753,246 |
| h MPH Acquisition Holdings LLC, senior note, 144A, 7.125%, | | | | | | |
| 6/01/24 | | United States | 1,000,000 | | | 1,072,400 |
| Stryker Corp., senior bond, 3.50%, 3/15/26 | | United States | 3,000,000 | | | 3,131,052 |
| Tenet Healthcare Corp., senior note, 5.50%, 3/01/19 | | United States | 15,835,000 | | | 15,557,887 |
| | | | | | | 47,012,921 |
| Household & Personal Products 0.6% | | | | | | |
| Avon Products Inc., senior note, 6.60%, 3/15/20 | | United States | 18,500,000 | | | 19,066,562 |
| The Procter & Gamble Co., senior note, 2.45%, 11/03/26 | | United States | 12,500,000 | | | 12,482,375 |
| | | | | | | 31,548,937 |
| Insurance 1.6% | | | | | | |
| Aflac Inc., senior bond, 3.625%, 6/15/23 | | United States | 17,500,000 | | | 18,697,158 |
| h Liberty Mutual Group Inc., senior note, 144A, 4.95%, 5/01/22 | | United States | 12,000,000 | | | 13,469,316 |
| MetLife Inc., | | | | | | |
| senior note, 3.60%, 4/10/24 | | United States | 9,600,000 | | | 10,182,950 |
| senior note, 3.00%, 3/01/25 | | United States | 1,500,000 | | | 1,524,162 |
| Prudential Financial Inc., junior sub. note, 5.875%, 9/15/42 | | United States | 7,000,000 | | | 7,673,750 |
| h Teachers Insurance & Annuity Assn. of America, sub. bond, 144A, | | | | | | |
| 4.90%, 9/15/44 | | United States | 20,400,000 | | | 22,764,258 |
| h TIAA Asset Management Finance LLC, senior note, 144A, 2.95%, | | | | | | |
| 11/01/19. | | United States | 5,800,000 | | | 5,969,714 |
| | | | | | | 80,281,308 |
| Materials 1.6% | | | | | | |
| g Arkema SA, senior note, Reg S, 1.50%, 1/20/25 | | France | 12,000,000 | EUR | | 13,858,183 |
| h Cemex SAB de CV, first lien, 144A, 5.70%, 1/11/25. | | Mexico | 8,000,000 | | | 8,170,520 |
| h FMG Resources (August 2006) Pty. Ltd., senior secured note, | | | | | | |
| 144A, 9.75%, 3/01/22 | | Australia | 300,000 | | | 350,641 |
| h Glencore Finance Canada Ltd., senior bond, 144A, 4.95%, | | | | | | |
| 11/15/21. | | Switzerland | 4,700,000 | | | 5,011,084 |
| LYB International Finance BV, senior note, 4.00%, 7/15/23. | | United States | 18,400,000 | | | 19,728,940 |
| Owens-Illinois Inc., senior note, 7.80%, 5/15/18 | | United States | 9,200,000 | | | 9,959,000 |
| Reliance Steel & Aluminum Co., senior note, 4.50%, 4/15/23 | | United States | 5,600,000 | | | 5,751,289 |
| Reynolds Group Holdings Inc., senior note, 8.125%, 6/15/17 | | United States | 12,000,000 | | | 12,435,000 |
88 Annual Report
franklintempleton.com
FRANKLIN INVESTORS SECURITIES TRUST
CONSOLIDATED STATEMENT OF INVESTMENTS
| | | | |
| Franklin Total Return Fund (continued) | | | | |
| | | Principal | | |
| | Country | Amount* | | Value |
| |
| Corporate Bonds (continued) | | | | |
| Materials (continued) | | | | |
| h Reynolds Group Issuer Inc./Reynolds Group Issuer LLC/Reynolds | | | | |
| Group Issuer Luxembourg SA, | | | | |
| first lien, 144A, 5.125%, 7/15/23 | United States | 1,600,000 | $ | 1,641,000 |
| senior note, 144A, 7.00%, 7/15/24 | United States | 800,000 | | 856,500 |
| | | | | 77,762,157 |
| Media 1.5% | | | | |
| 21st Century Fox America Inc., | | | | |
| senior bond, 6.90%, 8/15/39 | United States | 1,800,000 | | 2,377,361 |
| senior bond, 7.90%, 12/01/95 | United States | 500,000 | | 650,809 |
| senior note, 3.00%, 9/15/22 | United States | 5,100,000 | | 5,271,783 |
| senior note, 3.70%, 10/15/25. | United States | 2,300,000 | | 2,450,275 |
| h Altice U.S. Finance I Corp., senior secured bond, 144A, 5.50%, | | | | |
| 5/15/26 | United States | 6,500,000 | | 6,646,250 |
| h CCO Holdings LLC/CCO Holdings Capital Corp., senior bond, | | | | |
| 144A, 5.375%, 5/01/25 | United States | 7,000,000 | | 7,210,000 |
| CSC Holdings LLC, | | | | |
| senior bond, 7.625%, 7/15/18 | United States | 3,000,000 | | 3,225,000 |
| senior note, 8.625%, 2/15/19. | United States | 9,000,000 | | 10,063,080 |
| NBCUniversal Media LLC, senior bond, 4.45%, 1/15/43. | United States | 8,100,000 | | 8,788,411 |
| The New York Times Co., senior note, 6.625%, 12/15/16 | United States | 11,700,000 | | 11,773,710 |
| h Nextstar Escrow Corp., senior note, 144A, 5.625%, 8/01/24 | United States | 1,600,000 | | 1,592,000 |
| Time Warner Inc., | | | | |
| 7.70%, 5/01/32 | United States | 550,000 | | 762,211 |
| 6.10%, 7/15/40 | United States | 8,600,000 | | 10,378,540 |
| h Virgin Media Secured Finance PLC, senior secured bond, first lien, | | | | |
| 144A, 5.50%, 8/15/26 | United Kingdom | 4,300,000 | | 4,359,125 |
| | | | | 75,548,555 |
| Pharmaceuticals, Biotechnology & Life Sciences 1.2% | | | | |
| Actavis Funding SCS, senior bond, 4.55%, 3/15/35. | United States | 13,400,000 | | 13,888,872 |
| Baxalta Inc., senior note, 3.60%, 6/23/22 | United States | 8,300,000 | | 8,656,643 |
| Biogen Inc., senior bond, 5.20%, 9/15/45 | United States | 9,200,000 | | 10,425,155 |
| Gilead Sciences Inc., senior bond, 4.50%, 2/01/45 | United States | 6,000,000 | | 6,268,524 |
| PerkinElmer Inc., senior note, 5.00%, 11/15/21. | United States | 13,200,000 | | 14,442,714 |
| h Valeant Pharmaceuticals International Inc., senior bond, 144A, | | | | |
| 6.125%, 4/15/25 | United States | 6,800,000 | | 5,253,000 |
| Zoetis Inc., senior bond, 4.70%, 2/01/43 | United States | 3,000,000 | | 3,086,715 |
| | | | | 62,021,623 |
| Real Estate 1.5% | | | | |
| American Tower Corp., | | | | |
| senior bond, 3.50%, 1/31/23 | United States | 12,700,000 | | 13,149,885 |
| senior bond, 4.40%, 2/15/26 | United States | 9,400,000 | | 10,142,431 |
| ERP Operating LP, 5.75%, 6/15/17 | United States | 881,000 | | 905,509 |
| HCP Inc., senior bond, 3.875%, 8/15/24 | United States | 17,000,000 | | 17,484,534 |
| MPT Operating Partnership LP/MPT Finance Corp., senior bond, | | | | |
| 5.25%, 8/01/26 | United States | 1,100,000 | | 1,124,750 |
| Realty Income Corp., senior bond, 4.125%, 10/15/26 | United States | 12,500,000 | | 13,514,375 |
| Senior Housing Properties Trust, senior note, 6.75%, 12/15/21. | United States | 14,500,000 | | 16,560,479 |
| | | | | 72,881,963 |
franklintempleton.com
Annual Report
89
FRANKLIN INVESTORS SECURITIES TRUST
CONSOLIDATED STATEMENT OF INVESTMENTS
| | | | | |
| Franklin Total Return Fund (continued) | | | | | |
| | | Principal | | | |
| | Country | Amount* | | | Value |
| |
| Corporate Bonds (continued) | | | | | |
| Retailing 1.4% | | | | | |
| Dollar General Corp., senior bond, 4.15%, 11/01/25 | United States | 12,700,000 | | $ | 13,630,376 |
| h,l Edcon Ltd., secured note, 144A, 9.50%, 3/01/18. | South Africa | 3,500,000 | EUR | | 960,444 |
| Home Depot Inc., senior note, 2.125%, 9/15/26 | United States | 16,800,000 | | | 16,229,253 |
| Tiffany & Co., senior bond, 4.90%, 10/01/44. | United States | 10,300,000 | | | 10,105,248 |
| Toys R Us Inc., senior bond, 7.375%, 10/15/18. | United States | 28,800,000 | | | 27,720,000 |
| | | | | | 68,645,321 |
| Semiconductors & Semiconductor Equipment 0.5% | | | | | |
| Maxim Integrated Products Inc., senior note, 3.375%, 3/15/23 | United States | 22,000,000 | | | 22,327,756 |
| Software & Services 0.5% | | | | | |
| Alibaba Group Holding Ltd., senior bond, 4.50%, 11/28/34. | China | 10,000,000 | | | 10,652,500 |
| h First Data Corp., secured note, first lien, 144A, 5.00%, 1/15/24 | United States | 6,000,000 | | | 6,097,500 |
| Fiserv Inc., senior bond, 3.85%, 6/01/25 | United States | 9,300,000 | | | 9,908,620 |
| | | | | | 26,658,620 |
| Technology Hardware & Equipment 1.2% | | | | | |
| Cisco Systems Inc., senior note, 2.60%, 2/28/23. | United States | 12,000,000 | | | 12,303,756 |
| h Diamond 1 Finance Corp./Diamond 2 Finance Corp., senior | | | | | |
| secured note, first lien, 144A, 3.48%, 6/01/19 | United States | 12,000,000 | | | 12,320,808 |
| Juniper Networks Inc., | | | | | |
| senior bond, 4.50%, 3/15/24 | United States | 4,500,000 | | | 4,794,629 |
| senior bond, 4.35%, 6/15/25 | United States | 9,300,000 | | | 9,660,942 |
| h Sanmina Corp., senior note, first lien, 144A, 4.375%, 6/01/19. | United States | 7,500,000 | | | 7,837,500 |
| h Western Digital Corp., senior secured note, 144A, 7.375%, | | | | | |
| 4/01/23 | United States | 9,800,000 | | | 10,755,500 |
| | | | | | 57,673,135 |
| Telecommunication Services 1.6% | | | | | |
| AT&T Inc., | | | | | |
| senior bond, 4.50%, 5/15/35 | United States | 16,200,000 | | | 16,144,499 |
| senior note, 3.95%, 1/15/25 | United States | 7,400,000 | | | 7,677,352 |
| h Hughes Satellite Systems Corp., senior bond, 144A, 6.625%, | | | | | |
| 8/01/26 | United States | 5,400,000 | | | 5,359,500 |
| Sprint Communications Inc., senior note, 6.00%, 11/15/22 | United States | 7,000,000 | | | 6,527,500 |
| Sprint Corp., senior note, 7.625%, 2/15/25 | United States | 2,000,000 | | | 1,929,376 |
| Telefonica Emisiones SAU, senior note, 4.57%, 4/27/23. | Spain | 9,000,000 | | | 9,894,015 |
| Verizon Communications Inc., | | | | | |
| senior bond, 6.40%, 9/15/33 | United States | 10,255,000 | | | 12,836,214 |
| senior bond, 4.522%, 9/15/48 | United States | 10,700,000 | | | 10,780,378 |
| h Wind Acquisition Finance SA, secured note, second lien, 144A, | | | | | |
| 7.375%, 4/23/21 | Italy | 7,000,000 | | | 7,260,155 |
| | | | | | 78,408,989 |
| Transportation 0.3% | | | | | |
| h Aviation Capital Group Corp., 144A, 7.125%, 10/15/20 | United States | 6,000,000 | | | 7,100,520 |
| Burlington Northern and Santa Fe 99-2 Trust, secured bond, | | | | | |
| 7.57%, 1/02/21 | United States | 102,185 | | | 111,009 |
| h DP World Ltd., senior bond, 144A, 6.85%, 7/02/37 | United Arab Emirates | 3,700,000 | | | 4,241,125 |
| Union Pacific Railroad Co. 2005 Pass Trust, 2005-1, 5.082%, | | | | | |
| 1/02/29 | United States | 196,496 | | | 216,449 |
| XPO CNW Inc., senior bond, 7.25%, 1/15/18 | United States | 4,300,000 | | | 4,472,000 |
| | | | | | 16,141,103 |
90 Annual Report
franklintempleton.com
FRANKLIN INVESTORS SECURITIES TRUST
CONSOLIDATED STATEMENT OF INVESTMENTS
| | | | | | |
| Franklin Total Return Fund (continued) | | | | | | |
| | | | Principal | | | |
| | | Country | Amount* | | | Value |
| |
| Corporate Bonds (continued) | | | | | | |
| Utilities 2.3% | | | | | | |
| Commonwealth Edison Co., secured bond, 6.45%, 1/15/38 | | United States | 700,000 | | $ | 974,791 |
| Dominion Resources Inc., senior bond, 3.90%, 10/01/25 | | United States | 12,200,000 | | | 13,035,834 |
| h Dynegy Inc., senior note, 144A, 8.00%, 1/15/25 | | United States | 4,400,000 | | | 4,257,000 |
| h,i EDF SA, sub. note, 144A, 5.25% to 1/29/23, FRN thereafter, | | | | | | |
| Perpetual | | France | 24,000,000 | | | 23,866,200 |
| h Enogex LLC, senior note, 144A, 6.25%, 3/15/20 | | United States | 5,000,000 | | | 5,402,790 |
| Georgia Power Co., senior note, 4.30%, 3/15/42 | | United States | 9,000,000 | | | 9,569,664 |
| Kinder Morgan Energy Partners LP, | | | | | | |
| senior note, 5.95%, 2/15/18 | | United States | 5,200,000 | | | 5,468,804 |
| senior note, 6.85%, 2/15/20 | | United States | 1,000,000 | | | 1,127,971 |
| MidAmerican Energy Co., senior note, 5.95%, 7/15/17 | | United States | 2,200,000 | | | 2,275,414 |
| Sempra Energy, senior note, 3.75%, 11/15/25 | | United States | 8,200,000 | | | 8,697,543 |
| The Southern Co., senior bond, 3.25%, 7/01/26 | | United States | 14,350,000 | | | 14,780,457 |
| h State Grid Overseas Investment 2013 Ltd., senior note, 144A, | | | | | | |
| 3.125%, 5/22/23 | | China | 10,400,000 | | | 10,762,440 |
| g Veolia Environnement SA, senior bond, Reg S, 4.625%, 3/30/27 | | France | 7,800,000 | EUR | | 11,770,113 |
| | | | | | | 111,989,021 |
| Total Corporate Bonds (Cost $1,820,964,575) | | | | | | 1,861,143,778 |
| |
| j,n Senior Floating Rate Interests 1.5% | | | | | | |
| Automobiles & Components 0.0%† | | | | | | |
| TI Group Automotive Systems LLC, Initial U.S. Term Loan, 4.50%, | | | | | | |
| 6/25/22 | | United States | 1,488,040 | | | 1,492,988 |
| Capital Goods 0.0%† | | | | | | |
| o Harsco Corp., Initial Term Loan, 7.50%, 11/01/23 | | United States | 274,602 | | | 278,035 |
| Leidos (Abacus Innovations Corp.), B Term Loan, 3.284%, 8/16/23. | | United States | 194,626 | | | 196,390 |
| | | | | | | 474,425 |
| Consumer Services 0.1% | | | | | | |
| Aristocrat Technologies Inc., Term B-1 Loans, 3.631%, 10/20/21 | | United States | 166,321 | | | 167,298 |
| Fitness International LLC, Term B Loan, 6.00%, 7/01/20 | | United States | 2,495,938 | | | 2,500,619 |
| Prime Security Services Borrower LLC, Term B-1 Loans, 4.75%, | | | | | | |
| 5/02/22 | | United States | 795,514 | | | 802,077 |
| c,p Turtle Bay Holdings LLC, Term Loan B, PIK, 3.375%, 6/30/17. | | United States | 697,827 | | | 690,848 |
| | | | | | | 4,160,842 |
| Diversified Financials 0.0%† | | | | | | |
| First Eagle Investment Management, Initial Term Loans, 4.838%, | | | | | | |
| 12/01/22. | | United States | 475,649 | | | 475,054 |
| Russell Investments US Institutional Holdco Inc., Initial Term Loan, | | | | | | |
| 6.75%, 6/01/23 | | United States | 324,557 | | | 325,774 |
| | | | | | | 800,828 |
| Energy 0.2% | | | | | | |
| c Bowie Resource Holdings LLC, | | | | | | |
| First Lien Initial Term Loan, 6.75%, 8/16/20 | | United States | 3,229,920 | | | 2,680,834 |
| Second Lien Initial Term Loan, 11.75%, 2/16/21 | | United States | 592,359 | | | 488,696 |
| Fieldwood Energy LLC, Loans, 3.875%, 10/01/18 | | United States | 4,647,342 | | | 4,287,173 |
| Foresight Energy LLC, Term Loans, 6.50%, 8/23/20 | | United States | 500,000 | | | 475,000 |
| McDermott Finance LLC, Term Loan, 8.25% - 8.484%, 4/16/19 | | United States | 141,671 | | | 143,087 |
| | | | | | | 8,074,790 |
franklintempleton.com
Annual Report
91
FRANKLIN INVESTORS SECURITIES TRUST
CONSOLIDATED STATEMENT OF INVESTMENTS
| | | | | |
| Franklin Total Return Fund (continued) | | | | | |
| | | | Principal | | |
| | | Country | Amount* | | Value |
| |
| j,n Senior Floating Rate Interests (continued) | | | | | |
| Health Care Equipment & Services 0.1% | | | | | |
| Carestream Health Inc., Term Loan, 5.00%, 6/07/19 | | United States | 601,029 | $ | 560,352 |
| Community Health Systems Inc., 2018 Term F Loans, 4.083%, | | | | | |
| 12/31/18. | | United States | 3,061,012 | | 2,999,244 |
| | | | | | 3,559,596 |
| Household & Personal Products 0.0%† | | | | | |
| o Spectrum Brands Inc., Term Loans, 5.00%, 6/23/22 | | United States | 34,752 | | 35,128 |
| Materials 0.3% | | | | | |
| The Chemours Co. LLC, Tranche B Term Loan, 3.75%, 5/12/22 | | United States | 4,103,476 | | 4,066,524 |
| Cyanco Intermediate Corp., Initial Term Loan, 5.50%, 5/01/20 | | United States | 588,585 | | 590,057 |
| FMG America Finance Inc. (Fortescue Metals Group), Loans, | | | | | |
| 3.75%, 6/30/19 | | Australia | 3,777,887 | | 3,779,659 |
| Huntsman International LLC, 2015 Extended Term B Dollar Loan, | | | | | |
| 3.534% - 3.644%, 4/19/19 | | United States | 1,293,080 | | 1,301,162 |
| Novelis Inc., Initial Term Loan, 4.00% - 4.088%, 6/02/22 | | Canada | 2,055,020 | | 2,063,754 |
| c OCI Beaumont LLC, Term B-3 Loan, 7.75%, 8/20/19 | | United States | 1,924,716 | | 1,893,439 |
| | | | | | 13,694,595 |
| Media 0.2% | | | | | |
| o Altice U.S. Finance I Corp., 2016 Refinancing Term Loans, 5.50%, | | | | | |
| 1/01/25 | | United States | 235,499 | | 236,677 |
| o AMC Entertainment Holdings Inc., | | | | | |
| 2016 Incremental Term Loan, 5.25%, 12/15/23 | | United States | 91,534 | | 91,244 |
| Initial Term Loans, 5.25%, 12/15/22 | | United States | 143,198 | | 143,195 |
| CSC Holdings Inc. (Cablevision), 2016 Extended Term Loans, | | | | | |
| 3.876%, 10/11/24 | | United States | 1,102,071 | | 1,107,352 |
| o Lions Gate Entertainment Corp., Term Loan A, 5.00%, 10/12/21 | | United States | 1,650,000 | | 1,633,500 |
| o Live Nation Entertainment Inc., Term B-2 Loans, 5.00%, 10/31/23 . | | United States | 91,534 | | 91,763 |
| Radio One Inc., Term Loan B, 5.04%, 12/31/18 | | United States | 6,965,941 | | 6,983,356 |
| UPC Financing Partnership, Facility AN, 4.08%, 8/31/24 | | Netherlands | 287,841 | | 289,675 |
| | | | | | 10,576,762 |
| Pharmaceuticals, Biotechnology & Life Sciences 0.2% | | | | | |
| Endo Luxembourg Finance Co. I S.A.R.L. and Endo LLC, 2015 | | | | | |
| Incremental Term B Loans, 3.75%, 9/25/22 | | United States | 3,738,813 | | 3,738,229 |
| Grifols Worldwide Operations USA Inc., U.S. Tranche B Term Loan, | | | | | |
| 3.46%, 2/27/21 | | United States | 2,823,658 | | 2,851,895 |
| o RPI Finance Trust, Term A-2 Term Loan A, 4.75%, 10/14/20 | | United States | 357,494 | | 355,645 |
| Valeant Pharmaceuticals International Inc., | | | | | |
| Series C-2 Tranche B Term Loan, 5.25%, 12/11/19 | | United States | 640,488 | | 640,969 |
| Series D-2 Tranche B Term Loan, 5.00%, 2/13/19 | | United States | 1,745,646 | | 1,745,491 |
| | | | | | 9,332,229 |
| Retailing 0.1% | | | | | |
| Ascena Retail Group Inc., Tranche B Term Loan, 5.25%, 8/21/22 | | United States | 3,307,851 | | 3,232,045 |
| Dollar Tree Inc., Term A-1 Loans, 2.25%, 7/06/20 | | United States | 611,855 | | 610,895 |
| PetSmart Inc., Tranche B-2 Loans, 4.00%, 3/11/22 | | United States | 2,631,808 | | 2,640,032 |
| | | | | | 6,482,972 |
92 Annual Report
franklintempleton.com
FRANKLIN INVESTORS SECURITIES TRUST
CONSOLIDATED STATEMENT OF INVESTMENTS
| | | | | | |
| Franklin Total Return Fund (continued) | | | | | | |
| | | | Principal | | | |
| | | Country | Amount* | | | Value |
| |
| j,n Senior Floating Rate Interests (continued) | | | | | | |
| Semiconductors & Semiconductor Equipment 0.1% | | | | | | |
| Avago Technologies Cayman Finance Ltd., Term B-3 Loans, | | | | | | |
| 3.535%, 2/01/23 | | Singapore | 1,288,413 | | $ | 1,303,311 |
| MACOM Technology Solutions Holdings Inc., Initial Term Loan, | | | | | | |
| 4.628%, 5/07/21 | | United States | 242,052 | | | 244,775 |
| MKS Instruments Inc., Tranche B-1 Term Loans, 4.25%, 5/01/23 | | United States | 196,428 | | | 198,556 |
| ON Semiconductor Corp., 2016 Replacement Term Loans, | | | | | | |
| 3.777%, 3/31/23 | | United States | 2,691,999 | | | 2,710,746 |
| | | | | | | 4,457,388 |
| Software & Services 0.1% | | | | | | |
| o Global Payments Inc., Delayed Draw Term Loan (A-2), 4.75%, | | | | | | |
| 10/31/21 | . | United States | 1,310,631 | | | 1,308,823 |
| MoneyGram International Inc., Term Loan, 4.25%, 3/27/20 | | United States | 3,788,490 | | | 3,698,513 |
| o Rackspace Hosting Inc., Term B Loan, 6.50%, 11/03/23 | | United States | 457,670 | | | 460,898 |
| | | | | | | 5,468,234 |
| Technology Hardware & Equipment 0.0%† | | | | | | |
| Dell International LLC, Term A-3 Loan, 2.54%, 12/31/18 | | United States | 927,880 | | | 928,315 |
| Western Digital Corp., Term Loan B-1, 4.50%, 4/29/23 | | United States | 581,061 | | | 588,506 |
| Zebra Technologies Corp., Refinancing Term Loan, 4.089%, | | | | | | |
| 10/27/21 | . | United States | 432,524 | | | 437,570 |
| | | | | | | 1,954,391 |
| Telecommunication Services 0.0%† | | | | | | |
| Consolidated Communications Inc., Initial Term Loan, 4.00%, | | | | | | |
| 10/05/23 | . | United States | 229,278 | | | 230,997 |
| Global Tel*Link Corp., Term Loan, 5.00%, 5/23/20 | | United States | 268,059 | | | 261,190 |
| | | | | | | 492,187 |
| Transportation 0.1% | | | | | | |
| Air Canada, Term Loan, 3.614%, 10/06/23. | | Canada | 55,056 | | | 55,297 |
| Navios Maritime Midstream Partners LP, Initial Term Loan, 5.50%, | | | | | | |
| 6/18/20 | | Marshall Islands | 1,718,429 | | | 1,688,356 |
| Navios Maritime Partners LP, Initial Term Loan, 5.25%, 6/27/18 | | Marshall Islands | 59,170 | | | 54,326 |
| XPO Logistics Inc., Refinancing Term Loans, 4.25%, 10/30/21 | | United States | 1,148,068 | | | 1,157,109 |
| | | | | | | 2,955,088 |
| Utilities 0.0%† | | | | | | |
| EFS Cogen Holdings I LLC (Linden), Term B Advance, 5.25%, | | | | | | |
| 6/28/23 | | United States | 164,717 | | | 166,570 |
| NRG Energy Inc., Term Loans, 3.50%, 6/30/23. | | United States | 1,047,375 | | | 1,050,779 |
| | | | | | | 1,217,349 |
| Total Senior Floating Rate Interests | | | | | | |
| (Cost $75,239,805) | | | | | | 75,229,792 |
| |
| Foreign Government and Agency Securities 4.1% | | | | | | |
| The Export-Import Bank of Korea, senior note, 2.25%, 1/21/20 | | South Korea | 18,800,000 | | | 19,012,346 |
| Government of Hungary, | | | | | | |
| 5.50%, 12/22/16 | | Hungary | 3,092,050,000 | HUF | | 11,063,399 |
| 6.00%, 1/11/19 | | Hungary | 1,820,000 | EUR | | 2,252,283 |
| A, 6.75%, 11/24/17 | | Hungary | 1,457,960,000 | HUF | | 5,529,964 |
| A, 5.50%, 12/20/18 | | Hungary | 205,390,000 | HUF | | 802,336 |
| g senior bond, Reg S, 3.875%, 2/24/20 | | Hungary | 285,000 | EUR | | 351,199 |
| g senior note, Reg S, 4.375%, 7/04/17 | | Hungary | 215,000 | EUR | | 243,251 |
franklintempleton.com
Annual Report
93
FRANKLIN INVESTORS SECURITIES TRUST
CONSOLIDATED STATEMENT OF INVESTMENTS
| | | | | | |
| Franklin Total Return Fund (continued) | | | | | | |
| | | Principal | | | | |
| | Country | Amount* | | | | Value |
| |
| Foreign Government and Agency | | | | | | |
| Securities (continued) | | | | | | |
| Government of Hungary, (continued) | | | | | | |
| g senior note, Reg S, 5.75%, 6/11/18 | Hungary | 695,000 | | EUR | $ | 832,936 |
| h Government of Lithuania, 144A, 7.375%, 2/11/20 | Lithuania | 4,670,000 | | | | 5,490,029 |
| Government of Malaysia, | | | | | | |
| 3.80%, 8/17/23 | Malaysia | 35,300,000 | | MYR | | 8,560,355 |
| senior bond, 4.24%, 2/07/18 | Malaysia | 41,200,000 | | MYR | | 10,020,488 |
| senior bond, 3.26%, 3/01/18 | Malaysia | 18,700,000 | | MYR | | 4,494,464 |
| senior note, 4.012%, 9/15/17. | Malaysia | 76,500,000 | | MYR | | 18,475,981 |
| Government of Mexico, | | | | | | |
| 7.25%, 12/15/16 | Mexico | 3,414,390 | q | MXN | | 18,141,163 |
| 7.75%, 12/14/17 | Mexico | 2,600,000 | q | MXN | | 14,178,437 |
| M, 4.75%, 6/14/18 | Mexico | 2,940,000 | q | MXN | | 15,418,145 |
| senior note, 8.50%, 12/13/18. | Mexico | 2,000,000 | q | MXN | | 11,220,642 |
| h Government of Serbia, senior note, 144A, 4.875%, 2/25/20 | Serbia | 6,000,000 | | | | 6,219,240 |
| h Government of Spain, senior bond, 144A, 2.75%, 10/31/24 | Spain | 5,700,000 | | EUR | | 7,159,433 |
| h Government of Ukraine, | | | | | | |
| 144A, 7.75%, 9/01/20. | Ukraine | 292,000 | | | | 289,839 |
| 144A, 7.75%, 9/01/21. | Ukraine | 229,000 | | | | 226,469 |
| 144A, 7.75%, 9/01/22. | Ukraine | 229,000 | | | | 224,552 |
| 144A, 7.75%, 9/01/23. | Ukraine | 229,000 | | | | 223,281 |
| 144A, 7.75%, 9/01/24. | Ukraine | 229,000 | | | | 221,306 |
| 144A, 7.75%, 9/01/25. | Ukraine | 229,000 | | | | 220,075 |
| 144A, 7.75%, 9/01/26. | Ukraine | 229,000 | | | | 219,273 |
| 144A, 7.75%, 9/01/27. | Ukraine | 229,000 | | | | 218,409 |
| a,r 144A, VRI, GDP Linked Securities, 5/31/40. | Ukraine | 474,000 | | | | 152,291 |
| h Government of Vietnam, 144A, 6.75%, 1/29/20 | Vietnam | 5,120,000 | | | | 5,708,800 |
| Italy Treasury Bond, 2.50%, 12/01/24 | Italy | 6,000,000 | | EUR | | 7,171,551 |
| Korea Treasury Bond, senior note, 3.00%, 12/10/16 | South Korea | 21,100,000,000 | | KRW | | 18,482,051 |
| s Nota Do Tesouro Nacional, Index Linked, 6.00%, 8/15/18 | Brazil | 13,695 | t | BRL | | 12,585,900 |
| h Peru Enhanced Pass-Through Finance Ltd., senior secured bond, | | | | | | |
| A-1, 144A, zero cpn., 5/31/18 | Peru | 290,479 | | | | 282,701 |
| Total Foreign Government and Agency Securities | | | | | | |
| (Cost $229,396,449) | | | | | | 205,692,589 |
| |
| U.S. Government and Agency Securities 17.9% | | | | | | |
| U.S. Treasury Bond, | | | | | | |
| 6.25%, 8/15/23 | United States | 60,000,000 | | | | 78,155,880 |
| 4.75%, 2/15/37 | United States | 8,000,000 | | | | 11,223,280 |
| 3.875%, 8/15/40 | United States | 52,000,000 | | | | 65,132,028 |
| 4.75%, 2/15/41 | United States | 34,000,000 | | | | 48,204,962 |
| 3.75%, 8/15/41 | United States | 25,000,000 | | | | 30,796,375 |
| 3.125%, 2/15/43 | United States | 17,000,000 | | | | 18,928,769 |
| 2.875%, 5/15/43 | United States | 82,000,000 | | | | 87,179,448 |
| 2.875%, 8/15/45 | United States | 5,000,000 | | | | 5,306,835 |
| 2.50%, 2/15/46 | United States | 35,000,000 | | | | 34,397,055 |
| u Index Linked, 2.375%, 1/15/25 | United States | 21,082,018 | | | | 24,979,894 |
| U.S. Treasury Note, | | | | | | |
| 1.375%, 12/31/18 | United States | 50,000,000 | | | | 50,500,000 |
| 3.625%, 2/15/21 | United States | 25,000,000 | | | | 27,475,100 |
| 3.125%, 5/15/21 | United States | 90,000,000 | | | | 97,245,720 |
| 2.125%, 6/30/21 | United States | 75,000,000 | | | | 77,770,050 |
| 2.00%, 8/31/21 | United States | 30,000,000 | | | | 30,923,430 |
94 Annual Report
franklintempleton.com
FRANKLIN INVESTORS SECURITIES TRUST
CONSOLIDATED STATEMENT OF INVESTMENTS
| | | | | | |
| | Franklin Total Return Fund (continued) | | | | | |
| | | | | Principal | | |
| | | | Country | Amount* | | Value |
| |
| | U.S. Government and Agency Securities (continued) | | | | | |
| | U.S. Treasury Note, (continued) | | | | | |
| | 2.125%, 12/31/21 | | United States | 23,000,000 | $ | 23,852,610 |
| | 2.00%, 11/30/22 | | United States | 36,900,000 | | 37,929,879 |
| | 2.125%, 12/31/22 | | United States | 60,500,000 | | 62,617,500 |
| | u Index Linked, 0.125%, 7/15/24 | | United States | 75,565,492 | | 76,406,309 |
| | Total U.S. Government and Agency Securities | | | | | |
| | (Cost $876,803,353) | | | | | 889,025,124 |
| |
| | Asset-Backed Securities and Commercial | | | | | |
| | Mortgage-Backed Securities 13.7% | | | | | |
| | Banks 2.7% | | | | | |
| | Banc of America Commercial Mortgage Trust, | | | | | |
| | v 2006-4, AJ, 5.695%, 7/10/46 | | United States | 4,527,711 | | 4,497,957 |
| | j 2007-3, AM, FRN, 5.732%, 6/10/49 | | United States | 17,730,000 | | 18,042,640 |
| | Bear Stearns Commercial Mortgage Securities Trust, | | | | | |
| | j 2006-PW11, AJ, FRN, 5.569%, 3/11/39 | | United States | 17,194,000 | | 16,532,818 |
| | 2006-PW13, AJ, 5.611%, 9/11/41 | | United States | 1,771,959 | | 1,779,704 |
| | j 2007-PW16, AM, FRN, 5.90%, 6/11/40 | | United States | 11,110,000 | | 11,338,862 |
| | j Citibank Credit Card Issuance Trust, | | | | | |
| | 2013-A7, A7, FRN, 0.959%, 9/10/20 | | United States | 11,130,000 | | 11,187,035 |
| | 2013-A12, A12, FRN, 1.018%, 11/07/18 | | United States | 7,050,000 | | 7,050,216 |
| | Citigroup Commercial Mortgage Trust, 2006-C5, AJ, 5.482%, | | | | | |
| | 10/15/49 | . | United States | 10,492,000 | | 9,849,908 |
| | j,v Commercial Mortgage Trust, 2006-GG7, AJ, FRN, 5.951%, | | | | | |
| | 7/10/38 | | United States | 8,491,000 | | 7,837,711 |
| | Credit Suisse First Boston Mortgage Securities Corp., 2004-6, | | | | | |
| | 3A1, 5.00%, 9/25/19 | | United States | 640,660 | | 658,421 |
| | h,j CSMC, 2009-15R, 3A1, 144A, FRN, 2.965%, 3/26/36 | | United States | 3,402,208 | | 3,376,371 |
| | j CWABS Inc. Asset-Backed Certificates, 2004-1, M1, FRN, | | | | | |
| | 1.284%, 3/25/34 | | United States | 1,784,304 | | 1,731,717 |
| | j FNMA, 2005-122, FN, FRN, 0.884%, 1/25/36. | | United States | 514,480 | | 511,374 |
| | j Greenwich Capital Commercial Funding Corp., 2006-GG7, AM, | | | | | |
| | FRN, 5.951%, 7/10/38 | | United States | 2,038,959 | | 2,036,603 |
| | j,v JP Morgan Chase Commercial Mortgage Securities Trust, | | | | | |
| | 2006-CB16, B, FRN, 5.672%, 5/12/45 | | United States | 6,745,000 | | 2,747,309 |
| j LB-UBS Commercial Mortgage Trust, 2006-C4, AJ, FRN, 6.078%, | | | | | |
| | 6/15/38 | | United States | 272,235 | | 272,842 |
| | j Merrill Lynch Mortgage Investors Trust, 2003-A, 1A, FRN, 1.274%, | | | | | |
| | 3/25/28 | | United States | 1,516,963 | | 1,446,711 |
| | j Morgan Stanley ABS Capital I Inc. Trust, 2005-WMC, M2, FRN, | | | | | |
| | 1.269%, 1/25/35 | | United States | 2,127,703 | | 2,101,560 |
| | j Morgan Stanley Capital I Trust, | | | | | |
| | 2006-HQ8, AJ, FRN, 5.589%, 3/12/44 | | United States | 5,200,730 | | 5,225,887 |
| | 2007-IQ16, AM, FRN, 6.053%, 12/12/49 | | United States | 16,470,000 | | 17,079,186 |
| | j Wachovia Bank Commercial Mortgage Trust, 2006-C25, C, FRN, | | | | | |
| | 5.812%, 5/15/43 | | United States | 6,683,000 | | 6,668,238 |
| | k Weyerhaeuser Mortgage Co., 1984-A, 7.43%, 1/01/24 | | United States | 15,780 | | 15,780 |
| | | | | | | 131,988,850 |
| | Diversified Financials 11.0% | | | | | |
| | j American Express Credit Account Master Trust, | | | | | |
| | 2008-2, A, FRN, 1.795%, 9/15/20 | | United States | 15,550,000 | | 15,772,782 |
| | 2012-1, A, FRN, 0.805%, 1/15/20 | | United States | 8,160,000 | | 8,169,348 |
franklintempleton.com
Annual Report
95
FRANKLIN INVESTORS SECURITIES TRUST
CONSOLIDATED STATEMENT OF INVESTMENTS
| | | | |
| Franklin Total Return Fund (continued) | | | | |
| | | Principal | | |
| | Country | Amount* | | Value |
| |
| Asset-Backed Securities and Commercial | | | | |
| Mortgage-Backed Securities (continued) | | | | |
| Diversified Financials (continued) | | | | |
| j American Express Credit Account Secured Note Trust, 2012-4, A, | | | | |
| FRN, 0.775%, 5/15/20 | United States | 11,193,000 | $ | 11,204,589 |
| j American Home Mortgage Investment Trust, 2004-3, 4A, FRN, | | | | |
| 2.745%, 10/25/34 | United States | 1,947,492 | | 1,905,081 |
| j,v Ameriquest Mortgage Securities Inc. Asset-Backed Pass-Through | | | | |
| Certificates, 2004-R4, M1, FRN, 1.359%, 6/25/34 | United States | 6,014,310 | | 5,922,248 |
| h Apidos CDO, 2013-14A, C2, 144A, 4.85%, 4/15/25 | United States | 8,740,000 | | 8,809,133 |
| h,j ARCap REIT Inc., 2004-RR3, A2, 144A, FRN, 4.76%, 9/21/45 | United States | 7,041,473 | | 7,129,703 |
| h,j Ares Enhanced Loan Investment Strategy Ltd., 2013-IRAR, BR, | | | | |
| 144A, FRN, 3.932%, 7/23/25 | United States | 900,000 | | 895,824 |
| h,j Ares IIIR/IVR CLO Ltd., | | | | |
| 2007-3RA, A2, 144A, FRN, 1.10%, 4/16/21 | United States | 2,480,207 | | 2,463,962 |
| 2007-3RA, B, 144A, FRN, 1.25%, 4/16/21 | United States | 9,780,000 | | 9,579,901 |
| j Argent Securities Inc. Asset-Backed Pass-Through Certificates, | | | | |
| 2005-W2, A2C, FRN, 0.894%, 10/25/35 | United States | 4,291,634 | | 4,144,182 |
| h,j Atrium IX, | | | | |
| 9A, A, 144A, FRN, 2.129%, 2/28/24 | United States | 3,360,000 | | 3,364,939 |
| 9A, C, 144A, FRN, 4.079%, 2/28/24 | United States | 3,500,000 | | 3,505,005 |
| h,j Atrium X, | | | | |
| 10A, A, 144A, FRN, 2.00%, 7/16/25 | United States | 3,890,000 | | 3,879,692 |
| 10A, C, 144A, FRN, 3.48%, 7/16/25 | United States | 4,650,000 | | 4,622,519 |
| h,j Ballyrock CLO LLC, 2014-1A, B, 144A, FRN, 4.081%, 10/20/26 | United States | 10,000,000 | | 10,054,200 |
| j Bear Stearns ALT-A Trust, 2004-13, A2, FRN, 1.414%, 11/25/34 | United States | 996,834 | | 957,949 |
| h,j BlueMountain CLO Ltd., | | | | |
| 2011-1A, B, 144A, FRN, 2.818%, 8/16/22 | Cayman Islands | 2,500,000 | | 2,508,225 |
| 2011-1A, C, 144A, FRN, 3.818%, 8/16/22. | Cayman Islands | 1,800,000 | | 1,808,640 |
| 2013-3A, A, 144A, FRN, 2.287%, 10/29/25 | United States | 2,638,970 | | 2,639,049 |
| h,j Bridgeport CLO Ltd., 2006-1A, B, 144A, FRN, 1.531%, 7/21/20 | United States | 2,000,000 | | 1,997,160 |
| j Capital One Multi-Asset Execution Trust, | | | | |
| 2007-A1, A1, FRN, 0.585%, 11/15/19 | United States | 4,400,000 | | 4,399,323 |
| 2007-A2, A2, FRN, 0.615%, 12/16/19 | United States | 26,136,000 | | 26,137,004 |
| h,j Carlyle Global Market Strategies CLO Ltd., 2012-4A, AR, 144A, | | | | |
| FRN, 2.33%, 1/20/29 | United States | 6,280,000 | | 6,289,106 |
| h,j Carlyle Global Market Strategies Ltd., 2014-2A, B2, 144A, FRN, | | | | |
| 2.867%, 5/15/25 | United States | 3,400,000 | | 3,425,024 |
| h,j Catamaran CLO Ltd., 2014-2A, B, 144A, FRN, 3.882%, 10/18/26 | United States | 6,401,000 | | 6,404,969 |
| h,j Cent CDO Ltd., | | | | |
| 2007-15A, A2B, 144A, FRN, 1.185%, 3/11/21 | United States | 5,686,824 | | 5,450,593 |
| 2007-15A, B, 144A, FRN, 1.565%, 3/11/21 | United States | 8,500,000 | | 7,989,065 |
| h,j Cent CLO, 2013-17A, A1, 144A, FRN, 2.187%, 1/30/25 | United States | 16,246,000 | | 16,218,382 |
| h,j Cent CLO 20 Ltd., | | | | |
| 2013-20A, A, 144A, FRN, 2.362%, 1/25/26 | United States | 8,000,000 | | 8,017,680 |
| 2013-20A, C, 144A, FRN, 3.882%, 1/25/26 | United States | 3,500,000 | | 3,504,445 |
| h,j Cent CLO 21 Ltd., 2014-21A, B, 144A, FRN, 3.686%, 7/27/26 | United States | 1,760,000 | | 1,744,600 |
| h,j Cent CLO LP, 2013-17A, B, 144A, FRN, 3.887%, 1/30/25 | United States | 3,500,000 | | 3,533,775 |
| j Chase Funding Trust, 2004-2, 2A2, FRN, 1.034%, 2/26/35 | United States | 625,033 | | 574,038 |
| j Chase Issuance Trust, 2013-A6, A6, FRN, 0.955%, 7/15/20. | United States | 17,443,000 | | 17,523,498 |
| h,j CIFC Funding Ltd., 2007-3A, A1J, 144A, FRN, 1.284%, 7/26/21 | United States | 11,507,045 | | 11,439,729 |
| h,j Citigroup Mortgage Loan Trust, 2013-A, A, 144A, FRN, 3.00%, | | | | |
| 5/25/42 | United States | 2,959,408 | | 2,950,243 |
96 Annual Report
franklintempleton.com
FRANKLIN INVESTORS SECURITIES TRUST
CONSOLIDATED STATEMENT OF INVESTMENTS
| | | | |
| Franklin Total Return Fund (continued) | | | | |
| | | Principal | | |
| | Country | Amount* | | Value |
| |
| Asset-Backed Securities and Commercial | | | | |
| Mortgage-Backed Securities (continued) | | | | |
| Diversified Financials (continued) | | | | |
| h,j Colony American Homes, | | | | |
| 2014-1A, A, 144A, FRN, 1.685%, 5/17/31. | United States | 9,527,928 | $ | 9,553,394 |
| 2014-2A, C, 144A, FRN, 2.435%, 7/17/31. | United States | 10,105,000 | | 10,097,558 |
| h Colony MFM Trust, 2014-1, A, 144A, 2.543%, 4/20/50. | United States | 9,642,446 | | 9,613,652 |
| h,j Cornerstone CLO Ltd., 2007-1A, B, 144A, FRN, 1.83%, 7/15/21 | United States | 8,986,000 | | 8,900,543 |
| h CountryPlace Manufactured Housing Contract Trust, 2005-1, A3, | | | | |
| 144A, 4.80%, 12/15/35 | United States | 4,020 | | 4,015 |
| h,j Dryden 33 Senior Loan Fund, 2014-33A, A, 144A, FRN, 2.36%, | | | | |
| 7/15/26 | United States | 9,130,000 | | 9,127,078 |
| h,j Dryden Senior Loan Fund, 2015-38A, A, 144A, FRN, 2.31%, | | | | |
| 7/15/27 | Cayman Islands | 21,757,143 | | 21,764,540 |
| h,j Eaton Vance CDO Ltd., | | | | |
| 2014-1A, A, 144A, FRN, 2.33%, 7/15/26 | United States | 10,096,000 | | 10,096,606 |
| 2014-1A, B, 144A, FRN, 2.93%, 7/15/26. | United States | 1,813,400 | | 1,815,630 |
| 2014-1A, C, 144A, FRN, 3.88%, 7/15/26 | United States | 1,558,600 | | 1,557,743 |
| h,j Eleven Madison Trust Mortgage Trust, 2015-11MD, A, 144A, FRN, | | | | |
| 3.555%, 9/10/35 | United States | 3,255,000 | | 3,490,150 |
| h Emerson Park CLO Ltd., 2013-1A, C2, 144A, 5.64%, 7/15/25. | United States | 2,920,000 | | 2,952,295 |
| j FHLMC Structured Agency Credit Risk Debt Notes, | | | | |
| 2014-DN3, M3, FRN, 4.534%, 8/25/24 | United States | 3,028,000 | | 3,165,518 |
| 2014-DN4, M3, FRN, 5.084%, 10/25/24 | United States | 9,500,000 | | 10,056,837 |
| 2015-DN1, M3, FRN, 4.684%, 1/25/25 | United States | 9,310,000 | | 9,730,870 |
| 2015-HQ1, M3, FRN, 4.334%, 3/25/25 | United States | 2,000,000 | | 2,089,158 |
| h,j Galaxy XV CLO Ltd., 2013-15A, A, 144A, FRN, 2.13%, 4/15/25 | United States | 15,465,000 | | 15,452,628 |
| h G-Force LLC, 2005-RRA, C, 144A, 5.20%, 8/22/36 | United States | 9,275,000 | | 8,942,630 |
| v GMAC Commercial Mortgage Securities Inc. Trust, 2005-C1, B, | | | | |
| 4.936%, 5/10/43 | United States | 9,113,687 | | 1,535,939 |
| Green Tree Financial Corp., 1996-9, M1, 7.63%, 8/15/27 | United States | 2,799,771 | | 3,050,438 |
| j,v GSAA Home Equity Trust, 2005-5, M3, FRN, 1.479%, 2/25/35 | United States | 3,550,000 | | 3,411,457 |
| h Highbridge Loan Management Ltd., 2013-2A, B2, 144A, 5.80%, | | | | |
| 10/20/24. | United States | 2,620,000 | | 2,664,199 |
| j Home Equity Mortgage Trust, 2004-4, M3, FRN, 1.509%, 12/25/34. | United States | 3,170,745 | | 3,029,532 |
| h,j Invitation Homes Trust, | | | | |
| 2014-SFR3, C, 144A, FRN, 3.035%, 12/17/31. | United States | 1,250,000 | | 1,259,018 |
| 2015-SFR1, B, 144A, FRN, 2.385%, 3/17/32. | United States | 7,400,000 | | 7,443,299 |
| 2015-SFR2, C, 144A, FRN, 2.531%, 6/17/32 | United States | 2,340,000 | | 2,342,425 |
| 2015-SFR3, C, 144A, FRN, 2.528%, 8/17/32 | United States | 10,402,000 | | 10,394,874 |
| JP Morgan Chase Commercial Mortgage Securities Trust, | | | | |
| 2006-CB17, AM, 5.464%, 12/12/43 | United States | 13,790,000 | | 13,778,939 |
| h,j Katonah Ltd., 2007-IA, A2L, 144A, FRN, 2.382%, 4/23/22 | United States | 5,416,684 | | 5,389,763 |
| h,j LCM XI LP, 11A, B, 144A, FRN, 3.028%, 4/19/22 | United States | 10,000,000 | | 10,025,800 |
| j Merrill Lynch Mortgage Investors Trust, 2004-A1, M1, FRN, 2.90%, | | | | |
| 2/25/34 | United States | 1,560,917 | | 1,249,904 |
| h,j Mountain View CLO II Ltd., 2006-2A, C, 144A, FRN, 1.574%, | | | | |
| 1/12/21 | United States | 4,000,000 | | 3,894,680 |
| h,j NZCG Funding Ltd., 2015-2A, A1, 144A, FRN, 2.436%, 4/27/27 | United States | 18,215,625 | | 18,247,138 |
| h,j Octagon Investment Partners XXIII Ltd., | | | | |
| 2015-1A, A1, 144A, FRN, 2.30%, 7/15/27. | United States | 7,581,042 | | 7,578,616 |
| 2015-1A, A2, 144A, FRN, 2.30%, 7/15/27. | United States | 7,197,192 | | 7,191,866 |
franklintempleton.com
Annual Report
97
FRANKLIN INVESTORS SECURITIES TRUST
CONSOLIDATED STATEMENT OF INVESTMENTS
| | | | | |
| Franklin Total Return Fund (continued) | | | | | |
| | | | Principal | | |
| | | Country | Amount* | | Value |
| |
| Asset-Backed Securities and Commercial | | | | | |
| Mortgage-Backed Securities (continued) | | | | | |
| Diversified Financials (continued) | | | | | |
| h,j Progress Residential Trust, 2015-SFR1, A, 144A, FRN, 1.928%, | | | | | |
| 2/17/32 | | United States | 5,674,533 | $ | 5,701,348 |
| Residential Asset Securities Corp., 2001-KS2, AI5, 7.514%, | | | | | |
| 6/25/31 | | United States | 7,307 | | 7,488 |
| h,j Silverado CLO 2006-II Ltd., 2006-2A, B, 144A, FRN, 1.57%, | | | | | |
| 10/16/20 | . | United States | 9,000,000 | | 8,748,450 |
| j Structured Asset Securities Corp., 2002-1A, 2A1, FRN, 2.243%, | | | | | |
| 2/25/32 | | United States | 21,124 | | 19,276 |
| h,j Treman Park CLO Ltd., 2015-1A, A, 144A, FRN, 2.381%, 4/20/27 . | | Cayman Islands | 6,500,000 | | 6,528,795 |
| h,j Tricon American Homes Trust, 2015-SFR1, C, 144A, FRN, | | | | | |
| 2.435%, 5/17/32 | | United States | 8,170,000 | | 8,123,344 |
| h,j Trimaran CLO VII Ltd., 2007-1A, A2L, 144A, FRN, 1.22%, 6/15/21 . | | United States | 2,000,000 | | 1,990,520 |
| h,j Voya CLO Ltd., | | | | | |
| 2013-3A, A2, 144A, FRN, 2.682%, 1/18/26 | | United States | 900,000 | | 897,408 |
| 2014-4A, A1, 144A, FRN, 2.381%, 10/14/26 | | Cayman Islands | 7,620,000 | | 7,625,715 |
| 2015-1A, A1, 144A, FRN, 2.362%, 4/18/27 | | United States | 7,745,000 | | 7,744,690 |
| h,j Voya CLO II Ltd., 2006-2A, C, 144A, FRN, 1.459%, 8/01/20 | | United States | 3,500,000 | | 3,499,895 |
| Wells Fargo Mortgage Backed Securities Trust, | | | | | |
| j 2004-W, A9, FRN, 2.99%, 11/25/34 | | United States | 1,594,004 | | 1,617,239 |
| v 2007-3, 3A1, 5.50%, 4/25/22. | | United States | 258,877 | | 265,395 |
| h,j West CLO Ltd., | | | | | |
| 2014-1A, A2, 144A, FRN, 2.982%, 7/18/26 | | United States | 2,860,000 | | 2,860,315 |
| 2014-1A, B, 144A, FRN, 3.732%, 7/18/26 | | United States | 7,540,000 | | 7,468,219 |
| h,j Westchester CLO Ltd., 2007-1A, A1A, 144A, FRN, 0.982%, | | | | | |
| 8/01/22 | | United States | 980,387 | | 974,034 |
| h,j Ziggurat CLO I Ltd., 2014-1A, C, 144A, FRN, 3.98%, 10/17/26 | | United States | 2,000,000 | | 2,001,860 |
| | | | | | 543,908,328 |
| Insurance 0.0%† | | | | | |
| h,j Voya CLO III Ltd., 2006-3A, B, 144A, FRN, 1.56%, 12/13/20 | | United States | 2,000,000 | | 1,999,000 |
| Real Estate 0.0%† | | | | | |
| h,j American Homes 4 Rent, 2014-SFR1, A, 144A, FRN, 1.535%, | | | | | |
| 6/17/31 | | United States | 2,227,084 | | 2,221,745 |
| Total Asset-Backed Securities and Commercial | | | | | |
| Mortgage-Backed Securities (Cost $679,003,081). | | | | | 680,117,923 |
| |
| Mortgage-Backed Securities 20.9% | | | | | |
| j Federal Home Loan Mortgage Corp. (FHLMC) Adjustable Rate | | | | | |
| 0.1% | | | | | |
| FHLMC, 1.943%, 11/01/27 | | United States | 1,794,626 | | 1,847,614 |
| Federal Home Loan Mortgage Corp. (FHLMC) Fixed Rate | | | | | |
| 10.6% | | | | | |
| FHLMC 30 Year, 6.00%, 6/01/37 | | United States | 59,482 | | 68,399 |
| FHLMC 30 Year, 6.50%, 8/01/25 - 11/01/31 | | United States | 94,367 | | 108,159 |
| FHLMC 30 Year, 7.00%, 7/01/31 | | United States | 6,742 | | 7,148 |
| FHLMC 30 Year, 8.00%, 2/01/30 | | United States | 29,379 | | 36,826 |
| FHLMC 30 Year, 8.50%, 10/01/24 | | United States | 5,549 | | 6,310 |
| FHLMC Gold 15 Year, 5.00%, 10/01/17 - 9/01/18 | | United States | 25,335 | | 26,049 |
| FHLMC Gold 15 Year, 5.50%, 11/01/22 | | United States | 130,578 | | 137,665 |
| FHLMC Gold 15 Year, 6.00%, 2/01/17 - 9/01/22 | | United States | 431,332 | | 463,090 |
| FHLMC Gold 30 Year, 3.00%, 9/01/46 | | United States | 134,010,198 | | 138,124,368 |
98 Annual Report
franklintempleton.com
FRANKLIN INVESTORS SECURITIES TRUST
CONSOLIDATED STATEMENT OF INVESTMENTS
| | | | |
| Franklin Total Return Fund (continued) | | | | |
| | | Principal | | |
| | Country | Amount* | | Value |
| |
| Mortgage-Backed Securities (continued) | | | | |
| Federal Home Loan Mortgage Corp. (FHLMC) Fixed | | | | |
| Rate (continued) | | | | |
| w FHLMC Gold 30 Year, 3.00%, 11/01/46 | United States | 16,000,000 | $ | 16,473,125 |
| FHLMC Gold 30 Year, 3.50%, 8/01/46 | United States | 83,918,248 | | 88,200,962 |
| FHLMC Gold 30 Year, 4.00%, 6/01/46 | United States | 141,052,088 | | 151,249,302 |
| FHLMC Gold 30 Year, 4.00%, 8/01/46 | United States | 98,971,643 | | 106,063,706 |
| FHLMC Gold 30 Year, 4.50%, 3/01/39 | United States | 2,522,109 | | 2,763,636 |
| FHLMC Gold 30 Year, 5.00%, 8/01/33 - 2/01/39 | United States | 16,086,488 | | 17,811,087 |
| FHLMC Gold 30 Year, 5.50%, 1/01/35 - 12/01/37 | United States | 1,421,234 | | 1,611,297 |
| FHLMC Gold 30 Year, 6.00%, 5/01/33 - 4/01/38 | United States | 1,811,745 | | 2,078,010 |
| FHLMC Gold 30 Year, 6.50%, 4/01/28 - 3/01/39 | United States | 1,283,971 | | 1,490,721 |
| FHLMC Gold 30 Year, 7.00%, 1/01/28 - 7/01/32 | United States | 94,508 | | 109,366 |
| FHLMC Gold 30 Year, 7.50%, 3/01/32 | United States | 21,918 | | 26,458 |
| FHLMC Gold 30 Year, 8.50%, 8/01/30 | United States | 3,909 | | 4,956 |
| FHLMC Gold 30 Year, 9.00%, 1/01/22 | United States | 1,332 | | 1,347 |
| FHLMC Gold 30 Year, 10.00%, 10/01/30 | United States | 13,565 | | 13,789 |
| | | | | 526,875,776 |
| j Federal National Mortgage Association (FNMA) Adjustable | | | | |
| Rate 0.1% | | | | |
| FNMA, 1.943% - 4.103%, 12/01/24 - 3/01/37 | United States | 6,427,265 | | 6,787,337 |
| Federal National Mortgage Association (FNMA) Fixed Rate | | | | |
| 6.3% | | | | |
| FNMA 15 Year, 4.50%, 3/01/19 - 6/01/19 | United States | 87,999 | | 90,564 |
| FNMA 15 Year, 5.00%, 6/01/18 - 7/01/18 | United States | 60,260 | | 61,860 |
| FNMA 15 Year, 5.50%, 12/01/16 - 12/01/23 | United States | 241,690 | | 258,769 |
| FNMA 15 Year, 6.00%, 6/01/17 - 9/01/22 | United States | 69,357 | | 72,396 |
| FNMA 30 Year, 3.00%, 8/01/46 | United States | 133,292,034 | | 137,398,576 |
| w FNMA 30 Year, 3.00%, 11/01/46 | United States | 21,000,000 | | 21,623,438 |
| FNMA 30 Year, 3.50%, 7/01/46 | United States | 120,251,887 | | 126,317,448 |
| FNMA 30 Year, 5.00%, 6/01/36 - 5/01/39 | United States | 2,405,065 | | 2,663,464 |
| FNMA 30 Year, 5.50%, 6/01/33 - 8/01/37 | United States | 8,439,796 | | 9,619,065 |
| FNMA 30 Year, 6.00%, 9/01/32 - 9/01/38 | United States | 11,600,529 | | 13,304,524 |
| FNMA 30 Year, 6.50%, 5/01/28 - 5/01/37 | United States | 326,185 | | 375,389 |
| FNMA 30 Year, 7.00%, 11/01/25 | United States | 3,949 | | 4,002 |
| FNMA 30 Year, 7.50%, 1/01/30 | United States | 15,607 | | 19,228 |
| FNMA 30 Year, 8.50%, 4/01/30 - 5/01/32 | United States | 89,142 | | 111,695 |
| FNMA 30 Year, 9.00%, 11/01/26 - 5/01/27 | United States | 109,380 | | 118,946 |
| | | | | 312,039,364 |
| j Government National Mortgage Association (GNMA) | | | | |
| Adjustable Rate 0.0%† | | | | |
| GNMA, 2.00%, 1/20/23 - 10/20/26 | United States | 51,773 | | 53,411 |
| Government National Mortgage Association (GNMA) Fixed | | | | |
| Rate 3.8% | | | | |
| GNMA I SF 30 Year, 6.00%, 1/15/39 | United States | 244,296 | | 279,975 |
| GNMA I SF 30 Year, 6.50%, 10/15/31 - 7/15/38 | United States | 50,114 | | 59,650 |
| GNMA I SF 30 Year, 7.00%, 10/15/27 - 6/15/31 | United States | 41,268 | | 48,613 |
| GNMA I SF 30 Year, 7.50%, 2/15/17 - 5/15/26 | United States | 106,319 | | 110,287 |
| GNMA I SF 30 Year, 9.00%, 9/15/25 - 1/15/31 | United States | 1,670 | | 1,733 |
| GNMA II SF 30 Year, 3.00%, 8/20/46. | United States | 79,482,435 | | 82,917,966 |
| w GNMA II SF 30 Year, 3.00%, 11/01/46 | United States | 9,000,000 | | 9,374,766 |
| GNMA II SF 30 Year, 3.50%, 8/20/46. | United States | 90,292,404 | | 95,753,168 |
franklintempleton.com
Annual Report
99
FRANKLIN INVESTORS SECURITIES TRUST
CONSOLIDATED STATEMENT OF INVESTMENTS
| | | | |
| Franklin Total Return Fund (continued) | | | | |
| | | Principal | | |
| | Country | Amount* | | Value |
| |
| Mortgage-Backed Securities (continued) | | | | |
| Government National Mortgage Association (GNMA) Fixed | | | | |
| Rate (continued) | | | | |
| GNMA II SF 30 Year, 6.00%, 5/20/31. | United States | 5,869 | $ | 6,807 |
| GNMA II SF 30 Year, 6.50%, 3/20/28 - 7/20/38 | United States | 595,548 | | 697,242 |
| GNMA II SF 30 Year, 7.50%, 8/20/30 - 1/20/33 | United States | 58,368 | | 69,600 |
| | | | | 189,319,807 |
| Total Mortgage-Backed Securities | | | | |
| (Cost $1,036,887,556) | | | | 1,036,923,309 |
| |
| Municipal Bonds 1.7% | | | | |
| California State GO, Various Purpose, 6.00%, 11/01/39. | United States | 2,385,000 | | 2,729,084 |
| Chicago Transit Authority Sales and Transfer Tax Receipts | | | | |
| Revenue, Pension Funding, Series A, 6.899%, 12/01/40 | United States | 800,000 | | 1,036,968 |
| Connecticut State GO, Series B, 5.00%, 4/15/18. | United States | 650,000 | | 687,141 |
| Industry Public Facilities Authority Tax Allocation Revenue, | | | | |
| Transportation District, Industrial Redevelopment Project No. 2, | | | | |
| Refunding, Series B, AGMC Insured, 4.294%, 1/01/23 | United States | 10,000,000 | | 10,328,100 |
| Minnesota State GO, Various Purpose, Refunding, Series F, | | | | |
| 4.00%, 10/01/24 | United States | 5,760,000 | | 6,656,889 |
| New Jersey EDA Revenue, School Facilities Construction, | | | | |
| Refunding, Series NN, 5.00%, 3/01/30 | United States | 3,300,000 | | 3,608,022 |
| Port Authority of New York and New Jersey Revenue, | | | | |
| Consolidated, One Hundred Ninety-First Series, 4.823%, | | | | |
| 6/01/45 | United States | 4,570,000 | | 4,990,577 |
| Consolidated, Series 192, 4.81%, 10/15/65. | United States | 15,000,000 | | 17,350,800 |
| Providence St. Joseph Health Obligated Group, 2.746%, 10/01/26 . | United States | 8,875,000 | | 8,805,509 |
| Puerto Rico Electric Power Authority Power Revenue, Series A, | | | | |
| 6.75%, 7/01/36 | United States | 12,000,000 | | 8,232,000 |
| x Texas State GO, Transportation Commission-Highway | | | | |
| Improvement, Series A, 5.00%, 4/01/26 | United States | 8,215,000 | | 10,448,741 |
| University of California Revenue, Limited Project, Refunding, | | | | |
| Series J, 4.131%, 5/15/45 | United States | 10,750,000 | | 11,296,745 |
| Total Municipal Bonds (Cost $84,591,950) | | | | 86,170,576 |
| |
| |
| | | Shares | | |
| |
| Escrows and Litigation Trusts 0.0% | | | | |
| a,k Motors Liquidation Co., Escrow Account, cvt. pfd., C | United States | 43,500 | | — |
| a,k NewPage Corp., Litigation Trust | United States | 2,500,000 | | — |
| Total Escrows and Litigation Trusts (Cost $2,307) . | | | | — |
100 Annual Report
franklintempleton.com
FRANKLIN INVESTORS SECURITIES TRUST
CONSOLIDATED STATEMENT OF INVESTMENTS
| | | | | |
| Franklin Total Return Fund (continued) | | | | | |
| | | Notional | | | |
| | Counterparty | Amount* | | Value | |
| Options Purchased 0.0%† | | | | | |
| Puts - Over-the-Counter | | | | | |
| Credit Default Swaptions 0.0%† | | | | | |
| Buy protection on CDX.NA.HY.26, Premium Rate 5.00%, Strike | | | | | |
| Price $103.50, Expires 11/16/16 | CITI | 50,000,000 | $ | 87,700 | |
| Buy protection on CDX.NA.IG.27, Premium Rate 1.00%, Strike | | | | | |
| Price $85, Expires 11/16/16 | JPHQ | 25,000,000 | | 6,450 | |
| Buy protection on CDX.NA.IG.27, Premium Rate 1.00%, Strike | | | | | |
| Price $90, Expires 11/16/16 | CITI | 50,000,000 | | 8,700 | |
| Total Options Purchased (Cost $530,500) | | | | 102,850 | |
| Total Investments before Short Term Investments | | | | | |
| (Cost $4,915,251,194) | | | | 4,948,562,810 | |
| |
| |
| | Country | Shares | | | |
| Short Term Investments (Cost $104,199,665) 2.1% | | | | | |
| Money Market Funds 2.1% | | | | | |
| a,e Institutional Fiduciary Trust Money Market Portfolio | United States | 104,199,665 | | 104,199,665 | |
| Total Investments (Cost $5,019,450,859) 101.8% | | | | 5,052,762,475 | |
| Other Assets, less Liabilities (1.8)% | | | | (87,799,421 | ) |
| Net Assets 100.0% | | | $ | 4,964,963,054 | |
franklintempleton.com
Annual Report
101
FRANKLIN INVESTORS SECURITIES TRUST
CONSOLIDATED STATEMENT OF INVESTMENTS
Franklin Total Return Fund (continued)
†Rounds to less than 0.1% of net assets.
*The principal/notional amount is stated in U.S. dollars unless otherwise indicated.
aNon-income producing.
bThe security is owned by FT Holdings Corporation I, a wholly-owned subsidiary of the Fund. See Note 1(g).
cAt October 31, 2016, pursuant to the Fund’s policies and the requirements of applicable securities law, the Fund is restricted from trading these securities at year end.
dSee Note 8 regarding restricted securities.
eSee Note 3(f) regarding investments in affiliated management investment companies.
fVariable rate security. The rate shown represents the yield at period end.
gSecurity was purchased pursuant to Regulation S under the Securities Act of 1933, which exempts from registration securities offered and sold outside of the United States.
Such a security cannot be sold in the United States without either an effective registration statement filed pursuant to the Securities Act of 1933, or pursuant to an exemption
from registration. These securities have been deemed liquid under guidelines approved by the Trust’s Board of Trustees. At October 31, 2016, the aggregate value of these
securities was $65,507,249, representing 1.3% of net assets.
hSecurity was purchased pursuant to Rule 144A under the Securities Act of 1933 and may be sold in transactions exempt from registration only to qualified institutional buyers
or in a public offering registered under the Securities Act of 1933. These securities have been deemed liquid under guidelines approved by the Trust’s Board of Trustees. At
October 31, 2016, the aggregate value of these securities was $820,141,149, representing 16.5% of net assets.
iPerpetual security with no stated maturity date.
jThe coupon rate shown represents the rate at period end.
kSecurity has been deemed illiquid because it may not be able to be sold within seven days. At October 31, 2016, the aggregate value of these securities was $16,858,
representing less than 0.1% of net assets.
lSee Note 7 regarding defaulted securities.
mSee Note 1(f) regarding loan participation notes.
nSee Note 1(i) regarding senior floating rate interests.
oSecurity purchased on a delayed delivery basis. See Note 1(c).
pIncome may be received in additional securities and/or cash.
qPrincipal amount is stated in 100 Mexican Peso Units.
rThe principal represents the notional amount. See Note 1(d) regarding value recovery instruments.
sRedemption price at maturity is adjusted for inflation. See Note 1(k).
tPrincipal amount is stated in 1,000 Brazilian Real Units.
uPrincipal amount of security is adjusted for inflation. See Note 1(k).
vThe bond pays interest and/or principal based upon the issuer’s ability to pay, which may be less than the stated interest rate or principal paydown.
wSecurity purchased on a to-be-announced (TBA) basis. See Note 1(c).
xSecurity purchased on a when-issued basis. See Note 1(c).
102 Annual Report
franklintempleton.com
FRANKLIN INVESTORS SECURITIES TRUST
CONSOLIDATED STATEMENT OF INVESTMENTS
| | | | | | | | | | | | |
| Franklin Total Return Fund (continued) | | | | | | | | | | | |
| |
| At October 31, 2016, the Fund had the following financial futures contracts outstanding. See Note 1(d). | | | | | | |
| |
| | | | Number of | | Notional | Expiration | | Unrealized | | Unrealized | |
| Description | | Type | Contracts | | Value | Date | | Appreciation | | Depreciation | |
| Interest Rate Contracts | | | | | | | | | | | | |
| Australian 10 Yr. Bond | | Long | 650 | $ | 65,597,364 | 12/15/16 | | $ | — | $ | (1,196,056 | ) |
| Canadian 10 Yr. Bond | | Long | 207 | | 22,311,414 | 12/19/16 | | | — | | (256,580 | ) |
| CME Ultra Long Term U.S. Treasury Bond | Long | 150 | | 26,390,625 | 12/20/16 | | | — | | (1,575,412 | ) |
| Euro BOBL | | Short | 250 | | 35,978,224 | 12/08/16 | | | 135,321 | | — | |
| Euro-Bund | | Short | 120 | | 21,360,708 | 12/08/16 | | | 169,697 | | — | |
| Long Gilt | | Long | 380 | | 58,305,282 | 12/28/16 | | | — | | (989,511 | ) |
| U.S. 10 Yr. Ultra | | Short | 98 | | 13,868,531 | 12/20/16 | | | 278,090 | | — | |
| U.S. Treasury 2 Yr. Note. | | Long | 129 | | 28,140,141 | 12/30/16 | | | — | | (323 | ) |
| U.S. Treasury 5 Yr. Note. | | Long | 570 | | 68,854,219 | 12/30/16 | | | — | | (491,297 | ) |
| U.S. Treasury 10 Yr. Note | | Short | 50 | | 6,481,250 | 12/20/16 | | | 68,618 | | — | |
| Total Financial Futures Contracts | | | | | | $ | 651,726 | $ | (4,509,179 | ) |
| Net unrealized appreciation (depreciation) | | | | | | | | | $ | (3,857,453 | ) |
| |
| |
| At October 31, 2016, the Fund had the following forward exchange contracts outstanding. See Note 1(d). | | | | |
| |
| Forward Exchange Contracts | | | | | | | | | | | |
| | | | | | Contract | Settlement | | Unrealized | | Unrealized | |
| Currency | Counterpartya Type | Quantity | | Amount | Date | | Appreciation | | Depreciation | |
| OTC Forward Exchange Contracts | | | | | | | | | | | | |
| Australian Dollar. | DBAB | Sell | 9,789,527 | $ | 7,184,534 | 12/15/16 | | $ | — | $ | (256,137 | ) |
| Euro | DBAB | Buy | 8,800,000 | | 9,914,080 | 12/15/16 | | | — | | (234,802 | ) |
| Euro | DBAB | Sell | 98,223,576 | | 110,538,963 | 12/15/16 | | 2,501,091 | | — | |
| Euro | JPHQ | Sell | 966,580 | | 1,098,325 | 12/15/16 | | | 35,166 | | — | |
| Euro | MSCO | Sell | 5,621,360 | | 6,388,957 | 12/15/16 | | | 205,922 | | — | |
| Japanese Yen | JPHQ | Sell | 3,094,000,360 | | 29,380,766 | 12/15/16 | | | — | | (176,094 | ) |
| Japanese Yen | JPHQ | Sell | 500,000,000 | | 4,919,492 | 12/15/16 | | | 143,013 | | — | |
| Malaysian Ringgit | DBAB | Buy | 3,367,980 | | 819,460 | 12/15/16 | | | — | | (17,760 | ) |
| Malaysian Ringgit | HSBK | Buy | 790,000 | | 191,747 | 12/15/16 | | | — | | (3,699 | ) |
| Mexican Peso | JPHQ | Sell | 245,000,000 | | 12,307,538 | 12/15/16 | | | — | | (607,813 | ) |
| South Korean Won | JPHQ | Sell | 21,600,000,000 | | 18,444,985 | 12/15/16 | | | — | | (436,340 | ) |
| Japanese Yen | DBAB | Sell | 4,455,000,000 | | 44,504,605 | 4/27/17 | | 1,693,445 | | — | |
| Japanese Yen | JPHQ | Sell | 4,455,000,000 | | 44,490,605 | 4/27/17 | | 1,679,445 | | — | |
| Australian Dollar. | DBAB | Sell | 33,150,000 | | 24,985,155 | 5/18/17 | | | — | | (124,195 | ) |
| Australian Dollar. | JPHQ | Sell | 36,198,000 | | 27,445,324 | 5/18/17 | | | 27,278 | | — | |
| Canadian Dollar | JPHQ | Sell | 4,900,000 | | 3,733,476 | 5/18/17 | | | 75,206 | | — | |
| Euro | BZWS | Sell | 4,446,931 | | 4,967,208 | 5/18/17 | | | 40,512 | | — | |
| Euro | CITI | Sell | 3,200,070 | | 3,587,448 | 5/18/17 | | | 42,134 | | — | |
| Euro | DBAB | Buy | 3,683,229 | | 4,048,606 | 5/18/17 | | | 31,995 | | — | |
| Euro | DBAB | Sell | 108,263,979 | | 121,524,151 | 5/18/17 | | 1,579,935 | | — | |
| Euro | GSCO | Sell | 1,024,000 | | 1,150,566 | 5/18/17 | | | 16,090 | | — | |
| Euro | HSBK | Sell | 267,000 | | 296,343 | 5/18/17 | | | 537 | | — | |
| Euro | JPHQ | Sell | 30,245,583 | | 33,837,258 | 5/18/17 | | | 328,580 | | — | |
| Hungarian Forint | DBAB | Sell | 4,332,000,000 | | 15,500,215 | 5/18/17 | | | 38,998 | | — | |
| Hungarian Forint | JPHQ | Sell | 935,000,000 | | 3,364,641 | 5/18/17 | | | 27,559 | | — | |
| Indian Rupee | DBAB | Buy | 631,935,000 | | 9,092,590 | 5/18/17 | | | 121,396 | | — | |
| Indian Rupee | JPHQ | Buy | 260,000,000 | | 3,768,116 | 5/18/17 | | | 22,838 | | — | |
| Indonesian Rupiah | DBAB | Buy 139,844,100,000 | | 10,237,489 | 5/18/17 | | | 165,857 | | — | |
franklintempleton.com
Annual Report
103
FRANKLIN INVESTORS SECURITIES TRUST
CONSOLIDATED STATEMENT OF INVESTMENTS
| | | | | | | | | | | |
| Franklin Total Return Fund (continued) | | | | | | | | | | |
| |
| Forward Exchange Contracts (continued) | | | | | | | | | | |
| |
| | | | | | Contract | Settlement | | Unrealized | | Unrealized | |
| Currency | Counterpartya | Type | Quantity | | Amount | Date | | Appreciation | | Depreciation | |
| OTC Forward Exchange Contracts (continued) | | | | | | | | | | |
| Japanese Yen | JPHQ | Sell | 852,000,000 | $ | 8,570,356 | 5/18/17 | $ | 374,641 | $ | — | |
| Philippine Peso | JPHQ | Buy | 177,480,000 | | 3,602,192 | 5/18/17 | | 20,462 | | — | |
| Total Forward Exchange Contracts | | | | | | | $ | 9,172,100 | $ | (1,856,840 | ) |
| Net unrealized appreciation (depreciation) | | | | | | $ | 7,315,260 | | | |
| | | | | | | | | | | | | | | | | | | |
| aMay be comprised of multiple contracts with the same counterparty, currency and settlement date. | | | | | | | | | | |
| |
| |
| At October 31, 2016, the Fund had the following credit default swap contracts outstanding. See Note 1(d). | | | | | |
| |
| Credit Default Swap Contracts | | | | | | | | | | | | | | | | |
| | | | | | | | | | Unamortized | | | | | | | | | | |
| | Periodic | | Counter- | | | | | | Upfront | | | | | | | | | | |
| | Payment | | party/ | | Notional | | Expiration | | Payments | | | Unrealized | | Unrealized | | | | | |
| Description | Rate | | Exchange | | Amounta | | Date | | (Receipts) | | Appreciation | Depreciation | | | Value | | Ratingb |
| Centrally Cleared Swap Contracts | | | | | | | | | | | | | | | | |
| Contracts to Buy Protection | | | | | | | | | | | | | | | | | | |
| Traded Index | | | | | | | | | | | | | | | | | | | |
| CDX.NA.HY.27 | 5.00 | % | ICE | $ | 25,000,000 | | 12/20/21 | $ | (811,868 | ) | $ | – | $ | (178,220 | ) | $ | (990,088 | ) | |
| |
| Contracts to Sell Protectionc | | | | | | | | | | | | | | | | | | |
| Traded Index | | | | | | | | | | | | | | | | | | | |
| CDX.NA.IG.24 | 1.00 | % | ICE | | 25,000,000 | | 6/20/25 | | (50,578 | ) | | – | | (310,647 | ) | | (361,225 | ) | Investment |
| | | | | | | | | | | | | | | | | | | | Grade |
| CDX.NA.IG.26 | 1.00 | % | ICE | | 32,400,000 | | 6/20/21 | | 346,386 | | | 100,803 | | – | | | 447,189 | | Investment |
| | | | | | | | | | | | | | | | | | | | Grade |
| ITRX.EUR.25 | 1.00 | % | ICE | | 20,650,000 | EUR | 6/20/21 | | 211,987 | | | 160,927 | | – | | | 372,914 | | Investment |
| | | | | | | | | | | | | | | | | | | | Grade |
| ITRX.EUR.SN- | | | | | | | | | | | | | | | | | | | |
| RFIN.26 | 1.00 | % | ICE | | 31,550,000 | EUR | 12/20/21 | | (28,222 | ) | | 118,734 | | – | | | 90,512 | | Investment |
| | | | | | | | | | | | | | | | | | | | Grade |
| TotalCentrallyClearedSwapContracts | | | | | $ | (332,295 | ) | $ | 380,464 | $ | (488,867 | ) | $ | (440,698 | ) | |
| OTC Swap Contracts | | | | | | | | | | | | | | | | | | |
| Contracts to Buy Protection | | | | | | | | | | | | | | | | | | |
| Single Name | | | | | | | | | | | | | | | | | | | |
| The AES Corp | 5.00 | % | JPHQ | | 19,600,000 | | 6/20/21 | $ | (2,112,272 | ) | $ | – | $ | (551,272 | ) | $ | (2,663,544 | ) | |
| Avon Products Inc | 5.00 | % | GSCO | | 18,500,000 | | 3/20/20 | | 2,055,392 | | | – | | (3,485,471 | ) | | (1,430,079 | ) | |
| Bank of America | | | | | | | | | | | | | | | | | | | |
| Corp | 1.00 | % | FBCO | | 20,000,000 | | 9/20/17 | | 53,366 | | | – | | (206,686 | ) | | (153,320 | ) | |
| Beazer Homes | | | | | | | | | | | | | | | | | | | |
| USA Inc | 5.00 | % | CITI | | 4,000,000 | | 6/20/19 | | (124,084 | ) | | – | | (167,506 | ) | | (291,590 | ) | |
| Beazer Homes | | | | | | | | | | | | | | | | | | | |
| USA Inc | 5.00 | % | GSCO | | 5,000,000 | | 6/20/19 | | (163,686 | ) | | – | | (200,802 | ) | | (364,488 | ) | |
| Canadian Natural | | | | | | | | | | | | | | | | | | | |
| Resources Ltd | 5.00 | % | GSCO | | 5,400,000 | | 6/20/17 | | (124,820 | ) | | – | | (54,098 | ) | | (178,918 | ) | |
104 Annual Report
franklintempleton.com
FRANKLIN INVESTORS SECURITIES TRUST
CONSOLIDATED STATEMENT OF INVESTMENTS
| | | | | | | | | | | | | | | | | | |
| Franklin Total Return Fund (continued) | | | | | | | | | | | | | | |
| |
| Credit Default Swap Contracts (continued) | | | | | | | | | | | | | | |
| |
| | | | | | | | | Unamortized | | | | | | | | | | |
| | Periodic | | Counter- | | | | | Upfront | | | | | | | | | | |
| | Payment | | party/ | Notional | | Expiration | | Payments | | | Unrealized | | Unrealized | | | | | |
| Description | Rate | | Exchange | Amounta | | Date | | (Receipts) | | | Appreciation | | Depreciation | | | Value | | Ratingb |
| OTC Swap Contracts (continued) | | | | | | | | | | | | | | | |
| Contracts to Buy Protection (continued) | | | | | | | | | | | | | | | |
| Single Name (continued) | | | | | | | | | | | | | | | | | |
| Constellation | | | | | | | | | | | | | | | | | | |
| Brands Inc | 5.00 | % | BZWS | 3,000,000 | | 6/20/17 | $ | (58,299 | ) | $ | – | $ | (52,706 | ) | $ | (111,005 | ) | |
| Constellation | | | | | | | | | | | | | | | | | | |
| Brands Inc | 5.00 | % | DBAB | 2,000,000 | | 6/20/17 | | (39,134 | ) | | – | | (34,870 | ) | | (74,004 | ) | |
| CSC Holdings LLC . | 5.00 | % | GSCO | 3,000,000 | | 9/20/18 | | (116,555 | ) | | – | | (121,106 | ) | | (237,661 | ) | |
| CSC Holdings LLC . | 5.00 | % | GSCO | 9,000,000 | | 3/20/19 | | (284,107 | ) | | – | | (509,438 | ) | | (793,545 | ) | |
| DPL Inc | 5.00 | % | MSCO | 337,000 | | 12/20/16 | | (1,511 | ) | | – | | (2,510 | ) | | (4,021 | ) | |
| El Paso Corp | 5.00 | % | GSCO | 1,100,000 | | 6/20/17 | | (26,375 | ) | | ��� | | (14,137 | ) | | (40,512 | ) | |
| International Lease | | | | | | | | | | | | | | | | | | |
| Finance Corp | 5.00 | % | GSCO | 12,000,000 | | 3/20/17 | | (169,666 | ) | | – | | (112,370 | ) | | (282,036 | ) | |
| Intesa Sanpaolo | | | | | | | | | | | | | | | | | | |
| SPA | 1.00 | % | JPHQ | 6,450,000 | EUR | 6/20/21 | | 772,366 | | | – | | (186,624 | ) | | 585,742 | | |
| Kinder Morgan | | | | | | | | | | | | | | | | | | |
| Energy | | | | | | | | | | | | | | | | | | |
| Partners LP | 5.00 | % | CITI | 5,200,000 | | 3/20/18 | | (268,796 | ) | | – | | (101,745 | ) | | (370,541 | ) | |
| Kinder Morgan | | | | | | | | | | | | | | | | | | |
| Energy | | | | | | | | | | | | | | | | | | |
| Partners LP | 5.00 | % | CITI | 1,000,000 | | 3/20/20 | | (147,089 | ) | | 2,062 | | – | | | (145,027 | ) | |
| Lennar Corp | 5.00 | % | CITI | 6,200,000 | | 12/20/19 | | (491,189 | ) | | – | | (252,037 | ) | | (743,226 | ) | |
| Lennar Corp | 5.00 | % | FBCO | 4,500,000 | | 9/20/19 | | (380,136 | ) | | – | | (131,082 | ) | | (511,218 | ) | |
| Lennar Corp | 5.00 | % | GSCO | 3,900,000 | | 12/20/20 | | (326,846 | ) | | – | | (204,504 | ) | | (531,350 | ) | |
| The New York | | | | | | | | | | | | | | | | | | |
| TimesCo | 5.00 | % | GSCO | 11,700,000 | | 12/20/16 | | (28,817 | ) | | – | | (108,684 | ) | | (137,501 | ) | |
| Olin Corp | 1.00 | % | FBCO | 5,000,000 | | 6/20/21 | | 364,179 | | | – | | (70,292 | ) | | 293,887 | | |
| Olin Corp | 1.00 | % | GSCO | 5,000,000 | | 6/20/21 | | 360,761 | | | – | | (66,332 | ) | | 294,429 | | |
| Owens-Illinois Inc | 5.00 | % | CITI | 9,200,000 | | 6/20/18 | | (574,962 | ) | | – | | (200,434 | ) | | (775,396 | ) | |
| Pactiv LLC | 5.00 | % | UBSW | 12,000,000 | | 6/20/17 | | 111,358 | | | – | | (538,158 | ) | | (426,800 | ) | |
| PHH Corp | 5.00 | % | GSCO | 5,400,000 | | 9/20/19 | | 27,069 | | | – | | (227,116 | ) | | (200,047 | ) | |
| Rite Aid Corp | 5.00 | % | CITI | 5,000,000 | | 6/20/21 | | (712,096 | ) | | – | | (34,979 | ) | | (747,075 | ) | |
| Rite Aid Corp | 5.00 | % | JPHQ | 7,000,000 | | 12/20/20 | | (1,043,241 | ) | | 17,205 | | – | | | (1,026,036 | ) | |
| The Royal Bank of | | | | | | | | | | | | | | | | | | |
| Scotland PLC | 1.00 | % | JPHQ | 1,200,000 | EUR | 6/20/21 | | 138,481 | | | – | | (44,575 | ) | | 93,906 | | |
| Sanmina Corp | 5.00 | % | GSCO | 7,500,000 | | 6/20/19 | | (869,256 | ) | | – | | (42,481 | ) | | (911,737 | ) | |
| Springleaf Finance | | | | | | | | | | | | | | | | | | |
| Corp | 5.00 | % | BZWS | 1,000,000 | | 12/20/21 | | (9,325 | ) | | – | | (3,720 | ) | | (13,045 | ) | |
| Springleaf Finance | | | | | | | | | | | | | | | | | | |
| Corp | 5.00 | % | GSCO | 1,200,000 | | 6/20/20 | | (52,675 | ) | | 44 | | – | | | (52,631 | ) | |
| Tenet Healthcare | | | | | | | | | | | | | | | | | | |
| Corp | 5.00 | % | BZWS | 9,400,000 | | 12/20/16 | | (38,934 | ) | | – | | (69,347 | ) | | (108,281 | ) | |
| Tenet Healthcare | | | | | | | | | | | | | | | | | | |
| Corp | 5.00 | % | BZWS | 3,000,000 | | 3/20/19 | | (173,137 | ) | | 22,359 | | – | | | (150,778 | ) | |
| Tenet Healthcare | | | | | | | | | | | | | | | | | | |
| Corp | 5.00 | % | BZWS | 1,500,000 | | 3/20/19 | | (66,520 | ) | | – | | (8,869 | ) | | (75,389 | ) | |
franklintempleton.com
Annual Report
105
FRANKLIN INVESTORS SECURITIES TRUST
CONSOLIDATED STATEMENT OF INVESTMENTS
| | | | | | | | | | | | | | | | | | |
| Franklin Total Return Fund (continued) | | | | | | | | | | | | | | |
| |
| Credit Default Swap Contracts (continued) | | | | | | | | | | | | | | |
| |
| | | | | | | | | Unamortized | | | | | | | | | | |
| | Periodic | | Counter- | | | | | Upfront | | | | | | | | | | |
| | Payment | | party/ | Notional | | Expiration | | Payments | | | Unrealized | | Unrealized | | | | | |
| Description | Rate | | Exchange | Amounta | | Date | | (Receipts) | | | Appreciation | | Depreciation | | | Value | | Ratingb |
| OTC Swap Contracts (continued) | | | | | | | | | | | | | | | |
| Contracts to Buy Protection (continued) | | | | | | | | | | | | | | | |
| Single Name (continued) | | | | | | | | | | | | | | | | | |
| Tenet Healthcare | | | | | | | | | | | | | | | | | | |
| Corp | 5.00 | % | DBAB | 4,000,000 | | 3/20/19 | $ | (249,821 | ) | $ | 48,783 | $ | – | | $ | (201,038 | ) | |
| Tenet Healthcare | | | | | | | | | | | | | | | | | | |
| Corp | 5.00 | % | GSCO | 4,635,000 | | 3/20/19 | | (244,550 | ) | | 11,597 | | – | | | (232,953 | ) | |
| Tenet Healthcare | | | | | | | | | | | | | | | | | | |
| Corp | 5.00 | % | GSCO | 2,700,000 | | 3/20/19 | | (115,226 | ) | | – | | (20,474 | ) | | (135,700 | ) | |
| Toys R Us Inc | 5.00 | % | DBAB | 14,000,000 | | 12/20/18 | | 2,207,428 | | | – | | (1,797,150 | ) | | 410,278 | | |
| Toys R Us Inc | 5.00 | % | GSCO | 14,800,000 | | 12/20/18 | | 2,842,344 | | | – | | (2,408,622 | ) | | 433,722 | | |
| Transocean Inc | 5.00 | % | MSCO | 13,000,000 | | 6/20/18 | | (258,317 | ) | | – | | (290,423 | ) | | (548,740 | ) | |
| XPO CNW Inc | 5.00 | % | JPHQ | 4,300,000 | | 3/20/18 | | (143,725 | ) | | – | | (17,817 | ) | | (161,542 | ) | |
| Contracts to Sell Protectionc | | | | | | | | | | | | | | | | | |
| Single Name | | | | | | | | | | | | | | | | | | |
| Arcelormittal | 5.00 | % | CITI | 5,000,000 | EUR | 3/20/21 | | 381,796 | | | 49,927 | | – | | | 431,723 | | BB |
| Bank of America | | | | | | | | | | | | | | | | | | |
| Corp | 1.00 | % | FBCO | 20,000,000 | | 9/20/17 | | (53,366 | ) | | 206,686 | | – | | | 153,320 | | BBB+ |
| Beazer Homes | | | | | | | | | | | | | | | | | | |
| USA Inc | 5.00 | % | CITI | 6,200,000 | | 12/20/19 | | 110,836 | | | 301,159 | | – | | | 411,995 | | B- |
| Beazer Homes | | | | | | | | | | | | | | | | | | |
| USA Inc | 5.00 | % | GSCO | 3,900,000 | | 12/20/20 | | (375,864 | ) | | 523,428 | | – | | | 147,564 | | B- |
| dCalpine Corp | 5.00 | % | JPHQ | 19,600,000 | | 6/20/21 | | 1,072,526 | | | 293,512 | | – | | | 1,366,038 | | B |
| Electricite de | | | | | | | | | | | | | | | | | | |
| France SA | 1.00 | % | BZWS | 10,500,000 | EUR | 9/20/20 | | 209,873 | | | – | | (6,990 | ) | | 202,883 | | A- |
| Engie SA | 1.00 | % | BZWS | 10,500,000 | EUR | 9/20/20 | | 259,197 | | | 50,564 | | – | | | 309,761 | | A- |
| Freeport- | | | | | | | | | | | | | | | | | | |
| McMoRan Inc | 1.00 | % | DBAB | 6,500,000 | | 3/20/23 | | (299,551 | ) | | – | | (1,120,329 | ) | | (1,419,880 | ) | BB- |
| Government of | | | | | | | | | | | | | | | | | | |
| Mexico | 1.00 | % | CITI | 8,400,000 | | 6/20/20 | | (73,087 | ) | | 43,716 | | – | | | (29,371 | ) | BBB+ |
| iHeartCommunica- | | | | | | | | | | | | | | | | | | |
| tionsInc | 5.00 | % | BZWS | 5,000,000 | | 6/20/18 | | (579,486 | ) | | – | | (1,040,329 | ) | | (1,619,815 | ) | CC |
| OrangeSA | 1.00 | % | CITI | 10,500,000 | EUR | 9/20/20 | | 169,862 | | | 103,241 | | – | | | 273,103 | | BBB+ |
| Prudential | | | | | | | | | | | | | | | | | | |
| Financial Inc | 1.00 | % | BOFA | 8,800,000 | | 12/20/21 | | (133,707 | ) | | 152,451 | | – | | | 18,744 | | A |
| Tenet Healthcare | | | | | | | | | | | | | | | | | | |
| Corp | 5.00 | % | BZWS | 9,400,000 | | 12/20/18 | | 269,328 | | | 250,586 | | – | | | 519,914 | | CCC+ |
| Traded Index | | | | | | | | | | | | | | | | | | |
| MCDX.NA.27 | 1.00 | % | CITI | 12,400,000 | | 12/20/21 | | 127,249 | | | – | | (38,037 | ) | | 89,212 | | Investment |
| | | | | | | | | | | | | | | | | | | Grade |
| TotalOTCSwapContracts | | | | | | $ | 603,183 | | $ | 2,077,320 | $ | (14,544,122 | ) | $ | (11,863,619 | ) | |
| TotalCreditDefaultSwapContracts | | | | $ | 270,888 | | $ | 2,457,784 | $ | (15,032,989 | ) | $ | (12,304,317 | ) | |
| Netunrealizedappreciation(depreciation) | | | | | | | | $ | (12,575,205 | ) | | | | |
106 Annual Report
franklintempleton.com
FRANKLIN INVESTORS SECURITIES TRUST
CONSOLIDATED STATEMENT OF INVESTMENTS
Franklin Total Return Fund (continued)
Credit Default Swap Contracts (continued)
aIn U.S. dollars unless otherwise indicated. For contracts to sell protection, the notional amount is equal to the maximum potential amount of the future payments and no
recourse provisions have been entered into in association with the contracts.
bBased on Standard and Poor’s (S&P) Rating for single name swaps and internal ratings for index swaps. Internal ratings based on mapping into equivalent ratings from
external vendors.
cThe Fund enters contracts to sell protection to create a long credit position. Performance triggers include default, bankruptcy or restructuring for single name swaps, and
failure to pay or bankruptcy of the underlying securities for traded index swaps.
dAt October 31, 2016, pursuant to the Fund’s policies and the requirements of applicable securities law, the Fund is restricted from trading these contracts at year end.
| | | | | | | | | | |
| At October 31, 2016, the Fund had the following cross-currency swap contracts outstanding. See Note 1(d). | | | | |
| |
| Cross Currency Swap Contracts | | | | | | | | | | |
| | | | | Notional | | Expiration | | Unrealized | | Unrealized |
| Description | Counterparty | | | Amount | | Date | | Appreciation | | Depreciation |
| OTC Swap Contracts | | | | | | | | | | |
| Receive Floating Quarterly 3-month USD BBA LIBOR + 3.29% | JPHQ | 12,760,417 | USD | 10/13/17 | $ | 434,850 | $ | — |
| Pay Fixed Annual 2.125% | | 12,250,000 | CHF | | | | | |
| Receive Fixed Semi-Annual 3.045%. | CITI | 11,760,000 | USD | 12/15/21 | | 294,761 | | — |
| Pay Fixed Annual 1.125% | | 10,500,000 | EUR | | | | | |
| Net unrealized appreciation (depreciation) | | | | | | | $ | 729,611 | | |
| |
| At October 31, 2016, the Fund had the following inflation index swap contracts outstanding. See Note 1(d). | | | | |
| |
| Inflation Index Swap Contracts | | | | | | | | | | |
| | Coumter- | | Notional | Expiration | | Unrealized | | Unrealized |
| Description | party | | Amount | Date | | Appreciation | | Depreciation |
| OTC Swap Contracts | | | | | | | | | | |
| Receiving variable change in USA-CPI-U | | | | | | | | | | |
| Pay Fixed Rate at Maturity 1.782% | JPHQ | $ | 95,700,000 | 5/27/24 | $ | 1,614,905 | $ | — |
See Notes 6 and 10 regarding investment transactions and other derivative information, respectively.
See Abbreviations on page 140.
franklintempleton.com
The accompanying notes are an integral part of these financial statements. | Annual Report 107
FRANKLIN INVESTORS SECURITIES TRUST
Financial Statements
Statements of Assets and Liabilities
October 31, 2016
| | | | | | | | |
| | | Franklin | | Franklin | | Franklin | | |
| | | Adjustable | | Floating Rate | | Low Duration | | Franklin |
| | | U.S. Government | | Daily Access | | Total Return | | Total Return |
| | | Securities Fund | | Fund | | Fund | | Funda |
| Assets: | | | | | | | | |
| Investments in securities: | | | | | | | | |
| Cost - Unaffiliated issuers | $ | 1,282,882,940 | $ | 2,807,838,013 | $ | 2,379,092,078 | $ | 4,827,921,884 |
| Cost - Controlled affiliates (Note 3f) | | — | | — | | — | | 59,340,350 |
| Cost - Non-controlled affiliates (Note 3f) | | 26,812,763 | | 301,294,963 | | 131,204,635 | | 132,188,625 |
| Total cost of investments | $ | 1,309,695,703 | $ | 3,109,132,976 | $ | 2,510,296,713 | $ | 5,019,450,859 |
| Value - Unaffiliated issuers | $ | 1,291,397,310 | $ | 2,751,553,879 | $ | 2,381,062,315 | $ | 4,860,523,399 |
| Value - Controlled affiliates (Note 3f) | | — | | — | | — | | 58,668,000 |
| Value - Non-controlled affiliates (Note 3f) | | 26,812,763 | | 301,294,963 | | 133,465,058 | | 133,571,076 |
| Total value of investments | | 1,318,210,073 | | 3,052,848,842 | | 2,514,527,373 | | 5,052,762,475 |
| Cash. | | — | | 9,322,258 | | 2,688,965 | | 2,248,228 |
| Restricted Cash (Note 1e) | | — | | — | | 1,150,000 | | 6,050,000 |
| Foreign currency, at value (cost $—, $—, $1,224,609 | | | | | | | | |
| and $808,669, respectively) | | — | | — | | 1,226,327 | | 808,264 |
| Receivables: | | | | | | | | |
| Investment securities sold | | 6,748,438 | | 89,066,217 | | 208,298 | | 10,621,518 |
| Capital shares sold | | 1,882,318 | | 7,883,806 | | 5,585,479 | | 13,955,173 |
| Dividends and interest | | 3,496,193 | | 8,935,800 | | 11,635,473 | | 34,442,450 |
| Affiliates | | — | | — | | 94,226 | | — |
| Due from brokers | | — | | — | | 9,830,863 | | 16,389,554 |
| Variation margin | | — | | — | | — | | 138,860 |
| OTC swap contracts (upfront payments $—, $—, | | | | | | | | |
| $5,501,544 and $17,177,855) | | — | | — | | 3,982,848 | | 11,533,411 |
| Unrealized appreciation on OTC forward exchange | | | | | | | | |
| contracts | | — | | — | | 2,529,129 | | 9,172,100 |
| Unrealized appreciation on OTC swap contracts | | — | | — | | 1,700,004 | | 4,421,836 |
| Unrealized appreciation on unfunded loan | | | | | | | | |
| commitments (Note 9) | | — | | 11,867 | | — | | — |
| Other assets | | 339 | | 631 | | 597 | | 114 |
| Total assets | | 1,330,337,361 | | 3,168,069,421 | | 2,555,159,582 | | 5,162,543,983 |
| Liabilities: | | | | | | | | |
| Payables: | | | | | | | | |
| Investment securities purchased | | — | | 122,228,510 | | 9,038,083 | | 135,783,668 |
| Capital shares redeemed | | 4,647,178 | | 7,387,795 | | 8,531,700 | | 23,270,764 |
| Management fees | | 559,043 | | 1,212,101 | | 1,028,791 | | 1,949,840 |
| Distribution fees | | 304,825 | | 585,698 | | 446,128 | | 1,054,479 |
| Transfer agent fees | | 266,724 | | 491,625 | | — | | 981,912 |
| Distributions to shareholders | | 116,243 | | 2,704,182 | | 502,192 | | 352,960 |
| Variation margin | | — | | — | | 129,626 | | — |
| OTC swap contracts (upfront receipts $—, $—, | | | | | | | | |
| $10,736,125 and $17,916,203) | | — | | — | | 6,404,019 | | 10,930,228 |
| Due to brokers | | — | | — | | 1,150,000 | | 6,050,000 |
| Unrealized depreciation on OTC forward exchange | | | | | | | | |
| contracts | | — | | — | | 970,445 | | 1,856,840 |
| Unrealized depreciation on OTC swap contracts | | — | | — | | 5,538,363 | | 14,544,122 |
| Unrealized depreciation on unfunded loan | | | | | | | | |
| commitments (Note 9) | | — | | — | | 54,736 | | 120,803 |
108 Annual Report | The accompanying notes are an integral part of these financial statements.
franklintempleton.com
| | | | | | | | | | | | | |
| | | | | | | FRANKLIN INVESTORS SECURITIES TRUST | |
| | | | | | | | | | FINANCIAL STATEMENTS | |
| |
| |
| Statements of Assets and Liabilities (continued) | | | | | | | | | | | | | |
| October 31, 2016 | | | | | | | | | | | | | |
| |
| | | | Franklin | | | Franklin | | | Franklin | | | | |
| | | | Adjustable | | | Floating Rate | | | Low Duration | | | Franklin | |
| | | | U.S. Government | | | Daily Access | | | Total Return | | | Total Return | |
| | | | Securities Fund | | | Fund | | | Fund | | | Funda | |
| Accrued expenses and other liabilities. | $ | | 145,329 | | $ | 845,687 | | $ | 743,438 | | $ | 685,313 | |
| Total liabilities | | | 6,039,342 | | | 135,455,598 | | | 34,537,521 | | | 197,580,929 | |
| Net assets, at value | $ | | 1,324,298,019 | | $ | 3,032,613,823 | | $ | 2,520,622,061 | | $ | 4,964,963,054 | |
| Net assets consist of: | | | | | | | | | | | | | |
| Paid-in capital | $ | | 1,473,750,028 | | $ | 3,337,037,164 | | $ | 2,592,158,224 | | $ | 4,997,957,349 | |
| Undistributed net investment income | | | 36,132 | | | 2,223,849 | | | 1,657,052 | | | 3,637,002 | |
| Net unrealized appreciation (depreciation) | | | 8,514,370 | | | (56,272,267 | ) | | 2,993,561 | | | 25,453,015 | |
| Accumulated net realized gain (loss) | | | (158,002,511 | ) | | (250,374,923 | ) | | (76,186,776 | ) | | (62,084,312 | ) |
| Net assets, at value | $ | | 1,324,298,019 | | $ | 3,032,613,823 | | $ | 2,520,622,061 | | $ | 4,964,963,054 | |
| Class A: | | | | | | | | | | | | | |
| Net assets, at value | $ | | 667,670,669 | | $ | 1,359,862,215 | | $ | 1,524,436,661 | | $ | 3,623,034,930 | |
| Shares outstanding. | | | 79,451,673 | | | 153,804,451 | | | 154,118,160 | | | 364,927,154 | |
| Net asset value per shareb | | $ | 8.40 | | $ | 8.84 | | $ | 9.89 | | $ | 9.93 | |
| Maximum offering price per share (net asset value per | | | | | | | | | | | | | |
| share ÷ 97.75%, 97.75%, 97.75% and 95.75%, | | | | | | | | | | | | | |
| respectively) | | $ | 8.59 | | $ | 9.04 | | $ | 10.12 | | $ | 10.37 | |
| Class A1: | | | | | | | | | | | | | |
| Net assets, at value | $ | | 160,469,055 | | | | | | | | | | |
| Shares outstanding. | | | 19,101,500 | | | | | | | | | | |
| Net asset value per shareb | | $ | 8.40 | | | | | | | | | | |
| Maximum offering price per share (net asset value per | | | | | | | | | | | | | |
| share ÷ 97.75%) | | $ | 8.59 | | | | | | | | | | |
| Class C: | | | | | | | | | | | | | |
| Net assets, at value | $ | | 266,185,518 | | $ | 551,726,450 | | $ | 218,065,504 | | $ | 449,274,299 | |
| Shares outstanding. | | | 31,697,127 | | | 62,387,792 | | | 22,116,416 | | | 45,502,673 | |
| Net asset value and maximum offering price per | | | | | | | | | | | | | |
| shareb | | $ | 8.40 | | $ | 8.84 | | $ | 9.86 | | $ | 9.87 | |
| Class R: | | | | | | | | | | | | | |
| Net assets, at value | | | | | | | | | | | $ | 58,715,369 | |
| Shares outstanding. | | | | | | | | | | | | 5,931,895 | |
| Net asset value and maximum offering price per share . | | | | | | | | | | | $ | 9.90 | |
| Class R6: | | | | | | | | | | | | | |
| Net assets, at value | $ | | 2,373,810 | | $ | 12,332,804 | | $ | 553,233,246 | | $ | 93,892,394 | |
| Shares outstanding. | | | 282,193 | | | 1,394,780 | | | 55,647,586 | | | 9,404,728 | |
| Net asset value and maximum offering price per share . | | $ | 8.41 | | $ | 8.84 | | $ | 9.94 | | $ | 9.98 | |
| Advisor Class: | | | | | | | | | | | | | |
| Net assets, at value | $ | | 227,598,967 | | $ | 1,108,692,354 | | $ | 224,886,650 | | $ | 740,046,062 | |
| Shares outstanding. | | | 27,058,824 | | | 125,345,616 | | | 22,634,415 | | | 74,172,248 | |
| Net asset value and maximum offering price per share . | | $ | 8.41 | | $ | 8.85 | | $ | 9.94 | | $ | 9.98 | |
aConsolidated financial statement. See Note 1(g).
bRedemption price is equal to net asset value less contingent deferred sales charges, if applicable.
franklintempleton.com
The accompanying notes are an integral part of these financial statements. | Annual Report 109
| | | | | | | | | | | | |
| FRANKLIN INVESTORS SECURITIES TRUST | | | | | | | | | | | | |
| FINANCIAL STATEMENTS | | | | | | | | | | | | |
| |
| |
| Statements of Operations | | | | | | | | | | | | |
| for the year ended October 31, 2016 | | | | | | | | | | | | |
| |
| | | Franklin | | | Franklin | | | Franklin | | | | |
| | | Adjustable | | | Floating Rate | | | Low Duration | | | Franklin | |
| | | U.S. Government | | | Daily Access | | | Total Return | | | Total Return | |
| | | Securities Fund | | | Fund | | | Fund | | | Funda | |
| Investment income: | | | | | | | | | | | | |
| Dividends: | | | | | | | | | | | | |
| Unaffiliated issuers | $ | — | | $ | 192,383 | | $ | — | | $ | 1,118,832 | |
| Controlled affiliates (Note 3f) | | — | | | — | | | — | | | 878,940 | |
| Non-controlled affiliates (Note 3f) | | — | | | — | | | 3,104,759 | | | 1,994,178 | |
| Interest | | 34,986,782 | | | 168,211,616 | | | 62,141,387 | | | 146,508,263 | |
| Paydown gain (loss) | | (14,878,089 | ) | | — | | | (5,250,251 | ) | | 1,282,807 | |
| Total investment income. | | 20,108,693 | | | 168,403,999 | | | 59,995,895 | | | 151,783,020 | |
| Expenses: | | | | | | | | | | | | |
| Management fees (Note 3a) | | 7,488,149 | | | 15,324,977 | | | 12,652,821 | | | 22,456,814 | |
| Distribution fees: (Note 3c) | | | | | | | | | | | | |
| Class A | | 1,909,577 | | | 3,416,194 | | | 3,999,603 | | | 9,169,167 | |
| Class A1 | | 170,658 | | | — | | | — | | | — | |
| Class C | | 1,962,976 | | | 3,581,712 | | | 1,446,770 | | | 2,923,749 | |
| Class R | | — | | | — | | | — | | | 329,197 | |
| Transfer agent fees: (Note 3e) | | | | | | | | | | | | |
| Class A | | 918,966 | | | 1,411,446 | | | 2,685,395 | | | 5,181,943 | |
| Class A1 | | 215,754 | | | — | | | — | | | — | |
| Class C | | 363,222 | | | 569,215 | | | 376,264 | | | 635,743 | |
| Class R | | — | | | — | | | — | | | 93,037 | |
| Class R6 | | 301 | | | 229 | | | 387 | | | 1,278 | |
| Advisor Class | | 300,423 | | | 1,129,202 | | | 278,350 | | | 754,804 | |
| Custodian fees (Note 4) | | 13,898 | | | 24,239 | | | 48,928 | | | 148,113 | |
| Reports to shareholders | | 194,591 | | | 290,327 | | | 285,709 | | | 655,617 | |
| Registration and filing fees | | 120,898 | | | 117,416 | | | 190,618 | | | 413,127 | |
| Professional fees | | 55,816 | | | 116,131 | | | 97,356 | | | 171,740 | |
| Trustees’ fees and expenses | | 18,093 | | | 35,705 | | | 24,096 | | | 51,605 | |
| Other. | | 284,534 | | | 77,343 | | | 257,617 | | | 352,130 | |
| Total expenses | | 14,017,856 | | | 26,094,136 | | | 22,343,914 | | | 43,338,064 | |
| Expense reductions (Note 4) | | (450 | ) | | (8,185 | ) | | (16,755 | ) | | (48,639 | ) |
| Expenses waived/paid by affiliates (Note 3f and 3g) | | (86,638 | ) | | (544,650 | ) | | (3,649,073 | ) | | (2,347,785 | ) |
| Net expenses | | 13,930,768 | | | 25,541,301 | | | 18,678,086 | | | 40,941,640 | |
| Net investment income | | 6,177,925 | | | 142,862,698 | | | 41,317,809 | | | 110,841,380 | |
| Realized and unrealized gains (losses): | | | | | | | | | | | | |
| Net realized gain (loss) from: | | | | | | | | | | | | |
| Investments | | 617,606 | | | (60,832,757 | ) | | (12,093,115 | ) | | (33,131,810 | ) |
| Written options | | — | | | — | | | 307,231 | | | 655,836 | |
| Foreign currency transactions | | — | | | 18,878 | | | (2,569,755 | ) | | (23,758,842 | ) |
| Futures contracts | | — | | | — | | | (2,018,476 | ) | | 7,162,540 | |
| Swap contracts | | — | | | 217,311 | | | (5,578,730 | ) | | (10,191,077 | ) |
| Net realized gain (loss) | | 617,606 | | | (60,596,568 | ) | | (21,952,845 | ) | | (59,263,353 | ) |
| Net change in unrealized appreciation (depreciation) on: | | | | | | | | | | | | |
| Investments | | (11,522,082 | ) | | 119,165,880 | | | 35,084,133 | | | 128,959,232 | |
| Translation of other assets and liabilities | | | | | | | | | | | | |
| denominated in foreign currencies | | — | | | — | | | (2,539,649 | ) | | 341,975 | |
| Written options | | — | | | — | | | (308,273 | ) | | (659,146 | ) |
| Futures contracts | | — | | | — | | | 1,255,315 | | | (3,721,434 | ) |
| Swap contracts | | — | | | 47,565 | | | (4,109,710 | ) | | (10,585,565 | ) |
110 Annual Report | The accompanying notes are an integral part of these financial statements.
franklintempleton.com
| | | | | | | | | |
| | | | | | FRANKLIN INVESTORS SECURITIES TRUST |
| | | | | | | | FINANCIAL STATEMENTS |
| |
| |
| Statements of Operations (continued) | | | | | | | | | |
| for the year ended October 31, 2016 | | | | | | | | | |
| |
| | | Franklin | | | Franklin | | Franklin | | |
| | | Adjustable | | | Floating Rate | | Low Duration | | Franklin |
| | | U.S. Government | | | Daily Access | | Total Return | | Total Return |
| | | Securities Fund | | | Fund | | Fund | | Funda |
| Net change in unrealized appreciation | | | | | | | | | |
| (depreciation) | $ | (11,522,082 | ) | $ | 119,213,445 | $ | 29,381,816 | $ | 114,335,062 |
| Net realized and unrealized gain (loss) | | (10,904,476 | ) | | 58,616,877 | | 7,428,971 | | 55,071,709 |
| Net increase (decrease) in net assets resulting from | | | | | | | | | |
| operations | $ | (4,726,551 | ) | $ | 201,479,575 | $ | 48,746,780 | $ | 165,913,089 |
aConsolidated financial statement. See Note 1(g).
franklintempleton.com
The accompanying notes are an integral part of these financial statements. | Annual Report 111
| | | | | | | | | | | | | | |
| FRANKLIN INVESTORS SECURITIES TRUST | | | | | | | | | | | | | | |
| FINANCIAL STATEMENTS | | | | | | | | | | | | | | |
| |
| |
| Statements of Changes in Net Assets | | | | | | | | | | | | | | |
| |
| | | Franklin Adjustable U.S. | | | Franklin Floating Rate | |
| | | Government Securities Fund | | | Daily Access Fund | |
| | | Year Ended October 31, | | | Year Ended October 31, | |
| | | 2016 | | | 2015 | | | 2016 | | | | 2015 | |
| Increase (decrease) in net assets: | | | | | | | | | | | | | | |
| Operations: | | | | | | | | | | | | | | |
| Net investment income | $ | 6,177,925 | | | $ | 7,386,710 | | $ | 142,862,698 | | | $ | 181,670,130 | |
| Net realized gain (loss) | | 617,606 | | | | 3,977,176 | | | (60,596,568 | ) | | | (57,017,412 | ) |
| Net change in unrealized appreciation (depreciation) | | (11,522,082 | ) | | (16,455,279 | ) | | 119,213,445 | | | | (139,672,972 | ) |
| Net increase (decrease) in net assets resulting | | | | | | | | | | | | | | |
| from operations | | (4,726,551 | ) | | (5,091,393 | ) | | 201,479,575 | | | | (15,020,254 | ) |
| Distributions to shareholders from: | | | | | | | | | | | | | | |
| Net investment income: | | | | | | | | | | | | | | |
| Class A | | (10,995,661 | ) | | (11,496,470 | ) | | (64,460,934 | ) | | | (75,905,826 | ) |
| Class A1 | | (2,862,431 | ) | | (2,962,707 | ) | | — | | | | — | |
| Class C | | (3,137,657 | ) | | (2,804,429 | ) | | (23,786,613 | ) | | | (27,606,089 | ) |
| Class R6 | | (41,661 | ) | | | (71,457 | ) | | (285,466 | ) | | | (4,174 | ) |
| Advisor Class. | | (4,223,137 | ) | | (5,038,156 | ) | | (54,321,011 | ) | | | (76,936,149 | ) |
| Total distributions to shareholders | | (21,260,547 | ) | | (22,373,219 | ) | | (142,854,024 | ) | | | (180,452,238 | ) |
| Capital share transactions: (Note 2) | | | | | | | | | | | | | | |
| Class A | | (167,984,621 | ) | | (195,883,210 | ) | | (222,175,112 | ) | | | (239,383,605 | ) |
| Class A1 | | (35,100,623 | ) | | (51,188,248 | ) | | — | | | | — | |
| Class C | | (64,817,272 | ) | | (86,549,659 | ) | | (87,707,899 | ) | | | (81,761,761 | ) |
| Class R6 | | 236,438 | | | (4,959,369 | ) | | 11,857,272 | | | | (451,181 | ) |
| Advisor Class. | | (76,748,790 | ) | | (103,191,545 | ) | | (314,178,543 | ) | | | (534,150,566 | ) |
| Total capital share transactions | | (344,414,868 | ) | | (441,772,031 | ) | | (612,204,282 | ) | | | (855,747,113 | ) |
| Net increase (decrease) in net assets | | (370,401,966 | ) | | (469,236,643 | ) | | (553,578,731 | ) | | (1,051,219,605 | ) |
| Net assets: | | | | | | | | | | | | | | |
| Beginning of year | | 1,694,699,985 | | | 2,163,936,628 | | | 3,586,192,554 | | | | 4,637,412,159 | |
| End of year | $ | 1,324,298,019 | | $ | 1,694,699,985 | | $ | 3,032,613,823 | | $ | 3,586,192,554 | |
| Undistributed net investment income included in net | | | | | | | | | | | | | | |
| assets: | | | | | | | | | | | | | | |
| End of year | $ | 36,132 | | | $ | — | | $ | 2,223,849 | | | $ | 2,331,451 | |
| Distributions in excess of net investment income included | | | | | | | | | | | | | | |
| in net assets: | | | | | | | | | | | | | | |
| End of year | $ | — | | | $ | (430,553 | ) | $ | — | | | $ | — | |
112 Annual Report | The accompanying notes are an integral part of these financial statements.
franklintempleton.com
| | | | | | | | | | | | |
| | | | | | FRANKLIN INVESTORS SECURITIES TRUST | |
| | | | | | | | | FINANCIAL STATEMENTS | |
| |
| |
| Statements of Changes in Net Assets (continued) | | | | | | | | | | | | |
| |
| | | Franklin Low Duration | | | Franklin Total | |
| | | Total Return Fund | | | Return Funda | |
| | | Year Ended October 31, | | | Year Ended October 31, | |
| | | 2016 | | | 2015 | | | 2016 | | | 2015 | |
| Increase (decrease) in net assets: | | | | | | | | | | | | |
| Operations: | | | | | | | | | | | | |
| Net investment income | $ | 41,317,809 | | $ | 33,091,804 | | $ | 110,841,380 | | $ | 108,016,847 | |
| Net realized gain (loss) | | (21,952,845 | ) | | 10,086,678 | | | (59,263,353 | ) | | 105,081,761 | |
| Net change in unrealized appreciation (depreciation) | | 29,381,816 | | | (41,785,644 | ) | | 114,335,062 | | | (215,394,420 | ) |
| Net increase (decrease) in net assets resulting | | | | | | | | | | | | |
| from operations | | 48,746,780 | | | 1,392,838 | | | 165,913,089 | | | (2,295,812 | ) |
| Distributions to shareholders from: | | | | | | | | | | | | |
| Net investment income and net foreign currency gains: | | | | | | | | | | | | |
| Class A | | (33,131,709 | ) | | (31,970,213 | ) | | (101,527,245 | ) | | (102,580,350 | ) |
| Class C | | (4,013,836 | ) | | (3,021,768 | ) | | (11,788,656 | ) | | (12,390,512 | ) |
| Class R | | — | | | — | | | (1,861,369 | ) | | (1,874,785 | ) |
| Class R6 | | (12,099,518 | ) | | (11,544,553 | ) | | (2,201,117 | ) | | (1,493,816 | ) |
| Advisor Class | | (3,563,139 | ) | | (3,636,737 | ) | | (15,522,886 | ) | | (38,204,478 | ) |
| Total distributions to shareholders | | (52,808,202 | ) | | (50,173,271 | ) | | (132,901,273 | ) | | (156,543,941 | ) |
| Capital share transactions: (Note 2) | | | | | | | | | | | | |
| Class A | | (127,311,300 | ) | | 98,528,651 | | | 66,617,965 | | | 417,940,997 | |
| Class C | | 7,361,242 | | | 49,157,590 | | | 2,877,723 | | | 25,914,042 | |
| Class R | | — | | | — | | | (12,019,056 | ) | | 13,325,622 | |
| Class R6 | | 43,783,151 | | | 99,586,210 | | | 24,451,715 | | | 44,485,978 | |
| Advisor Class | | 74,356,194 | | | (45,036,986 | ) | | 212,187,480 | | | (717,785,422 | ) |
| Total capital share transactions | | (1,810,713 | ) | | 202,235,465 | | | 294,115,827 | | | (216,118,783 | ) |
| Net increase (decrease) in net assets | | (5,872,135 | ) | | 153,455,032 | | | 327,127,643 | | | (374,958,536 | ) |
| Net assets: | | | | | | | | | | | | |
| Beginning of year | | 2,526,494,196 | | | 2,373,039,164 | | | 4,637,835,411 | | | 5,012,793,947 | |
| End of year | $ | 2,520,622,061 | | $ | 2,526,494,196 | | $ | 4,964,963,054 | | $ | 4,637,835,411 | |
| Undistributed net investment income included in net assets: | | | | | | | | | | | | |
| End of year | $ | 1,657,052 | | $ | 7,129,079 | | $ | 3,637,002 | | $ | 49,185,692 | |
aConsolidated financial statement. See Note 1(g).
franklintempleton.com
The accompanying notes are an integral part of these financial statements. | Annual Report 113
FRANKLIN INVESTORS SECURITIES TRUST
Notes to Financial Statements
1. Organization and Significant Accounting Policies
Franklin Investors Securities Trust (Trust) is registered under the Investment Company Act of 1940 (1940 Act) as an open-end management investment company, consisting of eight separate funds, four of which are included in this report (Funds) and applies the specialized accounting and reporting guidance in U.S. Generally Accepted Accounting Principles (U.S. GAAP). The financial statements of the remaining funds in the Trust are presented separately. The classes of shares offered within each of the Funds are indicated below. Each class of shares differs by its initial sales load, contingent deferred sales charges, voting rights on matters affecting a single class, its exchange privilege and fees primarily due to differing arrangements for distribution and transfer agent fees.
Class A, Class A1, Class C, Class R6 & Advisor Class
Franklin Adjustable U.S. Government Securities Fund
Class A, Class C, Class R6 & Advisor Class
Franklin Floating Rate Daily Access Fund Franklin Low Duration Total Return Fund
Class A, Class C, Class R, Class R6 & Advisor Class
Franklin Total Return Fund
The following summarizes the Funds’ significant accounting policies.
a. Financial Instrument Valuation
The Funds’ investments in financial instruments are carried at fair value daily. Fair value is the price that would be received to sell an asset or paid to transfer a liability in an orderly transaction between market participants on the measurement date. The Funds calculate the net asset value (NAV) per share as of 4 p.m. Eastern time each day the New York Stock Exchange (NYSE) is open for trading. Under compliance policies and procedures approved by the Trust’s Board of Trustees (the Board), the Funds’ administrator has responsibility for oversight of valuation, including leading the cross-functional Valuation Committee (VC). The VC provides administration and oversight of the Funds’ valuation policies and procedures, which are approved annually by the Board. Among other things, these procedures allow the Funds to utilize independent pricing services, quotations from securities and financial instrument dealers, and other market sources to determine fair value.
Equity securities, exchange traded funds, and derivative financial instruments listed on an exchange or on the NASDAQ National Market System are valued at the last quoted sale price or the official closing price of the day, respectively. Foreign equity securities are valued as of the close of trading on the foreign stock exchange on which the security is primarily traded or as of 4 p.m. Eastern time, whichever is earlier. The value is then converted into its U.S. dollar equivalent at the foreign exchange rate in effect at 4 p.m. Eastern time on the day that the value of the security is determined. Over-the-counter (OTC) securities are valued within the range of the most recent quoted bid and ask prices. Securities that trade in multiple markets or on multiple exchanges are valued according to the broadest and most representative market. Certain equity securities are valued based upon fundamental characteristics or relationships to similar securities.
Debt securities generally trade in the OTC market rather than on a securities exchange. The Funds’ pricing services use multiple valuation techniques to determine fair value. In instances where sufficient market activity exists, the pricing services may utilize a market-based approach through which quotes from market makers are used to determine fair value. In instances where sufficient market activity may not exist or is limited, the pricing services also utilize proprietary valuation models which may consider market characteristics such as benchmark yield curves, credit spreads, estimated default rates, anticipated market interest rate volatility, coupon rates, anticipated timing of principal repayments, underlying collateral, and other unique security features in order to estimate the relevant cash flows, which are then discounted to calculate the fair value. Securities denominated in a foreign currency are converted into their U.S. dollar equivalent at the foreign exchange rate in effect at 4 p.m. Eastern time on the date that the values of the foreign debt securities are determined.
Investments in open-end mutual funds are valued at the closing NAV.
Certain derivative financial instruments trade in the OTC market. The Funds’ pricing services use various techniques including industry standard option pricing models and proprietary discounted cash flow models to determine the fair value of those instruments. The Funds’ net benefit or obligation under the derivative contract, as measured by the fair value of the contract, is included in net assets.
114 Annual Report
franklintempleton.com
FRANKLIN INVESTORS SECURITIES TRUST
NOTES TO FINANCIAL STATEMENTS
The Funds have procedures to determine the fair value of financial instruments for which market prices are not reliable or readily available. Under these procedures, the VC convenes on a regular basis to review such financial instruments and considers a number of factors, including significant unobservable valuation inputs, when arriving at fair value. The VC primarily employs a market-based approach which may use related or comparable assets or liabilities, recent transactions, market multiples, book values, and other relevant information for the investment to determine the fair value of the investment. An income-based valuation approach may also be used in which the anticipated future cash flows of the investment are discounted to calculate fair value. Discounts may also be applied due to the nature or duration of any restrictions on the disposition of the investments. Due to the inherent uncertainty of valuations of such investments, the fair values may differ significantly from the values that would have been used had an active market existed. The VC employs various methods for calibrating these valuation approaches including a regular review of key inputs and assumptions, transactional back-testing or disposition analysis, and reviews of any related market activity.
b. Foreign Currency Translation
Portfolio securities and other assets and liabilities denominated in foreign currencies are translated into U.S. dollars based on the exchange rate of such currencies against U.S. dollars on the date of valuation. The Funds may enter into foreign currency exchange contracts to facilitate transactions denominated in a foreign currency. Purchases and sales of securities, income and expense items denominated in foreign currencies are translated into U.S. dollars at the exchange rate in effect on the transaction date. Portfolio securities and assets and liabilities denominated in foreign currencies contain risks that those currencies will decline in value relative to the U.S. dollar. Occasionally, events may impact the availability or reliability of foreign exchange rates used to convert the U.S. dollar equivalent value. If such an event occurs, the foreign exchange rate will be valued at fair value using procedures established and approved by the Board.
The Funds do not separately report the effect of changes in foreign exchange rates from changes in market prices on securities held. Such changes are included in net realized and unrealized gain or loss from investments in the Statements of Operations.
Realized foreign exchange gains or losses arise from sales of foreign currencies, currency gains or losses realized between the trade and settlement dates on securities transactions and the difference between the recorded amounts of dividends, interest, and foreign withholding taxes and the U.S. dollar equivalent of the amounts actually received or paid. Net unrealized foreign exchange gains and losses arise from changes in foreign exchange rates on foreign denominated assets and liabilities other than investments in securities held at the end of the reporting period.
c. Securities Purchased on a When-Issued, Delayed Delivery, and TBA Basis
Certain or all Funds purchase securities on a when-issued or delayed delivery and to-be-announced (TBA) basis, with payment and delivery scheduled for a future date. These transactions are subject to market fluctuations and are subject to the risk that the value at delivery may be more or less than the trade date purchase price. Although the Funds will generally purchase these securities with the intention of holding the securities, they may sell the securities before the settlement date. Sufficient assets have been segregated for these securities and collateral has been pledged and/or received for open TBA trades.
d. Derivative Financial Instruments
Certain or all Funds invested in derivative financial instruments in order to manage risk or gain exposure to various other investments or markets. Derivatives are financial contracts based on an underlying or notional amount, require no initial investment or an initial net investment that is smaller than would normally be required to have a similar response to changes in market factors, and require or permit net settlement. Derivatives contain various risks including the potential inability of the counterparty to fulfill their obligations under the terms of the contract, the potential for an illiquid secondary market, and/or the potential for market movements which expose the Fund to gains or losses in excess of the amounts shown in the Statements of Assets and Liabilities. Realized gain and loss and unrealized appreciation and depreciation on these contracts for the period are included in the Statements of Operations.
Derivative counterparty credit risk is managed through a formal evaluation of the creditworthiness of all potential counter-parties. Certain or all Funds attempt to reduce their exposure to counterparty credit risk on OTC derivatives, whenever possible,
franklintempleton.com
Annual Report
115
FRANKLIN INVESTORS SECURITIES TRUST
NOTES TO FINANCIAL STATEMENTS
1. Organization and Significant Accounting
Policies (continued)
d. Derivative Financial Instruments (continued)
by entering into International Swaps and Derivatives Association (ISDA) master agreements with certain counterparties. These agreements contain various provisions, including but not limited to collateral requirements, events of default, or early termination. Termination events applicable to the counterparty include certain deteriorations in the credit quality of the counterparty. Termination events applicable to the Funds include failure of the Funds to maintain certain net asset levels and/or limit the decline in net assets over various periods of time. In the event of default or early termination, the ISDA master agreement gives the non-defaulting party the right to net and close-out all transactions traded, whether or not arising under the ISDA agreement, to one net amount payable by one counterparty to the other. However, absent an event of default or early termination, OTC derivative assets and liabilities are presented gross and not offset in the Statements of Assets and Liabilities. Early termination by the counterparty may result in an immediate payment by the Funds of any net liability owed to that counterparty under the ISDA agreement.
Collateral requirements differ by type of derivative. Collateral or initial margin requirements are set by the broker or exchange clearing house for exchange traded and centrally cleared derivatives. Initial margin deposited is held at the exchange and can be in the form of cash and/or securities. For OTC derivatives traded under an ISDA master agreement, posting of collateral is required by either the Fund or the applicable counterparty if the total net exposure of all OTC derivatives with the applicable counterparty exceeds the minimum transfer amount, which typically ranges from $100,000 to $250,000, and can vary depending on the counterparty and the type of the agreement. Generally, collateral is determined at the close of Fund business each day and any additional collateral required due to changes in derivative values may be delivered by the Fund or the counterparty within a few business days. Collateral pledged and/or received by the Fund for OTC derivatives, if any, is held in segregated accounts with the Fund’s custodian/counterparty broker and can be in the form of cash and/or securities. Unrestricted cash may be invested according to the Funds’ investment objectives. To the extent that the amounts due to the Fund from its counterparties are not subject to collateralization or are not fully collateralized, the Fund bears the risk of loss from counterparty non-performance.
Certain or all Funds entered into exchange traded financial futures contracts primarily to manage and/or gain exposure to interest rate risk. A futures contract is an agreement between the Fund and a counterparty to buy or sell an asset at a specified price on a future date. Required initial margins are pledged by the Fund, and the daily change in fair value is accounted for as a variation margin payable or receivable in the Statements of Assets and Liabilities.
Certain or all Funds entered into OTC forward exchange contracts primarily to manage and/or gain exposure to certain foreign currencies. A forward exchange contract is an agreement between the Fund and a counterparty to buy or sell a foreign currency at a specific exchange rate on a future date.
Certain or all Funds entered into credit default swap contracts primarily to manage and/or gain exposure to credit risk. A credit default swap is an agreement between the Fund and a counterparty whereby the buyer of the contract receives credit protection and the seller of the contract guarantees the credit worthiness of a referenced debt obligation. These agreements may be privately negotiated in the over-the-counter market (OTC credit default swaps) or may be executed in a multilateral trade facility platform, such as a registered exchange (centrally cleared credit default swaps). The underlying referenced debt obligation may be a single issuer of corporate or sovereign debt, a credit index, a basket of issuers or indices, or a tranche of a credit index or basket of issuers or indices. In the event of a default of the underlying referenced debt obligation, the buyer is entitled to receive the notional amount of the credit default swap contract from the seller in exchange for the referenced debt obligation, a net settlement amount equal to the notional amount of the credit default swap less the recovery value of the referenced debt obligation, or other agreed upon amount. For centrally cleared credit default swaps, required initial margins are pledged by the Fund, and the daily change in fair value is accounted for as a variation margin payable or receivable in the Statements of Assets and Liabilities. Over the term of the contract, the buyer pays the seller a periodic stream of payments, provided that no event of default has occurred. Such periodic payments are accrued daily as an unrealized appreciation or depreciation until the payments are made, at which time they are realized. Upfront payments and receipts are reflected in the Statements of Assets and Liabilities and represent compensating factors between stated terms of the credit default swap agreement and prevailing market conditions (credit spreads and other relevant factors). These upfront
116 Annual Report
franklintempleton.com
FRANKLIN INVESTORS SECURITIES TRUST
NOTES TO FINANCIAL STATEMENTS
payments and receipts are amortized over the term of the contract as a realized gain or loss in the Statements of Operations.
Certain or all Funds entered into OTC cross currency swap contracts primarily to manage and/or gain exposure to interest rate risk and certain foreign currencies. A cross currency swap is an agreement between the Fund and a counterparty to exchange cash flows (determined using either a fixed or floating rate) based on the notional amounts of two different currencies. The notional amounts are typically determined based on the spot exchange rates at the opening of the contract. Cross currency swaps may require the exchange of notional amounts at the opening and/or closing of the contract. Over the term of the contract, contractually required payments to be paid and to be received are accrued daily and recorded as unrealized depreciation and appreciation until the payments are made, at which time they are realized. Upfront payments and receipts are reflected in the Statements of Assets and Liabilities and represent compensating factors between stated terms of the cross currency swap contract and prevailing market conditions (interest rate spreads and other relevant factors). These upfront payments and receipts are amortized over the term of the contract as a realized gain or loss in the Statements of Operations.
Certain or all Funds entered into interest rate swap contracts primarily to manage interest rate risk. An interest rate swap is an agreement between the Fund and a counterparty to exchange cash flows based on the difference between two interest rates, applied to a notional amount. These agreements may be privately negotiated in the over-the-counter market (OTC interest rate swaps) or may be executed on a registered exchange (centrally cleared interest rate swaps). For centrally cleared interest rate swaps, required initial margins are pledged by the Fund, and the daily change in fair value is accounted for as a variation margin payable or receivable in the Statements of Assets and Liabilities. Over the term of the contract, contractually required payments to be paid and to be received are accrued daily and recorded as unrealized depreciation and appreciation until the payments are made, at which time they are realized.
Certain or all Funds purchased or wrote exchange traded and/or OTC option contracts primarily to manage and/or gain exposure to interest rate, foreign exchange rate and credit risk. An option is a contract entitling the holder to purchase or sell a specific amount of shares or units of an asset or notional amount of a swap (swaption), at a specified price. When an option is purchased or written, an amount equal to the premium paid or received is recorded as an asset or liability, respectively. Upon exercise of an option, the acquisition cost or sales proceeds of the underlying investment is adjusted by any premium received or paid. Upon expiration of an option, any premium received or paid is recorded as a realized gain or loss. Upon closing an option other than through expiration or exercise, the difference between the premium received or paid and the cost to close the position is recorded as a realized gain or loss.
Certain or all Funds entered into inflation index swap contracts primarily to manage inflation risk. An inflation index swap is an agreement between the Fund and a counterparty to exchange cash flows whereby one party makes payments based on the percentage change in an index that serves as a measure of inflation and the other party makes a regular payment based on a compounded fixed rate, applied to a notional amount. These agreements may be privately negotiated in the over-the-counter market (OTC inflation index swap) or may be executed on a registered exchange (centrally cleared inflation index swap). For centrally cleared inflation index swaps, required initial margins are pledged by the Fund, and the daily change in fair value is accounted for as a variation margin payable or receivable. Over the term of the contract, contractually required payments to be paid and to be received are accrued daily and recorded as unrealized depreciation and appreciation until the payments are made, at which time they are realized. Typically, an inflation index swap has payment obligations netted and exchanged upon maturity.
Certain or all Funds invest in value recovery instruments (VRI) primarily to gain exposure to growth risk. Periodic payments from VRI are dependent on established benchmarks for underlying variables. VRI has a notional amount, which is used to calculate amounts of payments to holders. Payments are recorded upon receipt as realized gains in the Statements of Operations. The risks of investing in VRI include growth risk, liquidity, and the potential loss of investment.
See Notes 6 and 10 regarding investment transactions and other derivative information, respectively.
franklintempleton.com
Annual Report
117
FRANKLIN INVESTORS SECURITIES TRUST
NOTES TO FINANCIAL STATEMENTS
1. Organization and Significant Accounting
Policies (continued)
e. Restricted Cash
At October 31, 2016, certain or all Funds held restricted cash in connection with investments in certain derivative securities. Restricted cash is held in a segregated account with the Fund’s custodian and is reflected in the Statements of Assets and Liabilities.
f. Loan Participation Notes
Certain or all Funds invest in loan participation notes (Participations). Participations are loans originally issued to a borrower by one or more financial institutions (the Lender) and subsequently sold to other investors, such as the Funds. Participations typically result in the Fund having a contractual relationship only with the Lender and not with the borrower. The Funds have the right to receive from the Lender any payments of principal, interest and fees which the Lender received from the borrower. The Funds generally have no rights to either enforce compliance by the borrower with the terms of the loan agreement or to any collateral relating to the original loan. As a result, the Funds assume the credit risk of both the borrower and the Lender that is selling the Participation. The Participations may also involve interest rate risk and liquidity risk, including the potential default or insolvency of the borrower and/or the Lender.
g. Investments in FT Holdings Corporation I (FT Subsidiary)
Franklin Total Return Fund invests in certain financial instruments through its investment in the FT Subsidiary. The FT Subsidiary is a Delaware Corporation, is a wholly-owned Subsidiary of the Fund, and is able to invest in certain financial instruments consistent with the investment objective of the Fund. At October 31, 2016, the FT Subsidiary’s investment, Turtle Bay Resort, as well as any other assets and liabilities of the FT Subsidiary are reflected in the Fund’s Consolidated Statement of Investments and Consolidated Statement of Assets and Liabilities. The financial statements have been consolidated and include the accounts of the Fund and the FT Subsidiary. All intercompany transactions and balances have been eliminated. At October 31, 2016, the net assets of the FT Subsidiary were $5,382,878, representing 0.1% of the Fund’s consolidated net assets. The Fund’s investment in the FT Subsidiary is limited to 25% of consolidated assets.
h. Mortgage Dollar Rolls
Certain or all Funds enter into mortgage dollar rolls, typically on a TBA basis. Mortgage dollar rolls are agreements between the Fund and a financial institution where the Fund sells (or buys) mortgage-backed securities for delivery on a specified date and simultaneously contracts to repurchase (or sell) substantially similar (same type, coupon, and maturity) securities at a future date and at a predetermined price. Gains or losses are realized on the initial sale, and the difference between the repurchase price and the sale price is recorded as an unrealized gain or loss to the Fund upon entering into the mortgage dollar roll. In addition, the Fund may invest the cash proceeds that are received from the initial sale. During the period between the sale and repurchase, the Fund is not entitled to principal and interest paid on the mortgage backed securities. Transactions in mortgage dollar rolls are accounted for as purchases and sales and may result in an increase to the Fund’s portfolio turnover rate. The risks of mortgage dollar roll transactions include the potential inability of the counterparty to fulfill its obligations.
i. Senior Floating Rate Interests
Certain or all Funds invest in senior secured corporate loans that pay interest at rates which are periodically reset by reference to a base lending rate plus a spread. These base lending rates are generally the prime rate offered by a designated U.S. bank or the London InterBank Offered Rate (LIBOR). Senior secured corporate loans often require prepayment of principal from excess cash flows or at the discretion of the borrower. As a result, actual maturity may be substantially less than the stated maturity. Senior secured corporate loans in which the Funds invest are generally readily marketable, but may be subject to certain restrictions on resale.
j. Income and Deferred Taxes
It is each Fund’s policy to qualify as a regulated investment company under the Internal Revenue Code. Each Fund intends to distribute to shareholders substantially all of its taxable income and net realized gains to relieve it from federal income and excise taxes. As a result, no provision for U.S. federal income taxes is required.
The Funds may be subject to foreign taxation related to income received, capital gains on the sale of securities and certain foreign currency transactions in the foreign jurisdictions in which the Funds invest. Foreign taxes, if any, are recorded
118 Annual Report
franklintempleton.com
FRANKLIN INVESTORS SECURITIES TRUST
NOTES TO FINANCIAL STATEMENTS
based on the tax regulations and rates that exist in the foreign markets in which the Funds invest. When a capital gain tax is determined to apply, certain or all Funds record an estimated deferred tax liability in an amount that would be payable if the securities were disposed of on the valuation date.
Each Fund may recognize an income tax liability related to its uncertain tax positions under U.S. GAAP when the uncertain tax position has a less than 50% probability that it will be sustained upon examination by the tax authorities based on its technical merits. As of October 31, 2016, each Fund has determined that no tax liability is required in its financial statements related to uncertain tax positions for any open tax years (or expected to be taken in future tax years). Open tax years are those that remain subject to examination and are based on each tax jurisdiction’s statute of limitation.
k. Security Transactions, Investment Income, Expenses and Distributions
Security transactions are accounted for on trade date. Realized gains and losses on security transactions are determined on a specific identification basis. Interest income and estimated expenses are accrued daily. Amortization of premium and accretion of discount on debt securities are included in interest income. Paydown gains and losses are recorded separately on the Statements of Operations. Facility fees are recognized as income over the expected term of the loan. Dividends from net investment income are normally declared daily; these dividends may be reinvested or paid monthly to shareholders. Distributions to shareholders are recorded on the ex-dividend date and are determined according to income tax regulations (tax basis). Distributable earnings determined on a tax basis may differ from earnings recorded in accordance with U.S. GAAP. These differences may be permanent or temporary. Permanent differences are reclassified among capital accounts to reflect their tax character. These reclassifications have no impact on net assets or the results of operations. Temporary differences are not reclassified, as they may reverse in subsequent periods.
Common expenses incurred by the Trust are allocated among the Funds based on the ratio of net assets of each Fund to the combined net assets of the Trust. Fund specific expenses are charged directly to the Fund that incurred the expense.
Net investment income, not including class specific expenses, is allocated daily to each class of shares based upon the relative value of the settled shares of each class. Realized and unrealized gains and losses are allocated daily to each class of shares based upon the relative proportion of net assets of each class. Differences in per share distributions, by class, are generally due to differences in class specific expenses.
Inflation-indexed bonds are adjusted for inflation through periodic increases or decreases in the security’s interest accruals, face amount, or principal redemption value, by amounts corresponding to the rate of inflation as measured by an index. Any increase or decrease in the face amount or principal redemption value will be included as interest income in the Statements of Operations.
l. Accounting Estimates
The preparation of financial statements in accordance with U.S. GAAP requires management to make estimates and assumptions that affect the reported amounts of assets and liabilities at the date of the financial statements and the amounts of income and expenses during the reporting period. Actual results could differ from those estimates.
m. Guarantees and Indemnifications
Under the Trust’s organizational documents, its officers and trustees are indemnified by the Trust against certain liabilities arising out of the performance of their duties to the Trust. Additionally, in the normal course of business, the Trust, on behalf of the Funds, enter into contracts with service providers that contain general indemnification clauses. The Trust’s maximum exposure under these arrangements is unknown as this would involve future claims that may be made against the Trust that have not yet occurred. Currently, the Trust expects the risk of loss to be remote.
franklintempleton.com
Annual Report
119
FRANKLIN INVESTORS SECURITIES TRUST
NOTES TO FINANCIAL STATEMENTS
2. Shares of Beneficial Interest
At October 31, 2016, there were an unlimited number of shares authorized (without par value). Transactions in the Funds’ shares were as follows:
| | | | | | | | | | |
| | Franklin Adjustable U.S. | | Franklin Floating Rate | |
| | Government Securities Fund | | Daily Access Fund | |
| | Shares | | | Amount | | Shares | | | Amount | |
| Class A Shares: | | | | | | | | | | |
| Year ended October 31, 2016 | | | | | | | | | | |
| Shares sold | 21,965,175 | | $ | 185,996,265 | �� | 24,811,623 | | $ | 212,007,459 | |
| Shares issued in reinvestment of distributions | 1,239,949 | | | 10,469,739 | | 7,064,574 | | | 59,950,762 | |
| Shares redeemed | (43,095,113 | ) | | (364,450,625 | ) | (58,463,296 | ) | | (494,133,333 | ) |
| Net increase (decrease) | (19,889,989 | ) | $ | (167,984,621 | ) | (26,587,099 | ) | $ | (222,175,112 | ) |
| Year ended October 31, 2015 | | | | | | | | | | |
| Shares sold | 29,600,803 | | $ | 255,228,822 | | 35,259,302 | | $ | 314,270,932 | |
| Shares issued in reinvestment of distributions | 1,093,408 | | | 9,421,052 | | 7,762,505 | | | 69,039,598 | |
| Shares redeemed | (53,496,340 | ) | | (460,533,084 | ) | (69,916,661 | ) | | (622,694,135 | ) |
| Net increase (decrease) | (22,802,129 | ) | $ | (195,883,210 | ) | (26,894,854 | ) | $ | (239,383,605 | ) |
| Class A1 Shares: | | | | | | | | | | |
| Year ended October 31, 2016 | | | | | | | | | | |
| Shares sold | 782,382 | | $ | 6,611,320 | | | | | | |
| Shares issued in reinvestment of distributions | 321,531 | | | 2,714,543 | | | | | | |
| Shares redeemed | (5,258,218 | ) | | (44,426,486 | ) | | | | | |
| Net increase (decrease) | (4,154,305 | ) | $ | (35,100,623 | ) | | | | | |
| Year ended October 31, 2015 | | | | | | | | | | |
| Shares sold | 1,222,138 | | $ | 10,538,383 | | | | | | |
| Shares issued in reinvestment of distributions | 322,924 | | | 2,781,758 | | | | | | |
| Shares redeemed | (7,479,327 | ) | | (64,508,389 | ) | | | | | |
| Net increase (decrease) | (5,934,265 | ) | $ | (51,188,248 | ) | | | | | |
| Class C Shares: | | | | | | | | | | |
| Year ended October 31, 2016 | | | | | | | | | | |
| Shares sold | 4,522,226 | | $ | 38,281,353 | | 9,537,412 | | $ | 81,449,034 | |
| Shares issued in reinvestment of distributions | 342,782 | | | 2,892,128 | | 2,536,642 | | | 21,527,906 | |
| Shares redeemed | (12,545,368 | ) | | (105,990,753 | ) | (22,589,768 | ) | | (190,684,839 | ) |
| Net increase (decrease) | (7,680,360 | ) | $ | (64,817,272 | ) | (10,515,714 | ) | $ | (87,707,899 | ) |
| Year ended October 31, 2015 | | | | | | | | | | |
| Shares sold | 5,349,068 | | $ | 46,082,804 | | 14,110,236 | | $ | 125,708,580 | |
| Shares issued in reinvestment of distributions | 298,946 | | | 2,574,236 | | 2,777,065 | | | 24,699,170 | |
| Shares redeemed | (15,680,366 | ) | | (135,206,699 | ) | (26,067,686 | ) | | (232,169,511 | ) |
| Net increase (decrease) | (10,032,352 | ) | $ | (86,549,659 | ) | (9,180,385 | ) | $ | (81,761,761 | ) |
120 Annual Report
franklintempleton.com
| | | | | | | | | | | | |
| | | | | FRANKLIN INVESTORS SECURITIES TRUST | |
| | | | | | NOTES TO FINANCIAL STATEMENTS | |
| |
| |
| |
| |
| | Franklin Adjustable U.S. | | Franklin Floating Rate | |
| | Government Securities Fund | | Daily Access Fund | |
| | Shares | | | | Amount | | Shares | | | | Amount | |
| Class R6 Shares: | | | | | | | | | | | | |
| Year ended October 31, 2016 | | | | | | | | | | | | |
| Shares sold | 59,418 | | | $ | 503,303 | | 1,447,506 | | | $ | 12,322,386 | |
| Shares issued in reinvestment of distributions | 4,930 | | | | 41,660 | | 32,856 | | | | 285,282 | |
| Shares redeemed | (36,505 | ) | | | (308,525 | ) | (86,396 | ) | | | (750,396 | ) |
| Net increase (decrease) | 27,843 | | | $ | 236,438 | | 1,393,966 | | | $ | 11,857,272 | |
| Year ended October 31, 2015 | | | | | | | | | | | | |
| Shares sold | 398,482 | | | $ | 3,455,605 | | 702 | | | $ | 6,249 | |
| Shares issued in reinvestment of distributions | 8,176 | | | | 70,673 | | 444 | | | | 3,983 | |
| Shares redeemed | (980,650 | ) | | | (8,485,647 | ) | (51,765 | ) | | | (461,413 | ) |
| Net increase (decrease) | (573,992 | ) | | $ | (4,959,369 | ) | (50,619 | ) | | $ | (451,181 | ) |
| Advisor Class Shares: | | | | | | | | | | | | |
| Year ended October 31, 2016 | | | | | | | | | | | | |
| Shares sold | 13,280,439 | | $ | 112,298,847 | | 43,401,930 | | | $ | 369,260,775 | |
| Shares issued in reinvestment of distributions | 441,098 | | | | 3,728,635 | | 2,892,071 | | | | 24,565,655 | |
| Shares redeemed | (22,751,797 | ) | | (192,776,272 | ) | (84,100,921 | ) | | | (708,004,973 | ) |
| Net increase (decrease) | (9,030,260 | ) | $ | (76,748,790 | ) | (37,806,920 | ) | | $ | (314,178,543 | ) |
| Year ended October 31, 2015 | | | | | | | | | | | | |
| Shares sold | 16,262,514 | | $ | 140,248,227 | | 50,519,163 | | | $ | 450,379,688 | |
| Shares issued in reinvestment of distributions | 492,842 | | | | 4,251,127 | | 3,269,592 | | | | 29,068,251 | |
| Shares redeemed | (28,703,734 | ) | | (247,690,899 | ) | (113,811,749 | ) | | (1,013,598,505 | ) |
| Net increase (decrease) | (11,948,378 | ) | $ | (103,191,545 | ) | (60,022,994 | ) | | $ | (534,150,566 | ) |
| |
| | Franklin Low Duration | | Franklin Total | |
| | Total Return Fund | | Return Fund | |
| | Shares | | | | Amount | | Shares | | | | Amount | |
| Class A Shares: | | | | | | | | | | | | |
| Year ended October 31, 2016 | | | | | | | | | | | | |
| Shares sold | 47,047,322 | | $ | 461,234,268 | | 93,822,994 | | | $ | 916,738,346 | |
| Shares issued in reinvestment of distributions | 2,977,746 | | | | 29,135,231 | | 10,292,781 | | | | 99,324,788 | |
| Shares redeemed | (62,936,182 | ) | | (617,680,799 | ) | (96,558,711 | ) | | | (949,445,169 | ) |
| Net increase (decrease) | (12,911,114 | ) | $ | (127,311,300 | ) | 7,557,064 | | | $ | 66,617,965 | |
| Year ended October 31, 2015 | | | | | | | | | | | | |
| Shares sold | 62,045,618 | | $ | 620,756,628 | | 106,013,942 | | $ | 1,065,164,455 | |
| Shares issued in reinvestment of distributions | 2,798,272 | | | | 27,971,757 | | 9,933,392 | | | | 99,512,096 | |
| Shares redeemed | (55,015,732 | ) | | (550,199,734 | ) | (74,337,731 | ) | | | (746,735,554 | ) |
| Net increase (decrease) | 9,828,158 | | | $ | 98,528,651 | | 41,609,603 | | | $ | 417,940,997 | |
franklintempleton.com
Annual Report
121
FRANKLIN INVESTORS SECURITIES TRUST
NOTES TO FINANCIAL STATEMENTS
| | | | | | | | | | |
| 2. Shares of Beneficial Interest (continued) | | | | | | | | | | |
| |
| | Franklin Low Duration | | Franklin Total | |
| | Total Return Fund | | Return Fund | |
| | Shares | | | Amount | | Shares | | | Amount | |
| Class C Shares: | | | | | | | | | | |
| Year ended October 31, 2016 | | | | | | | | | | |
| Shares sold | 10,992,306 | | $ | 107,389,119 | | 11,518,037 | | $ | 111,836,091 | |
| Shares issued in reinvestment of distributions | 344,793 | | | 3,366,635 | | 1,118,125 | | | 10,736,413 | |
| Shares redeemed | (10,576,146 | ) | | (103,394,512 | ) | (12,292,706 | ) | | (119,694,781 | ) |
| Net increase (decrease) | 760,953 | | $ | 7,361,242 | | 343,456 | | $ | 2,877,723 | |
| Year ended October 31, 2015 | | | | | | | | | | |
| Shares sold | 11,804,941 | | $ | 117,806,725 | | 13,450,866 | | $ | 134,822,571 | |
| Shares issued in reinvestment of distributions | 267,721 | | | 2,673,011 | | 1,125,209 | | | 11,241,167 | |
| Shares redeemed | (7,138,718 | ) | | (71,322,146 | ) | (12,032,841 | ) | | (120,149,696 | ) |
| Net increase (decrease) | 4,933,944 | | $ | 49,157,590 | | 2,543,234 | | $ | 25,914,042 | |
| Class R Shares: | | | | | | | | | | |
| Year ended October 31, 2016 | | | | | | | | | | |
| Shares sold | | | | | | 1,331,922 | | $ | 12,937,501 | |
| Shares issued in reinvestment of distributions | | | | | | 186,048 | | | 1,789,731 | |
| Shares redeemed | | | | | | (2,741,401 | ) | | (26,746,288 | ) |
| Net increase (decrease) | | | | | | (1,223,431 | ) | $ | (12,019,056 | ) |
| Year ended October 31, 2015 | | | | | | | | | | |
| Shares sold | | | | | | 2,816,817 | | $ | 28,284,445 | |
| Shares issued in reinvestment of distributions | | | | | | 178,317 | | | 1,783,880 | |
| Shares redeemed | | | | | | (1,673,042 | ) | | (16,742,703 | ) |
| Net increase (decrease) | | | | | | 1,322,092 | | $ | 13,325,622 | |
| Class R6 Shares: | | | | | | | | | | |
| Year ended October 31, 2016 | | | | | | | | | | |
| Shares sold | 13,012,102 | | $ | 127,680,026 | | 5,007,346 | | $ | 49,666,379 | |
| Shares issued in reinvestment of distributions | 1,225,030 | | | 12,041,881 | | 8,309 | | | 80,954 | |
| Shares redeemed | (9,709,503 | ) | | (95,938,756 | ) | (2,560,569 | ) | | (25,295,618 | ) |
| Net increase (decrease) | 4,527,629 | | $ | 43,783,151 | | 2,455,086 | | $ | 24,451,715 | |
| Year ended October 31, 2015 | | | | | | | | | | |
| Shares sold | 14,096,020 | | $ | 142,249,562 | | 5,543,739 | | $ | 56,013,679 | |
| Shares issued in reinvestment of distributions | 1,147,359 | | | 11,505,176 | | 4,715 | | | 47,383 | |
| Shares redeemed | (5,397,823 | ) | | (54,168,528 | ) | (1,159,308 | ) | | (11,575,084 | ) |
| Net increase (decrease) | 9,845,556 | | $ | 99,586,210 | | 4,389,146 | | $ | 44,485,978 | |
122 Annual Report
franklintempleton.com
| | | | | | | | | | | |
| | | | | FRANKLIN INVESTORS SECURITIES TRUST | |
| | | | | | NOTES TO FINANCIAL STATEMENTS | |
| |
| |
| |
| |
| | Franklin Low Duration | | Franklin Total | |
| | Total Return Fund | | Return Fund | |
| | Shares | | | | Amount | | Shares | | | Amount | |
| Advisor Class Shares: | | | | | | | | | | | |
| Year ended October 31, 2016 | | | | | | | | | | | |
| Shares sold | 18,882,422 | | $ | 186,687,617 | | 48,174,526 | | $ | 480,064,749 | |
| Shares issued in reinvestment of distributions | 280,629 | | | | 2,760,337 | | 1,297,441 | | | 12,575,671 | |
| Shares redeemed | (11,651,331 | ) | | (115,091,760 | ) | (28,473,005 | ) | | (280,452,940 | ) |
| Net increase (decrease) | 7,511,720 | | | $ | 74,356,194 | | 20,998,962 | | $ | 212,187,480 | |
| Year ended October 31, 2015 | | | | | | | | | | | |
| Shares sold | 7,865,807 | | | $ | 78,985,437 | | 26,269,640 | | $ | 265,286,213 | |
| Shares issued in reinvestment of distributions | 252,897 | | | | 2,536,877 | | 3,401,485 | | | 34,224,878 | |
| Shares redeemed | (12,585,151 | ) | | (126,559,300 | ) | (102,089,675 | ) | | (1,017,296,513 | ) |
| Net increase (decrease) | (4,466,447 | ) | $ | (45,036,986 | ) | (72,418,550 | ) | $ | (717,785,422 | ) |
3. Transactions with Affiliates
Franklin Resources, Inc. is the holding company for various subsidiaries that together are referred to as Franklin Templeton Investments. Certain officers and trustees of the Trust are also officers and/or directors of the following subsidiaries:
| |
| Subsidiary | Affiliation |
| Franklin Advisers, Inc. (Advisers) | Investment manager |
| Franklin Templeton Institutional, LLC (FT Institutional) | Investment manager |
| Franklin Templeton Services, LLC (FT Services) | Administrative manager |
| Franklin Templeton Distributors, Inc. (Distributors) | Principal underwriter |
| Franklin Templeton Investor Services, LLC (Investor Services) | Transfer agent |
a. Management Fees
Franklin Adjustable U.S. Government Securities Fund pays an investment management fee to Advisers based on the average daily net assets of the Fund as follows:
| | |
| Annualized Fee Rate | | Net Assets |
| 0.500 | % | Up to and including $5 billion |
| 0.440 | % | Over $5 billion, up to and including $10 billion |
| 0.410 | % | Over $10 billion, up to and including $15 billion |
| 0.380 | % | In excess of $15 billion |
franklintempleton.com
Annual Report
123
FRANKLIN INVESTORS SECURITIES TRUST
NOTES TO FINANCIAL STATEMENTS
3. Transactions with Affiliates (continued)
a. Management Fees (continued)
Franklin Floating Rate Daily Access Fund pays an investment management fee to Advisers based on the average daily net assets of the Fund as follows:
| | |
| Annualized Fee Rate | | Net Assets |
| 0.650 | % | Up to and including $500 million |
| 0.550 | % | Over $500 million, up to and including $1 billion |
| 0.500 | % | Over $1 billion, up to and including $1.5 billion |
| 0.450 | % | Over $1.5 billion, up to and including $6.5 billion |
| 0.425 | % | Over $6.5 billion, up to and including $11.5 billion |
| 0.400 | % | Over $11.5 billion, up to and including $16.5 billion |
| 0.390 | % | Over $16.5 billion, up to and including $19 billion |
| 0.380 | % | Over $19 billion, up to and including $21.5 billion |
| 0.370 | % | In excess of $21.5 billion |
Franklin Low Duration Total Return Fund and Franklin Total Return Fund pay an investment management fee to Advisers based on the average daily net assets of each of the Funds as follows:
| | |
| Annualized Fee Rate | | Net Assets |
| 0.625 | % | Up to and including $500 million |
| 0.525 | % | Over $500 million, up to and including $1 billion |
| 0.480 | % | Over $1 billion, up to and including $1.5 billion |
| 0.435 | % | Over $1.5 billion, up to and including $6.5 billion |
| 0.415 | % | Over $6.5 billion, up to and including $11.5 billion |
| 0.400 | % | Over $11.5 billion, up to and including $16.5 billion |
| 0.390 | % | Over $16.5 billion, up to and including $19 billion |
| 0.380 | % | Over $19 billion, up to and including $21.5 billion |
| 0.370 | % | In excess of $21.5 billion |
Under a subadvisory agreement, FT Institutional, an affiliate of Advisers, provides subadvisory services to Franklin Total Return Fund. The subadvisory fee is paid by Advisers based on the Fund’s average daily net assets, and is not an additional expense of the Fund.
For the year ended October 31, 2016, each Fund’s effective investment management fee rate based on average daily net assets were as follows:
| | | | | | | |
| Franklin | | Franklin | | Franklin | | | |
| Adjustable | | Floating Rate | | Low Duration | | Franklin | |
| U.S. Government | | Daily Access | | Total Return | | Total Return | |
| Securities Fund | | Fund | | Fund | | Fund | |
| |
| 0.500 | % | 0.508 | % | 0.499 | % | 0.469 | % |
b. Administrative Fees
Under an agreement with Advisers, FT Services provides administrative services to the Funds. The fee is paid by Advisers based on each of the Funds’ average daily net assets, and is not an additional expense of the Funds.
124 Annual Report
franklintempleton.com
FRANKLIN INVESTORS SECURITIES TRUST
NOTES TO FINANCIAL STATEMENTS
c. Distribution Fees
The Board has adopted distribution plans for each share class, with the exception of Class R6 and Advisor Class shares, pursuant to Rule 12b-1 under the 1940 Act. Under the Funds’ Class A and A1 reimbursement distribution plans, the Funds reimburse Distributors for costs incurred in connection with the servicing, sale and distribution of each Fund’s shares up to the maximum annual plan rate for each class. Under the Class A and A1 reimbursement distribution plans, costs exceeding the maximum for the current plan year cannot be reimbursed in subsequent periods. In addition, under the Funds’ Class C and R compensation distribution plans, the Funds pay Distributors for costs incurred in connection with the servicing, sale and distribution of each Fund’s shares up to the maximum annual plan rate for each class. The plan year, for purposes of monitoring compliance with the maximum annual plan rates, is February 1 through January 31 for each Fund.
The maximum annual plan rates, based on the average daily net assets, for each class, are as follows:
| | | | | | | | |
| | Franklin | | Franklin | | Franklin | | | |
| | Adjustable | | Floating Rate | | Low Duration | | Franklin | |
| | U.S. Government | | Daily Access | | Total Return | | Total Return | |
| | Securities Fund | | Fund | | Fund | | Fund | |
| |
| Reimbursement Plans: | | | | | | | | |
| Class A | 0.25 | % | 0.25 | % | 0.25 | % | 0.25 | % |
| Class A1 | 0.10 | % | — | | — | | — | |
| Compensation Plans: | | | | | | | | |
| Class C | 0.65 | % | 0.65 | % | 0.65 | % | 0.65 | % |
| Class R | — | | — | | — | | 0.50 | % |
d. Sales Charges/Underwriting Agreements
Front-end sales charges and contingent deferred sales charges (CDSC) do not represent expenses of the Funds. These charges are deducted from the proceeds of sales of fund shares prior to investment or from redemption proceeds prior to remittance, as applicable. Distributors has advised the Funds of the following commission transactions related to the sales and redemptions of the Funds’ shares for the year:
| | | | | | | | |
| | | Franklin | | Franklin | | Franklin | | |
| | | Adjustable | | Floating Rate | | Low Duration | | Franklin |
| | | U.S. Government | | Daily Access | | Total Return | | Total Return |
| | | Securities Fund | | Fund | | Fund | | Fund |
| |
| Sales charges retained net of commissions paid to | | | | | | | | |
| unaffiliated brokers/dealers | $ | 101,446 | $ | 107,323 | $ | 294,814 | $ | 1,878,970 |
| CDSC retained | $ | 31,367 | $ | 51,596 | $ | 92,140 | $ | 83,278 |
e. Transfer Agent Fees
Each class of shares, except for Class R6, pays transfer agent fees to Investor Services for its performance of shareholder servicing obligations and reimburses Investor Services for out of pocket expenses incurred, including shareholder servicing fees paid to third parties. These fees are allocated daily based upon their relative proportion of such classes’ aggregate net assets. Class R6 pays Investor Services transfer agent fees specific to that class.
For the year ended October 31, 2016, the Funds paid transfer agent fees as noted in the Statements of Operations of which the following amounts were retained by Investor Services:
| | | | | | | | |
| | | Franklin | | Franklin | | Franklin | | |
| | | Adjustable | | Floating Rate | | Low Duration | | Franklin |
| | | U.S. Government | | Daily Access | | Total Return | | Total Return |
| | | Securities Fund | | Fund | | Fund | | Fund |
| |
| Transfer agent fees | $ | 727,892 | $ | 1,093,101 | $ | 1,256,419 | $ | 2,501,774 |
franklintempleton.com
Annual Report
125
FRANKLIN INVESTORS SECURITIES TRUST
NOTES TO FINANCIAL STATEMENTS
3. Transactions with Affiliates (continued)
f. Investments in Affiliated Management Investment Companies
Certain or all Funds invest in one or more affiliated management investment companies for purposes other than exercising a controlling influence over the management or policies. Management fees paid by the Funds are waived on assets invested in the affiliated management investment companies, as noted in the Statements of Operations, in an amount not to exceed the management and administrative fees paid directly or indirectly by each affiliate. Prior to November 1, 2013, the waiver was accounted for as a reduction to management fees. During the year ended October 31, 2016, certain or all Funds held investments in affiliated management investment companies as follows:
| | | | | | | | | | | | | | |
| | | | | | | | | | | | | | % of | |
| | | | | | | | | | | | | | Affiliated | |
| | Number of | | | | | Number of | | | | | | | Fund Shares | |
| | Shares Held | | | | | Shares | | Value | | | | | Outstanding | |
| | at Beginning | Gross | | Gross | | Held at End | | at End | | Investment | | Realized | Held at End | |
| | of Year | Additions | | Reductions | | of Year | | of Year | | Income | | Gain (Loss) | of Year | |
| Franklin Adjustable U.S. Government Securities Fund | | | | | | | | | | | | |
| Non-Controlled Affiliates | | | | | | | | | | | | | | |
| Institutional Fiduciary Trust | | | | | | | | | | | | | | |
| Money Market Portfolio | 35,774,086 | 517,115,385 | | (526,076,708 | ) | 26,812,763 | $ | 26,812,763 | $ | – | $ | – | 0.2 | % |
| Franklin Floating Rate Daily Access Fund | | | | | | | | | | | | | |
| Non-Controlled Affiliates | | | | | | | | | | | | | | |
| Institutional Fiduciary Trust | | | | | | | | | | | | | | |
| Money Market Portfolio | 152,604,455 | 1,018,125,473 | | (869,434,965 | ) | 301,294,963 | $ | 301,294,963 | $ | – | $ | – | 1.8 | % |
| Franklin Low Duration Total Return Fund | | | | | | | | | | | | | |
| Non-Controlled Affiliates | | | | | | | | | | | | | | |
| Franklin Lower Tier Floating | | | | | | | | | | | | | | |
| RateFund | – | 1,893,663 | a | – | | 1,893,663 | $ | 19,675,161 | $ | 1,746,156 | $ | – | 4.3 | % |
| Franklin Middle Tier Floating | | | | | | | | | | | | | | |
| RateFund | – | 2,389,308 | b | – | | 2,389,308 | | 24,036,434 | | 1,358,603 | | – | 6.7 | % |
| Institutional Fiduciary Trust | | | | | | | | | | | | | | |
| Money Market Portfolio | 253,268,073 | 878,808,467 | | (1,042,323,077 | ) | 89,753,463 | | 89,753,463 | | – | | – | 0.5 | % |
| Total | | | | | | | $ | 133,465,058 | $ | 3,104,759 | $ | – | | |
| Franklin Total Return Fund | | | | | | | | | | | | | | |
| Controlled Affiliates | | | | | | | | | | | | | | |
| Franklin Liberty Investment | | | | | | | | | | | | | | |
| Grade Corporate ETF | – | 400,000 | | – | | 400,000 | $ | 9,888,000 | $ | – | $ | – | 57.1 | % |
| Franklin Liberty Short Duration | | | | | | | | | | | | | | |
| U.S. Government ETFc | 500,000 | – | | – | | 500,000 | | 48,780,000 | | 878,940 | | – | 28.6 | % |
| Non-Controlled Affiliates | | | | | | | | | | | | | | |
| Franklin Lower Tier Floating | | | | | | | | | | | | | | |
| RateFund | – | 997,589 | a | – | | 997,589 | | 10,364,951 | | 919,882 | | – | 2.3 | % |
| Franklin Middle Tier Floating | | | | | | | | | | | | | | |
| RateFund | – | 1,889,310 | b | – | | 1,889,310 | | 19,006,460 | | 1,074,296 | | – | 5.3 | % |
| Institutional Fiduciary Trust | | | | | | | | | | | | | | |
| Money Market Portfolio | 591,212,333 | 1,847,777,400 | | (2,334,790,068 | ) | 104,199,665 | | 104,199,665 | | – | | – | 0.6 | % |
| Total | | | | | | | $ | 192,239,076 | $ | 2,873,118 | $ | – | | |
126 Annual Report
franklintempleton.com
FRANKLIN INVESTORS SECURITIES TRUST
NOTES TO FINANCIAL STATEMENTS
aThe Funds purchased shares of the affiliate through an in-kind transfer of securities. Market value and cost basis of the securities transferred on the date of the transfer were
as follows:
| | | | |
| | | Franklin | | |
| | | Low Duration | | Franklin |
| | | Total Return | | Total Return |
| | | Fund | | Fund |
| |
| Market value | $ | 17,742,918 | $ | 9,347,037 |
| Cost basis | $ | 20,821,357 | $ | 11,616,851 |
bThe Funds purchased shares of the affiliate through an in-kind transfer of securities. Market value and cost basis of the securities transferred on the date of the transfer were
as follows:
| | | | |
| | | Franklin | | |
| | | Low Duration | | Franklin |
| | | Total Return | | Total Return |
| | | Fund | | Fund |
| |
| Market value | $ | 22,984,002 | $ | 18,174,265 |
| Cost basis | $ | 24,872,750 | $ | 21,006,435 |
cEffective June 1, 2016, Franklin Short Duration U.S.Government ETF was renamed Franklin Liberty Short Duration U.S.Government ETF.
g. Waiver and Expense Reimbursements
Advisers and Investor Services have contractually agreed in advance to waive or limit their respective fees and to assume as their own expense certain expenses otherwise payable by Franklin Low Duration Total Return and Franklin Total Return Fund so that the expenses (excluding distribution fees, and acquired fund fees and expenses) for Class A, Class C, Class R and Advisor Class of the Funds do not exceed 0.55% and 0.63%, respectively, and Class R6 does not exceed 0.42% and 0.47%, respectively, based on the average net assets of each class (other than certain non-routine expenses or costs, including those relating to litigation, indemnification, reorganizations, and liquidations) until February 28, 2017. Total expenses waived or paid are not subject to recapture subsequent to the Funds’ fiscal year end.
Additionally, Investor Services has contractually agreed in advance to waive or limit its fees so that the Class R6 transfer agent fees do not exceed 0.01% until February 28, 2017. For Franklin Low Duration Total Return Fund and Franklin Total Return Fund, there were no Class R6 transfer agent fees waived during the year ended October 31, 2016.
h. Other Affiliated Transactions
At October 31, 2016, one or more of the funds in Franklin Fund Allocator Series owned a percentage of the following Funds’ outstanding shares:
| | | |
| Franklin | | Franklin | |
| Floating Rate | | Low Duration | |
| Daily Access | | Total Return | |
| Fund | | Fund | |
| |
| 0.4 | % | 21.0 | % |
4. Expense Offset Arrangement
The Funds have entered into an arrangement with their custodian whereby credits realized as a result of uninvested cash balances are used to reduce a portion of the Funds’ custodian expenses. During the year ended October 31, 2016, the custodian fees were reduced as noted in the Statements of Operations.
franklintempleton.com
Annual Report
127
FRANKLIN INVESTORS SECURITIES TRUST
NOTES TO FINANCIAL STATEMENTS
5. Income Taxes
For tax purposes, capital losses may be carried over to offset future capital gains. Capital loss carryforwards with no expiration, if any, must be fully utilized before those losses with expiration dates.
| | | | | | | | |
| At October 31, 2016, the capital loss carryforwards were as follows: | | | | | | |
| |
| | | Franklin | | Franklin | | Franklin | | |
| | | Adjustable | | Floating | | Low Duration | | Franklin |
| | | U.S. Government | | Rate Daily | | Total Return | | Total Return |
| | | Securities Fund | | Access Fund | | Fund | | Fund |
| Capital loss carryforwards subject to expiration: | | | | | | | | |
| 2017 | $ | 4,398,245 | $ | 113,325,538 | $ | — | $ | — |
| 2018 | | 39,689,305 | | — | | — | | — |
| 2019 | | 21,934,756 | | 10,282,409 | | 5,327,487 | | — |
| Capital loss carryforwards not subject to | | | | | | | | |
| expiration: | | | | | | | | |
| Short term | | 19,905,561 | | 21,809,899 | | 23,452,757 | | 21,117,357 |
| Long term | | 72,074,646 | | 104,483,893 | | 44,282,224 | | 34,070,782 |
| Total capital loss carryforwards. | $ | 158,002,513 | $ | 249,901,739 | $ | 73,062,468 | $ | 55,188,139 |
On October 31, 2016, the following Funds had expired capital loss carryforwards, which were reclassified to paid-in capital.
| | | | | |
| | Franklin | | Franklin | | |
| | Adjustable | | Floating | | Franklin |
| | U.S. Government | | Rate Daily | | Total Return |
| | Securities Fund | | Access Fund | | Fund |
| |
| $ | 1,492,445 | $ | 91,562,953 | $ | 1,260,827 |
The tax character of distributions paid during the years ended October 31, 2016 and 2015, was as follows:
| | | | | | | | |
| | | Franklin Adjustable U.S. | | Franklin Floating Rate |
| | | Government Securities Fund | | Daily Access Fund |
| | | 2016 | | 2015 | | 2016 | | 2015 |
| Distributions paid from ordinary income | $ | 21,260,547 | $ | 22,373,219 | $ | 142,854,024 | $ | 180,452,238 |
| |
| | | Franklin Low Duration | | Franklin Total |
| | | Total Return Fund | | Return Fund |
| | | 2016 | | 2015 | | 2016 | | 2015 |
| Distributions paid from ordinary income | $ | 52,808,202 | $ | 50,173,271 | $ | 132,901,273 | $ | 156,543,941 |
128 Annual Report
franklintempleton.com
FRANKLIN INVESTORS SECURITIES TRUST
NOTES TO FINANCIAL STATEMENTS
At October 31, 2016, the cost of investments, net unrealized appreciation (depreciation) and undistributed ordinary income for income tax purposes were as follows:
| | | | | | | | | | | | |
| | | Franklin | | | Franklin | | | Franklin | | | | |
| | | Adjustable | | | Floating Rate | | | Low Duration | | | Franklin | |
| | | U.S. Government | | | Daily Access | | | Total Return | | | Total Return | |
| | | Securities Fund | | | Fund | | | Fund | | | Fund | |
| |
| Cost of investments | $ | 1,309,695,703 | | $ | 3,108,429,560 | | $ | 2,517,086,207 | | $ | 5,037,132,850 | |
| |
| Unrealized appreciation | $ | 12,045,543 | | $ | 27,787,236 | | $ | 27,903,759 | | $ | 122,722,343 | |
| Unrealized depreciation | | (3,531,173 | ) | | (83,367,954 | ) | | (30,462,593 | ) | | (107,092,718 | ) |
| Net unrealized appreciation (depreciation) | $ | 8,514,370 | | $ | (55,580,718 | ) | $ | (2,558,834 | ) | $ | 15,629,625 | |
| Distributable earnings - undistributed ordinary | | | | | | | | | | | | |
| income | $ | 152,380 | | $ | 4,175,222 | | $ | 10,846,509 | | $ | 23,461,625 | |
Differences between income and/or capital gains as determined on a book basis and a tax basis are primarily due to differing treatments of foreign currency transactions, paydown losses, bond discounts and premiums, swaps and wash sales.
| | | | | | | | | | | | | | | | | |
| 6. Investment Transactions | | | | | | | | | | | | | | | | | |
| |
| Purchases and sales of investments (excluding short term securities) for the year ended October 31, 2016, were as follows: | | |
| |
| | | Franklin | | Franklin | | | | Franklin | | | | | | | |
| | | Adjustable | | Floating Rate | | Low Duration | | | | | | Franklin | |
| | | U.S. Government | | Daily Access | | | | Total Return | | | | | Total Return | |
| | | Securities Fund | | | | Fund | | | | Fund | | | | | | Fund | |
| Purchases | $ | 167,013,172 | $ | 973,210,589 | $ | 1,408,666,376 | $ | 13,909,873,568 | |
| Sales | $ | 496,674,286 | $ | 1,697,404,535 | $ | 1,087,525,686 | $ | 13,652,417,019 | |
| |
| Transactions in options and swaptions written during the year ended October 31, 2016, were as follows: | | | | | | | |
| |
| | | | | Options | | | | | | Swaptions | | |
| | | | | Notional | | | | | | Notional | | | | | |
| | | | | Amount* | | Premiums | | Amount* | | | Premiums | |
| Franklin Low Duration Total Return Fund | | | | | | | | | | | | | | | | | |
| Options outstanding at October 31, 2015 | | | | 2,500,000 | | $ | | 15,425 | | 55,400,000 | | $ | 327,600 | |
| Options written | | | | 7,500,000 | | | | 52,404 | | | | — | | | | — | |
| Options expired | | | | (2,500,000 | ) | | | (22,839 | ) | (46,200,000 | ) | | | (229,689 | ) |
| Options exercised | | | | (5,000,000 | ) | | | (29,565 | ) | | | — | | | | — | |
| Options closed | | | | (2,500,000 | ) | | | (15,425 | ) | (9,200,000 | ) | | | (97,911 | ) |
| Options outstanding at October 31, 2016 | | | | — | | $ | | — | | | | — | | | $ | — | |
| |
| Franklin Total Return Fund | | | | | | | | | | | | | | | | | |
| Options outstanding at October 31, 2015 | | | | 3,800,000 | | $ | | 23,446 | | 120,000,000 | | $ | 711,000 | |
| Options written | | | | 16,530,000 | | | | 115,498 | | | | — | | | | — | |
| Options expired | | | | (5,510,000 | ) | | | (50,337 | ) | (100,000,000 | ) | | | (498,150 | ) |
| Options exercised | | | | — | | | | — | | | | — | | | | — | |
| Options closed | | | | (14,820,000 | ) | | | (88,607 | ) | (20,000,000 | ) | | | (212,850 | ) |
| Options outstanding at October 31, 2016 | | | | — | | $ | | — | | | | — | | | $ | — | |
| |
| *The notional amount is stated in U.S. dollars unless otherwise indicated. | | | | | | | | | | | | | | | |
| |
| See Notes 1(d) and 10 regarding derivative financial instruments and other derivative information, respectively. | | | | | | | |
franklintempleton.com
Annual Report
129
FRANKLIN INVESTORS SECURITIES TRUST
NOTES TO FINANCIAL STATEMENTS
7. Credit Risk and Defaulted Securities
At October 31, 2016, Franklin Floating Rate Daily Access Fund, Franklin Low Duration Total Return Fund and Franklin Total Return Fund had 81.2%, 15.6% and 13.9%, respectively, of their portfolio invested in high yield securities, senior secured floating rate notes, or other securities rated below investment grade and unrated securities, if any. These securities may be more sensitive to economic conditions causing greater price volatility and are potentially subject to a greater risk of loss due to default than higher rated securities.
Certain or all Funds held a defaulted securities and/or other securities for which the income has been deemed uncollectible. At October 31, 2016, the aggregate value of these securities for Franklin Floating Rate Daily Access Fund, Franklin Low Duration Total Return Fund, and Franklin Total Return Fund was $6,777,795, $1,935,244 and $4,396,522, representing 0.2%, 0.1%, and 0.1%, respectively, of each Fund’s net assets. The Funds discontinue accruing income on securities for which income has been deemed uncollectible and provide an estimate for losses on interest receivable. The securities have been identified in the accompanying Statements of Investments.
8. Restricted Securities
Certain or all Funds invest in securities that are restricted under the Securities Act of 1933 (1933 Act) or which are subject to legal, contractual, or other agreed upon restrictions on resale. Restricted securities are often purchased in private placement transactions, and cannot be sold without prior registration unless the sale is pursuant to an exemption under the 1933 Act. Disposal of these securities may require greater effort and expense, and prompt sale at an acceptable price may be difficult. The Funds may have registration rights for restricted securities. The issuer generally incurs all registration costs.
At October 31, 2016, certain or all Funds held investments in restricted securities, excluding certain securities exempt from registration under the 1933 Act deemed to be liquid, as follows:
| | | | | | |
| | | Acquisition | | | | |
| Shares | Issuer | Date | | Cost | | Value |
| Franklin Floating Rate Daily Access Fund | | | | | |
| 6,893 | Warrior Met Coal LLC, A (Value is 0.0%† of Net Assets) | 7/31/14 - 9/23/14 | $ | 13,170,468 | $ | 1,550,925 |
| Franklin Low Duration Total Return Fund | | | | | |
| 98,168 | a Halcon Resources Corp. (Value is 0.0%† of Net Assets) | 3/17/15 - 7/07/15 | $ | 1,880,354 | $ | 786,358 |
| Franklin Total Return Fund | | | | | |
| 229,059 | b Halcon Resources Corp. (Value is 0.0%† of Net Assets) | 3/17/15 - 7/07/15 | $ | 4,383,140 | $ | 1,834,837 |
†Rounds to less than 0.1% of net assets.
aThe Fund also invests in unrestricted securities or other investments in the issuer, valued at $22,145 as of October 31, 2016.
bThe Fund also invests in unrestricted securities or other investments in the issuer, valued at $51,675 as of October 31, 2016.
9. Unfunded Loan Commitments
Certain or all Funds enter into certain credit agreements, all or a portion of which may be unfunded. The Funds are obligated to fund these loan commitments at the borrowers’ discretion. Unfunded loan commitments and funded portions of credit agreements are marked to market daily and any unrealized appreciation or depreciation is included in the Statements of Assets and Liabilities and the Statements of Operations. Funded portions of credit agreements are presented in the Statements of Investments.
130 Annual Report
franklintempleton.com
FRANKLIN INVESTORS SECURITIES TRUST
NOTES TO FINANCIAL STATEMENTS
| | |
| At October 31, 2016, unfunded commitments were as follows: | | |
| |
| | | Unfunded |
| Borrower | | Commitment |
| Franklin Floating Rate Daily Access Fund | | |
| BMC Software Finance, Inc., Initial U.S. Revolving Commitment | $ | 20,723,252 |
| Franklin Low Duration Total Return Fund | | |
| BMC Software Finance, Inc., Initial US Revolving Commitment | $ | 3,492,917 |
| Franklin Total Return Fund | | |
| BMC Software Finance, Inc., Initial US Revolving Commitment | $ | 7,629,911 |
| Global Tel*Link Corp., Revolving Commitment | | 211,174 |
| | $ | 7,841,085 |
10. Other Derivative Information
At October 31, 2016, the Funds’ investments in derivative contracts are reflected in the Statements of Assets and Liabilities as follows:
| | | | | | | | |
| | Asset Derivatives | | | | Liability Derivatives | | | |
| Derivative Contracts | Statements of | | | | Statements of | | | |
| Not Accounted for as | Assets and Liabilities | | | | Assets and Liabilities | | | |
| Hedging Instruments | Location | | Fair Value | | Location | | Fair Value | |
| Franklin Low Duration Total | | | | | | | | |
| Return Fund | | | | | | | | |
| Interest rate contracts | Variation margin | $ | 1,435,193 | a | Variation margin | $ | 120,992 | a |
| |
| | Unrealized appreciation on OTC | | 529,316 | | Unrealized depreciation on OTC | | — | |
| | swap contracts | | | | swap contracts | | | |
| |
| Foreign exchange contracts. | Unrealized appreciation on OTC | | 2,529,129 | | Unrealized depreciation on OTC | | 970,445 | |
| | forward exchange | | | | forward exchange | | | |
| | contracts | | | | contracts | | | |
| |
| Credit contracts | Investments in securities, at value | | 35,792 | b | Options written, at value | | — | |
| |
| | Variation margin | | 246,036 | a | Variation margin | | — | |
| |
| | OTC swap contracts (Upfront | | 3,982,848 | | OTC swap contracts (Upfront | | 6,404,019 | |
| | payments) | | | | receipts) | | | |
| |
| | Unrealized appreciation on OTC | | 1,170,688 | | Unrealized depreciation on OTC | | 5,538,363 | |
| | swap contracts | | | | swap contracts | | | |
| Totals | | $ | 9,929,002 | | | $ | 13,033,819 | |
franklintempleton.com
Annual Report
131
FRANKLIN INVESTORS SECURITIES TRUST
NOTES TO FINANCIAL STATEMENTS
| | | | | | | | |
| 10. Other Derivative Information (continued) | | | | | | | |
| |
| | Asset Derivatives | | | | Liability Derivatives | | | |
| Derivative Contracts | Statements of | | | | Statements of | | | |
| Not Accounted for as | Assets and Liabilities | | | | Assets and Liabilities | | | |
| Hedging Instruments | Location | | Fair Value | | Location | | Fair Value | |
| Franklin Total Return Fund | | | | | | | | |
| Interest rate contracts | Variation margin | $ | 651,726 | a | Variation margin | $ | 4,509,179 | a |
| | Unrealized appreciation on OTC | | 729,611 | | Unrealized depreciation on OTC | | — | |
| | swap contracts | | | | swap contracts | | | |
| Foreign exchange contracts. | Unrealized appreciation on OTC | | 9,172,100 | | Unrealized depreciation on OTC | | 1,856,840 | |
| | forward exchange | | | | forward exchange | | | |
| | contracts | | | | contracts | | | |
| Credit contracts | Investments in securities, at value | | 102,850 | b | Options written, at value | | — | |
| | Variation margin | | 380,464 | a | Variation margin | | 488,867 | a |
| | OTC swap contracts (Upfront | | 11,533,411 | | OTC swap contracts (Upfront | | 10,930,228 | |
| | payments) | | | | receipts) | | | |
| | Unrealized appreciation on OTC | | 2,077,320 | | Unrealized depreciation on OTC | | 14,544,122 | |
| | swap contracts | | | | swap contracts | | | |
| Inflation contracts. | Unrealized appreciation on OTC | | 1,614,905 | | Unrealized depreciation on OTC | | — | |
| | swap contracts | | | | swap contracts | | | |
| Value recovery instruments | Investments in securities, at value | | 152,291 | | Investments in securities, at value | | — | |
| Totals | | $ | 26,414,678 | | | $ | 32,329,236 | |
aThis amount reflects the cumulative appreciation (depreciation) of futures contracts and/or centrally cleared swap contracts as reported in the Statement of Investments.
Only the variation margin receivable/payable at year end is separately reported within the Statements of Assets and Liabilities. Prior variation margin movements were
recorded to cash upon receipt or payment.
bPurchased option contracts are included in investments in securities, at value in the Statements of Assets and Liabilities.
132 Annual Report
franklintempleton.com
FRANKLIN INVESTORS SECURITIES TRUST
NOTES TO FINANCIAL STATEMENTS
For the year ended October 31, 2016, the effect of derivative contracts in the Funds’ Statements of Operations was as follows:
| | | | | | | | |
| | | | | | | | Net Change | |
| | | | | | | | in Unrealized | |
| Derivative Contracts | | | Net Realized | | | | Appreciation | |
| Not Accounted for as | Statements of | | Gain (Loss) for | | Statements | | (Depreciation) | |
| Hedging Instruments | Operations Locations | | the Year | | of Operations Locations | | for the Year | |
| | Net realized gain (loss) from: | | | | Net change in unrealized | | | |
| | | | | | appreciation (depreciation) on: | | | |
| Franklin Floating Rate Daily | | | | | | | | |
| Access Fund | | | | | | | | |
| Credit contracts | Swap contracts | $ | 217,311 | | Swap contracts | $ | 47,565 | |
| Franklin Low Duration | | | | | | | | |
| Total Return Fund | | | | | | | | |
| Interest rate contracts. | Futures contracts | $ | (2,018,476 | ) | Futures contracts | $ | 1,255,315 | |
| | Swap contracts | | (1,729,370 | ) | Swap contracts | | (298,189 | ) |
| Foreign exchange contracts | Investments | | (55,795 | )a | Investments | | 29,215 | a |
| | Written options | | (16,726 | ) | Written options | | (15,295 | ) |
| | Foreign currency transactions | | (2,529,777 | )b | Translation of other assets | | (2,514,662 | )b |
| | | | | | and liabilities denominated | | | |
| | | | | | in foreign currencies | | | |
| Credit contracts | Investments | | (562,290 | )a | Investments | | 341,632 | a |
| | Written options | | 323,957 | | Written options | | (292,978 | ) |
| | Swap contracts | | (3,849,360 | ) | Swap contracts | | (3,811,521 | ) |
| Totals | | $ | (10,437,837 | ) | | $ | (5,306,483 | ) |
| Franklin Total Return Fund | | | | | | | | |
| Interest rate contracts. | Investments | $ | (650,018 | )a | Investments | $ | 26,544 | a |
| | Futures contracts | | 7,162,540 | | Futures contracts | | (3,721,434 | ) |
| | Swap contracts | | 298,949 | | Swap contracts | | (4,200,848 | ) |
| Foreign exchange contracts | Investments | | (213,464 | )a | Investments | | 44,407 | a |
| | Written options | | (47,244 | ) | Written options | | (23,249 | ) |
| | Foreign currency transactions | | (23,123,401 | )b | Translation of other assets | | 324,184 | b |
| | | | | | and liabilities denominated | | | |
| | | | | | in foreign currencies | | | |
| Credit contracts | Investments | | (1,258,500 | )a | Investments | | 636,681 | a |
| | Written options | | 703,080 | | Written options | | (635,897 | ) |
| | Swap contracts | | (10,490,026 | ) | Swap contracts | | (7,999,622 | ) |
| Inflation contracts. | Swap contracts | | — | | Swap contracts | | 1,614,905 | |
| Value recovery instruments | Investments | | — | | Investments | | (34,939 | ) |
| Totals | | $ | (27,618,084 | ) | | $ | (13,969,268 | ) |
aPurchased option contracts are included in net realized gain (loss) from investments and net change in unrealized appreciation (depreciation) on investments in the
Statements of Operations.
bForward exchange contracts are included in net realized gain (loss) from foreign currency transactions and net change in unrealized appreciation (depreciation) on
translation of other assets and liabilities denominated in foreign currencies in the Statements of Operations.
franklintempleton.com
Annual Report
133
FRANKLIN INVESTORS SECURITIES TRUST
NOTES TO FINANCIAL STATEMENTS
10. Other Derivative Information (continued)
For the year ended October 31, 2016, the average month end fair value of derivatives, as a percentage of average month end net assets, and the average month end number of open derivative contracts for the year were as follows:
| | | | | | |
| | | | Franklin | | | |
| | Franklin | | Low Duration | | Franklin | |
| | Floating Rate | | Total Return | | Total Return | |
| | Daily Access Fund | | Fund | | Fund | |
| |
| Average month end fair value of derivatives | 0.0 | %a | 0.6 | % | 1.0 | % |
| Average month end number of open derivative contracts | —b | | 155 | | 166 | |
aRounds to less than 0.1%.
bRounds to less than 1 contract.
At October 31, 2016, the Funds’ OTC derivative assets and liabilities are as follows:
| | | | |
| | | Gross Amounts of | | |
| | | Assets and Liabilities Presented |
| | | in the Statements of Assets and Liabilities |
| | | Assetsa | | Liabilitiesa |
| Derivatives | | | | |
| Franklin Low Duration | | | | |
| Total Return Fund | | | | |
| Forward exchange contracts | $ | 2,529,129 | $ | 970,445 |
| Options purchased | | 35,792 | | — |
| Swap contracts | | 5,682,852 | | 11,942,382 |
| Total | $ | 8,247,773 | $ | 12,912,827 |
| |
| Franklin Total | | | | |
| Return Fund | | | | |
| Forward exchange contracts | $ | 9,172,100 | $ | 1,856,840 |
| Options purchased | | 102,850 | | — |
| Swap contracts | | 15,955,247 | | 25,474,350 |
| Total | $ | 25,230,197 | $ | 27,331,190 |
aAbsent an event of default or early termination, OTC derivative assets and liabilities are presented gross and not offset in the Statements of Assets and Liabilities.
134 Annual Report
franklintempleton.com
FRANKLIN INVESTORS SECURITIES TRUST
NOTES TO FINANCIAL STATEMENTS
At October 31, 2016, the Funds’ OTC derivative assets, which may be offset against the Funds’ OTC derivative liabilities and collateral received from the counterparty, are as follows:
| | | | | | | | | | | | | | | | |
| | | | | Amounts Not Offset in the | | | | |
| | | | | Statements of Assets and Liabilities | | | |
| | | Gross | | | | | | | | | | | | | | |
| | | Amounts of | | Financial | | | | | Financial | | | | | | | |
| | | Assets Presented in | | Instruments | | | Instruments | | | | Cash | | | Net Amount |
| | | the Statements of | | Available for | | | | | Collateral | | | Collateral | | | (Not less |
| | | Assets and Liabilities | | Offset | | | | | Received | | | Receiveda | | | than zero) |
| Franklin Low Duration Total Return Fund | | | | | | | | | | | | | | | | |
| Counterparty | | | | | | | | | | | | | | | | |
| BOFA | $ | — | $ | — | | | | $ | — | | | $ | — | | $ | — |
| BZWS | | 456,203 | | (456,203 | ) | | | | — | | | | — | | | — |
| CITI | | 1,180,897 | | (1,180,897 | ) | | | | — | | | | — | | | — |
| DBAB. | | 2,140,166 | | (1,411,595 | ) | | | | — | | | | (728,571 | ) | | — |
| FBCO | | 17,034 | | (17,034 | ) | | | | — | | | | — | | | — |
| GSCO | | 2,767,457 | | (2,767,457 | ) | | | | — | | | | — | | | — |
| HSBK | | 12 | | (12 | ) | | | | — | | | | — | | | — |
| JPHQ. | | 1,616,808 | | (1,616,808 | ) | | | | — | | | | — | | | — |
| MSCO | | 69,196 | | (69,196 | ) | | | | — | | | | — | | | — |
| Total | $ | 8,247,773 | $ | (7,519,202 | ) | | | $ | — | | $ | (728,571 | ) | $ | — |
| |
| | | | | Amounts Not Offset in the | | | | |
| | | | | Statements of Assets and Liabilities | | | |
| | | Gross | | | | | | | | | | | | | | |
| | | Amounts of | | Financial | | | | | Financial | | | | | | | |
| | | Assets Presented in | | Instruments | | | Instruments | | | | Cash | | | Net Amount |
| | | the Statements of | | Available for | | | | | Collateral | | | Collateral | | | (Not less |
| | | Assets and Liabilities | | Offset | | | Receiveda,b | | | Receiveda | | | than zero) |
| Franklin Total Return Fund | | | | | | | | | | | | | | | | |
| Counterparty | | | | | | | | | | | | | | | | |
| BOFA | $ | 152,451 | $ | (133,707 | ) | | $ | | — | | | $ | — | | $ | 18,744 |
| BZWS | | 1,102,419 | | (1,102,419 | ) | | | | — | | | | — | | | — |
| CITI | | 1,723,143 | | (1,723,143 | ) | | | | — | | | | — | | | — |
| DBAB | | 8,388,928 | | (4,173,749 | ) | | | | — | | | (4,215,179 | ) | | — |
| FBCO. | | 624,231 | | (624,231 | ) | | | | — | | | | — | | | — |
| GSCO | | 5,836,725 | | (5,836,725 | ) | | | | — | | | | — | | | — |
| HSBK. | | 537 | | (537 | ) | | | | — | | | | — | | | — |
| JPHQ | | 7,084,483 | | (5,319,773 | ) | | | | (1,764,710 | ) | | | — | | | — |
| MSCO | | 205,922 | | (205,922 | ) | | | | — | | | | — | | | — |
| UBSW | | 111,358 | | (111,358 | ) | | | | — | | | | — | | | — |
| Total | $ | 25,230,197 | $ | (19,231,564 | ) | $ | (1,764,710 | ) | $ | (4,215,179 | ) | $ | 18,744 |
aIn some instances, the collateral amounts disclosed in the table above were adjusted due to the requirement to limit collateral amounts to avoid the effect of overcollateral-
ization. Actual collateral received and/or pledged may be more than the amounts disclosed herein.
bAt October 31, 2016, the Fund received U.S. Government and Agency securities as collateral for derivatives.
franklintempleton.com
Annual Report
135
FRANKLIN INVESTORS SECURITIES TRUST
NOTES TO FINANCIAL STATEMENTS
10. Other Derivative Information (continued)
At October 31, 2016, the Funds’ OTC derivative liabilities, which may be offset against the Funds’ OTC derivative assets and collateral pledged to the counterparty, are as follows:
| | | | | | | | | | | | | |
| | | | | Amounts Not Offset in the | | | | |
| | | | | Statements of Assets and Liabilities | | | | |
| | | Gross | | | | | | | | | | | |
| | | Amounts of | | Financial | | | Financial | | | | | | |
| | | Liabilities Presented in | | Instruments | | | Instruments | | Cash | | | | Net Amount |
| | | the Statements of | | Available for | | | Collateral | | Collateral | | | | (Not less |
| | | Assets and Liabilities | | Offset | | | Pledged | | Pledgeda | | | | than zero) |
| Franklin Low Duration Total Return Fund | | | | | | | | | | | | | |
| Counterparty | | | | | | | | | | | | | |
| BOFA | $ | 71,765 | $ | — | | $ | — | $ | (71,765 | ) | $ | | — |
| BZWS | | 901,808 | | (456,203 | ) | | — | | (445,605 | ) | | | — |
| CITI | | 1,589,373 | | (1,180,897 | ) | | — | | (320,000 | ) | | | 88,476 |
| DBAB. | | 1,411,595 | | (1,411,595 | ) | | — | | — | | | | — |
| FBCO | | 17,034 | | (17,034 | ) | | — | | — | | | | — |
| GSCO | | 5,911,175 | | (2,767,457 | ) | | — | | (3,143,718 | ) | | | — |
| HSBK. | | 225 | | (12 | ) | | — | | — | | | | 213 |
| JPHQ. | | 2,698,496 | | (1,616,808 | ) | | — | | (850,000 | ) | | | 231,688 |
| MSCO | | 311,356 | | (69,196 | ) | | — | | (170,000 | ) | | | 72,160 |
| Total | $ | 12,912,827 | $ | (7,519,202 | ) | $ | — | $ | (5,001,088 | ) | $ | | 392,537 |
| |
| | | | | Amounts Not Offset in the | | | | |
| | | | | Statements of Assets and Liabilities | | | | |
| | | Gross | | | | | | | | | | | |
| | | Amounts of | | Financial | | | Financial | | | | | | |
| | | Liabilities Presented in | | Instruments | | | Instruments | | Cash | | | | Net Amount |
| | | the Statements of | | Available for | | | Collateral | | Collateral | | | | (Not less |
| | | Assets and Liabilities | | Offset | | | Pledged | | Pledgeda | | | | than zero) |
| Franklin Total Return Fund | | | | | | | | | | | | | |
| Counterparty | | | | | | | | | | | | | |
| BOFA | | 133,707 | | (133,707 | ) | | — | | — | | | | — |
| BZWS | | 2,107,662 | | (1,102,419 | ) | | — | | (1,005,243 | ) | | | — |
| CITI | | 3,186,041 | | (1,723,143 | ) | | — | | (1,370,000 | ) | | | 92,898 |
| DBAB. | | 4,173,749 | | (4,173,749 | ) | | — | | — | | | | — |
| FBCO | | 841,562 | | (624,231 | ) | | — | | (217,331 | ) | | | — |
| GSCO | | 10,474,078 | | (5,836,725 | ) | | — | | (4,637,353 | ) | | | — |
| HSBK. | | 3,699 | | (537 | ) | | — | | — | | | | 3,162 |
| JPHQ. | | 5,319,773 | | (5,319,773 | ) | | — | | — | | | | — |
| MSCO | | 552,761 | | (205,922 | ) | | — | | (346,839 | ) | | | — |
| UBSW | | 538,158 | | (111,358 | ) | | — | | (426,800 | ) | | | — |
| Total | $ | 27,331,190 | $ | (19,231,564 | ) | $ | — | $ | (8,003,566 | ) | | $ | 96,060 |
aIn some instances, the collateral amounts disclosed in the table above were adjusted due to the requirement to limit collateral amounts to avoid the effect of overcollateral-
ization. Actual collateral received and/or pledged may be more than the amounts disclosed herein.
See Note 1(d) and 6 regarding derivative financial instruments and investment transactions, respectively.
See Abbreviations on page 140.
136 Annual Report
franklintempleton.com
FRANKLIN INVESTORS SECURITIES TRUST
NOTES TO FINANCIAL STATEMENTS
11. Credit Facility
Certain or all Funds, together with other U.S. registered and foreign investment funds (collectively, Borrowers), managed by Franklin Templeton Investments, are borrowers in a joint syndicated senior unsecured credit facility totaling $2 billion (Global Credit Facility) which matures on February 10, 2017. This Global Credit Facility provides a source of funds to the Borrowers for temporary and emergency purposes, including the ability to meet future unanticipated or unusually large redemption requests.
Under the terms of the Global Credit Facility, the Funds shall, in addition to interest charged on any borrowings made by the Funds and other costs incurred by the Funds, pay their share of fees and expenses incurred in connection with the implementation and maintenance of the Global Credit Facility, based upon their relative share of the aggregate net assets of all of the Borrowers, including an annual commitment fee of 0.07% based upon the unused portion of the Global Credit Facility. Effective February 12, 2016, the annual commitment fee is 0.15%. These fees are reflected in other expenses in the Statements of Operations. During the year ended October 31, 2016, the Funds did not use the Global Credit Facility.
12. Fair Value Measurements
The Funds follow a fair value hierarchy that distinguishes between market data obtained from independent sources (observable inputs) and the Funds’ own market assumptions (unobservable inputs). These inputs are used in determining the value of the Funds’ financial instruments and are summarized in the following fair value hierarchy:
- Level 1 – quoted prices in active markets for identical financial instruments
- Level 2 – other significant observable inputs (including quoted prices for similar financial instruments, interest rates, prepayment speed, credit risk, etc.)
- Level 3 – significant unobservable inputs (including the Funds’ own assumptions in determining the fair value of financial instruments)
The input levels are not necessarily an indication of the risk or liquidity associated with financial instruments at that level.
For movements between the levels within the fair value hierarchy, the Funds have adopted a policy of recognizing the transfers as of the date of the underlying event which caused the movement.
A summary of inputs used as of October 31, 2016, in valuing the Funds’ assets and liabilities carried at fair value, is as follows:
| | | | | | | | |
| | | Level 1 | | Level 2 | | Level 3 | | Total |
| Franklin Adjustable U.S. Government Securities | | | | | | | | |
| Fund | | | | | | | | |
| Assets: | | | | | | | | |
| Investments in Securities: | | | | | | | | |
| Mortgage-Backed Securities | $ | — | $ | 1,291,397,310 | $ | — | $ | 1,291,397,310 |
| Short Term Investments | | 26,812,763 | | — | | — | | 26,812,763 |
| Total Investments in Securities | $ | 26,812,763 | $ | 1,291,397,310 | $ | — | $ | 1,318,210,073 |
franklintempleton.com
Annual Report
137
FRANKLIN INVESTORS SECURITIES TRUST
NOTES TO FINANCIAL STATEMENTS
| | | | | | | | |
| 12. Fair Value Measurements (continued) | | | | | | | | |
| |
| |
| | | Level 1 | | Level 2 | | Level 3 | | Total |
| Franklin Floating Rate Daily Access Fund | | | | | | | | |
| Assets: | | | | | | | | |
| Investments in Securities: | | | | | | | | |
| Equity Investments:a | | | | | | | | |
| Coal & Consumable Fuels | $ | — | $ | — | $ | 1,550,925 | $ | 1,550,925 |
| Corporate Bonds | | — | | — | | 55,695 | | 55,695 |
| Senior Floating Rate Interests | | — | | 2,603,915,572 | | — | | 2,603,915,572 |
| Asset-Backed Securities. | | — | | 146,031,687 | | — | | 146,031,687 |
| Short Term Investments | | 301,294,963 | | — | | — | | 301,294,963 |
| Total Investments in Securities | $ | 301,294,963 | $ | 2,749,947,259 | $ | 1,606,620 | $ | 3,052,848,842 |
| |
| Other Financial Instruments: | | | | | | | | |
| Unfunded Loan Commitments. | $ | — | $ | 11,867 | $ | — | $ | 11,867 |
| |
| Franklin Low Duration Total Return Fund | | | | | | | | |
| Assets: | | | | | | | | |
| Investments in Securities: | | | | | | | | |
| Equity Investments:a | | | | | | | | |
| Energy. | $ | 22,145 | $ | — | $ | 786,358 | $ | 808,503 |
| All Other Equity Investmentsb | | 43,720,111 | | — | | — | | 43,720,111 |
| Corporate Bonds | | — | | 1,018,926,197 | | — | | 1,018,926,197 |
| Senior Floating Rate Interests | | — | | 73,576,382 | | — | | 73,576,382 |
| Foreign Government and Agency Securities | | — | | 52,751,079 | | — | | 52,751,079 |
| U.S. Government and Agency Securities | | — | | 488,845,306 | | — | | 488,845,306 |
| Asset-Backed Securities and Commercial | | | | | | | | |
| Mortgage-Backed Securities. | | — | | 690,039,951 | | — | | 690,039,951 |
| Mortgage-Backed Securities | | — | | 43,381,835 | | — | | 43,381,835 |
| Municipal Bonds | | — | | 9,773,714 | | — | | 9,773,714 |
| Escrows and Litigation Trusts | | — | | — | | —c | | — |
| Options Purchased | | — | | 35,792 | | — | | 35,792 |
| Short Term Investments | | 89,753,463 | | 2,915,040 | | — | | 92,668,503 |
| Total Investments in Securities | $ | 133,495,719 | $ | 2,380,245,296 | $ | 786,358 | $ | 2,514,527,373 |
| |
| Other Financial Instruments: | | | | | | | | |
| Futures Contracts | $ | 1,088,083 | $ | — | $ | — | $ | 1,088,083 |
| Forward Exchange Contracts | | — | | 2,529,129 | | — | | 2,529,129 |
| Swap Contracts. | | — | | 2,293,150 | | — | | 2,293,150 |
| Total Other Financial Instruments | $ | 1,088,083 | $ | 4,822,279 | $ | — | $ | 5,910,362 |
| |
| Liabilities: | | | | | | | | |
| Other Financial Instruments: | | | | | | | | |
| Futures Contracts | $ | 120,992 | $ | — | $ | — | $ | 120,992 |
| Forward Exchange Contracts | | — | | 970,445 | | — | | 970,445 |
| Swap Contracts. | | — | | 5,538,363 | | — | | 5,538,363 |
| Unfunded Loan Commitments. | | — | | 54,736 | | — | | 54,736 |
| Total Other Financial Instruments | $ | 120,992 | $ | 6,563,544 | $ | — | $ | 6,684,536 |
138 Annual Report
franklintempleton.com
| | | | | | | | |
| | | | | FRANKLIN INVESTORS SECURITIES TRUST |
| | | | | NOTES TO FINANCIAL STATEMENTS |
| |
| |
| |
| |
| | | Level 1 | | Level 2 | | Level 3 | | Total |
| Franklin Total Return Fund | | | | | | | | |
| Assets: | | | | | | | | |
| Investments in Securities: | | | | | | | | |
| Equity Investments:a | | | | | | | | |
| Consumer Services | $ | — | $ | 5,378,919 | $ | — | $ | 5,378,919 |
| Energy. | | 51,675 | | — | | 1,834,837 | | 1,886,512 |
| All Other Equity Investmentsb | | 106,891,438 | | — | | — | | 106,891,438 |
| Corporate Bonds | | — | | 1,861,142,700 | | 1,078 | | 1,861,143,778 |
| Senior Floating Rate Interests | | — | | 75,229,792 | | — | | 75,229,792 |
| Foreign Government and Agency Securities | | — | | 205,692,589 | | — | | 205,692,589 |
| U.S. Government and Agency Securities | | — | | 889,025,124 | | — | | 889,025,124 |
| Asset-Backed Securities and Commercial | | | | | | | | |
| Mortgage-Backed Securities. | | — | | 680,102,143 | | 15,780 | | 680,117,923 |
| Mortgage-Backed Securities | | — | | 1,036,923,309 | | — | | 1,036,923,309 |
| Municipal Bonds | | — | | 86,170,576 | | — | | 86,170,576 |
| Escrows and Litigation Trusts | | — | | — | | —c | | — |
| Options Purchased | | — | | 102,850 | | — | | 102,850 |
| Short Term Investments | | 104,199,665 | | — | | — | | 104,199,665 |
| Total Investments in Securities | $ | 211,142,778 | $ | 4,839,768,002 | $ | 1,851,695 | $ | 5,052,762,475 |
| |
| Other Financial Instruments: | | | | | | | | |
| Futures Contracts | $ | 651,726 | $ | — | $ | — | $ | 651,726 |
| Forward Exchange Contracts | | — | | 9,172,100 | | — | | 9,172,100 |
| Swap Contracts. | | — | | 4,802,300 | | — | | 4,802,300 |
| Total Other Financial Instruments | $ | 651,726 | $ | 13,974,400 | $ | — | $ | 14,626,126 |
| |
| Liabilities: | | | | | | | | |
| Other Financial Instruments: | | | | | | | | |
| Futures Contracts | $ | 4,509,179 | $ | — | $ | — | $ | 4,509,179 |
| Forward Exchange Contracts | | — | | 1,856,840 | | — | | 1,856,840 |
| Swap Contracts. | | — | | 15,032,989 | | — | | 15,032,989 |
| Unfunded Loan Commitments. | | — | | 120,803 | | — | | 120,803 |
| Total Other Financial Instruments | $ | 4,509,179 | $ | 17,010,632 | $ | — | $ | 21,519,811 |
aIncludes common and preferred stocks, and management investment companies as well as other equity investments.
bFor detailed categories, see the accompanying Statement of Investments.
cIncludes securities determined to have no value at October 31, 2016.
A reconciliation of assets in which Level 3 inputs are used in determining fair value is presented when there are significant Level 3 financial instruments at the end of the year.
13. Subsequent Events
The Funds have evaluated subsequent events through the issuance of the financial statements and determined that no events have occurred that require disclosure.
franklintempleton.com
Annual Report
139
| | | | | | |
| FRANKLIN INVESTORS SECURITIES TRUST | | |
| NOTES TO FINANCIAL STATEMENTS | | | |
| |
| |
| |
| |
| Abbreviations | | | | | |
| |
| Counterparty/Exchange | | Currency | Selected Portfolio |
| BOFA | Bank of America, N.A. | | BRL | Brazilian Real | AGMC | Assured Guaranty Municipal Corp. |
| BZWS | Barclays Bank PLC | | CHF | Swiss Franc | ARM | Adjustable Rate Mortgage |
| CITI | Citigroup, Inc. | | EUR | Euro | BBA | British Bankers Association |
| DBAB | Deutsche Bank AG | | HUF | Hungarian Forint | CDO | Collateralized Debt Obligation |
| FBCO | Credit Suisse Group AG | | JPY | Japanese Yen | CLO | Collateralized Loan Obligation |
| GSCO | The Goldman Sachs Group, Inc. | KRW | South Korean Won | DIP | Debtor-In-Possession |
| HSBK | HSBC Bank PLC | | MXN | Mexican Peso | EDA | Economic Development Authority |
| ICE | Intercontinental Exchange | | MYR | Malaysian Ringgit | ETF | Exchange Traded Fund |
| JPHQ | JP Morgan Chase & Co. | | USD | United States Dollar | FRN | Floating Rate Note |
| LCH | LCH.Clearnet LLC | | | | GDP | Gross Domestic Product |
| MSCO | Morgan Stanley | | | | GO | General Obligation |
| UBSW | UBS AG | | | | LIBOR | London InterBank Offered Rate |
| | | | | | MFM | Multi-Family Mortgage |
| | | | | | PIK | Payment-In-Kind |
| | | | | | REIT | Real Estate Investment Trust |
| | | | | | SF | Single Family |
| | | | | | VRI | Value Recovery Instruments |
| |
| |
| |
| Index | | | | | | |
| CDX.NA.HY.Series number | CDX North America High Yield Index | | |
| CDX.NA.IG.Series number | CDX North America Investment Grade Index | |
| ITRX.EUR.Series number | iTraxx Europe Index | | |
| ITRX.EUR.SNRFIN.Series number | iTraxx Europe Senior Financials Index | | |
| MCDX.NA.Series number | MCDX North America Index | | |
140 Annual Report
franklintempleton.com
FRANKLIN INVESTORS SECURITIES TRUST
Report of Independent Registered Public Accounting Firm
To the Board of Trustees and Shareholders of Franklin Investors Securities Trust
In our opinion, the accompanying statements of assets and liabilities, including the statements of investments, and the related statements of operations and of changes in net assets and the financial highlights present fairly, in all material respects, the financial position of Franklin Adjustable U.S. Government Securities Fund, Franklin Floating Rate Daily Access Fund, Franklin Low Duration Total Return Fund, and Franklin Total Return Fund (hereafter referred to as the "Funds") as of October 31, 2016, the results of each of their operations for the year then ended, the changes in each of their net assets for each of the two years in the period then ended and the financial highlights for each of the periods presented, in conformity with accounting principles generally accepted in the United States of America. These financial statements and financial highlights (consolidated financial statements and consolidated financial highlights for Franklin Total Return Fund) (hereafter referred to as “financial statements”) are the responsibility of the Funds’ management. Our responsibility is to express an opinion on these financial statements based on our audits. We conducted our audits of these financial statements in accordance with the standards of the Public Company Accounting Oversight Board (United States). Those standards require that we plan and perform the audit to obtain reasonable assurance about whether the financial statements are free of material misstatement. An audit includes examining, on a test basis, evidence supporting the amounts and disclosures in the financial statements, assessing the accounting principles used and significant estimates made by management, and evaluating the overall financial statement presentation. We believe that our audits, which included confirmation of securities as of October 31, 2016 by correspondence with the custodian, transfer agent and brokers, provide a reasonable basis for our opinion.
PricewaterhouseCoopers LLP
San Francisco, California
December 16, 2016
franklintempleton.com
Annual Report
141
FRANKLIN INVESTORS SECURITIES TRUST
Tax Information (unaudited)
Under Section 871(k)(1)(C) of the Internal Revenue Code (Code), the Funds hereby report the maximum amount allowable but no less than the following amounts as interest related dividends for purposes of the tax imposed under Section 871(a)(1)(A) of the Code for the fiscal year ended October 31, 2016:
| | | | | | | |
| | Franklin | | | | | | |
| | Adjustable | | Franklin | | Franklin | | |
| | U.S. Government | | Floating Rate | | Low Duration | | Franklin Total |
| | Securities Fund | | Daily Access Fund | | Total Return Fund | | Return Fund |
| |
| $ | 21,142,072 | $ | 123,734,906 | $ | 40,337,054 | $ | 81,111,368 |
142 Annual Report
franklintempleton.com
FRANKLIN INVESTORS SECURITIES TRUST
Board Members and Officers
The name, year of birth and address of the officers and board members, as well as their affiliations, positions held with the Fund, principal occupations during at least the past five years and number of U.S. registered portfolios overseen in the Franklin Templeton Investments fund complex are shown below. Generally, each board member serves a three-year term that continues until that person’s successor is elected and qualified.
| | | | |
| Independent Board Members | | | |
| |
| | | | Number of Portfolios in | |
| Name, Year of Birth | | Length of | Fund Complex Overseen | Other Directorships Held |
| and Address | Position | Time Served | by Board Member* | During at Least the Past 5 Years |
| |
| Harris J. Ashton (1932) | Trustee | Since 1986 | 142 | Bar-S Foods (meat packing company) |
| One Franklin Parkway | | | | (1981-2010). |
| San Mateo, CA 94403-1906 | | | | |
| Principal Occupation During at Least the Past 5 Years: | | |
| Director of various companies; and formerly, Director, RBC Holdings, Inc. (bank holding company) (until 2002); and President, Chief Executive |
| Officer and Chairman of the Board, General Host Corporation (nursery and craft centers) (until 1998). | |
| |
| Mary C. Choksi (1950) | Trustee | Since 2014 | 136 | Avis Budget Group Inc. (car rental) |
| One Franklin Parkway | | | | (2007-present), Omnicom Group Inc. |
| San Mateo, CA 94403-1906 | | | | (advertising and marketing |
| | | | | communications services) |
| | | | | (2011-present) and H.J. Heinz |
| | | | | Company (processed foods and allied |
| | | | | products) (1998-2006). |
| Principal Occupation During at Least the Past 5 Years: | | |
| Senior Advisor, Strategic Investment Group (investment management group) (2015-present); director of various companies; and formerly, |
| Founding Partner and Senior Managing Director, Strategic Investment Group (1987–2015); Founding Partner and Managing Director, Emerging |
| Markets Management LLC (investment management firm) (1987-2011); and Loan Officer/Senior Loan Officer/Senior Pension Investment |
| Officer, World Bank Group (international financial institution) (1977-1987). | |
| |
| Edith E. Holiday (1952) | Trustee | Since 1998 | 142 | Hess Corporation (exploration and |
| One Franklin Parkway | | | | refining of oil and gas) (1993-present), |
| San Mateo, CA 94403-1906 | | | | Canadian National Railway (railroad) |
| | | | | (2001-present), Santander Consumer |
| | | | | USA Holdings, Inc. (consumer finance) |
| | | | | (November 2015), White Mountains |
| | | | | Insurance Group, Ltd. (holding |
| | | | | company) (2004-present), RTI |
| | | | | International Metals, Inc. (manufacture |
| | | | | and distribution of titanium) |
| | | | | (1999-2015) and H.J. Heinz Company |
| | | | | (processed foods and allied products) |
| | | | | (1994-2013). |
| Principal Occupation During at Least the Past 5 Years: | | |
| Director or Trustee of various companies and trusts; and formerly, Assistant to the President of the United States and Secretary of the |
| Cabinet (1990-1993); General Counsel to the United States Treasury Department (1989-1990); and Counselor to the Secretary and Assistant |
| Secretary for Public Affairs and Public Liaison-United States Treasury Department (1988-1989). | |
| |
| J. Michael Luttig (1954) | Trustee | Since 2009 | 142 | Boeing Capital Corporation (aircraft |
| One Franklin Parkway | | | | financing) (2006-2013). |
| San Mateo, CA 94403-1906 | | | | |
| Principal Occupation During at Least the Past 5 Years: | | |
| Executive Vice President, General Counsel and member of the Executive Council, The Boeing Company (aerospace company) (2006-present); |
| and formerly, Federal Appeals Court Judge, U.S. Court of Appeals for the Fourth Circuit (1991-2006). | |
franklintempleton.com
Annual Report
143
FRANKLIN INVESTORS SECURITIES TRUST
| | | | |
| Independent Board Members (continued) | | |
| |
| |
| |
| | | | Number of Portfolios in | |
| Name, Year of Birth | | Length of | Fund Complex Overseen | Other Directorships Held |
| and Address | Position | Time Served | by Board Member* | During at Least the Past 5 Years |
| |
| Larry D. Thompson (1945) | Trustee | Since 2007 | 142 | The Southern Company (energy |
| One Franklin Parkway | | | | company) (2014-present; previously |
| San Mateo, CA 94403-1906 | | | | 2010-2012), Graham Holdings |
| | | | | Company (education and media |
| | | | | organization) (2011-present) and |
| | | | | Cbeyond, Inc. (business |
| | | | | communications provider) |
| | | | | (2010-2012). |
| Principal Occupation During at Least the Past 5 Years: | | |
| Director of various companies; John A. Sibley Professor of Corporate and Business Law, University of Georgia School of Law (2015-present; |
| previously 2011-2012); and formerly, Executive Vice President - Government Affairs, General Counsel and Corporate Secretary, PepsiCo, Inc. |
| (consumer products) (2012-2014); Senior Vice President - Government Affairs, General Counsel and Secretary, PepsiCo, Inc. (2004-2011); |
| Senior Fellow of The Brookings Institution (2003-2004); Visiting Professor, University of Georgia School of Law (2004); and Deputy Attorney |
| General, U.S. Department of Justice (2001-2003). | | | |
| |
| John B. Wilson (1959) | Lead | Trustee | 116 | None |
| One Franklin Parkway | Independent | since 2007 | | |
| San Mateo, CA 94403-1906 | Trustee | and Lead | | |
| | | Independent | | |
| | | Trustee | | |
| | | since 2008 | | |
| Principal Occupation During at Least the Past 5 Years: | | |
| President, Staples Europe (office supplies) (2012-present); President and Founder, Hyannis Port Capital, Inc. (real estate and private equity |
| investing); serves on private and non-profit boards; and formerly, Chief Operating Officer and Executive Vice President, Gap, Inc. (retail) |
| (1996-2000); Chief Financial Officer and Executive Vice President – Finance and Strategy, Staples, Inc. (1992-1996); Senior Vice President – |
| Corporate Planning, Northwest Airlines, Inc. (airlines) (1990-1992); and Vice President and Partner, Bain & Company (consulting firm) |
| (1986-1990). | | | | |
| |
| |
| Interested Board Members and Officers | | |
| |
| | | | Number of Portfolios in | |
| Name, Year of Birth | | Length of | Fund Complex Overseen | Other Directorships Held |
| and Address | Position | Time Served | by Board Member* | During at Least the Past 5 Years |
| |
| **Gregory E. Johnson (1961) | Trustee | Since 2013 | 158 | None |
| One Franklin Parkway | | | | |
| San Mateo, CA 94403-1906 | | | | |
| Principal Occupation During at Least the Past 5 Years: | | |
| Chairman of the Board, Member - Office of the Chairman, Director and Chief Executive Officer, Franklin Resources, Inc.; officer and/or director |
| or trustee, as the case may be, of some of the other subsidiaries of Franklin Resources, Inc. and of 44 of the investment companies in Franklin |
| Templeton Investments; Vice Chairman, Investment Company Institute; and formerly, President, Franklin Resources, Inc. (1994-2015). |
| |
| **Rupert H. Johnson, Jr. (1940) | Chairman of | Chairman of the | 142 | None |
| One Franklin Parkway | the Board, | Board since 2013, | | |
| San Mateo, CA 94403-1906 | Trustee and | Trustee since 1987 | | |
| | Vice President | and Vice President | | |
| | | since 1986 | | |
| Principal Occupation During at Least the Past 5 Years: | | |
| Vice Chairman, Member - Office of the Chairman and Director, Franklin Resources, Inc.; Director, Franklin Advisers, Inc.; Senior Vice |
| President, Franklin Advisory Services, LLC; and officer and/or director or trustee, as the case may be, of some of the other subsidiaries of |
| Franklin Resources, Inc. and of 42 of the investment companies in Franklin Templeton Investments. | |
| |
| Alison E. Baur (1964) | Vice President | Since 2012 | Not Applicable | Not Applicable |
| One Franklin Parkway | | | | |
| San Mateo, CA 94403-1906 | | | | |
| Principal Occupation During at Least the Past 5 Years: | | |
| Deputy General Counsel, Franklin Templeton Investments; and officer of some of the other subsidiaries of Franklin Resources, Inc. and of 45 |
| of the investment companies in Franklin Templeton Investments. | | |
144 Annual Report
franklintempleton.com
FRANKLIN INVESTORS SECURITIES TRUST
| | | | |
| Interested Board Members and Officers (continued) | |
| |
| |
| |
| | | | Number of Portfolios in | |
| Name, Year of Birth | | Length of | Fund Complex Overseen | Other Directorships Held |
| and Address | Position | Time Served | by Board Member* | During at Least the Past 5 Years |
| |
| Mark Boyadjian (1964) | Vice President | Since 2003 | Not Applicable | Not Applicable |
| One Franklin Parkway | | | | |
| San Mateo, CA 94403-1906 | | | | |
| Principal Occupation During at Least the Past 5 Years: | | |
| Senior Vice President, Franklin Advisers, Inc.; and officer of two of the investment companies in Franklin Templeton Investments. |
| |
| Laura F. Fergerson (1962) | Chief Executive Since 2009 | Not Applicable | Not Applicable |
| One Franklin Parkway | Officer – | | | |
| San Mateo, CA 94403-1906 | Finance and | | | |
| | Administration | | | |
| Principal Occupation During at Least the Past 5 Years: | | |
| Senior Vice President, Franklin Templeton Services, LLC; Vice President, Franklin Advisers, Inc. and Franklin Templeton Institutional, LLC; and |
| officer of 45 of the investment companies in Franklin Templeton Investments. | |
| |
| Gaston Gardey (1967) | Treasurer, | Since 2009 | Not Applicable | Not Applicable |
| One Franklin Parkway | Chief Financial | | | |
| San Mateo, CA 94403-1906 | Officer and | | | |
| | Chief | | | |
| | Accounting | | | |
| | Officer | | | |
| Principal Occupation During at Least the Past 5 Years: | | |
| Treasurer, U.S. Fund Administration & Reporting, Franklin Templeton Investments; and officer of 27 of the investment companies in Franklin |
| Templeton Investments. | | | | |
| |
| Aliya S. Gordon (1973) | Vice President | Since 2009 | Not Applicable | Not Applicable |
| One Franklin Parkway | | | | |
| San Mateo, CA 94403-1906 | | | | |
| Principal Occupation During at Least the Past 5 Years: | | |
| Senior Associate General Counsel, Franklin Templeton Investments; and officer of 45 of the investment companies in Franklin Templeton |
| Investments. | | | | |
| |
| Steven J. Gray (1955) | Vice President | Since 2009 | Not Applicable | Not Applicable |
| One Franklin Parkway | | | | |
| San Mateo, CA 94403-1906 | | | | |
| Principal Occupation During at Least the Past 5 Years: | | |
| Senior Associate General Counsel, Franklin Templeton Investments; Vice President, Franklin Templeton Distributors, Inc. and Franklin |
| Alternative Strategies Advisers, LLC; and officer of 45 of the investment companies in Franklin Templeton Investments. |
| |
| Richard Hsu (1973) | Vice President | Since 2010 | Not Applicable | Not Applicable |
| One Franklin Parkway | | | | |
| San Mateo, CA 94403-1906 | | | | |
| Principal Occupation During at Least the Past 5 Years: | | |
| Vice President, Franklin Advisers, Inc.; and officer of three of the investment companies in Franklin Templeton Investments. |
| |
| Edward B. Jamieson (1948) | President and | President since | Not Applicable | Not Applicable |
| One Franklin Parkway | Chief Executive 1993 and Chief | | |
| San Mateo, CA 94403-1906 | Officer – | Executive Officer | | |
| | Investment | – Investment | | |
| | Management | Management since | | |
| | | 2002 | | |
| Principal Occupation During at Least the Past 5 Years: | | |
| President, Chief Investment Officer and Director, Franklin Advisers, Inc.; Executive Vice President, Franklin Templeton Institutional, LLC; and |
| officer and/or trustee, as the case may be, of some of the other subsidiaries of Franklin Resources, Inc. and of 10 of the investment |
| companies in Franklin Templeton Investments. | | | |
franklintempleton.com
Annual Report
145
FRANKLIN INVESTORS SECURITIES TRUST
| | | | |
| Interested Board Members and Officers (continued) | |
| |
| |
| |
| | | | Number of Portfolios in | |
| Name, Year of Birth | | Length of | Fund Complex Overseen | Other Directorships Held |
| and Address | Position | Time Served | by Board Member* | During at Least the Past 5 Years |
| |
| Madeline Lam (1969) | Vice President | Since 2010 | Not Applicable | Not Applicable |
| One Franklin Parkway | | | | |
| San Mateo, CA 94403-1906 | | | | |
| Principal Occupation During at Least the Past 5 Years: | | |
| Vice President, Franklin Advisers, Inc.; and officer of two of the investment companies in Franklin Templeton Investments. |
| |
| Robert Lim (1948) | Vice | Since May | Not Applicable | Not Applicable |
| One Franklin Parkway | President | 2016 | | |
| San Mateo, CA 94403-1906 | – AML | | | |
| | Compliance | | | |
| Principal Occupation During at Least the Past 5 Years: | | |
| Vice President, Franklin Templeton Companies, LLC; Chief Compliance Officer, Franklin Templeton Distributors, Inc. and Franklin Templeton |
| Investor Services, LLC; and officer of 45 of the investment companies in Franklin Templeton Investments. |
| |
| Kimberly H. Novotny (1972) | Vice President | Since 2013 | Not Applicable | Not Applicable |
| 300 S.E. 2nd Street | | | | |
| Fort Lauderdale, FL 33301-1923 | | | | |
| Principal Occupation During at Least the Past 5 Years: | | |
| Associate General Counsel, Franklin Templeton Investments; Vice President and Corporate Secretary, Fiduciary Trust International of the |
| South; Vice President, Templeton Investment Counsel, LLC; Assistant Secretary, Franklin Resources, Inc.; and officer of 45 of the investment |
| companies in Franklin Templeton Investments. | | | |
| |
| Robert C. Rosselot (1960) | Chief | Since 2013 | Not Applicable | Not Applicable |
| 300 S.E. 2nd Street | Compliance | | | |
| Fort Lauderdale, FL 33301-1923 | Officer | | | |
| Principal Occupation During at Least the Past 5 Years: | | |
| Director, Global Compliance, Franklin Templeton Investments; Vice President, Franklin Templeton Companies, LLC; officer of 45 of the |
| investment companies in Franklin Templeton Investments; and formerly, Senior Associate General Counsel, Franklin Templeton Investments |
| (2007-2013); and Secretary and Vice President, Templeton Group of Funds (2004-2013). | |
| |
| Karen L. Skidmore (1952) | Vice President | Since 2006 | Not Applicable | Not Applicable |
| One Franklin Parkway | and Secretary | | | |
| San Mateo, CA 94403-1906 | | | | |
| Principal Occupation During at Least the Past 5 Years: | | |
| Senior Associate General Counsel, Franklin Templeton Investments; and officer of 45 of the investment companies in Franklin Templeton |
| Investments. | | | | |
| |
| Navid J. Tofigh (1972) | Vice President | Since 2015 | Not Applicable | Not Applicable |
| One Franklin Parkway | | | | |
| San Mateo, CA 94403-1906 | | | | |
| Principal Occupation During at Least the Past 5 Years: | | |
| Associate General Counsel, Franklin Templeton Investments; and officer of 45 of the investment companies in Franklin Templeton Investments. |
| |
| Craig S. Tyle (1960) | Vice President | Since 2005 | Not Applicable | Not Applicable |
| One Franklin Parkway | | | | |
| San Mateo, CA 94403-1906 | | | | |
| Principal Occupation During at Least the Past 5 Years: | | |
| General Counsel and Executive Vice President, Franklin Resources, Inc.; and officer of some of the other subsidiaries of Franklin Resources, |
| Inc. and of 45 of the investment companies in Franklin Templeton Investments. | |
| |
| Lori A. Weber (1964) | Vice President | Since 2011 | Not Applicable | Not Applicable |
| 300 S.E. 2nd Street | | | | |
| Fort Lauderdale, FL 33301-1923 | | | | |
| Principal Occupation During at Least the Past 5 Years: | | |
| Senior Associate General Counsel, Franklin Templeton Investments; Assistant Secretary, Franklin Resources, Inc.; Vice President and |
| Secretary, Templeton Investment Counsel, LLC; and officer of 45 of the investment companies in Franklin Templeton Investments. |
146 Annual Report
franklintempleton.com
FRANKLIN INVESTORS SECURITIES TRUST
Interested Board Members and Officers (continued)
*We base the number of portfolios on each separate series of the U.S. registered investment companies within the Franklin Templeton Investments fund complex. These
portfolios have a common investment manager or affiliated investment managers.
**Gregory E. Johnson is considered to be an interested person of the Fund under the federal securities laws due to his position as an officer and director ofFranklin
Resources, Inc. (Resources), which is the parent company of the Fund’s investment manager and distributor. Rupert H. Johnson, Jr. is considered to be an interested person
of the Fund under the federal securities laws due to his position as officer and director and major shareholder of Resources.
Note 1: Rupert H. Johnson, Jr. is the uncle of Gregory E. Johnson.
Note 2: Officer information is current as of the date of this report. It is possible that after this date, information about officers may change.
Note 3: Effective November 1, 2016, Frank Olson ceased to be a trustee of the Trust.
The Sarbanes-Oxley Act of 2002 and Rules adopted by the Securities and Exchange Commission require the Fund to disclose whether the Fund’s Audit
Committee includes at least one member who is an audit committee financial expert within the meaning of such Act and Rules. The Fund’s Board has determined
that there is at least one such financial expert on the Audit Committee and has designated John B. Wilson as its audit committee financial expert. The Board
believes that Mr. Wilson qualifies as such an expert in view of his extensive business background and experience, including service as chief financial officer of
Staples, Inc. from 1992 to 1996. Mr. Wilson has been a Member and Chairman of the Fund’s Audit Committee since 2006. As a result of such background and
experience, the Board believes that Mr. Wilson has acquired an understanding of generally accepted accounting principles and financial statements, the general
application of such principles in connection with the accounting estimates, accruals and reserves, and analyzing and evaluating financial statements that
present a breadth and level of complexity of accounting issues generally comparable to those of the Fund, as well as an understanding of internal controls and
procedures for financial reporting and an understanding of audit committee functions. Mr. Wilson is an independent Board member as that term is defined under
the relevant Securities and Exchange Commission Rules and Releases.
The Statement of Additional Information (SAI) includes additional information about the board members and is available, without charge, upon request.
Shareholders may call (800) DIAL BEN/342-5236 to request the SAI.
franklintempleton.com
Annual Report
147
FRANKLIN INVESTORS SECURITIES TRUST
Shareholder Information
Proxy Voting Policies and Procedures
The Trust’s investment manager has established Proxy Voting Policies and Procedures (Policies) that the Trust uses to determine how to vote proxies relating to portfolio securities. Shareholders may view the Trust’s complete Policies online at franklintempleton.com. Alternatively, shareholders may request copies of the Policies free of charge by calling the Proxy Group collect at (954) 527-7678 or by sending a written request to: Franklin Templeton Companies, LLC, 300 S.E. 2nd Street, Fort Lauderdale, FL 33301, Attention: Proxy Group. Copies of the Trust’s proxy voting records are also made available online at franklintempleton.com and posted on the U.S. Securities and Exchange Commission’s website at sec.gov and reflect the most recent 12-month period ended June 30.
Quarterly Statement of Investments
The Trust files a complete statement of investments with the U.S. Securities and Exchange Commission for the first and third quarters for each fiscal year on Form N-Q. Shareholders may view the filed Form N-Q by visiting the Commission’s website at sec.gov. The filed form may also be viewed and copied at the Commission’s Public Reference Room in Washington, DC. Information regarding the operations of the Public Reference Room may be obtained by calling (800) SEC-0330.
Householding of Reports and Prospectuses
You will receive each Fund’s financial reports every six months as well as an annual updated summary prospectus (prospectus available upon request). To reduce Fund expenses, we try to identify related shareholders in a household and send only one copy of the financial reports and summary prospectus. This process, called “householding,” will continue indefinitely unless you instruct us otherwise. If you prefer not to have these documents householded, please call us at (800) 632-2301. At any time you may view current prospectuses/summary prospectuses and financial reports on our website. If you choose, you may receive these documents through electronic delivery.
148 Annual Report
franklintempleton.com
Item 2. Code of Ethics.
(a) The Registrant has adopted a code of ethics that applies to its principal executive officers and principal financial and accounting officer.
(c) N/A
(d) N/A
(f) Pursuant to Item 12(a)(1), the Registrant is attaching as an exhibit a copy of its code of ethics that applies to its principal executive officers and principal financial and accounting officer.
Item 3. Audit Committee Financial Expert.
(a)(1) The Registrant has an audit committee financial expert serving on its audit committee.
(2) The audit committee financial expert is John B. Wilson and he is "independent" as defined under the relevant Securities and Exchange Commission Rules and Releases.
Item 4. Principal Accountant Fees and Services.
(a) Audit Fees
The aggregate fees paid to the principal accountant for professional services rendered by the principal accountant for the audit of the registrant’s annual financial statements or for services that are normally provided by the principal accountant in connection with statutory and regulatory filings or engagements were $431,607 for the fiscal year ended October 31, 2016 and $450,822 for the fiscal year ended October 31, 2015.
(b) Audit-Related Fees
The aggregate fees paid to the principal accountant for assurance and related services rendered by the principal accountant to the registrant that are reasonably related to the performance of the audit of the registrant's financial statements and are not reported under paragraph (a) of Item 4 were $4,682 for the fiscal year ended October 31, 2016 and $4,590 for the fiscal year ended October 31, 2015. The services for which these fees were paid included attestation services.
There were no fees paid to the principal accountant for assurance and related services rendered by the principal accountant to the registrant's investment adviser and any entity controlling, controlled by or under common control with the investment adviser that provides ongoing services to the registrant that are reasonably related to the performance of the audit of their financial statements.
(c) Tax Fees
There were no fees paid to the principal accountant for professional services rendered by the principal accountant to the registrant for tax compliance, tax advice and tax planning.
There were no fees paid to the principal accountant for professional services rendered by the principal accountant to the registrant’s investment adviser and any entity controlling, controlled by or under common control with the investment adviser that provides ongoing services to the registrant for tax compliance, tax advice and tax planning.
(d) All Other Fees
The aggregate fees paid to the principal accountant for products and services rendered by the principal accountant to the registrant not reported in paragraphs (a)-(c) of Item 4 were $0 for the fiscal year ended October 31, 2016 and $6,850 for the fiscal year ended October 31, 2015. The services for which these fees were paid include review of materials provided to the fund Board in connection with the investment management contract renewal process.
The aggregate fees paid to the principal accountant for products and services rendered by the principal accountant to the registrant’s investment adviser and any entity controlling, controlled by or under common control with the investment adviser that provides ongoing services to the registrant not reported in paragraphs (a)-(c) of Item 4 were $439,897 for the fiscal year ended October 31, 2016 and $495,203 for the fiscal year ended October 31, 2015. The services for which these fees were paid include preparation and review of materials provided to the fund Board in connection with the investment management contract renewal process and derivatives assessment. Other services include compliance examination for Investment Advisor Act rule 204-2 and 206-4(2), and review of system processes related to fixed income securities.
(e) (1) The registrant’s audit committee is directly responsible for approving the services to be provided by the auditors, including:
(i) pre-approval of all audit and audit related services;
(ii) pre-approval of all non-audit related services to be provided to the Fund by the auditors;
(iii) pre-approval of all non-audit related services to be provided to the registrant by the auditors to the registrant’s investment adviser or to any entity that controls, is controlled by or is under common control with the registrant’s investment adviser and that provides ongoing services to the registrant where the non-audit services relate directly to the operations or financial reporting of the registrant; and
(iv) establishment by the audit committee, if deemed necessary or appropriate, as an alternative to committee pre-approval of services to be provided by the auditors, as required by paragraphs (ii) and (iii) above, of policies and procedures to permit such services to be pre-approved by other means, such as through establishment of guidelines or by action of a designated member or members of the committee; provided the policies and procedures are detailed as to the particular service and the committee is informed of each service and such policies and procedures do not include delegation of audit committee responsibilities, as contemplated under the Securities Exchange Act of 1934, to management; subject, in the case of (ii) through (iv), to any waivers, exceptions or exemptions that may be available under applicable law or rules.
(e) (2) None of the services provided to the registrant described in paragraphs (b)-(d) of Item 4 were approved by the audit committee pursuant to paragraph (c)(7)(i)(C) of Rule 2-01 of regulation S-X.
(f) No disclosures are required by this Item 4(f).
(g) The aggregate non-audit fees paid to the principal accountant for services rendered by the principal accountant to the registrant and the registrant’s investment adviser and any entity controlling, controlled by or under common control with the investment adviser that provides ongoing services to the registrant were $444,579 for the fiscal year ended October 31, 2016 and $506,644 for the fiscal year ended October 31, 2015.
(h) The registrant’s audit committee of the board has considered whether the provision of non-audit services that were rendered to the registrant’s investment adviser (not including any sub-adviser whose role is primarily portfolio management and is subcontracted with or overseen by another investment adviser), and any entity controlling, controlled by, or under common control with the investment adviser that provides ongoing services to the registrant that were not pre-approved pursuant to paragraph (c)(7)(ii) of Rule 2-01 of Regulation S-X is compatible with maintaining the principal accountant’s independence.
Item 5. Audit Committee of Listed Registrants. N/A
Item 6. Schedule of Investments. N/A
Item 7. Disclosure of Proxy Voting Policies and Procedures for Closed-End Management Investment Companies. N/A
Item 8. Portfolio Managers of Closed-End Management Investment Companies. N/A
Item 9. Purchases of Equity Securities by Closed-End Management Investment Company and Affiliated Purchasers. N/A
Item 10. Submission of Matters to a Vote of Security Holders.
There have been no changes to the procedures by which shareholders may recommend nominees to the Registrant's Board of Trustees that would require disclosure herein.
Item 11. Controls and Procedures.
(a) Evaluation of Disclosure Controls and Procedures. The Registrant maintains disclosure controls and procedures that are designed to ensure that information required to be disclosed in the Registrant’s filings under the Securities Exchange Act of 1934 and the Investment Company Act of 1940 is recorded, processed, summarized and reported within the periods specified in the rules and forms of the Securities and Exchange Commission. Such information is accumulated and communicated to the Registrant’s management, including its principal executive officer and principal financial officer, as appropriate, to allow timely decisions regarding required disclosure. The Registrant’s management, including the principal executive officer and the principal financial officer, recognizes that any set of controls and procedures, no matter how well designed and operated, can provide only reasonable assurance of achieving the desired control objectives.
Within 90 days prior to the filing date of this Shareholder Report on Form N-CSR, the Registrant had carried out an evaluation, under the supervision and with the participation of the Registrant’s management, including the Registrant’s principal executive officer and the Registrant’s principal financial officer, of the effectiveness of the design and operation of the Registrant’s disclosure controls and procedures. Based on such evaluation, the Registrant’s principal executive officer and principal financial officer concluded that the Registrant’s disclosure controls and procedures are effective.
(b) Changes in Internal Controls. There have been no changes in the Registrant’s internal controls or in other factors that could materially affect the internal controls over financial reporting subsequent to the date of their evaluation in connection with the preparation of this Shareholder Report on Form N-CSR.
Item 12. Exhibits.
(a) (1) Code of Ethics
(a) (2) Certifications pursuant to Section 302 of the Sarbanes-Oxley Act of 2002 of Laura F. Fergerson, Chief Executive Officer - Finance and Administration, and Gaston Gardey, Chief Financial Officer and Chief Accounting Officer
(b) Certifications pursuant to Section 906 of the Sarbanes-Oxley Act of 2002 of Laura F. Fergerson, Chief Executive Officer - Finance and Administration, and Gaston Gardey, Chief Financial Officer and Chief Accounting Officer
SIGNATURES
Pursuant to the requirements of the Securities Exchange Act of 1934 and the Investment Company Act of 1940, the registrant has duly caused this report to be signed on its behalf by the undersigned, thereunto duly authorized.
FRANKLIN INVESTORS SECURITIES TRUST
By /s/Laura F. Fergerson
Laura F. Fergerson
Chief Executive Officer - Finance and Administration
Date December 27, 2016
Pursuant to the requirements of the Securities Exchange Act of 1934 and the Investment Company Act of 1940, this report has been signed below by the following persons on behalf of the registrant and in the capacities and on the dates indicated.
By /s/Laura F. Fergerson
Laura F. Fergerson
Chief Executive Officer - Finance and Administration
Date December 27, 2016
By /s/Gaston Gardey _
Gaston Gardey
Chief Financial Officer and Chief Accounting Officer
Date December 27, 2016