UNITED STATES
SECURITIES AND EXCHANGE COMMISSION
Washington, DC 20549
FORMN-CSR
CERTIFIED SHAREHOLDER REPORT OF REGISTERED
MANAGEMENT INVESTMENT COMPANIES
Investment Company Act file number811-04986
Franklin Investors Securities Trust
(Exact name of registrant as specified in charter)
One Franklin Parkway, San Mateo, CA 94403-1906
(Address of principal executive offices) (Zip code)
Craig S. Tyle, One Franklin Parkway, San Mateo, CA 94403-1906
(Name and address of agent for service)
Registrant’s telephone number, including area code: 650 312-2000
Date of fiscal year end: 10/31
Date of reporting period: 10/31/19
| Item 1. | Reports to Stockholders. |

| | |
| | Franklin Adjustable U.S. Government Securities Fund |
| | |
| | Franklin Floating Rate Daily Access Fund |
| | |
|
Franklin Low Duration Total Return Fund |
|
Franklin Total Return Fund |
|
Sign up for electronic delivery at franklintempleton.com/edelivery
Internet Delivery of Fund Reports Unless You Request Paper Copies: Effective January 1, 2021, as permitted by the SEC, paper copies of the Fund’s shareholder reports will no longer be sent by mail, unless you specifically request them from the Fund or your financial intermediary. Instead, the reports will be made available on a website, and you will be notified by mail each time a report is posted and provided with a website link to access the report.
If you already elected to receive shareholder reports electronically, you will not be affected by this change and you need not take any action. If you have not signed up for electronic delivery, we would encourage you to join fellow shareholders who have. You may elect to receive shareholder reports and other communications electronically from the Fund by calling (800)632-2301 or by contacting your financial intermediary.
You may elect to continue to receive paper copies of all your future shareholder reports free of charge by contacting your financial intermediary or, if you invest directly with a Fund, calling (800)632-2301 to let the Fund know of your request. Your election to receive reports in paper will apply to all funds held in your account.
SHAREHOLDER LETTER
Dear Shareholder:
During the 12 months ended October 31, 2019, the U.S. economy continued to grow, but at a more moderate pace mainly due to concerns about trade and geopolitical stress. The U.S. Federal Reserve (Fed) raised the federal funds rate by 0.25% at its December 2018 meeting, increasing the rate from 2.25% to 2.50%, but lowered it by 0.25% at each of its July, September and October 2019 meetings, resulting in a rate of 1.75% byperiod-end. The Fed cited muted inflation pressures and the potential effects of global trade tensions on economic growth as rationale for easing the rate. The10-year U.S. Treasury yield began the period at 3.15% and decreased to 1.69% atperiod-end.
In this environment, the prices of U.S. stocks, as measured by the Standard & Poor’s® 500 Index (S&P 500®), rose 12.02% (the index increasing from 2,711.74 to 3,037.56).1,2 Investment-grade bonds, as measured by the Bloomberg Barclays U.S. Aggregate Bond Index (Bloomberg Index), posted a +11.51% total return (an index increase from 1,997.76 to 2,227.69), which includes reinvestment of interest.3
We are committed to our long-term perspective and disciplined investment approach as we conduct a rigorous, fundamental analysis of securities with a regular emphasis on investment risk management.
We believe active, professional investment management serves investors well. We also recognize the important role of financial advisors in today’s markets and encourage investors to continue to seek their advice. Amid changing markets and economic conditions, we are confident investors with a well-diversified portfolio and a patient, long-term outlook should be well positioned for the years ahead.
Franklin Investors Securities Trust’s annual report, covering Franklin Adjustable U.S. Government Securities Fund, Franklin Floating Rate Daily Access Fund, Franklin Low Duration Total Return Fund and Franklin Total Return Fund, includes more detail about prevailing conditions and a discussion about investment decisions during the period. Please remember all securities markets fluctuate, as do mutual fund share prices.
We thank you for investing with Franklin Templeton, welcome your questions and comments, and look forward to serving your future investment needs.
Sincerely,

Rupert H. Johnson, Jr.
Chairman
Franklin Investors Securities Trust
This letter reflects our analysis and opinions as of October 31, 2019, unless otherwise indicated. The information is not a complete analysis of every aspect of any market, country, industry, security or fund. Statements of fact are from sources considered reliable.
1. Source: Copyright©2019, S&P Dow Jones Indices LLC. All rights reserved.
2. Source: Morningstar. The changes in index prices shown for the S&P 500 do not include reinvestments of income and distributions, which are included in their total returns, which were: S&P 500 +14.33% (index total return resulting in an increase from 5,369.49 to 6,138.73).
3. Sources: Morningstar and Bloomberg Barclays Indices. For the Bloomberg Index, only total return as shown is available, not price change without the inclusion of reinvested income and distributions.
See www.franklintempletondatasources.com for additional data provider information.
| | |
| | Not FDIC Insured | May Lose Value | No Bank Guarantee |
| | | | |
| | | |
| franklintempleton.com | | Not part of the annual report | | 1 |
Contents
|
| Visitfranklintempleton.comfor fund updates, to access your account, or to find helpful financial planning tools. |
| | | | |
| | | |
2 | | Annual Report | | franklintempleton.com |
ANNUAL REPORT
Economic and Market Overview
The U.S. economy expanded during the 12 months ended October 31, 2019. After moderating for two consecutive quarters, the economy grew significantly faster in 2019’s first quarter before moderating in the second quarter. However, the economy grew faster in the third quarter, aided by consumer spending, housing investment, government spending, inventory investment and exports. The manufacturing sector expanded during most of the period, but contracted in the last three consecutive months. The services sector continued to expand during the period. The unemployment rate decreased from 3.8% in October 2018 to 3.6% atperiod-end.1 The annual inflation rate, as measured by the Consumer Price Index, decreased from 2.5% in October 2018 to 1.8% atperiod-end.1
The U.S. Federal Reserve (Fed) raised its target range for the federal funds rate by 0.25% at its December 2018 meeting, to 2.25%–2.50%. However, at its July 2019 meeting, the Fed lowered the federal funds target rate range for the first time since December 2008, to 2.00%–2.25%, citing muted inflation pressures and the potential effects of global trade tensions on economic growth. Furthermore, the Fed ended its balance sheet normalization program earlier than previously indicated. The Fed further lowered the federal funds target rate range by 0.25% at its September and October meetings, to 1.50%–1.75%, reiterating the rationale cited in the July meeting.
The10-year Treasury yield, which moves inversely to its price, decreased during the period. The yield rose to multi-year highs in late 2018, but fell to multi-year lows in 2019’s third quarter before recovering partially in October. U.S. political uncertainties (including the impeachment inquiry into President Donald Trump), geopolitical tensions in certain regions, U.S. trade disputes with China and other trading partners, slower domestic and global economic growth, and the Fed’s more accommodative monetary policy stance weighed on the Treasury yield at certain points during the period. However, several better-than-expected U.S. economic reports and periods of optimism about a potential U.S.-China trade agreement supported the yield. The10-year yield fell persistently below certain short-term yields during most of the period’s second half, but rose above all short-term Treasury yields towardperiod-end following the announcement of a potential phase one of the U.S.-China trade agreement. Overall, the10-year Treasury yield declined from 3.15% at the beginning of the period to 1.69% atperiod-end.
The foregoing information reflects our analysis and opinions as of October 31, 2019. The information is not a complete analysis of every aspect of any market, country, industry, security or fund. Statements of fact are from sources considered reliable.
1. Source: Bureau of Labor Statistics.
| | | | |
| | | |
| franklintempleton.com | | Annual Report | | 3 |
Franklin Adjustable U.S. Government Securities Fund
This annual report for Franklin Adjustable U.S. Government Securities Fund covers the fiscal year ended October 31, 2019.
Your Fund’s Goal and Main Investments
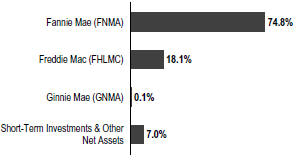
The Fund seeks to provide a high level of current income while providing lower volatility of principal than a fund that invests in fixed-rate securities by investing at least 80% of its net assets in adjustable-rate U.S. government mortgage securities, which are issued or guaranteed by the U.S. government, its agencies or instrumentalities.1 The Fund’s investments may include securities issued by Ginnie Mae (GNMA) and government-sponsored entities, such as Fannie Mae (FNMA) and Freddie Mac (FHLMC).2
Performance Overview
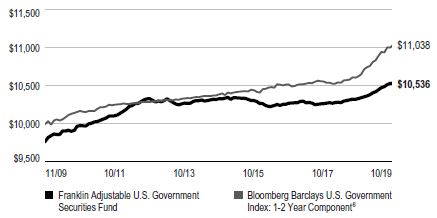
The Fund’s Class A shares posted a +2.01% cumulative total return for the 12 months under review. In comparison, the Fund’s benchmark, the Bloomberg Barclays U.S. Government Index:1-2 Year Component posted a +3.91% total return.3 The index measures public obligations of the U.S. Treasury with one to two years to final maturity and publicly issued debt of U.S. government agencies, quasi-federal corporations, and corporate or foreign debt guaranteed by the U.S. government. You can find the Fund’s long-term performance data in the Performance Summary beginning on page 6.
Performance data represent past performance, which does not guarantee future results. Investment return and principal value will fluctuate, and you may have a gain or loss when you sell your shares. Current performance may differ from figures shown. For most recentmonth-end performance, go tofranklintempleton.comor call(800)342-5236.
Investment Strategy
We employ a conservative investment strategy as we strive to produce solid performance in a variety of interest rate climates. We choose securities using a value-oriented
Portfolio Composition
Based on Total Net Assets as of 10/31/19
approach, emphasizing the bonds’ economic fundamentals in relation to comparable securities as well as their historical prepayment performance.
Manager’s Discussion
The Fund employed a conservative strategy that invested primarily in adjustable-rate mortgage securities (ARMs) that are either explicitly or implicitly backed by the U.S. government.1 During the period, the Fund invested predominantly in securities issued or guaranteed by FNMA and FHLMC. The Fund took a collateral-intensive research approach to analyze the prepayment behavior of individual ARMs to identify those with the most attractive prepayment profiles and focused on seasoned ARMs. Such securities have typically been through several interest-rate cycles and therefore tend to be less sensitive to changes in interest rates, compared to newer issued counterparts. We have found such securities historically to have experienced lower volatility than comparable maturity Treasuries and have provided more consistent income.
Underlying coupons continued to reset higher, although prepayment rate uncertainty hampered the ARM market outlook as they remained significantly elevated. We continued to be cautious about future prepayment speeds given a significant rally in mortgage rates and securities trading at notable premiums. The outlook for prepayments
1. Securities owned by the Fund, but not shares of the Fund, are issued or guaranteed by the U.S. government, its agencies or instrumentalities, including government sponsored entities, as to timely payment of principal and interest.
2. Although U.S. government-sponsored entities may be chartered by acts of Congress, their securities are neither issued nor guaranteed by the U.S. Government. Please see the Fund’s prospectus for a detailed discussion regarding various levels of credit support for government agency or instrumentality securities. The Fund’s yield and share price are not guaranteed and will vary with market conditions.
3. Source: Morningstar.
The index is unmanaged and includes reinvestment of any income or distributions. It does not reflect any fees, expenses or sales charges. One cannot invest directly in an index, and an index is not representative of the Fund’s portfolio.
The dollar value, number of shares or principal amount, and names of all portfolio holdings are listed in the Fund’s Statement of Investments (SOI).
The SOI begins on page 37.
| | | | |
| | | |
4 | | Annual Report | | franklintempleton.com |
FRANKLIN ADJUSTABLE U.S. GOVERNMENT SECURITIES FUND
Dividend Distributions*
11/1/18–10/31/19
| | | | | | | | | | | | | | | | | | |
| | | | | | Dividend per Share (cents) | | | |
| | | | | | | | | | | | | | | Advisor |
| Month | | Class A | | | Class A1 | | | Class C | | | Class R6 | | | Class |
| | | | | |
November | | | 1.8935 | | | | 1.9964 | | | | 1.6225 | | | | 2.1525 | | | 2.0621 |
| | | | | |
December | | | 1.8963 | | | | 1.9686 | | | | 1.6228 | | | | 2.1536 | | | 2.0700 |
| | | | | |
January | | | 1.9663 | | | | 2.0693 | | | | 1.6911 | | | | 2.2229 | | | 2.1403 |
| | | | | |
February | | | 2.0589 | | | | 2.1506 | | | | 1.8101 | | | | 2.2855 | | | 2.2158 |
| | | | | |
March | | | 1.9112 | | | | 1.9982 | | | | 1.6563 | | | | 2.1471 | | | 2.0723 |
| | | | | |
April | | | 2.2227 | | | | 2.3281 | | | | 1.9383 | | | | 2.4827 | | | 2.4012 |
| | | | | |
May | | | 2.0842 | | | | 2.1867 | | | | 1.8113 | | | | 2.3317 | | | 2.2544 |
| | | | | |
June | | | 1.9528 | | | | 2.0453 | | | | 1.7067 | | | | 2.1804 | | | 2.1097 |
| | | | | |
July | | | 2.2182 | | | | 2.3265 | | | | 1.9256 | | | | 2.4906 | | | 2.4029 |
| | | | | |
August | | | 1.9407 | | | | 2.0394 | | | | 1.6752 | | | | 2.1916 | | | 2.1083 |
| | | | | |
September | | | 2.0650 | | | | 2.1667 | | | | 1.7907 | | | | 2.3182 | | | 2.2382 |
| | | | | |
October | | | 1.8575 | | | | 1.9598 | | | | 1.5893 | | | | 2.0890 | | | 2.0318 |
| | | | | |
Total | | | 24.0673 | | | | 25.2356 | | | | 20.8399 | | | | 27.0458 | | | 26.1070 |
*The distribution amount is the sum of all net investment income distributions for the period shown. Assumes shares were purchased and held for the entire accrual period. Since dividends accrue daily, your actual distributions will vary depending on the date you purchased your shares and any account activity. All Fund distributions will vary depending upon current market conditions, and past distributions are not indicative of future trends.
had created wariness in the sector and led to a decrease in prices ranging from10-15 basis points. With a shift toward a flatter yield curve, and absolute prepayments continuing to be elevated, we remain cautious going forward. We believe that with borrowers having experienced a full year of mortgages resetting upward, it could result in a burnout effect, which would offset some of the refinance incentive and help to lower prepayment rates at some point in the future. Hence, we have been favoring those ARMs linked to the London Interbank Offered Rate (LIBOR) index4, which we believe would have slower speeds relative to those indexed off of the Constant Maturity Treasury Index. Given the high probability of elevated speeds for the foreseeable future in a market where the premiums are quite significant, we have retained a slightly higher cash allocation.
During the period, the Fund’s focus on seasoned, shorter-maturity, high-quality ARMs that tended to be less sensitive to interest-rate changes, supported performance. In particular, we continued to focus on diverse, seasoned, post-reset FNMA and FHLMC ARMs with average coupons above 3% that had larger loan counts. Secondary flows over the period declined significantly as post-reset mortgages
tend to be somewhat avoided with a preference toward fixed-rate mortgages.
Thank you for your continued participation in Franklin Adjustable U.S. Government Securities Fund. We look forward to serving your future investment needs.
| | |
 | |  |
| | Paul Varunok Lead Portfolio Manager |
|
The foregoing information reflects our analysis, opinions and portfolio holdings as of October 31, 2019, the end of the reporting period. The way we implement our main investment strategies and the resulting portfolio holdings may change depending on factors such as market and economic conditions. These opinions may not be relied upon as investment advice or an offer for a particular security. The information is not a complete analysis of every aspect of any market, country, industry, security or the Fund.
Statements of fact are from sources considered reliable, but the investment manager makes no representation or warranty as to their completeness or accuracy. Although historical performance is no guarantee of future results, these insights may help you understand our investment management philosophy.
4. The London Interbank Offered Rate (LIBOR) is the interest rate banks charge each other for loans. LIBOR is a widely used benchmark for short-term interest rates.
See www.franklintempletondatasources.com for additional data provider information.
| | | | |
| | | |
| franklintempleton.com | | Annual Report | | 5 |
FRANKLIN ADJUSTABLE U.S. GOVERNMENT SECURITIES FUND
Performance Summary as of October 31, 2019
The performance tables and graphs do not reflect any taxes that a shareholder would pay on Fund dividends, capital gain distributions, if any, or any realized gains on the sale of Fund shares. Total return reflects reinvestment of the Fund’s dividends and capital gain distributions, if any, and any unrealized gains or losses. Your dividend income will vary depending on dividends or interest paid by securities in the Fund’s portfolio, adjusted for operating expenses of each class. Capital gain distributions are net profits realized from the sale of portfolio securities.
Performance as of 10/31/191
Cumulative total return excludes sales charges. Average annual total return includes maximum sales charges. Sales charges will vary depending on the size of the investment and the class of share purchased. The maximum is 2.25% and the minimum is 0%.Class A:2.25% maximum initial sales charge;Advisor Class:no sales charges. For other share classes, visitfranklintempleton.com.
| | | | |
| Share Class | | Cumulative Total Return2 | | Average Annual Total Return3 |
|
| | |
A | | | | |
| | |
1-Year | | +2.01% | | -0.33% |
|
| | |
5-Year | | +2.04% | | -0.05% |
|
| | |
10-Year | | +7.83% | | +0.52% |
|
| | |
Advisor | | | | |
| | |
1-Year | | +2.39% | | +2.39% |
|
| | |
5-Year | | +3.33% | | +0.66% |
|
| | |
10-Year | | +10.57% | | +1.01% |
|
| | | | | | | | |
| |
| Distribution
Rate |
4 | | 30-Day Standardized Yield5 |
| Share Class | | (with fee waiver) | | (without fee waiver) |
| | | |
A | | | 2.66% | | | 1.73% | | 1.72% |
| | | |
Advisor | | | 2.97% | | | 2.03% | | 2.01% |
Performance data represent past performance, which does not guarantee future results. Investment return and principal value will fluctuate, and you may have a gain or loss when you sell your shares. Current performance may differ from figures shown. For most recentmonth-end performance, go tofranklintempleton.comor call(800)342-5236.
See page 8 for Performance Summary footnotes.
| | | | |
| | | |
6 | | Annual Report | | franklintempleton.com |
FRANKLIN ADJUSTABLE U.S. GOVERNMENT SECURITIES FUND
PERFORMANCE SUMMARY
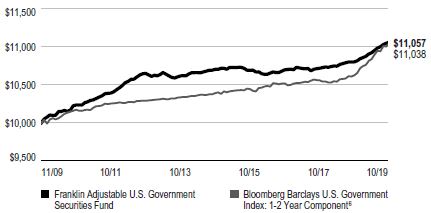
Total Return Index Comparison for a Hypothetical $10,000 Investment1
Total return represents the change in value of an investment over the periods shown. It includes any applicable maximum sales charge, Fund expenses, account fees and reinvested distributions. The unmanaged index includes reinvestment of any income or distributions. It differs from the Fund in composition and does not pay management fees or expenses. One cannot invest directly in an index.
Class A(11/1/09–10/31/19)
Advisor Class(11/1/09–10/31/19)
See page 8 for Performance Summary footnotes.
| | | | |
| | | |
| franklintempleton.com | | Annual Report | | 7 |
FRANKLIN ADJUSTABLE U.S. GOVERNMENT SECURITIES FUND
PERFORMANCE SUMMARY
Distributions(11/1/18–10/31/19)
| | |
| Share Class | | Net Investment Income |
| |
A | | $0.240673 |
| |
A1 | | $0.252356 |
| |
C | | $0.208399 |
| |
R6 | | $0.270458 |
| |
Advisor | | $0.261070 |
Total Annual Operating Expenses7
| | | | | | | | | | |
| Share Class | | With Fee Waiver | | | | | Without Fee Waiver | |
| | | |
A | | | 0.96% | | | | | | 0.97% | |
| | | |
Advisor | | | 0.71% | | | | | | 0.72% | |
Each class of shares is available to certain eligible investors and has different annual fees and expenses, as described in the prospectus.
All investments involve risks, including possible loss of principal. Interest rate movements, unscheduled mortgage prepayments and other risk factors will affect the Fund’s share price and yield. Bond prices generally move in the opposite direction of interest rates. As prices of bonds in the Fund adjust to a rise in interest rates, the Fund’s share price may decline. Changes in the financial strength of a bond issuer or in a bond’s credit rating may affect its value. The Fund is actively managed but there is no guarantee that the manager’s investment decisions will produce the desired results. The Fund’s prospectus also includes a description of the main investment risks.
1. The Fund has a fee waiver associated with any investment it makes in a Franklin Templeton money fund and/or other Franklin Templeton fund, contractually guaranteed through 2/29/20. Fund investment results reflect the fee waiver; without this waiver, the results would have been lower.
2. Cumulative total return represents the change in value of an investment over the periods indicated.
3. Average annual total return represents the average annual change in value of an investment over the periods indicated. Return for less than one year, if any, has not been annualized.
4. Distribution rate is based on an annualization of the sum of the respective class’s past month’s daily distributions and the maximum offering price (NAV for Advisor Class) per share on 10/31/19.
5. The Fund’s30-day standardized yield is calculated over a trailing30-day period using the yield to maturity on bonds and/or the dividends accrued on stocks. It may not equal the Fund’s actual income distribution rate, which reflects the Fund’s past dividends paid to shareholders.
6. Source: Morningstar. The Bloomberg Barclays U.S. Government Index:1-2 Year Component includes public obligations of the U.S. Treasury with at least one year up to, but not including, two years to final maturity and publicly issued debt of U.S. government agencies, quasi-federal corporations, and corporate or foreign debt guaranteed by the U.S. government.
7. Figures are as stated in the Fund’s current prospectus and may differ from the expense ratios disclosed in the Your Fund’s Expenses and Financial Highlights sections in this report. In periods of market volatility, assets may decline significantly, causing total annual Fund operating expenses to become higher than the figures shown.
See www.franklintempletondatasources.com for additional data provider information.
| | | | |
| | | |
8 | | Annual Report | | franklintempleton.com |
FRANKLIN ADJUSTABLE U.S. GOVERNMENT SECURITIES FUND
Your Fund’s Expenses
As a Fund shareholder, you can incur two types of costs: (1) transaction costs, including sales charges (loads) on Fund purchases and redemptions; and (2) ongoing Fund costs, including management fees, distribution and service(12b-1) fees, and other Fund expenses. All mutual funds have ongoing costs, sometimes referred to as operating expenses. The table below shows ongoing costs of investing in the Fund and can help you understand these costs and compare them with those of other mutual funds. The table assumes a $1,000 investment held for the six months indicated.
Actual Fund Expenses
The table below provides information about actual account values and actual expenses in the columns under the heading “Actual.” In these columns the Fund’s actual return, which includes the effect of Fund expenses, is used to calculate the “Ending Account Value” for each class of shares. You can estimate the expenses you paid during the period by following these steps (of course, your account value and expenses will differ from those in this illustration): Divide your account value by $1,000 (if your account had an $8,600 value, then $8,600÷ $1,000 = 8.6). Then multiply the result by the number in the row for your class of shares under the headings “Actual” and “Expenses Paid During Period” (if Actual Expenses Paid During Period were $7.50, then 8.6 x $7.50 = $64.50). In this illustration, the actual expenses paid this period are $64.50.
Hypothetical Example for Comparison with Other Funds
Under the heading “Hypothetical” in the table, information is provided about hypothetical account values and hypothetical expenses based on the Fund’s actual expense ratio and an assumed rate of return of 5% per year before expenses, which is not the Fund’s actual return. This information may not be used to estimate the actual ending account balance or expenses you paid for the period, but it can help you compare ongoing costs of investing in the Fund with those of other funds. To do so, compare this 5% hypothetical example for the class of shares you hold with the 5% hypothetical examples that appear in the shareholder reports of other funds.
Please note that expenses shown in the table are meant to highlight ongoing costs and do not reflect any transactional costs. Therefore, information under the heading “Hypothetical” is useful in comparing ongoing costs only, and will not help you compare total costs of owning different funds. In addition, if transactional costs were included, your total costs would have been higher.
| | | | | | | | | | | | | | | | | | | | | | | | | | | | | | |
| | | | | Actual | | Hypothetical | | |
| | | | | (actual return after expenses) | | (5% annual return before expenses) | | |
| | | | | | | Expenses | | | | Expenses | | Net |
| | | Beginning | | Ending | | Paid During | | Ending | | Paid During | | Annualized |
| Share | | Account | | Account | | Period | | Account | | Period | | Expense |
| Class | | Value 5/1/19 | | Value 10/31/19 | | 5/1/19–10/31/191, 2 | | Value 10/31/19 | | 5/1/19–10/31/191, 2 | | Ratio2 |
| | | | | | |
A | | | $ | 1,000 | | | | $ | 1,011.40 | | | | $ | 4.82 | | | | $ | 1,020.42 | | | | $ | 4.84 | | | | | 0.95% | |
A1 | | | $ | 1,000 | | | | $ | 1,012.20 | | | | $ | 4.06 | | | | $ | 1,021.17 | | | | $ | 4.08 | | | | | 0.80% | |
C | | | $ | 1,000 | | | | $ | 1,010.60 | | | | $ | 6.84 | | | | $ | 1,018.40 | | | | $ | 6.87 | | | | | 1.35% | |
R6 | | | $ | 1,000 | | | | $ | 1,013.20 | | | | $ | 2.99 | | | | $ | 1,022.23 | | | | $ | 3.01 | | | | | 0.59% | |
Advisor | | | $ | 1,000 | | | | $ | 1,012.70 | | | | $ | 3.55 | | | | $ | 1,021.68 | | | | $ | 3.57 | | | | | 0.70% | |
1. Expenses are equal to the annualized expense ratio for thesix-month period as indicated above—in the far right column—multiplied by the simple average account value over the period indicated, and then multiplied by 184/365 to reflect theone-half year period.
2. Reflects expenses after fee waivers and expense reimbursements. Does not include acquired fund fees and expenses.
| | | | |
| | | |
| franklintempleton.com | | Annual Report | | 9 |
Franklin Floating Rate Daily Access Fund
This annual report for Franklin Floating Rate Daily Access Fund covers the fiscal year ended October 31, 2019.
Your Fund’s Goal and Main Investments
The Fund seeks to provide a high level of current income and, secondarily, preservation of capital by investing at least 80% of its net assets in income-producing floating interest-rate corporate loans and corporate debt securities made to or issued by U.S. companies,non-U.S. entities and U.S. subsidiaries ofnon-U.S. entities.
| | |
| | What are corporate loans? Corporate loans are typically floating rate loans to corporate borrowers made by a group, or syndicate, of banks and other financial institutions. These loans provide capital to companies for varied purposes, such as merger and acquisition activity, leveraged buyouts or refinancings. These loans are typically syndicated to a group of investors. |
Performance Overview
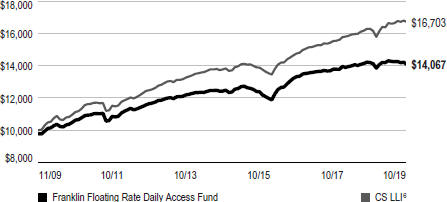
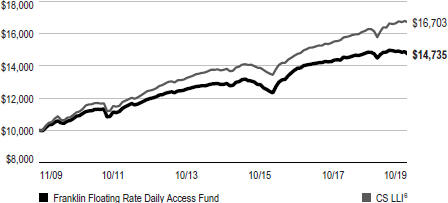
The Fund’s Class A shares posted a-0.88% cumulative total return for the 12 months under review. In comparison, the Credit Suisse Leveraged Loan Index (CS LLI), which is designed to mirror the investable universe of the U.S. dollar-denominated leveraged loan market, posted a +2.61% total return.1 You can find more of the Fund’s performance data in the Performance Summary beginning on page 14.
Performance data represent past performance, which does not guarantee future results. Investment return and principal value will fluctuate, and you may have a gain or loss when you sell your shares. Current performance may differ from figures shown. For most recentmonth-end performance, go tofranklintempleton.comor call(800)342-5236.
Corporate Loan Market Overview
Technical conditions in the loan market significantly weakened toward the end of 2018 as the asset class was impacted by broader volatility in the equity and credit markets. However, improved investor sentiment early in 2019 and demand from newcollateralized-loan-obligations (CLOs) led to a sharp rebound. As the period progressed,
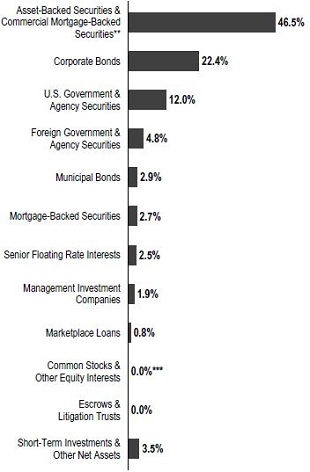
Portfolio Composition*
Based on Total Net Assets as of 10/31/19
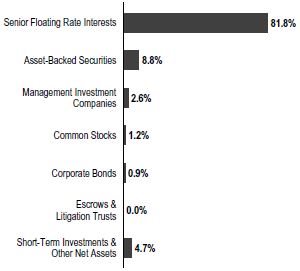
*Figures reflect certain derivatives held in the portfolio (or their underlying reference assets) and may not total 100% or may be negative due to rounding, use of derivatives, unsettled trades or other factors.
expectations that interest-rate cuts by the U.S. Federal Reserve (Fed) would decrease income generation limited principal gains, as retail investors continued loan mutual fund redemptions at a steadier pace. Healthy demand from CLOs remained and helped to support loan prices amid periodic bouts of volatility. While the loan market saw an increase in new issuance to finance mergers and acquisitions (M&A), large paydowns helped keep net new issuance relatively low compared to its historical levels.
While many investors had expected rising interest rates at the beginning of the period, eventual uncertainty surrounding future rate hikes led to the largest monthly outflows by dollar amount, resulting in significantly deteriorated technical conditions in December 2018. Outflows from retail investors continued throughout the period as the Fed cut its benchmark rate three times, prompting investors to shift away from low duration assets. Assets under management of retail loan funds declined significantly from its peak in October 2018 and the
1. Source: Credit Suisse Group.
The index is unmanaged and includes reinvestment of any income or distributions. It does not reflect any fees, expenses or sales charges. One cannot invest directly in an index, and an index is not representative of the Fund’s portfolio.
See www.franklintempletondatasources.com for additional data provider information.
The dollar value, number of shares or principal amount, and names of all portfolio holdings are listed in the Fund’s Statement of Investments (SOI).
The SOI begins on page 45.
| | | | |
| | | |
10 | | Annual Report | | franklintempleton.com |
FRANKLIN FLOATING RATE DAILY ACCESS FUND
composition of the loan investor base shifted as a result, with loan retail funds holding a meaningfully smaller share atperiod-end.
Dividend Distributions*
11/1/18–10/31/19
| | | | | | | | | | | | | | | | |
| | | Dividend per Share (cents) | |
| Month | | Class A | | | Class C | | | Class R6 | | | Advisor
Class | |
| | | | |
November | | | 3.2858 | | | | 2.9994 | | | | 3.5297 | | | | 3.4647 | |
| | | | |
December | | | 4.4747 | | | | 4.1878 | | | | 4.7126 | | | | 4.6577 | |
| | | | |
January | | | 3.6543 | | | | 3.3690 | | | | 3.8942 | | | | 3.8399 | |
| | | | |
February | | | 3.5818 | | | | 3.3177 | | | | 3.7973 | | | | 3.7438 | |
| | | | |
March | | | 3.4932 | | | | 3.2247 | | | | 3.7269 | | | | 3.6639 | |
| | | | |
April | | | 3.8449 | | | | 3.5468 | | | | 4.1015 | | | | 4.0347 | |
| | | | |
May | | | 3.7831 | | | | 3.4944 | | | | 4.0085 | | | | 3.9658 | |
| | | | |
June | | | 3.4156 | | | | 3.1567 | | | | 3.6570 | | | | 3.5800 | |
| | | | |
July | | | 4.0064 | | | | 3.7059 | | | | 4.3005 | | | | 4.1999 | |
| | | | |
August | | | 3.7197 | | | | 3.4462 | | | | 3.9549 | | | | 3.8930 | |
| | | | |
September | | | 3.7212 | | | | 3.4392 | | | | 3.9609 | | | | 3.8995 | |
| | | | |
October | | | 3.6602 | | | | 3.3822 | | | | 3.8556 | | | | 3.8293 | |
| | | | |
Total | | | 44.6409 | | | | 41.2700 | | | | 47.4996 | | | | 46.7722 | |
*The distribution amount is the sum of all net investment income distributions for the period shown. Assumes shares were purchased and held for the entire accrual period. Since dividends accrue daily, your actual distributions will vary depending on the date you purchased your shares and any account activity. All Fund distributions will vary depending upon current market conditions, and past distributions are not indicative of future trends.
CLOs, which had already been the majority holder of institutional leveraged loans, further gained share as retail investor demand shrunk. Although interest-rate cuts moderated demand for floating rate CLO tranches compared to the prior period, issuance of new CLOs remained the primary driver of demand for loans. Issuance was slower in 2019 compared to the previous year, but more than a hundred open CLO warehouses continued ramping and buying loans, which provided a floor to loan valuations and a source of support to loan prices. Managers overcame challenges in loan supply and arbitrage, in addition to fears that scrutiny from financial regulators would diminish demand from investors.
New issuance in the loan market remained relatively low, which eventually helped balance technical conditions as investor sentiment improved in 2019. Furthermore, price declines in the loan market restrained refinancing and repricing activity, which was more common in previous periods. Amid the slowdown in demand in the loan market, some deals also shifted funds from the loan market to the bond market, where there was more demand, reversing the trend from the previous year when the loan market
surpassed the size of the high-yield bond market by some measures. New supply continued to be primarily in B rated loans, while loan documentation remained relatively loose. Although deals related to M&A transactions picked up, the pace of total issuance continued to lag due to an increase in paydowns, especially among larger tranche names.
The default rate by principal amount declined during the period and continued to be below the historical average, after reaching a three-year high earlier in 2018. The default outlook remained generally benign even with higher leverage levels, especially among first-lien loans, a higher proportion of B rated loans in the market and more loans trading at distressed levels. However, uncertainty about the pace of economic growth contributed to increased concerns, as the pace of credit rating downgrades outpaced the number of loans that were upgraded. Due to CLO limits on holding CCC rated loans, further downgrades were expected to potentially contribute to increased selling and volatility in the loan market. As a result, lower-rated loans underperformed during the period, as less support from CLO managers and the absence of demand from retail investors led to greater price declines and higher leverage. Amid fears of slower economic growth, higher-rated loans outperformed lower-rated loans, widening the spread differential between BB rated and B rated loans.
Investment Strategy
We use a detailed credit analysis process to select corporate loan and corporate debt securities that meet our criteria. We conduct ongoing credit monitoring of our investments. To help manage the credit risk associated with investing in securities rated below investment grade (or if unrated, of comparable quality), we seek to diversify the Fund by investing in a large number of loans of companies that we have identified as having attractive risk/reward profiles, favorable capital structures, strong asset coverage and dominant market shares. This diversification potentially reduces credit risk by spreading assets across many different industries.
Manager’s Discussion
During theone-year period under review, the Fund underperformed its benchmark, the CSLLI. The Fund maintained an overweight in the upper tier of the market throughout the period, which contributed to performance as upper tier loans in the index returned +4.38%, middle tier returned +2.31%, and lower tier returned-3.97%, according to the CSLLI. Although upper tier loans outperformed during the quarter, performance was primarily driven by loan
| | | | |
| | | |
| franklintempleton.com | | Annual Report | | 11 |
FRANKLIN FLOATING RATE DAILY ACCESS FUND
selection, but some issuers continued to face operational and industry challenges.
The top individual contributors to performance included higher-rated issuers that attracted stronger demand, as well as companies that had support due to potential catalysts that investors expected to push prices higher. Within our portfolio, General Nutrition Centers, a specialty retailer of nutritional supplements, was a major contributor to performance after an equity investment from a Chinese pharmaceutical company cleared regulatory hurdles and was used to reduce leverage. Onsite Rentals, a specialized industrial equipment rental company, also contributed to performance as it reported improved results due to an increase in contracts and as the company explored a potential initial public offering.
The top detractors from performance included issuers that faced challenges in operations, in addition to sector weakness, which hindered results. The term loan of Foresight Energy (not held atperiod-end), a thermal coal producer, declined as company results were weaker due to low coal prices, competition from natural gas producers and flooding conditions that prevented delivery of shipments. These factors led to a credit rating downgrade during the period. Ascena Retail Group, a specialty apparel retailer with multiple core brands, also detracted from performance after the company reported worse-than-expected results and weak guidance for the remainder of the year, which resulted in major management changes and a material change in strategy.
During the period, the Fund looked to lower risk in areas of the portfolio that we believed had elevated credit risk and higher uncertainty. The Fund also reduced its investment in CLOs by selling AAA rated and A rated tranches. Buys during the period included higher-rated loans that launched deals in the primary market with relatively attractive spreads.
The Fund continued to maintain a significant overweighting in higher-rated loans as upper tier loans were more than half of the loan portfolio atperiod-end, compared to under one third for the index. In addition, we maintained the Fund’s investment in the Franklin Floating Rate Income Fund, which allowed the Fund to have further exposure to credit, while providing a potential source of liquidity. In an effort to protect against volatility in the credit markets, the Fund held a high-yield bond credit default swap index that provided synthetic exposure to the high-yield bond market.
Top 10 Holdings
10/31/19
| | |
Company Sector/Industry | | % of Total Net Assets |
| |
Fieldwood Energy LLC Oil & Gas Exploration & Production | | 4.4% |
| |
Appvion Operations, Inc.* Forest Products | | 2.8% |
| |
FGI Operating Co. LLC (Freedom Group) Personal Products | | 2.8% |
| |
General Nutrition Centers Inc. Specialty Stores | | 2.6% |
| |
Navistar Inc. Industrial Machinery | | 2.2% |
| |
Wolverine Fuels Holding LLC Coal & Consumable Fuels | | 1.9% |
| |
CSC Holdings LLC Cable & Satellite | | 1.9% |
| |
JBS USA Lux SA Packaged Foods & Meats | | 1.8% |
| |
Berry Global Inc. Metal & Glass Containers | | 1.6% |
| |
Sinclair Television Group Inc. Broadcasting | | 1.6% |
*Includes common stock and senior floating rate interests.
Thank you for your continued participation in Franklin Floating Rate Daily Access Fund. We look forward to serving your future investment needs.
| | |
 | | 
Reema Agarwal, CFA |
| | |
 | | 
Justin Ma, CFA |
| |
| | Margaret Chiu, CFA |
| |
| | Portfolio Management Team |
| | | | |
| | | |
12 | | Annual Report | | franklintempleton.com |
FRANKLIN FLOATING RATE DAILY ACCESS FUND
The foregoing information reflects our analysis, opinions and portfolio holdings as of October 31, 2019, the end of the reporting period. The way we implement our main investment strategies and the resulting portfolio holdings may change depending on factors such as market and economic conditions. These opinions may not be relied upon as investment advice or an offer for a particular security. The information is not a complete analysis of every aspect of any market, country, industry, security or the Fund. Statements of fact are from sources considered reliable, but the investment manager makes no representation or warranty as to their completeness or accuracy. Although historical performance is no guarantee of future results, these insights may help you understand our investment management philosophy.
| | | | |
| | | |
| franklintempleton.com | | Annual Report | | 13 |
FRANKLIN FLOATING RATE DAILY ACCESS FUND
Performance Summary as of October 31, 2019
The performance tables and graphs do not reflect any taxes that a shareholder would pay on Fund dividends, capital gain distributions, if any, or any realized gains on the sale of Fund shares. Total return reflects reinvestment of the Fund’s dividends and capital gain distributions, if any, and any unrealized gains or losses. Your dividend income will vary depending on dividends or interest paid by securities in the Fund’s portfolio, adjusted for operating expenses of each class. Capital gain distributions are net profits realized from the sale of portfolio securities.
Performance as of 10/31/191
Cumulative total return excludes sales charges. Average annual total return includes maximum sales charges. Sales charges will vary depending on the size of the investment and the class of share purchased. The maximum is 2.25% and the minimum is 0%.Class A:2.25% maximum initial sales charge;Advisor Class:no sales charges. For other share classes, visitfranklintempleton.com.
| | | | | | |
| | | Cumulative | | | | Average Annual |
| Share Class | | Total Return2 | | | | Total Return3 |
| | | |
A | | | | | | |
1-Year | | -0.88% | | | | -3.10% |
| | | |
5-Year | | +13.27% | | | | +2.05% |
| | | |
10-Year | | +43.90% | | | | +3.47% |
| | | |
Advisor | | | | | | |
1-Year | | -0.74% | | | | -0.74% |
| | | |
5-Year | | +14.55% | | | | +2.75% |
| | | |
10-Year | | +47.35% | | | | +3.95% |
| | | | | | | | |
| | | Distribution Rate4 | | 30-Day Standardized Yield5 |
| Share Class | | | (with fee waiver) | | | (without fee waiver) |
| | | |
A | | 5.14% | | | 6.11% | | | 6.07% |
| | | |
Advisor | | 5.50% | | | 6.51% | | | 6.48% |
Performance data represent past performance, which does not guarantee future results. Investment return and principal value will fluctuate, and you may have a gain or loss when you sell your shares. Current performance may differ from figures shown. For most recentmonth-end performance, go tofranklintempleton.comor call(800)342-5236.
See page 16 for Performance Summary footnotes.
| | | | |
| | | |
14 | | Annual Report | | franklintempleton.com |
FRANKLIN FLOATING RATE DAILY ACCESS FUND
PERFORMANCE SUMMARY
Total Return Index Comparison for a Hypothetical $10,000 Investment1
Total return represents the change in value of an investment over the periods shown. It includes any applicable maximum sales charge, Fund expenses, account fees and reinvested distributions. The unmanaged index includes reinvestment of any income or distributions. It differs from the Fund in composition and does not pay management fees or expenses. One cannot invest directly in an index.
Class A(11/1/09–10/31/19)
Advisor Class(11/1/09–10/31/19)
See page 16 for Performance Summary footnotes.
| | | | |
| | | |
| franklintempleton.com | | Annual Report | | 15 |
FRANKLIN FLOATING RATE DAILY ACCESS FUND
PERFORMANCE SUMMARY
Distributions(11/1/18–10/31/19)
| | |
| Share Class | | Net Investment
Income |
| |
A | | $0.446409 |
| |
C | | $0.412700 |
| |
R6 | | $0.474996 |
| |
Advisor | | $0.467722 |
Total Annual Operating Expenses7
| | | | | | | | | | |
| Share Class | | With Fee
Waiver | | | | | | Without Fee
Waiver |
| | | |
A | | | 0.87% | | | | | | | 0.93% |
| | | |
Advisor | | | 0.62% | | | | | | | 0.68% |
Each class of shares is available to certain eligible investors and has different annual fees and expenses, as described in the prospectus
All investments involve risks, including possible loss of principal. Investors should be aware that the Fund’s share price and yield will fluctuate with market conditions. The Fund should not be considered an alternative to money market funds or certificates of deposit (CDs). The floating rate loans and debt securities in which the Fund invests tend to be rated below investment grade. Investing in higher-yielding, lower-rated, floating rate loans and debt securities involves greater risk of default, which could result in loss of principal—a risk that may be heightened in a slowing economy. Interest earned on floating rate loans varies with changes in prevailing interest rates. Therefore, while floating rate loans offer higher interest income when interest rates rise, they will also generate less income when interest rates decline. Changes in the financial strength of a bond issuer or in a bond’s credit rating may affect its value. The Fund is actively managed but there is no guarantee that the manager’s investment decisions will produce the desired results. The Fund’s prospectus also includes a description of the main investment risks.
1. The Fund has a fee waiver associated with any investment it makes in a Franklin Templeton money fund and/or other Franklin Templeton fund, contractually guaranteed through 2/29/20. Fund investment results reflect the fee waiver; without this waiver, the results would have been lower.
2. Cumulative total return represents the change in value of an investment over the periods indicated.
3. Average annual total return represents the average annual change in value of an investment over the periods indicated. Return for less than one year, if any, has not been annualized.
4. Distribution rate is based on an annualization of the sum of the respective class’s past month’s daily distributions and the maximum offering price (NAV for Advisor Class) per share on 10/31/19.
5. The Fund’s30-day standardized yield is calculated over a trailing30-day period using the yield to maturity on bonds and/or the dividends accrued on stocks. It may not equal the Fund’s actual income distribution rate, which reflects the Fund’s past dividends paid to shareholders.
6. Source: Credit Suisse Group. The CS LLI is designed to mirror the investable universe of the U.S. dollar-denominated leveraged loan market. Loans must be below investment grade and rated no higher than Baa/BB+ or Ba1/BBB+ by Moody’s or S&P.
7. Figures are as stated in the Fund’s current prospectus and may differ from the expense ratios disclosed in the Your Fund’s Expenses and Financial Highlights sections in this report. In periods of market volatility, assets may decline significantly, causing total annual Fund operating expenses to become higher than the figures shown.
See www.franklintempletondatasources.com for additional data provider information.
| | | | |
| | | |
16 | | Annual Report | | franklintempleton.com |
FRANKLIN FLOATING RATE DAILY ACCESS FUND
Your Fund’s Expenses
As a Fund shareholder, you can incur two types of costs: (1) transaction costs, including sales charges (loads) on Fund purchases and redemptions; and (2) ongoing Fund costs, including management fees, distribution and service(12b-1) fees, and other Fund expenses. All mutual funds have ongoing costs, sometimes referred to as operating expenses. The table below shows ongoing costs of investing in the Fund and can help you understand these costs and compare them with those of other mutual funds. The table assumes a $1,000 investment held for the six months indicated.
Actual Fund Expenses
The table below provides information about actual account values and actual expenses in the columns under the heading “Actual.” In these columns the Fund’s actual return, which includes the effect of Fund expenses, is used to calculate the “Ending Account Value” for each class of shares. You can estimate the expenses you paid during the period by following these steps (of course, your account value and expenses will differ from those in this illustration): Divide your account value by $1,000 (if your account had an $8,600 value, then $8,600÷ $1,000 = 8.6). Then multiply the result by the number in the row for your class of shares under the headings “Actual” and “Expenses Paid During Period” (if Actual Expenses Paid During Period were $7.50, then 8.6 x $7.50 = $64.50). In this illustration, the actual expenses paid this period are $64.50.
Hypothetical Example for Comparison with Other Funds
Under the heading “Hypothetical” in the table, information is provided about hypothetical account values and hypothetical expenses based on the Fund’s actual expense ratio and an assumed rate of return of 5% per year before expenses, which is not the Fund’s actual return. This information may not be used to estimate the actual ending account balance or expenses you paid for the period, but it can help you compare ongoing costs of investing in the Fund with those of other funds. To do so, compare this 5% hypothetical example for the class of shares you hold with the 5% hypothetical examples that appear in the shareholder reports of other funds.
Please note that expenses shown in the table are meant to highlight ongoing costs and do not reflect any transactional costs. Therefore, information under the heading “Hypothetical” is useful in comparing ongoing costs only, and will not help you compare total costs of owning different funds. In addition, if transactional costs were included, your total costs would have been higher.
| | | | | | | | | | | | |
| | | | | Actual
(actual return after expenses) | | Hypothetical
(5% annual return before expenses) | | |
Share Class | | Beginning Account Value 5/1/19 | | Ending Account Value 10/31/19 | | Expenses Paid During
Period 5/1/19–10/31/191, 2 | | Ending Account Value 10/31/19 | | Expenses Paid During
Period 5/1/19–10/31/191, 2 | | Net Annualized
Expense
Ratio2 |
| | | | | | |
A | | $1,000 | | $983.70 | | $4.45 | | $1,020.72 | | $4.53 | | 0.89% |
C | | $1,000 | | $980.60 | | $6.44 | | $1,018.70 | | $6.56 | | 1.29% |
R6 | | $1,000 | | $985.40 | | $2.70 | | $1,022.48 | | $2.75 | | 0.54% |
Advisor | | $1,000 | | $983.80 | | $3.20 | | $1,021.98 | | $3.26 | | 0.64% |
1. Expenses are equal to the annualized expense ratio for thesix-month period as indicated above—in the far right column—multiplied by the simple average account value over the period indicated, and then multiplied by 184/365 to reflect theone-half year period.
2. Reflects expenses after fee waivers and expense reimbursements. Does not include acquired fund fees and expenses.
| | | | |
| | | |
| franklintempleton.com | | Annual Report | | 17 |
Franklin Low Duration Total Return Fund
This annual report for Franklin Low Duration Total Return Fund covers the fiscal year ended October 31, 2019.
Your Fund’s Goal and Main Investments
The Fund seeks a high level of current income as is consistent with prudent investing, while seeking capital preservation. The Fund invests primarily in investment-grade debt securities and investments, including government and corporate debt securities and mortgage- and asset-backed securities, targeting an estimated average portfolio duration of three years or less.
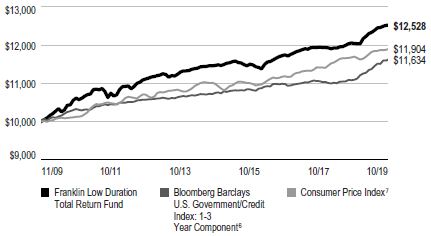
Performance Overview
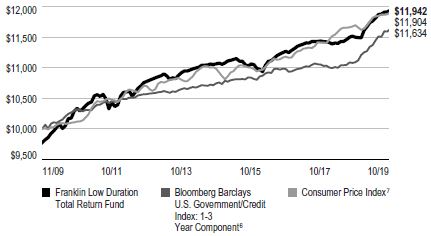
The Fund’s Class A shares posted a +3.78% cumulative total return for the 12 months under review. In comparison, the Fund’s benchmark, the Bloomberg Barclays U.S. Government/Credit Index:1-3 Year Component, posted a +4.89% total return.1 The index measures public obligations of the U.S. Treasury with one to three years to final maturity and publicly issued debt of U.S. government agencies, quasi-federal corporations, and corporate or foreign debt guaranteed by the U.S. government. You can find more of the Fund’s performance data in the Performance Summary beginning on page 21.
Performance data represent past performance, which does not guarantee future results. Investment return and principal value will fluctuate, and you may have a gain or loss when you sell your shares. Current performance may differ from figures shown. For most recentmonth-end performance, go tofranklintempleton.comor call(800)342-5236.
Investment Strategy
We seek to invest in a combination of fixed income securities, primarily from across the investment-grade debt universe. We analyze securities using proprietary and nonproprietary research to help us identify attractive investment opportunities across the entire fixed income opportunity set, on a relative basis. When making investment decisions, we evaluate business cycles, yield curves, and values between and within markets. Through a low duration portfolio, we seek to position the Fund to be less affected by
Portfolio Composition*
Based on Total Net Assets as of 10/31/19
*Figures reflect certain derivatives held in the portfolio (or their underlying reference assets) and may not total 100% or may be negative due to rounding, use of derivatives, unsettled trades or other factors.
**Includesnon-agency residential mortgage backed securities, collateralized loan obligations and consumer loan certificates.
***Rounds to less than 0.1% of total net assets.
interest-rate changes than a fund with a higher duration. In addition, we may use derivative transactions, such as forwards, futures contracts and swap agreements to obtain net long or short exposures to select currencies, interest rates, countries, duration or credit risks.
1. Source: Morningstar.
The index is unmanaged and includes reinvestment of any income or distributions. It does not reflect any fees, expenses or sales charges. One cannot invest directly in an index, and an index is not representative of the Fund’s portfolio.
See www.franklintempletondatasources.com for additional data provider information.
The dollar value, number of shares or principal amount, and names of all portfolio holdings are listed in the Fund’s Statement of Investments (SOI).
The SOI begins on page 61.
| | | | |
| | | |
18 | | Annual Report | | franklintempleton.com |
FRANKLIN LOW DURATION TOTAL RETURN FUND
|
|
What is duration? |
|
Duration is a measure of a bond’s price sensitivity to interest-rate changes. In general, a portfolio of securities with a lower duration can be expected to be less sensitive to interest-rate changes than a portfolio with a higher duration. |
|
|
What is the yield curve? |
|
A yield curve is a line that plots the yield to maturity of bonds having equal credit quality against their maturity dates. |
|
|
What is a currency forward contract? |
|
A currency forward contract is an agreement between the Fund and a counterparty to buy or sell a foreign currency in exchange for another currency at a specific exchange rate on a future date. Currency forward contracts are privately traded in the interbank market, not on a centralized exchange. |
|
|
What is a futures contract? |
|
A futures contract is an agreement between the Fund and a counterparty made through a U.S. or foreign futures exchange to buy or sell an underlying instrument or asset at a specific price on a future date. |
|
|
What are swap agreements? |
|
Swap agreements, such as interest rate, fixed income total return, currency, inflation index and credit default swaps, are contracts between the Fund and another party (the swap counterparty). In a basic swap transaction, the Fund agrees with the swap counterparty to exchange the returns (or differentials in rates of return) earned or realized on a particular “notional amount” of underlying instruments. The notional amount is the set amount selected by the parties as the basis on which to calculate the obligations that they have agreed to exchange. The parties typically do not actually exchange the notional amount. Instead, they agree to exchange the returns that would be earned or realized if the notional amount were invested in given instruments or at given interest rates. |
Manager’s Discussion
From a perspective of excess returns over Treasuries of similar duration, U.S. corporate credit performed well. Other major fixed income sectors that delivered notable positive excess returns, as measured by Bloomberg Barclays indexes, includednon-agency residential mortgage-backed securities (RMBS), emerging markets securities and commercial mortgage-backed securities (CMBS). In contrast, fixed-rate agency mortgage-backed securities (MBS) underperformed Treasuries.
Dividend Distributions*
11/1/18–10/31/19
| | | | | | | | | | |
| | | Dividend per Share (cents) |
| | | | | | | | | | | Advisor |
| Month | | Class A | | Class C | | Class R** | | Class R6 | | Class |
| | | | | |
November | | 2.5107 | | 2.1872 | | — | | 2.8413 | | 2.7224 |
| | | | | |
December | | 2.6718 | | 2.3375 | | — | | 3.0026 | | 2.8892 |
| | | | | |
January | | 2.4447 | | 2.1106 | | — | | 2.7737 | | 2.6620 |
| | | | | |
February | | 2.3819 | | 2.0779 | | — | | 2.6858 | | 2.5799 |
| | | | | |
March | | 2.4572 | | 2.1446 | | — | | 2.7701 | | 2.6378 |
| | | | | |
April | | 2.7103 | | 2.3558 | | — | | 3.0450 | | 2.9639 |
| | | | | |
May | | 2.8762 | | 2.5394 | | — | | 3.2098 | | 3.0981 |
| | | | | |
June | | 2.6035 | | 2.2985 | | — | | 2.9059 | | 2.8045 |
| | | | | |
July | | 2.7284 | | 2.4008 | | — | | 3.0514 | | 2.9433 |
| | | | | |
August | | 2.4763 | | 2.1486 | | — | | 2.7960 | | 2.6891 |
| | | | | |
September | | 2.4858 | | 2.1492 | | — | | 2.8165 | | 2.7053 |
| | | | | |
October | | 2.4929 | | 2.1685 | | 1.3375 | | 2.8118 | | 2.7050 |
| | | | | |
Total | | 30.8397 | | 26.9186 | | 1.3375 | | 34.7099 | | 33.4005 |
*The distribution amount is the sum of all net investment income distributions for the period shown. Assumes shares were purchased and held for the entire accrual period. Since dividends accrue daily, your actual distributions will vary depending on the date you purchased your shares and any account activity. All Fund distributions will vary depending upon current market conditions, and past distributions are not indicative of future trends.
**Effective 10/15/19, the Fund began offering Class R shares. See the prospectus for details.
During the period, the Fund’s exposure to the corporate credit sectors of high-yield, investment-grade and collateralized loan obligations (CLOs) contributed to the Fund’s performance relative to its benchmark. Allocation to senior secured floating-rate loans was positive, but not enough to offset negative security selection. Additionally, CMBS andnon-dollar developed bonds were positive for returns. In contrast, the Fund’s U.S. yield curve positioning detracted as did TIPS and RMBS.
We maintained our largest sector allocation in RMBS and increased it slightly over the period. We also increased allocation to CLOs, TIPS, U.S. Treasuries, MBS and sovereign emerging-market debt. We pared our exposure to investment-grade and high-yield corporate credit, senior secured floating-rate loans and CMBS as we found better relative opportunities.
During the period, the portfolio utilized derivatives, including credit default and currency swaps, inflation-linked swaps, currency forwards, Treasury futures, interest-rate swaps and credit default swap options, principally as a tool for efficient portfolio management and to manage overall portfolio risk. These derivative transactions may provide the same, or similar, net long or short exposure to select currencies,
| | | | |
| | | |
| franklintempleton.com | | Annual Report | | 19 |
FRANKLIN LOW DURATION TOTAL RETURN FUND
interest rates, countries, duration or credit risks in a less expensive way than by directly purchasing securities. In those markets wherenon-derivative securities are readily available, the cost difference in normal market conditions may be small.
Thank you for your continued participation in Franklin Low Duration Total Return Fund. We look forward to serving your future investment needs.
| | |
 | | 
Sonal Desai, Ph.D. Co-Lead Portfolio Manager |
| | | |
 | | 
David Yuen, CFA, FRM Co-Lead Portfolio Manager |
| |
| | Tina Chou Co-Lead Portfolio Manager |
| |
| | Kent Burns, CFA Co-Lead Portfolio Manager |
The foregoing information reflects our analysis, opinions and portfolio holdings as of October 31, 2019, the end of the reporting period. The way we implement our main investment strategies and the resulting portfolio holdings may change depending on factors such as market and economic conditions. These opinions may not be relied upon as investment advice or an offer for a particular security. The information is not a complete analysis of every aspect of any market, country, industry, security or the Fund. Statements of fact are from sources considered reliable, but the investment manager makes no representation or warranty as to their completeness or accuracy. Although historical performance is no guarantee of future results, these insights may help you understand our investment management philosophy.
| | | | |
| | | |
20 | | Annual Report | | franklintempleton.com |
FRANKLIN LOW DURATION TOTAL RETURN FUND
Performance Summary as of October 31, 2019
The performance tables and graphs do not reflect any taxes that a shareholder would pay on Fund dividends, capital gain distributions, if any, or any realized gains on the sale of Fund shares. Total return reflects reinvestment of the Fund’s dividends and capital gain distributions, if any, and any unrealized gains or losses. Your dividend income will vary depending on dividends or interest paid by securities in the Fund’s portfolio, adjusted for operating expenses of each class. Capital gain distributions are net profits realized from the sale of portfolio securities.
Performance as of 10/31/191
Cumulative total return excludes sales charges. Average annual total return includes maximum sales charges. Sales charges will vary depending on the size of the investment and the class of share purchased. The maximum is 2.25% and the minimum is 0%.Class A:2.25% maximum initial sales charge;Advisor Class:no sales charges. For other share classes, visitfranklintempleton.com.
| | | | | | |
| Share Class | |
| Cumulative
Total Return |
2 | | Average Annual Total Return3 |
|
| | |
A | | | | | | |
| | |
1-Year | | | +3.78% | | | +1.46% |
|
|
| | |
5-Year | | | +7.88% | | | +1.07% |
|
|
| | |
10-Year | | | +22.12% | | | +1.79% |
|
|
| | |
Advisor | | | | | | |
| | |
1-Year | | | +4.04% | | | +4.04% |
|
|
| | |
5-Year | | | +9.24% | | | +1.78% |
|
|
| | |
10-Year | | | +25.28% | | | +2.28% |
|
| | | | | | | | |
| Share Class | |
| Distribution
Rate |
4 | | 30-Day Standardized Yield5 |
| | (with fee waiver) | | (without fee waiver) |
| | | |
A | | | 3.03% | | | 2.76% | | 2.41% |
| | | |
Advisor | | | 3.35% | | | 3.09% | | 2.72% |
Performance data represent past performance, which does not guarantee future results. Investment return and principal value will fluctuate, and you may have a gain or loss when you sell your shares. Current performance may differ from figures shown. For most recentmonth-end performance, go tofranklintempleton.comor call(800)342-5236.
See page 23 for Performance Summary footnotes.
| | | | |
| | | |
| franklintempleton.com | | Annual Report | | 21 |
FRANKLIN LOW DURATION TOTAL RETURN FUND
PERFORMANCE SUMMARY
Total Return Index Comparison for a Hypothetical $10,000 Investment1
Total return represents the change in value of an investment over the periods shown. It includes any applicable maximum sales charge, Fund expenses, account fees and reinvested distributions. The unmanaged indexes include reinvestment of any income or distributions. They differ from the Fund in composition and do not pay management fees or expenses. One cannot invest directly in an index.
Class A(11/1/09–10/31/19)
Advisor Class(11/1/09–10/31/19)
See page 23 for Performance Summary footnotes.
| | | | |
| | | |
22 | | Annual Report | | franklintempleton.com |
FRANKLIN LOW DURATION TOTAL RETURN FUND
PERFORMANCE SUMMARY
Distributions(11/1/18–10/31/19)
| | |
| Share Class | | Net Investment
Income |
| |
A | | $0.308397 |
| |
C | | $0.269186 |
| |
R | | $0.013375 |
| |
R6 | | $0.347099 |
| |
Advisor | | $0.334005 |
Total Annual Operating Expenses8
| | | | | | |
| Share Class | | With Fee
Waiver | | | Without Fee
Waiver |
| | |
A | | | 0.72% | | | 0.97% |
| | |
Advisor | | | 0.47% | | | 0.72% |
Each class of shares is available to certain eligible investors and has different annual fees and expenses, as described in the prospectus.
All investments involve risks, including possible loss of principal. Interest-rate movements and mortgage prepayments will affect the Fund’s share price and yield. Bond prices generally move in the opposite direction of interest rates. Thus, as the prices of bonds in the Fund adjust to a rise in interest rates, the Fund’s share price may decline. Changes in the financial strength of a bond issuer or in a bond’s credit rating may affect its value. The risks associated with higher-yielding, lower-rated securities include higher risk of default and loss of principal. Investment in foreign securities also involves special risks, including currency fluctuations, and political and economic uncertainty. Derivatives, including currency management strategies, involve costs and can create economic leverage in the portfolio which may result in significant volatility and cause the Fund to participate in losses (as well as gains) on an amount that exceeds the Fund’s initial investment. The Fund may not achieve the anticipated benefits, and may realize losses when a counterparty fails to perform. The Fund is actively managed but there is no guarantee that the manager’s investment decisions will produce the desired results. The Fund’s prospectus also includes a description of the main investment risks.
1. The Fund has an expense reduction contractually guaranteed through 2/28/21 and a fee waiver associated with any investments it makes in a Franklin Templeton money fund and/or other Franklin Templeton fund, contractually guaranteed through 2/29/20. Fund investment results reflect the expense reduction and fee waiver; without these reductions, the results would have been lower.
2. Cumulative total return represents the change in value of an investment over the periods indicated.
3. Average annual total return represents the average annual change in value of an investment over the periods indicated. Return for less than one year, if any, has not been annualized.
4. Distribution rate is based on an annualization of the sum of the respective class’s past month’s daily distributions and the maximum offering price (NAV for Advisor Class) per share on 10/31/19.
5. The Fund’s30-day standardized yield is calculated over a trailing30-day period using the yield to maturity on bonds and/or the dividends accrued on stocks. It may not equal the Fund’s actual income distribution rate, which reflects the Fund’s past dividends paid to shareholders.
6. Source: Morningstar. The Bloomberg Barclays U.S. Government/Credit Index:1-3 Year Component includes dollar-denominated investment grade corporate debt andnon-native currency agency and local authority debt, sovereign, supranational, and taxable municipal debt, public obligations of the U.S. Treasury with at least one year up to, but not including, three years to final maturity, and publicly issued debt of U.S. government agencies, quasi-federal corporations, and corporate or foreign debt guaranteed by the U.S. government.
7. Source: Bureau of Labor Statistics, bls.gov/cpi. The Consumer Price Index (CPI) is a commonly used measure of the inflation rate.
8. Figures are as stated in the Fund’s current prospectus and may differ from the expense ratios disclosed in the Your Fund’s Expenses and Financial Highlights sections in this report. In periods of market volatility, assets may decline significantly, causing total annual Fund operating expenses to become higher than the figures shown.
See www.franklintempletondatasources.com for additional data provider information.
| | | | |
| | | |
| franklintempleton.com | | Annual Report | | 23 |
FRANKLIN LOW DURATION TOTAL RETURN FUND
Your Fund’s Expenses
As a Fund shareholder, you can incur two types of costs: (1) transaction costs, including sales charges (loads) on Fund purchases and redemptions; and (2) ongoing Fund costs, including management fees, distribution and service(12b-1) fees, and other Fund expenses. All mutual funds have ongoing costs, sometimes referred to as operating expenses. The table below shows ongoing costs of investing in the Fund and can help you understand these costs and compare them with those of other mutual funds. The table assumes a $1,000 investment held for the six months indicated.
Actual Fund Expenses
The table below provides information about actual account values and actual expenses in the columns under the heading “Actual.” In these columns the Fund’s actual return, which includes the effect of Fund expenses, is used to calculate the “Ending Account Value” for each class of shares. You can estimate the expenses you paid during the period by following these steps (of course, your account value and expenses will differ from those in this illustration): Divide your account value by $1,000 (if your account had an $8,600 value, then $8,600÷ $1,000 = 8.6). Then multiply the result by the number in the row for your class of shares under the headings “Actual” and “Expenses Paid During Period” (if Actual Expenses Paid During Period were $7.50, then 8.6 x $7.50 = $64.50). In this illustration, the actual expenses paid this period are $64.50.
Hypothetical Example for Comparison with Other Funds
Under the heading “Hypothetical” in the table, information is provided about hypothetical account values and hypothetical expenses based on the Fund’s actual expense ratio and an assumed rate of return of 5% per year before expenses, which is not the Fund’s actual return. This information may not be used to estimate the actual ending account balance or expenses you paid for the period, but it can help you compare ongoing costs of investing in the Fund with those of other funds. To do so, compare this 5% hypothetical example for the class of shares you hold with the 5% hypothetical examples that appear in the shareholder reports of other funds.
Please note that expenses shown in the table are meant to highlight ongoing costs and do not reflect any transactional costs. Therefore, information under the heading “Hypothetical” is useful in comparing ongoing costs only, and will not help you compare total costs of owning different funds. In addition, if transactional costs were included, your total costs would have been higher.
| | | | | | | | | | | | |
| | | Actual
(actual return after expenses) | | Hypothetical
(5% annual return before expenses) | | |
Share Class | | Beginning
Account
Value 5/1/191 | | Ending
Account
Value 10/31/19 | | Expenses Paid During Period 5/1/19–10/31/192, 3, 4 | | Ending
Account
Value 10/31/19 | | Expenses Paid During
Period 5/1/19–10/31/192, 4 | | Net
Annualized
Expense
Ratio4 |
| | | | | | |
A | | $1,000 | | $1,014.20 | | $3.45 | | $1,021.78 | | $3.47 | | 0.68% |
C | | $1,000 | | $1,012.20 | | $5.48 | | $1,019.76 | | $5.50 | | 1.08% |
R | | $1,000 | | $1,001.40 | | $0.41 | | $1,020.52 | | $4.74 | | 0.93% |
R6 | | $1,000 | | $1,016.10 | | $1.52 | | $1,023.69 | | $1.53 | | 0.30% |
Advisor | | $1,000 | | $1,015.50 | | $2.18 | | $1,023.04 | | $2.19 | | 0.43% |
1. For Classes A, C, R6 and Advisor, 5/1/19 for Actual and Hypothetical. For Class R, 10/15/19 for Actual and 5/1/19 for Hypothetical.
2. For Classes A, C, R6 and Advisor, 5/1/19–10/31/19. For Class R, 10/15/19–10/31/19.
3. Expenses are equal to the annualized expense ratio for thesix-month period as indicated above—in the far right column—multiplied by the simple average account value over the period indicated, and then multiplied by 184/365 to reflect theone-half year period. The multiplier is 16/365 for Actual Class R expenses to reflect the number of days since inception.
4. Reflects expenses after fee waivers and expense reimbursements. Does not include acquired fund fees and expenses.
| | | | |
| | | |
24 | | Annual Report | | franklintempleton.com |
Franklin Total Return Fund
This annual report for Franklin Total Return Fund covers the fiscal year ended October 31, 2019.
Your Fund’s Goal and Main Investments
The Fund seeks to provide high current income, consistent with preservation of capital. Capital appreciation over the long term is a secondary goal. The Fund invests primarily in investment-grade debt securities (including unrated securities of comparable quality) and other investments that provide exposure to such securities. The Fund currently focuses on government and corporate debt securities and mortgage- and asset-backed securities, but may invest in other securities and investments, such as floating-rate corporate loans and securities and municipal securities.
Performance Overview
The Fund’s Class A shares posted a +10.01% cumulative total return for the 12 months under review. In comparison, the Fund’s benchmark, the Bloomberg Barclays U.S. Aggregate Bond Index posted a +11.51% total return.1 The index measures the U.S. investment-grade, fixed-rate, taxable bond market with index components for government and corporate, mortgage pass-through and asset-backed securities. You can find the Fund’s long-term performance data in the Performance Summary beginning on page 28.
Performance data represent past performance, which does not guarantee future results. Investment return and principal value will fluctuate, and you may have a gain or loss when you sell your shares. Current performance may differ from figures shown. For most recentmonth-end performance, go tofranklintempleton.comor call(800)342-5236.
Investment Strategy
We seek to invest in a combination of fixed income securities, primarily from across the investment-grade debt universe. We analyze securities using proprietary and nonproprietary research to help us identify attractive investment opportunities, across the entire fixed income opportunity set, on a relative basis. The Fund may also invest up to 20% of its total assets in noninvestment-grade debt securities. In addition, we may use derivative
Portfolio Composition*
Based on Total Net Assets as of 10/31/19
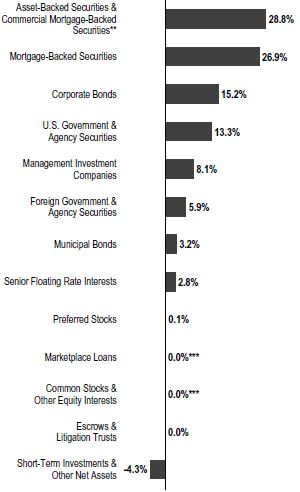
*Figures reflect certain derivatives held in the portfolio (or their underlying reference assets) and may not total 100% or may be negative due to rounding, use of derivatives, unsettled trades or other factors.
**Includesnon-agency residential mortgage backed securities, collateralized loan obligations and consumer loan certificates.
***Rounds to less than 0.1% of total net assets.
transactions, such as currency and cross-currency forwards, futures contracts and swap agreements, to obtain net long or short exposures to select currencies, interest rates, countries, duration or credit risks.
1. Source: Morningstar.
The index is unmanaged and includes reinvestment of any income or distributions. It does not reflect any fees, expenses or sales charges. One cannot invest directly in an index, and an index is not representative of the Fund’s portfolio.
See www.franklintempletondatasources.com for additional data provider information.
The dollar value, number of shares or principal amount, and names of all portfolio holdings are listed in the Fund’s Consolidated Statement of Investments (SOI). The Consolidated SOI begins on page 97.
| | | | |
| | | |
| franklintempleton.com | | Annual Report | | 25 |
FRANKLIN TOTAL RETURN FUND
| | | | |
| | What is a futures contract? | | |
| | |
| | A futures contract is an agreement between the Fund and a counterparty made through a U.S. or foreign futures exchange to buy or sell an underlying instrument or asset at a specific price on a future date. | | |
| | | | |
| | What is a currency forward contract? | | |
| | |
| | | A currency forward contract is an agreement between the Fund and a counterparty to buy or sell a foreign currency in exchange for another currency at a specific exchange rate on a future date. Currency forward contracts are privately traded in the interbank market, not on a centralized exchange. | | |
| | | | |
| | What are swap agreements? | | |
| | |
| | Swap agreements, such as interest rate, fixed income total return, currency, inflation index and credit default swaps, are contracts between the Fund and another party (the swap counterparty). In a basic swap transaction, the Fund agrees with the swap counterparty to exchange the returns (or differentials in rates of return) earned or realized on a particular “notional amount” of underlying instruments. The notional amount is the set amount selected by the parties as the basis on which to calculate the obligations that they have agreed to exchange. The parties typically do not actually exchange the notional amount. Instead, they agree to exchange the returns that would be earned or realized if the notional amount were invested in given instruments or at given interest rates. | | |
| | | | |
| | What is the yield curve? | | |
| | |
| | A yield curve is a line that plots the yield to maturity of bonds having equal credit quality against their maturity dates. | | |
| | | | |
| | What is an option? | | |
| | |
| | An option is a contract to buy or sell a specific financial product known as the option’s underlying instrument at a specific price. The buyer of an option has the right, but not the obligation, to buy or sell the underlying instrument at or until a specified expiration date. Conversely, the seller (“writer”) of an option who opens a transaction is obligated to buy or sell the underlying instrument should the option holder exercise that right. | | |
Manager’s Discussion
From a perspective of excess returns over Treasuries of similar duration, U.S. corporate credit performed well. Other major fixed income sectors that delivered notable positive excess returns, as measured by Bloomberg Barclays indexes, includednon-agency residential mortgage-backed
securities (RMBS), emerging markets securities and commercial mortgage-backed securities (CMBS). In contrast, fixed-rate agency mortgage-backed securities (MBS) underperformed Treasuries.
During the period, the Fund’snon-U.S. dollar yield curve positioning and exposure to high-yield corporate credit were significant contributors to the Fund’s performance relative to its benchmark. The Fund’s exposure to foreign currency andnon-dollar developed securities also benefited results as did senior secured floating-rate loans, marketplace loans and sovereign developed securities. In contrast, the Fund’s U.S. yield curve positioning and exposure to MBS and TIPS detracted from relative returns. Collateralized loan obligations (CLOs) also detracted.
We maintained our largest sector allocation in MBS and increased our allocation over the period. We also added to TIPS, Treasury positions and RMBS while paring exposure across corporate credit sectors, inclusive of investment-grade and high-yield corporate credit, senior secured floating-rate loans and CLOs. We also reduced exposure to sovereign emerging markets securities and CMBS.
During the period, the portfolio utilized derivatives, including credit default and currency swaps, currency forwards, Treasury futures, and inflation index swaps, principally as a tool for efficient portfolio management and to manage overall portfolio risk. These derivative transactions may provide the same, or similar, net long or short exposure to select currencies, interest rates, countries, duration or credit risks in a less expensive way than by directly purchasing securities. In those markets wherenon-derivative securities are readily available, the cost difference in normal market conditions may be small.
| | | | |
| | | |
26 | | Annual Report | | franklintempleton.com |
FRANKLIN TOTAL RETURN FUND
Thank you for your continued participation in Franklin Total Return Fund. We look forward to serving your future investment needs.
| | |
| |
Sonal Desai, Ph.D. Co-Lead Portfolio Manager |
| | |

| | 
Tina Chou Co-Lead Portfolio Manager David Yuen, CFA, FRM Co-Lead Portfolio Manager Patrick Klein, Ph.D. Co-Lead Portfolio Manager |
Dividend Distributions*
11/1/18–10/31/19
| | | | | | | | | | | | | | | | | | | | |
| | | Dividend per Share (cents) | |
| Month | | Class A | | | Class C | | | Class R | | | Class R6 | | | Advisor
Class | |
| | | | | |
November | | | 2.1769 | | | | 1.8681 | | | | 1.9832 | | | | 2.4812 | | | | 2.3753 | |
| | | | | |
December | | | 2.8677 | | | | 2.5351 | | | | 2.6663 | | | | 3.1837 | | | | 3.0831 | |
| | | | | |
January | | | 2.7227 | | | | 2.3855 | | | | 2.5124 | | | | 3.0400 | | | | 2.9399 | |
| | | | | |
February | | | 2.5445 | | | | 2.2361 | | | | 2.3521 | | | | 2.8206 | | | | 2.7434 | |
| | | | | |
March | | | 2.2626 | | | | 1.9658 | | | | 2.0830 | | | | 2.5311 | | | | 2.4541 | |
| | | | | |
April | | | 2.8015 | | | | 2.4456 | | | | 2.5791 | | | | 3.1357 | | | | 3.0310 | |
| | | | | |
May | | | 2.8399 | | | | 2.4933 | | | | 2.6242 | | | | 3.1514 | | | | 3.0631 | |
| | | | | |
June | | | 2.5602 | | | | 2.2441 | | | | 2.3622 | | | | 2.8501 | | | | 2.7647 | |
| | | | | |
July | | | 2.4792 | | | | 2.1622 | | | | 2.2817 | | | | 2.7705 | | | | 2.6848 | |
| | | | | |
August | | | 2.4163 | | | | 2.0932 | | | | 2.2146 | | | | 2.7097 | | | | 2.6228 | |
| | | | | |
September | | | 2.7006 | | | | 2.3451 | | | | 2.4787 | | | | 3.0255 | | | | 2.9298 | |
| | | | | |
October | | | 2.6595 | | | | 2.2976 | | | | 2.4288 | | | | 3.0384 | | | | 2.8832 | |
| | | | | |
Total | | | 31.0316 | | | | 27.0717 | | | | 28.5663 | | | | 34.7379 | | | | 33.5752 | |
*The distribution amount is the sum of all net investment income distributions for the period shown. Assumes shares were purchased and held for the entire accrual period. Since dividends accrue daily, your actual distributions will vary depending on the date you purchased your shares and any account activity. All Fund distributions will vary depending upon current market conditions, and past distributions are not indicative of future trends.
The foregoing information reflects our analysis, opinions and portfolio holdings as of October 31, 2019, the end of the reporting period. The way we implement our main investment strategies and the resulting portfolio holdings may change depending on factors such as market and economic conditions. These opinions may not be relied upon as investment advice or an offer for a particular security. The information is not a complete analysis of every aspect of any market, country, industry, security or the Fund. Statements of fact are from sources considered reliable, but the investment manager makes no representation or warranty as to their completeness or accuracy. Although historical performance is no guarantee of future results, these insights may help you understand our investment management philosophy.
| | | | |
| | | |
| franklintempleton.com | | Annual Report | | 27 |
FRANKLIN TOTAL RETURN FUND
Performance Summary as of October 31, 2019
The performance tables and graphs do not reflect any taxes that a shareholder would pay on Fund dividends, capital gain distributions, if any, or any realized gains on the sale of Fund shares. Total return reflects reinvestment of the Fund’s dividends and capital gain distributions, if any, and any unrealized gains or losses. Your dividend income will vary depending on dividends or interest paid by securities in the Fund’s portfolio, adjusted for operating expenses of each class. Capital gain distributions are net profits realized from the sale of portfolio securities.
Performance as of 10/31/191
Cumulative total return excludes sales charges. Average annual total return includes maximum sales charges. Sales charges will vary depending on the size of the investment and the class of share purchased. The maximum is 3.75% and the minimum is 0%.Class A:3.75% maximum initial sales charge;Advisor Class:no sales charges. For other share classes, visitfranklintempleton.com.
| | | | |
| Share Class | | Cumulative Total Return2 | | Average Annual Total Return3 |
| | |
A4 | | | | |
| | |
1-Year | | +10.01% | | +5.92% |
| | |
5-Year | | +12.56% | | +1.61% |
| | |
10-Year | | +48.58% | | +3.64% |
| | |
Advisor | | | | |
| | |
1-Year | | +10.23% | | +10.23% |
| | |
5-Year | | +14.06% | | +2.67% |
| | |
10-Year | | +52.44% | | +4.31% |
| | | | | | |
| Share Class | | Distribution
Rate5 | | 30-Day Standardized Yield6 |
| | (with fee waiver) | | (without fee waiver) |
| | | |
A | | 3.10% | | 2.65% | | 2.56% |
| | | |
Advisor | | 3.47% | | 3.01% | | 2.93% |
Performance data represent past performance, which does not guarantee future results. Investment return and principal value will fluctuate, and you may have a gain or loss when you sell your shares. Current performance may differ from figures shown. For most recentmonth-end performance, go tofranklintempleton.comor call(800)342-5236.
See page 30 for Performance Summary footnotes.
| | | | |
| | | |
28 | | Annual Report | | franklintempleton.com |
FRANKLIN TOTAL RETURN FUND
PERFORMANCE SUMMARY
Total Return Index Comparison for a Hypothetical $10,000 Investment1
Total return represents the change in value of an investment over the periods shown. It includes any applicable maximum sales charge, Fund expenses, account fees and reinvested distributions. The unmanaged indexes include reinvestment of any income or distributions. They differ from the Fund in composition and do not pay management fees or expenses. One cannot invest directly in an index.
Class A(11/1/09–10/31/19)
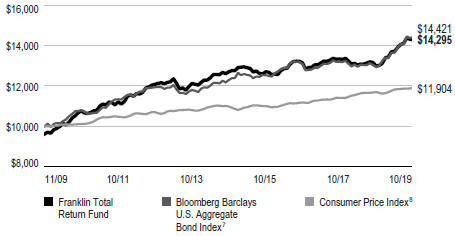
Advisor Class(11/1/09–10/31/19)
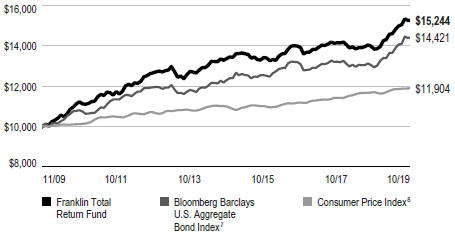
See page 30 for Performance Summary footnotes.
| | | | |
| | | |
| franklintempleton.com | | Annual Report | | 29 |
FRANKLIN TOTAL RETURN FUND
PERFORMANCE SUMMARY
Distributions(11/1/18–10/31/19)
| | |
| Share Class | | Net Investment
Income |
| |
A | | $0.310316 |
| |
C | | $0.270717 |
| |
R | | $0.285663 |
| |
R6 | | $0.347379 |
| |
Advisor | | $0.335752 |
Total Annual Operating Expenses9
| | | | | | | | | | |
| Share Class | | With Fee
Waiver | | | | | | Without Fee
Waiver |
| | | |
A | | | 0.88% | | | | | | | 0.92% |
| | | |
Advisor | | | 0.63% | | | | | | | 0.67% |
Each class of shares is available to certain eligible investors and has different annual fees and expenses, as described in the prospectus.
All investments involve risks, including possible loss of principal. Interest-rate movements and mortgage prepayments will affect the Fund’s share price and yield. Bond prices generally move in the opposite direction of interest rates. Thus, as prices of bonds in the Fund adjust to a rise in interest rates, the Fund’s share price may decline. Changes in the financial strength of a bond issuer or in a bond’s credit rating may affect its value. The risks associated with higher-yielding, lower-rated securities include higher risk of default and loss of principal. Investment in foreign securities also involves special risks, including currency fluctuations, and political and economic uncertainty. Derivatives, including currency management strategies, involve costs and can create economic leverage in the portfolio which may result in significant volatility and cause the Fund to participate in losses (as well as gains) on an amount that exceeds the Fund’s initial investment. The Fund may not achieve the anticipated benefits and may realize losses when a counterparty fails to perform as promised. The Fund is actively managed but there is no guarantee that the manager’s investment decisions will produce the desired results. The Fund’s prospectus also includes a description of the main investment risks.
1. The Fund has an expense reduction and a fee waiver associated with any investments it makes in a Franklin Templeton money fund and/or other Franklin Templeton fund, contractually guaranteed through 2/29/20. Fund investment results reflect the expense reduction and fee waiver; without these reductions, the results would have been lower.
2. Cumulative total return represents the change in value of an investment over the periods indicated.
3. Average annual total return represents the average annual change in value of an investment over the periods indicated. Return for less than one year, if any, has not been annualized.
4. Prior to 3/1/19, these shares were offered at a higher initial sales charge of 4.25%, thus actual returns (with sales charges) would have differed. Average annual total returns (with sales charges) have been restated to reflect the current maximum initial sales charge of 3.75%.
5. Distribution rate is based on an annualization of the sum of the respective class’s past month’s daily distributions and the maximum offering price (NAV for Advisor Class) per share on 10/31/19.
6. The Fund’s30-day standardized yield is calculated over a trailing30-day period using the yield to maturity on bonds and/or the dividends accrued on stocks. It may not equal the Fund’s actual income distribution rate, which reflects the Fund’s past dividends paid to shareholders.
7. Source: Morningstar. The Bloomberg Barclays U.S. Aggregate Bond Index is a market capitalization-weighted index representing the U.S. investment-grade, fixed-rate, taxable bond market with index components for government and corporate, mortgage pass through and asset-backed securities. All issues included are SEC registered, taxable, dollar denominated and nonconvertible, must have at least one year to final maturity and must be rated investment grade(Baa3/BBB-/BBB- or higher) using the middle rating of Moody’s, Standard & Poor’s and Fitch, respectively.
8. Source: Bureau of Labor Statistics, bls.gov/cpi. The Consumer Price Index (CPI) is a commonly used measure of the inflation rate.
9. Figures are as stated in the Fund’s current prospectus and may differ from the expense ratios disclosed in the Your Fund’s Expenses and Financial Highlights sections in this report. In periods of market volatility, assets may decline significantly, causing total annual Fund operating expenses to become higher than the figures shown.
See www.franklintempletondatasources.com for additional data provider information.
| | | | |
| | | |
30 | | Annual Report | | franklintempleton.com |
FRANKLIN TOTAL RETURN FUND
Your Fund’s Expenses
As a Fund shareholder, you can incur two types of costs: (1) transaction costs, including sales charges (loads) on Fund purchases and redemptions; and (2) ongoing Fund costs, including management fees, distribution and service(12b-1) fees, and other Fund expenses. All mutual funds have ongoing costs, sometimes referred to as operating expenses. The table below shows ongoing costs of investing in the Fund and can help you understand these costs and compare them with those of other mutual funds. The table assumes a $1,000 investment held for the six months indicated.
Actual Fund Expenses
The table below provides information about actual account values and actual expenses in the columns under the heading “Actual.” In these columns the Fund’s actual return, which includes the effect of Fund expenses, is used to calculate the “Ending Account Value” for each class of shares. You can estimate the expenses you paid during the period by following these steps (of course, your account value and expenses will differ from those in this illustration): Divide your account value by $1,000 (if your account had an $8,600 value, then $8,600÷ $1,000 = 8.6). Then multiply the result by the number in the row for your class of shares under the headings “Actual” and “Expenses Paid During Period” (if Actual Expenses Paid During Period were $7.50, then 8.6 x $7.50 = $64.50). In this illustration, the actual expenses paid this period are $64.50.
Hypothetical Example for Comparison with Other Funds
Under the heading “Hypothetical” in the table, information is provided about hypothetical account values and hypothetical expenses based on the Fund’s actual expense ratio and an assumed rate of return of 5% per year before expenses, which is not the Fund’s actual return. This information may not be used to estimate the actual ending account balance or expenses you paid for the period, but it can help you compare ongoing costs of investing in the Fund with those of other funds. To do so, compare this 5% hypothetical example for the class of shares you hold with the 5% hypothetical examples that appear in the shareholder reports of other funds.
Please note that expenses shown in the table are meant to highlight ongoing costs and do not reflect any transactional costs. Therefore, information under the heading “Hypothetical” is useful in comparing ongoing costs only, and will not help you compare total costs of owning different funds. In addition, if transactional costs were included, your total costs would have been higher.
| | | | | | | | | | | | |
| | | | | Actual
(actual return after expenses) | | Hypothetical
(5% annual return before expenses) | | |
Share Class | | Beginning
Account
Value 5/1/19 | | Ending
Account
Value 10/31/19 | | Expenses Paid During
Period 5/1/19–10/31/191, 2 | | Ending
Account
Value 10/31/19 | | Expenses Paid During Period 5/1/19–10/31/191, 2 | | Net
Annualized
Expense
Ratio2 |
| | | | | | |
A | | $1,000 | | $1,043.30 | | $4.43 | | $1,020.87 | | $4.38 | | 0.86% |
C | | $1,000 | | $1,041.40 | | $6.48 | | $1,018.85 | | $6.41 | | 1.26% |
R | | $1,000 | | $1,042.10 | | $5.71 | | $1,019.61 | | $5.65 | | 1.11% |
R6 | | $1,000 | | $1,044.90 | | $2.53 | | $1,022.74 | | $2.50 | | 0.49% |
Advisor | | $1,000 | | $1,044.40 | | $3.14 | | $1,022.13 | | $3.11 | | 0.61% |
1. Expenses are equal to the annualized expense ratio for thesix-month period as indicated above—in the far right column—multiplied by the simple average account value over the period indicated, and then multiplied by 184/365 to reflect theone-half year period.
2. Reflects expenses after fee waivers and expense reimbursements. Does not include acquired fund fees and expenses.
| | | | |
| | | |
| franklintempleton.com | | Annual Report | | 31 |
FRANKLIN INVESTORS SECURITIES TRUST
Financial Highlights
Franklin Adjustable U.S. Government Securities Fund
| | | | | | | | | | | | | | | | | | | | |
| | | Year Ended October 31, | |
| | | | | |
| | | 2019 | | | 2018 | | | 2017 | | | 2016 | | | 2015 | |
| | | | | |
Class A | | | | | | | | | | | | | | | | | | | | |
| | | | | |
Per share operating performance | | | | | | | | | | | | | | | | | | | | |
(for a share outstanding throughout the year) | | | | | | | | | | | | | | | | | | | | |
| | | | | |
Net asset value, beginning of year | | | $ 8.10 | | | | $ 8.24 | | | | $ 8.40 | | | | $ 8.55 | | | | $ 8.67 | |
| | | | | |
Income from investment operationsa: | | | | | | | | | | | | | | | | | | | | |
| | | | | |
Net investment income | | | 0.140 | b | | | 0.088 | b | | | 0.026 | | | | 0.025 | | | | 0.019 | |
| | | | | |
Net realized and unrealized gains (losses) | | | 0.021 | | | | (0.035 | ) | | | (0.031 | ) | | | (0.053 | ) | | | (0.040 | ) |
| | | | | |
Total from investment operations | | | 0.161 | | | | 0.053 | | | | (0.005 | ) | | | (0.028 | ) | | | (0.021 | ) |
| | | | | |
Less distributions from: | | | | | | | | | | | | | | | | | | | | |
| | | | | |
Net investment income | | | (0.241 | ) | | | (0.193 | ) | | | (0.155 | ) | | | (0.122 | ) | | | (0.099 | ) |
| | | | | |
Net asset value, end of year | | | $ 8.02 | | | | $ 8.10 | | | | $ 8.24 | | | | $ 8.40 | | | | $ 8.55 | |
| | | | | |
Total returnc | | | 2.01% | | | | 0.65% | | | | (0.06)% | | | | (0.32)% | | | | (0.24)% | |
| | | | | |
Ratios to average net assets | | | | | | | | | | | | | | | | | | | | |
| | | | | |
Expenses before waiver and payments by affiliates | | | 0.95% | | | | 0.96% | | | | 0.95% | | | | 0.92% | | | | 0.91% | |
| | | | | |
Expenses net of waiver and payments by affiliatesd | | | 0.94% | | | | 0.95% | | | | 0.94% | | | | 0.91% | | | | 0.91% | e |
| | | | | |
Net investment income | | | 1.73% | | | | 1.07% | | | | 0.54% | | | | 0.43% | | | | 0.39% | |
| | | | | |
Supplemental data | | | | | | | | | | | | | | | | | | | | |
| | | | | |
Net assets, end of year (000’s) | | $ | 393,736 | | | $ | 419,055 | | | $ | 492,319 | | | $ | 667,671 | | | $ | 848,918 | |
| | | | | |
Portfolio turnover rate | | | 12.72% | | | | 11.39% | | | | 2.81% | | | | 11.49% | | | | 9.98% | |
aThe amount shown for a share outstanding throughout the period may not correlate with the Statement of Operations for the period due to the timing of sales and repurchases of the Fund’s shares in relation to income earned and/or fluctuating fair value of the investments of the Fund.
bBased on average daily shares outstanding.
cTotal return does not reflect sales commissions or contingent deferred sales charges, if applicable.
dBenefit of expense reduction rounds to less than 0.01%.
eBenefit of waiver and payments by affiliates rounds to less than 0.01%.
| | | | |
| | | |
32 | | Annual Report | The accompanying notes are an integral part of these financial statements. | | franklintempleton.com |
FRANKLIN INVESTORS SECURITIES TRUST
FINANCIAL HIGHLIGHTS
Franklin Adjustable U.S. Government Securities Fund(continued)
| | | | | | | | | | | | | | | | | | | | |
| | | Year Ended October 31, | |
| | | | | |
| | | 2019 | | | 2018 | | | 2017 | | | 2016 | | | 2015 | |
| | | | | |
Class A1 | | | | | | | | | | | | | | | | | | | | |
| | | | | |
Per share operating performance | | | | | | | | | | | | | | | | | | | | |
(for a share outstanding throughout the year) | | | | | | | | | | | | | | | | | | | | |
| | | | | |
Net asset value, beginning of year | | | $ 8.09 | | | | $ 8.24 | | | | $ 8.40 | | | | $ 8.54 | | | | $ 8.67 | |
| | | | | |
Income from investment operationsa: | | | | | | | | | | | | | | | | | | | | |
| | | | | |
Net investment income | | | 0.151 | b | | | 0.100 | b | | | 0.059 | | | | 0.049 | | | | 0.046 | |
| | | | | |
Net realized and unrealized gains (losses) | | | 0.031 | | | | (0.044 | ) | | | (0.051 | ) | | | (0.054 | ) | | | (0.062 | ) |
| | | | | |
Total from investment operations | | | 0.182 | | | | 0.056 | | | | 0.008 | | | | (0.005 | ) | | | (0.016 | ) |
| | | | | |
Less distributions from: | | | | | | | | | | | | | | | | | | | | |
| | | | | |
Net investment income | | | (0.252 | ) | | | (0.206 | ) | | | (0.168 | ) | | | (0.135 | ) | | | (0.114 | ) |
| | | | | |
Net asset value, end of year | | | $ 8.02 | | | | $ 8.09 | | | | $ 8.24 | | | | $ 8.40 | | | | $ 8.54 | |
| | | | | |
Total returnc | | | 2.29% | | | | 0.68% | | | | 0.10% | | | | (0.05)% | | | | (0.19)% | |
| | | | | |
Ratios to average net assets | | | | | | | | | | | | | | | | | | | | |
| | | | | |
Expenses before waiver and payments by affiliates | | | 0.80% | | | | 0.80% | | | | 0.79% | | | | 0.77% | | | | 0.75% | |
| | | | | |
Expenses net of waiver and payments by affiliatesd | | | 0.79% | | | | 0.79% | | | | 0.78% | | | | 0.76% | | | | 0.75% | e |
| | | | | |
Net investment income | | | 1.88% | | | | 1.23% | | | | 0.70% | | | | 0.58% | | | | 0.55% | |
| | | | | |
Supplemental data | | | | | | | | | | | | | | | | | | | | |
| | | | | |
Net assets, end of year (000’s) | | | $86,471 | | | | $100,477 | | | | $121,012 | | | | $160,469 | | | | $198,670 | |
| | | | | |
Portfolio turnover rate | | | 12.72% | | | | 11.39% | | | | 2.81% | | | | 11.49% | | | | 9.98% | |
aThe amount shown for a share outstanding throughout the period may not correlate with the Statement of Operations for the period due to the timing of sales and repurchases of the Fund’s shares in relation to income earned and/or fluctuating fair value of the investments of the Fund.
bBased on average daily shares outstanding.
cTotal return does not reflect sales commissions or contingent deferred sales charges, if applicable.
dBenefit of expense reduction rounds to less than 0.01%.
eBenefit of waiver and payments by affiliates rounds to less than 0.01%.
| | | | |
| | | |
| franklintempleton.com | | The accompanying notes are an integral part of these financial statements. | Annual Report | | 33 |
FRANKLIN INVESTORS SECURITIES TRUST
FINANCIAL HIGHLIGHTS
Franklin Adjustable U.S. Government Securities Fund(continued)
| | | | | | | | | | | | | | | | | | | | |
| | | Year Ended October 31, | |
| | | | | |
| | | 2019 | | | 2018 | | | 2017 | | | 2016 | | | 2015 | |
| | | | | |
Class C | | | | | | | | | | | | | | | | | | | | |
| | | | | |
Per share operating performance | | | | | | | | | | | | | | | | | | | | |
(for a share outstanding throughout the year) | | | | | | | | | | | | | | | | | | | | |
| | | | | |
Net asset value, beginning of year | | | $ 8.09 | | | | $ 8.24 | | | | $ 8.40 | | | | $ 8.54 | | | | $ 8.66 | |
| | | | | |
Income from investment operationsa: | | | | | | | | | | | | | | | | | | | | |
| | | | | |
Net investment income (loss) | | | 0.106 | b | | | 0.054 | b | | | (0.014 | ) | | | (0.011 | ) | | | (0.013 | ) |
| | | | | |
Net realized and unrealized gains (losses) | | | 0.032 | | | | (0.044 | ) | | | (0.024 | ) | | | (0.041 | ) | | | (0.043 | ) |
| | | | | |
Total from investment operations | | | 0.138 | | | | 0.010 | | | | (0.038 | ) | | | (0.052 | ) | | | (0.056 | ) |
| | | | | |
Less distributions from: | | | | | | | | | | | | | | | | | | | | |
| | | | | |
Net investment income | | | (0.208 | ) | | | (0.160 | ) | | | (0.122 | ) | | | (0.088 | ) | | | (0.064 | ) |
| | | | | |
Net asset value, end of year | | | $ 8.02 | | | | $ 8.09 | | | | $ 8.24 | | | | $ 8.40 | | | | $ 8.54 | |
| | | | | |
Total returnc | | | 1.73% | | | | 0.13% | | | | (0.45)% | | | | (0.61)% | | | | (0.65)% | |
| | | | | |
Ratios to average net assets | | | | | | | | | | | | | | | | | | | | |
| | | | | |
Expenses before waiver and payments by affiliates | | | 1.35% | | | | 1.36% | | | | 1.35% | | | | 1.32% | | | | 1.31% | |
| | | | | |
Expenses net of waiver and payments by affiliatesd | | | 1.34% | | | | 1.35% | | | | 1.34% | | | | 1.31% | | | | 1.31% | e |
| | | | | |
Net investment income (loss) | | | 1.33% | | | | 0.67% | | | | 0.14% | | | | 0.03% | | | | (0.01)% | |
| | | | | |
Supplemental data | | | | | | | | | | | | | | | | | | | | |
| | | | | |
Net assets, end of year (000’s) | | | $84,685 | | | | $126,585 | | | | $189,634 | | | | $266,186 | | | | $336,254 | |
| | | | | |
Portfolio turnover rate | | | 12.72% | | | | 11.39% | | | | 2.81% | | | | 11.49% | | | | 9.98% | |
aThe amount shown for a share outstanding throughout the period may not correlate with the Statement of Operations for the period due to the timing of sales and repurchases of the Fund’s shares in relation to income earned and/or fluctuating fair value of the investments of the Fund.
bBased on average daily shares outstanding.
cTotal return does not reflect sales commissions or contingent deferred sales charges, if applicable.
dBenefit of expense reduction rounds to less than 0.01%.
eBenefit of waiver and payments by affiliates rounds to less than 0.01%.
| | | | |
| | | |
34 | | Annual Report | The accompanying notes are an integral part of these financial statements. | | franklintempleton.com |
FRANKLIN INVESTORS SECURITIES TRUST
FINANCIAL HIGHLIGHTS
Franklin Adjustable U.S. Government Securities Fund(continued)
| | | | | | | | | | | | | | | | | | | | |
| | | Year Ended October 31, | |
| | | | | |
| | | 2019 | | | 2018 | | | 2017 | | | 2016 | | | 2015 | |
| | | | | |
Class R6 | | | | | | | | | | | | | | | | | | | | |
| | | | | |
Per share operating performance | | | | | | | | | | | | | | | | | | | | |
(for a share outstanding throughout the year) | | | | | | | | | | | | | | | | | | | | |
| | | | | |
Net asset value, beginning of year | | | $ 8.11 | | | | $ 8.25 | | | | $ 8.41 | | | | $ 8.55 | | | | $ 8.68 | |
| | | | | |
Income from investment operationsa: | | | | | | | | | | | | | | | | | | | | |
| | | | | |
Net investment income | | | 0.169 | b | | | 0.121 | b | | | 0.074 | | | | 0.066 | | | | 0.013 | |
| | | | | |
Net realized and unrealized gains (losses) | | | 0.021 | | | | (0.037 | ) | | | (0.046 | ) | | | (0.053 | ) | | | (0.010 | ) |
| | | | | |
Total from investment operations | | | 0.190 | | | | 0.084 | | | | 0.028 | | | | 0.013 | | | | 0.003 | |
| | | | | |
Less distributions from: | | | | | | | | | | | | | | | | | | | | |
| | | | | |
Net investment income | | | (0.270 | ) | | | (0.224 | ) | | | (0.188 | ) | | | (0.153 | ) | | | (0.133 | ) |
| | | | | |
Net asset value, end of year | | | $ 8.03 | | | | $ 8.11 | | | | $ 8.25 | | | | $ 8.41 | | | | $ 8.55 | |
| | | | | |
Total return | | | 2.39% | | | | 1.03% | | | | 0.34% | | | | 0.15% | | | | 0.03% | |
| | | | | |
Ratios to average net assets | | | | | | | | | | | | | | | | | | | | |
| | | | | |
Expenses before waiver and payments by affiliates | | | 0.62% | | | | 0.62% | | | | 0.58% | | | | 0.56% | | | | 0.53% | |
| | | | | |
Expenses net of waiver and payments by affiliatesc | | | 0.58% | | | | 0.57% | | | | 0.55% | | | | 0.55% | | | | 0.53% | d |
| | | | | |
Net investment income | | | 2.09% | | | | 1.45% | | | | 0.93% | | | | 0.79% | | | | 0.77% | |
| | | | | |
Supplemental data | | | | | | | | | | | | | | | | | | | | |
| | | | | |
Net assets, end of year (000’s) | | | $31,953 | | | | $36,026 | | | | $2,196 | | | | $2,374 | | | | $2,176 | |
| | | | | |
Portfolio turnover rate | | | 12.72% | | | | 11.39% | | | | 2.81% | | | | 11.49% | | | | 9.98% | |
aThe amount shown for a share outstanding throughout the period may not correlate with the Statement of Operations for the period due to the timing of sales and repurchases of the Fund’s shares in relation to income earned and/or fluctuating fair value of the investments of the Fund.
bBased on average daily shares outstanding.
cBenefit of expense reduction rounds to less than 0.01%.
dBenefit of waiver and payments by affiliates rounds to less than 0.01%.
| | | | |
| | | |
| franklintempleton.com | | The accompanying notes are an integral part of these financial statements. | Annual Report | | 35 |
FRANKLIN INVESTORS SECURITIES TRUST
FINANCIAL HIGHLIGHTS
Franklin Adjustable U.S. Government Securities Fund(continued)
| | | | | | | | | | | | | | | | | | | | |
| | | Year Ended October 31, | |
| | | | | |
| | | 2019 | | | 2018 | | | 2017 | | | 2016 | | | 2015 | |
| | | | | |
Advisor Class | | | | | | | | | | | | | | | | | | | | |
| | | | | |
Per share operating performance | | | | | | | | | | | | | | | | | | | | |
(for a share outstanding throughout the year) | | | | | | | | | | | | | | | | | | | | |
| | | | | |
Net asset value, beginning of year | | | $ 8.10 | | | | $ 8.25 | | | | $ 8.41 | | | | $ 8.55 | | | | $ 8.68 | |
| | | | | |
Income from investment operationsa: | | | | | | | | | | | | | | | | | | | | |
| | | | | |
Net investment income | | | 0.160 | b | | | 0.108 | b | | | 0.052 | | | | 0.046 | | | | 0.040 | |
| | | | | |
Net realized and unrealized gains (losses) | | | 0.031 | | | | (0.044 | ) | | | (0.036 | ) | | | (0.043 | ) | | | (0.049 | ) |
| | | | | |
Total from investment operations | | | 0.191 | | | | 0.064 | | | | 0.016 | | | | 0.003 | | | | (0.009 | ) |
| | | | | |
Less distributions from: | | | | | | | | | | | | | | | | | | | | |
| | | | | |
Net investment income | | | (0.261 | ) | | | (0.214 | ) | | | (0.176 | ) | | | (0.143 | ) | | | (0.121 | ) |
| | | | | |
Net asset value, end of year | | | $ 8.03 | | | | $ 8.10 | | | | $ 8.25 | | | | $ 8.41 | | | | $ 8.55 | |
| | | | | |
Total return | | | 2.39% | | | | 0.78% | | | | 0.20% | | | | 0.05% | | | | (0.11)% | |
| | | | | |
Ratios to average net assets | | | | | | | | | | | | | | | | | | | | |
| | | | | |
Expenses before waiver and payments by affiliates | | | 0.70% | | | | 0.71% | | | | 0.70% | | | | 0.67% | | | | 0.66% | |
| | | | | |
Expenses net of waiver and payments by affiliatesc | | | 0.69% | | | | 0.70% | | | | 0.69% | | | | 0.66% | | | | 0.66% | d |
| | | | | |
Net investment income | | | 1.98% | | | | 1.32% | | | | 0.79% | | | | 0.68% | | | | 0.64% | |
| | | | | |
Supplemental data | | | | | | | | | | | | | | | | | | | | |
| | | | | |
Net assets, end of year (000’s) | | | $103,639 | | | | $112,441 | | | | $184,299 | | | | $227,599 | | | | $308,683 | |
| | | | | |
Portfolio turnover rate | | | 12.72% | | | | 11.39% | | | | 2.81% | | | | 11.49% | | | | 9.98% | |
aThe amount shown for a share outstanding throughout the period may not correlate with the Statement of Operations for the period due to the timing of sales and repurchases of the Fund’s shares in relation to income earned and/or fluctuating fair value of the investments of the Fund.
bBased on average daily shares outstanding.
cBenefit of expense reduction rounds to less than 0.01%.
dBenefit of waiver and payments by affiliates rounds to less than 0.01%.
| | | | |
| | | |
36 | | Annual Report | The accompanying notes are an integral part of these financial statements. | | franklintempleton.com |
FRANKLIN INVESTORS SECURITIES TRUST
Statement of Investments, October 31, 2019
Franklin Adjustable U.S. Government Securities Fund
| | | | | | | | |
| | | Principal
Amount | | | Value | |
| | |
Mortgage-Backed Securities 93.0% | | | | | | | | |
aFederal Home Loan Mortgage Corp. (FHLMC) Adjustable Rate 18.1% | | | | | | | | |
FHLMC, 2.704%,(12-month USD LIBOR +/- MBS Margin), 5/01/45 | | $ | 10,785,185 | | | $ | 11,017,504 | |
FHLMC, 3.751%,(12-month USD LIBOR +/- MBS Margin), 9/01/35 | | | 4,885,547 | | | | 5,064,366 | |
FHLMC, 3.949% - 4.085%,(6-month USD LIBOR +/- MBS Margin), 4/01/36 - 1/01/37 | | | 1,244,365 | | | | 1,290,606 | |
FHLMC, 3.833% - 4.481%,(12-month USD LIBOR +/- MBS Margin), 11/01/35 - 11/01/41 | | | 6,595,610 | | | | 6,926,719 | |
FHLMC, 4.56%,(12-month USD LIBOR +/- MBS Margin), 11/01/37 | | | 2,680,286 | | | | 2,827,230 | |
FHLMC, 4.483% - 4.561%,(12-month USD LIBOR +/- MBS Margin), 2/01/36 - 10/01/38 | | | 6,576,541 | | | | 6,901,607 | |
FHLMC, 4.634%,(12-month USD LIBOR +/- MBS Margin), 9/01/37 | | | 14,761,197 | | | | 15,384,168 | |
FHLMC, 4.635%, (US 1 Year CMTT-Note +/- MBS Margin), 3/01/35 | | | 3,209,037 | | | | 3,396,974 | |
FHLMC, 4.58% - 4.636%,(12-month USD LIBOR +/- MBS Margin), 6/01/35 - 5/01/37 | | | 6,431,221 | | | | 6,717,946 | |
FHLMC, 4.536% - 4.663%, (US 1 Year CMTT-Note +/- MBS Margin), 8/01/33 - 6/01/37 | | | 6,358,910 | | | | 6,729,083 | |
FHLMC, 4.65% - 4.699%,(12-month USD LIBOR +/- MBS Margin), 6/01/35 - 12/01/37 | | | 5,847,036 | | | | 6,160,438 | |
FHLMC, 4.673% - 4.746%, (US 1 Year CMTT-Note +/- MBS Margin), 9/01/35 - 11/01/36 | | | 6,462,068 | | | | 6,818,039 | |
FHLMC, 4.756%,(12-month USD LIBOR +/- MBS Margin), 10/01/41 | | | 2,781,423 | | | | 2,933,682 | |
FHLMC, 4.757%,(12-month USD LIBOR +/- MBS Margin), 7/01/35 | | | 6,232,780 | | | | 6,579,356 | |
FHLMC, 4.70% - 4.772%,(12-month USD LIBOR +/- MBS Margin), 1/01/36 - 5/01/40 | | | 6,213,998 | | | | 6,535,764 | |
FHLMC, 4.798%,(12-month USD LIBOR +/- MBS Margin), 12/01/35 | | | 2,645,625 | | | | 2,781,882 | |
FHLMC, 4.817%,(12-month USD LIBOR +/- MBS Margin), 11/01/40 | | | 3,365,167 | | | | 3,558,984 | |
FHLMC, 4.782% - 4.822%,(12-month USD LIBOR +/- MBS Margin), 8/01/34 - 4/01/40 | | | 6,196,810 | | | | 6,540,187 | |
FHLMC, 4.886%,(12-month USD LIBOR +/- MBS Margin), 6/01/37 | | | 5,912,581 | | | | 6,266,952 | |
FHLMC, 4.858% - 4.966%,(12-month USD LIBOR +/- MBS Margin), 12/01/34 - 3/01/37 | | | 3,665,305 | | | | 3,866,974 | |
FHLMC, 4.983%,(12-month USD LIBOR +/- MBS Margin), 1/01/37 | | | 2,887,174 | | | | 3,091,661 | |
FHLMC, 4.774% - 5.909%, (US 1 Year CMTT-Note +/- MBS Margin), 4/01/34 - 7/01/36 | | | 5,001,710 | | | | 5,357,234 | |
| | | | | | | | |
| | |
| | | | | | | 126,747,356 | |
| | | | | | | | |
aFederal National Mortgage Association (FNMA) Adjustable Rate 70.5% | | | | | | | | |
FNMA, 2.329%,(12-month USD LIBOR +/- MBS Margin), 4/01/45 | | | 4,772,529 | | | | 4,908,003 | |
FNMA, 2.475%,(12-month USD LIBOR +/- MBS Margin), 3/01/46 | | | 6,969,714 | | | | 7,164,450 | |
FNMA, 2.375% - 2.941%, (11th District COF +/- MBS Margin), 4/01/20 - 11/01/40 | | | 5,910,949 | | | | 5,864,511 | |
FNMA, 3.434%, (11th District COF +/- MBS Margin), 4/01/34 | | | 15,759,961 | | | | 16,046,965 | |
FNMA, 3.613%,(12-month USD LIBOR +/- MBS Margin), 11/01/34 | | | 3,517,940 | | | | 3,669,650 | |
FNMA, 3.201% - 3.628%,(12-month USD LIBOR +/- MBS Margin), 8/01/33 - 11/01/38 | | | 6,213,036 | | | | 6,433,271 | |
FNMA, 2.723% - 3.704%,(6-month USD LIBOR +/- MBS Margin), 6/01/21 - 3/01/38 | | | 6,594,954 | | | | 6,779,698 | |
FNMA, 3.63% - 3.773%,(12-month USD LIBOR +/- MBS Margin), 3/01/33 - 11/01/39 | | | 5,196,126 | | | | 5,413,730 | |
FNMA, 3.712% - 3.789%,(6-month USD LIBOR +/- MBS Margin), 3/01/32 - 1/01/37 | | | 5,624,379 | | | | 5,819,568 | |
FNMA, 2.74% - 3.805%,(1-month USD LIBOR +/- MBS Margin), 10/01/26 - 10/01/34 | | | 359,954 | | | | 364,701 | |
FNMA, 3.789% - 3.857%,(6-month USD LIBOR +/- MBS Margin), 9/01/24 - 6/01/37 | | | 5,023,624 | | | | 5,198,962 | |
FNMA, 3.778% - 3.881%,(12-month USD LIBOR +/- MBS Margin), 7/01/33 - 10/01/40 | | | 5,572,218 | | | | 5,805,677 | |
FNMA, 3.861% - 3.912%,(6-month USD LIBOR +/- MBS Margin), 9/01/23 - 7/01/37 | | | 6,487,807 | | | | 6,733,792 | |
FNMA, 3.881% - 3.992%,(12-month USD LIBOR +/- MBS Margin), 9/01/32 - 11/01/42 | | | 6,461,160 | | | | 6,706,553 | |
FNMA, 4.023%,(12-month USD LIBOR +/- MBS Margin), 3/01/37 | | | 3,121,913 | | | | 3,266,673 | |
FNMA, 3.994% - 4.025%,(12-month USD LIBOR +/- MBS Margin), 6/01/33 - 9/01/40 | | | 5,934,162 | | | | 6,191,811 | |
FNMA, 4.044%,(6-month USD LIBOR +/- MBS Margin), 12/01/34 | | | 3,418,547 | | | | 3,534,602 | |
FNMA, 4.044%,(12-month USD LIBOR +/- MBS Margin), 8/01/40 | | | 2,830,829 | | | | 2,973,998 | |
FNMA, 3.35% - 4.061%, (US 1 Year CMTT-Note +/- MBS Margin), 1/01/21 - 11/01/44 | | | 6,705,859 | | | | 6,907,987 | |
FNMA, 4.025% - 4.075%,(12-month USD LIBOR +/- MBS Margin), 11/01/32 - 5/01/39 | | | 5,558,997 | | | | 5,797,780 | |
FNMA, 4.088%,(12-month USD LIBOR +/- MBS Margin), 2/01/36 | | | 4,949,856 | | | | 5,153,639 | |
FNMA, 4.095%,(12-month USD LIBOR +/- MBS Margin), 2/01/36 | | | 3,048,195 | | | | 3,199,414 | |
| | | | |
| | | |
| franklintempleton.com | | Annual Report | | 37 |
FRANKLIN INVESTORS SECURITIES TRUST
STATEMENT OF INVESTMENTS
Franklin Adjustable U.S. Government Securities Fund(continued)
| | | | | | | | |
| | | Principal
Amount | | | Value | |
| | |
Mortgage-Backed Securities(continued) | | | | | | | | |
aFederal National Mortgage Association (FNMA) Adjustable Rate(continued) | | | | | | | | |
FNMA, 4.079% - 4.13%,(12-month USD LIBOR +/- MBS Margin), 8/01/33 - 6/01/38 | | $ | 6,580,646 | | | $ | 6,892,896 | |
FNMA, 3.913% - 4.172%,(6-month USD LIBOR +/- MBS Margin), 9/01/23 - 8/01/37 | | | 6,738,868 | | | | 6,983,538 | |
FNMA, 4.13% - 4.189%,(12-month USD LIBOR +/- MBS Margin), 12/01/32 - 9/01/40 | | | 4,945,268 | | | | 5,189,740 | |
FNMA, 4.189% - 4.21%,(12-month USD LIBOR +/- MBS Margin), 9/01/32 - 8/01/38 | | | 4,822,115 | | | | 5,038,650 | |
FNMA, 4.213% - 4.23%,(12-month USD LIBOR +/- MBS Margin), 7/01/34 - 10/01/38 | | | 6,491,766 | | | | 6,784,135 | |
FNMA, 4.23% - 4.259%,(12-month USD LIBOR +/- MBS Margin), 7/01/33 - 12/01/40 | | | 6,059,205 | | | | 6,363,246 | |
FNMA, 4.264%,(12-month USD LIBOR +/- MBS Margin), 5/01/39 | | | 4,896,220 | | | | 5,093,100 | |
FNMA, 4.27%,(12-month USD LIBOR +/- MBS Margin), 11/01/42 | | | 9,100,870 | | | | 9,541,517 | |
FNMA, 4.259% - 4.286%,(12-month USD LIBOR +/- MBS Margin), 10/01/33 - 2/01/43 | | | 6,482,921 | | | | 6,813,112 | |
FNMA, 4.318%,(12-month USD LIBOR +/- MBS Margin), 11/01/34 | | | 4,327,456 | | | | 4,542,260 | |
FNMA, 4.286% - 4.325%,(12-month USD LIBOR +/- MBS Margin), 5/01/33 - 8/01/40 | | | 6,712,085 | | | | 6,994,406 | |
FNMA, 4.096% - 4.34%, (US 1 Year CMTT-Note +/- MBS Margin), 11/01/20 - 7/01/38 | | | 6,613,038 | | | | 6,911,821 | |
FNMA, 4.346%,(12-month USD LIBOR +/- MBS Margin), 2/01/36 | | | 3,160,023 | | | | 3,308,733 | |
FNMA, 4.326% - 4.354%,(12-month USD LIBOR +/- MBS Margin), 3/01/33 - 8/01/40 | | | 6,112,464 | | | | 6,402,050 | |
FNMA, 4.354%,(12-month USD LIBOR +/- MBS Margin), 10/01/38 | | | 3,289,528 | | | | 3,458,763 | |
FNMA, 4.355% - 4.377%,(12-month USD LIBOR +/- MBS Margin), 6/01/33 - 12/01/43 | | | 6,433,828 | | | | 6,740,990 | |
FNMA, 4.378% - 4.383%,(12-month USD LIBOR +/- MBS Margin), 6/01/34 - 7/01/42 | | | 6,413,351 | | | | 6,716,816 | |
FNMA, 4.383% - 4.391%,(12-month USD LIBOR +/- MBS Margin), 2/01/35 - 3/01/40 | | | 6,389,670 | | | | 6,721,033 | |
FNMA, 4.401%,(12-month USD LIBOR +/- MBS Margin), 4/01/40 | | | 8,146,226 | | | | 8,565,108 | |
FNMA, 4.407%,(12-month USD LIBOR +/- MBS Margin), 1/01/36 | | | 2,990,452 | | | | 3,154,440 | |
FNMA, 4.395% - 4.426%,(12-month USD LIBOR +/- MBS Margin), 5/01/33 - 1/01/42 | | | 6,582,154 | | | | 6,892,998 | |
FNMA, 4.434%,(12-month USD LIBOR +/- MBS Margin), 7/01/40 | | | 2,921,993 | | | | 3,084,155 | |
FNMA, 4.435%,(12-month USD LIBOR +/- MBS Margin), 3/01/35 | | | 5,907,156 | | | | 6,198,584 | |
FNMA, 4.441%,(12-month USD LIBOR +/- MBS Margin), 5/01/38 | | | 3,591,034 | | | | 3,770,360 | |
FNMA, 4.427% - 4.445%,(12-month USD LIBOR +/- MBS Margin), 5/01/33 - 7/01/38 | | | 6,261,178 | | | | 6,570,175 | |
FNMA, 4.457%,(12-month USD LIBOR +/- MBS Margin), 1/01/36 | | | 3,390,825 | | | | 3,549,892 | |
FNMA, 4.447% - 4.475%,(12-month USD LIBOR +/- MBS Margin), 5/01/33 - 3/01/42 | | | 6,241,442 | | | | 6,528,043 | |
FNMA, 4.493%,(12-month USD LIBOR +/- MBS Margin), 10/01/38 | | | 6,490,325 | | | | 6,791,350 | |
FNMA, 4.502%,(12-month USD LIBOR +/- MBS Margin), 9/01/42 | | | 6,395,600 | | | | 6,704,833 | |
FNMA, 4.476% - 4.503%,(12-month USD LIBOR +/- MBS Margin), 12/01/32 - 4/01/40 | | | 6,399,780 | | | | 6,726,296 | |
FNMA, 4.343% - 4.515%, (US 1 Year CMTT-Note +/- MBS Margin), 4/01/22 - 7/01/40 | | | 6,645,600 | | | | 6,960,170 | |
FNMA, 4.504% - 4.525%,(12-month USD LIBOR +/- MBS Margin), 4/01/33 - 1/01/42 | | | 6,320,281 | | | | 6,634,600 | |
FNMA, 4.534%,(12-month USD LIBOR +/- MBS Margin), 2/01/42 | | | 2,791,832 | | | | 2,940,888 | |
FNMA, 4.549%,(12-month USD LIBOR +/- MBS Margin), 1/01/37 | | | 3,816,726 | | | | 4,029,493 | |
FNMA, 4.551%, (US 1 Year CMTT-Note +/- MBS Margin), 5/01/36 | | | 12,743,306 | | | | 13,494,507 | |
FNMA, 4.564%,(12-month USD LIBOR +/- MBS Margin), 2/01/43 | | | 7,518,614 | | | | 7,857,974 | |
FNMA, 4.526% - 4.572%,(12-month USD LIBOR +/- MBS Margin), 11/01/32 - 2/01/39 | | | 6,323,600 | | | | 6,644,070 | |
FNMA, 4.581%, (US 1 Year CMTT-Note +/- MBS Margin), 6/01/36 | | | 2,999,714 | | | | 3,169,035 | |
FNMA, 4.573% - 4.595%,(12-month USD LIBOR +/- MBS Margin), 12/01/32 - 12/01/39 | | | 5,230,528 | | | | 5,481,996 | |
FNMA, 4.595%,(12-month USD LIBOR +/- MBS Margin), 1/01/39 | | | 4,512,936 | | | | 4,726,051 | |
FNMA, 4.516% - 4.599%, (US 1 Year CMTT-Note +/- MBS Margin), 7/01/22 - 12/01/40 | | | 6,553,591 | | | | 6,874,167 | |
FNMA, 4.596% - 4.609%,(12-month USD LIBOR +/- MBS Margin), 11/01/32 - 11/01/42 | | | 6,553,699 | | | | 6,887,139 | |
FNMA, 4.615%,(12-month USD LIBOR +/- MBS Margin), 7/01/42 | | | 7,476,946 | | | | 7,851,598 | |
FNMA, 4.62%,(12-month USD LIBOR +/- MBS Margin), 8/01/35 | | | 2,622,079 | | | | 2,759,415 | |
FNMA, 4.638%, (US 1 Year CMTT-Note +/- MBS Margin), 1/01/38 | | | 3,536,841 | | | | 3,737,155 | |
FNMA, 4.641%,(12-month USD LIBOR +/- MBS Margin), 3/01/41 | | | 3,979,496 | | | | 4,197,820 | |
| | | | |
| | | |
38 | | Annual Report | | franklintempleton.com |
FRANKLIN INVESTORS SECURITIES TRUST
STATEMENT OF INVESTMENTS
Franklin Adjustable U.S. Government Securities Fund(continued)
| | | | | | | | |
| | | Principal Amount | | | Value | |
| | |
Mortgage-Backed Securities(continued) | | | | | | | | |
aFederal National Mortgage Association (FNMA) Adjustable Rate(continued) | | | | | | | | |
FNMA, 4.609% - 4.643%,(12-month USD LIBOR +/- MBS Margin), 4/01/33 - 5/01/48 | | $ | 6,607,594 | | | $ | 6,926,400 | |
FNMA, 4.648% - 4.669%,(12-month USD LIBOR +/- MBS Margin), 4/01/32 - 6/01/38 | | | 6,512,700 | | | | 6,807,524 | |
FNMA, 4.693%,(12-month USD LIBOR +/- MBS Margin), 6/01/35 | | | 2,848,885 | | | | 3,003,436 | |
FNMA, 4.601% - 4.703%, (US 1 Year CMTT-Note +/- MBS Margin), 4/01/22 - 9/01/39 | | | 6,564,932 | | | | 6,892,982 | |
FNMA, 4.669% - 4.71%,(12-month USD LIBOR +/- MBS Margin), 2/01/33 - 5/01/40 | | | 6,651,585 | | | | 6,980,080 | |
FNMA, 4.71% - 4.732%,(12-month USD LIBOR +/- MBS Margin), 1/01/33 - 2/01/37 | | | 6,118,638 | | | | 6,420,064 | |
FNMA, 4.741%,(12-month USD LIBOR +/- MBS Margin), 5/01/40 | | | 2,633,807 | | | | 2,783,574 | |
FNMA, 3.478% - 4.746%, (US 5 Year CMTT-Note +/- MBS Margin), 5/01/26 - 2/01/30 | | | 102,355 | | | | 107,973 | |
FNMA, 4.80%,(12-month USD LIBOR +/- MBS Margin), 5/01/40 | | | 7,411,664 | | | | 7,808,735 | |
FNMA, 4.732% - 4.803%,(12-month USD LIBOR +/- MBS Margin), 3/01/32 - 4/01/44 | | | 6,548,689 | | | | 6,871,322 | |
FNMA, 4.704% - 4.81%, (US 1 Year CMTT-Note +/- MBS Margin), 1/01/21 - 5/01/38 | | | 6,618,046 | | | | 6,928,172 | |
FNMA, 4.903%,(12-month USD LIBOR +/- MBS Margin), 1/01/36 | | | 2,906,714 | | | | 3,065,574 | |
FNMA, 4.807% - 4.91%,(12-month USD LIBOR +/- MBS Margin), 2/01/32 - 4/01/41 | | | 6,482,575 | | | | 6,832,136 | |
FNMA, 4.913% - 4.987%,(12-month USD LIBOR +/- MBS Margin), 7/01/33 - 3/01/47 | | | 6,595,428 | | | | 6,952,507 | |
FNMA, 3.25% - 5.027%, (US 3 Year CMTT-Note +/- MBS Margin), 6/01/21 - 1/01/35 | | | 570,000 | | | | 587,565 | |
FNMA, 4.81% - 5.085%, (US 1 Year CMTT-Note +/- MBS Margin), 10/01/22 - 1/01/40 | | | 6,688,667 | | | | 6,951,106 | |
FNMA, 5.033% - 5.516%,(12-month USD LIBOR +/- MBS Margin), 1/01/35 - 4/01/38 | | | 2,165,844 | | | | 2,275,125 | |
FNMA, 4.175% - 5.727%,(6-month USD LIBOR +/- MBS Margin), 11/01/23 - 6/01/38 | | | 4,239,052 | | | | 4,410,396 | |
FNMA, 5.124% - 6.81%, (US 1 Year CMTT-Note +/- MBS Margin), 12/01/23 - 10/01/36 | | | 1,611,612 | | | | 1,676,624 | |
FNMA, 2.99% - 6.989%, (11th District COF +/- MBS Margin), 2/01/20 - 11/01/36 | | | 2,044,631 | | | | 2,073,419 | |
FNMA, 4.381% - 7.67%,(6-month UST-Bill +/- MBS Margin), 12/01/21 - 11/01/34 | | | 165,988 | | | | 169,058 | |
| | | | | | | | |
| | |
| | | | | | | 493,738,325 | |
| | | | | | | | |
| | |
Federal National Mortgage Association (FNMA) Fixed Rate 4.3% | | | | | | | | |
FNMA 15 Year, 2.50%, 11/01/34 | | | 30,000,000 | | | | 30,334,663 | |
| | | | | | | | |
| | |
aGovernment National Mortgage Association (GNMA) Adjustable Rate 0.1% | | | | | | | | |
GNMA, 3.25% - 4.125%, (US 1 Year CMTT-Note +/- MBS Margin), 9/20/33 - 5/20/36 | | | 764,550 | | | | 779,717 | |
| | | | | | | | |
| | |
Total Mortgage-Backed Securities (Cost $651,910,074) | | | | | | | 651,600,061 | |
| | | | | | | | |
| | |
| | | Shares | | | | |
| | |
Short Term Investments 6.4% | | | | | | | | |
| | |
Money Market Funds (Cost $35,052,748) 5.0% | | | | | | | | |
b,cInstitutional Fiduciary Trust Money Market Portfolio, 1.56% | | | 35,052,748 | | | | 35,052,748 | |
| | | | | | | | |
| | | | |
| | | |
| franklintempleton.com | | Annual Report | | 39 |
FRANKLIN INVESTORS SECURITIES TRUST
STATEMENT OF INVESTMENTS
Franklin Adjustable U.S. Government Securities Fund(continued)
| | | | | | | | |
| | | Principal
Amount | | | Value | |
| | |
Short Term Investments(continued) | | | | | | | | |
Repurchase Agreements (Cost $9,446,232) 1.4% | | | | | | | | |
dJoint Repurchase Agreement, 1.722%, 11/01/19 (Maturity Value $9,446,684)
BNP Paribas Securities Corp. (Maturity Value $6,687,024)
Deutsche Bank Securities Inc. (Maturity Value $1,645,140)
HSBC Securities (USA) Inc. (Maturity Value $1,114,520)
Collateralized by U.S. Government Agency Securities, 5.00%, 10/20/48;eU.S. Treasury Bills, 12/03/19 - 12/10/19; and U.S. Treasury Notes, 1.625% - 1.875%, 3/15/20 - 4/30/22 (valued at $ 9,635,332) | | | 9,446,232 | | | $ | 9,446,232 | |
| | | | | | | | |
| | |
Total Investments (Cost $696,409,054) 99.4% | | | | | | | 696,099,041 | |
Other Assets, less Liabilities 0.6% | | | | | | | 4,384,915 | |
| | | | | | | | |
| | |
Net Assets 100.0% | | | | | | $ | 700,483,956 | |
| | | | | | | | |
��
See Abbreviations on page 165.
aAdjustable Rate Mortgage-Backed Security (ARM); the rate shown is the effective rate at period end. ARM rates are not based on a published reference rate and spread, but instead pass-through weighted average interest income inclusive of any caps or floors, if applicable, from the underlying mortgage loans in which the majority of mortgages pay interest based on the index shown at their designated reset dates plus a spread, less the applicable servicing and guaranty fee (MBS margin).
bSee Note 3(f) regarding investments in affiliated management investment companies.
cThe rate shown is the annualizedseven-day effective yield at period end.
dSee Note 1(c) regarding joint repurchase agreement.
eThe security was issued on a discount basis with no stated coupon rate.
| | | | |
| | | |
40 | | Annual Report | The accompanying notes are an integral part of these financial statements. | | franklintempleton.com |
FRANKLIN INVESTORS SECURITIES TRUST
Financial Highlights
Franklin Floating Rate Daily Access Fund
| | | | | | | | | | | | | | | | | | | | |
| | | Year Ended October 31, | |
| | | | | |
| | | 2019 | | | 2018 | | | 2017 | | | 2016 | | | 2015 | |
| | | | | |
Class A | | | | | | | | | | | | | | | | | | | | |
| | | | | |
Per share operating performance | | | | | | | | | | | | | | | | | | | | |
(for a share outstanding throughout the year) | | | | | | | | | | | | | | | | | | | | |
| | | | | |
Net asset value, beginning of year | | | $ 8.70 | | | | $ 8.83 | | | | $ 8.84 | | | | $ 8.61 | | | | $ 9.04 | |
| | | | | |
Income from investment operationsa: | | | | | | | | | | | | | | | | | | | | |
| | | | | |
Net investment income | | | 0.441 | b | | | 0.396 | | | | 0.307 | | | | 0.401 | | | | 0.406 | |
| | | | | |
Net realized and unrealized gains (losses) | | | (0.515 | ) | | | (0.129 | ) | | | (0.011 | ) | | | 0.228 | | | | (0.434 | ) |
| | | | | |
Total from investment operations | | | (0.074 | ) | | | 0.267 | | | | 0.296 | | | | 0.629 | | | | (0.028 | ) |
| | | | | |
Less distributions from: | | | | | | | | | | | | | | | | | | | | |
| | | | | |
Net investment income | | | (0.446 | ) | | | (0.397 | ) | | | (0.306 | ) | | | (0.399 | ) | | | (0.402 | ) |
| | | | | |
Net asset value, end of year | | | $ 8.18 | | | | $ 8.70 | | | | $ 8.83 | | | | $ 8.84 | | | | $ 8.61 | |
| | | | | |
Total returnc | | | (0.88)% | | | | 2.97% | | | | 3.51% | | | | 7.60% | | | | (0.37)% | |
| | | | | |
Ratios to average net assets | | | | | | | | | | | | | | | | | | | | |
| | | | | |
Expenses before waiver and payments by affiliates | | | 0.89% | | | | 0.87% | | | | 0.87% | | | | 0.88% | | | | 0.85% | |
| | | | | |
Expenses net of waiver and payments by affiliatesd | | | 0.86% | | | | 0.81% | | | | 0.82% | | | | 0.86% | | | | 0.84% | |
| | | | | |
Net investment income | | | 5.21% | | | | 4.53% | | | | 3.45% | | | | 4.72% | | | | 4.55% | |
| | | | | |
Supplemental data | | | | | | | | | | | | | | | | | | | | |
| | | | | |
Net assets, end of year (000’s) | | | $1,049,359 | | | | $1,344,473 | | | | $1,362,220 | | | | $1,359,862 | | | | $1,553,100 | |
| | | | | |
Portfolio turnover rate | | | 23.23% | e | | | 58.07% | | | | 64.21% | | | | 34.10% | | | | 46.72% | |
aThe amount shown for a share outstanding throughout the period may not correlate with the Statement of Operations for the period due to the timing of sales and repurchases of the Fund’s shares in relation to income earned and/or fluctuating fair value of the investments of the Fund.
bBased on average daily shares outstanding.
cTotal return does not reflect sales commissions or contingent deferred sales charges, if applicable.
dBenefit of expense reduction rounds to less than 0.01%.
eExcludes the value of portfolio activity as a result ofin-kind transactions. See Note 6.
| | | | |
| | | |
| franklintempleton.com | | The accompanying notes are an integral part of these financial statements. | Annual Report | | 41 |
FRANKLIN INVESTORS SECURITIES TRUST
FINANCIAL HIGHLIGHTS
Franklin Floating Rate Daily Access Fund(continued)
| | | | | | | | | | | | | | | | | | | | |
| | | Year Ended October 31, | |
| | | | | |
| | | 2019 | | | 2018 | | | 2017 | | | 2016 | | | 2015 | |
| | | | | |
Class C | | | | | | | | | | | | | | | | | | | | |
| | | | | |
Per share operating performance | | | | | | | | | | | | | | | | | | | | |
(for a share outstanding throughout the year) | | | | | | | | | | | | | | | | | | | | |
| | | | | |
Net asset value, beginning of year | | | $ 8.70 | | | | $ 8.83 | | | | $ 8.84 | | | | $ 8.61 | | | | $ 9.05 | |
| | | | | |
Income from investment operationsa: | | | | | | | | | | | | | | | | | | | | |
| | | | | |
Net investment income | | | 0.407 | b | | | 0.364 | | | | 0.271 | | | | 0.366 | | | | 0.369 | |
| | | | | |
Net realized and unrealized gains (losses) | | | (0.514 | ) | | | (0.131 | ) | | | (0.010 | ) | | | 0.229 | | | | (0.443 | ) |
| | | | | |
Total from investment operations | | | (0.107 | ) | | | 0.233 | | | | 0.261 | | | | 0.595 | | | | (0.074 | ) |
| | | | | |
Less distributions from: | | | | | | | | | | | | | | | | | | | | |
| | | | | |
Net investment income | | | (0.413 | ) | | | (0.363 | ) | | | (0.271 | ) | | | (0.365 | ) | | | (0.366 | ) |
| | | | | |
Net asset value, end of year | | | $ 8.18 | | | | $ 8.70 | | | | $ 8.83 | | | | $ 8.84 | | | | $ 8.61 | |
| | | | | |
Total returnc | | | (1.39)% | | | | 2.68% | | | | 3.11% | | | | 7.18% | | | | (0.87)% | |
| | | | | |
Ratios to average net assets | | | | | | | | | | | | | | | | | | | | |
| | | | | |
Expenses before waiver and payments by affiliates | | | 1.29% | | | | 1.27% | | | | 1.27% | | | | 1.28% | | | | 1.25% | |
| | | | | |
Expenses net of waiver and payments by affiliatesd | | | 1.26% | | | | 1.21% | | | | 1.22% | | | | 1.26% | | | | 1.24% | |
| | | | | |
Net investment income | | | 4.81% | | | | 4.13% | | | | 3.05% | | | | 4.32% | | | | 4.15% | |
| | | | | |
Supplemental data | | | | | | | | | | | | | | | | | | | | |
| | | | | |
Net assets, end of year (000’s) | | | $296,134 | | | | $438,480 | | | | $550,797 | | | | $551,726 | | | | $627,805 | |
| | | | | |
Portfolio turnover rate | | | 23.23% | e | | | 58.07% | | | | 64.21% | | | | 34.10% | | | | 46.72% | |
aThe amount shown for a share outstanding throughout the period may not correlate with the Statement of Operations for the period due to the timing of sales and repurchases of the Fund’s shares in relation to income earned and/or fluctuating fair value of the investments of the Fund.
bBased on average daily shares outstanding.
cTotal return does not reflect sales commissions or contingent deferred sales charges, if applicable.
dBenefit of expense reduction rounds to less than 0.01%.
eExcludes the value of portfolio activity as a result ofin-kind transactions. See Note 6.
| | | | |
| | | |
42 | | Annual Report | The accompanying notes are an integral part of these financial statements. | | franklintempleton.com |
FRANKLIN INVESTORS SECURITIES TRUST
FINANCIAL HIGHLIGHTS
Franklin Floating Rate Daily Access Fund(continued)
| | | | | | | | | | | | | | | | | | | | |
| | | Year Ended October 31, | |
| | | | | |
| | | 2019 | | | 2018 | | | 2017 | | | 2016 | | | 2015 | |
| | | | | |
Class R6 | | | | | | | | | | | | | | | | | | | | |
| | | | | |
Per share operating performance | | | | | | | | | | | | | | | | | | | | |
(for a share outstanding throughout the year) | | | | | | | | | | | | | | | | | | | | |
| | | | | |
Net asset value, beginning of year | | | $ 8.71 | | | | $ 8.84 | | | | $ 8.84 | | | | $ 8.60 | | | | $ 9.05 | |
| | | | | |
Income from investment operationsa: | | | | | | | | | | | | | | | | | | | | |
| | | | | |
Net investment income | | | 0.463 | b | | | 0.427 | | | | 0.338 | | | | 0.422 | | | | 0.437 | |
| | | | | |
Net realized and unrealized gains (losses) | | | (0.508 | ) | | | (0.130 | ) | | | (0.002 | ) | | | 0.245 | | | | (0.457 | ) |
| | | | | |
Total from investment operations | | | (0.045 | ) | | | 0.297 | | | | 0.336 | | | | 0.667 | | | | (0.020 | ) |
| | | | | |
Less distributions from: | | | | | | | | | | | | | | | | | | | | |
| | | | | |
Net investment income | | | (0.475 | ) | | | (0.427 | ) | | | (0.336 | ) | | | (0.427 | ) | | | (0.430 | ) |
| | | | | |
Net asset value, end of year | | | $ 8.19 | | | | $ 8.71 | | | | $ 8.84 | | | | $ 8.84 | | | | $ 8.60 | |
| | | | | |
Total return | | | (0.54)% | | | | 3.43% | | | | 3.85% | | | | 7.96% | | | | (0.16)% | |
| | | | | |
Ratios to average net assets | | | | | | | | | | | | | | | | | | | | |
| | | | | |
Expenses before waiver and payments by affiliates | | | 0.57% | | | | 0.55% | | | | 0.52% | | | | 0.53% | | | | 0.72% | |
| | | | | |
Expenses net of waiver and payments by affiliatesc | | | 0.53% | | | | 0.48% | | | | 0.47% | | | | 0.51% | | | | 0.51% | |
| | | | | |
Net investment income | | | 5.54% | | | | 4.86% | | | | 3.80% | | | | 5.07% | | | | 4.88% | |
| | | | | |
Supplemental data | | | | | | | | | | | | | | | | | | | | |
| | | | | |
Net assets, end of year (000’s) | | | $18,764 | | | | $142,075 | | | | $130,180 | | | | $12,333 | | | | $7 | |
| | | | | |
Portfolio turnover rate | | | 23.23% | d | | | 58.07% | | | | 64.21% | | | | 34.10% | | | | 46.72% | |
aThe amount shown for a share outstanding throughout the period may not correlate with the Statement of Operations for the period due to the timing of sales and repurchases of the Fund’s shares in relation to income earned and/or fluctuating fair value of the investments of the Fund.
bBased on average daily shares outstanding.
cBenefit of expense reduction rounds to less than 0.01%.
dExcludes the value of portfolio activity as a result ofin-kind transactions. See Note 6.
| | | | |
| | | |
| franklintempleton.com | | The accompanying notes are an integral part of these financial statements. | Annual Report | | 43 |
FRANKLIN INVESTORS SECURITIES TRUST
FINANCIAL HIGHLIGHTS
Franklin Floating Rate Daily Access Fund(continued)
| | | | | | | | | | | | | | | | | | | | |
| | | Year Ended October 31, | |
| | | | | |
| | | 2019 | | | 2018 | | | 2017 | | | 2016 | | | 2015 | |
| | | | | |
Advisor Class | | | | | | | | | | | | | | | | | | | | |
| | | | | |
Per share operating performance | | | | | | | | | | | | | | | | | | | | |
(for a share outstanding throughout the year) | | | | | | | | | | | | | | | | | | | | |
| | | | | |
Net asset value, beginning of year | | | $ 8.71 | | | | $ 8.84 | | | | $ 8.85 | | | | $ 8.61 | | | | $ 9.05 | |
| | | | | |
Income from investment operationsa: | | | | | | | | | | | | | | | | | | | | |
| | | | | |
Net investment income | | | 0.463 | b | | | 0.418 | | | | 0.327 | | | | 0.422 | | | | 0.427 | |
| | | | | |
Net realized and unrealized gains (losses) | | | (0.525 | ) | | | (0.129 | ) | | | (0.010 | ) | | | 0.239 | | | | (0.443 | ) |
| | | | | |
Total from investment operations | | | (0.062 | ) | | | 0.289 | | | | 0.317 | | | | 0.661 | | | | (0.016 | ) |
| | | | | |
Less distributions from: | | | | | | | | | | | | | | | | | | | | |
| | | | | |
Net investment income | | | (0.468 | ) | | | (0.419 | ) | | | (0.327 | ) | | | (0.421 | ) | | | (0.424 | ) |
| | | | | |
Net asset value, end of year | | | $ 8.18 | | | | $ 8.71 | | | | $ 8.84 | | | | $ 8.85 | | | | $ 8.61 | |
| | | | | |
Total return | | | (0.74)% | | | | 3.35% | | | | 3.64% | | | | 8.00% | | | | (0.23)% | |
| | | | | |
Ratios to average net assets | | | | | | | | | | | | | | | | | | | | |
| | | | | |
Expenses before waiver and payments by affiliates | | | 0.64% | | | | 0.62% | | | | 0.62% | | | | 0.63% | | | | 0.60% | |
| | | | | |
Expenses net of waiver and payments by affiliatesc | | | 0.61% | | | | 0.56% | | | | 0.57% | | | | 0.61% | | | | 0.59% | |
| | | | | |
Net investment income | | | 5.46% | | | | 4.78% | | | | 3.70% | | | | 4.97% | | | | 4.80% | |
| | | | | |
Supplemental data | | | | | | | | | | | | | | | | | | | | |
| | | | | |
Net assets, end of year (000’s) | | | $858,071 | | | | $1,743,880 | | | | $1,672,724 | | | | $1,108,692 | | | | $1,405,281 | |
| | | | | |
Portfolio turnover rate | | | 23.23% | d | | | 58.07% | | | | 64.21% | | | | 34.10% | | | | 46.72% | |
aThe amount shown for a share outstanding throughout the period may not correlate with the Statement of Operations for the period due to the timing of sales and repurchases of the Fund’s shares in relation to income earned and/or fluctuating fair value of the investments of the Fund.
bBased on average daily shares outstanding.
cBenefit of expense reduction rounds to less than 0.01%.
dExcludes the value of portfolio activity as a result ofin-kind transactions. See Note 6.
| | | | |
| | | |
44 | | Annual Report | The accompanying notes are an integral part of these financial statements. | | franklintempleton.com |
FRANKLIN INVESTORS SECURITIES TRUST
Statement of Investments, October 31, 2019
Franklin Floating Rate Daily Access Fund
| | | | | | | | | | | | |
| | | Country | | | Shares | | | Value | |
| | | |
Common Stocks 1.2% | | | | | | | | | | | | |
Diversified Support Services 0.1% | | | | | | | | | | | | |
a,b,cRemington Outdoor Co. Inc. | | | United States | | | | 1,808,932 | | | $ | 1,808,932 | |
| | | | | | | | | | | | |
Forest Products 0.7% | | | | | | | | | | | | |
a,b,c,dAppvion Operations Inc. | | | United States | | | | 1,219,956 | | | | 16,265,063 | |
| | | | | | | | | | | | |
Oil & Gas Exploration & Production 0.4% | | | | | | | | | | | | |
aSamson Resources II LLC | | | United States | | | | 432,778 | | | | 9,304,727 | |
| | | | | | | | | | | | |
| | | |
Total Common Stocks (Cost $87,820,268) | | | | | | | | | | | 27,378,722 | |
| | | | | | | | | | | | |
| | | |
Management Investment Companies (Cost $67,471,246) 2.6% | | | | | | | | | | | | |
Other Diversified Financial Services 2.6% | | | | | | | | | | | | |
eFranklin Floating Rate Income Fund | | | United States | | | | 6,837,495 | | | | 56,546,081 | |
| | | | | | | | | | | | |
| | | |
| | | | | | Principal
Amount* | | | | |
| | | |
Corporate Bonds (Cost $18,556,766) 0.9% | | | | | | | | | | | | |
Industrial Machinery 0.9% | | | | | | | | | | | | |
fOnsite Rental Group Operations Pty. Ltd., secured note, PIK, 6.10%, 10/26/23 | | | Australia | | | $ | 21,096,262 | | | | 19,514,042 | |
| | | | | | | | | | | | |
g,hSenior Floating Rate Interests 81.8% | | | | | | | | | | | | |
Aerospace & Defense 1.7% | | | | | | | | | | | | |
Delos Finance S.A.R.L. (AerCap), New Loans, 3.854%,(3-month USD LIBOR + 1.75%), 10/06/23 | | | Luxembourg | | | | 12,359,015 | | | | 12,409,996 | |
Doncasters U.S. Finance LLC, | | | | | | | | | | | | |
Second-Lien Term Loans, 10.354%,(3-month USD LIBOR + 8.25%), 10/09/20 | | | United States | | | | 8,951,314 | | | | 2,416,855 | |
Term B Loans, 5.604%,(3-month USD LIBOR + 3.50%), 4/09/20 | | | United States | | | | 26,917,631 | | | | 18,976,930 | |
Flying Fortress Holdings LLC (ILFC), New Loan, 3.854%,(3-month USD LIBOR + 1.75%), 10/30/22 | | | United States | | | | 4,696,029 | | | | 4,715,400 | |
| | | | | | | | | | | | |
| | | |
| | | | | | | | | | | 38,519,181 | |
| | | | | | | | | | | | |
| | | |
Air Freight & Logistics 0.5% | | | | | | | | | | | | |
XPO Logistics Inc., Refinanced Term Loan, 3.786%,(1-month USD LIBOR + 2.00%), 2/24/25 | | | United States | | | | 10,200,000 | | | | 10,230,457 | |
| | | | | | | | | | | | |
Airlines 2.4% | | | | | | | | | | | | |
Air Canada, Term Loan, 3.805%,(1-month USD LIBOR + 2.00%), 10/06/23 | | | Canada | | | | 15,893,103 | | | | 15,972,569 | |
Allegiant Travel Co., Class B Term Loans, 6.709%,(3-month USD LIBOR + 4.50%), 2/05/24 | | | United States | | | | 17,711,000 | | | | 17,777,416 | |
American Airlines Inc., 2018 Replacement Term Loans, 3.554%,(1-month USD LIBOR + 1.75%), 6/27/25 | | | United States | | | | 10,600,000 | | | | 10,498,420 | |
i,jKestrel Bidco Inc & WestJet, Term Loan B, TBD, 8/08/26 | | | Canada | | | | 8,175,918 | | | | 8,225,554 | |
| | | | | | | | | | | | |
| | | |
| | | | | | | | | | | 52,473,959 | |
| | | | | | | | | | | | |
| | | |
Apparel Retail 0.8% | | | | | | | | | | | | |
Ascena Retail Group Inc., Tranche B Term Loan, 6.313%,(1-month USD LIBOR + 4.50%), 8/21/22 | | | United States | | | | 31,598,193 | | | | 17,471,178 | |
| | | | | | | | | | | | |
Auto Parts & Equipment 2.7% | | | | | | | | | | | | |
Adient US LLC, | | | | | | | | | | | | |
Initial Term Loans, 6.459%,(3-month USD LIBOR + 4.25%), 5/06/24 | | | United States | | | | 3,546,698 | | | | 3,471,331 | |
Initial Term Loans, 6.889%,(6-month USD LIBOR + 4.25%), 5/06/24 | | | United States | | | | 10,604,629 | | | | 10,379,281 | |
| | | | |
| | | |
| franklintempleton.com | | Annual Report | | 45 |
FRANKLIN INVESTORS SECURITIES TRUST
STATEMENT OF INVESTMENTS
Franklin Floating Rate Daily Access Fund(continued)
| | | | | | | | | | | | |
| | | Country | | | Principal
Amount* | | | Value | |
| | | |
g,hSenior Floating Rate Interests(continued) | | | | | | | | | | | | |
Auto Parts & Equipment(continued) | | | | | | | | | | | | |
American Axle & Manufacturing, Inc., | | | | | | | | | | | | |
Tranche B Term Loan, 4.08%,(1-month USD LIBOR + 2.25%), 4/06/24 | | | United States | | | $ | 2,554,029 | | | $ | 2,442,290 | |
Tranche B Term Loan, 4.19%,(3-month USD LIBOR + 2.25%), 4/06/24 | | | United States | | | | 634,996 | | | | 607,215 | |
Panther BF Aggregator 2 LP, Initial Dollar Term Loan, 5.30%,(1-month USD LIBOR + 3.50%), 4/30/26 | | | United States | | | | 16,901,359 | | | | 16,689,889 | |
TI Group Automotive Systems LLC, Initial US Term Loan, 4.286%,(1-month USD LIBOR + 2.50%), 6/30/22 | | | United States | | | | 27,566,480 | | | | 27,389,889 | |
| | | | | | | | | | | | |
| | | |
| | | | | | | | | | | 60,979,895 | |
| | | | | | | | | | | | |
| | | |
Automobile Manufacturers 0.6% | | | | | | | | | | | | |
Thor Industries Inc., Initial USD Term Loans, 5.813%,(1-month USD LIBOR + 3.75%), 2/01/26 | | | United States | | | | 14,313,553 | | | | 13,982,552 | |
| | | | | | | | | | | | |
| | | |
Automotive Retail 0.2% | | | | | | | | | | | | |
Wand NewCo. 3 Inc. (Caliber Collision), Initial Term Loan, 5.286%,(1-month USD LIBOR + 3.50%), 2/05/26 | | | United States | | | | 3,491,250 | | | | 3,509,143 | |
| | | | | | | | | | | | |
| | | |
Broadcasting 5.2% | | | | | | | | | | | | |
Diamond Sports Group LLC, Term Loan, 5.08%,(1-month USD LIBOR + 3.25%), 8/24/26 | | | United States | | | | 20,949,399 | | | | 21,077,714 | |
Gray Television Inc., | | | | | | | | | | | | |
TermB-2 Loan, 4.261%,(1-month USD LIBOR + 2.25%), 2/07/24 | | | United States | | | | 26,687,491 | | | | 26,745,883 | |
Term C Loan, 4.511%,(1-month USD LIBOR + 2.50%), 1/02/26 | | | United States | | | | 5,718,602 | | | | 5,741,390 | |
Mission Broadcasting Inc., TermB-3 Loan, 4.282%,(1-month USD LIBOR + 2.25%), 1/17/24 | | | United States | | | | 2,061,034 | | | | 2,065,414 | |
Nexstar Broadcasting Inc., | | | | | | | | | | | | |
TermA-4 Loan, 3.532%,(1-month USD LIBOR + 1.50%), 10/26/23 | | | United States | | | | 12,721,352 | | | | 12,647,186 | |
TermB-3 Loan, 4.05%,(1-month USD LIBOR + 2.25%), 10/26/25 | | | United States | | | | 10,372,313 | | | | 10,394,354 | |
TermB-4 Loan, 4.554%,(1-month USD LIBOR + 2.75%), 9/19/26 | | | United States | | | | 1,665,034 | | | | 1,674,192 | |
Sinclair Television Group Inc., Tranche B Term Loans, 4.04%,(1-month USD LIBOR + 2.25%), 1/03/24 | | | United States | | | | 35,709,733 | | | | 35,720,875 | |
WXXA-TV LLC andWLAJ-TV LLC, TermA-4 Loan, 3.532%,(1-month USD LIBOR + 1.50%), 10/26/23 | | | United States | | | | 352,088 | | | | 350,036 | |
| | | | | | | | | | | | |
| | | |
| | | | | | | | | | | 116,417,044 | |
| | | | | | | | | | | | |
| | | |
Building Products 0.8% | | | | | | | | | | | | |
Resideo Funding Inc., | | | | | | | | | | | | |
Tranche A Term Loan, 4.11%,(3-month USD LIBOR + 2.00%), 10/25/23 | | | United States | | | | 16,747,500 | | | | 16,757,548 | |
Tranche B Term Loan, 4.11%,(3-month USD LIBOR + 2.00%), 10/25/25 | | | United States | | | | 1,706,668 | | | | 1,703,113 | |
| | | | | | | | | | | | |
| | | |
| | | | | | | | | | | 18,460,661 | |
| | | | | | | | | | | | |
| | | |
Cable & Satellite 2.0% | | | | | | | | | | | | |
Charter Communications Operating LLC (CCO Safari), TermB-2 Loan, 3.58%,(1-month USD LIBOR + 1.75%), 2/01/27 | | | United States | | | | 2,418,657 | | | | 2,431,054 | |
CSC Holdings LLC, March 2017 Incremental Term Loans, 4.171%,(1-month USD LIBOR + 2.25%), 7/17/25 | | | United States | | | | 41,516,177 | | | | 41,373,444 | |
| | | | | | | | | | | | |
| | | |
| | | | | | | | | | | 43,804,498 | |
| | | | | | | | | | | | |
| | | | |
| | | |
46 | | Annual Report | | franklintempleton.com |
FRANKLIN INVESTORS SECURITIES TRUST
STATEMENT OF INVESTMENTS
Franklin Floating Rate Daily Access Fund(continued)
| | | | | | | | | | | | |
| | | Country | | | Principal
Amount* | | | Value | |
| | | |
g,hSenior Floating Rate Interests (continued) | | | | | | | | | | | | |
Casinos & Gaming 3.3% | | | | | | | | | | | | |
Aristocrat Technologies Inc., TermB-3 Loans, 3.716%,(3-month USD LIBOR + 1.75%), 10/19/24 | | | United States | | | $ | 7,641,152 | | | $ | 7,668,614 | |
Boyd Gaming Corp., | | | | | | | | | | | | |
Refinancing Term B Loans, 3.96%,(1-week USD LIBOR + 2.25%), 9/15/23 | | | United States | | | | 13,169,841 | | | | 13,207,467 | |
Term A Loans, 3.96%,(1-week USD LIBOR + 2.25%), 9/15/21 | | | United States | | | | 4,223,263 | | | | 4,216,223 | |
Caesars Resort Collection LLC, Term B Loans, 4.536%,(1-month USD LIBOR + 2.75%), 12/22/24 | | | United States | | | | 18,992,525 | | | | 18,738,804 | |
Eldorado Resorts Inc., Initial Term Loan, 4.125% - 4.313%,(1-month USD LIBOR + 2.25%), 4/17/24 | | | United States | | | | 14,546,158 | | | | 14,543,002 | |
Kingpin Intermediate Holdings LLC, Amendment No. 2 Term Loans, 5.29%,(1-month USD LIBOR + 3.50%), 7/03/24 | | | United States | | | | 2,744,280 | | | | 2,747,688 | |
Station Casinos LLC, Term B Facility Loans, 4.29%,(1-month USD LIBOR + 2.50%), 6/08/23 | | | United States | | | | 11,511,534 | | | | 11,539,162 | |
| | | | | | | | | | | | |
| | | |
| | | | | | | | | | | 72,660,960 | |
| | | | | | | | | | | | |
| | | |
Coal & Consumable Fuels 1.9% | | | | | | | | | | | | |
Wolverine Fuels Holding LLC, | | | | | | | | | | | | |
First Lien Initial Term Loan, 7.874%,(3-month USD LIBOR + 5.75%), 8/14/20 | | | United States | | | | 29,981,854 | | | | 29,332,237 | |
Second Lien Initial Term Loan, 12.874%,(3-month USD LIBOR + 10.75%), 2/16/21 | | | United States | | | | 13,774,236 | | | | 13,028,127 | |
| | | | | | | | | | | | |
| | | |
| | | | | | | | | | | 42,360,364 | |
| | | | | | | | | | | | |
| | | |
Commodity Chemicals 0.7% | | | | | | | | | | | | |
Ineos U.S. Finance LLC, 2024 Dollar Term Loan, 3.786%,(1-month USD LIBOR + 2.00%), 3/31/24 | | | United States | | | | 6,942,313 | | | | 6,878,534 | |
iUnivar USA Inc., TermB-3 Loans, 4.036%,(1-month USD LIBOR + 2.25%), 7/01/24 | | | United States | | | | 9,448,371 | | | | 9,507,423 | |
| | | | | | | | | | | | |
| | | |
| | | | | | | | | | | 16,385,957 | |
| | | | | | | | | | | | |
| | | |
Communications Equipment 1.0% | | | | | | | | | | | | |
Ciena Corp., 2018 Term Loan, 3.846%,(1-month USD LIBOR + 2.00%), 9/28/25 | | | United States | | | | 9,191,483 | | | | 9,244,618 | |
CommScope Inc., Initial Term Loans, 5.036%,(1-month USD LIBOR + 3.25%), 4/04/26 | | | United States | | | | 14,019,428 | | | | 13,813,511 | |
| | | | | | | | | | | | |
| | | |
| | | | | | | | | | | 23,058,129 | |
| | | | | | | | | | | | |
| | | |
Data Processing & Outsourced Services 2.3% | | | | | | | | | | | | |
Iron Mountain Information Management LLC, Term B Loan, 3.536%,(1-month USD LIBOR + 1.75%), 1/26/26 | | | United States | | | | 9,152,828 | | | | 9,038,418 | |
Neustar Inc., | | | | | | | | | | | | |
TLB4, 5.286%,(1-month USD LIBOR + 3.50%), 8/08/24 | | | United States | | | | 3,084,264 | | | | 2,958,580 | |
TLB5, 6.286%,(1-month USD LIBOR + 4.50%), 8/08/24 | | | United States | | | | 16,463,685 | | | | 16,251,057 | |
WEX Inc., TermB-3 Loan, 4.036%,(1-month USD LIBOR + 2.25%), 5/17/26 | | | United States | | | | 23,655,166 | | | | 23,773,441 | |
| | | | | | | | | | | | |
| | | |
| | | | | | | | | | | 52,021,496 | |
| | | | | | | | | | | | |
Diversified Chemicals 0.2% | | | | | | | | | | | | |
Chemours Co., TrancheB-2 US$ Term Loan, 3.54%,(1-month USD LIBOR + 1.75%), 4/03/25 | | | United States | | | | 5,112,427 | | | | 4,854,674 | |
| | | | | | | | | | | | |
Diversified Support Services 0.9% | | | | | | | | | | | | |
Ventia Pty Ltd., Term B Loans, 5.604%,(3-month USD LIBOR + 3.50%), 5/21/26 | | | Australia | | | | 19,001,766 | | | | 19,049,271 | |
| | | | | | | | | | | | |
| | | | |
| | | |
| franklintempleton.com | | Annual Report | | 47 |
FRANKLIN INVESTORS SECURITIES TRUST
STATEMENT OF INVESTMENTS
Franklin Floating Rate Daily Access Fund(continued)
| | | | | | | | | | | | |
| | | | Country | | |
| Principal
Amount* |
| | | Value | |
| | | |
g,hSenior Floating Rate Interests (continued) | | | | | | | | | | | | |
Electric Utilities 0.6% | | | | | | | | | | | | |
EFS Cogen Holdings I LLC (Linden), | | | | | | | | | | | | |
Term B Advance, 5.04%,(1-month USD LIBOR + 3.25%), 6/28/23 | | | United States | | | $ | 3,779,501 | | | $ | 3,773,598 | |
Term B Advance, 5.36%,(3-month USD LIBOR + 3.25%), 6/28/23 | | | United States | | | | 9,334,011 | | | | 9,319,431 | |
| | | | | | | | | | | | |
| | | |
| | | | | | | | | | | 13,093,029 | |
| | | | | | | | | | | | |
| | | |
Food Distributors 1.4% | | | | | | | | | | | | |
Aramark Corp., U.S. TermB-3 Loan, 3.536%,(1-month USD LIBOR + 1.75%), 3/11/25 | | | United States | | | | 18,524,719 | | | | 18,582,609 | |
Nutraceutical International Corp., Term Loan B, 5.036%,(1-month USD LIBOR + 3.25%), 8/22/23 | | | United States | | | | 5,018,521 | | | | 4,911,878 | |
U.S. Foods Inc., Initial Term Loans, 3.786%,(1-month USD LIBOR + 2.00%), 6/27/23 | | | United States | | | | 6,625,731 | | | | 6,654,718 | |
| | | | | | | | | | | | |
| | | |
| | | | | | | | | | | 30,149,205 | |
| | | | | | | | | | | | |
Food Retail 1.4% | | | | | | | | | | | | |
BI-LO LLC (Southeastern Grocers), FILO Loan (ABL), 7.374%,(3-month USD LIBOR + 5.25%), 5/31/22 | | | United States | | | | 26,406,250 | | | | 26,472,266 | |
Whatabrands LLC (Whataburger), Term Loan B, 5.516%,(3-month USD LIBOR + 3.25%), 8/02/26 | | | United States | | | | 4,003,143 | | | | 4,018,871 | |
| | | | | | | | | | | | |
| | | |
| | | | | | | | | | | 30,491,137 | |
| | | | | | | | | | | | |
Forest Products 2.1% | | | | | | | | | | | | |
bAppvion Operations, Inc., | | | | | | | | | | | | |
Term Loan, 8.10%,(3-month USD LIBOR + 6.00%), 6/15/26 | | | United States | | | | 2,672,630 | | | | 2,699,356 | |
Term Loan, 8.22%,(6-month USD LIBOR + 6.00%), 6/15/26 | | | United States | | | | 42,511,633 | | | | 42,936,750 | |
| | | | | | | | | | | | |
| | | |
| | | | | | | | | | | 45,636,106 | |
| | | | | | | | | | | | |
General Merchandise Stores 1.5% | | | | | | | | | | | | |
f99 Cents Only Stores, | | | | | | | | | | | | |
First Lien Term Loan, PIK, 8.604%,(3-month USD LIBOR + 6.50%), 1/13/22 | | | United States | | | | 22,704,412 | | | | 18,674,379 | |
First Lien Term Loan, PIK, 8.535%,(6-month USD LIBOR + 6.50%), 1/13/22 | | | United States | | | | 17,041,733 | | | | 14,016,825 | |
| | | | | | | | | | | | |
| | | |
| | | | | | | | | | | 32,691,204 | |
| | | | | | | | | | | | |
| | | |
Health Care Distributors 0.3% | | | | | | | | | | | | |
Mallinckrodt International Finance SA & Mallinckrodt CB LLC, 2017 Term B Loans, 4.854%,(3-month USD LIBOR + 2.75%), 9/24/24 | | | Luxembourg | | | | 8,332,110 | | | | 6,551,122 | |
| | | | | | | | | | | | |
Health Care Facilities 0.4% | | | | | | | | | | | | |
HCA Inc., Term Loan, 3.536%,(1-month USD LIBOR + 1.75%), 3/13/25 | | | United States | | | | 8,037,402 | | | | 8,081,777 | |
| | | | | | | | | | | | |
Health Care Services 1.9% | | | | | | | | | | | | |
Air Medical Group Holdings Inc., 2018 New Term Loans, 6.036%,(1-month USD LIBOR + 4.25%), 3/14/25 | | | United States | | | | 18,555,189 | | | | 16,671,837 | |
Catalent Pharma Solutions Inc., Dollar TermB-2 Loan, 4.036%,(1-month USD LIBOR + 2.25%), 5/17/26 | | | United States | | | | 8,044,155 | | | | 8,065,875 | |
DaVita Inc., Tranche B Term Loan, 4.036%,(1-month USD LIBOR + 2.25%), 8/12/26 | | | United States | | | | 7,039,110 | | | | 7,068,590 | |
iNational Mentor Holdings Inc., | | | | | | | | | | | | |
Initial Term C Loans, 6.04%,(1-month USD LIBOR + 4.25%), 3/08/26 | | | United States | | | | 497,615 | | | | 498,963 | |
Initial Term Loans, 6.04%,(1-month USD LIBOR + 4.25%), 3/08/26 | | | United States | | | | 9,491,544 | | | | 9,517,246 | |
| | | | | | | | | | | | |
| | | |
| | | | | | | | | | | 41,822,511 | |
| | | | | | | | | | | | |
| | | | |
| | | |
48 | | Annual Report | | franklintempleton.com |
FRANKLIN INVESTORS SECURITIES TRUST
STATEMENT OF INVESTMENTS
Franklin Floating Rate Daily Access Fund(continued)
| | | | | | | | | | | | |
| | | Country | | | Principal
Amount* | | | Value | |
| | | |
g,hSenior Floating Rate Interests (continued) | | | | | | | | | | | | |
Health Care Technology 0.8% | | | | | | | | | | | | |
IQVIA Inc., | | | | | | | | | | | | |
TermB-1 Dollar Loans, 4.104%,(3-month USD LIBOR + 2.00%), 3/07/24 | | | United States | | | $ | 8,470,833 | | | $ | 8,511,426 | |
TermB-3 Dollar Loans, 3.854%,(3-month USD LIBOR + 1.75%), 6/11/25 | | | United States | | | | 8,690,000 | | | | 8,699,307 | |
| | | | | | | | | | | | |
| | | |
| | | | | | | | | | | 17,210,733 | |
| | | | | | | | | | | | |
| | | |
Industrial Machinery 4.3% | | | | | | | | | | | | |
Altra Industrial Motion Corp., Term Loan, 3.786%,(3-month USD LIBOR + 2.00%), 10/01/25 | | | United States | | | | 13,608,559 | | | | 13,587,207 | |
Harsco Corp., Term LoanB-2, 4.063%,(1-month USD LIBOR + 2.25%), 12/10/24 | | | United States | | | | 8,514,574 | | | | 8,541,182 | |
Navistar Inc., Tranche B Term Loan, 5.42%,(1-month USD LIBOR + 3.50%), 11/06/24 | | | United States | | | | 49,939,064 | | | | 49,407,863 | |
Onsite Rental Group Operations Pty. Ltd., Term Loan, 6.323%,(1-month USD LIBOR + 4.50%), 10/25/22 | | | Australia | | | | 15,430,073 | | | | 15,237,197 | |
RBS Global Inc. (Rexnord), Term B Loan, 3.786%,(1-month USD LIBOR + 2.00%), 8/21/24 | | | United States | | | | 7,884,375 | | | | 7,932,170 | |
| | | | | | | | | | | | |
| | | |
| | | | | | | | | | | 94,705,619 | |
| | | | | | | | | | | | |
| | | |
Integrated Telecommunication Services 1.7% | | | | | | | | | | | | |
Global Tel*Link Corp., | | | | | | | | | | | | |
First Lien Term Loan, 6.036%,(1-month USD LIBOR + 4.25%), 11/29/25 | | | United States | | | | 11,570,219 | | | | 10,135,511 | |
Second Lien Term Loan, 10.036%,(1-month USD LIBOR + 8.25%), 11/29/26 | | | United States | | | | 7,895,149 | | | | 7,539,868 | |
Securus Technologies Holdings Inc., | | | | | | | | | | | | |
Initial Term Loan, 6.286%,(1-month USD LIBOR + 4.50%), 11/01/24 | | | United States | | | | 8,931,818 | | | | 7,094,409 | |
Second Lien Initial Loan, 10.036%,(1-month USD LIBOR + 8.25%), 11/01/25 | | | United States | | | | 4,911,521 | | | | 2,701,337 | |
Zayo Group LLC, 2017 Incremental RefinancingB-1 Term Loan, 3.786%,(1-month USD LIBOR + 2.00%), 1/19/21 | | | United States | | | | 10,067,511 | | | | 10,101,066 | |
| | | | | | | | | | | | |
| | | |
| | | | | | | | | | | 37,572,191 | |
| | | | | | | | | | | | |
Interactive Media & Services 0.3% | | | | | | | | | | | | |
Ancestry.com Operations Inc.,Non-Extended Term Loans, 5.54%,(1-month USD LIBOR + 3.75%), 10/19/23 | | | United States | | | | 7,484,557 | | | | 6,941,927 | |
| | | | | | | | | | | | |
Internet Services & Infrastructure 1.5% | | | | | | | | | | | | |
Carbonite Inc., Initial Term Loan, 5.677%,(3-month USD LIBOR + 3.75%), 3/26/26 | | | United States | | | | 5,642,595 | | | | 5,643,476 | |
LegalZoom.com Inc., 2018 Term Loans, 6.286%,(1-month USD LIBOR + 4.50%), 11/21/24 | | | United States | | | | 7,675,374 | | | | 7,687,363 | |
TIBCO Software Inc., TermB-2 Loans, 6.00%,(1-month USD LIBOR + 4.00%), 6/30/26 | | | United States | | | | 19,844,370 | | | | 19,778,228 | |
| | | | | | | | | | | | |
| | | |
| | | | | | | | | | | 33,109,067 | |
| | | | | | | | | | | | |
| | | |
Investment Banking & Brokerage 0.5% | | | | | | | | | | | | |
Russell Investments U.S. Institutional Holdco Inc., Initial Term Loan, 5.036%,(1-month USD LIBOR + 3.25%), 6/01/23 | | | United States | | | | 11,809,666 | | | | 11,489,825 | |
| | | | | | | | | | | | |
Leisure Facilities 1.7% | | | | | | | | | | | | |
i24 Hour Fitness Worldwide Inc., Term Loan, 5.286%,(1-month USD LIBOR + 3.50%), 5/30/25 | | | United States | | | | 23,511,838 | | | | 18,260,939 | |
Equinox Holdings Inc., TermB-1 Loans, 4.786%,(1-month USD LIBOR + 3.00%), 3/08/24 | | | United States | | | | 12,334,872 | | | | 12,304,035 | |
NASCAR Holdings Inc., Initial Term Loans, 4.628%,(3-month USD LIBOR + 2.75%), 10/18/26 | | | United States | | | | 8,042,028 | | | | 8,091,736 | |
| | | | | | | | | | | | |
| | | |
| | | | | | | | | | | 38,656,710 | |
| | | | | | | | | | | | |
| | | | |
| | | |
| franklintempleton.com | | Annual Report | | 49 |
FRANKLIN INVESTORS SECURITIES TRUST
STATEMENT OF INVESTMENTS
Franklin Floating Rate Daily Access Fund(continued)
| | | | | | | | | | | | |
| | | Country | | | Principal
Amount* | | | Value | |
| | | |
g,hSenior Floating Rate Interests(continued) | | | | | | | | | | | | |
Life Sciences Tools & Services 0.4% | | | | | | | | | | | | |
Syneos Health Inc., Initial Term B Loans, 3.786%,(1-month USD LIBOR + 2.00%), 8/01/24 | | | United States | | | $ | 9,526,616 | | | $ | 9,556,386 | |
| | | | | | | | | | | | |
| | | |
Marine 0.3% | | | | | | | | | | | | |
iInternational Seaways Operating Corp., Initial Term Loans, 7.79%,(1-month USD LIBOR + 6.00%), 6/22/22 | | | United States | | | | 7,076,410 | | | | 7,109,584 | |
| | | | | | | | | | | | |
| | | |
Mortgage REITs 0.1% | | | | | | | | | | | | |
Blackstone Mortgage Trust Inc., Initial Term Loans, 4.30%,(1-month USD LIBOR + 2.50%), 4/23/26 | | | United States | | | | 1,524,249 | | | | 1,531,871 | |
| | | | | | | | | | | | |
| | | |
Movies & Entertainment 1.0% | | | | | | | | | | | | |
Lions Gate Capital Holdings LLC, Term A Loan, 3.536%,(1-month USD LIBOR + 1.75%), 3/22/23 | | | Canada | | | | 23,564,193 | | | | 23,004,543 | |
| | | | | | | | | | | | |
| | | |
Office Services & Supplies 0.3% | | | | | | | | | | | | |
West Corporation, | | | | | | | | | | | | |
Term B Loans, 5.786%,(1-month USD LIBOR + 4.00%), 10/10/24 | | | United States | | | | 17,160 | | | | 14,396 | |
Term B Loans, 5.927%,(3-month USD LIBOR + 4.00%), 10/10/24 | | | United States | | | | 6,726,613 | | | | 5,643,346 | |
| | | | | | | | | | | | |
| | | |
| | | | | | | | | | | 5,657,742 | |
| | | | | | | | | | | | |
| | | |
Oil & Gas Exploration & Production 5.5% | | | | | | | | | | | | |
Fieldwood Energy LLC, Closing Date Loans, 7.177%,(3-month USD LIBOR + 5.25%), 4/11/22 | | | United States | | | | 120,576,116 | | | | 97,546,078 | |
Utex Industries Inc., | | | | | | | | | | | | |
First Lien Initial Term Loan, 5.786%,(1-month USD LIBOR + 4.00%), 5/21/21 | | | United States | | | | 30,770,987 | | | | 23,693,660 | |
Second Lien Initial Term Loan, 9.036%,(1-month USD LIBOR + 7.25%), 5/20/22 | | | United States | | | | 253,504 | | | | 134,357 | |
| | | | | | | | | | | | |
| | | |
| | | | | | | | | | | 121,374,095 | |
| | | | | | | | | | | | |
| | | |
Oil & Gas Storage & Transportation 1.4% | | | | | | | | | | | | |
i,jBuckeye Partners LP, Initial Term, TBD, 11/01/26 | | | United States | | | | 8,374,652 | | | | 8,423,066 | |
Centurion Pipeline Co. LLC, Initial Term Loans, 5.036%,(1-month USD LIBOR + 3.25%), 9/28/25 | | | United States | | | | 6,453,388 | | | | 6,465,488 | |
Strike LLC, | | | | | | | | | | | | |
Term Loan, 10.104%,(3-month USD LIBOR + 8.00%), 11/30/22 | | | United States | | | | 245,065 | | | | 244,759 | |
Term Loan, 10.064%,(6-month USD LIBOR + 8.00%), 11/30/22 | | | United States | | | | 16,664,416 | | | | 16,643,585 | |
| | | | | | | | | | | | |
| | | |
| | | | | | | | | | | 31,776,898 | |
| | | | | | | | | | | | |
| | | |
Other Diversified Financial Services 0.7% | | | | | | | | | | | | |
Asurion LLC, | | | | | | | | | | | | |
AM No. 14 ReplacementB-4 Term Loans, 4.786%,(1-month USD LIBOR + 3.00%), 8/04/22 | | | United States | | | | 6,569,740 | | | | 6,581,033 | |
ReplacementB-6 Term Loans, 4.786%,(1-month USD LIBOR + 3.00%), 11/03/23 | | | United States | | | | 9,233,592 | | | | 9,249,465 | |
Second Lien ReplacementB-2 Term Loans, 8.286%,(1-month USD LIBOR + 6.50%), 8/04/25 | | | United States | | | | 169,003 | | | | 170,164 | |
| | | | | | | | | | | | |
| | | |
| | | | | | | | | | | 16,000,662 | |
| | | | | | | | | | | | |
| | | | |
| | | |
50 | | Annual Report | | franklintempleton.com |
FRANKLIN INVESTORS SECURITIES TRUST
STATEMENT OF INVESTMENTS
Franklin Floating Rate Daily Access Fund(continued)
| | | | | | | | | | | | |
| | | Country | | | Principal
Amount* | | | Value | |
| | | |
g,hSenior Floating Rate Interests(continued) | | | | | | | | | | | | |
Packaged Foods & Meats 3.5% | | | | | | | | | | | | |
B&G Foods Inc., TrancheB-4 Term Loan, 4.475%,(1-month USD LIBOR + 2.50%), 10/10/26 | | | United States | | | $ | 1,999,696 | | | $ | 2,005,111 | |
CSM Bakery Supplies LLC, | | | | | | | | | | | | |
Second Lien Term Loan, 9.78%,(3-month USD LIBOR + 7.75%), 7/03/21 | | | United States | | | | 15,995,244 | | | | 14,315,743 | |
Term Loans, 6.03%,(3-month USD LIBOR + 4.00%), 7/03/20 | | | United States | | | | 21,563,389 | | | | 20,233,640 | |
JBS USA Lux SA, New Term Loans, 4.286%,(1-month USD LIBOR + 2.50%), 5/01/26 | | | United States | | | | 38,648,644 | | | | 38,832,688 | |
Post Holdings Inc., Series A Incremental Term Loans, 3.83%,(1-month USD LIBOR + 2.00%), 5/24/24 | | | United States | | | | 1,840,842 | | | | 1,846,759 | |
| | | | | | | | | | | | |
| | | |
| | | | | | | | | | | 77,233,941 | |
| | | | | | | | | | | | |
| | | |
Paper Packaging 2.0% | | | | | | | | | | | | |
Berry Global Inc., | | | | | | | | | | | | |
Term U Loans, 4.439%,(1-month USD LIBOR + 2.50%), 7/01/26 | | | United States | | | | 22,965,300 | | | | 23,077,256 | |
Term W Loan, 3.878%,(1-month USD LIBOR + 2.00%), 10/01/22 | | | United States | | | | 13,400,204 | | | | 13,458,830 | |
Reynolds Group Holdings Inc., U.S. Term Loans, 4.536%,(1-month USD LIBOR + 2.75%), 2/05/23 | | | United States | | | | 8,682,280 | | | | 8,694,218 | |
| | | | | | | | | | | | |
| | | |
| | | | | | | | | | | 45,230,304 | |
| | | | | | | | | | | | |
| | | |
Personal Products 2.9% | | | | | | | | | | | | |
cFGI Operating Co. LLC (Freedom Group), | | | | | | | | | | | | |
fTerm Loan, PIK, 12.10%,(3-month USD LIBOR + 10.00%), 5/15/22 | | | United States | | | | 49,219,310 | | | | 48,024,659 | |
Term Loan FILO, 9.624% - 9.658%,(3-month USD LIBOR + 7.50%), 5/15/21 | | | United States | | | | 13,405,115 | | | | 13,378,940 | |
Sunshine Luxembourg VII SARL, Facility B1 Commitments, 6.349%,(2-month USD LIBOR + 4.25%), 9/25/26 | | | Luxembourg | | | | 2,700,000 | | | | 2,705,400 | |
| | | | | | | | | | | | |
| | | |
| | | | | | | | | | | 64,108,999 | |
| | | | | | | | | | | | |
| | | |
Pharmaceuticals 3.6% | | | | | | | | | | | | |
Endo Luxembourg Finance Co. I S.A.R.L. and Endo LLC, Initial Term Loans, 6.063%,(1-month USD LIBOR + 4.25%), 4/29/24 | | | United States | | | | 7,072,604 | | | | 6,499,221 | |
Grifols Worldwide Operations USA Inc., Tranche B Term Loan, 4.086%,(1-week USD LIBOR + 2.25%), 1/31/25 | | | United States | | | | 30,348,834 | | | | 30,429,440 | |
Horizon Pharma Inc., Sixth Amendment Refinanced Term Loans, 4.563%,(1-month USD LIBOR + 2.50%), 5/22/26 | | | United States | | | | 18,951,094 | | | | 19,025,117 | |
Innoviva Inc., Initial Term Loan, 6.652%,(3-month USD LIBOR + 4.50%), 8/18/22 | | | United States | | | | 172,970 | | | | 170,375 | |
Valeant Pharmaceuticals International, Initial Term Loans, 4.921%,(1-month USD LIBOR + 3.00%), 6/02/25 | | | United States | | | | 23,505,680 | | | | 23,616,674 | |
| | | | | | | | | | | | |
| | | |
| | | | | | | | | | | 79,740,827 | |
| | | | | | | | | | | | |
| | | |
Research & Consulting Services 0.1% | | | | | | | | | | | | |
Nielsen Finance LLC,Class B-4 Term Loans, 3.94%,(1-month USD LIBOR + 2.00%), 10/04/23 | | | United States | | | | 3,274,809 | | | | 3,267,644 | |
| | | | | | | | | | | | |
| | | |
Restaurants 0.6% | | | | | | | | | | | | |
1011778 B.C. ULC, TermB-3 Loan, 4.036%,(1-month USD LIBOR + 2.25%), 2/17/24 | | | Canada | | | | 3,160,842 | | | | 3,170,707 | |
KFC Holding Co./Pizza Hut Holdings LLC/Taco Bell of America LLC (Yum Brands), Term Loan B, 3.628%,(1-month USD LIBOR + 1.75%), 4/03/25 | | | United States | | | | 9,423,776 | | | | 9,455,185 | |
NPC International Inc., Second Lien Initial Term Loan, 9.427%,(3-month USD LIBOR + 7.50%), 4/20/25 | | | United States | | | | 8,228,426 | | | | 1,494,833 | |
| | | | | | | | | | | | |
| | | |
| | | | | | | | | | | 14,120,725 | |
| | | | | | | | | | | | |
| | | | |
| | | |
| franklintempleton.com | | Annual Report | | 51 |
FRANKLIN INVESTORS SECURITIES TRUST
STATEMENT OF INVESTMENTS
Franklin Floating Rate Daily Access Fund(continued)
| | | | | | | | | | | | | | | | |
| | | Country | | | Principal
Amount* | | | | | | Value | |
| | | | |
g,hSenior Floating Rate Interests(continued) | | | | | | | | | | | | | | | | |
Semiconductor Equipment 0.2% | | | | | | | | | | | | | | | | |
MKS Instruments Inc., TrancheB-6 Term Loan, 3.536%,(1-month USD LIBOR + 1.75%), 2/02/26 | | | United States | | | $ | 5,085,082 | | | | | | | $ | 5,105,738 | |
| | | | | | | | | | | | | | | | |
| | | | |
Semiconductors 0.6% | | | | | | | | | | | | | | | | |
ON Semiconductor Corp., 2019 Replacement TermB-4 Loans, 3.786%,(1-month USD LIBOR + 2.00%), 9/18/26 | | | United States | | | | 13,474,740 | | | | | | | | 13,552,368 | |
| | | | | | | | | | | | | | | | |
| | | | |
Specialized Consumer Services 2.7% | | | | | | | | | | | | | | | | |
Avis Budget Car Rental LLC, Tranche B Term Loans, 3.79%,(1-month USD LIBOR + 2.00%), 2/13/25 | | | United States | | | | 30,301,852 | | | | | | | | 30,364,879 | |
NVA Holdings Inc., | | | | | | | | | | | | | | | | |
TermB-3 Loan, 4.536%,(1-month USD LIBOR + 2.75%), 2/02/25 | | | United States | | | | 18,882,784 | | | | | | | | 18,878,063 | |
TermB-4 Loan, 5.286%,(1-month USD LIBOR + 3.50%), 2/02/25 | | | United States | | | | 2,020,719 | | | | | | | | 2,023,245 | |
Sabre GLBL Inc., | | | | | | | | | | | | | | | | |
2017 Other Term A Loans, 4.036%,(1-month USD LIBOR + 2.25%), 7/01/22 | | | United States | | | | 6,506,048 | | | | | | | | 6,518,247 | |
2018 Other Term B Loans, 3.786%,(1-month USD LIBOR + 2.00%), 2/22/24 | | | United States | | | | 1,849,457 | | | | | | | | 1,854,577 | |
| | | | | | | | | | | | | | | | |
| | | | |
| | | | | | | | | | | | | | | 59,639,011 | |
| | | | | | | | | | | | | | | | |
Specialty Chemicals 1.8% | | | | | | | | | | | | | | | | |
Axalta Coating Systems U.S. Holdings Inc., TermB-3 Dollar Loan, 3.854%,(3-month USD LIBOR + 1.75%), 6/01/24 | | | United States | | | | 27,012,161 | | | | | | | | 27,015,673 | |
Oxbow Carbon LLC, | | | | | | | | | | | | | | | | |
Tranche A Term Loan, 4.286%,(1-month USD LIBOR + 2.50%), 1/04/22 | | | United States | | | | 3,259,436 | | | | | | | | 3,243,138 | |
Tranche B Term Loan, 5.536%,(1-month USD LIBOR + 3.75%), 1/04/23 | | | United States | | | | 10,119,625 | | | | | | | | 10,113,300 | |
| | | | | | | | | | | | | | | | |
| | | | |
| | | | | | | | | | | | | | | 40,372,111 | |
| | | | | | | | | | | | | | | | |
Specialty Stores 4.4% | | | | | | | | | | | | | | | | |
General Nutrition Centers Inc., | | | | | | | | | | | | | | | | |
FILO Term Loan (ABL), 8.79%,(1-month USD LIBOR + 7.00%), 12/31/22 | | | United States | | | | 16,678,686 | | | | | | | | 16,700,702 | |
TrancheB-2 Term Loans, 10.54%,(1-month USD LIBOR + 8.75%), 3/04/21 | | | United States | | | | 42,922,055 | | | | | | | | 40,574,862 | |
Harbor Freight Tools USA Inc., Refinancing Loans, 4.286%,(1-month USD LIBOR + 2.50%), 8/19/23. | | | United States | | | | 6,585,654 | | | | | | | | 6,458,057 | |
Jo-Ann Stores Inc., Initial Loans, 6.934%,(3-month USD LIBOR + 5.00%), 10/23/23 | | | United States | | | | 11,400,965 | | | | | | | | 8,750,240 | |
Michaels Stores Inc., 2018 New Replacement Term B Loan, 4.30% - 4.323%,(1-month USD LIBOR + 2.50%), 1/28/23 | | | United States | | | | 26,732,479 | | | | | | | | 26,084,217 | |
PetSmart Inc., Amended Loan, 5.93%,(1-month USD LIBOR + 4.00%), 3/11/22 | | | United States | | | | 140,117 | | | | | | | | 136,935 | |
| | | | | | | | | | | | | | | | |
| | | | |
| | | | | | | | | | | | | | | 98,705,013 | |
| | | | | | | | | | | | | | | | |
Systems Software 1.1% | | | | | | | | | | | | | | | | |
iDcert Buyer Inc., First Lien Term Loan, 5.786%,(1-month USD LIBOR + 4.00%), 10/16/26 | | | United States | | | | 5,262,169 | | | | | | | | 5,172,275 | |
i,jFinastra USA Inc., Dollar Term Laon, TBD, 6/13/24 | | | United States | | | | 1,000,000 | | | | | | | | 958,125 | |
Go Daddy Operating Co. LLC, TrancheB-2 Term Loan, 3.536%,(1-month USD LIBOR + 1.75%), 2/15/24 | | | United States | | | | 13,349,920 | | | | | | | | 13,380,292 | |
i,jHyland Software Inc., First Lien Term, TBD, 7/01/24 | | | United States | | | | 1,480,000 | | | | | | | | 1,472,600 | |
i,jPerforce Software Inc., first lien, Term Loan, TBD, 7/08/26 | | | United States | | | | 2,600,000 | | | | | | | | 2,574,000 | |
| | | | | | | | | | | | | | | | |
| | | | |
| | | | | | | | | | | | | | | 23,557,292 | |
| | | | | | | | | | | | | | | | |
| | | | |
| | | |
52 | | Annual Report | | franklintempleton.com |
FRANKLIN INVESTORS SECURITIES TRUST
STATEMENT OF INVESTMENTS
Franklin Floating Rate Daily Access Fund(continued)
| | | | | | | | | | | | |
| | | Country | | | Principal
Amount* | | | Value | |
| | | |
g,hSenior Floating Rate Interests(continued) | | | | | | | | | | | | |
Trucking 1.0% | | | | | | | | | | | | |
Hertz Corp., TrancheB-1 Term Loan, 4.54%,(1-month USD LIBOR + 2.75%), 6/30/23 | | | United States | | | $ | 23,027,660 | | | $ | 23,061,234 | |
| | | | | | | | | | | | |
| | | |
Total Senior Floating Rate Interests
(Cost $1,907,110,797) | | | | | | | | | | | 1,818,148,570 | |
| | | | | | | | | | | | |
| | | |
Asset-Backed Securities 8.8% | | | | | | | | | | | | |
Other Diversified Financial Services 8.8% | | | | | | | | | | | | |
k,lAlinea CLO Ltd.,2018-1A, C, 144A, FRN, 3.866%,(3-month USD LIBOR + 1.90%), 7/20/31 | | | United States | | | | 7,000,000 | | | | 6,663,930 | |
k,lAnnisa CLO Ltd.,2016-2A, CR, 144A, FRN, 3.966%,(3-month USD LIBOR + 2.00%), 7/20/31 | | | United States | | | | 1,800,000 | | | | 1,712,394 | |
k,mARES XLIX CLO Ltd.,2018-49A, C, 144A, FRN, 3.903%, 7/22/30 | | | United States | | | | 3,000,000 | | | | 2,890,530 | |
k,lARES XXXVII CLO Ltd.,2015-4A, BR, 144A, FRN, 3.801%,(3-month USD LIBOR + 1.80%), 10/15/30 | | | United States | | | | 4,908,000 | | | | 4,707,803 | |
k,mAtrium XIV LLC, 14A, B, 144A, FRN, 3.701%, 8/23/30 | | | United States | | | | 6,300,000 | | | | 6,264,342 | |
k,lBetony CLO 2 Ltd.,2018-1A, B, 144A, FRN, 3.786%,(3-month USD LIBOR + 1.85%), 4/30/31 | | | United States | | | | 5,700,000 | | | | 5,409,300 | |
k,mBlueMountain CLO XXII Ltd., | | | | | | | | | | | | |
2018-1A, B, 144A, FRN, 3.636%, 7/30/30. | | | United States | | | | 10,330,510 | | | | 10,238,672 | |
2018-1A, C, 144A, FRN, 3.986%, 7/30/30 | | | United States | | | | 3,750,000 | | | | 3,600,000 | |
k,lBristol Park CLO Ltd.,2016-1A, A, 144A, FRN, 3.421%,(3-month USD LIBOR + 1.42%), 4/15/29 | | | United States | | | | 25,000,000 | | | | 25,028,250 | |
k,lCarlyle U.S. CLO Ltd.,2017-4A, B, 144A, FRN, 3.851%,(3-month USD LIBOR + 1.85%), 1/15/30 | | | United States | | | | 1,493,000 | | | | 1,416,349 | |
k,mCole Park CLO Ltd.,2015-1A, CR, 144A, FRN, 3.966%, 10/20/28 | | | United States | | | | 2,500,000 | | | | 2,478,850 | |
k,mDryden 40 Senior Loan Fund,2015-40A, CR, 144A, FRN, 4.258%, 8/15/31 | | | United States | | | | 2,000,000 | | | | 1,949,900 | |
k,mDryden 70 CLO Ltd.,2018-70A, B, 144A, FRN, 3.701%, 1/16/32 | | | United States | | | | 5,880,435 | | | | 5,831,098 | |
k,mEaton Vance CLO Ltd.,2014-1RA, C, 144A, FRN, 4.101%, 7/15/30 | | | United States | | | | 5,136,585 | | | | 4,967,848 | |
kEmerson Park CLO Ltd.,2013-1A, C2R, 144A, 4.055%, 7/15/25 | | | United States | | | | 3,600,000 | | | | 3,604,644 | |
k,mGalaxy XXV CLO Ltd., | | | | | | | | | | | | |
2018-25A, B, 144A, FRN, 3.59%, 10/25/31 | | | United States | | | | 4,000,000 | | | | 3,938,360 | |
2018-25A, C, 144A, FRN, 3.94%, 10/25/31. | | | United States | | | | 500,000 | | | | 476,560 | |
k,lGilbert Park CLO Ltd.,2017-1A, C, 144A, FRN, 3.951%,(3-month USD LIBOR + 1.95%), 10/15/30 | | | United States | | | | 350,000 | | | | 339,560 | |
k,mLCM Loan Income Fund I Income Note Issuer Ltd., 2027A, C, 144A, FRN, 3.951%, 7/16/31 | | | United States | | | | 3,000,000 | | | | 2,849,220 | |
k,mLCM XVI LP, 2016A, BR2, 144A, FRN, 3.751%, 10/15/31 | | | United States | | | | 6,399,083 | | | | 6,382,253 | |
k,lLCM XXIV Ltd., 24A, A, 144A, FRN, 3.276%,(3-month USD LIBOR + 1.31%), 3/20/30 | | | United States | | | | 17,000,000 | | | | 16,996,260 | |
k,lMadison Park Funding Ltd., | | | | | | | | | | | | |
2016-21A, A1, 144A, FRN,3.47%,(3-month USD LIBOR + 1.53%), 7/25/29 | | | United States | | | | 5,400,000 | | | | 5,407,992 | |
2018-28A, C, 144A, FRN,3.851%,(3-month USD LIBOR + 1.85%), 7/15/30 | | | United States | | | | 7,000,000 | | | | 6,724,690 | |
| | | | |
| | | |
| franklintempleton.com | | Annual Report | | 53 |
FRANKLIN INVESTORS SECURITIES TRUST
STATEMENT OF INVESTMENTS
Franklin Floating Rate Daily Access Fund(continued)
| | | | | | | | | | | | |
| | | Country | | | Principal
Amount* | | | Value | |
| | | |
Asset-Backed Securities(continued) | | | | | | | | | | | | |
Other Diversified Financial Services(continued) | | | | | | | | | | | | |
k,lMadison Park Funding XI Ltd.,2013-11, CR, 144A, FRN, 4.134%,(3-month USD LIBOR + 2.20%), 7/23/29 | | | United States | | | $ | 2,040,000 | | | $ | 1,982,982 | |
k,lMadison Park Funding XXIII Ltd.,2017-23A, C, 144A, FRN, 4.286%,(3-month USD LIBOR + 2.35%), 7/27/30. | | | United States | | | | 3,000,000 | | | | 2,950,590 | |
k,lNeuberger Berman CLO Ltd.,2017-26A, C, 144A, FRN, 3.753%,(3-month USD LIBOR + 1.75%), 10/18/30 | | | United States | | | | 746,000 | | | | 705,462 | |
k,lOctagon Investment Partners 37 Ltd.,2018-2A, B, 144A, FRN, 3.69%,(3-month USD LIBOR + 1.75%), 7/25/30. | | | United States | | | | 10,875,000 | | | | 10,193,573 | |
k,mOctagon Investment Partners 38,2018-1A, A3A, 144A, FRN, 3.636%, 7/20/30 | | | United States | | | | 3,484,000 | | | | 3,447,766 | |
k,lOctagon Investment Partners XVI Ltd.,2013-1A, CR, 144A, FRN, 3.852%,(3-month USD LIBOR + 1.85%), 7/17/30 | | | United States | | | | 12,500,000 | | | | 11,762,125 | |
k,lOctagon Investment Partners XXII Ltd.,2014-1A, CRR, 144A, FRN, 3.853%,(3-month USD LIBOR + 1.90%), 1/22/30 | | | United States | | | | 3,000,000 | | | | 2,838,900 | |
k,mRace Point X CLO Ltd.,2016-10A, C1R, 144A, FRN, 3.94%, 7/25/31 | | | United States | | | | 7,000,000 | | | | 6,693,750 | |
kVoya CLO Ltd., | | | | | | | | | | | | |
l2017-3A, B, 144A, FRN,4.316%,(3-month USD LIBOR + 2.35%), 7/20/30 | | | United States | | | | 8,362,537 | | | | 8,270,884 | |
m2018-4A, B, 144A, FRN, 3.851%, 1/15/32 | | | United States | | | | 14,285,714 | | | | 14,193,714 | |
m2018-4A, C1, 144A, FRN, 4.551%, 1/15/32 | | | United States | | | | 3,000,000 | | | | 3,001,230 | |
| | | | | | | | | | | | |
| | | |
Total Asset-Backed Securities (Cost $200,419,875) | | | | | | | | | | | 195,919,781 | |
| | | | | | | | | | | | |
| | | |
| | | | | | Units | | | | |
| | | |
Escrows and Litigation Trusts (Cost $—) 0.0% | | | | | | | | | | | | |
a,b,c,dRemington Outdoor Co. Inc., Litigation Units | | | United States | | | | 170,300 | | | | — | |
| | | | | | | | | | | | |
| | | |
Total Investments before Short Term Investments
(Cost $2,281,378,952) | | | | | | | | | | | 2,117,507,196 | |
| | | | | | | | | | | | |
| | | |
| | | | | | Shares | | | | |
| | | |
Short Term Investments (Cost $103,958,277) 4.7% | | | | | | | | | | | | |
| | | |
Money Market Funds 4.7% | | | | | | | | | | | | |
e,nInstitutional Fiduciary Trust Money Market Portfolio, 1.56% | | | United States | | | | 103,958,277 | | | | 103,958,277 | |
| | | | | | | | | | | | |
| | | |
Total Investments (Cost $2,385,337,229) 100.0% | | | | | | | | | | | 2,221,465,473 | |
Other Assets, less Liabilities 0.0%† | | | | | | | | | | | 861,240 | |
| | | | | | | | | | | | |
| | | |
Net Assets 100.0% | | | | | | | | | | $ | 2,222,326,713 | |
| | | | | | | | | | | | |
| | | | |
| | | |
54 | | Annual Report | | franklintempleton.com |
FRANKLIN INVESTORS SECURITIES TRUST
STATEMENT OF INVESTMENTS
Franklin Floating Rate Daily Access Fund(continued)
†Rounds to less than 0.1% of net assets.
*The principal amount is stated in U.S. dollars unless otherwise indicated.
aNon-income producing.
bSee Note 10 regarding holdings of 5% voting securities.
cFair valued using significant unobservable inputs. See Note 13 regarding fair value measurements.
dSee Note 8 regarding restricted securities.
eSee Note 3(f) regarding investments in affiliated management investment companies.
fIncome may be received in additional securities and/or cash.
gThe coupon rate shown represents the rate at period end.
hSee Note 1(j) regarding senior floating rate interests.
iA portion or all of the security purchased on a delayed delivery basis. See Note 1(d).
jA portion or all of the security represents an unsettled loan commitment. The coupon rate isto-be determined (TBD) at the time of settlement and will be based upon a reference index/floor plus a spread.
kSecurity was purchased pursuant to Rule 144A under the Securities Act of 1933 and may be sold in transactions exempt from registration only to qualified institutional buyers or in a public offering registered under the Securities Act of 1933. At October 31, 2019, the aggregate value of these securities was $195,919,781, representing 8.8% of net assets.
lThe coupon rate shown represents the rate inclusive of any caps or floors, if applicable, in effect at period end.
mAdjustable rate security with an interest rate that is not based on a published reference index and spread. The rate is based on the structure of the agreement and current market conditions. The coupon rate shown represents the rate at period end.
nThe rate shown is the annualizedseven-day effective yield at period end.
At October 31, 2019, the Fund had the following credit default swap contracts outstanding. See Note 1(e).
Credit Default Swap Contracts
| | | | | | | | | | | | | | | | | | | | | | | | | | | | |
| Description | | Periodic
Payment Rate
Received
(Paid) | | | Payment
Frequency | | | Maturity
Date | | | Notional
Amount | | | Value | | | Unamortized
Upfront
Payments
(Receipts) | | | Unrealized
Appreciation
(Depreciation) | |
| | | | | | | |
Centrally Cleared Swap Contracts | | | | | | | | | | | | | | | | | | | | | | | | | | | | |
| | | | | | | |
Contracts to Buy Protectiona | | | | | | | | | | | | | | | | | | | | | | | | | | | | |
| | | | | | | |
Traded Index | | | | | | | | | | | | | | | | | | | | | | | | | | | | |
| | | | | | | |
CDX.NA.HY.26 | �� | | (5.00)% | | | | Quarterly | | | | 6/20/21 | | | | $31,772,000 | | | | $(1,352,702 | ) | | | $(983,530) | | | | $(369,172) | |
aPerformance triggers for settlement of contract include failure to pay or bankruptcy of the underlying securities for traded index swaps.
See Note 9 regarding other derivative information.
See Abbreviations on page 165.
| | | | |
| | | |
| franklintempleton.com | | The accompanying notes are an integral part of these financial statements. | Annual Report | | 55 |
FRANKLIN INVESTORS SECURITIES TRUST
Financial Highlights
Franklin Low Duration Total Return Fund
| | | | | | | | | | | | | | | | | | | | |
| | | Year Ended October 31, | |
| | | 2019 | | | 2018 | | | 2017 | | | 2016 | | | 2015 | |
| | | | | |
Class A | | | | | | | | | | | | | | | | | | | | |
| | | | | |
Per share operating performance | | | | | | | | | | | | | | | | | | | | |
(for a share outstanding throughout the year) | | | | | | | | | | | | | | | | | | | | |
| | | | | |
Net asset value, beginning of year | | | $ 9.60 | | | | $ 9.84 | | | | $ 9.89 | | | | $ 9.91 | | | | $ 10.11 | |
| | | | | |
Income from investment operationsa: | | | | | | | | | | | | | | | | | | | | |
| | | | | |
Net investment income | | | 0.290 | | | | 0.237 | | | | 0.170 | | | | 0.151 | | | | 0.134 | |
| | | | | |
Net realized and unrealized gains (losses) | | | 0.068 | | | | (0.185 | ) | | | (0.023 | ) | | | 0.031 | | | | (0.135 | ) |
| | | | | |
Total from investment operations | | | 0.358 | | | | 0.052 | | | | 0.147 | | | | 0.182 | | | | (0.001 | ) |
| | | | | |
Less distributions from: | | | | | | | | | | | | | | | | | | | | |
| | | | | |
Net investment income and net foreign currency gains | | | (0.308 | ) | | | (0.292 | ) | | | (0.197 | ) | | | (0.202 | ) | | | (0.199 | ) |
| | | | | |
Net asset value, end of year | | | $ 9.65 | | | | $ 9.60 | | | | $ 9.84 | | | | $ 9.89 | | | | $ 9.91 | |
| | | | | |
Total returnb | | | 3.78% | | | | 0.54% | | | | 1.50% | | | | 1.88% | | | | (0.02)% | |
| | | | | |
Ratios to average net assets | | | | | | | | | | | | | | | | | | | | |
| | | | | |
Expenses before waiver and payments by affiliates | | | 0.94% | | | | 0.96% | | | | 0.96% | | | | 0.95% | | | | 0.96% | |
| | | | | |
Expenses net of waiver and payments by affiliatesc | | | 0.68% | | | | 0.72% | | | | 0.80% | | | | 0.80% | | | | 0.80% | |
| | | | | |
Net investment income | | | 2.99% | | | | 2.43% | | | | 1.73% | | | | 1.57% | | | | 1.27% | |
| | | | | |
Supplemental data | | | | | | | | | | | | | | | | | | | | |
| | | | | |
Net assets, end of year (000’s) | | | $1,631,123 | | | | $1,499,579 | | | | $1,519,902 | | | | $1,524,437 | | | | $1,656,001 | |
| | | | | |
Portfolio turnover rate | | | 51.93% | d | | | 56.12% | | | | 50.40% | | | | 44.76% | | | | 41.28% | |
| | | | | |
Portfolio turnover rate excluding mortgage dollar rolls | | | 51.93% | d | | | 44.01% | e | | | 45.29% | e | | | 44.76% | e | | | 41.28% | e |
aThe amount shown for a share outstanding throughout the period may not correlate with the Statement of Operations for the period due to the timing of sales and repurchases of the Fund’s shares in relation to income earned and/or fluctuating fair value of the investments of the Fund.
bTotal return does not reflect sales commissions or contingent deferred sales charges, if applicable.
cBenefit of expense reduction rounds to less than 0.01%.
dExcludes the value of portfolio activity as a result ofin-kind transactions. See Note 6.
eSee Note 1(i) regarding mortgage dollar rolls.
| | | | |
| | | |
56 | | Annual Report | The accompanying notes are an integral part of these financial statements. | | franklintempleton.com |
FRANKLIN INVESTORS SECURITIES TRUST
FINANCIAL HIGHLIGHTS
Franklin Low Duration Total Return Fund(continued)
| | | | | | | | | | | | | | | | | | | | |
| | | Year Ended October 31, | |
| | | | | |
| | | 2019 | | | 2018 | | | 2017 | | | 2016 | | | 2015 | |
| | | | | |
Class C | | | | | | | | | | | | | | | | | | | | |
| | | | | |
Per share operating performance | | | | | | | | | | | | | | | | | | | | |
(for a share outstanding throughout the year) | | | | | | | | | | | | | | | | | | | | |
| | | | | |
Net asset value, beginning of year | | | $ 9.56 | | | | $ 9.80 | | | | $ 9.86 | | | | $ 9.90 | | | | $ 10.11 | |
| | | | | |
Income from investment operationsa: | | | | | | | | | | | | | | | | | | | | |
| | | | | |
Net investment income | | | 0.251 | | | | 0.168 | | | | 0.121 | | | | 0.113 | | | | 0.104 | |
| | | | | |
Net realized and unrealized gains (losses) | | | 0.068 | | | | (0.155 | ) | | | (0.015 | ) | | | 0.024 | | | | (0.145 | ) |
| | | | | |
Total from investment operations | | | 0.319 | | | | 0.013 | | | | 0.106 | | | | 0.137 | | | | (0.041 | ) |
| | | | | |
Less distributions from: | | | | | | | | | | | | | | | | | | | | |
| | | | | |
Net investment income and net foreign currency gains | | | (0.269 | ) | | | (0.253 | ) | | | (0.166 | ) | | | (0.177 | ) | | | (0.169 | ) |
| | | | | |
Net asset value, end of year | | | $ 9.61 | | | | $ 9.56 | | | | $ 9.80 | | | | $ 9.86 | | | | $ 9.90 | |
| | | | | |
Total returnb | | | 3.38% | | | | 0.14% | | | | 1.08% | | | | 1.41% | | | | (0.41)% | |
| | | | | |
Ratios to average net assets | | | | | | | | | | | | | | | | | | | | |
| | | | | |
Expenses before waiver and payments by affiliates | | | 1.34% | | | | 1.36% | | | | 1.36% | | | | 1.35% | | | | 1.36% | |
| | | | | |
Expenses net of waiver and payments by affiliatesc | | | 1.08% | | | | 1.12% | | | | 1.20% | | | | 1.20% | | | | 1.20% | |
| | | | | |
Net investment income | | | 2.59% | | | | 2.03% | | | | 1.33% | | | | 1.17% | | | | 0.87% | |
| | | | | |
Supplemental data | | | | | | | | | | | | | | | | | | | | |
| | | | | |
Net assets, end of year (000’s) | | | $135,372 | | | | $130,206 | | | | $174,754 | | | | $218,066 | | | | $211,354 | |
| | | | | |
Portfolio turnover rate | | | 51.93% | d | | | 56.12% | | | | 50.40% | | | | 44.76% | | | | 41.28% | |
| | | | | |
Portfolio turnover rate excluding mortgage dollar rolls | | | 51.93% | d | | | 44.01% | e | | | 45.29% | e | | | 44.76% | e | | | 41.28% | e |
aThe amount shown for a share outstanding throughout the period may not correlate with the Statement of Operations for the period due to the timing of sales and repurchases of the Fund’s shares in relation to income earned and/or fluctuating fair value of the investments of the Fund.
bTotal return does not reflect sales commissions or contingent deferred sales charges, if applicable.
cBenefit of expense reduction rounds to less than 0.01%.
dExcludes the value of portfolio activity as a result ofin-kind transactions. See Note 6.
eSee Note 1(i) regarding mortgage dollar rolls.
| | | | |
| | | |
| franklintempleton.com | | The accompanying notes are an integral part of these financial statements. | Annual Report | | 57 |
FRANKLIN INVESTORS SECURITIES TRUST
FINANCIAL HIGHLIGHTS
Franklin Low Duration Total Return Fund(continued)
| | | | |
| | | Year Ended
October 31, 2019a | |
| |
Class R | | | | |
| |
Per share operating performance | | | | |
(for a share outstanding throughout the year) | | | | |
| |
Net asset value, beginning of year | | | $ 9.65 | |
| |
Income from investment operationsb: | | | | |
| |
Net investment income | | | 0.012 | |
| |
Net realized and unrealized gains (losses) | | | 0.001 | |
| |
Total from investment operations | | | 0.013 | |
| |
Less distributions from: | | | | |
| |
Net investment income | | | (0.013 | ) |
| |
Net asset value, end of year | | | $ 9.65 | |
| |
Total returnc | | | 0.14% | |
| |
Ratios to average net assetsd | | | | |
| |
Expenses before waiver and payments by affiliates | | | 1.19% | |
| |
Expenses net of waiver and payments by affiliatese | | | 0.93% | |
| |
Net investment income | | | 2.73% | |
| |
Supplemental data | | | | |
| |
Net assets, end of year (000’s) | | | $18 | |
| |
Portfolio turnover rate | | | 51.93% | f |
| |
Portfolio turnover rate excluding mortgage dollar rolls | | | 51.93% | f |
aFor the period October 15, 2019 (effective date) to October 31, 2019.
bThe amount shown for a share outstanding throughout the period may not correlate with the Statement of Operations for the period due to the timing of sales and repurchases of the Fund’s shares in relation to income earned and/or fluctuating fair value of the investments of the Fund.
cTotal return is not annualized for periods less than one year.
dRatios are annualized for periods less than one year.
eBenefit of expense reduction rounds to less than 0.01%.
fExcludes the value of portfolio activity as a result ofin-kind transactions. See Note 6.
| | | | |
| | | |
58 | | Annual Report | The accompanying notes are an integral part of these financial statements. | | franklintempleton.com |
FRANKLIN INVESTORS SECURITIES TRUST
FINANCIAL HIGHLIGHTS
Franklin Low Duration Total Return Fund(continued)
| | | | | | | | | | | | | | | | | | | | |
| | | Year Ended October 31, | |
| | | 2019 | | | 2018 | | | 2017 | | | 2016 | | | 2015 | |
| | | | | |
Class R6 | | | | | | | | | | | | | | | | | | | | |
| | | | | |
Per share operating performance | | | | | | | | | | | | | | | | | | | | |
(for a share outstanding throughout the year) | | | | | | | | | | | | | | | | | | | | |
| | | | | |
Net asset value, beginning of year | | | $ 9.66 | | | | $ 9.90 | | | | $ 9.94 | | | | $ 9.95 | | | | $ 10.14 | |
| | | | | |
Income from investment operationsa: | | | | | | | | | | | | | | | | | | | | |
| | | | | |
Net investment income | | | 0.326 | | | | 0.271 | | | | 0.214 | | | | 0.195 | | | | 0.165 | |
| | | | | |
Net realized and unrealized gains (losses) | | | 0.071 | | | | (0.178 | ) | | | (0.025 | ) | | | 0.021 | | | | (0.130 | ) |
| | | | | |
Total from investment operations | | | 0.397 | | | | 0.093 | | | | 0.189 | | | | 0.216 | | | | 0.035 | |
| | | | | |
Less distributions from: | | | | | | | | | | | | | | | | | | | | |
| | | | | |
Net investment income and net foreign currency gains | | | (0.347 | ) | | | (0.333 | ) | | | (0.229 | ) | | | (0.226 | ) | | | (0.228 | ) |
| | | | | |
Net asset value, end of year | | | $ 9.71 | | | | $ 9.66 | | | | $ 9.90 | | | | $ 9.94 | | | | $ 9.95 | |
| | | | | |
Total return | | | 4.17% | | | | 0.96% | | | | 1.92% | | | | 2.22% | | | | 0.37% | |
| | | | | |
Ratios to average net assets | | | | | | | | | | | | | | | | | | | | |
| | | | | |
Expenses before waiver and payments by affiliates | | | 0.56% | | | | 0.55% | | | | 0.53% | | | | 0.53% | | | | 0.54% | |
| | | | | |
Expenses net of waiver and payments by affiliatesb | | | 0.30% | | | | 0.31% | | | | 0.39% | | | | 0.42% | | | | 0.42% | |
| | | | | |
Net investment income | | | 3.37% | | | | 2.84% | | | | 2.14% | | | | 1.95% | | | | 1.65% | |
| | | | | |
Supplemental data | | | | | | | | | | | | | | | | | | | | |
| | | | | |
Net assets, end of year (000’s) | | | $1,003,208 | | | | $1,017,856 | | | | $591,622 | | | | $553,233 | | | | $508,675 | |
| | | | | |
Portfolio turnover rate | | | 51.93% | c | | | 56.12% | | | | 50.40% | | | | 44.76% | | | | 41.28% | |
| | | | | |
Portfolio turnover rate excluding mortgage dollar rolls | | | 51.93% | c | | | 44.01% | d | | | 45.29% | d | | | 44.76% | d | | | 41.28% | d |
aThe amount shown for a share outstanding throughout the period may not correlate with the Statement of Operations for the period due to the timing of sales and repurchases of the Fund’s shares in relation to income earned and/or fluctuating fair value of the investments of the Fund.
bBenefit of expense reduction rounds to less than 0.01%.
cExcludes the value of portfolio activity as a result of in-kind transactions. See Note 6.
dSee Note 1(i) regarding mortgage dollar rolls.
| | | | |
| | | |
| franklintempleton.com | | The accompanying notes are an integral part of these financial statements. | Annual Report | | 59 |
FRANKLIN INVESTORS SECURITIES TRUST
FINANCIAL HIGHLIGHTS
Franklin Low Duration Total Return Fund(continued)
| | | | | | | | | | | | | | | | | | | | |
| | | Year Ended October 31, | |
| | | 2019 | | | 2018 | | | 2017 | | | 2016 | | | 2015 | |
| | | | | |
Advisor Class | | | | | | | | | | | | | | | | | | | | |
| | | | | |
Per share operating performance | | | | | | | | | | | | | | | | | | | | |
(for a share outstanding throughout the year) | | | | | | | | | | | | | | | | | | | | |
| | | | | |
Net asset value, beginning of year | | | $ 9.65 | | | | $ 9.89 | | | | $ 9.94 | | | | $ 9.95 | | | | $ 10.14 | |
| | | | | |
Income from investment operationsa: | | | | | | | | | | | | | | | | | | | | |
| | | | | |
Net investment income | | | 0.315 | | | | 0.264 | | | | 0.209 | | | | 0.184 | | | | 0.134 | |
| | | | | |
Net realized and unrealized gains (losses) | | | 0.069 | | | | (0.187 | ) | | | (0.042 | ) | | | 0.025 | | | | (0.106 | ) |
| | | | | |
Total from investment operations | | | 0.384 | | | | 0.077 | | | | 0.167 | | | | 0.209 | | | | 0.028 | |
| | | | | |
Less distributions from: | | | | | | | | | | | | | | | | | | | | |
| | | | | |
Net investment income and net foreign currency gains | | | (0.334 | ) | | | (0.317 | ) | | | (0.217 | ) | | | (0.219 | ) | | | (0.218 | ) |
| | | | | |
Net asset value, end of year | | | $ 9.70 | | | | $ 9.65 | | | | $ 9.89 | | | | $ 9.94 | | | | $ 9.95 | |
| | | | | |
Total return | | | 4.04% | | | | 0.80% | | | | 1.70% | | | | 2.14% | | | | 0.27% | |
| | | | | |
Ratios to average net assets | | | | | | | | | | | | | | | | | | | | |
| | | | | |
Expenses before waiver and payments by affiliates | | | 0.69% | | | | 0.71% | | | | 0.71% | | | | 0.70% | | | | 0.71% | |
| | | | | |
Expenses net of waiver and payments by affiliatesb | | | 0.43% | | | | 0.47% | | | | 0.55% | | | | 0.55% | | | | 0.55% | |
| | | | | |
Net investment income | | | 3.24% | | | | 2.68% | | | | 1.98% | | | | 1.82% | | | | 1.52% | |
| | | | | |
Supplemental data | | | | | | | | | | | | | | | | | | | | |
| | | | | |
Net assets, end of year (000’s) | | | $254,314 | | | | $214,339 | | | | $428,838 | | | | $224,887 | | | | $150,464 | |
| | | | | |
Portfolio turnover rate | | | 51.93% | c | | | 56.12% | | | | 50.40% | | | | 44.76% | | | | 41.28% | |
| | | | | |
Portfolio turnover rate excluding mortgage dollar rolls | | | 51.93% | c | | | 44.01% | d | | | 45.29% | d | | | 44.76% | d | | | 41.28% | d |
aThe amount shown for a share outstanding throughout the period may not correlate with the Statement of Operations for the period due to the timing of sales and repurchases of the Fund’s shares in relation to income earned and/or fluctuating fair value of the investments of the Fund.
bBenefit of expense reduction rounds to less than 0.01%.
cExcludes the value of portfolio activity as a result of in-kind transactions. See Note 6.
dSee Note 1(i) regarding mortgage dollar rolls.
| | | | |
| | | |
60 | | Annual Report | The accompanying notes are an integral part of these financial statements. | | franklintempleton.com |
FRANKLIN INVESTORS SECURITIES TRUST
Statement of Investments, October 31, 2019
Franklin Low Duration Total Return Fund
| | | | | | | | | | | | | | | | |
| | | Country | | | Shares/
Warrants | | | | | | Value | |
| | | | |
Common Stocks and Other Equity Interests 0.0%† | | | | | | | | | | | | | | | | |
Commercial & Professional Services 0.0%† | | | | | | | | | | | | | | | | |
a,bRemington Outdoor Co. Inc. | | | United States | | | | 170,787 | | | | | | | $ | 170,787 | |
| | | | | | | | | | | | | | | | |
| | | | |
Energy 0.0%† | | | | | | | | | | | | | | | | |
a,bHalcon Resources Corp. | | | United States | | | | 227 | | | | | | | | 4,511 | |
a,bHalcon Resources Corp., wts., 9/09/20 | | | United States | | | | 8,753 | | | | | | | | — | |
a,bHalcon Resources Corp., wts., A, 10/08/20 | | | United States | | | | 1,093 | | | | | | | | — | |
a,bHalcon Resources Corp., wts., B, 10/08/22 | | | United States | | | | 1,366 | | | | | | | | — | |
a,bHalcon Resources Corp., wts., C, 10/08/22 | | | United States | | | | 1,757 | | | | | | | | — | |
aRiviera Resources Inc. | | | United States | | | | 2,835 | | | | | | | | 36,968 | |
aRoan Resources Inc. | | | United States | | | | 2,964 | | | | | | | | 4,446 | |
| | | | | | | | | | | | | | | | |
| | | | |
| | | | | | | | | | | | | | | 45,925 | |
| | | | | | | | | | | | | | | | |
Materials 0.0%† | | | | | | | | | | | | | | | | |
a,b,cAppvion Operations Inc. | | | United States | | | | 24,739 | | | | | | | | 329,838 | |
aVerso Corp., A | | | United States | | | | 1,387 | | | | | | | | 20,306 | |
aVerso Corp., wts., 7/25/23 | | | United States | | | | 146 | | | | | | | | 255 | |
| | | | | | | | | | | | | | | | |
| | | | |
| | | | | | | | | | | | | | | 350,399 | |
| | | | | | | | | | | | | | | | |
Retailing 0.0%† | | | | | | | | | | | | | | | | |
a,b,cK2016470219 South Africa Ltd., A | | | South Africa | | | | 12,326,925 | | | | | | | | 8,155 | |
a,b,cK2016470219 South Africa Ltd., B | | | South Africa | | | | 1,226,701 | | | | | | | | 812 | |
| | | | | | | | | | | | | | | | |
| | | | |
| | | | | | | | | | | | | | | 8,967 | |
| | | | | | | | | | | | | | | | |
| | | | |
Total Common Stocks and Other Equity Interests
(Cost $6,174,515) | | | | | | | | | | | | | | | 576,078 | |
| | | | | | | | | | | | | | | | |
| | | | |
Management Investment Companies 1.9% | | | | | | | | | | | | | | | | |
Diversified Financials 1.9% | | | | | | | | | | | | | | | | |
| | | | |
dFranklin Floating Rate Income Fund | | | United States | | | | 2,389,308 | | | | | | | | 19,759,574 | |
| | | | |
Invesco Senior Loan ETF | | | United States | | | | 1,629,000 | | | | | | | | 36,505,890 | |
| | | | | | | | | | | | | | | | |
| | | | |
Total Management Investment Companies
(Cost $60,536,785) | | | | | | | | | | | | | | | 56,265,464 | |
| | | | | | | | | | | | | | | | |
| | | | |
| | | | | | Principal
Amount* | | | | | | | |
| | | | |
Corporate Bonds 22.4% | | | | | | | | | | | | | | | | |
Banks 6.4% | | | | | | | | | | | | | | | | |
eAkbank T.A.S., senior note, 144A, 5.125%, 3/31/25 | | | Turkey | | | | 2,200,000 | | | | | | | | 2,105,488 | |
eANZ New Zealand International Ltd. of London, senior note, 144A, 2.85%, 8/06/20 | | | New Zealand | | | | 7,500,000 | | | | | | | | 7,554,319 | |
fBanca Monte dei Paschi di Siena SpA, secured note, Reg S, 2.875%, 4/16/59 | | | Italy | | | | 6,300,000 | | | | EUR | | | | 7,315,070 | |
Bank of America Corp., | | | | | | | | | | | | | | | | |
senior note, 2.369% to 7/20/20, FRN thereafter, 7/21/21 | | | United States | | | | 6,800,000 | | | | | | | | 6,815,802 | |
senior note, 3.55% to 3/05/23, FRN thereafter, 3/05/24 | | | United States | | | | 8,950,000 | | | | | | | | 9,332,300 | |
| | | | |
| | | |
| franklintempleton.com | | Annual Report | | 61 |
FRANKLIN INVESTORS SECURITIES TRUST
STATEMENT OF INVESTMENTS
Franklin Low Duration Total Return Fund(continued)
| | | | | | | | | | | | | | | | |
| | | Country | | | Principal
Amount* | | | | | | Value | |
| | | | |
Corporate Bonds(continued) | | | | | | | | | | | | | | | | |
Banks(continued) | | | | | | | | | | | | | | | | |
Barclays PLC, senior note, 4.61% to 2/14/22, FRN thereafter, 2/15/23 | | | United Kingdom | | | | 6,300,000 | | | | | | | $ | 6,577,295 | |
Citibank NA, senior note, 3.165% to 2/19/22, FRN thereafter, 2/19/22 | | | United States | | | | 5,950,000 | | | | | | | | 6,039,420 | |
Citigroup Inc., | | | | | | | | | | | | | | | | |
senior note, 2.40%, 2/18/20 | | | United States | | | | 11,300,000 | | | | | | | | 11,313,449 | |
senior note, 2.65%, 10/26/20 | | | United States | | | | 5,000,000 | | | | | | | | 5,035,570 | |
senior note, 2.35%, 8/02/21 | | | United States | | | | 5,400,000 | | | | | | | | 5,434,706 | |
senior note, 2.90%, 12/08/21 | | | United States | | | | 6,000,000 | | | | | | | | 6,106,830 | |
senior note, 2.75%, 4/25/22 | | | United States | | | | 5,800,000 | | | | | | | | 5,890,200 | |
Credit Suisse of New York, senior note, 4.375%, 8/05/20 | | | Switzerland | | | | 12,000,000 | | | | | | | | 12,305,400 | |
HSBC Holdings PLC, | | | | | | | | | | | | | | | | |
senior note, 3.40%, 3/08/21 | | | United Kingdom | | | | 3,300,000 | | | | | | | | 3,359,499 | |
senior note, 2.95%, 5/25/21 | | | United Kingdom | | | | 14,500,000 | | | | | | | | 14,699,230 | |
Industrial & Commercial Bank of China Ltd., | | | | | | | | | | | | | | | | |
senior note, 3.231%, 11/13/19 | | | China | | | | 5,400,000 | | | | | | | | 5,401,026 | |
senior note, 2.957%, 11/08/22 | | | China | | | | 9,400,000 | | | | | | | | 9,526,195 | |
Realkredit Danmark A/S, secured bond, 1.00%, 4/01/27 | | | Denmark | | | | 30,060,000 | | | | DKK | | | | 4,834,922 | |
Regions Financial Corp., senior note, 3.20%, 2/08/21 | | | United States | | | | 9,300,000 | | | | | | | | 9,429,013 | |
Royal Bank of Canada, secured note, 2.10%, 10/14/21 | | | Canada | | | | 6,300,000 | | | | | | | | 6,317,090 | |
eStandard Chartered PLC, senior note, 144A, 3.885% to 3/15/23, FRN thereafter, 3/15/24 | | | United Kingdom | | | | 10,000,000 | | | | | | | | 10,390,150 | |
SunTrust Bank of Atlanta, senior note, 3.525% to 10/25/20, FRN thereafter, 10/26/21 | | | United States | | | | 5,000,000 | | | | | | | | 5,071,340 | |
eThe Toronto-Dominion Bank, secured note, 144A, 2.25%, 3/15/22 | | | Canada | | | | 12,700,000 | | | | | | | | 12,778,629 | |
fTurkiye Vakiflar Bankasi TAO, secured note, Reg S, 2.375%, 11/04/22 | | | Turkey | | | | 1,800,000 | | | | EUR | | | | 2,026,792 | |
eWestpac Banking Corp., | | | | | | | | | | | | | | | | |
secured note, 144A, 2.10%, 2/25/22 | | | Australia | | | | 9,700,000 | | | | | | | | 9,720,418 | |
senior secured note, 144A, 2.25%, 11/09/21 | | | Australia | | | | 6,300,000 | | | | | | | | 6,319,184 | |
| | | | | | | | | | | | | | | | |
| | | | |
| | | | | | | | | | | | | | | 191,699,337 | |
| | | | | | | | | | | | | | | | |
| | | | |
Capital Goods 0.4% | | | | | | | | | | | | | | | | |
CNH Industrial Capital LLC, senior note, 3.875%, 10/15/21 | | | United States | | | | 5,100,000 | | | | | | | | 5,253,000 | |
gOnsite Rental Group Operations Pty. Ltd., secured note, PIK, 6.10%, 10/26/23 | | | Australia | | | | 347,593 | | | | | | | | 321,524 | |
United Technologies Corp., senior note, 4.50%, 4/15/20 | | | United States | | | | 7,500,000 | | | | | | | | 7,590,105 | |
| | | | | | | | | | | | | | | | |
| | | | |
| | | | | | | | | | | | | | | 13,164,629 | |
| | | | | | | | | | | | | | | | |
Consumer Services 0.5% | | | | | | | | | | | | | | | | |
e1011778 BC ULC/New Red Finance Inc., senior secured note, first lien, 144A, 4.25%, 5/15/24 | | | Canada | | | | 4,000,000 | | | | | | | | 4,112,660 | |
Marriott International Inc., senior note, 2.875%, 3/01/21 | | | United States | | | | 10,000,000 | | | | | | | | 10,113,896 | |
| | | | | | | | | | | | | | | | |
| | | | |
| | | | | | | | | | | | | | | 14,226,556 | |
| | | | | | | | | | | | | | | | |
| | | | |
| | | |
62 | | Annual Report | | franklintempleton.com |
FRANKLIN INVESTORS SECURITIES TRUST
STATEMENT OF INVESTMENTS
Franklin Low Duration Total Return Fund(continued)
| | | | | | | | | | | | | | | | |
| | | Country | | | Principal
Amount* | | | | | | Value | |
| | | | |
Corporate Bonds(continued) | | | | | | | | | | | | | | | | |
Diversified Financials 4.5% | | | | | | | | | | | | | | | | |
American Express Co., senior note, 3.70%, 8/03/23 | | | United States | | | | 6,800,000 | | | | | | | $ | 7,199,075 | |
Capital One Financial Corp., | | | | | | | | | | | | | | | | |
senior note, 2.50%, 5/12/20 | | | United States | | | | 3,900,000 | | | | | | | | 3,908,594 | |
senior note, 3.45%, 4/30/21 | | | United States | | | | 6,800,000 | | | | | | | | 6,942,916 | |
senior note, 3.05%, 3/09/22 | | | United States | | | | 13,600,000 | | | | | | | | 13,868,965 | |
hCia Securitizadora de Creditos Financeiros Vert-Fintech, senior secured note, FRN, 5.96%, (BZDIOVRA + 5.75%), 2/14/24 | | | Brazil | | | | 3,537 | i | | | BRL | | | | 910,995 | |
hDeutsche Bank AG, senior note, FRN, 3.446%, (3-month USD LIBOR + 1.31%), 8/20/20 | | | Germany | | | | 7,500,000 | | | | | | | | 7,518,300 | |
eDexia Credit Local SA, senior note, 144A, 2.375%, 9/20/22 | | | France | | | | 4,550,000 | | | | | | | | 4,617,545 | |
GE Capital International Funding Co., senior note, 2.342%, 11/15/20 | | | United States | | | | 2,000,000 | | | | | | | | 1,999,224 | |
The Goldman Sachs Group Inc., | | | | | | | | | | | | | | | | |
senior note, 2.625%, 4/25/21 | | | United States | | | | 12,000,000 | | | | | | | | 12,115,167 | |
senior note, 2.35%, 11/15/21 | | | United States | | | | 4,000,000 | | | | | | | | 4,015,422 | |
hsenior note, FRN, 3.319%, (3-month USD LIBOR + 1.20%), 9/15/20 | | | United States | | | | 23,000,000 | | | | | | | | 23,191,643 | |
Jyske Realkredit A/S, secured note, 1.00%, 4/01/26 | | | Denmark | | | | 49,970,000 | | | | DKK | | | | 8,006,486 | |
Morgan Stanley, | | | | | | | | | | | | | | | | |
senior note, 2.65%, 1/27/20 | | | United States | | | | 4,000,000 | | | | | | | | 4,006,912 | |
senior note, 2.80%, 6/16/20 | | | United States | | | | 6,600,000 | | | | | | | | 6,632,611 | |
hsenior note, FRN, 3.076%, (3-month USD LIBOR + 1.14%), 1/27/20 | | | United States | | | | 22,400,000 | | | | | | | | 22,451,821 | |
Navient Corp., senior bond, 8.00%, 3/25/20 | | | United States | | | | 1,150,000 | | | | | | | | 1,177,313 | |
ePricoa Global Funding I, secured note, 144A, 3.45%, 9/01/23 | | | United States | | | | 7,200,000 | | | | | | | | 7,554,785 | |
| | | | | | | | | | | | | | | | |
| | | | |
| | | | | | | | | | | | | | | 136,117,774 | |
| | | | | | | | | | | | | | | | |
Energy 1.0% | | | | | | | | | | | | | | | | |
eAker BP ASA, senior note, 144A, 4.75%, 6/15/24 | | | Norway | | | | 1,800,000 | | | | | | | | 1,872,000 | |
eCalifornia Resources Corp., secured note, second lien, 144A, 8.00%, 12/15/22 | | | United States | | | | 1,656,000 | | | | | | | | 488,520 | |
eHarvest Operations Corp., senior note, 144A, 4.20%, 6/01/23 | | | South Korea | | | | 1,900,000 | | | | | | | | 2,030,959 | |
Kinder Morgan Inc., | | | | | | | | | | | | | | | | |
senior note, 3.05%, 12/01/19 | | | United States | | | | 4,500,000 | | | | | | | | 4,503,153 | |
senior note, 3.15%, 1/15/23 | | | United States | | | | 9,300,000 | | | | | | | | 9,535,155 | |
Sabine Pass Liquefaction LLC, senior secured note, first lien, 5.625%, 2/01/21 | | | United States | | | | 10,400,000 | | | | | | | | 10,736,639 | |
jSanchez Energy Corp., senior note, 7.75%, 6/15/21 | | | United States | | | | 1,900,000 | | | | | | | | 95,000 | |
The Williams Cos. Inc., senior note, 4.125%, 11/15/20 | | | United States | | | | 1,700,000 | | | | | | | | 1,726,440 | |
| | | | | | | | | | | | | | | | |
| | | | |
| | | | | | | | | | | | | | | 30,987,866 | |
| | | | | | | | | | | | | | | | |
Food, Beverage & Tobacco 0.4% | | | | | | | | | | | | | | | | |
BAT Capital Corp., senior note, 2.764%, 8/15/22 | | | United Kingdom | | | | 3,000,000 | | | | | | | | 3,029,938 | |
Bunge Ltd. Finance Corp., senior note, 3.50%, 11/24/20 | | | United States | | | | 3,100,000 | | | | | | | | 3,139,907 | |
eImperial Brands Finance PLC, senior note, 144A, 2.95%, 7/21/20 | | | United Kingdom | | | | 6,000,000 | | | | | | | | 6,001,737 | |
| | | | | | | | | | | | | | | | |
| | | | |
| | | | | | | | | | | | | | | 12,171,582 | |
| | | | | | | | | | | | | | | | |
| | | | |
| | | |
| franklintempleton.com | | Annual Report | | 63 |
FRANKLIN INVESTORS SECURITIES TRUST
STATEMENT OF INVESTMENTS
Franklin Low Duration Total Return Fund(continued)
| | | | | | | | | | | | | | | | |
| | | Country | | | Principal
Amount* | | | | | | Value | |
| | | | |
Corporate Bonds(continued) | | | | | | | | | | | | | | | | |
Health Care Equipment & Services 1.7% | | | | | | | | | | | | | | | | |
Anthem Inc., senior note, 2.50%, 11/21/20 | | | United States | | | | 7,800,000 | | | | | | | $ | 7,853,969 | |
Centene Corp., senior note, 4.75%, 5/15/22 | | | United States | | | | 4,000,000 | | | | | | | | 4,100,000 | |
eCHS/Community Health Systems Inc., senior note, 144A, 8.125%, 6/30/24 | | | United States | | | | 1,500,000 | | | | | | | | 1,155,000 | |
Cigna Corp., | | | | | | | | | | | | | | | | |
senior note, 3.40%, 9/17/21 | | | United States | | | | 5,800,000 | | | | | | | | 5,942,911 | |
senior note, 3.75%, 7/15/23 | | | United States | | | | 3,900,000 | | | | | | | | 4,090,763 | |
esenior note, 144A, 4.75%, 11/15/21 | | | United States | | | | 6,700,000 | | | | | | | | 7,041,808 | |
CVS Health Corp., | | | | | | | | | | | | | | | | |
senior note, 2.80%, 7/20/20 | | | United States | | | | 2,800,000 | | | | | | | | 2,813,632 | |
senior note, 2.125%, 6/01/21 | | | United States | | | | 4,100,000 | | | | | | | | 4,109,193 | |
senior note, 3.70%, 3/09/23 | | | United States | | | | 7,000,000 | | | | | | | | 7,303,362 | |
Zimmer Holdings Inc., senior note, 2.70%, 4/01/20 | | | United States | | | | 7,500,000 | | | | | | | | 7,515,542 | |
| | | | | | | | | | | | | | | | |
| | | | |
| | | | | | | | | | | | | | | 51,926,180 | |
| | | | | | | | | | | | | | | | |
Household & Personal Products 0.3% | | | | | | | | | | | | | | | | |
Avon Products Inc., senior bond, 7.00%, 3/15/23 | | | United Kingdom | | | | 5,835,000 | | | | | | | | 6,155,925 | |
The Procter & Gamble Co., senior note, 1.70%, 11/03/21 | | | United States | | | | 3,200,000 | | | | | | | | 3,204,534 | |
| | | | | | | | | | | | | | | | |
| | | | |
| | | | | | | | | | | | | | | 9,360,459 | |
| | | | | | | | | | | | | | | | |
Insurance 0.9% | | | | | | | | | | | | | | | | |
eJackson National Life Global Funding, secured note, 144A, 3.30%, 2/01/22 | | | United States | | | | 12,000,000 | | | | | | | | 12,341,643 | |
eMetropolitan Life Global Funding I, | | | | | | | | | | | | | | | | |
secured note, 144A, 3.375%, 1/11/22 | | | United States | | | | 8,400,000 | | | | | | | | 8,668,548 | |
senior secured bond, 144A, 3.875%, 4/11/22 | | | United States | | | | 5,900,000 | | | | | | | | 6,166,730 | |
| | | | | | | | | | | | | | | | |
| | | | |
| | | | | | | | | | | | | | | 27,176,921 | |
| | | | | | | | | | | | | | | | |
Materials 0.8% | | | | | | | | | | | | | | | | |
eArdagh Packaging Finance PLC/Ardagh MP Holdings USA Inc., senior note, 144A, 4.25%, 9/15/22 | | | Luxembourg | | | | 4,000,000 | | | | | | | | 4,065,000 | |
fCNAC HK Finbridge Co. Ltd., senior note, Reg S, 3.875%, 6/19/29 | | | China | | | | 4,700,000 | | | | | | | | 4,841,729 | |
eFMG Resources (August 2006) Pty. Ltd., senior note, 144A, 4.75%, 5/15/22 | | | Australia | | | | 4,900,000 | | | | | | | | 5,077,625 | |
eGlencore Finance Canada Ltd., senior bond, 144A, 4.95%, 11/15/21 | | | Switzerland | | | | 3,500,000 | | | | | | | | 3,666,001 | |
eGlencore Funding LLC, senior note, 144A, 3.00%, 10/27/22 | | | Switzerland | | | | 2,200,000 | | | | | | | | 2,219,713 | |
eOwens-Brockway Glass Container Inc., senior note, 144A, 5.875%, 8/15/23 | | | United States | | | | 4,000,000 | | | | | | | | 4,240,000 | |
| | | | | | | | | | | | | | | | |
| | | | |
| | | | | | | | | | | | | | | 24,110,068 | |
| | | | | | | | | | | | | | | | |
Media & Entertainment 1.2% | | | | | | | | | | | | | | | | |
eAltice Financing SA, secured bond, 144A, 7.50%, 5/15/26 | | | Luxembourg | | | | 2,000,000 | | | | | | | | 2,127,500 | |
Baidu Inc., senior note, 4.375%, 5/14/24 | | | China | | | | 6,000,000 | | | | | | | | 6,414,240 | |
CCO Holdings LLC/CCO Holdings Capital Corp., senior bond, 5.125%, 2/15/23 | | | United States | | | | 3,800,000 | | | | | | | | 3,890,250 | |
Comcast Corp., senior note, 3.45%, 10/01/21 | | | United States | | | | 12,000,000 | | | | | | | | 12,375,496 | |
DISH DBS Corp., senior bond, 5.875%, 7/15/22 | | | United States | | | | 3,000,000 | | | | | | | | 3,148,680 | |
eSirius XM Radio Inc., senior note, 144A, 4.625%, 7/15/24 | | | United States | | | | 700,000 | | | | | | | | 733,250 | |
| | | | |
| | | |
64 | | Annual Report | | franklintempleton.com |
FRANKLIN INVESTORS SECURITIES TRUST
STATEMENT OF INVESTMENTS
Franklin Low Duration Total Return Fund(continued)
| | | | | | | | | | | | | | | | |
| | | Country | | | Principal
Amount* | | | | | | Value | |
| | | | |
Corporate Bonds(continued) | | | | | | | | | | | | | | | | |
Media & Entertainment(continued) | | | | | | | | | | | | | | | | |
eTencent Holdings Ltd., senior note, 144A, 2.985%, 1/19/23 | | | China | | | | 8,000,000 | | | | | | | $ | 8,137,240 | |
| | | | | | | | | | | | | | | | |
| | | | |
| | | | | | | | | | | | | | | 36,826,656 | |
| | | | | | | | | | | | | | | | |
Pharmaceuticals, Biotechnology & Life Sciences 1.2% | | | | | | | | | | | | | | | | |
Allergan Funding SCS, senior note, 3.45%, 3/15/22 | | | United States | | | | 10,500,000 | | | | | | | | 10,765,595 | |
eBayer U.S. Finance II LLC, senior note, 144A, 3.875%, 12/15/23 | | | Germany | | | | 5,400,000 | | | | | | | | 5,659,982 | |
Biogen Inc., senior note, 2.90%, 9/15/20 | | | United States | | | | 11,500,000 | | | | | | | | 11,592,747 | |
Celgene Corp., senior note, 2.25%, 8/15/21 | | | United States | | | | 7,900,000 | | | | | | | | 7,941,294 | |
| | | | | | | | | | | | | | | | |
| | | | |
| | | | | | | | | | | | | | | 35,959,618 | |
| | | | | | | | | | | | | | | | |
Retailing 1.0% | | | | | | | | | | | | | | | | |
Alibaba Group Holding Ltd., | | | | | | | | | | | | | | | | |
senior note, 2.50%, 11/28/19 | | | China | | | | 11,900,000 | | | | | | | | 11,902,499 | |
senior note, 3.125%, 11/28/21 | | | China | | | | 5,400,000 | | | | | | | | 5,494,419 | |
Amazon.com Inc., senior note, 2.40%, 2/22/23 | | | United States | | | | 4,150,000 | | | | | | | | 4,230,196 | |
Dollar Tree Inc., senior note, 3.70%, 5/15/23 | | | United States | | | | 8,800,000 | | | | | | | | 9,198,552 | |
b,e,gK2016470219 South Africa Ltd., senior secured note, 144A, PIK, 3.00%, 12/31/22 | | | South Africa | | | | 976,985 | | | | | | | | 1,209 | |
b,e,gK2016470260 South Africa Ltd., senior secured note, 144A, PIK, 25.00%, 12/31/22 | | | South Africa | | | | 232,121 | | | | | | | | 1,071 | |
| | | | | | | | | | | | | | | | |
| | | | |
| | | | | | | | | | | | | | | 30,827,946 | |
| | | | | | | | | | | | | | | | |
Technology Hardware & Equipment 0.0%† | | | | | | | | | | | | | | | | |
| | | | |
Tech Data Corp., senior note, 3.70%, 2/15/22 | | | United States | | | | 800,000 | | | | | | | | 821,125 | |
| | | | | | | | | | | | | | | | |
| | | | |
Telecommunication Services 0.2% | | | | | | | | | | | | | | | | |
eSprint Spectrum Co. LLC/Sprint Spectrum Co. II LLC/Sprint | | | | | | | | | | | | | | | | |
Spectrum Co. III LLC, first lien, 144A, 3.36%, 3/20/23 | | | United States | | | | 1,250,000 | | | | | | | | 1,260,937 | |
Telefonica Emisiones SA, senior bond, 5.134%, 4/27/20 | | | Spain | | | | 3,600,000 | | | | | | | | 3,654,342 | |
| | | | | | | | | | | | | | | | |
| | | | |
| | | | | | | | | | | | | | | 4,915,279 | |
| | | | | | | | | | | | | | | | |
Transportation 0.7% | | | | | | | | | | | | | | | | |
eDAE Funding LLC, senior note, 144A, 4.00%, 8/01/20 | | | United Arab Emirates | | | | 4,100,000 | | | | | | | | 4,130,545 | |
FedEx Corp., senior note, 3.40%, 1/14/22 | | | United States | | | | 3,900,000 | | | | | | | | 4,017,413 | |
eKazakhstan Temir Zholy Finance BV, senior bond, 144A, 6.95%, 7/10/42 | | | Kazakhstan | | | | 3,200,000 | | | | | | | | 4,330,560 | |
eMexico City Airport Trust, senior secured bond, first lien, 144A, 5.50%, 7/31/47 | | | Mexico | | | | 2,000,000 | | | | | | | | 2,013,850 | |
f,kRZD Capital PLC, (Russian Railways), loan participation, senior bond, Reg S, 5.70%, 4/05/22 | | | Russia | | | | 4,800,000 | | | | | | | | 5,151,096 | |
| | | | | | | | | | | | | | | | |
| | | | |
| | | | | | | | | | | | | | | 19,643,464 | |
| | | | | | | | | | | | | | | | |
Utilities 1.2% | | | | | | | | | | | | | | | | |
eCalpine Corp., senior secured bond, first lien, 144A, 5.875%, 1/15/24 | | | United States | | | | 4,000,000 | | | | | | | | 4,098,000 | |
Dominion Energy Inc., junior sub. note, 2.579%, 7/01/20 | | | United States | | | | 5,200,000 | | | | | | | | 5,216,160 | |
eKorea East-West Power Co. Ltd., senior note, 144A, 3.875%, 7/19/23 | | | South Korea | | | | 3,300,000 | | | | | | | | 3,494,436 | |
PSEG Power LLC, senior note, 3.00%, 6/15/21 | | | United States | | | | 7,700,000 | | | | | | | | 7,799,530 | |
The Southern Co., senior note, 2.35%, 7/01/21 | | | United States | | | | 6,500,000 | | | | | | | | 6,537,060 | |
| | | | |
| | | |
| franklintempleton.com | | Annual Report | | 65 |
FRANKLIN INVESTORS SECURITIES TRUST
STATEMENT OF INVESTMENTS
Franklin Low Duration Total Return Fund(continued)
| | | | | | | | | | | | | | | | |
| | | Country | | | Principal Amount* | | | | | | Value | |
| | | | |
Corporate Bonds(continued) | | | | | | | | | | | | | | | | |
Utilities(continued) | | | | | | | | | | | | | | | | |
eState Grid Overseas Investment 2016 Ltd., senior note, 144A, 2.75%, 5/04/22 | | | China | | | | 9,400,000 | | | | | | | $ | 9,503,447 | |
| | | | | | | | | | | | | | | | |
| | | | |
| | | | | | | | | | | | | | | 36,648,633 | |
| | | | | | | | | | | | | | | | |
| | | | |
Total Corporate Bonds (Cost $671,167,951) | | | | | | | | | | | | | | | 676,584,093 | |
| | | | | | | | | | | | | | | | |
| | | | |
h,lSenior Floating Rate Interests 2.5% | | | | | | | | | | | | | | | | |
Automobiles & Components 0.1% | | | | | | | | | | | | | | | | |
Adient US LLC, | | | | | | | | | | | | | | | | |
Initial Term Loans, 6.459%, (3-month USD LIBOR + 4.25%), 5/06/24 | | | United States | | | | 517,500 | | | | | | | | 506,503 | |
Initial Term Loans, 6.889%, (6-month USD LIBOR + 4.25%), 5/06/24 | | | United States | | | | 1,547,325 | | | | | | | | 1,514,444 | |
Thor Industries Inc., Initial USD Term Loans, 5.813%, (1-month USD LIBOR + 3.75%), 2/01/26 | | | United States | | | | 1,791,220 | | | | | | | | 1,749,798 | |
| | | | | | | | | | | | | | | | |
| | | | |
| | | | | | | | | | | | | | | 3,770,745 | |
| | | | | | | | | | | | | | | | |
Capital Goods 0.0%† | | | | | | | | | | | | | | | | |
Altra Industrial Motion Corp., Term Loan, 3.786%, (3-month USD LIBOR + 2.00%), 10/01/25 | | | United States | | | | 576,845 | | | | | | | | 575,940 | |
Doncasters U.S. Finance LLC, Second-Lien Term Loans, 10.354%, (3-month USD LIBOR + 8.25%), 10/09/20 | | | United States | | | | 881,574 | | | | | | | | 238,025 | |
Onsite Rental Group Operations Pty. Ltd., Term Loan, 6.323%, (1-month USD LIBOR + 4.50%), 10/25/22 | | | Australia | | | | 254,234 | | | | | | | | 251,056 | |
| | | | | | | | | | | | | | | | |
| | | | |
| | | | | | | | | | | | | | | 1,065,021 | |
| | | | | | | | | | | | | | | | |
| | | | |
Commercial & Professional Services 0.2% | | | | | | | | | | | | | | | | |
United Rentals North America Inc., Initial Term Loans, 3.536%, (1-month USD LIBOR + 1.75%), 10/31/25 | | | United States | | | | 4,683,533 | | | | | | | | 4,708,904 | |
| | | | | | | | | | | | | | | | |
| | | | |
Consumer Services 0.3% | | | | | | | | | | | | | | | | |
Aristocrat Technologies Inc., Term B-3 Loans, 3.716%, (3-month USD LIBOR + 1.75%), 10/19/24 | | | United States | | | | 2,075,901 | | | | | | | | 2,083,362 | |
Avis Budget Car Rental LLC, Tranche B Term Loans, 3.79%, (1-month USD LIBOR + 2.00%), 2/13/25 | | | United States | | | | 1,520,759 | | | | | | | | 1,523,922 | |
Eldorado Resorts Inc., Initial Term Loan, 4.125% - 4.313%, (1-month USD LIBOR + 2.25%), 4/17/24 | | | United States | | | | 1,454,810 | | | | | | | | 1,454,494 | |
Hilton Worldwide Finance LLC, Refinanced Series B-2 Term Loans, 3.573%, (1-month USD LIBOR + 1.75%), 6/17/26 | | | United States | | | | 1,650,000 | | | | | | | | 1,658,663 | |
KFC Holding Co./Pizza Hut Holdings LLC/Taco Bell of America LLC (Yum Brands), Term Loan B, 3.628%, (1-month USD LIBOR + 1.75%), 4/03/25 | | | United States | | | | 1,790,909 | | | | | | | | 1,796,878 | |
| | | | | | | | | | | | | | | | |
| | | | |
| | | | | | | | | | | | | | | 8,517,319 | |
| | | | | | | | | | | | | | | | |
| | | | |
| | | |
66 | | Annual Report | | franklintempleton.com |
FRANKLIN INVESTORS SECURITIES TRUST
STATEMENT OF INVESTMENTS
Franklin Low Duration Total Return Fund(continued)
| | | | | | | | | | | | | | | | |
| | | Country | | | Principal
Amount* | | | | | | Value | |
| | | | |
h,lSenior Floating Rate Interests(continued) | | | | | | | | | | | | | | | | |
Energy 0.3% | | | | | | | | | | | | | | | | |
m,nBuckeye Partners LP, Initial Term, TBD, 11/01/26 | | | United States | | | | 2,000,000 | | | | | | | $ | 2,011,562 | |
Fieldwood Energy LLC, Closing Date Loans, 7.177%, (3-month USD LIBOR + 5.25%), 4/11/22 | | | United States | | | | 6,760,617 | | | | | | | | 5,469,339 | |
Utex Industries Inc., | | | | | | | | | | | | | | | | |
First Lien Initial Term Loan, 5.786%, (1-month USD LIBOR + 4.00%), 5/21/21 | | | United States | | | | 684,589 | | | | | | | | 527,133 | |
Second Lien Initial Term Loan, 9.036%, (1-month USD LIBOR + 7.25%), 5/20/22 | | | United States | | | | 71,338 | | | | | | | | 37,810 | |
Wolverine Fuels Holding LLC, | | | | | | | | | | | | | | | | |
First Lien Initial Term Loan, 7.874%, (3-month USD LIBOR + 5.75%), 8/14/20 | | | United States | | | | 1,371,508 | | | | | | | | 1,341,791 | |
Second Lien Initial Term Loan, 12.874%, (3-month USD LIBOR + 10.75%), 2/16/21 | | | United States | | | | 427,667 | | | | | | | | 404,502 | |
| | | | | | | | | | | | | | | | |
| | | | |
| | | | | | | | | | | | | | | 9,792,137 | |
| | | | | | | | | | | | | | | | |
Food & Staples Retailing 0.0%† | | | | | | | | | | | | | | | | |
Aramark Corp., U.S. Term B-3 Loan, 3.536%, (1-month USD LIBOR + 1.75%), 3/11/25 | | | United States | | | | 95,905 | | | | | | | | 96,205 | |
| | | | | | | | | | | | | | | | |
| | | | |
Food, Beverage & Tobacco 0.1% | | | | | | | | | | | | | | | | |
CSM Bakery Supplies LLC, Second Lien Term Loan, 9.78%, (3-month USD LIBOR + 7.75%), 7/03/21 | | | United States | | | | 772,194 | | | | | | | | 691,114 | |
JBS USA Lux SA, New Term Loans, 4.286%, (1-month USD LIBOR + 2.50%), 5/01/26 | | | United States | | | | 3,785,787 | | | | | | | | 3,803,815 | |
Post Holdings Inc., Series A Incremental Term Loans, 3.83%, (1-month USD LIBOR + 2.00%), 5/24/24 | | | United States | | | | 92,028 | | | | | | | | 92,324 | |
| | | | | | | | | | | | | | | | |
| | | | |
| | | | | | | | | | | | | | | 4,587,253 | |
| | | | | | | | | | | | | | | | |
Health Care Equipment & Services 0.2% | | | | | | | | | | | | | | | | |
HCA Inc., Term Loan B11, 3.536%, (1-month USD LIBOR + 1.75%), 3/18/23 | | | United States | | | | 1,312,820 | | | | | | | | 1,318,819 | |
IQVIA Inc., Term B-2 Dollar Loans, 4.104%, (3-month USD LIBOR + 2.00%), 1/20/25 | | | United States | | | | 3,532,194 | | | | | | | | 3,546,175 | |
| | | | | | | | | | | | | | | | |
| | | | |
| | | | | | | | | | | | | | | 4,864,994 | |
| | | | | | | | | | | | | | | | |
Household & Personal Products 0.1% | | | | | | | | | | | | | | | | |
bFGI Operating Co. LLC (Freedom Group), | | | | | | | | | | | | | | | | |
gTerm Loan, PIK, 12.10%, (3-month USD LIBOR + 10.00%), 5/15/22 | | | United States | | | | 1,124,853 | | | | | | | | 1,097,551 | |
Term Loan FILO, 9.624% - 9.658%, (3-month USD LIBOR + 7.50%), 5/15/21 | | | United States | | | | 2,140,156 | | | | | | | | 2,135,977 | |
| | | | | | | | | | | | | | | | |
| | | | |
| | | | | | | | | | | | | | | 3,233,528 | |
| | | | | | | | | | | | | | | | |
Materials 0.1% | | | | | | | | | | | | | | | | |
Appvion Operations, Inc., | | | | | | | | | | | | | | | | |
Term Loan, 8.10%, (3-month USD LIBOR + 6.00%), 6/15/26 | | | United States | | | | 33,067 | | | | | | | | 33,397 | |
Term Loan, 8.22%, (6-month USD LIBOR + 6.00%), 6/15/26 | | | United States | | | | 525,968 | | | | | | | | 531,228 | |
| | | | |
| | | |
| franklintempleton.com | | Annual Report | | 67 |
FRANKLIN INVESTORS SECURITIES TRUST
STATEMENT OF INVESTMENTS
Franklin Low Duration Total Return Fund(continued)
| | | | | | | | | | | | | | | | |
| | | Country | | | Principal
Amount* | | | | | | Value | |
| | | | |
h,lSenior Floating Rate Interests(continued) | | | | | | | | | | | | | | | | |
Materials(continued) | | | | | | | | | | | | | | | | |
Crown Americas LLC, Dollar Term B Loan, 3.997%, (1-month USD LIBOR + 2.00%), 4/03/25 | | | United States | | | | 1,052,971 | | | | | | | $ | 1,060,868 | |
Oxbow Carbon LLC, | | | | | | | | | | | | | | | | |
Tranche A Term Loan, 4.286%, (1-month USD LIBOR + 2.50%), 1/04/22 | | | United States | | | | 321,287 | | | | | | | | 319,681 | |
Tranche B Term Loan, 5.536%, (1-month USD LIBOR + 3.75%), 1/04/23 | | | United States | | | | 547,500 | | | | | | | | 547,158 | |
| | | | | | | | | | | | | | | | |
| | | | |
| | | | | | | | | | | | | | | 2,492,332 | |
| | | | | | | | | | | | | | | | |
Media & Entertainment 0.3% | | | | | | | | | | | | | | | | |
Charter Communications Operating LLC, Term A-2 Loan, 3.55%, (1-month USD LIBOR + 1.50%), 3/31/23 | | | United States | | | | 1,130,803 | | | | | | | | 1,129,390 | |
CSC Holdings LLC, March 2017 Incremental Term Loans, 4.171%, (1-month USD LIBOR + 2.25%), 7/17/25 | | | United States | | | | 2,192,878 | | | | | | | | 2,185,339 | |
Gray Television Inc., Term C Loan, 4.511%, (1-month USD LIBOR + 2.50%), 1/02/26 | | | United States | | | | 375,921 | | | | | | | | 377,418 | |
Lions Gate Capital Holdings LLC, Term A Loan, 3.536%, (1-month USD LIBOR + 1.75%), 3/22/23 | | | Canada | | | | 144,763 | | | | | | | | 141,325 | |
Live Nation Entertainment Inc., Term Loan B, 3.688%, (1-month USD LIBOR + 1.75%), 10/17/26 | | | United States | | | | 1,292,095 | | | | | | | | 1,294,108 | |
Mediacom Illinois LLC, Tranche N Term Loan, 3.57%, (1-week USD LIBOR + 1.75%), 2/15/24 | | | United States | | | | 3,494,496 | | | | | | | | 3,491,585 | |
| | | | | | | | | | | | | | | | |
| | | | |
| | | | | | | | | | | | | | | 8,619,165 | |
| | | | | | | | | | | | | | | | |
Pharmaceuticals, Biotechnology & Life Sciences 0.3% | | | | | | | | | | | | | | | | |
Endo Luxembourg Finance Co. I S.A.R.L. and Endo LLC, Initial Term Loans, 6.063%, (1-month USD LIBOR + 4.25%), 4/29/24 | | | United States | | | | 118,232 | | | | | | | | 108,646 | |
Grifols Worldwide Operations USA Inc., Tranche B Term Loan, 4.086%, (1-week USD LIBOR + 2.25%), 1/31/25 | | | United States | | | | 1,420,504 | | | | | | | | 1,424,277 | |
mHorizon Pharma Inc., Sixth Amendment Refinanced Term Loans, 4.563%, (1-month USD LIBOR + 2.50%), 5/22/26 | | | United States | | | | 1,452,527 | | | | | | | | 1,458,201 | |
Syneos Health Inc., Initial Term B Loans, 3.786%, (1-month USD LIBOR + 2.00%), 8/01/24 | | | United States | | | | 2,600,559 | | | | | | | | 2,608,686 | |
Valeant Pharmaceuticals International, | | | | | | | | | | | | | | | | |
First Incremental Term Loan, 4.671%, (1-month USD LIBOR + 2.75%), 11/27/25 | | | United States | | | | 1,750,000 | | | | | | | | 1,753,594 | |
Initial Term Loans, 4.921%, (1-month USD LIBOR + 3.00%), 6/02/25 | | | United States | | | | 473,850 | | | | | | | | 476,088 | |
| | | | | | | | | | | | | | | | |
| | | | |
| | | | | | | | | | | | | | | 7,829,492 | |
| | | | | | | | | | | | | | | | |
Retailing 0.2% | | | | | | | | | | | | | | | | |
g99 Cents Only Stores, | | | | | | | | | | | | | | | | |
First Lien Term Loan, PIK, 8.604%, (3-month USD LIBOR + 6.50%), 1/13/22 | | | United States | | | | 257,453 | | | | | | | | 211,755 | |
First Lien Term Loan, PIK, 8.535%, (6-month USD LIBOR + 6.50%), 1/13/22 | | | United States | | | | 193,242 | | | | | | | | 158,942 | |
| | | | |
| | | |
68 | | Annual Report | | franklintempleton.com |
FRANKLIN INVESTORS SECURITIES TRUST
STATEMENT OF INVESTMENTS
Franklin Low Duration Total Return Fund(continued)
| | | | | | | | | | | | | | | | |
| | | Country | | | Principal
Amount* | | | | | | Value | |
| | | | |
h,lSenior Floating Rate Interests(continued) | | | | | | | | | | | | | | | | |
Retailing(continued) | | | | | | | | | | | | | | | | |
Ascena Retail Group Inc., Tranche B Term Loan, 6.313%, (1-month USD LIBOR + 4.50%), 8/21/22 | | | United States | | | | 1,373,784 | | | | | | | $ | 759,588 | |
General Nutrition Centers Inc., Tranche B-2 Term Loans, 10.54%, (1-month USD LIBOR + 8.75%), 3/04/21 | | | United States | | | | 1,166,712 | | | | | | | | 1,102,910 | |
Harbor Freight Tools USA Inc., Refinancing Loans, 4.286%, (1-month USD LIBOR + 2.50%), 8/19/23 | | | United States | | | | 2,532,083 | | | | | | | | 2,483,024 | |
| | | | | | | | | | | | | | | | |
| | | | |
| | | | | | | | | | | | | | | 4,716,219 | |
| | | | | | | | | | | | | | | | |
| | | | |
Semiconductors & Semiconductor Equipment 0.1% | | | | | | | | | | | | | | | | |
MKS Instruments Inc., Tranche B-6 Term Loan, 3.536%, (1-month USD LIBOR + 1.75%), 2/02/26 | | | United States | | | | 494,868 | | | | | | | | 496,878 | |
ON Semiconductor Corp., 2019 Replacement Term B-4 Loans, 3.786%, (1-month USD LIBOR + 2.00%), 9/18/26 | | | United States | | | | 3,234,379 | | | | | | | | 3,253,012 | |
| | | | | | | | | | | | | | | | |
| | | | |
| | | | | | | | | | | | | | | 3,749,890 | |
| | | | | | | | | | | | | | | | |
| | | | |
Software & Services 0.1% | | | | | | | | | | | | | | | | |
Go Daddy Operating Co. LLC, Tranche B-2 Term Loan, 3.536%, (1-month USD LIBOR + 1.75%), 2/15/24 | | | United States | | | | 1,350,213 | | | | | | | | 1,353,285 | |
LegalZoom.com Inc., 2018 Term Loans, 6.286%, (1-month USD LIBOR + 4.50%), 11/21/24 | | | United States | | | | 230,116 | | | | | | | | 230,475 | |
TIBCO Software Inc., Term B-2 Loans, 6.00%, (1-month USD LIBOR + 4.00%), 6/30/26 | | | United States | | | | 1,380,000 | | | | | | | | 1,375,401 | |
| | | | | | | | | | | | | | | | |
| | | | |
| | | | | | | | | | | | | | | 2,959,161 | |
| | | | | | | | | | | | | | | | |
| | | | |
Telecommunication Services 0.1% | | | | | | | | | | | | | | | | |
Global Tel*Link Corp., | | | | | | | | | | | | | | | | |
First Lien Term Loan, 6.036%, (1-month USD LIBOR + 4.25%), 11/29/25 | | | United States | | | | 953,133 | | | | | | | | 834,945 | |
Second Lien Term Loan, 10.036%, (1-month USD LIBOR + 8.25%), 11/29/26 | | | United States | | | | 242,354 | | | | | | | | 231,448 | |
Securus Technologies Holdings Inc., | | | | | | | | | | | | | | | | |
Initial Term Loan, 6.286%, (1-month USD LIBOR + 4.50%), 11/01/24 | | | United States | | | | 348,228 | | | | | | | | 276,592 | |
Second Lien Initial Loan, 10.036%, (1-month USD LIBOR + 8.25%), 11/01/25 | | | United States | | | | 790,636 | | | | | | | | 434,850 | |
mZayo Group LLC, 2017 Incremental Refinancing B-1 Term Loan, 3.786%, (1-month USD LIBOR + 2.00%), 1/19/21 | | | United States | | | | 1,193,878 | | | | | | | | 1,197,857 | |
| | | | | | | | | | | | | | | | |
| | | | |
| | | | | | | | | | | | | | | 2,975,692 | |
| | | | | | | | | | | | | | | | |
| | | | |
Transportation 0.0%† | | | | | | | | | | | | | | | | |
Air Canada, Term Loan, 3.805%, (1-month USD LIBOR + 2.00%), 10/06/23 | | | Canada | | | | 34,630 | | | | | | | | 34,803 | |
Allegiant Travel Co., Class B Term Loans, 6.709%, (3-month USD LIBOR + 4.50%), 2/05/24 | | | United States | | | | 309,501 | | | | | | | | 310,661 | |
| | | | | | | | | | | | | | | | |
| | | | |
| | | | | | | | | | | | | | | 345,464 | |
| | | | | | | | | | | | | | | | |
| | | | |
| | | |
| franklintempleton.com | | Annual Report | | 69 |
FRANKLIN INVESTORS SECURITIES TRUST
STATEMENT OF INVESTMENTS
Franklin Low Duration Total Return Fund(continued)
| | | | | | | | | | | | | | | | |
| | | Country | | | Principal Amount* | | | | | | Value | |
| | | | |
h,lSenior Floating Rate Interests(continued) | | | | | | | | | | | | | | | | |
Utilities 0.0%† | | | | | | | | | | | | | | | | |
EFS Cogen Holdings I LLC (Linden), | | | | | | | | | | | | | | | | |
Term B Advance, 5.04%, (1-month USD LIBOR + 3.25%), 6/28/23 | | | United States | | | | 40,424 | | | | | | | $ | 40,361 | |
Term B Advance, 5.36%, (3-month USD LIBOR + 3.25%), 6/28/23 | | | United States | | | | 99,832 | | | | | | | | 99,676 | |
| | | | | | | | | | | | | | | | |
| | | | |
| | | | | | | | | | | | | | | 140,037 | |
| | | | | | | | | | | | | | | | |
| | | | |
Total Senior Floating Rate Interests (Cost $77,297,359) | | | | | | | | | | | | | | | 74,463,558 | |
| | | | | | | | | | | | | | | | |
| | | | |
oMarketplace Loans 0.8% | | | | | | | | | | | | | | | | |
Diversified Financials 0.8% | | | | | | | | | | | | | | | | |
bLending Club, 6.00% - 28.80%, 9/19/21 - 10/25/24 | | | United States | | | | 23,664,284 | | | | | | | | 22,126,055 | |
bUpgrade, 13.64% - 30.50%, 9/05/22 - 10/24/24 | | | United States | | | | 2,369,621 | | | | | | | | 2,345,867 | |
| | | | | | | | | | | | | | | | |
| | | | |
Total Marketplace Loans (Cost $26,033,905) | | | | | | | | | | | | | | | 24,471,922 | |
| | | | | | | | | | | | | | | | |
| | | | |
Foreign Government and Agency Securities 4.8% | | | | | | | | | | | | | | | | |
eAngolan Government International Bond, senior note, 144A, 8.25%, 5/09/28 | | | Angola | | | | 7,400,000 | | | | | | | | 7,760,676 | |
fBanque Centrale de Tunisie International Bond, senior note, Reg S, 5.625%, 2/17/24 | | | Tunisia | | | | 7,300,000 | | | | EUR | | | | 7,980,200 | |
eDominican Republic, senior note, 144A, 8.90%, 2/15/23 | | | Dominican Republic | | | | 323,200,000 | | | | DOP | | | | 6,133,492 | |
The Export-Import Bank of Korea, senior note, 2.25%, 1/21/20 | | | South Korea | | | | 11,200,000 | | | | | | | | 11,206,552 | |
eGovernment of Belarus International Bond, senior note, 144A, 7.625%, 6/29/27 | | | Belarus | | | | 500,000 | | | | | | | | 575,625 | |
Government of China, 3.29%, 5/23/29 | | | China | | | | 13,500,000 | | | | CNY | | | | 1,915,535 | |
Government of Colombia, | | | | | | | | | | | | | | | | |
senior bond, 9.85%, 6/28/27 | | | Colombia | | | | 19,800,000,000 | | | | COP | | | | 7,365,160 | |
senior bond, 5.00%, 6/15/45 | | | Colombia | | | | 5,800,000 | | | | | | | | 6,770,108 | |
eGovernment of Gabon, 144A, 6.375%, 12/12/24 | | | Gabon | | | | 8,000,000 | | | | | | | | 7,987,320 | |
eGovernment of Iraq, 144A, 5.80%, 1/15/28 | | | Iraq | | | | 8,000,000 | | | | | | | | 7,695,720 | |
eGovernment of Kazakhstan, senior bond, 144A, 4.875%, 10/14/44 | | | Kazakhstan | | | | 3,500,000 | | | | | | | | 4,268,005 | |
Government of Mexico, senior note, 4.15%, 3/28/27 | | | Mexico | | | | 7,600,000 | | | | | | | | 8,146,440 | |
Government of Peru, senior bond, 6.55%, 3/14/37 | | | Peru | | | | 2,200,000 | | | | | | | | 3,218,072 | |
Government of South Africa, senior bond, 7.00%, 2/28/31 | | | South Africa | | | | 115,300,000 | | | | ZAR | | | | 6,366,240 | |
e,fGovernment of Spain, | | | | | | | | | | | | | | | | |
senior bond, 144A, Reg S, 2.70%, 10/31/48 | | | Spain | | | | 7,350,000 | | | | EUR | | | | 11,398,808 | |
senior note, 144A, Reg S, 0.25%, 7/30/24 | | | Spain | | | | 22,500,000 | | | | EUR | | | | 25,644,694 | |
eGovernment of Ukraine, senior bond, 144A, 7.375%, 9/25/32 | | | Ukraine | | | | 8,100,000 | | | | | | | | 8,484,871 | |
pGovernment of Uruguay, senior bond, Index Linked, 3.70%, 6/26/37 | | | Uruguay | | | | 222,537,457 | | | | UYU | | | | 5,938,933 | |
The Korea Development Bank, senior note, 3.375%, 3/12/23 | | | South Korea | | | | 6,500,000 | | | | | | | | 6,768,158 | |
Nota do Tesouro Nacional, 10.00%, 1/01/21 | | | Brazil | | | | 2,350 | i | | | BRL | | | | 620,290 | |
| | | | | | | | | | | | | | | | |
| | | | |
Total Foreign Government and Agency Securities (Cost $146,406,250) | | | | | | | | | | | | | | | 146,244,899 | |
| | | | | | | | | | | | | | | | |
| | | | |
| | | |
70 | | Annual Report | | franklintempleton.com |
FRANKLIN INVESTORS SECURITIES TRUST
STATEMENT OF INVESTMENTS
Franklin Low Duration Total Return Fund(continued)
| | | | | | | | | | | | | | | | |
| | | Country | | | Principal
Amount* | | | | | | Value | |
| | | | |
U.S. Government and Agency Securities 12.0% | | | | | | | | | | | | | | | | |
U.S. Treasury Note, | | | | | | | | | | | | | | | | |
2.125%, 1/31/21 | | | United States | | | | 55,500,000 | | | | | | | $ | 55,873,975 | |
2.25%, 7/31/21 | | | United States | | | | 39,000,000 | | | | | | | | 39,457,031 | |
2.125%, 9/30/21 | | | United States | | | | 117,000,000 | | | | | | | | 118,247,695 | |
pIndex Linked, 1.375%, 1/15/20 | | | United States | | | | 25,935,113 | | | | | | | | 25,937,139 | |
pIndex Linked, 0.125%, 4/15/21 | | | United States | | | | 19,484,874 | | | | | | | | 19,338,313 | |
pIndex Linked, 0.125%, 1/15/22 | | | United States | | | | 40,807,271 | | | | | | | | 40,545,202 | |
pIndex Linked, 0.125%, 7/15/22 | | | United States | | | | 31,238,216 | | | | | | | | 31,192,802 | |
pIndex Linked, 0.375%, 7/15/23 | | | United States | | | | 32,081,106 | | | | | | | | 32,353,627 | |
| | | | | | | | | | | | | | | | |
| | | | |
Total U.S. Government and Agency Securities
(Cost $360,798,801) | | | | | | | | | | | | | | | 362,945,784 | |
| | | | | | | | | | | | | | | | |
| | | | |
Asset-Backed Securities and Commercial
Mortgage-Backed Securities 46.5% | | | | | | | | | | | | | | | | |
| | | | |
Automobiles & Components 0.0%† | | | | | | | | | | | | | | | | |
qCountrywide Asset-Backed Certificates, 2002-3, 1A1, FRN, 2.563%, (1-month USD LIBOR + 0.74%), 5/25/32 | | | United States | | | | 1,245 | | | | | | | | 1,217 | |
| | | | | | | | | | | | | | | | |
| | | | |
Banks 0.3% | | | | | | | | | | | | | | | | |
e,rBX Commercial Mortgage Trust, 2018-IND, A, 144A, FRN, 2.515%, 11/15/35 | | | United States | | | | 5,567,626 | | | | | | | | 5,567,674 | |
rCommercial Mortgage Trust, | | | | | | | | | | | | | | | | |
2006-GG7, AJ, FRN, 5.637%, 7/10/38 | | | United States | | | | 1,908,000 | | | | | | | | 1,768,060 | |
2006-GG7, AM, FRN, 5.637%, 7/10/38 | | | United States | | | | 102,317 | | | | | | | | 103,014 | |
qCWABS Inc. Asset-Backed Certificates, 2004-1, M1, FRN, 2.573%, (1-month USD LIBOR + 0.75%), 3/25/34 | | | United States | | | | 134,052 | | | | | | | | 135,119 | |
r,sGE Capital Commercial Mortgage Corp. Trust, 2007-C1, AM, FRN, 5.606%, 12/10/49 | | | United States | | | | 858,348 | | | | | | | | 758,402 | |
qMerrill Lynch Mortgage Investors Trust, 2003-A, 1A, FRN, 2.563%, (1-month USD LIBOR + 0.74%), 3/25/28 | | | United States | | | | 212,832 | | | | | | | | 212,899 | |
qMorgan Stanley ABS Capital I Inc. Trust, 2005-WMC, M2, FRN, 2.558%, (1-month USD LIBOR + 0.735%), 1/25/35 | | | United States | | | | 30,800 | | | | | | | | 31,376 | |
rWells Fargo Mortgage Backed Securities Trust, | | | | | | | | | | | | | | | | |
2005-AR, 1A1, FRN, 5.08%, 2/25/35 | | | United States | | | | 593,820 | | | | | | | | 619,475 | |
2005-AR9, 2A2, FRN, 4.592%, 10/25/33 | | | United States | | | | 86,686 | | | | | | | | 88,048 | |
| | | | | | | | | | | | | | | | |
| | | | |
| | | | | | | | | | | | | | | 9,284,067 | |
| | | | | | | | | | | | | | | | |
| | | | |
Diversified Financials 46.2% | | | | | | | | | | | | | | | | |
e,qAlinea CLO Ltd., 2018-1A, B, 144A, FRN, 3.616%, (3-month USD LIBOR + 1.65%), 7/20/31 | | | United States | | | | 3,000,000 | | | | | | | | 2,941,950 | |
American Express Credit Account Master Trust, | | | | | | | | | | | | | | | | |
2017-1, B, 2.10%, 9/15/22 | | | United States | | | | 13,480,000 | | | | | | | | 13,479,476 | |
2017-6, A, 2.04%, 5/15/23 | | | United States | | | | 16,300,000 | | | | | | | | 16,336,316 | |
2018-1, A, 2.67%, 10/17/22 | | | United States | | | | 12,000,000 | | | | | | | | 12,039,187 | |
qAmerican Home Mortgage Investment Trust, | | | | | | | | | | | | | | | | |
2004-3, 4A, FRN, 3.531%, (6-month USD LIBOR + 1.50%), 10/25/34 | | | United States | | | | 1,402,597 | | | | | | | | 1,411,942 | |
2005-1, 6A, FRN, 4.059%, (6-month USD LIBOR + 2.00%), 6/25/45 | | | United States | | | | 755,992 | | | | | | | | 778,556 | |
| | | | |
| | | |
| franklintempleton.com | | Annual Report | | 71 |
FRANKLIN INVESTORS SECURITIES TRUST
STATEMENT OF INVESTMENTS
Franklin Low Duration Total Return Fund(continued)
| | | | | | | | | | | | | | | | |
| | | Country | | | Principal
Amount* | | | | | | Value | |
| | | | |
Asset-Backed Securities and Commercial
Mortgage-Backed Securities(continued) | | | | | | | | | | | | | | | | |
Diversified Financials(continued) | | | | | | | | | | | | | | | | |
eAmerican Homes 4 Rent, 2015-SFR1, A, 144A, 3.467%, 4/17/52 | | | United States | | | | 5,634,933 | | | | | | | $ | 5,897,204 | |
qAmeriquest Mortgage Securities Inc. Asset-Backed Pass-Through Certificates, 2004-R4, M1, FRN, 2.648%, (1-month USD LIBOR + 0.825%), 6/25/34 | | | United States | | | | 379,984 | | | | | | | | 382,032 | |
e,rAMMC CLO 15 Ltd., | | | | | | | | | | | | | | | | |
2014-15A, ARR, 144A, FRN, 3.261%, 1/15/32 | | | United States | | | | 4,700,000 | | | | | | | | 4,694,642 | |
2014-15A, BRR, 144A, FRN, 3.801%, 1/15/32 | | | United States | | | | 1,494,355 | | | | | | | | 1,474,570 | |
eAMMC CLO XI Ltd., | | | | | | | | | | | | | | | | |
r2012-11A, A1R2, 144A, FRN, 2.946%, 4/30/31 | | | United States | | | | 2,750,000 | | | | | | | | 2,728,825 | |
q2012-11A, BR2, 144A, FRN, 3.536%, (3-month USD LIBOR + 1.60%), 4/30/31 | | | United States | | | | 1,700,000 | | | | | | | | 1,661,767 | |
q2012-11A, CR2, 144A, FRN, 3.836%, (3-month USD LIBOR + 1.90%), 4/30/31 | | | United States | | | | 1,850,000 | | | | | | | | 1,742,126 | |
e,qAntares CLO Ltd., 2018-1A, B, 144A, FRN, 3.616%, (3-month USD LIBOR + 1.65%), 4/20/31 | | | United States | | | | 5,400,000 | | | | | | | | 5,262,732 | |
e,qARES CLO Ltd., 2018-48A, B, 144A, FRN, 3.546%, (3-month USD LIBOR + 1.58%), 7/20/30 | | | United States | | | | 1,000,000 | | | | | | | | 985,680 | |
e,rARES L CLO Ltd., 2018-50A, B, 144A, FRN, 3.701%, 1/15/32 | | | United States | | | | 4,000,000 | | | | | | | | 3,942,760 | |
e,rARES LII CLO Ltd., 2019-52A, C, 144A, FRN, 4.633%, 4/22/31 | | | United States | | | | 1,000,000 | | | | | | | | 995,020 | |
e,rARES XLIX CLO Ltd., 2018-49A, C, 144A, FRN, 3.903%, 7/22/30 | | | United States | | | | 3,100,000 | | | | | | | | 2,986,881 | |
e,qARES XLVIII CLO Ltd., 2018-48A, C, 144A, FRN, 3.766%, (3-month USD LIBOR + 1.80%), 7/20/30 | | | United States | | | | 3,135,000 | | | | | | | | 2,988,658 | |
qArgent Securities Inc. Asset-Backed Pass-Through Certificates, 2005-W2, A2C, FRN, 2.183%, (1-month USD LIBOR + 0.36%), 10/25/35 | | | United States | | | | 315,010 | | | | | | | | 316,353 | |
e,r,tArmada Euro CLO IV DAC, 4A, B, 144A, FRN, 1.70%, 7/15/33 | | | United Kingdom | | | | 10,700,000 | | | | EUR | | | | 11,933,711 | |
e,qAtrium IX, 9A, AR, 144A, FRN, 3.384%, (3-month USD LIBOR + 1.24%), 5/28/30 | | | United States | | | | 2,000,000 | | | | | | | | 1,999,040 | |
e,rAtrium XII, 2012A, CR, 144A, FRN, 2.783%, 4/22/27 | | | United States | | | | 9,000,000 | | | | | | | | 8,977,770 | |
e,qAtrium XIII, | | | | | | | | | | | | | | | | |
2013A, B, 144A, FRN, 3.434%, (3-month USD LIBOR + 1.50%), 11/21/30 | | | United States | | | | 1,000,000 | | | | | | | | 988,500 | |
2013A, C, 144A, FRN, 3.734%, (3-month USD LIBOR + 1.80%), 11/21/30 | | | United States | | | | 1,000,000 | | | | | | | | 954,000 | |
e,rAtrium XIV LLC, | | | | | | | | | | | | | | | | |
14A, B, 144A, FRN, 3.701%, 8/23/30 | | | United States | | | | 2,400,000 | | | | | | | | 2,386,416 | |
14A, C, 144A, FRN, 3.951%, 8/23/30 | | | United States | | | | 4,000,000 | | | | | | | | 3,862,280 | |
e,rAtrium XV, 15A, B, 144A, FRN, 3.684%, 1/23/31 | | | United States | | | | 2,000,000 | | | | | | | | 1,991,560 | |
e,qBain Capital Credit CLO, 2018-1A, A1, 144A, FRN, 2.894%, (3-month USD LIBOR + 0.96%), 4/23/31 | | | United States | | | | 2,000,000 | | | | | | | | 1,975,360 | |
eBAMLL Commercial Mortgage Securities Trust, 2012-PARK, A, 144A, 2.959%, 12/10/30 | | | United States | | | | 3,200,000 | | | | | | | | 3,293,555 | |
r,uBank, 2018-BN13, XA, IO, FRN, 0.515%, 8/15/61 | | | United States | | | | 106,419,998 | | | | | | | | 3,593,239 | |
e,rBCC Middle Market CLO LLC, 2018-1A, A2, 144A, FRN, 4.116%, 10/20/30 | | | United States | | | | 2,100,000 | | | | | | | | 2,084,565 | |
e,qBellemeade Re Ltd., 2018-1A, M1B, 144A, FRN, 3.423%, (1-month USD LIBOR + 1.60%), 4/25/28 | | | United States | | | | 5,208,216 | | | | | | | | 5,215,886 | |
e,qBetony CLO 2 Ltd., 2018-1A, A2, 144A, FRN, 3.536%, (3-month USD LIBOR + 1.60%), 4/30/31 | | | United States | | | | 3,500,000 | | | | | | | | 3,418,275 | |
| | | | |
| | | |
72 | | Annual Report | | franklintempleton.com |
FRANKLIN INVESTORS SECURITIES TRUST
STATEMENT OF INVESTMENTS
Franklin Low Duration Total Return Fund(continued)
| | | | | | | | | | | | | | | | |
| | | Country | | | Principal
Amount* | | | | | | Value | |
| | | | |
Asset-Backed Securities and Commercial
Mortgage-Backed Securities(continued) | | | | | | | | | | | | | | | | |
Diversified Financials(continued) | | | | | | | | | | | | | | | | |
e,rBlueMountain CLO Ltd., | | | | | | | | | | | | | | | | |
2012-2A, AR2, 144A, FRN, 3.186%, 11/20/28 | | | United States | | | | 2,841,775 | | | | | | | $ | 2,846,180 | |
2012-2A, BR2, 144A, FRN, 3.586%, 11/20/28 | | | United States | | | | 2,051,917 | | | | | | | | 2,042,150 | |
2014-2A, A2R2, 144A, FRN, 3.366%, 10/20/30 | | | United States | | | | 974,225 | | | | | | | | 957,468 | |
2014-2A, CR2, 144A, FRN, 4.166%, 10/20/30 | | | United States | | | | 1,000,000 | | | | | | | | 953,960 | |
2018-3A, B, 144A, FRN, 3.71%, 10/25/30 | | | United States | | | | 4,000,000 | | | | | | | | 3,985,000 | |
2018-3A, C, 144A, FRN, 4.14%, 10/25/30 | | | United States | | | | 1,785,715 | | | | | | | | 1,714,644 | |
e,rBlueMountain CLO XXIV Ltd., | | | | | | | | | | | | | | | | |
2019-24A, A2, 144A, FRN, 3.566%, 4/20/31 | | | United States | | | | 4,687,500 | | | | | | | | 4,674,234 | |
2019-24A, C, 144A, FRN, 4.666%, 4/20/31 | | | United States | | | | 1,750,000 | | | | | | | | 1,757,227 | |
e,r,tBlueMountain EUR CLO, | | | | | | | | | | | | | | | | |
5A, A, 144A, FRN, 0.91%, 1/15/33 | | | Ireland | | | | 14,100,000 | | | | EUR | | | | 15,725,731 | |
5A, B, 144A, FRN, 1.55%, 1/15/33 | | | Ireland | | | | 4,300,000 | | | | EUR | | | | 4,795,790 | |
e,qBlueMountain Fuji U.S. CLO II Ltd., | | | | | | | | | | | | | | | | |
2017-2A, A1A, 144A, FRN, 3.166%, (3-month USD LIBOR + 1.20%), 10/20/30 | | | United States | | | | 3,500,000 | | | | | | | | 3,502,240 | |
2017-2A, B, 144A, FRN, 4.116%, (3-month USD LIBOR + 2.15%), 10/20/30 | | | United States | | | | 1,000,000 | | | | | | | | 968,080 | |
e,qBlueMountain Fuji U.S. CLO III Ltd., | | | | | | | | | | | | | | | | |
2017-3A, A2, 144A, FRN, 3.151%, (3-month USD LIBOR + 1.15%), 1/15/30 | | | United States | | | | 1,000,000 | | | | | | | | 977,500 | |
2017-3A, C, 144A, FRN, 3.701%, (3-month USD LIBOR + 1.70%), 1/15/30 | | | United States | | | | 500,000 | | | | | | | | 473,110 | |
eBRAVO Residential Funding Trust, 2019-1, A1C, 144A, 3.50%, 3/25/58 | | | United States | | | | 6,843,104 | | | | | | | | 6,971,571 | |
e,rBurnham Park CLO Ltd., 2016-1A, BR, 144A, FRN, 3.466%, 10/20/29 | | | United States | | | | 2,321,575 | | | | | | | | 2,297,454 | |
Capital One Multi-Asset Execution Trust, | | | | | | | | | | | | | | | | |
2016-A5, A5, 1.66%, 6/17/24 | | | United States | | | | 8,878,000 | | | | | | | | 8,857,858 | |
2017-A4, A4, 1.99%, 7/17/23 | | | United States | | | | 14,230,000 | | | | | | | | 14,248,996 | |
e,qCarlyle Global Market Strategies CLO Ltd., | | | | | | | | | | | | | | | | |
2014-1A, A2R2, 144A, FRN, 3.132%, (3-month USD LIBOR + 1.13%), 4/17/31 | | | United States | | | | 1,200,000 | | | | | | | | 1,168,812 | |
2014-4RA, A2, 144A, FRN, 3.601%, (3-month USD LIBOR + 1.60%), 7/15/30 | | | United States | | | | 12,000,000 | | | | | | | | 11,791,560 | |
e,rCarlyle GMS Finance MM CLO LLC, 2015-1A, A2R, 144A, FRN, 4.201%, 10/15/31 | | | United States | | | | 6,500,000 | | | | | | | | 6,447,675 | |
e,qCarlyle U.S. CLO Ltd., | | | | | | | | | | | | | | | | |
2017-1A, A1A, 144A, FRN, 3.266%, (3-month USD LIBOR + 1.30%), 4/20/31 | | | United States | | | | 1,000,000 | | | | | | | | 998,770 | |
2017-2A, B, 144A, FRN, 4.366%, (3-month USD LIBOR + 2.40%), 7/20/31 | | | United States | | | | 2,110,000 | | | | | | | | 2,059,254 | |
2017-3A, B, 144A, FRN, 4.316%, (3-month USD LIBOR + 2.35%), 7/20/29 | | | United States | | | | 1,250,000 | | | | | | | | 1,216,112 | |
2017-5A, B, 144A, FRN, 3.766%, (3-month USD LIBOR + 1.80%), 1/20/30 | | | United States | | | | 2,200,000 | | | | | | | | 2,062,962 | |
| | | | |
| | | |
| franklintempleton.com | | Annual Report | | 73 |
FRANKLIN INVESTORS SECURITIES TRUST
STATEMENT OF INVESTMENTS
Franklin Low Duration Total Return Fund(continued)
| | | | | | | | | | | | | | | | |
| | | Country | | | Principal
Amount* | | | | | | Value | |
| | | | |
Asset-Backed Securities and Commercial
Mortgage-Backed Securities(continued) | | | | | | | | | | | | | | | | |
Diversified Financials(continued) | | | | | | | | | | | | | | | | |
e,qCatamaran CLO Ltd., 2014-2A, BR, 144A, FRN, 4.953%, (3-month USD LIBOR + 2.95%), 10/18/26 | | | United States | | | | 3,011,300 | | | | | | | $ | 3,012,685 | |
e,rCIM Trust, | | | | | | | | | | | | | | | | |
2018-INV1, A4, 144A, FRN, 4.00%, 8/25/48 | | | United States | | | | 7,124,450 | | | | | | | | 7,455,519 | |
2019-INV2, A3, 144A, FRN, 4.00%, 5/25/49 | | | United States | | | | 13,606,058 | | | | | | | | 14,227,063 | |
Citibank Credit Card Issuance Trust, | | | | | | | | | | | | | | | | |
2017-A3, A3, 1.92%, 4/07/22 | | | United States | | | | 11,000,000 | | | | | | | | 11,003,760 | |
2018-A1, A1, 2.49%, 1/20/23 | | | United States | | | | 13,700,000 | | | | | | | | 13,815,899 | |
e,rCole Park CLO Ltd., 2015-1A, BR, 144A, FRN, 3.566%, 10/20/28 | | | United States | | | | 1,714,286 | | | | | | | | 1,703,280 | |
e,rColumbia Cent CLO 27 Ltd., 2018-27A, A2A, 144A, FRN, 3.54%, 10/25/28 | | | United States | | | | 1,538,462 | | | | | | | | 1,525,816 | |
e,rCOMM Mortgage Trust, 2014-277P, A, 144A, FRN, 3.732%, 8/10/49. | | | United States | | | | 2,980,000 | | | | | | | | 3,183,994 | |
rConseco Finance Securitizations Corp., 2002-2, M1, FRN, 7.424%, 3/01/33 | | | United States | | | | 582,820 | | | | | | | | 632,916 | |
rConseco Financial Corp., 1998-6, A8, FRN, 6.66%, 6/01/30 | | | United States | | | | 2,642,433 | | | | | | | | 2,733,312 | |
e,rConsumer Loan Underlying Bond CLUB Certificate Issuer Trust I, | | | | | | | | | | | | | | | | |
2019-S6, PT, 144A, FRN, 12.793%, 10/17/44 | | | United States | | | | 1,720,503 | | | | | | | | 1,606,347 | |
2018-14, PT, 144A, FRN, 9.459%, 9/16/41 | | | United States | | | | 2,586,727 | | | | | | | | 2,539,266 | |
2018-29, PT, 144A, FRN, 25.917%, 12/15/43 | | | United States | | | | 721,225 | | | | | | | | 596,586 | |
2018-8, 144A, FRN, 8.60%, 6/17/41 | | | United States | | | | 1,929,917 | | | | | | | | 1,781,617 | |
2019-26, PT, 144A, FRN, 20.442%, 8/15/44 | | | United States | | | | 2,547,260 | | | | | | | | 2,397,754 | |
2019-31, PT, 144A, FRN, 21.412%, 9/15/44 | | | United States | | | | 2,300,367 | | | | | | | | 2,149,903 | |
2019-37, PT, 144A, FRN, 20.088%, 10/17/44 | | | United States | | | | 2,157,523 | | | | | | | | 2,073,145 | |
2019-42, PT, 144A, FRN, 24.207%, 11/15/44 | | | United States | | | | 2,048,001 | | | | | | | | 1,969,275 | |
2019-S1, PT, 144A, FRN, 14.902%, 4/15/44 | | | United States | | | | 2,058,107 | | | | | | | | 1,807,253 | |
2019-S2, PT, 144A, FRN, 14.389%, 5/16/44 | | | United States | | | | 1,501,488 | | | | | | | | 1,372,529 | |
2019-S3, PT, 144A, FRN, 14.539%, 6/15/44 | | | United States | | | | 912,502 | | | | | | | | 851,455 | |
2019-S4, PT, 144A, FRN, 13.454%, 8/15/44 | | | United States | | | | 1,943,026 | | | | | | | | 1,813,564 | |
2019-S5, PT, 144A, FRN, 13.279%, 9/15/44 | | | United States | | | | 1,846,587 | | | | | | | | 1,693,239 | |
e,qCook Park CLO Ltd., 2018-1A, A2, 144A, FRN, 3.122%, (3-month USD LIBOR + 1.12%), 4/17/30 | | | United States | | | | 1,000,000 | | | | | | | | 974,180 | |
rCountrywide Home Loans, 2004-11, 2A1, FRN, 3.82%, 7/25/34 | | | United States | | | | 1,241,833 | | | | | | | | 1,270,706 | |
Credit Suisse First Boston Mortgage Securities Corp., 2004-6, 3A1, 5.00%, 9/25/19 | | | United States | | | | 167,135 | | | | | | | | 151,351 | |
e,rCSMC Trust, 2014-IVR3, A1, 144A, FRN, 3.50%, 7/25/44 | | | United States | | | | 1,684,145 | | | | | | | | 1,716,135 | |
Discover Card Execution Note Trust, | | | | | | | | | | | | | | | | |
2018-A4, A4, 3.11%, 1/16/24 | | | United States | | | | 8,230,000 | | | | | | | | 8,414,974 | |
2018-A5, A5, 3.32%, 3/15/24 | | | United States | | | | 9,386,000 | | | | | | | | 9,654,143 | |
r2019-A2, A, FRN, 2.191%, 12/15/23. | | | United States | | | | 9,250,000 | | | | | | | | 9,266,046 | |
2019-A3, A, 1.89%, 10/15/24 | | | United States | | | | 11,820,000 | | | | | | | | 11,843,931 | |
| | | | |
| | | |
74 | | Annual Report | | franklintempleton.com |
FRANKLIN INVESTORS SECURITIES TRUST
STATEMENT OF INVESTMENTS
Franklin Low Duration Total Return Fund (continued)
| | | | | | | | | | | | | | | | |
| | | Country | | | Principal
Amount* | | | | | | Value | |
| | | | |
Asset-Backed Securities and Commercial
Mortgage-Backed Securities (continued) | | | | | | | | | | | | | | | | |
Diversified Financials(continued) | | | | | | | | | | | | | | | | |
e,qDryden 41 Senior Loan Fund, 2015-41A, AR, 144A, FRN, 2.956%, (3-month USD LIBOR + 0.97%), 4/15/31 | | | United States | | | | 3,025,000 | | | | | | | $ | 2,992,058 | |
e,rDryden 45 Senior Loan Fund, 2016-45A, CR, 144A, FRN, 4.201%, 10/15/30 | | | United States | | | | 625,000 | | | | | | | | 615,119 | |
e,qDryden 49 Senior Loan Fund, 2017-49A, C, 144A, FRN, 4.353%, (3-month USD LIBOR + 2.35%), 7/18/30 | | | United States | | | | 870,000 | | | | | | | | 848,676 | |
e,qDryden 50 Senior Loan Fund, | | | | | | | | | | | | | | | | |
2017-50A, A1, 144A, FRN, 3.221%, (3-month USD LIBOR + 1.22%), 7/15/30 | | | United States | | | | 2,640,000 | | | | | | | | 2,631,288 | |
2017-50A, C, 144A, FRN, 4.251%, (3-month USD LIBOR + 2.25%), 7/15/30 | | | United States | | | | 2,150,000 | | | | | | | | 2,150,666 | |
e,qDryden 55 CLO Ltd., | | | | | | | | | | | | | | | | |
2018-55A, A1, 144A, FRN, 3.021%, (3-month USD LIBOR + 1.02%), 4/15/31 | | | United States | | | | 3,000,000 | | | | | | | | 2,972,340 | |
2018-55A, C, 144A, FRN, 3.901%, (3-month USD LIBOR + 1.90%), 4/15/31 | | | United States | | | | 600,000 | | | | | | | | 568,896 | |
2018-55A, D, 144A, FRN, 4.851%, (3-month USD LIBOR + 2.85%), 4/15/31 | | | United States | | | | 300,000 | | | | | | | | 272,409 | |
e,qDryden 58 CLO Ltd., | | | | | | | | | | | | | | | | |
2018-58A, A2, 144A, FRN, 3.252%, (3-month USD LIBOR + 1.25%), 7/17/31 | | | United States | | | | 1,600,000 | | | | | | | | 1,573,744 | |
2018-58A, B, 144A, FRN, 3.502%, (3-month USD LIBOR + 1.50%), 7/17/31 | | | United States | | | | 11,000,000 | | | | | | | | 10,792,760 | |
e,qDryden 64 CLO Ltd., 2018-64A, A, 144A, FRN, 2.973%, (3-month USD LIBOR + 0.97%), 4/18/31 | | | United States | | | | 6,500,000 | | | | | | | | 6,423,820 | |
e,rDryden 70 CLO Ltd., 2018-70A, B, 144A, FRN, 3.701%, 1/16/32 | | | United States | | | | 560,580 | | | | | | | | 555,877 | |
e,rDunedin Park CLO DAC, | | | | | | | | | | | | | | | | |
1A, A1, 144A, FRN, 1.07%, 10/22/32 | | | Ireland | | | | 8,200,000 | | | | EUR | | | | 9,079,062 | |
1A, A2A, 144A, FRN, 1.75%, 10/22/32 | | | Ireland | | | | 3,900,000 | | | | EUR | | | | 4,312,235 | |
e,rEaton Vance CLO Ltd., 2014-1RA, C, 144A, FRN, 4.101%, 7/15/30 | | | United States | | | | 789,030 | | | | | | | | 763,110 | |
e,qEllington CLO III Ltd., 2018-3A, A1, 144A, FRN, 3.616%, (3-month USD LIBOR + 1.65%), 7/20/30 | | | United States | | | | 3,400,000 | | | | | | | | 3,383,850 | |
e,rEuro-Galaxy III CLO BV, 2013-3A, B2ER, 144A, FRN, 1.50%, 1/17/31 | | | Netherlands | | | | 1,800,000 | | | | EUR | | | | 2,004,015 | |
e,rEuro-Galaxy V CLO BV, 2016-5A, BR, 144A, FRN, 1.60%, 11/10/30 | | | Netherlands | | | | 6,000,000 | | | | EUR | | | | 6,691,800 | |
FHLMC Structured Agency Credit Risk Debt Notes, | | | | | | | | | | | | | | | | |
q2013-DN2, M2, FRN, 6.073%, (1-month USD LIBOR + 4.25%), 11/25/23 | | | United States | | | | 6,474,000 | | | | | | | | 6,987,559 | |
q2014-DN1, M2, FRN, 4.023%, (1-month USD LIBOR + 2.20%), 2/25/24 | | | United States | | | | 833,001 | | | | | | | | 842,623 | |
q2014-DN2, M3, FRN, 5.423%, (1-month USD LIBOR + 3.60%), 4/25/24 | | | United States | | | | 14,350,000 | | | | | | | | 15,161,381 | |
q2014-DN3, M3, FRN, 5.823%, (1-month USD LIBOR + 4.00%), 8/25/24 | | | United States | | | | 1,887,705 | | | | | | | | 1,992,679 | |
q2014-DN4, M3, FRN, 6.373%, (1-month USD LIBOR + 4.55%), 10/25/24 | | | United States | | | | 7,330,755 | | | | | | | | 7,863,516 | |
q2014-HQ1, M3, FRN, 5.923%, (1-month USD LIBOR + 4.10%), 8/25/24 | | | United States | | | | 10,078,927 | | | | | | | | 10,653,721 | |
| | | | |
| | | |
| franklintempleton.com | | Annual Report | | 75 |
FRANKLIN INVESTORS SECURITIES TRUST
STATEMENT OF INVESTMENTS
Franklin Low Duration Total Return Fund(continued)
| | | | | | | | | | | | | | | | |
| | | Country | | | Principal
Amount* | | | | | | Value | |
| | | | |
Asset-Backed Securities and Commercial
Mortgage-Backed Securities(continued) | | | | | | | | | | | | | | | | |
Diversified Financials(continued) | | | | | | | | | | | | | | | | |
FHLMC Structured Agency Credit Risk Debt Notes, (continued) | | | | | | | | | | | | | | | | |
q2014-HQ2, M3, FRN, 5.573%, (1-month USD LIBOR + 3.75%), 9/25/24 | | | United States | | | | 12,060,000 | | | | | | | $ | 13,034,897 | |
q2014-HQ3, M3, FRN, 6.573%, (1-month USD LIBOR + 4.75%), 10/25/24 | | | United States | | | | 3,249,179 | | | | | | | | 3,442,389 | |
q2015-DN1, M3, FRN, 5.973%, (1-month USD LIBOR + 4.15%), 1/25/25 | | | United States | | | | 12,578,190 | | | | | | | | 13,027,363 | |
q2015-DNA1, M2, FRN, 3.673%, (1-month USD LIBOR + 1.85%), 10/25/27 | | | United States | | | | 5,535,364 | | | | | | | | 5,578,668 | |
q2015-DNA1, M3, FRN, 5.123%, (1-month USD LIBOR + 3.30%), 10/25/27 | | | United States | | | | 4,500,000 | | | | | | | | 4,787,649 | |
q2015-DNA2, M2, FRN, 4.423%, (1-month USD LIBOR + 2.60%), 12/25/27 | | | United States | | | | 1,941,926 | | | | | | | | 1,949,975 | |
q2015-DNA2, M3, FRN, 5.723%, (1-month USD LIBOR + 3.90%), 12/25/27 | | | United States | | | | 18,171,000 | | | | | | | | 18,889,663 | |
q2015-DNA3, M2, FRN, 4.673%, (1-month USD LIBOR + 2.85%), 4/25/28 | | | United States | | | | 3,077,919 | | | | | | | | 3,111,961 | |
q2015-DNA3, M3, FRN, 6.523%, (1-month USD LIBOR + 4.70%), 4/25/28 | | | United States | | | | 6,970,000 | | | | | | | | 7,692,802 | |
q2015-HQ1, M3, FRN, 5.623%, (1-month USD LIBOR + 3.80%), 3/25/25 | | | United States | | | | 10,046,903 | | | | | | | | 10,325,061 | |
q2015-HQ2, M3, FRN, 5.073%, (1-month USD LIBOR + 3.25%), 5/25/25 | | | United States | | | | 6,860,000 | | | | | | | | 7,173,494 | |
q2015-HQA1, M2, FRN, 4.473%, (1-month USD LIBOR + 2.65%), 3/25/28 | | | United States | | | | 1,756,238 | | | | | | | | 1,761,315 | |
q2015-HQA1, M3, FRN, 6.523%, (1-month USD LIBOR + 4.70%), 3/25/28 | | | United States | | | | 18,500,000 | | | | | | | | 19,601,323 | |
q2015-HQA2, M2, FRN, 4.623%, (1-month USD LIBOR + 2.80%), 5/25/28 | | | United States | | | | 3,078,283 | | | | | | | | 3,096,373 | |
q2016-DNA1, M2, FRN, 4.723%, (1-month USD LIBOR + 2.90%), 7/25/28 | | | United States | | | | 108,268 | | | | | | | | 108,942 | |
q2016-DNA1, M3, FRN, 7.373%, (1-month USD LIBOR + 5.55%), 7/25/28 | | | United States | | | | 23,610,000 | | | | | | | | 26,055,920 | |
q2016-DNA2, M3, FRN, 6.473%, (1-month USD LIBOR + 4.65%), 10/25/28 | | | United States | | | | 14,255,829 | | | | | | | | 15,292,496 | |
q2016-HQA1, M2, FRN, 4.573%, (1-month USD LIBOR + 2.75%), 9/25/28 | | | United States | | | | 259,109 | | | | | | | | 260,149 | |
q2016-HQA2, M2, FRN, 4.073%, (1-month USD LIBOR + 2.25%), 11/25/28 | | | United States | | | | 413,458 | | | | | | | | 415,582 | |
q2016-HQA2, M3, FRN, 6.973%, (1-month USD LIBOR + 5.15%), 11/25/28 | | | United States | | | | 9,640,000 | | | | | | | | 10,580,021 | |
q2016-HQA3, M2, FRN, 3.173%, (1-month USD LIBOR + 1.35%), 3/25/29 | | | United States | | | | 177,719 | | | | | | | | 178,083 | |
q2017-DNA3, M2, FRN, 4.323%, (1-month USD LIBOR + 2.50%), 3/25/30 | | | United States | | | | 8,350,000 | | | | | | | | 8,526,492 | |
r2017-HQA1, M2, FRN, 5.373%, 8/25/29 | | | United States | | | | 15,764,156 | | | | | | | | 16,528,418 | |
q2018-HQA1, M1, FRN, 2.523%, (1-month USD LIBOR + 0.70%), 9/25/30 | | | United States | | | | 3,720,904 | | | | | | | | 3,722,141 | |
| | | | |
| | | |
76 | | Annual Report | | franklintempleton.com |
FRANKLIN INVESTORS SECURITIES TRUST
STATEMENT OF INVESTMENTS
Franklin Low Duration Total Return Fund(continued)
| | | | | | | | | | | | | | | | |
| | | Country | | | Principal
Amount* | | | | | | Value | |
| | | | |
Asset-Backed Securities and Commercial
Mortgage-Backed Securities(continued) | | | | | | | | | | | | | | | | |
Diversified Financials(continued) | | | | | | | | | | | | | | | | |
e,qFlagship CLO VIII Ltd., 2014-8A, ARR, 144A, FRN, 2.851%, (3-month USD LIBOR + 0.85%), 1/16/26 | | | United States | | | | 4,490,326 | | | | | | | $ | 4,490,192 | |
e,rFlagstar Mortgage Trust, 2018-6RR, 1A3, 144A, FRN, 4.00%, 10/25/48 | | | United States | | | | 6,974,011 | | | | | | | | 7,157,551 | |
FNMA Connecticut Avenue Securities, | | | | | | | | | | | | | | | | |
q2013-C01, M2, FRN, 7.073%, (1-month USD LIBOR + 5.25%), 10/25/23 | | | United States | | | | 17,238,688 | | | | | | | | 19,004,514 | |
q2014-C02, 1M2, FRN, 4.423%, (1-month USD LIBOR + 2.60%), 5/25/24 | | | United States | | | | 12,929,309 | | | | | | | | 13,451,733 | |
q2014-C02, 2M2, FRN, 4.423%, (1-month USD LIBOR + 2.60%), 5/25/24 | | | United States | | | | 1,212,596 | | | | | | | | 1,254,600 | |
q2014-C03, 1M2, FRN, 4.823%, (1-month USD LIBOR + 3.00%), 7/25/24 | | | United States | | | | 22,732,254 | | | | | | | | 23,888,098 | |
q2014-C03, 2M2, FRN, 4.723%, (1-month USD LIBOR + 2.90%), 7/25/24 | | | United States | | | | 18,457,940 | | | | | | | | 19,196,655 | |
q2014-C04, 1M1, FRN, 6.723%, (1-month USD LIBOR + 4.90%), 11/25/24 | | | United States | | | | 10,966,017 | | | | | | | | 11,954,627 | |
q2014-C04, 2M2, FRN, 6.823%, (1-month USD LIBOR + 5.00%), 11/25/24 | | | United States | | | | 4,943,769 | | | | | | | | 5,273,890 | |
q2015-C01, 1M2, FRN, 6.123%, (1-month USD LIBOR + 4.30%), 2/25/25 | | | United States | | | | 11,008,666 | | | | | | | | 11,661,856 | |
q2015-C01, 2M2, FRN, 6.373%, (1-month USD LIBOR + 4.55%), 2/25/25 | | | United States | | | | 5,430,894 | | | | | | | | 5,617,519 | |
q2015-C02, 1M2, FRN, 5.823%, (1-month USD LIBOR + 4.00%), 5/25/25 | | | United States | | | | 11,688,629 | | | | | | | | 12,335,509 | |
q2015-C02, 2M2, FRN, 5.823%, (1-month USD LIBOR + 4.00%), 5/25/25 | | | United States | | | | 6,756,227 | | | | | | | | 7,029,755 | |
q2015-C03, 1M2, FRN, 6.823%, (1-month USD LIBOR + 5.00%), 7/25/25 | | | United States | | | | 10,596,089 | | | | | | | | 11,447,389 | |
q2015-C03, 2M2, FRN, 6.823%, (1-month USD LIBOR + 5.00%), 7/25/25 | | | United States | | | | 6,414,064 | | | | | | | | 6,823,093 | |
r2016-C01, 2M2, FRN, 8.773%, 8/25/28 | | | United States | | | | 7,939,852 | | | | | | | | 8,625,289 | |
r2016-C04, 1M2, FRN, 6.073%, 1/25/29 | | | United States | | | | 15,320,000 | | | | | | | | 16,190,921 | |
r2016-C05, 2M2, FRN, 6.273%, 1/25/29 | | | United States | | | | 14,277,901 | | | | | | | | 15,040,098 | |
r2016-C06, 1M2, FRN, 6.073%, 4/25/29 | | | United States | | | | 4,260,000 | | | | | | | | 4,533,771 | |
r2016-C07, 2M2, FRN, 6.173%, 5/25/29 | | | United States | | | | 11,110,238 | | | | | | | | 11,675,662 | |
q2017-C01, 1M2, FRN, 5.373%, (1-month USD LIBOR + 3.55%), 7/25/29 | | | United States | | | | 20,305,000 | | | | | | | | 21,278,361 | |
r2017-C06, 1M2, FRN, 4.473%, 2/25/30 | | | United States | | | | 12,970,000 | | | | | | | | 13,256,162 | |
q2018-C02, 2M1, FRN, 2.473%, (1-month USD LIBOR + 0.65%), 8/25/30 | | | United States | | | | 1,707,986 | | | | | | | | 1,708,031 | |
e,rGalaxy XVIII CLO Ltd., 2018-28A, A2, 144A, FRN, 3.071%, 7/15/31 | | | United States | | | | 6,500,000 | | | | | | | | 6,492,005 | |
e,rGalaxy XXV CLO Ltd., 2018-25A, B, 144A, FRN, 3.59%, 10/25/31 | | | United States | | | | 2,000,000 | | | | | | | | 1,969,180 | |
e,rGalaxy XXVI CLO Ltd., | | | | | | | | | | | | | | | | |
2018-26A, A, 144A, FRN, 3.35%, 11/22/31 | | | United States | | | | 3,429,602 | | | | | | | | 3,423,154 | |
2018-26A, B, 144A, FRN, 3.85%, 11/22/31 | | | United States | | | | 2,100,000 | | | | | | | | 2,072,595 | |
| | | | |
| | | |
| franklintempleton.com | | Annual Report | | 77 |
FRANKLIN INVESTORS SECURITIES TRUST
STATEMENT OF INVESTMENTS
Franklin Low Duration Total Return Fund(continued)
| | | | | | | | | | | | | | | | |
| | | Country | | | Principal
Amount* | | | | | | Value | |
| | | | |
Asset-Backed Securities and Commercial
Mortgage-Backed Securities(continued) | | | | | | | | | | | | | | | | |
Diversified Financials(continued) | | | | | | | | | | | | | | | | |
e,qGalaxy XXVII CLO Ltd., 2018-27A, A, 144A, FRN, 3.188%, (3-month USD LIBOR + 1.02%), 5/16/31 | | | United States | | | | 1,500,000 | | | | | | | $ | 1,483,170 | |
rGreenpoint Manufactured Housing, 1999-5, M1A, FRN, 8.30%, 10/15/26 | | | United States | | | | 357,243 | | | | | | | | 377,933 | |
qGSAA Home Equity Trust, | | | | | | | | | | | | | | | | |
2005-5, M3, FRN, 2.768%, (1-month USD LIBOR + 0.945%), 2/25/35 | | | United States | | | | 1,763,533 | | | | | | | | 1,803,312 | |
2005-6, A3, FRN, 2.193%, (1-month USD LIBOR + 0.37%), 6/25/35 | | | United States | | | | 54,750 | | | | | | | | 54,953 | |
qGSAMP Trust, 2005-HE3, M2, FRN, 2.828%, (1-month USD LIBOR + 1.005%), 6/25/35 | | | United States | | | | 55,659 | | | | | | | | 55,847 | |
rGSR Mortgage Loan Trust, 2005-AR1, 1A1, FRN, 4.53%, 1/25/35 | | | United States | | | | 242,832 | | | | | | | | 248,978 | |
e,qHalcyon Loan Advisors Funding Ltd., 2018-1A, A2, 144A, FRN, 3.766%, (3-month USD LIBOR + 1.80%), 7/21/31 | | | United States | | | | 5,000,000 | | | | | | | | 4,850,200 | |
e,rHarbor Park CLO Ltd., | | | | | | | | | | | | | | | | |
1A, A2, 144A, FRN, 3.366%, 1/20/31 | | | United States | | | | 1,710,526 | | | | | | | | 1,697,817 | |
1A, B1, 144A, FRN, 3.666%, 1/20/31 | | | United States | | | | 466,667 | | | | | | | | 463,545 | |
e,qHayFin Kingsland IX Ltd., 2013-6A, BR, 144A, FRN, 3.736%, (3-month USD LIBOR + 1.80%), 4/28/31 | | | United States | | | | 5,200,000 | | | | | | | | 5,134,220 | |
e,rHPS Loan Management Ltd., | | | | | | | | | | | | | | | | |
2013A-18, A2, 144A, FRN, 3.451%, 10/15/30 | | | United States | | | | 1,400,000 | | | | | | | | 1,388,366 | |
2013A-18, C, 144A, FRN, 4.151%, 10/15/30 | | | United States | | | | 500,000 | | | | | | | | 481,535 | |
eInvitation Homes Trust, | | | | | | | | | | | | | | | | |
q2017-SFR2, A, 144A, FRN, 2.739%, (1-month USD LIBOR + 0.85%), 12/17/36 | | | United States | | | | 13,295,218 | | | | | | | | 13,294,568 | |
q2018-SFR3, A, 144A, FRN, 2.889%, (1-month USD LIBOR + 1.00%), 7/17/37 | | | United States | | | | 10,983,696 | | | | | | | | 11,013,156 | |
r2018-SFR4, A, 144A, FRN, 2.989%, 1/17/38 | | | United States | | | | 9,051,576 | | | | | | | | 9,101,942 | |
rJP Morgan Mortgage Trust, 2004-A1, 5A1, FRN, 4.909%, 2/25/34 | | | United States | | | | 32,256 | | | | | | | | 34,062 | |
e,qLCM 26 Ltd., | | | | | | | | | | | | | | | | |
26A, B, 144A, FRN, 3.366%, (3-month USD LIBOR + 1.40%), 1/20/31 | | | United States | | | | 4,500,000 | | | | | | | | 4,351,995 | |
26A, C, 144A, FRN, 3.766%, (3-month USD LIBOR + 1.80%), 1/20/31 | | | United States | | | | 2,000,000 | | | | | | | | 1,883,540 | |
e,rLCM XV LP, 2015-A, AR, 144A, FRN, 3.206%, 7/20/30 | | | United States | | | | 1,250,000 | | | | | | | | 1,250,487 | |
e,rLCM XVI LP, | | | | | | | | | | | | | | | | |
2016A, A2R, 144A, FRN, 3.181%, 10/15/31 | | | United States | | | | 1,083,333 | | | | | | | | 1,080,300 | |
2016A, BR2, 144A, FRN, 3.751%, 10/15/31 | | | United States | | | | 1,756,602 | | | | | | | | 1,751,982 | |
e,rLCM XXII Ltd., 22A, A2R, 144A, FRN, 3.416%, 10/20/28 | | | United States | | | | 5,000,000 | | | | | | | | 4,901,700 | |
e,qLCM XXIII Ltd., 23A, A2, 144A, FRN, 3.816%, (3-month USD LIBOR + 1.85%), 10/20/29 | | | United States | | | | 1,000,000 | | | | | | | | 1,000,400 | |
e,qLCM XXV Ltd., 25A, A, 144A, FRN, 3.176%, (3-month USD LIBOR + 1.21%), 7/20/30 | | | United States | | | | 274,000 | | | | | | | | 273,797 | |
qLehman XS Trust, 2005-4, 1A4, FRN, 2.383%, (1-month USD LIBOR + 0.56%), 10/25/35 | | | United States | | | | 393,785 | | �� | | | | | | 391,991 | |
| | | | |
| | | |
78 | | Annual Report | | franklintempleton.com |
FRANKLIN INVESTORS SECURITIES TRUST
STATEMENT OF INVESTMENTS
Franklin Low Duration Total Return Fund(continued)
| | | | | | | | | | | | | | | | |
| | | Country | | | Principal
Amount* | | | | | | Value | |
| | | | |
Asset-Backed Securities and Commercial
Mortgage-Backed Securities(continued) | | | | | | | | | | | | | | | | |
Diversified Financials(continued) | | | | | | | | | | | | | | | | |
e,qLong Point Park CLO Ltd., | | | | | | | | | | | | | | | | |
2017-1A, A2, 144A, FRN, 3.377%, (3-month USD LIBOR + 1.375%), 1/17/30 | | | United States | | | | 2,400,000 | | | | | | | $ | 2,340,720 | |
2017-1A, B, 144A, FRN, 3.702%, (3-month USD LIBOR + 1.70%), 1/17/30 | | | United States | | | | 1,000,000 | | | | | | | | 954,350 | |
e,rMach One ULC, 2004-1A, M, 144A, FRN, 5.45%, 5/28/40 | | | United States | | | | 162,674 | | | | | | | | 161,983 | |
e,rMadison Park Euro Funding XIV DAC, 2014A, A1N, 144A, FRN, 1.12%, 7/15/32 | | | Ireland | | | | 4,200,000 | | | | EUR | | | | 4,704,534 | |
e,qMadison Park Funding Ltd., | | | | | | | | | | | | | | | | |
2018-28A, B, 144A, FRN, 3.601%, (3-month USD LIBOR + 1.60%), 7/15/30 | | | United States | | | | 2,000,000 | | | | | | | | 1,976,700 | |
2018-28A, C, 144A, FRN, 3.851%, (3-month USD LIBOR + 1.85%), 7/15/30 | | | United States | | | | 4,200,000 | | | | | | | | 4,034,814 | |
e,qMadison Park Funding XI Ltd., 2013-11, CR, 144A, FRN, 4.134%, (3-month USD LIBOR + 2.20%), 7/23/29 | | | United States | | | | 1,910,000 | | | | | | | | 1,856,615 | |
e,rMadison Park Funding XIV Ltd., | | | | | | | | | | | | | | | | |
2014-14A, BRR, 144A, FRN, 3.653%, 10/22/30 | | | United States | | | | 1,000,000 | | | | | | | | 992,990 | |
2014-14A, CRR, 144A, FRN, 4.153%, 10/22/30 | | | United States | | | | 375,000 | | | | | | | | 368,490 | |
e,qMadison Park Funding XXIII Ltd., | | | | | | | | | | | | | | | | |
2017-23A, B, 144A, FRN, 3.636%, (3-month USD LIBOR + 1.70%), 7/27/30 | | | United States | | | | 4,000,000 | | | | | | | | 3,975,240 | |
2017-23A, C, 144A, FRN, 4.286%, (3-month USD LIBOR + 2.35%), 7/27/30 | | | United States | | | | 1,300,000 | | | | | | | | 1,278,589 | |
e,rMadison Park Funding XXIX Ltd., | | | | | | | | | | | | | | | | |
2018-29A, A2, 144A, FRN, 3.453%, 10/18/30 | | | United States | | | | 7,945,455 | | | | | | | | 7,859,565 | |
2018-29A, B, 144A, FRN, 3.753%, 10/18/30 | | | United States | | | | 4,000,000 | | | | | | | | 3,978,200 | |
2018-29A, C, 144A, FRN, 4.203%, 10/18/30 | | | United States | | | | 995,968 | | | | | | | | 976,118 | |
e,qMadison Park Funding XXVI Ltd., 2017-26A, AR, 144A, FRN, 3.128%, (3-month USD LIBOR + 1.20%), 7/29/30 | | | United States | | | | 4,400,000 | | | | | | | | 4,392,124 | |
e,qMadison Park Funding XXVII Ltd., 2018-27A, A1B, 144A, FRN, 3.096%, (3-month USD LIBOR + 1.13%), 4/20/30 | | | United States | | | | 3,061,000 | | | | | | | | 3,018,238 | |
e,rMadison Park Funding XXXI Ltd., | | | | | | | | | | | | | | | | |
2018-31A, A2A, 144A, FRN, 3.434%, 1/23/31 | | | United States | | | | 2,250,000 | | | | | | | | 2,234,700 | |
2018-31A, B, 144A, FRN, 3.634%, 1/23/31 | | | United States | | | | 3,000,000 | | | | | | | | 2,979,660 | |
2018-31A, C, 144A, FRN, 4.084%, 1/23/31 | | | United States | | | | 650,000 | | | | | | | | 636,200 | |
e,rMagnetite Ltd., 2015-14RA, A1, 144A, FRN, 3.123%, 10/18/31 | | | United States | | | | 11,000,000 | | | | | | | | 10,970,630 | |
MASTR Alternative Loan Trust, | | | | | | | | | | | | | | | | |
2003-1, 3A1, 5.00%, 6/25/23 | | | United States | | | | 13,248 | | | | | | | | 13,968 | |
2003-6, 2A1, 5.00%, 8/25/20 | | | United States | | | | 23,663 | | | | | | | | 23,670 | |
qMerrill Lynch Mortgage Investors Trust, 2005-A10, A, FRN, 2.033%, (1-month USD LIBOR + 0.21%), 2/25/36 | | | United States | | | | 1,875,976 | | | | | | | | 1,845,880 | |
qMerrill Lynch Mortgage Investors Trust Inc., 2003-E, A1, FRN, 2.443%, (1-month USD LIBOR + 0.62%), 10/25/28 | | | United States | | | | 474,822 | | | | | | | | 481,562 | |
e,rMill City Mortgage Loan Trust, | | | | | | | | | | | | | | | | |
2016-1, A, 144A, FRN, 2.50%, 4/25/57 | | | United States | | | | 5,835,014 | | | | | | | | 5,864,387 | |
2017-3, A1, 144A, FRN, 2.75%, 1/25/61 | | | United States | | | | 6,665,992 | | | | | | | | 6,747,840 | |
2018-1, A1, 144A, FRN, 3.25%, 5/25/62 | | | United States | | | | 12,541,036 | | | | | | | | 12,868,113 | |
2018-2, A1, 144A, FRN, 3.50%, 5/25/58 | | | United States | | | | 4,359,279 | | | | | | | | 4,479,687 | |
| | | | |
| | | |
| franklintempleton.com | | Annual Report | | 79 |
FRANKLIN INVESTORS SECURITIES TRUST
STATEMENT OF INVESTMENTS
Franklin Low Duration Total Return Fund(continued)
| | | | | | | | | | | | | | | | |
| | | Country | | | Principal
Amount* | | | | | | Value | |
| | | | |
Asset-Backed Securities and Commercial
Mortgage-Backed Securities(continued) | | | | | | | | | | | | | | | | |
Diversified Financials(continued) | | | | | | | | | | | | | | | | |
e,rMill City Mortgage Loan Trust, (continued) | | | | | | | | | | | | | | | | |
2018-4, A1B, 144A, FRN, 3.50%, 4/25/66 | | | United States | | | | 9,680,000 | | | | | | | $ | 9,991,114 | |
e,rMorgan Stanley Capital I Trust, 2011-C1, A4, 144A, FRN, 5.033%, 9/15/47 | | | United States | | | | 3,478,298 | | | | | | | | 3,537,553 | |
e,rMountain View Funding CLO XIV Ltd., 2019-1A, A1, 144A, FRN, 3.441%, 4/15/29 | | | United States | | | | 4,500,000 | | | | | | | | 4,500,945 | |
eNeuberger Berman CLO Ltd., | | | | | | | | | | | | | | | | |
r2016-22A, A2R, 144A, FRN, 3.402%, 10/17/30 | | | United States | | | | 1,400,000 | | | | | | | | 1,388,856 | |
r2016-22A, BR, 144A, FRN, 3.652%, 10/17/30 | | | United States | | | | 900,000 | | | | | | | | 891,819 | |
q2017-26A, C, 144A, FRN, 3.753%, (3-month USD LIBOR + 1.75%), 10/18/30 | | | United States | | | | 2,100,000 | | | | | | | | 1,985,886 | |
e,rNeuberger Berman CLO XVIII Ltd., | | | | | | | | | | | | | | | | |
2014-18A, A1BR, 144A, FRN, 3.366%, 10/21/30 | | | United States | | | | 2,295,000 | | | | | | | | 2,283,846 | |
2014-18A, BR2, 144A, FRN, 4.116%, 10/21/30 | | | United States | | | | 1,600,000 | | | | | | | | 1,532,912 | |
e,qNeuberger Berman CLO XVI-S Ltd., | | | | | | | | | | | | | | | | |
2017-16SA, B, 144A, FRN, 3.251%, (3-month USD LIBOR + 1.25%), 1/15/28 | | | United States | | | | 400,000 | | | | | | | | 391,720 | |
2017-16SA, C, 144A, FRN, 3.601%, (3-month USD LIBOR + 1.60%), 1/15/28 | | | United States | | | | 400,000 | | | | | | | | 390,464 | |
eNeuberger Berman Loan Advisers CLO Ltd., | | | | | | | | | | | | | | | | |
q2017-26A, B, 144A, FRN, 3.503%, (3-month USD LIBOR + 1.50%), 10/18/30 | | | United States | | | | 1,078,945 | | | | | | | | 1,058,186 | |
q2018-27A, C, 144A, FRN, 3.701%, (3-month USD LIBOR + 1.70%), 1/15/30 | | | United States | | | | 500,000 | | | | | | | | 469,325 | |
r2019-32A, B, 144A, FRN, 3.816%, 1/19/32 | | | United States | | | | 4,800,000 | | | | | | | | 4,787,952 | |
r2019-32A, C, 144A, FRN, 4.616%, 1/19/32 | | | United States | | | | 6,000,000 | | | | | | | | 6,000,300 | |
qNew York Mortgage Trust, 2005-3, M1, FRN, 2.498%, (1-month USD LIBOR + 0.675%), 2/25/36 | | | United States | | | | 190,431 | | | | | | | | 180,098 | |
e,qNewark BSL CLO 2 Ltd., 2017-1A, B, 144A, FRN, 4.29%, (3-month USD LIBOR + 2.35%), 7/25/30 | | | United States | | | | 583,989 | | | | | | | | 576,543 | |
e,qNZCG Funding Ltd., 2015-1A, A2R, 144A, FRN, 3.682%, (3-month USD LIBOR + 1.55%), 2/26/31 | | | United States | | | | 6,600,000 | | | | | | | | 6,470,376 | |
eOBP Depositor LLC Trust, 2010-OBP, A, 144A, 4.646%, 7/15/45 | | | United States | | | | 5,834,000 | | | | | | | | 5,858,123 | |
e,qOBX Trust, 2018-1, A2, 144A, FRN, 2.473%, (1-month USD LIBOR + 0.65%), 6/25/57 | | | United States | | | | 2,821,866 | | | | | | | | 2,817,135 | |
eOctagon Investment Partners 18-R Ltd., | | | | | | | | | | | | | | | | |
r2018-18A, A1A, 144A, FRN, 2.961%, 4/16/31 | | | United States | | | | 1,000,000 | | | | | | | | 991,010 | |
q2018-18A, C, 144A, FRN, 4.701%, (3-month USD LIBOR + 2.70%), 4/16/31 | | | United States | | | | 1,000,000 | | | | | | | | 894,420 | |
e,qOctagon Investment Partners 26 Ltd., | | | | | | | | | | | | | | | | |
2016-1A, A2R, 144A, FRN, 3.351%, (3-month USD LIBOR + 1.35%), 7/15/30 | | | United States | | | | 1,600,000 | | | | | | | | 1,573,632 | |
2016-1A, BR, 144A, FRN, 3.601%, (3-month USD LIBOR + 1.60%), 7/15/30 | | | United States | | | | 2,000,000 | | | | | | | | 1,971,600 | |
e,rOctagon Investment Partners 28 Ltd., | | | | | | | | | | | | | | | | |
2016-1A, A2R, 144A, FRN, 3.386%, 10/24/30 | | | United States | | | | 4,000,000 | | | | | | | | 4,004,840 | |
2016-1A, BR, 144A, FRN, 3.736%, 10/24/30 | | | United States | | | | 1,186,282 | | | | | | | | 1,185,511 | |
| | | | |
| | | |
80 | | Annual Report | | franklintempleton.com |
FRANKLIN INVESTORS SECURITIES TRUST
STATEMENT OF INVESTMENTS
Franklin Low Duration Total Return Fund(continued)
| | | | | | | | | | | | | | |
| | | Country | | | Principal
Amount* | | | Value | |
| | | | |
Asset-Backed Securities and Commercial
Mortgage-Backed Securities(continued) | | | | | | | | | | | | | | |
Diversified Financials(continued) | | | | | | | | | | | | | | |
e,qOctagon Investment Partners 31 LLC, 2017-1A, C, 144A, FRN, 4.366%, (3-month USD LIBOR + 2.40%), 7/20/30 | | | United States | | | | 280,761 | | | | | $ | 278,024 | |
e,qOctagon Investment Partners 35 Ltd., 2018-1A, A1B, 144A, FRN, 3.066%, (3-month USD LIBOR + 1.10%), 1/20/31 | | | United States | | | | 2,000,000 | | | | | | 1,955,580 | |
e,qOctagon Investment Partners 37 Ltd., 2018-2A, A2, 144A, FRN, 3.52%, (3-month USD LIBOR + 1.58%), 7/25/30 | | | United States | | | | 1,000,000 | | | | | | 986,660 | |
e,qOctagon Investment Partners XVI Ltd., | | | | | | | | | | | | | | |
2013-1A, BR, 144A, FRN, 3.602%, (3-month USD LIBOR + 1.60%), 7/17/30 | | | United States | | | | 4,000,000 | | | | | | 3,944,200 | |
2013-1A, CR, 144A, FRN, 3.852%, (3-month USD LIBOR + 1.85%), 7/17/30 | | | United States | | | | 3,000,000 | | | | | | 2,822,910 | |
e,qOctagon Investment Partners XXII Ltd., 2014-1A, CRR, 144A, FRN, 3.853%, (3-month USD LIBOR + 1.90%), 1/22/30 | | | United States | | | | 2,100,000 | | | | | | 1,987,230 | |
e,qOctagon Investment Partners XXIII Ltd., | | | | | | | | | | | | | | |
2015-1A, CR, 144A, FRN, 3.851%, (3-month USD LIBOR + 1.85%), 7/15/27 | | | United States | | | | 250,000 | | | | | | 246,322 | |
2015-1A, DR, 144A, FRN, 4.551%, (3-month USD LIBOR + 2.55%), 7/15/27 | | | United States | | | | 300,000 | | | | | | 292,137 | |
e,rOctagon Loan Funding Ltd., 2014-1A, ARR, 144A, FRN, 3.304%, 11/18/31 | | | United States | | | | 3,300,000 | | | | | | 3,286,734 | |
eProgress Residential Trust, | | | | | | | | | | | | | | |
2017-SFR1, A, 144A, 2.768%, 8/17/34 | | | United States | | | | 408,504 | | | | | | 411,260 | |
2018-SFR2, A, 144A, 3.712%, 8/17/35 | | | United States | | | | 2,967,000 | | | | | | 3,033,868 | |
qRAAC, 2004-SP1, AII, FRN, 2.523%, (1-month USD LIBOR + 0.70%), 3/25/34 | | | United States | | | | 289,629 | | | | | | 288,597 | |
e,rRace Point X CLO Ltd., 2016-10A, B1R, 144A, FRN, 3.59%, 7/25/31 | | | United States | | | | 700,000 | | | | | | 683,718 | |
e,qRadnor RE Ltd., 2018-1, M1, 144A, FRN, 3.223%, (1-month USD LIBOR + 1.40%), 3/25/28 | | | United States | | | | 3,632,060 | | | | | | 3,632,869 | |
e,rSequoia Mortgage Trust, 2016-2, A4, 144A, FRN, 3.50%, 8/25/46 | | | United States | | | | 12,254,106 | | | | | | 12,527,757 | |
e,rSound Point Euro CLO II Funding DAC, | | | | | | | | | | | | | | |
2A, A, 144A, FRN, 1.11%, 10/26/32 | | | Ireland | | | | 8,200,000 | | | EUR | | | 9,167,815 | |
2A, B1, 144A, FRN, 1.85%, 10/26/32 | | | Ireland | | | | 4,300,000 | | | EUR | | | 4,788,239 | |
rStructured ARM Loan Trust, 2004-12, 3A1, FRN, 4.214%, 9/25/34 | | | United States | | | | 1,260,162 | | | | | | 1,289,988 | |
qStructured Asset Mortgage Investments II Trust, 2004-AR6, A1A, FRN, 2.546%, (1-month USD LIBOR + 0.70%), 2/19/35 | | | United States | | | | 1,160,143 | | | | | | 1,152,575 | |
e,qTCI-Flatiron CLO Ltd., 2017-1A, C, 144A, FRN, 3.974%, (3-month USD LIBOR + 1.85%), 11/18/30 | | | United States | | | | 500,000 | | | | | | 472,450 | |
Thornburg Mortgage Securities Trust, | | | | | | | | | | | | | | |
q2004-3, A, FRN, 2.563%, (1-month USD LIBOR + 0.74%), 9/25/44 | | | United States | | | | 701,125 | | | | | | 708,994 | |
r2005-1, A3, FRN, 4.578%, 4/25/45 | | | United States | | | | 177,865 | | | | | | 179,680 | |
eTowd Point Mortgage Trust, | | | | | | | | | | | | | | |
r2015-1, 144A, FRN, 2.75%, 11/25/60 | | | United States | | | | 475,819 | | | | | | 479,655 | |
2015-1, AE, 144A, 3.00%, 10/25/53 | | | United States | | | | 3,103,826 | | | | | | 3,126,021 | |
r2015-2, 2A1, 144A, FRN, 3.75%, 11/25/57 | | | United States | | | | 505,655 | | | | | | 511,131 | |
r2015-3, A1A, 144A, FRN, 3.50%, 3/25/54 | | | United States | | | | 1,964,945 | | | | | | 1,986,838 | |
r2015-3, A1B, 144A, FRN, 3.00%, 3/25/54 | | | United States | | | | 907,383 | | | | | | 913,685 | |
| | | | |
| | | |
| franklintempleton.com | | Annual Report | | 81 |
FRANKLIN INVESTORS SECURITIES TRUST
STATEMENT OF INVESTMENTS
Franklin Low Duration Total Return Fund (continued)
| | | | | | | | | | | | | | | | |
| | | Country | | | Principal
Amount* | | | | | | Value | |
| | | | |
Asset-Backed Securities and Commercial
Mortgage-Backed Securities(continued) | | | | | | | | | | | | | | | | |
Diversified Financials(continued) | | | | | | | | | | | | | | | | |
eTowd Point Mortgage Trust, (continued) | | | | | | | | | | | | | | | | |
r2016-1, A1, 144A, FRN, 3.50%, 2/25/55 | | | United States | | | | 7,664,199 | | | | | | | $ | 7,798,680 | |
r2016-2, A1A, 144A, FRN, 2.75%, 8/25/55 | | | United States | | | | 789,910 | | | | | | | | 798,795 | |
r2016-3, A1, 144A, FRN, 2.25%, 4/25/56 | | | United States | | | | 8,114,465 | | | | | | | | 8,117,020 | |
r2016-4, A1, 144A, FRN, 2.25%, 7/25/56 | | | United States | | | | 12,206,495 | | | | | | | | 12,216,297 | |
r2016-5, A1, 144A, FRN, 2.50%, 10/25/56 | | | United States | | | | 3,829,710 | | | | | | | | 3,854,502 | |
r2017-1, A1, 144A, FRN, 2.75%, 10/25/56 | | | United States | | | | 11,588,709 | | | | | | | | 11,759,202 | |
r2017-2, A1, 144A, FRN, 2.75%, 4/25/57 | | | United States | | | | 11,467,112 | | | | | | | | 11,587,730 | |
r2017-4, A1, 144A, FRN, 2.75%, 6/25/57 | | | United States | | | | 12,483,079 | | | | | | | | 12,665,784 | |
q2017-5, A1, 144A, FRN, 2.423%, (1-month USD LIBOR + 0.60%), 2/25/57 | | | United States | | | | 2,697,691 | | | | | | | | 2,698,147 | |
r2018-1, A1, 144A, FRN, 3.00%, 1/25/58 | | | United States | | | | 2,879,629 | | | | | | | | 2,930,983 | |
r2018-2, A1, 144A, FRN, 3.25%, 3/25/58 | | | United States | | | | 6,725,882 | | | | | | | | 6,902,797 | |
r2018-3, A1, 144A, FRN, 3.75%, 5/25/58 | | | United States | | | | 14,300,553 | | | | | | | | 14,945,307 | |
r2018-4, A1, 144A, FRN, 3.00%, 6/25/58 | | | United States | | | | 17,003,140 | | | | | | | | 17,569,970 | |
r2018-5, A1A, 144A, FRN, 3.25%, 7/25/58 | | | United States | | | | 3,828,359 | | | | | | | | 3,941,368 | |
r2018-6, A1A, 144A, FRN, 3.75%, 3/25/58 | | | United States | | | | 6,957,214 | | | | | | | | 7,248,483 | |
r2019-1, A1, 144A, FRN, 3.75%, 3/25/58 | | | United States | | | | 13,437,024 | | | | | | | | 14,203,934 | |
e,rUpgrade Master Pass-Thru Trust, 2019-PT1, A, 144A, FRN, 11.128%, 6/15/25 | | | United States | | | | 1,090,333 | | | | | | | | 1,089,898 | |
eVoya CLO Ltd., | | | | | | | | | | | | | | | | |
q2012-4A, A2R, 144A, FRN, 3.851%, (3-month USD LIBOR + 1.85%), 10/15/28 | | | United States | | | | 7,660,000 | | | | | | | | 7,663,141 | |
q2013-2A, A1R, 144A, FRN, 2.91%, (3-month USD LIBOR + 0.97%), 4/25/31 | | | United States | | | | 4,500,000 | | | | | | | | 4,455,540 | |
q2013-2A, CR, 144A, FRN, 4.69%, (3-month USD LIBOR + 2.75%), 4/25/31 | | | United States | | | | 375,000 | | | | | | | | 337,766 | |
q2014-1A, CR2, 144A, FRN, 4.803%, (3-month USD LIBOR + 2.80%), 4/18/31 | | | United States | | | | 600,000 | | | | | | | | 542,958 | |
r2016-3A, A1R, 144A, FRN, 3.193%, 10/18/31 | | | United States | | | | 1,800,000 | | | | | | | | 1,797,498 | |
r2016-3A, A2R, 144A, FRN, 3.403%, 10/18/31 | | | United States | | | | 818,182 | | | | | | | | 808,282 | |
r2016-3A, CR, 144A, FRN, 5.253%, 10/18/31 | | | United States | | | | 1,698,113 | | | | | | | | 1,588,007 | |
q2017-3A, B, 144A, FRN, 4.316%, (3-month USD LIBOR + 2.35%), 7/20/30 | | | United States | | | | 507,690 | | | | | | | | 502,126 | |
q2018-2A, A2, 144A, FRN, 3.251%, (3-month USD LIBOR + 1.25%), 7/15/31 | | | United States | | | | 2,500,000 | | | | | | | | 2,455,000 | |
r2018-4A, B, 144A, FRN, 3.851%, 1/15/32 | | | United States | | | | 948,052 | | | | | | | | 941,947 | |
qWaMu Mortgage Pass-Through Certificates, | | | | | | | | | | | | | | | | |
2005-AR19, A1A1, FRN, 2.093%, (1-month USD LIBOR + 0.27%), 12/25/45 | | | United States | | | | 2,037,361 | | | | | | | | 2,041,238 | |
2005-AR8, 1A1A, FRN, 2.403%, (1-month USD LIBOR + 0.58%), 7/25/45 | | | United States | | | | 820,751 | | | | | | | | 822,924 | |
| | | | |
| | | |
82 | | Annual Report | | franklintempleton.com |
FRANKLIN INVESTORS SECURITIES TRUST
STATEMENT OF INVESTMENTS
Franklin Low Duration Total Return Fund(continued)
| | | | | | | | | | | | | | | | |
| | | Country | | | Principal Amount* | | | | | | Value | |
| | | | |
Asset-Backed Securities and Commercial
Mortgage-Backed Securities(continued) | | | | | | | | | | | | | | | | |
Diversified Financials(continued) | | | | | | | | | | | | | | | | |
e,qWebster Park CLO Ltd., 2015-1A, A2R, 144A, FRN, 3.566%, (3-month USD LIBOR + 1.60%), 7/20/30 | | | United States | | | | 1,750,000 | | | | | | | $ | 1,726,690 | |
Wells Fargo Commercial Mortgage Trust, 2016-NXS6, A2, 2.399%, 11/15/49 | | | United States | | | | 6,534,000 | | | | | | | | 6,566,403 | |
e,rWells Fargo Mortgage Backed Securities, 2018-1, A3, 144A, FRN, 3.50%, 7/25/47 | | | United States | | | | 5,327,292 | | | | | | | | 5,427,829 | |
rWells Fargo Mortgage Backed Securities Trust, | | | | | | | | | | | | | | | | |
2004-W, A9, FRN, 4.597%, 11/25/34 | | | United States | | | | 56,574 | | | | | | | | 59,328 | |
2005-AR10, 2A3, FRN, 4.927%, 6/25/35 | | | United States | | | | 310,284 | | | | | | | | 319,128 | |
e,qWest CLO Ltd., | | | | | | | | | | | | | | | | |
2014-1A, A2R, 144A, FRN, 3.353%, (3-month USD LIBOR + 1.35%), 7/18/26 | | | United States | | | | 1,360,000 | | | | | | | | 1,357,103 | |
2014-1A, BR, 144A, FRN, 3.853%, (3-month USD LIBOR + 1.85%), 7/18/26 | | | United States | | | | 2,410,000 | | | | | | | | 2,403,879 | |
| | | | | | | | | | | | | | | | |
| | | | |
| | | | | | | | | | | | | | | 1,397,999,556 | |
| | | | | | | | | | | | | | | | |
| | | | |
Total Asset-Backed Securities and Commercial Mortgage-Backed Securities (Cost $1,421,609,049) | | | | | | | | | | | | | | | 1,407,284,840 | |
| | | | | | | | | | | | | | | | |
| | | | |
Mortgage-Backed Securities 2.7% | | | | | | | | | | | | | | | | |
vFederal Home Loan Mortgage Corp. (FHLMC) Adjustable Rate 0.1% | | | | | | | | | | | | | | | | |
FHLMC, 4.715% - 4.886%, (12-month USD LIBOR +/- MBS Margin), 10/01/36 - 6/01/37 | | | United States | | | | 1,396,398 | | | | | | | | 1,476,208 | |
| | | | | | | | | | | | | | | | |
| | | | |
Federal Home Loan Mortgage Corp. (FHLMC) Fixed Rate 2.1% | | | | | | | | | | | | | | | | |
wFHLMC 15 Year, 2.50%, 10/01/34 | | | United States | | | | 62,740,000 | | | | | | | | 63,421,317 | |
FHLMC Gold 15 Year, 5.00%, 10/01/23 | | | United States | | | | 75,095 | | | | | | | | 77,449 | |
FHLMC Gold 15 Year, 6.00%, 6/01/23 | | | United States | | | | 10,081 | | | | | | | | 10,405 | |
FHLMC Gold 30 Year, 5.00%, 1/01/39 | | | United States | | | | 104,437 | | | | | | | | 115,396 | |
| | | | | | | | | | | | | | | | |
| | | | |
| | | | | | | | | | | | | | | 63,624,567 | |
| | | | | | | | | | | | | | | | |
| | | | |
vFederal National Mortgage Association (FNMA) Adjustable Rate 0.4% | | | | | | | | | | | | | | | | |
FNMA, 3.10% - 3.293%, (1-month USD LIBOR +/- MBS Margin), 4/01/28 - 7/01/34 | | | United States | | | | 258,729 | | | | | | | | 265,827 | |
FNMA, 4.25%, (Federal COF +/- MBS Margin), 8/01/29 | | | United States | | | | 3,347 | | | | | | | | 3,388 | |
FNMA, 2.946% - 4.461%, (US 3 Year CMT T-Note +/- MBS Margin), 3/01/21 - 6/01/34 | | | United States | | | | 48,260 | | | | | | | | 49,047 | |
FNMA, 4.50%, (6-month US T-Bill +/- MBS Margin), 8/01/32 | | | United States | | | | 85,994 | | | | | | | | 87,947 | |
FNMA, 4.746%, (US 5 Year CMT T-Note +/- MBS Margin), 2/01/30 | | | United States | | | | 55,039 | | | | | | | | 58,906 | |
FNMA, 3.334% - 5.011%, (12-month USD LIBOR +/- MBS Margin), 11/01/32 - 2/01/44 | | | United States | | | | 9,255,049 | | | | | | | | 9,707,967 | |
FNMA, 3.59% - 5.165%, (US 1 Year CMT T-Note +/- MBS Margin), 2/01/21 - 10/01/44 | | | United States | | | | 2,258,494 | | | | | | | | 2,332,924 | |
FNMA, 3.123% - 5.488%, (6-month USD LIBOR +/- MBS Margin), 9/01/22 - 8/01/37 | | | United States | | | | 891,044 | | | | | | | | 912,076 | |
| | | | |
| | | |
| franklintempleton.com | | Annual Report | | 83 |
FRANKLIN INVESTORS SECURITIES TRUST
STATEMENT OF INVESTMENTS
Franklin Low Duration Total Return Fund(continued)
| | | | | | | | | | | | | | | | |
| | | Country | | | Principal
Amount* | | | | | | Value | |
| | | | |
Mortgage-Backed Securities(continued) | | | | | | | | | | | | | | | | |
vFederal National Mortgage Association (FNMA) Adjustable Rate (continued) | | | | | | | | | | | | | | | | |
FNMA, 2.391% - 5.625%, (11th District COF +/- MBS Margin), 12/01/25 - 12/01/36 | | | United States | | | | 105,095 | | | | | | | $ | 106,943 | |
| | | | | | | | | | | | | | | | |
| | | | |
| | | | | | | | | | | | | | | 13,525,025 | |
| | | | | | | | | | | | | | | | |
Federal National Mortgage Association (FNMA) Fixed Rate 0.1% | | | | | | | | | | | | | | | | |
FNMA 15 Year, 3.50%, 10/01/25 | | | United States | | | | 656,713 | | | | | | | | 680,101 | |
FNMA 15 Year, 4.00%, 12/01/25 | | | United States | | | | 973,985 | | | | | | | | 1,016,085 | |
FNMA 15 Year, 4.50%, 5/01/23 - 6/01/25 | | | United States | | | | 638,857 | | | | | | | | 661,632 | |
FNMA 30 Year, 5.00%, 3/01/38 | | | United States | | | | 22,164 | | | | | | | | 24,411 | |
| | | | | | | | | | | | | | | | |
| | | | |
| | | | | | | | | | | | | | | 2,382,229 | |
| | | | | | | | | | | | | | | | |
vGovernment National Mortgage Association (GNMA) Adjustable Rate 0.0%† | | | | | | | | | | | | | | | | |
| | | | |
GNMA, 3.25% - 3.875%, (US 1 Year CMT T-Note +/- MBS Margin), 4/20/26 - 9/20/26 | | | United States | | | | 14,733 | | | | | | | | 15,027 | |
| | | | | | | | | | | | | | | | |
| | | | |
Total Mortgage-Backed Securities (Cost $80,797,940) | | | | | | | | | | | | | | | 81,023,056 | |
| | | | | | | | | | | | | | | | |
| | | | |
Municipal Bonds 2.9% | | | | | | | | | | | | | | | | |
California State GO, Various Purpose, Refunding, 2.375%, 10/01/26 | | | United States | | | | 18,195,000 | | | | | | | | 18,441,178 | |
tHonolulu City and County Wastewater System Revenue, Second Bond Resolution, Refunding, Junior Series B, 2.233%, 7/01/24 | | | United States | | | | 2,470,000 | | | | | | | | 2,486,598 | |
Industry Public Facilities Authority Tax Allocation Revenue, Transportation District, Industrial Redevelopment Project No. 2, Refunding, Series B, AGMC Insured, 3.389%, 1/01/20 | | | United States | | | | 5,900,000 | | | | | | | | 5,912,980 | |
New York State GO, Refunding, Series B, 2.12%, 2/15/25 | | | United States | | | | 18,195,000 | | | | | | | | 18,414,614 | |
New York State Urban Development Corp. Sales Tax Revenue, Series B, 2.25%, 3/15/26 | | | United States | | | | 20,685,000 | | | | | | | | 20,884,610 | |
Pennsylvania State GO, Refunding, Second Series, 5.00%, 1/15/20 | | | United States | | | | 6,500,000 | | | | | | | | 6,548,750 | |
San Jose RDA Successor Agency Tax Allocation, | | | | | | | | | | | | | | | | |
Senior, Refunding, Series A-T, 2.48%, 8/01/21 | | | United States | | | | 1,595,000 | | | | | | | | 1,617,234 | |
Senior, Refunding, Series A-T, 2.63%, 8/01/22 | | | United States | | | | 5,320,000 | | | | | | | | 5,446,191 | |
Texas State GO, Transportation Commission Highway Improvement, Series A, 5.00%, 4/01/21 | | | United States | | | | 2,685,000 | | | | | | | | 2,831,306 | |
tTexas State University Systems Financing Revenue, Refunding, Serise B, 2.351%, 3/15/26 | | | United States | | | | 4,825,000 | | | | | | | | 4,854,288 | |
| | | | | | | | | | | | | | | | |
| | | | |
Total Municipal Bonds (Cost $86,566,551) | | | | | | | | | | | | | | | 87,437,749 | |
| | | | | | | | | | | | | | | | |
| | | | |
| | | |
84 | | Annual Report | | franklintempleton.com |
FRANKLIN INVESTORS SECURITIES TRUST
STATEMENT OF INVESTMENTS
Franklin Low Duration Total Return Fund(continued)
| | | | | | | | | | | | |
| | | Country | | | Shares/ Units | | | Value | |
| | | |
Escrows and Litigation Trusts 0.0% | | | | | | | | | | | | |
a,bNewPage Corp., Escrow Account | | | United States | | | | 500,000 | | | $ | — | |
a,b,cRemington Outdoor Co. Inc., Litigation Units | | | United States | | | | 16,078 | | | | — | |
a,bT-Mobile USA Inc., Escrow Account | | | United States | | | | 1,800,000 | | | | — | |
| | | | | | | | | | | | |
| | | |
Total Escrows and Litigation Trusts (Cost $—) | | | | | | | | | | | — | |
| | | | | | | | | | | | |
| | | |
Total Investments before Short Term Investments (Cost $2,937,389,106) | | | | | | | | | | | 2,917,297,443 | |
| | | | | | | | | | | | |
| | | |
| | | | | | Principal
Amount* | | | | |
| | | |
Short Term Investments 3.6% | | | | | | | | | | | | |
| | | |
Corporate Bonds (Cost $2,021,670) 0.0%† | | | | | | | | | | | | |
Telecommunication Services 0.0%† | | | | | | | | | | | | |
eSprint Communications Inc., senior note, 144A, 7.00%, 3/01/20 | | | United States | | | | 2,000,000 | | | | 2,030,000 | |
| | | | | | | | | | | | |
| | | |
Total Investments before Money Market Funds (Cost $2,939,410,776) | | | | | | | | | | | 2,919,327,443 | |
| | | | | | | | | | | | |
| | | |
| | | | | | Shares | | | | |
Money Market Funds (Cost $108,041,040) 3.6% | | | | | | | | | | | | |
d,xInstitutional Fiduciary Trust Money Market Portfolio, 1.56% | | | United States | | | | 108,041,040 | | | | 108,041,040 | |
| | | | | | | | | | | | |
Total Investments (Cost $3,047,451,816) 100.1% | | | | | | | | | | | 3,027,368,483 | |
| | | |
Other Assets, less Liabilities (0.1)% | | | | | | | | | | | (3,332,585 | ) |
| | | | | | | | | | | | |
| | | |
Net Assets 100.0% | | | | | | | | | | $ | 3,024,035,898 | |
| | | | | | | | | | | | |
| | | | |
| | | |
| franklintempleton.com | | Annual Report | | 85 |
FRANKLIN INVESTORS SECURITIES TRUST
STATEMENT OF INVESTMENTS
Franklin Low Duration Total Return Fund(continued)
†Rounds to less than 0.1% of net assets.
*The principal amount is stated in U.S. dollars unless otherwise indicated.
aNon-income producing.
bFair valued using significant unobservable inputs. See Note 13 regarding fair value measurements.
cSee Note 8 regarding restricted securities.
dSee Note 3(f) regarding investments in affiliated management investment companies.
eSecurity was purchased pursuant to Rule 144A under the Securities Act of 1933 and may be sold in transactions exempt from registration only to qualified institutional buyers or in a public offering registered under the Securities Act of 1933. At October 31, 2019, the aggregate value of these securities was $1,022,164,639, representing 33.8% of net assets.
fSecurity was purchased pursuant to Regulation S under the Securities Act of 1933, which exempts from registration securities offered and sold outside of the United States. Such a security cannot be sold in the United States without either an effective registration statement filed pursuant to the Securities Act of 1933, or pursuant to an exemption from registration. At October 31, 2019, the aggregate value of these securities was $64,358,389, representing 2.1% of net assets.
gIncome may be received in additional securities and/or cash.
hThe coupon rate shown represents the rate at period end.
iPrincipal amount is stated in 1,000 Brazilian Real Units.
jSee Note 7 regarding defaulted securities.
kSee Note 1(g) regarding loan participation notes.
lSee Note 1(j) regarding senior floating rate interests.
mA portion or all of the security purchased on a delayed delivery basis. See Note 1(d).
nA portion or all of the security represents an unsettled loan commitment. The coupon rate is to-be determined (TBD) at the time of settlement and will be based upon a reference index/floor plus a spread.
oSee Note 1(k) regarding Marketplace lending.
pPrincipal amount of security is adjusted for inflation. See Note 1(m).
qThe coupon rate shown represents the rate inclusive of any caps or floors, if applicable, in effect at period end.
rAdjustable rate security with an interest rate that is not based on a published reference index and spread. The rate is based on the structure of the agreement and current market conditions. The coupon rate shown represents the rate at period end.
sThe bond pays interest and/or principal based upon the issuer’s ability to pay, which may be less than the stated interest rate or principal paydown.
tSecurity purchased on a when-issued basis. See Note 1(d).
uInvestment in an interest-only security entitles holders to receive only the interest payment on the underlying instruments. The principal amount shown is the notional amount of the underlying instruments.
vAdjustable Rate Mortgage-Backed Security (ARM); the rate shown is the effective rate at period end. ARM rates are not based on a published reference rate and spread, but instead pass-through weighted average interest income inclusive of any caps or floors, if applicable, from the underlying mortgage loans in which the majority of mortgages pay interest based on the index shown at their designated reset dates plus a spread, less the applicable servicing and guaranty fee (MBS margin).
wSecurity purchased on a to-be-announced (TBA) basis. See Note 1(d).
xThe rate shown is the annualized seven-day effective yield at period end.
| | | | |
| | | |
86 | | Annual Report | | franklintempleton.com |
FRANKLIN INVESTORS SECURITIES TRUST
STATEMENT OF INVESTMENTS
Franklin Low Duration Total Return Fund(continued)
At October 31, 2019, the Fund had the following futures contracts outstanding. See Note 1(e).
Futures Contracts
| | | | | | | | | | | | | | | | | | | | |
| Description | | Type | | | Number of Contracts | | | Notional Amount* | | | Expiration Date | | | Value/ Unrealized Appreciation (Depreciation) | |
| |
Interest Rate Contracts | | | | | | | | | | | | | | | | | | | | |
Australian 3 Yr. Bond | | | Long | | | | 725 | | | $ | 57,666,724 | | | | 12/16/19 | | | $ | 87,706 | |
Australian 10 Yr. Bond | | | Long | | | | 200 | | | | 20,105,599 | | | | 12/16/19 | | | | (243 | ) |
Canadian 10 Yr. Bond | | | Long | | | | 354 | | | | 38,193,817 | | | | 12/18/19 | | | | (531,552 | ) |
CME Ultra Long Term U.S. Treasury Bond | | | Short | | | | 5 | | | | 948,750 | | | | 12/19/19 | | | | 42,649 | |
U.S. Treasury 2 Yr. Note | | | Long | | | | 3,291 | | | | 709,544,742 | | | | 12/31/19 | | | | (1,561,842 | ) |
U.S. Treasury 5 Yr. Note | | | Short | | | | 76 | | | | 9,059,438 | | | | 12/31/19 | | | | 79,466 | |
U.S. Treasury 10 Yr. Note | | | Short | | | | 850 | | | | 110,752,344 | | | | 12/19/19 | | | | (238,196 | ) |
U.S. Treasury 30 Yr. Bond | | | Short | | | | 150 | | | | 24,206,250 | | | | 12/19/19 | | | | 656,037 | |
Ultra 10 Yr. U.S. Treasury Note | | | Short | | | | 84 | | | | 11,937,187 | | | | 12/19/19 | | | | 234,429 | |
| | | | | | | | | | | | | | | | | | | | |
| | | | | |
Total Futures Contracts | | | | | | | | | | | | | | | | | | $ | (1,231,546 | ) |
| | | | | | | | | | | | | | | | | | | | |
*As of period end.
At October 31, 2019, the Fund had the following forward exchange contracts outstanding. See Note 1(e).
Forward Exchange Contracts
| | | | | | | | | | | | | | | | | | | | | | | | | | | | |
| Currency | | Counterpartya | | | Type | | | Quantity | | | Contract Amount | | | Settlement Date | | | Unrealized Appreciation | | | Unrealized Depreciation | |
| |
OTC Forward Exchange Contracts | | | | | | | | | | | | | | | | | | | | | |
Brazilian Real | | | JPHQ | | | | Sell | | | | 2,640,000 | | | $ | 645,582 | | | | 12/09/19 | | | $ | — | | | $ | (10,752 | ) |
Brazilian Real | | | JPHQ | | | | Sell | | | | 985,000 | | | | 241,244 | | | | 12/11/19 | | | | — | | | | (3,615 | ) |
Indonesian Rupiah | | | JPHQ | | | | Buy | | | | 31,065,000,000 | | | | 2,120,912 | | | | 12/16/19 | | | | 73,897 | | | | — | |
Australian Dollar | | | JPHQ | | | | Sell | | | | 11,520,000 | | | | 7,773,523 | | | | 1/09/20 | | | | — | | | | (183,605 | ) |
Australian Dollar | | | JPHQ | | | | Sell | | | | 4,300,000 | | | | 2,931,525 | | | | 1/28/20 | | | | — | | | | (39,711 | ) |
Japanese Yen | | | JPHQ | | | | Buy | | | | 2,572,000,000 | | | | 24,360,898 | | | | 1/29/20 | | | | — | | | | (395,701 | ) |
Canadian Dollar | | | JPHQ | | | | Sell | | | | 9,160,000 | | | | 6,901,904 | | | | 1/30/20 | | | | — | | | | (59,120 | ) |
Canadian Dollar | | | JPHQ | | | | Sell | | | | 43,606,003 | | | | 33,187,715 | | | | 1/30/20 | | | | 49,895 | | | | — | |
Danish Krone | | | JPHQ | | | | Sell | | | | 88,653,329 | | | | 13,362,422 | | | | 1/30/20 | | | | 32,595 | | | | — | |
Euro | | | JPHQ | | | | Sell | | | | 63,822,612 | | | | 72,171,192 | | | | 1/30/20 | | | | 532,384 | | | | — | |
Mexican Peso | | | JPHQ | | | | Buy | | | | 48,650,000 | | | | 2,410,982 | | | | 1/30/20 | | | | 82,529 | | | | — | |
Norwegian Krone | | | JPHQ | | | | Buy | | | | 67,900,000 | | | | 7,546,118 | | | | 1/30/20 | | | | — | | | | (159,038 | ) |
Chinese Yuan Renminbi | | | JPHQ | | | | Sell | | | | 68,950,000 | | | | 9,697,114 | | | | 2/24/20 | | | | — | | | | (55,301 | ) |
Japanese Yen | | | JPHQ | | | | Buy | | | | 1,080,000,000 | | | | 10,161,502 | | | | 3/13/20 | | | | — | | | | (72,306 | ) |
Canadian Dollar | | | JPHQ | | | | Buy | | | | 43,524,355 | | | | 33,070,705 | | | | 3/16/20 | | | | 4,683 | | | | — | |
Canadian Dollar | | | JPHQ | | | | Sell | | | | 3,300,000 | | | | 2,495,803 | | | | 3/16/20 | | | | — | | | | (11,961 | ) |
Canadian Dollar | | | JPHQ | | | | Sell | | | | 5,300,000 | | | | 4,052,731 | | | | 3/16/20 | | | | 25,112 | | | | — | |
Euro | | | BZWS | | | | Sell | | | | 194,860 | | | | 218,644 | | | | 3/16/20 | | | | — | | | | (683 | ) |
Euro | | | CITI | | | | Sell | | | | 391,262 | | | | 439,094 | | | | 3/16/20 | | | | — | | | | (1,295 | ) |
Euro | | | DBAB | | | | Sell | | | | 3,367,136 | | | | 3,774,728 | | | | 3/16/20 | | | | — | | | | (15,185 | ) |
Euro | | | GSCO | | | | Sell | | | | 420,000 | | | | 470,988 | | | | 3/16/20 | | | | — | | | | (1,747 | ) |
Euro | | | JPHQ | | | | Sell | | | | 21,003,130 | | | | 23,504,936 | | | | 3/16/20 | | | | — | | | | (135,344 | ) |
Norwegian Krone | | | JPHQ | | | | Buy | | | | 83,000,000 | | | | 9,268,565 | | | | 3/16/20 | | | | — | | | | (239,746 | ) |
| | | | |
| | | |
| franklintempleton.com | | Annual Report | | 87 |
FRANKLIN INVESTORS SECURITIES TRUST
STATEMENT OF INVESTMENTS
Franklin Low Duration Total Return Fund(continued)
Forward Exchange Contracts(continued)
| | | | | | | | | | | | | | | | | | | | | | | | | | | | |
| Currency | | Counterpartya | | | Type | | | Quantity | | | Contract Amount | | | Settlement Date | | | Unrealized Appreciation | | | Unrealized Depreciation | |
| | | | |
OTC Forward Exchange Contracts(continued) | | | | | | | | | | | | | | | | | |
Swedish Krona | | | JPHQ | | | | Buy | | | | 59,800,000 | | | $ | 6,101,138 | | | | 3/16/20 | | | $ | 136,493 | | | $ | — | |
Swedish Krona | | | JPHQ | | | | Sell | | | | 59,800,000 | | | | 6,287,192 | | | | 3/16/20 | | | | 49,562 | | | | — | |
South Korean Won | | | JPHQ | | | | Sell | | | | 2,920,000,000 | | | | 2,454,400 | | | | 3/25/20 | | | | — | | | | (50,220 | ) |
Turkish Lira | | | JPHQ | | | | Buy | | | | 9,910,000 | | | | 1,571,395 | | | | 4/15/20 | | | | 87,878 | | | | — | |
| | | | | | | | | | | | | | | | | | | | | | | | |
Total Forward Exchange Contracts | | | | | | | | | | | | | | | | | | | | | | $ | 1,075,028 | | | $ | (1,435,330 | ) |
| | | | | | | | | | | | | | | | | | | | | | | | |
Net unrealized appreciation (depreciation) | | | | | | | | | | | | | | | | | | | $ | (360,302 | ) |
| | | | | | | | | | | | | | | | | | | | | | | | | | | | |
aMay be comprised of multiple contracts with the same counterparty, currency and settlement date.
At October 31, 2019, the Fund had the following credit default swap contracts outstanding. See Note 1(e).
Credit Default Swap Contracts
| | | | | | | | | | | | | | | | | | | | | | | | | | | | | | | | | | | | |
| Description | | Periodic Payment Rate Received (Paid) | | | Payment Frequency | | | Counter- party | | | Maturity Date | | | Notional Amounta | | | Value | | | Unamortized Upfront Payments (Receipts) | | | Unrealized Appreciation (Depreciation) | | | Ratingb | |
| | | | | | | |
Centrally Cleared Swap Contracts | | | | | | | | | | | | | | | | | | | | | | | | | | | | | |
| | | | | | | |
Contracts to Sell Protectionc,d | | | | | | | | | | | | | | | | | | | | | | | | | | | | | |
| | | | | | | | | |
Traded Index | | | | | | | | | | | | | | | | | | | | | | | | | | | | | | | | | | | | |
CDX.NA.HY.24 | | | 5.00% | | | | Quarterly | | | | | | | | 6/20/20 | | | $ | 28,536,250 | | | $ | 538,027 | | | $ | 496,637 | | | $ | 41,390 | | |
| Non- Investment
Grade |
|
CDX.NA.IG.31 | | | 1.00% | | | | Quarterly | | | | | | | | 12/20/21 | | | | 74,600,000 | | | | 1,363,537 | | | | 868,045 | | | | 495,492 | | | | Investment Grade | |
| | | | | | | | | | | | | | | | | | | | | | | | | | | | |
Total Centrally Cleared Swap Contracts | | | | | | | | | | | | | | | $ | 1,901,564 | | | $ | 1,364,682 | | | $ | 536,882 | | | | | |
| | | | | | | | | | | | | | | | | | | | | | | | | | | | |
| | | | | | | |
OTC Swap Contracts | | | | | | | | | | | | | | | | | | | | | | | | | | | | | |
| | | | | | | |
Contracts to Buy Protectionc | | | | | | | | | | | | | | | | | | | | | | | | | | | | | |
| | | | | | | | | |
Single Name | | | | | | | | | | | | | | | | | | | | | | | | | | | | | | | | | | | | |
Ally Financial Inc. | | | (5.00)% | | | | Quarterly | | | | JPHQ | | | | 12/20/24 | | | $ | 11,000,000 | | | $ | (2,263,291 | ) | | $ | (2,113,160 | ) | | $ | (150,131 | ) | | | | |
American Airlines Group Inc. | | | (5.00)% | | | | Quarterly | | | | CITI | | | | 12/20/19 | | | | 1,780,000 | | | | (21,878 | ) | | | (10,034 | ) | | | (11,844 | ) | | | | |
Avon Products Inc. | | | (5.00)% | | | | Quarterly | | | | CITI | | | | 3/20/23 | | | | 5,835,000 | | | | (668,856 | ) | | | (574,811 | ) | | | (94,045 | ) | | | | |
Government of Italy | | | (1.00)% | | | | Quarterly | | | | BZWS | | | | 6/20/23 | | | | 4,100,000 | | | | (63,316 | ) | | | 32,482 | | | | (95,798 | ) | | | | |
Government of Turkey | | | (1.00)% | | | | Quarterly | | | | BZWS | | | | 12/20/19 | | | | 900,000 | | | | (1,553 | ) | | | 5,757 | | | | (7,310 | ) | | | | |
Nabors Industries Inc. | | | (1.00)% | | | | Quarterly | | | | CITI | | | | 12/20/21 | | | | 5,150,000 | | | | 616,740 | | | | 160,545 | | | | 456,195 | | | | | |
Navient Corp. | | | (5.00)% | | | | Quarterly | | | | JPHQ | | | | 3/20/20 | | | | 1,150,000 | | | | (27,611 | ) | | | (16,169 | ) | | | (11,442 | ) | | | | |
| | | | | | | |
Contracts to Sell Protectionc,d | | | | | | | | | | | | | | | | | | | | | | | | | | | | | |
| | | | | | | | | |
Single Name | | | | | | | | | | | | | | | | | | | | | | | | | | | | | | | | | | | | |
American Tower Corp. | | | 1.00% | | | | Quarterly | | | | GSCO | | | | 3/20/21 | | | | 6,500,000 | | | | 20,414 | | | | (33,733 | ) | | | 54,147 | | | | BBB- | |
The Goldman Sachs Group Inc. | | | 1.00% | | | | Quarterly | | | | JPHQ | | | | 12/20/24 | | | | 11,000,000 | | | | 220,478 | | | | 194,747 | | | | 25,731 | | | | BBB+ | |
Government of Argentina | | | 5.00% | | | | Quarterly | | | | CITI | | | | 12/20/21 | | | | 7,085,000 | | | | (4,208,379 | ) | | | (4,007,018 | ) | | | (201,361 | ) | | | CCC- | |
Government of Indonesia | | | 1.00% | | | | Quarterly | | | | CITI | | | | 12/20/24 | | | | 5,225,000 | | | | 65,889 | | | | 35,145 | | | | 30,744 | | | | NR | |
Government of Italy | | | 1.00% | | | | Quarterly | | | | BZWS | | | | 6/20/23 | | | | 4,100,000 | | | | 20,813 | | | | (142,437 | ) | | | 163,250 | | | | NR | |
Government of Russia | | | 1.00% | | | | Quarterly | | | | CITI | | | | 12/20/24 | | | | 3,700,000 | | | | 47,268 | | | | 37,701 | | | | 9,567 | | | | BBB- | |
Government of Spain | | | 1.00% | | | | Quarterly | | | | CITI | | | | 12/20/24 | | | | 4,400,000 | | | | 144,651 | | | | 128,704 | | | | 15,947 | | | | NR | |
| | | | |
| | | |
88 | | Annual Report | | franklintempleton.com |
FRANKLIN INVESTORS SECURITIES TRUST
STATEMENT OF INVESTMENTS
Franklin Low Duration Total Return Fund(continued)
Credit Default Swap Contracts(continued)
| | | | | | | | | | | | | | | | | | | | | | | | | | | | | | | | | | | | |
| Description | | Periodic Payment Rate Received (Paid) | | | Payment Frequency | | | Counter- party | | | Maturity Date | | | Notional Amounta | | | Value | | | Unamortized Upfront Payments (Receipts) | | | Unrealized Appreciation (Depreciation) | | | Ratingb | |
| |
| | | | | | | |
OTC Swap Contracts(continued) | | | | | | | | | | | | | | | | | | | | | | | | | | | | | |
| | | | | | | |
Contracts to Sell Protectionc,d(continued) | | | | | | | | | | | | | | | | | | | | | | | | | | | | | |
| | | | | | | |
Single Name(continued) | | | | | | | | | | | | | | | | | | | | | | | | | | | | | |
Morgan Stanley | | | 1.00 | % | | | Quarterly | | | | JPHQ | | | | 12/20/24 | | | $ | 11,000,000 | | | $ | 239,090 | | | $ | 213,745 | | | $ | 25,345 | | | | BBB+ | |
Nabors Industries Inc. | | | 1.00 | % | | | Quarterly | | | | CITI | | | | 12/20/23 | | | | 5,150,000 | | | | (1,295,717 | ) | | | (638,278 | ) | | | (657,439 | ) | | | BB- | |
Traded Index | | | | | | | | | | | | | | | | | | | | | | | | | | | | | | | | | | | | |
eBNP Paribas Bespoke Rodez Index, Mezzanine Tranche 5-7% | | | 2.00 | % | | | Quarterly | | | | BNDP | | | | 12/20/20 | | | | 3,600,000 | | | | 29,863 | | | | — | | | | 29,863 | | | | Non- | |
| | | | | | | | | | | | | | | | | | | | | | | | | | | | | | | | | | | Investment | |
| | | | | | | | | | | | | | | | | | | | | | | | | | | | | | | | | | | Grade | |
eBNP Paribas Bespoke Rodez2 Index, Mezzanine Tranche 5-7% | | | 3.20 | % | | | Quarterly | | | | BNDP | | | | 12/20/20 | | | | 2,000,000 | | | | 48,245 | | | | — | | | | 48,245 | | |
| Non-
|
|
| | | | | | | | | | | | | | | | | | | | | | | | | | | | | | | | | | | Investment | |
| | | | | | | | | | | | | | | | | | | | | | | | | | | | | | | | | | | Grade | |
eCitibank Bespoke Cambridge Index, Equity Tranche 0-3% | | | 0.00 | % | | | Quarterly | | | | CITI | | | | 12/20/19 | | | | 2,200,500 | | | | (196,514 | ) | | | (24,674 | ) | | | (171,840 | ) | |
| Non-
|
|
| | | | | | | | | | | | | | | | | | | | | | | | | | | | | | | | | | | Investment | |
| | | | | | | | | | | | | | | | | | | | | | | | | | | | | | | | | | | Grade | |
eCitibank Bespoke Palma Index, Mezzanine Tranche 5-7% | | | 2.30 | % | | | Quarterly | | | | CITI | | | | 6/20/21 | | | | 4,200,000 | | | | 59,610 | | | | — | | | | 59,610 | | |
| Non-
|
|
| | | | | | | | | | | | | | | | | | | | | | | | | | | | | | | | | | | Investment | |
| | | | | | | | | | | | | | | | | | | | | | | | | | | | | | | | | | | Grade | |
eCitibank Bespoke Phoenix Index, Mezzanine Tranche 5-7% | | | 2.90 | % | | | Quarterly | | | | CITI | | | | 12/20/21 | | | | 2,800,000 | | | | 76,517 | | | | — | | | | 76,517 | | |
| Non-
|
|
| | | | | | | | | | | | | | | | | | | | | | | | | | | | | | | | | | | Investment | |
| | | | | | | | | | | | | | | | | | | | | | | | | | | | | | | | | | | Grade | |
eCitibank Bespoke Singapore Index, Equity Tranche 0-3% | | | 0.00 | % | | | Quarterly | | | | CITI | | | | 6/20/20 | | | | 5,000,000 | | | | (529,614 | ) | | | (445,361 | ) | | | (84,253 | ) | |
| Non-
|
|
| | | | | | | | | | | | | | | | | | | | | | | | | | | | | | | | | | | Investment | |
| | | | | | | | | | | | | | | | | | | | | | | | | | | | | | | | | | | Grade | |
eCitibank Bespoke Sydney Index, Equity Tranche 0-3% | | | 0.00 | % | | | Quarterly | | | | CITI | | | | 6/20/20 | | | | 798,913 | | | | (101,805 | ) | | | (81,239 | ) | | | (20,566 | ) | |
| Non-
|
|
| | | | | | | | | | | | | | | | | | | | | | | | | | | | | | | | | | | Investment | |
| | | | | | | | | | | | | | | | | | | | | | | | | | | | | | | | | | | Grade | |
eCitibank Bespoke Verona Index, Equity Tranche 0-3% | | | 0.00 | % | | | Quarterly | | | | CITI | | | | 12/20/19 | | | | 1,711,500 | | | | (23,667 | ) | | | (23,557 | ) | | | (110 | ) | |
| Non-
|
|
| | | | | | | | | | | | | | | | | | | | | | | | | | | | | | | | | | | Investment | |
| | | | | | | | | | | | | | | | | | | | | | | | | | | | | | | | | | | Grade | |
eCitibank Bespoke Verona Index, Mezzanine Tranche 7-15% | | | 0.40 | % | | | Quarterly | | | | CITI | | | | 12/20/19 | | | | 4,000,000 | | | | 2,843 | | | | — | | | | 2,843 | | |
| Non-
|
|
| | | | | | | | | | | | | | | | | | | | | | | | | | | | | | | | | | | Investment | |
| | | | | | | | | | | | | | | | | | | | | | | | | | | | | | | | | | | Grade | |
| | | | |
| | | |
| franklintempleton.com | | Annual Report | | 89 |
FRANKLIN INVESTORS SECURITIES TRUST
STATEMENT OF INVESTMENTS
Franklin Low Duration Total Return Fund(continued)
Credit Default Swap Contracts(continued)
| | | | | | | | | | | | | | | | | | | | | | | | | | | | | | | | | | | | |
| Description | | Periodic
Payment Rate
Received
(Paid) | | | Payment
Frequency | | | Counter- party | | | Maturity
Date | | | Notional
Amounta | | | Value | | | Unamortized
Upfront
Payments
(Receipts) | | | Unrealized
Appreciation
(Depreciation) | | | Ratingb | |
| | | | | | | | | |
OTC Swap Contracts (continued) | | | | | | | | | | | | | | | | | | | | | | | | | | | | | | | | | | | | |
| | | | | | | | |
Contracts to Sell Protectionc,d (continued) | | | | | | | | | | | | | | | | | | | | | | | | | | | | | | | | | |
| | | | | | | | | |
Traded Index(continued) | | | | | | | | | | | | | | | | | | | | | | | | | | | | | | | | | | | | |
| | | | | | | | | |
eMorgan Stanley Bespoke Pecan Index, Mezzanine
Tranche 5-10% | | | 3.98 | % | | | Quarterly | | | | MSCO | | | | 12/20/21 | | | $ | 2,900,000 | | | $ | 72,994 | | | $ | — | | | $ | 72,994 | | |
| Non-
Investment
Grade |
|
| | | | | | | | | |
eMorgan Stanley Bespoke Pecan Index, Mezzanine
Tranche 5-10% | | | 4.10 | % | | | Quarterly | | | | MSCO | | | | 12/20/21 | | | | 2,900,000 | | | | 86,225 | | | | — | | | | 86,225 | | |
| Non-
Investment
Grade |
|
Total OTC Swap Contracts | | | | | | | | | | | | | | | | | | | $ | (7,650,561 | ) | | $ | (7,301,645 | ) | | $ | (348,916 | ) | | | | |
Total Credit Default Swap Contracts | | | | | | | | | | | | | | | $ | (5,748,997 | ) | | $ | (5,936,963 | ) | | $ | 187,966 | | | | | |
aIn U.S. dollars unless otherwise indicated. For contracts to sell protection, the notional amount is equal to the maximum potential amount of the future payments and no recourse provisions have been entered into in association with the contracts.
bBased on Standard and Poor’s (S&P) Rating for single name swaps and internal ratings for index swaps. Internal ratings based on mapping into equivalent ratings from external vendors.
cPerformance triggers for settlement of contract include default, bankruptcy or restructuring for single name swaps, and failure to pay or bankruptcy of the underlying securities for traded index swaps.
dThe Fund enters contracts to sell protection to create a long credit position.
eRepresents a custom index comprised of a basket of underlying instruments.
At October 31, 2019, the Fund had the following cross-currency swap contracts outstanding. See Note 1(e).
Cross-Currency Swap Contracts
| | | | | | | | | | | | | | | | | | | | | | | | |
| Description | | Payment Frequency | | | Coun- terparty | | | Maturity Date | | | Notional Amount | | | | | | Value/ Unrealized Appreciation (Depreciation) | |
| |
| | | | | | |
OTC Swap Contracts | | | | | | | | | | | | | | | | | | | | | | | | |
| | | | | | |
Receive Fixed 2.393% | | | Semi-Annual | | | | | | | | | | | | 7,916,500 | | | | USD | | | | | |
| | | | | | |
Pay Fixed 0.50% | | | Annual | | | | JPHQ | | | | 4/09/20 | | | | 7,100,000 | | | | EUR | | | | $ (32,283) | |
| | | | | | |
Receive Floating 3-month USD LIBOR + 2.87% | | | Quarterly | | | | | | | | | | | | 1,743,000 | | | | USD | | | | | |
| | | | | | |
Pay Fixed 2.50% | | | Annual | | | | CITI | | | | 5/04/21 | | | | 1,500,000 | | | | EUR | | | | 68,293 | |
| | | | | | |
Receive Floating 3-month USD LIBOR + 1.334% | | | Quarterly | | | | | | | | | | | | 4,704,000 | | | | USD | | | | | |
| | | | | | |
Pay Floating 3-month EUR LIBOR + 1.12% | | | Quarterly | | | | CITI | | | | 7/10/21 | | | | 4,200,000 | | | | EUR | | | | 29,102 | |
| | | | | | |
Receive Floating 3-month USD LIBOR + 1.81% | | | Quarterly | | | | | | | | | | | | 6,720,000 | | | | USD | | | | | |
| | | | | | |
Pay Floating 3-month EUR LIBOR + 1.60% | | | Quarterly | | | | CITI | | | | 8/12/21 | | | | 6,000,000 | | | | EUR | | | | 78,393 | |
| | | | | | |
Receive Floating 3-month USD LIBOR + 1.31% | | | Quarterly | | | | | | | | | | | | 13,875,000 | | | | USD | | | | | |
| | | | | | |
Pay Floating 3-month EUR LIBOR + 1.11% | | | Quarterly | | | | CITI | | | | 8/30/21 | | | | 12,500,000 | | | | EUR | | | | 2,605 | |
| | | | | | |
Receive Floating 3-month USD LIBOR + 1.23% | | | Quarterly | | | | | | | | | | | | 15,429,000 | | | | USD | | | | | |
| | | | | | |
Pay Floating 3-month EUR LIBOR + 1.07% | | | Quarterly | | | | CITI | | | | 9/17/21 | | | | 13,900,000 | | | | EUR | | | | (25,786 | ) |
| | | | | | | | | | | | | | | | | | | | | | | | |
| | | | | | |
Total Cross Currency Swap Contracts | | | | | | | | | | | | | | | | | | | | | | | $ 120,324 | |
| | | | | | | | | | | | | | | | | | | | | | | | |
| | | | |
| | | |
90 | | Annual Report | | franklintempleton.com |
FRANKLIN INVESTORS SECURITIES TRUST
STATEMENT OF INVESTMENTS
Franklin Low Duration Total Return Fund(continued)
At October 31, 2019, the Fund had the following interest rate swap contracts outstanding. See Note 1(e).
Interest Rate Swap Contracts
| | | | | | | | | | | | | | | | | | |
| Description | | Payment
Frequency | | | Maturity
Date | | | Notional
Amount* | | | Value/ Unrealized Appreciation
(Depreciation) | |
| |
Centrally Cleared Swap Contracts | | | | | | | | | | | | |
Receive Fixed 2.773% | | | Quarterly | | | | | | | | | |
Pay Floating 3-month CNY CNRR | | | Quarterly | | | | 8/23/24 | | | | 135,800,000 | | | CNY | | | $(288,249 | ) |
Receive Fixed 2.765% | | | Quarterly | | | | | | | | | |
Pay Floating 3-month CNY CNRR | | | Quarterly | | | | 8/26/24 | | | | 109,200,000 | | | CNY | | | (237,145 | ) |
Receive Fixed 2.79% | | | Quarterly | | | | | | | | | |
Pay Floating 3-month CNY CNRR | | | Quarterly | | | | 8/30/24 | | | | 171,350,000 | | | CNY | | | (352,681 | ) |
| | | | | | | | | | | | | | | | | | |
Total Interest Rate Swap Contracts | | | | | | | | | | | | | | $(878,075 | ) |
| | | | | | | | | | | | | | | | | | |
*In U.S. dollars unless otherwise indicated.
At October 31, 2019, the Fund had the following inflation index swap contracts outstanding. See Note 1(e).
Inflation Index Swap Contracts
| | | | | | | | | | | | | | | | |
| Description | | Payment
Frequency | | | Maturity
Date | | | Notional
Amount | | | Value/
Unrealized
Appreciaton
(Depreciation) | |
| |
| | | | |
Centrally Cleared Swap Contracts | | | | | | | | | | | | | | | | |
Receive variable change in USA-CPI-U | | | At maturity | | | | | | | | | | | | | |
Pay Fixed 1.96% | | | At maturity | | | | 8/31/24 | | | $ | 25,200,000 | | | | $ (313,072 | ) |
Receive variable change in USA-CPI-U | | | At maturity | | | | | | | | | | | | | |
Pay Fixed 1.719% | | | At maturity | | | | 8/14/26 | | | | 16,000,000 | | | | (77,305 | ) |
| | | | | | | | | | | | | | | | |
Total Inflation Index Swap Contracts | | | | | | | | | | | | | | | $ (390,377 | ) |
| | | | | | | | | | | | | | | | |
At October 31, 2019, the Fund had the following total return swap contracts outstanding. See Note 1(e).
Total Return Swap Contracts
| | | | | | | | | | | | | | | | | | | | | | | | |
| Underlying Instruments | | Financing Rate | | Payment
Frequency | | | Counter- party | | | Maturity
Date | | | Notional
Value* | | | | | Value/
Unrealized
Appreciation
(Depreciation) | |
| |
OTC Swap Contracts | | | | | | | | | | | | | | | | | | | | | | | | |
Longa | | | | | | | | | | | | | | | | | | | | | | | | |
Euribor 3 Month | | 3-month EUR LIBOR | | | Quarterly | | | | BNDP | | | | 12/20/19 | | | | 8,500,000 | | | EUR | | | $ (15,642 | ) |
Euribor 3 Month | | 3-month EUR LIBOR | | | Quarterly | | | | CITI | | | | 12/20/19 | | | | 18,750,000 | | | EUR | | | (72,007 | ) |
Markit iBoxx USD Liquid Leveraged Loan Index | | 3-month USD LIBOR | | | Quarterly | | | | JPHQ | | | | 12/20/19 | | | | 1,300,000 | | | | | | 10,562 | |
Markit iBoxx USD Liquid Leveraged Loan Index | | 3-month USD LIBOR | | | Quarterly | | | | MSCO | | | | 12/20/19 | | | | 1,700,000 | | | | | | 24,196 | |
Markit iBoxx USD Liquid Leveraged Loan Index | | 3-month USD LIBOR | | | Quarterly | | | | FBCO | | | | 3/20/20 | | | | 1,600,000 | | | | | | 19,666 | |
Markit iBoxx USD Liquid Leveraged Loan Index | | 3-month USD LIBOR | | | Quarterly | | | | GSCO | | | | 3/20/20 | | | | 2,600,000 | | | | | | 42,832 | |
Markit iBoxx USD Liquid Leveraged Loan Index | | 3-month USD LIBOR | | | Quarterly | | | | BZWS | | | | 6/20/20 | | | | 30,950,000 | | | | | | (329,186 | ) |
Shortb | | | | | | | | | | | | | | | | | | | | | | | | |
iBoxx USD Liquid Investment Grade Index | | 3-month USD LIBOR | | | Quarterly | | | | BNDP | | | | 12/20/19 | | | | 6,400,000 | | | | | | (2,762 | ) |
iBoxx USD Liquid Investment Grade Index | | 3-month USD LIBOR | | | Quarterly | | | | GSCO | | | | 12/20/19 | | | | 5,400,000 | | | | | | 7,741 | |
| | | | | | | | | | | | | | | | | | | | | | | | |
Total Total Return Swap Contracts | | | | | | | | | | | | | | | | | | | | | | | $ (314,600 | ) |
| | | | | | | | | | | | | | | | | | | | | | | | |
*In U.S. dollars unless otherwise indicated.
aThe Fund receives the total return on the underlying instrument and pays a variable financing rate.
bThe Fund receives the variable financing rate and pays the total return on the underlying instrument.
See Note 9 regarding other derivative information.
| | | | |
| | | |
| franklintempleton.com | | The accompanying notes are an integral part of these financial statements. | Annual Report | | 91 |
FRANKLIN INVESTORS SECURITIES TRUST
Consolidated Financial Highlights
Franklin Total Return Fund
| | | | | | | | | | | | | | | | | | | | |
| | | Year Ended October 31, | |
| | | 2019 | | | 2018 | | | 2017 | | | 2016 | | | 2015 | |
| | | | | |
Class A | | | | | | | | | | | | | | | | | | | | |
| | | | | |
Per share operating performance | | | | | | | | | | | | | | | | | | | | |
(for a share outstanding throughout the year) | | | | | | | | | | | | | | | | | | | | |
| | | | | |
Net asset value, beginning of year | | | $ 9.31 | | | | $ 9.84 | | | | $ 9.93 | | | | $ 9.87 | | | | $ 10.18 | |
| | | | | |
Income from investment operationsa: | | | | | | | | | | | | | | | | | | | | |
| | | | | |
Net investment income | | | 0.302 | b | | | 0.269 | | | | 0.251 | b | | | 0.231 | | | | 0.217 | |
| | | | | |
Net realized and unrealized gains (losses) | | | 0.618 | | | | (0.518 | ) | | | (0.110 | ) | | | 0.107 | | | | (0.220 | ) |
| | | | | |
Total from investment operations | | | 0.920 | | | | (0.249 | ) | | | 0.141 | | | | 0.338 | | | | (0.003 | ) |
| | | | | |
Less distributions from: | | | | | | | | | | | | | | | | | | | | |
| | | | | |
Net investment income and net foreign currency gains | | | (0.310 | ) | | | (0.275 | ) | | | (0.231 | ) | | | (0.278 | ) | | | (0.307 | ) |
| | | | | |
Tax return of capital | | | — | | | | (0.006 | ) | | | — | | | | — | | | | — | |
| | | | | |
Total distributions | | | (0.310 | ) | | | (0.281 | ) | | | (0.231 | ) | | | (0.278 | ) | | | (0.307 | ) |
| | | | | |
Net asset value, end of year | | | $ 9.92 | | | | $ 9.31 | | | | $ 9.84 | | | | $ 9.93 | | | | $ 9.87 | |
| | | | | |
Total returnc | | | 10.01% | | | | (2.57 | )% | | | 1.47% | | | | 3.53% | | | | (0.05)% | |
| | | | | |
Ratios to average net assets | | | | | | | | | | | | | | | | | | | | |
| | | | | |
Expenses before waiver and payments by affiliates | | | 0.90% | | | | 0.91% | | | | 0.91% | | | | 0.90% | | | | 0.91% | |
| | | | | |
Expenses net of waiver and payments by affiliatesd | | | 0.86% | | | | 0.88% | | | | 0.87% | | | | 0.85% | | | | 0.87% | |
| | | | | |
Net investment income | | | 3.12% | | | | 2.91% | | | | 2.58% | | | | 2.32% | | | | 2.08% | |
| | | | | |
Supplemental data | | | | | | | | | | | | | | | | | | | | |
| | | | | |
Net assets, end of year (000’s) | | | $3,422,747 | | | | $2,763,774 | | | | $3,153,751 | | | | $3,623,035 | | | | $3,527,479 | |
| | | | | |
Portfolio turnover rate | | | 169.95% | e | | | 151.77% | | | | 101.07% | | | | 287.38% | | | | 294.80% | |
| | | | | |
Portfolio turnover rate excluding mortgage dollar rollsf | | | 98.83% | e | | | 84.86% | | | | 78.46% | | | | 146.15% | | | | 95.06% | |
aThe amount shown for a share outstanding throughout the period may not correlate with the Consolidated Statement of Operations for the period due to the timing of sales and repurchases of the Fund’s shares in relation to income earned and/or fluctuating fair value of the investments of the Fund.
bBased on average daily shares outstanding.
cTotal return does not reflect sales commissions or contingent deferred sales charges, if applicable.
dBenefit of expense reduction rounds to less than 0.01%.
eExcludes the value of portfolio activity as a result of in-kind transactions. See Note 6.
fSee Note 1(i) regarding mortgage dollar rolls.
| | | | |
| | | |
92 | | Annual Report | The accompanying notes are an integral part of these financial statements. | | franklintempleton.com |
FRANKLIN INVESTORS SECURITIES TRUST
CONSOLIDATED FINANCIAL HIGHLIGHTS
Franklin Total Return Fund(continued)
| | | | | | | | | | | | | | | | | | | | |
| | | Year Ended October 31, | |
| | | 2019 | | | 2018 | | | 2017 | | | 2016 | | | 2015 | |
| | | | | |
Class C | | | | | | | | | | | | | | | | | | | | |
| | | | | |
Per share operating performance | | | | | | | | | | | | | | | | | | | | |
(for a share outstanding throughout the year) | | | | | | | | | | | | | | | | | | | | |
| | | | | |
Net asset value, beginning of year | | | $ 9.25 | | | | $ 9.77 | | | | $ 9.87 | | | | $ 9.84 | | | | $ 10.16 | |
| | | | | |
Income from investment operationsa: | | | | | | | | | | | | | | | | | | | | |
| | | | | |
Net investment income | | | 0.262 | b | | | 0.183 | | | | 0.212 | b | | | 0.189 | | | | 0.172 | |
| | | | | |
Net realized and unrealized gains (losses) | | | 0.609 | | | | (0.457 | ) | | | (0.109 | ) | | | 0.100 | | | | (0.214 | ) |
| | | | | |
Total from investment operations | | | 0.871 | | | | (0.274 | ) | | | 0.103 | | | | 0.289 | | | | (0.042 | ) |
| | | | | |
Less distributions from: | | | | | | | | | | | | | | | | | | | | |
| | | | | |
Net investment income and net foreign currency gains | | | (0.271 | ) | | | (0.241 | ) | | | (0.203 | ) | | | (0.259 | ) | | | (0.278 | ) |
| | | | | |
Tax return of capital | | | — | | | | (0.005 | ) | | | — | | | | — | | | | — | |
| | | | | |
Total distributions | | | (0.271 | ) | | | (0.246 | ) | | | (0.203 | ) | | | (0.259 | ) | | | (0.278 | ) |
| | | | | |
Net asset value, end of year | | | $ 9.85 | | | | $ 9.25 | | | | $ 9.77 | | | | $ 9.87 | | | | $ 9.84 | |
| | | | | |
Total returnc | | | 9.52% | | | | (2.84 | )% | | | 0.98% | | | | 3.13% | | | | (0.43)% | |
| | | | | |
Ratios to average net assets | | | | | | | | | | | | | | | | | | | | |
| | | | | |
Expenses before waiver and payments by affiliates | | | 1.30% | | | | 1.31% | | | | 1.31% | | | | 1.30% | | | | 1.31% | |
| | | | | |
Expenses net of waiver and payments by affiliatesd | | | 1.26% | | | | 1.28% | | | | 1.27% | | | | 1.25% | | | | 1.27% | |
| | | | | |
Net investment income | | | 2.72% | | | | 2.51% | | | | 2.18% | | | | 1.92% | | | | 1.68% | |
| | | | | |
Supplemental data | | | | | | | | | | | | | | | | | | | | |
| | | | | |
Net assets, end of year (000’s) | | | $236,838 | | | | $243,068 | | | | $354,269 | | | | $449,274 | | | | $444,253 | |
| | | | | |
Portfolio turnover rate | | | 169.95% | e | | | 151.77% | | | | 101.07% | | | | 287.38% | | | | 294.80% | |
| | | | | |
Portfolio turnover rate excluding mortgage dollar rollsf | | | 98.83% | e | | | 84.86% | | | | 78.46% | | | | 146.15% | | | | 95.06% | |
aThe amount shown for a share outstanding throughout the period may not correlate with the Consolidated Statement of Operations for the period due to the timing of sales and repurchases of the Fund’s shares in relation to income earned and/or fluctuating fair value of the investments of the Fund.
bBased on average daily shares outstanding.
cTotal return does not reflect sales commissions or contingent deferred sales charges, if applicable.
dBenefit of expense reduction rounds to less than 0.01%.
eExcludes the value of portfolio activity as a result of in-kind transactions. See Note 6.
fSee Note 1(i) regarding mortgage dollar rolls.
| | | | |
| | | |
| franklintempleton.com | | The accompanying notes are an integral part of these financial statements. | Annual Report | | 93 |
FRANKLIN INVESTORS SECURITIES TRUST
CONSOLIDATED FINANCIAL HIGHLIGHTS
Franklin Total Return Fund(continued)
| | | | | | | | | | | | | | | | | | | | |
| | | Year Ended October 31, | |
| | | 2019 | | | 2018 | | | 2017 | | | 2016 | | | 2015 | |
| | | | | |
Class R | | | | | | | | | | | | | | | | | | | | |
| | | | | |
Per share operating performance | | | | | | | | | | | | | | | | | | | | |
(for a share outstanding throughout the year) | | | | | | | | | | | | | | | | | | | | |
| | | | | |
Net asset value, beginning of year | | | $ 9.27 | | | | $ 9.80 | | | | $ 9.90 | | | | $ 9.85 | | | | $ 10.17 | |
| | | | | |
Income from investment operationsa: | | | | | | | | | | | | | | | | | | | | |
| | | | | |
Net investment income | | | 0.277 | b | | | 0.182 | | | | 0.228 | b | | | 0.199 | | | | 0.198 | |
| | | | | |
Net realized and unrealized gains (losses) | | | 0.619 | | | | (0.453 | ) | | | (0.115 | ) | | | 0.117 | | | | (0.229 | ) |
| | | | | |
Total from investment operations | | | 0.896 | | | | (0.271 | ) | | | 0.113 | | | | 0.316 | | | | (0.031 | ) |
| | | | | |
Less distributions from: | | | | | | | | | | | | | | | | | | | | |
| | | | | |
Net investment income and net foreign currency gains | | | (0.286 | ) | | | (0.253 | ) | | | (0.213 | ) | | | (0.266 | ) | | | (0.289 | ) |
| | | | | |
Tax return of capital | | | — | | | | (0.006 | ) | | | — | | | | — | | | | — | |
| | | | | |
Total distributions | | | (0.286 | ) | | | (0.259 | ) | | | (0.213 | ) | | | (0.266 | ) | | | (0.289 | ) |
| | | | | |
Net asset value, end of year | | | $ 9.88 | | | | $ 9.27 | | | | $ 9.80 | | | | $ 9.90 | | | | $ 9.85 | |
| | | | | |
Total return | | | 9.66% | | | | (2.70 | )% | | | 1.19% | | | | 3.31% | | | | (0.32)% | |
| | | | | |
Ratios to average net assets | | | | | | | | | | | | | | | | | | | | |
| | | | | |
Expenses before waiver and payments by affiliates | | | 1.15% | | | | 1.16% | | | | 1.16% | | | | 1.15% | | | | 1.16% | |
| | | | | |
Expenses net of waiver and payments by affiliatesc | | | 1.11% | | | | 1.13% | | | | 1.12% | | | | 1.10% | | | | 1.12% | |
| | | | | |
Net investment income | | | 2.87% | | | | 2.66% | | | | 2.33% | | | | 2.07% | | | | 1.83% | |
| | | | | |
Supplemental data | | | | | | | | | | | | | | | | | | | | |
| | | | | |
Net assets, end of year (000’s) | | | $21,223 | | | | $23,620 | | | | $36,337 | | | | $58,715 | | | | $70,506 | |
| | | | | |
Portfolio turnover rate | | | 169.95% | d | | | 151.77% | | | | 101.07% | | | | 287.38% | | | | 294.80% | |
| | | | | |
Portfolio turnover rate excluding mortgage dollar rollse | | | 98.83% | d | | | 84.86% | | | | 78.46% | | | | 146.15% | | | | 95.06% | |
aThe amount shown for a share outstanding throughout the period may not correlate with the Consolidated Statement of Operations for the period due to the timing of sales and repurchases of the Fund’s shares in relation to income earned and/or fluctuating fair value of the investments of the Fund.
bBased on average daily shares outstanding.
cBenefit of expense reduction rounds to less than 0.01%.
dExcludes the value of portfolio activity as a result of in-kind transactions. See Note 6.
eSee Note 1(i) regarding mortgage dollar rolls.
| | | | |
| | | |
94 | | Annual Report | The accompanying notes are an integral part of these financial statements. | | franklintempleton.com |
FRANKLIN INVESTORS SECURITIES TRUST
CONSOLIDATED FINANCIAL HIGHLIGHTS
Franklin Total Return Fund(continued)
| | | | | | | | | | | | | | | | | | | | |
| | | Year Ended October 31, | |
| | | 2019 | | | 2018 | | | 2017 | | | 2016 | | | 2015 | |
| | | | | |
Class R6 | | | | | | | | | | | | | | | | | | | | |
| | | | | |
Per share operating performance | | | | | | | | | | | | | | | | | | | | |
(for a share outstanding throughout the year) | | | | | | | | | | | | | | | | | | | | |
| | | | | |
Net asset value, beginning of year | | | $ 9.38 | | | | $ 9.90 | | | | $ 9.98 | | | | $ 9.91 | | | | $ 10.20 | |
| | | | | |
Income from investment operationsa: | | | | | | | | | | | | | | | | | | | | |
| | | | | |
Net investment income | | | 0.340 | b | | | 0.308 | | | | 0.296 | b | | | 0.195 | | | | 0.255 | b |
| | | | | |
Net realized and unrealized gains (losses) | | | 0.617 | | | | (0.512 | ) | | | (0.117 | ) | | | 0.173 | | | | (0.209 | ) |
| | | | | |
Total from investment operations | | | 0.957 | | | | (0.204 | ) | | | 0.179 | | | | 0.368 | | | | 0.046 | |
| | | | | |
Less distributions from: | | | | | | | | | | | | | | | | | | | | |
| | | | | |
Net investment income and net foreign currency gains | | | (0.347 | ) | | | (0.309 | ) | | | (0.259 | ) | | | (0.298 | ) | | | (0.336 | ) |
| | | | | |
Tax return of capital | | | — | | | | (0.007 | ) | | | — | | | | — | | | | — | |
| | | | | |
Total distributions | | | (0.347 | ) | | | (0.316 | ) | | | (0.259 | ) | | | (0.298 | ) | | | (0.336 | ) |
| | | | | |
Net asset value, end of year | | | $ 9.99 | | | | $ 9.38 | | | | $ 9.90 | | | | $ 9.98 | | | | $ 9.91 | |
| | | | | |
Total return | | | 10.35% | | | | (2.10 | )% | | | 1.75% | | | | 3.94% | | | | 0.44% | |
| | | | | |
Ratios to average net assets | | | | | | | | | | | | | | | | | | | | |
| | | | | |
Expenses before waiver and payments by affiliates | | | 0.53% | | | | 0.54% | | | | 0.50% | | | | 0.51% | | | | 0.50% | |
| | | | | |
Expenses net of waiver and payments by affiliatesc | | | 0.49% | | | | 0.49% | | | | 0.48% | | | | 0.46% | | | | 0.46% | |
| | | | | |
Net investment income | | | 3.49% | | | | 3.30% | | | | 2.97% | | | | 2.71% | | | | 2.49% | |
| | | | | |
Supplemental data | | | | | | | | | | | | | | | | | | | | |
| | | | | |
Net assets, end of year (000’s) | | | $481,399 | | | | $430,637 | | | | $398,732 | | | | $93,892 | | | | $68,848 | |
| | | | | |
Portfolio turnover rate | | | 169.95% | d | | | 151.77% | | | | 101.07% | | | | 287.38% | | | | 294.80% | |
| | | | | |
Portfolio turnover rate excluding mortgage dollar rollse | | | 98.83% | d | | | 84.86% | | | | 78.46% | | | | 146.15% | | | | 95.06% | |
aThe amount shown for a share outstanding throughout the period may not correlate with the Consolidated Statement of Operations for the period due to the timing of sales and repurchases of the Fund’s shares in relation to income earned and/or fluctuating fair value of the investments of the Fund.
bBased on average daily shares outstanding.
cBenefit of expense reduction rounds to less than 0.01%.
dExcludes the value of portfolio activity as a result of in-kind transactions. See Note 6.
eSee Note 1(i) regarding mortgage dollar rolls.
| | | | |
| | | |
| franklintempleton.com | | The accompanying notes are an integral part of these financial statements. | Annual Report | | 95 |
FRANKLIN INVESTORS SECURITIES TRUST
CONSOLIDATED STATEMENT OF INVESTMENTS
Franklin Total Return Fund(continued)
| | | | | | | | | | | | | | | | | | | | |
| | | | | | Year Ended October 31, | |
| | | 2019 | | | 2018 | | | 2017 | | | 2016 | | | 2015 | |
| | | | | |
Advisor Class | | | | | | | | | | | | | | | | | | | | |
| | | | | |
Per share operating performance (for a share outstanding throughout the year) | | | | | | | | | | | | | | | | | | | | |
Net asset value, beginning of year | | $ | 9.37 | | | $ | 9.89 | | | $ | 9.98 | | | $ | 9.91 | | | $ | 10.20 | |
| | | | | |
Income from investment operationsa: | | | | | | | | | | | | | | | | | | | | |
Net investment income | | | 0.328 | b | | | 0.291 | | | | 0.275 | b | | | 0.218 | | | | 0.127 | |
Net realized and unrealized gains (losses) | | | 0.618 | | | | (0.507 | ) | | | (0.116 | ) | | | 0.142 | | | | (0.092 | ) |
| | | | | |
Total from investment operations | | | 0.946 | | | | (0.216 | ) | | | 0.159 | | | | 0.360 | | | | 0.035 | |
| | | | | |
Less distributions from: | | | | | | | | | | | | | | | | | | | | |
Net investment income and net foreign currency gains | | | (0.336 | ) | | | (0.297 | ) | | | (0.249 | ) | | | (0.290 | ) | | | (0.325 | ) |
Tax return of capital | | | — | | | | (0.007 | ) | | | — | | | | — | | | | — | |
| | | | | |
Total distributions | | | (0.336 | ) | | | (0.304 | ) | | | (0.249 | ) | | | (0.290 | ) | | | (0.325 | ) |
| | | | | |
Net asset value, end of year | | $ | 9.98 | | | $ | 9.37 | | | $ | 9.89 | | | $ | 9.98 | | | $ | 9.91 | |
| | | | | |
Total return | | | 10.23% | | | | (2.22)% | | | | 1.65% | | | | 3.75% | | | | 0.33% | |
| | | | | |
Ratios to average net assets | | | | | | | | | | | | | | | | | | | | |
Expenses before waiver and payments by affiliates | | | 0.65% | | | | 0.66% | | | | 0.66% | | | | 0.65% | | | | 0.66% | |
Expenses net of waiver and payments by affiliatesc | | | 0.61% | | | | 0.63% | | | | 0.62% | | | | 0.60% | | | | 0.62% | |
Net investment income | | | 3.37% | | | | 3.16% | | | | 2.83% | | | | 2.57% | | | | 2.33% | |
| | | | | |
Supplemental data | | | | | | | | | | | | | | | | | | | | |
Net assets, end of year (000’s) | | $ | 863,516 | | | $ | 620,803 | | | $ | 595,239 | | | $ | 740,046 | | | $ | 526,749 | |
Portfolio turnover rate | | | 169.95% | d | | | 151.77% | | | | 101.07% | | | | 287.38% | | | | 294.80% | |
Portfolio turnover rate excluding mortgage dollar rollse | | | 98.83% | d | | | 84.86% | | | | 78.46% | | | | 146.15% | | | | 95.06% | |
aThe amount shown for a share outstanding throughout the period may not correlate with the Consolidated Statement of Operations for the period due to the timing of sales and repurchases of the Fund’s shares in relation to income earned and/or fluctuating fair value of the investments of the Fund.
bBased on average daily shares outstanding.
cBenefit of expense reduction rounds to less than 0.01%.
dExcludes the value of portfolio activity as a result of in-kind transactions. See Note 6.
eSee Note 1(i) regarding mortgage dollar rolls.
| | | | |
| | | |
96 | | Annual Report | The accompanying notes are an integral part of these financial statements. | | franklintempleton.com |
FRANKLIN INVESTORS SECURITIES TRUST
Consolidated Statement of Investments, October 31, 2019
Franklin Total Return Fund
| | | | | | | | | | | | | | | | |
| | | Country | | | Shares/
Warrants | | | | | | Value | |
| | | | |
Common Stocks and Other Equity Interests 0.0%† | | | | | | | | | | | | | | | | |
Commercial & Professional Services 0.0%† | | | | | | | | | | | | | | | | |
a,bRemington Outdoor Co. Inc. | | | United States | | | | 52,019 | | | | | | | $ | 52,019 | |
| | | | | | | | | | | | | | | | |
| | | | |
Consumer Services 0.0%† | | | | | | | | | | | | | | | | |
a,b,cTurtle Bay Resort | | | United States | | | | 1,550,567 | | | | | | | | 34,113 | |
| | | | | | | | | | | | | | | | |
| | | | |
Energy 0.0%† | | | | | | | | | | | | | | | | |
a,bHalcon Resources Corp. | | | United States | | | | 531 | | | | | | | | 10,552 | |
a,bHalcon Resources Corp., wts., 9/09/20 | | | United States | | | | 20,425 | | | | | | | | — | |
a,bHalcon Resources Corp., wts., A, 10/08/20 | | | United States | | | | 2,551 | | | | | | | | — | |
a,bHalcon Resources Corp., wts., B, 10/08/22 | | | United States | | | | 3,189 | | | | | | | | — | |
a,bHalcon Resources Corp., wts., C, 10/08/22 | | | United States | | | | 4,100 | | | | | | | | — | |
aRiviera Resources Inc. | | | United States | | | | 12,605 | | | | | | | | 164,369 | |
aRoan Resources Inc. | | | United States | | | | 13,179 | | | | | | | | 19,767 | |
| | | | | | | | | | | | | | | | |
| | | | | | | | | | | | | | | 194,688 | |
| | | | | | | | | | | | | | | | |
| | | | |
Materials 0.0%† | | | | | | | | | | | | | | | | |
a,b,dAppvion Operations Inc. | | | United States | | | | 13,033 | | | | | | | | 173,760 | |
aVerso Corp., A | | | United States | | | | 6,954 | | | | | | | | 101,806 | |
aVerso Corp., wts., 7/25/23 | | | United States | | | | 732 | | | | | | | | 1,281 | |
| | | | | | | | | | | | | | | | |
| | | | | | | | | | | | | | | 276,847 | |
| | | | | | | | | | | | | | | | |
| | | | |
Retailing 0.0%† | | | | | | | | | | | | | | | | |
a,b,dK2016470219 South Africa Ltd., A | | | South Africa | | | | 28,762,824 | | | | | | | | 19,029 | |
a,b,dK2016470219 South Africa Ltd., B | | | South Africa | | | | 2,862,311 | | | | | | | | 1,894 | |
| | | | | | | | | | | | | | | | |
| | | | | | | | | | | | | | | 20,923 | |
| | | | | | | | | | | | | | | | |
Total Common Stocks and Other Equity Interests
(Cost $7,358,889) | | | | | | | | | | | | | | | 578,590 | |
| | | | | | | | | | | | | | | | |
| | | | |
Management Investment Companies 8.1% | | | | | | | | | | | | | | | | |
Diversified Financials 8.1% | | | | | | | | | | | | | | | | |
eFranklin Floating Rate Income Fund | | | United States | | | | 1,549,310 | | | | | | | | 12,812,795 | |
eFranklin Liberty Investment Grade Corporate ETF | | | United States | | | | 14,415,000 | | | | | | | | 369,960,975 | |
eFranklin Liberty Senior Loan ETF | | | United States | | | | 914,900 | | | | | | | | 22,730,691 | |
| | | | | | | | | | | | | | | | |
| | | | |
Total Management Investment Companies
(Cost $397,290,975) | | | | | | | | | | | | | | | 405,504,461 | |
| | | | | | | | | | | | | | | | |
| | | | |
Preferred Stocks (Cost $2,325,000) 0.1% | | | | | | | | | | | | | | | | |
Diversified Financials 0.1% | | | | | | | | | | | | | | | | |
fCitigroup Capital XIII, 8.265%, pfd., 10/30/40 | | | United States | | | | 93,000 | | | | | | | | 2,537,970 | |
| | | | | | | | | | | | | | | | |
| | | | |
| | | | | |
| Principal
Amount |
* | | | | | | | | |
Corporate Bonds 15.2% | | | | | | | | | | | | | | | | |
Automobiles & Components 0.1% | | | | | | | | | | | | | | | | |
gAdient U.S. LLC, senior secured note, 144A, 7.00%, 5/15/26 | | | United States | | | | 1,000,000 | | | | | | | | 1,056,250 | |
gAllison Transmission Inc., senior bond, 144A, 5.875%, 6/01/29 | | | United States | | | | 800,000 | | | | | | | | 864,000 | |
Aptiv Corp., senior bond, 4.15%, 3/15/24 | | | United States | | | | 5,100,000 | | | | | | | | 5,430,241 | |
| | | | | | | | | | | | | | | | |
| | | | | | | | | | | | | | | 7,350,491 | |
| | | | | | | | | | | | | | | | |
| | | | |
| | | |
| franklintempleton.com | | Annual Report | | 97 |
FRANKLIN INVESTORS SECURITIES TRUST
CONSOLIDATED STATEMENT OF INVESTMENTS
Franklin Total Return Fund(continued)
| | | | | | | | | | | | | | | | |
| | | | Country | | |
| Principal
Amount |
* | | | | | | | Value | |
| | | | |
Corporate Bonds(continued) | | | | | | | | | | | | | | | | |
Banks 2.3% | | | | | | | | | | | | | | | | |
gAkbank T.A.S., senior note, 144A, 5.125%, 3/31/25 | | | Turkey | | | | 5,000,000 | | | | | | | $ | 4,785,200 | |
hBanca Monte dei Paschi di Siena SpA, secured note, Reg S, 2.125%, 11/26/63 | | | Italy | | | | 20,000,000 | | | | EUR | | | | 24,184,166 | |
Bank of America Corp., senior note, 3.50%, 4/19/26 | | | United States | | | | 20,400,000 | | | | | | | | 21,722,724 | |
gIntesa Sanpaolo SpA, senior note, 144A, 6.50%, 2/24/21 | | | Italy | | | | 1,000,000 | | | | | | | | 1,049,595 | |
Realkredit Danmark A/S, | | | | | | | | | | | | | | | | |
secured bond, 1.00%, 4/01/27 | | | Denmark | | | | 77,800,000 | | | | DKK | | | | 12,513,537 | |
senior bond, 10F, 1.00%, 4/01/29 | | | Denmark | | | | 57,080,000 | | | | DKK | | | | 9,214,667 | |
Royal Bank of Canada, secured note, 2.10%, 10/14/21 | | | Canada | | | | 11,500,000 | | | | | | | | 11,531,196 | |
SVB Financial Group, senior note, 3.50%, 1/29/25 | | | United States | | | | 6,000,000 | | | | | | | | 6,257,395 | |
Wells Fargo & Co., sub. bond, 4.65%, 11/04/44 | | | United States | | | | 10,000,000 | | | | | | | | 11,716,244 | |
gWestpac Banking Corp., senior secured note, 144A, 2.25%, 11/09/21 | | | Australia | | | | 10,800,000 | | | | | | | | 10,832,886 | |
| | | | | | | | | | | | | | | | |
| | | | | | | | | | | | | | | 113,807,610 | |
| | | | | | | | | | | | | | | | |
| | | | |
Capital Goods 0.8% | | | | | | | | | | | | | | | | |
gAhern Rentals Inc., secured note, second lien, 144A, 7.375%, 5/15/23 | | | United States | | | | 400,000 | | | | | | | | 326,000 | |
Aircastle Ltd., senior note, 4.25%, 6/15/26 | | | United States | | | | 2,800,000 | | | | | | | | 2,916,945 | |
gAmcor Finance USA Inc., senior note, 144A, 3.625%, 4/28/26 | | | Australia | | | | 11,800,000 | | | | | | | | 12,285,647 | |
gBeacon Roofing Supply Inc., senior note, 144A, 4.875%, 11/01/25 | | | United States | | | | 4,100,000 | | | | | | | | 4,043,830 | |
CNH Industrial Capital LLC, senior note, 3.875%, 10/15/21 | | | United States | | | | 3,400,000 | | | | | | | | 3,502,000 | |
CNH Industrial NV, senior bond, 3.85%, 11/15/27 | | | United Kingdom | | | | 4,600,000 | | | | | | | | 4,801,365 | |
gHarsco Corp., senior note, 144A, 5.75%, 7/31/27 | | | United States | | | | 5,000,000 | | | | | | | | 5,206,350 | |
gJeld-Wen Inc., senior note, 144A, 4.625%, 12/15/25 | | | United States | | | | 1,000,000 | | | | | | | | 995,000 | |
gThe Manitowoc Co. Inc., secured note, second lien, 144A, 9.00%, 4/01/26 | | | United States | | | | 400,000 | | | | | | | | 385,500 | |
gNCI Building Systems Inc., senior secured note, 144A, 8.00%, 4/15/26 | | | United States | | | | 400,000 | | | | | | | | 394,852 | |
iOnsite Rental Group Operations Pty. Ltd., secured note, PIK, 6.10%, 10/26/23 | | | Australia | | | | 183,113 | | | | | | | | 169,379 | |
gVertiv Group Corp., senior note, 144A, 9.25%, 10/15/24 | | | United States | | | | 6,400,000 | | | | | | | | 6,052,000 | |
| | | | | | | | | | | | | | | | |
| | | | | | | | | | | | | | | 41,078,868 | |
| | | | | | | | | | | | | | | | |
| | | | |
Commercial & Professional Services 0.2% | | | | | | | | | | | | | | | | |
United Rentals North America Inc., senior bond, 5.875%, 9/15/26 | | | United States | | | | 5,000,000 | | | | | | | | 5,325,000 | |
gWest Corp., senior note, 144A, 8.50%, 10/15/25 | | | United States | | | | 5,000,000 | | | | | | | | 3,800,000 | |
| | | | | | | | | | | | | | | | |
| | | | | | | | | | | | | | | 9,125,000 | |
| | | | | | | | | | | | | | | | |
| | | | |
Consumer Durables & Apparel 0.1% | | | | | | | | | | | | | | | | |
gAshton Woods USA LLC/Ashton Woods Finance Co., senior note, 144A, 6.75%, 8/01/25 | | | United States | | | | 600,000 | | | | | | | | 604,083 | |
gHanesbrands Inc., senior bond, 144A, 4.875%, 5/15/26 | | | United States | | | | 1,900,000 | | | | | | | | 2,018,750 | |
| | | | | | | | | | | | | | | | |
| | | | | | | | | | | | | | | 2,622,833 | |
| | | | | | | | | | | | | | | | |
| | | | |
Consumer Services 0.1% | | | | | | | | | | | | | | | | |
gWynn Las Vegas LLC/Wynn Las Vegas Capital Corp., senior bond, 144A, 5.25%, 5/15/27 | | | United States | | | | 6,000,000 | | | | | | | | 6,262,500 | |
| | | | | | | | | | | | | | | | |
| | | | |
Diversified Financials 1.8% | | | | | | | | | | | | | | | | |
gBayer US Finance LLC, senior note, 144A, 3.00%, 10/08/21 | | | Germany | | | | 3,600,000 | | | | | | | | 3,651,733 | |
Capital One Bank USA NA, sub. bond, 3.375%, 2/15/23 | | | United States | | | | 6,000,000 | | | | | | | | 6,186,366 | |
Capital One Financial Corp., senior note, 3.20%, 2/05/25 | | | United States | | | | 9,700,000 | | | | | | | | 10,051,305 | |
| | | | |
| | | |
98 | | Annual Report | | franklintempleton.com |
FRANKLIN INVESTORS SECURITIES TRUST
CONSOLIDATED STATEMENT OF INVESTMENTS
Franklin Total Return Fund(continued)
| | | | | | | | | | | | | | | | |
| | | | Country | | |
| Principal
Amount |
* | | | | | | | Value | |
| | | | |
Corporate Bonds(continued) | | | | | | | | | | | | | | | | |
Diversified Financials(continued) | | | | | | | | | | | | | | | | |
gFirstCash Inc., senior note, 144A, 5.375%, 6/01/24 | | | United States | | | | 4,000,000 | | | | | | | $ | 4,160,000 | |
GE Capital International Funding Co., senior bond, 3.373%, 11/15/25 | | | United States | | | | 17,000,000 | | | | | | | | 17,526,580 | |
The Goldman Sachs Group Inc., | | | | | | | | | | | | | | | | |
senior note, 3.75%, 5/22/25 | | | United States | | | | 7,700,000 | | | | | | | | 8,174,198 | |
senior note, 3.75%, 2/25/26 | | | United States | | | | 21,300,000 | | | | | | | | 22,677,088 | |
Jyske Realkredit A/S, secured note, 1.00%, 4/01/26 | | | Denmark | | | | 68,400,000 | | | | DKK | | | | 10,959,449 | |
Navient Corp., senior bond, 8.00%, 3/25/20 | | | United States | | | | 5,000,000 | | | | | | | | 5,118,750 | |
Springleaf Finance Corp., senior note, 6.625%, 1/15/28 | | | United States | | | | 4,000,000 | | | | | | | | 4,440,000 | |
| | | | | | | | | | | | | | | | |
| | | | | | | | | | | | | | | 92,945,469 | |
| | | | | | | | | | | | | | | | |
Energy 1.3% | | | | | | | | | | | | | | | | |
gAker BP ASA, senior note, 144A, 4.75%, 6/15/24 | | | Norway | | | | 3,400,000 | | | | | | | | 3,536,000 | |
Baker Hughes a GE Co. LLC/Baker Hughes Co-obligator Inc., senior bond, 4.08%, 12/15/47 | | | United States | | | | 1,200,000 | | | | | | | | 1,189,042 | |
gCalifornia Resources Corp., secured note, second lien, 144A, 8.00%, 12/15/22 | | | United States | | | | 3,400,000 | | | | | | | | 1,003,000 | |
Cheniere Corpus Christi Holdings LLC, senior secured note, first lien, 5.875%, 3/31/25 | | | United States | | | | 1,600,000 | | | | | | | | 1,778,144 | |
Cheniere Energy Partners LP, senior secured note, first lien, 5.25%, 10/01/25 | | | United States | | | | 4,000,000 | | | | | | | | 4,155,000 | |
Enable Midstream Partners LP, | | | | | | | | | | | | | | | | |
senior bond, 5.00%, 5/15/44 | | | United States | | | | 1,200,000 | | | | | | | | 1,058,862 | |
senior note, 3.90%, 5/15/24 | | | United States | | | | 3,600,000 | | | | | | | | 3,672,720 | |
Energy Transfer Operating LP, senior bond, 5.15%, 2/01/43 | | | United States | | | | 6,000,000 | | | | | | | | 6,141,956 | |
EnLink Midstream LLC, senior bond, 5.375%, 6/01/29 | | | United States | | | | 400,000 | | | | | | | | 356,000 | |
g,jGaz Capital SA, (OJSC Gazprom), loan participation, senior note, 144A, 3.85%, 2/06/20 | | | Russia | | | | 10,000,000 | | | | | | | | 10,042,050 | |
gHarvest Operations Corp., senior note, 144A, 4.20%, 6/01/23 | | | South Korea | | | | 3,800,000 | | | | | | | | 4,061,919 | |
Martin Midstream Partners LP/Martin Midstream Finance Corp., senior note, 7.25%, 2/15/21 | | | United States | | | | 800,000 | | | | | | | | 722,800 | |
MPLX LP, | | | | | | | | | | | | | | | | |
senior bond, 4.00%, 2/15/25 | | | United States | | | | 4,600,000 | | | | | | | | 4,820,408 | |
senior bond, 4.70%, 4/15/48 | | | United States | | | | 2,000,000 | | | | | | | | 2,023,663 | |
Murphy Oil USA Inc., senior bond, 4.75%, 9/15/29 | | | United States | | | | 3,700,000 | | | | | | | | 3,871,125 | |
Oceaneering International Inc., senior note, 4.65%, 11/15/24 | | | United States | | | | 1,200,000 | | | | | | | | 1,122,000 | |
kSanchez Energy Corp., senior note, 6.125%, 1/15/23 | | | United States | | | | 3,000,000 | | | | | | | | 150,000 | |
Sunoco Logistics Partners Operations LP, senior note, 4.25%, 4/01/24 | | | United States | | | | 6,100,000 | | | | | | | | 6,453,595 | |
gTullow Oil PLC, senior note, 144A, 7.00%, 3/01/25 | | | Ghana | | | | 600,000 | | | | | | | | 618,447 | |
Valaris PLC, senior bond, 5.75%, 10/01/44 | | | United States | | | | 3,700,000 | | | | | | | | 1,517,000 | |
kWeatherford International Ltd., | | | | | | | | | | | | | | | | |
senior note, 7.75%, 6/15/21 | | | United States | | | | 1,600,000 | | | | | | | | 512,000 | |
senior note, 8.25%, 6/15/23 | | | United States | | | | 2,000,000 | | | | | | | | 620,000 | |
gWoodside Finance Ltd., senior note, 144A, 3.70%, 9/15/26 | | | Australia | | | | 4,000,000 | | | | | | | | 4,165,110 | |
| | | | | | | | | | | | | | | | |
| | | | | | | | | | | | | | | 63,590,841 | |
| | | | | | | | | | | | | | | | |
| | | | |
| | | |
| franklintempleton.com | | Annual Report | | 99 |
FRANKLIN INVESTORS SECURITIES TRUST
CONSOLIDATED STATEMENT OF INVESTMENTS
Franklin Total Return Fund(continued)
| | | | | | | | | | | | | | | | |
| | | | Country | | |
| Principal
Amount |
* | | | | | | | Value | |
| | | | |
Corporate Bonds(continued) | | | | | | | | | | | | | | | | |
Food & Staples Retailing 0.3% | | | | | | | | | | | | | | | | |
The Kroger Co., senior note, 4.00%, 2/01/24 | | | United States | | | | 15,400,000 | | | | | | | $ | 16,475,038 | |
gPerformance Food Group Inc., senior note, 144A, 5.50%, 10/15/27 | | | United States | | | | 1,000,000 | | | | | | | | 1,062,500 | |
| | | | | | | | | | | | | | | | |
| | | | | | | | | | | | | | | 17,537,538 | |
| | | | | | | | | | | | | | | | |
| | | | |
Food, Beverage & Tobacco 0.6% | | | | | | | | | | | | | | | | |
Bunge Ltd. Finance Corp., senior note, 3.25%, 8/15/26 | | | United States | | | | 12,000,000 | | | | | | | | 12,034,138 | |
gJBS USA LUX SA/JBS USA Food Co./JBS USA Finance Inc., senior bond, 144A, 5.50%, 1/15/30 | | | United States | | | | 1,200,000 | | | | | | | | 1,296,000 | |
Kraft Heinz Foods Co., senior bond, 3.00%, 6/01/26 | | | United States | | | | 5,100,000 | | | | | | | | 5,086,803 | |
Reynolds American Inc., | | | | | | | | | | | | | | | | |
senior bond, 5.70%, 8/15/35 | | | United Kingdom | | | | 9,300,000 | | | | | | | | 10,517,787 | |
senior bond, 5.85%, 8/15/45 | | | United Kingdom | | | | 300,000 | | | | | | | | 333,822 | |
| | | | | | | | | | | | | | | | |
| | | | | | | | | | | | | | | 29,268,550 | |
| | | | | | | | | | | | | | | | |
| | | | |
Health Care Equipment & Services 0.4% | | | | | | | | | | | | | | | | |
CHS/Community Health Systems Inc., senior secured note, first lien, 6.25%, 3/31/23 | | | United States | | | | 4,000,000 | | | | | | | | 3,912,500 | |
Cigna Corp., senior note, 4.125%, 11/15/25 | | | United States | | | | 5,900,000 | | | | | | | | 6,399,344 | |
CVS Health Corp., senior bond, 4.30%, 3/25/28 | | | United States | | | | 1,800,000 | | | | | | | | 1,955,558 | |
Edwards Lifesciences Corp., senior note, 4.30%, 6/15/28 | | | United States | | | | 1,700,000 | | | | | | | | 1,920,164 | |
gMEDNAX Inc., senior note, 144A, 6.25%, 1/15/27 | | | United States | | | | 5,200,000 | | | | | | | | 5,157,880 | |
| | | | | | | | | | | | | | | | |
| | | | | | | | | | | | | | | 19,345,446 | |
| | | | | | | | | | | | | | | | |
| | | | |
Household & Personal Products 0.2% | | | | | | | | | | | | | | | | |
Avon Products Inc., senior bond, 7.00%, 3/15/23 | | | United Kingdom | | | | 8,800,000 | | | | | | | | 9,284,000 | |
| | | | | | | | | | | | | | | | |
| | | | |
Insurance 1.0% | | | | | | | | | | | | | | | | |
Aflac Inc., senior note, 0.932%, 1/25/27 | | | United States | | | | 1,400,000,000 | | | | JPY | | | | 13,237,931 | |
gLiberty Mutual Group Inc., senior bond, 144A, 4.569%, 2/01/29 | | | United States | | | | 12,000,000 | | | | | | | | 13,571,894 | |
gTeachers Insurance & Annuity Assn. of America, sub. bond, 144A, 4.90%, 9/15/44 | | | United States | | | | 20,400,000 | | | | | | | | 25,656,232 | |
| | | | | | | | | | | | | | | | |
| | | | | | | | | | | | | | | 52,466,057 | |
| | | | | | | | | | | | | | | | |
| | | | |
Materials 0.5% | | | | | | | | | | | | | | | | |
The Chemours Co., senior note, 5.375%, 5/15/27 | | | United States | | | | 700,000 | | | | | | | | 625,513 | |
gMauser Packaging Solutions Holding Co., senior note, 144A, 7.25%, 4/15/25 | | | United States | | | | 4,000,000 | | | | | | | | 3,840,000 | |
gNew Gold Inc., senior note, 144A, 6.375%, 5/15/25 | | | Canada | | | | 1,800,000 | | | | | | | | 1,719,000 | |
gNovelis Corp., senior bond, 144A, 5.875%, 9/30/26 | | | United States | | | | 5,000,000 | | | | | | | | 5,263,000 | |
gOI European Group BV, senior note, 144A, 4.00%, 3/15/23 | | | United States | | | | 2,500,000 | | | | | | | | 2,509,375 | |
gPlastipak Holdings Inc., senior note, 144A, 6.25%, 10/15/25 | | | United States | | | | 2,300,000 | | | | | | | | 1,909,000 | |
Reliance Steel & Aluminum Co., senior note, 4.50%, 4/15/23 | | | United States | | | | 5,600,000 | | | | | | | | 5,944,894 | |
gSunCoke Energy Partners LP/SunCoke Energy Partners Finance Corp., senior note, 144A, 7.50%, 6/15/25 | | | United States | | | | 4,500,000 | | | | | | | | 3,847,500 | |
| | | | | | | | | | | | | | | | |
| | | | | | | | | | | | | | | 25,658,282 | |
| | | | | | | | | | | | | | | | |
| | | | |
Media & Entertainment 0.6% | | | | | | | | | | | | | | | | |
gAltice Luxembourg SA, first lien, 144A, 10.50%, 5/15/27 | | | Luxembourg | | | | 600,000 | | | | | | | | 680,250 | |
AMC Entertainment Holdings Inc., senior sub. bond, 5.75%, 6/15/25 | | | United States | | | | 800,000 | | | | | | | | 763,080 | |
gCCO Holdings LLC/CCO Holdings Capital Corp., senior bond, 144A, 5.00%, 2/01/28 | | | United States | | | | 1,500,000 | | | | | | | | 1,573,125 | |
| | | | |
| | | |
100 | | Annual Report | | franklintempleton.com |
FRANKLIN INVESTORS SECURITIES TRUST
CONSOLIDATED STATEMENT OF INVESTMENTS
Franklin Total Return Fund(continued)
| | | | | | | | | | | | | | | | |
| | | | Country | | |
| Principal
Amount |
* | | | | | | | Value | |
| | | | |
Corporate Bonds(continued) | | | | | | | | | | | | | | | | |
Media & Entertainment(continued) | | | | | | | | | | | | | | | | |
gCSC Holdings LLC, | | | | | | | | | | | | | | | | |
senior bond, 144A, 5.375%, 2/01/28 | | | United States | | | | 3,000,000 | | | | | | | $ | 3,180,000 | |
senior secured note, first lien, 144A, 5.50%, 5/15/26 | | | United States | | | | 4,000,000 | | | | | | | | 4,225,000 | |
gDiamond Sports Group LLC/Diamond Sports Finance Co., first lien, 144A, 5.375%, 8/15/26 | | | United States | | | | 6,200,000 | | | | | | | | 6,486,750 | |
DISH DBS Corp., senior bond, 5.00%, 3/15/23 | | | United States | | | | 2,600,000 | | | | | | | | 2,629,250 | |
gLive Nation Entertainment Inc., senior note, 144A, 4.75%, 10/15/27 | | | United States | | | | 3,000,000 | | | | | | | | 3,135,300 | |
Netflix Inc., senior bond, 4.875%, 4/15/28 | | | United States | | | | 1,800,000 | | | | | | | | 1,864,422 | |
gNexstar Broadcasting Inc. senior note, 144A, 5.625%, 7/15/27 | | | United States | | | | 4,900,000 | | | | | | | | 5,180,280 | |
gUnivision Communications Inc., senior secured note, first lien, 144A, 5.125%, 2/15/25 | | | United States | | | | 1,000,000 | | | | | | | | 980,000 | |
| | | | | | | | | | | | | | | | |
| | | | |
| | | | | | | | | | | | | | | 30,697,457 | |
| | | | | | | | | | | | | | | | |
Pharmaceuticals, Biotechnology & Life Sciences 0.6% | | | | | | | | | | | | | | | | |
gBausch Health Cos. Inc., senior bond, 144A, 6.125%, 4/15/25 | | | United States | | | | 4,800,000 | | | | | | | | 4,995,000 | |
gBayer U.S. Finance II LLC, senior bond, 144A, 4.375%, 12/15/28 | | | Germany | | | | 3,900,000 | | | | | | | | 4,234,002 | |
Biogen Inc., senior bond, 5.20%, 9/15/45 | | | United States | | | | 18,200,000 | | | | | | | | 22,333,181 | |
gHorizon Pharma USA Inc., senior note, 144A, 5.50%, 8/01/27 | | | United States | | | | 800,000 | | | | | | | | 836,000 | |
| | | | | | | | | | | | | | | | |
| | | | |
| | | | | | | | | | | | | | | 32,398,183 | |
| | | | | | | | | | | | | | | | |
Real Estate 0.2% | | | | | | | | | | | | | | | | |
gFive Point Operating Co. LP/Five Point Capital Corp., senior note, 144A, 7.875%, 11/15/25 | | | United States | | | | 600,000 | | | | | | | | 568,602 | |
National Retail Properties Inc., senior bond, 4.30%, 10/15/28 | | | United States | | | | 9,700,000 | | | | | | | | 10,850,319 | |
| | | | | | | | | | | | | | | | |
| | | | |
| | | | | | | | | | | | | | | 11,418,921 | |
| | | | | | | | | | | | | | | | |
Retailing 0.4% | | | | | | | | | | | | | | | | |
Dollar Tree Inc., senior note, 4.00%, 5/15/25 | | | United States | | | | 13,100,000 | | | | | | | | 14,099,360 | |
b,g,iK2016470219 South Africa Ltd., senior secured note, 144A, PIK, 3.00%, 12/31/22 | | | South Africa | | | | 2,279,634 | | | | | | | | 2,821 | |
b,g,iK2016470260 South Africa Ltd., senior secured note, 144A, PIK, 25.00%, 12/31/22 | | | South Africa | | | | 541,623 | | | | | | | | 2,500 | |
gParty City Holdings Inc., senior note, 144A, 6.625%, 8/01/26 | | | United States | | | | 5,100,000 | | | | | | | | 4,947,000 | |
| | | | | | | | | | | | | | | | |
| | | | |
| | | | | | | | | | | | | | | 19,051,681 | |
| | | | | | | | | | | | | | | | |
Semiconductors & Semiconductor Equipment 0.5% | | | | | | | | | | | | | | | | |
gAmkor Technology Inc., senior note, 144A, 6.625%, 9/15/27 | | | United States | | | | 1,000,000 | | | | | | | | 1,100,000 | |
Maxim Integrated Products Inc., senior note, 3.375%, 3/15/23 | | | United States | | | | 22,000,000 | | | | | | | | 22,649,824 | |
| | | | | | | | | | | | | | | | |
| | | | |
| | | | | | | | | | | | | | | 23,749,824 | |
| | | | | | | | | | | | | | | | |
Software & Services 0.2% | | | | | | | | | | | | | | | | |
Fiserv Inc., senior bond, 3.85%, 6/01/25 | | | United States | | | | 9,300,000 | | | | | | | | 10,023,357 | |
| | | | | | | | | | | | | | | | |
Technology Hardware & Equipment 0.2% | | | | | | | | | | | | | | | | |
gCommScope Technologies LLC, senior bond, 144A, 5.00%, 3/15/27 | | | United States | | | | 5,000,000 | | | | | | | | 4,112,500 | |
gTempo Acquisition LLC/Tempo Acquisition Finance Corp., senior note, 144A, 6.75%, 6/01/25 | | | United States | | | | 4,000,000 | | | | | | | | 4,135,000 | |
| | | | | | | | | | | | | | | | |
| | | | |
| | | | | | | | | | | | | | | 8,247,500 | |
| | | | | | | | | | | | | | | | |
Telecommunication Services 0.2% | | | | | | | | | | | | | | | | |
Telefonica Emisiones SA, senior note, 4.103%, 3/08/27 | | | Spain | | | | 7,600,000 | | | | | | | | 8,269,294 | |
| | | | | | | | | | | | | | | | |
| | | | |
| | | |
| franklintempleton.com | | Annual Report | | 101 |
FRANKLIN INVESTORS SECURITIES TRUST
CONSOLIDATED STATEMENT OF INVESTMENTS
Franklin Total Return Fund(continued)
| | | | | | | | | | | | | | | | |
| | | | Country | | |
| Principal
Amount |
* | | | | | | | Value | |
| | | | |
Corporate Bonds(continued) | | | | | | | | | | | | | | | | |
Transportation 0.7% | | | | | | | | | | | | | | | | |
Burlington Northern and Santa Fe 99-2 Trust, secured bond, 7.57%, 1/02/21 | | | United States | | | | 14,337 | | | | | | | $ | 14,664 | |
gKazakhstan Temir Zholy Finance BV, senior bond, 144A, 6.95%, 7/10/42 | | | Kazakhstan | | | | 7,400,000 | | | | | | | | 10,014,420 | |
gMexico City Airport Trust, senior secured bond, first lien, 144A, 5.50%, 7/31/47 | | | Mexico | | | | 4,500,000 | | | | | | | | 4,531,162 | |
h,jRZD Capital PLC, (Russian Railways), loan participation, senior bond, Reg S, 5.70%, 4/05/22 | | | Russia | | | | 11,600,000 | | | | | | | | 12,448,482 | |
gTransurban Finance Co. Pty. Ltd., senior secured bond, 144A, 4.125%, 2/02/26 | | | Australia | | | | 8,200,000 | | | | | | | | 8,697,822 | |
Union Pacific Railroad Co. 2005 Pass Through Trust, 2005-1, 5.082%, 1/02/29 | | | United States | | | | 115,805 | | | | | | | | 124,335 | |
| | | | | | | | | | | | | | | | |
| | | | |
| | | | | | | | | | | | | | | 35,830,885 | |
| | | | | | | | | | | | | | | | |
Utilities 1.9% | | | | | | | | | | | | | | | | |
Commonwealth Edison Co., secured bond, 6.45%, 1/15/38 | | | United States | | | | 700,000 | | | | | | | | 1,011,721 | |
Duke Energy Corp., senior bond, 3.15%, 8/15/27 | | | United States | | | | 15,400,000 | | | | | | | | 16,052,633 | |
g,lEDF SA, junior sub. note, 144A, 5.25% to 1/29/23, FRN thereafter, Perpetual | | | France | | | | 24,000,000 | | | | | | | | 24,877,440 | |
Georgia Power Co., senior bond, 4.30%, 3/15/42 | | | United States | | | | 9,000,000 | | | | | | | | 9,893,890 | |
gInterGen NV, secured bond, 144A, 7.00%, 6/30/23 | | | Netherlands | | | | 400,000 | | | | | | | | 382,200 | |
gIsrael Electric Corp. Ltd., secured bond, 144A, 4.25%, 8/14/28 | | | Israel | | | | 6,700,000 | | | | | | | | 7,309,599 | |
The Southern Co., senior bond, 3.25%, 7/01/26 | | | United States | | | | 7,950,000 | | | | | | | | 8,300,520 | |
gState Grid Overseas Investment 2016 Ltd., | | | | | | | | | | | | | | | | |
senior note, 144A, 3.50%, 5/04/27 | | | China | | | | 10,700,000 | | | | | | | | 11,318,139 | |
senior note, 144A, 4.25%, 5/02/28 | | | China | | | | 6,700,000 | | | | | | | | 7,504,335 | |
gTalen Energy Supply LLC, | | | | | | | | | | | | | | | | |
senior note, 144A, 10.50%, 1/15/26 | | | United States | | | | 1,500,000 | | | | | | | | 1,293,750 | |
senior secured note, 144A, 7.25%, 5/15/27 | | | United States | | | | 5,500,000 | | | | | | | | 5,513,750 | |
Virginia Electric & Power Co., senior bond, 6.35%, 11/30/37 | | | United States | | | | 520,000 | | | | | | | | 734,027 | |
| | | | | | | | | | | | | | | | |
| | | | |
| | | | | | | | | | | | | | | 94,192,004 | |
| | | | | | | | | | | | | | | | |
| | | | |
Total Corporate Bonds (Cost $744,162,840) | | | | | | | | | | | | | | | 764,222,591 | |
| | | | | | | | | | | | | | | | |
| | | | |
m,nSenior Floating Rate Interests 2.8% | | | | | | | | | | | | | | | | |
Automobiles & Components 0.1% | | | | | | | | | | | | | | | | |
Adient US LLC, | | | | | | | | | | | | | | | | |
Initial Term Loans, 6.459%, (3-month USD LIBOR + 4.25%), 5/06/24 | | | United States | | | | 775,000 | | | | | | | | 758,531 | |
Initial Term Loans, 6.889%, (6-month USD LIBOR + 4.25%), 5/06/24 | | | United States | | | | 2,317,250 | | | | | | | | 2,268,008 | |
Allison Transmission Inc., Term Loan, 3.796%, (1-month USD LIBOR + 1.75%), 3/29/26 | | | United States | | | | 3,786,688 | | | | | | | | 3,811,128 | |
| | | | | | | | | | | | | | | | |
| | | | |
| | | | | | | | | | | | | | | 6,837,667 | |
| | | | | | | | | | | | | | | | |
| | | | |
| | | |
102 | | Annual Report | | franklintempleton.com |
FRANKLIN INVESTORS SECURITIES TRUST
CONSOLIDATED STATEMENT OF INVESTMENTS
Franklin Total Return Fund(continued)
| | | | | | | | | | | | | | | | |
| | | | Country | | |
| Principal
Amount |
* | | | | | | | Value | |
| | | | |
m,nSenior Floating Rate Interests(continued) | | | | | | | | | | | | | | | | |
Capital Goods 0.1% | | | | | | | | | | | | | | | | |
Altra Industrial Motion Corp., Term Loan, 3.786%, (3-month USD LIBOR + 2.00%), 10/01/25 | | | United States | | | | 576,845 | | | | | | | $ | 575,940 | |
Doncasters U.S. Finance LLC, Second-Lien Term Loans, 10.354%, (3-month USD LIBOR + 8.25%), 10/09/20 | | | United States | | | | 464,417 | | | | | | | | 125,393 | |
Navistar Inc., Tranche B Term Loan, 5.42%, (1-month USD LIBOR + 3.50%), 11/06/24 | | | United States | | | | 3,431,269 | | | | | | | | 3,394,771 | |
Onsite Rental Group Operations Pty. Ltd., Term Loan, 6.323%, (1-month USD LIBOR + 4.50%), 10/25/22 | | | Australia | | | | 133,931 | | | | | | | | 132,257 | |
RBS Global Inc. (Rexnord), Term B Loan, 3.786%, (1-month USD LIBOR + 2.00%), 8/21/24 | | | United States | | | | 1,250,000 | | | | | | | | 1,257,577 | |
| | | | | | | | | | | | | | | | |
| | | | |
| | | | | | | | | | | | | | | 5,485,938 | |
| | | | | | | | | | | | | | | | |
Commercial & Professional Services 0.2% | | | | | | | | | | | | | | | | |
United Rentals North America Inc., Initial Term Loans, 3.536%, (1-month USD LIBOR + 1.75%), 10/31/25 | | | United States | | | | 6,556,946 | | | | | | | | 6,592,465 | |
oVentia Pty Ltd., Term B Loans, 5.604%, (3-month USD LIBOR + 3.50%), 5/21/26 | | | Australia | | | | 1,951,631 | | | | | | | | 1,956,510 | |
| | | | | | | | | | | | | | | | |
| | | | |
| | | | | | | | | | | | | | | 8,548,975 | |
| | | | | | | | | | | | | | | | |
Consumer Services 0.4% | | | | | | | | | | | | | | | | |
24 Hour Fitness Worldwide Inc., Term Loan, 5.286%, (1-month USD LIBOR + 3.50%), 5/30/25 | | | United States | | | | 3,331,566 | | | | | | | | 2,587,527 | |
Avis Budget Car Rental LLC, Tranche B Term Loans, 3.79%, (1-month USD LIBOR + 2.00%), 2/13/25 | | | United States | | | | 4,975,323 | | | | | | | | 4,985,672 | |
Caesars Resort Collection LLC, Term B Loans, 4.536%, (1-month USD LIBOR + 2.75%), 12/22/24 | | | United States | | | | 3,331,523 | | | | | | | | 3,287,017 | |
Eldorado Resorts Inc., Initial Term Loan, 4.125% - 4.313%, (1-month USD LIBOR + 2.25%), 4/17/24 | | | United States | | | | 3,040,773 | | | | | | | | 3,040,113 | |
Hilton Worldwide Finance LLC, Refinanced Series B-2 Term Loans, 3.573%, (1-month USD LIBOR + 1.75%), 6/17/26 | | | United States | | | | 2,500,000 | | | | | | | | 2,513,125 | |
KFC Holding Co./Pizza Hut Holdings LLC/Taco Bell of America LLC (Yum Brands), Term Loan B, 3.628%, (1-month USD LIBOR + 1.75%), 4/03/25 | | | United States | | | | 2,984,848 | | | | | | | | 2,994,797 | |
NASCAR Holdings Inc., Initial Term Loans, 4.628%, (3-month USD LIBOR + 2.75%), 10/18/26 | | | United States | | | | 367,194 | | | | | | | | 369,463 | |
| | | | | | | | | | | | | | | | |
| | | | |
| | | | | | | | | | | | | | | 19,777,714 | |
| | | | | | | | | | | | | | | | |
| | | | |
Diversified Financials 0.1% | | | | | | | | | | | | | | | | |
FinCo I LLC (Fortress Investment Group), 2018 Replacement Term Loan, 3.786%, (1-month USD LIBOR + 2.00%), 12/27/22 | | | United States | | | | 4,184,412 | | | | | | | | 4,195,994 | |
| | | | | | | | | | | | | | | | |
| | | | |
Energy 0.4% | | | | | | | | | | | | | | | | |
Centurion Pipeline Co. LLC, Initial Term Loans, 5.036%, (1-month USD LIBOR + 3.25%), 9/28/25 | | | United States | | | | 1,213,885 | | | | | | | | 1,216,161 | |
Fieldwood Energy LLC, Closing Date Loans, 7.177%, (3-month USD LIBOR + 5.25%), 4/11/22 | | | United States | | | | 6,877,828 | | | | | | | | 5,564,163 | |
Strike LLC, | | | | | | | | | | | | | | | | |
Term Loan, 10.104%, (3-month USD LIBOR + 8.00%), 11/30/22 | | | United States | | | | 86,443 | | | | | | | | 86,335 | |
Term Loan, 10.064%, (6-month USD LIBOR + 8.00%), 11/30/22 | | | United States | | | | 5,878,112 | | | | | | | | 5,870,764 | |
| | | | |
| | | |
| franklintempleton.com | | Annual Report | | 103 |
FRANKLIN INVESTORS SECURITIES TRUST
CONSOLIDATED STATEMENT OF INVESTMENTS
Franklin Total Return Fund(continued)
| | | | | | | | | | | | | | | | |
| | | | Country | | |
| Principal
Amount |
* | | | | | | | Value | |
| | | | |
m,nSenior Floating Rate Interests(continued) | | | | | | | | | | | | | | | | |
Energy(continued) | | | | | | | | | | | | | | | | |
Utex Industries Inc., | | | | | | | | | | | | | | | | |
First Lien Initial Term Loan, 5.786%, (1-month USD LIBOR + 4.00%), 5/21/21 | | | United States | | | | 360,644 | | | | | | | $ | 277,696 | |
Second Lien Initial Term Loan, 9.036%, (1-month USD LIBOR + 7.25%), 5/20/22 | | | United States | | | | 37,582 | | | | | | | | 19,918 | |
Wolverine Fuels Holding LLC, | | | | | | | | | | | | | | | | |
First Lien Initial Term Loan, 7.874%, (3-month USD LIBOR + 5.75%), 8/14/20 | | | United States | | | | 4,823,484 | | | | | | | | 4,718,973 | |
Second Lien Initial Term Loan, 12.874%, (3-month USD LIBOR + 10.75%), 2/16/21 | | | United States | | | | 817,655 | | | | | | | | 773,366 | |
| | | | | | | | | | | | | | | | |
| | | | |
| | | | | | | | | | | | | | | 18,527,376 | |
| | | | | | | | | | | | | | | | |
Food & Staples Retailing 0.1% | | | | | | | | | | | | | | | | |
Aramark Corp., | | | | | | | | | | | | | | | | |
U.S. Term B-2 Loan, 3.536%, (1-month USD LIBOR + 1.75%), 3/28/24 | | | United States | | | | 2,657,462 | | | | | | | | 2,666,312 | |
U.S. Term B-3 Loan, 3.536%, (1-month USD LIBOR + 1.75%), 3/11/25 | | | United States | | | | 1,834,185 | | | | | | | | 1,839,917 | |
| | | | | | | | | | | | | | | | |
| | | | |
| | | | | | | | | | | | | | | 4,506,229 | |
| | | | | | | | | | | | | | | | |
Food, Beverage & Tobacco 0.1% | | | | | | | | | | | | | | | | |
B&G Foods Inc., Tranche B-4 Term Loan, 4.475%, (1-month USD LIBOR + 2.50%), 10/10/26 | | | United States | | | | 907,221 | | | | | | | | 909,678 | |
CSM Bakery Supplies LLC, Second Lien Term Loan, 9.78%, (3-month USD LIBOR + 7.75%), 7/03/21 | | | United States | | | | 412,156 | | | | | | | | 368,879 | |
JBS USA Lux SA, New Term Loans, 4.286%, (1-month USD LIBOR + 2.50%), 5/01/26 | | | United States | | | | 4,288,373 | | | | | | | | 4,308,795 | |
Post Holdings Inc., Series A Incremental Term Loans, 3.83%, (1-month USD LIBOR + 2.00%), 5/24/24 | | | United States | | | | 114,331 | | | | | | | | 114,698 | |
| | | | | | | | | | | | | | | | |
| | | | |
| | | | | | | | | | | | | | | 5,702,050 | |
| | | | | | | | | | | | | | | | |
Health Care Equipment & Services 0.2% | | | | | | | | | | | | | | | | |
DaVita Inc., Tranche B Term Loan, 4.036%, (1-month USD LIBOR + 2.25%), 8/12/26 | | | United States | | | | 2,325,000 | | | | | | | | 2,334,737 | |
HCA Inc., Term Loan B11, 3.536%, (1-month USD LIBOR + 1.75%), 3/18/23 | | | United States | | | | 1,797,992 | | | | | | | | 1,806,209 | |
IQVIA Inc., | | | | | | | | | | | | | | | | |
Term B-2 Dollar Loans, 4.104%, (3-month USD LIBOR + 2.00%), 1/20/25 | | | United States | | | | 1,008,378 | | | | | | | | 1,012,369 | |
Term B-3 Dollar Loans, 3.854%, (3-month USD LIBOR + 1.75%), 6/11/25 | | | United States | | | | 2,888,745 | | | | | | | | 2,891,839 | |
| | | | | | | | | | | | | | | | |
| | | | |
| | | | | | | | | | | | | | | 8,045,154 | |
| | | | | | | | | | | | | | | | |
Household & Personal Products 0.0%† | | | | | | | | | | | | | | | | |
bFGI Operating Co. LLC (Freedom Group), | | | | | | | | | | | | | | | | |
iTerm Loan, PIK, 12.10%, (3-month USD LIBOR + 10.00%), 5/15/22 | | | United States | | | | 592,577 | | | | | | | | 578,194 | |
Term Loan FILO, 9.624% - 9.658%, (3-month USD LIBOR + 7.50%), 5/15/21 | | | United States | | | | 1,127,442 | | | | | | | | 1,125,241 | |
| | | | | | | | | | | | | | | | |
| | | | |
| | | | | | | | | | | | | | | 1,703,435 | |
| | | | | | | | | | | | | | | | |
| | | | |
| | | |
104 | | Annual Report | | franklintempleton.com |
FRANKLIN INVESTORS SECURITIES TRUST
CONSOLIDATED STATEMENT OF INVESTMENTS
Franklin Total Return Fund(continued)
| | | | | | | | | | | | | | | | |
| | | | Country | | |
| Principal
Amount |
* | | | | | | | Value | |
| | | | |
m,nSenior Floating Rate Interests(continued) | | | | | | | | | | | | | | | | |
Materials 0.1% | | | | | | | | | | | | | | | | |
Appvion Operations, Inc., | | | | | | | | | | | | | | | | |
Term Loan, 8.10%, (3-month USD LIBOR + 6.00%), 6/15/26 | | | United States | | | | 17,420 | | | | | | | $ | 17,594 | |
Term Loan, 8.22%, (6-month USD LIBOR + 6.00%), 6/15/26 | | | United States | | | | 277,082 | | | | | | | | 279,853 | |
Crown Americas LLC, Dollar Term B Loan, 3.997%, (1-month USD LIBOR + 2.00%), 4/03/25 | | | United States | | | | 1,068,269 | | | | | | | | 1,076,282 | |
Oxbow Carbon LLC, | | | | | | | | | | | | | | | | |
Tranche A Term Loan, 4.286%, (1-month USD LIBOR + 2.50%), 1/04/22 | | | United States | | | | 512,197 | | | | | | | | 509,636 | |
Tranche B Term Loan, 5.536%, (1-month USD LIBOR + 3.75%), 1/04/23 | | | United States | | | | 2,535,745 | | | | | | | | 2,534,160 | |
| | | | | | | | | | | | | | | | |
| | | | |
| | | | | | | | | | | | | | | 4,417,525 | |
| | | | | | | | | | | | | | | | |
Media & Entertainment 0.3% | | | | | | | | | | | | | | | | |
Charter Communications Operating LLC (CCO Safari), Term B-2 Loan, 3.58%, (1-month USD LIBOR + 1.75%), 2/01/27 | | | United States | | | | 2,984,810 | | | | | | | | 3,000,107 | |
Diamond Sports Group LLC, Term Loan, 5.08%, (1-month USD LIBOR + 3.25%), 8/24/26 | | | United States | | | | 887,784 | | | | | | | | 893,222 | |
oGray Television Inc., Term C Loan, 4.511%, (1-month USD LIBOR + 2.50%), 1/02/26 | | | United States | | | | 2,704,505 | | | | | | | | 2,715,283 | |
Lions Gate Capital Holdings LLC, Term A Loan, 3.536%, (1-month USD LIBOR + 1.75%), 3/22/23 | | | Canada | | | | 1,628,214 | | | | | | | | 1,589,544 | |
Live Nation Entertainment Inc., Term Loan B, 3.688%, (1-month USD LIBOR + 1.75%), 10/17/26 | | | United States | | | | 4,405,018 | | | | | | | | 4,411,881 | |
Mediacom Illinois LLC, Tranche N Term Loan, 3.57%, (1-week USD LIBOR + 1.75%), 2/15/24 | | | United States | | | | 2,123,300 | | | | | | | | 2,121,531 | |
Sinclair Television Group Inc., Tranche B Term Loans, 4.04%, (1-month USD LIBOR + 2.25%), 1/03/24 | | | United States | | | | 994,885 | | | | | | | | 995,195 | |
| | | | | | | | | | | | | | | | |
| | | | |
| | | | | | | | | | | | | | | 15,726,763 | |
| | | | | | | | | | | | | | | | |
Pharmaceuticals, Biotechnology & Life Sciences 0.2% | | | | | | | | | | | | | | | | |
Grifols Worldwide Operations USA Inc., Tranche B Term Loan, 4.086%, (1-week USD LIBOR + 2.25%), 1/31/25 | | | United States | | | | 2,385,671 | | | | | | | | 2,392,007 | |
Horizon Pharma Inc., Sixth Amendment Refinanced Term Loans, 4.563%, (1-month USD LIBOR + 2.50%), 5/22/26 | | | United States | | | | 3,179,283 | | | | | | | | 3,191,701 | |
Valeant Pharmaceuticals International, | | | | | | | | | | | | | | | | |
First Incremental Term Loan, 4.671%, (1-month USD LIBOR + 2.75%), 11/27/25 | | | United States | | | | 2,625,000 | | | | | | | | 2,630,392 | |
Initial Term Loans, 4.921%, (1-month USD LIBOR + 3.00%), 6/02/25 | | | United States | | | | 304,618 | | | | | | | | 306,056 | |
| | | | | | | | | | | | | | | | |
| | | | |
| | | | | | | | | | | | | | | 8,520,156 | |
| | | | | | | | | | | | | | | | |
Retailing 0.1% | | | | | | | | | | | | | | | | |
i99 Cents Only Stores, | | | | | | | | | | | | | | | | |
First Lien Term Loan, PIK, 8.604%, (3-month USD LIBOR + 6.50%), 1/13/22 | | | United States | | | | 78,020 | | | | | | | | 64,172 | |
First Lien Term Loan, PIK, 8.535%, (6-month USD LIBOR + 6.50%), 1/13/22 | | | United States | | | | 58,561 | | | | | | | | 48,166 | |
| | | | |
| | | |
| franklintempleton.com | | Annual Report | | 105 |
FRANKLIN INVESTORS SECURITIES TRUST
CONSOLIDATED STATEMENT OF INVESTMENTS
Franklin Total Return Fund(continued)
| | | | | | | | | | | | | | |
| | | Country | |
| Principal
Amount |
* | | | | | | | Value | |
| | | | |
m,nSenior Floating Rate Interests(continued) | | | | | | | | | | | | | | |
Retailing(continued) | | | | | | | | | | | | | | |
General Nutrition Centers Inc., Tranche B-2 Term Loans, 10.54%, (1-month USD LIBOR + 8.75%), 3/04/21 | | United States | | | 1,646,911 | | | | | | | $ | 1,556,849 | |
Harbor Freight Tools USA Inc., Refinancing Loans, 4.286%, (1-month USD LIBOR + 2.50%), 8/19/23 | | United States | | | 2,876,200 | | | | | | | | 2,820,474 | |
| | | | | | | | | | | | | | |
| | | | |
| | | | | | | | | | | | | 4,489,661 | |
| | | | | | | | | | | | | | |
Semiconductors & Semiconductor Equipment 0.0%† | | | | | | | | | | | | | | |
MKS Instruments Inc., Tranche B-6 Term Loan, 3.536%, (1-month USD LIBOR + 1.75%), 2/02/26 | | United States | | | 81,483 | | | | | | | | 81,814 | |
ON Semiconductor Corp., 2019 Replacement Term B-4 Loans, 3.786%, (1-month USD LIBOR + 2.00%), 9/18/26 | | United States | | | 1,245,405 | | | | | | | | 1,252,579 | |
| | | | | | | | | | | | | | |
| | | | |
| | | | | | | | | | | | | 1,334,393 | |
| | | | | | | | | | | | | | |
Software & Services 0.1% | | | | | | | | | | | | | | |
Go Daddy Operating Co. LLC, Tranche B-2 Term Loan, 3.536%, (1-month USD LIBOR + 1.75%), 2/15/24 | | United States | | | 4,826,591 | | | | | | | | 4,837,572 | |
LegalZoom.com Inc., 2018 Term Loans, 6.286%, (1-month USD LIBOR + 4.50%), 11/21/24 | | United States | | | 306,821 | | | | | | | | 307,300 | |
| | | | | | | | | | | | | | |
| | | | |
| | | | | | | | | | | | | 5,144,872 | |
| | | | | | | | | | | | | | |
Telecommunication Services 0.1% | | | | | | | | | | | | | | |
Global Tel*Link Corp., | | | | | | | | | | | | | | |
First Lien Term Loan, 6.036%, (1-month USD LIBOR + 4.25%), 11/29/25 | | United States | | | 1,052,632 | | | | | | | | 922,106 | |
Second Lien Term Loan, 10.036%, (1-month USD LIBOR + 8.25%), 11/29/26 | | United States | | | 127,673 | | | | | | | | 121,928 | |
Securus Technologies Holdings Inc., Second Lien Initial Loan, 10.036%, (1-month USD LIBOR + 8.25%), 11/01/25 | | United States | | | 416,510 | | | | | | | | 229,080 | |
oZayo Group LLC, 2017 Incremental Refinancing B-1 Term Loan, 3.786%, (1-month USD LIBOR + 2.00%), 1/19/21 | | United States | | | 2,984,694 | | | | | | | | 2,994,642 | |
| | | | | | | | | | | | | | |
| | | | |
| | | | | | | | | | | | | 4,267,756 | |
| | | | | | | | | | | | | | |
Transportation 0.2% | | | | | | | | | | | | | | |
Air Canada, Term Loan, 3.805%, (1-month USD LIBOR + 2.00%), 10/06/23 | | Canada | | | 40,741 | | | | | | | | 40,945 | |
Allegiant Travel Co., Class B Term Loans, 6.709%, (3-month USD LIBOR + 4.50%), 2/05/24 | | United States | | | 464,251 | | | | | | | | 465,991 | |
American Airlines Inc., 2018 Replacement Term Loans, 3.554%, (1-month USD LIBOR + 1.75%), 6/27/25 | | United States | | | 6,385,500 | | | | | | | | 6,324,308 | |
Hertz Corp., Tranche B-1 Term Loan, 4.54%, (1-month USD LIBOR + 2.75%), 6/30/23 | | United States | | | 3,809,045 | | | | | | | | 3,814,599 | |
| | | | | | | | | | | | | | |
| | | | |
| | | | | | | | | | | | | 10,645,843 | |
| | | | | | | | | | | | | | |
| | | | |
| | | |
106 | | Annual Report | | franklintempleton.com |
FRANKLIN INVESTORS SECURITIES TRUST
CONSOLIDATED STATEMENT OF INVESTMENTS
Franklin Total Return Fund(continued)
| | | | | | | | | | | | | | |
| | | Country | |
| Principal
Amount |
* | | | | | | | Value | |
| | | | |
m,nSenior Floating Rate Interests(continued) | | | | | | | | | | | | | | |
Utilities 0.0%† | | | | | | | | | | | | | | |
EFS Cogen Holdings I LLC (Linden), | | | | | | | | | | | | | | |
Term B Advance, 5.04%, (1-month USD LIBOR + 3.25%), 6/28/23 | | United States | | | 331,235 | | | | | | | $ | 330,718 | |
Term B Advance, 5.36%, (3-month USD LIBOR + 3.25%), 6/28/23 | | United States | | | 818,032 | | | | | | | | 816,754 | |
| | | | | | | | | | | | | | |
| | | | |
| | | | | | | | | | | | | 1,147,472 | |
| | | | | | | | | | | | | | |
| | | | |
Total Senior Floating Rate Interests
(Cost $141,619,286) | | | | | | | | | | | | | 139,024,973 | |
| | | | | | | | | | | | | | |
| | | | |
pMarketplace Loans (Cost $1,567,003) 0.0%† | | | | | | | | | | | | | | |
Diversified Financials 0.0%† | | | | | | | | | | | | | | |
| | | | |
bUpgrade, 14.19% - 31.00%, 10/11/22 - 10/28/24 | | United States | | | 1,567,003 | | | | | | | | 1,560,709 | |
| | | | | | | | | | | | | | |
| | | | |
Foreign Government and Agency Securities 5.9% | | | | | | | | | | | | | | |
gAngolan Government International Bond, senior note, 144A, 8.25%, 5/09/28 | | Angola | | | 16,700,000 | | | | | | | | 17,513,958 | |
hBanque Centrale de Tunisie International Bond, senior note, Reg S, 5.625%, 2/17/24 | | Tunisia | | | 16,500,000 | | | | EUR | | | | 18,037,438 | |
gDominican Republic, senior note, 144A, 8.90%, 2/15/23 | | Dominican Republic | | | 727,200,000 | | | | DOP | | | | 13,800,358 | |
The Export-Import Bank of Korea, senior note, 2.25%, 1/21/20 | | South Korea | | | 18,800,000 | | | | | | | | 18,810,998 | |
gGovernment of Belarus International Bond, senior note, 144A, 7.625%, 6/29/27 | | Belarus | | | 900,000 | | | | | | | | 1,036,125 | |
Government of China, 3.29%, 5/23/29 | | China | | | 160,800,000 | | | | CNY | | | | 22,816,148 | |
Government of Colombia, | | | | | | | | | | | | | | |
senior bond, 9.85%, 6/28/27 | | Colombia | | | 27,300,000,000 | | | | COP | | | | 10,154,994 | |
senior bond, 5.00%, 6/15/45 | | Colombia | | | 13,000,000 | | | | | | | | 15,174,380 | |
gGovernment of Gabon, 144A, 6.375%, 12/12/24 | | Gabon | | | 17,900,000 | | | | | | | | 17,871,629 | |
gGovernment of Iraq, 144A, 5.80%, 1/15/28 | | Iraq | | | 18,000,000 | | | | | | | | 17,315,370 | |
gGovernment of Kazakhstan, senior bond, 144A, 4.875%, 10/14/44 | | Kazakhstan | | | 8,200,000 | | | | | | | | 9,999,326 | |
Government of Mexico, senior note, 4.15%, 3/28/27 | | Mexico | | | 17,200,000 | | | | | | | | 18,436,680 | |
Government of Peru, senior bond, 6.55%, 3/14/37 | | Peru | | | 5,700,000 | | | | | | | | 8,337,732 | |
Government of South Africa, senior bond, 7.00%, 2/28/31 | | South Africa | | | 259,300,000 | | | | ZAR | | | | 14,317,139 | |
g,hGovernment of Spain, | | | | | | | | | | | | | | |
senior bond, 144A, Reg S, 1.45%, 4/30/29 | | Spain | | | 19,700,000 | | | | EUR | | | | 24,532,069 | |
senior bond, 144A, Reg S, 2.70%, 10/31/48 | | Spain | | | 20,000,000 | | | | EUR | | | | 31,017,164 | |
gGovernment of Ukraine, | | | | | | | | | | | | | | |
144A, 7.75%, 9/01/20 | | Ukraine | | | 292,000 | | | | | | | | 300,329 | |
144A, 7.75%, 9/01/21 | | Ukraine | | | 229,000 | | | | | | | | 240,026 | |
144A, 7.75%, 9/01/22 | | Ukraine | | | 229,000 | | | | | | | | 244,022 | |
144A, 7.75%, 9/01/23 | | Ukraine | | | 229,000 | | | | | | | | 245,351 | |
144A, 7.75%, 9/01/24 | | Ukraine | | | 229,000 | | | | | | | | 245,889 | |
144A, 7.75%, 9/01/25 | | Ukraine | | | 229,000 | | | | | | | | 246,275 | |
144A, 7.75%, 9/01/26 | | Ukraine | | | 229,000 | | | | | | | | 246,438 | |
144A, 7.75%, 9/01/27 | | Ukraine | | | 229,000 | | | | | | | | 246,610 | |
a,q144A, VRI, GDP Linked Security, 5/31/40 | | Ukraine | | | 474,000 | | | | | | | | 446,532 | |
senior bond, 144A, 7.375%, 9/25/32 | | Ukraine | | | 18,200,000 | | | | | | | | 19,064,773 | |
| | | | |
| | | |
| franklintempleton.com | | Annual Report | | 107 |
FRANKLIN INVESTORS SECURITIES TRUST
CONSOLIDATED STATEMENT OF INVESTMENTS
Franklin Total Return Fund(continued)
| | | | | | | | | | | | | | | | |
| | | | Country | | |
| Principal
Amount |
* | | | | | | | Value | |
| | | | |
Foreign Government and Agency Securities (continued) | | | | | | | | | | | | | | | | |
rGovernment of Uruguay, senior bond, Index Linked, 3.70%, 6/26/37 | | | Uruguay | | | | 509,096,046 | | | | UYU | | | $ | 13,586,420 | |
| | | | | | | | | | | | | | | | |
| | | | |
Total Foreign Government and Agency Securities
(Cost $294,986,696) | | | | | | | | | | | | | | | 294,284,173 | |
| | | | | | | | | | | | | | | | |
| | | | |
U.S. Government and Agency Securities 13.3% | | | | | | | | | | | | | | | | |
U.S. Treasury Bond, | | | | | | | | | | | | | | | | |
3.50%, 2/15/39 | | | United States | | | | 7,700,000 | | | | | | | | 9,556,572 | |
3.125%, 11/15/41 | | | United States | | | | 12,000,000 | | | | | | | | 14,127,891 | |
3.00%, 11/15/44 | | | United States | | | | 13,000,000 | | | | | | | | 15,086,094 | |
2.50%, 5/15/46 | | | United States | | | | 41,000,000 | | | | | | | | 43,622,558 | |
2.25%, 8/15/46 | | | United States | | | | 58,500,000 | | | | | | | | 59,268,955 | |
2.75%, 11/15/47 | | | United States | | | | 19,500,000 | | | | | | | | 21,817,529 | |
3.125%, 5/15/48 | | | United States | | | | 10,500,000 | | | | | | | | 12,606,973 | |
3.00%, 8/15/48 | | | United States | | | | 17,000,000 | | | | | | | | 19,966,367 | |
2.875%, 5/15/49 | | | United States | | | | 14,000,000 | | | | | | | | 16,118,047 | |
2.25%, 8/15/49 | | | United States | | | | 10,800,000 | | | | | | | | 10,960,313 | |
U.S. Treasury Note, | | | | | | | | | | | | | | | | |
2.00%, 8/31/21 | | | United States | | | | 60,000,000 | | | | | | | | 60,476,953 | |
1.875%, 8/31/24 | | | United States | | | | 89,900,000 | | | | | | | | 91,341,561 | |
1.50%, 9/30/24 | | | United States | | | | 48,700,000 | | | | | | | | 48,646,734 | |
2.625%, 12/31/25 | | | United States | | | | 43,700,000 | | | | | | | | 46,353,580 | |
2.00%, 11/15/26 | | | United States | | | | 25,500,000 | | | | | | | | 26,180,332 | |
rIndex Linked, 0.125%, 7/15/24 | | | United States | | | | 65,369,761 | | | | | | | | 65,434,928 | |
rIndex Linked, 0.375%, 7/15/25 | | | United States | | | | 45,438,508 | | | | | | | | 46,132,854 | |
rIndex Linked, 0.625%, 1/15/26 | | | United States | | | | 14,576,490 | | | | | | | | 14,962,756 | |
rIndex Linked, 0.375%, 7/15/27 | | | United States | | | | 44,899,592 | | | | | | | | 45,686,794 | |
| | | | | | | | | | | | | | | | |
| | | | |
Total U.S. Government and Agency Securities
(Cost $639,484,934) | | | | | | | | | | | | | | | 668,347,791 | |
| | | | | | | | | | | | | | | | |
| | | | |
Asset-Backed Securities and Commercial Mortgage-Backed Securities 28.8% | | | | | | | | | | | | | | | | |
Banks 0.7% | | | | | | | | | | | | | | | | |
sCommercial Mortgage Trust, | | | | | | | | | | | | | | | | |
t2006-GG7, AJ, FRN, 5.637%, 7/10/38 | | | United States | | | | 3,599,000 | | | | | | | | 3,335,036 | |
2006-GG7, AM, FRN, 5.637%, 7/10/38 | | | United States | | | | 726,298 | | | | | | | | 731,245 | |
g,sCSMC, 2009-15R, 3A1, 144A, FRN, 5.155%, 3/26/36 | | | United States | | | | 467,324 | | | | | | | | 469,703 | |
uCWABS Inc. Asset-Backed Certificates, 2004-1, M1, FRN, 2.573%, (1-month USD LIBOR + 0.75%), 3/25/34 | | | United States | | | | 723,541 | | | | | | | | 729,295 | |
g,uDBCG Mortgage Trust, 2017-BBG, A, 144A, FRN, 2.614%, (1-month USD LIBOR + 0.70%), 6/15/34 | | | United States | | | | 9,840,000 | | | | | | | | 9,832,908 | |
uFNMA, 2005-122, FN, FRN, 2.173%, (1-month USD LIBOR + 0.35%), 1/25/36 | | | United States | | | | 380,188 | | | | | | | | 378,647 | |
g,sFREMF Mortgage Trust, 2018-K72, B, 144A, FRN, 3.992%, 12/25/50 | | | United States | | | | 17,900,000 | | | | | | | | 19,308,000 | |
sGE Capital Commercial Mortgage Corp. Trust, 2007-C1, AM, FRN, 5.606%, 12/10/49 | | | United States | | | | 1,687,435 | | | | | | | | 1,490,950 | |
uMerrill Lynch Mortgage Investors Trust, 2003-A, 1A, FRN, 2.563%, (1-month USD LIBOR + 0.74%), 3/25/28 | | | United States | | | | 619,263 | | | | | | | | 619,460 | |
| | | | |
| | | |
108 | | Annual Report | | franklintempleton.com |
FRANKLIN INVESTORS SECURITIES TRUST
CONSOLIDATED STATEMENT OF INVESTMENTS
Franklin Total Return Fund(continued)
| | | | | | | | | | | | | | | | |
| | | | Country | | |
| Principal
Amount |
* | | | | | | | Value | |
| | | | |
Asset-Backed Securities and Commercial Mortgage-Backed Securities(continued) | | | | | | | | | | | | | | | | |
Banks(continued) | | | | | | | | | | | | | | | | |
uMorgan Stanley ABS Capital I Inc. Trust, 2005-WMC, M2, FRN, 2.558%, (1-month USD LIBOR + 0.735%), 1/25/35 | | | United States | | | | 184,798 | | | | | | | $ | 188,255 | |
bWeyerhaeuser Mortgage Co., 1984-A, 7.43%, 1/01/24 | | | United States | | | | 10,010 | | | | | | | | 10,010 | |
| | | | | | | | | | | | | | | | |
| | | | |
| | | | | | | | | | | | | | | 37,093,509 | |
| | | | | | | | | | | | | | | | |
Diversified Financials 28.1% | | | | | | | | | | | | | | | | |
g,s,vAdagio CLO VIII DAC, VIII-A, B1, 144A, FRN, 1.65%, 4/15/32 | | | Ireland | | | | 2,050,000 | | | | EUR | | | | 2,286,365 | |
uAmerican Home Mortgage Investment Trust, 2004-3, 4A, FRN, 3.531%, (6-month USD LIBOR + 1.50%), 10/25/34 | | | United States | | | | 824,860 | | | | | | | | 830,357 | |
uAmeriquest Mortgage Securities Inc. Asset-Backed Pass-Through Certificates, 2004-R4, M1, FRN, 2.648%, (1-month USD LIBOR + 0.825%), 6/25/34 | | | United States | | | | 2,046,227 | | | | | | | | 2,057,254 | |
g,sAMMC CLO 15 Ltd., | | | | | | | | | | | | | | | | |
2014-15A, ARR, 144A, FRN, 3.261%, 1/15/32 | | | United States | | | | 3,000,000 | | | | | | | | 2,996,580 | |
2014-15A, BRR, 144A, FRN, 3.801%, 1/15/32 | | | United States | | | | 922,984 | | | | | | | | 910,764 | |
g,uAMMC CLO 21 Ltd., 2017-21A, C, 144A, FRN, 4.002%, (3-month USD LIBOR + 2.10%), 11/02/30 | | | United States | | | | 1,000,000 | | | | | | | | 956,690 | |
g,uAMMC CLO XI Ltd., | | | | | | | | | | | | | | | | |
2012-11A, BR2, 144A, FRN, 3.536%, (3-month USD LIBOR + 1.60%), 4/30/31 | | | United States | | | | 5,050,000 | | | | | | | | 4,936,426 | |
2012-11A, CR2, 144A, FRN, 3.836%, (3-month USD LIBOR + 1.90%), 4/30/31 | | | United States | | | | 2,750,000 | | | | | | | | 2,589,648 | |
g,uAntares CLO Ltd., 2018-1A, B, 144A, FRN, 3.616%, (3-month USD LIBOR + 1.65%), 4/20/31 | | | United States | | | | 12,900,000 | | | | | | | | 12,572,082 | |
g,uAres CLO Ltd., 2018-48A, D, 144A, FRN, 4.666%, (3-month USD LIBOR + 2.70%), 7/20/30 | | | United States | | | | 2,000,000 | | | | | | | | 1,845,000 | |
g,sAres European CLO VIII BV, | | | | | | | | | | | | | | | | |
8A, AR, 144A, FRN, 0.92%, 4/17/32 | | | Netherlands | | | | 20,700,000 | | | | EUR | | | | 23,086,711 | |
8A, BR, 144A, FRN, 1.60%, 4/17/32 | | | Netherlands | | | | 2,900,000 | | | | EUR | | | | 3,234,370 | |
g,sARES LII CLO Ltd., | | | | | | | | | | | | | | | | |
2019-52A, A2, 144A, FRN, 3.603%, 4/22/31 | | | United States | | | | 1,382,114 | | | | | | | | 1,378,673 | |
2019-52A, B, 144A, FRN, 3.803%, 4/22/31 | | | United States | | | | 6,000,000 | | | | | | | | 6,006,000 | |
2019-52A, C, 144A, FRN, 4.633%, 4/22/31 | | | United States | | | | 2,500,000 | | | | | | | | 2,487,550 | |
2019-52A, D, 144A, FRN, 5.903%, 4/22/31 | | | United States | | | | 3,194,444 | | | | | | | | 3,150,520 | |
uArgent Securities Inc. Asset-Backed Pass-Through Certificates, 2005-W2, A2C, FRN, 2.183%, (1-month USD LIBOR + 0.36%), 10/25/35 | | | United States | | | | 1,697,781 | | | | | | | | 1,705,019 | |
g,s,vArmada Euro CLO IV DAC, 4A, B, 144A, FRN, 1.70%, 7/15/33 | | | United Kingdom | | | | 5,100,000 | | | | EUR | | | | 5,688,030 | |
g,uAtrium IX, 9A, AR, 144A, FRN, 3.384%, (3-month USD LIBOR + 1.24%), 5/28/30 | | | United States | | | | 4,500,000 | | | | | | | | 4,497,840 | |
g,sAtrium XII, 2012A, CR, 144A, FRN, 2.783%, 4/22/27 | | | United States | | | | 11,600,000 | | | | | | | | 11,571,348 | |
g,uAtrium XIII, | | | | | | | | | | | | | | | | |
2013A, B, 144A, FRN, 3.434%, (3-month USD LIBOR + 1.50%), 11/21/30 | | | United States | | | | 2,700,000 | | | | | | | | 2,668,950 | |
2013A, C, 144A, FRN, 3.734%, (3-month USD LIBOR + 1.80%), 11/21/30 | | | United States | | | | 3,753,500 | | | | | | | | 3,580,839 | |
2013A, D, 144A, FRN, 4.634%, (3-month USD LIBOR + 2.70%), 11/21/30 | | | United States | | | | 5,500,000 | | | | | | | | 4,972,660 | |
| | | | |
| | | |
| franklintempleton.com | | Annual Report | | 109 |
FRANKLIN INVESTORS SECURITIES TRUST
CONSOLIDATED STATEMENT OF INVESTMENTS
Franklin Total Return Fund(continued)
| | | | | | | | | | | | | | | | |
| | | | Country | | |
| Principal
Amount |
* | | | | | | | Value | |
Asset-Backed Securities and Commercial Mortgage-Backed Securities(continued) | | | | | | | | | | | | | | | | |
Diversified Financials(continued) | | | | | | | | | | | | | | | | |
g,sAtrium XIV LLC, 14A, A2A, 144A, FRN, 3.451%, 8/23/30 | | | United States | | | | 7,400,000 | | | | | | | $ | 7,337,544 | |
g,sAtrium XV, 15A, A1, 144A, FRN, 3.104%, 1/23/31 | | | United States | | | | 3,150,000 | | | | | | | | 3,143,480 | |
g,sAvoca CLO XVII Designated Activity Co., 17A, B1R, 144A, FRN, 1.70%, 10/15/32 | | | Ireland | | | | 5,600,000 | | | | EUR | | | | 6,241,408 | |
g,uBain Capital Credit CLO, | | | | | | | | | | | | | | | | |
2018-1A, A1, 144A, FRN, 2.894%, (3-month USD LIBOR + 0.96%), 4/23/31 | | | United States | | | | 12,000,000 | | | | | | | | 11,852,160 | |
2018-1A, A2, 144A, FRN, 3.084%, (3-month USD LIBOR + 1.15%), 4/23/31 | | | United States | | | | 5,100,000 | | | | | | | | 5,060,679 | |
g,sBCC Middle Market CLO LLC, 2018-1A, A2, 144A, FRN, 4.116%, 10/20/30 | | | United States | | | | 5,100,000 | | | | | | | | 5,062,515 | |
g,uBellemeade Re Ltd., 2018-1A, M1B, 144A, FRN, 3.423%, (1-month USD LIBOR + 1.60%), 4/25/28 | | | United States | | | | 8,739,511 | | | | | | | | 8,752,381 | |
g,sBetony CLO 2 Ltd., 2018-1A, A1, 144A, FRN, 3.016%, 4/30/31 | | | United States | | | | 10,300,000 | | | | | | | | 10,212,038 | |
g,s,vBlackrock European CLO IX DAC, | | | | | | | | | | | | | | | | |
9A, A, 144A, FRN, 0.90%, 12/15/32 | | | Ireland | | | | 17,350,000 | | | | EUR | | | | 19,350,456 | |
9A, B, 144A, FRN, 1.55%, 12/15/32 | | | Ireland | | | | 5,250,000 | | | | EUR | | | | 5,855,325 | |
g,sBlueMountain CLO Ltd., | | | | | | | | | | | | | | | | |
2012-2A, AR2, 144A, FRN, 3.186%, 11/20/28 | | | United States | | | | 1,291,071 | | | | | | | | 1,293,072 | |
2014-2A, A2R2, 144A, FRN, 3.366%, 10/20/30 | | | United States | | | | 5,775,775 | | | | | | | | 5,676,432 | |
2014-2A, CR2, 144A, FRN, 4.166%, 10/20/30 | | | United States | | | | 3,600,000 | | | | | | | | 3,434,256 | |
2018-3A, B, 144A, FRN, 3.71%, 10/25/30 | | | United States | | | | 2,000,000 | | | | | | | | 1,992,500 | |
2018-3A, C, 144A, FRN, 4.14%, 10/25/30 | | | United States | | | | 1,071,430 | | | | | | | | 1,028,787 | |
g,sBlueMountain CLO XXII Ltd., 2018-1A, B, 144A, FRN, 3.636%, 7/30/30 | | | United States | | | | 272,725 | | | | | | | | 270,300 | |
g,s,vBlueMountain EUR CLO, | | | | | | | | | | | | | | | | |
5A, A, 144A, FRN, 0.91%, 1/15/33 | | | Ireland | | | | 20,950,000 | | | | EUR | | | | 23,365,536 | |
5A, B, 144A, FRN, 1.55%, 1/15/33 | | | Ireland | | | | 6,250,000 | | | | EUR | | | | 6,970,625 | |
g,uBlueMountain Fuji U.S. CLO II Ltd., 2017-2A, B, 144A, FRN, 4.116%, (3-month USD LIBOR + 2.15%), 10/20/30 | | | United States | | | | 4,010,000 | | | | | | | | 3,882,001 | |
g,uBlueMountain Fuji U.S. CLO III Ltd., | | | | | | | | | | | | | | | | |
2017-3A, C, 144A, FRN, 3.701%, (3-month USD LIBOR + 1.70%), 1/15/30 | | | United States | | | | 2,300,000 | | | | | | | | 2,176,306 | |
2017-3A, D, 144A, FRN, 4.401%, (3-month USD LIBOR + 2.40%), 1/15/30 | | | United States | | | | 1,600,000 | | | | | | | | 1,422,672 | |
gBRAVO Residential Funding Trust, 2019-1, A1C, 144A, 3.50%, 3/25/58 | | | United States | | | | 9,634,370 | | | | | | | | 9,815,238 | |
g,sBurnham Park CLO Ltd., 2016-1A, BR, 144A, FRN, 3.466%, 10/20/29 | | | United States | | | | 1,488,189 | | | | | | | | 1,472,727 | |
g,sButtermilk Park CLO Ltd., 2018-1A, C, 144A, FRN, 4.101%, 10/15/31 | | | United States | | | | 1,452,380 | | | | | | | | 1,404,582 | |
g,sCarlyle Euro CLO DAC, 2019-2A, A1A, 144A, FRN, 1.11%, 8/15/32 | | | Ireland | | | | 10,400,000 | | | | EUR | | | | 11,622,319 | |
g,uCarlyle Global Market Strategies CLO Ltd., | | | | | | | | | | | | | | | | |
2014-1A, A1R2, 144A, FRN, 2.972%, (3-month USD LIBOR + 0.97%), 4/17/31 | | | United States | | | | 725,000 | | | | | | | | 716,119 | |
2014-1A, A2R2, 144A, FRN, 3.132%, (3-month USD LIBOR + 1.13%), 4/17/31 | | | United States | | | | 6,300,000 | | | | | | | | 6,136,263 | |
| | | | |
| | | |
110 | | Annual Report | | franklintempleton.com |
FRANKLIN INVESTORS SECURITIES TRUST
CONSOLIDATED STATEMENT OF INVESTMENTS
Franklin Total Return Fund(continued)
| | | | | | | | | | | | | | |
| | | | Country | | |
| Principal
Amount |
* | | | | | Value | |
| | | | |
Asset-Backed Securities and Commercial Mortgage-Backed Securities(continued) | | | | | | | | | | | | | | |
Diversified Financials(continued) | | | | | | | | | | | | | | |
g,sCarlyle GMS Finance MM CLO LLC, 2015-1A, A2R, 144A, FRN, 4.201%, 10/15/31 | | | United States | | | | 10,000,000 | | | | | $ | 9,919,500 | |
g,uCarlyle U.S. CLO Ltd., | | | | | | | | | | | | | | |
2017-1A, A1A, 144A, FRN, 3.266%, (3-month USD LIBOR + 1.30%), 4/20/31 | | | United States | | | | 8,160,000 | | | | | | 8,149,963 | |
2017-2A, A1B, 144A, FRN, 3.186%, (3-month USD LIBOR + 1.22%), 7/20/31 | | | United States | | | | 10,650,000 | | | | | | 10,650,319 | |
2017-2A, B, 144A, FRN, 4.366%, (3-month USD LIBOR + 2.40%), 7/20/31 | | | United States | | | | 8,829,000 | | | | | | 8,616,663 | |
2017-3A, B, 144A, FRN, 4.316%, (3-month USD LIBOR + 2.35%), 7/20/29 | | | United States | | | | 1,000,000 | | | | | | 972,890 | |
2017-4A, C, 144A, FRN, 4.801%, (3-month USD LIBOR + 2.80%), 1/15/30 | | | United States | | | | 545,000 | | | | | | 498,675 | |
2017-5A, A2, 144A, FRN, 3.366%, (3-month USD LIBOR + 1.40%), 1/20/30 | | | United States | | | | 2,000,000 | | | | | | 1,925,980 | |
2017-5A, B, 144A, FRN, 3.766%, (3-month USD LIBOR + 1.80%), 1/20/30 | | | United States | | | | 7,000,000 | | | | | | 6,563,970 | |
g,uCatamaran CLO Ltd., | | | | | | | | | | | | | | |
2014-2A, BR, 144A, FRN, 4.953%, (3-month USD LIBOR + 2.95%), 10/18/26 | | | United States | | | | 6,401,000 | | | | | | 6,403,944 | |
2015-1A, C2R, 144A, FRN, 3.903%, (3-month USD LIBOR + 1.95%), 4/22/27 | | | United States | | | | 7,600,000 | | | | | | 7,308,996 | |
g,sCIM Trust, | | | | | | | | | | | | | | |
2018-INV1, A4, 144A, FRN, 4.00%, 8/25/48 | | | United States | | | | 10,409,099 | | | | | | 10,892,804 | |
2019-INV1, A1, 144A, FRN, 4.00%, 2/25/49 | | | United States | | | | 12,335,955 | | | | | | 12,656,063 | |
2019-INV2, A3, 144A, FRN, 4.00%, 5/25/49 | | | United States | | | | 20,481,369 | | | | | | 21,416,175 | |
g,sCitigroup Mortgage Loan Trust, 2013-A, A, 144A, FRN, 3.00%, 5/25/42 | | | United States | | | | 608,244 | | | | | | 599,914 | |
g,sCole Park CLO Ltd., 2015-1A, BR, 144A, FRN, 3.566%, 10/20/28 | | | United States | | | | 2,571,428 | | | | | | 2,554,919 | |
g,sColumbia Cent CLO 27 Ltd., 2018-27A, A2A, 144A, FRN, 3.54%, 10/25/28 | | | United States | | | | 769,230 | | | | | | 762,907 | |
g,sConsumer Loan Underlying Bond CLUB Certificate Issuer Trust I, | | | | | | | | | | | | | | |
2019-S6, PT, 144A, FRN, 12.793%, 10/17/44 | | | United States | | | | 5,630,734 | | | | | | 5,257,135 | |
2018-14, PT, 144A, FRN, 9.459%, 9/16/41 | | | United States | | | | 3,973,916 | | | | | | 3,901,003 | |
2018-29, PT, 144A, FRN, 25.917%, 12/15/43 | | | United States | | | | 1,775,324 | | | | | | 1,468,520 | |
2019-26, PT, 144A, FRN, 20.442%, 8/15/44 | | | United States | | | | 7,429,510 | | | | | | 6,993,448 | |
2019-31, PT, 144A, FRN, 21.412%, 9/15/44 | | | United States | | | | 6,709,404 | | | | | | 6,270,551 | |
2019-37, PT, 144A, FRN, 20.088%, 10/17/44 | | | United States | | | | 7,257,122 | | | | | | 6,973,307 | |
2019-42, PT, 144A, FRN, 24.207%, 11/15/44 | | | United States | | | | 7,987,204 | | | | | | 7,680,171 | |
2019-S1, PT, 144A, FRN, 14.902%, 4/15/44 | | | United States | | | | 5,831,303 | | | | | | 5,120,548 | |
2019-S2, PT, 144A, FRN, 14.389%, 5/16/44 | | | United States | | | | 4,504,462 | | | | | | 4,117,587 | |
2019-S3, PT, 144A, FRN, 14.539%, 6/15/44 | | | United States | | | | 5,475,010 | | | | | | 5,108,734 | |
2019-S4, PT, 144A, FRN, 13.454%, 8/15/44 | | | United States | | | | 6,182,356 | | | | | | 5,770,430 | |
2019-S5, PT, 144A, FRN, 13.279%, 9/15/44 | | | United States | | | | 6,043,377 | | | | | | 5,541,510 | |
| | | | |
| | | |
| franklintempleton.com | | Annual Report | | 111 |
FRANKLIN INVESTORS SECURITIES TRUST
CONSOLIDATED STATEMENT OF INVESTMENTS
Franklin Total Return Fund(continued)
| | | | | | | | | | | | | | | | |
| | | | Country | | |
| Principal
Amount |
* | | | | | | | Value | |
| | | | |
Asset-Backed Securities and Commercial Mortgage-Backed Securities(continued) | | | | | | | | | | | | | | | | |
Diversified Financials(continued) | | | | | | | | | | | | | | | | |
g,uCook Park CLO Ltd., 2018-1A, A2, 144A, FRN, 3.122%, (3-month USD LIBOR + 1.12%), 4/17/30 | | | United States | | | | 6,000,000 | | | | | | | $ | 5,845,080 | |
Credit Suisse First Boston Mortgage Securities Corp., 2004-6, 3A1, 5.00%, 9/25/19 | | | United States | | | | 121,424 | | | | | | | | 109,956 | |
Discover Card Execution Note Trust, 2019-A3, A, 1.89%, 10/15/24 | | | United States | | | | 17,820,000 | | | | | | | | 17,856,078 | |
Dryden 41 Senior Loan Fund, | | | | | | | | | | | | | | | | |
g,u2015-41A, AR, 144A, FRN, 2.956%, (3-month USD LIBOR + 0.97%), 4/15/31 | | | United States | | | | 22,025,000 | | | | | | | | 21,785,148 | |
h,s2015-41X, AR, Reg S, FRN, 2.956%, 4/15/31 | | | United States | | | | 4,700,000 | | | | | | | | 4,648,817 | |
g,uDryden 42 Senior Loan Fund, 2016-42A, DR, 144A, FRN, 4.931%, (3-month USD LIBOR + 2.93%), 7/15/30 | | | United States | | | | 800,000 | | | | | | | | 728,536 | |
g,sDryden 45 Senior Loan Fund, 2016-45A, CR, 144A, FRN, 4.201%, 10/15/30 | | | United States | | | | 1,250,000 | | | | | | | | 1,230,238 | |
g,uDryden 49 Senior Loan Fund, | | | | | | | | | | | | | | | | |
2017-49A, A, 144A, FRN, 3.213%, (3-month USD LIBOR + 1.21%), 7/18/30 | | | United States | | | | 7,030,000 | | | | | | | | 7,033,164 | |
2017-49A, C, 144A, FRN, 4.353%, (3-month USD LIBOR + 2.35%), 7/18/30 | | | United States | | | | 5,320,000 | | | | | | | | 5,189,607 | |
g,uDryden 50 Senior Loan Fund, | | | | | | | | | | | | | | | | |
2017-50A, A1, 144A, FRN, 3.221%, (3-month USD LIBOR + 1.22%), 7/15/30 | | | United States | | | | 5,660,000 | | | | | | | | 5,641,322 | |
2017-50A, C, 144A, FRN, 4.251%, (3-month USD LIBOR + 2.25%), 7/15/30 | | | United States | | | | 2,600,000 | | | | | | | | 2,600,806 | |
g,uDryden 55 CLO Ltd., | | | | | | | | | | | | | | | | |
2018-55A, A1, 144A, FRN, 3.021%, (3-month USD LIBOR + 1.02%), 4/15/31 | | | United States | | | | 23,362,000 | | | | | | | | 23,146,602 | |
2018-55A, D, 144A, FRN, 4.851%, (3-month USD LIBOR + 2.85%), 4/15/31 | | | United States | | | | 2,000,000 | | | | | | | | 1,816,060 | |
g,uDryden 64 CLO Ltd., 2018-64A, A, 144A, FRN, 2.973%, (3-month USD LIBOR + 0.97%), 4/18/31 | | | United States | | | | 1,200,000 | | | | | | | | 1,185,936 | |
g,sEleven Madison Trust 2015-11MD Mortgage Trust, 2015-11MD, A, 144A, FRN, 3.673%, 9/10/35 | | | United States | | | | 3,255,000 | | | | | | | | 3,484,490 | |
g,uEllington CLO III Ltd., 2018-3A, A1, 144A, FRN, 3.616%, (3-month USD LIBOR + 1.65%), 7/20/30 | | | United States | | | | 5,400,000 | | | | | | | | 5,374,350 | |
g,sEuro-Galaxy III CLO BV, 2013-3A, B2ER, 144A, FRN, 1.50%, 1/17/31 | | | Netherlands | | | | 2,550,000 | | | | EUR | | | | 2,839,021 | |
FHLMC Structured Agency Credit Risk Debt Notes, | | | | | | | | | | | | | | | | |
u2014-DN1, M2, FRN, 4.023%, (1-month USD LIBOR + 2.20%), 2/25/24 | | | United States | | | | 1,536,126 | | | | | | | | 1,553,869 | |
u2014-DN3, M3, FRN, 5.823%, (1-month USD LIBOR + 4.00%), 8/25/24 | | | United States | | | | 14,241,606 | | | | | | | | 15,033,579 | |
u2014-DN4, M3, FRN, 6.373%, (1-month USD LIBOR + 4.55%), 10/25/24 | | | United States | | | | 8,223,523 | | | | | | | | 8,821,165 | |
u2014-HQ1, M3, FRN, 5.923%, (1-month USD LIBOR + 4.10%), 8/25/24 | | | United States | | | | 2,608,716 | | | | | | | | 2,757,489 | |
u2015-DN1, M3, FRN, 5.973%, (1-month USD LIBOR + 4.15%), 1/25/25 | | | United States | | | | 9,633,672 | | | | | | | | 9,977,694 | |
u2015-DNA2, M3, FRN, 5.723%, (1-month USD LIBOR + 3.90%), 12/25/27 | | | United States | | | | 25,057,000 | | | | | | | | 26,048,004 | |
| | | | |
| | | |
112 | | Annual Report | | franklintempleton.com |
FRANKLIN INVESTORS SECURITIES TRUST
CONSOLIDATED STATEMENT OF INVESTMENTS
Franklin Total Return Fund(continued)
| | | | | | | | | | | | | | |
| | | | Country | | |
| Principal
Amount |
* | | | | | Value | |
| | | | |
Asset-Backed Securities and Commercial Mortgage-Backed Securities(continued) | | | | | | | | | | | | | | |
Diversified Financials(continued) | | | | | | | | | | | | | | |
FHLMC Structured Agency Credit Risk Debt Notes, (continued) | | | | | | | | | | | | | | |
u2015-DNA3, M2, FRN, 4.673%, (1-month USD LIBOR + 2.85%), 4/25/28 | | | United States | | | | 8,455,451 | | | | | $ | 8,548,970 | |
u2015-DNA3, M3, FRN, 6.523%, (1-month USD LIBOR + 4.70%), 4/25/28 | | | United States | | | | 3,330,000 | | | | | | 3,675,327 | |
u2015-HQ1, M3, FRN, 5.623%, (1-month USD LIBOR + 3.80%), 3/25/25 | | | United States | | | | 21,697,129 | | | | | | 22,297,834 | |
u2015-HQ2, M3, FRN, 5.073%, (1-month USD LIBOR + 3.25%), 5/25/25 | | | United States | | | | 4,580,000 | | | | | | 4,789,301 | |
u2015-HQA1, M2, FRN, 4.473%, (1-month USD LIBOR + 2.65%), 3/25/28 | | | United States | | | | 4,178,808 | | | | | | 4,190,886 | |
u2015-HQA2, M2, FRN, 4.623%, (1-month USD LIBOR + 2.80%), 5/25/28 | | | United States | | | | 866,519 | | | | | | 871,612 | |
u2016-DNA1, M2, FRN, 4.723%, (1-month USD LIBOR + 2.90%), 7/25/28 | | | United States | | | | 2,230,978 | | | | | | 2,244,868 | |
u2016-DNA1, M3, FRN, 7.373%, (1-month USD LIBOR + 5.55%), 7/25/28 | | | United States | | | | 29,600,000 | | | | | | 32,666,465 | |
u2016-DNA2, M3, FRN, 6.473%, (1-month USD LIBOR + 4.65%), 10/25/28 | | | United States | | | | 19,720,548 | | | | | | 21,154,602 | |
u2016-HQA1, M2, FRN, 4.573%, (1-month USD LIBOR + 2.75%), 9/25/28 | | | United States | | | | 3,265,294 | | | | | | 3,278,392 | |
u2016-HQA2, M2, FRN, 4.073%, (1-month USD LIBOR + 2.25%), 11/25/28 | | | United States | | | | 7,847,855 | | | | | | 7,888,177 | |
u2016-HQA2, M3, FRN, 6.973%, (1-month USD LIBOR + 5.15%), 11/25/28 | | | United States | | | | 26,915,000 | | | | | | 29,539,552 | |
u2016-HQA3, M2, FRN, 3.173%, (1-month USD LIBOR + 1.35%), 3/25/29 | | | United States | | | | 1,599,473 | | | | | | 1,602,743 | |
s2017-DNA1, M2, FRN, 5.073%, 7/25/29 | | | United States | | | | 10,450,000 | | | | | | 10,965,906 | |
s2017-DNA2, M2, FRN, 5.273%, 10/25/29 | | | United States | | | | 12,000,000 | | | | | | 12,755,563 | |
u2017-DNA3, M2, FRN, 4.323%, (1-month USD LIBOR + 2.50%), 3/25/30 | | | United States | | | | 13,500,000 | | | | | | 13,785,347 | |
g,uFlagship CLO VIII Ltd., 2014-8A, ARR, 144A, FRN, 2.851%, (3-month USD LIBOR
+ 0.85%), 1/16/26 | | | United States | | | | 4,149,244 | | | | | | 4,149,120 | |
FNMA Connecticut Avenue Securities, | | | | | | | | | | | | | | |
u2013-C01, M2, FRN, 7.073%, (1-month USD LIBOR + 5.25%), 10/25/23 | | | United States | | | | 5,358,447 | | | | | | 5,907,333 | |
u2014-C02, 1M2, FRN, 4.423%, (1-month USD LIBOR + 2.60%), 5/25/24 | | | United States | | | | 22,096,847 | | | | | | 22,989,697 | |
u2014-C02, 2M2, FRN, 4.423%, (1-month USD LIBOR + 2.60%), 5/25/24 | | | United States | | | | 7,903,146 | | | | | | 8,176,909 | |
u2014-C03, 1M2, FRN, 4.823%, (1-month USD LIBOR + 3.00%), 7/25/24 | | | United States | | | | 26,470,037 | | | | | | 27,815,932 | |
u2014-C03, 2M2, FRN, 4.723%, (1-month USD LIBOR + 2.90%), 7/25/24 | | | United States | | | | 2,858,508 | | | | | | 2,972,910 | |
u2014-C04, 1M1, FRN, 6.723%, (1-month USD LIBOR + 4.90%), 11/25/24 | | | United States | | | | 20,250,164 | | | | | | 22,075,761 | |
u2014-C04, 2M2, FRN, 6.823%, (1-month USD LIBOR + 5.00%), 11/25/24 | | | United States | | | | 3,531,475 | | | | | | 3,767,290 | |
u2015-C01, 1M2, FRN, 6.123%, (1-month USD LIBOR + 4.30%), 2/25/25 | | | United States | | | | 2,955,472 | | | | | | 3,130,833 | |
| | | | |
| | | |
| franklintempleton.com | | Annual Report | | 113 |
FRANKLIN INVESTORS SECURITIES TRUST
CONSOLIDATED STATEMENT OF INVESTMENTS
Franklin Total Return Fund(continued)
| | | | | | | | | | | | | | |
| | | | Country | | |
| Principal
Amount |
* | | | | | Value | |
| | | | |
Asset-Backed Securities and Commercial Mortgage-Backed Securities(continued) | | | | | | | | | | | | | | |
Diversified Financials(continued) | | | | | | | | | | | | | | |
FNMA Connecticut Avenue Securities, (continued) | | | | | | | | | | | | | | |
u2015-C01, 2M2, FRN, 6.373%, (1-month USD LIBOR + 4.55%), 2/25/25 | | | United States | | | | 11,494,806 | | | | | $ | 11,889,807 | |
u2015-C02, 1M2, FRN, 5.823%, (1-month USD LIBOR + 4.00%), 5/25/25 | | | United States | | | | 14,140,622 | | | | | | 14,923,201 | |
u2015-C02, 2M2, FRN, 5.823%, (1-month USD LIBOR + 4.00%), 5/25/25 | | | United States | | | | 3,845,518 | | | | | | 4,001,205 | |
u2015-C03, 1M2, FRN, 6.823%, (1-month USD LIBOR + 5.00%), 7/25/25 | | | United States | | | | 9,965,706 | | | | | | 10,766,360 | |
u2015-C03, 2M2, FRN, 6.823%, (1-month USD LIBOR + 5.00%), 7/25/25 | | | United States | | | | 3,960,865 | | | | | | 4,213,452 | |
s2016-C02, 1M2, FRN, 7.823%, 9/25/28 | | | United States | | | | 19,149,481 | | | | | | 20,902,065 | |
s2016-C04, 1M2, FRN, 6.073%, 1/25/29 | | | United States | | | | 17,450,000 | | | | | | 18,442,008 | |
s2016-C05, 2M2, FRN, 6.273%, 1/25/29 | | | United States | | | | 18,816,393 | | | | | | 19,820,869 | |
s2016-C07, 2M2, FRN, 6.173%, 5/25/29 | | | United States | | | | 12,732,171 | | | | | | 13,380,138 | |
u2017-C01, 1B1, FRN, 7.573%, (1-month USD LIBOR + 5.75%), 7/25/29 | | | United States | | | | 5,375,000 | | | | | | 6,323,589 | |
u2017-C01, 1M2, FRN, 5.373%, (1-month USD LIBOR + 3.55%), 7/25/29 | | | United States | | | | 11,760,000 | | | | | | 12,323,739 | |
s2017-C03, 1M2, FRN, 4.823%, 10/25/29 | | | United States | | | | 17,670,000 | | | | | | 18,406,906 | |
sFreddie Mac Structured Agency Credit Risk Debt Notes, HQA2, M2, FRN, 4.473%, 12/25/29 | | | United States | | | | 3,000,000 | | | | | | 3,082,208 | |
g,uGalaxy XXVII CLO Ltd., | | | | | | | | | | | | | | |
2018-27A, A, 144A, FRN, 3.188%, (3-month USD LIBOR + 1.02%), 5/16/31 | | | United States | | | | 1,000,000 | | | | | | 988,780 | |
2018-27A, C, 144A, FRN, 3.968%, (3-month USD LIBOR + 1.80%), 5/16/31 | | | United States | | | | 4,000,000 | | | | | | 3,770,960 | |
g,uGilbert Park CLO Ltd., 2017-1A, B, 144A, FRN, 3.601%, (3-month USD LIBOR + 1.60%), 10/15/30 | | | United States | | | | 1,000,000 | | | | | | 992,210 | |
uGSAA Home Equity Trust, 2005-5, M3, FRN, 2.768%, (1-month USD LIBOR + 0.945%), 2/25/35 | | | United States | | | | 1,052,192 | | | | | | 1,075,926 | |
g,uHalcyon Loan Advisors Funding Ltd., 2018-1A, A2, 144A, FRN, 3.766%, (3-month USD LIBOR + 1.80%), 7/21/31 | | | United States | | | | 4,500,000 | | | | | | 4,365,180 | |
g,sHarbor Park CLO Ltd., 1A, A2, 144A, FRN, 3.366%, 1/20/31 | | | United States | | | | 657,895 | | | | | | 653,007 | |
g,uHayFin Kingsland IX Ltd., 2013-6A, BR, 144A, FRN, 3.736%, (3-month USD LIBOR + 1.80%), 4/28/31 | | | United States | | | | 14,500,000 | | | | | | 14,316,575 | |
g,sHPS Loan Management Ltd., | | | | | | | | | | | | | | |
2013A-18, A2, 144A, FRN, 3.451%, 10/15/30 | | | United States | | | | 8,600,000 | | | | | | 8,528,534 | |
2013A-18, C, 144A, FRN, 4.151%, 10/15/30 | | | United States | | | | 3,000,000 | | | | | | 2,889,210 | |
g,uInvitation Homes Trust, 2017-SFR2, A, 144A, FRN, 2.739%, (1-month USD LIBOR + 0.85%), 12/17/36 | | | United States | | | | 9,239,050 | | | | | | 9,238,598 | |
g,uLCM 26 Ltd., | | | | | | | | | | | | | | |
26A, B, 144A, FRN, 3.366%, (3-month USD LIBOR + 1.40%), 1/20/31 | | | United States | | | | 2,000,000 | | | | | | 1,934,220 | |
26A, C, 144A, FRN, 3.766%, (3-month USD LIBOR + 1.80%), 1/20/31 | | | United States | | | | 9,600,000 | | | | | | 9,040,992 | |
26A, D, 144A, FRN, 4.466%, (3-month USD LIBOR + 2.50%), 1/20/31 | | | United States | | | | 600,000 | | | | | | 529,290 | |
| | | | |
| | | |
114 | | Annual Report | | franklintempleton.com |
FRANKLIN INVESTORS SECURITIES TRUST
CONSOLIDATED STATEMENT OF INVESTMENTS
Franklin Total Return Fund(continued)
| | | | | | | | | | | | | | | | |
| | | | Country | | |
| Principal
Amount |
* | | | | | | | Value | |
| | | | |
Asset-Backed Securities and Commercial Mortgage-Backed Securities(continued) | | | | | | | | | | | | | | | | |
Diversified Financials(continued) | | | | | | | | | | | | | | | | |
g,sLCM XVI LP, 2016A, A2R, 144A, FRN, 3.181%, 10/15/31 | | | United States | | | | 1,083,333 | | | | | | | $ | 1,080,300 | |
g,uLCM XVIII LP, 2018A, CR, 144A, FRN, 3.816%, (3-month USD LIBOR + 1.85%), 4/20/31 | | | United States | | | | 2,000,000 | | | | | | | | 1,883,140 | |
g,sLCM XXII Ltd., | | | | | | | | | | | | | | | | |
22A, A2R, 144A, FRN, 3.416%, 10/20/28 | | | United States | | | | 1,000,000 | | | | | | | | 980,340 | |
22A, CR, 144A, FRN, 4.766%, 10/20/28 | | | United States | | | | 1,000,000 | | | | | | | | 916,290 | |
g,uLCM XXIII Ltd., 23A, A2, 144A, FRN, 3.816%, (3-month USD LIBOR + 1.85%), 10/20/29 | | | United States | | | | 2,000,000 | | | | | | | | 2,000,800 | |
g,uLong Point Park CLO Ltd., | | | | | | | | | | | | | | | | |
2017-1A, A2, 144A, FRN, 3.377%, (3-month USD LIBOR + 1.375%), 1/17/30 | | | United States | | | | 5,800,000 | | | | | | | | 5,656,740 | |
2017-1A, B, 144A, FRN, 3.702%, (3-month USD LIBOR + 1.70%), 1/17/30 | | | United States | | | | 2,700,000 | | | | | | | | 2,576,745 | |
2017-1A, C, 144A, FRN, 4.402%, (3-month USD LIBOR + 2.40%), 1/17/30 | | | United States | | | | 3,100,000 | | | | | | | | 2,769,819 | |
g,sMadison Park Euro Funding XIV DAC, 2014A, A1N, 144A, FRN, 1.12%, 7/15/32 | | | Ireland | | | | 7,300,000 | | | | EUR | | | | 8,176,928 | |
g,uMadison Park Funding XXIII Ltd., | | | | | | | | | | | | | | | | |
2017-23A, B, 144A, FRN, 3.636%, (3-month USD LIBOR + 1.70%), 7/27/30 | | | United States | | | | 3,840,000 | | | | | | | | 3,816,230 | |
2017-23A, C, 144A, FRN, 4.286%, (3-month USD LIBOR + 2.35%), 7/27/30 | | | United States | | | | 1,000,000 | | | | | | | | 983,530 | |
g,sMadison Park Funding XXIX Ltd., | | | | | | | | | | | | | | | | |
2018-29A, A2, 144A, FRN, 3.453%, 10/18/30 | | | United States | | | | 1,727,273 | | | | | | | | 1,708,601 | |
2018-29A, C, 144A, FRN, 4.203%, 10/18/30 | | | United States | | | | 1,072,581 | | | | | | | | 1,051,204 | |
g,uMadison Park Funding XXVII Ltd., 2018-27A, A1B, 144A, FRN, 3.096%, (3-month USD LIBOR + 1.13%), 4/20/30 | | | United States | | | | 6,837,000 | | | | | | | | 6,741,487 | |
g,sMadison Park Funding XXXI Ltd., | | | | | | | | | | | | | | | | |
2018-31A, B, 144A, FRN, 3.634%, 1/23/31 | | | United States | | | | 1,500,000 | | | | | | | | 1,489,830 | |
2018-31A, C, 144A, FRN, 4.084%, 1/23/31 | | | United States | | | | 650,000 | | | | | | | | 636,201 | |
g,sMagnetite Ltd., 2015-14RA, A1, 144A, FRN, 3.123%, 10/18/31 | | | United States | | | | 15,000,000 | | | | | | | | 14,959,950 | |
g,sMill City Mortgage Loan Trust, | | | | | | | | | | | | | | | | |
2018-1, A1, 144A, FRN, 3.25%, 5/25/62 | | | United States | | | | 2,179,387 | | | | | | | | 2,236,227 | |
2018-4, A1B, 144A, FRN, 3.50%, 4/25/66 | | | United States | | | | 14,274,000 | | | | | | | | 14,732,764 | |
g,sNeuberger Berman CLO Ltd., 2016-22A, A2R, 144A, FRN, 3.402%, 10/17/30 | | | United States | | | | 8,300,000 | | | | | | | | 8,233,932 | |
g,sNeuberger Berman CLO XVIII Ltd., 2014-18A, A1BR, 144A, FRN, 3.366%, 10/21/30 | | | United States | | | | 1,700,000 | | | | | | | | 1,691,738 | |
g,uNeuberger Berman CLO XVI-S Ltd., | | | | | | | | | | | | | | | | |
2017-16SA, C, 144A, FRN, 3.601%, (3-month USD LIBOR + 1.60%), 1/15/28 | | | United States | | | | 2,350,000 | | | | | | | | 2,293,976 | |
2017-16SA, D, 144A, FRN, 4.501%, (3-month USD LIBOR + 2.50%), 1/15/28 | | | United States | | | | 650,000 | | | | | | | | 627,660 | |
| | | | |
| | | |
| franklintempleton.com | | Annual Report | | 115 |
FRANKLIN INVESTORS SECURITIES TRUST
CONSOLIDATED STATEMENT OF INVESTMENTS
Franklin Total Return Fund(continued)
| | | | | | | | | | | | | | | | |
| | | | Country | | |
| Principal
Amount |
* | | | | | | | Value | |
| | | | |
Asset-Backed Securities and Commercial Mortgage-Backed Securities(continued) | | | | | | | | | | | | | | | | |
Diversified Financials(continued) | | | | | | | | | | | | | | | | |
gNeuberger Berman Loan Advisers CLO Ltd., | | | | | | | | | | | | | | | | |
u2017-26A, B, 144A, FRN, 3.503%, (3-month USD LIBOR + 1.50%), 10/18/30 | | | United States | | | | 5,772,370 | | | | | | | $ | 5,661,310 | |
u2018-27A, C, 144A, FRN, 3.701%, (3-month USD LIBOR + 1.70%), 1/15/30 | | | United States | | | | 4,900,000 | | | | | | | | 4,599,385 | |
s2019-32A, C, 144A, FRN, 4.616%, 1/19/32 | | | United States | | | | 2,000,000 | | | | | | | | 2,000,100 | |
g,uNewark BSL CLO 2 Ltd., | | | | | | | | | | | | | | | | |
2017-1A, B, 144A, FRN, 4.29%, (3-month USD LIBOR + 2.35%), 7/25/30 | | | United States | | | | 3,069,687 | | | | | | | | 3,030,548 | |
2017-1A, C, 144A, FRN, 5.59%, (3-month USD LIBOR + 3.65%), 7/25/30 | | | United States | | | | 1,000,000 | | | | | | | | 976,780 | |
g,uNZCG Funding Ltd., 2015-1A, A2R, 144A, FRN, 3.682%, (3-month USD LIBOR + 1.55%), 2/26/31 | |
| United
States |
| | | 11,200,000 | | | | | | | | 10,980,032 | |
g,uOctagon Investment Partners 18-R Ltd., 2018-18A, C, 144A, FRN, 4.701%, (3-month USD LIBOR + 2.70%), 4/16/31 | |
| United
States |
| | | 9,050,000 | | | | | | | | 8,094,501 | |
g,sOctagon Investment Partners 24 Ltd., 2015-1A, BS, 144A, FRN, 3.866%, 4/21/31 | |
| United
States |
| | | 6,482,500 | | | | | | | | 6,478,805 | |
g,sOctagon Investment Partners 28 Ltd., 2016-1A, A2R, 144A, FRN, 3.386%, 10/24/30 | |
| United
States |
| | | 1,000,000 | | | | | | | | 1,001,210 | |
g,uOctagon Investment Partners 31 LLC, 2017-1A, C, 144A, FRN, 4.366%, (3-month USD LIBOR + 2.40%), 7/20/30 | |
| United
States |
| | | 1,707,068 | | | | | | | | 1,690,424 | |
g,uOctagon Investment Partners 33 Ltd., | | | | | | | | | | | | | | | | |
2017-1A, A2, 144A, FRN, 3.466%, (3-month USD LIBOR + 1.50%), 1/20/31 | | | United States | | | | 400,000 | | | | | | | | 392,796 | |
2017-1A, C, 144A, FRN, 4.716%, (3-month USD LIBOR + 2.75%), 1/20/31 | | | United States | | | | 2,800,000 | | | | | | | | 2,585,660 | |
g,uOctagon Investment Partners 35 Ltd., | | | | | | | | | | | | | | | | |
2018-1A, A1B, 144A, FRN, 3.066%, (3-month USD LIBOR + 1.10%), 1/20/31 | | | United States | | | | 3,325,000 | | | | | | | | 3,251,152 | |
2018-1A, B, 144A, FRN, 3.666%, (3-month USD LIBOR + 1.70%), 1/20/31 | | | United States | | | | 450,000 | | | | | | | | 424,643 | |
g,uOctagon Investment Partners 36 Ltd., | | | | | | | | | | | | | | | | |
2018-1A, A1, 144A, FRN, 2.971%, (3-month USD LIBOR + 0.97%), 4/15/31 | | | United States | | | | 18,000,000 | | | | | | | | 17,866,440 | |
2018-1A, A2, 144A, FRN, 3.201%, (3-month USD LIBOR + 1.20%), 4/15/31 | | | United States | | | | 8,500,000 | | | | | | | | 8,294,215 | |
g,uOctagon Investment Partners 37 Ltd., 2018-2A, C, 144A, FRN, 4.79%, (3-month USD LIBOR + 2.85%), 7/25/30 | | | United States | | | | 2,000,000 | | | | | | | | 1,812,080 | |
g,sOctagon Investment Partners 38 Ltd., 2018-1A, C, 144A, FRN, 4.916%, 7/20/30 | | | United States | | | | 4,000,000 | | | | | | | | 3,661,400 | |
g,uOctagon Investment Partners XVII Ltd., 2013-1A, CR2, 144A, FRN, 3.64%, (3-month USD LIBOR + 1.70%), 1/25/31 | | | United States | | | | 5,250,000 | | | | | | | | 4,918,830 | |
g,uOctagon Investment Partners XXIII Ltd., | | | | | | | | | | | | | | | | |
2015-1A, BR, 144A, FRN, 3.201%, (3-month USD LIBOR + 1.20%), 7/15/27 | | | United States | | | | 1,170,000 | | | | | | | | 1,150,438 | |
2015-1A, CR, 144A, FRN, 3.851%, (3-month USD LIBOR + 1.85%), 7/15/27 | | | United States | | | | 2,700,000 | | | | | | | | 2,660,283 | |
2015-1A, DR, 144A, FRN, 4.551%, (3-month USD LIBOR + 2.55%), 7/15/27 | | | United States | | | | 1,000,000 | | | | | | | | 973,790 | |
| | | | |
| | | |
116 | | Annual Report | | franklintempleton.com |
FRANKLIN INVESTORS SECURITIES TRUST
CONSOLIDATED STATEMENT OF INVESTMENTS
Franklin Total Return Fund(continued)
| | | | | | | | | | | | | | | | |
| | | | Country | | |
| Principal
Amount |
* | | | | | | | Value | |
| | | | |
Asset-Backed Securities and Commercial Mortgage-Backed Securities(continued) | | | | | | | | | | | | | | | | |
| | | | |
Diversified Financials(continued) | | | | | | | | | | | | | | | | |
g,sOctagon Loan Funding Ltd., 2014-1A, ARR, 144A, FRN, 3.304%, 11/18/31 | | | United States | | | | 1,000,000 | | | | | | | $ | 995,980 | |
g,uRace Point IX CLO Ltd., 2015-9A, A1AR, 144A, FRN, 3.211%, (3-month USD LIBOR + 1.21%), 10/15/30 | | | United States | | | | 5,175,000 | | | | | | | | 5,162,166 | |
g,sRace Point X CLO Ltd., 2016-10A, B1R, 144A, FRN, 3.59%, 7/25/31 | | | United States | | | | 3,600,000 | | | | | | | | 3,516,264 | |
g,uRadnor RE Ltd., 2018-1, M1, 144A, FRN, 3.223%, (1-month USD LIBOR + 1.40%), 3/25/28 | | | United States | | | | 4,113,198 | | | | | | | | 4,114,114 | |
g,sStrata CLO I Ltd., 2018-1A, B, 144A, FRN, 4.201%, 1/15/31 | | | United States | | | | 11,000,000 | | | | | | | | 10,857,550 | |
g,uTCI-Flatiron CLO Ltd., | | | | | | | | | | | | | | | | |
2017-1A, B, 144A, FRN, 3.684%, (3-month USD LIBOR + 1.56%), 11/18/30 | | | United States | | | | 3,500,000 | | | | | | | | 3,417,960 | |
2017-1A, C, 144A, FRN, 3.974%, (3-month USD LIBOR + 1.85%), 11/18/30 | | | United States | | | | 2,800,000 | | | | | | | | 2,645,720 | |
g,sTowd Point Mortgage Trust, | | | | | | | | | | | | | | | | |
2017-1, A1, 144A, FRN, 2.75%, 10/25/56 | | | United States | | | | 7,998,758 | | | | | | | | 8,116,436 | |
2017-1, A2, 144A, FRN, 3.50%, 10/25/56 | | | United States | | | | 8,862,000 | | | | | | | | 9,258,609 | |
2017-2, A1, 144A, FRN, 2.75%, 4/25/57 | | | United States | | | | 3,644,696 | | | | | | | | 3,683,033 | |
2017-4, A1, 144A, FRN, 2.75%, 6/25/57 | | | United States | | | | 6,328,413 | | | | | | | | 6,421,037 | |
2019-1, A1, 144A, FRN, 3.75%, 3/25/58 | | | United States | | | | 13,676,326 | | | | | | | | 14,456,894 | |
g,sUpgrade Master Pass-Thru Trust, 2019-PT1, A, 144A, FRN, 11.128%, 6/15/25 | | | United States | | | | 3,270,998 | | | | | | | | 3,269,693 | |
gVoya CLO Ltd., | | | | | | | | | | | | | | | | |
u2013-2A, CR, 144A, FRN, 4.69%, (3-month USD LIBOR + 2.75%), 4/25/31 | | | United States | | | | 1,650,000 | | | | | | | | 1,486,172 | |
u2014-1A, BR2, 144A, FRN, 3.903%, (3-month USD LIBOR + 1.90%), 4/18/31 | | | United States | | | | 1,000,000 | | | | | | | | 965,020 | |
u2014-1A, CR2, 144A, FRN, 4.803%, (3-month USD LIBOR + 2.80%), 4/18/31 | | | United States | | | | 3,750,000 | | | | | | | | 3,393,488 | |
s2015-2A, AR, 144A, FRN, 2.904%, 7/23/27 | | | United States | | | | 4,840,000 | | | | | | | | 4,843,194 | |
s2016-3A, CR, 144A, FRN, 5.253%, 10/18/31 | | | United States | | | | 2,547,170 | | | | | | | | 2,382,012 | |
u2017-3A, B, 144A, FRN, 4.316%, (3-month USD LIBOR + 2.35%), 7/20/30 | | | United States | | | | 3,091,704 | | | | | | | | 3,057,819 | |
s2018-2A, A1, 144A, FRN, 3.001%, 7/15/31 | | | United States | | | | 6,122,582 | | | | | | | | 6,058,417 | |
u2018-2A, A2, 144A, FRN, 3.251%, (3-month USD LIBOR + 1.25%), 7/15/31 | | | United States | | | | 1,500,000 | | | | | | | | 1,473,000 | |
u2018-2A, C1, 144A, FRN, 3.851%, (3-month USD LIBOR + 1.85%), 7/15/31 | | | United States | | | | 700,000 | | | | | | | | 664,944 | |
s2018-4A, B, 144A, FRN, 3.851%, 1/15/32 | | | United States | | | | 1,896,104 | | | | | | | | 1,883,893 | |
| | | | |
| | | |
| franklintempleton.com | | Annual Report | | 117 |
FRANKLIN INVESTORS SECURITIES TRUST
CONSOLIDATED STATEMENT OF INVESTMENTS
Franklin Total Return Fund(continued)
| | | | | | | | | | | | | | | | |
| | | | Country | | |
| Principal
Amount |
* | | | | | | | Value | |
| | | | |
Asset-Backed Securities and Commercial Mortgage-Backed Securities(continued) | | | | | | | | | | | | | | | | |
Diversified Financials(continued) | | | | | | | | | | | | | | | | |
g,uWebster Park CLO Ltd., 2015-1A, BR, 144A, FRN, 3.766%, (3-month USD LIBOR + 1.80%), 7/20/30 | | | United States | | | | 2,000,000 | | | | | | | $ | 1,882,680 | |
sWells Fargo Mortgage Backed Securities Trust, 2004-W, A9, FRN, 4.597%, 11/25/34 | | | United States | | | | 595,361 | | | | | | | | 624,339 | |
g,uWest CLO Ltd., | | | | | | | | | | | | | | | | |
2014-1A, A2R, 144A, FRN, 3.353%, (3-month USD LIBOR + 1.35%), 7/18/26 | | | United States | | | | 2,860,000 | | | | | | | | 2,853,908 | |
2014-1A, BR, 144A, FRN, 3.853%, (3-month USD LIBOR + 1.85%), 7/18/26 | | | United States | | | | 5,060,000 | | | | | | | | 5,047,148 | |
| | | | | | | | | | | | | | | | |
| | | | |
| | | | | | | | | | | | | | | 1,410,682,137 | |
| | | | | | | | | | | | | | | | |
| | | | |
Total Asset-Backed Securities and Commercial Mortgage-Backed Securities (Cost $1,466,764,432) | | | | | | | | | | | | | | | 1,447,775,646 | |
| | | | | | | | | | | | | | | | |
| | | | |
Mortgage-Backed Securities 26.9% | | | | | | | | | | | | | | | | |
wFederal Home Loan Mortgage Corp. (FHLMC) Adjustable Rate 0.0%† | | | | | | | | | | | | | | | | |
FHLMC, 2.405%, (11th District COF +/- MBS Margin), 11/01/27 | | | United States | | | | 1,146,366 | | | | | | | | 1,141,578 | |
| | | | | | | | | | | | | | | | |
Federal Home Loan Mortgage Corp. (FHLMC) Fixed Rate 17.1% | | | | | | | | | | | | | | | | |
xFHLMC 15 Year, 2.50%, 10/01/34 | | | United States | | | | 11,000,000 | | | | | | | | 11,119,453 | |
xFHLMC 30 Year, 2.50%, 11/01/49 | | | United States | | | | 31,000,000 | | | | | | | | 30,829,258 | |
xFHLMC 30 Year, 3.00%, 11/01/49 | | | United States | | | | 189,000,000 | | | | | | | | 192,071,252 | |
xFHLMC 30 Year, 3.50%, 11/01/49 | | | United States | | | | 226,800,000 | | | | | | | | 232,895,252 | |
FHLMC 30 Year, 4.00%, 7/01/49 | | | United States | | | | 132,926,650 | | | | | | | | 138,053,132 | |
xFHLMC 30 Year, 4.00%, 11/01/49 | | | United States | | | | 48,800,000 | | | | | | | | 50,638,244 | |
xFHLMC 30 Year, 4.50%, 11/01/49 | | | United States | | | | 57,000,000 | | | | | | | | 59,953,618 | |
FHLMC 30 Year, 6.00%, 6/01/37 | | | United States | | | | 28,801 | | | | | | | | 33,099 | |
FHLMC 30 Year, 6.50%, 8/01/25 - 11/01/31 | | | United States | | | | 80,619 | | | | | | | | 89,906 | |
FHLMC 30 Year, 7.00%, 7/01/31 | | | United States | | | | 5,610 | | | | | | | | 5,865 | |
FHLMC 30 Year, 8.00%, 2/01/30 | | | United States | | | | 16,274 | | | | | | | | 18,851 | |
FHLMC 30 Year, 8.50%, 10/01/24 | | | United States | | | | 3,271 | | | | | | | | 3,556 | |
FHLMC Gold 15 Year, 5.50%, 11/01/22 | | | United States | | | | 45,566 | | | | | | | | 45,940 | |
FHLMC Gold 15 Year, 6.00%, 10/01/21 - 9/01/22 | | | United States | | | | 122,021 | | | | | | | | 125,169 | |
FHLMC Gold 30 Year, 3.50%, 12/01/47 | | | United States | | | | 49,371,336 | | | | | | | | 51,306,631 | |
FHLMC Gold 30 Year, 3.50%, 4/01/48 | | | United States | | | | 77,512,038 | | | | | | | | 80,360,845 | |
FHLMC Gold 30 Year, 4.50%, 3/01/39 | | | United States | | | | 1,400,592 | | | | | | | | 1,518,381 | |
FHLMC Gold 30 Year, 5.00%, 8/01/33 - 2/01/39 | | | United States | | | | 8,409,419 | | | | | | | | 9,286,886 | |
FHLMC Gold 30 Year, 5.50%, 1/01/35 - 12/01/37 | | | United States | | | | 623,962 | | | | | | | | 691,219 | |
FHLMC Gold 30 Year, 6.00%, 5/01/33 - 4/01/38 | | | United States | | | | 884,552 | | | | | | | | 1,015,527 | |
FHLMC Gold 30 Year, 6.50%, 4/01/28 - 3/01/39 | | | United States | | | | 661,173 | | | | | | | | 754,245 | |
FHLMC Gold 30 Year, 7.00%, 1/01/28 - 7/01/32 | | | United States | | | | 50,658 | | | | | | | | 57,336 | |
FHLMC Gold 30 Year, 7.50%, 3/01/32. | | | United States | | | | 11,781 | | | | | | | | 13,860 | |
FHLMC Gold 30 Year, 8.50%, 8/01/30 | | | United States | | | | 1,191 | | | | | | | | 1,378 | |
FHLMC Gold 30 Year, 9.00%, 1/01/22 | | | United States | | | | 18 | | | | | | | | 18 | |
| | | | | | | | | | | | | | | | |
| | | | |
| | | | | | | | | | | | | | | 860,888,921 | |
| | | | | | | | | | | | | | | | |
| | | | |
| | | |
118 | | Annual Report | | franklintempleton.com |
FRANKLIN INVESTORS SECURITIES TRUST
CONSOLIDATED STATEMENT OF INVESTMENTS
Franklin Total Return Fund(continued)
| | | | | | | | | | | | | | | | |
| | | | Country | | |
| Principal
Amount |
* | | | | | | | Value | |
| | | | |
Mortgage-Backed Securities(continued) | | | | | | | | | | | | | | | | |
wFederal National Mortgage Association (FNMA) Adjustable Rate 0.1% | | | | | | | | | | | | | | | | |
FNMA, 3.671%,(6-month USD LIBOR +/- MBS Margin), 10/01/32 | | | United States | | | | 138,242 | | | | | | | $ | 140,888 | |
FNMA, 4.026%, (US 3 Year CMTT-Note +/- MBS Margin), 12/01/24 | | | United States | | | | 7,496 | | | | | | | | 7,737 | |
FNMA, 2.404% - 4.108%, (11th District COF +/- MBS Margin), 12/01/27 - 9/01/34 | | | United States | | | | 2,306,616 | | | | | | | | 2,349,265 | |
FNMA, 4.38% - 4.691%,(12-month USD LIBOR +/- MBS Margin), 2/01/34 - 3/01/37 | | | United States | | | | 918,441 | | | | | | | | 952,376 | |
FNMA, 4.115% -5.287%, (US 1 Year CMTT-Note +/- MBS Margin), 5/01/25 - 10/01/36 | | | United States | | | | 213,011 | | | | | | | | 223,086 | |
| | | | | | | | | | | | | | | | |
| | | | |
| | | | | | | | | | | | | | | 3,673,352 | |
| | | | | | | | | | | | | | | | |
Federal National Mortgage Association (FNMA) Fixed Rate 7.5% | | | | | | | | | | | | | | | | |
FNMA 15 Year, 5.50%, 12/01/22 - 12/01/23 | | | United States | | | | 76,300 | | | | | | | | 78,637 | |
FNMA 15 Year, 6.00%, 9/01/22 | | | United States | | | | 34,920 | | | | | | | | 35,457 | |
FNMA 30 Year, 3.00%, 9/01/48 | | | United States | | | | 72,793,547 | | | | | | | | 74,743,858 | |
FNMA 30 Year, 3.00%, 11/01/48 | | | United States | | | | 89,321,586 | | | | | | | | 91,553,515 | |
FNMA 30 Year, 3.50%, 11/01/47 | | | United States | | | | 83,946,192 | | | | | | | | 87,116,203 | |
FNMA 30 Year, 3.50%, 4/01/48 | | | United States | | | | 46,392,612 | | | | | | | | 48,096,338 | |
FNMA 30 Year, 4.00%, 10/01/47 | | | United States | | | | 55,889,810 | | | | | | | | 58,726,123 | |
FNMA 30 Year, 5.00%, 6/01/36 - 5/01/39 | | | United States | | | | 1,493,509 | | | | | | | | 1,644,818 | |
FNMA 30 Year, 5.50%, 6/01/33 - 8/01/37 | | | United States | | | | 4,779,221 | | | | | | | | 5,283,287 | |
FNMA 30 Year, 6.00%, 9/01/32 - 9/01/38 | | | United States | | | | 6,003,648 | | | | | | | | 6,882,674 | |
FNMA 30 Year, 6.50%, 8/01/28 - 5/01/37 | | | United States | | | | 164,343 | | | | | | | | 184,823 | |
FNMA 30 Year, 7.00%, 11/01/25 | | | United States | | | | 2,825 | | | | | | | | 2,828 | |
FNMA 30 Year, 7.50%, 1/01/30 | | | United States | | | | 9,561 | | | | | | | | 11,186 | |
FNMA 30 Year, 8.50%, 4/01/30 - 5/01/32 | | | United States | | | | 53,159 | | | | | | | | 63,394 | |
FNMA 30 Year, 9.00%, 11/01/26 - 5/01/27 | | | United States | | | | 51,552 | | | | | | | | 52,615 | |
| | | | | | | | | | | | | | | | |
| | | | |
| | | | | | | | | | | | | | | 374,475,756 | |
| | | | | | | | | | | | | | | | |
wGovernment National Mortgage Association (GNMA) Adjustable Rate 0.0%† | | | | | | | | | | | | | | | | |
GNMA, 4.00% - 4.125%, (US 1 Year CMTT-Note +/- MBS Margin), 1/20/23 - 10/20/26 | | | United States | | | | 26,064 | | | | | | | | 26,752 | |
| | | | | | | | | | | | | | | | |
| | | | |
Government National Mortgage Association (GNMA) Fixed Rate 2.2% | | | | | | | | | | | | | | | | |
xGNMA I SF 30 Year, 4.50%, 10/01/49 | | | United States | | | | 4,900,000 | | | | | | | | 5,130,364 | |
GNMA I SF 30 Year, 6.00%, 1/15/39 | | | United States | | | | 142,759 | | | | | | | | 164,202 | |
GNMA I SF 30 Year, 6.50%, 10/15/31 - 7/15/38 | | | United States | | | | 20,506 | | | | | | | | 22,727 | |
GNMA I SF 30 Year, 7.00%, 10/15/27 - 6/15/31 | | | United States | | | | 25,505 | | | | | | | | 28,773 | |
GNMA I SF 30 Year, 7.50%, 2/15/22 - 5/15/26 | | | United States | | | | 29,012 | | | | | | | | 29,713 | |
GNMA I SF 30 Year, 9.00%, 9/15/25 | | | United States | | | | 41 | | | | | | | | 42 | |
GNMA II SF 30 Year, 3.50%, 9/20/49 | | | United States | | | | 8,132,931 | | | | | | | | 8,454,447 | |
xGNMA II SF 30 Year, 3.50%, 10/01/49 | | | United States | | | | 17,400,000 | | | | | | | | 18,056,578 | |
GNMA II SF 30 Year, 4.50%, 5/20/49 | | | United States | | | | 76,092,664 | | | | | | | | 79,809,245 | |
GNMA II SF 30 Year, 6.00%, 5/20/31 | | | United States | | | | 3,307 | | | | | | | | 3,698 | |
GNMA II SF 30 Year, 6.50%, 3/20/28 - 7/20/38 | | | United States | | | | 318,891 | | | | | | | | 367,756 | |
| | | | |
| | | |
| franklintempleton.com | | Annual Report | | 119 |
FRANKLIN INVESTORS SECURITIES TRUST
CONSOLIDATED STATEMENT OF INVESTMENTS
Franklin Total Return Fund(continued)
| | | | | | | | | | | | | | | | |
| | | | Country | | |
| Principal
Amount |
* | | | | | | | Value | |
| | | | |
Mortgage-Backed Securities(continued) | | | | | | | | | | | | | | | | |
Government National Mortgage Association (GNMA) Fixed Rate(continued) | | | | | | | | | | | | | | | | |
GNMA II SF 30 Year, 7.50%, 8/20/30 - 1/20/33 | | | United States | | | | 33,829 | | | | | | | $ | 38,244 | |
| | | | | �� | | | | | | | | | | | |
| | | | |
| | | | | | | | | | | | | | | 112,105,789 | |
| | | | | | | | | | | | | | | | |
| | | | |
Total Mortgage-Backed Securities
(Cost $1,334,689,214) | | | | | | | | | | | | | | | 1,352,312,148 | |
| | | | | | | | | | | | | | | | |
| | | | |
Municipal Bonds 3.2% | | | | | | | | | | | | | | | | |
California State GO, Various Purpose, 6.00%, 11/01/39 | | | United States | | | | 2,385,000 | | | | | | | | 2,385,000 | |
Chicago Transit Authority Sales and Transfer Tax Receipts Revenue, Pension Funding, Series A, 6.899%, 12/01/40 | | | United States | | | | 800,000 | | | | | | | | 1,106,152 | |
City of Austin Electric Utility System Revenue, Travis and Williamson Counties, Refunding, 6.262%, 11/15/32 | | | United States | | | | 6,830,000 | | | | | | | | 8,583,193 | |
vGreenville City School District GO, County of Darke, School Improvement, Refunding, 3.541%, 1/01/51 | | | United States | | | | 8,420,000 | | | | | | | | 8,421,095 | |
vHonolulu City and County Wastewater System Revenue, Second Bond Resolution, Refunding, Junior, 2.585%, 7/01/28 | | | United States | | | | 1,350,000 | | | | | | | | 1,363,729 | |
Industry Public Facilities Authority Tax Allocation Revenue, Transportation District, Industrial Redevelopment Project No. 2, Refunding, Series B, AGMC Insured, 4.294%, 1/01/23 | | | United States | | | | 10,000,000 | | | | | | | | 10,238,400 | |
Kaiser Foundation Hospitals, 3.266%, 11/01/49 | | | United States | | | | 11,270,000 | | | | | | | | 11,506,686 | |
Minnesota State GO, Various Purpose, Refunding, Series F, 4.00%, 10/01/24 | | | United States | | | | 5,760,000 | | | | | | | | 6,379,891 | |
New York State Urban Development Corp. Sales Tax Revenue, Bidding Group 2, Series B, 2.97%, 3/15/34 | | | United States | | | | 22,040,000 | | | | | | | | 22,168,052 | |
New York State GO, Refunding, Series B, 3.20%, 2/15/39 | | | United States | | | | 13,470,000 | | | | | | | | 13,650,902 | |
vOhio State Hospital Facility Revenue, Cleveland Clinic Health System Obligated Group, Refunding, Series G, 3.276%, 1/01/42 | | | United States | | | | 2,265,000 | | | | | | | | 2,327,582 | |
Orlando Health Obligated Group, 3.777%, 10/01/28 | | | United States | | | | 2,810,000 | | | | | | | | 3,041,798 | |
vPennsylvania State Turnpike Commission Turnpike Revenue, Motor License Fund-Enhanced, Subordinate, Refunding, First Series, 3.579%, 12/01/43 | | | United States | | | | 11,275,000 | | | | | | | | 11,395,755 | |
Port Authority of New York and New Jersey Revenue, | | | | | | | | | | | | | | | | |
Consolidated, One Hundred Ninety-First Series, 4.823%, 6/01/45 | | | United States | | | | 4,570,000 | | | | | | | | 5,084,034 | |
Consolidated, Refunding, One Hundred Ninety-Second Series, 4.81%, 10/15/65 | | | United States | | | | 15,000,000 | | | | | | | | 19,634,700 | |
Providence St. Joseph Health Obligated Group, 2.746%, 10/01/26 | | | United States | | | | 8,875,000 | | | | | | | | 9,092,308 | |
RWJ Barnabas Health Inc., 3.477%, 7/01/49 | | | United States | | | | 3,050,000 | | | | | | | | 3,116,240 | |
San Jose RDA Successor Agency Tax Allocation, Senior, Refunding, SeriesA-T, 3.226%, 8/01/27 | | | United States | | | | 6,150,000 | | | | | | | | 6,580,561 | |
vTexas State University System Financing Revenue, | | | | | | | | | | | | | | | | |
Refunding, Serise B, 2.938%, 3/15/33 | | | United States | | | | 2,655,000 | | | | | | | | 2,702,870 | |
Refunding, Serise B, 3.289%, 3/15/40 | | | United States | | | | 2,255,000 | | | | | | | | 2,274,754 | |
University of California Revenue, Limited Project, Refunding, Series J, 4.131%, 5/15/45 | | | United States | | | | 10,750,000 | | | | | | | | 12,045,697 | |
| | | | | | | | | | | | | | | | |
| | | | |
Total Municipal Bonds (Cost $153,820,772) | | | | | | | | | | | | | | | 163,099,399 | |
| | | | | | | | | | | | | | | | |
| | | | |
| | | |
120 | | Annual Report | | franklintempleton.com |
FRANKLIN INVESTORS SECURITIES TRUST
CONSOLIDATED STATEMENT OF INVESTMENTS
Franklin Total Return Fund(continued)
| | | | | | | | | | | | | | | | |
| | | Country | | | Shares/
Units | | | | | | Value | |
| | | | |
Escrows and Litigation Trusts 0.0% | | | | | | | | | | | | | | | | |
a,bMotors Liquidation Co., Escrow Account, cvt. pfd., C | | | United States | | | | 43,500 | | | | | | | $ | — | |
a,bNewPage Corp., Escrow Account | | | United States | | | | 2,500,000 | | | | | | | | — | |
a,b,dRemington Outdoor Co. Inc., Litigation Units | | | United States | | | | 4,897 | | | | | | | | — | |
| | | | | | | | | | | | | | | | |
| | | | |
Total Escrows and Litigation Trusts (Cost $2,307) | | | | | | | | | | | | | | | — | |
| | | | | | | | | | | | | | | | |
| | | | |
Total Investments before Short Term Investments
(Cost $5,184,072,348) | | | | | | | | | | | | | | | 5,239,248,451 | |
| | | | | | | | | | | | | | | | |
| | | | |
| | | | | | Shares | | | | | | | |
| | | | |
Short Term Investments (Cost $373,627,760) 7.4% | | | | | | | | | | | | | | | | |
| | | | |
Money Market Funds 7.4% | | | | | | | | | | | | | | | | |
e,yInstitutional Fiduciary Trust Money Market Portfolio, 1.56% | | | United States | | | | 373,627,760 | | | | | | | | 373,627,760 | |
| | | | | | | | | | | | | | | | |
| | | | |
Total Investments (Cost $5,557,700,108) 111.7% | | | | | | | | | | | | | | | 5,612,876,211 | |
Other Assets, less Liabilities (11.7)% | | | | | | | | | | | | | | | (587,153,055 | ) |
| | | | | | | | | | | | | | | | |
| | | | |
Net Assets 100.0%. | | | | | | | | | | | | | | $ | 5,025,723,156 | |
| | | | | | | | | | | | | | | | |
| | | | |
| | | |
| franklintempleton.com | | Annual Report | | 121 |
FRANKLIN INVESTORS SECURITIES TRUST
CONSOLIDATED STATEMENT OF INVESTMENTS
Franklin Total Return Fund(continued)
†Rounds to less than 0.1% of net assets.
*The principal amount is stated in U.S. dollars unless otherwise indicated.
aNon-income producing.
bFair valued using significant unobservable inputs. See Note 13 regarding fair value measurements.
cThe security is owned by FT Holdings Corporation I, a wholly-owned subsidiary of the Fund. See Note 1(h).
dSee Note 8 regarding restricted securities.
eSee Note 3(f) regarding investments in affiliated management investment companies.
fVariable rate security. The rate shown represents the yield at period end.
gSecurity was purchased pursuant to Rule 144A under the Securities Act of 1933 and may be sold in transactions exempt from registration only to qualified institutional buyers or in a public offering registered under the Securities Act of 1933. At October 31, 2019, the aggregate value of these securities was $1,356,087,519, representing 27.0% of net assets.
hSecurity was purchased pursuant to Regulation S under the Securities Act of 1933, which exempts from registration securities offered and sold outside of the United States. Such a security cannot be sold in the United States without either an effective registration statement filed pursuant to the Securities Act of 1933, or pursuant to an exemption from registration. At October 31, 2019, the aggregate value of these securities was $114,868,136, representing 2.3% of net assets.
iIncome may be received in additional securities and/or cash.
jSee Note 1(g) regarding loan participation notes.
kSee Note 7 regarding defaulted securities.
lPerpetual security with no stated maturity date.
mThe coupon rate shown represents the rate at period end.
nSee Note 1(j) regarding senior floating rate interests.
oA portion or all of the security purchased on a delayed delivery basis. See Note 1(d).
pSee Note 1(k) regarding Marketplace lending.
qThe principal represents the notional amount. See Note 1(e) regarding value recovery instruments.
rPrincipal amount of security is adjusted for inflation. See Note 1(m).
sAdjustable rate security with an interest rate that is not based on a published reference index and spread. The rate is based on the structure of the agreement and current market conditions. The coupon rate shown represents the rate at period end.
tThe bond pays interest and/or principal based upon the issuer’s ability to pay, which may be less than the stated interest rate or principal paydown.
uThe coupon rate shown represents the rate inclusive of any caps or floors, if applicable, in effect at period end.
vSecurity purchased on a when-issued basis. See Note 1(d).
wAdjustable Rate Mortgage-Backed Security (ARM); the rate shown is the effective rate at period end. ARM rates are not based on a published reference rate and spread, but instead pass-through weighted average interest income inclusive of any caps or floors, if applicable, from the underlying mortgage loans in which the majority of mortgages pay interest based on the index shown at their designated reset dates plus a spread, less the applicable servicing and guaranty fee (MBS margin).
xA portion or all of the security purchased on ato-be-announced (TBA) basis. See Note 1(d).
yThe rate shown is the annualizedseven-day effective yield at period end.
| | | | |
| | | |
122 | | Annual Report | | franklintempleton.com |
FRANKLIN INVESTORS SECURITIES TRUST
CONSOLIDATED STATEMENT OF INVESTMENTS
Franklin Total Return Fund(continued)
At October 31, 2019, the Fund had the following futures contracts outstanding. See Note 1(e).
Futures Contracts
| | | | | | | | | | | | | | | | | | | | |
| Description | | | Type | | |
| Number of
Contracts |
| |
| Notional
Amount |
* | |
| Expiration
Date |
| |
| Value/
Unrealized Appreciation (Depreciation) |
|
Interest Rate Contracts | | | | | | | | | | | | | | | | | | | | |
Australian 3 Yr. Bond | | | Long | | | | 2,020 | | | $ | 160,671,425 | | | | 12/16/19 | | | | $ 244,368 | |
Australian 10 Yr. Bond | | | Long | | | | 839 | | | | 84,342,987 | | | | 12/16/19 | | | | (1,021 | ) |
Canadian 10 Yr. Bond | | | Long | | | | 1,002 | | | | 108,107,923 | | | | 12/18/19 | | | | (2,704,335 | ) |
CME Ultra Long Term U.S. Treasury Bond | | | Long | | | | 529 | | | | 100,377,750 | | | | 12/19/19 | | | | (4,695,653 | ) |
Euro-Bund | | | Long | | | | 174 | | | | 33,332,125 | | | | 12/06/19 | | | | (394,634 | ) |
U.S. Treasury 2 Yr. Note | | | Long | | | | 907 | | | | 195,550,617 | | | | 12/31/19 | | | | (430,444 | ) |
U.S. Treasury 5 Yr. Note | | | Long | | | | 2,710 | | | | 323,040,469 | | | | 12/31/19 | | | | (1,968,569 | ) |
U.S. Treasury 10 Yr. Note | | | Long | | | | 240 | | | | 31,271,250 | | | | 12/19/19 | | | | (322,829 | ) |
U.S. Treasury 30 Yr. Bond | | | Long | | | | 1,037 | | | | 167,345,875 | | | | 12/19/19 | | | | (3,801,105 | ) |
Ultra 10 Yr. U.S. Treasury Note | | | Short | | | | 302 | | | | 42,917,031 | | | | 12/19/19 | | | | 419,195 | |
| | | | | | | | | | | | | | | | | | | | |
Total Futures Contracts | | | | | | | | | | | | | | | | | | | $(13,655,027 | ) |
| | | | | | | | | | | | | | | | | | | | |
*As of period end.
At October 31, 2019, the Fund had the following forward exchange contracts outstanding. See Note 1(e).
Forward Exchange Contracts
| | | | | | | | | | | | | | | | | | | | | | | | | | | | |
| Currency | | | Counterparty | a | | | Type | | | | Quantity | | |
| Contract
Amount |
| |
| Settlement
Date |
| |
| Unrealized
Appreciation |
| |
| Unrealized
Depreciation |
|
| |
OTC Forward Exchange Contracts | | | | | | | | | | | | | | | | | | | | | | | | | | | | |
Indonesian Rupiah | | | DBAB | | | | Buy | | | | 139,844,100,000 | | | $ | 9,568,532 | | | | 12/16/19 | | | $ | 311,755 | | | $ | — | |
Indonesian Rupiah | | | JPHQ | | | | Buy | | | | 6,900,000,000 | | | | 471,086 | | | | 12/16/19 | | | | 16,414 | | | | — | |
Australian Dollar | | | JPHQ | | | | Sell | | | | 34,750,000 | | | | 23,448,779 | | | | 1/09/20 | | | | — | | | | (553,843 | ) |
Japanese Yen | | | JPHQ | | | | Sell | | | | 1,400,000,000 | | | | 13,147,638 | | | | 1/09/20 | | | | 117,866 | | | | — | |
Australian Dollar | | | JPHQ | | | | Sell | | | | 11,200,000 | | | | 7,635,600 | | | | 1/28/20 | | | | — | | | | (103,434 | ) |
Japanese Yen | | | JPHQ | | | | Buy | | | | 7,348,000,000 | | | | 69,580,066 | | | | 1/29/20 | | | | — | | | | (1,113,400 | ) |
Canadian Dollar | | | JPHQ | | | | Sell | | | | 15,200,000 | | | | 11,452,941 | | | | 1/30/20 | | | | — | | | | (98,103 | ) |
Danish Krone | | | JPHQ | | | | Sell | | | | 226,372,668 | | | | 34,120,578 | | | | 1/30/20 | | | | 83,408 | | | | — | |
Euro | | | JPHQ | | | | Sell | | | | 85,444,180 | | | | 96,437,658 | | | | 1/30/20 | | | | 529,343 | | | | — | |
Mexican Peso | | | JPHQ | | | | Buy | | | | 206,500,000 | | | | 10,233,665 | | | | 1/30/20 | | | | 350,302 | | | | — | |
Norwegian Krone | | | JPHQ | | | | Buy | | | | 274,700,000 | | | | 30,425,270 | | | | 1/30/20 | | | | — | | | | (539,687 | ) |
Chinese Yuan Renminbi | | | JPHQ | | | | Sell | | | | 320,900,000 | | | | 45,021,112 | | | | 2/24/20 | | | | — | | | | (367,570 | ) |
Japanese Yen | | | JPHQ | | | | Buy | | | | 2,510,000,000 | | | | 23,616,083 | | | | 3/13/20 | | | | — | | | | (168,044 | ) |
Canadian Dollar | | | JPHQ | | | | Sell | | | | 24,180,000 | | | | 18,287,426 | | | | 3/16/20 | | | | — | | | | (87,640 | ) |
Canadian Dollar | | | JPHQ | | | | Sell | | | | 26,000,000 | | | | 19,881,324 | | | | 3/16/20 | | | | 123,189 | | | | — | |
Euro | | | DBAB | | | | Sell | | | | 2,178,384 | | | | 2,442,078 | | | | 3/16/20 | | | | — | | | | (9,824 | ) |
Euro | | | JPHQ | | | | Sell | | | | 68,474,138 | | | | 76,597,003 | | | | 3/16/20 | | | | — | | | | (474,741 | ) |
Norwegian Krone | | | JPHQ | | | | Buy | | | | 233,800,000 | | | | 26,108,319 | | | | 3/16/20 | | | | — | | | | (675,332 | ) |
Swedish Krona | | | JPHQ | | | | Buy | | | | 168,000,000 | | | | 17,140,321 | | | | 3/16/20 | | | | 383,457 | | | | — | |
Swedish Krona | | | JPHQ | | | | Sell | | | | 168,000,000 | | | | 17,663,015 | | | | 3/16/20 | | | | 139,236 | | | | — | |
South Korean Won | | | JPHQ | | | | Sell | | | | 14,000,000,000 | | | | 11,767,672 | | | | 3/25/20 | | | | — | | | | (240,779 | ) |
| | | | |
| | | |
| franklintempleton.com | | Annual Report | | 123 |
FRANKLIN INVESTORS SECURITIES TRUST
CONSOLIDATED STATEMENT OF INVESTMENTS
Franklin Total Return Fund(continued)
Forward Exchange Contracts(continued)
| | | | | | | | | | | | | | | | | | | | | | | | | | |
| Currency | | | Counterparty | a | | Type | | | Quantity | | |
| Contract
Amount |
| |
| Settlement
Date |
| |
| Unrealized
Appreciation |
| |
| Unrealized
Depreciation |
|
| |
OTC Forward Exchange Contracts(continued) | | | | | | | | | | | | | | | | | |
Turkish Lira | | | JPHQ | | | Buy | | | 41,600,000 | | | $ | 6,596,369 | | | | 4/15/20 | | | | $ 368,891 | | | | $ — | |
| | | | | | | | | | | | | | | | | | | | | | |
| | | | | | |
Total Forward Exchange Contracts | | | | | | | | | | | | | | | | | | $2,423,861 | | | | $(4,432,397 | ) |
| | | | | | | | | | | | | | | | | | | | | | |
| | | | | |
Net unrealized appreciation (depreciation) | | | | | | | | | | | | | | | | | | | $(2,008,536 | ) |
| | | | | | | | | | | | | | | | | | | | | | | | | | |
aMay be comprised of multiple contracts with the same counterparty, currency and settlement date.
At October 31, 2019, the Fund had the following credit default swap contracts outstanding. See Note 1(e).
Credit Default Swap Contracts
| | | | | | | | | | | | | | | | | | | | | | | | | | | | | | | | | | | | |
| Description | |
| Periodic
Payment Rate
Received
(Paid) |
| |
| Payment
Frequency |
| |
| Counter-
party |
| |
| Maturity
Date |
| |
| Notional
Amount |
a | | | Value | | |
| Unamortized
Upfront
Payments
(Receipts) |
| |
| Unrealized
Appreciation
(Depreciation) |
| | | Rating | b |
| |
| | | | | | | | |
Centrally Cleared Swap Contracts | | | | | | | | | | | | | | | | | | | | | | | | | | | | | | | | | |
Contracts to Buy Protectionc | | | | | | | | | | | | | | | | | | | | | | | | | | | | | |
Traded Index | | | | | | | | | | | | | | | | | | | | | | | | | | | | | | | | | | | | |
CDX.NA.HY.32 | | | (5.00)% | | | | Quarterly | | | | | | | | 6/20/24 | | | $ | 14,850,000 | | | $ | (1,024,652 | ) | | $ | (1,067,909 | ) | | | $ 43,257 | | | | | |
| | | | | | | | | | | | | | | | | | | | | | | | | | | | |
OTC Swap Contracts | | | | | | | | | | | | | | | | | | | | | | | | | | | | | | | | | | | | |
Contracts to Buy Protectionc | | | | | | | | | | | | | | | | | | | | | | | | | | | | | | | | | |
Single Name | | | | | | | | | | | | | | | | | | | | | | | | | | | | | | | | | | | | |
Ally Financial Inc. | | | (5.00)% | | | | Quarterly | | | | JPHQ | | | | 12/20/24 | | | $ | 20,750,000 | | | $ | (4,269,390 | ) | | $ | (3,986,188 | ) | | | $ (283,202) | | | | | |
Avon Products Inc. | | | (5.00)% | | | | Quarterly | | | | CITI | | | | 3/20/23 | | | | 8,800,000 | | | | (1,008,730 | ) | | | (866,895 | ) | | | (141,835) | | | | | |
Government of Italy | | | (1.00)% | | | | Quarterly | | | | BZWS | | | | 6/20/23 | | | | 10,600,000 | | | | (163,694 | ) | | | 83,978 | | | | (247,672) | | | | | |
Government of Turkey | | | (1.00)% | | | | Quarterly | | | | BZWS | | | | 12/20/19 | | | | 3,466,666 | | | | (5,980 | ) | | | 22,178 | | | | (28,158) | | | | | |
Nabors Industries Inc. | | | (1.00)% | | | | Quarterly | | | | CITI | | | | 12/20/21 | | | | 10,225,000 | | | | 1,224,500 | | | | 318,661 | | | | 905,839 | | | | | |
Navient Corp. | | | (5.00)% | | | | Quarterly | | | | JPHQ | | | | 3/20/20 | | | | 5,000,000 | | | | (120,049 | ) | | | (70,462 | ) | | | (49,587) | | | | | |
Contracts to Sell Protectionc,d | | | | | | | | | | | | | | | | | | | | | | | | | | | | | |
Single Name | | | | | | | | | | | | | | | | | | | | | | | | | | | | | | | | | | | | |
The Goldman Sachs | | | | | | | | | | | | | | | | | | | | | | | | | | | | | | | | | | | | |
Group Inc. | | | 1.00% | | | | Quarterly | | | | JPHQ | | | | 12/20/24 | | | | 20,750,000 | | | | 415,902 | | | | 367,363 | | | | 48,539 | | | | BBB+ | |
Government of Argentina | | | 5.00% | | | | Quarterly | | | | CITI | | | | 12/20/21 | | | | 16,050,000 | | | | (9,533,450 | ) | | | (9,069,947 | ) | | | (463,503) | | | | CCC- | |
Government of Indonesia | | | 1.00% | | | | Quarterly | | | | CITI | | | | 12/20/24 | | | | 17,770,000 | | | | 224,086 | | | | 119,527 | | | | 104,559 | | | | NR | |
Government of Italy | | | 1.00% | | | | Quarterly | | | | BZWS | | | | 6/20/23 | | | | 10,600,000 | | | | 53,809 | | | | (368,253 | ) | | | 422,062 | | | | NR | |
Government of Russia | | | 1.00% | | | | Quarterly | | | | CITI | | | | 12/20/24 | | | | 8,600,000 | | | | 109,867 | | | | 87,629 | | | | 22,238 | | | | BBB- | |
Government of Spain | | | 1.00% | | | | Quarterly | | | | CITI | | | | 12/20/24 | | | | 12,300,000 | | | | 404,366 | | | | 359,788 | | | | 44,578 | | | | NR | |
Morgan Stanley | | | 1.00% | | | | Quarterly | | | | JPHQ | | | | 12/20/24 | | | | 20,750,000 | | | | 451,011 | | | | 403,201 | | | | 47,810 | | | | BBB+ | |
Nabors Industries Inc. | | | 1.00% | | | | Quarterly | | | | CITI | | | | 12/20/23 | | | | 10,225,000 | | | | (2,572,565 | ) | | | (1,267,098 | ) | | | (1,305,467) | | | | BB- | |
Traded Index | | | | | | | | | | | | | | | | | | | | | | | | | | | | | | | | | | | | |
eBNP Paribas Bespoke Bordeaux Index, Mezzanine Tranche7-10% | | | 2.10% | | | | Quarterly | | | | BNDP | | | | 6/20/20 | | | | 5,150,000 | | | | 61,287 | | | | — | | | | 61,287 | | |
| Non-
Investment
Grade |
|
| | | | |
| | | |
124 | | Annual Report | | franklintempleton.com |
FRANKLIN INVESTORS SECURITIES TRUST
CONSOLIDATED STATEMENT OF INVESTMENTS
Franklin Total Return Fund(continued)
Credit Default Swap Contracts(continued)
| | | | | | | | | | | | | | | | | | | | | | | | | | | | | | | | | | | | |
| Description | |
| Periodic
Payment Rate Received
(Paid) |
| |
| Payment
Frequency |
| |
| Counter-
party |
| |
| Maturity
Date |
| |
| Notional
Amount |
a | | | Value | | |
| Unamortized
Upfront
Payments
(Receipts) |
| |
| Unrealized
Appreciation
(Depreciation) |
| | | Rating | b |
| |
| | | | | | | | |
OTC Swap Contracts(continued) | | | | | | | | | | | | | | | | | | | | | | | | | | | | | | | | | |
Contracts to Sell Protectionc,d(continued) | | | | | | | | | | | | | | | | | | | | | | | | | | | | | |
Traded Index(continued) | | | | | | | | | | | | | | | | | | | | | | | | | | | | | |
eBNP Paribas Bespoke Rodez Index, Mezzanine Tranche5-7% | | | 2.00% | | | | Quarterly | | | | BNDP | | | | 12/20/20 | | | $ | 5,300,000 | | | $ | 43,964 | | | $ | — | | | | $ 43,964 | | |
| Non-
Investment
Grade |
|
eBNP Paribas Bespoke Rodez2 Index, Mezzanine Tranche5-7% | | | 3.20% | | | | Quarterly | | | | BNDP | | | | 12/20/20 | | | | 2,700,000 | | | | 65,131 | | | | — | | | | 65,131 | | |
| Non-
Investment
Grade |
|
eCitibank Bespoke Cambridge Index, Equity Tranche0-3% | | | 0.00% | | | | Quarterly | | | | CITI | | | | 12/20/19 | | | | 8,476,000 | | | | (756,942 | ) | | | (95,041 | ) | | | (661,901 | ) | |
| Non-
Investment
Grade |
|
eCitibank Bespoke Lima Index, Mezzanine Tranche5-7% | | | 2.13% | | | | Quarterly | | | | CITI | | | | 12/20/19 | | | | 10,500,000 | | | | 246 | | | | — | | | | 246 | | |
| Non-
Investment
Grade |
|
eCitibank Bespoke Palma Index, Mezzanine Tranche5-7% | | | 2.30% | | | | Quarterly | | | | CITI | | | | 6/20/21 | | | | 5,900,000 | | | | 83,738 | | | | — | | | | 83,738 | | |
| Non-
Investment
Grade |
|
eCitibank Bespoke Phoenix Index, Mezzanine Tranche5-7% | | | 2.90% | | | | Quarterly | | | | CITI | | | | 12/20/21 | | | | 7,800,000 | | | | 213,154 | | | | — | | | | 213,154 | | |
| Non-
Investment
Grade |
|
eCitibank Bespoke Singapore Index, Equity Tranche0-3% | | | 0.00% | | | | Quarterly | | | | CITI | | | | 6/20/20 | | | | 11,300,000 | | | | (1,196,927 | ) | | | (1,006,514 | ) | | | (190,413 | ) | |
| Non-
Investment
Grade |
|
eCitibank Bespoke Sydney Index, Equity Tranche0-3% | | | 0.00% | | | | Quarterly | | | | CITI | | | | 6/20/20 | | | | 3,595,109 | | | | (458,123 | ) | | | (365,577 | ) | | | (92,546 | ) | |
| Non-
Investment
Grade |
|
eCitibank Bespoke Verona Index, Equity Tranche0-3% | | | 0.00% | | �� | | Quarterly | | | | CITI | | | | 12/20/19 | | | | 6,112,500 | | | | (84,526 | ) | | | (84,132 | ) | | | (394 | ) | |
| Non-
Investment
Grade |
|
| | | | |
| | | |
| franklintempleton.com | | Annual Report | | 125 |
FRANKLIN INVESTORS SECURITIES TRUST
CONSOLIDATED STATEMENT OF INVESTMENTS
Franklin Total Return Fund(continued)
Credit Default Swap Contracts(continued)
| | | | | | | | | | | | | | | | | | | | | | | | | | | | | | | | | | |
| Description | |
| Periodic
Payment Rate Received (Paid) |
| | Payment Frequency | |
| Counter-
party |
| |
| Maturity
Date |
| |
| Notional
Amount |
a | | | Value | | |
| Unamortized
Upfront Payments (Receipts) |
| |
| Unrealized
Appreciation (Depreciation) |
| | | Rating | b |
| |
OTC Swap Contracts(continued) | | | | | | | | | | | | | | | | | | | | | | | | | |
Contracts to Sell Protectionc,d(continued) | | | | | | | | | | | | | | | | | | | | | | | | | |
Traded Index(continued) | | | | | | | | | | | | | | | | | | | | | | | | | | | | | | | | | | |
eCitibank Bespoke Verona Index, Mezzanine Tranche7-15% | | | 0.40% | | | Quarterly | | | CITI | | | | 12/20/19 | | | $ | 21,000,000 | | | $ | 14,925 | | | $ | — | | | $ | 14,925 | | |
| Non-
Investment
Grade |
|
MCDX.NA.31 | | | 1.00% | | | Quarterly | | | CITI | | | | 12/20/23 | | | | 2,325,000 | | | | 41,235 | | | | 19,486 | | | | 21,749 | | |
| Investment
Grade |
|
eMorgan Stanley Bespoke Pecan Index, Mezzanine Tranche5-10% | | | 3.98% | | | Quarterly | | | MSCO | | | | 12/20/21 | | | | 8,300,000 | | | | 208,915 | | | | — | | | | 208,915 | | |
| Non-
Investment
Grade |
|
eMorgan Stanley Bespoke Pecan Index, Mezzanine Tranche5-10% | | | 4.10% | | | Quarterly | | | MSCO | | | | 12/20/21 | | | | 8,300,000 | | | | 246,781 | | | | — | | | | 246,781 | | |
| Non-
Investment
Grade |
|
Total OTC Swap Contracts | | | | | | | | | | | $ | (16,307,459 | ) | | $ | (15,398,296 | ) | | $ | (909,163 | ) | | | | |
Total Credit Default Swap Contracts | | | | | | | | | | | $ | (17,332,111 | ) | | $ | (16,466,205 | ) | | $ | (865,906 | ) | | | | |
aIn U.S. dollars unless otherwise indicated. For contracts to sell protection, the notional amount is equal to the maximum potential amount of the future payments and no recourse provisions have been entered into in association with the contracts.
bBased on Standard and Poor’s (S&P) Rating for single name swaps and internal ratings for index swaps. Internal ratings based on mapping into equivalent ratings from external vendors.
cPerformance triggers for settlement of contract include default, bankruptcy or restructuring for single name swaps, and failure to pay or bankruptcy of the underlying securities for traded index swaps.
dThe Fund enters contracts to sell protection to create a long credit position.
eRepresents a custom index comprised of a basket of underlying instruments.
At October 31, 2019, the Fund had the following cross-currency swap contracts outstanding. See Note 1(e).
Cross-Currency Swap Contracts
| | | | | | | | | | | | | | | | | | | | | | | | |
| Description | | Payment Frequency | | | Coun- terparty | | | Maturity Date | | | Notional
Amount | | | | | | Value/ Unrealized Appreciation (Depreciation) | |
OTC Swap Contracts | | | | | | | | | | | | | | | | | | | | | | | | |
Receive Floating3-month USD LIBOR + 2.87% | | | Quarterly | | | | | | | | | | | | 3,137,400 | | | | USD | | | | | |
Pay Fixed 2.50% | | | Annual | | | | CITI | | | | 5/04/21 | | | | 2,700,000 | | | | EUR | | | | $ 122,926 | |
Receive Floating3-month USD LIBOR + 1.334% | | | Quarterly | | | | | | | | | | | | 8,176,000 | | | | USD | | | | | |
Pay Floating3-month EUR LIBOR + 1.12% | | | Quarterly | | | | CITI | | | | 7/10/21 | | | | 7,300,000 | | | | EUR | | | | 50,582 | |
Receive Floating3-month USD LIBOR + 1.305% | | | Quarterly | | | | | | | | | | | | 11,512,800 | | | | USD | | | | | |
Pay Floating3-month EUR LIBOR + 1.11% | | | Quarterly | | | | JPHQ | | | | 8/20/21 | | | | 10,400,000 | | | | EUR | | | | (24,068 | ) |
Receive Floating3-month USD LIBOR + 1.23% | | | Quarterly | | | | | | | | | | | | 2,830,500 | | | | USD | | | | | |
Pay Floating3-month EUR LIBOR + 1.07% | | | Quarterly | | | | CITI | | | | 9/17/21 | | | | 2,550,000 | | | | EUR | | | | (4,730 | ) |
| | | | |
| | | |
126 | | Annual Report | | franklintempleton.com |
FRANKLIN INVESTORS SECURITIES TRUST
CONSOLIDATED STATEMENT OF INVESTMENTS
Franklin Total Return Fund(continued)
Cross-Currency Swap Contracts(continued)
| | | | | | | | | | | | | | | | | | | | | | | | |
| Description | | Payment Frequency | | | Coun- terparty | | | Maturity Date | | | Notional Amount | | | | | | Value/ Unrealized Appreciation (Depreciation) | |
OTC Swap Contracts(continued) | | | | | | | | | | | | | | | | | | | | | | | | |
Receive Floating3-month USD LIBOR + 1.87% | | | Quarterly | | | | | | | | | | | | 6,160,000 | | | | USD | | | | | |
Pay Floating3-month EUR LIBOR + 1.7% | | | Quarterly | | | | CITI | | | | 10/15/21 | | | | 5,600,000 | | | | EUR | | | $ | (81,741 | ) |
Receive Floating3-month USD LIBOR + 1.25% | | | Quarterly | | | | | | | | | | | | 28,471,500 | | | | USD | | | | | |
Pay Floating3-month EUR LIBOR + 1.10% | | | Quarterly | | | | CITI | | | | 10/30/21 | | | | 25,650,000 | | | | EUR | | | | (137,610 | ) |
| | | | | | | | | | | | | | | | | | | | | | | | |
Total Cross Currency Swap Contracts | | | | | | | | | | | | | | | | | | | | | | $ | (74,641 | ) |
| | | | | | | | | | | | | | | | | | | | | | | | |
At October 31, 2019, the Fund had the following interest rate swap contracts outstanding. See Note 1(e).
Interest Rate Swap Contracts
| | | | | | | | | | | | | | | | | | | | |
| Description | |
| Payment
Frequency |
| |
| Maturity
Date |
| |
| Notional
Amount |
* | | | | | |
| Value/
Unrealized Appreciation (Depreciation) |
|
Centrally Cleared Swap Contracts | | | | | | | | | | | | | | | | | | | | |
Receive Fixed 2.773% | | | Quarterly | | | | | | | | | | | | | | | | | |
Pay Floating3-month CNY CNRR | | | Quarterly | | | | 8/23/24 | | | | 194,000,000 | | | | CNY | | | | $ (411,701 | ) |
Receive Fixed 2.765% | | | Quarterly | | | | | | | | | | | | | | | | | |
Pay Floating3-month CNY CNRR | | | Quarterly | | | | 8/26/24 | | | | 156,000,000 | | | | CNY | | | | (338,695 | ) |
Receive Fixed 2.79% | | | Quarterly | | | | | | | | | | | | | | | | | |
Pay Floating3-month CNY CNRR | | | Quarterly | | | | 8/30/24 | | | | 244,300,000 | | | | CNY | | | | (502,748 | ) |
| | | | | | | | | | | | | | | | | | | | |
Total Interest Rate Swap Contracts | | | | | | | | | | | | | | | | | | | $(1,253,144 | ) |
| | | | | | | | | | | | | | | | | | | | |
*In U.S. dollars unless otherwise indicated. | |
At October 31, 2019, the Fund had the following inflation index swap contracts outstanding. See Note 1(e).
Inflation Index Swap Contracts
| | | | | | | | | | | | | | | | | | |
| Description | | Payment Frequency | | Counter- party | | | Maturity Date | | | Notional Amount | | | Value/ Unrealized Appreciation (Depreciation) | |
Centrally Cleared Swap Contracts | | | | | | | | | | | | | | | | | | |
Receive variable change inUSA-CPI-U | | At maturity | | | | | | | | | | | | | | | | |
Pay Fixed 1.96% | | At maturity | | | | | | | 8/31/24 | | | $ | 24,600,000 | | | $ | (305,618 | ) |
Receive variable change inUSA-CPI-U | | At maturity | | | | | | | | | | | | | | | | |
Pay Fixed 1.719% | | At maturity | | | | | | | 8/14/26 | | | | 23,000,000 | | | | (111,041 | ) |
| | | | | | | | | | | | | | | | | | |
Total Centrally Cleared Swap Contracts | | | | | | | | | | | | | | | | $ | (416,659 | ) |
| | | | | | | | | | | | | | | | | | |
OTC Swap Contracts | | | | | | | | | | | | | | | | | | |
Receive variable change inUSA-CPI-U | | At maturity | | | | | | | | | | | | | | | | |
Pay Fixed 1.782% | | At maturity | | | JPHQ | | | | 5/27/24 | | | $ | 35,700,000 | | | $ | 181,988 | |
| | | | | | | | | | | | | | | | | | |
Total Inflation Index Swap Contracts | | | | | | | | | | | | | | | | $ | (234,671 | ) |
| | | | | | | | | | | | | | | | | | |
| | | | |
| | | |
| franklintempleton.com | | Annual Report | | 127 |
FRANKLIN INVESTORS SECURITIES TRUST
CONSOLIDATED STATEMENT OF INVESTMENTS
Franklin Total Return Fund(continued)
At October 31, 2019, the Fund had the following total return swap contracts outstanding. See Note 1(e).
Total Return Swap Contracts
| | | | | | | | | | | | | | | | | | | | | | | | | | |
| Underlying Instruments | | Financing Rate | |
| Payment
Frequency |
| |
| Counter-
party |
| |
| Maturity
Date |
| |
| Notional
Value |
* | | | | | |
| Value/
Unrealized Appreciation (Depreciation) |
|
OTC Swap Contracts | | | | | | | | | | | | | | | | | | | | | | | | | | |
Longa | | | | | | | | | | | | | | | | | | | | | | | | | | |
Euribor 3 Month | | 3-month EUR LIBOR | | | Quarterly | | | | BNDP | | | | 12/20/19 | | | | 20,000,000 | | | | EUR | | | | $ (36,806 | ) |
Euribor 3 Month | | 3-month EUR LIBOR | | | Quarterly | | | | CITI | | | | 12/20/19 | | | | 37,350,000 | | | | EUR | | | | (143,472 | ) |
Markit iBoxx USD Liquid Leveraged Loan Index | | 3-month USD LIBOR | | | Quarterly | | | | JPHQ | | | | 12/20/19 | | | | 8,400,000 | | | | | | | | 68,247 | |
Markit iBoxx USD Liquid Leveraged Loan Index | | 3-month USD LIBOR | | | Quarterly | | | | MSCO | | | | 12/20/19 | | | | 1,600,000 | | | | | | | | 22,773 | |
Markit iBoxx USD Liquid Leveraged Loan Index | | 3-month USD LIBOR | | | Quarterly | | | | FBCO | | | | 3/20/20 | | | | 10,400,000 | | | | | | | | 127,826 | |
Markit iBoxx USD Liquid Leveraged Loan Index | | 3-month USD LIBOR | | | Quarterly | | | | GSCO | | | | 3/20/20 | | | | 16,700,000 | | | | | | | | 275,113 | |
Markit iBoxx USD Liquid Leveraged Loan Index | | 3-month USD LIBOR | | | Quarterly | | | | BZWS | | | | 6/20/20 | | | | 29,200,000 | | | | | | | | (310,573 | ) |
Shortb | | | | | | | | | | | | | | | | | | | | | | | | | | |
iBoxx USD Liquid Investment Grade Index | | 3-month USD LIBOR | | | Quarterly | | | | BNDP | | | | 12/20/19 | | | | 12,800,000 | | | | | | | | (5,525 | ) |
iBoxx USD Liquid Investment Grade Index | | 3-month USD LIBOR | | | Quarterly | | | | GSCO | | | | 12/20/19 | | | | 10,700,000 | | | | | | | | 15,338 | |
| | | | | | | | | | | | | | | | | | | | | | | | | | |
Total Total Return Swap Contracts | | | | | | | | | | | | | | | | | | | | | | | | | $ 12,921 | |
| | | | | | | | | | | | | | | | | | | | | | | | | | |
*In U.S. dollars unless otherwise indicated.
aThe Fund receives the total return on the underlying instrument and pays a variable financing rate.
bThe Fund receives the variable financing rate and pays the total return on the underlying instrument.
See Note 9 regarding other derivative information.
See Abbreviations on page 165.
| | | | |
| | | |
128 | | Annual Report | The accompanying notes are an integral part of these financial statements. | | franklintempleton.com |
FRANKLIN INVESTORS SECURITIES TRUST
FINANCIAL STATEMENTS
Statements of Assets and Liabilities
October 31, 2019
| | | | | | | | | | | | | | | | |
| | | Franklin Adjustable U.S. Government Securities Fund | | | Franklin Floating Rate Daily Access Fund | | | Franklin Low Duration Total Return Fund | | | Franklin Total Return
Funda | |
Assets: | | | | | | | | | | | | | | | | |
Investments in securities: | | | | | | | | | | | | | | | | |
Cost - Unaffiliated issuers | | | $651,910,074 | | | $ | 2,082,947,346 | | | $ | 2,916,100,481 | | | $ | 4,786,781,373 | |
Cost - Controlled affiliates (Note 3f and 10) | | | — | | | | — | | | | — | | | | 382,177,099 | |
Cost -Non-controlled affiliates (Note 3f and 10) | | | 35,052,748 | | | | 302,389,883 | | | | 131,351,335 | | | | 388,741,636 | |
Cost - Unaffiliated repurchase agreements | | | 9,446,232 | | | | — | | | | — | | | | — | |
| | | | |
Value - Unaffiliated issuers | | | $651,600,061 | | | $ | 1,997,251,014 | | | $ | 2,899,567,869 | | | $ | 4,833,743,990 | |
Value - Controlled affiliates (Note 3f and 10) | | | — | | | | — | | | | — | | | | 392,691,666 | |
Value -Non-controlled affiliates (Note 3f and 10) | | | 35,052,748 | | | | 224,214,459 | | | | 127,800,614 | | | | 386,440,555 | |
Value - Unaffiliated repurchase agreements | | | 9,446,232 | | | | — | | | | — | | | | — | |
Cash | | | — | | | | 8,618,519 | | | | 9,964,534 | | | | 7,390,560 | |
Restricted cash for OTC derivative contracts (Note 1f) | | | — | | | | — | | | | 260,000 | | | | 330,000 | |
Foreign currency, at value (cost $—, $—, $63,506,054 and $23,500,044, respectively) | | | — | | | | — | | | | 63,505,559 | | | | 23,517,577 | |
Receivables: | | | | | | | | | | | | | | | | |
Investment securities sold | | | 3,076,109 | | | | 28,714,001 | | | | 10,173,153 | | | | 39,532,325 | |
Capital shares sold | | | 569,407 | | | | 1,159,728 | | | | 10,379,186 | | | | 8,012,813 | |
Dividends and interest | | | 2,590,450 | | | | 9,849,411 | | | | 11,841,342 | | | | 23,715,684 | |
Deposits with brokers for: | | | | | | | | | | | | | | | | |
OTC derivative contracts | | | — | | | | — | | | | 8,480,000 | | | | 19,120,000 | |
TBA transactions | | | — | | | | — | | | | — | | | | 1,538,000 | |
Futures contracts | | | — | | | | — | | | | 2,825,145 | | | | 12,837,492 | |
Centrally cleared swap contracts | | | — | | | | 663,851 | | | | 2,823,787 | | | | 2,089,759 | |
Variation margin on futures contracts | | | — | | | | — | | | | 196,489 | | | | 5,775,722 | |
Variation margin on centrally cleared swap contracts | | | — | | | | 10,753 | | | | 117,441 | | | | 210,400 | |
OTC swap contracts (upfront payments $—, $—, $956,023 and $2,181,057) | | | — | | | | — | | | | 808,826 | | | | 1,781,811 | |
Unrealized appreciation on OTC forward exchange contracts | | | — | | | | — | | | | 1,075,028 | | | | 2,423,861 | |
Unrealized appreciation on OTC swap contracts | | | — | | | | — | | | | 1,440,613 | | | | 3,420,308 | |
FT Subsidiary deferred tax benefit (Note 1h) | | | — | | | | — | | | | — | | | | 101,634 | |
Other assets | | | 252 | | | | 1,034 | | | | 2,450 | | | | 6,557 | |
| | | | |
Total assets | | | 702,335,259 | | | | 2,270,482,770 | | | | 3,151,262,036 | | | | 5,764,680,714 | |
| | | | |
Liabilities: | | | | | | | | | | | | | | | | |
Payables: | | | | | | | | | | | | | | | | |
Investment securities purchased | | | — | | | | 36,437,646 | | | | 106,232,883 | | | | 701,588,214 | |
Capital shares redeemed | | | 1,046,894 | | | | 7,610,812 | | | | 6,408,610 | | | | 6,917,631 | |
Management fees | | | 287,682 | | | | 967,252 | | | | 444,021 | | | | 1,763,706 | |
Distribution fees | | | 137,915 | | | | 394,725 | | | | 438,951 | | | | 817,346 | |
Transfer agent fees | | | 136,500 | | | | 599,982 | | | | 454,790 | | | | 602,902 | |
Distributions to shareholders | | | 101,283 | | | | 1,932,006 | | | | 1,084,910 | | | | 677,389 | |
Deposits from brokers for: | | | | | | | | | | | | | | | | |
OTC derivative contracts | | | — | | | | — | | | | 260,000 | | | | 330,000 | |
OTC swap contracts (upfront receipts $—, $—, $10,107,531 and $22,603,046) | | | — | | | | — | | | | 8,110,471 | | | | 17,180,107 | |
Unrealized depreciation on OTC forward exchange contracts | | | — | | | | — | | | | 1,435,330 | | | | 4,432,397 | |
Unrealized depreciation on OTC swap contracts | | | — | | | | — | | | | 1,983,805 | | | | 4,209,203 | |
| | | | |
| | | |
| franklintempleton.com | | The accompanying notes are an integral part of these financial statements. | Annual Report | | 129 |
FRANKLIN INVESTORS SECURITIES TRUST
FINANCIAL STATEMENTS
Statements of Assets and Liabilities(continued)
October 31, 2019
| | | | | | | | | | | | | | | | |
| | | Franklin Adjustable U.S. Government Securities Fund | | | Franklin Floating Rate Daily Access Fund | | | Franklin Low Duration Total Return Fund | | | Franklin Total Return Funda | |
| | | | |
Deferred tax | | $ | — | | | $ | — | | | $ | — | | | $ | 2,835 | |
Accrued expenses and other liabilities | | | 141,029 | | | | 213,634 | | | | 372,367 | | | | 435,828 | |
| | | | |
Total liabilities | | | 1,851,303 | | | | 48,156,057 | | | | 127,226,138 | | | | 738,957,558 | |
| | | | |
Net assets, at value | | $ | 700,483,956 | | | $ | 2,222,326,713 | | | $ | 3,024,035,898 | | | $ | 5,025,723,156 | |
| | | | |
Net assets consist of: | | | | | | | | | | | | | | | | |
Paid-in capital | | $ | 828,740,166 | | | $ | 2,650,109,183 | | | $ | 3,155,271,176 | | | $ | 5,075,873,079 | |
Total distributable earnings (loss) | | | (128,256,210 | ) | | | (427,782,470 | ) | | | (131,235,278 | ) | | | (50,149,923 | ) |
| | | | |
Net assets, at value | | $ | 700,483,956 | | | $ | 2,222,326,713 | | | $ | 3,024,035,898 | | | $ | 5,025,723,156 | |
| | | | |
Class A: | | | | | | | | | | | | | | | | |
Net assets, at value | | $ | 393,735,642 | | | $ | 1,049,358,722 | | | $ | 1,631,122,894 | | | $ | 3,422,746,926 | |
| | | | |
Shares outstanding | | | 49,088,208 | | | | 128,312,702 | | | | 169,083,814 | | | | 345,070,333 | |
| | | | |
Net asset value per shareb | | | $8.02 | | | | $8.18 | | | | $9.65 | | | | $9.92 | |
| | | | |
Maximum offering price per share (net asset value per share ÷ 97.75%, 97.75%, 97.75% and 96.25%, respectively) | | | $8.20 | | | | $8.37 | | | | $9.87 | | | | $10.31 | |
| | | | |
Class A1: | | | | | | | | | | | | | | | | |
Net assets, at value | | $ | 86,471,463 | | | | | | | | | | | | | |
| | | | | | | | | | | | | | | | |
Shares outstanding | | | 10,783,541 | | | | | | | | | | | | | |
| | | | | | | | | | | | | | | | |
Net asset value per shareb | | | $8.02 | | | | | | | | | | | | | |
| | | | | | | | | | | | | | | | |
Maximum offering price per share (net asset value per share ÷ 97.75%) | | | $8.20 | | | | | | | | | | | | | |
| | | | | | | | | | | | | | | | |
Class C: | | | | | | | | | | | | | | | | |
Net assets, at value | | $ | 84,684,691 | | | $ | 296,133,765 | | | $ | 135,372,403 | | | $ | 236,837,930 | |
| | | | |
Shares outstanding | | | 10,565,088 | | | | 36,204,175 | | | | 14,091,443 | | | | 24,052,695 | |
| | | | |
Net asset value and maximum offering price per shareb | | | $8.02 | | | | $8.18 | | | | $9.61 | | | | $9.85 | |
| | | | |
Class R: | | | | | | | | | | | | | | | | |
Net assets, at value | | | | | | | | | | $ | 18,304 | | | $ | 21,223,216 | |
| | | | | | | | | | | | |
Shares outstanding | | | | | | | | | | | 1,897 | | | | 2,148,644 | |
| | | | | | | | | | | | |
Net asset value and maximum offering price per share | | | | | | | | | | | $9.65 | | | | $9.88 | |
| | | | | | | | | | | | |
Class R6: | | | | | | | | | | | | | | | | |
Net assets, at value | | $ | 31,953,034 | | | $ | 18,763,620 | | | $ | 1,003,208,195 | | | $ | 481,398,619 | |
| | | | |
Shares outstanding | | | 3,976,783 | | | | 2,289,985 | | | | 103,351,645 | | | | 48,200,781 | |
| | | | |
Net asset value and maximum offering price per share | | $ | 8.03 | | | $ | 8.19 | | | $ | 9.71 | | | $ | 9.99 | |
| | | | |
Advisor Class: | | | | | | | | | | | | | | | | |
Net assets, at value | | $ | 103,639,126 | | | $ | 858,070,606 | | | $ | 254,314,102 | | | $ | 863,516,465 | |
| | | | |
Shares outstanding | | | 12,907,315 | | | | 104,874,478 | | | | 26,223,910 | | | | 86,529,580 | |
| | | | |
Net asset value and maximum offering price per share | | | $8.03 | | | | $8.18 | | | | $9.70 | | | | $9.98 | |
| | | | |
aConsolidated financial statement. See Note 1(g).
bRedemption price is equal to net asset value less contingent deferred sales charges, if applicable.
| | | | |
| | | |
130 | | Annual Report | The accompanying notes are an integral part of these financial statements. | | franklintempleton.com |
FRANKLIN INVESTORS SECURITIES TRUST
FINANCIAL STATEMENTS
Statements of Operations
for the year ended October 31, 2019
| | | | | | | | | | | | | | | | |
| | | Franklin
Adjustable
U.S. Government
Securities Fund | | | Franklin
Floating Rate
Daily Access Fund | | | Franklin
Low Duration
Total Return Fund | | | Franklin Total Return
Funda | |
Investment income: | | | | | | | | | | | | | | | | |
Dividends: | | | | | | | | | | | | | | | | |
Unaffiliated issuers | | $ | — | | | $ | — | | | $ | 2,221,038 | | | $ | 1,068,558 | |
Controlled affiliates (Note 3f and 10) | | | — | | | | — | | | | — | | | | 4,611,173 | |
Non-controlled affiliates (Note 3f and 10) | | | 618,630 | | | | 10,443,691 | | | | 3,914,220 | | | | 5,312,169 | |
Interest: | | | | | | | | | | | | | | | | |
Non-controlled affiliates (Note 10) | | | — | | | | 4,180,654 | | | | — | | | | — | |
Unaffiliated issuers: | | | | | | | | | | | | | | | | |
Paydown gain (loss) | | | (9,541,450 | ) | | | — | | | | (4,392,881 | ) | | | (5,165,606 | ) |
Paid in cash | | | 29,188,711 | | | | 170,607,694 | | | | 110,788,500 | | | | 167,021,793 | |
| | | | |
Total investment income | | | 20,265,891 | | | | 185,232,039 | | | | 112,530,877 | | | | 172,848,087 | |
| | | | |
Expenses: | | | | | | | | | | | | | | | | |
Management fees (Note 3a) | | | 3,789,053 | | | | 15,511,047 | | | | 14,985,816 | | | | 20,500,201 | |
Distribution fees: (Note 3c) | | | | | | | | | | | | | | | | |
Class A | | | 1,003,786 | | | | 3,037,149 | | | | 4,090,044 | | | | 7,210,403 | |
Class A1 | | | 97,124 | | | | — | | | | — | | | | — | |
Class C | | | 712,479 | | | | 2,425,643 | | | | 860,796 | | | | 1,543,947 | |
Class R | | | — | | | | — | | | | 1 | | | | 112,034 | |
Transfer agent fees: (Note 3e) | | | | | | | | | | | | | | | | |
Class A | | | 579,254 | | | | 1,378,220 | | | | 2,504,193 | | | | 4,204,681 | |
Class A1 | | | 134,174 | | | | — | | | | — | | | | — | |
Class C | | | 158,126 | | | | 423,441 | | | | 202,422 | | | | 346,306 | |
Class R | | | — | | | | — | | | | — | | | | 32,734 | |
Class R6 | | | 20,505 | | | | 28,569 | | | | 245,491 | | | | 130,250 | |
Advisor Class | | | 169,550 | | | | 1,583,133 | | | | 360,138 | | | | 1,089,880 | |
Custodian fees (Note 4) | | | 6,169 | | | | 22,427 | | | | 41,965 | | | | 53,460 | |
Reports to shareholders | | | 93,491 | | | | 228,127 | | | | 308,682 | | | | 548,602 | |
Registration and filing fees | | | 132,434 | | | | 158,878 | | | | 261,040 | | | | 248,068 | |
Professional fees | | | 65,833 | | | | 148,909 | | | | 108,376 | | | | 150,947 | |
Trustees’ fees and expenses | | | 8,960 | | | | 38,428 | | | | 33,620 | | | | 47,460 | |
Marketplace lending fees (Note 1k) | | | — | | | | — | | | | 284,274 | | | | — | |
Other | | | 199,100 | | | | 88,580 | | | | 371,098 | | | | 307,641 | |
| | | | |
Total expenses | | | 7,170,038 | | | | 25,072,551 | | | | 24,657,956 | | | | 36,526,614 | |
Expense reductions (Note 4) | | | (42 | ) | | | (24,337 | ) | | | (25,608 | ) | | | (63,440 | ) |
Expenses waived/paid by affiliates (Note 3f and 3g) | | | (119,880 | ) | | | (1,017,693 | ) | | | (7,892,413 | ) | | | (1,623,073 | ) |
| | | | |
Net expenses | | | 7,050,116 | | | | 24,030,521 | | | | 16,739,935 | | | | 34,840,101 | |
| | | | |
Net investment income | | | 13,215,775 | | | | 161,201,518 | | | | 95,790,942 | | | | 138,007,986 | |
| | | | |
Realized and unrealized gains (losses): | | | | | | | | | | | | | | | | |
Net realized gain (loss) from: | | | | | | | | | | | | | | | | |
Investments: | | | | | | | | | | | | | | | | |
Unaffiliated issuers | | | — | | | | (60,055,757 | ) | | | 2,298,360 | | | | 45,981,056 | |
Non-controlled affiliates (Note 3f and 10) | | | — | | | | (11,830,078 | ) | | | (1,828,483 | ) | | | (2,565,076 | ) |
Foreign currency transactions | | | — | | | | — | | | | 1,212,257 | | | | 645,835 | |
Forward exchange contracts | | | — | | | | — | | | | 2,986,966 | | | | 8,135,522 | |
Futures contracts | | | — | | | | — | | | | 435,648 | | | | 53,987,564 | |
Swap contracts | | | — | | | | (637,127 | ) | | | 6,249,850 | | | | 3,857,619 | |
| | | | |
| | | |
| franklintempleton.com | | The accompanying notes are an integral part of these financial statements. | Annual Report | | 131 |
FRANKLIN INVESTORS SECURITIES TRUST
FINANCIAL STATEMENTS
Statements of Operations(continued)
for the year ended October 31, 2019
| | | | | | | | | | | | | | | | |
| | | Franklin
Adjustable
U.S. Government
Securities Fund | | | Franklin
Floating Rate
Daily Access
Fund | | | Franklin
Low Duration
Total Return
Fund | | | Franklin Total Return Funda | |
Capital gain distributions from management investment companies: | | | | | | | | | | | | | | | | |
Non-controlled affiliates (Note 3f) | | $ | — | | | $ | — | | | $ | — | | | $ | 129,196 | |
| | | | |
Net realized gain (loss) | | | — | | | | (72,522,962 | ) | | | 11,354,598 | | | | 110,171,716 | |
| | | | |
Net change in unrealized appreciation (depreciation) on: | | | | | | | | | | | | | | | | |
Investments: | | | | | | | | | | | | | | | | |
Unaffiliated issuers | | | 2,476,828 | | | | (95,917,654 | ) | | | 13,626,983 | | | | 161,822,246 | |
Controlled affiliates (Note 3f and 10) | | | — | | | | — | | | | — | | | | 10,964,807 | |
Non-controlled affiliates (Note 3f and 10) | | | — | | | | (15,929,829 | ) | | | (2,681,397 | ) | | | (906,458 | ) |
Translation of other assets and liabilities denominated in foreign currencies | | | — | | | | — | | | | (145,338 | ) | | | (591,138 | ) |
Forward exchange contracts | | | — | | | | — | | | | (892,430 | ) | | | (3,162,825 | ) |
Futures contracts | | | — | | | | — | | | | (745,594 | ) | | | (4,304,163 | ) |
Swap contracts | | | — | | | | 403,994 | | | | 767,137 | | | | (1,261,243 | ) |
Change in FT Subsidiary deferred tax benefit (Note 1h) | | | — | | | | — | | | | — | | | | (35,885 | ) |
Change in deferred taxes on unrealized appreciation | | | — | | | | — | | | | — | | | | (2,835 | ) |
| | | | |
Net change in unrealized appreciation (depreciation) | | | 2,476,828 | | | | (111,443,489 | ) | | | 9,929,361 | | | | 162,522,506 | |
| | | | | | | | |
Net realized and unrealized gain (loss) | | | 2,476,828 | | | | (183,966,451 | ) | | | 21,283,959 | | | | 272,694,222 | |
| | | | |
Net increase (decrease) in net assets resulting from operations | | $ | 15,692,603 | | | $ | (22,764,933 | ) | | $ | 117,074,901 | | | $ | 410,702,208 | |
| | | | |
aConsolidated financial statement. See Note 1(g).
| | | | |
| | | |
132 | | Annual Report | The accompanying notes are an integral part of these financial statements. | | franklintempleton.com |
FRANKLIN INVESTORS SECURITIES TRUST
FINANCIAL STATEMENTS
Statements of Changes in Net Assets
| | | | | | | | | | | | | | | | |
| | | Franklin Adjustable U.S.
Government Securities Fund | | | Franklin Floating Rate Daily Access Fund | |
| | | Year Ended October 31, | | | Year Ended October 31, | |
| | | 2019 | | | 2018 | | | 2019 | | | 2018 | |
Increase (decrease) in net assets: | | | | | | | | | | | | | | | | |
Operations: | | | | | | | | | | | | | | | | |
Net investment income | | $ | 13,215,775 | | | $ | 9,344,342 | | | $ | 161,201,518 | | | $ | 164,172,813 | |
Net realized gain (loss) | | | — | | | | (7,313 | ) | | | (72,522,962 | ) | | | (36,441,542 | ) |
Net change in unrealized appreciation (depreciation) | | | 2,476,828 | | | | (4,194,916 | ) | | | (111,443,489 | ) | | | (17,257,402 | ) |
| | | | |
Net increase (decrease) in net assets resulting from operations | | | 15,692,603 | | | | 5,142,113 | | | | (22,764,933 | ) | | | 110,473,869 | |
| | | | |
Distributions to shareholders: | | | | | | | | | | | | | | | | |
Class A | | | (12,001,795 | ) | | | (10,399,916 | ) | | | (64,119,132 | ) | | | (57,420,220 | ) |
Class A1 | | | (2,915,661 | ) | | | (2,680,182 | ) | | | — | | | | — | |
Class C | | | (2,843,324 | ) | | | (3,179,693 | ) | | | (18,210,835 | ) | | | (21,410,984 | ) |
Class R6 | | | (1,199,781 | ) | | | (749,735 | ) | | | (3,994,879 | ) | | | (6,632,500 | ) |
Advisor Class | | | (3,815,385 | ) | | | (3,615,201 | ) | | | (77,201,443 | ) | | | (78,812,669 | ) |
| | | | |
Total distributions to shareholders | | | (22,775,946 | ) | | | (20,624,727 | ) | | | (163,526,289 | ) | | | (164,276,373 | ) |
| | | | |
Capital share transactions: (Note 2) | | | | | | | | | | | | | | | | |
Class A | | | (21,579,949 | ) | | | (65,465,520 | ) | | | (220,170,584 | ) | | | 1,323,344 | |
Class A1 | | | (13,138,172 | ) | | | (18,641,058 | ) | | | — | | | | — | |
Class C | | | (40,864,972 | ) | | | (60,178,017 | ) | | | (119,511,218 | ) | | | (104,757,060 | ) |
Class R6 | | | (3,739,246 | ) | | | 34,338,586 | | | | (118,338,106 | ) | | | 13,923,525 | |
Advisor Class | | | (7,695,018 | ) | | | (69,446,005 | ) | | | (802,269,979 | ) | | | 96,300,188 | |
| | | | |
Total capital share transactions | | | (87,017,357 | ) | | | (179,392,014 | ) | | | (1,260,289,887 | ) | | | 6,789,997 | |
| | | | |
Net increase (decrease) in net assets | | | (94,100,700 | ) | | | (194,874,628 | ) | | | (1,446,581,109 | ) | | | (47,012,507 | ) |
Net assets: | | | | | | | | | | | | | | | | |
Beginning of year | | | 794,584,656 | | | | 989,459,284 | | | | 3,668,907,822 | | | | 3,715,920,329 | |
| | | | |
End of year | | $ | 700,483,956 | | | $ | 794,584,656 | | | $ | 2,222,326,713 | | | $ | 3,668,907,822 | |
| | | | |
| | | | |
| | | |
| franklintempleton.com | | The accompanying notes are an integral part of these financial statements. | Annual Report | | 133 |
FRANKLIN INVESTORS SECURITIES TRUST
FINANCIAL STATEMENTS
Statements of Changes in Net Assets(continued)
| | | | | | | | | | | | | | | | |
| | | Franklin Low Duration Total Return Fund | | | Franklin Total Return Funda | |
| | | Year Ended October 31, | | | Year Ended October 31, | |
| | | 2019 | | | 2018 | | | 2019 | | | 2018 | |
Increase (decrease) in net assets: | | | | | | | | | | | | | | | | |
Operations: | | | | | | | | | | | | | | | | |
Net investment income | | $ | 95,790,942 | | | $ | 69,340,190 | | | $ | 138,007,986 | | | $ | 128,163,399 | |
Net realized gain (loss) | | | 11,354,598 | | | | (21,567,956 | ) | | | 110,171,716 | | | | (95,199,341 | ) |
Net change in unrealized appreciation (depreciation) | | | 9,929,361 | | | | (29,608,008 | ) | | | 162,522,506 | | | | (141,895,358 | ) |
| | | | |
| | | | |
Net increase (decrease) in net assets resulting from operations | | | 117,074,901 | | | | 18,164,226 | | | | 410,702,208 | | | | (108,931,300 | ) |
| | | | |
Distributions to shareholders: | | | | | | | | | | | | | | | | |
Class A | | | (52,306,023 | ) | | | (44,054,661 | ) | | | (92,537,289 | ) | | | (84,620,684 | ) |
Class C | | | (3,709,440 | ) | | | (4,116,896 | ) | | | (6,711,287 | ) | | | (8,070,593 | ) |
Class R | | | (7 | ) | | | — | | | | (667,734 | ) | | | (821,725 | ) |
Class R6 | | | (38,208,441 | ) | | | (29,893,839 | ) | | | (15,990,733 | ) | | | (13,679,438 | ) |
Advisor Class | | | (8,102,666 | ) | | | (7,005,174 | ) | | | (25,772,639 | ) | | | (19,582,562 | ) |
Distributions to shareholders from tax return of capital: | | | | | | | | | | | | | | | | |
Class A | | | — | | | | — | | | | — | | | | (1,864,025 | ) |
Class C | | | — | | | | — | | | | — | | | | (173,121 | ) |
Class R | | | — | | | | — | | | | — | | | | (17,375 | ) |
Class R6 | | | — | | | | — | | | | — | | | | (312,827 | ) |
Advisor Class | | | — | | | | — | | | | — | | | | (438,993 | ) |
| | | | |
| | | | |
Total distributions to shareholders | | | (102,326,577 | ) | | | (85,070,570 | ) | | | (141,679,682 | ) | | | (129,581,343 | ) |
| | | | |
| | | | |
Capital share transactions: (Note 2) | | | | | | | | | | | | | | | | |
Class A | | | 123,680,413 | | | | 16,141,095 | | | | 479,864,224 | | | | (228,420,356 | ) |
Class C | | | 4,489,729 | | | | (40,573,740 | ) | | | (21,014,946 | ) | | | (93,634,238 | ) |
Class R | | | 18,305 | | | | — | | | | (3,811,785 | ) | | | (11,028,558 | ) |
Class R6 | | | (19,707,867 | ) | | | 447,306,561 | | | | 22,963,552 | | | | 55,069,872 | |
Advisor Class | | | 38,827,472 | | | | (209,104,674 | ) | | | 196,798,568 | | | | 60,100,000 | |
| | | | |
| | | | |
Total capital share transactions | | | 147,308,052 | | | | 213,769,242 | | | | 674,799,613 | | | | (217,913,280 | ) |
| | | | |
Net increase (decrease) in net assets | | | 162,056,376 | | | | 146,862,898 | | | | 943,822,139 | | | | (456,425,923 | ) |
Net assets: | | | | | | | | | | | | | | | | |
Beginning of year | | | 2,861,979,522 | | | | 2,715,116,624 | | | | 4,081,901,017 | | | | 4,538,326,940 | |
| | | | |
End of year | | $ | 3,024,035,898 | | | $ | 2,861,979,522 | | | $ | 5,025,723,156 | | | $ | 4,081,901,017 | |
| | | | |
aConsolidated financial statement. See Note 1(g).
| | | | |
| | | |
134 | | Annual Report | The accompanying notes are an integral part of these financial statements. | | franklintempleton.com |
FRANKLIN INVESTORS SECURITIES TRUST
Notes to Financial Statements
1. Organization and Significant Accounting Policies
Franklin Investors Securities Trust (Trust) is registered under the Investment Company Act of 1940 (1940 Act) as anopen-end management investment company, consisting of eight separate funds, four of which are included in this report (Funds) and applies the specialized accounting and reporting guidance in U.S. Generally Accepted Accounting Principles (U.S. GAAP). The classes of shares offered within each of the Funds are indicated below. Class C shares automatically convert to Class A shares after they have been held for 10 years. Each class of shares may differ by its initial sales load, contingent deferred sales charges, voting rights on matters affecting a single class, its exchange privilege and fees due to differing arrangements for distribution and transfer agent fees.
Class A, Class A1, Class C, Class R6 & Advisor Class
Franklin Adjustable U.S. Government Securities Fund
Class A, Class C, Class R6 & Advisor Class
Franklin Floating Rate Daily Access Fund
Class A, Class C, Class R, Class R6 & Advisor Class
Franklin Low Duration Total Return Fund
Franklin Total Return Fund
Effective October 15, 2019, Franklin Low Duration Total Return Fund began offering a new class of shares, Class R.
The following summarizes the Funds’ significant accounting policies.
a. Financial Instrument Valuation
The Funds’ investments in financial instruments are carried at fair value daily. Fair value is the price that would be received to sell an asset or paid to transfer a liability in an orderly transaction between market participants on the measurement date. The Funds calculate the net asset value (NAV) per share each business day as of 4 p.m. Eastern time or the regularly scheduled close of the New York Stock Exchange (NYSE), whichever is earlier. Under compliance policies and procedures approved by the Trust’s Board of Trustees (the Board), the Funds’ administrator has responsibility for oversight of valuation, including leading the cross-functional Valuation Committee (VC). The Funds may utilize
independent pricing services, quotations from securities and financial instrument dealers, and other market sources to determine fair value.
Equity securities, exchange traded funds and derivative financial instruments listed on an exchange or on the NASDAQ National Market System are valued at the last quoted sale price or the official closing price of the day, respectively. Foreign equity securities are valued as of the close of trading on the foreign stock exchange on which the security is primarily traded, or as of 4 p.m. Eastern time. The value is then converted into its U.S. dollar equivalent at the foreign exchange rate in effect at 4 p.m. Eastern time on the day that the value of the security is determined.Over-the- counter (OTC) securities are valued within the range of the most recent quoted bid and ask prices. Securities that trade in multiple markets or on multiple exchanges are valued according to the broadest and most representative market. Certain equity securities are valued based upon fundamental characteristics or relationships to similar securities.
Debt securities generally trade in the OTC market rather than on a securities exchange. The Funds’ pricing services use multiple valuation techniques to determine fair value. In instances where sufficient market activity exists, the pricing services may utilize a market-based approach through which quotes from market makers are used to determine fair value. In instances where sufficient market activity may not exist or is limited, the pricing services also utilize proprietary valuation models which may consider market characteristics such as benchmark yield curves, credit spreads, estimated default rates, anticipated market interest rate volatility, coupon rates, anticipated timing of principal repayments, underlying collateral, and other unique security features in order to estimate the relevant cash flows, which are then discounted to calculate the fair value. Securities denominated in a foreign currency are converted into their U.S. dollar equivalent at the foreign exchange rate in effect at 4 p.m. Eastern time on the date that the values of the foreign debt securities are determined.
Investments inopen-end mutual funds are valued at the closing NAV. Investments in repurchase agreements are valued at cost, which approximates fair value.
Certain derivative financial instruments are centrally cleared or trade in the OTC market. The Funds’ pricing services use various techniques including industry standard option pricing models and proprietary discounted cash flow models to
| | | | |
| | | |
| franklintempleton.com | | Annual Report | | 135 |
FRANKLIN INVESTORS SECURITIES TRUST
NOTES TO FINANCIAL STATEMENTS
1. Organization and Significant Accounting Policies(continued)
a. Financial Instrument Valuation(continued)
determine the fair value of those instruments. The Funds’ net benefit or obligation under the derivative contract, as measured by the fair value of the contract, is included in net assets.
The Funds have procedures to determine the fair value of financial instruments for which market prices are not reliable or readily available. Under these procedures, the Funds primarily employ a market-based approach which may use related or comparable assets or liabilities, recent transactions, market multiples, book values, and other relevant information for the investment to determine the fair value of the investment. An income-based valuation approach may also be used in which the anticipated future cash flows of the investment are discounted to calculate fair value. Discounts may also be applied due to the nature or duration of any restrictions on the disposition of the investments. Due to the inherent uncertainty of valuations of such investments, the fair values may differ significantly from the values that would have been used had an active market existed.
Trading in securities on foreign securities stock exchanges and OTC markets may be completed before 4 p.m. Eastern time. In addition, trading in certain foreign markets may not take place on every Funds’ business day. Occasionally, events occur between the time at which trading in a foreign security is completed and 4 p.m. Eastern time that might call into question the reliability of the value of a portfolio security held by the Fund. As a result, differences may arise between the value of the Funds’ portfolio securities as determined at the foreign market close and the latest indications of value at 4 p.m. Eastern time. In order to minimize the potential for these differences, the VC monitors price movements following the close of trading in foreign stock markets through a series of country specific market proxies (such as baskets of American Depositary Receipts, futures contracts and exchange traded funds). These price movements are measured against established trigger thresholds for each specific market proxy to assist in determining if an event has occurred that may call into question the reliability of the values of the foreign securities held by the Funds. If such an event occurs, the securities may be valued using fair value procedures, which may include the use of independent pricing services.
When the last day of the reporting period is anon-business day, certain foreign markets may be open on those days that the Funds’ NAV is not calculated, which could result in differences between the value of the Funds’ portfolio securities on the last business day and the last calendar day of the reporting period. Any significant security valuation changes due to an open foreign market are adjusted and reflected by the Funds for financial reporting purposes.
b. Foreign Currency Translation
Portfolio securities and other assets and liabilities denominated in foreign currencies are translated into U.S. dollars based on the exchange rate of such currencies against U.S. dollars on the date of valuation. The Funds may enter into foreign currency exchange contracts to facilitate transactions denominated in a foreign currency. Purchases and sales of securities, income and expense items denominated in foreign currencies are translated into U.S. dollars at the exchange rate in effect on the transaction date. Portfolio securities and assets and liabilities denominated in foreign currencies contain risks that those currencies will decline in value relative to the U.S. dollar. Occasionally, events may impact the availability or reliability of foreign exchange rates used to convert the U.S. dollar equivalent value. If such an event occurs, the foreign exchange rate will be valued at fair value using procedures established and approved by the Board.
The Funds do not separately report the effect of changes in foreign exchange rates from changes in market prices on securities held. Such changes are included in net realized and unrealized gain or loss from investments in the Statements of Operations.
Realized foreign exchange gains or losses arise from sales of foreign currencies, currency gains or losses realized between the trade and settlement dates on securities transactions and the difference between the recorded amounts of dividends, interest, and foreign withholding taxes and the U.S. dollar equivalent of the amounts actually received or paid. Net unrealized foreign exchange gains and losses arise from changes in foreign exchange rates on foreign denominated assets and liabilities other than investments in securities held at the end of the reporting period.
| | | | |
| | | |
136 | | Annual Report | | franklintempleton.com |
FRANKLIN INVESTORS SECURITIES TRUST
NOTES TO FINANCIAL STATEMENTS
c. Joint Repurchase Agreement
Certain or all Funds enter into a joint repurchase agreement whereby their uninvested cash balance is deposited into a joint cash account with other funds managed by the investment manager or an affiliate of the investment manager and is used to invest in one or more repurchase agreements. The value and face amount of the joint repurchase agreement are allocated to the funds based on theirpro-rata interest. A repurchase agreement is accounted for as a loan by the Fund to the seller, collateralized by securities which are delivered to the Funds’ custodian. The fair value, including accrued interest, of the initial collateralization is required to be at least 102% of the dollar amount invested by the funds, with the value of the underlying securities marked to market daily to maintain coverage of at least 100%. Repurchase agreements are subject to the terms of Master Repurchase Agreements (MRAs) with approved counterparties (sellers). The MRAs contain various provisions, including but not limited to events of default and maintenance of collateral for repurchase agreements. In the event of default by either the seller or the Funds, certain MRAs may permit thenon-defaulting party to net andclose-out all transactions, if any, traded under such agreements. The Funds may sell securities it holds as collateral and apply the proceeds towards the repurchase price and any other amounts owed by the seller to the Funds in the event of default by the seller. This could involve costs or delays in addition to a loss on the securities if their value falls below the repurchase price owed by the seller. The joint repurchase agreement held by the Funds at year end, as indicated in the Statements of Investments, had been entered into on October 31, 2019.
d. Securities Purchased on a When-Issued or Delayed Delivery and TBA Basis
Certain or all Funds purchase securities on a when-issued or delayed delivery andto-be-announced (TBA) basis, with payment and delivery scheduled for a future date. These transactions are subject to market fluctuations and are subject to the risk that the value at delivery may be more or less than the trade date purchase price. Although the Funds will generally purchase these securities with the intention of holding the securities, they may sell the securities before the settlement date. Sufficient assets have been segregated for these securities and collateral has been pledged and/or received for open TBA trades.
e. Derivative Financial Instruments
Certain or all Funds invested in derivative financial instruments in order to manage risk or gain exposure to various other investments or markets. Derivatives are financial contracts based on an underlying or notional amount, require no initial investment or an initial net investment that is smaller than would normally be required to have a similar response to changes in market factors, and require or permit net settlement. Derivatives contain various risks including the potential inability of the counterparty to fulfill their obligations under the terms of the contract, the potential for an illiquid secondary market, and/or the potential for market movements which expose the Fund to gains or losses in excess of the amounts shown in the Statements of Assets and Liabilities. Realized gain and loss and unrealized appreciation and depreciation on these contracts for the period are included in the Statements of Operations.
Derivative counterparty credit risk is managed through a formal evaluation of the creditworthiness of all potential counterparties. Certain or all Funds attempt to reduce their exposure to counterparty credit risk on OTC derivatives, whenever possible, by entering into International Swaps and Derivatives Association (ISDA) master agreements with certain counterparties. These agreements contain various provisions, including but not limited to collateral requirements, events of default, or early termination. Termination events applicable to the counterparty include certain deteriorations in the credit quality of the counterparty. Termination events applicable to the Funds include failure of the Funds to maintain certain net asset levels and/or limit the decline in net assets over various periods of time. In the event of default or early termination, the ISDA master agreement gives thenon-defaulting party the right to net andclose-out all transactions traded, whether or not arising under the ISDA agreement, to one net amount payable by one counterparty to the other. However, absent an event of default or early termination, OTC derivative assets and liabilities are presented gross and not offset in the Statements of Assets and Liabilities. Early termination by the counterparty may result in an immediate payment by the Funds of any net liability owed to that counterparty under the ISDA agreement.
Collateral requirements differ by type of derivative. Collateral or initial margin requirements are set by the broker or exchange clearing house for exchange traded and centrally cleared derivatives. Initial margin deposited is held at the exchange and can be in the form of cash and/or securities.
| | | | |
| | | |
| franklintempleton.com | | Annual Report | | 137 |
FRANKLIN INVESTORS SECURITIES TRUST
NOTES TO FINANCIAL STATEMENTS
1. Organization and Significant Accounting Policies(continued)
e. Derivative Financial Instruments(continued)
For OTC derivatives traded under an ISDA master agreement, posting of collateral is required by either the Fund or the applicable counterparty if the total net exposure of all OTC derivatives with the applicable counterparty exceeds the minimum transfer amount, which typically ranges from $100,000 to $250,000, and can vary depending on the counterparty and the type of the agreement. Generally, collateral is determined at the close of Fund business each day and any additional collateral required due to changes in derivative values may be delivered by the Fund or the counterparty the next business day, or within a few business days. Collateral pledged and/or received by the Fund for OTC derivatives, if any, is held in segregated accounts with the Fund’s custodian/counterparty broker and can be in the form of cash and/or securities. Unrestricted cash may be invested according to the Funds’ investment objectives. To the extent that the amounts due to the Fund from its counterparties are not subject to collateralization or are not fully collateralized, the Fund bears the risk of loss from counterpartynon-performance.
Certain or all Funds entered into exchange traded futures contracts primarily to manage and/or gain exposure to interest rate risk. A futures contract is an agreement between the Fund and a counterparty to buy or sell an asset at a specified price on a future date. Required initial margins are pledged by the Fund, and the daily change in fair value is accounted for as a variation margin payable or receivable in the Statements of Assets and Liabilities.
Certain or all Funds entered into OTC forward exchange contracts primarily to manage and/or gain exposure to certain foreign currencies. A forward exchange contract is an agreement between the Fund and a counterparty to buy or sell a foreign currency at a specific exchange rate on a future date.
Certain or all Funds entered into credit default swap contracts primarily to manage and/or gain exposure to credit risk. A credit default swap is an agreement between the Fund and a counterparty whereby the buyer of the contract receives credit protection and the seller of the contract guarantees the credit worthiness of a referenced debt obligation. These agreements may be privately negotiated in theover-the-counter market (OTC credit default swaps) or may be
executed in a multilateral trade facility platform, such as a registered exchange (centrally cleared credit default swaps). The underlying referenced debt obligation may be a single issuer of corporate or sovereign debt, a credit index, a basket of issuers or indices, or a tranche of a credit index or basket of issuers or indices. In the event of a default of the underlying referenced debt obligation, the buyer is entitled to receive the notional amount of the credit default swap contract from the seller in exchange for the referenced debt obligation, a net settlement amount equal to the notional amount of the credit default swap less the recovery value of the referenced debt obligation, or other agreed upon amount. For centrally cleared credit default swaps, required initial margins are pledged by the Fund, and the daily change in fair value is accounted for as a variation margin payable or receivable in the Statements of Assets and Liabilities. Over the term of the contract, the buyer pays the seller a periodic stream of payments, provided that no event of default has occurred. Such periodic payments are accrued daily as an unrealized appreciation or depreciation until the payments are made, at which time they are realized. Upfront payments and receipts are reflected in the Statements of Assets and Liabilities and represent compensating factors between stated terms of the credit default swap agreement and prevailing market conditions (credit spreads and other relevant factors). These upfront payments and receipts are amortized over the term of the contract as a realized gain or loss in the Statements of Operations.
Certain or all Funds entered into OTC cross currency swap contracts primarily to manage and/or gain exposure to certain foreign currencies. A cross currency swap is an agreement between the Fund and a counterparty to exchange cash flows (determined using either a fixed or floating rate) based on the notional amounts of two different currencies. The notional amounts are typically determined based on the spot exchange rates at the opening of the contract. Cross currency swaps may require the exchange of notional amounts at the opening and/or closing of the contract. Over the term of the contract, contractually required payments to be paid and to be received are accrued daily and recorded as unrealized depreciation and appreciation until the payments are made, at which time they are realized. Upfront payments and receipts are reflected in the Statements of Assets and Liabilities and represent compensating factors between stated terms of the cross currency swap contract and prevailing market conditions (interest rate spreads and other
| | | | |
| | | |
138 | | Annual Report | | franklintempleton.com |
FRANKLIN INVESTORS SECURITIES TRUST
NOTES TO FINANCIAL STATEMENTS
relevant factors). These upfront payments and receipts are amortized over the term of the contract as a realized gain or loss in the Statements of Operations.
Certain or all Funds entered into inflation index swap contracts primarily to manage and/or gain exposure to inflation risk. An inflation index swap is an agreement between the Fund and a counterparty to exchange cash flows whereby one party makes payments based on the percentage change in an index that serves as a measure of inflation and the other party makes a regular payment based on a compounded fixed rate, applied to a notional amount. These agreements may be privately negotiated in theover-the-counter market (OTC inflation index swap) or may be executed on a registered exchange (centrally cleared inflation index swap). For centrally cleared inflation index swaps, required initial margins are pledged by the Fund, and the daily change in fair value is accounted for as a variation margin payable or receivable. Over the term of the contract, contractually required payments to be paid and to be received are accrued daily and recorded as unrealized depreciation and appreciation until the payments are made, at which time they are realized. Typically, an inflation index swap has payment obligations netted and exchanged upon maturity.
Certain or all Funds entered into interest rate swap contracts primarily to manage interest rate risk. An interest rate swap is an agreement between the Fund and a counterparty to exchange cash flows based on the difference between two interest rates, applied to a notional amount. These agreements may be privately negotiated in theover-the-counter market (OTC interest rate swaps) or may be executed on a registered exchange (centrally cleared interest rate swaps). For centrally cleared interest rate swaps, required initial margins are pledged by the Fund, and the daily change in fair value is accounted for as a variation margin payable or receivable in the Statements of Assets and Liabilities. Over the term of the contract, contractually required payments to be paid and to be received are accrued daily and recorded as unrealized depreciation and appreciation until the payments are made, at which time they are realized.
Certain or all Funds entered into OTC total return swap contracts primarily to manage and/or gain exposure to credit and other market risks of an underlying instrument such as a stock, bond, index or basket of securities or indices. A total return swap is an agreement between the Fund and a counterparty to exchange a return linked to an underlying instrument for a floating or fixed rate payment, both based
upon a notional amount. Over the term of the contract, contractually required payments to be paid or received are accrued daily and recorded as unrealized appreciation or depreciation until the payments are made, at which time they are recognized as realized gain or loss.
Certain or all Funds invest in value recovery instruments (VRI) primarily to gain exposure to economic growth. Periodic payments from VRI are dependent on established benchmarks for underlying variables. VRI has a notional amount, which is used to calculate amounts of payments to holders. Payments are recorded upon receipt as realized gains in the Statements of Operations. The risks of investing in VRI include growth risk, liquidity, and the potential loss of investment.
See Note 9 regarding other derivative information.
f. Restricted Cash
At October 31, 2019, certain or all Funds held restricted cash in connection with investments in certain derivative securities. Restricted cash is held in a segregated account with the Fund’s custodian and is reflected in the Statements of Assets and Liabilities.
g. Loan Participation Notes
Certain or all Funds invest in loan participation notes (Participations). Participations are loans originally issued to a borrower by one or more financial institutions (the Lender) and subsequently sold to other investors, such as the Funds. Participations typically result in the Fund having a contractual relationship only with the Lender and not with the borrower. The Funds have the right to receive from the Lender any payments of principal, interest and fees which the Lender received from the borrower. The Funds generally have no rights to either enforce compliance by the borrower with the terms of the loan agreement or to any collateral relating to the original loan. As a result, the Funds assume the credit risk of both the borrower and the Lender that is selling the Participation. The Participations may also involve interest rate risk and liquidity risk, including the potential default or insolvency of the borrower and/or the Lender.
h. Investments in FT Holdings Corporation I (FT Subsidiary)
Franklin Total Return Fund invests in certain financial instruments through its investment in FT Subsidiary. FT Subsidiary is a Delaware Corporation, is a wholly-owned
| | | | |
| | | |
| franklintempleton.com | | Annual Report | | 139 |
FRANKLIN INVESTORS SECURITIES TRUST
NOTES TO FINANCIAL STATEMENTS
1. Organization and Significant Accounting Policies(continued)
h. Investments in FT Holdings Corporation I (FT Subsidiary)(continued)
subsidiary of the Fund, and is able to invest in certain financial instruments consistent with the investment objective of the Fund. At October 31, 2019, FT Subsidiary’s investment, Turtle Bay Resort, as well as any other assets and liabilities of the FT Subsidiary are reflected in the Fund’s Consolidated Statement of Investments and Consolidated Statement of Assets and Liabilities.
At October 31, 2019, FT Subsidiary, which is a tax paying entity, recognized an unrealized loss on its Turtle Bay investment. An estimated deferred tax asset based on such unrealized loss is reflected as FT Subsidiary deferred tax benefit in the Consolidated Statement of Assets and Liabilities. The estimated benefit was calculated using a federal rate of 21%. When the Turtle Bay investment liquidates, FT Subsidiary will recognize a capital loss which can be carried-back to offset prior year capital gains, resulting in a tax refund which will relieve the deferred tax asset.
The financial statements have been consolidated and include the accounts of the Fund and FT Subsidiary. All intercompany transactions and balances have been eliminated. At October 31, 2019, the net assets of FT Subsidiary were $5,162,239, representing 0.1% of the Fund’s consolidated net assets. The Fund’s investment in FT Subsidiary is limited to 25% of consolidated assets.
i. Mortgage Dollar Rolls
Certain or all Funds enter into mortgage dollar rolls, typically on a TBA basis. Mortgage dollar rolls are agreements between the Fund and a financial institution where the Fund sells (or buys) mortgage-backed securities for delivery on a specified date and simultaneously contracts to repurchase (or sell) substantially similar (same type, coupon, and maturity) securities at a future date and at a predetermined price. Gains or losses are realized on the initial sale, and the difference between the repurchase price and the sale price is recorded as an unrealized gain or loss to the Fund upon entering into the mortgage dollar roll. In addition, the Fund may invest the cash proceeds that are received from the initial sale. During the period between the sale and repurchase, the Fund is not entitled to principal and interest paid on the mortgage backed securities. Transactions in
mortgage dollar rolls are accounted for as purchases and sales and may result in an increase to the Fund’s portfolio turnover rate. The risks of mortgage dollar roll transactions include the potential inability of the counterparty to fulfill its obligations.
j. Senior Floating Rate Interests
Certain or all Funds invest in senior secured corporate loans that pay interest at rates which are periodically reset by reference to a base lending rate plus a spread. These base lending rates are generally the prime rate offered by a designated U.S. bank or the London InterBank Offered Rate (LIBOR). Senior secured corporate loans often require prepayment of principal from excess cash flows or at the discretion of the borrower. As a result, actual maturity may be substantially less than the stated maturity. Senior secured corporate loans in which the Funds invest are generally readily marketable, but may be subject to certain restrictions on resale. On July 27, 2017, the United Kingdom’s Financial Conduct Authority announced its intention to cease sustaining LIBOR after 2021. There remains uncertainty regarding the future utilization of LIBOR and the nature of any replacement rate. As such, the potential effect of a transition away from LIBOR on the Fund or the Fund’s investments that use or may use a floating rate based on LIBOR cannot yet be determined.
k. Marketplace Lending
Certain or all Funds invest in loans obtained through marketplace lending. Marketplace lending, sometimes referred to aspeer-to-peer lending, is a method of financing in which a platform facilitates the borrowing and lending of money. It is considered an alternative to more traditional forms of debt financing. Prospective borrowers are required to provide certain financial information to the platform, including, but not limited to, the intended purpose of the loan, income, employment information, credit score,debt-to-income ratio, credit history (including defaults and delinquencies) and home ownership status. Based on this and other information, the platform assigns its own credit rating to the borrower and sets the interest rate for the requested loan. The platform then posts the borrowing requests online, giving investors the opportunity to purchase the loans based on factors such as the interest rates and expected yields of the loans, the borrower background data, and the credit rating assigned by the platform.
| | | | |
| | | |
140 | | Annual Report | | franklintempleton.com |
FRANKLIN INVESTORS SECURITIES TRUST
NOTES TO FINANCIAL STATEMENTS
When the Fund invests in these loans, it usually purchases all rights, title and interest in the loans pursuant to a loan purchase agreement directly from the platform. The platform or a third-party servicer typically continues to service the loans, collecting payments and distributing them to the Fund, less any servicing fees assessed. The servicer is typically responsible for taking actions against a borrower in the event of a default on the loan. Servicing fees, along with other administration fees, are included in marketplace lending fees in the Statements of Operations. The Fund, as an investor in a loan, would be entitled to receive payment only from the borrower and would not be able to recover any deficiency from the platform, except under very narrow circumstances. The loans in which the Fund may invest are unsecured.
l. Income and Deferred Taxes
It is each Fund’s policy to qualify as a regulated investment company under the Internal Revenue Code. Each Fund intends to distribute to shareholders substantially all of its taxable income and net realized gains to relieve it from federal income and excise taxes. As a result, no provision for U.S. federal income taxes is required.
The Funds may be subject to foreign taxation related to income received, capital gains on the sale of securities and certain foreign currency transactions in the foreign jurisdictions in which the Funds invest. Foreign taxes, if any, are recorded based on the tax regulations and rates that exist in the foreign markets in which the Funds invest. When a capital gain tax is determined to apply, certain or all Funds record an estimated deferred tax liability in an amount that would be payable if the securities were disposed of on the valuation date.
Each Fund may recognize an income tax liability related to its uncertain tax positions under U.S. GAAP when the uncertain tax position has a less than 50% probability that it will be sustained upon examination by the tax authorities based on its technical merits. As of October 31, 2019, each Fund has determined that no tax liability is required in its financial statements related to uncertain tax positions for any open tax years (or expected to be taken in future tax years). Open tax years are those that remain subject to examination and are based on the statute of limitations in each jurisdiction in which the Fund invests.
m. Security Transactions, Investment Income, Expenses and Distributions
Security transactions are accounted for on trade date. Realized gains and losses on security transactions are determined on a specific identification basis. Interest income and estimated expenses are accrued daily. Amortization of premium and accretion of discount on debt securities are included in interest income. Paydown gains and losses are recorded separately on the Statements of Operations. Facility fees are recognized as income over the expected term of the loan. Dividend income and realized gain distributions are recorded on theex-dividend date except for certain dividends from securities where the dividend rate is not available. In such cases, the dividend is recorded as soon as the information is received by the Funds. Dividends from net investment income are normally declared daily; these dividends may be reinvested or paid monthly to shareholders. Distributions from realized capital gains and other distributions, if any, are recorded on theex-dividend date. Distributable earnings are determined according to income tax regulations (tax basis) and may differ from earnings recorded in accordance with U.S. GAAP. These differences may be permanent or temporary. Permanent differences are reclassified among capital accounts to reflect their tax character. These reclassifications have no impact on net assets or the results of operations. Temporary differences are not reclassified, as they may reverse in subsequent periods.
Common expenses incurred by the Trust are allocated among the Funds based on the ratio of net assets of each Fund to the combined net assets of the Trust or based on the ratio of number of shareholders of each Fund to the combined number of shareholders of the Trust. Fund specific expenses are charged directly to the Fund that incurred the expense.
Net investment income, excluding class specific expenses, is allocated daily to each class of shares based upon the relative value of the settled shares of each class. Realized and unrealized gains and losses are allocated daily to each class of shares based upon the relative proportion of net assets of each class. Differences in per share distributions by class are generally due to differences in class specific expenses.
Inflation-indexed bonds are adjusted for inflation through periodic increases or decreases in the security’s interest accruals, face amount, or principal redemption value, by amounts corresponding to the rate of inflation as measured
| | | | |
| | | |
| franklintempleton.com | | Annual Report | | 141 |
FRANKLIN INVESTORS SECURITIES TRUST
NOTES TO FINANCIAL STATEMENTS
1. Organization and Significant Accounting Policies(continued)
m. Security Transactions, Investment Income, Expenses and Distributions(continued)
by an index. Any increase or decrease in the face amount or principal redemption value will be included as interest income in the Statements of Operations.
n. Accounting Estimates
The preparation of financial statements in accordance with U.S. GAAP requires management to make estimates and assumptions that affect the reported amounts of assets and liabilities at the date of the financial statements and the amounts of income and expenses during the reporting period. Actual results could differ from those estimates.
o. Guarantees and Indemnifications
Under the Trust’s organizational documents, its officers and trustees are indemnified by the Trust against certain liabilities arising out of the performance of their duties to the Trust. Additionally, in the normal course of business, the Trust, on behalf of the Funds, enters into contracts with service providers that contain general indemnification clauses. The Trust’s maximum exposure under these arrangements is unknown as this would involve future claims that may be made against the Trust that have not yet occurred. Currently, the Trust expects the risk of loss to be remote.
2. Shares of Beneficial Interest
At October 31, 2019, there were an unlimited number of shares authorized (without par value). Transactions in the Funds’ shares were as follows:
| | | | | | | | | | | | | | | | |
| | | Franklin Adjustable U.S. Government Securities Fund | | | Franklin Floating Rate Daily Access Fund | |
| | | Shares | | | Amount | | | Shares | | | Amount |
Class A Shares: | | | | | | | | | | | | | | | | |
| | | | |
Year ended October 31, 2019 | | | | | | | | | | | | | | | | |
| | | | |
Shares solda | | | 18,451,688 | | | $ | 148,737,677 | | | | 24,396,121 | | | $ | 207,005,295 | |
| | | | |
Shares issued in reinvestment of distributions | | | 1,420,216 | | | | 11,437,638 | | | | 7,091,086 | | | | 59,838,783 | |
| | | | |
Shares redeemed | | | (22,545,484 | ) | | | (181,755,264 | ) | | | (57,649,550 | ) | | | (487,014,662 | ) |
| | | | |
Net increase (decrease) | | | (2,673,580 | ) | | $ | (21,579,949 | ) | | | (26,162,343 | ) | | $ | (220,170,584 | ) |
| | | | |
| | | | |
Year ended October 31, 2018 | | | | | | | | | | | | | | | | |
| | | | |
Shares solda | | | 12,980,707 | | | $ | 105,938,933 | | | | 40,041,598 | | | $ | 350,572,136 | |
| | | | |
Shares issued in reinvestment of distributions | | | 1,209,703 | | | | 9,874,447 | | | | 6,091,861 | | | | 53,389,454 | |
| | | | |
Shares redeemed | | | (22,167,585 | ) | | | (181,278,900 | ) | | | (45,866,654 | ) | | | (402,638,246 | ) |
| | | | |
Net increase (decrease) | | | (7,977,175 | ) | | $ | (65,465,520 | ) | | | 266,805 | | | $ | 1,323,344 | |
| | | | |
| | | | |
| | | |
142 | | Annual Report | | franklintempleton.com |
FRANKLIN INVESTORS SECURITIES TRUST
NOTES TO FINANCIAL STATEMENTS
| | | | | | | | | | | | | | | | | | | | |
| | | Franklin Adjustable U.S. Government Securities Fund | | | | | | Franklin Floating Rate Daily Access Fund | |
| | | Shares | | | Amount | | | | | | Shares | | | Amount | |
| | | | | |
Class A1 Shares: | | | | | | | | | | | | | | | | | | | | |
Year ended October 31, 2019 | | | | | | | | | | | | | | | | | | | | |
Shares sold | | | 644,638 | | | $ | 5,198,030 | | | | | | | | | | | | | |
Shares issued in reinvestment of distributions | | | 341,392 | | | | 2,748,361 | | | | | | | | | | | | | |
Shares redeemed | | | (2,617,010 | ) | | | (21,084,563 | ) | | | | | | | | | | | | |
| | | | | | | | | | | | |
Net increase (decrease) | | | (1,630,980 | ) | | $ | (13,138,172 | ) | | | | | | | | | | | | |
| | | | | | | | | | | | |
Year ended October 31, 2018 | | | | | | | | | | | | | | | | | | | | |
Shares sold | | | 748,665 | | | $ | 6,097,241 | | | | | | | | | | | | | |
Shares issued in reinvestment of distributions | | | 309,106 | | | | 2,522,673 | | | | | | | | | | | | | |
Shares redeemed | | | (3,331,933 | ) | | | (27,260,972 | ) | | | | | | | | | | | | |
| | | | | | | | | | | | |
Net increase (decrease) | | | (2,274,162 | ) | | $ | (18,641,058 | ) | | | | | | | | | | | | |
| | | | | | | | | | | | |
| | | | | |
Class C Shares: | | | | | | | | | | | | | | | | | | | | |
Year ended October 31, 2019 | | | | | | | | | | | | | | | | | | | | |
Shares sold | | | 2,141,425 | | | $ | 17,258,372 | | | | | | | | 4,867,026 | | | $ | 41,398,389 | |
Shares issued in reinvestment of distributions | | | 328,535 | | | | 2,643,522 | | | | | | | | 2,007,653 | | | | 16,956,492 | |
Shares redeemeda | | | (7,551,249 | ) | | | (60,766,866 | ) | | | | | | | (21,042,279 | ) | | | (177,866,099) | |
| | | | |
Net increase (decrease) | | | (5,081,289 | ) | | $ | (40,864,972 | ) | | | | | | | (14,167,600 | ) | | $ | (119,511,218) | |
| | | | |
Year ended October 31, 2018 | | | | | | | | | | | | | | | | | | | | |
Shares sold | | | 1,531,585 | | | $ | 12,510,001 | | | | | | | | 9,725,663 | | | $ | 85,257,879 | |
Shares issued in reinvestment of distributions | | | 364,009 | | | | 2,969,738 | | | | | | | | 2,281,358 | | | | 19,996,858 | |
Shares redeemeda | | | (9,275,058 | ) | | | (75,657,756 | ) | | | | | | | (23,980,411 | ) | | | (210,011,797) | |
| | | | |
Net increase (decrease) | | | (7,379,464 | ) | | $ | (60,178,017 | ) | | | | | | | (11,973,390 | ) | | $ | (104,757,060) | |
| | | | |
| | | | | |
Class R6 Shares: | | | | | | | | | | | | | | | | | | | | |
Year ended October 31, 2019 | | | | | | | | | | | | | | | | | | | | |
Shares sold | | | 1,808,708 | | | $ | 14,620,360 | | | | | | | | 6,237,102 | | | $ | 53,203,518 | |
Shares issued in reinvestment of distributions | | | 148,766 | | | | 1,199,760 | | | | | | | | 449,623 | | | | 3,806,996 | |
Shares redeemed | | | (2,423,068 | ) | | | (19,559,366 | ) | | | | | | | (20,715,643 | ) | | | (175,348,620) | |
| | | | |
Net increase (decrease) | | | (465,594 | ) | | $ | (3,739,246 | ) | | | | | | | (14,028,918 | ) | | $ | (118,338,106) | |
| | | | |
Year ended October 31, 2018 | | | | | | | | | | | | | | | | | | | | |
Shares sold | | | 5,030,194 | | | $ | 41,324,507 | | | | | | | | 4,483,095 | | | $ | 39,317,573 | |
Shares issued in reinvestment of distributions | | | 91,803 | | | | 749,678 | | | | | | | | 746,119 | | | | 6,539,786 | |
Shares redeemed | | | (945,757 | ) | | | (7,735,599 | ) | | | | | | | (3,642,765 | ) | | | (31,933,834) | |
| | | | |
Net increase (decrease) | | | 4,176,240 | | | $ | 34,338,586 | | | | | | | | 1,586,449 | | | $ | 13,923,525 | |
| | | | |
| | | | |
| | | |
| franklintempleton.com | | Annual Report | | 143 |
FRANKLIN INVESTORS SECURITIES TRUST
NOTES TO FINANCIAL STATEMENTS
2. Shares of Beneficial Interest(continued)
| | | | | | | | | | | | | | | | |
| | | Franklin Adjustable U.S. Government Securities Fund | | | Franklin Floating Rate Daily Access Fund | |
| | | | |
| | | Shares | | | Amount | | | Shares | | | Amount | |
Advisor Class Shares: | | | | | | | | | | | | | | | | |
Year ended October 31, 2019 | | | | | | | | | | | | | | | | |
Shares sold | | | 9,661,245 | | | $ | 78,040,579 | | | | 49,968,193 | | | $ | 425,681,497 | |
Shares issued in reinvestment of distributions | | | 409,290 | | | | 3,300,024 | | | | 5,583,560 | | | | 47,203,015 | |
Shares redeemed | | | (11,037,539 | ) | | | (89,035,621 | ) | | | (150,952,054 | ) | | | (1,275,154,491 | ) |
| | | | |
Net increase (decrease) | | | (967,004 | ) | | $ | (7,695,018 | ) | | | (95,400,301 | ) | | $ | (802,269,979 | ) |
| | | | |
Year ended October 31, 2018 | | | | | | | | | | | | | | | | |
Shares sold | | | 8,026,624 | | | $ | 65,714,269 | | | | 72,581,582 | | | $ | 636,947,305 | |
Shares issued in reinvestment of distributions | | | 386,115 | | | | 3,155,976 | | | | 5,110,153 | | | | 44,798,000 | |
Shares redeemed | | | (16,879,585 | ) | | | (138,316,250 | ) | | | (66,685,337 | ) | | | (585,445,117 | ) |
| | | | |
Net increase (decrease) | | | (8,466,846 | ) | | $ | (69,446,005 | ) | | | 11,006,398 | | | $ | 96,300,188 | |
| | | | |
|
| aMay include a portion of Class C shares that were automatically converted to Class A. | |
| | | Franklin Low Duration Total Return Fund | | | Franklin Total Return Fund | |
| | | | |
| | | Shares | | | Amount | | | Shares | | | Amount | |
Class A Shares: | | | | | | | | | | | | | | | | |
Year ended October 31, 2019 | | | | | | | | | | | | | | | | |
Shares solda | | | 79,629,462 | | | $ | 767,009,943 | | | | 100,587,834 | | | $ | 983,059,322 | |
Shares issued in reinvestment of distributions | | | 4,538,511 | | | | 43,788,521 | | | | 9,364,951 | | | | 90,862,421 | |
Shares redeemed | | | (71,313,399 | ) | | | (687,118,051 | ) | | | (61,650,157 | ) | | | (594,057,519 | ) |
| | | | |
| | | | |
Net increase (decrease) | | | 12,854,574 | | | $ | 123,680,413 | | | | 48,302,628 | | | $ | 479,864,224 | |
| | | | |
Year ended October 31, 2018 | | | | | | | | | | | | | | | | |
Shares solda | | | 45,754,362 | | | $ | 443,188,528 | | | | 46,213,804 | | | $ | 442,391,448 | |
Shares issued in reinvestment of distributions | | | 3,715,625 | | | | 35,982,102 | | | | 8,890,356 | | | | 85,021,536 | |
Shares redeemed | | | (47,715,588 | ) | | | (463,029,535 | ) | | | (78,958,900 | ) | | | (755,833,340 | ) |
| | | | |
| | | | |
Net increase (decrease) | | | 1,754,399 | | | $ | 16,141,095 | | | | (23,854,740 | ) | | $ | (228,420,356 | ) |
| | | | |
Class C Shares: | | | | | | | | | | | | | | | | |
Year ended October 31, 2019 | | | | | | | | | | | | | | | | |
Shares sold | | | 5,751,967 | | | $ | 55,153,027 | | | | 5,400,892 | | | $ | 52,080,169 | |
Shares issued in reinvestment of distributions | | | 330,448 | | | | 3,174,573 | | | | 655,873 | | | | 6,311,021 | |
Shares redeemeda | | | (5,611,766 | ) | | | (53,837,871 | ) | | | (8,294,058 | ) | | | (79,406,136 | ) |
| | | | |
| | | | |
Net increase (decrease) | | | 470,649 | | | $ | 4,489,729 | | | | (2,237,293 | ) | | $ | (21,014,946 | ) |
| | | | |
Year ended October 31, 2018 | | | | | | | | | | | | | | | | |
Shares sold | | | 3,413,048 | | | $ | 32,944,334 | | | | 3,654,316 | | | $ | 34,887,774 | |
Shares issued in reinvestment of distributions | | | 360,095 | | | | 3,473,725 | | | | 817,226 | | | | 7,767,582 | |
Shares redeemeda | | | (7,985,724 | ) | | | (76,991,799 | ) | | | (14,440,705 | ) | | | (136,289,594 | ) |
| | | | |
| | | | |
Net increase (decrease) | | | (4,212,581 | ) | | $ | (40,573,740 | ) | | | (9,969,163 | ) | | $ | (93,634,238 | ) |
| | | | |
| | | | |
| | | |
144 | | Annual Report | | franklintempleton.com |
FRANKLIN INVESTORS SECURITIES TRUST
NOTES TO FINANCIAL STATEMENTS
| | | | | | | | | | | | | | | | |
| | | Franklin Low Duration Total Return Fund | | | Franklin Total Return Fund | |
| | | Shares | | | Amount | | | Shares | | | Amount | |
Class R Shares: | | | | | | | | | | | | | | | | |
Year ended October 31, 2019 | | | | | | | | | | | | | | | | |
Shares sold | | | 1,897 | | | $ | 18,305 | | | | 333,857 | | | $ | 3,227,561 | |
Shares issued in reinvestment of distributions | | | — | | | | — | | | | 65,347 | | | | 630,599 | |
Shares redeemed | | | — | | | | — | | | | (797,352 | ) | | | (7,669,945 | ) |
| | | | |
| | | | |
Net increase (decrease) | | | 1,897 | | | $ | 18,305 | | | | (398,148 | ) | | $ | (3,811,785 | ) |
| | | | |
Year ended October 31, 2018 | | | | | | | | | | | | | | | | |
Shares sold | | | | | | | | | | | 492,019 | | | $ | 4,681,884 | |
Shares issued in reinvestment of distributions | | | | | | | | | | | 82,563 | | | | 787,630 | |
Shares redeemed | | | | | | | | | | | (1,736,019 | ) | | | (16,498,072 | ) |
| | | | | | | | | | | | |
| | | | |
Net increase (decrease) | | | | | | | | | | | (1,161,437 | ) | | $ | (11,028,558 | ) |
| | | | | | | | | | | | |
Class R6 Shares: | | | | | | | | | | | | | | | | |
Year ended October 31, 2019 | | | | | | | | | | | | | | | | |
Shares sold | | | 48,117,630 | | | $ | 466,169,000 | | | | 11,319,959 | | | $ | 110,557,913 | |
Shares issued in reinvestment of distributions | | | 3,421,634 | | | | 33,223,142 | | | | 1,474,135 | | | | 14,399,466 | |
Shares redeemed | | | (53,573,761 | ) | | | (519,100,009 | ) | | | (10,523,386 | ) | | | (101,993,827 | ) |
| | | | |
| | | | |
Net increase (decrease) | | | (2,034,497 | ) | | $ | (19,707,867 | ) | | | 2,270,708 | | | $ | 22,963,552 | |
| | | | |
Year ended October 31, 2018 | | | | | | | | | | | | | | | | |
Shares sold | | | 70,752,923 | | | $ | 691,874,381 | | | | 16,699,247 | | | $ | 161,014,195 | |
Shares issued in reinvestment of distributions | | | 2,699,247 | | | | 26,294,764 | | | | 1,317,931 | | | | 12,670,874 | |
Shares redeemed | | | (27,828,421 | ) | | | (270,862,584 | ) | | | (12,370,887 | ) | | | (118,615,197 | ) |
| | | | |
| | | | |
Net increase (decrease) | | | 45,623,749 | | | $ | 447,306,561 | | | | 5,646,291 | | | $ | 55,069,872 | |
| | | | |
Advisor Class Shares: | | | | | | | | | | | | | | | | |
Year ended October 31, 2019 | | | | | | | | | | | | | | | | |
Shares sold | | | 18,103,769 | | | $ | 175,348,265 | | | | 45,881,218 | | | $ | 444,031,555 | |
Shares issued in reinvestment of distributions | | | 730,667 | | | | 7,086,653 | | | | 2,450,870 | | | | 23,965,092 | |
Shares redeemed | | | (14,823,774 | ) | | | (143,607,446 | ) | | | (28,072,302 | ) | | | (271,198,079 | ) |
| | | | |
| | | | |
Net increase (decrease) | | | 4,010,662 | | | $ | 38,827,472 | | | | 20,259,786 | | | $ | 196,798,568 | |
| | | | |
Year ended October 31, 2018 | | | | | | | | | | | | | | | | |
Shares sold | | | 12,420,216 | | | $ | 121,011,438 | | | | 22,751,004 | | | $ | 220,031,575 | |
Shares issued in reinvestment of distributions | | | 625,164 | | | | 6,089,056 | | | | 1,828,038 | | | | 17,566,461 | |
Shares redeemed | | | (34,195,050 | ) | | | (336,205,168 | ) | | | (18,489,847 | ) | | | (177,498,036 | ) |
| | | | |
| | | | |
Net increase (decrease) | | | (21,149,670 | ) | | $ | (209,104,674 | ) | | | 6,089,195 | | | $ | 60,100,000 | |
| | | | |
aMay include a portion of Class C shares that were automatically converted to Class A.
| | | | |
| | | |
| franklintempleton.com | | Annual Report | | 145 |
FRANKLIN INVESTORS SECURITIES TRUST
NOTES TO FINANCIAL STATEMENTS
3. Transactions with Affiliates
Franklin Resources, Inc. is the holding company for various subsidiaries that together are referred to as Franklin Templeton. Certain officers and trustees of the Trust are also officers and/or directors of the following subsidiaries:
| | |
| Subsidiary | | Affiliation |
Franklin Advisers, Inc. (Advisers) | | Investment manager |
Franklin Templeton Institutional, LLC (FT Institutional) | | Investment manager |
Franklin Templeton Services, LLC (FT Services) | | Administrative manager |
Franklin Templeton Distributors, Inc. (Distributors) | | Principal underwriter |
Franklin Templeton Investor Services, LLC (Investor Services) | | Transfer agent |
a. Management Fees
Franklin Adjustable U.S. Government Securities Fund pays an investment management fee to Advisers based on the average daily net assets of the Fund as follows:
| | |
| Annualized Fee Rate | | Net Assets |
0.500% | | Up to and including $5 billion |
0.440% | | Over $5 billion, up to and including $10 billion |
0.410% | | Over $10 billion, up to and including $15 billion |
0.380% | | In excess of $15 billion |
Franklin Floating Rate Daily Access Fund pays an investment management fee to Advisers based on the average daily net assets of the Fund as follows:
| | |
| Annualized Fee Rate | | Net Assets |
0.650% | | Up to and including $500 million |
0.550% | | Over $500 million, up to and including $1 billion |
0.500% | | Over $1 billion, up to and including $1.5 billion |
0.450% | | Over $1.5 billion, up to and including $6.5 billion |
0.425% | | Over $6.5 billion, up to and including $11.5 billion |
0.400% | | Over $11.5 billion, up to and including $16.5 billion |
0.390% | | Over $16.5 billion, up to and including $19 billion |
0.380% | | Over $19 billion, up to and including $21.5 billion |
0.370% | | In excess of $21.5 billion |
| | | | |
| | | |
146 | | Annual Report | | franklintempleton.com |
FRANKLIN INVESTORS SECURITIES TRUST
NOTES TO FINANCIAL STATEMENTS
Franklin Low Duration Total Return Fund and Franklin Total Return Fund pay an investment management fee to Advisers based on the average daily net assets of each of the Funds as follows:
| | |
| Annualized Fee Rate | | Net Assets |
0.625% | | Up to and including $500 million |
0.525% | | Over $500 million, up to and including $1 billion |
0.480% | | Over $1 billion, up to and including $1.5 billion |
0.435% | | Over $1.5 billion, up to and including $6.5 billion |
0.415% | | Over $6.5 billion, up to and including $11.5 billion |
0.400% | | Over $11.5 billion, up to and including $16.5 billion |
0.390% | | Over $16.5 billion, up to and including $19 billion |
0.380% | | Over $19 billion, up to and including $21.5 billion |
0.370% | | In excess of $21.5 billion |
Under a subadvisory agreement, FT Institutional, an affiliate of Advisers, provides subadvisory services to Franklin Total Return Fund. The subadvisory fee is paid by Advisers based on the Fund’s average daily net assets, and is not an additional expense of the Fund.
For the year ended October 31, 2019, each Fund’s gross effective investment management fee rate based on average daily net assets was as follows:
| | | | | | | | | | |
| | | Franklin Adjustable
U.S. Government
Securities Fund | | Franklin
Floating Rate
Daily Access Fund | | Franklin
Low Duration Total Return Fund | | Franklin
Total Return Fund | | |
| | | | |
| | | | | |
| | 0.500% | | 0.508% | | 0.488% | | 0.472% | | |
b. Administrative Fees
Under an agreement with Advisers, FT Services provides administrative services to the Funds. The fee is paid by Advisers based on each of the Funds’ average daily net assets, and is not an additional expense of the Funds.
c. Distribution Fees
The Board has adopted distribution plans for each share class, with the exception of Class R6 and Advisor Class shares, pursuant to Rule 12b-1 under the 1940 Act. Under the Funds’ Class A and A1 reimbursement distribution plans, the Funds reimburse Distributors for costs incurred in connection with the servicing, sale and distribution of each Fund’s shares up to the maximum annual plan rate for each class. Under the Class A and A1 reimbursement distribution plans, costs exceeding the maximum for the current plan year cannot be reimbursed in subsequent periods. In addition, under the Funds’ Class C and R compensation distribution plans, the Funds pay Distributors for costs incurred in connection with the servicing, sale and distribution of each Fund’s shares up to the maximum annual plan rate for each class. The plan year, for purposes of monitoring compliance with the maximum annual plan rates, is February 1 through January 31 for each Fund.
| | | | |
| | | |
| franklintempleton.com | | Annual Report | | 147 |
FRANKLIN INVESTORS SECURITIES TRUST
NOTES TO FINANCIAL STATEMENTS
3. Transactions with Affiliates(continued)
c. Distribution Fees(continued)
The maximum annual plan rates, based on the average daily net assets, for each class, are as follows:
| | | | | | | | | | | | | | | | |
| | | Franklin Adjustable U.S. Government Securities Fund | | | Franklin
Floating Rate Daily Access Fund | | | Franklin
Low Duration Total Return Fund | | | Franklin
Total Return
Fund | |
| | | | |
Reimbursement Plans: | | | | | | | | | | | | | | | | |
| | | | |
Class A | | | 0.25% | | | | 0.25% | | | | 0.25% | | | | 0.25% | |
| | | | |
Class A1 | | | 0.10% | | | | —% | | | | —% | | | | —% | |
| | | | |
Compensation Plans: | | | | | | | | | | | | | | | | |
| | | | |
Class C | | | 0.65% | | | | 0.65% | | | | 0.65% | | | | 0.65% | |
| | | | |
Class R | | | — | | | | — | | | | 0.50% | | | | 0.50% | |
d. Sales Charges/Underwriting Agreements
Front-end sales charges and contingent deferred sales charges (CDSC) do not represent expenses of the Funds. These charges are deducted from the proceeds of sales of fund shares prior to investment or from redemption proceeds prior to remittance, as applicable. Distributors has advised the Funds of the following commission transactions related to the sales and redemptions of the Funds’ shares for the year:
| | | | | | | | | | | | | | | | |
| | | Franklin
Adjustable
U.S. Government
Securities Fund | | | Franklin
Floating Rate
Daily Access
Fund | | | Franklin Low Duration Total Return Fund | | | Franklin
Total Return
Fund | |
Sales charges retained net of commissions paid to unaffiliated brokers/dealers | | | $10,197 | | | | $27,771 | | | | $46,959 | | | | $214,752 | |
| | | | |
CDSC retained | | | $16,631 | | | | $42,216 | | | | $43,091 | | | | $ 19,187 | |
Effective March 1, 2019, certain front-end sales charges on Class A and A1 shares, if any, were lowered. Further details are disclosed in the Funds’ Prospectus.
e. Transfer Agent Fees
Each class of shares pays transfer agent fees to Investor Services for its performance of shareholder servicing obligations. The fees are based on an annualized asset based fee of 0.02% plus a transaction based fee. In addition, each class reimburses Investor Services for out of pocket expenses incurred and, except for Class R6, reimburses shareholder servicing fees paid to third parties. These fees are allocated daily based upon their relative proportion of such classes’ aggregate net assets. Class R6 pays Investor Services transfer agent fees specific to that class.
For the year ended October 31, 2019, the Funds paid transfer agent fees as noted in the Statements of Operations of which the following amounts were retained by Investor Services:
| | | | | | | | | | | | | | | | |
| | | Franklin
Adjustable U.S. Government Securities Fund | | | Franklin
Floating Rate Daily Access Fund | | | Franklin Low Duration Total Return Fund | | | Franklin
Total Return Fund | |
| | | | |
Transfer agent fees | | | $524,726 | | | | $1,330,594 | | | | $1,090,527 | | | | $2,361,718 | |
| | | | |
| | | |
148 | | Annual Report | | franklintempleton.com |
FRANKLIN INVESTORS SECURITIES TRUST
NOTES TO FINANCIAL STATEMENTS
f. Investments in Affiliated Management Investment Companies
Certain or all Funds invest in one or more affiliated management investment companies for purposes other than exercising a controlling influence over the management or policies. Management fees paid by the Funds are waived on assets invested in the affiliated management investment companies, as noted in the Statements of Operations, in an amount not to exceed the management and administrative fees paid directly or indirectly by each affiliate. During the year ended October 31, 2019, investments in affiliated management investment companies were as follows:
| | | | | | | | | | | | | | | | | | | | | | | | | | | | | | | | |
| | | Value at
Beginning of Year | | | Purchases | | | Sales | | | Realized Gain (Loss) | | | Net Change in Unrealized Appreciation (Depreciation) | | | Value at End of Year | | | Number of Shares Held at End of Year | | | Dividend Income | |
Franklin Adjustable U.S. Government Securities Fund | | | | | | | | | | | | | | | | | | | | | |
Non-Controlled Affiliates | | | | | | | | | | | | | | | | | | | | | | | | | | | | | |
Institutional Fiduciary Trust Money Market Portfolio, 1.56% | | $ | 18,732,898 | | | $ | 140,421,885 | | | $ | (124,102,035 | ) | | $ | — | | | $ | — | | | $ | 35,052,748 | | | | 35,052,748 | | | $ | 618,630 | |
| | | | | | | | | | | | |
Franklin Floating Rate Daily Access Fund | | | | | | | | | | | | | | | | | | | | | | | | | |
Non-Controlled Affiliates | | | | | | | | | | | | | | | | | | | | | | | | | | | | | |
Franklin Floating Rate Income Funda | | $ | 64,272,450 | | | $ | — | | | $ | — | | | $ | — | | | $ | (7,726,369 | ) | | $ | 56,546,081 | | | | 6,837,495 | | | $ | 4,711,834 | |
Franklin Lower Tier Floating Rate Fund | | | 64,398,391 | | | | — | | | | (57,966,627 | )b | | | (11,845,737 | ) | | | 5,413,973 | | | | — | c | | | — | | | | 2,769,898 | |
Institutional Fiduciary Trust Money Market Portfolio, 1.56% | | | 219,846,906 | | | | 855,308,136 | | | | (971,196,765 | ) | | | — | | | | — | | | | 103,958,277 | | | | 103,958,277 | | | | 2,961,959 | |
| | | | | | | | | | | | |
Total Affiliated Securities | | $ | 348,517,747 | | | $ | 855,308,136 | | | $ | (1,029,163,392 | ) | | $ | (11,845,737 | ) | | $ | (2,312,396 | ) | | $ | 160,504,358 | | | | | | | $ | 10,443,691 | |
| | | | | | | | | | | | |
Franklin Low Duration Total Return Fund | | | | | | | | | | | | | | | | | | | | | | | | | |
Non-Controlled Affiliates | | | | | | | | | | | | | | | | | | | | | | | | | | | | | |
Franklin Floating Rate Income Funda | | $ | 22,459,491 | | | $ | — | | | $ | — | | | $ | — | | | $ | (2,699,917 | ) | | $ | 19,759,574 | | | | 2,389,308 | | | $ | 1,646,512 | |
Franklin Lower Tier Floating Rate Fund | | | 18,122,357 | | | | — | | | | (16,312,394 | )b | | | (1,828,483 | ) | | | 18,520 | | | | — | c | | | — | | | | 779,477 | |
Institutional Fiduciary Trust Money Market Portfolio, 1.56% | | | 58,057,813 | | | | 1,201,251,861 | | | | (1,151,268,634 | ) | | | — | | | | — | | | | 108,041,040 | | | | 108,041,040 | | | | 1,488,231 | |
| | | | | | | | | | | | |
Total Affiliated Securities | | $ | 98,639,661 | | | $ | 1,201,251,861 | | | $ | (1,167,581,028 | ) | | $ | (1,828,483 | ) | | $ | (2,681,397 | ) | | $ | 127,800,614 | | | | | | | $ | 3,914,220 | |
| | | | | | | | | | | | |
Franklin Total Return Fund | | | | | | | | | | | | | | | | | | | | | | | | | | | | | |
Controlled Affiliates | | | | | | | | | | | | | | | | | | | | | | | | | | | | | |
Franklin Liberty Investment Grade Corporate ETF | | $ | 9,218,000 | | | $ | 349,439,313 | | | $ | — | | | $ | — | | | $ | 11,303,662 | | | $ | 369,960,975 | | | | 14,415,000 | | | $ | 3,599,762 | |
Franklin Liberty Senior Loan ETF | | | 7,548,483 | | | | 15,521,063 | | | | — | | | | — | | | | (338,855 | ) | | | 22,730,691 | | | | 914,900 | | | | 1,011,411 | |
| | | | | | | | | | | | |
Total Controlled Affiliates | | $ | 16,766,483 | | | $ | 364,960,376 | | | $ | — | | | $ | — | | | $ | 10,964,807 | | | $ | 392,691,666 | | | | | | | $ | 4,611,173 | |
| | | | | | | | | | | | |
Non-Controlled Affiliates | | | | | | | | | | | | | | | | | | | | | | | | | | | | | |
Franklin Flexible Alpha Bond Fund, Class R6 | | $ | 99,287,894 | | | $ | — | | | $ | (98,880,977 | ) | | $ | (1,119,023 | ) | | $ | 712,106 | | | $ | — | c | | | — | | | $ | 2,010,732 | d |
Franklin Floating Rate Income Funda | | | 17,759,516 | | | | — | | | | (2,835,600 | ) | | | (482,801 | ) | | | (1,628,320 | ) | | | 12,812,795 | | | | 1,549,310 | | | | 1,298,047 | |
Franklin Lower Tier Floating Rate Fund | | | 9,546,927 | | | | — | | | | (8,593,431 | )b | | | (963,252 | ) | | | 9,756 | | | | — | c | | | — | | | | 410,632 | |
| | | | |
| | | |
| franklintempleton.com | | Annual Report | | 149 |
FRANKLIN INVESTORS SECURITIES TRUST
NOTES TO FINANCIAL STATEMENTS
3. Transactions with Affiliates(continued)
f. Investments in Affiliated Management Investment Companies(continued)
| | | | | | | | | | | | | | | | | | | | | | | | | | | | | | | | |
| | | Value at
Beginning of Year | | | Purchases | | | Sales | | | Realized Gain (Loss) | | | Net Change in
Unrealized Appreciation (Depreciation) | | | Value at End of Year | | | Number of
Shares Held at End of Year | | | Dividend Income | |
| | | | | | | |
Franklin Total Return Fund(continued) | | | | | | | | | | | | | | | | | | | | | | | | | | | | | |
| | | | | | |
Non-Controlled Affiliates(continued) | | | | | | | | | | | | | | | | | | | | | | | | | |
| | | | | | | | |
Institutional Fiduciary Trust Money Market Portfolio, 1.56% | | $ | 39,095,058 | | | $ | 2,129,714,267 | | | $ | (1,795,181,565 | ) | | $ | — | | | $ | — | | | $ | 373,627,760 | | | | 373,627,760 | | | $ | 1,721,954 | |
| | | | | | | | | | | | |
| | | | | | | | |
Total Non-Controlled Affiliates | | $ | 165,689,395 | | | $ | 2,129,714,267 | | | $ | (1,905,491,573 | ) | | $ | (2,565,076 | ) | | $ | (906,458 | ) | | $ | 386,440,555 | | | | | | | $ | 5,441,365 | |
| | | | | | | | | | | | |
| | | | | | | | |
Total Affiliated Securities | | $ | 182,455,878 | | | $ | 2,494,674,643 | | | $ | (1,905,491,573 | ) | | $ | (2,565,076 | ) | | $ | 10,058,349 | | | $ | 779,132,221 | | | | | | | $ | 10,052,538 | |
| | | | | | | | | | | | |
aEffective May 31, 2019, Franklin Middle Tier Floating Rate Fund was renamed Franklin Floating Rate Income Fund.
bThe Fund sold shares of the affiliate through an in-kind transfer of common stocks and other equity interests, corporate bonds and senior floating rate interests securities and cash. See Note 6.
cAs of October 31, 2019, no longer held by the fund.
dDividend income includes any capital gain distributions received from underlying funds, and are presented in corresponding line item in the Statement of Operations.
g. Waiver and Expense Reimbursements
Advisers and Investor Services have contractually agreed in advance to waive or limit their respective fees and to assume as their own expense certain expenses otherwise payable by Franklin Low Duration Total Return Fund and Franklin Total Return Fund so that the expenses (excluding distribution fees and acquired fund fees and expenses and certain non-routine expenses or costs, including those relating to litigation, indemnification, reorganizations, and liquidations) for Class A, Class C, Class R and Advisor Class of the Funds do not exceed 0.44% and 0.60%, respectively, and for Class R6 do not exceed 0.30% and 0.49%, respectively, based on the average net assets of each class until February 28, 2021 and February 29, 2020 respectively. Total expenses waived or paid are not subject to recapture subsequent to the Funds’ fiscal year end.
Prior to March 1, 2019, expenses (excluding certain fees and expenses as previously disclosed) for Franklin Total Return Fund for Class A, Class C, Class R and Advisor Class were limited to 0.63% and for Franklin Low Duration Total Return Fund expenses for Class R6 were limited to 0.29% based on the average net assets of each class.
For Franklin Adjustable U.S. Government Fund and Franklin Floating Rate Daily Access Fund, Investor Services has contractually agreed in advance to waive or limit its fees so that the Class R6 transfer agent fees do not exceed 0.03% based on the average net assets of the class until February 29, 2020.
Prior to March 1, 2019, for Franklin Floating Rate Daily Access Fund the Class R6 transfer agent fees were limited to 0.02% based on the average net assets of the class.
h. Other Affiliated Transactions
At October 31, 2019, one or more of the funds in Franklin Fund Allocator Series owned 15.1% of Franklin Low Duration Total Return Fund outstanding shares.
4. Expense Offset Arrangement
The Funds have entered into an arrangement with their custodian whereby credits realized as a result of uninvested cash balances are used to reduce a portion of the Funds’ custodian expenses. During the year ended October 31, 2019, the custodian fees were reduced as noted in the Statements of Operations.
| | | | |
| | | |
150 | | Annual Report | | franklintempleton.com |
FRANKLIN INVESTORS SECURITIES TRUST
NOTES TO FINANCIAL STATEMENTS
5. Income Taxes
For tax purposes, capital losses may be carried over to offset future capital gains.
At October 31, 2019, the capital loss carryforwards were as follows:
| | | | | | | | | | | | | | | | |
| | | Franklin
Adjustable U.S. Government
Securities Fund | | | Franklin
Floating Rate
Daily Access
Fund | | | Franklin Low Duration
Total Return
Fund | | | Franklin Total Return
Fund | |
Capital loss carryforwards not subject to expiration: | | | | | | | | | | | | | | | | |
Short term | | $ | 23,092,600 | | | $ | 20,570,518 | | | $ | 32,417,165 | | | $ | 30,224,308 | |
Long term | | | 104,891,205 | | | | 239,462,365 | | | | 81,065,745 | | | | 91,879,023 | |
| | | | |
Total capital loss carryforwards | | $ | 127,983,805 | | | $ | 260,032,883 | | | $ | 113,482,910 | | | $ | 122,103,331 | |
| | | | |
During the year ended October 31, 2019, the Franklin Total Return Fund utilized $76,739,506 of capital loss carryforwards.
On October 31, 2019, the following Funds had expired capital loss carryforwards, which were reclassified to paid-in capital.
| | | | | | | | |
Franklin Adjustable U.S. Government Securities Fund | | Franklin Floating Rate Daily Access Fund | | | Franklin Low Duration Total Return Fund | |
$21,934,756 | | $ | 10,282,409 | | | $ | 5,327,487 | |
The tax character of distributions paid during the years ended October 31, 2019 and 2018, was as follows:
| | | | | | | | | | | | | | | | |
| | | Franklin Adjustable U.S. | | | Franklin Floating Rate | |
| | | Government Securities Fund | | | Daily Access Fund | |
| | | 2019 | | | 2018 | | | 2019 | | | 2018 | |
Distributions paid from: | | | | | | | | | | | | | | | | |
Ordinary income | | $ | 22,775,946 | | | $ | 20,624,727 | | | $ | 163,526,289 | | | $ | 164,276,373 | |
| | | | |
| | |
| | | Franklin Low Duration Total Return Fund | | | Franklin Total Return Fund | |
| | | 2019 | | | 2018 | | | 2019 | | | 2018 | |
Distributions paid from: | | | | | | | | | | | | | | | | |
Ordinary income | | $ | 102,326,577 | | | $ | 85,070,570 | | | $ | 141,679,682 | | | $ | 129,581,343 | |
Return of capital | | | — | | | | — | | | | — | | | | 2,794,205 | |
| | | | |
| | $ | 102,326,577 | | | $ | 85,070,570 | | | $ | 141,679,682 | | | $ | 132,375,548 | |
| | | | |
| | | | |
| | | |
| franklintempleton.com | | Annual Report | | 151 |
FRANKLIN INVESTORS SECURITIES TRUST
NOTES TO FINANCIAL STATEMENTS
5. Income Taxes(continued)
At October 31, 2019, the cost of investments, net unrealized appreciation (depreciation) and undistributed ordinary income for income tax purposes were as follows:
| | | | | | | | | | | | | | | | |
| | | Franklin
Adjustable U.S. Government
Securities Fund | | | Franklin Floating Rate
Daily Access Fund | | | Franklin Low Duration
Total Return Fund | | | Franklin Total Return Fund | |
Cost of investments | | $ | 696,409,054 | | | $ | 2,386,375,580 | | | $ | 3,044,936,125 | | | $ | 5,532,337,509 | |
| | | | |
| | | | |
Unrealized appreciation | | $ | 3,733,804 | | | $ | 17,998,275 | | | $ | 30,648,087 | | | $ | 138,919,203 | |
Unrealized depreciation | | | (4,043,817 | ) | | | (184,261,084 | ) | | | (57,845,275 | ) | | | (92,854,612 | ) |
| | | | |
| | | | |
Net unrealized appreciation (depreciation) | | $ | (310,013 | ) | | $ | (166,262,809 | ) | | $ | (27,197,188 | ) | | $ | 46,064,591 | |
| | | | |
| | | | |
Distributable earnings: | | | | | | | | | | | | | | | | |
Undistributed ordinary income | | $ | 138,891 | | | $ | 994,033 | | | $ | 10,399,949 | | | $ | 22,225,994 | |
| | | | |
Differences between income and/or capital gains as determined on a book basis and a tax basis are primarily due to differing treatments of foreign currency transactions, pass-through entity income, paydown losses, bond discounts and premiums and swaps.
6. Investment Transactions
Purchases and sales of investments (excluding short term securities and in-kind transactions) for the year ended October 31, 2019, were as follows:
| | | | | | | | | | | | | | | | |
| | | Franklin
Adjustable U.S. Government
Securities Fund | | | Franklin Floating Rate
Daily Access
Funda | | | Franklin Low Duration
Total Return
Fundb | | | Franklin Total Return
Fundc | |
Purchases | | $ | 90,754,949 | | | $ | 670,461,184 | | | $ | 1,634,278,128 | | | $ | 8,518,996,889 | |
Sales | | $ | 202,332,588 | | | $ | 1,711,301,798 | | | $ | 1,539,266,462 | | | $ | 7,782,931,144 | |
aPurchases and sales of investments excludes in-kind transactions of $48,327,921 and $57,966,627, respectively. See Note 3(f).
bPurchases and sales of investments excludes in-kind transactions of $13,599,965 and $16,312,394, respectively. See Note 3(f).
cPurchases and sales of investments excludes in-kind transactions of $7,164,514 and $8,593,432, respectively. See Note 3(f).
7. Credit Risk and Defaulted Securities
At October 31, 2019, Franklin Floating Rate Daily Access Fund, Franklin Low Duration Total Return Fund and Franklin Total Return Fund had 78.8% and 11.3% and 11.8%, respectively, of their portfolio invested in high yield securities, senior secured floating rate loans, or other securities rated below investment grade and unrated securities, if any. These securities may be more sensitive to economic conditions causing greater price volatility and are potentially subject to a greater risk of loss due to default than higher rated securities.
Certain or all Funds held defaulted securities and/or other securities for which the income has been deemed uncollectible. At October 31, 2019, the aggregate value of these securities for Franklin Low Duration Total Return Fund and Franklin Total Return Fund represents less than 0.1% of each Fund’s net assets. The Funds discontinue accruing income on securities for which income has been deemed uncollectible and provide an estimate for losses on interest receivable. The securities have been identified in the accompanying Statements of Investments.
| | | | |
| | | |
152 | | Annual Report | | franklintempleton.com |
FRANKLIN INVESTORS SECURITIES TRUST
NOTES TO FINANCIAL STATEMENTS
8. Restricted Securities
Certain or all Funds invest in securities that are restricted under the Securities Act of 1933 (1933 Act). Restricted securities are often purchased in private placement transactions, and cannot be sold without prior registration unless the sale is pursuant to an exemption under the 1933 Act. Disposal of these securities may require greater effort and expense, and prompt sale at an acceptable price may be difficult. The Funds may have registration rights for restricted securities. The issuer generally incurs all registration costs.
At October 31, 2019, investments in restricted securities, excluding securities exempt from registration under the 1933 Act, were as follows:
| | | | | | | | | | | | | | | | |
Principal Amount/ Shares/ Units | | | Issuer | | Acquisition
Date | | | Cost | | | Value |
| | Franklin Floating Rate Daily Access Fund | | | | | |
| | 1,219,956 | | | aAppvion Operations Inc. | | | 6/14/18 - 4/12/19 | | | $ | 12,791,766 | | | $ | 16,265,063 | |
| | 170,300 | | | bRemington Outdoor Co. Inc., Litigation Units | | | 5/16/18 - 4/12/19 | | | | — | | | | — | |
| | | | |
| | | | Total Restricted Securities(Value is 0.7% of Net Assets) | | | | | | $ | 12,791,766 | | | $ | 16,265,063 | |
| |
| | Franklin Low Duration Total Return Fund | | | | | |
| | 24,739 | | | cAppvion Operations Inc. | | | 4/12/19 | | | $ | 334,607 | | | $ | 329,838 | |
| | 12,326,925 | | | dK2016470219 South Africa Ltd., A | | | 4/15/13 - 2/01/17 | | | | 92,078 | | | | 8,155 | |
| | 1,226,701 | | | dK2016470219 South Africa Ltd., B | | | 2/01/17 | | | | 911 | | | | 812 | |
| | 16,078 | | | eRemington Outdoor Co. Inc., Litigation Units | | | 5/16/18 - 4/12/19 | | | | — | | | | — | |
| | | | |
| | | | Total Restricted Securities(Value is 0.0%†of Net Assets) | | | | | | $ | 427,596 | | | $ | 338,805 | |
| | |
| | Franklin Total Return Fund | | | | | | | | | |
| | 13,033 | | | fAppvion Operations Inc. | | | 4/12/19 | | | $ | 176,272 | | | $ | 173,760 | |
| | 28,762,824 | | | gK2016470219 South Africa Ltd., A | | | 4/15/13 - 2/01/17 | | | | 221,469 | | | | 19,029 | |
| | 2,862,311 | | | gK2016470219 South Africa Ltd., B | | | 2/01/17 | | | | 2,125 | | | | 1,894 | |
| | 4,897 | | | hRemington Outdoor Co. Inc., Litigation Units | | | 4/12/19 | | | | — | | | | — | |
| | | | |
| | | | Total Restricted Securities(Value is 0.0%†of Net Assets) | | | | | | $ | 399,866 | | | $ | 194,683 | |
†Rounds to less than 0.1% of net assets.
aThe Fund also invests in unrestricted securities of the issuer, valued at $45,636,106 as of October 31, 2019.
bThe Fund also invests in unrestricted securities of the issuer, valued at $1,808,932 as of October 31, 2019.
cThe Fund also invests in unrestricted securities of the issuer, valued at $564,625 as of October 31, 2019
dThe Fund also invests in unrestricted securities of the issuer, valued at $2,280 as of October 31, 2019.
eThe Fund also invests in unrestricted securities of the issuer, valued at $170,787 as of October 31, 2019.
fThe Fund also invests in unrestricted securities of the issuer, valued at $297,447 as of October 31, 2019.
gThe Fund also invests in unrestricted securities of the issuer, valued at $5,321 as of October 31, 2019.
hThe Fund also invests in unrestricted securities of the issuer, valued at $52,019 as of October 31, 2019.
| | | | |
| | | |
| franklintempleton.com | | Annual Report | | 153 |
FRANKLIN INVESTORS SECURITIES TRUST
NOTES TO FINANCIAL STATEMENTS
9. Other Derivative Information
At October 31, 2019, investments in derivative contracts are reflected in the Statements of Assets and Liabilities as follows:
| | | | | | | | | | | | |
| | | Asset Derivatives | | | Liability Derivatives | |
| | | | | | |
| | | | |
Derivative Contracts Not Accounted for as Hedging Instruments | | Statements of
Assets and Liabilities Location | | Fair Value | | | Statements of
Assets and Liabilities Location | | Fair Value | |
| | |
Franklin Floating Rate Daily Access Fund | | | | | | | |
| | | | |
Credit contracts | | Variation margin on centrally cleared swap contracts | | $ | — | | | Variation margin on centrally cleared swap contracts | | $ | 369,172 | a |
| | | | | | | | | | | | |
| |
Franklin Low Duration Total Return Fund | | | | |
| | | | |
Interest rate contracts | | Variation margin on futures contracts | | $ | 1,100,287 | a | | Variation margin on futures contracts | | $ | 2,331,833 | a |
| | | | |
| | Variation margin on centrally cleared swap contracts | | | — | | | Variation margin on centrally cleared swap contracts | | | 878,075 | a |
| | | | |
| | Unrealized appreciation on OTC swap contracts | | | 178,393 | | | Unrealized depreciation on OTC swap contracts | | | 58,069 | |
| | | | |
Foreign exchange contracts | | Unrealized appreciation on OTC forward exchange contracts | | | 1,075,028 | | | Unrealized depreciation on OTC forward exchange contracts | | | 1,435,330 | |
| | | | |
Credit contracts | | Variation margin on centrally cleared swap contracts | | | 536,882 | a | | Variation margin on centrally cleared swap contracts | | | — | |
| | | | |
| | OTC swap contracts (upfront payments) | | | 808,826 | | | OTC swap contracts (upfront receipts) | | | 8,110,471 | |
| | | | |
| | Unrealized appreciation on OTC swap contracts | | | 1,262,220 | | | Unrealized depreciation on OTC swap contracts | | | 1,925,736 | |
| | | | |
Inflation contracts | | Variation margin on centrally cleared swap contracts | | | — | | | Variation margin on centrally cleared swap contracts | | | 390,377 | a |
| | | | | | | | | | | | |
| | | | |
Totals | | | | $ | 4,961,636 | | | | | $ | 15,129,891 | |
| | | | | | | | | | | | |
| | | |
Franklin Total Return Fund | | | | | | | | | |
| | | | |
Interest rate contracts | | Variation margin on futures contracts | | $ | 663,563 | a | | Variation margin on futures contracts | | $ | 14,318,590 | a |
| | | | |
| | Variation margin on centrally cleared swap contracts | | | — | | | Variation margin on centrally cleared swap contracts | | | 1,253,144 | a |
| | | |
| | | | | | | | | |
| | | | |
| | Unrealized appreciation on OTC swap contracts | | | 173,508 | | | Unrealized depreciation on OTC swap contracts | | | 248,149 | |
| | | | |
Foreign exchange contracts | | Unrealized appreciation on OTC forward exchange contracts | | | 2,423,861 | | | Unrealized depreciation on OTC forward exchange contracts | | | 4,432,397 | |
| | | | |
Credit contracts | | Variation margin on centrally cleared swap contracts | | | 43,257 | a | | Variation margin on centrally cleared swap contracts | | | — | |
| | | | |
| | OTC swap contracts (upfront payments) | | | 1,781,811 | | | OTC swap contracts (upfront receipts) | | | 17,180,107 | |
| | | | |
| | Unrealized appreciation on OTC swap contracts | | | 3,064,812 | | | Unrealized depreciation on OTC swap contracts | | | 3,961,054 | |
| | | | |
Inflation contracts | | Variation margin on centrally cleared swap contracts | | | — | | | Variation margin on centrally cleared swap contracts | | | 416,659 | a |
| | | | |
| | Unrealized appreciation on OTC swap contracts | | | 181,988 | | | Unrealized depreciation on OTC swap contracts | | | — | |
| | | |
Value recovery instruments | | Investments in securities, at value | | | 446,532 | b | | | |
| | | | | | | | | | | | |
| | | | |
Totals | | | | $ | 8,779,332 | | | | | $ | 41,810,100 | |
| | | | | | | | | | | | |
| | | | |
| | | |
154 | | Annual Report | | franklintempleton.com |
FRANKLIN INVESTORS SECURITIES TRUST
NOTES TO FINANCIAL STATEMENTS
aThis amount reflects the cumulative appreciation (depreciation) of futures contracts and centrally cleared swap contracts as reported in the Statement of Investments. Only the variation margin receivable/payable at year end is separately reported within the Statements of Assets and Liabilities. Prior variation margin movements were recorded to cash upon receipt or payment.
bVRI are included in investments in securities, at value in the Statements of Assets and Liabilities.
For the year ended October 31, 2019, the effect of derivative contracts in the Statements of Operations was as follows:
| | | | | | | | | | | | |
Derivative Contracts Not Accounted for as Hedging Instruments | | Statements of
Operations Location | | Net Realized
Gain (Loss)
for the Year | | | Statements of Operations Location | | Net Change in
Unrealized
Appreciation
(Depreciation)
for the Year | |
| | | | |
| | Net realized gain (loss) from: | | | | | | Net change in unrealized appreciation (depreciation) on: | | | | |
Franklin Floating Rate Daily Access Fund | | | | | | | | | | |
| | | | |
Credit contracts | | Swap contracts | | $ | (637,127 | ) | | Swap contracts | | $ | 403,994 | |
Franklin Low Duration Total Return Fund | | | | | | | | | | |
| | | | |
Interest rate contracts | | Futures contracts | | $ | 435,648 | | | Futures contracts | | $ | (745,594 | ) |
| | | | |
| | Swap contracts | | | 3,778,342 | | | Swap contracts | | | 332,991 | |
| | | | |
Foreign exchange contracts | | Forward exchange contracts | | | 2,986,966 | | | Forward exchange contracts | | | (892,430 | ) |
| | | | |
Credit contracts | | Swap contracts | | | 2,471,514 | | | Swap contracts | | | 1,352,368 | |
| | | | |
Inflation contracts | | Swap contracts | | | (6 | ) | | Swap contracts | | | (918,222 | ) |
| | | | | | | | | | | | |
| | | | |
Totals | | | | $ | 9,672,464 | | | | | $ | (870,887 | ) |
| | | | | | | | | | | | |
Franklin Total Return Fund | | | | | | | | | | | | |
| | | | |
Interest rate contracts | | Futures contracts | | $ | 53,987,564 | | | Futures contracts | | $ | (4,304,163 | ) |
| | | | |
| | Swap contracts | | | 1,268,739 | | | Swap contracts | | | (2,861,804 | ) |
| | | | |
Foreign exchange contracts | | Forward exchange contracts | | | 8,135,522 | | | Forward exchange contracts | | | (3,162,825 | ) |
| | | | |
Credit contracts | | Swap contracts | | | 2,588,886 | | | Swap contracts | | | 3,655,435 | |
| | | | |
Inflation contracts | | Swap contracts | | | (6 | ) | | Swap contracts | | | (2,054,874 | ) |
| | | | |
Value recovery instruments | | Investments | | | — | | | Investments | | | 202,062 | a |
| | | | | | | | | | | | |
| | | | |
Totals | | | | $ | 65,980,705 | | | | | $ | (8,526,169 | ) |
| | | | | | | | | | | | |
aVRI are included in net change in unrealized appreciation (depreciation) on investments in the Statements of Operations.
For the year ended October 31, 2019, the average month end notional amount of futures contracts, options and swap contracts, and the average month end contract value for forward exchange contracts, and average month end fair value of VRI, were as follows:
| | | | | | | | | | | | | | |
| | | Franklin Floating Rate
Daily Access Fund | | | Franklin Low Duration
Total Return
Fund | | | Franklin Total
Return Fund | | | |
| | | | |
Futures Contracts | | $ | — | | | $ | 751,922,256 | | | $ | 1,108,682,978 | | | |
| | | | |
Swap contracts | | | 45,180,615 | | | | 480,534,131 | | | | 652,496,233 | | | |
| | | | |
Forward exchange contracts | | | — | | | | 118,539,714 | | | | 311,874,474 | | | |
| | | | |
VRI | | | — | | | | — | | | | 333,915 | | | |
| | | | |
| | | |
| franklintempleton.com | | Annual Report | | 155 |
FRANKLIN INVESTORS SECURITIES TRUST
NOTES TO FINANCIAL STATEMENTS
9. Other Derivative Information(continued)
At October 31, 2019, the Funds’ OTC derivative assets and liabilities are as follows:
| | | | | | | | |
| | | Gross Amounts of Assets and Liabilities Presented in the Statements of Assets and Liabilities | |
| | | Assetsa | | | Liabilitiesa | |
| | |
Derivatives | | | | | | | | |
Franklin Low Duration | | | | | | | | |
Total Return Fund | | | | | | | | |
Forward exchange contracts | | | $1,075,028 | | | | $ 1,435,330 | |
Swap contracts | | | 2,249,439 | | | | 10,094,276 | |
| | |
Total | | | $3,324,467 | | | | $11,529,606 | |
Franklin Total | | | | | | | | |
Return Fund | | | | | | | | |
Forward exchange contracts | | | 2,423,861 | | | | 4,432,397 | |
Swap contracts | | | 5,202,119 | | | | 21,389,310 | |
| | |
Total | | | $7,625,980 | | | | $25,821,707 | |
aAbsent an event of default or early termination, OTC derivative assets and liabilities are presented gross and not offset in the Statements of Assets and Liabilities.
At October 31, 2019, OTC derivative assets, which may be offset against OTC derivative liabilities and collateral received from the counterparty, are as follows:
| | | | | | | | | | | | | | | | | | | | |
| | | | | | Amounts Not Offset in the
Statement of Assets and
Liabilities | | | | |
| | | Gross Amounts of Assets Presented in the Statement of Assets and Liabilities | | | Financial Instruments Available for Offset | | | Financial Instruments Collateral Received | | | Cash
Collateral
Receiveda | | | Net Amount (Not less than zero) | |
| | | | | |
Franklin Low Duration Total Return Fund | | | | | | | | | | | | | | | | | | | | |
Counterparty | | | | | | | | | | | | | | | | | | | | |
BNDP | | | $ 78,108 | | | | $ (18,404 | ) | | | $ — | | | | $ — | | | | $ 59,704 | |
BZWS | | | 201,489 | | | | (201,489 | ) | | | — | | | | — | | | | — | |
CITI | | | 1,191,911 | | | | (1,191,911 | ) | | | — | | | | — | | | | — | |
DBAB | | | — | | | | — | | | | — | | | | — | | | | — | |
FBCO | | | 19,666 | | | | — | | | | — | | | | — | | | | 19,666 | |
GSCO | | | 104,720 | | | | (35,480 | ) | | | — | | | | (69,240 | ) | | | — | |
JPHQ | | | 1,545,158 | | | | (1,545,158 | ) | | | — | | | | — | | | | — | |
MSCO | | | 183,415 | | | | — | | | | — | | | | — | | | | 183,415 | |
| | | | | |
Total | | | $3,324,467 | | | | $(2,992,442 | ) | | | $ — | | | | $(69,240 | ) | | | $262,785 | |
| | | | |
| | | |
156 | | Annual Report | | franklintempleton.com |
FRANKLIN INVESTORS SECURITIES TRUST
NOTES TO FINANCIAL STATEMENTS
| | | | | | | | | | | | | | | | | | | | |
| | | | | | Amounts Not Offset in the
Statement of Assets and Liabilities | | | | |
| | | Gross Amounts of Assets Presented in the Statement of Assets and Liabilities | | | Financial Instruments Available for Offset | | | Financial Instruments Collateral Receiveda,b | | | Cash
Collateral
Received | | | Net Amount (Not less than zero) | |
| | | | | |
Franklin Total Return Fund | | | | | | | | | | | | | | | | | | | | |
Counterparty | | | | | | | | | | | | | | | | | | | | |
BNDP | | | $ 170,382 | | | | $ (42,331 | ) | | | $(128,051 | ) | | | $ — | | | | $ — | |
BZWS | | | 528,218 | | | | (528,218 | ) | | | — | | | | — | | | | — | |
CITI | | | 2,489,625 | | | | (2,489,625 | ) | | | — | | | | — | | | | — | |
DBAB | | | 311,755 | | | | (9,824 | ) | | | (301,931 | ) | | | — | | | | — | |
FBCO | | | 127,826 | | | | — | | | | — | | | | (120,000 | ) | | | 7,826 | |
GSCO | | | 290,451 | | | | — | | | | — | | | | (260,000 | ) | | | 30,451 | |
JPHQ | | | 3,229,254 | | | | (3,229,254 | ) | | | — | | | | — | | | | — | |
MSCO | | | 478,469 | | | | — | | | | — | | | | (70,000 | ) | | | 408,469 | |
| | | | | |
Total | | | $7,625,980 | | | | $(6,299,252 | ) | | | $(429,982 | ) | | | $(450,000 | ) | | | $446,746 | |
|
| At October 31, 2019, OTC derivative liabilities, which may be offset against OTC derivative assets and collateral pledged to the counterparty, are as follows: | |
| | | | | | Amounts Not Offset in the
Statement of Assets and Liabilities | | | | |
| | | Gross Amounts of Liabilities Presented in the Statement of Assets and Liabilities | | | Financial Instruments Available for Offset | | | Financial Instruments Collateral Pledged | | | Cash
Collateral
Pledgeda | | | Net Amount (Not less than zero) | |
|
Franklin Low Duration Total Return Fund | |
Counterparty | | | | | | | | | | | | | | | | | | | | |
BNDP | | | $ 18,404 | | | | $ (18,404 | ) | | | $ — | | | | $ — | | | | $ — | |
BZWS | | | 575,414 | | | | (201,489 | ) | | | — | | | | (370,000 | ) | | | 3,925 | |
CITI | | | 7,145,518 | | | | (1,191,911 | ) | | | — | | | | (5,850,000 | ) | | | 103,607 | |
DBAB | | | 15,185 | | | | — | | | | — | | | | — | | | | 15,185 | |
FBCO | | | — | | | | — | | | | — | | | | — | | | | — | |
GSCO | | | 35,480 | | | | (35,480 | ) | | | — | | | | — | | | | — | |
JPHQ | | | 3,739,605 | | | | (1,545,158 | ) | | | — | | | | (2,194,447 | ) | | | — | |
MSCO | | | — | | | | — | | | | — | | | | — | | | | — | |
| | | | | |
Total | | | $11,529,606 | | | | $(2,992,442 | ) | | | $ — | | | | $(8,414,447 | ) | | | $122,717 | |
| | | | |
| | | |
| franklintempleton.com | | Annual Report | | 157 |
FRANKLIN INVESTORS SECURITIES TRUST
NOTES TO FINANCIAL STATEMENTS
9. Other Derivative Information(continued)
| | | | | | | | | | | | | | | | | | | | |
| | | | | | Amounts Not Offset in the
Statement of Assets and Liabilities | | | | |
| | | Gross Amounts of Liabilities Presented in the Statement of Assets and Liabilities | | | Financial Instruments Available for Offset | | | Financial Instruments Collateral Pledged | | | Cash
Collateral Pledged | | | Net Amount (Not less than zero) | |
| | | | | |
Franklin Total Return Fund | | | | | | | | | | | | | | | | | | | | |
Counterparty | | | | | | | | | | | | | | | | | | | | |
BNDP | | | $ 42,331 | | | | $ (42,331 | ) | | | $ — | | | | $ — | | | | $ — | |
BZWS | | | 954,656 | | | | (528,218 | ) | | | — | | | | (410,000 | ) | | | 16,438 | |
CITI | | | 15,978,816 | | | | (2,489,625 | ) | | | — | | | | (13,220,000 | ) | | | 269,191 | |
DBAB | | | 9,824 | | | | (9,824 | ) | | | — | | | | — | | | | — | |
FBCO | | | — | | | | — | | | | — | | | | — | | | | — | |
GSCO | | | — | | | | — | | | | — | | | | — | | | | — | |
JPHQ | | | 8,836,080 | | | | (3,229,254 | ) | | | — | | | | (5,490,000 | ) | | | 116,826 | |
MSCO | | | — | | | | — | | | | — | | | | — | | | | — | |
| | | | | |
Total | | | $25,821,707 | | | | $(6,299,252 | ) | | | $ — | | | | $(19,120,000 | ) | | | $402,455 | |
aIn some instances, the collateral amounts disclosed in the table above were adjusted due to the requirement to limit collateral amounts to avoid the effect of overcollateralization. Actual collateral received and/or pledged may be more than the amounts disclosed herein.
bAt October 31, 2019, the Fund received U.S. Treasury Bills, Bonds and Notes as collateral for derivatives.
See Note 1(e) regarding derivative financial instruments.
See Abbreviations on page 165.
10. Holdings of 5% Voting Securities of Portfolio Companies
The 1940 Act defines “affiliated companies” to include investments in portfolio companies in which a fund owns 5% or more of the outstanding voting securities. During the year ended October 31, 2019, investments in “affiliated companies” were as follows:
| | | | | | | | | | | | | | | | | | | | | | | | | | | | | | | | |
| Name of Issuer | |
| Value at
Beginning of Year |
| | | Purchases | a | | | Sales | | |
| Realized
Gain (Loss) |
| |
| Net Change in
Unrealized
Appreciation
(Depreciation) |
| |
| Value at
End of Year |
| |
| Number of
Shares/ Units Held at End of Year |
| |
| Investment
Income |
|
| | | | | | | | |
Franklin Floating Rate Daily Access Fund | | | | | | | | | | | | | | | | | | | | | | | | | | | | | | | | |
Non-Controlled Affiliates | | | | | | | | | | | | | | | | | | | | | | | | | | | | | | | | |
| | | | | | | | |
| | | | | | | | | | | | | | | | | | | | | | | | Dividends | |
Appvion Operations Inc. | | $ | 11,581,914 | | | | $1,189,036 | | | | $ — | | | | $ — | | | | $ 3,494,113 | | | $ | 16,265,063 | | | | 1,219,956 | | | | $ — | |
Remington Outdoor Co. Inc. | | | 18,876,774 | | | | 447,384 | | | | — | | | | — | | | | (17,515,226 | ) | | | 1,808,932 | | | | 1,808,932 | | | | — | |
Remington Outdoor Co. Inc., Litigation Units | | | — | | | | — | | | | — | | | | — | | | | — | | | | — | | | | 170,300 | | | | — | |
| | | | | | | | | | | | |
| | | | | | | | |
| | $ | 30,458,688 | | | | $1,636,420 | | | | $ — | | | | $ — | | | | $(14,021,113 | ) | | $ | 18,073,995 | | | | | | | | $ — | |
| | | | | | | | | | | | |
| | | | |
| | | |
158 | | Annual Report | | franklintempleton.com |
FRANKLIN INVESTORS SECURITIES TRUST
NOTES TO FINANCIAL STATEMENTS
| | | | | | | | | | | | | | | | | | | | | | | | | | | | | | | | |
| Name of Issuer | |
| Value at
Beginning of Year |
| | | Purchases | a | | | Sales | | |
| Realized
Gain (Loss) |
| |
| Net Change in
Unrealized Appreciation (Depreciation) |
| |
| Value at
End of Year |
| |
| Number of
Shares/ Units Held at End of Year |
| |
| Investment
Income |
|
| | | |
Franklin Floating Rate Daily Access Fund(continued) | | | | | | | | | | | | | |
Non-Controlled Affiliates(continued) | | | | | | | | | | | | | |
| | | |
| | | | | | | | | | Interest | |
Appvion Operations Inc., Term Loan, 6/15/26 | | $ | 53,498,450 | | | $ | 2,031,391 | | | $ | (10,313,074 | )b | | $ | 15,659 | | | $ | 403,680 | | | $ | 45,636,106 | | | | 45,184,263 | | | $ | 4,180,654 | |
| | | | | | | | | | | | |
Total Affiliated Securities(Value is 2.9% of Net Assets) | | $ | 83,957,138 | | | | $3,667,811 | | | $ | (10,313,074 | ) | | | $15,659 | | | | $(13,617,433 | ) | | $ | 63,710,101 | | | | | | | | $4,180,654 | |
| | | | | | | | | | | | |
aPurchases were the result of an in-kind transfer of securities.
bMay include accretion, amortization, partnership adjustments, and/or other cost basis adjustments.
11. Upcoming Acquisitions/Mergers
On July 17, 2019, the Board for Franklin Investors Securities Trust approved a proposal to reorganize Franklin Real Return Fund with and into Franklin Total Return Fund, subject to approval by the shareholders of Franklin Real Return Fund.
12. Credit Facility
The Funds, together with other U.S. registered and foreign investment funds (collectively, Borrowers), managed by Franklin Templeton, are borrowers in a joint syndicated senior unsecured credit facility totaling $2 billion (Global Credit Facility) which matures on February 7, 2020. This Global Credit Facility provides a source of funds to the Borrowers for temporary and emergency purposes, including the ability to meet future unanticipated or unusually large redemption requests.
Under the terms of the Global Credit Facility, the Funds shall, in addition to interest charged on any borrowings made by the Funds and other costs incurred by the Funds, pay their share of fees and expenses incurred in connection with the implementation and maintenance of the Global Credit Facility, based upon their relative share of the aggregate net assets of all of the Borrowers, including an annual commitment fee of 0.15% based upon the unused portion of the Global Credit Facility. These fees are reflected in other expenses in the Statements of Operations. During the year ended October 31, 2019, the Funds did not use the Global Credit Facility.
13. Fair Value Measurements
The Funds follow a fair value hierarchy that distinguishes between market data obtained from independent sources (observable inputs) and the Funds’ own market assumptions (unobservable inputs). These inputs are used in determining the value of the Funds’ financial instruments and are summarized in the following fair value hierarchy:
| | • | | Level 1 – quoted prices in active markets for identical financial instruments |
| | • | | Level 2 – other significant observable inputs (including quoted prices for similar financial instruments, interest rates, prepayment speed, credit risk, etc.) |
| | • | | Level 3 – significant unobservable inputs (including the Funds’ own assumptions in determining the fair value of financial instruments) |
The input levels are not necessarily an indication of the risk or liquidity associated with financial instruments at that level.
| | | | |
| | | |
| franklintempleton.com | | Annual Report | | 159 |
FRANKLIN INVESTORS SECURITIES TRUST
NOTES TO FINANCIAL STATEMENTS
13. Fair Value Measurements(continued)
A summary of inputs used as of October 31, 2019, in valuing the Funds’ assets and liabilities carried at fair value, is as follows:
| | | | | | | | | | | | | | | | |
| | | Level 1 | | | Level 2 | | | Level 3 | | | Total | |
| | | | |
Franklin Adjustable U.S. Government Securities Fund | | | | | | | | | | | | | | | | |
Assets: | | | | | | | | | | | | | | | | |
Investments in Securities:a | | | | | | | | | | | | | | | | |
Mortgage-Backed Securities | | $ | — | | | $ | 651,600,061 | | | $ | — | | | $ | 651,600,061 | |
Short Term Investments | | | 35,052,748 | | | | 9,446,232 | | | | — | | | | 44,498,980 | |
| | | | |
| | | | |
Total Investments in Securities | | $ | 35,052,748 | | | $ | 661,046,293 | | | $ | — | | | $ | 696,099,041 | |
| | | | |
Franklin Floating Rate Daily Access Fund | | | | | | | | | | | | | | | | |
Assets: | | | | | | | | | | | | | | | | |
Investments in Securities:a | | | | | | | | | | | | | | | | |
Equity Investments:b | | | | | | | | | | | | | | | | |
Diversified Support Services | | $ | — | | | $ | — | | | $ | 1,808,932 | | | $ | 1,808,932 | |
Forest Products | | | — | | | | — | | | | 16,265,063 | | | | 16,265,063 | |
Oil & Gas Exploration & Production | | | — | | | | 9,304,727 | | | | — | | | | 9,304,727 | |
All Other Equity Investments | | | 56,546,081 | | | | — | | | | — | | | | 56,546,081 | |
Corporate Bonds | | | — | | | | 19,514,042 | | | | — | | | | 19,514,042 | |
Senior Floating Rate Interests: | | | | | | | | | | | | | | | | |
Personal Products | | | — | | | | 2,705,400 | | | | 61,403,599 | | | | 64,108,999 | |
All Other Senior Floating Rate Interests | | | — | | | | 1,754,039,571 | | | | — | | | | 1,754,039,571 | |
Asset-Backed Securities | | | — | | | | 195,919,781 | | | | — | | | | 195,919,781 | |
Escrows and Litigation Trusts | | | — | | | | — | | | | — | c | | | — | |
Short Term Investments | | | 103,958,277 | | | | — | | | | — | | | | 103,958,277 | |
| | | | |
| | | | |
Total Investments in Securities | | $ | 160,504,358 | | | $ | 1,981,483,521 | | | $ | 79,477,594 | | | $ | 2,221,465,473 | |
| | | | |
Liabilities: | | | | | | | | | | | | | | | | |
Other Financial Instruments: | | | | | | | | | | | | | | | | |
Swap Contracts | | $ | — | | | $ | 369,172 | | | $ | — | | | $ | 369,172 | |
| | | | |
| | | | |
| | | |
160 | | Annual Report | | franklintempleton.com |
FRANKLIN INVESTORS SECURITIES TRUST
NOTES TO FINANCIAL STATEMENTS
| | | | | | | | | | | | | | | | |
| | | Level 1 | | | Level 2 | | | Level 3 | | | Total | |
| |
| | | | |
Franklin Low Duration Total Return Fund | | | | | | | | | | | | | | | | |
Assets: | | | | | | | | | | | | | | | | |
Investments in Securities:a | | | | | | | | | | | | | | | | |
Equity Investments:b | | | | | | | | | | | | | | | | |
Commercial & Professional Services | | $ | — | | | $ | — | | | $ | 170,787 | | | $ | 170,787 | |
Energy | | | 41,414 | | | | — | | | | 4,511 | c | | | 45,925 | |
Materials | | | 20,561 | | | | — | | | | 329,838 | | | | 350,399 | |
Retailing | | | — | | | | — | | | | 8,967 | | | | 8,967 | |
All Other Equity Investments | | | 56,265,464 | | | | — | | | | — | | | | 56,265,464 | |
Corporate Bonds: | | | | | | | | | | | | | | | | |
Retailing | | | — | | | | 30,825,666 | | | | 2,280 | | | | 30,827,946 | |
All Other Corporate Bonds | | | — | | | | 645,756,147 | | | | — | | | | 645,756,147 | |
Senior Floating Rate Interests: | | | | | | | | | | | | | | | | |
Household & Personal Products | | | — | | | | — | | | | 3,233,528 | | | | 3,233,528 | |
All Other Senior Floating Rate Interests | | | — | | | | 71,230,030 | | | | — | | | | 71,230,030 | |
Marketplace Loans | | | — | | | | — | | | | 24,471,922 | | | | 24,471,922 | |
Foreign Government and Agency Securities | | | — | | | | 146,244,899 | | | | — | | | | 146,244,899 | |
U.S. Government and Agency Securities | | | — | | | | 362,945,784 | | | | — | | | | 362,945,784 | |
Asset-Backed Securities and Commercial Mortgage-Backed Securities | | | — | | | | 1,407,284,840 | | | | — | | | | 1,407,284,840 | |
Mortgage-Backed Securities | | | — | | | | 81,023,056 | | | | — | | | | 81,023,056 | |
Municipal Bonds | | | — | | | | 87,437,749 | | | | — | | | | 87,437,749 | |
Escrows and Litigation Trusts | | | — | | | | — | | | | — | c | | | — | |
Short Term Investments | | | 108,041,040 | | | | 2,030,000 | | | | — | | | | 110,071,040 | |
| | | | |
Total Investments in Securities | | $ | 164,368,479 | | | $ | 2,834,778,171 | | | $ | 28,221,833 | | | $ | 3,027,368,483 | |
| | | | |
Other Financial Instruments: | | | | | | | | | | | | | | | | |
Futures Contracts | | $ | 1,100,287 | | | $ | — | | | $ | — | | | $ | 1,100,287 | |
Forward Exchange Contracts | | | — | | | | 1,075,028 | | | | — | | | | 1,075,028 | |
Swap Contracts | | | — | | | | 1,977,495 | | | | — | | | | 1,977,495 | |
| | | | |
Total Other Financial Instruments | | $ | 1,100,287 | | | $ | 3,052,523 | | | $ | — | | | $ | 4,152,810 | |
| | | | |
| | | | |
Liabilities: | | | | | | | | | | | | | | | | |
Other Financial Instruments: | | | | | | | | | | | | | | | | |
Futures Contracts | | $ | 2,331,833 | | | $ | — | | | $ | — | | | $ | 2,331,833 | |
Forward Exchange Contracts | | | — | | | | 1,435,330 | | | | — | | | | 1,435,330 | |
Swap Contracts | | | — | | | | 3,252,257 | | | | — | | | | 3,252,257 | |
| | | | |
Total Other Financial Instruments | | $ | 2,331,833 | | | $ | 4,687,587 | | | $ | — | | | $ | 7,019,420 | |
| | | | |
| | | | |
| | | |
| franklintempleton.com | | Annual Report | | 161 |
FRANKLIN INVESTORS SECURITIES TRUST
NOTES TO FINANCIAL STATEMENTS
13. Fair Value Measurements (continued)
| | | | | | | | | | | | | | | | |
| | | Level 1 | | | Level 2 | | | Level 3 | | | Total | |
| |
| | | | |
Franklin Total Return Fund | | | | | | | | | | | | | | | | |
Assets: | | | | | | | | | | | | | | | | |
Investments in Securities:a | | | | | | | | | | | | | | | | |
Equity Investments:b | | | | | | | | | | | | | | | | |
Commercial & Professional Services | | $ | — | | | $ | — | | | $ | 52,019 | | | $ | 52,019 | |
Consumer Services | | | — | | | | — | | | | 34,113 | | | | 34,113 | |
Energy | | | 184,136 | | | | — | | | | 10,552 | c | | | 194,688 | |
Materials | | | 103,087 | | | | — | | | | 173,760 | | | | 276,847 | |
Retailing | | | — | | | | — | | | | 20,923 | | | | 20,923 | |
All Other Equity Investments | | | 408,042,431 | | | | — | | | | — | | | | 408,042,431 | |
Corporate Bonds: | | | | | | | | | | | | | | | | |
Retailing | | | — | | | | 19,046,360 | | | | 5,321 | | | | 19,051,681 | |
All Other Corporate Bonds | | | — | | | | 745,170,910 | | | | — | | | | 745,170,910 | |
Senior Floating Rate Interests: | | | | | | | | | | | | | | | | |
Household & Personal Products | | | — | | | | — | | | | 1,703,435 | | | | 1,703,435 | |
All Other Senior Floating Rate Interests | | | — | | | | 137,321,538 | | | | — | | | | 137,321,538 | |
Marketplace Loans | | | — | | | | — | | | | 1,560,709 | | | | 1,560,709 | |
Foreign Government and Agency Securities | | | — | | | | 294,284,173 | | | | — | | | | 294,284,173 | |
U.S. Government and Agency Securities | | | — | | | | 668,347,791 | | | | — | | | | 668,347,791 | |
Asset-Backed Securities and Commercial | | | | | | | | | | | | | | | | |
Mortgage-Backed Securities: | | | | | | | | | | | | | | | | |
Banks | | | — | | | | 37,083,499 | | | | 10,010 | | | | 37,093,509 | |
All Other Asset-Backed Securities and | | | | | | | | | | | | | | | | |
Commercial Mortgage-Backed Securities | | | — | | | | 1,410,682,137 | | | | — | | | | 1,410,682,137 | |
Mortgage-Backed Securities | | | — | | | | 1,352,312,148 | | | | — | | | | 1,352,312,148 | |
Municipal Bonds | | | — | | | | 163,099,399 | | | | — | | | | 163,099,399 | |
Escrows and Litigation Trusts | | | — | | | | — | | | | — | c | | | — | |
Short Term Investments | | | 373,627,760 | | | | — | | | | — | | | | 373,627,760 | |
| | | | |
Total Investments in Securities | | $ | 781,957,414 | | | $ | 4,827,347,955 | | | $ | 3,570,842 | | | $ | 5,612,876,211 | |
| | | | |
Other Financial Instruments: | | | | | | | | | | | | | | | | |
Futures Contracts | | $ | 663,563 | | | $ | — | | | $ | — | | | $ | 663,563 | |
Forward Exchange Contracts | | | — | | | | 2,423,861 | | | | — | | | | 2,423,861 | |
Swap Contracts | | | — | | | | 3,463,565 | | | | — | | | | 3,463,565 | |
| | | | |
Total Other Financial Instruments | | $ | 663,563 | | | $ | 5,887,426 | | | $ | — | | | $ | 6,550,989 | |
| | | | |
| | | | |
Liabilities: | | | | | | | | | | | | | | | | |
Other Financial Instruments: | | | | | | | | | | | | | | | | |
Futures Contracts | | $ | 14,318,590 | | | $ | — | | | $ | — | | | $ | 14,318,590 | |
Forward Exchange Contracts | | | — | | | | 4,432,397 | | | | — | | | | 4,432,397 | |
Swap Contracts | | | — | | | | 5,879,006 | | | | — | | | | 5,879,006 | |
| | | | |
Total Other Financial Instruments | | $ | 14,318,590 | | | $ | 10,311,403 | | | $ | — | | | $ | 24,629,993 | |
| | | | |
aFor detailed categories, see the accompanying Statement of Investments.
bIncludes common and preferred stocks and management investment companies as well as other equity interests.
cIncludes securities determined to have no value at October 31, 2019.
| | | | |
| | | |
162 | | Annual Report | | franklintempleton.com |
FRANKLIN INVESTORS SECURITIES TRUST
NOTES TO FINANCIAL STATEMENTS
A reconciliation of assets in which Level 3 inputs are used in determining fair value is presented when there are significant Level 3 financial instruments at the beginning and/or end of the year. At October 31, 2019, the reconciliation of assets, is as follows:
| | | | | | | | | | | | | | | | | | | | | | | | | | | | | | | | | | | | |
| | | Balance at Beginning of Year | | | Purchases | | | Sales | | | Transfer
Into(Out of)
Level 3 | | | Cost Basis
Adjustmentsa | | | Net
Realized
Gain
(Loss) | | | Net
Unrealized
Appreciation (Depreciation) | | | Balance at End of Year | | | Net Change in Unrealized
Appreciation
(Depreciation)
on Assets
Held at
Year End | |
| |
Franklin Floating Rate Daily Access Fund | | | | | | | | | | | | | | | | | | | | | | | | | | | | |
Assets: | | | | | | | | | | | | | | | | | | | | | | | | | | | | |
Investments in Securities: | | | | | | | | | | | | | | | | | | | | | �� | | | | | | | |
Equity Investments:b | | | | | | | | | | | | | | | | | | | | | | | | | | | | |
Diversified Support Services | | $ | 18,876,774 | | | $ | 447,384 | d | | $ | — | | | $ | — | | | $ | — | | | $ | — | | | $ | (17,515,226 | ) | | $ | 1,808,932 | | | $ | (17,515,226 | ) |
Forest Products | | | 11,581,914 | | | | 1,189,036 | d | | | — | | | | — | | | | — | | | | — | | | | 3,494,113 | | | | 16,265,063 | | | | 3,494,113 | |
Senior Floating Rate Interests: | | | | | | | | | | | | | | | | | | | | | | | | | | | | |
Personal Products | | | 45,928,772 | | | | 11,146,386 | d | | | — | | | | — | | | | 4,261,188 | | | | — | | | | 67,253 | | | | 61,403,599 | | | | 67,253 | |
Escrows and Litigation Trusts | | | — | c | | | — | c,d | | | — | | | | — | | | | — | | | | — | | | | — | | | | — | c | | | — | |
| | | | |
Total Investments in Securities | | $ | 76,387,460 | | | $ | 12,782,806 | | | $ | — | | | $ | — | | | $ | 4,261,188 | | | $ | — | | | $ | (13,953,860 | ) | | $ | 79,477,594 | | | $ | (13,953,860 | ) |
| | | | |
aMay include accretion, amortization, partnership adjustments, and/or other cost basis adjustments.
bIncludes common stocks and other equity interests.
cIncludes securities determined to have no value.
dIncludes securities received as a result of an in-kind transfer.
| | | | |
| | | |
| franklintempleton.com | | Annual Report | | 163 |
FRANKLIN INVESTORS SECURITIES TRUST
NOTES TO FINANCIAL STATEMENTS
13. Fair Value Measurements(continued)
Significant unobservable valuation inputs for material Level 3 financial instruments and impact to fair value as a result of changes in unobservable valuation inputs as of October 31, 2019, are as follows:
| | | | | | | | | | | | | | | | |
| Description | | Fair Value at End of Year | | | Valuation Technique | | | Unobservable Input | | Amount/Range (Weighted Averagea) | | | Impact to Fair Value if Input Increasesb |
| | | | | |
| Franklin Floating Rate Daily Access Fund | | | | | | | | | | | | | | | | |
Assets: | | | | | | | | | | | | | | | | |
Investments in Securities: | | | | | | | | | | | | | | | | |
Equity Investments: | | | | | | | | | | | | | | | | |
Forest Products | | $ | 16,265,063 | | | | Discounted cash flow | | | Weighted average cost of capital | | | 17.7% | | | Decreasec |
| | | | | | | | | | Total unlevered free cashflows | | | $162.0 mil | | | Increasec |
| | | | | | | | | | Discount for lack of marketability | | | 20.0% | | | Decreased |
| | | | | | | | | | | Long term growth | | | 0.0% | | | Increase |
Senior Floating Rate | | | | | | | | | | | | | | | | |
Interests: | | | | | | | | | | | | | | | | |
Personal Products | | | 61,403,599 | | | | Discounted cash flow | | | Discount rate | |
| 10.8% - 13.3%
(12.8%) |
| | Decreasec |
| | | | | | | | | | Free cash flow | | | $15.9 - $65.3 mil | | | Increased |
| | | | | | | | | | | | | | (54.5) mil | | | |
All Other Investmentse | | | 1,808,932 | f | | | | | | | | | | | | |
Total | | | 79,477,594 | | | | | | | | | | | | | |
aWeighted based on the relative fair value of the financial instruments.
bRepresents the directional change in the fair value of the Level 3 financial instruments that would result from a significant and reasonable increase in the corresponding input. A significant and reasonable decrease in the input would have the opposite effect. Significant impacts, if any, to fair value and/or net assets have been indicated.
cRepresents a significant impact to fair value and net assets.
dRepresents a significant impact to fair value but not net assets.
eIncludes fair value of immaterial financial instruments developed using various valuation techniques and unobservable inputs. May also include financial instruments with values derived using private transaction prices or non-public third party pricing information which is unobservable.
fIncludes securities determined to have no value at October 31, 2019.
14. Subsequent Events
The Funds have evaluated subsequent events through the issuance of the financial statements and determined that no events have occurred that require disclosure, except for the following:
On December 6, 2019, Franklin Low Duration Total Return Fund (Surviving Fund), pursuant to a plan of reorganization approved on October 18, 2019, by shareholders of Franklin Flexible Alpha Bond Fund (Acquired Fund), a series of Franklin Strategic Series, acquired 100% of the Acquired Fund’s net assets, primarily made up of investment securities, through a tax-free exchange of shares of the Surviving Fund for the net assets of the Acquired Fund. Capital losses obtained by the Surviving Fund may be carried over to offset future capital gains, subject to certain limitations.
| | | | |
| | | |
164 | | Annual Report | | franklintempleton.com |
FRANKLIN INVESTORS SECURITIES TRUST
NOTES TO FINANCIAL STATEMENTS
Abbreviations
| | | | | | | | | | |
| Counterparty | | Currency | | Selected Portfolio |
| | | | | |
BNDP | | BNP Paribas SA | | BRL | | Brazilian Real | | AGMC | | Assured Guaranty Municipal Corp. |
BZWS | | Barclays Bank PLC | | CNY | | Chinese Yuan | | ARM | | Adjustable Rate Mortgage |
CITI | | Citigroup, Inc. | | COP | | Colombian Peso | | BZDIOVRA | | Brazil Cetip DI Interbank Deposit Rate |
DBAB | | Deutsche Bank AG | | DKK | | Danish Krone | | CLO | | Collateralized Loan Obligation |
FBCO | | Credit Suisse Group AG | | DOP | | Dominican Peso | | CME | | Chicago Mercantile Exchange |
GSCO | | The Goldman Sachs Group, Inc. | | EUR | | Euro | | CMT | | Constant Maturity Treasury Index |
JPHQ | | JP Morgan Chase & Co. | | JPY | | Japanese Yen | | CNRR | | China Reverse Repo Rate |
MSCO | | Morgan Stanley | | USD | | United States Dollar | | COF | | Cost of Funds |
| | | | UYU | | Uruguayan Peso | | CPI | | Consumer Price Index |
| | | | ZAR | | South Africa C Rand | | ETF | | Exchange Traded Fund |
| | | | | | | | FRN | | Floating Rate Note |
| | | | | | | | GDP | | Gross Domestic Product |
| | | | | | | | GO | | General Obligation |
| | | | | | | | IO | | Interest Only |
| | | | | | | | LIBOR | | London InterBank Offered Rate |
| | | | | | | | MBS | | Mortgage-Backed Security |
| | | | | | | | PIK | | Payment-In-Kind |
| | | | | | | | RDA | | Redevelopment Agency/Authority |
| | | | | | | | REIT | | Real Estate Investment Trust |
| | | | | | | | SF | | Single Family |
| | | | | | | | T-Bill | | Treasury Bill |
| | | | | | | | T-Note | | Treasury Note |
| | | | | | | | VRI | | Value Recovery Instruments |
| | |
| Index | | |
| |
CDX.NA.HY.Series number | | CDX North America High Yield Index |
CDX.NA.IG.Series number | | CDX North America Investment Grade Index |
MCDX.NA.Series number | | MCDX North America Index |
| | | | |
| | | |
| franklintempleton.com | | Annual Report | | 165 |
FRANKLIN INVESTORS SECURITIES TRUST
Report of Independent Registered Public Accounting Firm
To the Board of Trustees of Franklin Investors Securities Trust and Shareholders of Franklin Adjustable U.S. Government Securities Fund, Franklin Floating Rate Daily Access Fund, Franklin Low Duration Total Return Fund, and Franklin Total Return Fund.
Opinions on the Financial Statements
We have audited the accompanying statements of assets and liabilities, including the statements of investments, of Franklin Adjustable U.S. Government Securities Fund, Franklin Floating Rate Daily Access Fund, Franklin Low Duration Total Return Fund, and Franklin Total Return Fund (the “Funds”) as of October 31, 2019, the related statements of operations for the year ended October 31, 2019, the statements of changes in net assets for each of the two years in the period ended October 31, 2019, including the related notes, and the financial highlights for each of the periods indicated therein (collectively referred to as the “financial statements”). In our opinion, the financial statements present fairly, in all material respects, the financial position of each of the Funds as of October 31, 2019, the results of each of their operations for the year then ended, the changes in each of their net assets for each of the two years in the period ended October 31, 2019 and each of the financial highlights for each of the periods indicated therein in conformity with accounting principles generally accepted in the United States of America.
Basis for Opinions
These financial statements are the responsibility of the Funds’ management. Our responsibility is to express an opinion on the Funds’ financial statements based on our audits. We are a public accounting firm registered with the Public Company Accounting Oversight Board (United States) (PCAOB) and are required to be independent with respect to the Funds in accordance with the U.S. federal securities laws and the applicable rules and regulations of the Securities and Exchange Commission and the PCAOB.
We conducted our audits of these financial statements in accordance with the standards of the PCAOB. Those standards require that we plan and perform the audit to obtain reasonable assurance about whether the financial statements are free of material misstatement, whether due to error or fraud.
Our audits included performing procedures to assess the risks of material misstatement of the financial statements, whether due to error or fraud, and performing procedures that respond to those risks. Such procedures included examining, on a test basis, evidence regarding the amounts and disclosures in the financial statements. Our audits also included evaluating the accounting principles used and significant estimates made by management, as well as evaluating the overall presentation of the financial statements. Our procedures included confirmation of securities owned as of October 31, 2019 by correspondence with the custodian, transfer agent and brokers; when replies were not received from brokers, we performed other auditing procedures. We believe that our audits provide a reasonable basis for our opinions.
PricewaterhouseCoopers LLP
San Francisco, California
December 17, 2019
We have served as the auditor of one or more investment companies in the Franklin Templeton Group of Funds since 1948.
| | | | |
| | | |
166 | | Annual Report | | franklintempleton.com |
FRANKLIN INVESTORS SECURITIES TRUST
Tax Information (unaudited)
Under Section 871(k)(1)(C) of the Internal Revenue Code, the Funds hereby report the maximum amount allowable but no less than the following amounts as interest related dividends for purposes of the tax imposed under Section 871(a)(1)(A) of the Internal Revenue Code for the fiscal year ended October 31, 2019:
| | | | | | | | | | | | |
Franklin Adjustable U.S. Government Securities Fund | | Franklin Floating Rate Daily Access Fund | | | Franklin Low Duration Total Return Fund | | | Franklin Total Return Fund | |
| | | |
$22,297,697 | | $ | 153,191,126 | | | | $90,477,655 | | | $ | 123,612,966 | |
| | | | |
| | | |
| franklintempleton.com | | Annual Report | | 167 |
FRANKLIN INVESTORS SECURITIES TRUST
Board Members and Officers
The name, year of birth and address of the officers and board members, as well as their affiliations, positions held with the Fund, principal occupations during at least the past five years and number of U.S. registered portfolios overseen in the Franklin Templeton fund complex are shown below. Generally, each board member serves a three-year term that continues until that person’s successor is elected and qualified.
| | | | | | | | |
| Independent Board Members |
Name, Year of Birth and Address | | Position | | Length of Time Served | | Number of Portfolios in Fund Complex Overseen by Board Member* | | Other Directorships Held During at Least the Past 5 Years |
| | | | | |
Harris J. Ashton (1932) One Franklin Parkway San Mateo, CA 94403-1906 | | Trustee | | Since 1986 | | 135 | | Bar-S Foods (meat packing company) (1981-2010). |
|
Principal Occupation During at Least the Past 5 Years: Director of various companies; andformerly, Director, RBC Holdings, Inc. (bank holding company) (until 2002); and President, Chief Executive Officer and Chairman of the Board, General Host Corporation (nursery and craft centers) (until 1998). |
| | | | | |
Terrence J. Checki (1945) One Franklin Parkway San Mateo, CA 94403-1906 | | Trustee | | Since 2017 | | 114 | | Hess Corporation (exploration of oil and gas) (2014-present). |
|
Principal Occupation During at Least the Past 5 Years: Member of the Council on Foreign Relations (1996-present); Member of the National Committee on U.S.-China Relations (1999-present); member of the Board of Trustees of the Economic Club of New York (2013-present); member of the Board of Trustees of the Foreign Policy Association (2005-present) and member of various other boards of trustees and advisory boards; andformerly, Executive Vice President of the Federal Reserve Bank of New York and Head of its Emerging Markets and Internal Affairs Group and Member of Management Committee (1995-2014); and Visiting Fellow at the Council on Foreign Relations (2014). |
| | | | | |
Mary C. Choksi (1950) One Franklin Parkway San Mateo, CA 94403-1906 | | Trustee | | Since 2014 | | 135 | | Avis Budget Group Inc. (car rental) (2007-present), Omnicom Group Inc. (advertising and marketing communications services) (2011-present) and White Mountains Insurance Group, Ltd. (holding company) (2017-present). |
|
Principal Occupation During at Least the Past 5 Years: Director of various companies; andformerly, Founder and Senior Advisor, Strategic Investment Group (investment management group) (2015-2017); Founding Partner and Senior Managing Director, Strategic Investment Group (1987–2015); Founding Partner and Managing Director, Emerging Markets Management LLC (investment management firm) (1987-2011); and Loan Officer/Senior Loan Officer/Senior Pension Investment Officer, World Bank Group (international financial institution) (1977-1987). |
| | | | | |
Edith E. Holiday (1952) One Franklin Parkway San Mateo, CA 94403-1906 | | Lead Independent Trustee | | Since 1998 and Lead Independent Trustee since March 2019 | | 135 | | Hess Corporation (exploration of oil and gas) (1993-present), Canadian National Railway (railroad) (2001-present), White Mountains Insurance Group, Ltd. (holding company) (2004-present), Santander Consumer USA Holdings, Inc. (consumer finance) (2016-present), RTI International Metals, Inc. (manufacture and distribution of titanium) (1999-2015) and H.J. Heinz Company (processed foods and allied products) (1994-2013). |
Principal Occupation During at Least the Past 5 Years: Director or Trustee of various companies and trusts; andformerly, Assistant to the President of the United States and Secretary of the Cabinet (1990-1993); General Counsel to the United States Treasury Department (1989-1990); and Counselor to the Secretary and Assistant Secretary for Public Affairs and Public Liaison-United States Treasury Department (1988-1989). |
| | | | |
| | | |
168 | | Annual Report | | franklintempleton.com |
FRANKLIN INVESTORS SECURITIES TRUST
Independent Board Members(continued)
| | | | | | | | |
Name, Year of Birth and Address | | Position | | Length of Time Served | | Number of Portfolios in Fund Complex Overseen by Board Member* | | Other Directorships Held During at Least the Past 5 Years |
| | | | | |
J. Michael Luttig (1954) One Franklin Parkway San Mateo, CA 94403-1906 | | Trustee | | Since 2009 | | 135 | | Boeing Capital Corporation (aircraft financing) (2006-2013). |
|
Principal Occupation During at Least the Past 5 Years: Executive Vice President, Counselor and Senior Advisor to Boeing Chairman and Board of Directors, The Boeing Company (aerospace company) (May 2019); andformerly, General Counsel and member of the Executive Council, The Boeing Company (2006-2019) and Federal Appeals Court Judge, U.S. Court of Appeals for the Fourth Circuit (1991-2006). |
| | | | | |
Larry D. Thompson (1945) One Franklin Parkway San Mateo, CA 94403-1906 | | Trustee | | Since 2007 | | 135 | | The Southern Company (energy company) (2014-present; previously 2010-2012), Graham Holdings Company (education and media organization) (2011-present) and Cbeyond, Inc. (business communications provider) (2010-2012). |
Principal Occupation During at Least the Past 5 Years: Director of various companies; Counsel, Finch McCranie, LLP (law firm) (2015-present); Independent Compliance Monitor and Auditor, Volkswagen AG (manufacturer of automobiles and commercial vehicles) (2017-present); John A. Sibley Professor of Corporate and Business Law, University of Georgia School of Law (2015-present; previously 2011-2012); andformerly, Executive Vice President - Government Affairs, General Counsel and Corporate Secretary, PepsiCo, Inc. (consumer products) (2012-2014); Senior Vice President - Government Affairs, General Counsel and Secretary, PepsiCo, Inc. (2004-2011); Senior Fellow of The Brookings Institution (2003-2004); Visiting Professor, University of Georgia School of Law (2004); and Deputy Attorney General, U.S. Department of Justice (2001-2003). |
| |
| Interested Board Members and Officers |
Name, Year of Birth and Address | | Position | | Length of Time Served | | Number of Portfolios in Fund Complex Overseen by Board Member* | | Other Directorships Held During at Least the Past 5 Years |
| | | | | |
**Gregory E. Johnson (1961) One Franklin Parkway San Mateo, CA 94403-1906 | | Trustee | | Since 2013 | | 147 | | None |
|
Principal Occupation During at Least the Past 5 Years: Chairman of the Board, Member - Office of the Chairman, Director and Chief Executive Officer, Franklin Resources, Inc.; officer and/or director or trustee, as the case may be, of some of the other subsidiaries of Franklin Resources, Inc. and of 39 of the investment companies in Franklin Templeton; Vice Chairman, Investment Company Institute; andformerly, President, Franklin Resources, Inc. (1994-2015). |
| | | | | |
**Rupert H. Johnson, Jr. (1940) One Franklin Parkway San Mateo, CA 94403-1906 | | Chairman of the Board, Trustee and Vice President | | Chairman of the Board since 2013, Trustee since 1987 and Vice President since 1986 | | 135 | | None |
|
Principal Occupation During at Least the Past 5 Years: Vice Chairman, Member - Office of the Chairman and Director, Franklin Resources, Inc.; Director, Franklin Advisers, Inc.; and officer and/or director or trustee, as the case may be, of some of the other subsidiaries of Franklin Resources, Inc. and of 37 of the investment companies in Franklin Templeton. |
| | | | | |
Reema Agarwal (1974) One Franklin Parkway San Mateo, CA 94403-1906 | | Vice President | | Since April 2019 | | Not Applicable | | Not Applicable |
|
Principal Occupation During at Least the Past 5 Years: Senior Vice President, Franklin Advisers, Inc.; and officer of two of the investment companies in Franklin Templeton. |
| | | | |
| | | |
| franklintempleton.com | | Annual Report | | 169 |
FRANKLIN INVESTORS SECURITIES TRUST
Interested Board Members and Officers(continued)
| | | | | | | | | | |
Name, Year of Birth and Address | | Position | | Length of Time Served | | Number of Portfolios in Fund Complex Overseen
by Board Member* | | Other Directorships Held During at Least the Past 5 Years |
| | | | | |
Alison E. Baur (1964) One Franklin Parkway San Mateo, CA 94403-1906 | | Vice President | | Since 2012 | | Not Applicable | | Not Applicable |
|
Principal Occupation During at Least the Past 5 Years: Deputy General Counsel, Franklin Templeton; and officer of some of the other subsidiaries of Franklin Resources, Inc. and of 41 of the investment companies in Franklin Templeton. |
| | | | | |
Gaston Gardey (1967) One Franklin Parkway San Mateo, CA 94403-1906 | | Treasurer, Chief Financial Officer and Chief Accounting Officer | | Since 2009 | | Not Applicable | | Not Applicable |
Principal Occupation During at Least the Past 5 Years: Treasurer, U.S. Fund Administration & Reporting and officer of 24 of the investment companies in Franklin Templeton. |
| | | | | |
Aliya S. Gordon (1973) One Franklin Parkway San Mateo, CA 94403-1906 | | Vice President | | Since 2009 | | Not Applicable | | Not Applicable |
Principal Occupation During at Least the Past 5 Years: Senior Associate General Counsel, Franklin Templeton; Vice President and Secretary, Franklin Resources, Inc.; and officer of 41 of the investment companies in Franklin Templeton. |
| | | | | |
Steven J. Gray (1955) One Franklin Parkway San Mateo, CA 94403-1906 | | Vice President and Co- Secretary | | Vice President since 2009 and Co-Secretary since January 2019 | | Not Applicable | | Not Applicable |
|
Principal Occupation During at Least the Past 5 Years: Senior Associate General Counsel, Franklin Templeton; Vice President, Franklin Templeton Distributors, Inc. and FASA, LLC; and officer of 41 of the investment companies in Franklin Templeton. |
| | | | | |
Matthew T. Hinkle (1971) One Franklin Parkway San Mateo, CA 94403-1906 | | Chief Executive Officer – Finance and Administration | | Since 2017 | | Not Applicable | | Not Applicable |
|
Principal Occupation During at Least the Past 5 Years: Senior Vice President, Franklin Templeton Services, LLC; officer of 41 of the investment companies in Franklin Templeton; andformerly, Vice President, Global Tax (2012-April 2017) and Treasurer/Assistant Treasurer, Franklin Templeton (2009-2017). |
| | | | | |
Robert Lim (1948) One Franklin Parkway San Mateo, CA 94403-1906 | | Vice President –AML Compliance | | Since 2016 | | Not Applicable | | Not Applicable |
|
Principal Occupation During at Least the Past 5 Years: Vice President, Franklin Templeton Companies, LLC; Chief Compliance Officer, Franklin Templeton Distributors, Inc. and Franklin Templeton Investor Services, LLC; and officer of 41 of the investment companies in Franklin Templeton. |
| | | | |
| | | |
170 | | Annual Report | | franklintempleton.com |
FRANKLIN INVESTORS SECURITIES TRUST
Interested Board Members and Officers(continued)
| | | | | | | | |
Name, Year of Birth and Address | | Position | | Length of Time Served | | Number of Portfolios in Fund Complex Overseen
by Board Member* | | Other Directorships Held During at Least the Past 5 Years |
| | | | | |
Kimberly H. Novotny (1972) 300 S.E. 2nd Street Fort Lauderdale, FL 33301-1923 | | Vice President | | Since 2013 | | Not Applicable | | Not Applicable |
Principal Occupation During at Least the Past 5 Years: Senior Associate General Counsel, Franklin Templeton; Vice President and Corporate Secretary, Fiduciary Trust International of the South; Vice President, Templeton Investment Counsel, LLC; Assistant Secretary, Franklin Resources, Inc.; and officer of 41 of the investment companies in Franklin Templeton. |
| | | | | |
Edward D. Perks (1970) One Franklin Parkway San Mateo, CA 94403-1906 | | President and Chief Executive Officer – Investment Management | | Since December 2018 | | Not Applicable | | Not Applicable |
|
Principal Occupation During at Least the Past 5 Years: President and Director, Franklin Advisers, Inc.; and officer of eight of the investment companies in Franklin Templeton (since December 2018). |
| | | | | |
Robert C. Rosselot (1960) 300 S.E. 2nd Street Fort Lauderdale, FL 33301-1923 | | Chief Compliance Officer | | Since 2013 | | Not Applicable | | Not Applicable |
|
Principal Occupation During at Least the Past 5 Years: Director, Global Compliance, Franklin Templeton; Vice President, Franklin Templeton Companies, LLC; officer of 41 of the investment companies in Franklin Templeton; andformerly, Senior Associate General Counsel, Franklin Templeton (2007-2013); and Secretary and Vice President, Templeton Group of Funds (2004-2013). |
| | | | | |
Navid J. Tofigh (1972) One Franklin Parkway San Mateo, CA 94403-1906 | | Vice President | | Since 2015 | | Not Applicable | | Not Applicable |
|
Principal Occupation During at Least the Past 5 Years: Associate General Counsel and officer of 41 of the investment companies in Franklin Templeton. |
| | | | | |
Craig S. Tyle (1960) One Franklin Parkway San Mateo, CA 94403-1906 | | Vice President | | Since 2005 | | Not Applicable | | Not Applicable |
|
Principal Occupation During at Least the Past 5 Years: General Counsel and Executive Vice President, Franklin Resources, Inc.; and officer of some of the other subsidiaries of Franklin Resources, Inc. and of 41 of the investment companies in Franklin Templeton. |
| | | | | |
Lori A. Weber (1964) 300 S.E. 2nd Street Fort Lauderdale, FL 33301-1923 | | Vice President and Co- Secretary | | Vice President since 2011 and Co-Secretary since January 2019 | | Not Applicable | | Not Applicable |
|
Principal Occupation During at Least the Past 5 Years: Senior Associate General Counsel, Franklin Templeton; Assistant Secretary, Franklin Resources, Inc.; Vice President and Secretary, Templeton Investment Counsel, LLC; and officer of 41 of the investment companies in Franklin Templeton. |
*We base the number of portfolios on each separate series of the U.S. registered investment companies within the Franklin Templeton fund complex. These portfolios have a common investment manager or affiliated investment managers.
**Gregory E. Johnson is considered to be an interested person of the Fund under the federal securities laws due to his position as an officer and director of Franklin Resources, Inc. (Resources), which is the parent company of the Fund’s investment manager and distributor. Rupert H. Johnson, Jr. is considered to be an interested person of the Fund under the federal securities laws due to his position as officer and director and major shareholder of Resources.
Note 1: Rupert H. Johnson, Jr. is the uncle of Gregory E. Johnson.
Note 2: Effective March 12, 2019, John B. Wilson ceased to be a trustee of the Trust.
| | | | |
| | | |
| franklintempleton.com | | Annual Report | | 171 |
FRANKLIN INVESTORS SECURITIES TRUST
Note 3: Officer information is current as of the date of this report. It is possible that after this date, information about officers may change.
The Sarbanes-Oxley Act of 2002 and Rules adopted by the Securities and Exchange Commission require the Fund to disclose whether the Fund’s Audit Committee includes at least one member who is an audit committee financial expert within the meaning of such Act and Rules. The Fund’s Board has determined that there is at least one such financial expert on the Audit Committee and has designated Mary C. Choksi as its audit committee financial expert. The Board believes that Ms. Choksi qualifies as such an expert in view of her extensive business background and experience. She currently serves as a director of Avis Budget Group, Inc. (2007-present) and formerly, Founder and Senior Advisor, Strategic Investment Group (1987 to 2017). Ms. Choksi has been a Member of the Fund’s Audit Committee since 2014. As a result of such background and experience, the Board believes that Ms. Choksi has acquired an understanding of generally accepted accounting principles and financial statements, the general application of such principles in connection with the accounting estimates, accruals and reserves, and analyzing and evaluating financial statements that present a breadth and level of complexity of accounting issues generally comparable to those of the Fund, as well as an understanding of internal controls and procedures for financial reporting and an understanding of audit committee functions. Ms. Choksi is an independent Board member as that term is defined under the relevant Securities and Exchange Commission Rules and Releases.
The Statement of Additional Information (SAI) includes additional information about the board members and is available, without charge, upon request. Shareholders may call (800) DIAL BEN/342-5236 to request the SAI.
| | | | |
| | | |
172 | | Annual Report | | franklintempleton.com |
FRANKLIN INVESTORS SECURITIES TRUST
Shareholder Information
Proxy Voting Policies and Procedures
The Trust’s investment manager has established Proxy Voting Policies and Procedures (Policies) that the Trust uses to determine how to vote proxies relating to portfolio securities. Shareholders may view the Trust’s complete Policies online at franklintempleton.com. Alternatively, shareholders may request copies of the Policies free of charge by calling the Proxy Group collect at (954) 527-7678 or by sending a written request to: Franklin Templeton Companies, LLC, 300 S.E. 2nd Street, Fort Lauderdale, FL 33301, Attention: Proxy Group. Copies of the Trust’s proxy voting records are also made available online at franklintempleton.com and posted on the U.S. Securities and Exchange Commission’s website at sec.gov and reflect the most recent 12-month period ended June 30.
Quarterly Statement of Investments
The Trust files a complete statement of investments with the U.S. Securities and Exchange Commission for the first and third quarters for each fiscal year as an exhibit to its report on Form N-PORT. Shareholders may view the filed Form N-PORT by visiting the Commission’s website at sec.gov. The filed form may also be viewed and copied at the Commission’s Public Reference Room in Washington, DC. Information regarding the operations of the Public Reference Room may be obtained by calling (800) SEC-0330.
Householding of Reports and Prospectuses
You will receive each Fund’s financial reports every six months as well as an annual updated summary prospectus (prospectus available upon request). To reduce Fund expenses, we try to identify related shareholders in a household and send only one copy of the financial reports and summary prospectus. This process, called “householding,” will continue indefinitely unless you instruct us otherwise. If you prefer not to have these documents householded, please call us at (800) 632-2301. At any time you may view current prospectuses/summary prospectuses and financial reports on our website. If you choose, you may receive these documents through electronic delivery.
| | | | |
| | | |
| franklintempleton.com | | Annual Report | | 173 |
This page intentionally left blank.
This page intentionally left blank.
This page intentionally left blank.
Authorized for distribution only when accompanied or preceded by a summary prospectus and/or prospectus. Investors should carefully consider a fund’s investment goals, risks, charges and expenses before investing. A prospectus contains this and other information; please read it carefully before investing.
To help ensure we provide you with quality service, all calls to and from our service areas are monitored and/or recorded.
| | | | | | | | |
 | | Annual Report and Shareholder Letter Franklin Investors Securities Trust |
| | | | |
| | Investment Manager | | Subadvisor | | Distributor | | Shareholder Services |
| | Franklin Advisers, Inc. | | Franklin Templeton | | Franklin Templeton | | (800) 632-2301 |
| | | | Institutional, LLC | | Distributors, Inc. | | |
| | | | | | (800) DIAL BEN® /342-5236 | | |
| | | | | | franklintempleton.com | | |
| | |
| © 2019 Franklin Templeton Investments. All rights reserved. | | FIST2 A 12/19 |

| | |
| | | Franklin Convertible Securities Fund |
| | |
| | Franklin Equity Income Fund |
| | |
| | Franklin Managed Income Fund Formerly, Franklin Balanced Fund |
| | |
| | |
| | Franklin Real Return Fund |
| | |
Sign up for electronic delivery at franklintempleton.com/edelivery
Internet Delivery of Fund Reports Unless You Request Paper Copies: Effective January 1, 2021, as permitted by the SEC, paper copies of the Fund’s shareholder reports will no longer be sent by mail, unless you specifically request them from the Fund or your financial intermediary. Instead, the reports will be made available on a website, and you will be notified by mail each time a report is posted and provided with a website link to access the report.
If you already elected to receive shareholder reports electronically, you will not be affected by this change and you need not take any action. If you have not signed up for electronic delivery, we would encourage you to join fellow shareholders who have. You may elect to receive shareholder reports and other communications electronically from the Fund by calling (800)632-2301 or by contacting your financial intermediary.
You may elect to continue to receive paper copies of all your future shareholder reports free of charge by contacting your financial intermediary or, if you invest directly with a Fund, calling (800)632-2301 to let the Fund know of your request. Your election to receive reports in paper will apply to all funds held in your account.
SHAREHOLDER LETTER
Dear Shareholder:
During the 12 months ended October 31, 2019, the U.S. economy continued to grow, but at a more moderate pace mainly due to concerns about trade. The U.S. Federal Reserve (Fed) raised the federal funds rate by 0.25% at its December 2018 meeting, increasing the rate from 2.25% to 2.50%, but lowered it by 0.25% at each of its July, September and October 2019 meetings, resulting in a rate of 1.75% byperiod-end. The Fed cited muted inflation pressures and the potential effects of global trade tensions on economic growth as rationale for easing the rate. The10-year U.S. Treasury yield began the period at 3.15% and decreased to 1.69% atperiod-end.
In this environment, the prices of U.S. stocks, as measured by the Standard & Poor’s® 500 Index (S&P 500®), rose 12.02% (the index increasing from 2,711.74 to 3,037.56).1,2 Investment-grade bonds, as measured by the Bloomberg Barclays U.S. Aggregate Bond Index (Bloomberg Index), posted a +11.51% total return (an index increase from 1,997.76 to 2,227.69), which includes reinvestment of interest.3
We are committed to our long-term perspective and disciplined investment approach as we conduct a rigorous, fundamental analysis of securities with a regular emphasis on investment risk management.
We believe active, professional investment management serves investors well. We also recognize the important role of financial advisors in today’s markets and encourage investors to continue to seek their advice. Amid changing markets and economic conditions, we are confident investors
with a well-diversified portfolio and a patient, long-term outlook should be well positioned for the years ahead.
Franklin Investors Securities Trust’s annual report, covering Franklin Convertible Securities Fund, Franklin Equity Income Fund, Franklin Managed Income Fund and Franklin Real Return Fund, includes more detail about prevailing conditions and a discussion about investment decisions during the period. Please remember all securities markets fluctuate, as do mutual fund share prices.
We thank you for investing with Franklin, welcome your questions and comments, and look forward to serving your future investment needs.
Sincerely,
Rupert H. Johnson, Jr.
Chairman
Franklin Investors Securities Trust
This letter reflects our analysis and opinions as of October 31, 2019, unless otherwise indicated. The information is not a complete analysis of every aspect of any market, country, industry, security or fund. Statements of fact are from sources considered reliable.
1. Source: Copyright © 2019, S&P Dow Jones Indices LLC. All rights reserved.
2. Source: Morningstar. The changes in index prices shown for the S&P 500 do not include reinvestments of income and distributions, which are included in their total returns, which were: S&P 500 +14.33% (index total return resulting in an increase from 5,369.49 to 6,138.73).
3. Sources: Morningstar and Bloomberg Barclays Indices. For the Bloomberg Index, only total return as shown is available, not price change without the inclusion of reinvested income and distributions.
See www.franklintempletondatasources.com for additional data provider information.
| | |
| | Not FDIC Insured | May Lose Value | No Bank Guarantee |
| | | | |
| | | |
| franklintempleton.com | | Not part of the annual report | | 1 |
Contents
| | | | |
| | | |
2 | | Annual Report | | franklintempleton.com |
ANNUAL REPORT
Economic and Market Overview
The U.S. economy expanded during the 12 months ended October 31, 2019. After moderating for two consecutive quarters, the economy grew significantly faster in 2019’s first quarter before moderating in the second quarter. However, the economy grew faster in the third quarter, aided by consumer spending, housing investment, government spending, inventory investment and exports. The manufacturing sector expanded during most of the period, but contracted in the last three consecutive months. The services sector continued to expand during the period. The unemployment rate decreased from 3.8% in October 2018 to 3.6% atperiod-end.1 The annual inflation rate, as measured by the Consumer Price Index, decreased from 2.5% in October 2018 to 1.8% atperiod-end.1
The U.S. Federal Reserve (Fed) raised its target range for the federal funds rate by 0.25% at its December 2018 meeting, to 2.25%–2.50%. However, at its July 2019 meeting, the Fed lowered the federal funds target rate range for the first time since December 2008, to 2.00%–2.25%, citing muted inflation pressures and the potential effects of global trade tensions on economic growth. Furthermore, the Fed ended its balance sheet normalization program earlier than previously indicated. The Fed further lowered the federal funds target rate range by 0.25% at its September and October meetings, to 1.50%–1.75%, reiterating the rationale cited in the July meeting.
U.S. equity markets overall rose during the period, benefiting from upbeat economic data and U.S. corporate earnings, the Fed’s 2019 interest-rate cuts and investor optimism about further monetary easing. However, markets reflected concerns about tighter regulation of technology companies, the Fed’s December 2018 rate increase, U.S. political uncertainties (including the impeachment inquiry into President Donald Trump), geopolitical tensions in certain regions, and the impact of U.S. trade disputes with China and other trading partners on global growth and corporate earnings. These concerns were partly alleviated at certain points during the period by occasional easing of trade tensions and optimism about a potential U.S.-China trade deal. The broad U.S. stock market, as measured by the Standard & Poor’s 500 Index (S&P 500), recovered from heightened volatility in December 2018 as well as May and August 2019,
reaching newall-time highs in October amid a number of better-than-expected corporate earnings reports, investor optimism about a potential phase one of the U.S.-China trade agreement and the Fed’s third successive rate cut. Overall, the S&P 500 posted a +14.33% total return for the12-month period.2
The foregoing information reflects our analysis and opinions as of October 31, 2019. The information is not a complete analysis of every aspect of any market, country, industry, security or fund. Statements of fact are from sources considered reliable.
1. Source: Bureau of Labor Statistics
2. Source: Morningstar.
See www.franklintempletondatasources.com for additional data provider information.
| | | | |
| | | |
| franklintempleton.com | | Annual Report | | 3 |
Franklin Convertible Securities Fund
This annual report for Franklin Convertible Securities Fund covers the fiscal year ended October 31, 2019. The Fund closed to new investors with limited exceptions on August 29, 2018. Existing investors may continue to purchase additional shares of the Fund.
Your Fund’s Goal and Main Investments
The Fund seeks to maximize total return, consistent with reasonable risk, by seeking to optimize capital appreciation and high current income under varying market conditions. The Fund normally invests at least 80% of its net assets in convertible securities and common stock received upon conversion of convertible securities.
Performance Overview
For the 12 months under review, the Fund’s Class A shares posted a +13.84% cumulative total return. In comparison, the Fund’s benchmark, the ICE BofA Merrill Lynch (BofAML) All Alternatives U.S. Convertibles Index, which tracks the domestic convertible securities market, posted a +14.66% total return.1 You can find the Fund’s long-term performance data in the Performance Summary beginning on page 7.
Performance data represent past performance, which does not guarantee future results. Investment return and principal value will fluctuate, and you may have a gain or loss when you sell your shares. Current performance may differ from figures shown. For most recentmonth-end performance, go tofranklintempleton.comor call(800)342-5236.
Investment Strategy
When choosing convertible securities for the Fund, we attempt to maintain a balance in the portfolio between the equity and debt characteristics of convertible securities with an emphasis on the equity features. We also consider the company’s long-term earnings, asset value and cash flow potential. By investing in convertible securities, the Fund seeks the opportunity to participate in the capital appreciation of underlying stocks, while at the same time relying on the fixed income aspect of the convertible securities to provide current income and reduced price volatility, which can limit the risk of loss in a down equity
Portfolio Composition
Based on Total Net Assets as of 10/31/19
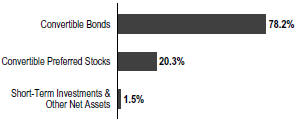
market. Some of the convertible securities in which the Fund may invest have been structured to provide enhanced yield, increased equity exposure or enhanced downside protection. These securities typically provide a benefit to the issuer in exchange for the enhanced features, such as a conversion premium that is paid by the Fund. We may invest in convertible securities of companies of any capitalization size, but we generally seek to make the portfolio representative of the entire convertible securities market.
Manager’s Discussion
The information technology (IT), consumer discretionary and utilities sectors contributed most to Fund performance during the period. Among a number of IT positions that contributed notably to performance, the Fund’s holdings of convertible bonds issued by enterprise-grade identity management services provider Okta, software hosting services provider Atlassian and enterprise IT management software provider ServiceNow were top contributors. Okta issued lower fiscal-year 2020 earnings guidance due to anticipated investments related to its acquisition of Azuqua (not a Fund holding) and efforts to capture new cloud customers. However, shares of Okta benefited from better-than-expected revenue and financial results during the period, and we believe the company’s larger number of third-party, niche integrations, better reliability and growing platform of identity solutions may give it an advantage over competitors. Shares of Atlassian were propelled by higher-than-ever fiscal 2019 revenue and a record number of customers for its cloud platform automation products, including Trello and Jira.
1. Source: Morningstar.
The index is unmanaged and includes reinvestment of any income or distributions. It does not reflect any fees, expenses or sales charges. One cannot invest directly in an index, and an index is not representative of the Fund’s portfolio.
See www.franklintempletondatasources.com for additional data provider information.
The dollar value, number of shares or principal amount, and names of all portfolio holdings are listed in the Fund’s Statement of Investments (SOI).
The SOI begins on page 37.
| | | | |
| | | |
4 | | Annual Report | | franklintempleton.com |
FRANKLIN CONVERTIBLE SECURITIES FUND
Top 10 Holdings
10/31/19
| | | | |
Company Sector/Industry | | % of Total Net Assets | |
| |
Microchip Technology Inc. Information Technology | | | 2.4% | |
Sempra Energy Utilities | | | 2.3% | |
RH ConsumerDiscretionary | | | 2.1% | |
Insulet Corp. Health Care | | | 2.1% | |
Viavi Solutions Inc. Information Technology | | | 2.1% | |
Illumina Inc. Health Care | | | 2.0% | |
Broadcom Inc. Information Technology | | | 2.0% | |
DocuSign Inc. InformationTechnology | | | 2.0% | |
DexCom Inc. Health Care | | | 2.0% | |
Okta Inc. Information Technology | | | 2.0% | |
In consumer discretionary, our holdings of convertible bonds issued bye-commerce company Etsy and online commerce platform provider MercadoLibre contributed to performance. Shares of Etsy advanced as the company raised fees and improved its site functionality and sellers experienced increased business growth and exposure. In utilities, our holdings of a security convertible into shares of electric and gas utilities holding company Sempra Energy contributed to performance. In other sectors, our holdings of convertible preferred stocks issued by diabetes medical device company Insulet also aided performance.
In contrast, the materials and energy sectors detracted from Fund performance. In the materials and energy sectors, our holdings in convertible preferred stocks issued by manufacturer International Flavors & Fragrances and convertible bonds issued by oil and gas services company Oil States International detracted from performance. Shares of International Flavors & Fragrances declined based on concerns about the company’s investigation of its Frutarom business acquired last year and disappointing quarterly results.
In other sectors, our holdings in convertible bonds issued by commercial-stage biopharmaceutical companies Sarepta
Therapeutics and Clovis Oncology (not held atperiod-end) and credit card payment processing solutions company Square also hindered performance. Biotechnology company valuations suffered during the period as key U.S. politicians, including presidential candidates, pushed for drug pricing reform. Sarepta’s stock price fell after U.S. Food and Drug Administration regulators raised concerns over two of the company’s important drug candidates aimed at treating Duchenne muscular dystrophy. Clovis reported net losses due to higher selling and research and development expenses and a regulatory settlement.
Thank you for your continued participation in Franklin Convertible Securities Fund. We look forward to serving your future investment needs.
| | |

| | 
Alan E. Muschott, CFA |
| | |

| | 
Matthew D. Quinlan |
| | Eric Webster, CFA Portfolio Management Team |
CFA® is a trademark owned by CFA Institute.
| | | | |
| | | |
| franklintempleton.com | | Annual Report | | 5 |
FRANKLIN CONVERTIBLE SECURITIES FUND
The foregoing information reflects our analysis, opinions and portfolio holdings as of October 31, 2019, the end of the reporting period. The way we implement our main investment strategies and the resulting portfolio holdings may change depending on factors such as market and economic conditions. These opinions may not be relied upon as investment advice or an offer for a particular security. The information is not a complete analysis of every aspect of any market, country, industry, security or the Fund. Statements of fact are from sources considered reliable, but the investment manager makes no representation or warranty as to their completeness or accuracy. Although historical performance is no guarantee of future results, these insights may help you understand our investment management philosophy.
| | | | |
| | | |
6 | | Annual Report | | franklintempleton.com |
FRANKLIN CONVERTIBLE SECURITIES FUND
Performance Summary as of October 31, 2019
The performance tables and graphs do not reflect any taxes that a shareholder would pay on Fund dividends, capital gain distributions, if any, or any realized gains on the sale of Fund shares. Total return reflects reinvestment of the Fund’s dividends and capital gain distributions, if any, and any unrealized gains or losses. Your dividend income will vary depending on dividends or interest paid by securities in the Fund’s portfolio, adjusted for operating expenses of each class. Capital gain distributions are net profits realized from the sale of portfolio securities.
Performance as of 10/31/191
Cumulative total return excludes sales charges. Average annual total return includes maximum sales charges. Sales charges will vary depending on the size of the investment and the class of share purchased. The maximum is 5.50% and the minimum is 0%.Class A:5.50% maximum initial sales charge;Advisor Class:no sales charges. For other share classes, visitfranklintempleton.com.
| | | | | | |
| Share Class | | Cumulative Total Return2 | | | Average Annual Total Return3 |
A4 | | | | | | |
1-Year | | | +13.84 | % | | +7.59% |
| | |
5-Year | | | +55.41 | % | | +7.99% |
| | |
10-Year | | | +182.18 | % | | +10.31% |
| | |
Advisor | | | | | | |
1-Year | | | +14.18 | % | | +14.18% |
| | |
5-Year | | | +57.36 | % | | +9.49% |
| | |
10-Year | | | +189.24 | % | | +11.21% |
| | | | | | | | | | | | |
| | | Distribution | | | 30-Day Standardized Yield6 | |
| | | | | | | | |
| Share Class | | | Rate | 5 | | | (with fee waiver) | | | | (without fee waiver) | |
| |
A | | | 1.94% | | | | 1.39% | | | | 1.39% | |
| |
| | | |
Advisor | | | 2.29% | | | | 1.73% | | | | 1.73% | |
| |
Performance data represent past performance, which does not guarantee future results. Investment return and principal value will fluctuate, and you may have a gain or loss when you sell your shares. Current performance may differ from figures shown. For most recentmonth-end performance, go tofranklintempleton.comor call(800)342-5236.
See page 9 for Performance Summary footnotes.
| | | | |
| | | |
| franklintempleton.com | | Annual Report | | 7 |
FRANKLIN CONVERTIBLE SECURITIES FUND
PERFORMANCE SUMMARY
Total Return Index Comparison for a Hypothetical $10,000 Investment1
Total return represents the change in value of an investment over the periods shown. It includes any applicable maximum sales charge, Fund expenses, account fees and reinvested distributions. The unmanaged index includes reinvestment of any income or distributions. It differs from the Fund in composition and does not pay management fees or expenses. One cannot invest directly in an index.
Class A(11/1/09–10/31/19)
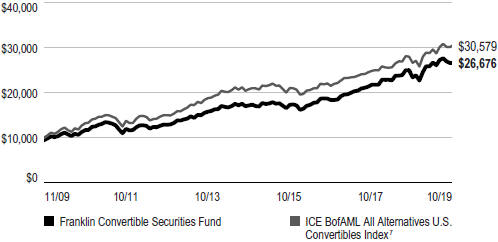
Advisor Class(11/1/09–10/31/19)
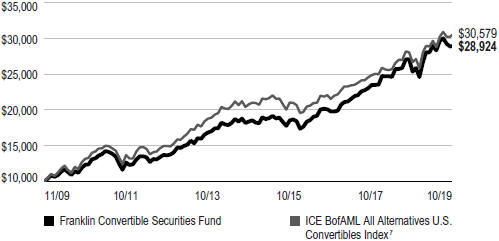
See page 9 for Performance Summary footnotes.
| | | | |
| | | |
8 | | Annual Report | | franklintempleton.com |
FRANKLIN CONVERTIBLE SECURITIES FUND
PERFORMANCE SUMMARY
Distributions(11/1/18–10/31/19)
| | | | | | | | | | | | |
| Share Class | | Net Investment
Income | | | Long-Term
Capital Gain | | | Total | |
| | | |
A | | | $0.4535 | | | | $0.7531 | | | | $1.2066 | |
| | | |
C | | | $0.2793 | | | | $0.7531 | | | | $1.0324 | |
| | | |
R6 | | | $0.5306 | | | | $0.7531 | | | | $1.2837 | |
| | | |
Advisor | | | $0.5079 | | | | $0.7531 | | | | $1.2610 | |
Total Annual Operating Expenses8
| | | | | | | | |
| Share Class | | With Fee
Waiver | | | Without Fee
Waiver | |
| A | | | 0.85% | | | | 0.87% | |
| Advisor | | | 0.60% | | | | 0.62% | |
Each class of shares is available to certain eligible investors and has different annual fees and expenses, as described in the prospectus.
All investments involve risks, including possible loss of principal. Convertible securities are subject to the risks of stocks when the underlying stock price is high relative to the conversion price (because more of the security’s value resides in the conversion feature) and debt securities when the underlying stock price is low relative to the conversion price (because the conversion feature is less valuable). A convertible security is not as sensitive to interest rate changes as a similarnon-convertible debt security, and generally has less potential for gain or loss than the underlying stock. The Fund may invest in high-yielding, fixed income securities. High yields reflect the higher credit risk associated with these lower-rated securities and, in some cases, the lower market prices for these instruments. Interest rate movements may affect the Fund’s share price and yield. Bond prices generally move in the opposite direction of interest rates. As prices of bonds in the Fund adjust to a rise in interest rates, the Fund’s share price may decline. The Fund may also invest in foreign securities, which involve special risks, including political uncertainty and currency volatility. The Fund’s prospectus also includes a description of the main investment risks.
1. The Fund has a fee waiver associated with any investment it makes in a Franklin Templeton money fund and/or other Franklin Templeton fund, contractually guaranteed through 2/29/20. Fund investment results reflect the fee waiver; without this reduction, the results would have been lower.
2. Cumulative total return represents the change in value of an investment over the periods indicated.
3. Average annual total return represents the average annual change in value of an investment over the periods indicated. Return for less than one year, if any, has not been annualized.
4. Prior to 9/10/18, these shares were offered at a higher initial sales charge of 5.75%, thus actual returns (with sales charges) would have differed. Average annual returns (with sales charges) have been restated to reflect the current maximum initial sales charge of 5.50%.
5. Distribution rate is based on an annualization of the respective class’s past four quarterly dividends and the maximum offering price (NAV for Advisor Class) per share on 10/31/19.
6. The Fund’s30-day standardized yield is calculated over a trailing30-day period using the yield to maturity on bonds and/or the dividends accrued on stocks. It may not equal the Fund’s actual income distribution rate, which reflects the Fund’s past dividends paid to shareholders.
7. Source: Morningstar. The ICE BofAML All Alternatives U.S. Convertibles Index comprises domestic securities of all quality grades that are convertible into U.S. dollar-denominated common stock, ADRs or cash equivalents and have a delta (measure of equity sensitivity) that indicates the security likely has a balance between the debt and equity characteristics of the security.
8. Figures are as stated in the Fund’s current prospectus and may differ from the expense ratios disclosed in the Your Fund’s Expenses and Financial Highlights sections in this report. In periods of market volatility, assets may decline significantly, causing total annual Fund operating expenses to become higher than the figures shown.
See www.franklintempletondatasources.com for additional data provider information.
| | | | |
| | | |
| franklintempleton.com | | Annual Report | | 9 |
FRANKLIN CONVERTIBLE SECURITIES FUND
Your Fund’s Expenses
As a Fund shareholder, you can incur two types of costs: (1) transaction costs, including sales charges (loads) on Fund purchases and redemptions; and (2) ongoing Fund costs, including management fees, distribution and service(12b-1) fees, and other Fund expenses. All mutual funds have ongoing costs, sometimes referred to as operating expenses. The table below shows ongoing costs of investing in the Fund and can help you understand these costs and compare them with those of other mutual funds. The table assumes a $1,000 investment held for the six months indicated.
Actual Fund Expenses
The table below provides information about actual account values and actual expenses in the columns under the heading “Actual.” In these columns the Fund’s actual return, which includes the effect of Fund expenses, is used to calculate the “Ending Account Value” for each class of shares. You can estimate the expenses you paid during the period by following these steps (of course, your account value and expenses will differ from those in this illustration): Divide your account value by $1,000 (if your account had an $8,600 value, then $8,600÷ $1,000 = 8.6). Then multiply the result by the number in the row for your class of shares under the headings “Actual” and “Expenses Paid During Period” (if Actual Expenses Paid During Period were $7.50, then 8.6 x $7.50 = $64.50). In this illustration, the actual expenses paid this period are $64.50.
Hypothetical Example for Comparison with Other Funds
Under the heading “Hypothetical” in the table, information is provided about hypothetical account values and hypothetical expenses based on the Fund’s actual expense ratio and an assumed rate of return of 5% per year before expenses, which is not the Fund’s actual return. This information may not be used to estimate the actual ending account balance or expenses you paid for the period, but it can help you compare ongoing costs of investing in the Fund with those of other funds. To do so, compare this 5% hypothetical example for the class of shares you hold with the 5% hypothetical examples that appear in the shareholder reports of other funds.
Please note that expenses shown in the table are meant to highlight ongoing costs and do not reflect any transactional costs. Therefore, information under the heading “Hypothetical” is useful in comparing ongoing costs only, and will not help you compare total costs of owning different funds. In addition, if transactional costs were included, your total costs would have been higher.
| | | | | | | | | | | | | | |
| | | | | Actual
(actual return after expenses) | | | | Hypothetical
(5% annual return before expenses) | | |
Share Class | | Beginning
Account
Value 5/1/19 | | Ending
Account
Value 10/31/19 | | Expenses Paid During Period 5/1/19–10/31/191, 2 | | | | Ending
Account
Value 10/31/19 | | Expenses Paid During
Period 5/1/19–10/31/191, 2 | | Net Annualized
Expense
Ratio2 |
| | | | | | | | |
| A | | $1,000 | | $997.90 | | $4.18 | | | | $1,021.02 | | $4.23 | | 0.83% |
| C | | $1,000 | | $994.00 | | $7.94 | | | | $1,017.24 | | $8.03 | | 1.58% |
| R6 | | $1,000 | | $999.70 | | $2.47 | | | | $1,022.74 | | $2.50 | | 0.49% |
| Advisor | | $1,000 | | $999.20 | | $2.92 | | | | $1,022.28 | | $2.96 | | 0.58% |
1. Expenses are equal to the annualized expense ratio for thesix-month period as indicated above—in the far right column—multiplied by the simple average account value over the period indicated, and then multiplied by 184/365 to reflect theone-half year period.
2. Reflects expenses after fee waivers and expense reimbursements. Does not include acquired fund fees and expenses.
| | | | |
| | | |
10 | | Annual Report | | franklintempleton.com |
Franklin Equity Income Fund
This annual report for Franklin Equity Income Fund covers the fiscal year ended October 31, 2019.
Your Fund’s Goal and Main Investments
The Fund seeks to maximize total return by emphasizing high current income and long-term capital appreciation, consistent with reasonable risk, by normally investing at least 80% of its net assets in equity securities, including securities convertible into common stocks. The Fund may also invest in debt securities and foreign securities, including emerging markets.
Performance Overview
For the 12 months under review, the Fund’s Class A shares posted a +12.73% cumulative total return. In comparison, the Fund’s benchmark, the Standard & Poor’s 500 Index (S&P 500), which tracks the broad U.S. stock market, posted a +14.33% total return.1 The Fund’s peers, as measured by the Lipper Equity Income Funds Classification Average, which consists of funds chosen by Lipper that seek relatively high current income and growth of income by investing at least 60% of their portfolios in stocks, posted a +10.90% total return.2 You can find the Fund’s long-term performance data in the Performance Summary beginning on page 14.
Performance data represent past performance, which does not guarantee future results. Investment return and principal value will fluctuate, and you may have a gain or loss when you sell your shares. Current performance may differ from figures shown. For most recentmonth-end performance, go tofranklintempleton.comor call(800)342-5236.
Investment Strategy
Portfolio Composition
Based on Total Net Assets as of 10/31/19
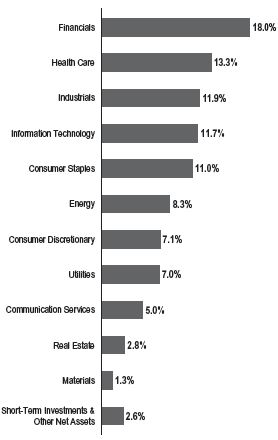
We seek to invest in a broadly diversified portfolio of equity securities that we consider to be financially strong, with a focus on blue chip companies. We apply abottom-up approach to investing in individual securities. We will assess the market price of a company’s securities relative to our evaluation of the company’s long-term earnings, cash flow potential and asset value. We also consider a company’s price/earnings ratio, return on capital, profit margins and
balance sheet strength. We consider dividend yield and the opportunity for dividend growth in selecting stocks for the Fund because we believe that, over time, dividend income can contribute significantly to total return and can be a more consistent source of investment return than capital appreciation. We seek to take advantage of price dislocations that result from the market’s short-term focus and choose to invest in those companies that, in our opinion, offer the besttrade-off between growth opportunity, business and financial risk, and valuation.
1. Source: Morningstar.
2. Source: Lipper, a Thomson Reuters Company. For the12-month period ended 10/31/19, this category consisted of 535 funds. Lipper calculations do not include sales charges, or expense subsidization by a fund’s manager. The Fund’s performance relative to the average may have differed if these and other factors had been considered. The indexes are unmanaged and include reinvestment of any income or distributions. They do not include any fees, expenses or sales charges. One cannot invest directly in an index, and an index is not representative of the Fund’s portfolio.
See www.franklintempletondatasources.com for additional data provider information.
The dollar value, number of shares or principal amount, and names of all portfolio holdings are listed in the Fund’s Statement of Investments (SOI).
The SOI begins on page 46.
| | | | |
| | | |
| franklintempleton.com | | Annual Report | | 11 |
FRANKLIN EQUITY INCOME FUND
Manager’s Discussion
The information technology (IT), consumer staples and financials sectors contributed most to Fund performance during the period. Within IT, software and services firm Microsoft, a notable contributor, is a beneficiary of strong sales execution, a positive enterprise IT spending environment, its status as a critical partner to IT departments in this time of digital transformation, and a large installed base that is successfully moving to higher-value cloud andService-as-a-Software deployments. The company saw sustained strength in its enterprise cloud computing platform Azure, solid growth in its traditional server products and particularly strong growth in commercial bookings. Furthermore, the company continued to expand gross profit margins and control operational expenses.
In consumer staples, branded consumer packaged goods manufacturer Procter & Gamble (P&G) and beverage manufacturer PepsiCo were notable contributors. P&G’s product portfolio management and investment efforts have helped drive strong growth, and the stock rallied as more progress appears likely in the coming years, in our view. Recent quarterly sales increases have been among the fastest in over a decade. P&G has overcome headwinds, including cost increases, negative foreign currency moves and aggressive competition, to increase the breadth of its sales and achieve growth that easily surpassed consensus expectations and prior company guidance. In financials, leading banking companies JPMorgan Chase and Bank of America were top contributors. In other sectors, shares of NextEra Energy and Xcel Energy were boosted in recent months along with some other utilities as interest rates declined and investors sought less-cyclical stocks, underscoring the sector’s traditional role as a haven during times of market and economic uncertainty.
In contrast, the energy, materials and real estate sectors detracted from performance. In energy, Occidental Petroleum and Exxon Mobil hindered results. Shares of Occidental fell with oil prices during the period and its valuation was not helped by its leveraged acquisition of Anadarko Petroleum, which was not viewed as favorable by some investors. In materials, shares of manufacturer International Flavors & Fragrances (not held atperiod-end) declined based on concerns about the company’s investigation of its Frutarom business acquired last year and disappointing quarterly results. In the real estate sector, real estate investment trust Host Hotels and Resorts hurt performance.
In other sectors, industrial, safety and consumer technology products manufacturer 3M; health care products manufacturer Pfizer; and diversified financial services
Top 10 Holdings
10/31/19
| | |
Company Sector/Industry | | % of Total
Net Assets |
| |
JPMorgan Chase & Co. Financials | | 4.3% |
| |
Microsoft Corp. Information Technology | | 3.5% |
| |
Bank of America Corp. Financials | | 3.1% |
| |
The Procter & Gamble Co. Consumer Staples | | 2.7% |
| |
NextEra Energy Inc. Utilities | | 2.4% |
| |
The Coca-Cola Co. Consumer Staples | | 2.3% |
| |
Chevron Corp. Energy | | 2.3% |
| |
PepsiCo Inc. Consumer Staples | | 2.3% |
| |
Morgan Stanley Financials | | 2.3% |
| |
BB&T Corp. Financials | | 2.2% |
company Wells Fargo were key detractors. The stock price of 3M was hurt by disappointing sales results due to slow growth in key end markets.
| | | | |
| | | |
12 | | Annual Report | | franklintempleton.com |
FRANKLIN EQUITY INCOME FUND
Thank you for your continued participation in Franklin Equity Income Fund. We look forward to serving your future investment needs.
| | |
 | | 
Matthew D. Quinlan |

| | 
Alan E. Muschott, CFA |
| | Todd Brighton, CFA Portfolio Management Team |
The foregoing information reflects our analysis, opinions and portfolio holdings as of October 31, 2019, the end of the reporting period. The way we implement our main investment strategies and the resulting portfolio holdings may change depending on factors such as market and economic conditions. These opinions may not be relied upon as investment advice or an offer for a particular security. The information is not a complete analysis of every aspect of any market, country, industry, security or the Fund.
Statements of fact are from sources considered reliable, but the investment manager makes no representation or warranty as to their completeness or accuracy. Although historical performance is no guarantee of future results, these insights may help you understand our investment management philosophy.
| | | | |
| | | |
| franklintempleton.com | | Annual Report | | 13 |
FRANKLIN EQUITY INCOME FUND
Performance Summary as of October 31, 2019
The performance tables and graphs do not reflect any taxes that a shareholder would pay on Fund dividends, capital gain distributions, if any, or any realized gains on the sale of Fund shares. Total return reflects reinvestment of the Fund’s dividends and capital gain distributions, if any, and any unrealized gains or losses. Your dividend income will vary depending on dividends or interest paid by securities in the Fund’s portfolio, adjusted for operating expenses of each class. Capital gain distributions are net profits realized from the sale of portfolio securities.
Performance as of 10/31/191
Cumulative total return excludes sales charges. Average annual total return includes maximum sales charges. Sales charges will vary depending on the size of the investment and the class of share purchased. The maximum is 5.50% and the minimum is 0%.Class A:5.50% maximum initial sales charge;Advisor Class:no sales charges. For other share classes, visitfranklintempleton.com.
| | | | | | |
| Share Class | | Cumulative
Total Return2 | | | | Average Annual
Total Return3 |
| | | |
A4 | | | | | | |
| | | |
1-Year | | +12.73% | | | | +6.51% |
| | | |
5-Year | | +48.90% | | | | +7.07% |
| | | |
10-Year | | +190.10% | | | | +10.61% |
| | | |
Advisor | | | | | | |
| | | |
1-Year | | +13.04% | | | | +13.04% |
| | | |
5-Year | | +50.76% | | | | +8.56% |
| | | |
10-Year | | +197.51% | | | | +11.52% |
| | | | | | | | | | | | |
| | | Distribution | | | 30-Day Standardized Yield6 | |
| Share Class | | | Rate | 5 | | | (with fee waiver) | | | | �� (without fee waiver) | |
| | | |
A | | | 2.20% | | | | 1.67% | | | | 1.67% | |
| | | |
Advisor | | | 2.56% | | | | 2.02% | | | | 2.02% | |
Performance data represent past performance, which does not guarantee future results. Investment return and principal value will fluctuate, and you may have a gain or loss when you sell your shares. Current performance may differ from figures shown. For most recentmonth-end performance, go tofranklintempleton.comor call(800)342-5236.
See page 16 for Performance Summary footnotes.
| | | | |
| | | |
14 | | Annual Report | | franklintempleton.com |
FRANKLIN EQUITY INCOME FUND
PERFORMANCE SUMMARY
Total Return Index Comparison for a Hypothetical $10,000 Investment1
Total return represents the change in value of an investment over the periods shown. It includes any applicable maximum sales charge, Fund expenses, account fees and reinvested distributions. The unmanaged indexes include reinvestment of any income or distributions. They differ from the Fund in composition and do not pay management fees or expenses. One cannot invest directly in an index.
Class A(11/1/09–10/31/19)
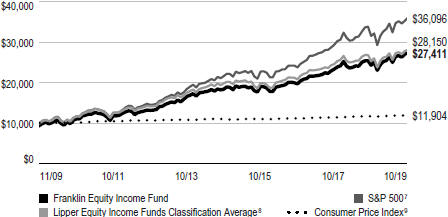
Advisor Class(11/1/09–10/31/19)
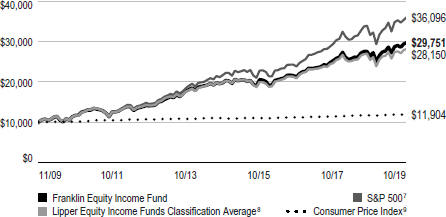
See page 16 for Performance Summary footnotes.
| | | | |
| | | |
| franklintempleton.com | | Annual Report | | 15 |
FRANKLIN EQUITY INCOME FUND
PERFORMANCE SUMMARY
Distributions(11/1/18–10/31/19)
| | | | | | |
| Share Class | | Net Investment
Income | | Long-Term
Capital Gain | | Total |
| | | |
A | | $0.5766 | | $0.9957 | | $1.5723 |
| | | |
C | | $0.3759 | | $0.9957 | | $1.3716 |
| | | |
R | | $0.5174 | | $0.9957 | | $1.5131 |
| | | |
R6 | | $0.6587 | | $0.9957 | | $1.6544 |
| | | |
Advisor | | $0.6396 | | $0.9957 | | $1.6353 |
|
| Total Annual Operating Expenses10 |
| Share Class | | With Fee
Waiver | | Without Fee Waiver | | |
| A | | 0.84% | | 0.85% | | |
| Advisor | | 0.59% | | 0.60% | | |
Each class of shares is available to certain eligible investors and has different annual fees and expenses, as described in the prospectus.
All investments involve risks, including possible loss of principal. Stock prices fluctuate, sometimes rapidly and dramatically, due to factors affecting individual companies, particular industries or sectors, or general market conditions. Convertible securities are subject to the risks of stocks when the underlying stock price is high relative to the conversion price and debt securities when the underlying stock price is low relative to the conversion price. The Fund’s investment in foreign securities also involves special risks, including currency fluctuations and economic as well as political uncertainty. The Fund’s prospectus also includes a description of the main investment risks.
1. The Fund has a fee waiver associated with any investment it makes in a Franklin Templeton money fund and/or other Franklin Templeton fund, contractually guaranteed through 2/29/20. Fund investment results reflect the fee waiver; without this reduction, the results would have been lower.
2. Cumulative total return represents the change in value of an investment over the periods indicated.
3. Average annual total return represents the average annual change in value of an investment over the periods indicated. Return for less than one year, if any, has not been annualized.
4. Prior to 9/10/18, these shares were offered at a higher initial sales charge of 5.75%, thus actual returns (with sales charges) would have differed. Average annual total returns (with sales charges) have been restated to reflect the current maximum initial sales charge of 5.50%.
5. Distribution rate is based on an annualization of the respective class’s current quarterly dividend and the maximum offering price (NAV for Advisor Class) per share on 10/31/19.
6. The Fund’s30-day standardized yield is calculated over a trailing30-day period using the yield to maturity on bonds and/or the dividends accrued on stocks. It may not equal the Fund’s actual income distribution rate, which reflects the Fund’s past dividends paid to shareholders.
7. Source: Morningstar: The S&P 500 is a market capitalization-weighted index of 500 stocks designed to measure total U.S. equity market performance.
8. Source: Lipper, a Thomson Reuters Company. The Lipper Equity Income Funds Classification Average is an equally weighted average calculation of performance figures for all funds within the Lipper Equity Income Funds classification in the LipperOpen-End underlying funds universe. Lipper Equity Income Funds seek relatively high current income and growth of income through investing 60% or more of their portfolios in equities. For theone-year period ended 10/31/19, there were 535 funds in this category. Lipper calculations do not include sales charges or expense subsidization by a fund’s manager. The Fund’s performance relative to the average may have differed if these or other factors had been considered.
9. Source: Bureau of Labor Statistics, bls.gov/cpi. The Consumer Price Index (CPI) is a commonly used measure of the inflation rate.
10. Figures are as stated in the Fund’s current prospectus and may differ from the expense ratios disclosed in the Your Fund’s Expenses and Financial Highlights sections in this report. In periods of market volatility, assets may decline significantly, causing total annual Fund operating expenses to become higher than the figures shown.
See www.franklintempletondatasources.com for additional data provider information.
| | | | |
| | | |
16 | | Annual Report | | franklintempleton.com |
FRANKLIN EQUITY INCOME FUND
Your Fund’s Expenses
As a Fund shareholder, you can incur two types of costs: (1) transaction costs, including sales charges (loads) on Fund purchases and redemptions; and (2) ongoing Fund costs, including management fees, distribution and service(12b-1) fees, and other Fund expenses. All mutual funds have ongoing costs, sometimes referred to as operating expenses. The table below shows ongoing costs of investing in the Fund and can help you understand these costs and compare them with those of other mutual funds. The table assumes a $1,000 investment held for the six months indicated.
Actual Fund Expenses
The table below provides information about actual account values and actual expenses in the columns under the heading “Actual.” In these columns the Fund’s actual return, which includes the effect of Fund expenses, is used to calculate the “Ending Account Value” for each class of shares. You can estimate the expenses you paid during the period by following these steps (of course, your account value and expenses will differ from those in this illustration): Divide your account value by $1,000 (if your account had an $8,600 value, then $8,600÷ $1,000 = 8.6). Then multiply the result by the number in the row for your class of shares under the headings “Actual” and “Expenses Paid During Period” (if Actual Expenses Paid During Period were $7.50, then 8.6 x $7.50 = $64.50). In this illustration, the actual expenses paid this period are $64.50.
Hypothetical Example for Comparison with Other Funds
Under the heading “Hypothetical” in the table, information is provided about hypothetical account values and hypothetical expenses based on the Fund’s actual expense ratio and an assumed rate of return of 5% per year before expenses, which is not the Fund’s actual return. This information may not be used to estimate the actual ending account balance or expenses you paid for the period, but it can help you compare ongoing costs of investing in the Fund with those of other funds. To do so, compare this 5% hypothetical example for the class of shares you hold with the 5% hypothetical examples that appear in the shareholder reports of other funds.
Please note that expenses shown in the table are meant to highlight ongoing costs and do not reflect any transactional costs. Therefore, information under the heading “Hypothetical” is useful in comparing ongoing costs only, and will not help you compare total costs of owning different funds. In addition, if transactional costs were included, your total costs would have been higher.
| | | | | | | | | | | | |
| | | | | Actual | | Hypothetical | | |
| | | | | (actual return after expenses) | | (5% annual return before expenses) | | |
Share Class | | Beginning Account
Value 5/1/19 | | Ending Account
Value 10/31/19 | | Expenses Paid During Period
5/1/19–10/31/191, 2 | | Ending Account
Value 10/31/19 | | Expenses Paid During
Period 5/1/19–10/31/191, 2 | | Net
Annualized
Expense
Ratio2 |
| | | | | | |
| A | | $1,000 | | $1,039.30 | | $4.42 | | $1,020.87 | | $4.38 | | 0.86% |
| C | | $1,000 | | $1,035.30 | | $8.26 | | $1,017.09 | | $8.19 | | 1.61% |
| R | | $1,000 | | $1,038.50 | | $5.65 | | $1,019.66 | | $5.60 | | 1.10% |
| R6 | | $1,000 | | $1,041.30 | | $2.62 | | $1,022.63 | | $2.60 | | 0.51% |
| Advisor | | $1,000 | | $1,041.00 | | $3.14 | | $1,022.13 | | $3.11 | | 0.61% |
1. Expenses are equal to the annualized expense ratio for thesix-month period as indicated above—in the far right column—multiplied by the simple average account value over the period indicated, and then multiplied by 184/365 to reflect theone-half year period.
2. Reflects expenses after fee waivers and expense reimbursements. Does not include acquired fund fees and expenses.
| | | | |
| | | |
| franklintempleton.com | | Annual Report | | 17 |
Franklin Managed Income Fund
Formerly, Franklin Balanced Fund
This annual report for Franklin Managed Income Fund covers the fiscal year ended October 31, 2019. Effective March 1, 2019, Franklin Balanced Fund repositioned to become an income strategy and changed its name to Franklin Managed Income Fund.
Your Fund’s Goal and Main Investments
The Fund seeks to maximize income to support monthly distributions, while maintaining the prospects for capital appreciation by investing, under normal market conditions, in a diversified portfolio of stocks (substantially dividend paying) and debt securities. The Fund normally invests at least 25% of its total assets in debt securities, including bonds, notes, debentures and money market securities, and at least 25% of its total assets in equity securities, primarily common and preferred stock.
Portfolio Composition*
10/31/19
| | |
| | | % of Total
Net Assets |
| |
| Stocks | | 47.5% |
Common Stocks | | 32.6% |
Equity-Linked Securities | | 11.7% |
Convertible Preferred Stocks | | 1.4% |
Management Investment Companies | | 1.0% |
Preferred Stocks | | 0.4% |
Options Purchased | | 0.4% |
| |
Bonds | | 43.6% |
Corporate Bonds | | 34.1% |
U.S. Government and Agency Securities | | 8.0% |
Mortgage-Backed Securities | | 1.1% |
Convertible Bonds | | 0.4% |
| |
| Short-Term Investments & Other Net Assets** | | 8.9% |
*Figures reflect certain derivatives held in the portfolio (or their underlying reference assets) and may not total 100% or may be negative due to rounding, use of derivatives, unsettled trades or other factors.
**Includes money market funds and other net assets (including derivatives).
Performance Overview
For the 12 months under review, the Fund’s Class A shares posted a cumulative total return of +12.64%. In comparison, the Fund’s new primary benchmark, the Bloomberg Barclays U.S. Aggregate Bond Index, which tracks the U.S.
investment-grade, taxable bond market, posted a +11.51% total return.1 The Fund’s new secondary benchmark, the blended 25% ICE BofA Merrill Lynch (BofAML) U.S. Corporate & High Yield Index, 25% Bloomberg Barclays U.S. Aggregate Bond Index and 50% MSCI USA High Dividend Yield Index (Blended Benchmark), which is a combination of leading stock and bond indexes, posted a +12.72% total return.2 The ICE BofAML U.S. Corporate & High Yield Index tracks the performance of U.S. dollar-denominated investment-grade corporate debt publicly issued in the U.S. domestic market, and below investment grade, but not in default, U.S. dollar-denominated corporate bonds publicly issued in the U.S. domestic market, and includes issues with a credit rating of BBB or below, as rated by credit rating agencies Moody’s and Standard & Poor’s. The MSCI USA High Dividend Yield Index is designed to reflect the performance of equities in the MSCI USA Index (excluding REITs) with higher dividend income and quality characteristics than average dividend yields that are both sustainable and persistent. The Bloomberg Barclays U.S. Aggregate Bond Index is replacing the Standard & Poor’s 500 Index (S&P 500) as the Fund’s primary benchmark. The investment manager believes the composition of the Bloomberg Barclays U.S. Aggregate Bond Index represents securities that align more closely with the markets in which the Fund invests. For the same reason, the Fund is adding the Blended Benchmark as a secondary benchmark. The Fund’s prior primary and current third benchmark, the S&P 500, which is a broad measure of U.S. stock performance, posted a +14.33% total return.1 You can find the Fund’s long-term performance data in the Performance Summary beginning on page 22.
Performance data represent past performance, which does not guarantee future results. Investment return and principal value will fluctuate, and you may have a gain or loss when you sell your shares. Current performance may differ from figures shown. For most recentmonth-end performance, go tofranklintempleton.comor call(800)342-5236.
Investment Strategy
We apply abottom-up approach to investing in individual securities. We will assess the market price of a company’s
1. Source: Morningstar.
2. Source: FactSet. The Blended Benchmark was calculated internally and rebalanced monthly.
The indexes are unmanaged and include reinvestment of any income or distributions. One cannot invest directly in an index, and an index is not representative of the Fund’s portfolio.
The dollar value, number of shares or principal amount, and names of all portfolio holdings are listed in the Fund’s Statement of Investments (SOI).
The SOI begins on page 55.
| | | | |
| | | |
18 | | Annual Report | | franklintempleton.com |
FRANKLIN MANAGED INCOME FUND
securities relative to our evaluation of the company’s long-term earnings, asset value and cash flow potential. We also consider a company’s price/earnings ratio, profit margins and liquidation value. In determining an optimal mix of equity and fixed income investments for the Fund, we assess changing economic, market and industry conditions. The Fund seeks income by investing in a combination of corporate, agency and government bonds issued in the U.S. and other countries, as well as common stocks in any market capitalization and convertible securities. The Fund seeks capital appreciation by investing in equity securities and convertible securities of companies from a variety of industries. We may, from time to time, use for various purposes equity-related derivatives, including call and put options and futures on equity securities and equity indexes, options on equity index futures, as well as interest-rate, currency and credit-related derivatives. These purposes include enhancing Fund returns, increasing liquidity, gaining exposure to particular instruments or markets in more efficient or less expensive ways and/or hedging risks. The use of such derivative transactions may allow the Fund to obtain net long or short exposures to selected securities, markets, interest rates, countries, currencies, credits or durations.
|
What are put and call options? |
A put option is a contract giving the owner the right, but not the obligation, to sell a specified amount of an underlying security at a specified price within a specified time. Put options are most commonly used to protect against the decline of a stock price below a certain price. Conversely, a call option gives the holder the right to buy shares at a specified price within a specified time, regardless of the price in the future before the expiration date. If the stock price rises, the holder of the call option has the right to buy at the agreed-upon price, which could be lower. |
|
What is a future? |
A future is an agreement between the Fund and a counterparty made through a U.S. or foreign futures exchange to buy or sell an underlying instrument or asset at a specific price on a future date. |
|
What is duration? |
Duration is a measure of a bond’s price sensitivity to interest-rate changes. In general, a portfolio of securities with a lower duration can be expected to be less sensitive to interest-rate changes than a portfolio with a higher duration. |
Manager’s Discussion
Consistent with the Fund’s long-term strategy of investing across asset classes to seek to generate attractive income while seeking opportunities for capital appreciation, performance was supported by healthy diversification and double-digit total returns from both equity and fixed income holdings.
Dividend Distributions*
11/1/18–10/31/19
| | | | | | | | | | | | | | | | | | |
| | | Dividend per Share (cents) |
| Month | | Class A | | | Class C | | | Class R | | | Class R6 | | | Advisor
Class |
November | | | 3.00 | | | | 2.25 | | | | 2.74 | | | | 3.34 | | | 3.25 |
December | | | 3.00 | | | | 2.27 | | | | 2.75 | | | | 3.32 | | | 3.24 |
January | | | 3.00 | | | | 2.27 | | | | 2.75 | | | | 3.32 | | | 3.24 |
February | | | 3.00 | | | | 2.27 | | | | 2.75 | | | | 3.32 | | | 3.24 |
March | | | 3.58 | | | | 2.87 | | | | 3.34 | | | | 3.90 | | | 3.82 |
April | | | 3.58 | | | | 2.87 | | | | 3.34 | | | | 3.90 | | | 3.82 |
May | | | 3.58 | | | | 2.87 | | | | 3.34 | | | | 3.90 | | | 3.82 |
June | | | 3.58 | | | | 2.87 | | | | 3.34 | | | | 3.90 | | | 3.82 |
July | | | 3.58 | | | | 2.87 | | | | 3.34 | | | | 3.90 | | | 3.82 |
August | | | 3.58 | | | | 2.87 | | | | 3.34 | | | | 3.90 | | | 3.82 |
September | | | 3.58 | | | | 2.87 | | | | 3.34 | | | | 3.90 | | | 3.82 |
October | | | 3.58 | | | | 2.87 | | | | 3.34 | | | | 3.90 | | | 3.82 |
| Total | | | 40.64 | | | | 32.02 | | | | 37.71 | | | | 44.50 | | | 43.53 |
*The distribution amount is the sum of all net investment income distributions for the period shown. All Fund distributions will vary depending upon current market conditions, and past distributions are not indicative of future trends.
During the 12 months under review, the Fund’s asset mix shifted toward a somewhat more cautious positioning to reflect uncertainty related to the slowdown in global economic activity, trade tensions, rising recession probability and weakening corporate earnings growth. Our actions and movements in equity and fixed income markets resulted in a decline in equity holdings from 56.2% to 47.5% of total net assets, and a rise in fixed income holdings from 39.2% to 43.6%. Our cash position increased from 4.6% to 8.9% of total net assets. The flexibility to use market volatility to invest in different asset classes remains a core strategy of the Fund.
Equities advanced largely based on optimism related to the U.S. Federal Reserve’s pivot from raising short-term interest rates at the start of the period, which was partially responsible for triggering a significant fourth-quarter 2018 selloff, to reversing course and cutting short-term rates several times while committing to a sustained period of monetary policy accommodation. Additionally, equities
| | | | |
| | | |
| franklintempleton.com | | Annual Report | | 19 |
FRANKLIN MANAGED INCOME FUND
Top Five Equity Holdings
10/31/19
| | |
Company Sector/Industry | | % of Total Net Assets |
Intel Corp. Information Technology | | 2.1% |
JPMorgan Chase & Co. Financials | | 2.1% |
Apple Inc. Information Technology | | 1.9% |
Broadcom Inc. Information Technology | | 1.7% |
Texas Instruments Inc. Information Technology | | 1.6% |
advanced toward the end of the period on the prospects for a phase 1 trade deal between the U.S. and China. For the time being, it appears an escalation of trade tensions and additional tariffs that would likely further curtail growth and threaten corporate profitability is less likely, in our view.
The Fund’s equity holdings in the information technology (IT), consumer staples, utilities and health care sectors led returns, but strength was broad-based as almost all equity sectors contributed to performance. Within the IT sector, our investments in semiconductor companies, including Analog Devices, Texas Instruments, Broadcom and Intel, benefited performance as corporate results continued to impress despite concerns around trade tensions disrupting their businesses. Microsoft was another key contributor as it experienced sustained strength in its enterprise cloud computing platform Azure, solid growth in its traditional server products and particularly strong growth in commercial bookings.
In consumer staples, Procter & Gamble was another top contributor as restructuring and investment efforts have helped drive strong growth, and the stock rallied as management gave details on the latest business expansion drivers. Nestle, PepsiCo and Coca-Cola were other sector contributors. The Fund’s focus on volatility management also contributed to performance as equity index put option positions were able to offset some of the broader equity market declines during the period, which benefited Fund returns.
Within health care, pharmaceuticals companies Astra-Zeneca, Bristol-Myers Squibb and AbbVie, and pharmacy services provider CVS Health helped performance. AstraZeneca reported robustsecond-and third-quarter 2019 earnings results and upgraded its sales guidance for two consecutive quarters, driving its shares to a record U.S. price.
Conversely, the Fund’s energy sector holdings dominated the detractors list for the12-month period, including Occidental Petroleum, Exxon Mobil and Chesapeake Energy. Shares of Occidental fell with oil prices during the period and its valuation was not helped by its leveraged acquisition of Anadarko Petroleum, which was not viewed favorably by some investors. In other sectors, Apple, FedEx International (not held atperiod-end) and Philip Morris International (not held atperiod-end) also detracted from performance.
Fixed income markets were supported by the significant decline in long-term interest rates during the period. After a period of short-term interest rate normalization, the Fed pivoted toward easing to offset the effects of a broad global slowdown and rising uncertainty related to trade policy going forward. The decline in market expectations for inflation also aided the rally in rates, which helped bolster long-duration fixed income holdings. Although showing select areas of distress in lower-rated corporate credit, overall yield spreads of investment-grade corporate bonds over U.S. Treasuries of comparable maturities remained near cycle lows, providing a favorable backdrop for strong total returns. In addition to the strong contribution from the Fund’s holdings of U.S. Treasuries, select corporate issuers posted attractive gains, including Capital One, CVS Health, Charter Communications3, NIKE and Citigroup. Energy holdings were among leading detractors, including Chesapeake Energy, Oceaneering International (not held atperiod-end) and Nabors Industries.
3. CCO Holdings/CCO Holdings Capital (Charter Communications subsidiaries) in the SOI. Charter Communications Operating Capital (also a Charter Communications subsidiary) was not held atperiod-end.
See franklintempletondatasources.com for additional data provider information.
| | | | |
| | | |
20 | | Annual Report | | franklintempleton.com |
FRANKLIN MANAGED INCOME FUND
Top Five Fixed Income Holdings
10/31/19
| | |
Company Sector/Industry | | % of Total Net Assets |
U.S. Treasury Note Financials | | 8.0% |
Capital One Financial Corp. Financials | | 1.2% |
Morgan Stanley Financials | | 0.9% |
Cigna Corp. Health Care | | 0.9% |
CHS/Community Health Systems Inc. Health Care | | 0.9% |
Thank you for your continued participation in Franklin Managed Income Fund. We look forward to serving your future investment needs
| | |
 | | 
Edward D. Perks, CFA Brendan Circle, CFA Todd Brighton, CFA Alan E. Muschott, CFA Shawn Lyons, CFA Portfolio Management Team |
The foregoing information reflects our analysis, opinions and portfolio holdings as of October 31, 2019, the end of the reporting period. The way we implement our main investment strategies and the resulting portfolio holdings may change depending on factors such as market and economic conditions. These opinions may not be relied upon as investment advice or an offer for a particular security. The information is not a complete analysis of every aspect of any market, country, industry, security or the Fund. Statements of fact are from sources considered reliable, but the investment manager makes no representation or warranty as to their completeness or accuracy. Although historical performance is no guarantee of future results, these insights may help you understand our investment management philosophy.
| | | | |
| | | |
| franklintempleton.com | | Annual Report | | 21 |
FRANKLIN MANAGED INCOME FUND
Performance Summary as of October 31, 2019
The performance tables and graphs do not reflect any taxes that a shareholder would pay on Fund dividends, capital gain distributions, if any, or any realized gains on the sale of Fund shares. Total return reflects reinvestment of the Fund’s dividends and capital gain distributions, if any, and any unrealized gains or losses. Your dividend income will vary depending on dividends or interest paid by securities in the Fund’s portfolio, adjusted for operating expenses of each class. Capital gain distributions are net profits realized from the sale of portfolio securities.
Performance as of 10/31/191
Cumulative total return excludes sales charges. Average annual total return includes maximum sales charges. Sales charges will vary depending on the size of the investment and the class of share purchased. The maximum is 5.50% and the minimum is 0%.Class A:5.50% maximum initial sales charge;Advisor Class:no sales charges. For other share classes, visitfranklintempleton.com.
| | | | | | |
| Share Class | | Cumulative
Total Return2 | | | Average Annual Total Return3 |
| | |
A4 | | | | | | |
| | |
1-Year | | | +12.64% | | | +6.47% |
|
| | |
5-Year | | | +33.67% | | | +4.78% |
|
| | |
10-Year | | | +127.37% | | | +7.95% |
|
| | |
Advisor | | | | | | |
| | |
1-Year | | | +12.96% | | | +12.96% |
|
| | |
5-Year | | | +35.50% | | | +6.26% |
|
| | |
10-Year | | | +134.04% | | | +8.88% |
|
| | | | | | | | |
| | | Distribution | | | 30-Day Standardized Yield6 |
| Share Class | | Rate5 | | | (with fee waiver) | | (without fee waiver) |
| | | |
A | | | 3.17% | | | 1.79% | | 1.79% |
| | | |
Advisor | | | 3.57% | | | 2.14% | | 2.14% |
Performance data represent past performance, which does not guarantee future results. Investment return and principal value will fluctuate, and you may have a gain or loss when you sell your shares. Current performance may differ from figures shown. For most recentmonth-end performance, go tofranklintempleton.comor call(800)342-5236.
See page 25 for Performance Summary footnotes.
| | | | |
| | | |
22 | | Annual Report | | franklintempleton.com |
FRANKLIN MANAGED INCOME FUND
PERFORMANCE SUMMARY
Total Return Index Comparison for a Hypothetical $10,000 Investment1
Total return represents the change in value of an investment over the periods shown. It includes any applicable maximum sales charge, Fund expenses, account fees and reinvested distributions. The unmanaged indexes include reinvestment of any income or distributions. They differ from the Fund in composition and do not pay management fees or expenses. One cannot invest directly in an index.
Class A(11/1/09–10/31/19)
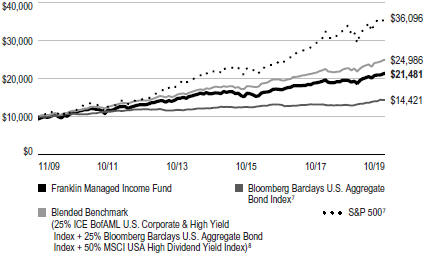
Advisor Class(11/1/09–10/31/19)
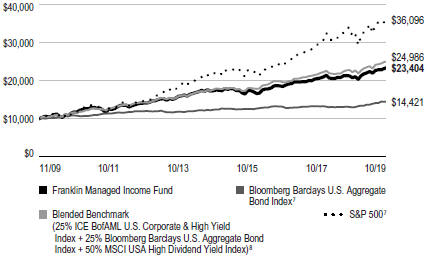
See page 25 for Performance Summary footnotes.
| | | | |
| | | |
| franklintempleton.com | | Annual Report | | 23 |
FRANKLIN MANAGED INCOME FUND
PERFORMANCE SUMMARY
Net Asset Value
| | | | | | | | | | | | |
| Share Class(Symbol) | | 10/31/19 | | | 10/31/18 | | | Change | |
| A(FBLAX) | | | $ 12.80 | | | | $ 11.89 | | | | +$0.91 | |
| C(FBMCX) | | | $ 12.67 | | | | $ 11.78 | | | | +$0.89 | |
| R(FBFQX) | | | $ 12.84 | | | | $ 11.92 | | | | +$0.92 | |
| R6(FBFRX) | | | $ 12.85 | | | | $ 11.93 | | | | +$0.92 | |
| Advisor(FBFZX) | | | $ 12.84 | | | | $ 11.92 | | | | +$0.92 | |
| | | |
| Distributions(11/1/18–10/31/19) | | | | | | | | | | | | |
| | | |
| Share Class | | Net Investment
Income | | | Long-Term Capital Gain | | | Total | |
| A | | | $0.4064 | | | | $0.1418 | | | | $0.5482 | |
| C | | | $0.3202 | | | | $0.1418 | | | | $0.4620 | |
| R | | | $0.3771 | | | | $0.1418 | | | | $0.5189 | |
| R6 | | | $0.4450 | | | | $0.1418 | | | | $0.5868 | |
| Advisor | | | $0.4353 | | | | $0.1418 | | | | $0.5771 | |
| |
| Total Annual Operating Expenses9 | | | | | |
| | | |
| Share Class | | With Fee
Waiver | | | Without Fee
Waiver | | | | |
| A | | | 0.93% | | | | 0.96% | | | | | |
| Advisor | | | 0.68% | | | | 0.71% | | | | | |
See page 25 for Performance Summary footnotes.
| | | | |
| | | |
24 | | Annual Report | | franklintempleton.com |
FRANKLIN MANAGED INCOME FUND
PERFORMANCE SUMMARY
Each class of shares is available to certain eligible investors and has different annual fees and expenses, as described in the prospectus.
All investments involve risks, including possible loss of principal. The Fund’s share price and yield will be affected by interest rate movements. Bond prices generally move in the opposite direction of interest rates. As the prices of bonds in the Fund adjust to a rise in interest rates, the Fund’s share price may decline. Stock prices fluctuate, sometimes rapidly and dramatically, due to factors affecting individual companies, particular industries or sectors, or general market conditions. The Fund’s prospectus also includes a description of the main investment risks.
The Fund is not guaranteed to achieve its investment goal of making monthly distributions, while maintaining prospects for capital appreciation nor is there any guarantee that the Fund will provide sufficient income at or through the investor’s retirement. In addition, some of its distributions may be treated in part as a return of capital, which will decrease shareholders’ cost basis in the Fund and affect the amount of any capital gain or loss that they realize when selling or exchanging fund shares. The annual payout rate may be adjusted higher or lower from year to year and could vary substantially over time. It is possible for the Fund to suffer substantial investment losses and simultaneously experience additional asset reductions as a result of its distributions to shareholders under the managed distribution policy. Investors who hold the Fund within atax-advantaged retirement account should consult their tax advisors to discuss tax consequences of receiving cash distributions. In addition, use of the Fund or election of the option to receive distribution payments in cash may be restricted in certain retirement plans by the terms of the governing plan documents and/or the discretion of the plan administrator. Investors are strongly advised to consult with their financial advisor for assistance before selecting the appropriate fund, based on their goals and personal situations, including time horizon, retirement income needs, risk tolerance and tax bracket.
1. The Fund has an expense reduction and a fee waiver associated with any investments it makes in a Franklin Templeton money fund and/or other Franklin Templeton fund, contractually guaranteed through 2/29/20. Fund investment results reflect the expense reduction and fee waiver; without these reductions, the results would have been lower. As of March 1, 2019, the Fund changed its name from Franklin Balanced Fund in connection with changes to its strategies including, among other things, the addition of an income generation strategy to support the Fund’s managed distribution policy.
2. Cumulative total return represents the change in value of an investment over the periods indicated.
3. Average annual total return represents the average annual change in value of an investment over the periods indicated. Return for less than one year, if any, has not been annualized.
4. Prior to 9/10/18, these shares were offered at a higher initial sales charge of 5.75%, thus actual returns (with sales charges) would have differed. Average annual total returns (with sales charges) have been restated to reflect the current maximum initial sales charge of 5.50%.
5. Distribution rate is based on an annualization of the respective class’s October dividend and the maximum offering price (NAV for Advisor Class) per share on 10/31/19.
6. The Fund’s30-day standardized yield is calculated over a trailing30-day period using the yield to maturity on bonds and/or the dividends accrued on stocks. It may not equal the Fund’s actual income distribution rate, which reflects the Fund’s past dividends paid to shareholders.
7. Source: Morningstar. The Bloomberg Barclays U.S. Aggregate Bond Index is a market capitalization-weighted index representing the U.S. investment-grade, fixed-rate, taxable bond market with index components for government and corporate, mortgage pass-through and asset-backed securities. All issues included are SEC registered, taxable, dollar denominated and nonconvertible, must have at least one year to final maturity and must be rated investment grade(Baa3/BBB-/BBB- or higher) using the middle rating of Moody’s, S&P and Fitch, respectively. The S&P 500 is a market capitalization-weighted index of 500 stocks designed to measure total U.S. equity market performance.
8. FactSet. The Blended Benchmark (25% ICE BofAML U.S. Corporate & High Yield Index, 25% Bloomberg Barclays U.S. Aggregate Bond Index and 50% MSCI USA High Dividend Yield Index) is a combination of leading stock and bond indexes. The ICE BofAML U.S. Corporate & High Yield Index tracks the performance of U.S. dollar-denominated investment-grade corporate debt publicly issued in the U.S. domestic market, and below investment grade, but not in default, U.S. dollar-denominated corporate bonds publicly issued in the U.S. domestic market, and includes issues with a credit rating of BBB or below, as rated by credit rating agencies Moody’s and S&P. The MSCI USA High Dividend Yield Index is designed to reflect the performance of equities in the MSCI USA Index (excluding REITs) with higher dividend income and quality characteristics than average dividend yields that are both sustainable and persistent.
9. Figures are as stated in the Fund’s current prospectus and may differ from the expense ratios disclosed in the Your Fund’s Expenses and Financial Highlights sections in this report. In periods of market volatility, assets may decline significantly, causing total annual Fund operating expenses to become higher than the figures shown.
See www.franklintempletondatasources.com for additional data provider information.
| | | | |
| | | |
| franklintempleton.com | | Annual Report | | 25 |
FRANKLIN MANAGED INCOME FUND
Your Fund’s Expenses
As a Fund shareholder, you can incur two types of costs: (1) transaction costs, including sales charges (loads) on Fund purchases and redemptions; and (2) ongoing Fund costs, including management fees, distribution and service(12b-1) fees, and other Fund expenses. All mutual funds have ongoing costs, sometimes referred to as operating expenses. The table below shows ongoing costs of investing in the Fund and can help you understand these costs and compare them with those of other mutual funds. The table assumes a $1,000 investment held for the six months indicated.
Actual Fund Expenses
The table below provides information about actual account values and actual expenses in the columns under the heading “Actual.” In these columns the Fund’s actual return, which includes the effect of Fund expenses, is used to calculate the “Ending Account Value” for each class of shares. You can estimate the expenses you paid during the period by following these steps (of course, your account value and expenses will differ from those in this illustration): Divide your account value by $1,000 (if your account had an $8,600 value, then $8,600÷ $1,000 = 8.6). Then multiply the result by the number in the row for your class of shares under the headings “Actual” and “Expenses Paid During Period” (if Actual Expenses Paid During Period were $7.50, then 8.6 x $7.50 = $64.50). In this illustration, the actual expenses paid this period are $64.50.
Hypothetical Example for Comparison with Other Funds
Under the heading “Hypothetical” in the table, information is provided about hypothetical account values and hypothetical expenses based on the Fund’s actual expense ratio and an assumed rate of return of 5% per year before expenses, which is not the Fund’s actual return. This information may not be used to estimate the actual ending account balance or expenses you paid for the period, but it can help you compare ongoing costs of investing in the Fund with those of other funds. To do so, compare this 5% hypothetical example for the class of shares you hold with the 5% hypothetical examples that appear in the shareholder reports of other funds.
Please note that expenses shown in the table are meant to highlight ongoing costs and do not reflect any transactional costs. Therefore, information under the heading “Hypothetical” is useful in comparing ongoing costs only, and will not help you compare total costs of owning different funds. In addition, if transactional costs were included, your total costs would have been higher.
| | | | | | | | | | | | |
| | | | | Actual
(actual return after expenses) | | Hypothetical
(5% annual return before expenses) | | |
Share Class | | Beginning Account Value 5/1/19 | | Ending Account Value 10/31/19 | | Expenses Paid During Period
5/1/19–10/31/191, 2 | | Ending Account Value 10/31/19 | | Expenses Paid During Period 5/1/19–10/31/191, 2 | | Net Annualized Expense Ratio2 |
| | | | | | |
| A | | $1,000 | | $1,045.90 | | $4.64 | | $1,020.67 | | $4.58 | | 0.90% |
| C | | $1,000 | | $1,042.00 | | $8.49 | | $1,016.89 | | $8.39 | | 1.65% |
| R | | $1,000 | | $1,044.60 | | $5.93 | | $1,019.41 | | $5.85 | | 1.15% |
| R6 | | $1,000 | | $1,048.20 | | $2.99 | | $1,022.28 | | $2.96 | | 0.58% |
| Advisor | | $1,000 | | $1,047.80 | | $3.36 | | $1,021.93 | | $3.31 | | 0.65% |
1. Expenses are equal to the annualized expense ratio for thesix-month period as indicated above—in the far right column—multiplied by the simple average account value over the period indicated, and then multiplied by 184/365 to reflect theone-half year period.
2. Reflects expenses after fee waivers and expense reimbursements. Does not include acquired fund fees and expenses.
| | | | |
| | | |
26 | | Annual Report | | franklintempleton.com |
Franklin Real Return Fund
This annual report for Franklin Real Return Fund covers the fiscal year ended October 31, 2019. As previously communicated, shareholders approved the reorganization of Franklin Real Return Fund into Franklin Total Return Fund effective January 31, 2020. The Fund closed to new investors with limited exceptions on August 27, 2019. Existing investors may continue to purchase additional shares of the Fund.
Your Fund’s Goal and Main Investments
The Fund seeks total return that exceeds the rate of inflation over an economic cycle. Under normal market conditions, the Fund seeks to allocate assets among investments to achieve the highest level of real return (total return less the rate of inflation) consistent with an acceptable level of risk. The Fund shifts its investments among the following general asset classes and at any given time may have a substantial amount of its asset in any one class: inflation-indexed securities and investment-grade fixed income securities issued by governments, corporations and municipal issuers; equity securities with high correlation to broad measures of inflation; andnon-dollar denominated inflation-indexed securities.
Portfolio Composition*
Based on Total Net Assets as of 10/31/19
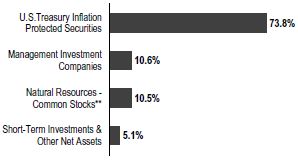
*Figures reflect certain derivatives held in the portfolio (or their underlying reference assets) and may not total 100% or may be negative due to rounding, use of derivatives, unsettled trades or other factors.
**In the SOI, the natural resources sector comprises energy and materials.
Performance Overview
For the 12 months under review, the Fund’s Class A shares posted a +2.80% cumulative total return. In comparison, the Bloomberg Barclays U.S. TIPS Index, which tracks the universe of inflation-protected notes issued by the U.S. Treasury that have at least one year to final maturity, posted a +8.96% total return.1 Also for comparison, the Consumer Price Index for All Urban Consumers -Non-Seasonally Adjusted(CPI-NSA), a measure of the average change in prices of all goods and services purchased for consumption by urban householders, rose 1.8% for the same period.2 You can find the Fund’s long-term performance data in the Performance Summary beginning on page 29.
Performance data represent past performance, which does not guarantee future results. Investment return and principal value will fluctuate, and you may have a gain or loss when you sell your shares. Current performance may differ from figures shown. For most recentmonth-end performance, go tofranklintempleton.comor call(800)342-5236.
Investment Strategy
The Fund uses an active asset allocation strategy to try to achieve its goal of total return that exceeds the rate of inflation over an economic cycle by allocating its assets among securities in various market sectors based on our assessment of changing economic, global market, industry and issuer conditions. When making our investment decisions, we use atop-down analysis of macroeconomic trends combined with abottom-up fundamental analysis of market sectors, industries and issuers to try to take advantage of varying sector reactions to economic events. We will evaluate such criteria as country risk, business cycles, yield curves and values between and within markets.
| | |
What is the yield curve? | | |
A yield curve is a line that plots the yield to maturity of bonds having equal credit quality against their maturity dates. | | |
1. Source: Morningstar.
The indexes are unmanaged and include reinvestment of any income or distributions. They do not reflect any fees, expenses or sales charges. One cannot invest directly in an index, and an index is not representative of the Fund’s portfolio.
2. Source: Bureau of Labor Statistics, bls.gov/cpi.
See www.franklintempletondatasources.com for additional data provider information.
The dollar value, number of shares or principal amount, and names of all portfolio holdings are listed in the Fund’s Statement of Investments (SOI).
The SOI begins on page 66.
| | | | |
| | | |
| franklintempleton.com | | Annual Report | | 27 |
FRANKLIN REAL RETURN FUND
Manager’s Discussion
Atperiod-end, nearly three quarters of total net assets were invested in Treasury Inflation-Protected Securities (TIPS). For diversification, we also allocated the Fund’s assets to natural resources common stocks, management investment companies that provide exposure to real estate investment trusts (REITS) and infrastructure equities, and repurchase agreements and other short-term investments. We employed anon-U.S. dollar strategy to help hedge against potential U.S. dollar weakness versus certain currencies and concentrated our TIPS holdings in shorter maturities.
Dividend Distributions*
11/1/18–10/31/19
| | | | | | | | | | | | | | | | |
| | | Dividend per Share (cents) | |
| Month | | Class A | | | Class C | | | Class R6 | | | Advisor
Class | |
| November | | | 1.04 | | | | 0.26 | | | | 1.73 | | | | 1.48 | |
| December | | | 2.28 | | | | 1.98 | | | | 2.59 | | | | 2.47 | |
| January | | | 1.08 | | | | 0.78 | | | | 1.38 | | | | 1.26 | |
| February | | | 1.49 | | | | 1.18 | | | | 1.81 | | | | 1.69 | |
| March** | | | — | | | | — | | | | — | | | | — | |
| April | | | 1.36 | | | | 1.04 | | | | 1.68 | | | | 1.56 | |
| May | | | 2.09 | | | | 1.77 | | | | 2.42 | | | | 2.25 | |
| June | | | 2.29 | | | | 2.00 | | | | 2.59 | | | | 2.47 | |
| July | | | 0.71 | | | | 0.34 | | | | 1.09 | | | | 0.94 | |
| August | | | 0.66 | | | | 0.35 | | | | 1.00 | | | | 0.87 | |
| September | | | 1.06 | | | | 0.72 | | | | 1.38 | | | | 1.25 | |
| October** | | | — | | | | — | | | | — | | | | — | |
| Total | | | 14.06 | | | | 10.42 | | | | 17.67 | | | | 16.24 | |
*The distribution amount is the sum of all net investment income distributions for the period shown. All Fund distributions will vary depending upon current market conditions, and past distributions are not indicative of future trends.
**The Fund paid no dividends due to negative inflation adjustments for TIPS, which are the Fund’s primary investments.
During the period, we increased the Fund’s allocations to natural resources equities and REITs. In contrast, we slightly decreased the Fund’s allocation to TIPS. The Fund’s heaviest allocations were in TIPS and natural resources equities. The Fund’s investments in TIPS, REITS and infrastructure helped results. In contrast, the Fund’s investments in natural resources equities and a commodities fund (not held atperiod-end) hindered Fund performance.
Thank you for your participation in Franklin Real Return Fund. It has been a pleasure serving your investment needs.
| | |
 | | 
Kent Burns, CFA |
| | |
 | |  |
| |
| | David Yuen, CFA |
| |
| | Portfolio Management Team |
| |
| | | |
The foregoing information reflects our analysis, opinions and portfolio holdings as of October 31, 2019, the end of the reporting period. The way we implement our main investment strategies and the resulting portfolio holdings may change depending on factors such as market and economic conditions. These opinions may not be relied upon as investment advice or an offer for a particular security. The information is not a complete analysis of every aspect of any market, country, industry, security or the Fund.
Statements of fact are from sources considered reliable, but the investment manager makes no representation or warranty as to their completeness or accuracy. Although historical performance is no guarantee of future results, these insights may help you understand our investment management philosophy.
| | | | |
| | | |
28 | | Annual Report | | franklintempleton.com |
FRANKLIN REAL RETURN FUND
Performance Summary as of October 31, 2019
The performance tables and graphs do not reflect any taxes that a shareholder would pay on Fund dividends, capital gain distributions, if any, or any realized gains on the sale of Fund shares. Total return reflects reinvestment of the Fund’s dividends and capital gain distributions, if any, and any unrealized gains or losses. Your dividend income will vary depending on dividends or interest paid by securities in the Fund’s portfolio, adjusted for operating expenses of each class. Capital gain distributions are net profits realized from the sale of portfolio securities.
Performance as of 10/31/191
Cumulative total return excludes sales charges. Average annual total return includes maximum sales charges. Sales charges will vary depending on the size of the investment and the class of share purchased. The maximum is 3.75% and the minimum is 0%.Class A:3.75% maximum initial sales charge;Advisor Class:no sales charges. For other share classes, visitfranklintempleton.com.
| | | | | | | | |
| | | Cumulative | | | Average Annual | |
| Share Class | | | Total Return | 2 | | | Total Return | 3 |
| |
| | |
A4 | | | | | | | | |
| | |
1-Year | | | +2.80% | | | | -1.06% | |
| |
| | |
5-Year | | | +0.04% | | | | -0.76% | |
| |
| | |
10-Year | | | +13.48% | | | | +0.88% | |
| |
| | |
Advisor | | | | | | | | |
| | |
1-Year | | | +3.12% | | | | +3.12% | |
| |
| | |
5-Year | | | +1.34% | | | | +0.27% | |
| |
| | |
10-Year | | | +16.39% | | | | +1.53% | |
| |
| | | | | | | | |
| | | Distribution | | | 30-Day Standardized Yield6 |
| Share Class | | | Rate | 5 | | (with fee waiver) | | (without fee waiver) |
| | | |
A | | | 0.00% | | | 1.87% | | 1.54% |
| | | |
Advisor | | | 0.00% | | | 2.21% | | 1.85% |
Performance data represent past performance, which does not guarantee future results. Investment return and principal value will fluctuate, and you may have a gain or loss when you sell your shares. Current performance may differ from figures shown. For most recentmonth-end performance, go tofranklintempleton.comor call(800)342-5236.
See page 31 for Performance Summary footnotes.
| | | | |
| | | |
| franklintempleton.com | | Annual Report | | 29 |
FRANKLIN REAL RETURN FUND
PERFORMANCE SUMMARY
Total Return Index Comparison for a Hypothetical $10,000 Investment1
Total return represents the change in value of an investment over the periods shown. It includes any applicable maximum sales charge, Fund expenses, account fees and reinvested distributions. The unmanaged indexes include reinvestment of any income or distributions. They differ from the Fund in composition and do not pay management fees or expenses. One cannot invest directly in an index.
Class A (11/1/09–10/31/19)
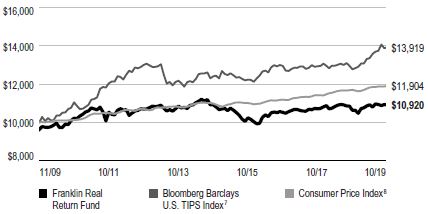
Advisor Class (11/1/09–10/31/19)
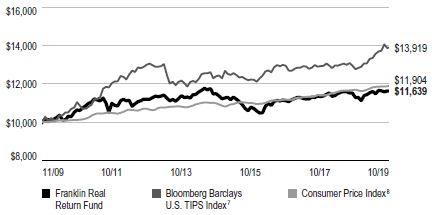
See page 31 for Performance Summary footnotes.
| | | | |
| | | |
30 | | Annual Report | | franklintempleton.com |
FRANKLIN REAL RETURN FUND
PERFORMANCE SUMMARY
Distributions(11/1/18–10/31/19)
| | |
| Share Class | | Net Investment Income |
| A | | $0.1406 |
| C | | $0.1042 |
| R6 | | $0.1767 |
| Advisor | | $0.1624 |
Total Annual Operating Expenses9
| | | | | | |
| Share Class | | With Fee Waiver | | | Without Fee Waiver |
| A | | | 0.89% | | | 1.19% |
| Advisor | | | 0.64% | | | 0.94% |
Each class of shares is available to certain eligible investors and has different annual fees and expenses, as described in the prospectus.
All investments involve risks, including possible loss of principal. Interest rate movements will affect the Fund’s share price and yield. Bond prices generally move in the opposite direction of interest rates. As prices of bonds in a fund adjust to a rise in interest rates, the Fund’s share price may decline. Foreign securities involve special risks, including currency fluctuations and economic and political uncertainties. Changes in the financial strength of a bond issuer or in a bond’s credit rating may affect its value. Stock prices fluctuate, sometimes rapidly and dramatically, due to factors affecting individual companies, particular industries or sectors, or general market conditions. The Fund’s prospectus also includes a description of the main investment risks.
1. The Fund has an expense reduction and a fee waiver associated with any investments it makes in a Franklin Templeton money fund and/or other Franklin Templeton fund, contractually guaranteed through 2/29/20. Fund investment results reflect the expense reduction and fee waiver; without these reductions, the results would have been lower.
2. Cumulative total return represents the change in value of an investment over the periods indicated.
3. Average annual total return represents the average annual change in value of an investment over the periods indicated. Return for less than one year, if any, has not been annualized.
4. Prior to 3/1/19, these shares were offered at a higher initial sales charge of 4.25%, thus actual returns (with sales charges) would have differed. Average annual total returns (with sales charges) have been restated to reflect the current maximum initial sales charge of 3.75%.
5. Distribution rate is based on an annualization of the respective class’s October dividend and the maximum offering price (NAV for Advisor Class) per share on 10/31/19.
6. The Fund’s30-day standardized yield is calculated over a trailing30-day period using the yield to maturity on bonds and/or the dividends accrued on stocks. It may not equal the Fund’s actual income distribution rate, which reflects the Fund’s past dividends paid to shareholders.
7. Source: Morningstar. The Bloomberg Barclays U.S. TIPS Index comprises U.S. TIPS rated investment grade(Baa3/BBB- or better) with at least one year to final maturity and at least $250 million par amount outstanding.
8. Source: Bureau of Labor Statistics, bls.gov/cpi. The Consumer Price Index (CPI) is a commonly used measure of the inflation rate.
9. Figures are as stated in the Fund’s current prospectus and may differ from the expense ratios disclosed in the Your Fund’s Expenses and Financial Highlights sections in this report. In periods of market volatility, assets may decline significantly, causing total annual Fund operating expenses to become higher than the figures shown.
See www.franklintempletondatasources.com for additional data provider information.
| | | | |
| | | |
| franklintempleton.com | | Annual Report | | 31 |
FRANKLIN REAL RETURN FUND
Your Fund’s Expenses
As a Fund shareholder, you can incur two types of costs: (1) transaction costs, including sales charges (loads) on Fund purchases and redemptions; and (2) ongoing Fund costs, including management fees, distribution and service(12b-1) fees, and other Fund expenses. All mutual funds have ongoing costs, sometimes referred to as operating expenses. The table below shows ongoing costs of investing in the Fund and can help you understand these costs and compare them with those of other mutual funds. The table assumes a $1,000 investment held for the six months indicated.
Actual Fund Expenses
The table below provides information about actual account values and actual expenses in the columns under the heading “Actual.” In these columns the Fund’s actual return, which includes the effect of Fund expenses, is used to calculate the “Ending Account Value” for each class of shares. You can estimate the expenses you paid during the period by following these steps (of course, your account value and expenses will differ from those in this illustration): Divide your account value by $1,000 (if your account had an $8,600 value, then $8,600÷ $1,000 = 8.6). Then multiply the result by the number in the row for your class of shares under the headings “Actual” and “Expenses Paid During Period” (if Actual Expenses Paid During Period were $7.50, then 8.6 x $7.50 = $64.50). In this illustration, the actual expenses paid this period are $64.50.
Hypothetical Example for Comparison with Other Funds
Under the heading “Hypothetical” in the table, information is provided about hypothetical account values and hypothetical expenses based on the Fund’s actual expense ratio and an assumed rate of return of 5% per year before expenses, which is not the Fund’s actual return. This information may not be used to estimate the actual ending account balance or expenses you paid for the period, but it can help you compare ongoing costs of investing in the Fund with those of other funds. To do so, compare this 5% hypothetical example for the class of shares you hold with the 5% hypothetical examples that appear in the shareholder reports of other funds.
Please note that expenses shown in the table are meant to highlight ongoing costs and do not reflect any transactional costs. Therefore, information under the heading “Hypothetical” is useful in comparing ongoing costs only, and will not help you compare total costs of owning different funds. In addition, if transactional costs were included, your total costs would have been higher.
| | | | | | | | | | | | |
| | | | | Actual
(actual return after expenses) | | Hypothetical
(5% annual return before expenses) | | |
| | | | | | | Expenses | | | | Expenses | | Net |
| | | Beginning | | Ending | | Paid During | | Ending | | Paid During | | Annualized |
| Share | | Account | | Account | | Period | | Account | | Period | | Expense |
| Class | | Value 5/1/19 | | Value 10/31/19 | | 5/1/19–10/31/191, 2 | | Value 10/31/19 | | 5/1/19–10/31/191, 2 | | Ratio2 |
| | | | | | |
| A | | $1,000 | | $1,000.80 | | $4.34 | | $1,020.87 | | $4.38 | | 0.86% |
| C | | $1,000 | | $ 999.20 | | $6.35 | | $1,018.85 | | $6.41 | | 1.26% |
| R6 | | $1,000 | | $1,003.50 | | $2.22 | | $1,022.99 | | $2.24 | | 0.44% |
| Advisor | | $1,000 | | $1,002.80 | | $3.08 | | $1,022.13 | | $3.11 | | 0.61% |
1. Expenses are equal to the annualized expense ratio for thesix-month period as indicated above—in the far right column—multiplied by the simple average account value over the period indicated, and then multiplied by 184/365 to reflect theone-half year period.
2. Reflects expenses after fee waivers and expense reimbursements. Does not include acquired fund fees and expenses.
| | | | |
| | | |
32 | | Annual Report | | franklintempleton.com |
FRANKLIN INVESTORS SECURITIES TRUST
Financial Highlights
Franklin Convertible Securities Fund
| | | | | | | | | | | | | | | | | | | | |
| | | Year Ended October 31, | |
| | | 2019 | | | 2018 | | | 2017 | | | 2016 | | | 2015 | |
Class A | | | | | | | | | | | | | | | | | | | | |
| | | | | |
Per share operating performance | | | | | | | | | | | | | | | | | | | | |
(for a share outstanding throughout the year) | | | | | | | | | | | | | | | | | | | | |
| | | | | |
Net asset value, beginning of year | | | $20.65 | | | | $20.68 | | | | $18.24 | | | | $18.00 | | | | $18.97 | |
| | | | | |
Income from investment operationsa: | | | | | | | | | | | | | | | | | | | | |
| | | | | |
Net investment incomeb | | | 0.21 | | | | 0.16 | | | | 0.27 | | | | 0.25 | | | | 0.24 | |
| | | | | |
Net realized and unrealized gains (losses) | | | 2.47 | | | | 1.35 | | | | 2.98 | | | | 0.85 | | | | (0.14 | ) |
| | | | |
| | | | | |
Total from investment operations | | | 2.68 | | | | 1.51 | | | | 3.25 | | | | 1.10 | | | | 0.10 | |
| | | | |
| | | | | |
Less distributions from: | | | | | | | | | | | | | | | | | | | | |
| | | | | |
Net investment income | | | (0.45 | ) | | | (0.49 | ) | | | (0.47 | ) | | | (0.50 | ) | | | (0.39 | ) |
| | | | | |
Net realized gains | | | (0.75 | ) | | | (1.05 | ) | | | (0.34 | ) | | | (0.36 | ) | | | (0.68 | ) |
| | | | |
| | | | | |
Total distributions | | | (1.20 | ) | | | (1.54 | ) | | | (0.81 | ) | | | (0.86 | ) | | | (1.07 | ) |
| | | | |
| | | | | |
Net asset value, end of year | | | $22.13 | | | | $20.65 | | | | $20.68 | | | | $18.24 | | | | $18.00 | |
| | | | |
| | | | | |
Total returnc | | | 13.84% | | | | 7.65% | | | | 18.39% | | | | 6.41% | | | | 0.66% | |
| | | | | |
Ratios to average net assets | | | | | | | | | | | | | | | | | | | | |
| | | | | |
Expenses before waiver and payments by affiliates | | | 0.85% | | | | 0.86% | | | | 0.85% | | | | 0.86% | | | | 0.86% | |
| | | | | |
Expenses net of waiver and payments by affiliatesd | | | 0.83% | | | | 0.84% | | | | 0.84% | | | | 0.85% | | | | 0.86% | e |
| | | | | |
Net investment income | | | 0.97% | | | | 0.76% | | | | 1.39% | | | | 1.44% | | | | 1.33% | |
| | | | | |
Supplemental data | | | | | | | | | | | | | | | | | | | | |
| | | | | |
Net assets, end of year (000’s) | | | $1,169,928 | | | | $1,153,875 | | | | $815,491 | | | | $768,553 | | | | $818,082 | |
| | | | | |
Portfolio turnover rate | | | 26.83% | | | | 35.90% | | | | 27.24% | | | | 28.03% | | | | 17.30% | |
aThe amount shown for a share outstanding throughout the period may not correlate with the Statement of Operations for the period due to the timing of sales and repurchases of the Fund’s shares in relation to income earned and/or fluctuating fair value of the investments of the Fund.
bBased on average daily shares outstanding.
cTotal return does not reflect sales commissions or contingent deferred sales charges, if applicable.
dBenefit of expense reduction rounds to less than 0.01%.
eBenefit of waiver and payments by affiliates rounds to less than 0.01%.
| | | | |
| | | |
| franklintempleton.com | | The accompanying notes are an integral part of these financial statements. | Annual Report | | 33 |
FRANKLIN INVESTORS SECURITIES TRUST
FINANCIAL HIGHLIGHTS
Franklin Convertible Securities Fund (continued)
| | | | | | | | | | | | | | | | | | | | |
| | | Year Ended October 31, | |
| | | 2019 | | | 2018 | | | 2017 | | | 2016 | | | 2015 | |
Class C | | | | | | | | | | | | | | | | | | | | |
| | | | | |
Per share operating performance (for a share outstanding throughout the year) | | | | | | | | | | | | | | | | | | | | |
| | | | | |
Net asset value, beginning of year | | | $20.31 | | | | $20.37 | | | | $17.98 | | | | $17.75 | | | | $18.73 | |
| | | | | |
Income from investment operationsa: | | | | | | | | | | | | | | | | | | | | |
| | | | | |
Net investment incomeb | | | 0.04 | | | | (— | )c | | | 0.12 | | | | 0.12 | | | | 0.11 | |
| | | | | |
Net realized and unrealized gains (losses) | | | 2.45 | | | | 1.33 | | | | 2.93 | | | | 0.84 | | | | (0.16 | ) |
| | | | | |
Total from investment operations | | | 2.49 | | | | 1.33 | | | | 3.05 | | | | 0.96 | | | | (0.05 | ) |
| | | | | |
Less distributions from: | | | | | | | | | | | | | | | | | | | | |
| | | | | |
Net investment income | | | (0.28 | ) | | | (0.34 | ) | | | (0.32 | ) | | | (0.37 | ) | | | (0.25 | ) |
| | | | | |
Net realized gains | | | (0.75 | ) | | | (1.05 | ) | | | (0.34 | ) | | | (0.36 | ) | | | (0.68 | ) |
| | | | | |
Total distributions | | | (1.03 | ) | | | (1.39 | ) | | | (0.66 | ) | | | (0.73 | ) | | | (0.93 | ) |
| | | | | |
Net asset value, end of year | | | $21.77 | | | | $20.31 | | | | $20.37 | | | | $17.98 | | | | $17.75 | |
| | | | | |
Total returnd | | | 13.03% | | | | 6.84% | | | | 17.49% | | | | 5.65% | | | | (0.15)% | |
| | | | | |
Ratios to average net assets | | | | | | | | | | | | | | | | | | | | |
| | | | | |
Expenses before waiver and payments by affiliates | | | 1.60% | | | | 1.61% | | | | 1.60% | | | | 1.61% | | | | 1.61% | |
| | | | | |
Expenses net of waiver and payments by affiliatese | | | 1.58% | | | | 1.59% | | | | 1.59% | | | | 1.60% | | | | 1.61% | f |
| | | | | |
Net investment income | | | 0.22% | | | | 0.01% | | | | 0.64% | | | | 0.69% | | | | 0.58% | |
| | | | | |
Supplemental data | | | | | | | | | | | | | | | | | | | | |
| | | | | |
Net assets, end of year (000’s) | | | $256,075 | | | | $299,716 | | | | $303,243 | | | | $293,038 | | | | $311,951 | |
| | | | | |
Portfolio turnover rate | | | 26.83% | | | | 35.90% | | | | 27.24% | | | | 28.03% | | | | 17.30% | |
aThe amount shown for a share outstanding throughout the period may not correlate with the Statement of Operations for the period due to the timing of sales and repurchases of the Fund’s shares in relation to income earned and/or fluctuating fair value of the investments of the Fund.
bBased on average daily shares outstanding.
cAmount rounds to less than $0.01 per share.
dTotal return does not reflect sales commissions or contingent deferred sales charges, if applicable.
eBenefit of expense reduction rounds to less than 0.01%.
fBenefit of waiver and payments by affiliates rounds to less than 0.01%.
| | | | |
| | | |
34 | | Annual Report | The accompanying notes are an integral part of these financial statements. | | franklintempleton.com |
FRANKLIN INVESTORS SECURITIES TRUST
FINANCIAL HIGHLIGHTS
Franklin Convertible Securities Fund(continued)
| | | | | | | | | | | | | | | | | | | | |
| | | Year Ended October 31, | |
| | | 2019 | | | 2018 | | | 2017 | | | 2016 | | | 2015 | |
Class R6 | | | | | | | | | | | | | | | | | | | | |
| | | | | |
Per share operating performance | | | | | | | | | | | | | | | | | | | | |
(for a share outstanding throughout the year) | | | | | | | | | | | | | | | | | | | | |
| | | | | |
Net asset value, beginning of year | | | $20.78 | | | | $20.79 | | | | $18.33 | | | | $18.09 | | | | $18.99 | |
| | | | |
| | | | | |
Income from investment operationsa: | | | | | | | | | | | | | | | | | | | | |
| | | | | |
Net investment incomeb | | | 0.28 | | | | 0.24 | | | | 0.34 | | | | 0.33 | | | | 0.30 | |
| | | | | |
Net realized and unrealized gains (losses) | | | 2.50 | | | | 1.36 | | | | 3.00 | | | | 0.84 | | | | (0.14 | ) |
| | | | |
| | | | | |
Total from investment operations | | | 2.78 | | | | 1.60 | | | | 3.34 | | | | 1.17 | | | | 0.16 | |
| | | | |
| | | | | |
Less distributions from: | | | | | | | | | | | | | | | | | | | | |
| | | | | |
Net investment income | | | (0.53 | ) | | | (0.56 | ) | | | (0.54 | ) | | | (0.57 | ) | | | (0.38 | ) |
| | | | | |
Net realized gains | | | (0.75 | ) | | | (1.05 | ) | | | (0.34 | ) | | | (0.36 | ) | | | (0.68 | ) |
| | | | |
| | | | | |
Total distributions | | | (1.28 | ) | | | (1.61 | ) | | | (0.88 | ) | | | (0.93 | ) | | | (1.06 | ) |
| | | | |
| | | | | |
Net asset value, end of year | | | $22.28 | | | | $20.78 | | | | $20.79 | | | | $18.33 | | | | $18.09 | |
| | | | |
| | | | | |
Total return | | | 14.26% | | | | 8.07% | | | | 18.84% | | | | 6.78% | | | | 0.99% | |
| | | | | |
Ratios to average net assets | | | | | | | | | | | | | | | | | | | | |
| | | | | |
Expenses before waiver and payments by affiliates | | | 0.54% | | | | 0.55% | | | | 0.49% | | | | 0.50% | | | | 0.50% | |
| | | | | |
Expenses net of waiver and payments by affiliatesc | | | 0.49% | | | | 0.49% | | | | 0.48% | | | | 0.49% | | | | 0.50% | d |
| | | | | |
Net investment income | | | 1.31% | | | | 1.11% | | | | 1.75% | | | | 1.80% | | | | 1.69% | |
| | | | | |
Supplemental data | | | | | | | | | | | | | | | | | | | | |
| | | | | |
Net assets, end of year (000’s) | | | $51,791 | | | | $57,824 | | | | $22,950 | | | | $7,154 | | | | $5 | |
| | | | | |
Portfolio turnover rate | | | 26.83% | | | | 35.90% | | | | 27.24% | | | | 28.03% | | | | 17.30% | |
aThe amount shown for a share outstanding throughout the period may not correlate with the Statement of Operations for the period due to the timing of sales and repurchases of the Fund’s shares in relation to income earned and/or fluctuating fair value of the investments of the Fund.
bBased on average daily shares outstanding.
cBenefit of expense reduction rounds to less than 0.01%.
dBenefit of waiver and payments by affiliates and expense reduction rounds to less than 0.01%.
| | | | |
| | | |
| franklintempleton.com | | The accompanying notes are an integral part of these financial statements. | Annual Report | | 35 |
FRANKLIN INVESTORS SECURITIES TRUST
FINANCIAL HIGHLIGHTS
Franklin Convertible Securities Fund(continued)
| | | | | | | | | | | | | | | | | | | | |
| | | Year Ended October 31, | |
| | | 2019 | | | 2018 | | | 2017 | | | 2016 | | | 2015 | |
Advisor Class | | | | | | | | | | | | | | | | | | | | |
| | | | | |
Per share operating performance | | | | | | | | | | | | | | | | | | | | |
(for a share outstanding throughout the year) | | | | | | | | | | | | | | | | | | | | |
| | | | | |
Net asset value, beginning of year | | | $20.65 | | | | $20.68 | | | | $18.24 | | | | $18.00 | | | | $18.98 | |
| | | | |
| | | | | |
Income from investment operationsa: | | | | | | | | | | | | | | | | | | | | |
| | | | | |
Net investment incomeb | | | 0.26 | | | | 0.21 | | | | 0.32 | | | | 0.30 | | | | 0.29 | |
| | | | | |
Net realized and unrealized gains (losses) | | | 2.49 | | | | 1.35 | | | | 2.98 | | | | 0.85 | | | | (0.15 | ) |
| | | | |
| | | | | |
Total from investment operations | | | 2.75 | | | | 1.56 | | | | 3.30 | | | | 1.15 | | | | 0.14 | |
| | | | |
| | | | | |
Less distributions from: | | | | | | | | | | | | | | | | | | | | |
| | | | | |
Net investment income | | | (0.51 | ) | | | (0.54 | ) | | | (0.52 | ) | | | (0.55 | ) | | | (0.44 | ) |
| | | | | |
Net realized gains | | | (0.75 | ) | | | (1.05 | ) | | | (0.34 | ) | | | (0.36 | ) | | | (0.68 | ) |
| | | | |
| | | | | |
Total distributions | | | (1.26 | ) | | | (1.59 | ) | | | (0.86 | ) | | | (0.91 | ) | | | (1.12 | ) |
| | | | |
| | | | | |
Net asset value, end of year | | | $22.14 | | | | $20.65 | | | | $20.68 | | | | $18.24 | | | | $18.00 | |
| | | | |
| | | | | |
Total return | | | 14.18% | | | | 7.91% | | | | 18.69% | | | | 6.68% | | | | 0.87% | |
| | | | | |
Ratios to average net assets | | | | | | | | | | | | | | | | | | | | |
| | | | | |
Expenses before waiver and payments by affiliates | | | 0.60% | | | | 0.61% | | | | 0.60% | | | | 0.61% | | | | 0.61% | |
| | | | | |
Expenses net of waiver and payments by affiliatesc | | | 0.58% | | | | 0.59% | | | | 0.59% | | | | 0.60% | | | | 0.61% | d |
| | | | | |
Net investment income | | | 1.22% | | | | 1.01% | | | | 1.64% | | | | 1.69% | | | | 1.58% | |
| | | | | |
Supplemental data | | | | | | | | | | | | | | | | | | | | |
| | | | | |
Net assets, end of year (000’s) | | | $2,379,435 | | | | $2,189,462 | | | | $1,542,254 | | | | $1,080,346 | | | | $899,441 | |
| | | | | |
Portfolio turnover rate | | | 26.83% | | | | 35.90% | | | | 27.24% | | | | 28.03% | | | | 17.30% | |
aThe amount shown for a share outstanding throughout the period may not correlate with the Statement of Operations for the period due to the timing of sales and repurchases of the Fund’s shares in relation to income earned and/or fluctuating fair value of the investments of the Fund.
bBased on average daily shares outstanding.
cBenefit of expense reduction rounds to less than 0.01%.
dBenefit of waiver and payments by affiliates rounds to less than 0.01%.
| | | | |
| | | |
36 | | Annual Report | The accompanying notes are an integral part of these financial statements. | | franklintempleton.com |
FRANKLIN INVESTORS SECURITIES TRUST
Statement of Investments, October 31, 2019
Franklin Convertible Securities Fund
| | | | | | | | | | | | |
| | | Country | | | Shares | | | Value | |
Convertible Preferred Stocks 20.3% | | | | | | | | | | | | |
Consumer Staples 1.7% | | | | | | | | | | | | |
Bunge Ltd., 4.875%, cvt. pfd. | | | United States | | | | 630,000 | | | $ | 63,956,088 | |
| | | | | | | | | | | | |
| | | |
Health Care 4.8% | | | | | | | | | | | | |
Avantor Inc., 6.25%, cvt. pfd., A | | | United States | | | | 820,000 | | | | 42,648,200 | |
Becton Dickinson and Co., 6.125%, cvt. pfd., A | | | United States | | | | 1,120,000 | | | | 69,081,600 | |
Change Healthcare Inc., 6.00%, cvt. pfd. | | | United States | | | | 300,000 | | | | 15,159,000 | |
Danaher Corp., 4.75%, cvt. pfd., A | | | United States | | | | 54,000 | | | | 59,957,275 | |
| | | | | | | | | | | | |
| | | |
| | | | | | | | | | | 186,846,075 | |
| | | | | | | | | | | | |
| | | |
Industrials 3.8% | | | | | | | | | | | | |
Fortive Corp., 5.00%, cvt. pfd., A | | | United States | | | | 34,350 | | | | 30,933,893 | |
Rexnord Corp., 5.75%, cvt. pfd. | | | United States | | | | 1,017,500 | | | | 56,786,675 | |
Stanley Black & Decker Inc., 5.375%, cvt. pfd. | | | United States | | | | 592,000 | | | | 60,348,480 | |
| | | | | | | | | | | | |
| | | |
| | | | | | | | | | | 148,069,048 | |
| | | | | | | | | | | | |
| | | |
Information Technology 2.0% | | | | | | | | | | | | |
Broadcom Inc., 8.00%, cvt. pfd., A | | | United States | | | | 71,100 | | | | 77,002,722 | |
| | | | | | | | | | | | |
| | | |
Materials 1.5% | | | | | | | | | | | | |
International Flavors & Fragrances Inc., 6.00%, cvt. pfd. | | | United States | | | | 1,192,242 | | | | 55,761,158 | |
| | | | | | | | | | | | |
| | | |
Utilities 6.5% | | | | | | | | | | | | |
American Electric Power Co. Inc., 6.125%, cvt. pfd. | | | United States | | | | 440,000 | | | | 24,195,600 | |
Aqua America Inc., 6.00%, cvt. pfd. | | | United States | | | | 770,000 | | | | 46,392,500 | |
aDTE Energy Co., 6.25%, cvt. pfd. | | | United States | | | | 800,000 | | | | 40,624,000 | |
Sempra Energy, 6.00%, cvt. pfd., A | | | United States | | | | 567,500 | | | | 65,847,025 | |
Sempra Energy, 6.75%, cvt. pfd., B | | | United States | | | | 206,000 | | | | 23,935,140 | |
South Jersey Industries Inc., 7.25%, cvt. pfd. | | | United States | | | | 360,000 | | | | 18,360,000 | |
The Southern Co., 6.75%, cvt. pfd. | | | United States | | | | 550,000 | | | | 29,238,000 | |
| | | | | | | | | | | | |
| | | |
| | | | | | | | | | | 248,592,265 | |
| | | | | | | | | | | | |
| | | |
Total Convertible Preferred Stocks (Cost $748,475,501) | | | | | | | | | | | 780,227,356 | |
| | | | | | | | | | | | |
| | | |
| | | | | |
| Principal
Amount |
* | | | | |
Convertible Bonds 78.2% | | | | | | | | | | | | |
Communication Services 10.4% | | | | | | | | | | | | |
DISH Network Corp., cvt., senior bond, 3.375%, 8/15/26 | | | United States | | | $ | 45,900,000 | | | | 43,034,061 | |
biQIYI Inc., | | | | | | | | | | | | |
cvt., senior note, 144A, 3.75%, 12/01/23 | | | China | | | | 43,500,000 | | | | 44,644,443 | |
cvt., senior note, 144A, 2.00%, 4/01/25 | | | China | | | | 26,000,000 | | | | 23,547,242 | |
bLiberty Interactive LLC, cvt., senior bond, 144A, 1.75%, 9/30/46 | | | United States | | | | 37,000,000 | | | | 52,495,157 | |
Liberty Media Corp., | | | | | | | | | | | | |
cvt., senior bond, 2.25%, 9/30/46 | | | United States | | | | 39,000,000 | | | | 22,630,211 | |
cvt., senior note, 1.375%, 10/15/23 | | | United States | | | | 21,200,000 | | | | 26,804,009 | |
bSnap Inc., cvt., senior note, 144A, 0.75%, 8/01/26 | | | United States | | | | 59,000,000 | | | | 59,780,570 | |
Weibo Corp., cvt., senior note, 1.25%, 11/15/22 | | | China | | | | 78,000,000 | | | | 73,210,020 | |
Zillow Group Inc., | | | | | | | | | | | | |
cvt., senior note, 2.00%, 12/01/21 | | | United States | | | | 34,500,000 | | | | 34,977,706 | |
cvt., senior note, 1.50%, 7/01/23 | | | United States | | | | 23,500,000 | | | | 20,954,560 | |
| | | | | | | | | | | | |
| | | |
| | | | | | | | | | | 402,077,979 | |
| | | | | | | | | | | | |
| | | | |
| | | |
| franklintempleton.com | | Annual Report | | 37 |
FRANKLIN INVESTORS SECURITIES TRUST
STATEMENT OF INVESTMENTS
Franklin Convertible Securities Fund(continued)
| | | | | | | | | | | | |
| | | | Country | | |
| Principal
Amount |
* | | | Value | |
| | | |
Convertible Bonds(continued) | | | | | | | | | | | | |
Consumer Discretionary 10.0% | | | | | | | | | | | | |
Booking Holdings Inc., cvt., senior note, 0.35%, 6/15/20 | | | United States | | | $ | 35,000,000 | | | $ | 54,580,651 | |
Etsy Inc., cvt., senior note, zero cpn., 3/01/23 | | | United States | | | | 40,000,000 | | | | 56,750,000 | |
MercadoLibre Inc., cvt., senior note, 2.00%, 8/15/28 | | | Argentina | | | | 50,000,000 | | | | 70,909,200 | |
bPinduoduo Inc., cvt., senior note, 144A, zero cpn., 10/01/24 | | | China | | | | 44,000,000 | | | | 51,293,722 | |
RH, | | | | | | | | | | | | |
bcvt., senior note, 144A, zero cpn., 9/15/24 | | | United States | | | | 24,000,000 | | | | 25,135,654 | |
cvt., senior note, zero cpn., 6/15/23 | | | United States | | | | 52,500,000 | | | | 59,391,132 | |
Wayfair Inc., | | | | | | | | | | | | |
cvt., senior note, 0.375%, 9/01/22 | | | United States | | | | 19,000,000 | | | | 20,134,424 | |
bcvt., senior note, 144A, 1.125%, 11/01/24 | | | United States | | | | 22,000,000 | | | | 22,518,212 | |
bcvt., senior note, 144A, 1.00%, 8/15/26 | | | United States | | | | 28,000,000 | | | | 25,036,860 | |
| | | | | | | | | | | | |
| | | | | | | | | | | 385,749,855 | |
| �� | | | | | | | | | | | |
Energy 0.6% | | | | | | | | | | | | |
Oil States International Inc., cvt., senior note, 1.50%, 2/15/23 | | | United States | | | | 28,000,000 | | | | 23,842,616 | |
| | | | | | | | | | | | |
Financials 2.0% | | | | | | | | | | | | |
bAXA SA, cvt., senior note, 144A, 7.25%, 5/15/21 | | | France | | | | 71,500,000 | | | | 74,562,345 | |
| | | | | | | | | | | | |
Health Care 14.9% | | | | | | | | | | | | |
bAssertio Therapeutics Inc., cvt., senior note, 144A, 5.00%, 8/15/24 | | | United States | | | | 8,400,000 | | | | 5,562,229 | |
BioMarin Pharmaceutical Inc., cvt., senior sub. note, 1.50%, 10/15/20 | | | United States | | | | 28,200,000 | | | | 29,668,089 | |
Dermira Inc., cvt., senior note, 3.00%, 5/15/22 | | | United States | | | | 41,120,000 | | | | 34,283,800 | |
bDexCom Inc., cvt., senior note, 144A, 0.75%, 12/01/23 | | | United States | | | | 64,000,000 | | | | 76,642,618 | |
Illumina Inc., | | | | | | | | | | | | |
cvt., senior note, 0.50%, 6/15/21 | | | United States | | | | 32,500,000 | | | | 42,414,015 | |
cvt., senior note, zero cpn., 8/15/23 | | | United States | | | | 32,750,000 | | | | 35,564,960 | |
Insulet Corp., | | | | | | | | | | | | |
cvt., senior note, 1.375%, 11/15/24 | | | United States | | | | 36,300,000 | | | | 60,416,812 | |
bcvt., senior note, 144A, 0.375%, 9/01/26 | | | United States | | | | 22,000,000 | | | | 21,133,750 | |
Intercept Pharmaceuticals Inc., cvt., senior note, 2.00%, 5/15/26 | | | United States | | | | 21,000,000 | | | | 19,722,264 | |
Jazz Investments I Ltd., | | | | | | | | | | | | |
cvt., senior note, 1.875%, 8/15/21 | | | United States | | | | 35,000,000 | | | | 35,043,292 | |
cvt., senior note, 1.50%, 8/15/24 | | | United States | | | | 39,750,000 | | | | 38,204,386 | |
Neurocrine Biosciences Inc., cvt., senior note, 2.25%, 5/15/24 | | | United States | | | | 44,750,000 | | | | 65,421,097 | |
Novavax Inc., cvt., senior note, 3.75%, 2/01/23 | | | United States | | | | 29,000,000 | | | | 11,976,785 | |
NuVasive Inc., cvt., senior note, 2.25%, 3/15/21 | | | United States | | | | 12,000,000 | | | | 15,101,277 | |
bPTC Therapeutics Inc., cvt., senior note, 144A, 1.50%, 9/15/26 | | | United States | | | | 40,000,000 | | | | 41,754,932 | |
Sarepta Therapeutics Inc., cvt., senior note, 1.50%, 11/15/24 | | | United States | | | | 30,250,000 | | | | 42,732,336 | |
| | | | | | | | | | | | |
| | | | | | | | | | | 575,642,642 | |
| | | | | | | | | | | | |
Industrials 1.0% | | | | | | | | | | | | |
bFortive Corp., cvt., senior note, 144A, 0.875%, 2/15/22 | | | United States | | | | 40,270,000 | | | | 39,830,138 | |
| | | | | | | | | | | | |
Information Technology 38.1% | | | | | | | | | | | | |
bAlteryx Inc., | | | | | | | | | | | | |
cvt., senior note, 144A, 0.50%, 8/01/24 | | | United States | | | | 8,000,000 | | | | 7,418,014 | |
cvt., senior note, 144A, 1.00%, 8/01/26 | | | United States | | | | 8,000,000 | | | | 7,252,064 | |
| | | | |
| | | |
38 | | Annual Report | | franklintempleton.com |
FRANKLIN INVESTORS SECURITIES TRUST
STATEMENT OF INVESTMENTS
Franklin Convertible Securities Fund(continued)
| | | | | | | | | | | | |
| | | | Country | | |
| Principal
Amount |
* | | | Value | |
Convertible Bonds(continued) | | | | | | | | | | | | |
Information Technology(continued) | | | | | | | | | | | | |
Atlassian Inc., cvt., senior note, 0.625%, 5/01/23 | | | United States | | | $ | 43,000,000 | | | $ | 68,417,685 | |
bBlackline Inc., cvt., senior note, 144A, 0.125%, 8/01/24 | | | United States | | | | 9,500,000 | | | | 9,066,900 | |
bCoupa Software Inc., cvt., senior note, 144A, 0.125%, 6/15/25 | | | United States | | | | 21,000,000 | | | | 23,849,997 | |
DocuSign Inc., cvt., senior note, 0.50%, 9/15/23 | | | United States | | | | 65,000,000 | | | | 76,655,938 | |
Envestnet Inc., cvt., senior note, 1.75%, 6/01/23 | | | United States | | | | 51,500,000 | | | | 58,369,706 | |
Guidewire Software Inc., cvt., senior note, 1.25%, 3/15/25 | | | United States | | | | 49,000,000 | | | | 58,686,863 | |
HubSpot Inc., cvt., senior note, 0.25%, 6/01/22 | | | United States | | | | 38,875,000 | | | | 66,589,937 | |
Inphi Corp., cvt., senior note, 0.75%, 9/01/21 | | | United States | | | | 9,600,000 | | | | 13,272,165 | |
Intel Corp., cvt., junior sub. bond, 3.25%, 8/01/39 | | | United States | | | | 8,000,000 | | | | 22,301,200 | |
Microchip Technology Inc., cvt., 1.625%, 2/15/27 | | | United States | | | | 69,250,000 | | | | 90,827,173 | |
New Relic Inc., cvt., senior note, 0.50%, 5/01/23 | | | United States | | | | 24,000,000 | | | | 23,126,395 | |
NXP Semiconductors NV, cvt., senior note, 1.00%, 12/01/19 | | | Netherlands | | | | 55,000,000 | | | | 60,468,235 | |
bOkta Inc., cvt., senior note, 144A, 0.125%, 9/01/25 | | | United States | | | | 80,000,000 | | | | 76,104,331 | |
Palo Alto Networks Inc., cvt., senior note, 0.75%, 7/01/23 | | | United States | | | | 53,000,000 | | | | 58,563,032 | |
bPluralsight Inc., cvt., senior note, 144A, 0.375%, 3/01/24 | | | United States | | | | 39,000,000 | | | | 34,317,270 | |
Q2 Holdings Inc., cvt., senior note, 0.75%, 2/15/23 | | | United States | | | | 32,000,000 | | | | 44,001,093 | |
RealPage Inc., cvt., senior note, 1.50%, 11/15/22 | | | United States | | | | 40,850,000 | | | | 62,622,618 | |
ServiceNow Inc., cvt., senior note, zero cpn., 6/01/22 | | | United States | | | | 40,000,000 | | | | 75,031,032 | |
Silicon Laboratories Inc., cvt., senior note, 1.375%, 3/01/22 | | | United States | | | | 53,700,000 | | | | 68,060,230 | |
Splunk Inc., cvt., senior note, 1.125%, 9/15/25 | | | United States | | | | 22,500,000 | | | | 25,019,773 | |
Square Inc., cvt., senior note, 0.50%, 5/15/23 | | | United States | | | | 65,000,000 | | | | 71,937,645 | |
Twilio Inc., cvt., senior note, 0.25%, 6/01/23 | | | United States | | | | 37,500,000 | | | | 57,083,392 | |
Viavi Solutions Inc., | | | | | | | | | | | | |
cvt., senior note, 1.75%, 6/01/23 | | | United States | | | | 40,969,000 | | | | 53,364,255 | |
cvt., senior note, 1.00%, 3/01/24 | | | United States | | | | 20,000,000 | | | | 26,875,000 | |
Wix.com Ltd., cvt., senior note, zero cpn., 7/01/23 | | | Israel | | | | 56,500,000 | | | | 64,533,170 | |
Workday Inc., cvt., senior note, 0.25%, 10/01/22 | | | United States | | | | 57,500,000 | | | | 73,415,695 | |
bWorkiva Inc., cvt., senior note, 144A, 1.125%, 8/15/26 | | | United States | | | | 22,000,000 | | | | 19,851,179 | |
Zendesk Inc., cvt., senior note, 0.25%, 3/15/23 | | | United States | | | | 56,500,000 | | | | 73,711,728 | |
| | | | | | | | | | | | |
| | | | | | | | | | | 1,470,793,715 | |
| | | | | | | | | | | | |
Materials 1.2% | | | | | | | | | | | | |
Cemex SAB de CV, cvt., sub. note, 3.72%, 3/15/20 | | | Mexico | | | | 44,250,000 | | | | 44,363,795 | |
| | | | | | | | | | | | |
Total Convertible Bonds (Cost $2,650,978,125) | | | | | | | | | | | 3,016,863,085 | |
| | | | | | | | | | | | |
| | | |
| | | | | | Shares | | | | |
Escrows and Litigation Trusts (Cost $22,362) 0.0% | | | | | | | | | | | | |
a,cMotors Liquidation Co., Escrow Account | | | United States | | | | 376,200 | | | | — | |
| | | | | | | | | | | | |
Total Investments before Short Term Investments
(Cost $3,399,475,988) | | | | | | | | | | | 3,797,090,441 | |
| | | | | | | | | | | | |
| | | | |
| | | |
| franklintempleton.com | | Annual Report | | 39 |
FRANKLIN INVESTORS SECURITIES TRUST
STATEMENT OF INVESTMENTS
Franklin Convertible Securities Fund(continued)
| | | | | | | | | | | | |
| | | Country | | | Shares | | | Value | |
| |
| | | |
Short Term Investments (Cost $89,909,657) 2.3% | | | | | | | | | | | | |
| | | |
Money Market Funds 2.3% | | | | | | | | | | | | |
d,eInstitutional Fiduciary Trust Money Market Portfolio, 1.56% | | | United States | | | | 89,909,657 | | | $ | 89,909,657 | |
| | | | | | | | | | | | |
| | | |
Total Investments (Cost $3,489,385,645) 100.8% | | | | | | | | | | | 3,887,000,098 | |
| | | |
Other Assets, less Liabilities (0.8)% | | | | | | | | | | | (29,770,514 | ) |
| | | | | | | | | | | | |
| | | |
Net Assets 100.0% | | | | | | | | | | $ | 3,857,229,584 | |
| | | | | | | | | | | | |
*The principal amount is stated in U.S. dollars unless otherwise indicated.
aNon-income producing.
bSecurity was purchased pursuant to Rule 144A under the Securities Act of 1933 and may be sold in transactions exempt from registration only to qualified institutional buyers or in a public offering registered under the Securities Act of 1933. At October 31, 2019, the aggregate value of these securities was $741,797,627, representing 19.2% of net assets.
cFair valued using significant unobservable inputs. See Note 11 regarding fair value measurements.
dSee Note 3(f) regarding investments in affiliated management investment companies.
eThe rate shown is the annualized seven-day effective yield at period end.
| | | | |
| | | |
40 | | Annual Report | The accompanying notes are an integral part of these financial statements. | | franklintempleton.com |
FRANKLIN INVESTORS SECURITIES TRUST
Financial Highlights
Franklin Equity Income Fund
| | | | | | | | | | | | | | | | | | | | |
| | | Year Ended October 31, | |
| | | 2019 | | | 2018 | | | 2017 | | | 2016 | | | 2015 | |
| | | | | |
Class A | | | | | | | | | | | | | | | | | | | | |
| | | | | |
Per share operating performance | | | | | | | | | | | | | | | | | | | | |
(for a share outstanding throughout the year) | | | | | | | | | | | | | | | | | | | | |
| | | | | |
Net asset value, beginning of year | | | $24.86 | | | | $25.06 | | | | $22.50 | | | | $22.99 | | | | $23.93 | |
| | | | |
| | | | | |
Income from investment operationsa: | | | | | | | | | | | | | | | | | | | | |
| | | | | |
Net investment incomeb | | | 0.46 | | | | 0.42 | | | | 0.48 | | | | 0.47 | | | | 0.55 | |
| | | | | |
Net realized and unrealized gains (losses) | | | 2.49 | | | | 0.58 | | | | 3.55 | | | | 0.24 | | | | 0.26 | |
| | | | |
| | | | | |
Total from investment operations | | | 2.95 | | | | 1.00 | | | | 4.03 | | | | 0.71 | | | | 0.81 | |
| | | | |
| | | | | |
Less distributions from: | | | | | | | | | | | | | | | | | | | | |
| | | | | |
Net investment income | | | (0.58 | ) | | | (0.57 | ) | | | (0.58 | ) | | | (0.60 | ) | | | (0.69) | |
| | | | | |
Net realized gains | | | (1.00 | ) | | | (0.63 | ) | | | (0.89 | ) | | | (0.60 | ) | | | (1.06) | |
| | | | |
| | | | | |
Total distributions | | | (1.58 | ) | | | (1.20 | ) | | | (1.47 | ) | | | (1.20 | ) | | | (1.75) | |
| | | | |
| | | | | |
Net asset value, end of year | | | $26.23 | | | | $24.86 | | | | $25.06 | | | | $22.50 | | | | $22.99 | |
| | | | |
| | | | | |
Total returnc | | | 12.73% | | | | 3.98% | | | | 18.55% | | | | 3.31% | | | | 3.72% | |
| | | | | |
Ratios to average net assets | | | | | | | | | | | | | | | | | | | | |
| | | | | |
Expenses before waiver and payments by affiliates | | | 0.86% | | | | 0.85% | | | | 0.86% | | | | 0.87% | | | | 0.86% | |
| | | | | |
Expenses net of waiver and payments by affiliatesd | | | 0.85% | | | | 0.84% | | | | 0.86% | e | | | 0.87% | e | | | 0.86% | e |
| | | | | |
Net investment income | | | 1.85% | | | | 1.66% | | | | 2.02% | | | | 2.13% | | | | 2.37% | |
| | | | | |
Supplemental data | | | | | | | | | | | | | | | | | | | | |
| | | | | |
Net assets, end of year (000’s) | | | $2,017,910 | | | | $1,752,181 | | | | $1,753,135 | | | | $1,700,712 | | | | $1,790,392 | |
| | | | | |
Portfolio turnover rate | | | 23.23% | | | | 28.40% | | | | 27.18% | | | | 50.05% | | | | 34.09% | |
aThe amount shown for a share outstanding throughout the period may not correlate with the Statement of Operations for the period due to the timing of sales and repurchases of the Fund’s shares in relation to income earned and/or fluctuating fair value of the investments of the Fund.
bBased on average daily shares outstanding.
cTotal return does not reflect sales commissions or contingent deferred sales charges, if applicable.
dBenefit of expense reduction rounds to less than 0.01%.
eBenefit of waiver and payments by affiliates rounds to less than 0.01%.
| | | | |
| | | |
| franklintempleton.com | | The accompanying notes are an integral part of these financial statements. | Annual Report | | 41 |
FRANKLIN INVESTORS SECURITIES TRUST
FINANCIAL HIGHLIGHTS
Franklin Equity Income Fund(continued)
| | | | | | | | | | | | | | | | | | | | |
| | | Year Ended October 31, | |
| | | 2019 | | | 2018 | | | 2017 | | | 2016 | | | 2015 | |
| | | | | |
Class C | | | | | | | | | | | | | | | | | | | | |
| | | | | |
Per share operating performance | | | | | | | | | | | | | | | | | | | | |
(for a share outstanding throughout the year) | | | | | | | | | | | | | | | | | | | | |
| | | | | |
Net asset value, beginning of year | | | $24.64 | | | | $24.86 | | | | $22.32 | | | | $22.85 | | | | $23.79 | |
| | | | |
| | | | | |
Income from investment operationsa: | | | | | | | | | | | | | | | | | | | | |
| | | | | |
Net investment incomeb | | | 0.28 | | | | 0.26 | | | | 0.30 | | | | 0.30 | | | | 0.37 | |
| | | | | |
Net realized and unrealized gains (losses) | | | 2.47 | | | | 0.53 | | | | 3.54 | | | | 0.23 | | | | 0.27 | |
| | | | |
| | | | | |
Total from investment operations | | | 2.75 | | | | 0.79 | | | | 3.84 | | | | 0.53 | | | | 0.64 | |
| | | | |
| | | | | |
Less distributions from: | | | | | | | | | | | | | | | | | | | | |
| | | | | |
Net investment income | | | (0.38 | ) | | | (0.38 | ) | | | (0.41 | ) | | | (0.46 | ) | | | (0.52 | ) |
| | | | | |
Net realized gains | | | (1.00 | ) | | | (0.63 | ) | | | (0.89 | ) | | | (0.60 | ) | | | (1.06 | ) |
| | | | |
| | | | | |
Total distributions | | | (1.38 | ) | | | (1.01 | ) | | | (1.30 | ) | | | (1.06 | ) | | | (1.58 | ) |
| | | | |
| | | | | |
Net asset value, end of year | | | $26.01 | | | | $24.64 | | | | $24.86 | | | | $22.32 | | | | $22.85 | |
| | | | |
| | | | | |
Total returnc | | | 11.91% | | | | 3.16% | | | | 17.73% | | | | 2.51% | | | | 2.96% | |
| | | | | |
Ratios to average net assets | | | | | | | | | | | | | | | | | | | | |
| | | | | |
Expenses before waiver and payments by affiliates | | | 1.61% | | | | 1.60% | | | | 1.61% | | | | 1.62% | | | | 1.61% | |
| | | | | |
Expenses net of waiver and payments by affiliatesd | | | 1.60% | | | | 1.59% | | | | 1.61% | e | | | 1.62% | e | | | 1.61% | e |
| | | | | |
Net investment income | | | 1.10% | | | | 0.91% | | | | 1.27% | | | | 1.38% | | | | 1.62% | |
| | | | | |
Supplemental data | | | | | | | | | | | | | | | | | | | | |
| | | | | |
Net assets, end of year (000’s) | | | $208,734 | | | | $204,402 | | | | $267,450 | | | | $257,156 | | | | $250,347 | |
| | | | | |
Portfolio turnover rate | | | 23.23% | | | | 28.40% | | | | 27.18% | | | | 50.05% | | | | 34.09% | |
aThe amount shown for a share outstanding throughout the period may not correlate with the Statement of Operations for the period due to the timing of sales and repurchases of the Fund’s shares in relation to income earned and/or fluctuating fair value of the investments of the Fund.
bBased on average daily shares outstanding.
cTotal return does not reflect sales commissions or contingent deferred sales charges, if applicable.
dBenefit of expense reduction rounds to less than 0.01%.
eBenefit of waiver and payments by affiliates rounds to less than 0.01%.
| | | | |
| | | |
42 | | Annual Report | The accompanying notes are an integral part of these financial statements. | | franklintempleton.com |
FRANKLIN INVESTORS SECURITIES TRUST
FINANCIAL HIGHLIGHTS
Franklin Equity Income Fund(continued)
| | | | | | | | | | | | | | | | | | | | |
| | | Year Ended October 31, | |
| | | 2019 | | | 2018 | | | 2017 | | | 2016 | | | 2015 | |
| | | | | |
Class R | | | | | | | | | | | | | | | | | | | | |
| | | | | |
Per share operating performance | | | | | | | | | | | | | | | | | | | | |
(for a share outstanding throughout the year) | | | | | | | | | | | | | | | | | | | | |
| | | | | |
Net asset value, beginning of year | | | $24.85 | | | | $25.05 | | | | $22.49 | | | | $22.99 | | | | $23.93 | |
| | | | |
| | | | | |
Income from investment operationsa: | | | | | | | | | | | | | | | | | | | | |
| | | | | |
Net investment incomeb | | | 0.41 | | | | 0.36 | | | | 0.42 | | | | 0.41 | | | | 0.50 | |
| | | | | |
Net realized and unrealized gains (losses) | | | 2.49 | | | | 0.58 | | | | 3.56 | | | | 0.24 | | | | 0.25 | |
| | | | |
| | | | | |
Total from investment operations | | | 2.90 | | | | 0.94 | | | | 3.98 | | | | 0.65 | | | | 0.75 | |
| | | | |
| | | | | |
Less distributions from: | | | | | | | | | | | | | | | | | | | | |
| | | | | |
Net investment income | | | (0.52 | ) | | | (0.51 | ) | | | (0.53 | ) | | | (0.55 | ) | | | (0.63 | ) |
| | | | | |
Net realized gains | | | (1.00 | ) | | | (0.63 | ) | | | (0.89 | ) | | | (0.60 | ) | | | (1.06 | ) |
| | | | |
| | | | | |
Total distributions | | | (1.52 | ) | | | (1.14 | ) | | | (1.42 | ) | | | (1.15 | ) | | | (1.69 | ) |
| | | | |
| | | | | |
Net asset value, end of year | | | $26.23 | | | | $24.85 | | | | $25.05 | | | | $22.49 | | | | $22.99 | |
| | | | |
| | | | | |
Total return | | | 12.50% | | | | 3.75% | | | | 18.29% | | | | 3.05% | | | | 3.45% | |
| | | | | |
Ratios to average net assets | | | | | | | | | | | | | | | | | | | | |
| | | | | |
Expenses before waiver and payments by affiliates | | | 1.09% | | | | 1.08% | | | | 1.09% | | | | 1.11% | | | | 1.11% | |
| | | | | |
Expenses net of waiver and payments by affiliatesc | | | 1.08% | | | | 1.07% | | | | 1.09% | d | | | 1.11% | d | | | 1.11% | d |
| | | | | |
Net investment income | | | 1.62% | | | | 1.43% | | | | 1.79% | | | | 1.89% | | | | 2.12% | |
| | | | | |
Supplemental data | | | | | | | | | | | | | | | | | | | | |
| | | | | |
Net assets, end of year (000’s) | | | $7,284 | | | | $6,750 | | | | $7,074 | | | | $6,395 | | | | $6,265 | |
| | | | | |
Portfolio turnover rate | | | 23.23% | | | | 28.40% | | | | 27.18% | | | | 50.05% | | | | 34.09% | |
aThe amount shown for a share outstanding throughout the period may not correlate with the Statement of Operations for the period due to the timing of sales and repurchases of the Fund’s shares in relation to income earned and/or fluctuating fair value of the investments of the Fund.
bBased on average daily shares outstanding.
cBenefit of expense reduction rounds to less than 0.01%.
dBenefit of waiver and payments by affiliates rounds to less than 0.01%.
| | | | |
| | | |
| franklintempleton.com | | The accompanying notes are an integral part of these financial statements. | Annual Report | | 43 |
FRANKLIN INVESTORS SECURITIES TRUST
FINANCIAL HIGHLIGHTS
Franklin Equity Income Fund(continued)
| | | | | | | | | | | | | | | | | | | | |
| | | Year Ended October 31, | |
| | | 2019 | | | 2018 | | | 2017 | | | 2016 | | | 2015 | |
| | | | | |
Class R6 | | | | | | | | | | | | | | | | | | | | |
| | | | | |
Per share operating performance | | | | | | | | | | | | | | | | | | | | |
(for a share outstanding throughout the year) | | | | | | | | | | | | | | | | | | | | |
| | | | | |
Net asset value, beginning of year | | | $24.91 | | | | $25.11 | | | | $22.54 | | | | $23.01 | | | | $23.95 | |
| | | | |
| | | | | |
Income from investment operationsa: | | | | | | | | | | | | | | | | | | | | |
| | | | | |
Net investment incomeb | | | 0.54 | | | | 0.50 | | | | 0.56 | | | | 0.43 | | | | 0.63 | |
| | | | | |
Net realized and unrealized gains (losses) | | | 2.50 | | | | 0.59 | | | | 3.57 | | | | 0.37 | | | | 0.27 | |
| | | | |
| | | | | |
Total from investment operations | | | 3.04 | | | | 1.09 | | | | 4.13 | | | | 0.80 | | | | 0.90 | |
| | | | |
| | | | | |
Less distributions from: | | | | | | | | | | | | | | | | | | | | |
| | | | | |
Net investment income | | | (0.66 | ) | | | (0.66 | ) | | | (0.67 | ) | | | (0.67 | ) | | | (0.78 | ) |
| | | | | |
Net realized gains | | | (1.00 | ) | | | (0.63 | ) | | | (0.89 | ) | | | (0.60 | ) | | | (1.06 | ) |
| | | | |
| | | | | |
Total distributions | | | (1.66 | ) | | | (1.29 | ) | | | (1.56 | ) | | | (1.27 | ) | | | (1.84 | ) |
| | | | |
| | | | | |
Net asset value, end of year | | | $26.29 | | | | $24.91 | | | | $25.11 | | | | $22.54 | | | | $23.01 | |
| | | | |
| | | | | |
Total return | | | 13.12% | | | | 4.35% | | | | 19.00% | | | | 3.72% | | | | 4.10% | |
| | | | | |
Ratios to average net assets | | | | | | | | | | | | | | | | | | | | |
| | | | | |
Expenses before waiver and payments by affiliates | | | 0.53% | | | | 0.52% | | | | 0.49% | | | | 0.49% | | | | 2.89% | |
| | | | | |
Expenses net of waiver and payments by affiliatesc | | | 0.51% | | | | 0.50% | | | | 0.49% | d | | | 0.49% | d | | | 0.48% | |
| | | | | |
Net investment income | | | 2.19% | | | | 2.00% | | | | 2.39% | | | | 2.51% | | | | 2.75% | |
| | | | | |
Supplemental data | | | | | | | | | | | | | | | | | | | | |
| | | | | |
Net assets, end of year (000’s) | | | $96,406 | | | | $81,171 | | | | $12,728 | | | | $10,537 | | | | $6 | |
| | | | | |
Portfolio turnover rate | | | 23.23% | | | | 28.40% | | | | 27.18% | | | | 50.05% | | | | 34.09% | |
aThe amount shown for a share outstanding throughout the period may not correlate with the Statement of Operations for the period due to the timing of sales and repurchases of the Fund’s shares in relation to income earned and/or fluctuating fair value of the investments of the Fund.
bBased on average daily shares outstanding.
cBenefit of expense reduction rounds to less than 0.01%.
dBenefit of waiver and payments by affiliates rounds to less than 0.01%.
| | | | |
| | | |
44 | | Annual Report | The accompanying notes are an integral part of these financial statements. | | franklintempleton.com |
FRANKLIN INVESTORS SECURITIES TRUST
FINANCIAL HIGHLIGHTS
Franklin Equity Income Fund(continued)
| | | | | | | | | | | | | | | | | | | | |
| | | Year Ended October 31, | |
| | | 2019 | | | 2018 | | | 2017 | | | 2016 | | | 2015 | |
| | | | | |
Advisor Class | | | | | | | | | | | | | | | | | | | | |
| | | | | |
Per share operating performance | | | | | | | | | | | | | | | | | | | | |
(for a share outstanding throughout the year) | | | | | | | | | | | | | | | | | | | | |
| | | | | |
Net asset value, beginning of year | | | $24.90 | | | | $25.10 | | | | $22.53 | | | | $23.02 | | | | $23.96 | |
| | | | | |
Income from investment operationsa: | | | | | | | | | | | | | | | | | | | | |
| | | | | |
Net investment incomeb | | | 0.50 | | | | 0.46 | | | | 0.50 | | | | 0.45 | | | | 0.60 | |
| | | | | |
Net realized and unrealized gains (losses) | | | 2.51 | | | | 0.60 | | | | 3.60 | | | | 0.31 | | | | 0.27 | |
| | | | | |
Total from investment operations | | | 3.01 | | | | 1.06 | | | | 4.10 | | | | 0.76 | | | | 0.87 | |
| | | | | |
Less distributions from: | | | | | | | | | | | | | | | | | | | | |
| | | | | |
Net investment income | | | (0.64 | ) | | | (0.63 | ) | | | (0.64 | ) | | | (0.65 | ) | | | (0.75 | ) |
| | | | | |
Net realized gains | | | (1.00 | ) | | | (0.63 | ) | | | (0.89 | ) | | | (0.60 | ) | | | (1.06 | ) |
| | | | | |
Total distributions | | | (1.64 | ) | | | (1.26 | ) | | | (1.53 | ) | | | (1.25 | ) | | | (1.81 | ) |
| | | | | |
Net asset value, end of year | | | $26.27 | | | | $24.90 | | | | $25.10 | | | | $22.53 | | | | $23.02 | |
| | | | | |
Total return | | | 13.04% | | | | 4.22% | | | | 18.88% | | | | 3.53% | | | | 3.98% | |
| | | | | |
Ratios to average net assets | | | | | | | | | | | | | | | | | | | | |
| | | | | |
Expenses before waiver and payments by affiliates | | | 0.61% | | | | 0.60% | | | | 0.61% | | | | 0.62% | | | | 0.61% | |
| | | | | |
Expenses net of waiver and payments by affiliatesc | | | 0.60% | | | | 0.59% | | | | 0.61% | d | | | 0.62% | d | | | 0.61% | d |
| | | | | |
Net investment income | | | 2.10% | | | | 1.91% | | | | 2.27% | | | | 2.38% | | | | 2.62% | |
| | | | | |
Supplemental data | | | | | | | | | | | | | | | | | | | | |
| | | | | |
Net assets, end of year (000’s) | | | $173,739 | | | | $109,435 | | | | $147,681 | | | | $80,422 | | | | $34,577 | |
| | | | | |
Portfolio turnover rate | | | 23.23% | | | | 28.40% | | | | 27.18% | | | | 50.05% | | | | 34.09% | |
aThe amount shown for a share outstanding throughout the period may not correlate with the Statement of Operations for the period due to the timing of sales and repurchases of the Fund’s shares in relation to income earned and/or fluctuating fair value of the investments of the Fund.
bBased on average daily shares outstanding.
cBenefit of expense reduction rounds to less than 0.01%.
dBenefit of waiver and payments by affiliates rounds to less than 0.01%.
| | | | |
| | | |
| franklintempleton.com | | The accompanying notes are an integral part of these financial statements. | Annual Report | | 45 |
FRANKLIN INVESTORS SECURITIES TRUST
Statement of Investments, October 31, 2019
Franklin Equity Income Fund
| | | | | | | | | | | | |
| | | Country | | | Shares | | | Value | |
Common Stocks 84.8% | | | | | | | | | | | | |
Communication Services 5.0% | | | | | | | | | | | | |
Comcast Corp., A | | | United States | | | | 860,000 | | | $ | 38,545,200 | |
Rogers Communications Inc., B | | | Canada | | | | 350,000 | | | | 16,481,500 | |
TELUS Corp. | | | Canada | | | | 470,000 | | | | 16,725,788 | |
Verizon Communications Inc. | | | United States | | | | 875,000 | | | | 52,911,250 | |
| | | | | | | | | | | | |
| | | | | | | | | | | 124,663,738 | |
| | | | | | | | | | | | |
Consumer Discretionary 3.6% | | | | | | | | | | | | |
Lowe’s Cos. Inc. | | | United States | | | | 151,000 | | | | 16,853,110 | |
McDonald’s Corp. | | | United States | | | | 180,000 | | | | 35,406,000 | |
Target Corp. | | | United States | | | | 220,000 | | | | 23,520,200 | |
Tractor Supply Co. | | | United States | | | | 155,000 | | | | 14,728,100 | |
| | | | | | | | | | | | |
| | | | | | | | | | | 90,507,410 | |
| | | | | | | | | | | | |
Consumer Staples 11.0% | | | | | | | | | | | | |
The Coca-Cola Co. | | | United States | | | | 1,075,000 | | | | 58,512,250 | |
Nestle SA | | | Switzerland | | | | 190,000 | | | | 20,285,671 | |
PepsiCo Inc. | | | United States | | | | 415,000 | | | | 56,925,550 | |
The Procter & Gamble Co. | | | United States | | | | 546,500 | | | | 68,044,715 | |
Unilever NV, N.Y. shs | | | United Kingdom | | | | 450,000 | | | | 26,658,000 | |
Walmart Inc. | | | United States | | | | 380,000 | | | | 44,558,800 | |
| | | | | | | | | | | | |
| | | | | | | | | | | 274,984,986 | |
| | | | | | | | | | | | |
Energy 7.7% | | | | | | | | | | | | |
Chevron Corp. | | | United States | | | | 500,000 | | | | 58,070,000 | |
Exxon Mobil Corp. | | | United States | | | | 455,934 | | | | 30,807,460 | |
Occidental Petroleum Corp. | | | United States | | | | 537,000 | | | | 21,748,500 | |
ONEOK Inc. | | | United States | | | | 250,000 | | | | 17,457,500 | |
Royal Dutch Shell PLC, A, ADR | | | United Kingdom | | | | 600,000 | | | | 34,782,000 | |
Suncor Energy Inc. | | | Canada | | | | 1,035,000 | | | | 30,729,150 | |
| | | | | | | | | | | | |
| | | | | | | | | | | 193,594,610 | |
| | | | | | | | | | | | |
Financials 16.2% | | | | | | | | | | | | |
Arthur J. Gallagher & Co. | | | United States | | | | 210,000 | | | | 19,156,200 | |
Bank of America Corp. | | | United States | | | | 1,679,708 | | | | 52,524,469 | |
BB&T Corp. | | | United States | | | | 1,050,000 | | | | 55,702,500 | |
BlackRock Inc. | | | United States | | | | 39,500 | | | | 18,237,150 | |
JPMorgan Chase & Co. | | | United States | | | | 866,000 | | | | 108,180,720 | |
MetLife Inc. | | | United States | | | | 810,000 | | | | 37,899,900 | |
Morgan Stanley | | | United States | | | | 1,225,000 | | | | 56,411,250 | |
U.S. Bancorp | | | United States | | | | 555,000 | | | | 31,646,100 | |
Wells Fargo & Co. | | | United States | | | | 525,000 | | | | 27,105,750 | |
| | | | | | | | | | | | |
| | | | | | | | | | | 406,864,039 | |
| | | | | | | | | | | | |
Health Care 10.9% | | | | | | | | | | | | |
Baxter International Inc. | | | United States | | | | 380,000 | | | | 29,146,000 | |
Eli Lilly & Co. | | | United States | | | | 55,000 | | | | 6,267,250 | |
HCA Holdings Inc. | | | United States | | | | 120,000 | | | | 16,024,800 | |
Johnson & Johnson. | | | United States | | | | 400,000 | | | | 52,816,000 | |
Medtronic PLC | | | United States | | | | 455,000 | | | | 49,549,500 | |
Merck & Co. Inc. | | | United States | | | | 455,000 | | | | 39,430,300 | |
| | | | |
| | | |
46 | | Annual Report | | franklintempleton.com |
FRANKLIN INVESTORS SECURITIES TRUST
STATEMENT OF INVESTMENTS
Franklin Equity Income Fund(continued)
| | | | | | | | | | | | |
| | | Country | | | Shares | | | Value | |
| | | |
Common Stocks(continued) | | | | | | | | | | | | |
Health Care(continued) | | | | | | | | | | | | |
Pfizer Inc. | | | United States | | | | 1,184,300 | | | $ | 45,441,591 | |
UnitedHealth Group Inc. | | | United States | | | | 140,500 | | | | 35,504,350 | |
| | | | | | | | | | | | |
| | | | | | | | | | | 274,179,791 | |
| | | | | | | | | | | | |
Industrials 11.4% | | | | | | | | | | | | |
3M Co. | | | United States | | | | 167,500 | | | | 27,635,825 | |
Emerson Electric Co. | | | United States | | | | 381,000 | | | | 26,727,150 | |
Illinois Tool Works Inc. | | | United States | | | | 82,500 | | | | 13,907,850 | |
Lockheed Martin Corp. | | | United States | | | | 95,000 | | | | 35,784,600 | |
Norfolk Southern Corp. | | | United States | | | | 216,000 | | | | 39,312,000 | |
Raytheon Co. | | | United States | | | | 215,000 | | | | 45,625,150 | |
Republic Services Inc. | | | United States | | | | 498,500 | | | | 43,623,735 | |
Stanley Black & Decker Inc. | | | United States | | | | 95,780 | | | | 14,494,388 | |
United Technologies Corp. | | | United States | | | | 260,000 | | | | 37,330,800 | |
| | | | | | | | | | | | |
| | | | | | | | | | | 284,441,498 | |
| | | | | | | | | | | | |
Information Technology 8.8% | | | | | | | | | | | | |
Analog Devices Inc. | | | United States | | | | 176,000 | | | | 18,766,880 | |
Apple Inc. | | | United States | | | | 130,000 | | | | 32,338,800 | |
Cisco Systems Inc. | | | United States | | | | 629,233 | | | | 29,894,860 | |
Intel Corp. | | | United States | | | | 328,402 | | | | 18,564,565 | |
Microsoft Corp. | | | United States | | | | 500,000 | | | | 71,685,000 | |
Oracle Corp. | | | United States | | | | 340,000 | | | | 18,526,600 | |
Texas Instruments Inc. | | | United States | | | | 250,000 | | | | 29,497,500 | |
| | | | | | | | | | | | |
| | | | | | | | | | | 219,274,205 | |
| | | | | | | | | | | | |
Materials 1.3% | | | | | | | | | | | | |
BASF SE | | | Germany | | | | 87,500 | | | | 6,658,481 | |
Dow Inc. | | | United States | | | | 160,000 | | | | 8,078,400 | |
DuPont de Nemours Inc. | | | United States | | | | 138,333 | | | | 9,117,528 | |
International Paper Co. | | | United States | | | | 175,000 | | | | 7,644,000 | |
| | | | | | | | | | | | |
| | | | | | | | | | | 31,498,409 | |
| | | | | | | | | | | | |
Real Estate 2.8% | | | | | | | | | | | | |
Equity Residential | | | United States | | | | 300,000 | | | | 26,598,000 | |
Host Hotels & Resorts Inc. | | | United States | | | | 1,525,000 | | | | 24,994,750 | |
Prologis Inc. | | | United States | | | | 215,000 | | | | 18,868,400 | |
| | | | | | | | | | | | |
| | | | | | | | | | | 70,461,150 | |
| | | | | | | | | | | | |
Utilities 6.1% | | | | | | | | | | | | |
Duke Energy Corp. | | | United States | | | | 500,000 | | | | 47,130,000 | |
NextEra Energy Inc. | | | United States | | | | 255,300 | | | | 60,848,202 | |
Xcel Energy Inc. | | | United States | | | | 723,500 | | | | 45,949,485 | |
| | | | | | | | | | | | |
| | | | | | | | | | | 153,927,687 | |
| | | | | | | | | | | | |
Total Common Stocks (Cost $1,443,490,738) | | | | | | | | | | | 2,124,397,523 | |
| | | | | | | | | | | | |
| | | | |
| | | |
| franklintempleton.com | | Annual Report | | 47 |
FRANKLIN INVESTORS SECURITIES TRUST
STATEMENT OF INVESTMENTS
Franklin Equity Income Fund(continued)
| | | | | | | | | | | | |
| | | Country | | | Shares | | | Value | |
aEquity-Linked Securities 9.0% | | | | | | | | | | | | |
Consumer Discretionary 3.5% | | | | | | | | | | | | |
bCitigroup Global Markets Holdings Inc. into Amazon.com Inc., 6.50%, 144A | | | United States | | | | 17,500 | | | $ | 31,075,144 | |
bJPMorgan Chase Bank NA into The TJX Cos. Inc., 5.50%, 144A | | | United States | | | | 326,000 | | | | 18,574,196 | |
bRoyal Bank of Canada into Lowe’s Cos. Inc., 7.00%, 144A | | | United States | | | | 115,000 | | | | 12,815,029 | |
bWells Fargo Bank National Assn. into Dollar General Corp., 6.50%, 144A | | | United States | | | | 205,000 | | | | 25,299,758 | |
| | | | | | | | | | | | |
| | | | | | | | | | | 87,764,127 | |
| | | | | | | | | | | | |
Energy 0.6% | | | | | | | | | | | | |
bCitigroup Global Markets Holdings Inc. into Occidental Petroleum Corp., 8.00%, 144A | | | United States | | | | 250,000 | | | | 14,404,227 | |
| | | | | | | | | | | | |
| | | |
Financials 1.8% | | | | | | | | | | | | |
bCredit Suisse AG into Bank of America Corp., 7.00%, 144A | | | United States | | | | 850,000 | | | | 26,266,131 | |
bGoldman Sachs International into The Charles Schwab Corp., 7.00%, 144A | | | United States | | | | 436,000 | | | | 17,951,764 | |
| | | | | | | | | | | | |
| | | | | | | | | | | 44,217,895 | |
| | | | | | | | | | | | |
Health Care 0.7% | | | | | | | | | | | | |
bGoldman Sachs International into HCA Holdings Inc., 6.00%, 144A | | | United States | | | | 140,200 | | | | 18,980,648 | |
| | | | | | | | | | | | |
| | | |
Information Technology 2.4% | | | | | | | | | | | | |
bBarclays Bank PLC into Broadcom Inc., 10.00%, 144A | | | United States | | | | 67,000 | | | | 19,913,683 | |
bBarclays Bank PLC into Microsoft Corp., 6.50%, 144A | | | United States | | | | 110,000 | | | | 15,593,932 | |
bGoldman Sachs International into Intel Corp., 8.00%, 144A | | | United States | | | | 230,000 | | | | 12,650,636 | |
bMerrill Lynch International & Co. CV into Cisco System Inc., 7.00%, 144A | | | United States | | | | 225,000 | | | | 10,952,125 | |
| | | | | | | | | | | | |
| | | | | | | | | | | 59,110,376 | |
| | | | | | | | | | | | |
Total Equity-Linked Securities (Cost $212,583,202) | | | | | | | | | | | 224,477,273 | |
| | | | | | | | | | | | |
| | | |
Convertible Preferred Stocks 3.6% | | | | | | | | | | | | |
| | | |
Health Care 1.7% | | | | | | | | | | | | |
Becton Dickinson and Co., 6.125%, cvt. pfd., A | | | United States | | | | 700,000 | | | | 43,176,000 | |
| | | | | | | | | | | | |
| | | |
Industrials 0.5% | | | | | | | | | | | | |
Fortive Corp., 5.00%, cvt. pfd., A | | | United States | | | | 13,250 | | | | 11,932,287 | |
| | | | | | | | | | | | |
| | | |
Information Technology 0.5% | | | | | | | | | | | | |
Broadcom Inc., 8.00%, cvt. pfd., A | | | United States | | | | 12,400 | | | | 13,429,448 | |
| | | | | | | | | | | | |
| | | |
Utilities 0.9% | | | | | | | | | | | | |
Aqua America Inc., 6.00%, cvt. pfd. | | | United States | | | | 370,000 | | | | 22,292,500 | |
| | | | | | | | | | | | |
| | | |
Total Convertible Preferred Stocks (Cost $84,719,755) | | | | | | | | | | | 90,830,235 | |
| | | | | | | | | | | | |
| | | |
Total Investments before Short Term Investments
(Cost $1,740,793,695) | | | | | | | | | | | 2,439,705,031 | |
| | | | | | | | | | | | |
| | | | |
| | | |
48 | | Annual Report | | franklintempleton.com |
FRANKLIN INVESTORS SECURITIES TRUST
STATEMENT OF INVESTMENTS
Franklin Equity Income Fund(continued)
| | | | | | | | | | | | |
| | | Country | | | Shares | | | Value | |
| | | |
Short Term Investments (Cost $69,588,667) 2.8% | | | | | | | | | | | | |
| | | |
Money Market Funds 2.8% | | | | | | | | | | | | |
c,dInstitutional Fiduciary Trust Money Market Portfolio, 1.56% | | | United States | | | | 69,588,667 | | | $ | 69,588,667 | |
| | | | | | | | | | | | |
| | | |
Total Investments (Cost $1,810,382,362) 100.2% | | | | | | | | | | | 2,509,293,698 | |
Other Assets, less Liabilities (0.2)% | | | | | | | | | | | (5,221,897 | ) |
| | | | | | | | | | | | |
| | | |
Net Assets 100.0% | | | | | | | | | | $ | 2,504,071,801 | |
| | | | | | | | | | | | |
See Abbreviations on page 91.
aSee Note 1(e) regarding equity-linked securities.
bSecurity was purchased pursuant to Rule 144A under the Securities Act of 1933 and may be sold in transactions exempt from registration only to qualified institutional buyers or in a public offering registered under the Securities Act of 1933. At October 31, 2019, the aggregate value of these securities was $224,477,273, representing 9.0% of net assets.
cSee Note 3(f) regarding investments in affiliated management investment companies.
dThe rate shown is the annualized seven-day effective yield at period end.
| | | | |
| | | |
| franklintempleton.com | | The accompanying notes are an integral part of these financial statements. | Annual Report | | 49 |
FRANKLIN INVESTORS SECURITIES TRUST
Financial Highlights
Franklin Managed Income Fund
| | | | | | | | | | | | | | | | | | | | |
| | | Year Ended October 31, | |
| | | 2019 | | | 2018 | | | 2017 | | | 2016 | | | 2015 | |
| | | | | |
Class A | | | | | | | | | | | | | | | | | | | | |
| | | | | |
Per share operating performance (for a share outstanding throughout the year) | | | | | | | | | | | | | | | | | | | | |
| | | | | |
Net asset value, beginning of year | | | $11.89 | | | | $12.36 | | | | $11.65 | | | | $11.40 | | | | $11.86 | |
| | | | | |
Income from investment operationsa: | | | | | | | | | | | | | | | | | | | | |
| | | | | |
Net investment incomeb | | | 0.29 | | | | 0.27 | | | | 0.33 | | | | 0.30 | | | | 0.30 | |
| | | | | |
Net realized and unrealized gains (losses) | | | 1.17 | | | | (0.16 | ) | | | 0.91 | | | | 0.31 | | | | (0.24 | ) |
| | | | | |
Total from investment operations | | | 1.46 | | | | 0.11 | | | | 1.24 | | | | 0.61 | | | | 0.06 | |
| | | | | |
Less distributions from: | | | | | | | | | | | | | | | | | | | | |
| | | | | |
Net investment income | | | (0.41 | ) | | | (0.38 | ) | | | (0.36 | ) | | | (0.36 | ) | | | (0.36 | ) |
| | | | | |
Net realized gains | | | (0.14 | ) | | | (0.20 | ) | | | (0.17 | ) | | | (— | )c | | | (0.16 | ) |
| | | | | |
Total distributions | | | (0.55 | ) | | | (0.58 | ) | | | (0.53 | ) | | | (0.36 | ) | | | (0.52 | ) |
| | | | | |
Net asset value, end of year | | | $12.80 | | | | $11.89 | | | | $12.36 | | | | $11.65 | | | | $11.40 | |
| | | | | |
Total returnd | | | 12.64% | | | | 0.89% | | | | 10.88% | | | | 5.54% | | | | 0.51% | |
| | | | | |
Ratios to average net assets | | | | | | | | | | | | | | | | | | | | |
| | | | | |
Expenses before waiver and payments by affiliates | | | 0.96% | | | | 1.02% | | | | 1.02% | | | | 1.02% | | | | 1.06% | |
| | | | | |
Expenses net of waiver and payments by affiliatese | | | 0.94% | | | | 1.01% | | | | 1.00% | | | | 1.01% | | | | 1.06% | f |
| | | | | |
Net investment income | | | 2.36% | | | | 2.22% | | | | 2.72% | | | | 2.62% | | | | 2.56% | |
| | | | | |
Supplemental data | | | | | | | | | | | | | | | | | | | | |
| | | | | |
Net assets, end of year (000’s) | | | $2,966,899 | | | | $2,586,246 | | | | $2,646,599 | | | | $2,532,459 | | | | $2,371,133 | |
| | | | | |
Portfolio turnover rate | | | 53.02% | | | | 63.64% | | | | 34.99% | | | | 46.03% | | | | 69.23% | |
aThe amount shown for a share outstanding throughout the period may not correlate with the Statement of Operations for the period due to the timing of sales and repurchases of the Fund’s shares in relation to income earned and/or fluctuating fair value of the investments of the Fund.
bBased on average daily shares outstanding.
cAmount rounds to less than $0.01 per share.
dTotal return does not reflect sales commissions or contingent deferred sales charges, if applicable.
eBenefit of expense reduction rounds to less than 0.01%.
fBenefit of waiver and payments by affiliates rounds to less than 0.01%.
| | | | |
| | | |
50 | | Annual Report | The accompanying notes are an integral part of these financial statements. | | franklintempleton.com |
FRANKLIN INVESTORS SECURITIES TRUST
FINANCIAL HIGHLIGHTS
Franklin Managed Income Fund (continued)
| | | | | | | | | | | | | | | | | | | | |
| | | Year Ended October 31, | |
| | | 2019 | | | 2018 | | | 2017 | | | 2016 | | | 2015 | |
| | | | | |
Class C | | | | | | | | | | | | | | | | | | | | |
| | | | | |
Per share operating performance | | | | | | | | | | | | | | | | | | | | |
(for a share outstanding throughout the year) | | | | | | | | | | | | | | | | | | | | |
| | | | | |
Net asset value, beginning of year | | | $11.78 | | | | $12.25 | | | | $11.55 | | | | $11.31 | | | | $11.77 | |
| | | | |
| | | | | |
Income from investment operationsa: | | | | | | | | | | | | | | | | | | | | |
| | | | | |
Net investment incomeb | | | 0.20 | | | | 0.19 | | | | 0.24 | | | | 0.21 | | | | 0.21 | |
| | | | | |
Net realized and unrealized gains (losses) | | | 1.15 | | | | (0.17 | ) | | | 0.90 | | | | 0.31 | | | | (0.23 | ) |
| | | | |
| | | | | |
Total from investment operations | | | 1.35 | | | | 0.02 | | | | 1.14 | | | | 0.52 | | | | (0.02 | ) |
| | | | |
| | | | | |
Less distributions from: | | | | | | | | | | | | | | | | | | | | |
| | | | | |
Net investment income | | | (0.32 | ) | | | (0.29 | ) | | | (0.27 | ) | | | (0.28 | ) | | | (0.28 | ) |
| | | | | |
Net realized gains | | | (0.14 | ) | | | (0.20 | ) | | | (0.17 | ) | | | (— | )c | | | (0.16 | ) |
| | | | |
| | | | | |
Total distributions | | | (0.46 | ) | | | (0.49 | ) | | | (0.44 | ) | | | (0.28 | ) | | | (0.44 | ) |
| | | | |
| | | | | |
Net asset value, end of year | | | $12.67 | | | | $11.78 | | | | $12.25 | | | | $11.55 | | | | $11.31 | |
| | | | |
| | | | | |
Total returnd | | | 11.79% | | | | 0.14% | | | | 10.06% | | | | 4.73% | | | | (0.20)% | |
| | | | | |
Ratios to average net assets | | | | | | | | | | | | | | | | | | | | |
| | | | | |
Expenses before waiver and payments by affiliates | | | 1.71% | | | | 1.76% | | | | 1.77% | | | | 1.77% | | | | 1.77% | |
| | | | | |
Expenses net of waiver and payments by affiliatese | | | 1.69% | | | | 1.75% | | | | 1.75% | | | | 1.76% | | | | 1.77% | f |
| | | | | |
Net investment income | | | 1.61% | | | | 1.48% | | | | 1.97% | | | | 1.87% | | | | 1.85% | |
| | | | | |
Supplemental data | | | | | | | | | | | | | | | | | | | | |
| | | | | |
Net assets, end of year (000’s) | | | $491,751 | | | | $493,762 | | | | $633,108 | | | | $630,110 | | | | $563,419 | |
| | | | | |
Portfolio turnover rate | | | 53.02% | | | | 63.64% | | | | 34.99% | | | | 46.03% | | | | 69.23% | |
aThe amount shown for a share outstanding throughout the period may not correlate with the Statement of Operations for the period due to the timing of sales and repurchases of the Fund’s shares in relation to income earned and/or fluctuating fair value of the investments of the Fund.
bBased on average daily shares outstanding.
cAmount rounds to less than $0.01 per share.
dTotal return does not reflect sales commissions or contingent deferred sales charges, if applicable.
eBenefit of expense reduction rounds to less than 0.01%.
fBenefit of waiver and payments by affiliates rounds to less than 0.01%.
| | | | |
| | | |
| franklintempleton.com | | The accompanying notes are an integral part of these financial statements. | Annual Report | | 51 |
FRANKLIN INVESTORS SECURITIES TRUST
FINANCIAL HIGHLIGHTS
Franklin Managed Income Fund (continued)
| | | | | | | | | | | | | | | | | | | | |
| | | Year Ended October 31, | |
| | | 2019 | | | 2018 | | | 2017 | | | 2016 | | | 2015 | |
| | | | | |
Class R | | | | | | | | | | | | | | | | | | | | |
| | | | | |
Per share operating performance | | | | | | | | | | | | | | | | | | | | |
(for a share outstanding throughout the year) | | | | | | | | | | | | | | | | | | | | |
| | | | | |
Net asset value, beginning of year | | | $11.92 | | | | $12.39 | | | | $11.67 | | | | $11.42 | | | | $11.89 | |
| | | | |
| | | | | |
Income from investment operationsa: | | | | | | | | | | | | | | | | | | | | |
| | | | | |
Net investment incomeb | | | 0.26 | | | | 0.26 | | | | 0.30 | | | | 0.27 | | | | 0.27 | |
| | | | | |
Net realized and unrealized gains (losses) | | | 1.18 | | | | (0.18 | ) | | | 0.92 | | | | 0.32 | | | | (0.24 | ) |
| | | | |
| | | | | |
Total from investment operations | | | 1.44 | | | | 0.08 | | | | 1.22 | | | | 0.59 | | | | 0.03 | |
| | | | |
| | | | | |
Less distributions from: | | | | | | | | | | | | | | | | | | | | |
| | | | | |
Net investment income | | | (0.38 | ) | | | (0.35 | ) | | | (0.33 | ) | | | (0.34 | ) | | | (0.34 | ) |
| | | | | |
Net realized gains | | | (0.14 | ) | | | (0.20 | ) | | | (0.17 | ) | | | (— | )c | | | (0.16 | ) |
| | | | |
| | | | | |
Total distributions | | | (0.52 | ) | | | (0.55 | ) | | | (0.50 | ) | | | (0.34 | ) | | | (0.50 | ) |
| | | | |
| | | | | |
Net asset value, end of year | | | $12.84 | | | | $11.92 | | | | $12.39 | | | | $11.67 | | | | $11.42 | |
| | | | |
| | | | | |
Total return | | | 12.43% | | | | 0.63% | | | | 10.66% | | | | 5.28% | | | | 0.21% | |
| | | | | |
Ratios to average net assets | | | | | | | | | | | | | | | | | | | | |
| | | | | |
Expenses before waiver and payments by affiliates | | | 1.21% | | | | 1.27% | | | | 1.27% | | | | 1.27% | | | | 1.27% | |
| | | | | |
Expenses net of waiver and payments by affiliatesd | | | 1.19% | | | | 1.26% | | | | 1.25% | | | | 1.26% | | | | 1.27% | e |
| | | | | |
Net investment income | | | 2.11% | | | | 1.97% | | | | 2.47% | | | | 2.37% | | | | 2.35% | |
| | | | | |
Supplemental data | | | | | | | | | | | | | | | | | | | | |
| | | | | |
Net assets, end of year (000’s) | | | $4,081 | | | | $3,371 | | | | $4,763 | | | | $4,482 | | | | $4,699 | |
| | | | | |
Portfolio turnover rate | | | 53.02% | | | | 63.64% | | | | 34.99% | | | | 46.03% | | | | 69.23% | |
aThe amount shown for a share outstanding throughout the period may not correlate with the Statement of Operations for the period due to the timing of sales and repurchases of the Fund’s shares in relation to income earned and/or fluctuating fair value of the investments of the Fund.
bBased on average daily shares outstanding.
cAmount rounds to less than $0.01 per share.
dBenefit of expense reduction rounds to less than 0.01%.
eBenefit of waiver and payments by affiliates rounds to less than 0.01%.
| | | | |
| | | |
52 | | Annual Report | The accompanying notes are an integral part of these financial statements. | | franklintempleton.com |
FRANKLIN INVESTORS SECURITIES TRUST
FINANCIAL HIGHLIGHTS
Franklin Managed Income Fund (continued)
| | | | | | | | | | | | | | | | | | | | |
| | | Year Ended October 31, | |
| | | 2019 | | | 2018 | | | 2017 | | | 2016 | | | 2015 | |
| | | | | |
Class R6 | | | | | | | | | | | | | | | | | | | | |
| | | | | |
Per share operating performance | | | | | | | | | | | | | | | | | | | | |
(for a share outstanding throughout the year) | | | | | | | | | | | | | | | | | | | | |
| | | | | |
Net asset value, beginning of year | | | $11.93 | | | | $12.39 | | | | $11.67 | | | | $11.42 | | | | $11.89 | |
| | | | |
| | | | | |
Income from investment operationsa: | | | | | | | | | | | | | | | | | | | | |
| | | | | |
Net investment incomeb | | | 0.33 | | | | 0.31 | | | | 0.41 | | | | 0.34 | | | | 0.35 | |
| | | | | |
Net realized and unrealized gains (losses) | | | 1.18 | | | | (0.14 | ) | | | 0.88 | | | | 0.31 | | | | (0.25 | ) |
| | | | |
| | | | | |
Total from investment operations | | | 1.51 | | | | 0.17 | | | | 1.29 | | | | 0.65 | | | | 0.10 | |
| | | | |
| | | | | |
Less distributions from: | | | | | | | | | | | | | | | | | | | | |
| | | | | |
Net investment income | | | (0.45 | ) | | | (0.43 | ) | | | (0.40 | ) | | | (0.40 | ) | | | (0.41 | ) |
| | | | | |
Net realized gains | | | (0.14 | ) | | | (0.20 | ) | | | (0.17 | ) | | | (— | )c | | | (0.16 | ) |
| | | | |
| | | | | |
Total distributions | | | (0.59 | ) | | | (0.63 | ) | | | (0.57 | ) | | | (0.40 | ) | | | (0.57 | ) |
| | | | |
| | | | | |
Net asset value, end of year | | | $12.85 | | | | $11.93 | | | | $12.39 | | | | $11.67 | | | | $11.42 | |
| | | | |
| | | | | |
Total return | | | 13.14% | | | | 1.23% | | | | 11.33% | | | | 5.90% | | | | 0.81% | |
| | | | | |
Ratios to average net assets | | | | | | | | | | | | | | | | | | | | |
| | | | | |
Expenses before waiver and payments by affiliates | | | 0.63% | | | | 0.68% | | | | 0.71% | | | | 0.73% | | | | 0.70% | |
| | | | | |
Expenses net of waiver and payments by affiliatesd | | | 0.61% | | | | 0.66% | | | | 0.64% | | | | 0.66% | | | | 0.67% | |
| | | | | |
Net investment income | | | 2.69% | | | | 2.56% | | | | 3.08% | | | | 2.97% | | | | 2.95% | |
| | | | | |
Supplemental data | | | | | | | | | | | | | | | | | | | | |
| | | | | |
Net assets, end of year (000’s) | | | $159,877 | | | | $138,923 | | | | $342 | | | | $233 | | | | $221 | |
| | | | | |
Portfolio turnover rate | | | 53.02% | | | | 63.64% | | | | 34.99% | | | | 46.03% | | | | 69.23% | |
aThe amount shown for a share outstanding throughout the period may not correlate with the Statement of Operations for the period due to the timing of sales and repurchases of the Fund’s shares in relation to income earned and/or fluctuating fair value of the investments of the Fund.
bBased on average daily shares outstanding.
cAmount rounds to less than $0.01 per share.
dBenefit of expense reduction rounds to less than 0.01%.
| | | | |
| | | |
| franklintempleton.com | | The accompanying notes are an integral part of these financial statements. | Annual Report | | 53 |
FRANKLIN INVESTORS SECURITIES TRUST
FINANCIAL HIGHLIGHTS
Franklin Managed Income Fund (continued)
| | | | | | | | | | | | | | | | | | | | |
| | | Year Ended October 31, | |
| | | 2019 | | | 2018 | | | 2017 | | | 2016 | | | 2015 | |
| | | | | |
Advisor Class | | | | | | | | | | | | | | | | | | | | |
| | | | | |
Per share operating performance | | | | | | | | | | | | | | | | | | | | |
(for a share outstanding throughout the year) | | | | | | | | | | | | | | | | | | | | |
| | | | | |
Net asset value, beginning of year | | | $11.92 | | | | $12.39 | | | | $11.67 | | | | $11.42 | | | | $11.88 | |
| | | | |
| | | | | |
Income from investment operationsa: | | | | | | | | | | | | | | | | | | | | |
| | | | | |
Net investment incomeb | | | 0.32 | | | | 0.30 | | | | 0.35 | | | | 0.29 | | | | 0.33 | |
| | | | | |
Net realized and unrealized gains (losses) | | | 1.18 | | | | (0.16 | ) | | | 0.93 | | | | 0.35 | | | | (0.24 | ) |
| | | | |
| | | | | |
Total from investment operations | | | 1.50 | | | | 0.14 | | | | 1.28 | | | | 0.64 | | | | 0.09 | |
| | | | |
| | | | | |
Less distributions from: | | | | | | | | | | | | | | | | | | | | |
| | | | | |
Net investment income | | | (0.44 | ) | | | (0.41 | ) | | | (0.39 | ) | | | (0.39 | ) | | | (0.39 | ) |
| | | | | |
Net realized gains | | | (0.14 | ) | | | (0.20 | ) | | | (0.17 | ) | | | (— | )c | | | (0.16 | ) |
| | | | |
| | | | | |
Total distributions | | | (0.58 | ) | | | (0.61 | ) | | | (0.56 | ) | | | (0.39 | ) | | | (0.55 | ) |
| | | | |
| | | | | |
Net asset value, end of year | | | $12.84 | | | | $11.92 | | | | $12.39 | | | | $11.67 | | | | $11.42 | |
| | | | |
| | | | | |
Total return | | | 12.96% | | | | 1.14% | | | | 11.21% | | | | 5.79% | | | | 0.81% | |
| | | | | |
Ratios to average net assets | | | | | | | | | | | | | | | | | | | | |
| | | | | |
Expenses before waiver and payments by affiliates | | | 0.71% | | | | 0.77% | | | | 0.77% | | | | 0.77% | | | | 0.77% | |
| | | | | |
Expenses net of waiver and payments by affiliatesd | | | 0.69% | | | | 0.76% | | | | 0.75% | | | | 0.76% | | | | 0.77% | e |
| | | | | |
Net investment income | | | 2.61% | | | | 2.47% | | | | 2.97% | | | | 2.87% | | | | 2.85% | |
| | | | | |
Supplemental data | | | | | | | | | | | | | | | | | | | | |
| | | | | |
Net assets, end of year (000’s) | | | $180,882 | | | | $124,265 | | | | $243,674 | | | | $138,111 | | | | $54,881 | |
| | | | | |
Portfolio turnover rate | | | 53.02% | | | | 63.64% | | | | 34.99% | | | | 46.03% | | | | 69.23% | |
aThe amount shown for a share outstanding throughout the period may not correlate with the Statement of Operations for the period due to the timing of sales and repurchases of the Fund’s shares in relation to income earned and/or fluctuating fair value of the investments of the Fund.
bBased on average daily shares outstanding.
cAmount rounds to less than $0.01 per share.
dBenefit of expense reduction rounds to less than 0.01%.
eBenefit of waiver and payments by affiliates rounds to less than 0.01%.
| | | | |
| | | |
54 | | Annual Report | The accompanying notes are an integral part of these financial statements. | | franklintempleton.com |
FRANKLIN INVESTORS SECURITIES TRUST
Statement of Investments, October 31, 2019
Franklin Managed Income Fund
| | | | | | | | | | |
| | | Country | | Shares | | | Value | |
Common Stocks 32.6% | | | | | | | | | | |
Communication Services 2.9% | | | | | | | | | | |
aAT&T Inc. | | United States | | | 1,000,000 | | | $ | 38,490,000 | |
Verizon Communications Inc. | | United States | | | 850,000 | | | | 51,399,500 | |
Vodafone Group PLC | | United Kingdom | | | 10,000,000 | | | | 20,390,384 | |
| | | | | | | | | | |
| | | | | | | | | 110,279,884 | |
| | | | | | | | | | |
Consumer Discretionary 0.6% | | | | | | | | | | |
Ford Motor Co. | | United States | | | 2,500,000 | | | | 21,475,000 | |
| | | | | | | | | | |
Consumer Staples 3.0% | | | | | | | | | | |
aThe Coca-Cola Co. | | United States | | | 650,200 | | | | 35,390,386 | |
Nestle SA | | Switzerland | | | 500,000 | | | | 53,250,000 | |
aPepsiCo Inc. | | United States | | | 187,200 | | | | 25,678,224 | |
| | | | | | | | | | |
| | | | | | | | | 114,318,610 | |
| | | | | | | | | | |
Energy 3.5% | | | | | | | | | | |
Chevron Corp. | | United States | | | 400,000 | | | | 46,456,000 | |
Exxon Mobil Corp. | | United States | | | 550,000 | | | | 37,163,500 | |
Occidental Petroleum Corp. | | United States | | | 450,000 | | | | 18,225,000 | |
Royal Dutch Shell PLC, A, ADR | | United Kingdom | | | 545,000 | | | | 31,593,650 | |
| | | | | | | | | | |
| | | | | | | | | 133,438,150 | |
| | | | | | | | | | |
Financials 6.3% | | | | | | | | | | |
Bank of America Corp. | | United States | | | 1,496,715 | | | | 46,802,278 | |
Barclays PLC | | United Kingdom | | | 5,000,000 | | | | 10,868,826 | |
JPMorgan Chase & Co. | | United States | | | 500,000 | | | | 62,460,000 | |
Morgan Stanley | | United States | | | 875,000 | | | | 40,293,750 | |
The Toronto-Dominion Bank | | Canada | | | 415,000 | | | | 23,684,050 | |
Wells Fargo & Co. | | United States | | | 1,100,000 | | | | 56,793,000 | |
| | | | | | | | | | |
| | | | | | | | | 240,901,904 | |
| | | | | | | | | | |
Health Care 6.9% | | | | | | | | | | |
AbbVie Inc. | | United States | | | 500,000 | | | | 39,775,000 | |
AstraZeneca PLC, ADR | | United Kingdom | | | 1,100,000 | | | | 53,933,000 | |
aBristol-Myers Squibb Co. | | United States | | | 1,000,000 | | | | 57,370,000 | |
aCVS Health Corp. | | United States | | | 470,000 | | | | 31,203,300 | |
Johnson & Johnson | | United States | | | 280,000 | | | | 36,971,200 | |
Pfizer Inc. | | United States | | | 1,150,000 | | | | 44,125,500 | |
| | | | | | | | | | |
| | | | | | | | | 263,378,000 | |
| | | | | | | | | | |
Industrials 4.0% | | | | | | | | | | |
a3M Co. | | United States | | | 200,000 | | | | 32,998,000 | |
aGeneral Dynamics Corp. | | United States | | | 150,000 | | | | 26,520,000 | |
aNorthrop Grumman Corp. | | United States | | | 105,000 | | | | 37,010,400 | |
Raytheon Co. | | United States | | | 260,000 | | | | 55,174,600 | |
| | | | | | | | | | |
| | | | | | | | | 151,703,000 | |
| | | | | | | | | | |
Information Technology 3.3% | | | | | | | | | | |
aAnalog Devices Inc. | | United States | | | 350,000 | | | | 37,320,500 | |
aIntel Corp. | | United States | | | 685,000 | | | | 38,723,050 | |
aInternational Business Machines Corp. | | United States | | | 200,000 | | | | 26,746,000 | |
| | | | |
| | | |
| franklintempleton.com | | Annual Report | | 55 |
FRANKLIN INVESTORS SECURITIES TRUST
STATEMENT OF INVESTMENTS
Franklin Managed Income Fund(continued)
| | | | | | | | | | |
| | | Country | | Shares | | | Value | |
Common Stocks(continued) | | | | | | | | | | |
Information Technology(continued) | | | | | | | | | | |
aTexas Instruments Inc. | | United States | | | 197,000 | | | $ | 23,244,030 | |
| | | | | | | | | | |
| | | | | | | | | 126,033,580 | |
| | | | | | | | | | |
Real Estate 0.7% | | | | | | | | | | |
Host Hotels & Resorts Inc. | | United States | | | 1,500,000 | | | | 24,585,000 | |
| | | | | | | | | | |
Utilities 1.4% | | | | | | | | | | |
Dominion Energy Inc. | | United States | | | 528,200 | | | | 43,602,910 | |
Sempra Energy | | United States | | | 59,000 | | | | 8,526,090 | |
| | | | | | | | | | |
| | | | | | | | | 52,129,000 | |
| | | | | | | | | | |
Total Common Stocks (Cost $950,209,993) | | | | | | | | | 1,238,242,128 | |
| | | | | | | | | | |
| | |
Management Investment Companies (Cost $36,607,500) 1.0% | | | | | | | | |
Financials 1.0% | | | | | | | | | | |
bFranklin Liberty U.S. Low Volatility ETF | | United States | | | 1,000,000 | | | | 36,596,800 | |
| | | | | | | | | | |
cEquity-Linked Securities 11.7% | | | | | | | | | | |
Communication Services 0.5% | | | | | | | | | | |
dGoldman Sachs International into Alphabet Inc., 7.00%, A, 144A | | United States | | | 15,000 | | | | 17,945,184 | |
| | | | | | | | | | |
Consumer Discretionary 1.5% | | | | | | | | | | |
dCitigroup Global Markets Holdings Inc. into Amazon.com Inc., 9.00%, 144A | | United States | | | 20,000 | | | | 36,295,601 | |
dJPMorgan Chase Bank NA into Target Corp., 9.00%, 144A | | United States | | | 190,000 | | | | 20,453,601 | |
| | | | | | | | | | |
| | | | | | | | | 56,749,202 | |
| | | | | | | | | | |
Financials 0.8% | | | | | | | | | | |
dBarclays Bank PLC into The Charles Schwab Corp., 6.00%, 144A | | United States | | | 755,000 | | | | 31,397,646 | |
| | | | | | | | | | |
Health Care 0.6% | | | | | | | | | | |
dUBS AG London into CVS Health Corp., 8.50%, 144A | | United States | | | 350,000 | | | | 22,621,026 | |
| | | | | | | | | | |
Information Technology 8.3% | | | | | | | | | | |
dBarclays Bank PLC into Broadcom Inc., 10.00%, 144A | | United States | | | 130,000 | | | | 38,638,489 | |
dCitigroup Global Markets Holdings Inc. into Cisco Systems Inc., 7.00%, 144A | | United States | | | 743,000 | | | | 36,746,565 | |
dJPMorgan Chase Bank NA into Apple Inc., 7.00%, 144A | | United States | | | 320,000 | | | | 70,450,296 | |
dMerrill Lynch International & Co. C.V. into Microsoft Corp., 6.00%, 144A | | United States | | | 340,000 | | | | 47,126,840 | |
dRoyal Bank of Canada into Intel Corp., 8.00%, 144A | | United States | | | 800,000 | | | | 41,268,744 | |
dWells Fargo Bank National Assn. into NVIDIA Corp., 10.00%, 144A | | United States | | | 260,000 | | | | 45,442,056 | |
dWells Fargo Bank National Assn. into Texas Instruments Inc., 7.50%, 144A | | United States | | | 300,000 | | | | 36,051,099 | |
| | | | | | | | | | |
| | | | | | | | | 315,724,089 | |
| | | | | | | | | | |
Total Equity-Linked Securities (Cost $427,086,825) | | | | | | | | | 444,437,147 | |
| | | | | | | | | | |
Convertible Preferred Stocks 1.4% | | | | | | | | | | |
Information Technology 0.7% | | | | | | | | | | |
Broadcom Inc., 8.00%, cvt. pfd., A | | United States | | | 25,000 | | | | 27,075,500 | |
| | | | | | | | | | |
Utilities 0.7% | | | | | | | | | | |
Sempra Energy, 6.00%, cvt. pfd., A | | United States | | | 100,000 | | | | 11,603,000 | |
The Southern Co., 6.75%, cvt. pfd. | | United States | | | 280,000 | | | | 14,884,800 | |
| | | | | | | | | | |
| | | | | | | | | 26,487,800 | |
| | | | | | | | | | |
Total Convertible Preferred Stocks (Cost $49,227,000) | | | | | | | | | 53,563,300 | |
| | | | | | | | | | |
| | | | |
| | | |
56 | | Annual Report | | franklintempleton.com |
FRANKLIN INVESTORS SECURITIES TRUST
STATEMENT OF INVESTMENTS
Franklin Managed Income Fund (continued)
| | | | | | | | | | |
| | | Country | | Shares | | | Value | |
Preferred Stocks (Cost $15,000,000) 0.4% | | | | | | | | | | |
Financials 0.4% | | | | | | | | | | |
JPMorgan Chase & Co., 6.00%, pfd., EE, 6/01/67 | | United States | | | 600,000 | | | $ | 17,094,000 | |
| | | | | | | | | | |
| | | |
| | | |
| Principal
Amount |
* | | | | |
Convertible Bonds (Cost $19,132,330) 0.4% | | | | | | | | | | |
Energy 0.4% | | | | | | | | | | |
Chesapeake Energy Corp., cvt., senior note, 5.50%, 9/15/26 | | United States | | $ | 27,500,000 | | | | 15,451,562 | |
| | | | | | | | | | |
Corporate Bonds 34.1% | | | | | | | | | | |
Communication Services 2.2% | | | | | | | | | | |
dCCO Holdings LLC/CCO Holdings Capital Corp., senior bond, 144A, 5.125%, 5/01/27 | | United States | | | 15,000,000 | | | | 15,843,750 | |
DISH DBS Corp., senior bond, 5.875%, 7/15/22 | | United States | | | 12,000,000 | | | | 12,594,720 | |
dSirius XM Radio Inc., senior bond, 144A, 5.375%, 4/15/25 | | United States | | | 15,000,000 | | | | 15,656,250 | |
Sprint Corp., senior note, 7.625%, 2/15/25 | | United States | | | 10,000,000 | | | | 11,012,500 | |
dSprint Spectrum Co. LLC/Sprint Spectrum Co. II LLC, senior secured bond, first lien, 144A, 4.738%, 9/20/29 | | United States | | | 25,000,000 | | | | 26,656,500 | |
| | | | | | | | | | |
| | | | | | | | | 81,763,720 | |
| | | | | | | | | | |
Consumer Discretionary 2.5% | | | | | | | | | | |
Dollar General Corp., senior bond, 3.875%, 4/15/27 | | United States | | | 10,000,000 | | | | 10,780,465 | |
Dollar Tree Inc., senior note, 4.00%, 5/15/25 | | United States | | | 15,000,000 | | | | 16,144,305 | |
Ford Motor Credit Co. LLC, senior note, 5.113%, 5/03/29 | | United States | | | 25,000,000 | | | | 25,337,057 | |
Las Vegas Sands Corp., senior bond, 3.90%, 8/08/29 | | United States | | | 10,000,000 | | | | 10,316,391 | |
NIKE Inc., senior bond, 2.375%, 11/01/26 | | United States | | | 20,000,000 | | | | 20,509,756 | |
dWynn Las Vegas LLC/Wynn Las Vegas Capital Corp., senior bond, 144A, 5.50%, 3/01/25 | | United States | | | 10,000,000 | | | | 10,650,000 | |
| | | | | | | | | | |
| | | | | | | | | 93,737,974 | |
| | | | | | | | | | |
Consumer Staples 3.9% | | | | | | | | | | |
Anheuser-Busch Cos. LLC/InBev Worldwide Inc., senior bond, 4.90%, 2/01/46 | | Belgium | | | 10,000,000 | | | | 11,957,338 | |
BAT Capital Corp., senior note, 3.557%, 8/15/27 | | United Kingdom | | | 15,000,000 | | | | 15,128,901 | |
The Clorox Co., senior bond, 3.10%, 10/01/27 | | United States | | | 15,000,000 | | | | 15,754,066 | |
Costco Wholesale Corp., senior note, 2.75%, 5/18/24 | | United States | | | 15,000,000 | | | | 15,583,389 | |
Kraft Heinz Foods Co., senior bond, 3.00%, 6/01/26 | | United States | | | 15,000,000 | | | | 14,961,186 | |
The Procter & Gamble Co., senior note, 2.70%, 2/02/26 | | United States | | | 25,000,000 | | | | 26,059,749 | |
Reynolds American Inc., senior note, 4.45%, 6/12/25 | | United Kingdom | | | 15,000,000 | | | | 16,111,528 | |
Tyson Foods Inc., senior bond, 3.95%, 8/15/24 | | United States | | | 12,100,000 | | | | 12,995,499 | |
Walmart Inc., senior bond, 3.25%, 7/08/29 | | United States | | | 20,000,000 | | | | 21,660,133 | |
| | | | | | | | | | |
| | | | | | | | | 150,211,789 | |
| | | | | | | | | | |
Energy 1.8% | | | | | | | | | | |
dCalumet Specialty Products Partners LP/Calumet Finance Corp., senior note, 144A, 11.00%, 4/15/25 | | United States | | | 20,000,000 | | | | 20,200,000 | |
Nabors Industries Inc., senior note, 5.50%, 1/15/23 | | United States | | | 25,000,000 | | | | 21,250,000 | |
The Williams Cos. Inc., | | | | | | | | | | |
senior note, 3.60%, 3/15/22 | | United States | | | 15,000,000 | | | | 15,440,309 | |
senior note, 4.55%, 6/24/24 | | United States | | | 10,000,000 | | | | 10,795,844 | |
| | | | | | | | | | |
| | | | | | | | | 67,686,153 | |
| | | | | | | | | | |
| | | | |
| | | |
| franklintempleton.com | | Annual Report | | 57 |
FRANKLIN INVESTORS SECURITIES TRUST
STATEMENT OF INVESTMENTS
Franklin Managed Income Fund(continued)
| | | | | | | | | | | | |
| | | | Country | | |
| Principal
Amount |
* | | | Value | |
Corporate Bonds(continued) | | | | | | | | | | | | |
Financials 8.2% | | | | | | | | | | | | |
Bank of America Corp., | | | | | | | | | | | | |
senior bond, 3.419% to 12/20/27, FRN thereafter, 12/20/28 | | | United States | | | $ | 15,000,000 | | | $ | 15,728,517 | |
sub. bond, 4.183%, 11/25/27 | | | United States | | | | 10,000,000 | | | | 10,840,513 | |
Barclays PLC, senior note, 3.65%, 3/16/25 | | | United Kingdom | | | | 15,000,000 | | | | 15,583,875 | |
eBB&T Corp., junior sub. bond, 4.80% to 9/01/24, FRN thereafter, Perpetual | | | United States | | | | 25,000,000 | | | | 25,518,750 | |
BBVA USA, sub. note, 3.875%, 4/10/25 | | | United States | | | | 15,000,000 | | | | 15,830,234 | |
Capital One Financial Corp., | | | | | | | | | | | | |
senior bond, 3.80%, 1/31/28 | | | United States | | | | 20,000,000 | | | | 21,287,652 | |
senior note, 3.75%, 3/09/27 | | | United States | | | | 10,000,000 | | | | 10,630,907 | |
sub. note, 3.75%, 7/28/26 | | | United States | | | | 10,000,000 | | | | 10,570,201 | |
Citigroup Inc., sub. bond, 4.125%, 7/25/28 | | | United States | | | | 20,000,000 | | | | 21,682,040 | |
The Goldman Sachs Group Inc., senior note, 3.50%, 11/16/26 | | | United States | | | | 15,000,000 | | | | 15,652,723 | |
HSBC Holdings PLC, senior note, 4.292% to 9/12/25, FRN thereafter, 9/12/26 | | | United Kingdom | | | | 20,000,000 | | | | 21,671,300 | |
e,fJPMorgan Chase & Co., junior sub. bond, V, FRN, 5.419%, (3-month USD LIBOR + 3.32%), Perpetual | | | United States | | | | 15,000,000 | | | | 15,112,500 | |
dLiberty Mutual Group Inc., senior note, 144A, 4.95%, 5/01/22 | | | United States | | | | 7,100,000 | | | | 7,549,145 | |
Morgan Stanley, | | | | | | | | | | | | |
senior note, 3.125%, 1/23/23 | | | United States | | | | 20,000,000 | | | | 20,588,592 | |
senior sub. bond, 4.35%, 9/08/26 | | | United States | | | | 15,000,000 | | | | 16,357,230 | |
Navient Corp., senior note, 6.125%, 3/25/24 | | | United States | | | | 15,000,000 | | | | 15,742,710 | |
ePNC Financial Services Group Inc., junior sub. note, 4.85% to 6/01/23, FRN thereafter, Perpetual | | | United States | | | | 12,000,000 | | | | 12,392,640 | |
Prudential Financial Inc., junior sub. bond, 5.70% to 9/15/28, FRN thereafter, 9/15/48 | | | United States | | | | 20,000,000 | | | | 22,728,400 | |
eWells Fargo & Co., junior sub. bond, 5.875% to 6/15/25, FRN thereafter, Perpetual | | | United States | | | | 15,000,000 | | | | 16,625,325 | |
| | | | | | | | | | | | |
| | | | | | | | | | | 312,093,254 | |
| | | | | | | | | | | | |
Health Care 6.9% | | | | | | | | | | | | |
Anthem Inc., senior bond, 3.65%, 12/01/27 | | | United States | | | | 10,000,000 | | | | 10,587,127 | |
dBausch Health Cos. Inc., | | | | | | | | | | | | |
senior bond, 144A, 6.125%, 4/15/25 | | | United States | | | | 6,300,000 | | | | 6,555,937 | |
senior note, 144A, 5.875%, 5/15/23 | | | United States | | | | 3,207,000 | | | | 3,265,528 | |
senior secured note, first lien, 144A, 5.50%, 11/01/25 | | | United States | | | | 10,000,000 | | | | 10,487,600 | |
dBayer U.S. Finance II LLC, senior note, 144A, 4.25%, 12/15/25 | | | Germany | | | | 15,000,000 | | | | 16,121,202 | |
Biogen Inc., senior note, 3.625%, 9/15/22 | | | United States | | | | 10,000,000 | | | | 10,454,571 | |
dBristol-Myers Squibb Co., | | | | | | | | | | | | |
senior bond, 144A, 3.40%, 7/26/29 | | | United States | | | | 10,000,000 | | | | 10,769,769 | |
senior bond, 144A, 4.25%, 10/26/49 | | | United States | | | | 10,000,000 | | | | 11,730,940 | |
CHS/Community Health Systems Inc., | | | | | | | | | | | | |
dsenior secured note, 144A, 8.00%, 3/15/26 | | | United States | | | | 10,000,000 | | | | 9,800,000 | |
senior secured note, first lien, 6.25%, 3/31/23 | | | United States | | | | 25,000,000 | | | | 24,453,125 | |
Cigna Corp., | | | | | | | | | | | | |
senior note, 3.75%, 7/15/23 | | | United States | | | | 20,000,000 | | | | 20,978,273 | |
dsenior note, 144A, 3.40%, 3/01/27 | | | United States | | | | 15,000,000 | | | | 15,488,547 | |
CVS Health Corp., | | | | | | | | | | | | |
senior bond, 5.05%, 3/25/48 | | | United States | | | | 15,000,000 | | | | 17,209,817 | |
senior note, 3.875%, 7/20/25 | | | United States | | | | 15,000,000 | | | | 15,960,801 | |
| | | | |
| | | |
58 | | Annual Report | | franklintempleton.com |
FRANKLIN INVESTORS SECURITIES TRUST
STATEMENT OF INVESTMENTS
Franklin Managed Income Fund(continued)
| | | | | | | | | | | | |
| | | | Country | | |
| Principal
Amount |
* | | | Value | |
Corporate Bonds(continued) | | | | | | | | | | | | |
Health Care(continued) | | | | | | | | | | | | |
Edwards Lifesciences Corp., senior note, 4.30%, 6/15/28 | | | United States | | | $ | 9,700,000 | | | $ | 10,956,230 | |
HCA Inc., senior note, 5.375%, 9/01/26 | | | United States | | | | 25,000,000 | | | | 27,312,500 | |
Mylan Inc., senior bond, 4.55%, 4/15/28 | | | United States | | | | 19,000,000 | | | | 20,384,150 | |
Tenet Healthcare Corp., senior secured note, first lien, 4.625%, 7/15/24 | | | United States | | | | 20,000,000 | | | | 20,650,000 | |
| | | | | | | | | | | | |
| | | |
| | | | | | | | | | | 263,166,117 | |
| | | | | | | | | | | | |
Industrials 2.1% | | | | | | | | | | | | |
dAshtead Capital Inc., secured note, second lien, 144A, 4.125%, 8/15/25 | | | United Kingdom | | | | 21,000,000 | | | | 21,525,000 | |
CNH Industrial NV, senior bond, 3.85%, 11/15/27 | | | United Kingdom | | | | 15,000,000 | | | | 15,656,625 | |
Lockheed Martin Corp., senior bond, 3.55%, 1/15/26 | | | United States | | | | 20,000,000 | | | | 21,629,718 | |
United Rentals North America Inc., senior note, 4.625%, 10/15/25 | | | United States | | | | 20,000,000 | | | | 20,500,000 | |
| | | | | | | | | | | | |
| | | |
| | | | | | | | | | | 79,311,343 | |
| | | | | | | | | | | | |
Information Technology 2.2% | | | | | | | | | | | | |
dCommScope Technologies LLC, senior bond, 144A, 5.00%, 3/15/27 | | | United States | | | | 20,000,000 | | | | 16,450,000 | |
dDell International LLC/EMC Corp., senior secured note, first lien, 144A, 4.42%, 6/15/21 | | | United States | | | | 18,000,000 | | | | 18,599,019 | |
Fiserv Inc., senior bond, 4.20%, 10/01/28 | | | United States | | | | 20,000,000 | | | | 22,275,714 | |
Microchip Technology Inc., senior secured note, 4.333%, 6/01/23 | | | United States | | | | 15,000,000 | | | | 15,885,154 | |
Xilinx Inc., senior note, 2.95%, 6/01/24 | | | United States | | | | 11,000,000 | | | | 11,382,101 | |
| | | | | | | | | | | | |
| | | |
| | | | | | | | | | | 84,591,988 | |
| | | | | | | | | | | | |
Materials 1.4% | | | | | | | | | | | | |
DuPont de Nemours Inc., senior note, 4.493%, 11/15/25 | | | United States | | | | 20,000,000 | | | | 22,152,424 | |
Freeport-McMoRan Inc., senior bond, 5.25%, 9/01/29 | | | United States | | | | 10,000,000 | | | | 10,203,000 | |
dSyngenta Finance NV, senior note, 144A, 5.182%, 4/24/28 | | | Switzerland | | | | 20,000,000 | | | | 21,213,540 | |
| | | | | | | | | | | | |
| | | |
| | | | | | | | | | | 53,568,964 | |
| | | | | | | | | | | | |
Real Estate 1.8% | | | | | | | | | | | | |
American Tower Corp., senior bond, 3.375%, 10/15/26 | | | United States | | | | 15,000,000 | | | | 15,620,518 | |
Healthpeak Properties Inc., senior bond, 3.875%, 8/15/24 | | | United States | | | | 21,700,000 | | | | 23,288,376 | |
Prologis LP, senior note, 4.25%, 8/15/23 | | | United States | | | | 12,000,000 | | | | 12,958,563 | |
Realty Income Corp., senior bond, 3.875%, 7/15/24 | | | United States | | | | 15,000,000 | | | | 16,097,773 | |
| | | | | | | | | | | | |
| | | |
| | | | | | | | | | | 67,965,230 | |
| | | | | | | | | | | | |
Utilities 1.1% | | | | | | | | | | | | |
Duke Energy Corp., senior bond, 3.15%, 8/15/27 | | | United States | | | | 20,000,000 | | | | 20,847,575 | |
dVistra Operations Co. LLC, senior secured bond, first lien, 144A, 4.30%, 7/15/29 | | | United States | | | | 20,000,000 | | | | 20,806,363 | |
| | | | | | | | | | | | |
| | | | | | | | | | | 41,653,938 | |
| | | | | | | | | | | | |
| | | |
Total Corporate Bonds (Cost $1,216,976,799) | | | | | | | | | | | 1,295,750,470 | |
| | | | | | | | | | | | |
| | | |
U.S. Government and Agency Securities 8.0% | | | | | | | | | | | | |
U.S. Treasury Note, | | | | | | | | | | | | |
2.25%, 3/31/20 | | | United States | | | | 100,000,000 | | | | 100,269,531 | |
2.75%, 9/30/20 | | | United States | | | | 100,000,000 | | | | 101,025,391 | |
2.75%, 9/15/21 | | | United States | | | | 50,000,000 | | | | 51,105,469 | |
2.875%, 10/31/23 | | | United States | | | | 50,000,000 | | | | 52,616,211 | |
| | | | | | | | | | | | |
| | | |
Total U.S. Government and Agency Securities
(Cost $299,823,313) | | | | | | | | | | | 305,016,602 | |
| | | | | | | | | | | | |
| | | | |
| | | |
| franklintempleton.com | | Annual Report | | 59 |
FRANKLIN INVESTORS SECURITIES TRUST
STATEMENT OF INVESTMENTS
Franklin Managed Income Fund(continued)
| | | | | | | | | | | | |
| | | | Country | | |
| Principal
Amount |
* | | | Value | |
Mortgage-Backed Securities 1.1% | | | | | | | | | | | | |
Federal Home Loan Mortgage Corp. (FHLMC) Fixed Rate 0.1% | | | | | | | | | | | | |
FHLMC 30 Year, 4.00%, 10/01/49 | | | United States | | | $ | 2,234,766 | | | $ | 2,323,952 | |
| | | | | | | | | | | | |
Federal National Mortgage Association (FNMA) Fixed Rate 0.2% | | | | | | | | | | | | |
FNMA 30 Year, 4.00%, 6/01/49 | | | United States | | | | 7,027,056 | | | | 7,304,009 | |
| | | | | | | | | | | | |
Government National Mortgage Association (GNMA) Fixed Rate 0.8% | | | | | | | | | | | | |
GNMA II SF 30 Year, 3.50%, 9/20/49 | | | United States | | | | 19,279,789 | | | | 20,052,933 | |
GNMA II SF 30 Year, 4.00%, 9/20/49 | | | United States | | | | 9,789,975 | | | | 10,257,732 | |
| | | | | | | | | | | | |
Total Mortgage-Backed Securities
(Cost $39,884,902) | | | | | | | | | | | 39,938,626 | |
| | | | | | | | | | | | |
| | | |
| |
| Number of
Contracts |
| |
| Notional
Amount |
* | | | | |
| | | |
Options Purchased 0.4% | | | | | | | | | | | | |
Puts - Exchange-Traded | | | | | | | | | | | | |
SPDR S&P 500 ETF Trust, December Strike Price $290.00, Expires 12/20/19 | | | 10,000 | | | | 1,000,000 | | | | 2,410,000 | |
SPDR S&P 500 ETF Trust, June Strike Price $300.00, Expires 6/19/20 | | | 10,000 | | | | 1,000,000 | | | | 14,200,000 | |
| | | | | | | | | | | | |
Total Options Purchased
(Cost $28,140,769) | | | | | | | | | | | 16,610,000 | |
| | | | | | | | | | | | |
Total Investments before Short Term Investments
(Cost $3,082,089,431) | | | | | | | | | | | 3,462,700,635 | |
| | | | | | | | | | | | |
| | | |
| | | Country | | | Shares | | | | |
| | | |
Short Term Investments (Cost $331,668,940) 8.7% | | | | | | | | | | | | |
| | | |
Money Market Funds 8.7% | | | | | | | | | | | | |
b,gInstitutional Fiduciary Trust Money Market Portfolio, 1.56% | | | United States | | | | 331,668,940 | | | | 331,668,940 | |
| | | | | | | | | | | | |
| | | |
Total Investments (Cost $3,413,758,371) 99.8% | | | | | | | | | | | 3,794,369,575 | |
Options Written (0.1)% | | | | | | | | | | | (5,208,470 | ) |
Other Assets, less Liabilities 0.3% | | | | | | | | | | | 14,329,220 | |
| | | | | | | | | | | | |
| | | |
Net Assets 100.0% | | | | | | | | | | $ | 3,803,490,325 | |
| | | | | | | | | | | | |
| | | |
| | | Number of
Contracts | | | Notional
Amount | | | | |
| | | |
hOptions Written (0.1)% | | | | | | | | | | | | |
Calls - Exchange-Traded | | | | | | | | | | | | |
3M Co., January Strike Price $185.00, Expires 1/17/20 | | | 2,000 | | | | 200,000 | | | | (104,000 | ) |
Analog Devices Inc., December Strike Price $125.00, Expires 12/20/19 | | | 3,500 | | | | 350,000 | | | | (105,000 | ) |
AT&T Inc., November Strike Price $40.00, Expires 11/15/19 | | | 10,000 | | | | 1,000,000 | | | | (60,000 | ) |
Bristol-Myers Squibb Co., December Strike Price $55.00, Expires 12/20/19 | | | 10,000 | | | | 1,000,000 | | | | (3,320,000 | ) |
The Coca-Cola Co., January Strike Price $57.50, Expires 1/17/20 | | | 6,500 | | | | 650,000 | | | | (169,000 | ) |
CVS Health Corp., November Strike Price $70.00, Expires 11/15/19 | | | 3,000 | | | | 300,000 | | | | (165,000 | ) |
General Dynamics Corp., January Strike Price $200.00, Expires 1/17/20 | | | 1,500 | | | | 150,000 | | | | (52,500 | ) |
Intel Corp., January Strike Price $60.00, Expires 1/17/20 | | | 6,850 | | | | 685,000 | | | | (548,000 | ) |
| | | | |
| | | |
60 | | Annual Report | | franklintempleton.com |
FRANKLIN INVESTORS SECURITIES TRUST
STATEMENT OF INVESTMENTS
Franklin Managed Income Fund(continued)
| | | | | | | | | | | | |
| | | Number of
Contracts | | | Notional
Amount | | | Value | |
| | | |
hOptions Written(continued) | | | | | | | | | | | | |
Calls - Exchange-Traded(continued) | | | | | | | | | | | | |
International Business Machines Corp., January Strike Price $155.00, Expires 1/17/20 | | | 2,000 | | | | 200,000 | | | $ | (22,000 | ) |
Northrop Grumman Corp., November Strike Price $400.00, Expires 11/15/19 | | | 1,050 | | | | 105,000 | | | | (3,150 | ) |
PepsiCo Inc., January Strike Price $145.00, Expires 1/17/20 | | | 1,870 | | | | 187,000 | | | | (102,850 | ) |
Texas Instruments Inc., November Strike Price $140.00, Expires 11/15/19 | | | 1,970 | | | | 197,000 | | | | (1,970 | ) |
| | | | | | | | | | | | |
| | | | | | | | | | | (4,653,470 | ) |
| | | | | | | | | | | | |
| | | |
Puts - Exchange-Traded | | | | | | | | | | | | |
General Dynamics Corp., January Strike Price $160.00, Expires 1/17/20 | | | 1,000 | | | | 100,000 | | | | (190,000 | ) |
SPDR S&P 500 ETF Trust, December Strike Price $250.00, Expires 12/20/19 | | | 5,000 | | | | 500,000 | | | | (135,000 | ) |
SPDR S&P 500 ETF Trust, December Strike Price $260.00, Expires 12/20/19 | | | 5,000 | | | | 500,000 | | | | (230,000 | ) |
| | | | | | | | | | | | |
| | | | | | | | | | | (555,000 | ) |
| | | | | | | | | | | | |
Total Options Written (Premiums received $10,367,474) | | | | | | | | | | $ | (5,208,470 | ) |
| | | | | | | | | | | | |
See Abbreviations on page 91.
*The principal/notional amount is stated in U.S. dollars unless otherwise indicated.
aA portion or all of the security is held in connection with written option contracts open at year end.
bSee Note 3(f) regarding investments in affiliated management investment companies.
cSee Note 1(e) regarding equity-linked securities.
dSecurity was purchased pursuant to Rule 144A under the Securities Act of 1933 and may be sold in transactions exempt from registration only to qualified institutional buyers or in a public offering registered under the Securities Act of 1933. At October 31, 2019, the aggregate value of these securities was $723,806,237, representing 19.0% of net assets.
ePerpetual security with no stated maturity date.
fThe coupon rate shown represents the rate at period end.
gThe rate shown is the annualized seven-day effective yield at period end.
hSee Note 1(d) regarding written options.
| | | | |
| | | |
| franklintempleton.com | | The accompanying notes are an integral part of these financial statements. | Annual Report | | 61 |
FRANKLIN INVESTORS SECURITIES TRUST
Financial Highlights
Franklin Real Return Fund
| | | | | | | | | | | | | | | | | | | | |
| | | Year Ended October 31, | |
| | | 2019 | | | 2018 | | | 2017 | | | 2016 | | | 2015 | |
| | | | | |
Class A | | | | | | | | | | | | | | | | | | | | |
| | | | | |
Per share operating performance | | | | | | | | | | | | | | | | | | | | |
(for a share outstanding throughout the year) | | | | | | | | | | | | | | | | | | | | |
| | | | | |
Net asset value, beginning of year | | | $9.75 | | | | $10.14 | | | | $10.09 | | | | $9.92 | | | | $10.66 | |
| | | | |
| | | | | |
Income from investment operationsa: | | | | | | | | | | | | | | | | | | | | |
| | | | | |
Net investment incomeb | | | 0.16 | | | | 0.19 | | | | 0.17 | | | | 0.12 | | | | 0.05 | |
| | | | | |
Net realized and unrealized gains (losses) | | | 0.11 | | | | (0.25 | ) | | | 0.01 | | | | 0.15 | | | | (0.72 | ) |
| | | | |
| | | | | |
Total from investment operations | | | 0.27 | | | | (0.06 | ) | | | 0.18 | | | | 0.27 | | | | (0.67 | ) |
| | | | |
| | | | | |
Less distributions from: | | | | | | | | | | | | | | | | | | | | |
| | | | | |
Net investment income | | | (0.14 | ) | | | (0.33 | ) | | | (0.13 | ) | | | (0.09 | ) | | | (0.07 | ) |
| | | | | |
Tax return of capital | | | — | | | | — | | | | — | | | | (0.01 | ) | | | — | |
| | | | |
| | | | | |
Total distributions | | | (0.14 | ) | | | (0.33 | ) | | | (0.13 | ) | | | (0.10 | ) | | | (0.07 | ) |
| | | | |
| | | | | |
Net asset value, end of year | | | $9.88 | | | | $9.75 | | | | $10.14 | | | | $10.09 | | | | $9.92 | |
| | | | |
| | | | | |
Total returnc | | | 2.80% | | | | (0.69 | )% | | | 1.77% | | | | 2.77% | | | | (6.32)% | |
| | | | | |
Ratios to average net assets | | | | | | | | | | | | | | | | | | | | |
| | | | | |
Expenses before waiver and payments by affiliates | | | 1.17% | | | | 1.16% | | | | 1.17% | | | | 1.12% | | | | 1.10% | |
| | | | | |
Expenses net of waiver and payments by affiliatesd | | | 0.87% | | | | 0.90% | | | | 0.90% | | | | 0.90% | | | | 0.90% | |
| | | | | |
Net investment income | | | 1.66% | | | | 1.92% | | | | 1.69% | | | | 1.18% | | | | 0.43% | |
| | | | | |
Supplemental data | | | | | | | | | | | | | | | | | | | | |
| | | | | |
Net assets, end of year (000’s) | | | $113,358 | | | | $132,772 | | | | $146,866 | | | | $161,541 | | | | $185,743 | |
| | | | | |
Portfolio turnover rate | | | 35.41% | | | | 27.83% | | | | 32.44% | | | | 31.82% | | | | 26.57% | |
aThe amount shown for a share outstanding throughout the period may not correlate with the Statement of Operations for the period due to the timing of sales and repurchases of the Fund’s shares in relation to income earned, adjustments to interest income for the inflation-indexed bonds, and/or fluctuating fair value of the investments of the Fund.
bBased on average daily shares outstanding.
cTotal return does not reflect sales commissions or contingent deferred sales charges, if applicable.
dBenefit of expense reduction rounds to less than 0.01%.
| | | | |
| | | |
62 | | Annual Report | The accompanying notes are an integral part of these financial statements. | | franklintempleton.com |
FRANKLIN INVESTORS SECURITIES TRUST
FINANCIAL HIGHLIGHTS
Franklin Real Return Fund (continued)
| | | | | | | | | | | | | | | | | | | | |
| | | Year Ended October 31, | |
| | | 2019 | | | 2018 | | | 2017 | | | 2016 | | | 2015 | |
| | | | | |
Class C | | | | | | | | | | | | | | | | | | | | |
| | | | | |
Per share operating performance | | | | | | | | | | | | | | | | | | | | |
(for a share outstanding throughout the year) | | | | | | | | | | | | | | | | | | | | |
| | | | | |
Net asset value, beginning of year | | | $9.64 | | | | $10.03 | | | | $10.00 | | | | $9.82 | | | | $10.59 | |
| | | | |
| | | | | |
Income from investment operationsa: | | | | | | | | | | | | | | | | | | | | |
| | | | | |
Net investment incomeb | | | 0.12 | | | | 0.15 | | | | 0.13 | | | | 0.08 | | | | — | c |
| | | | | |
Net realized and unrealized gains (losses) | | | 0.11 | | | | (0.25 | ) | | | — | c | | | 0.16 | | | | (0.71 | ) |
| | | | |
| | | | | |
Total from investment operations | | | 0.23 | | | | (0.10 | ) | | | 0.13 | | | | 0.24 | | | | (0.71 | ) |
| | | | |
| | | | | |
Less distributions from: | | | | | | | | | | | | | | | | | | | | |
| | | | | |
Net investment income | | | (0.10 | ) | | | (0.29 | ) | | | (0.10 | ) | | | (0.05 | ) | | | (0.06 | ) |
| | | | | |
Tax return of capital | | | — | | | | — | | | | — | | | | (0.01 | ) | | | — | |
| | | | |
| | | | | |
Total distributions | | | (0.10 | ) | | | (0.29 | ) | | | (0.10 | ) | | | (0.06 | ) | | | (0.06 | ) |
| | | | |
| | | | | |
Net asset value, end of year | | | $9.77 | | | | $9.64 | | | | $10.03 | | | | $10.00 | | | | $9.82 | |
| | | | |
| | | | | |
Total returnd | | | 2.44% | | | | (1.06 | )% | | | 1.30% | | | | 2.44% | | | | (6.70)% | |
| | | | | |
Ratios to average net assets | | | | | | | | | | | | | | | | | | | | |
| | | | | |
Expenses before waiver and payments by affiliates | | | 1.57% | | | | 1.56% | | | | 1.57% | | | | 1.52% | | | | 1.50% | |
| | | | | |
Expenses net of waiver and payments by affiliatese | | | 1.27% | | | | 1.30% | | | | 1.30% | | | | 1.30% | | | | 1.30% | |
| | | | | |
Net investment income | | | 1.26% | | | | 1.52% | | | | 1.29% | | | | 0.78% | | | | 0.04% | |
| | | | | |
Supplemental data | | | | | | | | | | | | | | | | | | | | |
| | | | | |
Net assets, end of year (000’s) | | | $17,344 | | | | $24,685 | | | | $33,844 | | | | $39,568 | | | | $48,084 | |
| | | | | |
Portfolio turnover rate | | | 35.41% | | | | 27.83% | | | | 32.44% | | | | 31.82% | | | | 26.57% | |
aThe amount shown for a share outstanding throughout the period may not correlate with the Statement of Operations for the period due to the timing of sales and repurchases of the Fund’s shares in relation to income earned, adjustments to interest income for the inflation-indexed bonds, and/or fluctuating fair value of the investments of the Fund.
bBased on average daily shares outstanding.
cAmount rounds to less than $0.01 per share.
dTotal return does not reflect sales commissions or contingent deferred sales charges, if applicable.
eBenefit of expense reduction rounds to less than 0.01%.
| | | | |
| | | |
| franklintempleton.com | | The accompanying notes are an integral part of these financial statements. | Annual Report | | 63 |
FRANKLIN INVESTORS SECURITIES TRUST
FINANCIAL HIGHLIGHTS
Franklin Real Return Fund (continued)
| | | | | | | | | | | | | | | | | | | | |
| | | Year Ended October 31, | |
| | | 2019 | | | 2018 | | | 2017 | | | 2016 | | | 2015 | |
| | | | | |
Class R6 | | | | | | | | | | | | | | | | | | | | |
| | | | | |
Per share operating performance | | | | | | | | | | | | | | | | | | | | |
(for a share outstanding throughout the year) | | | | | | | | | | | | | | | | | | | | |
| | | | | |
Net asset value, beginning of year | | | $9.81 | | | | $10.19 | | | | $10.15 | | | | $9.98 | | | | $10.68 | |
| | | | |
| | | | | |
Income from investment operationsa: | | | | | | | | | | | | | | | | | | | | |
| | | | | |
Net investment incomeb | | | 0.21 | | | | 0.22 | | | | 0.22 | | | | 0.16 | | | | 0.10 | |
| | | | | |
Net realized and unrealized gains (losses) | | | 0.11 | | | | (0.24 | ) | | | (0.01 | ) | | | 0.16 | | | | (0.72 | ) |
| | | | |
| | | | | |
Total from investment operations | | | 0.32 | | | | (0.02 | ) | | | 0.21 | | | | 0.32 | | | | (0.62 | ) |
| | | | |
| | | | | |
Less distributions from: | | | | | | | | | | | | | | | | | | | | |
| | | | | |
Net investment income | | | (0.18 | ) | | | (0.36 | ) | | | (0.17 | ) | | | (0.14 | ) | | | (0.08 | ) |
| | | | | |
Tax return of capital | | | — | | | | — | | | | — | | | | (0.01 | ) | | | — | |
| | | | |
| | | | | |
Total distributions | | | (0.18 | ) | | | (0.36 | ) | | | (0.17 | ) | | | (0.15 | ) | | | (0.08 | ) |
| | | | |
| | | | | |
Net asset value, end of year | | | $9.95 | | | | $9.81 | | | | $10.19 | | | | $10.15 | | | | $9.98 | |
| | | | |
| | | | | |
Total return | | | 3.26% | | | | (0.21 | )% | | | 2.09% | | | | 3.25% | | | | (5.87)% | |
| | | | | |
Ratios to average net assets | | | | | | | | | | | | | | | | | | | | |
| | | | | |
Expenses before waiver and payments by affiliates | | | 0.80% | | | | 0.81% | | | | 0.72% | | | | 0.71% | | | | 0.71% | |
| | | | | |
Expenses net of waiver and payments by affiliatesc | | | 0.46% | | | | 0.49% | | | | 0.49% | | | | 0.50% | | | | 0.50% | |
| | | | | |
Net investment income | | | 2.07% | | | | 2.33% | | | | 2.11% | | | | 1.58% | | | | 0.83% | |
| | | | | |
Supplemental data | | | | | | | | | | | | | | | | | | | | |
| | | | | |
Net assets, end of year (000’s) | | | $11,940 | | | | $14,475 | | | | $5,727 | | | | $5,326 | | | | $1,730 | |
| | | | | |
Portfolio turnover rate | | | 35.41% | | | | 27.83% | | | | 32.44% | | | | 31.82% | | | | 26.57% | |
aThe amount shown for a share outstanding throughout the period may not correlate with the Statement of Operations for the period due to the timing of sales and repurchases of the Fund’s shares in relation to income earned, adjustments to interest income for the inflation-indexed bonds, and/or fluctuating fair value of the investments of the Fund.
bBased on average daily shares outstanding.
cBenefit of expense reduction rounds to less than 0.01%.
| | | | |
| | | |
64 | | Annual Report | The accompanying notes are an integral part of these financial statements. | | franklintempleton.com |
FRANKLIN INVESTORS SECURITIES TRUST
FINANCIAL HIGHLIGHTS
Franklin Real Return Fund (continued)
| | | | | | | | | | | | | | | | | | | | |
| | | Year Ended October 31, | |
| | | 2019 | | | 2018 | | | 2017 | | | 2016 | | | 2015 | |
| | | | | |
Advisor Class | | | | | | | | | | | | | | | | | | | | |
| | | | | |
Per share operating performance | | | | | | | | | | | | | | | | | | | | |
(for a share outstanding throughout the year) | | | | | | | | | | | | | | | | | | | | |
| | | | | |
Net asset value, beginning of year | | | $9.79 | | | | $10.18 | | | | $10.13 | | | | $9.96 | | | | $10.68 | |
| | | | |
| | | | | |
Income from investment operationsa: | | | | | | | | | | | | | | | | | | | | |
| | | | | |
Net investment incomeb | | | 0.18 | | | | 0.23 | | | | 0.20 | | | | 0.14 | | | | 0.05 | |
| | | | | |
Net realized and unrealized gains (losses) | | | 0.12 | | | | (0.27 | ) | | | — | c | | | 0.16 | | | | (0.70 | ) |
| | | | |
| | | | | |
Total from investment operations | | | 0.30 | | | | (0.04 | ) | | | 0.20 | | | | 0.30 | | | | (0.65 | ) |
| | | | |
| | | | | |
Less distributions from: | | | | | | | | | | | | | | | | | | | | |
| | | | | |
Net investment income | | | (0.16 | ) | | | (0.35 | ) | | | (0.15 | ) | | | (0.12 | ) | | | (0.07 | ) |
| | | | | |
Tax return of capital | | | — | | | | — | | | | — | | | | (0.01 | ) | | | — | |
| | | | |
| | | | | |
Total distributions | | | (0.16 | ) | | | (0.35 | ) | | | (0.15 | ) | | | (0.13 | ) | | | (0.07 | ) |
| | | | |
| | | | | |
Net asset value, end of year | | | $9.93 | | | | $9.79 | | | | $10.18 | | | | $10.13 | | | | $9.96 | |
| | | | |
| | | | | |
Total return | | | 3.12% | | | | (0.47 | )% | | | 2.03% | | | | 3.04% | | | | (6.08)% | |
| | | | | |
Ratios to average net assets | | | | | | | | | | | | | | | | | | | | |
| | | | | |
Expenses before waiver and payments by affiliates | | | 0.92% | | | | 0.91% | | | | 0.92% | | | | 0.87% | | | | 0.85% | |
| | | | | |
Expenses net of waiver and payments by affiliatesd | | | 0.62% | | | | 0.65% | | | | 0.65% | | | | 0.65% | | | | 0.65% | |
| | | | | |
Net investment income | | | 1.91% | | | | 2.17% | | | | 1.94% | | | | 1.43% | | | | 0.68% | |
| | | | | |
Supplemental data | | | | | | | | | | | | | | | | | | | | |
| | | | | |
Net assets, end of year (000’s) | | | $9,603 | | | | $19,703 | | | | $40,077 | | | | $35,215 | | | | $37,758 | |
| | | | | |
Portfolio turnover rate | | | 35.41% | | | | 27.83% | | | | 32.44% | | | | 31.82% | | | | 26.57% | |
aThe amount shown for a share outstanding throughout the period may not correlate with the Statement of Operations for the period due to the timing of sales and repurchases of the Fund’s shares in relation to income earned, adjustments to interest income for the inflation-indexed bonds, and/or fluctuating fair value of the investments of the Fund.
bBased on average daily shares outstanding.
cAmount rounds to less than $0.01 per share.
dBenefit of expense reduction rounds to less than 0.01%.
| | | | |
| | | |
| franklintempleton.com | | The accompanying notes are an integral part of these financial statements. | Annual Report | | 65 |
FRANKLIN INVESTORS SECURITIES TRUST
Statement of Investments, October 31, 2019
Franklin Real Return Fund
| | | | | | | | | | | | |
| | | Country | | | Shares | | | Value | |
Common Stocks 10.5% | | | | | | | | | | | | |
Energy 5.3% | | | | | | | | | | | | |
Canadian Natural Resources Ltd. | | | Canada | | | | 33,700 | | | $ | 849,914 | |
Chevron Corp. | | | United States | | | | 13,700 | | | | 1,591,117 | |
Exxon Mobil Corp. | | | United States | | | | 15,277 | | | | 1,032,267 | |
Halliburton Co. | | | United States | | | | 33,300 | | | | 641,025 | |
Noble Energy Inc. | | | United States | | | | 27,400 | | | | 527,724 | |
Occidental Petroleum Corp. | | | United States | | | | 25,153 | | | | 1,018,696 | |
Pioneer Natural Resources Co. | | | United States | | | | 4,700 | | | | 578,194 | |
Royal Dutch Shell PLC, A, ADR | | | United Kingdom | | | | 19,800 | | | | 1,147,806 | |
Schlumberger Ltd. | | | United States | | | | 20,850 | | | | 681,587 | |
| | | | | | | | | | | | |
| | | |
| | | | | | | | | | | 8,068,330 | |
| | | | | | | | | | | | |
Materials 5.2% | | | | | | | | | | | | |
BHP Group PLC, ADR. | | | United Kingdom | | | | 32,700 | | | | 1,387,134 | |
Corteva Inc. | | | United States | | | | 8,866 | | | | 233,885 | |
Dow Inc. | | | United States | | | | 8,866 | | | | 447,644 | |
DuPont de Nemours Inc. | | | United States | | | | 8,866 | | | | 584,358 | |
Freeport-McMoRan Inc. | | | United States | | | | 53,046 | | | | 520,912 | |
Newmont Goldcorp Corp. | | | United States | | | | 33,324 | | | | 1,323,963 | |
Nucor Corp. | | | United States | | | | 21,000 | | | | 1,130,850 | |
Nutrien Ltd. | | | Canada | | | | 19,624 | | | | 937,831 | |
Rio Tinto PLC, ADR | | | Australia | | | | 27,700 | | | | 1,440,677 | |
| | | | | | | | | | | | |
| | | |
| | | | | | | | | | | 8,007,254 | |
| | | | | | | | | | | | |
| | | |
Total Common Stocks (Cost $18,038,585) | | | | | | | | | | | 16,075,584 | |
| | | | | | | | | | | | |
| | | |
Management Investment Companies 10.6% | | | | | | | | | | | | |
| | | |
Diversified Financials 10.6% | | | | | | | | | | | | |
iShares Global Infrastructure ETF | | | United States | | | | 95,000 | | | | 4,481,150 | |
SPDR Dow Jones REIT ETF | | | United States | | | | 109,700 | | | | 11,598,581 | |
| | | | | | | | | | | | |
| | | |
Total Management Investment Companies (Cost $9,329,164) | | | | | | | | | | | 16,079,731 | |
| | | | | | | | | | | | |
| | | |
| | | | | | Principal
Amount | | | | |
U.S. Government and Agency Securities 73.8% | | | | | | | | | | | | |
aU.S. Treasury Note, | | | | | | | | | | | | |
Index Linked, 1.375%, 1/15/20 | | | United States | | | $ | 2,372,837 | | | | 2,373,023 | |
Index Linked, 0.125%, 4/15/20 | | | United States | | | | 10,407,797 | | | | 10,352,913 | |
Index Linked, 1.25%, 7/15/20 | | | United States | | | | 9,411,304 | | | | 9,480,970 | |
Index Linked, 0.125%, 4/15/21 | | | United States | | | | 12,556,919 | | | | 12,462,468 | |
Index Linked, 0.625%, 7/15/21 | | | United States | | | | 7,171,403 | | | | 7,220,665 | |
Index Linked, 0.125%, 1/15/22 | | | United States | | | | 7,027,919 | | | | 6,982,785 | |
Index Linked, 0.125%, 4/15/22 | | | United States | | | | 22,153,889 | | | | 21,984,532 | |
Index Linked, 0.125%, 7/15/22 | | | United States | | | | 6,917,034 | | | | 6,906,978 | |
Index Linked, 0.125%, 1/15/23 | | | United States | | | | 7,002,443 | | | | 6,962,353 | |
Index Linked, 0.625%, 1/15/24 | | | United States | | | | 8,246,618 | | | | 8,384,557 | |
Index Linked, 0.125%, 7/15/24 | | | United States | | | | 8,643,935 | | | | 8,652,552 | |
| | | | |
| | | |
66 | | Annual Report | | franklintempleton.com |
FRANKLIN INVESTORS SECURITIES TRUST
STATEMENT OF INVESTMENTS
Franklin Real Return Fund(continued)
| | | | | | | | | | | | |
| | | Country | | | Principal
Amount | | | Value | |
U.S. Government and Agency Securities(continued) | | | | | | | | | | | | |
| | | |
aU.S. Treasury Note, (continued) | | | | | | | | | | | | |
Index Linked, 0.25%, 1/15/25 | | | United States | | | $ | 10,506,964 | | | $ | 10,544,101 | |
| | | | | | | | | | | | |
| | | |
Total U.S. Government and Agency Securities
(Cost $111,798,437) | | | | | | | | | | | 112,307,897 | |
| | | | | | | | | | | | |
| | | |
Total Investments before Short Term Investments
(Cost $139,166,186) | | | | | | | | | | | 144,463,212 | |
| | | | | | | | | | | | |
| | | |
Short Term Investments (Cost $7,981,406) 5.2% | | | | | | | | | | | | |
| | | |
Repurchase Agreements 5.2% | | | | | | | | | | | | |
bJoint Repurchase Agreement, 1.722%, 11/01/19 (Maturity Value $7,981,787) | | | | | | | | | | | | |
BNP Paribas Securities Corp. (Maturity Value $5,650,068) | | | | | | | | | | | | |
Deutsche Bank Securities Inc. (Maturity Value $1,390,028) | | | | | | | | | | | | |
HSBC Securities (USA) Inc. (Maturity Value $941,691) | | | | | | | | | | | | |
Collateralized by U.S. Government Agency Securities, 5.00%, 10/20/48;cU.S. Treasury Bills, 12/03/19 - 12/10/19; and U.S. Treasury Notes, 1.625% - 1.875%, 3/15/20 - 4/30/22 (valued at $8,141,182) | | | United States | | | | 7,981,406 | | | | 7,981,406 | |
| | | | | | | | | | | | |
| | | |
Total Investments (Cost $147,147,592) 100.1% | | | | | | | | | | | 152,444,618 | |
| | | |
Other Assets, less Liabilities (0.1)% | | | | | | | | | | | (199,613 | ) |
| | | | | | | | | | | | |
| | | |
Net Assets 100.0% | | | | | | | | | | $ | 152,245,005 | |
| | | | | | | | | | | | |
See Abbreviations on page 91.
aPrincipal amount of security is adjusted for inflation. See Note 1(h).
bSee Note 1(c) regarding joint repurchase agreement.
cThe security was issued on a discount basis with no stated coupon rate.
| | | | |
| | | |
| franklintempleton.com | | The accompanying notes are an integral part of these financial statements. | Annual Report | | 67 |
FRANKLIN INVESTORS SECURITIES TRUST
FINANCIAL STATEMENTS
Statements of Assets and Liabilities
October 31, 2019
| | | | | | | | | | | | | | | | |
| | | Franklin Convertible Securities Fund | | | Franklin Equity Income Fund | | | Franklin Managed Income Fund | | | Franklin Real Return Fund | |
Assets: | | | | | | | | | | | | | | | | |
Investments in securities: | | | | | | | | | | | | | | | | |
Cost - Unaffiliated issuers | | $ | 3,399,475,988 | | | $ | 1,740,793,695 | | | $ | 3,045,481,931 | | | $ | 139,166,186 | |
Cost - Controlled affiliates (Note 3f) | | | — | | | | — | | | | 36,607,500 | | | | — | |
Cost - Non-controlled affiliates (Note 3f) | | | 89,909,657 | | | | 69,588,667 | | | | 331,668,940 | | | | — | |
Cost - Unaffiliated repurchase agreements | | | — | | | | — | | | | — | | | | 7,981,406 | |
| | | | |
| | | | |
Value - Unaffiliated issuers | | $ | 3,797,090,441 | | | $ | 2,439,705,031 | | | $ | 3,426,103,835 | | | $ | 144,463,212 | |
Value - Controlled affiliates (Note 3f) | | | — | | | | — | | | | 36,596,800 | | | | — | |
Value - Non-controlled affiliates (Note 3f) | | | 89,909,657 | | | | 69,588,667 | | | | 331,668,940 | | | | — | |
Value - Unaffiliated repurchase agreements | | | — | | | | — | | | | — | | | | 7,981,406 | |
Cash | | | — | | | | 246,660 | | | | 198,264 | | | | — | |
Foreign currency, at value (cost $—, $—, $— and $79,350, respectively) | | | — | | | | — | | | | — | | | | 79,394 | |
Receivables: | | | | | | | | | | | | | | | | |
Investment securities sold | | | — | | | | 2,816,052 | | | | — | | | | — | |
Capital shares sold | | | 3,638,604 | | | | 9,546,681 | | | | 5,078,641 | | | | 72,199 | |
Dividends and interest | | | 13,902,899 | | | | 2,906,937 | | | | 18,334,843 | | | | 119,527 | |
European Union tax reclaims | | | — | | | | 63,855 | | | | 88,846 | | | | — | |
Other assets | | | 1,146 | | | | 696 | | | | 1,094 | | | | 59 | |
| | | | |
Total assets | | | 3,904,542,747 | | | | 2,524,874,579 | | | | 3,818,071,263 | | | | 152,715,797 | |
| | | | |
Liabilities: | | | | | | | | | | | | | | | | |
Payables: | | | | | | | | | | | | | | | | |
Investment securities purchased | | | 40,000,000 | | | | 15,907,741 | | | | — | | | | — | |
Capital shares redeemed | | | 4,408,392 | | | | 2,746,900 | | | | 5,889,578 | | | | 294,488 | |
Management fees | | | 1,441,185 | | | | 944,252 | | | | 1,688,256 | | | | 34,081 | |
Distribution fees | | | 469,907 | | | | 598,035 | | | | 1,040,713 | | | | 34,067 | |
Transfer agent fees | | | 788,114 | | | | 452,098 | | | | 527,704 | | | | 31,452 | |
Professional fees | | | 59,991 | | | | 46,683 | | | | 65,697 | | | | 43,771 | |
Options written, at value (premiums received $—, $—, $10,367,474 and $—, respectively) | | | — | | | | — | | | | 5,208,470 | | | | — | |
Accrued expenses and other liabilities | | | 145,574 | | | | 107,069 | | | | 160,520 | | | | 32,933 | |
| | | | |
Total liabilities | | | 47,313,163 | | | | 20,802,778 | | | | 14,580,938 | | | | 470,792 | |
| | | | |
Net assets, at value | | $ | 3,857,229,584 | | | $ | 2,504,071,801 | | | $ | 3,803,490,325 | | | $ | 152,245,005 | |
| | | | |
| | | | |
Net assets consist of: | | | | | | | | | | | | | | | | |
Paid-in capital | | $ | 3,202,104,249 | | | $ | 1,725,963,367 | | | $ | 3,279,222,498 | | | $ | 178,348,018 | |
Total distributable earnings (loss) | | | 655,125,335 | | | | 778,108,434 | | | | 524,267,827 | | | | (26,103,013 | ) |
| | | | |
Net assets, at value | | $ | 3,857,229,584 | | | $ | 2,504,071,801 | | | $ | 3,803,490,325 | | | $ | 152,245,005 | |
| | | | |
| | | | |
| | | |
68 | | Annual Report | The accompanying notes are an integral part of these financial statements. | | franklintempleton.com |
FRANKLIN INVESTORS SECURITIES TRUST
FINANCIAL STATEMENTS
Statements of Assets and Liabilities(continued)
October 31, 2019
| | | | | | | | | | | | | | | | |
| | | Franklin Convertible Securities Fund | | | Franklin Equity Income Fund | | | Franklin Managed Income Fund | | | Franklin Real Return Fund | |
Class A: | | | | | | | | | | | | | | | | |
Net assets, at value | | $ | 1,169,927,961 | | | $ | 2,017,910,044 | | | $ | 2,966,899,403 | | | $ | 113,358,267 | |
| | | | |
| | | | |
Shares outstanding | | | 52,866,205 | | | | 76,937,970 | | | | 231,730,378 | | | | 11,470,554 | |
| | | | |
| | | | |
Net asset value per sharea | | | $22.13 | | | | $26.23 | | | | $12.80 | | | | $9.88 | |
| | | | |
| | | | |
Maximum offering price per share (net asset value per share ÷ 94.50%, 94.50%, 94.50% and 96.25%, respectively) | | | $23.42 | | | | $27.76 | | | | $13.54 | | | | $10.26 | |
| | | | |
Class C: | | | | | | | | | | | | | | | | |
Net assets, at value | | $ | 256,075,132 | | | $ | 208,733,838 | | | $ | 491,751,432 | | | $ | 17,343,564 | |
| | | | |
| | | | |
Shares outstanding | | | 11,762,976 | | | | 8,026,169 | | | | 38,799,229 | | | | 1,774,815 | |
| | | | |
| | | | |
Net asset value and maximum offering price per sharea | | | $21.77 | | | | $26.01 | | | | $12.67 | | | | $9.77 | |
| | | | |
Class R: | | | | | | | | | | | | | | | | |
Net assets, at value | | | | | | $ | 7,283,663 | | | $ | 4,080,893 | | | | | |
| | | | |
Shares outstanding | | | | | | | 277,670 | | | | 317,855 | | | | | |
| | | | |
Net asset value and maximum offering price per share | | | | | | | $26.23 | | | | $12.84 | | | | | |
Class R6: | | | | | | | | | | | | | | | | |
Net assets, at value | | $ | 51,791,422 | | | $ | 96,405,674 | | | $ | 159,877,086 | | | $ | 11,940,061 | |
| | | | |
| | | | |
Shares outstanding | | | 2,324,951 | | | | 3,667,530 | | | | 12,446,592 | | | | 1,200,116 | |
| | | | |
| | | | |
Net asset value and maximum offering price per share | | | $22.28 | | | | $26.29 | | | | $12.85 | | | | $9.95 | |
| | | | |
Advisor Class: | | | | | | | | | | | | | | | | |
| | | | |
Net assets, at value | | $ | 2,379,435,069 | | | $ | 173,738,582 | | | $ | 180,881,511 | | | $ | 9,603,113 | |
| | | | |
| | | | |
Shares outstanding | | | 107,480,292 | | | | 6,612,377 | | | | 14,091,775 | | | | 967,277 | |
| | | | |
| | | | |
Net asset value and maximum offering price per share | | | $22.14 | | | | $26.27 | | | | $12.84 | | | | $9.93 | |
| | | | |
aRedemption price is equal to net asset value less contingent deferred sales charges, if applicable.
| | | | |
| | | |
| franklintempleton.com | | The accompanying notes are an integral part of these financial statements. | Annual Report | | 69 |
FRANKLIN INVESTORS SECURITIES TRUST
FINANCIAL STATEMENTS
Statements of Operations
for the year ended October 31, 2019
| | | | | | | | | | | | | | | | |
| | | Franklin Convertible Securities Fund | | | Franklin Equity Income Fund | | | Franklin Managed Income Fund | | | Franklin Real Return Fund | |
Investment income: | | | | | | | | | | | | | | | | |
Dividends: (net of foreign taxes)* | | | | | | | | | | | | | | | | |
Unaffiliated issuers | | | $ 30,577,922 | | | | $61,578,114 | | | | $ 46,774,308 | | | | $ 1,341,185 | |
Non-controlled affiliates (Note 3f) | | | 2,673,614 | | | | 777,035 | | | | 3,230,705 | | | | 504,877 | |
Interest: | | | | | | | | | | | | | | | | |
Unaffiliated issuers: | | | | | | | | | | | | | | | | |
Inflation principal adjustments | | | — | | | | — | | | | — | | | | 2,192,434 | |
Paid in cash | | | 35,958,229 | | | | — | | | | 68,056,004 | | | | 435,226 | |
Income from securities loaned: | | | | | | | | | | | | | | | | |
Unaffiliated issuers (net of fees and rebates) | | | — | | | | — | | | | 785 | | | | — | |
Non-controlled affiliates (Note 3f) | | | — | | | | — | | | | 993 | | | | — | |
| | | | |
| | | | |
Total investment income | | | 69,209,765 | | | | 62,355,149 | | | | 118,062,795 | | | | 4,473,722 | |
| | | | |
Expenses: | | | | | | | | | | | | | | | | |
Management fees (Note 3a) | | | 17,556,232 | | | | 10,703,178 | | | | 20,531,667 | | | | 1,104,670 | |
Distribution fees: (Note 3c) | | | | | | | | | | | | | | | | |
Class A | | | 2,945,158 | | | | 4,658,795 | | | | 6,907,412 | | | | 315,511 | |
Class C | | | 2,872,849 | | | | 2,063,809 | | | | 5,009,434 | | | | 138,196 | |
Class R | | | — | | | | 34,218 | | | | 19,506 | | | | — | |
Transfer agent fees: (Note 3e) | | | | | | | | | | | | | | | | |
Class A | | | 1,464,936 | | | | 2,314,350 | | | | 2,952,360 | | | | 226,974 | |
Class C | | | 356,647 | | | | 255,959 | | | | 535,141 | | | | 38,215 | |
Class R | | | — | | | | 8,862 | | | | 4,174 | | | | — | |
Class R6 | | | 34,909 | | | | 33,906 | | | | 47,534 | | | | 8,022 | |
Advisor Class | | | 2,874,274 | | | | 175,784 | | | | 168,649 | | | | 27,758 | |
Custodian fees (Note 4) | | | 31,743 | | | | 26,759 | | | | 42,192 | | | | 2,173 | |
Reports to shareholders | | | 315,259 | | | | 176,028 | | | | 235,529 | | | | 32,523 | |
Registration and filing fees | | | 186,919 | | | | 175,396 | | | | 179,452 | | | | 70,677 | |
Professional fees | | | 76,072 | | | | 75,249 | | | | 166,015 | | | | 59,111 | |
Trustees’ fees and expenses | | | 44,034 | | | | 25,575 | | | | 39,520 | | | | 2,153 | |
Other | | | 69,778 | | | | 50,089 | | | | 86,042 | | | | 31,187 | |
| | | | |
| | | | |
Total expenses | | | 28,828,810 | | | | 20,777,957 | | | | 36,924,627 | | | | 2,057,170 | |
Expense reductions (Note 4) | | | (14,034 | ) | | | (4,641 | ) | | | (49,298 | ) | | | (755 | ) |
Expenses waived/paid by affiliates (Note 3f and 3g) | | | (499,886 | ) | | | (149,239 | ) | | | (557,058 | ) | | | (526,810 | ) |
| | | | |
| | | | |
Net expenses | | | 28,314,890 | | | | 20,624,077 | | | | 36,318,271 | | | | 1,529,605 | |
| | | | |
| | | | |
Net investment income | | | 40,894,875 | | | | 41,731,072 | | | | 81,744,524 | | | | 2,944,117 | |
| | | | |
Realized and unrealized gains (losses): | | | | | | | | | | | | | | | | |
Net realized gain (loss) from: | | | | | | | | | | | | | | | | |
Investments: | | | | | | | | | | | | | | | | |
Unaffiliated issuers | | | 324,390,042 | | | | 91,531,662 | | | | 208,129,556 | | | | (2,559,436 | ) |
Controlled affiliates (Note 3f) | | | — | | | | — | | | | (8,591,145 | ) | | | — | |
Non-controlled affiliates (Note 3f) | | | — | | | | — | | | | — | | | | (1,271,716 | ) |
Written options | | | — | | | | — | | | | 10,555,397 | | | | — | |
Foreign currency transactions | | | — | | | | 3,840 | | | | (292,105 | ) | | | (1,484 | ) |
Capital gain distributions from management investment companies: | | | | | | | | | | | | | | | | |
Controlled affiliates (Note 3f) | | | — | | | | — | | | | 4,386,856 | | | | — | |
| | | | |
| | | | |
Net realized gain (loss) | | | 324,390,042 | | | | 91,535,502 | | | | 214,188,559 | | | | (3,832,636 | ) |
| | | | |
| | | | |
| | | |
70 | | Annual Report | The accompanying notes are an integral part of these financial statements. | | franklintempleton.com |
FRANKLIN INVESTORS SECURITIES TRUST
FINANCIAL STATEMENTS
Statements of Operations (continued)
for the year ended October 31, 2019
| | | | | | | | | | | | | | | | |
| | | Franklin
Convertible
Securities Fund | | | Franklin Equity Income Fund | | | Franklin Managed
Income Fund | | | Franklin Real
Return Fund | |
Net change in unrealized appreciation (depreciation) on: | | | | | | | | | | | | | | | | |
Investments: | | | | | | | | | | | | | | | | |
Unaffiliated issuers | | | $115,337,070 | | | | $146,775,826 | | | | $124,502,934 | | | | $5,850,394 | |
Controlled affiliates (Note 3f) | | | — | | | | — | | | | 3,643,550 | | | | — | |
Non-controlled affiliates (Note 3f) | | | — | | | | — | | | | — | | | | 191,492 | |
Translation of other assets and liabilities denominated in foreign currencies | | | — | | | | 13,072 | | | | 3,087 | | | | 285 | |
Written options | | | — | | | | — | | | | 3,141,875 | | | | — | |
| | | | |
Net change in unrealized appreciation (depreciation) | | | 115,337,070 | | | | 146,788,898 | | | | 131,291,446 | | | | 6,042,171 | |
| | | | |
| | | | |
Net realized and unrealized gain (loss) | | | 439,727,112 | | | | 238,324,400 | | | | 345,480,005 | | | | 2,209,535 | |
| | | | |
Net increase (decrease) in net assets resulting from operations | | | $480,621,987 | | | | $280,055,472 | | | | $427,224,529 | | | | $5,153,652 | |
| | | | |
| | | | | | | | | | | | | | | | |
*Foreign taxes withheld on dividends | | $ | — | | | $ | 1,071,552 | | | $ | 1,146,364 | | | $ | 19,652 | |
| | | | |
| | | |
| franklintempleton.com | | The accompanying notes are an integral part of these financial statements. | Annual Report | | 71 |
FRANKLIN INVESTORS SECURITIES TRUST
FINANCIAL STATEMENTS
Statements of Changes in Net Assets
| | | | | | | | | | | | | | | | |
| | | Franklin Convertible Securities Fund | | | Franklin Equity Income Fund | |
| | | | |
| | | Year Ended October 31, | | | Year Ended October 31, | |
| | | | |
| | | 2019 | | | 2018 | | | 2019 | | | 2018 | |
| |
Increase (decrease) in net assets: | | | | | | | | | | | | | | | | |
Operations: | | | | | | | | | | | | | | | | |
Net investment income | | $ | 40,894,875 | | | $ | 25,909,414 | | | $ | 41,731,072 | | | $ | 35,094,167 | |
Net realized gain (loss) | | | 324,390,042 | | | | 245,578,005 | | | | 91,535,502 | | | | 106,911,824 | |
Net change in unrealized appreciation (depreciation) | | | 115,337,070 | | | | (102,999,826 | ) | | | 146,788,898 | | | | (57,133,702 | ) |
| | | | |
Net increase (decrease) in net assets resulting from operations | | | 480,621,987 | | | | 168,487,593 | | | | 280,055,472 | | | | 84,872,289 | |
| | | | |
Distributions to shareholders: | | | | | | | | | | | | | | | | |
Class A | | | (66,139,328 | ) | | | (63,608,374 | ) | | | (113,557,485 | ) | | | (82,499,588 | ) |
Class C | | | (14,733,353 | ) | | | (21,106,601 | ) | | | (11,317,759 | ) | | | (10,790,019 | ) |
Class R | | | — | | | | — | | | | (419,288 | ) | | | (315,650 | ) |
Class R6 | | | (3,516,561 | ) | | | (2,162,200 | ) | | | (5,532,461 | ) | | | (3,914,155 | ) |
Advisor Class | | | (131,568,983 | ) | | | (124,290,867 | ) | | | (8,002,666 | ) | | | (4,738,259 | ) |
| | | | |
Total distributions to shareholders | | | (215,958,225 | ) | | | (211,168,042 | ) | | | (138,829,659 | ) | | | (102,257,671 | ) |
| | | | |
Capital share transactions: (Note 2) | | | | | | | | | | | | | | | | |
Class A | | | (66,639,987 | ) | | | 344,731,206 | | | | 152,902,721 | | | | 13,100,601 | |
Class C | | | (64,918,362 | ) | | | (1,890,826 | ) | | | (7,886,644 | ) | | | (61,548,993 | ) |
Class R | | | — | | | | — | | | | 93,237 | | | | (272,949 | ) |
Class R6 | | | (9,724,781 | ) | | | 35,475,394 | | | | 9,835,991 | | | | 69,294,512 | |
Advisor Class | | | 32,971,457 | | | | 681,304,202 | | | | 53,962,771 | | | | (37,318,550 | ) |
| | | | |
Total capital share transactions | | | (108,311,673 | ) | | | 1,059,619,976 | | | | 208,908,076 | | | | (16,745,379 | ) |
| | | | |
Net increase (decrease) in net assets | | | 156,352,089 | | | | 1,016,939,527 | | | | 350,133,889 | | | | (34,130,761 | ) |
Net assets: | | | | | | | | | | | | | | | | |
Beginning of year | | | 3,700,877,495 | | | | 2,683,937,968 | | | | 2,153,937,912 | | | | 2,188,068,673 | |
| | | | |
End of year | | $ | 3,857,229,584 | | | $ | 3,700,877,495 | | | $ | 2,504,071,801 | | | $ | 2,153,937,912 | |
| | | | |
| | | | |
| | | |
72 | | Annual Report | The accompanying notes are an integral part of these financial statements. | | franklintempleton.com |
FRANKLIN INVESTORS SECURITIES TRUST
FINANCIAL STATEMENTS
Statements of Changes in Net Assets(continued)
| | | | | | | | | | | | | | | | |
| | | Franklin Managed Income Fund | | | Franklin Real Return Fund | |
| | | | |
| | | Year Ended October 31, | | | Year Ended October 31, | |
| | | | |
| | | 2019 | | | 2018 | | | 2019 | | | 2018 | |
| |
Increase (decrease) in net assets: | | | | | | | | | | | | | | | | |
Operations: | | | | | | | | | | | | | | | | |
Net investment income | | $ | 81,744,524 | | | $ | 73,691,923 | | | $ | 2,944,117 | | | $ | 3,896,092 | |
Net realized gain (loss) | | | 214,188,559 | | | | 38,766,320 | | | | (3,832,636 | ) | | | 4,314,310 | |
Net change in unrealized appreciation (depreciation) | | | 131,291,446 | | | | (83,381,646 | ) | | | 6,042,171 | | | | (9,287,071 | ) |
| | | | |
Net increase (decrease) in net assets resulting from operations | | | 427,224,529 | | | | 29,076,597 | | | | 5,153,652 | | | | (1,076,669 | ) |
| | | | |
Distributions to shareholders: | | | | | | | | | | | | | | | | |
Class A | | | (122,327,719 | ) | | | (124,779,231 | ) | | | (1,815,361 | ) | | | (4,501,773 | ) |
Class C | | | (19,053,022 | ) | | | (24,853,963 | ) | | | (229,717 | ) | | | (905,045 | ) |
Class R | | | (160,782 | ) | | | (205,981 | ) | | | — | | | | — | |
Class R6 | | | (6,990,241 | ) | | | (6,906,404 | ) | | | (247,375 | ) | | | (372,274 | ) |
Advisor Class | | | (7,106,607 | ) | | | (6,100,753 | ) | | | (254,048 | ) | | | (829,402 | ) |
| | | | |
Total distributions to shareholders | | | (155,638,371 | ) | | | (162,846,332 | ) | | | (2,546,501 | ) | | | (6,608,494 | ) |
| | | | |
Capital share transactions: (Note 2) | | | | | | | | | | | | | | | | |
Class A | | | 170,733,085 | | | | 40,700,401 | | | | (21,240,102 | ) | | | (8,760,975 | ) |
Class C | | | (39,706,617 | ) | | | (116,913,479 | ) | | | (7,647,853 | ) | | | (8,013,165 | ) |
Class R | | | 422,350 | | | | (1,229,264 | ) | | | — | | | | — | |
Class R6 | | | 9,808,027 | | | | 144,466,333 | | | | (2,740,402 | ) | | | 9,265,304 | |
Advisor Class | | | 44,080,423 | | | | (115,174,213 | ) | | | (10,368,871 | ) | | | (19,684,992 | ) |
| | | | |
Total capital share transactions | | | 185,337,268 | | | | (48,150,222 | ) | | | (41,997,228 | ) | | | (27,193,828 | ) |
| | | | |
Net increase (decrease) in net assets | | | 456,923,426 | | | | (181,919,957 | ) | | | (39,390,077 | ) | | | (34,878,991 | ) |
Net assets: | | | | | | | | | | | | | | | | |
Beginning of year | | | 3,346,566,899 | | | | 3,528,486,856 | | | | 191,635,082 | | | | 226,514,073 | |
| | | | |
End of year | | $ | 3,803,490,325 | | | $ | 3,346,566,899 | | | $ | 152,245,005 | | | $ | 191,635,082 | |
| | | | |
| | | | |
| | | |
| franklintempleton.com | | The accompanying notes are an integral part of these financial statements. | Annual Report | | 73 |
FRANKLIN INVESTORS SECURITIES TRUST
Notes to Financial Statements
1. Organization and Significant Accounting Policies
Franklin Investors Securities Trust (Trust) is registered under the Investment Company Act of 1940 (1940 Act) as an open-end management investment company, consisting of eight separate funds, four of which are included in this report (Funds) and applies the specialized accounting and reporting guidance in U.S. Generally Accepted Accounting Principles (U.S. GAAP). Class C shares automatically convert to Class A shares after they have been held for 10 years. Each class of shares may differ by its initial sales load, contingent deferred sales charges, voting rights on matters affecting a single class, its exchange privilege and fees due to differing arrangements for distribution and transfer agent fees. Franklin Convertible Securities Fund was closed to new investors with limited exceptions effective at the close of market on August 29, 2018. Franklin Real Return Fund was closed to new investors with limited exceptions effective at the close of market August 27, 2019.
Class A, Class C, Class R, Class R6 & Advisor Class
Franklin Managed Income Fund
Franklin Equity Income Fund
Class A, Class C, Class R6 & Advisor Class
Franklin Convertible Securities Fund
Franklin Real Return Fund
Effective March 1, 2019, Franklin Balanced Fund was renamed Franklin Managed Income Fund.
The following summarizes the Funds’ significant accounting policies.
a. Financial Instrument Valuation
The Funds’ investments in financial instruments are carried at fair value daily. Fair value is the price that would be received to sell an asset or paid to transfer a liability in an orderly transaction between market participants on the measurement date. The Funds calculate the net asset value (NAV) per share each business day as of 4 p.m. Eastern time or the regularly scheduled close of the New York Stock Exchange (NYSE), whichever is earlier. Under compliance policies and procedures approved by the Trust’s Board of Trustees (the Board), the Funds’ administrator has responsibility for oversight of valuation, including leading the cross-functional Valuation Committee (VC). The Funds may utilize
independent pricing services, quotations from securities and financial instrument dealers, and other market sources to determine fair value.
Equity securities, exchange traded funds and derivative financial instruments listed on an exchange or on the NASDAQ National Market System are valued at the last quoted sale price or the official closing price of the day, respectively. Foreign equity securities are valued as of the close of trading on the foreign stock exchange on which the security is primarily traded, or as of 4 p.m. Eastern time. The value is then converted into its U.S. dollar equivalent at the foreign exchange rate in effect at 4 p.m. Eastern time on the day that the value of the security is determined. Over-the-counter (OTC) securities are valued within the range of the most recent quoted bid and ask prices. Securities that trade in multiple markets or on multiple exchanges are valued according to the broadest and most representative market. Certain equity securities are valued based upon fundamental characteristics or relationships to similar securities.
Debt and certain preferred securities generally trade in the OTC market rather than on a securities exchange. The Funds’ pricing services use multiple valuation techniques to determine fair value. In instances where sufficient market activity exists, the pricing services may utilize a market-based approach through which quotes from market makers are used to determine fair value. In instances where sufficient market activity may not exist or is limited, the pricing services also utilize proprietary valuation models which may consider market characteristics such as benchmark yield curves, credit spreads, estimated default rates, anticipated market interest rate volatility, coupon rates, anticipated timing of principal repayments, underlying collateral, and other unique security features in order to estimate the relevant cash flows, which are then discounted to calculate the fair value.
Investments in open-end mutual funds are valued at the closing NAV. Investments in repurchase agreements are valued at cost, which approximates fair value.
Certain derivative financial instruments trade in the OTC market. The Funds’ pricing services use various techniques including industry standard option pricing models and proprietary discounted cash flow models to determine the fair value of those instruments. The Funds’ net benefit or obligation under the derivative contract, as measured by the fair value of the contract, is included in net assets.
| | | | |
| | | |
74 | | Annual Report | | franklintempleton.com |
FRANKLIN INVESTORS SECURITIES TRUST
NOTES TO FINANCIAL STATEMENTS
The Funds have procedures to determine the fair value of financial instruments for which market prices are not reliable or readily available. Under these procedures, the Funds primarily employ a market-based approach which may use related or comparable assets or liabilities, recent transactions, market multiples, book values, and other relevant information for the investment to determine the fair value of the investment. An income-based valuation approach may also be used in which the anticipated future cash flows of the investment are discounted to calculate fair value. Discounts may also be applied due to the nature or duration of any restrictions on the disposition of the investments. Due to the inherent uncertainty of valuations of such investments, the fair values may differ significantly from the values that would have been used had an active market existed.
Trading in securities on foreign securities stock exchanges and OTC markets may be completed before 4 p.m. Eastern time. In addition, trading in certain foreign markets may not take place on every Funds’ business day. Occasionally, events occur between the time at which trading in a foreign security is completed and 4 p.m. Eastern time that might call into question the reliability of the value of a portfolio security held by the Fund. As a result, differences may arise between the value of the Funds’ portfolio securities as determined at the foreign market close and the latest indications of value at 4 p.m. Eastern time. In order to minimize the potential for these differences, the VC monitors price movements following the close of trading in foreign stock markets through a series of country specific market proxies (such as baskets of American Depositary Receipts, futures contracts and exchange traded funds). These price movements are measured against established trigger thresholds for each specific market proxy to assist in determining if an event has occurred that may call into question the reliability of the values of the foreign securities held by the Funds. If such an event occurs, the securities may be valued using fair value procedures, which may include the use of independent pricing services.
When the last day of the reporting period is a non-business day, certain foreign markets may be open on those days that the Funds’ NAV is not calculated, which could result in differences between the value of the Funds’ portfolio securities on the last business day and the last calendar day of the reporting period. Any significant security valuation changes due to an open foreign market are adjusted and reflected by the Funds for financial reporting purposes.
b. Foreign Currency Translation
Portfolio securities and other assets and liabilities denominated in foreign currencies are translated into U.S. dollars based on the exchange rate of such currencies against U.S. dollars on the date of valuation. The Funds may enter into foreign currency exchange contracts to facilitate transactions denominated in a foreign currency. Purchases and sales of securities, income and expense items denominated in foreign currencies are translated into U.S. dollars at the exchange rate in effect on the transaction date. Portfolio securities and assets and liabilities denominated in foreign currencies contain risks that those currencies will decline in value relative to the U.S. dollar. Occasionally, events may impact the availability or reliability of foreign exchange rates used to convert the U.S. dollar equivalent value. If such an event occurs, the foreign exchange rate will be valued at fair value using procedures established and approved by the Board.
The Funds do not separately report the effect of changes in foreign exchange rates from changes in market prices on securities held. Such changes are included in net realized and unrealized gain or loss from investments in the Statements of Operations.
Realized foreign exchange gains or losses arise from sales of foreign currencies, currency gains or losses realized between the trade and settlement dates on securities transactions and the difference between the recorded amounts of dividends, interest, and foreign withholding taxes and the U.S. dollar equivalent of the amounts actually received or paid. Net unrealized foreign exchange gains and losses arise from changes in foreign exchange rates on foreign denominated assets and liabilities other than investments in securities held at the end of the reporting period.
c. Joint Repurchase Agreement
Certain or all Funds enter into a joint repurchase agreement whereby their uninvested cash balance is deposited into a joint cash account with other funds managed by the investment manager or an affiliate of the investment manager and is used to invest in one or more repurchase agreements. The value and face amount of the joint repurchase agreement are allocated to the funds based on their pro-rata interest. A repurchase agreement is accounted for as a loan by the Fund to the seller, collateralized by securities which are delivered to the Funds’ custodian. The fair value, including accrued interest, of the initial collateralization is required to
| | | | |
| | | |
| franklintempleton.com | | Annual Report | | 75 |
FRANKLIN INVESTORS SECURITIES TRUST
NOTES TO FINANCIAL STATEMENTS
1. Organization and Significant Accounting Policies(continued)
c. Joint Repurchase Agreement(continued)
be at least 102% of the dollar amount invested by the funds, with the value of the underlying securities marked to market daily to maintain coverage of at least 100%. Repurchase agreements are subject to the terms of Master Repurchase Agreements (MRAs) with approved counterparties (sellers). The MRAs contain various provisions, including but not limited to events of default and maintenance of collateral for repurchase agreements. In the event of default by either the seller or the Funds, certain MRAs may permit the non-defaulting party to net and close-out all transactions, if any, traded under such agreements. The Funds may sell securities it holds as collateral and apply the proceeds towards the repurchase price and any other amounts owed by the seller to the Funds in the event of default by the seller. This could involve costs or delays in addition to a loss on the securities if their value falls below the repurchase price owed by the seller. The joint repurchase agreement held by the Funds at year end, as indicated in the Statements of Investments, had been entered into on October 31, 2019.
d. Derivative Financial Instruments
Certain or all Funds invested in derivative financial instruments in order to manage risk or gain exposure to various other investments or markets. Derivatives are financial contracts based on an underlying or notional amount, require no initial investment or an initial net investment that is smaller than would normally be required to have a similar response to changes in market factors, and require or permit net settlement. Derivatives contain various risks including the potential inability of the counterparty to fulfill their obligations under the terms of the contract, the potential for an illiquid secondary market, and/or the potential for market movements which expose the Fund to gains or losses in excess of the amounts shown in the Statements of Assets and Liabilities. Realized gain and loss and unrealized appreciation and depreciation on these contracts for the period are included in the Statements of Operations.
Collateral requirements differ by type of derivative. Collateral or initial margin requirements are set by the broker or exchange clearing house for exchange traded and centrally cleared derivatives. Initial margin deposited is held at the exchange and can be in the form of cash and/or securities.
Certain or all Funds purchased or wrote exchange traded option contracts primarily to manage and/or gain exposure to equity volatility risk. An option is a contract entitling the holder to purchase or sell a specific amount of shares or units of an asset or notional amount of a swap (swaption), at a specified price. When an option is purchased or written, an amount equal to the premium paid or received is recorded as an asset or liability, respectively. Upon exercise of an option, the acquisition cost or sales proceeds of the underlying investment is adjusted by any premium received or paid. Upon expiration of an option, any premium received or paid is recorded as a realized gain or loss. Upon closing an option other than through expiration or exercise, the difference between the premium received or paid and the cost to close the position is recorded as a realized gain or loss.
See Note 8 regarding other derivative information.
e. Equity-Linked Securities
Certain or all Funds invest in equity-linked securities. Equity-linked securities are hybrid financial instruments that generally combine both debt and equity characteristics into a single note form. Income received from equity-linked securities is recorded as realized gains in the Statements of Operations and may be based on the performance of an underlying equity security, an equity index, or an option position. The risks of investing in equity-linked securities include unfavorable price movements in the underlying security and the credit risk of the issuing financial institution. There may be no guarantee of a return of principal with equity-linked securities and the appreciation potential may be limited. Equity-linked securities may be more volatile and less liquid than other investments held by the Funds.
f. Securities Lending
Certain or all Funds participate in an agency based securities lending program to earn additional income. The Fund receives cash collateral against the loaned securities in an amount equal to at least 102% of the fair value of the loaned securities. Collateral is maintained over the life of the loan in an amount not less than 100% of the fair value of loaned securities, as determined at the close of Fund business each day; any additional collateral required due to changes in security values is delivered to the Fund on the next business day. The collateral is deposited into a joint cash account with other funds and is used to invest in a money market fund managed by Franklin Advisers, Inc., an affiliate of the Funds, and/or a joint repurchase agreement. The Fund may receive
| | | | |
| | | |
76 | | Annual Report | | franklintempleton.com |
FRANKLIN INVESTORS SECURITIES TRUST
NOTES TO FINANCIAL STATEMENTS
income from the investment of cash collateral, in addition to lending fees and rebates paid by the borrower. Income from securities loaned, net of fees paid to the securities lending agent and/or third-party vendor, is reported separately in the Statements of Operations. The Fund bears the market risk with respect to the collateral investment, securities loaned, and the risk that the agent may default on its obligations to the Fund. If the borrower defaults on its obligation to return the securities loaned, the Fund has the right to repurchase the securities in the open market using the collateral received. The securities lending agent has agreed to indemnify the Fund in the event of default by a third party borrower. At October 31, 2019, the Funds had no securities on loan.
g. Income and Deferred Taxes
It is each Fund’s policy to qualify as a regulated investment company under the Internal Revenue Code. Each Fund intends to distribute to shareholders substantially all of its taxable income and net realized gains to relieve it from federal income and excise taxes. As a result, no provision for U.S. federal income taxes is required.
The Funds may be subject to foreign taxation related to income received, capital gains on the sale of securities and certain foreign currency transactions in the foreign jurisdictions in which the Funds invest. Foreign taxes, if any, are recorded based on the tax regulations and rates that exist in the foreign markets in which the Funds invest. When a capital gain tax is determined to apply, certain or all Funds record an estimated deferred tax liability in an amount that would be payable if the securities were disposed of on the valuation date.
As a result of several court cases, in certain countries across the European Union, certain or all Funds filed additional tax reclaims for previously withheld taxes on dividends earned in those countries (EU reclaims). These additional filings are subject to various administrative proceedings by the local jurisdictions’ tax authorities within the European Union, as well as a number of related judicial proceedings. Income recognized, if any, for EU reclaims is reflected as other income in the Statements of Operations and any related receivable, if any, is reflected as European Union tax reclaims in the Statements of Assets and Liabilities. When uncertainty exists as to the ultimate resolution of these proceedings, the likelihood of receipt of these EU reclaims, and the potential timing of payment, no amounts are reflected in the financial statements. For U.S. income tax purposes, EU reclaims
received by the Funds, if any, reduce the amounts of foreign taxes Fund shareholders can use as tax credits in their individual income tax returns.
Each Fund may recognize an income tax liability related to its uncertain tax positions under U.S. GAAP when the uncertain tax position has a less than 50% probability that it will be sustained upon examination by the tax authorities based on its technical merits. As of October 31, 2019, each Fund has determined that no tax liability is required in its financial statements related to uncertain tax positions for any open tax years (or expected to be taken in future tax years). Open tax years are those that remain subject to examination and are based on the statute of limitations in each jurisdiction in which the Fund invests.
h. Security Transactions, Investment Income, Expenses and Distributions
Security transactions are accounted for on trade date. Realized gains and losses on security transactions are determined on a specific identification basis. Interest income and estimated expenses are accrued daily. Amortization of premium and accretion of discount on debt securities are included in interest income. Facility fees are recognized as income over the expected term of the loan. Dividend income and capital gain distributions by Underlying Funds are recorded on the ex-dividend date except for certain dividends from securities where the dividend rate is not available. In such cases, the dividend is recorded as soon as the information is received by the Funds. Distributions to shareholders are recorded on the ex-dividend date. The Franklin Managed Income Fund employs a managed distribution policy. Under this policy, the fund will distribute level monthly distributions in any given year regardless of the performance of the fund; however, the twelfth monthly payment may be greater than the initially anticipated amount if additional income or capital gains are required to be distributed. These distributions may include income and capital gains generated by the Fund, as well as a possible return of capital component, if necessary, to meet the annual distribution rate. The annual payout rate may be adjusted higher or lower from year to year in response to market conditions. Distributable earnings are determined according to income tax regulations (tax basis) and may differ from earnings recorded in accordance with U.S. GAAP. These differences may be permanent or temporary. Permanent differences are reclassified among capital accounts to reflect
| | | | |
| | | |
| franklintempleton.com | | Annual Report | | 77 |
FRANKLIN INVESTORS SECURITIES TRUST
NOTES TO FINANCIAL STATEMENTS
1. Organization and Significant Accounting Policies(continued)
h. Security Transactions, Investment Income, Expenses and Distributions(continued)
their tax character. These reclassifications have no impact on net assets or the results of operations. Temporary differences are not reclassified, as they may reverse in subsequent periods.
Common expenses incurred by the Trust are allocated among the Funds based on the ratio of net assets of each Fund to the combined net assets of the Trust or based on the ratio of number of shareholders of each Fund to the combined number of shareholders of the Trust. Fund specific expenses are charged directly to the Fund that incurred the expense.
Realized and unrealized gains and losses and net investment income, excluding class specific expenses, are allocated daily to each class of shares based upon the relative proportion of net assets of each class. Differences in per share distributions by class are generally due to differences in class specific expenses.
Inflation-indexed bonds are adjusted for inflation through periodic increases or decreases in the security’s interest accruals, face amount, or principal redemption value, by
amounts corresponding to the rate of inflation as measured by an index. Any increase or decrease in the face amount or principal redemption value will be included as inflation principal adjustments in the Statements of Operations.
i. Accounting Estimates
The preparation of financial statements in accordance with U.S. GAAP requires management to make estimates and assumptions that affect the reported amounts of assets and liabilities at the date of the financial statements and the amounts of income and expenses during the reporting period. Actual results could differ from those estimates.
j. Guarantees and Indemnifications
Under the Trust’s organizational documents, its officers and trustees are indemnified by the Trust against certain liabilities arising out of the performance of their duties to the Trust. Additionally, in the normal course of business, the Trust, on behalf of the Funds, enters into contracts with service providers that contain general indemnification clauses. The Trust’s maximum exposure under these arrangements is unknown as this would involve future claims that may be made against the Trust that have not yet occurred. Currently, the Trust expects the risk of loss to be remote.
2. Shares of Beneficial Interest
At October 31, 2019, there were an unlimited number of shares authorized (without par value). Transactions in the Funds’ shares were as follows:
| | | | | | | | | | | | | | | | |
| | | Franklin Convertible Securities Fund | | | Franklin Equity Income Fund | |
| | | Shares | | | Amount | | | Shares | | | Amount | |
| | | | |
Class A Shares: | | | | | | | | | | | | | | | | |
Year ended October 31, 2019 | | | | | | | | | | | | | | | | |
Shares solda | | | 6,419,478 | | | $ | 138,547,580 | | | | 12,618,566 | | | $ | 311,210,362 | |
Shares issued in reinvestment of distributions | | | 3,246,558 | | | | 63,366,459 | | | | 4,757,293 | | | | 111,013,154 | |
Shares redeemed | | | (12,685,094 | ) | | | (268,554,026 | ) | | | (10,930,597 | ) | | | (269,320,795 | ) |
| | | | |
Net increase (decrease) | | | (3,019,058 | ) | | $ | (66,639,987 | ) | | | 6,445,262 | | | $ | 152,902,721 | |
| | | | |
Year ended October 31, 2018 | | | | | | | | | | | | | | | | |
Shares solda | | | 28,565,417 | | | $ | 600,371,738 | | | | 8,522,436 | | | $ | 215,600,707 | |
Shares issued in reinvestment of distributions | | | 3,028,430 | | | | 60,507,562 | | | | 3,204,198 | | | | 80,643,785 | |
Shares redeemed | | | (15,150,859 | ) | | | (316,148,094 | ) | | | (11,186,923 | ) | | | (283,143,891 | ) |
| | | | |
Net increase (decrease) | | | 16,442,988 | | | $ | 344,731,206 | | | | 539,711 | | | $ | 13,100,601 | |
| | | | |
| | | |
76 | | Annual Report | | franklintempleton.com |
FRANKLIN INVESTORS SECURITIES TRUST
NOTES TO FINANCIAL STATEMENTS
| | | | | | | | | | | | | | | | |
| | | Franklin Convertible Securities Fund | | | Franklin Equity Income Fund | |
| | | | |
| | | Shares | | | Amount | | | Shares | | | Amount | |
| | | | |
Class C Shares: | | | | | | | | | | | | | | | | |
Year ended October 31, 2019 | | | | | | | | | | | | | | | | |
Shares sold | | | 840,031 | | | $ | 17,694,676 | | | | 1,754,938 | | | $ | 42,669,455 | |
Shares issued in reinvestment of distributions | | | 685,031 | | | | 13,012,703 | | | | 476,082 | | | | 10,958,143 | |
Shares redeemeda | | | (4,516,464 | ) | | | (95,625,741 | ) | | | (2,499,030 | ) | | | (61,514,242 | ) |
| | | | |
| | | | |
Net increase (decrease) | | | (2,991,402 | ) | | $ | (64,918,362 | ) | | | (268,010 | ) | | $ | (7,886,644 | ) |
| | | | |
| | | | |
Year ended October 31, 2018 | | | | | | | | | | | | | | | | |
Shares sold | | | 5,832,864 | | | $ | 120,961,542 | | | | 1,755,701 | | | $ | 44,156,220 | |
Shares issued in reinvestment of distributions | | | 963,682 | | | | 18,860,854 | | | | 419,604 | | | | 10,474,658 | |
Shares redeemeda | | | (6,928,441 | ) | | | (141,713,222 | ) | | | (4,640,390 | ) | | | (116,179,871 | ) |
| | | | |
| | | | |
Net increase (decrease) | | | (131,895 | ) | | $ | (1,890,826 | ) | | | (2,465,085 | ) | | $ | (61,548,993 | ) |
| | | | |
| | | | |
Class R Shares: | | | | | | | | | | | | | | | | |
Year ended October 31, 2019 | | | | | | | | | | | | | | | | |
Shares sold | | | | | | | | | | | 44,565 | | | $ | 1,076,955 | |
Shares issued in reinvestment of distributions | | | | | | | | | | | 16,690 | | | | 388,732 | |
Shares redeemed | | | | | | | | | | | (55,202 | ) | | | (1,372,450 | ) |
| | | | | | | | | | | | |
| | | | |
Net increase (decrease) | | | | | | | | | | | 6,053 | | | $ | 93,237 | |
| | | | | | | | | | | | |
| | | | |
Year ended October 31, 2018 | | | | | | | | | | | | | | | | |
Shares sold | | | | | | | | | | | 41,575 | | | $ | 1,049,280 | |
Shares issued in reinvestment of distributions | | | | | | | | | | | 11,318 | | | | 284,867 | |
Shares redeemed | | | | | | | | | | | (63,625 | ) | | | (1,607,096 | ) |
| | | | |
Net increase (decrease) | | | | | | | | | | | (10,732 | ) | | $ | (272,949 | ) |
| | | | | | | | |
| | | | |
Class R6 Shares: | | | | | | | | | | | | | | | | |
Year ended October 31, 2019 | | | | | | | | | | | | | | | | |
Shares sold | | | 865,814 | | | $ | 18,678,428 | | | | 958,941 | | | $ | 23,746,953 | |
Shares issued in reinvestment of distributions | | | 178,341 | | | | 3,515,052 | | | | 187,558 | | | | 4,394,439 | |
Shares redeemed | | | (1,502,089 | ) | | | (31,918,261 | ) | | | (738,112 | ) | | | (18,305,401 | ) |
| | | | |
Net increase (decrease) | | | (457,934 | ) | | $ | (9,724,781 | ) | | | 408,387 | | | $ | 9,835,991 | |
| | | | |
| | | | |
Year ended October 31, 2018 | | | | | | | | | | | | | | | | |
Shares sold | | | 2,814,780 | | | $ | 59,072,073 | | | | 3,474,912 | | | $ | 87,644,288 | |
Shares issued in reinvestment of distributions | | | 106,403 | | | | 2,160,058 | | | | 126,940 | | | | 3,202,571 | |
Shares redeemed | | | (1,242,069 | ) | | | (25,756,737 | ) | | | (849,554 | ) | | | (21,552,347 | ) |
| | | | |
Net increase (decrease) | | | 1,679,114 | | | $ | 35,475,394 | | | | 2,752,298 | | | $ | 69,294,512 | |
| | | | |
| | | | |
| | | |
| franklintempleton.com | | Annual Report | | 79 |
FRANKLIN INVESTORS SECURITIES TRUST
NOTES TO FINANCIAL STATEMENTS
2. Shares of Beneficial Interest(continued)
| | | | | | | | | | | | | | | | |
| | | Franklin Convertible Securities Fund | | | Franklin Equity Income Fund | |
| | | Shares | | | Amount | | | Shares | | | Amount | |
Advisor Class Shares: | | | | | | | | | | | | | | | | |
Year ended October 31, 2019 | | | | | | | | | | | | | | | | |
Shares sold | | | 31,898,944 | | | $ | 682,438,950 | | | | 3,482,614 | | | $ | 85,115,695 | |
Shares issued in reinvestment of distributions | | | 5,813,623 | | | | 113,983,447 | | | | 310,395 | | | | 7,308,854 | |
Shares redeemed | | | (36,235,757 | ) | | | (763,450,940 | ) | | | (1,575,590 | ) | | | (38,461,778 | ) |
| | | | |
Net increase (decrease) | | | 1,476,810 | | | $ | 32,971,457 | | | | 2,217,419 | | | $ | 53,962,771 | |
| | | | |
Year ended October 31, 2018 | | | | | | | | | | | | | | | | |
Shares sold | | | 71,119,463 | | | $ | 1,499,743,371 | | | | 1,666,939 | | | $ | 42,390,161 | |
Shares issued in reinvestment of distributions | | | 5,499,134 | | | | 109,979,709 | | | | 167,247 | | | | 4,221,565 | |
Shares redeemed | | | (45,190,202 | ) | | | (928,418,878 | ) | | | (3,322,517 | ) | | | (83,930,276 | ) |
| | | | |
Net increase (decrease) | | | 31,428,395 | | | $ | 681,304,202 | | | | (1,488,331 | ) | | $ | (37,318,550 | ) |
| | |
| aMay include a portion of Class C shares that were automatically converted to Class A. | | | | | | | | | |
| | |
| | | Franklin Managed Income Fund | | | Franklin Real Return Fund | |
| | | Shares | | | Amount | | | Shares | | | Amount | |
Class A Shares: | | | | | | | | | | | | | | | | |
Year ended October 31, 2019 | | | | | | | | | | | | | | | | |
Shares solda | | | 39,624,179 | | | $ | 481,294,589 | | | | 1,958,164 | | | $ | 19,166,723 | |
Shares issued in reinvestment of distributions | | | 9,892,242 | | | | 119,363,850 | | | | 181,785 | | | | 1,782,297 | |
Shares redeemed | | | (35,313,277 | ) | | | (429,925,354 | ) | | | (4,293,664 | ) | | | (42,189,122 | ) |
| | | | |
Net increase (decrease) | | | 14,203,144 | | | $ | 170,733,085 | | | | (2,153,715 | ) | | $ | (21,240,102 | ) |
| | | | |
Year ended October 31, 2018 | | | | | | | | | | | | | | | | |
Shares solda | | | 31,254,193 | | | $ | 380,495,174 | | | | 2,394,029 | | | $ | 23,972,212 | |
Shares issued in reinvestment of distributions | | | 9,972,235 | | | | 121,740,304 | | | | 437,971 | | | | 4,406,173 | |
Shares redeemed | | | (37,826,274 | ) | | | (461,535,077 | ) | | | (3,697,499 | ) | | | (37,139,360 | ) |
| | | | |
Net increase (decrease) | | | 3,400,154 | | | $ | 40,700,401 | | | | (865,499 | ) | | $ | (8,760,975 | ) |
| | | | |
Class C Shares: | | | | | | | | | | | | | | | | |
Year ended October 31, 2019 | | | | | | | | | | | | | | | | |
Shares sold | | | 6,705,072 | | | $ | 79,963,632 | | | | 149,775 | | | $ | 1,453,938 | |
Shares issued in reinvestment of distributions | | | 1,528,493 | | | | 18,200,268 | | | | 22,954 | | | | 222,413 | |
Shares redeemeda | | | (11,352,596 | ) | | | (137,870,517 | ) | | | (958,563 | ) | | | (9,324,204 | ) |
| | | | |
Net increase (decrease) | | | (3,119,031 | ) | | $ | (39,706,617 | ) | | | (785,834 | ) | | $ | (7,647,853 | ) |
| | | | |
Year ended October 31, 2018 | | | | | | | | | | | | | | | | |
Shares sold | | | 5,331,825 | | | $ | 64,522,420 | | | | 384,940 | | | $ | 3,821,041 | |
Shares issued in reinvestment of distributions | | | 1,966,557 | | | | 23,818,011 | | | | 88,631 | | | | 882,650 | |
Shares redeemeda | | | (17,061,942 | ) | | | (205,253,910 | ) | | | (1,285,936 | ) | | | (12,716,856 | ) |
Net increase (decrease) | | | (9,763,560 | ) | | $ | (116,913,479 | ) | | | (812,365 | ) | | $ | (8,013,165 | ) |
| | | | |
| | | |
80 | | Annual Report | | franklintempleton.com |
FRANKLIN INVESTORS SECURITIES TRUST
NOTES TO FINANCIAL STATEMENTS
| | | | | | | | | | | | | | | | |
| | | Franklin Managed Income Fund | | | Franklin Real Return Fund | |
| | | Shares | | | Amount | | | Shares | | | Amount | |
| | | | |
Class R Shares: | | | | | | | | | | | | | | | | |
Year ended October 31, 2019 | | | | | | | | | | | | | | | | |
Shares sold | | | 79,143 | | | $ | 961,918 | | | | | | | | | |
Shares issued in reinvestment of distributions | | | 13,269 | | | | 160,596 | | | | | | | | | |
Shares redeemed | | | (57,333 | ) | | | (700,164 | ) | | | | | | | | |
| | | | |
Net increase (decrease) | | | 35,079 | | | $ | 422,350 | | | | | | | | | |
| | | | |
Year ended October 31, 2018 | | | | | | | | | | | | | | | | |
Shares sold | | | 52,561 | | | $ | 644,571 | | | | | | | | | |
Shares issued in reinvestment of distributions | | | 16,814 | | | | 205,981 | | | | | | | | | |
Shares redeemed | | | (170,975 | ) | | | (2,079,816 | ) | | | | | | | | |
| | | | |
Net increase (decrease) | | | (101,600 | ) | | $ | (1,229,264 | ) | | | | | | | | |
| | | | |
Class R6 Shares: | | | | | | | | | | | | | | | | |
Year ended October 31, 2019 | | | | | | | | | | | | | | | | |
Shares sold | | | 2,981,043 | | | $ | 36,633,670 | | | | 380,431 | | | $ | 3,758,860 | |
Shares issued in reinvestment of distributions | | | 576,916 | | | | 6,987,353 | | | | 18,370 | | | | 181,182 | |
Shares redeemed | | | (2,761,099 | ) | | | (33,812,996 | ) | | | (674,873 | ) | | | (6,680,444 | ) |
| | | | |
Net increase (decrease) | | | 796,860 | | | $ | 9,808,027 | | | | (276,072 | ) | | $ | (2,740,402 | ) |
| | | | |
Year ended October 31, 2018 | | | | | | | | | | | | | | | | |
Shares sold | | | 14,240,369 | | | $ | 176,497,963 | | | | 1,199,559 | | | $ | 12,138,483 | |
Shares issued in reinvestment of distributions | | | 564,301 | | | | 6,905,816 | | | | 26,854 | | | | 271,471 | |
Shares redeemed | | | (3,182,549 | ) | | | (38,937,446 | ) | | | (312,145 | ) | | | (3,144,650 | ) |
| | | | |
Net increase (decrease) | | | 11,622,121 | | | $ | 144,466,333 | | | | 914,268 | | | $ | 9,265,304 | |
| | | | |
Advisor Class Shares: | | | | | | | | | | | | | | | | |
Year ended October 31, 2019 | | | | | | | | | | | | | | | | |
Shares sold | | | 6,300,058 | | | $ | 76,396,303 | | | | 382,594 | | | $ | 3,772,637 | |
Shares issued in reinvestment of distributions | | | 504,313 | | | | 6,125,151 | | | | 25,740 | | | | 253,013 | |
Shares redeemed | | | (3,140,172 | ) | | | (38,441,031 | ) | | | (1,454,147 | ) | | | (14,394,521 | ) |
| | | | |
Net increase (decrease) | | | 3,664,199 | | | $ | 44,080,423 | | | | (1,045,813 | ) | | $ | (10,368,871 | ) |
| | | | |
Year ended October 31, 2018 | | | | | | | | | | | | | | | | |
Shares sold | | | 3,903,537 | | | $ | 47,754,786 | | | | 1,354,135 | | | $ | 13,625,198 | |
Shares issued in reinvestment of distributions | | | 413,056 | | | | 5,051,434 | | | | 79,839 | | | | 806,460 | |
Shares redeemed | | | (13,562,421 | ) | | | (167,980,433 | ) | | | (3,358,885 | ) | | | (34,116,650 | ) |
| | | | |
Net increase (decrease) | | | (9,245,828 | ) | | $ | (115,174,213 | ) | | | (1,924,911 | ) | | $ | (19,684,992 | ) |
aMay include a portion of Class C shares that were automatically converted to Class A.
| | | | |
| | | |
| franklintempleton.com | | Annual Report | | 81 |
FRANKLIN INVESTORS SECURITIES TRUST
NOTES TO FINANCIAL STATEMENTS
3. Transactions with Affiliates
Franklin Resources, Inc. is the holding company for various subsidiaries that together are referred to as Franklin Templeton. Certain officers and trustees of the Trust are also officers and/or directors of the following subsidiaries:
| | |
| Subsidiary | | Affiliation |
Franklin Advisers, Inc. (Advisers) | | Investment manager |
Franklin Templeton Services, LLC (FT Services) | | Administrative manager |
Franklin Templeton Distributors, Inc. (Distributors) | | Principal underwriter |
Franklin Templeton Investor Services, LLC (Investor Services) | | Transfer agent |
a. Management Fees
Effective March 1, 2019, the Franklin Managed Income Fund pays an investment management fee to Advisers based on the average daily net assets of the Fund as follows:
| | |
| Annualized Fee Rate | | Net Assets |
0.620% | | Up to and including $250 million |
0.595% | | Over $250 million, up to and including $500 million |
0.570% | | Over $500 million, up to and including $1 billion |
0.545% | | Over $1 billion, up to and including $2.5 billion |
0.520% | | Over $2.5 billion, up to and including $5 billion |
0.495% | | Over $5 billion, up to and including $10 billion |
0.470% | | Over $10 billion, up to and including $15 billion |
0.445% | | Over $15 billion, up to and including $20 billion |
0.420% | | In excess of $20 billion |
Prior to March 1, 2019, the Franklin Managed Income Fund paid fees to Advisers based on the average daily net assets of the Fund as follows:
| | |
| Annualized Fee Rate | | Net Assets |
0.700% | | Up to and including $250 million |
0.675% | | Over $250 million, up to and including $500 million |
0.650% | | Over $500 million, up to and including $1 billion |
0.625% | | Over $1 billion, up to and including $2.5 billion |
0.600% | | Over $2.5 billion, up to and including $5 billion |
0.575% | | Over $5 billion, up to and including $10 billion |
0.550% | | Over $10 billion, up to and including $15 billion |
0.525% | | Over $15 billion, up to and including $20 billion |
0.500% | | In excess of $20 billion |
| | | | |
| | | |
82 | | Annual Report | | franklintempleton.com |
FRANKLIN INVESTORS SECURITIES TRUST
NOTES TO FINANCIAL STATEMENTS
Franklin Convertible Securities Fund and Franklin Equity Income Fund pay an investment management fee to Advisers based on the month-end net assets of each of the Funds as follows:
| | |
| Annualized Fee Rate | | Net Assets |
0.625% | | Up to and including $100 million |
0.500% | | Over $100 million, up to and including $250 million |
0.450% | | Over $250 million, up to and including $7.5 billion |
0.440% | | Over $7.5 billion, up to and including $10 billion |
0.430% | | Over $10 billion, up to and including $12.5 billion |
0.420% | | Over $12.5 billion, up to and including $15 billion |
0.400% | | Over $15 billion, up to and including $17.5 billion |
0.380% | | Over $17.5 billion, up to and including $20 billion |
0.360% | | Over $20 billion, up to and including $35 billion |
0.355% | | Over $35 billion, up to and including $50 billion |
0.350% | | In excess of $50 billion |
Franklin Real Return Fund pays an investment management fee to Advisers based on the average daily net assets of the Fund as follows:
| | |
| Annualized Fee Rate | | Net Assets |
0.625% | | Up to and including $500 million |
0.525% | | Over $500 million, up to and including $1 billion |
0.480% | | Over $1 billion, up to and including $1.5 billion |
0.435% | | Over $1.5 billion, up to and including $6.5 billion |
0.415% | | Over $6.5 billion, up to and including $11.5 billion |
0.400% | | Over $11.5 billion, up to and including $16.5 billion |
0.390% | | Over $16.5 billion, up to and including $19 billion |
0.380% | | Over $19 billion, up to and including $21.5 billion |
0.370% | | In excess of $21.5 billion |
For the year ended October 31, 2019, each Fund’s gross effective investment management fee rate based on average daily net assets was as follows:
| | | | | | | | | | | | | | |
Franklin Convertible Securities Fund | | | Franklin Equity Income Fund | | | Franklin Managed
Income Fund | | | Franklin Real Return Fund | |
| 0.458% | | | | 0.464% | | | | 0.574% | | | | 0.625% | |
b. Administrative Fees
Under an agreement with Advisers, FT Services provides administrative services to the Funds. The fee is paid by Advisers based on each of the Funds’ average daily net assets, and is not an additional expense of the Funds.
| | | | |
| | | |
| franklintempleton.com | | Annual Report | | 83 |
FRANKLIN INVESTORS SECURITIES TRUST
NOTES TO FINANCIAL STATEMENTS
3. Transactions with Affiliates(continued)
c. Distribution Fees
The Board has adopted distribution plans for each share class, with the exception of Class R6 and Advisor Class shares, pursuant to Rule 12b-1 under the 1940 Act. Under the Funds’ Class A reimbursement distribution plans, the Funds reimburse Distributors for costs incurred in connection with the servicing, sale and distribution of each Fund’s shares up to the maximum annual plan rate for each class. Under the Class A reimbursement distribution plans, costs exceeding the maximum for the current plan year cannot be reimbursed in subsequent periods. In addition, under the Funds’ Class C and R compensation distribution plans, the Funds pay Distributors for costs incurred in connection with the servicing, sale and distribution of each Fund’s shares up to the maximum annual plan rate for each class. The plan year, for purposes of monitoring compliance with the maximum annual plan rates, is February 1 through January 31 for each Fund.
The maximum annual plan rates, based on the average daily net assets, for each class, are as follows:
| | | | | | | | | | | | | | | | |
| | | Franklin Convertible Securities Fund | | | Franklin Equity Income Fund | | | Franklin Managed Income Fund | | | Franklin Real Return Fund | |
| | | | |
Reimbursement Plans: | | | | | | | | | | | | | | | | |
| | | | |
Class A | | | 0.25% | | | | 0.25% | | | | 0.35% | | | | 0.25% | |
| | | | |
Compensation Plans: | | | | | | | | | | | | | | | | |
| | | | |
Class C | | | 1.00% | | | | 1.00% | | | | 1.00% | | | | 0.65% | |
| | | | |
Class R | | | — | | | | 0.50% | | | | 0.50% | | | | — | |
For Franklin Managed Income Fund, the Board has set the current rate at 0.25% per year for Class A shares until further notice and approval by the Board.
d. Sales Charges/Underwriting Agreements
Front-end sales charges and contingent deferred sales charges (CDSC) do not represent expenses of the Funds. These charges are deducted from the proceeds of sales of fund shares prior to investment or from redemption proceeds prior to remittance, as applicable. Distributors has advised the Funds of the following commission transactions related to the sales and redemptions of the Funds’ shares for the year:
| | | | | | | | | | | | | | | | |
| | | Franklin Convertible Securities Fund | | | Franklin Equity Income Fund | | | Franklin Managed Income Fund | | | Franklin Real Return Fund | |
Sales charges retained net of commissions paid to unaffiliated brokers/dealers | | | $68,084 | | | | $355,632 | | | | $534,845 | | | | $2,878 | |
CDSC retained | | | $48,941 | | | | $ 13,576 | | | | $ 24,468 | | | | $ 790 | |
Effective March 1, 2019, certain front-end sales charges on Class A were lowered for Franklin Real Return Fund. Further details are disclosed in the Funds’ Prospectus.
e. Transfer Agent Fees
Each class of shares pays transfer agent fees to Investor Services for its performance of shareholder servicing obligations. The fees are based on an annualized asset based fee of 0.02% plus a transaction based fee. In addition, each class reimburses Investor Services for out of pocket expenses incurred and, except for Class R6, reimburses shareholder servicing fees paid to third parties. These fees are allocated daily based upon their relative proportion of such classes’ aggregate net assets. Class R6 pays Investor Services transfer agent fees specific to that class.
| | | | |
| | | |
84 | | Annual Report | | franklintempleton.com |
FRANKLIN INVESTORS SECURITIES TRUST
NOTES TO FINANCIAL STATEMENTS
For the year ended October 31, 2019, the Funds paid transfer agent fees as noted in the Statements of Operations of which the following amounts were retained by Investor Services:
| | | | | | | | | | | | | | | | |
| | | Franklin
Convertible
Securities Fund | | | Franklin Equity
Income Fund | | | Franklin Managed
Income Fund | | | Franklin Real
Return Fund | |
| | | | |
Transfer agent fees | | | $1,306,047 | | | | $1,007,964 | | | | $1,537,459 | | | | $153,149 | |
f. Investments in Affiliated Management Investment Companies
Certain or all Funds invest in one or more affiliated management investment companies for purposes other than exercising a controlling influence over the management or policies. Management fees paid by the Funds are waived on assets invested in the affiliated management investment companies, as noted in the Statements of Operations, in an amount not to exceed the management and administrative fees paid directly or indirectly by each affiliate. During the year ended October 31, 2019, investments in affiliated management investment companies were as follows:
| | | | | | | | | | | | | | | | | | | | | | | | | | | | | | | | |
| | | Value at
Beginning of Year | | | Purchases | | | Sales | | | Realized
Gain (Loss) | | | Net Change in Unrealized Appreciation (Depreciation) | | | Value at End of Year | | | Number of Shares Held at End of Year | | | Investment Income | |
Franklin Convertible Securities Fund | | | | | | | | | | | | | | | | | | | | | | | | | | | | | | | | |
| | | | | | | | |
Non-Controlled Affiliates | | | | | | | | | | | | | | | | | | | | | | | | | | | | | | | | |
| | | | | | | | | | | | | | | | | | | | | | | | | | | | | | | Dividends | |
Institutional Fiduciary Trust Money Market Portfolio, 1.56% | | $ | 163,242,682 | | | $ | 891,386,105 | | | $ | (964,719,130 | ) | | $ | — | | | $ | — | | | $ | 89,909,657 | | | | 89,909,657 | | | | $2,673,614 | |
| | | | | | | | |
Franklin Equity Income Fund | | | | | | | | | | | | | | | | | | | | | | | | | | | | | | | | |
| | | | | | | | |
Non-Controlled Affiliates | | | | | | | | | | | | | | | | | | | | | | | | | | | | | | | | |
| | | | | | | | | | | | | | | | | | | | | | | | | | | | | | | Dividends | |
Institutional Fiduciary Trust Money Market Portfolio, 1.56% | | $ | 70,527,817 | | | $ | 440,294,825 | | | $ | (441,233,975 | ) | | $ | — | | | $ | — | | | $ | 69,588,667 | | | | 69,588,667 | | | | $ 777,035 | |
| | | | | | | | |
Franklin Managed Income Fund | | | | | | | | | | | | | | | | | | | | | | | | | | | | | | | | |
| | | | | | | | |
Controlled Affiliates | | | | | | | | | | | | | | | | | | | | | | | | | | | | | | | | |
| | | | | | | | | | | | | | | | | | | | | | | | | | | | | | | Dividends | |
| | | | | | | | |
Franklin FTSE Europe Hedged ETF | | $ | 32,123,250 | | | $ | — | | | $ | (29,576,550 | ) | | $ | (4,136,075 | ) | | $ | 1,589,375 | | | $ | — | a | | | — | | | | $2,829,290 | b |
| | | | | | | | |
Franklin FTSE Japan Hedged ETF | | | 30,808,000 | | | | — | | | | (28,417,805 | ) | | | (4,455,070 | ) | | | 2,064,875 | | | | — | a | | | — | | | | 1,557,566 | b |
| | | | | | | | |
Franklin Liberty U.S. Low Volatility ETF | | | — | | | | 36,607,500 | | | | — | | | | — | | | | (10,700 | ) | | | 36,596,800 | | | | 1,000,000 | | | | — | |
Total Controlled Affiliates | | $ | 62,931,250 | | | $ | 36,607,500 | | | $ | (57,994,355 | ) | | $ | (8,591,145 | ) | | $ | 3,643,550 | | | $ | 36,596,800 | | | | | | | | $4,386,856 | |
| | | | | | | | |
Non-Controlled Affiliates | | | | | | | | | | | | | | | | | | | | | | | | | | | | | | | | |
| | | | | | | | | | | | | | | | | | | | | | | | | | | | | | | Dividends | |
Institutional Fiduciary Trust Money Market Portfolio, 1.56% | | $ | 126,683,009 | | | $ | 1,656,589,160 | | | $ | (1,451,603,229 | ) | | $ | — | | | $ | — | | | $ | 331,668,940 | | | | 331,668,940 | | | | $3,230,705 | |
| | | | |
| | | |
| franklintempleton.com | | Annual Report | | 85 |
FRANKLIN INVESTORS SECURITIES TRUST
NOTES TO FINANCIAL STATEMENTS
3. Transactions with Affiliates(continued)
f. Investments in Affiliated Management Investment Companies(continued)
| | | | | | | | | | | | | | | | | | | | | | | | | | | | | | | | |
| | | Value at Beginning of Year | | | Purchases | | | Sales | | | Realized Gain (Loss) | | | Net Change in Unrealized
Appreciation
(Depreciation) | | | Value at End of Year | | | Number of Shares Held at End of Year | | | Investment Income | |
| | | | | | |
Franklin Managed Income Fund(continued) | | | | | | | | | | | | | | | | | | | | | | | | | |
| | | | | | |
Non-Controlled Affiliates(continued) | | | | | | | | | | | | | | | | | | | | | | | | | |
| | | | | | | | | | | | | | | | | | | | | | | | | | | | | |
| Income from
securities
loaned |
|
| | | | | | | | |
Institutional Fiduciary Trust Money Market Portfolio, 1.56% | | $ | — | | | $ | 582,000 | | | $ | (582,000 | ) | | $ | — | | | $ | — | | | $ | — | | | | — | | | | $ 993 | |
| | | | | | | | |
TotalNon-Controlled Affiliates | | $ | 126,683,009 | | | $ | 1,657,171,160 | | | $ | (1,452,185,229 | ) | | $ | — | | | $ | — | | | $ | 331,668,940 | | | | | | | | $3,231,698 | |
| | | | | | | | |
Total Affiliated Securities | | $ | 189,614,259 | | | $ | 1,693,778,660 | | | $ | (1,510,179,584 | ) | | $ | (8,591,145 | ) | | $ | 3,643,550 | | | $ | 368,265,740 | | | | | | | | $7,618,554 | |
| | | | | | | | |
Franklin Real Return Fund | | | | | | | | | | | | | | | | | | | | | | | | | | | | | | | | |
| | | | | | | | |
Non-Controlled Affiliates | | | | | | | | | | | | | | | | | | | | | | | | | | | | | | | | |
| | | | | | | | |
| | | | | | | | | | | | | | | | | | | | | | | | | | | | | | | Dividends | |
| | | | | | | | |
Franklin Pelagos Commodities, Class R6 | | $ | 5,808,508 | | | $ | 504,877 | | | $ | (5,233,161 | ) | | $ | (1,271,716 | ) | | $ | 191,492 | | | $ | — | a | | | — | | | | $ 504,877 | |
aAs of October 31, 2019, no longer held by the fund.
bDividend income includes capital gain distributions received, if any, from underlying funds, and are presented in corresponding line item in the Statement of Operations.
g. Waiver and Expense Reimbursements
Effective March 1, 2019, Advisers and Investor Services have contractually agreed in advance to waive or limit their respective fees and to assume as their own expense certain expenses otherwise payable by Franklin Managed Income Fund so that the expenses (including acquired fund fees and expenses but excluding distribution fees, and certainnon-routine expenses or costs such as those relating to litigation, indemnification, reorganizations, and liquidations) for Class A, Class C, Class R, Advisor Class and for Class R6 of the Fund do not exceed 0.68% and 0.60% respectively, based on the average net assets of each class until February 29, 2020.
Advisers and Investor Services have contractually agreed in advance to waive or limit their respective fees and to assume as their own expense certain expenses otherwise payable by Franklin Real Return Fund so that the expenses (excluding distribution fees, acquired fund fees and expenses, and certainnon-routine expenses or costs, including those relating to litigation, indemnification, reorganizations, and liquidations) for Class A, Class C, Advisor Class and for Class R6 of the Fund do not exceed 0.60% and 0.44% respectively, based on the average net assets of each class until February 29, 2020. Prior to March 1, 2019 , expenses (excluding certain fees and expenses as previously disclosed) for Class A, Class C, Advisor Class were limited to 0.65%, and for Class R6 were limited to 0.49% based on the average net assets of each class.
Total expenses waived or paid are not subject to recapture subsequent to the Funds’ fiscal year end.
For Franklin Convertible Securities Fund and Franklin Equity Income Fund, Investor Services has contractually agreed in advance to waive or limit its fees so that the Class R6 transfer agent fees do not exceed 0.03% based on the average net assets of the class until February 29, 2020.
| | | | |
| | | |
86 | | Annual Report | | franklintempleton.com |
FRANKLIN INVESTORS SECURITIES TRUST
NOTES TO FINANCIAL STATEMENTS
h. Interfund Transactions
Franklin Managed Income Fund engaged in purchases and sales of investments with funds or other accounts that have common investment managers (or affiliated investment managers), directors, trustees or officers. During the year ended October 31, 2019, these purchase and sale transactions aggregated $0 and $11,512,500, respectively.
4. Expense Offset Arrangement
The Funds have entered into an arrangement with their custodian whereby credits realized as a result of uninvested cash balances are used to reduce a portion of the Funds’ custodian expenses. During the year ended October 31, 2019, the custodian fees were reduced as noted in the Statements of Operations.
5. Income Taxes
For tax purposes, capital losses may be carried over to offset future capital gains.
At October 31, 2019, the capital loss carryforwards were as follows:
| | | | |
| | | Franklin Real Return Fund | |
Capital loss carryforwards not subject to expiration: | | | | |
Short term | | | $ 1,105,810 | |
Long term | | | 32,425,869 | |
| | | | |
| |
Total capital loss carryforwards | | | $33,531,679 | |
| | | | |
The tax character of distributions paid during the years ended October 31, 2019 and 2018, was as follows:
| | | | | | | | | | | | | | | | |
| | | Franklin Convertible Securities Fund | | | Franklin Equity Income Fund | |
| | | | |
| | | 2019 | | | 2018 | | | 2019 | | | 2018 | |
Distributions paid from: | | | | | | | | | | | | | | | | |
Ordinary income | | $ | 120,285,792 | | | $ | 102,614,199 | | | $ | 51,918,486 | | | $ | 48,204,970 | |
Long term capital gain | | | 95,672,433 | | | | 108,553,843 | | | | 86,911,173 | | | | 54,052,701 | |
| | | | |
| | | | |
| | $ | 215,958,225 | | | $ | 211,168,042 | | | $ | 138,829,659 | | | $ | 102,257,671 | |
| | | | |
| | |
| | | Franklin Managed Income Fund | | | Franklin Real Return Fund | |
| | | | |
| | | 2019 | | | 2018 | | | 2019 | | | 2018 | |
Distributions paid from: | | | | | | | | | | | | | | | | |
Ordinary income | | $ | 115,713,153 | | | $ | 119,167,099 | | | $ | 2,546,501 | | | $ | 6,608,494 | |
Long term capital gain | | | 39,925,218 | | | | 43,679,233 | | | | — | | | | — | |
| | | | |
| | | | |
| | $ | 155,638,371 | | | $ | 162,846,332 | | | $ | 2,546,501 | | | $ | 6,608,494 | |
| | | | |
| | | | |
| | | |
| franklintempleton.com | | Annual Report | | 87 |
FRANKLIN INVESTORS SECURITIES TRUST
NOTES TO FINANCIAL STATEMENTS
5. Income Taxes(continued)
At October 31, 2019, the cost of investments, net unrealized appreciation (depreciation), undistributed ordinary income and undistributed long term capital gains for income tax purposes were as follows:
| | | | | | | | | | | | | | | | | | | | | | | | | | | | | | | | |
| | | Franklin
Convertible
Securities Fund | | | Franklin Equity
Income Fund | | | Franklin Managed
Income Fund | | | Franklin Real Return Fund | |
| | | | | | | | |
Cost of investments | | | | | | $ | 3,520,523,855 | | | | | | | $ | 1,813,104,636 | | | | | | | $ | 3,406,123,528 | | | | | | | $ | 147,437,947 | |
| | | | | | | | |
Unrealized appreciation | | | | | | $ | 492,578,155 | | | | | | | $ | 723,630,602 | | | | | | | $ | 439,801,226 | | | | | | | $ | 9,970,869 | |
| | | | | | | | |
Unrealized depreciation | | | | | | | (126,101,912 | ) | | | | | | | (27,441,540 | ) | | | | | | | (56,763,649 | ) | | | | | | | (4,964,198 | ) |
| | | | | | | | |
Net unrealized appreciation (depreciation) | | | | | | $ | 366,476,243 | | | | | | | $ | 696,189,062 | | | | | | | $ | 383,037,577 | | | | | | | $ | 5,006,671 | |
| | | | | | | | |
Distributable earnings: | | | | | | | | | | | | | | | | | | | | | | | | | | | | | | | | |
| | | | | | | | |
Undistributed ordinary income | | | | | | $ | 99,362,107 | | | | | | | $ | 4,704,910 | | | | | | | $ | 28,202,842 | | | | | | | $ | 2,421,057 | |
| | | | | | | | |
Undistributed long term capital gains | | | | | | | 189,246,596 | | | | | | | | 72,860,716 | | | | | | | | 116,031,806 | | | | | | | | — | |
| | | | | | | | |
Total distributable earnings | | | | | | $ | 288,608,703 | | | | | | | $ | 77,565,626 | | | | | | | $ | 144,234,648 | | | | | | | $ | 2,421,057 | |
Differences between income and/or capital gains as determined on a book basis and a tax basis are primarily due to differing treatments of bond discounts and premiums and equity-linked securities.
The Funds except Franklin Real Return Fund, utilized a tax accounting practice to treat a portion of the proceeds from capital shares redeemed as a distribution from realized capital gains.
6. Investment Transactions
Purchases and sales of investments (excluding short term securities) for the year ended October 31, 2019, were as follows:
| | | | | | | | | | | | | | | | |
| | | Franklin
Convertible
Securities Fund | | | Franklin Equity
Income Fund | | | Franklin Managed
Income Fund | | | Franklin Real
Return Fund | |
Purchases | | | $ 992,595,344 | | | | $650,283,553 | | | | $1,824,404,562 | | | | $58,439,077 | |
Sales | | | $1,163,763,934 | | | | $527,066,700 | | | | $1,787,670,583 | | | | $96,913,406 | |
7. Credit Risk
At October 31, 2019, Franklin Convertible Securities Fund and Franklin Managed Income Fund had 76.0% and 7.6%, respectively, of their portfolio invested in high yield securities, senior secured floating rate loans, or other securities rated below investment grade and unrated securities, if any. These securities may be more sensitive to economic conditions causing greater price volatility and are potentially subject to a greater risk of loss due to default than higher rated securities.
| | | | |
| | | |
88 | | Annual Report | | franklintempleton.com |
FRANKLIN INVESTORS SECURITIES TRUST
NOTES TO FINANCIAL STATEMENTS
8. Other Derivative Information
At October 31, 2019, investments in derivative contracts are reflected in the Statements of Assets and Liabilities as follows:
| | | | | | | | | | | | |
| | | Asset Derivatives | | | | | Liability Derivatives |
Derivative Contracts Not Accounted for as Hedging Instruments | | Statements of Assets and Liabilities Location | | Fair Value | | | | | Statements of Assets and Liabilities Location | | Fair Value |
| | | | | |
Franklin Managed Income Fund | | | | | | | | | | | | |
Equity contracts | | Investments in securities, at value | | | $16,610,000 | a | | | | Options written, at value | | $5,208,470 |
| | | | | | | | | | | | |
aPurchased option contracts are included in investments in securities, at value in the Statements of Assets and Liabilities.
For the year ended October 31, 2019, the effect of derivative contracts in the Statements of Operations was as follows:
| | | | | | | | | | |
Derivative Contracts Not Accounted for as Hedging Instruments | | Statements of Operations Location | | Net Realized Gain (Loss) for the Year | | | Statements of Operations Location | | Net Change in Unrealized Appreciation (Depreciation) for the Year |
| | | | |
| | Net realized gain (loss) from: | | | | | | Net change in unrealized | | |
| | | | | | | | appreciation (depreciation) on: | | |
Franklin Managed Income Fund | | | | | | | | | | |
Equity contracts | | Investments | | | $54,866,682 | a | | Investments | | $(36,050,683)a |
| | Written options | | | 10,555,397 | | | Written options | | 3,141,875 |
| | | | | | | | | | |
Totals | | | | | $65,422,079 | | | | | $(32,908,808) |
| | | | | | | | | | |
aPurchased option contracts are included in net realized gain (loss) from investments and net change in unrealized appreciation (depreciation) on investments in the Statements of Operations.
For the year ended October 31, 2019, the average month end notional amount of options contracts represented 5,850,300 shares.
See Note 1(d) regarding derivative financial instruments.
9. Upcoming Acquisitions/Reorganization
On July 17, 2019, the Board of Trustees of Franklin Investors Securities Trust approved a proposal to reorganize Franklin Real Return Fund with and into Franklin Total Return Fund, subject to approval by the shareholders of Franklin Real Return Fund.
10. Credit Facility
The Funds, together with other U.S. registered and foreign investment funds (collectively, Borrowers), managed by Franklin Templeton, are borrowers in a joint syndicated senior unsecured credit facility totaling $2 billion (Global Credit Facility) which matures on February 7, 2020. This Global Credit Facility provides a source of funds to the Borrowers for temporary and emergency purposes, including the ability to meet future unanticipated or unusually large redemption requests.
Under the terms of the Global Credit Facility, the Funds shall, in addition to interest charged on any borrowings made by the Funds and other costs incurred by the Funds, pay their share of fees and expenses incurred in connection with the implementation and maintenance of the Global Credit Facility, based upon their relative share of the aggregate net assets of
| | | | |
| | | |
| franklintempleton.com | | Annual Report | | 89 |
FRANKLIN INVESTORS SECURITIES TRUST
NOTES TO FINANCIAL STATEMENTS
10. Credit Facility(continued)
all of the Borrowers, including an annual commitment fee of 0.15% based upon the unused portion of the Global Credit Facility. These fees are reflected in other expenses in the Statements of Operations. During the year ended October 31, 2019, the Funds did not use the Global Credit Facility
11. Fair Value Measurements
The Funds follow a fair value hierarchy that distinguishes between market data obtained from independent sources (observable inputs) and the Funds’ own market assumptions (unobservable inputs). These inputs are used in determining the value of the Funds’ financial instruments and are summarized in the following fair value hierarchy:
| | • | | Level 1 – quoted prices in active markets for identical financial instruments |
| | • | | Level 2 – other significant observable inputs (including quoted prices for similar financial instruments, interest rates, prepayment speed, credit risk, etc.) |
| | • | | Level 3 – significant unobservable inputs (including the Funds’ own assumptions in determining the fair value of financial instruments) |
The input levels are not necessarily an indication of the risk or liquidity associated with financial instruments at that level.
A summary of inputs used as of October 31, 2019, in valuing the Funds’ assets and liabilities carried at fair value, is as follows:
| | | | | | | | | | | | | | | | |
| | | Level 1 | | | Level 2 | | | Level 3 | | | Total | |
Franklin Convertible Securities Fund | | | | | | | | | | | | | | | | |
Assets: | | | | | | | | | | | | | | | | |
Investments in Securities:a | | | | | | | | | | | | | | | | |
Equity Investmentsb | | $ | 780,227,356 | | | $ | — | | | $ | — | | | $ | 780,227,356 | |
Convertible Bonds | | | — | | | | 3,016,863,085 | | | | — | | | | 3,016,863,085 | |
Escrows and Litigation Trusts | | | — | | | | — | | | | — | c | | | — | |
Short Term Investments | | | 89,909,657 | | | | — | | | | — | | | | 89,909,657 | |
| | | | |
| | | | |
Total Investments in Securities | | $ | 870,137,013 | | | $ | 3,016,863,085 | | | $ | — | | | $ | 3,887,000,098 | |
| | | | |
| | | | |
Franklin Equity Income Fund | | | | | | | | | | | | | | | | |
Assets: | | | | | | | | | | | | | | | | |
Investments in Securities:a | | | | | | | | | | | | | | | | |
Equity Investmentsb | | $ | 2,215,227,758 | | | $ | — | | | $ | — | | | $ | 2,215,227,758 | |
Equity-Linked Securities | | | — | | | | 224,477,273 | | | | — | | | | 224,477,273 | |
Short Term Investments | | | 69,588,667 | | | | — | | | | — | | | | 69,588,667 | |
| | | | |
| | | | |
Total Investments in Securities | | $ | 2,284,816,425 | | | $ | 224,477,273 | | | $ | — | | | $ | 2,509,293,698 | |
| | | | |
| | | | |
| | | |
90 | | Annual Report | | franklintempleton.com |
FRANKLIN INVESTORS SECURITIES TRUST
NOTES TO FINANCIAL STATEMENTS
| | | | | | | | | | | | | | | | |
| | | Level 1 | | | Level 2 | | | Level 3 | | | Total | |
Franklin Managed Income Fund | | | | | | | | | | | | | | | | |
Assets: | | | | | | | | | | | | | | | | |
Investments in Securities:a | | | | | | | | | | | | | | | | |
Equity Investmentsb | | $ | 1,345,496,228 | | | $ | — | | | $ | — | | | $ | 1,345,496,228 | |
Equity-Linked Securities | | | — | | | | 444,437,147 | | | | — | | | | 444,437,147 | |
Convertible Bonds | | | — | | | | 15,451,562 | | | | — | | | | 15,451,562 | |
Corporate Bonds | | | — | | | | 1,295,750,470 | | | | — | | | | 1,295,750,470 | |
U.S. Government and Agency Securities | | | — | | | | 305,016,602 | | | | — | | | | 305,016,602 | |
Mortgage-Backed Securities | | | — | | | | 39,938,626 | | | | — | | | | 39,938,626 | |
Options Purchased | | | 16,610,000 | | | | — | | | | — | | | | 16,610,000 | |
Short Term Investments | | | 331,668,940 | | | | — | | | | — | | | | 331,668,940 | |
| | | | |
| | | | |
Total Investments in Securities | | $ | 1,693,775,168 | | | $ | 2,100,594,407 | | | $ | — | | | $ | 3,794,369,575 | |
| | | | |
| | | | |
Liabilities: | | | | | | | | | | | | | | | | |
Other Financial Instruments: | | | | | | | | | | | | | | | | |
Options Written | | $ | 5,208,470 | | | $ | — | | | $ | — | | | $ | 5,208,470 | |
| | | | |
| | | | |
Franklin Real Return Fund | | | | | | | | | | | | | | | | |
Assets: | | | | | | | | | | | | | | | | |
Investments in Securities:a | | | | | | | | | | | | | | | | |
Equity Investments | | $ | 32,155,315 | | | $ | — | | | $ | — | | | $ | 32,155,315 | |
U.S. Government and Agency Securities | | | — | | | | 112,307,897 | | | | — | | | | 112,307,897 | |
Short Term Investments | | | — | | | | 7,981,406 | | | | — | | | | 7,981,406 | |
| | | | |
| | | | |
Total Investments in Securities | | $ | 32,155,315 | | | $ | 120,289,303 | | | $ | — | | | $ | 152,444,618 | |
| | | | |
aFor detailed categories, see the accompanying Statement of Investments.
bIncludes common, preferred, convertible preferred stocks and management investment companies.
cIncludes securities determined to have no value at October 31, 2019.
A reconciliation of assets in which Level 3 inputs are used in determining fair value is presented when there are significant Level 3 financial instruments at the beginning and/or end of the year.
12. Subsequent Events
The Funds have evaluated subsequent events through the issuance of the financial statements and determined that no events have occurred that require disclosure other than those already disclosed in the financial statements.
Abbreviations
| | | | | | |
| Currency | | Counterparty |
| | | |
USD | | United States Dollar | | ADR | | American Depositary Receipt |
| | | | ETF | | Exchange Traded Fund |
| | | | FRN | | Floating Rate Note |
| | | | REIT | | Real Estate Investment Trust |
| | | | SPDR | | S&P Depositary Receipt |
| | | | |
| | | |
| franklintempleton.com | | Annual Report | | 91 |
FRANKLIN INVESTORS SECURITIES TRUST
Report of Independent Registered Public Accounting Firm
To the Board of Trustees of Franklin Investors Securities Trust and Shareholders of Franklin Convertible Securities Fund, Franklin Equity Income Fund, Franklin Managed Income Fund, and Franklin Real Return Fund.
Opinions on the Financial Statements
We have audited the accompanying statements of assets and liabilities, including the statements of investments, of Franklin Convertible Securities Fund, Franklin Equity Income Fund, Franklin Managed Income Fund, and Franklin Real Return Fund (the “Funds”) as of October 31, 2019, the related statements of operations for the year ended October 31, 2019, the statements of changes in net assets for each of the two years in the period ended October 31, 2019, including the related notes, and the financial highlights for each of the five years in the period ended October 31, 2019 (collectively referred to as the “financial statements”). In our opinion, the financial statements present fairly, in all material respects, the financial position of each of the Funds as of October 31, 2019, the results of each of their operations for the year then ended, the changes in each of their net assets for each of the two years in the period ended October 31, 2019 and each of the financial highlights for each of the five years in the period ended October 31, 2019 in conformity with accounting principles generally accepted in the United States of America.
Basis for Opinions
These financial statements are the responsibility of the Funds’ management. Our responsibility is to express an opinion on the Funds’ financial statements based on our audits. We are a public accounting firm registered with the Public Company Accounting Oversight Board (United States) (PCAOB) and are required to be independent with respect to the Funds in accordance with the U.S. federal securities laws and the applicable rules and regulations of the Securities and Exchange Commission and the PCAOB.
We conducted our audits of these financial statements in accordance with the standards of the PCAOB. Those standards require that we plan and perform the audit to obtain reasonable assurance about whether the financial statements are free of material misstatement, whether due to error or fraud.
Our audits included performing procedures to assess the risks of material misstatement of the financial statements, whether due to error or fraud, and performing procedures that respond to those risks. Such procedures included examining, on a test basis, evidence regarding the amounts and disclosures in the financial statements. Our audits also included evaluating the accounting principles used and significant estimates made by management, as well as evaluating the overall presentation of the financial statements. Our procedures included confirmation of securities owned as of October 31, 2019 by correspondence with the custodian, transfer agent and brokers; when replies were not received from brokers, we performed other auditing procedures. We believe that our audits provide a reasonable basis for our opinions.
PricewaterhouseCoopers LLP
San Francisco, California
December 17, 2019
We have served as the auditor of one or more investment companies in the Franklin Templeton Group of Funds since 1948.
| | | | |
| | | |
92 | | Annual Report | | franklintempleton.com |
FRANKLIN INVESTORS SECURITIES TRUST
Tax Information (unaudited)
Under Section 852(b)(3)(C) of the Internal Revenue Code, the Funds hereby report the maximum amount allowable but no less than the following amounts as long term capital gain dividends for the fiscal year ended October 31, 2019:
| | | | | | | | |
Franklin Convertible Securities Fund | | Franklin Equity Income Fund | | | Franklin Managed Income Fund | |
| |
| | |
$126,072,412 | | | $91,689,606 | | | | $49,684,072 | |
Under Section 871(k)(2)(C) of the Internal Revenue Code, the Funds hereby report the maximum amount allowable but no less than the following amounts as short term capital gain dividends for purposes of the tax imposed under Section 871(a)(1)(A) of the Internal Revenue Code for the fiscal year ended October 31, 2019:
| | | | |
Franklin Convertible Securities Fund | | Franklin Managed Income Fund | |
| |
| |
$36,701,091 | | | $3,242,808 | |
Under Section 854(b)(1)(A) of the Internal Revenue Code, the Funds hereby report the following percentage amounts of the ordinary income dividends as income qualifying for the dividends received deduction for the fiscal year ended October 31, 2019:
| | | | | | | | | | | | |
Franklin Convertible Securities Fund | | Franklin Equity Income Fund | | | Franklin Managed Income Fund | | | Franklin Real Return Fund | |
| |
| | | |
5.53% | | | 99.86% | | | | 30.48% | | | | 13.10% | |
Under Section 854(b)(1)(B) of the Internal Revenue Code, the Funds hereby report the maximum amount allowable but no less than the following amounts as qualified dividends for purposes of the maximum rate under Section 1(h)(11) of the Internal Revenue Code for the fiscal year ended October 31, 2019:
| | | | | | | | | | | | |
Franklin Convertible Securities Fund | | Franklin Equity Income Fund | | | Franklin Managed Income Fund | | | Franklin Real Return Fund | |
| |
| | | |
$9,723,388 | | | $58,198,638 | | | | $43,660,145 | | | | $851,654 | |
Distributions, including qualified dividend income, paid during calendar year 2019 will be reported to shareholders on Form1099-DIV bymid-February 2020. Shareholders are advised to check with their tax advisors for information on the treatment of these amounts on their individual income tax returns.
Under Section 871(k)(1)(C) of the Internal Revenue Code, the Funds hereby report the maximum amount allowable but no less than the following amounts as interest related dividends for purposes of the tax imposed under Section 871(a)(1)(A) of the Internal Revenue Code for the fiscal year ended October 31, 2019:
|
Franklin Convertible Securities Fund |
|
|
$17,181,474 |
| | | | |
| | | |
| franklintempleton.com | | Annual Report | | 93 |
FRANKLIN INVESTORS SECURITIES TRUST
Board Members and Officers
The name, year of birth and address of the officers and board members, as well as their affiliations, positions held with the Trust, principal occupations during at least the past five years and number of U.S. registered portfolios overseen in the Franklin Templeton fund complex, are shown below. Generally, each board member serves until that person’s successor is elected and qualified.
Independent Board Members
| | | | | | | | |
Name, Year of Birth and Address | | Position | | Length of Time Served | | Number of Portfolios in Fund Complex Overseen by Board Member* | | Other Directorships Held During at Least the Past 5 Years |
| | | | | |
Harris J. Ashton (1932) One Franklin Parkway San Mateo, CA 94403-1906 | | Trustee | | Since 1986 | | 135 | | Bar-S Foods (meat packing company) (1981-2010). |
|
| Principal Occupation During at Least the Past 5 Years: |
| Director of various companies; andformerly, Director, RBC Holdings, Inc. (bank holding company) (until 2002); and President, Chief Executive Officer and Chairman of the Board, General Host Corporation (nursery and craft centers) (until 1998). |
| | | | | |
Terrence J. Checki (1945)One Franklin Parkway San Mateo, CA 94403-1906 | | Trustee | | Since 2017 | | 114 | | Hess Corporation (exploration of oil and gas) (2014-present). |
| |
| Principal Occupation During at Least the Past 5 Years: | | |
| Member of the Council on Foreign Relations (1996-present); Member of the National Committee on U.S.-China Relations (1999-present); member of the Board of Trustees of the Economic Club of New York (2013-present); member of the Board of Trustees of the Foreign Policy Association (2005-present) and member of various other boards of trustees and advisory boards; andformerly, Executive Vice President of the Federal Reserve Bank of New York and Head of its Emerging Markets and Internal Affairs Group and Member of Management Committee (1995-2014); and Visiting Fellow at the Council on Foreign Relations (2014). |
| | | | | |
Mary C. Choksi (1950) One Franklin Parkway San Mateo, CA 94403-1906 | | Trustee | | Since 2014 | | 135 | | Avis Budget Group Inc. (car rental) (2007-present), Omnicom Group Inc. (advertising and marketing communications services) (2011-present) and White Mountains Insurance Group, Ltd. (holding company) (2017-present). |
|
| Principal Occupation During at Least the Past 5 Years: |
| Director of various companies; andformerly, Founder and Senior Advisor, Strategic Investment Group (investment management group) (2015-2017); Founding Partner and Senior Managing Director, Strategic Investment Group (1987–2015); Founding Partner and Managing Director, Emerging Markets Management LLC (investment management firm) (1987-2011); and Loan Officer/Senior Loan Officer/Senior Pension Investment Officer, World Bank Group (international financial institution) (1977-1987). |
| | | | | |
Edith E. Holiday (1952) One Franklin Parkway San Mateo, CA 94403-1906 | | Lead Independent Trustee | | Since 1998 and Lead Independent Trustee since March 2019 | | 135 | | Hess Corporation (exploration of oil and gas) (1993-present), Canadian National Railway (railroad) (2001-present), White Mountains Insurance Group, Ltd. (holding company) (2004-present), Santander Consumer USA Holdings, Inc. (consumer finance) (2016-present), RTI International Metals, Inc. (manufacture and distribution of titanium) (1999-2015) and H.J. Heinz Company (processed foods and allied products) (1994-2013). |
|
| Principal Occupation During at Least the Past 5 Years: |
| Director or Trustee of various companies and trusts; andformerly, Assistant to the President of the United States and Secretary of the Cabinet (1990-1993); General Counsel to the United States Treasury Department (1989-1990); and Counselor to the Secretary and Assistant Secretary for Public Affairs and Public Liaison-United States Treasury Department (1988-1989). |
| | | | |
| | | |
94 | | Annual Report | | franklintempleton.com |
FRANKLIN INVESTORS SECURITIES TRUST
Independent Board Members(continued)
| | | | | | | | |
Name, Year of Birth and Address | | Position | | Length of Time Served | | Number of Portfolios in Fund Complex Overseen by Board Member* | | Other Directorships Held During at Least the Past 5 Years |
| | | | | |
J. Michael Luttig (1954) One Franklin Parkway San Mateo, CA 94403-1906 | | Trustee | | Since 2009 | | 135 | | Boeing Capital Corporation (aircraft financing) (2006-2013). |
|
| Principal Occupation During at Least the Past 5 Years: |
| Executive Vice President, Counselor and Senior Advisor to Boeing Chairman and Board of Directors, The Boeing Company (aerospace company) (May 2019); andformerly, General Counsel and member of the Executive Council, The Boeing Company (2006-2019) and Federal Appeals Court Judge, U.S. Court of Appeals for the Fourth Circuit (1991-2006). |
| | | | | |
Larry D. Thompson (1945) One Franklin Parkway San Mateo, CA 94403-1906 | | Trustee | | Since 2007 | | 135 | | The Southern Company (energy company) (2014-present; previously 2010-2012), Graham Holdings Company (education and media organization) (2011-present) and Cbeyond, Inc. (business communications provider) (2010-2012). |
|
| Principal Occupation During at Least the Past 5 Years: |
| Director of various companies; Counsel, Finch McCranie, LLP (law firm) (2015-present); Independent Compliance Monitor and Auditor, Volkswagen AG (manufacturer of automobiles and commercial vehicles) (2017-present); John A. Sibley Professor of Corporate and Business Law, University of Georgia School of Law (2015-present; previously 2011-2012); andformerly, Executive Vice President -Government Affairs, General Counsel and Corporate Secretary, PepsiCo, Inc. (consumer products) (2012-2014); Senior Vice President - Government Affairs, General Counsel and Secretary, PepsiCo, Inc. (2004-2011); Senior Fellow of The Brookings Institution (2003-2004); Visiting Professor, University of Georgia School of Law (2004); and Deputy Attorney General, U.S. Department of Justice (2001-2003). |
Interested Board Members and Officers |
Name, Year of Birth and Address | | Position | | Length of Time Served | | Number of Portfolios in Fund Complex Overseen
by Board Member* | | Other Directorships Held During at Least the Past 5 Years |
| | | | | |
**Gregory E. Johnson (1961) One Franklin Parkway San Mateo, CA 94403-1906 | | Trustee | | Since 2013 | | 147 | | None |
|
| Principal Occupation During at Least the Past 5 Years: |
| Chairman of the Board, Member - Office of the Chairman, Director and Chief Executive Officer, Franklin Resources, Inc.; officer and/or director or trustee, as the case may be, of some of the other subsidiaries of Franklin Resources, Inc. and of 39 of the investment companies in Franklin Templeton; Vice Chairman, Investment Company Institute; andformerly, President, Franklin Resources, Inc. (1994-2015). |
| | | | | |
**Rupert H. Johnson, Jr. (1940) One Franklin Parkway San Mateo, CA 94403-1906 | | Chairman of the Board, Trustee and Vice President | | Chairman of the Board since 2013, Trustee since 1987 and Vice President since 1986 | | 135 | | None |
|
| Principal Occupation During at Least the Past 5 Years: |
| Vice Chairman, Member - Office of the Chairman and Director, Franklin Resources, Inc.; Director, Franklin Advisers, Inc.; and officer and/or director or trustee, as the case may be, of some of the other subsidiaries of Franklin Resources, Inc. and of 37 of the investment companies in Franklin Templeton. |
| | | | | |
Reema Agarwal (1974) One Franklin Parkway San Mateo, CA 94403-1906 | | Vice President | | Since April 2019 | | Not Applicable | | Not Applicable |
|
| Principal Occupation During at Least the Past 5 Years: |
| Senior Vice President, Franklin Advisers, Inc.; and officer of two of the investment companies in Franklin Templeton. |
| | | | |
| | | |
| franklintempleton.com | | Annual Report | | 95 |
FRANKLIN INVESTORS SECURITIES TRUST
Interested Board Members and Officers(continued)
| | | | | | | | |
Name, Year of Birth and Address | | Position | | Length of Time Served | | Number of Portfolios in Fund Complex Overseen
by Board Member* | | Other Directorships Held During at Least the Past 5 Years |
| | | | | |
Alison E. Baur (1964) One Franklin Parkway San Mateo, CA 94403-1906 | | Vice President | | Since 2012 | | Not Applicable | | Not Applicable |
|
| Principal Occupation During at Least the Past 5 Years: |
| Deputy General Counsel, Franklin Templeton; and officer of some of the other subsidiaries of Franklin Resources, Inc. and of 41 of the investment companies in Franklin Templeton. |
| | | | | |
Gaston Gardey (1967) One Franklin Parkway San Mateo, CA 94403-1906 | | Treasurer, Chief Financial Officer and Chief Accounting Officer | | Since 2009 | | Not Applicable | | Not Applicable |
|
| Principal Occupation During at Least the Past 5 Years: |
| Treasurer, U.S. Fund Administration & Reporting and officer of 24 of the investment companies in Franklin Templeton. |
| | | | | |
Aliya S. Gordon (1973) One Franklin Parkway San Mateo, CA 94403-1906 | | Vice President | | Since 2009 | | Not Applicable | | Not Applicable |
|
| Principal Occupation During at Least the Past 5 Years: |
| Senior Associate General Counsel, Franklin Templeton; Vice President and Secretary, Franklin Resources, Inc.; and officer of 41 of the investment companies in Franklin Templeton. |
| | | | | |
Steven J. Gray (1955) One Franklin Parkway San Mateo, CA 94403-1906 | | Vice President and Co- Secretary | | Vice President since 2009 andCo-Secretary since January 2019 | | Not Applicable | | Not Applicable |
|
| Principal Occupation During at Least the Past 5 Years: |
| Senior Associate General Counsel, Franklin Templeton; Vice President, Franklin Templeton Distributors, Inc. and FASA, LLC; and officer of 41 of the investment companies in Franklin Templeton. |
| | | | | |
Matthew T. Hinkle (1971) One Franklin Parkway San Mateo, CA 94403-1906 | | Chief Executive Officer – Finance and Administration | | Since 2017 | | Not Applicable | | Not Applicable |
| | |
| Principal Occupation During at Least the Past 5 Years: | | | | |
| Senior Vice President, Franklin Templeton Services, LLC; officer of 41 of the investment companies in Franklin Templeton; andformerly, Vice President, Global Tax (2012-April 2017) and Treasurer/Assistant Treasurer, Franklin Templeton (2009-2017). |
| | | | | |
Robert Lim (1948) One Franklin Parkway San Mateo, CA 94403-1906 | | Vice President –AML Compliance | | Since 2016 | | Not Applicable | | Not Applicable |
|
| Principal Occupation During at Least the Past 5 Years: |
| Vice President, Franklin Templeton Companies, LLC; Chief Compliance Officer, Franklin Templeton Distributors, Inc. and Franklin Templeton Investor Services, LLC; and officer of 41 of the investment companies in Franklin Templeton. |
| | | | |
| | | |
96 | | Annual Report | | franklintempleton.com |
FRANKLIN INVESTORS SECURITIES TRUST
Interested Board Members and Officers(continued)
| | | | | | | | |
Name, Year of Birth and Address | | Position | | Length of Time Served | | Number of Portfolios in Fund Complex Overseen
by Board Member* | | Other Directorships Held During at Least the Past 5 Years |
| | | | | |
Kimberly H. Novotny (1972) 300 S.E. 2nd Street Fort Lauderdale, FL 33301-1923 | | Vice President | | Since 2013 | | Not Applicable | | Not Applicable |
|
| Principal Occupation During at Least the Past 5 Years: |
| Senior Associate General Counsel, Franklin Templeton; Vice President and Corporate Secretary, Fiduciary Trust International of the South; Vice President, Templeton Investment Counsel, LLC; Assistant Secretary, Franklin Resources, Inc.; and officer of 41 of the investment companies in Franklin Templeton. |
| | | | | |
Edward D. Perks (1970) One Franklin Parkway San Mateo, CA 94403-1906 | | President and Chief Executive Officer – Investment Management | | Since December 2018 | | Not Applicable | | Not Applicable |
|
| Principal Occupation During at Least the Past 5 Years: |
| President and Director, Franklin Advisers, Inc.; and officer of eight of the investment companies in Franklin Templeton (since December 2018). |
| | | | | |
Robert C. Rosselot (1960) 300 S.E. 2nd Street Fort Lauderdale, FL 33301-1923 | | Chief Compliance Officer | | Since 2013 | | Not Applicable | | Not Applicable |
|
| Principal Occupation During at Least the Past 5 Years: |
| Director, Global Compliance, Franklin Templeton; Vice President, Franklin Templeton Companies, LLC; officer of 41 of the investment companies in Franklin Templeton; andformerly, Senior Associate General Counsel, Franklin Templeton (2007-2013); and Secretary and Vice President, Templeton Group of Funds (2004-2013). |
| | | | | |
Navid J. Tofigh (1972) One Franklin Parkway San Mateo, CA 94403-1906 | | Vice President | | Since 2015 | | Not Applicable | | Not Applicable |
|
| Principal Occupation During at Least the Past 5 Years: |
| Associate General Counsel and officer of 41 of the investment companies in Franklin Templeton. |
| | | | | |
Craig S. Tyle (1960) One Franklin Parkway San Mateo, CA 94403-1906 | | Vice President | | Since 2005 | | Not Applicable | | Not Applicable |
|
| Principal Occupation During at Least the Past 5 Years: |
| General Counsel and Executive Vice President, Franklin Resources, Inc.; and officer of some of the other subsidiaries of Franklin Resources, Inc. and of 41 of the investment companies in Franklin Templeton. |
| | | | | |
Lori A. Weber (1964) 300 S.E. 2nd Street Fort Lauderdale, FL 33301-1923 | | Vice President and Co- Secretary | | Vice President since 2011 andCo-Secretary since January 2019 | | Not Applicable | | Not Applicable |
|
| Principal Occupation During at Least the Past 5 Years: |
| Senior Associate General Counsel, Franklin Templeton; Assistant Secretary, Franklin Resources, Inc.; Vice President and Secretary, Templeton Investment Counsel, LLC; and officer of 41 of the investment companies in Franklin Templeton. |
| | | | |
| | | |
| franklintempleton.com | | Annual Report | | 97 |
FRANKLIN INVESTORS SECURITIES TRUST
*We base the number of portfolios on each separate series of the U.S. registered investment companies within the Franklin Templeton fund complex. These portfolios have a common investment manager or affiliated investment managers.
**Gregory E. Johnson is considered to be an interested person of the Fund under the federal securities laws due to his position as an officer and director of Franklin Resources, Inc. (Resources), which is the parent company of the Fund’s investment manager and distributor. Rupert H. Johnson, Jr. is considered to be an interested person of the Fund under the federal securities laws due to his position as an officer and director and major shareholder of Resources.
Note 1: Rupert H. Johnson, Jr. is the uncle of Gregory E. Johnson.
Note 2: Effective March 12, 2019, John B. Wilson ceased to be a trustee of the Trust.
Note 3: Officer information is current as of the date of this report. It is possible that after this date, information about officers may change.
The Sarbanes-Oxley Act of 2002 and Rules adopted by the Securities and Exchange Commission require the Fund to disclose whether the Fund’s Audit Committee includes at least one member who is an audit committee financial expert within the meaning of such Act and Rules. The Fund’s Board has determined that there is at least one such financial expert on the Audit Committee and has designated Mary C. Choksi as its audit committee financial expert. The Board believes that Ms. Choksi qualifies as such an expert in view of her extensive business background and experience. She currently serves as a director of Avis Budget Group, Inc. (2007-present) and formerly, Founder and Senior Advisor, Strategic Investment Group (1987 to 2017). Ms. Choksi has been a Member of the Fund’s Audit Committee since 2014. As a result of such background and experience, the Board believes that Ms. Choksi has acquired an understanding of generally accepted accounting principles and financial statements, the general application of such principles in connection with the accounting estimates, accruals and reserves, and analyzing and evaluating financial statements that present a breadth and level of complexity of accounting issues generally comparable to those of the Fund, as well as an understanding of internal controls and procedures for financial reporting and an understanding of audit committee functions. Ms. Choksi is an independent Board member as that term is defined under the relevant Securities and Exchange Commission Rules and Releases.
The Statement of Additional Information (SAI) includes additional information about the board members and is available, without charge, upon request. Shareholders may call (800) DIALBEN/342-5236 to request the SAI.
| | | | |
| | | |
98 | | Annual Report | | franklintempleton.com |
FRANKLIN INVESTORS SECURITIES TRUST
Shareholder Information
Proxy Voting Policies and Procedures
The Trust’s investment manager has established Proxy Voting Policies and Procedures (Policies) that the Trust uses to determine how to vote proxies relating to portfolio securities. Shareholders may view the Trust’s complete Policies online at franklintempleton.com. Alternatively, shareholders may request copies of the Policies free of charge by calling the Proxy Group collect at (954)527-7678 or by sending a written request to: Franklin Templeton Companies, LLC, 300 S.E. 2nd Street, Fort Lauderdale, FL 33301, Attention: Proxy Group. Copies of the Trust’s proxy voting records are also made available online at franklintempleton.com and posted on the U.S. Securities and Exchange Commission’s website at sec.gov and reflect the most recent12-month period ended June 30.
Quarterly Statement of Investments
The Trust files a complete statement of investments with the U.S. Securities and Exchange Commission for the first and third quarters for each fiscal year as an exhibit to its report on FormN-PORT. Shareholders may view the filed FormN-PORT by visiting the Commission’s website at sec.gov. The filed form may also be viewed and copied at the Commission’s Public Reference Room in Washington, DC. Information regarding the operations of the Public Reference Room may be obtained by calling(800) SEC-0330.
Householding of Reports and Prospectuses
You will receive each Fund’s financial reports every six months as well as an annual updated summary prospectus (prospectus available upon request). To reduce Fund expenses, we try to identify related shareholders in a household and send only one copy of the financial reports and summary prospectus. This process, called “householding,” will continue indefinitely unless you instruct us otherwise. If you prefer not to have these documents householded, please call us at (800)632-2301. At any time you may view current prospectuses/summary prospectuses and financial reports on our website. If you choose, you may receive these documents through electronic delivery.
| | | | |
| | | |
| franklintempleton.com | | Annual Report | | 99 |
This page intentionally left blank.
Authorized for distribution only when accompanied or preceded by a summary prospectus and/or prospectus. Investors should carefully consider a fund’s investment goals, risks, charges and expenses before investing. A prospectus contains this and other information; please read it carefully before investing.
To help ensure we provide you with quality service, all calls to and from our service areas are monitored and/or recorded.
| | | | | | |
 | | Annual Report and Shareholder Letter |
| | Franklin Investors Securities Trust |
| | Investment Manager | | Distributor | | Shareholder Services |
| | Franklin Advisers, Inc. | | Franklin Templeton Distributors, Inc. | | (800)632-2301 |
| | | | | (800) DIAL BEN®/342-5236 | | |
| | | | | franklintempleton.com | | |
| | |
| © 2019 Franklin Templeton Investments. All rights reserved. | | FIST1 A 12/19 |
(a) The Registrant has adopted a code of ethics that applies to its principal executive officers and principal financial and accounting officer.
(c) N/A
(d) N/A
(f) Pursuant to Item 13(a)(1), the Registrant is attaching as an exhibit a copy of its code of ethics that applies to its principal executive officers and principal financial and accounting officer.
| Item 3. | Audit Committee Financial Expert. |
(a)(1) The Registrant has an audit committee financial expert serving on its audit committee.
(2) The audit committee financial expert is Mary C. Choksi and she is “independent” as defined under the relevant Securities and Exchange Commission Rules and Releases.
| Item 4. | Principal Accountant Fees and Services. |
(a) Audit Fees
The aggregate fees paid to the principal accountant for professional services rendered by the principal accountant for the audit of the registrant’s annual financial statements or for services that are normally provided by the principal accountant in connection with statutory and regulatory filings or engagements were $448,298 for the fiscal year ended October 31, 2019 and $458,104 for the fiscal year ended October 31, 2018.
(b) Audit-Related Fees
There were no fees paid to the principal accountant for assurance and related services rendered by the principal accountant to the registrant that are reasonably related to the performance of the audit of the registrant’s financial statements and are not reported under paragraph (a) of Item 4.
There were no fees paid to the principal accountant for assurance and related services rendered by the principal accountant to the registrant’s investment adviser and any entity controlling, controlled by or under common control with the investment adviser that provides ongoing services to the registrant that are reasonably related to the performance of the audit of their financial statements.
(c) Tax Fees
There were no fees paid to the principal accountant for professional services rendered by the principal accountant to the registrant for tax compliance, tax advice and tax planning.
The aggregate fees paid to the principal accountant for professional services rendered by the principal accountant to the registrant’s investment adviser and any entity controlling, controlled by or under common control with the investment adviser that provides ongoing services to the registrant for tax compliance, tax advice and tax planning were $190,000 for the fiscal year ended October 31, 2019 and $194,500 for the fiscal year ended October 31, 2018. The services for which these fees were paid included tax compliance services related to year end, professional fees in connection with tax treatment of equipment lease transactions, professional fees in connection with an Indonesia withholding tax refund claim and tax consulting services related to the operating agreement and term sheet for the launch of a new fund.
(d) All Other Fees
The aggregate fees paid to the principal accountant for products and services rendered by the principal accountant to the registrant not reported in paragraphs (a)-(c) of Item 4 were $0 for the fiscal year ended October 31, 2019 and $7,209 for the fiscal year ended October 31, 2018. The services for which these fees were paid included review of materials provided to the fund Board in connection with the investment management contract renewal process.
The aggregate fees paid to the principal accountant for products and services rendered by the principal accountant to the registrant’s investment adviser and any entity controlling, controlled by or under common control with the investment adviser that provides ongoing services to the registrant not reported in paragraphs (a)-(c) of Item 4 were $160,144 for the fiscal year ended October 31, 2019 and $61,500 for the fiscal year ended October 31, 2018. The services for which
these fees were paid included valuation services related to fair value engagement, the issuance of an Auditors’ Certificate for South Korean regulatory shareholder disclosures, benchmarking services in connection with the ICI TA survey, account maintenance project and assets under management certification.
(e) (1) The registrant’s audit committee is directly responsible for approving the services to be provided by the auditors, including:
(i) pre-approval of all audit and audit related services;
(ii) pre-approval of allnon-audit related services to be provided to the Fund by the auditors;
(iii) pre-approval of allnon-audit related services to be provided to the registrant by the auditors to the registrant’s investment adviser or to any entity that controls, is controlled by or is under common control with the registrant’s investment adviser and that provides ongoing services to the registrant where thenon-audit services relate directly to the operations or financial reporting of the registrant; and
(iv) establishment by the audit committee, if deemed necessary or appropriate, as an alternative to committeepre-approval of services to be provided by the auditors, as required by paragraphs (ii) and (iii) above, of policies and procedures to permit such services to bepre-approved by other means, such as through establishment of guidelines or by action of a designated member or members of the committee; provided the policies and procedures are detailed as to the particular service and the committee is informed of each service and such policies and procedures do not include delegation of audit committee responsibilities, as contemplated under the Securities Exchange Act of 1934, to management; subject, in the case of (ii) through (iv), to any waivers, exceptions or exemptions that may be available under applicable law or rules.
(e) (2) None of the services provided to the registrant described in paragraphs (b)-(d) of Item 4 were approved by the audit committee pursuant to paragraph (c)(7)(i)(C) of Rule2-01 of regulationS-X.
(f) No disclosures are required by this Item 4(f).
(g) The aggregatenon-audit fees paid to the principal accountant for services rendered by the principal accountant to the registrant and the registrant’s investment adviser and any entity controlling, controlled by or under common control with the investment adviser that provides ongoing services to the registrant were $350,144 for the fiscal year ended October 31, 2019 and $263,209 for the fiscal year ended October 31, 2018.
(h) The registrant’s audit committee of the board has considered whether the provision ofnon-audit services that were rendered to the registrant’s investment adviser (not including anysub-adviser whose role is primarily portfolio management and is subcontracted with or overseen by another investment adviser), and any entity controlling, controlled by, or under common control with the investment adviser that provides ongoing services to the registrant that were notpre-approved
pursuant to paragraph (c)(7)(ii) of Rule2-01 of RegulationS-X is compatible with maintaining the principal accountant’s independence.
| Item 5. | Audit Committee of Listed Registrants. N/A |
| Item 6. | Schedule of Investments. N/A |
| Item 7. | Disclosure of Proxy Voting Policies and Procedures forClosed-End Management Investment Companies. N/A |
| Item 8. | Portfolio Managers ofClosed-End Management Investment Companies. N/A |
| Item 9. | Purchases of Equity Securities byClosed-End Management Investment Company and Affiliated Purchasers. N/A |
| Item 10. | Submission of Matters to a Vote of Security Holders. |
There have been no changes to the procedures by which shareholders may recommend nominees to the Registrant’s Board of Trustees that would require disclosure herein.
| Item 11. | Controls and Procedures. |
(a) Evaluation of Disclosure Controls and Procedures. The Registrant maintains disclosure controls and procedures that are designed to provide reasonable assurance that information required to be disclosed in the Registrant’s filings under the Securities Exchange Act of 1934, as amended, and the Investment Company Act of 1940 is recorded, processed, summarized and reported within the periods specified in the rules and forms of the Securities and Exchange Commission. Such information is accumulated and communicated to the Registrant’s management, including its principal executive officer and principal financial officer, as appropriate, to allow timely decisions regarding required disclosure. The Registrant’s management, including the principal executive officer and the principal financial officer, recognizes that any set of controls and procedures, no matter how well designed and operated, can provide only reasonable assurance of achieving the desired control objectives.
Within 90 days prior to the filing date of this Shareholder Report on FormN-CSR, the Registrant had carried out an evaluation, under the supervision and with the participation of the Registrant’s management, including the Registrant’s principal executive officer and the Registrant’s principal financial officer, of the effectiveness of the design and operation of the Registrant’s disclosure controls and procedures. Based on such evaluation, the Registrant’s principal executive officer and principal financial officer concluded that the Registrant’s disclosure controls and procedures are effective.
(b) Changes in Internal Controls. There have been no changes in the Registrant’s internal control over financial reporting that occurred during the period covered by this report that has materially affected, or is reasonably likely to materially affect the internal control over financial reporting.
| Item 12. | Disclosure of Securities Lending Activities forClosed-End Management Investment Company. N/A |
(a) (1) Code of Ethics
(a) (2) Certifications pursuant to Section 302 of the Sarbanes-Oxley Act of 2002 of Matthew T. Hinkle, Chief Executive Officer - Finance and Administration, and Gaston Gardey, Chief Financial Officer and Chief Accounting Officer
(b) Certifications pursuant to Section 906 of the Sarbanes-Oxley Act of 2002 of Matthew T. Hinkle, Chief Executive Officer - Finance and Administration, and Gaston Gardey, Chief Financial Officer and Chief Accounting Officer
SIGNATURES
Pursuant to the requirements of the Securities Exchange Act of 1934 and the Investment Company Act of 1940, the registrant has duly caused this report to be signed on its behalf by the undersigned, thereunto duly authorized.
| | |
| FRANKLIN INVESTORS SECURITIES TRUST |
| |
| By | | S\ MATTHEW T. HINKLE |
| | Matthew T. Hinkle |
| | Chief Executive Officer - Finance and Administration |
| Date | | December 31, 2019 |
Pursuant to the requirements of the Securities Exchange Act of 1934 and the Investment Company Act of 1940, this report has been signed below by the following persons on behalf of the registrant and in the capacities and on the dates indicated.
| | |
| By | | S\ MATTHEW T. HINKLE |
| | Matthew T. Hinkle |
| | Chief Executive Officer - Finance and Administration |
| Date | | December 31, 2019 |
| |
| By | | S\ GASTON GARDEY |
| | Gaston Gardey |
| | Chief Financial Officer and Chief Accounting Officer |
| Date | | December 31, 2019 |