UNITED STATES
SECURITIES AND EXCHANGE COMMISSION
Washington, DC 20549
FORM N-CSR
CERTIFIED SHAREHOLDER REPORT OF REGISTERED
MANAGEMENT INVESTMENT COMPANIES
Investment Company Act file number 811-04986
Franklin Investors Securities Trust
(Exact name of registrant as specified in charter)
One Franklin Parkway, San Mateo, CA 94403-1906
(Address of principal executive offices) (Zip code)
Craig S. Tyle, One Franklin Parkway, San Mateo, CA 94403-1906
(Name and address of agent for service)
Registrant’s telephone number, including area code: 650 312-2000
Date of fiscal year end: 10/31
Date of reporting period: 10/31/18
Item 1. Reports to Stockholders.

Franklin Templeton Investments
Successful investing begins with ambition. And achievement only comes when you reach for it. That’s why we continually strive to deliver better outcomes for investors. No matter what your goals are, our deep, global investment expertise allows us to offer solutions that can help.
During our more than 70 years of experience, we’ve managed through all kinds of markets—up, down and those in between. We’re always preparing for what may come next. It’s because of this, combined with our strength as one of the world’s largest asset managers that we’ve earned the trust of millions of investors around the world.
Dear Fellow Shareholder:
The 12 months ended October 31, 2018, benefited from mostly upbeat economic data as corporate earnings increased, the U.S. job market continued to improve and the unemployment rate declined.
Under new chairman Jerome Powell, the U.S. Federal Reserve (Fed) increased its federal funds rate by 0.25% three times in 2018, after a 0.25% increase in December 2017, bringing the rate from 1.25% to 2.25% by period-end. In September, the Fed cited business investment and household spending growth as more evidence of economic strength. The Fed noted inflation remained stable and longer-term inflation expectations had changed little. The 10-year U.S. Treasury yield began the period at 2.38% and ended the period at 3.15%.
In September 2018, the Standard & Poor’s 500® Index (S&P 500®) reached an all-time high, but experienced heightened volatility near period-end due to investor concerns about Fed interest-rate policies, higher U.S. Treasury yields, trade tensions, a potentially slower economy and some weaker-than-expected fourth-quarter 2018 revenue guidance. In this environment, U.S. securities, as measured by the S&P 500, increased 7.35%,1 representing a change in this total return index level from 5,002.03 to 5,369.49.2 Investment-grade
bonds, as measured by the Bloomberg Barclays U.S. Aggregate Bond Index, decreased 2.05%,1 representing a change in this total return index level from 2,039.64 to 1,997.76.3
We are committed to our long-term perspective and disciplined investment approach as we conduct a rigorous, fundamental analysis of securities with a regular emphasis on investment risk management.
We believe active, professional investment management serves investors well. We also recognize the important role of financial advisors in today’s markets and encourage investors to continue to seek their advice. Amid changing markets and economic conditions, we are confident investors with a well-diversified portfolio and a patient, long-term outlook should be well positioned for the years ahead.
Franklin Investors Securities Trust’s annual report, covering Franklin Balanced Fund, Franklin Convertible Securities Fund, Franklin Equity Income Fund and Franklin Real Return Fund, includes more detail about prevailing conditions and a discussion about investment decisions during the period. Please remember all securities markets fluctuate, as do mutual fund share prices.
1. Source: Morningstar.
2. Source: Copyright © 2018, S&P Dow Jones Indices LLC. All rights reserved. The index levels for the S&P 500 shown above are based on total returns, which include reinvestment of any income or distributions.
3. Source: Bloomberg Barclays Indices. The index levels for the Bloomberg Barclays U.S. Aggregate Bond Index shown above are based on total returns, which include reinvestment of any income or distributions.
The indexes are unmanaged and include reinvestment of any income or distributions.
See www.franklintempletondatasources.com for additional data provider information.
| | | | | | | | |
| | | | Not FDIC Insured | | | May Lose Value | | | No Bank Guarantee |
| | | | |
| | | |
franklintempleton.com | | Not part of the annual report | | 1 |
We thank you for investing with Franklin Templeton, welcome your questions and comments, and look forward to serving your future investment needs.
Sincerely,

Rupert H. Johnson, Jr.
Chairman
Franklin Investors Securities Trust
This letter reflects our analysis and opinions as of October 31, 2018, unless otherwise indicated. The information is not a complete analysis of every aspect of any market, country, industry, security or fund. Statements of fact are from sources considered reliable.
Contents
Visit franklintempleton.com for fund updates, to access your account, or to find helpful financial planning tools.
| | | | |
| | | |
| 2 | | Not part of the annual report | | franklintempleton.com |
Annual Report
Economic and Market Overview
The U.S. economy grew during the 12 months under review. The economy grew faster in 2018’s second quarter, driven by consumer spending, business investment, exports and government spending, but moderated in the third quarter due to declines in exports and housing investment. The manufacturing and services sectors expanded during the period. The unemployment rate declined from 4.1% in October 2017, as reported at the beginning of the 12-month period, to a nearly 49-year low of 3.7% at period-end.1 Annual inflation, as measured by the Consumer Price Index, increased from 2.0% in October 2017, as reported at the beginning of the period, to 2.5% at period-end.1
The U.S. Federal Reserve (Fed) raised its target range for the federal funds rate 0.25% at its December 2017 meeting and continued to reduce its balance sheet as part of its ongoing plan to normalize monetary policy. In his congressional testimonies in February and July 2018, as well as at the Fed symposium in August, Fed Chair Jerome Powell reiterated the Fed’s intention to gradually raise interest rates. As widely expected, the Fed further raised its target range for the federal funds rate 0.25% each at its March, June and September 2018 meetings, to 2.00%–2.25%. At its September meeting, the Fed raised its forecast for U.S. economic growth in 2018 and 2019 and projected one more rate increase in 2018. Minutes from the Fed’s September meeting (released in October) indicated that a few officials expected monetary policy to become modestly restrictive of economic growth, while some officials seemed to favor increasing the federal funds rate temporarily above what they consider to be its longer-term level to reduce the risk of overshooting the Fed’s inflation objective. In contrast, some officials indicated they would not favor a restrictive policy unless they see clear signs of an overheating economy and rising inflation.
U.S. equity markets overall rose during the period, benefiting from mostly upbeat economic data, and better U.S. corporate earnings, as well as the passage of the U.S. tax reform bill. After reaching record highs in January 2018, U.S. stocks declined amid concerns that strong economic growth and rising inflation would lead the Fed to increase its target rate faster than expected, as well as fears of tighter regulation of information technology and technology-related companies. Other factors that curbed investor sentiment included tensions
between the U.S. and North Korea at certain times during the period, political uncertainties in the U.S., the Trump administration’s protectionist policies, and the potential impact of escalating U.S.-China trade tensions on global growth and corporate earnings. Partially offsetting these concerns were an overall easing of tensions in the Korean peninsula in the latter part of the period, intermittent U.S.-China trade negotiations, an agreement between the U.S. and the European Union to try to reduce trade barriers, and a trade deal between the U.S., Mexico and Canada. After reaching a new all-time high in September 2018, the broad U.S. stock market, as measured by the Standard & Poor’s 500 Index (S&P 500), experienced heightened volatility in October amid investor concerns about the Fed’s interest-rate path, rising U.S. Treasury yields, trade, a potentially moderating economy and several big companies’ weaker-than-expected fourth-quarter 2018 revenue guidance. In this environment, the S&P 500 generated a +7.35% total return for the 12-month period.2
The foregoing information reflects our analysis and opinions as of October 31, 2018. The information is not a complete analysis of every aspect of any market, country, industry, security or fund. Statements of fact are from sources considered reliable.
1. Source: U.S. Bureau of Labor Statistics.
2. Source: Morningstar.
| See | www.franklintempletondatasources.com for additional data provider information. |
| | | | |
| | | |
franklintempleton.com | | Annual Report | | 3 |
Franklin Balanced Fund
This annual report for Franklin Balanced Fund covers the fiscal year ended October 31, 2018.
Your Fund’s Goal and Main Investments
The Fund seeks both income and capital appreciation by investing in a diversified portfolio of stocks (substantially dividend paying), convertible securities and debt securities. The Fund normally invests at least 25% of its total assets in debt securities, including bonds, notes, debentures and money market securities, and at least 25% of its total assets in equity securities, primarily common and preferred stock.
Portfolio Composition*
10/31/18
| | |
| | | % of Total
Net Assets |
| |
Stocks | | 56.2% |
Common Stocks | | 40.5% |
Equity-Linked Securities | | 10.6% |
Management Investment Companies | | 1.9% |
Options Purchased | | 1.9% |
Index-Linked Notes | | 1.0% |
Convertible Preferred Stocks | | 0.3% |
| |
Bonds | | 39.2% |
Corporate Bonds | | 33.7% |
U.S. Government and Agency Securities | | 5.2% |
Convertible Bonds | | 0.3% |
| |
Short-Term Investments & Other Net Assets** | | 4.6% |
*Figures reflect certain derivatives held in the portfolio (or their underlying reference assets) and may not total 100% or may be negative due to rounding, use of derivatives, unsettled trades or other factors.
**Includes money market funds and other net assets (including derivatives).
Performance Overview
For the 12 months under review, the Fund’s Class A shares posted a cumulative total return of +0.89%. In comparison, the Fund’s equity benchmark, the Standard & Poor’s 500 Index (S&P 500), which is a broad measure of U.S. stock performance, generated a +7.25% total return.1 The Fund’s fixed income benchmark, the Bloomberg Barclays U.S. Aggregate Bond Index, which tracks the U.S. investment-grade, taxable bond market, had a -2.05% total return.1 You can find the Fund’s long-term performance data in the Performance Summary beginning on page 8.
Performance data represent past performance, which does not guarantee future results. Investment return and principal value will fluctuate, and you may have a gain or loss when you sell your shares. Current performance may differ from figures shown. For most recent month-end performance, go to franklintempleton.com or call (800) 342-5236.
Investment Strategy
We apply a bottom-up approach to investing in individual securities. We will assess the market price of a company’s securities relative to our evaluation of the company’s long-term earnings, asset value and cash flow potential. We also consider a company’s price/earnings ratio, profit margins and liquidation value. In determining an optimal mix of equity and fixed income investments for the Fund, we assess changing economic, market and industry conditions. The Fund seeks income by investing in a combination of corporate, agency and government bonds issued in the US and other countries, as well as common stocks and convertible securities. The Fund seeks capital appreciation by investing in equity securities and convertible securities of companies from a variety of industries. For purposes of pursuing the Fund’s investment goal, we may from time to time enter into various equity-related transactions involving derivative instruments, including put and call options on equity securities and equity indexes. We may also enter into equity-related derivatives transactions to hedge against market risk, to earn income, to gain or increase exposure to certain equity securities or segments of the equity markets or to otherwise enhance Fund returns.
|
What are put and call options? A put option is a contract giving the owner the right, but not the obligation, to sell a specified amount of an underlying security at a specified price within a specified time. Put options are most commonly used to protect against the decline of a stock price below a certain price. Conversely, a call option gives the holder the right to buy shares at a specified price within a specified time, regardless of the price in the future before the expiration date. If the stock price rises, the holder of the call option has the right to buy at the agreed-upon price, which could be lower. |
Manager’s Discussion
Consistent with the Fund’s long-term strategy of investing across asset classes to seek to generate attractive income, while
1. Source: Morningstar.
The indexes are unmanaged and include reinvestment of any income or distributions. One cannot invest directly in an index, and an index is not representative of the Fund’s portfolio.
The dollar value, number of shares or principal amount, and names of all portfolio holdings are listed in the Fund’s Statement of Investments (SOI). The SOI begins on page 38.
| | | | |
| | | |
4 | | Annual Report | | franklintempleton.com |
FRANKLIN BALANCED FUND
seeking opportunities for capital appreciation, performance was supported by healthy diversification and a positive overall contribution from the Fund’s equity holdings, while our fixed income position detracted from results. During the 12 months under review, our actions and movements in equity and fixed income markets resulted in a decline in equity holdings from 61.2% to 56.2% of total net assets, and a rise in fixed income holdings from 33.0% to 39.2%. Our cash position decreased from 5.8% to 4.6% of total net assets. The flexibility to use market volatility to invest in different asset classes remains a core strategy of the Fund.
Dividend Distributions*
11/1/17–10/31/18
| | | | | | | | | | | | | | | | | | | | |
| | | Dividend per Share (cents) | |
| Month | | Class A | | | Class C | | | Class R | | | Class R6 | | | Advisor Class | |
November | | | 3.00 | | | | 2.25 | | | | 2.74 | | | | 3.34 | | | | 3.25 | |
December** | | | 5.36 | | | | 4.59 | | | | 5.10 | | | | 5.71 | | | | 5.61 | |
January | | | 3.00 | | | | 2.23 | | | | 2.74 | | | | 3.35 | | | | 3.25 | |
February | | | 3.00 | | | | 2.23 | | | | 2.74 | | | | 3.35 | | | | 3.25 | |
March | | | 3.00 | | | | 2.22 | | | | 2.73 | | | | 3.36 | | | | 3.26 | |
April | | | 3.00 | | | | 2.22 | | | | 2.73 | | | | 3.36 | | | | 3.26 | |
May | | | 3.00 | | | | 2.22 | | | | 2.73 | | | | 3.36 | | | | 3.26 | |
June | | | 3.00 | | | | 2.27 | | | | 2.74 | | | | 3.35 | | | | 3.25 | |
July | | | 3.00 | | | | 2.27 | | | | 2.74 | | | | 3.35 | | | | 3.25 | |
August | | | 3.00 | | | | 2.27 | | | | 2.74 | | | | 3.35 | | | | 3.25 | |
September | | | 3.00 | | | | 2.25 | | | | 2.74 | | | | 3.34 | | | | 3.25 | |
October | | | 3.00 | | | | 2.25 | | | | 2.74 | | | | 3.34 | | | | 3.25 | |
Total | | | 38.36 | | | | 29.27 | | | | 35.21 | | | | 42.56 | | | | 41.39 | |
*The distribution amount is the sum of all net investment income distributions for the period shown. All Fund distributions will vary depending upon current market conditions, and past distributions are not indicative of future trends.
**Includes an additional 2.36 cent per share distribution to meet excise tax requirements.
We reduced our equity exposure amid continued strong performance in 2018 and our assessment of relative value versus other asset classes. We substantially trimmed our energy and industrial holdings, and we found select opportunities to build on our information technology (IT) holdings amid volatility toward the end of the period.
The Fund’s equity holdings in the IT, health care and energy sectors led returns. Within the IT sector, our investments in Apple, Microsoft and Cisco Systems benefited performance. Apple reported solid results for its fiscal second and third quarters (ended March and June, respectively), supported by strong growth in services and higher average selling price for
Top Five Equity Holdings
10/31/18
| | |
Company Sector/Industry | | % of Total
Net Assets |
Apple Inc. Information Technology | | 2.5% |
Analog Devices Inc. Information Technology | | 2.0% |
Microsoft Corp. Information Technology | | 1.9% |
The Procter & Gamble Co. Consumer Staples | | 1.9% |
Wells Fargo & Co. Financials | | 1.7% |
iPhones, and issued strong guidance for its fiscal fourth quarter (ended September). Near period-end, the company revealed its latest lineup of products, which included new Apple Watch and iPhone models. Microsoft reported robust quarterly results during the period, supported by solid demand for its suite of office and cloud-based products, as well as its cloud services. The company is a beneficiary of strong sales execution, a positive enterprise IT spending environment, its status as a critical partner to IT departments in this time of digital transformation, and a large installed base that it is successfully moving to higher-value cloud and Service-as-a-Software (SaaS) deployments. In the consumer market, the company continued to deliver new value into the declining personal computer market, while generating growth in gaming. Cisco benefited from strong demand across most segments of its business including infrastructure, applications and security. In addition, the company continued to execute on key shareholder initiatives of share buybacks and dividends aided by the repatriation and corporate tax reforms earlier this year.
Health care sector contributors included Pfizer and Eli Lilly2. Successful new products in large markets helped results for Pfizer, while Eli Lilly benefited from strong revenue growth and operating margin performance driven in part by several fast growing products including Trulicity, Taltz, and Basaglar.
Anadarko Petroleum2 and Royal Dutch Shell were notable energy sector contributors. Anadarko Petroleum reported strong results in the improved commodity environment amid a shifting focus from production growth to delivering free cash flow back to shareholders. Royal Dutch Shell benefited from continued cost reductions, modest production growth and progress on asset sales as they integrate BG Group.
2. Not held at period-end.
| | | | |
| | | |
| franklintempleton.com | | Annual Report | | 5 |
FRANKLIN BALANCED FUND
Conversely, the Fund’s equity holdings in the materials and industrials sectors detracted from performance. Notable detractors included General Electric and General Dynamics in the industrials sector and BASF and DowDuPont in the materials sector. General Electric (GE) was a major detractor during the period as cash flow eroded from weak fundamentals, causing the company to cut its dividend in half early in the period. General Dynamics was plagued by weakness in its Aerospace segment which included disappointing results in its Gulfstream corporate jet business. Germany-based chemical manufacturer BASF struggled to offset higher input costs, while DowDuPont underperformed in advance of its split into three distinct businesses—materials, agriculture and specialty chemicals—scheduled for 2019.
Fixed income returns were challenged for the year as interest rates increased across the yield curve. The Bloomberg Barclays U.S. Aggregate Index performed better than our fixed income holdings during the year as our portfolio was weighted more heavily in the corporate bonds category that lagged the overall index. As U.S. Treasury yields increased, we added to our exposure to U.S. Treasury securities based on our assessment of relative value within fixed income. Short-dated U.S. government securities were positive contributors during the period. The Fund’s investment-grade corporate exposure was negatively impacted by rising interest rates over the course of the year. We trimmed our exposures to the utilities and information technology sectors, while adding to the communication services sector and consumer cyclical companies based on broader credit market weakness.
Among the Fund’s corporate fixed income exposures, holdings in banking companies and in consumer cyclical and consumer non-cyclical companies detracted from performance.3 Among these holdings, longer-duration securities tended to underperform the most, including companies such as Anheuser-Busch Inbev, Clorox, Citigroup and Wells Fargo, that were challenged during the year. Other notable detractors were Capital One Financial, Morgan Stanley and Wynn Resorts.
Conversely, the Fund’s key fixed income contributors were in the energy and health care sectors, with high-yield issuers such as oil service companies Nabors Industries and Weatherford
Top Five Fixed Income Holdings
10/31/18
| | |
Company Sector/Industry | | % of Total
Net Assets |
U.S. Treasury Note U.S. Government and Agency Securities | | 5.2% |
Morgan Stanley Financials | | 1.0% |
Amazon.com Inc. Consumer Discretionary | | 1.0% |
Citigroup Inc. Financials | | 0.8% |
Costco Wholesale Corp. Consumer Staples | | 0.9% |
International2, Bausch Health (formerly Valeant Pharmaceuticals) and Endo Finance2 leading the way. Nabors Industries and Weatherford International benefited as crude oil prices recovered and drilling activity started to pick up. Bausch Health, formerly Valeant Pharmaceuticals, posted results well ahead of expectations, driven by positive revenue growth across most segments including Bausch, Salix, Ortho Dermatologics and Diversified Products. Endo International, a branded and generic pharmaceuticals company, benefited from strength in its base business as well as several competitive threats which have thus far failed to materialize. Other individual contributors included communication services companies Sprint Spectrum and Charter Communications and electric utility companies Intergen2 and PSEG Power.
3. Banking companies are in financials in the fixed income section of the SOI. Consumer cyclical companies are in the consumer discretionary, consumer staples and health care sectors in the fixed income section of the SOI. Consumer non-cyclical companies are in the consumer discretionary, consumer staples and health care sectors in the fixed income section of the SOI.
See www.franklintempletondatasources.com for additional data provider information.
| | | | |
| | | |
| 6 | | Annual Report | | franklintempleton.com |
FRANKLIN BALANCED FUND
Thank you for your continued participation in Franklin Balanced Fund. We look forward to serving your future investment needs.
| | |
 | | 
Edward D. Perks, CFA |
| |
| | Alan E. Muschott, CFA Shawn Lyons, CFA Todd Brighton, CFA |
| |
| | Portfolio Management Team |
The foregoing information reflects our analysis, opinions and portfolio holdings as of October 31, 2018, the end of the reporting period. The way we implement our main investment strategies and the resulting portfolio holdings may change depending on factors such as market and economic conditions. These opinions may not be relied upon as investment advice or an offer for a particular security. The information is not a complete analysis of every aspect of any market, country, industry, security or the Fund. Statements of fact are from sources considered reliable, but the investment manager makes no representation or warranty as to their completeness or accuracy. Although historical performance is no guarantee of future results, these insights may help you understand our investment management philosophy.
CFA® is a trademark owned by CFA Institute.
| | | | |
| | | |
| franklintempleton.com | | Annual Report | | 7 |
FRANKLIN BALANCED FUND
Performance Summary as of October 31, 2018
The performance tables and graphs do not reflect any taxes that a shareholder would pay on Fund dividends, capital gain distributions, if any, or any realized gains on the sale of Fund shares. Total return reflects reinvestment of the Fund’s dividends and capital gain distributions, if any, and any unrealized gains or losses. Your dividend income will vary depending on dividends or interest paid by securities in the Fund’s portfolio, adjusted for operating expenses of each class. Capital gain distributions are net profits realized from the sale of portfolio securities.
Performance as of 10/31/181
Cumulative total return excludes sales charges. Average annual total return includes maximum sales charges. Sales charges will vary depending on the size of the investment and the class of share purchased. The maximum is 5.50% and the minimum is 0%. Class A: 5.50% maximum initial sales charge; Advisor Class: no sales charges. For other share classes, visit franklintempleton.com.
| | | | |
| Share Class | | Cumulative Total Return2 | | Average Annual Total Return3 |
| | |
A4 | | | | |
1-Year | | +0.89% | | -4.66% |
5-Year | | +28.94% | | +4.02% |
10-Year | | +160.46% | | +9.42% |
| | |
Advisor | | | | |
1-Year | | +1.14% | | +1.14% |
5-Year | | +30.71% | | +5.50% |
10-Year | | +167.94% | | +10.36% |
| | | | | | | | |
| Share Class | | Distribution Rate5 | | 30-Day Standardized Yield6 |
| | (with waiver) | | | (without waiver) |
A | | 2.86% | | | 2.14% | | | 2.14% |
Advisor | | 3.27% | | | 2.53% | | | 2.53% |
Performance data represent past performance, which does not guarantee future results. Investment return and principal value will fluctuate, and you may have a gain or loss when you sell your shares. Current performance may differ from figures shown. For most recent month-end performance, go to franklintempleton.com or call (800) 342-5236.
See page 11 for Performance Summary footnotes.
| | | | |
| | | |
| 8 | | Annual Report | | franklintempleton.com |
FRANKLIN BALANCED FUND
PERFORMANCE SUMMARY
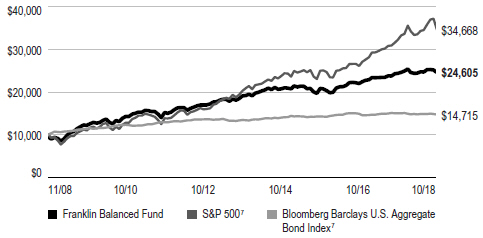
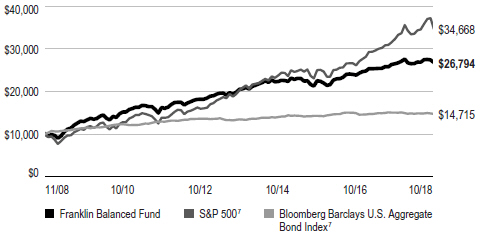
Total Return Index Comparison for a Hypothetical $10,000 Investment1
Total return represents the change in value of an investment over the periods shown. It includes any applicable maximum sales charge, Fund expenses, account fees and reinvested distributions. The unmanaged indexes include reinvestment of any income or distributions. They differ from the Fund in composition and do not pay management fees or expenses. One cannot invest directly in an index.
Class A (11/1/08–10/31/18)
Advisor Class (11/1/08–10/31/18)
See page 11 for Performance Summary footnotes.
| | | | |
| | | |
| franklintempleton.com | | Annual Report | | 9 |
FRANKLIN BALANCED FUND
PERFORMANCE SUMMARY
Net Asset Value
| | | | | | | | | | | | |
| Share Class (Symbol) | | 10/31/18 | | | 10/31/17 | | | Change | |
| |
A (FBLAX) | | | $11.89 | | | | $12.36 | | | | -$0.47 | |
| |
C (FBMCX) | | | $11.78 | | | | $12.25 | | | | -$0.47 | |
| |
R (FBFQX) | | | $11.92 | | | | $12.39 | | | | -$0.47 | |
R6 (FBFRX) | | | $11.93 | | | | $12.39 | | | | -$0.46 | |
| |
Advisor (FBFZX) | | | $11.92 | | | | $12.39 | | | | -$0.47 | |
| |
Distributions (11/1/17–10/31/18)
| | | | | | | | | | | | | | | | |
| Share Class | | Net Investment
Income | | | Short-Term
Capital Gain | | | Long-Term
Capital Gain | | | Total | |
| |
A | | | $0.3836 | | | | $0.0474 | | | | $0.1535 | | | | $0.5845 | |
| |
C | | | $0.2927 | | | | $0.0474 | | | | $0.1535 | | | | $0.4936 | |
| |
R | | | $0.3521 | | | | $0.0474 | | | | $0.1535 | | | | $0.5530 | |
| |
R6 | | | $0.4256 | | | | $0.0474 | | | | $0.1535 | | | | $0.6265 | |
| |
Advisor | | | $0.4139 | | | | $0.0474 | | | | $0.1535 | | | | $0.6148 | |
| |
Total Annual Operating Expenses8
| | | | | | | | |
| Share Class | | With Waiver | | | Without Waiver | |
| |
A | | | 1.01% | | | | 1.03% | |
| |
Advisor | | | 0.76% | | | | 0.78% | |
| |
See page 11 for Performance Summary footnotes.
| | | | |
| | | |
| 10 | | Annual Report | | franklintempleton.com |
FRANKLIN BALANCED FUND
PERFORMANCE SUMMARY
Each class of shares is available to certain eligible investors and has different annual fees and expenses, as described in the prospectus.
All investments involve risks, including possible loss of principal. The Fund’s share price and yield will be affected by interest rate movements. Bond prices generally move in the opposite direction of interest rates. As the prices of bonds in the Fund adjust to a rise in interest rates, the Fund’s share price may decline. Stock prices fluctuate, sometimes rapidly and dramatically, due to factors affecting individual companies, particular industries or sectors, or general market conditions. The Fund is actively managed but there is no guarantee that the manager’s investment decisions will produce the desired results. The Fund’s prospectus also includes a description of the main investment risks.
1. The Fund has a fee waiver associated with any investment it makes in a Franklin Templeton money fund and/or other Franklin Templeton Fund, contractually guaranteed through 2/28/19. Fund investment results reflect the fee waiver; without this reduction, the results would have been lower.
2. Cumulative total return represents the change in value of an investment over the periods indicated.
3. Average annual total return represents the average annual change in value of an investment over the periods indicated. Return for less than one year, if any, has not been annualized.
4. Prior to 9/10/18, these shares were offered at a higher initial sales charge of 5.75%, thus actual returns would have differed. Total returns with sales charges have been restated to reflect the current maximum initial sales charge of 5.50%.
5. Distribution rate is based on an annualization of the respective class’s October dividend and the maximum offering price (NAV for Advisor Class) per share on 10/31/18.
6. The Fund’s 30-day standardized yield is calculated over a trailing 30-day period using the yield to maturity on bonds and/or the dividends accrued on stocks. It may not equal the Fund’s actual income distribution rate, which reflects the Fund’s past dividends paid to shareholders.
7. Source: Morningstar. The S&P 500 is a market capitalization-weighted index of 500 stocks designed to measure total U.S. equity market performance. The Bloomberg Barclays U.S. Aggregate Bond Index is a market capitalization-weighted index representing the U.S. investment-grade, fixed-rate, taxable bond market with index components for government and corporate, mortgage pass-through and asset-backed securities. All issues included are SEC registered, taxable, dollar denominated and nonconvertible, must have at least one year to final maturity and must be rated investment grade (Baa3/BBB-/BBB- or higher) using the middle rating of Moody’s, S&P and Fitch, respectively.
8. Figures are as stated in the Fund’s current prospectus and may differ from the expense ratios disclosed in the Your Fund’s Expenses and Financial Highlights sections in this report. In periods of market volatility, assets may decline significantly, causing total annual Fund operating expenses to become higher than the figures shown.
See www.franklintempletondatasources.com for additional data provider information.
| | | | |
| | | |
| franklintempleton.com | | Annual Report | | 11 |
FRANKLIN BALANCED FUND
Your Fund’s Expenses
As a Fund shareholder, you can incur two types of costs: (1) transaction costs, including sales charges (loads) on Fund purchases and redemptions; and (2) ongoing Fund costs, including management fees, distribution and service (12b-1) fees, and other Fund expenses. All mutual funds have ongoing costs, sometimes referred to as operating expenses. The table below shows ongoing costs of investing in the Fund and can help you understand these costs and compare them with those of other mutual funds. The table assumes a $1,000 investment held for the six months indicated.
Actual Fund Expenses
The table below provides information about actual account values and actual expenses in the columns under the heading “Actual.” In these columns the Fund’s actual return, which includes the effect of Fund expenses, is used to calculate the “Ending Account Value” for each class of shares. You can estimate the expenses you paid during the period by following these steps (of course, your account value and expenses will differ from those in this illustration): Divide your account value by $1,000 (if your account had an $8,600 value, then $8,600 ÷ $1,000 = 8.6). Then multiply the result by the number in the row for your class of shares under the headings “Actual” and “Expenses Paid During Period” (if Actual Expenses Paid During Period were $7.50, then 8.6 x $7.50 = $64.50). In this illustration, the actual expenses paid this period are $64.50.
Hypothetical Example for Comparison with Other Funds
Under the heading “Hypothetical” in the table, information is provided about hypothetical account values and hypothetical expenses based on the Fund’s actual expense ratio and an assumed rate of return of 5% per year before expenses, which is not the Fund’s actual return. This information may not be used to estimate the actual ending account balance or expenses you paid for the period, but it can help you compare ongoing costs of investing in the Fund with those of other funds. To do so, compare this 5% hypothetical example for the class of shares you hold with the 5% hypothetical examples that appear in the shareholder reports of other funds.
Please note that expenses shown in the table are meant to highlight ongoing costs and do not reflect any transactional costs. Therefore, information under the heading “Hypothetical” is useful in comparing ongoing costs only, and will not help you compare total costs of owning different funds. In addition, if transactional costs were included, your total costs would have been higher.
| | | | | | | | | | | | |
| | | | | Actual
(actual return after expenses) | | Hypothetical
(5% annual return before expenses) | | |
Share Class | | Beginning Account Value 5/1/18 | | Ending
Account Value 10/31/18 | | Expenses Paid During
Period 5/1/18–10/31/181,2 | | Ending
Account Value 10/31/18 | | Expenses Paid During
Period 5/1/18–10/31/181,2 | | Net Annualized
Expense Ratio2 |
| | | | | | |
A | | $1,000 | | $1,007.30 | | $5.16 | | $1,020.06 | | $5.19 | | 1.02% |
C | | $1,000 | | $1,003.70 | | $8.89 | | $1,016.33 | | $8.94 | | 1.76% |
R | | $1,000 | | $1,006.00 | | $6.42 | | $1,018.75 | | $6.46 | | 1.27% |
R6 | | $1,000 | | $1,009.00 | | $3.39 | | $1,021.83 | | $3.41 | | 0.67% |
Advisor | | $1,000 | | $1,009.40 | | $3.90 | | $1,021.32 | | $3.92 | | 0.77% |
1. Expenses are equal to the annualized expense ratio for the six-month period as indicated above—in the far right column—multiplied by the simple average account value over the period indicated, and then multiplied by 184/365 to reflect the one-half year period.
2. Reflects expenses after fee waivers and expense reimbursements. Does not include acquired fund fees and expenses.
| | | | |
| | | |
| 12 | | Annual Report | | franklintempleton.com |
Franklin Convertible Securities Fund
We are pleased to bring you Franklin Convertible Securities Fund’s annual report for the fiscal year ended October 31, 2018. Franklin Convertible Securities Fund closed to new investors with limited exceptions on August 29, 2018. Existing investors may continue to purchase additional shares of the Fund.
Your Fund’s Goal and Main Investments
The Fund seeks to maximize total return, consistent with reasonable risk, by seeking to optimize capital appreciation and high current income under varying market conditions. The Fund normally invests at least 80% of its net assets in convertible securities and common stock received upon conversion of convertible securities.
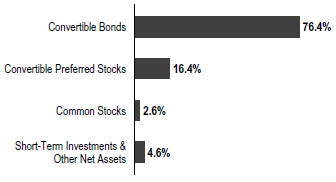
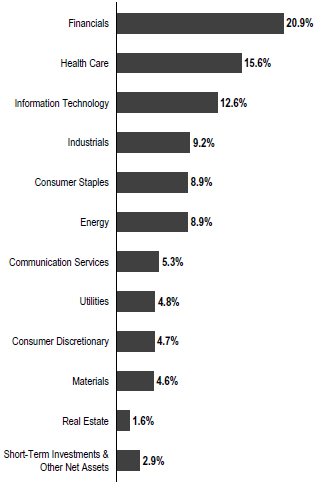
Portfolio Composition
Based on Total Net Assets as of 10/31/18
Performance Overview
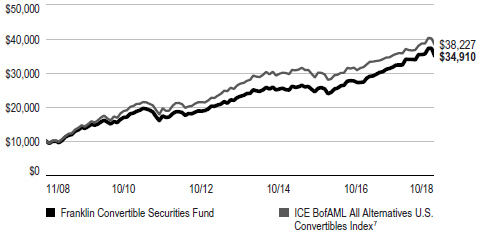
For the 12 months under review, the Fund’s Class A shares delivered a +7.65% cumulative total return. In comparison, the Fund’s benchmark, the ICE BofA Merrill Lynch (BofAML) All Alternatives U.S. Convertibles Index, which tracks the domestic convertible securities market, generated a +7.34% total return.1 You can find the Fund’s long-term performance data in the Performance Summary beginning on page 16.
Performance data represent past performance, which does not guarantee future results. Investment return and principal value will fluctuate, and you may have a gain or loss when you sell your shares. Current performance may differ from figures shown. For most recent month-end performance, go to franklintempleton.com or call (800) 342-5236.
Investment Strategy
When choosing convertible securities for the Fund, we attempt to maintain a balance in the portfolio between the equity and debt characteristics of convertible securities with an emphasis on the equity features. We also consider the company’s long-term earnings, asset value and cash flow potential. By investing in convertible securities, the Fund seeks the opportunity to participate in the capital appreciation of underlying stocks, while at the same time relying on the fixed income aspect of the convertible securities to provide current income and reduced price volatility, which can limit the risk of loss in a down equity market. Some of the convertible securities in which the Fund may invest have been structured to provide enhanced yield, increased equity exposure or enhanced downside protection. These securities typically provide a benefit to the issuer in exchange for the enhanced features, such as a conversion premium that is paid by the Fund. We may invest in convertible securities of companies of any capitalization size, but we generally seek to make the portfolio representative of the entire convertible securities market.
Manager’s Discussion
The information technology (IT), health care and consumer discretionary sectors contributed most to Fund performance during the period. Within IT, the Fund’s holdings of convertible bonds issued by mobile payment solutions provider Square, enterprise IT management software provider ServiceNow and open source software solutions provider Red Hat contributed to performance. Square’s quarterly results and earnings guidance were higher than anticipated. On top of solid performance in the company’s core payments business, the innovative company appears to be gaining traction in its platform-like subscription and services-based products for small and medium-sized businesses that could underpin an attractive long-term growth outlook for the company. Shares of ServiceNow rose amid better-than-expected earnings, revenue, operating margin, cash flow and billings, and higher revenue guidance. We believe ServiceNow is a high-quality Software-as-a-Service company that is proving itself as a key partner in business and government enterprise initiatives to drive productivity through digital transformation, while also delivering excellent unit economics. Red Hat’s stock price
1. Source: ICE BofA Merrill Lynch.
The index is unmanaged and includes reinvestment of any income or distributions. It does not reflect any fees, expenses or sales charges. One cannot invest directly in an index, and an index is not representative of the Fund’s portfolio.
The dollar value, number of shares or principal amount, and names of all portfolio holdings are listed in the Fund’s Statement of Investments (SOI). The SOI begins on page 48.
| | | | |
| | | |
franklintempleton.com | | Annual Report | | 13 |
FRANKLIN CONVERTIBLE SECURITIES FUND
soared shortly before period-end after IBM2 announced an agreement to acquire all common shares of Red Hat for a substantial premium above the company’s share price at that time. IBM’s management believed the acquisition would make IBM the world’s number one hybrid cloud provider and unlock the full value of the cloud for businesses.
In health care, our holdings of convertible bonds issued by Sarepta Therapeutics, a commercial stage biotechnology company that seeks treatment for rare neuromuscular diseases, and Neurocrine Biosciences, which develops therapies for neurologic, psychiatric and endocrine related disorders, contributed to performance. In the consumer discretionary sector, our holdings of convertible bonds issued by digital image and photo products and services provider Shutterfly (not held at period-end) and online home furnishing store Wayfair, contributed to performance.
In contrast, the industrials, utilities and energy sectors detracted from performance. In industrials, our holdings in convertible preferred stock issued by power and hand tools maker Stanley Black & Decker hampered results, and in utilities, our position in convertible preferred stocks issued by diversified energy company Black Hills also hurt performance.
In other sectors, our holdings in convertible bonds issued by semiconductor products manufacturer Microchip Technology, biopharmaceutical dermatology company Dermira and semiconductor processing systems manufacturer LAM Research (Novellus Systems in the SOI) also hindered performance. Despite mostly solid earnings and revenue performance, Microchip Technology’s stock declined amid concerns about the company’s leveraged acquisition of Microsemi2 in May. Microsemi’s prior practice of inflating revenue by overstocking its distributors is expected to temporarily reduce Microchip Technology’s future revenue and delay planned debt reduction by the company. Shares of Dermira fell significantly after the failure of two phase III clinical trials using its topical gel olumacostat to treat acne, but another clinical trial is pending to determine if the gel could be used to treat hyperhidrosis. The company has one more potential product in development that targets atopic dermatitis, with results expected by the first half of 2019. Semiconductor processing equipment manufacturer LAM Research suffered during the period from lower manufacturing spending in the industry, as evidenced by significant quarterly volatility in orders and a recent quarter-over-quarter decline in revenue.
Top 10 Holdings
10/31/18
| | | | |
Company Sector/Industry | | % of Total
Net Assets | |
Illumina Inc. Health Care | | | 2.1% | |
Square Inc. Information Technology | | | 2.1% | |
Sempra Energy Utilities | | | 2.1% | |
Jazz Investments I Ltd. Health Care | | | 2.1% | |
Workday Inc. Information Technology | | | 2.0% | |
Atlassian Inc. Information Technology | | | 2.0% | |
AXA SA Financials | | | 2.0% | |
DexCom Inc. Health Care | | | 2.0% | |
Ctrip.com International Ltd. Consumer Discretionary | | | 2.0% | |
ServiceNow Inc. Information Technology | | | 1.9% | |
However, we believe that rising demand for big data infrastructure by cloud providers, smartphone manufacturers and enterprises may support future revenue growth.
2. Not a Fund holding.
See www.franklintempletondatasources.com for additional data provider information.
| | | | |
| | | |
| 14 | | Annual Report | | franklintempleton.com |
FRANKLIN CONVERTIBLE SECURITIES FUND
Thank you for your continued participation in Franklin Convertible Securities Fund. We look forward to serving your future investment needs.
| | |
 | | 
Alan E. Muschott, CFA |
| | |
 | | 
Matthew D. Quinlan |
| |
| | Eric Webster, CFA |
| |
| | Portfolio Management Team |
The foregoing information reflects our analysis, opinions and portfolio holdings as of October 31, 2018, the end of the reporting period. The way we implement our main investment strategies and the resulting portfolio holdings may change depending on factors such as market and economic conditions. These opinions may not be relied upon as investment advice or an offer for a particular security. The information is not a complete analysis of every aspect of any market, country, industry, security or the Fund. Statements of fact are from sources considered reliable, but the investment manager makes no representation or warranty as to their completeness or accuracy. Although historical performance is no guarantee of future results, these insights may help you understand our investment management philosophy.
| | | | |
| | | |
| franklintempleton.com | | Annual Report | | 15 |
FRANKLIN CONVERTIBLE SECURITIES FUND
Performance Summary as of October 31, 2018
The performance tables and graphs do not reflect any taxes that a shareholder would pay on Fund dividends, capital gain distributions, if any, or any realized gains on the sale of Fund shares. Total return reflects reinvestment of the Fund’s dividends and capital gain distributions, if any, and any unrealized gains or losses. Your dividend income will vary depending on dividends or interest paid by securities in the Fund’s portfolio, adjusted for operating expenses of each class. Capital gain distributions are net profits realized from the sale of portfolio securities.
Performance as of 10/31/181
Cumulative total return excludes sales charges. Average annual total return includes maximum sales charges. Sales charges will vary depending on the size of the investment and the class of share purchased. The maximum is 5.50% and the minimum is 0%. Class A: 5.50% maximum initial sales charge; Advisor Class: no sales charges. For other share classes, visit franklintempleton.com.
| | | | |
| Share Class | | Cumulative Total Return2 | | Average Annual Total Return3 |
| | |
A4 | | | | |
1-Year | | +7.65% | | +1.75% |
5-Year | | +48.59% | | +7.02% |
10-Year | | +240.47% | | +12.40% |
| | |
Advisor | | | | |
1-Year | | +7.91% | | +7.91% |
5-Year | | +50.41% | | +8.51% |
10-Year | | +249.10% | | +13.32% |
| | | | | | | | | | |
| | | Distribution | | | 30-Day Standardized Yield6 |
| Share Class | | Rate5 | | | (with waiver) | | | (without waiver) |
A | | | 2.23% | | | | 1.49% | | | 1.46% |
Advisor | | | 2.61% | | | | 1.84% | | | 1.81% |
Performance data represent past performance, which does not guarantee future results. Investment return and principal value will fluctuate, and you may have a gain or loss when you sell your shares. Current performance may differ from figures shown. For most recent month-end performance, go to franklintempleton.com or call (800) 342-5236.
See page 18 for Performance Summary footnotes.
| | | | |
| | | |
| 16 | | Annual Report | | franklintempleton.com |
FRANKLIN CONVERTIBLE SECURITIES FUND
PERFORMANCE SUMMARY
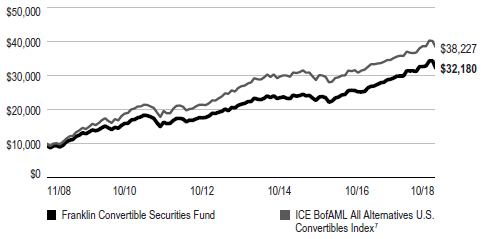
Total Return Index Comparison for a Hypothetical $10,000 Investment1
Total return represents the change in value of an investment over the periods shown. It includes any applicable maximum sales charge, Fund expenses, account fees and reinvested distributions. The unmanaged index includes reinvestment of any income or distributions. It differs from the Fund in composition and does not pay management fees or expenses. One cannot invest directly in an index.
Class A (11/1/08–10/31/18)
Advisor Class (11/1/08–10/31/18)
See page 18 for Performance Summary footnotes.
| | | | |
| | | |
| franklintempleton.com | | Annual Report | | 17 |
FRANKLIN CONVERTIBLE SECURITIES FUND
PERFORMANCE SUMMARY
Distributions (11/1/17–10/31/18)
| | | | | | | | | | | | | | | | |
| Share Class | | Net Investment
Income | | | Short-Term
Capital Gain | | | Long-Term
Capital Gain | | | Total | |
A | | | $0.4883 | | | | $0.2120 | | | | $0.8333 | | | | $1.5336 | |
C | | | $0.3392 | | | | $0.2120 | | | | $0.8333 | | | | $1.3845 | |
R6 | | | $0.5591 | | | | $0.2120 | | | | $0.8333 | | | | $1.6044 | |
Advisor | | | $0.5388 | | | | $0.2120 | | | | $0.8333 | | | | $1.5841 | |
Total Annual Operating Expenses8
| | | | | | | | |
| Share Class | | With Waiver | | | Without Waiver | |
| A | | 0.84% | | | 0.85% | |
Advisor | | | 0.59% | | | | 0.60% | |
Each class of shares is available to certain eligible investors and has different annual fees and expenses, as described in the prospectus.
All investments involve risks, including possible loss of principal. Convertible securities are subject to the risks of stocks when the underlying stock price is high relative to the conversion price (because more of the security’s value resides in the conversion feature) and debt securities when the underlying stock price is low relative to the conversion price (because the conversion feature is less valuable). A convertible security is not as sensitive to interest rate changes as a similar non-convertible debt security, and generally has less potential for gain or loss than the underlying stock. The Fund may invest in high yielding, fixed income securities. High yields reflect the higher credit risk associated with these lower rated securities and, in some cases, the lower market prices for these instruments. Interest rate movements may affect the Fund’s share price and yield. Bond prices generally move in the opposite direction of interest rates. As prices of bonds in the Fund adjust to a rise in interest rates, the Fund’s share price may decline. The Fund may also invest in foreign securities, which involve special risks, including political uncertainty and currency volatility. The Fund is actively managed but there is no guarantee that the manager’s investment decisions will produce the desired results. The Fund’s prospectus also includes a description of the main investment risks.
1. The Fund has a fee waiver associated with any investment it makes in a Franklin Templeton money fund and/or other Franklin Templeton fund, contractually guaranteed through 2/28/19. Fund investment results reflect the fee waiver; without this waiver, the results would have been lower.
2. Cumulative total return represents the change in value of an investment over the periods indicated.
3. Average annual total return represents the average annual change in value of an investment over the periods indicated. Return for less than one year, if any, has not been annualized.
4. Prior to 9/10/18, these shares were offered at a higher initial sales charge of 5.75%, thus actual returns would have differed. Total returns with sales charges have been restated to reflect the current maximum initial sales charge of 5.50%.
5. Distribution rate is based on the sum of the respective class’s past four quarterly dividends and the maximum offering price (NAV for Advisor Class) per share on 10/31/18.
6. The Fund’s 30-day standardized yield is calculated over a trailing 30-day period using the yield to maturity on bonds and/or the dividends accrued on stocks. It may not equal the Fund’s actual income distribution rate, which reflects the Fund’s past dividends paid to shareholders.
7. Source: Morningstar. The ICE BofAML All Alternatives U.S. Convertibles Index comprises domestic securities of all quality grades that are convertible into U.S. dollar-denominated common stock, ADRs or cash equivalents and have a delta (measure of equity sensitivity) that indicates the security likely has a balance between the debt and equity characteristics of the security.
8. Figures are as stated in the Fund’s current prospectus and may differ from the expense ratios disclosed in the Your Fund’s Expenses and Financial Highlights sections in this report. In periods of market volatility, assets may decline significantly, causing total annual Fund operating expenses to become higher than the figures shown.
See www.franklintempletondatasources.com for additional data provider information.
| | | | |
| | | |
| 18 | | Annual Report | | franklintempleton.com |
FRANKLIN CONVERTIBLE SECURITIES FUND
Your Fund’s Expenses
As a Fund shareholder, you can incur two types of costs: (1) transaction costs, including sales charges (loads) on Fund purchases and redemptions; and (2) ongoing Fund costs, including management fees, distribution and service (12b-1) fees, and other Fund expenses. All mutual funds have ongoing costs, sometimes referred to as operating expenses. The table below shows ongoing costs of investing in the Fund and can help you understand these costs and compare them with those of other mutual funds. The table assumes a $1,000 investment held for the six months indicated.
Actual Fund Expenses
The table below provides information about actual account values and actual expenses in the columns under the heading “Actual.” In these columns the Fund’s actual return, which includes the effect of Fund expenses, is used to calculate the “Ending Account Value” for each class of shares. You can estimate the expenses you paid during the period by following these steps (of course, your account value and expenses will differ from those in this illustration): Divide your account value by $1,000 (if your account had an $8,600 value, then $8,600 ÷ $1,000 = 8.6). Then multiply the result by the number in the row for your class of shares under the headings “Actual” and “Expenses Paid During Period” (if Actual Expenses Paid During Period were $7.50, then 8.6 x $7.50 = $64.50). In this illustration, the actual expenses paid this period are $64.50.
Hypothetical Example for Comparison with Other Funds
Under the heading “Hypothetical” in the table, information is provided about hypothetical account values and hypothetical expenses based on the Fund’s actual expense ratio and an assumed rate of return of 5% per year before expenses, which is not the Fund’s actual return. This information may not be used to estimate the actual ending account balance or expenses you paid for the period, but it can help you compare ongoing costs of investing in the Fund with those of other funds. To do so, compare this 5% hypothetical example for the class of shares you hold with the 5% hypothetical examples that appear in the shareholder reports of other funds.
Please note that expenses shown in the table are meant to highlight ongoing costs and do not reflect any transactional costs. Therefore, information under the heading “Hypothetical” is useful in comparing ongoing costs only, and will not help you compare total costs of owning different funds. In addition, if transactional costs were included, your total costs would have been higher.
| | | | | | | | | | | | |
| | | | | Actual
(actual return after expenses) | | Hypothetical
(5% annual return before expenses) | | |
Share Class | | Beginning Account Value 5/1/18 | | Ending
Account Value 10/31/18 | | Expenses Paid During
Period 5/1/18–10/31/181,2
| | Ending
Account Value 10/31/18 | | Expenses Paid During
Period 5/1/18–10/31/181,2
| | Net Annualized
Expense Ratio2 |
| | | | | | |
A | | $1,000 | | $1,029.30 | | $4.40 | | $1,020.87 | | $4.38 | | 0.86% |
C | | $1,000 | | $1,025.20 | | $8.22 | | $1,017.09 | | $8.19 | | 1.61% |
R6 | | $1,000 | | $1,031.30 | | $2.51 | | $1,022.74 | | $2.50 | | 0.49% |
Advisor | | $1,000 | | $1,030.00 | | $3.12 | | $1,022.13 | | $3.11 | | 0.61% |
1. Expenses are equal to the annualized expense ratio for the six-month period as indicated above—in the far right column—multiplied by the simple average account value over the period indicated, and then multiplied by 184/365 to reflect the one-half year period.
2. Reflects expenses after fee waivers and expense reimbursements. Does not include acquired fund fees and expenses.
| | | | |
| | | |
| franklintempleton.com | | Annual Report | | 19 |
Franklin Equity Income Fund
This annual report for Franklin Equity Income Fund covers the fiscal year ended October 31, 2018.
Your Fund’s Goal and Main Investments
The Fund seeks to maximize total return, emphasizing high current income and long-term capital appreciation, consistent with reasonable risk, by normally investing at least 80% of its net assets in equity securities, including securities convertible into common stocks. The Fund may also invest in debt securities and foreign securities, including emerging markets.
Performance Overview
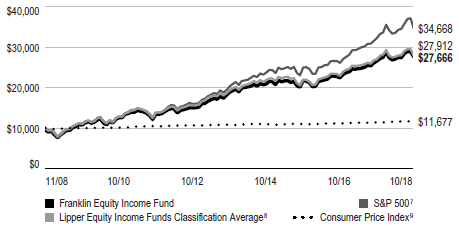
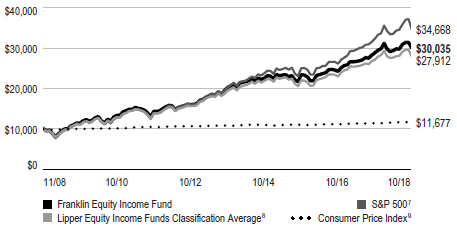
For the 12 months under review, the Fund’s Class A shares delivered a +3.98% cumulative total return. In comparison, the Fund’s benchmark, the Standard & Poor’s 500 Index (S&P 500), which tracks the broad U.S. stock market, generated a +7.35% total return.1 The Fund’s peers, as measured by the Lipper Equity Income Funds Classification Average, which consists of funds chosen by Lipper that seek relatively high current income and growth of income by investing at least 60% of their portfolios in stocks, posted a +3.14% total return.2 You can find the Fund’s long-term performance data in the Performance Summary beginning on page 23.
Performance data represent past performance, which does not guarantee future results. Investment return and principal value will fluctuate, and you may have a gain or loss when you sell your shares. Current performance may differ from figures shown. For most recent month-end performance, go to franklintempleton.com or call (800) 342-5236.
Investment Strategy
We seek to invest in a broadly diversified portfolio of equity securities that we consider to be financially strong, with a focus on blue chip companies. We apply a bottom-up approach to investing in individual securities. We will assess the market price of a company’s securities relative to our evaluation of the company’s long-term earnings, asset value and cash flow potential. We also consider a company’s price/earnings ratio, profit margins, balance sheet and liquidation value. We consider dividend yield and the opportunity for dividend growth in selecting stocks for the Fund because we believe that,
Portfolio Composition
Based on Total Net Assets as of 10/31/18
over time, dividend income can contribute significantly to total return and can be a more consistent source of investment return than capital appreciation. We seek to take advantage of price dislocations that result from the market’s short-term focus and choose to invest in those companies that, in our opinion, offer the best trade-off between growth opportunity, business and financial risk, and valuation.
Manager’s Discussion
The health care, information technology (IT) and energy sectors contributed most to Fund returns during the period. Within health care, pharmaceutical companies Merck, Pfizer
1. Source: Morningstar.
2. Source: Lipper, a Thomson Reuters Company. For the 12-month period ended 10/31/18, this category consisted of 536 funds. Lipper calculations do not include sales charges, or expense subsidization by a fund’s manager. The Fund’s performance relative to the average may have differed if these and other factors had been considered. The indexes are unmanaged and include reinvestment of any income or distributions. They do not include any fees, expenses or sales charges. One cannot invest directly in an index, and an index is not representative of the Fund’s portfolio.
The dollar value, number of shares or principal amount, and names of all portfolio holdings are listed in the Fund’s Statement of Investments (SOI). The SOI begins on page 57.
| | | | |
| | | |
20 | | Annual Report | | franklintempleton.com |
FRANKLIN EQUITY INCOME FUND
and Eli Lilly were notable contributors. Merck delivered solid quarterly results with increased revenue and earnings, and the outlook has been helped by continued growing demand for its cancer treatment drug Keytruda. Although some investors remained concerned about the company’s growing reliance on a narrowing list of drugs, Merck planned to increase capital spending to develop new cancer treatments, vaccines and medicines for animal health.
In IT, software and services firm Microsoft, software and electronics company Apple and networking hardware and telecommunications equipment maker Cisco Systems were notable contributors. Microsoft reported robust quarterly results during the period, supported by solid demand for its suite of office and cloud-based products and services. The company is a beneficiary of strong sales execution, a positive enterprise IT spending environment, its status as a critical partner to IT departments in this time of digital transformation, and a large installed base that it is successfully moving to higher-value cloud and Service-as-a-Software (SaaS) deployments. In the consumer market, the company continued to deliver new value into the declining personal computer market, while generating growth in gaming. Apple reported solid results for its fiscal second and third quarters (ended March and June, respectively), supported by strong growth in services and higher average selling price for iPhones, and issued strong guidance for its fiscal fourth quarter (ended September). Near period-end, the company revealed its latest lineup of products, which included new Apple Watch and iPhone models.
In energy, the performance of independent oil and gas exploration and production company Anadarko Petroleum3 helped results as its focus on improving cash flow has been recognized by investors.
In other sectors, banking giant JPMorgan continued to show strong results across its businesses. Retailer Target benefited from an improving economy and new merchandise to post some of its best sales and earnings results in years. Strong results from railroad operator Norfolk Southern and managed care company UnitedHealth Group also aided performance.
In contrast, the industrials, materials and financials sectors detracted most from Fund performance. In industrials, conglomerate General Electric (GE)3 and diesel and natural gas engine manufacturer Cummins hurt results. In January 2018, GE announced a greater-than-expected $6.2 billion after-tax
Top 10 Holdings
10/31/18
| | | | |
Company Sector/Industry | | % of Total
Net Assets | |
JPMorgan Chase & Co. Financials | | | 4.4% | |
Microsoft Corp. Information Technology | | | 3.8% | |
Wells Fargo & Co. Financials | | | 2.8% | |
Bank of America Corp. Financials | | | 2.7% | |
PepsiCo Inc. Consumer Staples | | | 2.4% | |
Johnson & Johnson Health Care | | | 2.4% | |
Pfizer Inc. Health Care | | | 2.4% | |
Chevron Corp. Energy | | | 2.3% | |
The Procter & Gamble Co. Consumer Staples | | | 2.3% | |
Merck & Co. Inc. Health Care | | | 2.3% | |
charge related to its insurance subsidiary at GE Capital. The value of the company’s stock was heavily impacted by cash flow shortfalls during the period and the Fund exited the position during the early summer. Despite strong revenue and earnings results helped by an upturn in the industrials sector, shares of Cummins were affected by the discovery of faulty emissions control systems by regulators, in response to which the company agreed to a recall of diesel trucks using their engines. Investors were also concerned about long-term prospects for the company given a peaking North American truck market and a trend toward electric engines.
In materials, agriculture and specialty chemicals producer DowDuPont and Germany-based chemical manufacturer BASF hindered performance. In financials, insurer and financial services provider MetLife detracted from performance.
In other sectors, consumer and commercial products manufacturer Newell Brands3 and packaged food company Kraft Heinz also detracted. Newell Brands reported weak quarterly results and declining earnings guidance due in part to rising costs, unfavorable pricing and worse-than-expected margins. Revenue was also affected due to destocking by retailers and store closures of some important customers.
3. Not held at period-end.
See www.franklintempletondatasources.com for additional data provider information.
| | | | |
| | | |
| franklintempleton.com | | Annual Report | | 21 |
FRANKLIN EQUITY INCOME FUND
Thank you for your continued participation in Franklin Equity Income Fund. We look forward to serving your future investment needs.
| | |
 | |  Matthew D. Quinlan |
| | |
 | | 
Alan E. Muschott, CFA |
| |
| | Todd Brighton, CFA |
| |
| | Portfolio Management Team |
The foregoing information reflects our analysis, opinions and portfolio holdings as of October 31, 2018, the end of the reporting period. The way we implement our main investment strategies and the resulting portfolio holdings may change depending on factors such as market and economic conditions. These opinions may not be relied upon as investment advice or an offer for a particular security. The information is not a complete analysis of every aspect of any market, country, industry, security or the Fund. Statements of fact are from sources considered reliable, but the investment manager makes no representation or warranty as to their completeness or accuracy. Although historical performance is no guarantee of future results, these insights may help you understand our investment management philosophy.
| | | | |
| | | |
| 22 | | Annual Report | | franklintempleton.com |
FRANKLIN EQUITY INCOME FUND
Performance Summary as of October 31, 2018
The performance tables and graphs do not reflect any taxes that a shareholder would pay on Fund dividends, capital gain distributions, if any, or any realized gains on the sale of Fund shares. Total return reflects reinvestment of the Fund’s dividends and capital gain distributions, if any, and any unrealized gains or losses. Your dividend income will vary depending on dividends or interest paid by securities in the Fund’s portfolio, adjusted for operating expenses of each class. Capital gain distributions are net profits realized from the sale of portfolio securities.
Performance as of 10/31/181
Cumulative total return excludes sales charges. Average annual total return includes maximum sales charges. Sales charges will vary depending on the size of the investment and the class of share purchased. The maximum is 5.50% and the minimum is 0%. Class A: 5.50% maximum initial sales charge; Advisor Class: no sales charges. For other share classes, visit franklintempleton.com.
| | | | |
| Share Class | | Cumulative Total Return2 | | Average Annual Total Return3 |
| | |
A4 | | | | |
1-Year | | +3.98% | | -1.74% |
5-Year | | +46.61% | | +6.74% |
10-Year | | +192.77% | | +10.71% |
| | |
Advisor | | | | |
1-Year | | +4.22% | | +4.22% |
5-Year | | +48.39% | | +8.21% |
10-Year | | +200.35% | | +11.63% |
| | | | | | | | | | |
| | | Distribution | | | 30-Day Standardized Yield6 |
| Share Class | | Rate5 | | | (with waiver) | | | (without waiver) |
A | | | 2.75% | | | | 1.61% | | | 1.60% |
Advisor | | | 3.18% | | | | 1.97% | | | 1.96% |
Performance data represent past performance, which does not guarantee future results. Investment return and principal value will fluctuate, and you may have a gain or loss when you sell your shares. Current performance may differ from figures shown. For most recent month-end performance, go to franklintempleton.com or call (800) 342-5236.
See page 25 for Performance Summary footnotes.
| | | | |
| | | |
| franklintempleton.com | | Annual Report | | 23 |
FRANKLIN EQUITY INCOME FUND
PERFORMANCE SUMMARY
Total Return Index Comparison for a Hypothetical $10,000 Investment1
Total return represents the change in value of an investment over the periods shown. It includes any applicable maximum sales charge, Fund expenses, account fees and reinvested distributions. The unmanaged indexes include reinvestment of any income or distributions. They differ from the Fund in composition and do not pay management fees or expenses. One cannot invest directly in an index.
Class A (11/1/08–10/31/18)
Advisor Class (11/1/08–10/31/18)
See page 25 for Performance Summary footnotes.
| | | | |
| | | |
| 24 | | Annual Report | | franklintempleton.com |
FRANKLIN EQUITY INCOME FUND
PERFORMANCE SUMMARY
Distributions (11/1/17–10/31/18)
| | | | | | | | | | | | | | | | |
| Share Class | | Net Investment
Income | | | Short-Term
Capital Gain | | | Long-Term
Capital Gain | | | Total | |
A | | | $0.5721 | | | | $0.0013 | | | | $0.6248 | | | | $1.1982 | |
C | | | $0.3830 | | | | $0.0013 | | | | $0.6248 | | | | $1.0091 | |
R | | | $0.5136 | | | | $0.0013 | | | | $0.6248 | | | | $1.1397 | |
R6 | | | $0.6643 | | | | $0.0013 | | | | $0.6248 | | | | $1.2904 | |
Advisor | | | $0.6323 | | | | $0.0013 | | | | $0.6248 | | | | $1.2584 | |
Total Annual Operating Expenses10
| | | | | | | | |
| Share Class | | With Waiver | | | Without Waiver | |
A | | | 0.85% | | | | 0.85 | % |
Advisor | | | 0.60% | | | | 0.60 | % |
Each class of shares is available to certain eligible investors and has different annual fees and expenses, as described in the prospectus.
All investments involve risks, including possible loss of principal. Stock prices fluctuate, sometimes rapidly and dramatically, due to factors affecting individual companies, particular industries or sectors, or general market conditions. Convertible securities are subject to the risks of stocks when the underlying stock price is high relative to the conversion price and debt securities when the underlying stock price is low relative to the conversion price. The Fund’s investment in foreign securities also involves special risks, including currency fluctuations and economic as well as political uncertainty. The Fund is actively managed but there is no guarantee that the manager’s investment decisions will produce the desired results. The Fund’s prospectus also includes a description of the main investment risks.
1. The Fund has a fee waiver associated with any investment it makes in a Franklin Templeton money fund and/or other Franklin Templeton Fund, contractually guaranteed through 2/28/19. Fund investment results reflect the fee waiver; without this waiver, the results would have been lower.
2. Cumulative total return represents the change in value of an investment over the periods indicated.
3. Average annual total return represents the average annual change in value of an investment over the periods indicated. Return for less than one year, if any, has not been annualized.
4. Prior to 9/10/18, these shares were offered at a higher initial sales charge of 5.75%, thus actual returns would have differed. Total returns with sales charges have been restated to reflect the current maximum initial sales charge of 5.50%.
5. Distribution rate is based on an annualization of the respective class’s current quarterly dividend and the maximum offering price (NAV for Advisor Class) per share on 10/31/18.
6. The Fund’s 30-day standardized yield is calculated over a trailing 30-day period using the yield to maturity on bonds and/or the dividends accrued on stocks. It may not equal the Fund’s actual income distribution rate, which reflects the Fund’s past dividends paid to shareholders.
7. Source: Morningstar: The S&P 500 is a market capitalization-weighted index of 500 stocks designed to measure total U.S. equity market performance.
8. Source: Lipper, a Thomson Reuters Company. The Lipper Equity Income Funds Classification Average is an equally weighted average calculation of performance figures for all funds within the Lipper Equity Income Funds classification in the Lipper Open-End underlying funds universe. Lipper Equity Income Funds seek relatively high current income and growth of income through investing 60% or more of their portfolios in equities. For the one-year period ended 10/31/18, there were 536 funds in this category. Lipper calculations do not include sales charges or expense subsidization by a fund’s manager. The Fund’s performance relative to the average may have differed if these or other factors had been considered.
9. Source: Bureau of Labor Statistics, bls.gov/cpi. The Consumer Price Index (CPI) is a commonly used measure of the inflation rate.
10. Figures are as stated in the Fund’s current prospectus and may differ from the expense ratios disclosed in the Your Fund’s Expenses and Financial Highlights sections in this report. In periods of market volatility, assets may decline significantly, causing total annual Fund operating expenses to become higher than the figures shown.
See www.franklintempletondatasources.com for additional data provider information.
| | | | |
| | | |
| franklintempleton.com | | Annual Report | | 25 |
FRANKLIN EQUITY INCOME FUND
Your Fund’s Expenses
As a Fund shareholder, you can incur two types of costs: (1) transaction costs, including sales charges (loads) on Fund purchases and redemptions; and (2) ongoing Fund costs, including management fees, distribution and service (12b-1) fees, and other Fund expenses. All mutual funds have ongoing costs, sometimes referred to as operating expenses. The table below shows ongoing costs of investing in the Fund and can help you understand these costs and compare them with those of other mutual funds. The table assumes a $1,000 investment held for the six months indicated.
Actual Fund Expenses
The table below provides information about actual account values and actual expenses in the columns under the heading “Actual.” In these columns the Fund’s actual return, which includes the effect of Fund expenses, is used to calculate the “Ending Account Value” for each class of shares. You can estimate the expenses you paid during the period by following these steps (of course, your account value and expenses will differ from those in this illustration): Divide your account value by $1,000 (if your account had an $8,600 value, then $8,600 ÷ $1,000 = 8.6). Then multiply the result by the number in the row for your class of shares under the headings “Actual” and “Expenses Paid During Period” (if Actual Expenses Paid During Period were $7.50, then 8.6 x $7.50 = $64.50). In this illustration, the actual expenses paid this period are $64.50.
Hypothetical Example for Comparison with Other Funds
Under the heading “Hypothetical” in the table, information is provided about hypothetical account values and hypothetical expenses based on the Fund’s actual expense ratio and an assumed rate of return of 5% per year before expenses, which is not the Fund’s actual return. This information may not be used to estimate the actual ending account balance or expenses you paid for the period, but it can help you compare ongoing costs of investing in the Fund with those of other funds. To do so, compare this 5% hypothetical example for the class of shares you hold with the 5% hypothetical examples that appear in the shareholder reports of other funds.
Please note that expenses shown in the table are meant to highlight ongoing costs and do not reflect any transactional costs. Therefore, information under the heading “Hypothetical” is useful in comparing ongoing costs only, and will not help you compare total costs of owning different funds. In addition, if transactional costs were included, your total costs would have been higher.
| | | | | | | | | | | | |
| | | | | Actual
(actual return after expenses) | | Hypothetical
(5% annual return before expenses) | | |
Share Class | | Beginning Account Value 5/1/18 | | Ending
Account Value 10/31/18 | | Expenses Paid During
Period 5/1/18–10/31/181,2 | | Ending
Account Value 10/31/18 | | Expenses Paid During
Period 5/1/18–10/31/181,2 | | Net Annualized
Expense Ratio2 |
| | | | | | |
A | | $1,000 | | $1,022.30 | | $4.33 | | $1,020.92 | | $4.33 | | 0.85% |
C | | $1,000 | | $1,017.80 | | $8.14 | | $1,017.14 | | $8.13 | | 1.60% |
R | | $1,000 | | $1,020.70 | | $5.50 | | $1,019.76 | | $5.50 | | 1.08% |
R6 | | $1,000 | | $1,024.00 | | $2.55 | | $1,022.68 | | $2.55 | | 0.50% |
Advisor | | $1,000 | | $1,023.10 | | $3.06 | | $1,022.18 | | $3.06 | | 0.60% |
1. Expenses are equal to the annualized expense ratio for the six-month period as indicated above—in the far right column—multiplied by the simple average account value over the period indicated, and then multiplied by 184/365 to reflect the one-half year period.
2. Reflects expenses after fee waivers and expense reimbursements. Does not include acquired fund fees and expenses.
| | | | |
| | | |
| 26 | | Annual Report | | franklintempleton.com |
Franklin Real Return Fund
This annual report for Franklin Real Return Fund covers the fiscal year ended October 31, 2018.
Your Fund’s Goal and Main Investments
The Fund seeks total return that exceeds the rate of inflation over an economic cycle. Under normal market conditions, the Fund seeks to allocate assets among investments to achieve the highest level of real return (total return less the rate of inflation) consistent with an acceptable level of risk. The Fund shifts its investments among the following general asset classes and at any given time may have a substantial amount of its asset in any one class: inflation-indexed securities and investment-grade fixed income securities issued by governments, corporations and municipal issuers; equity securities with high correlation to broad measures of inflation; and non-dollar denominated inflation-indexed securities.
Portfolio Composition*
Based on Total Net Assets as of 10/31/18
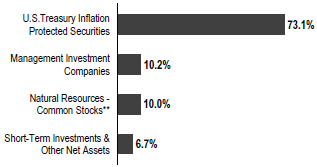
*Figures reflect certain derivatives held in the portfolio (or their underlying reference assets) and may not total 100% or may be negative due to rounding, use of derivatives, unsettled trades or other factors.
**In the SOI, the natural resources sector comprises energy and materials.
Performance Overview
For the 12 months under review, the Fund’s Class A shares had a -0.69% cumulative total return. In comparison, the Bloomberg Barclays U.S. TIPS Index, which tracks the universe of inflation-protected notes issued by the U.S. Treasury that have at least one year to final maturity, had a -1.24% total return.1 Also for comparison, the Consumer Price Index for All Urban Consumers - Non-Seasonally Adjusted (CPI-NSA), a measure of the average change in prices of all
goods and services purchased for consumption by urban householders, rose 2.52% for the same period.2 You can find the Fund’s long-term performance data in the Performance Summary beginning on page 29.
Performance data represent past performance, which does not guarantee future results. Investment return and principal value will fluctuate, and you may have a gain or loss when you sell your shares. Current performance may differ from figures shown. For most recent month-end performance, go to franklintempleton.com or call (800) 342-5236.
Investment Strategy
The Fund uses an active asset allocation strategy to try to achieve its goal of total return that exceeds the rate of inflation over an economic cycle by allocating its assets among securities in various market sectors based on our assessment of changing economic, global market, industry and issuer conditions. When making our investment decisions, we use a top-down analysis of macroeconomic trends combined with a bottom-up fundamental analysis of market sectors, industries and issuers to try to take advantage of varying sector reactions to economic events. We will evaluate such criteria as country risk, business cycles, yield curves and values between and within markets.
|
What is the yield curve? A yield curve is a line that plots the yield to maturity of bonds having equal credit quality against their maturity dates. |
Manager’s Discussion
At period-end, nearly three quarters of total net assets were invested in Treasury Inflation-Protected Securities (TIPS). For diversification, we also allocated the Fund’s assets to management investment companies, natural resources common stocks, management investment companies, repurchase agreements and other short-term investments. We employed a non-U.S. dollar strategy to help hedge against potential U.S. dollar weakness versus certain currencies and concentrated our TIPS holdings in shorter maturities.
1. Source: Morningstar.
The indexes are unmanaged and include reinvestment of any income or distributions. They do not reflect any fees, expenses or sales charges. One cannot invest directly in an index, and an index is not representative of the Fund’s portfolio.
2. Source: Bureau of Labor Statistics, bls.gov/cpi.
See www.franklintempletondatasources.com for additional data provider information.
The dollar value, number of shares or principal amount, and names of all portfolio holdings are listed in the Fund’s Statement of Investments (SOI). The SOI begins on page 64.
| | | | |
| | | |
franklintempleton.com | | Annual Report | | 27 |
FRANKLIN REAL RETURN FUND
Dividend Distributions*
11/1/17–10/31/18
| | | | | | | | | | | | | | | | |
| | | Dividend per Share (cents) | |
| | | | | | | | | | | | Advisor | |
| Month | | Class A | | | Class C | | | Class R6 | | | Class | |
November | | | 4.32 | | | | 3.98 | | | | 4.66 | | | | 4.48 | |
December | | | 10.37 | | | | 10.02 | | | | 10.73 | | | | 10.60 | |
January | | | 0.56 | | | | 0.24 | | | | 0.88 | | | | 0.77 | |
February** | | | — | | | | — | | | | — | | | | — | |
March | | | 4.21 | | | | 3.58 | | | | 4.90 | | | | 4.60 | |
April | | | 2.90 | | | | 2.58 | | | | 3.22 | | | | 3.10 | |
May | | | 1.92 | | | | 1.55 | | | | 2.32 | | | | 2.15 | |
June | | | 4.53 | | | | 4.22 | | | | 4.85 | | | | 4.68 | |
July | | | 2.63 | | | | 2.30 | | | | 2.97 | | | | 2.84 | |
August** | | | — | | | | — | | | | — | | | | — | |
September | | | 1.15 | | | | 0.48 | | | | 1.84 | | | | 1.57 | |
October** | | | — | | | | — | | | | — | | | | — | |
| Total | | 32.59 | | | 28.95 | | | 36.37 | | | 34.79 | |
*The distribution amount is the sum of all net investment income distributions for the period shown. All Fund distributions will vary depending upon current market conditions, and past distributions are not indicative of future trends.
**The Fund paid no dividends due to negative inflation adjustments for TIPS, which are the Fund’s primary investments.
During the period, we increased the Fund’s allocations to real estate investment trusts (REITs). In contrast, we decreased the Fund’s allocation to natural resources equities and TIPS and eliminated our exposure to foreign debt securities. The Fund’s heaviest allocations were in TIPS and natural resources equities. The Fund’s investments in TIPS, foreign currency exposure and bank loans helped results. In contrast, the Fund’s investments in natural resources equities, commodities and REITs hindered Fund performance.
Thank you for your continued participation in Franklin Real Return Fund. We look forward to serving your future investment needs.
| | |
 | | 
T. Anthony Coffey, CFA |
| |
 | | 
Kent Burns, CFA |
| |
| | Portfolio Management Team |
The foregoing information reflects our analysis, opinions and portfolio holdings as of October 31, 2018, the end of the reporting period. The way we implement our main investment strategies and the resulting portfolio holdings may change depending on factors such as market and economic conditions. These opinions may not be relied upon as investment advice or an offer for a particular security. The information is not a complete analysis of every aspect of any market, country, industry, security or the Fund. Statements of fact are from sources considered reliable, but the investment manager makes no representation or warranty as to their completeness or accuracy. Although historical performance is no guarantee of future results, these insights may help you understand our investment management philosophy.
| | | | |
| | | |
| 28 | | Annual Report | | franklintempleton.com |
FRANKLIN REAL RETURN FUND
Performance Summary as of October 31, 2018
The performance tables and graphs do not reflect any taxes that a shareholder would pay on Fund dividends, capital gain distributions, if any, or any realized gains on the sale of Fund shares. Total return reflects reinvestment of the Fund’s dividends and capital gain distributions, if any, and any unrealized gains or losses. Your dividend income will vary depending on dividends or interest paid by securities in the Fund’s portfolio, adjusted for operating expenses of each class. Capital gain distributions are net profits realized from the sale of portfolio securities.
Performance as of 10/31/181
Cumulative total return excludes sales charges. Average annual total return includes maximum sales charges. Sales charges will vary depending on the size of the investment and the class of share purchased. The maximum is 4.25% and the minimum is 0%. Class A: 4.25% maximum initial sales charge; Advisor Class: no sales charges. For other share classes, visit franklintempleton.com.
| | | | |
| Share Class | | Cumulative Total Return2 | | Average Annual Total Return3 |
| | |
A | | | | |
1-Year | | -0.69% | | -4.91% |
5-Year | | -1.96% | | -1.26% |
10-Year | | +24.29% | | +1.76% |
| | |
Advisor | | | | |
1-Year | | -0.47% | | -0.47% |
5-Year | | -0.82% | | -0.17% |
10-Year | | +27.32% | | +2.44% |
| | | | | | | | | | | | |
| | | Distribution | | | 30-Day Standardized Yield5 | |
| Share Class | | Rate4 | | | (with waiver) | | | (without waiver) | |
A | | | 0.00% | | | | 1.81% | | | | 1.51% | |
Advisor | | | 0.00% | | | | 2.15% | | | | 1.84% | |
Performance data represent past performance, which does not guarantee future results. Investment return and principal value will fluctuate, and you may have a gain or loss when you sell your shares. Current performance may differ from figures shown. For most recent month-end performance, go to franklintempleton.com or call (800) 342-5236.
See page 31 for Performance Summary footnotes.
| | | | |
| | | |
| franklintempleton.com | | Annual Report | | 29 |
FRANKLIN REAL RETURN FUND
PERFORMANCE SUMMARY
Total Return Index Comparison for a Hypothetical $10,000 Investment1
Total return represents the change in value of an investment over the periods shown. It includes any applicable maximum sales charge, Fund expenses, account fees and reinvested distributions. The unmanaged indexes include reinvestment of any income or distributions. They differ from the Fund in composition and do not pay management fees or expenses. One cannot invest directly in an index.
Class A (11/1/08–10/31/18)
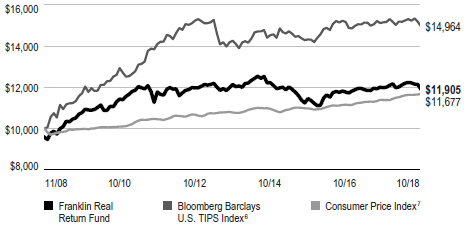
Advisor Class (11/1/08–10/31/18)
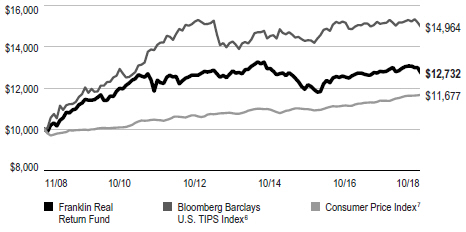
See page 31 for Performance Summary footnotes.
| | | | |
| | | |
| 30 | | Annual Report | | franklintempleton.com |
FRANKLIN REAL RETURN FUND
PERFORMANCE SUMMARY
Distributions (11/1/17–10/31/18)
| | | | |
| Share Class | | Net Investment
Income | |
A | | | $0.3259 | |
C | | | $0.2895 | |
R6 | | | $0.3637 | |
Advisor | | | $0.3479 | |
Total Annual Operating Expenses8
| | | | | | | | |
| Share Class | | With Waiver | | | Without Waiver | |
A | | | 0.93% | | | | 1.17% | |
Advisor | | | 0.68% | | | | 0.92% | |
Each class of shares is available to certain eligible investors and has different annual fees and expenses, as described in the prospectus.
All investments involve risks, including possible loss of principal. Interest rate movements will affect the Fund’s share price and yield. Bond prices generally move in the opposite direction of interest rates. As prices of bonds in a fund adjust to a rise in interest rates, the Fund’s share price may decline. Foreign securities involve special risks, including currency fluctuations and economic and political uncertainties. Changes in the financial strength of a bond issuer or in a bond’s credit rating may affect its value. Stock prices fluctuate, sometimes rapidly and dramatically, due to factors affecting individual companies, particular industries or sectors, or general market conditions. The Fund is actively managed but there is no guarantee that the manager’s investment decisions will produce the desired results. The Fund’s prospectus also includes a description of the main investment risks.
1. The Fund has an expense reduction and a fee waiver associated with any investments it makes in a Franklin Templeton money fund and/or other Franklin Templeton fund, contractually guaranteed through 2/28/19. Fund investment results reflect the expense reduction and fee waiver; without these reductions, the results would have been lower.
2. Cumulative total return represents the change in value of an investment over the periods indicated.
3. Average annual total return represents the average annual change in value of an investment over the periods indicated. Return for less than one year, if any, has not been annualized.
4. Distribution rate is based on an annualization of the respective class’s October dividend and the maximum offering price (NAV for Advisor Class) per share on 10/31/18.
5. The Fund’s 30-day standardized yield is calculated over a trailing 30-day period using the yield to maturity on bonds and/or the dividends accrued on stocks. It may not equal the Fund’s actual income distribution rate, which reflects the Fund’s past dividends paid to shareholders.
6. Source: Morningstar. The Bloomberg Barclays U.S. TIPS Index comprises U.S. TIPS rated investment grade (Baa3/BBB- or better) with at least one year to final maturity and at least $250 million par amount outstanding.
7. Source: Bureau of Labor Statistics, bls.gov/cpi. The Consumer Price Index (CPI) is a commonly used measure of the inflation rate.
8. Figures are as stated in the Fund’s current prospectus and may differ from the expense ratios disclosed in the Your Fund’s Expenses and Financial Highlights sections in this report. In periods of market volatility, assets may decline significantly, causing total annual Fund operating expenses to become higher than the figures shown.
See www.franklintempletondatasources.com for additional data provider information.
| | | | |
| | | |
| franklintempleton.com | | Annual Report | | 31 |
FRANKLIN REAL RETURN FUND
Your Fund’s Expenses
As a Fund shareholder, you can incur two types of costs: (1) transaction costs, including sales charges (loads) on Fund purchases and redemptions; and (2) ongoing Fund costs, including management fees, distribution and service (12b-1) fees, and other Fund expenses. All mutual funds have ongoing costs, sometimes referred to as operating expenses. The table below shows ongoing costs of investing in the Fund and can help you understand these costs and compare them with those of other mutual funds. The table assumes a $1,000 investment held for the six months indicated.
Actual Fund Expenses
The table below provides information about actual account values and actual expenses in the columns under the heading “Actual.” In these columns the Fund’s actual return, which includes the effect of Fund expenses, is used to calculate the “Ending Account Value” for each class of shares. You can estimate the expenses you paid during the period by following these steps (of course, your account value and expenses will differ from those in this illustration): Divide your account value by $1,000 (if your account had an $8,600 value, then $8,600 ÷ $1,000 = 8.6). Then multiply the result by the number in the row for your class of shares under the headings “Actual” and “Expenses Paid During Period” (if Actual Expenses Paid During Period were $7.50, then 8.6 x $7.50 = $64.50). In this illustration, the actual expenses paid this period are $64.50.
Hypothetical Example for Comparison with Other Funds
Under the heading “Hypothetical” in the table, information is provided about hypothetical account values and hypothetical expenses based on the Fund’s actual expense ratio and an assumed rate of return of 5% per year before expenses, which is not the Fund’s actual return. This information may not be used to estimate the actual ending account balance or expenses you paid for the period, but it can help you compare ongoing costs of investing in the Fund with those of other funds. To do so, compare this 5% hypothetical example for the class of shares you hold with the 5% hypothetical examples that appear in the shareholder reports of other funds.
Please note that expenses shown in the table are meant to highlight ongoing costs and do not reflect any transactional costs. Therefore, information under the heading “Hypothetical” is useful in comparing ongoing costs only, and will not help you compare total costs of owning different funds. In addition, if transactional costs were included, your total costs would have been higher.
| | | | | | | | | | | | |
| | | | | Actual
(actual return after expenses) | | Hypothetical
(5% annual return before expenses) | | |
Share Class | | Beginning Account Value 5/1/18 | | Ending
Account Value 10/31/18 | | Expenses Paid During
Period 5/1/18–10/31/181,2 | | Ending
Account Value 10/31/18 | | Expenses Paid During
Period 5/1/18–10/31/181,2 | | Net Annualized
Expense Ratio2 |
| | | | | | |
A | | $1,000 | | $982.00 | | $4.50 | | $1,020.67 | | $4.58 | | 0.90% |
C | | $1,000 | | $979.20 | | $6.49 | | $1,018.65 | | $6.61 | | 1.30% |
R6 | | $1,000 | | $983.80 | | $2.45 | | $1,022.74 | | $2.50 | | 0.49% |
Advisor | | $1,000 | | $982.10 | | $3.25 | | $1,021.93 | | $3.31 | | 0.65% |
1. Expenses are equal to the annualized expense ratio for the six-month period as indicated above—in the far right column—multiplied by the simple average account value over the period indicated, and then multiplied by 184/365 to reflect the one-half year period.
2. Reflects expenses after fee waivers and expense reimbursements. Does not include acquired fund fees and expenses.
| | | | |
| | | |
| 32 | | Annual Report | | franklintempleton.com |
FRANKLIN INVESTORS SECURITIES TRUST
Financial Highlights
Franklin Balanced Fund
| | | | | | | | | | | | | | | | | | | | |
| | | Year Ended October 31, | |
| | | 2018 | | | 2017 | | | 2016 | | | 2015 | | | 2014 | |
Class A | | | | | | | | | | | | | | | | | | | | |
| | | | | |
| Per share operating performance | | | | | | | | | | | | | | | | | | | | |
(for a share outstanding throughout the year) | | | | | | | | | | | | | | | | | | | | |
| | | | | |
Net asset value, beginning of year | | | $12.36 | | | | $11.65 | | | | $11.40 | | | | $11.86 | | | | $11.43 | |
| | | | | |
Income from investment operationsa: | | | | | | | | | | | | | | | | | | | | |
| | | | | |
Net investment incomeb | | | 0.27 | | | | 0.33 | | | | 0.30 | | | | 0.30 | | | | 0.31 | c |
| | | | | | |
Net realized and unrealized gains (losses) | | | (0.16 | ) | | | 0.91 | | | | 0.31 | | | | (0.24 | ) | | | 0.65 | |
| | | | | |
Total from investment operations | | | 0.11 | | | | 1.24 | | | | 0.61 | | | | 0.06 | | | | 0.96 | |
| | | | | |
Less distributions from: | | | | | | | | | | | | | | | | | | | | |
| | | | | |
Net investment income | | | (0.38 | ) | | | (0.36 | ) | | | (0.36 | ) | | | (0.36 | ) | | | (0.36 | ) |
| | | | | |
Net realized gains | | | (0.20 | ) | | | (0.17 | ) | | | (— | )d | | | (0.16 | ) | | | (0.17 | ) |
| | | | | |
Total distributions | | | (0.58 | ) | | | (0.53 | ) | | | (0.36 | ) | | | (0.52 | ) | | | (0.53 | ) |
| | | | | |
Net asset value, end of year | | | $11.89 | | | | $12.36 | | | | $11.65 | | | | $11.40 | | | | $11.86 | |
| | | | | |
Total returne | | | 0.89% | | | | 10.88% | | | | 5.54% | | | | 0.51% | | | | 8.66% | |
| | | | | |
| Ratios to average net assets | | | | | | | | | | | | | | | | | | | | |
| | | | | |
Expenses before waiver and payments by affiliates | | | 1.02% | | | | 1.02% | | | | 1.02% | | | | 1.06% | | | | 1.09% | |
| | | | | |
Expenses net of waiver and payments by affiliatesf | | | 1.01% | | | | 1.00% | | | | 1.01% | | | | 1.06% | g | | | 1.09% | g |
| | | | | | |
Net investment income | | | 2.22% | | | | 2.72% | | | | 2.62% | | | | 2.56% | | | | 2.64% | c |
| | | | | | |
| Supplemental data | | | | | | | | | | | | | | | | | | | | |
| | | | | |
Net assets, end of year (000’s) | | | $2,586,246 | | | | $2,646,599 | | | | $2,532,459 | | | | $2,371,133 | | | | $2,053,623 | |
| | | | | |
Portfolio turnover rate | | | 63.64% | | | | 34.99% | | | | 46.03% | | | | 69.23% | | | | 40.54% | |
aThe amount shown for a share outstanding throughout the period may not correlate with the Statement of Operations for the period due to the timing of sales and repurchases of the Fund’s shares in relation to income earned and/or fluctuating fair value of the investments of the Fund.
bBased on average daily shares outstanding.
cNet investment income per share includes approximately $0.03 per share related to income received in the form of a special dividend in connection with certain Fund holdings. Excluding this amount, the ratio of net investment income to average net assets would have been 2.39%.
dAmount rounds to less than $0.01 per share.
eTotal return does not reflect sales commissions or contingent deferred sales charges, if applicable.
fBenefit of expense reduction rounds to less than 0.01%.
gBenefit of waiver and payments by affiliates rounds to less than 0.01%.
| | | | |
| | | |
| franklintempleton.com | | The accompanying notes are an integral part of these financial statements. | Annual Report | | 33 |
FRANKLIN INVESTORS SECURITIES TRUST
FINANCIAL HIGHLIGHTS
Franklin Balanced Fund (continued)
| | | | | | | | | | | | | | | | | | | | |
| | | Year Ended October 31, | |
| | | 2018 | | | 2017 | | | 2016 | | | 2015 | | | 2014 | |
| | | | | | |
Class C | | | | | | | | | | | | | | | | | | | | |
| | | | | |
| Per share operating performance | | | | | | | | | | | | | | | | | | | | |
(for a share outstanding throughout the year) | | | | | | | | | | | | | | | | | | | | |
| | | | | |
Net asset value, beginning of year | | | $12.25 | | | | $11.55 | | | | $11.31 | | | | $11.77 | | | | $11.34 | |
| | | | | |
Income from investment operationsa: | | | | | | | | | | | | | | | | | | | | |
| | | | | |
Net investment incomeb | | | 0.19 | | | | 0.24 | | | | 0.21 | | | | 0.21 | | | | 0.23 | c |
| | | | | | |
Net realized and unrealized gains (losses) | | | (0.17 | ) | | | 0.90 | | | | 0.31 | | | | (0.23 | ) | | | 0.65 | |
| | | | | |
Total from investment operations | | | 0.02 | | | | 1.14 | | | | 0.52 | | | | (0.02 | ) | | | 0.88 | |
| | | | | |
Less distributions from: | | | | | | | | | | | | | | | | | | | | |
| | | | | |
Net investment income | | | (0.29 | ) | | | (0.27 | ) | | | (0.28 | ) | | | (0.28 | ) | | | (0.28 | ) |
| | | | | |
Net realized gains | | | (0.20 | ) | | | (0.17 | ) | | | (— | )d | | | (0.16 | ) | | | (0.17 | ) |
| | | | | |
Total distributions | | | (0.49 | ) | | | (0.44 | ) | | | (0.28 | ) | | | (0.44 | ) | | | (0.45 | ) |
| | | | | |
Net asset value, end of year | | | $11.78 | | | | $12.25 | | | | $11.55 | | | | $11.31 | | | | $11.77 | |
| | | | | |
Total returne | | | 0.14% | | | | 10.06% | | | | 4.73% | | | | (0.20)% | | | | 7.97% | |
| | | | | |
| Ratios to average net assets | | | | | | | | | | | | | | | | | | | | |
| | | | | |
Expenses before waiver and payments by affiliates | | | 1.76% | | | | 1.77% | | | | 1.77% | | | | 1.77% | | | | 1.79% | |
| | | | | |
Expenses net of waiver and payments by affiliatesf | | | 1.75% | | | | 1.75% | | | | 1.76% | | | | 1.77% | g | | | 1.79% | g |
| | | | | | |
Net investment income | | | 1.48% | | | | 1.97% | | | | 1.87% | | | | 1.85% | | | | 1.94% | c |
| | | | | | |
| Supplemental data | | | | | | | | | | | | | | | | | | | | |
| | | | | |
Net assets, end of year (000’s) | | | $493,762 | | | | $633,108 | | | | $630,110 | | | | $563,419 | | | | $492,514 | |
| | | | | |
Portfolio turnover rate | | | 63.64% | | | | 34.99% | | | | 46.03% | | | | 69.23% | | | | 40.54% | |
aThe amount shown for a share outstanding throughout the period may not correlate with the Statement of Operations for the period due to the timing of sales and repurchases of the Fund’s shares in relation to income earned and/or fluctuating fair value of the investments of the Fund.
bBased on average daily shares outstanding.
cNet investment income per share includes approximately $0.03 per share related to income received in the form of a special dividend in connection with certain Fund holdings. Excluding this amount, the ratio of net investment income to average net assets would have been 1.69%.
dAmount rounds to less than $0.01 per share.
eTotal return does not reflect sales commissions or contingent deferred sales charges, if applicable.
fBenefit of expense reduction rounds to less than 0.01%.
gBenefit of waiver and payments by affiliates rounds to less than 0.01%.
| | | | |
| | | |
| 34 | | Annual Report | The accompanying notes are an integral part of these financial statements. | | franklintempleton.com |
FRANKLIN INVESTORS SECURITIES TRUST
FINANCIAL HIGHLIGHTS
Franklin Balanced Fund (continued)
| | | | | | | | | | | | | | | | | | | | |
| | | Year Ended October 31, | |
| | | 2018 | | | 2017 | | | 2016 | | | 2015 | | | 2014 | |
| | | | | |
Class R | | | | | | | | | | | | | | | | | | | | |
| | | | | |
| Per share operating performance | | | | | | | | | | | | | | | | | | | | |
(for a share outstanding throughout the year) | | | | | | | | | | | | | | | | | | | | |
| | | | | |
Net asset value, beginning of year | | | $12.39 | | | | $11.67 | | | | $11.42 | | | | $11.89 | | | | $11.45 | |
| | | | | |
Income from investment operationsa: | | | | | | | | | | | | | | | | | | | | |
| | | | | |
Net investment incomeb | | | 0.26 | | | | 0.30 | | | | 0.27 | | | | 0.27 | | | | 0.29 | c |
| | | | | | |
Net realized and unrealized gains (losses) | | | (0.18 | ) | | | 0.92 | | | | 0.32 | | | | (0.24 | ) | | | 0.66 | |
| | | | | |
Total from investment operations | | | 0.08 | | | | 1.22 | | | | 0.59 | | | | 0.03 | | | | 0.95 | |
| | | | | |
Less distributions from: | | | | | | | | | | | | | | | | | | | | |
| | | | | |
Net investment income | | | (0.35 | ) | | | (0.33 | ) | | | (0.34 | ) | | | (0.34 | ) | | | (0.34 | ) |
| | | | | |
Net realized gains | | | (0.20 | ) | | | (0.17 | ) | | | (— | )d | | | (0.16 | ) | | | (0.17 | ) |
| | | | | |
Total distributions | | | (0.55 | ) | | | (0.50 | ) | | | (0.34 | ) | | | (0.50 | ) | | | (0.51 | ) |
| | | | | |
Net asset value, end of year | | | $11.92 | | | | $12.39 | | | | $11.67 | | | | $11.42 | | | | $11.89 | |
| | | | | |
Total return | | | 0.63% | | | | 10.66% | | | | 5.28% | | | | 0.21% | | | | 8.51% | |
| | | | | |
| Ratios to average net assets | | | | | | | | | | | | | | | | | | | | |
| | | | | |
Expenses before waiver and payments by affiliates | | | 1.27% | | | | 1.27% | | | | 1.27% | | | | 1.27% | | | | 1.29% | |
| | | | | |
Expenses net of waiver and payments by affiliatese | | | 1.26% | | | | 1.25% | | | | 1.26% | | | | 1.27% | f | | | 1.29% | f |
| | | | | | |
Net investment income | | | 1.97% | | | | 2.47% | | | | 2.37% | | | | 2.35% | | | | 2.44% | c |
| | | | | | |
| Supplemental data | | | | | | | | | | | | | | | | | | | | |
| | | | | |
Net assets, end of year (000’s) | | | $3,371 | | | | $4,763 | | | | $4,482 | | | | $4,699 | | | | $3,598 | |
| | | | | |
Portfolio turnover rate | | | 63.64% | | | | 34.99% | | | | 46.03% | | | | 69.23% | | | | 40.54% | |
aThe amount shown for a share outstanding throughout the period may not correlate with the Statement of Operations for the period due to the timing of sales and repurchases of the Fund’s shares in relation to income earned and/or fluctuating fair value of the investments of the Fund.
bBased on average daily shares outstanding.
cNet investment income per share includes approximately $0.03 per share related to income received in the form of a special dividend in connection with certain Fund holdings. Excluding this amount, the ratio of net investment income to average net assets would have been 2.19%.
dAmount rounds to less than $0.01 per share.
eBenefit of expense reduction rounds to less than 0.01%.
fBenefit of waiver and payments by affiliates rounds to less than 0.01%.
| | | | |
| | | |
| franklintempleton.com | | The accompanying notes are an integral part of these financial statements. | Annual Report | | 35 |
FRANKLIN INVESTORS SECURITIES TRUST
FINANCIAL HIGHLIGHTS
Franklin Balanced Fund (continued)
| | | | | | | | | | | | | | | | | | | | |
| | | Year Ended October 31, | |
| | | 2018 | | | 2017 | | | 2016 | | | 2015 | | | 2014 | |
| | | | | |
Class R6 | | | | | | | | | | | | | | | | | | | | |
| | | | | |
| Per share operating performance | | | | | | | | | | | | | | | | | | | | |
(for a share outstanding throughout the year) | | | | | | | | | | | | | | | | | | | | |
| | | | | |
Net asset value, beginning of year | | | $12.39 | | | | $11.67 | | | | $11.42 | | | | $11.89 | | | | $11.45 | |
| | | | | |
Income from investment operationsa: | | | | | | | | | | | | | | | | | | | | |
| | | | | |
Net investment incomeb | | | 0.31 | | | | 0.41 | | | | 0.34 | | | | 0.35 | | | | 0.37 | c |
| | | | | | |
Net realized and unrealized gains (losses) | | | (0.14 | ) | | | 0.88 | | | | 0.31 | | | | (0.25 | ) | | | 0.65 | |
| | | | | |
Total from investment operations | | | 0.17 | | | | 1.29 | | | | 0.65 | | | | 0.10 | | | | 1.02 | |
| | | | | |
Less distributions from: | | | | | | | | | | | | | | | | | | | | |
| | | | | |
Net investment income | | | (0.43 | ) | | | (0.40 | ) | | | (0.40 | ) | | | (0.41 | ) | | | (0.41 | ) |
| | | | | |
Net realized gains | | | (0.20 | ) | | | (0.17 | ) | | | (— | )d | | | (0.16 | ) | | | (0.17 | ) |
| | | | | |
Total distributions | | | (0.63 | ) | | | (0.57 | ) | | | (0.40 | ) | | | (0.57 | ) | | | (0.58 | ) |
| | | | | |
Net asset value, end of year | | | $11.93 | | | | $12.39 | | | | $11.67 | | | | $11.42 | | | | $11.89 | |
| | | | | |
Total return | | | 1.23% | | | | 11.33% | | | | 5.90% | | | | 0.81% | | | | 9.29% | |
| | | | | |
| Ratios to average net assets | | | | | | | | | | | | | | | | | | | | |
| | | | | |
Expenses before waiver and payments by affiliates | | | 0.68% | | | | 0.71% | | | | 0.73% | | | | 0.70% | | | | 0.68% | |
| | | | | |
Expenses net of waiver and payments by affiliatese | | | 0.66% | | | | 0.64% | | | | 0.66% | | | | 0.67% | | | | 0.68% | f |
| | | | | | |
Net investment income | | | 2.56% | | | | 3.08% | | | | 2.97% | | | | 2.95% | | | | 3.05% | c |
| | | | | | |
| Supplemental data | | | | | | | | | | | | | | | | | | | | |
| | | | | |
Net assets, end of year (000’s) | | | $138,923 | | | | $342 | | | | $233 | | | | $221 | | | | $513 | |
| | | | | |
Portfolio turnover rate | | | 63.64% | | | | 34.99% | | | | 46.03% | | | | 69.23% | | | | 40.54% | |
aThe amount shown for a share outstanding throughout the period may not correlate with the Statement of Operations for the period due to the timing of sales and repurchases of the Fund’s shares in relation to income earned and/or fluctuating fair value of the investments of the Fund.
bBased on average daily shares outstanding.
cNet investment income per share includes approximately $0.03 per share related to income received in the form of a special dividend in connection with certain Fund holdings. Excluding this amount, the ratio of net investment income to average net assets would have been 2.80%.
dAmount rounds to less than $0.01 per share.
eBenefit of expense reduction rounds to less than 0.01%.
fBenefit of waiver and payments by affiliates rounds to less than 0.01%.
| | | | |
| | | |
| 36 | | Annual Report | The accompanying notes are an integral part of these financial statements. | | franklintempleton.com |
FRANKLIN INVESTORS SECURITIES TRUST
FINANCIAL HIGHLIGHTS
Franklin Balanced Fund (continued)
| | | | | | | | | | | | | | | | | | | | |
| | | Year Ended October 31, | |
| | | 2018 | | | 2017 | | | 2016 | | | 2015 | | | 2014 | |
| | | | | |
Advisor Class | | | | | | | | | | | | | | | | | | | | |
| | | | | |
| Per share operating performance | | | | | | | | | | | | | | | | | | | | |
(for a share outstanding throughout the year) | | | | | | | | | | | | | | | | | | | | |
| | | | | |
Net asset value, beginning of year | | | $12.39 | | | | $11.67 | | | | $11.42 | | | | $11.88 | | | | $11.45 | |
| | | | | |
Income from investment operationsa: | | | | | | | | | | | | | | | | | | | | |
| | | | | |
Net investment incomeb | | | 0.30 | | | | 0.35 | | | | 0.29 | | | | 0.33 | | | | 0.35 | c |
| | | | | | |
Net realized and unrealized gains (losses) | | | (0.16 | ) | | | 0.93 | | | | 0.35 | | | | (0.24 | ) | | | 0.65 | |
| | | | | |
Total from investment operations | | | 0.14 | | | | 1.28 | | | | 0.64 | | | | 0.09 | | | | 1.00 | |
| | | | | |
Less distributions from: | | | | | | | | | | | | | | | | | | | | |
| | | | | |
Net investment income | | | (0.41 | ) | | | (0.39 | ) | | | (0.39 | ) | | | (0.39 | ) | | | (0.40 | ) |
| | | | | |
Net realized gains | | | (0.20 | ) | | | (0.17 | ) | | | (— | )d | | | (0.16 | ) | | | (0.17 | ) |
| | | | | |
Total distributions | | | (0.61 | ) | | | (0.56 | ) | | | (0.39 | ) | | | (0.55 | ) | | | (0.57 | ) |
| | | | | |
Net asset value, end of year | | | $11.92 | | | | $12.39 | | | | $11.67 | | | | $11.42 | | | | $11.88 | |
| | | | | |
Total return | | | 1.14% | | | | 11.21% | | | | 5.79% | | | | 0.81% | | | | 8.97% | |
| | | | | |
| Ratios to average net assets | | | | | | | | | | | | | | | | | | | | |
| | | | | |
Expenses before waiver and payments by affiliates | | | 0.77% | | | | 0.77% | | | | 0.77% | | | | 0.77% | | | | 0.79% | |
| | | | | |
Expenses net of waiver and payments by affiliatese | | | 0.76% | | | | 0.75% | | | | 0.76% | | | | 0.77% | f | | | 0.79% | f |
| | | | | | |
Net investment income | | | 2.47% | | | | 2.97% | | | | 2.87% | | | | 2.85% | | | | 2.94% | c |
| | | | | | |
| Supplemental data | | | | | | | | | | | | | | | | | | | | |
| | | | | |
Net assets, end of year (000’s) | | | $124,265 | | | | $243,674 | | | | $138,111 | | | | $54,881 | | | | $41,494 | |
| | | | | |
Portfolio turnover rate | | | 63.64% | | | | 34.99% | | | | 46.03% | | | | 69.23% | | | | 40.54% | |
aThe amount shown for a share outstanding throughout the period may not correlate with the Statement of Operations for the period due to the timing of sales and repurchases of the Fund’s shares in relation to income earned and/or fluctuating fair value of the investments of the Fund.
bBased on average daily shares outstanding.
cNet investment income per share includes approximately $0.03 per share related to income received in the form of a special dividend in connection with certain Fund holdings. Excluding this amount, the ratio of net investment income to average net assets would have been 2.69%.
dAmount rounds to less than $0.01 per share.
eBenefit of expense reduction rounds to less than 0.01%.
fBenefit of waiver and payments by affiliates rounds to less than 0.01%.
| | | | |
| | | |
| franklintempleton.com | | The accompanying notes are an integral part of these financial statements. | Annual Report | | 37 |
FRANKLIN INVESTORS SECURITIES TRUST
Statement of Investments, October 31, 2018
Franklin Balanced Fund
| | | | | | | | | | | | |
| | | Country | | | Shares | | | Value | |
| |
Common Stocks 40.5% | | | | | | | | | | | | |
Communication Services 1.7% | | | | | | | | | | | | |
a Verizon Communications Inc. | | | United States | | | | 980,100 | | | $ | 55,953,909 | |
| | | | | | | | | | | | |
Consumer Discretionary 1.9% | | | | | | | | | | | | |
b Amazon.com Inc. | | | United States | | | | 10,000 | | | | 15,980,100 | |
a Ford Motor Co. | | | United States | | | | 5,000,000 | | | | 47,750,000 | |
| | | | | | | | | | | | |
| | | |
| | | | | | | | | | | 63,730,100 | |
| | | | | | | | | | | | |
Consumer Staples 6.0% | | | | | | | | | | | | |
The Coca-Cola Co. | | | United States | | | | 650,200 | | | | 31,131,576 | |
Nestle SA | | | Switzerland | | | | 500,000 | | | | 41,925,000 | |
PepsiCo Inc. | | | United States | | | | 337,200 | | | | 37,894,536 | |
a Philip Morris International Inc. | | | United States | | | | 300,000 | | | | 26,421,000 | |
a The Procter & Gamble Co. | | | United States | | | | 700,000 | | | | 62,076,000 | |
| | | | | | | | | | | | |
| | | |
| | | | | | | | | | | 199,448,112 | |
| | | | | | | | | | | | |
Energy 3.5% | | | | | | | | | | | | |
Chevron Corp. | | | United States | | | | 375,000 | | | | 41,868,750 | |
Exxon Mobil Corp. | | | United States | | | | 535,000 | | | | 42,628,800 | |
Royal Dutch Shell PLC, A, ADR | | | United Kingdom | | | | 545,000 | | | | 34,438,550 | |
| | | | | | | | | | | | |
| | | |
| | | | | | | | | | | 118,936,100 | |
| | | | | | | | | | | | |
Financials 6.0% | | | | | | | | | | | | |
Bank of America Corp. | | | United States | | | | 1,496,715 | | | | 41,159,662 | |
The Charles Schwab Corp. | | | United States | | | | 505,000 | | | | 23,351,200 | |
JPMorgan Chase & Co. | | | United States | | | | 500,000 | | | | 54,510,000 | |
The Toronto-Dominion Bank | | | Canada | | | | 415,000 | | | | 23,015,900 | |
Wells Fargo & Co. | | | United States | | | | 1,100,000 | | | | 58,553,000 | |
| | | | | | | | | | | | |
| | | |
| | | | | | | | | | | 200,589,762 | |
| | | | | | | | | | | | |
Health Care 4.3% | | | | | | | | | | | | |
AbbVie Inc. | | | United States | | | | 200,000 | | | | 15,570,000 | |
AstraZeneca PLC, ADR | | | United Kingdom | | | | 1,100,000 | | | | 42,658,000 | |
a Johnson & Johnson | | | United States | | | | 267,000 | | | | 37,377,330 | |
a Pfizer Inc. | | | United States | | | | 1,150,000 | | | | 49,519,000 | |
| | | | | | | | | | | | |
| | | |
| | | | | | | | | | | 145,124,330 | |
| | | | | | | | | | | | |
Industrials 3.6% | | | | | | | | | | | | |
General Dynamics Corp. | | | United States | | | | 100,000 | | | | 17,258,000 | |
a Honeywell International Inc. | | | United States | | | | 200,000 | | | | 28,964,000 | |
Northrop Grumman Corp. | | | United States | | | | 105,000 | | | | 27,504,750 | |
Raytheon Co. | | | United States | | | | 260,000 | | | | 45,510,400 | |
b Resideo Technologies Inc. | | | United States | | | | 33,333 | | | | 701,667 | |
| | | | | | | | | | | | |
| | | |
| | | | | | | | | | | 119,938,817 | |
| | | | | | | | | | | | |
Information Technology 6.4% | | | | | | | | | | | | |
Analog Devices Inc. | | | United States | | | | 350,000 | | | | 29,298,500 | |
Apple Inc. | | | United States | | | | 200,000 | | | | 43,772,000 | |
Cisco Systems Inc. | | | United States | | | | 500,000 | | | | 22,875,000 | |
Intel Corp. | | | United States | | | | 500,000 | | | | 23,440,000 | |
Maxim Integrated Products Inc. | | | United States | | | | 325,000 | | | | 16,256,500 | |
Microsoft Corp. | | | United States | | | | 215,000 | | | | 22,964,150 | |
a Texas Instruments Inc. | | | United States | | | | 600,000 | | | | 55,698,000 | |
| | | | | | | | | | | | |
| | | |
| | | | | | | | | | | 214,304,150 | |
| | | | | | | | | | | | |
| | | | |
| | | |
| 38 | | Annual Report | | franklintempleton.com |
FRANKLIN INVESTORS SECURITIES TRUST
STATEMENT OF INVESTMENTS
| | | | | | | | | | | | |
Franklin Balanced Fund (continued) | |
| | | Country | | | Shares | | | Value | |
| |
Common Stocks (continued) | | | | | | | | | | | | |
Materials 1.6% | | | | | | | | | | | | |
BASF SE | | | Germany | | | | 400,000 | | | $ | 30,810,786 | |
DowDuPont Inc. | | | United States | | | | 400,000 | | | | 21,568,000 | |
| | | | | | | | | | | | |
| | | |
| | | | | | | | | | | 52,378,786 | |
| | | | | | | | | | | | |
Real Estate 2.3% | | | | | | | | | | | | |
American Tower Corp. | | | United States | | | | 305,970 | | | | 47,673,186 | |
Host Hotels & Resorts Inc. | | | United States | | | | 1,500,000 | | | | 28,665,000 | |
| | | | | | | | | | | | |
| | | |
| | | | | | | | | | | 76,338,186 | |
| | | | | | | | | | | | |
Utilities 3.2% | | | | | | | | | | | | |
a Dominion Energy Inc. | | | United States | | | | 550,000 | | | | 39,281,000 | |
NextEra Energy Inc. | | | United States | | | | 115,440 | | | | 19,913,400 | |
a Sempra Energy | | | United States | | | | 300,000 | | | | 33,036,000 | |
The Southern Co. | | | United States | | | | 350,000 | | | | 15,760,500 | |
| | | | | | | | | | | | |
| | | |
| | | | | | | | | | | 107,990,900 | |
| | | | | | | | | | | | |
Total Common Stocks (Cost $1,086,033,628) | | | | | | | | | | | 1,354,733,152 | |
| | | | | | | | | | | | |
| | | |
Management Investment Companies 1.9% | | | | | | | | | | | | |
Financials 1.9% | | | | | | | | | | | | |
c Franklin FTSE Europe Hedged ETF | | | United States | | | | 1,350,000 | | | | 32,123,250 | |
c Franklin FTSE Japan Hedged ETF | | | United States | | | | 1,250,000 | | | | 30,808,000 | |
| | | | | | | | | | | | |
Total Management Investment Companies
(Cost $66,585,500) | | | | | | | | | | | 62,931,250 | |
| | | | | | | | | | | | |
| | | |
d Equity-Linked Securities 10.6% | | | | | | | | | | | | |
Communication Services 2.5% | | | | | | | | | | | | |
e Royal Bank of Canada into Comcast Corp., 7.50%, 144A | | | United States | | | | 1,485,000 | | | | 53,968,201 | |
e UBS AG London into Alphabet Inc., 6.00%, 144A | | | United States | | | | 29,000 | | | | 30,558,982 | |
| | | | | | | | | | | | |
| | | |
| | | | | | | | | | | 84,527,183 | |
| | | | | | | | | | | | |
Industrials 1.7% | | | | | | | | | | | | |
e Barclays Bank PLC into General Electric Co., 7.00%, 144A | | | United States | | | | 2,390,000 | | | | 25,659,640 | |
e Goldman Sachs International into Union Pacific Corp., 7.50%, 144A | | | United States | | | | 200,000 | | | | 29,112,501 | |
| | | | | | | | | | | | |
| | | |
| | | | | | | | | | | 54,772,141 | |
| | | | | | | | | | | | |
Information Technology 6.4% | | | | | | | | | | | | |
e Barclays Bank PLC into Broadcom Inc., 8.50%, 144A | | | United States | | | | 156,000 | | | | 35,925,018 | |
e BNP Paribas Arbitrage Issuance BV into Microsoft Corp., 6.50%, 144A | | | United States | | | | 410,000 | | | | 41,992,428 | |
e BNP Paribas Arbitrage Issuance BV into Oracle Corp., 6.50%, 144A | | | United States | | | | 582,000 | | | | 28,197,753 | |
e Credit Suisse AG London into Analog Devices Inc., 7.00%, 144A | | | United States | | | | 430,000 | | | | 36,530,711 | |
e Deutsche Bank AG London into Apple Inc., 6.50%, 144A | | | United States | | | | 200,000 | | | | 39,037,959 | |
e JPMorgan Chase Financial Co. LLC into Intel Corp., 9.00%, 144A | | | United States | | | | 685,000 | | | | 32,855,447 | |
| | | | | | | | | | | | |
| | | |
| | | | | | | | | | | 214,539,316 | |
| | | | | | | | | | | | |
| | | |
Total Equity-Linked Securities (Cost $359,820,760) | | | | | | | | | | | 353,838,640 | |
| | | | | | | | | | | | |
| | | |
Convertible Preferred Stocks (Cost $10,227,000) 0.3% | | | | | | | | | | | | |
Utilities 0.3% | | | | | | | | | | | | |
Sempra Energy, 6.00%, cvt. pfd., A | | | United States | | | | 100,000 | | | | 9,916,000 | |
| | | | | | | | | | | | |
| | | |
| | | | | | Units | | | | |
| | | |
f Index-Linked Notes (Cost $33,147,500) 1.0% | | | | | | | | | | | | |
Financials 1.0% | | | | | | | | | | | | |
| e,g Morgan Stanley Finance LLC, senior note, 144A, 5.89%, 10/03/19 | | | United States | | | | 250,000 | | | | 33,322,500 | |
| | | | | | | | | | | | |
| | | | |
| | | |
| franklintempleton.com | | Annual Report | | 39 |
FRANKLIN INVESTORS SECURITIES TRUST
STATEMENT OF INVESTMENTS
| | | | | | | | | | | | |
Franklin Balanced Fund (continued) | |
| | | Country | | |
| Principal
Amount |
* | | | Value | |
| |
Convertible Bonds (Cost $15,000,000) 0.3% | | | | | | | | | | | | |
Energy 0.3% | | | | | | | | | | | | |
Weatherford International Ltd., cvt., senior note, 5.875%, 7/01/21 | | | United States | | | $ | 15,000,000 | | | $ | 11,550,435 | |
| | | | | | | | | | | | |
| | | |
Corporate Bonds 33.7% | | | | | | | | | | | | |
Communication Services 3.4% | | | | | | | | | | | | |
AT&T Inc., senior note, 3.95%, 1/15/25 | | | United States | | | | 11,700,000 | | | | 11,369,530 | |
CCO Holdings LLC/CCO Holdings Capital Corp., | | | | | | | | | | | | |
senior bond, 5.75%, 1/15/24 | | | United States | | | | 5,000,000 | | | | 5,062,500 | |
e senior bond, 144A, 5.125%, 5/01/27 | | | United States | | | | 15,000,000 | | | | 14,156,250 | |
Charter Communications Operating LLC/Charter Communications Operating Capital Corp., senior secured note, first lien, 4.908%, 7/23/25 | | | United States | | | | 20,000,000 | | | | 20,169,344 | |
DISH DBS Corp., senior bond, 5.875%, 7/15/22 | | | United States | | | | 12,000,000 | | | | 11,385,000 | |
e Sirius XM Radio Inc., senior bond, 144A, 5.375%, 4/15/25 | | | United States | | | | 15,000,000 | | | | 14,896,875 | |
Sprint Corp., senior note, 7.625%, 2/15/25 | | | United States | | | | 10,000,000 | | | | 10,412,500 | |
e Sprint Spectrum Co. LLC/Sprint Spectrum Co. II LLC, senior secured bond, first lien, 144A, 4.738%, 9/20/29 | | | United States | | | | 25,000,000 | | | | 25,007,500 | |
| | | | | | | | | | | | |
| | | |
| | | | | | | | | | | 112,459,499 | |
| | | | | | | | | | | | |
Consumer Discretionary 3.4% | | | | | | | | | | | | |
Amazon.com Inc., | | | | | | | | | | | | |
senior note, 5.20%, 12/03/25 | | | United States | | | | 20,000,000 | | | | 21,689,854 | |
senior note, 2.40%, 2/22/23 | | | United States | | | | 10,000,000 | | | | 9,563,019 | |
Dollar General Corp., | | | | | | | | | | | | |
senior bond, 3.25%, 4/15/23 | | | United States | | | | 15,000,000 | | | | 14,584,416 | |
senior bond, 3.875%, 4/15/27 | | | United States | | | | 10,000,000 | | | | 9,552,047 | |
NIKE Inc., senior bond, 2.375%, 11/01/26 | | | United States | | | | 30,000,000 | | | | 26,980,376 | |
e Wynn Las Vegas LLC/Wynn Las Vegas Capital Corp., senior bond, 144A, 5.50%, 3/01/25 | | | United States | | | | 10,000,000 | | | | 9,537,500 | |
e Wynn Macau Ltd., senior bond, 144A, 5.50%, 10/01/27 | | | Macau | | | | 25,000,000 | | | | 22,687,500 | |
| | | | | | | | | | | | |
| | | |
| | | | | | | | | | | 114,594,712 | |
| | | | | | | | | | | | |
Consumer Staples 4.2% | | | | | | | | | | | | |
Anheuser-Busch InBev Finance Inc., senior bond, 4.90%, 2/01/46 | | | Belgium | | | | 10,000,000 | | | | 9,477,410 | |
The Clorox Co., senior bond, 3.10%, 10/01/27 | | | United States | | | | 22,500,000 | | | | 20,884,547 | |
Costco Wholesale Corp., senior note, 2.75%, 5/18/24 | | | United States | | | | 30,000,000 | | | | 28,925,395 | |
Kraft Heinz Foods Co., senior bond, 3.50%, 6/06/22 | | | United States | | | | 15,000,000 | | | | 14,837,343 | |
Mondelez International Inc., senior bond, 4.00%, 2/01/24 | | | United States | | | | 15,000,000 | | | | 15,030,828 | |
The Procter & Gamble Co., senior note, 2.70%, 2/02/26 | | | United States | | | | 25,000,000 | | | | 23,434,393 | |
Reynolds American Inc., senior note, 4.45%, 6/12/25 | | | United Kingdom | | | | 15,000,000 | | | | 14,945,070 | |
Tyson Foods Inc., senior bond, 3.95%, 8/15/24 | | | United States | | | | 12,100,000 | | | | 12,052,239 | |
| | | | | | | | | | | | |
| | | |
| | | | | | | | | | | 139,587,225 | |
| | | | | | | | | | | | |
Energy 3.1% | | | | | | | | | | | | |
Energy Transfer Operating LP, senior bond, 3.60%, 2/01/23 | | | United States | | | | 15,000,000 | | | | 14,621,264 | |
Kinder Morgan Energy Partners LP, senior note, 4.30%, 5/01/24 | | | United States | | | | 12,900,000 | | | | 12,943,314 | |
Nabors Industries Inc., senior note, 5.50%, 1/15/23 | | | United States | | | | 15,000,000 | | | | 14,173,683 | |
Oceaneering International Inc., | | | | | | | | | | | | |
senior note, 4.65%, 11/15/24 | | | United States | | | | 9,400,000 | | | | 8,739,966 | |
senior note, 6.00%, 2/01/28 | | | United States | | | | 20,000,000 | | | | 19,533,825 | |
Sabine Pass Liquefaction LLC, senior secured bond, first lien, 5.00%, 3/15/27 | | | United States | | | | 8,200,000 | | | | 8,244,252 | |
The Williams Companies Inc., | | | | | | | | | | | | |
senior note, 3.60%, 3/15/22 | | | United States | | | | 15,000,000 | | | | 14,776,632 | |
senior note, 4.55%, 6/24/24 | | | United States | | | | 10,000,000 | | | | 10,078,156 | |
| | | | | | | | | | | | |
| | | |
| | | | | | | | | | | 103,111,092 | |
| | | | | | | | | | | | |
| | | | |
| | | |
| 40 | | Annual Report | | franklintempleton.com |
FRANKLIN INVESTORS SECURITIES TRUST
STATEMENT OF INVESTMENTS
| | | | | | | | | | | | |
| Franklin Balanced Fund (continued) | |
| | | Country | | |
| Principal
Amount |
* | | | Value | |
| |
Corporate Bonds (continued) | | | | | | | | | | | | |
Financials 7.0% | | | | | | | | | | | | |
Capital One Financial Corp., | | | | | | | | | | | | |
senior bond, 3.80%, 1/31/28 | | | United States | | | $ | 20,000,000 | | | $ | 18,466,058 | |
senior note, 3.75%, 3/09/27 | | | United States | | | | 10,000,000 | | | | 9,297,691 | |
h Capital One NA, FRN, 3.099%, (3-month USD LIBOR + 0.765%), 9/13/19 | | | United States | | | | 10,000,000 | | | | 10,043,895 | |
Citigroup Inc., | | | | | | | | | | | | |
i junior sub. bond, P, 5.95% to 5/15/25, FRN thereafter, Perpetual | | | United States | | | | 15,000,000 | | | | 14,803,125 | |
sub. bond, 4.125%, 7/25/28 | | | United States | | | | 15,000,000 | | | | 14,257,148 | |
Compass Bank, sub. note, 3.875%, 4/10/25 | | | United States | | | | 15,000,000 | | | | 14,263,930 | |
HSBC Holdings PLC, senior bond, 4.292% to 9/12/25, FRN thereafter, 9/12/26 | | | United Kingdom | | | | 20,000,000 | | | | 19,725,400 | |
JPMorgan Chase & Co., | | | | | | | | | | | | |
i junior sub. bond, V, 5.00% to 7/30/19, FRN thereafter, Perpetual | | | United States | | | | 13,000,000 | | | | 13,016,250 | |
senior note, 2.295%, 8/15/21 | | | United States | | | | 15,000,000 | | | | 14,522,798 | |
e Liberty Mutual Group Inc., senior note, 144A, 4.95%, 5/01/22 | | | United States | | | | 7,100,000 | | | | 7,315,605 | |
e Mizuho Bank Ltd., senior note, 144A, 2.45%, 4/16/19 | | | Japan | | | | 12,000,000 | | | | 11,976,429 | |
Morgan Stanley, | | | | | | | | | | | | |
senior note, 3.125%, 1/23/23 | | | United States | | | | 20,000,000 | | | | 19,374,278 | |
senior sub. bond, 4.35%, 9/08/26 | | | United States | | | | 15,000,000 | | | | 14,633,081 | |
Navient Corp., senior note, 6.125%, 3/25/24 | | | United States | | | | 15,000,000 | | | | 14,681,250 | |
i PNC Financial Services Group Inc., junior sub. note, 4.85% to 6/01/23, FRN thereafter, Perpetual | | | United States | | | | 12,000,000 | | | | 11,610,000 | |
e Pricoa Global Funding I, secured note, 144A, 2.45%, 9/21/22 | | | United States | | | | 10,000,000 | | | | 9,606,837 | |
i Wells Fargo & Co., junior sub. bond, 5.875% to 6/15/25, FRN thereafter, Perpetual | | | United States | | | | 15,000,000 | | | | 15,468,750 | |
| | | | | | | | | | | | |
| | | |
| | | | | | | | | | | 233,062,525 | |
| | | | | | | | | | | | |
Health Care 5.5% | | | | | | | | | | | | |
Anthem Inc., senior bond, 3.65%, 12/01/27 | | | United States | | | | 10,000,000 | | | | 9,366,817 | |
e Bausch Health Cos. Inc., | | | | | | | | | | | | |
senior bond, 144A, 6.125%, 4/15/25 | | | United States | | | | 6,300,000 | | | | 5,809,860 | |
senior note, 144A, 5.875%, 5/15/23 | | | United States | | | | 8,300,000 | | | | 7,968,000 | |
senior secured note, first lien, 144A, 5.50%, 11/01/25 | | | United States | | | | 10,000,000 | | | | 9,837,500 | |
Biogen Inc., senior note, 3.625%, 9/15/22 | | | United States | | | | 10,000,000 | | | | 9,988,296 | |
Celgene Corp., senior note, 3.625%, 5/15/24 | | | United States | | | | 10,000,000 | | | | 9,724,657 | |
CHS/Community Health Systems Inc., senior secured note, first lien, 6.25%, 3/31/23 | | | United States | | | | 21,400,000 | | | | 19,761,830 | |
CVS Health Corp., | | | | | | | | | | | | |
senior bond, 5.05%, 3/25/48 | | | United States | | | | 12,300,000 | | | | 12,035,804 | |
senior note, 3.875%, 7/20/25 | | | United States | | | | 15,000,000 | | | | 14,620,483 | |
Edwards Lifesciences Corp., senior note, 4.30%, 6/15/28 | | | United States | | | | 9,700,000 | | | | 9,649,902 | |
e Halfmoon Parent Inc., senior secured note, 144A, 3.75%, 7/15/23 | | | United States | | | | 20,000,000 | | | | 19,858,423 | |
HCA Inc., senior note, 5.375%, 9/01/26 | | | United States | | | | 25,000,000 | | | | 24,875,000 | |
e Mylan Inc., senior bond, 144A, 4.55%, 4/15/28 | | | United States | | | | 19,000,000 | | | | 17,616,625 | |
Tenet Healthcare Corp., senior secured note, first lien, 4.625%, 7/15/24 | | | United States | | | | 15,000,000 | | | | 14,495,250 | |
| | | | | | | | | | | | |
| | | |
| | | | | | | | | | | 185,608,447 | |
| | | | | | | | | | | | |
Industrials 1.6% | | | | | | | | | | | | |
e Air Canada 2013-1A Pass Through Trust, first lien, 144A, 4.125%, 11/15/26 | | | Canada | | | | 5,497,629 | | | | 5,549,856 | |
CNH Industrial NV, senior bond, 3.85%, 11/15/27 | | | United Kingdom | | | | 15,000,000 | | | | 13,975,875 | |
Lockheed Martin Corp., senior bond, 3.55%, 1/15/26 | | | United States | | | | 20,000,000 | | | | 19,552,906 | |
United Rentals North America Inc., senior note, 4.625%, 10/15/25 | | | United States | | | | 15,000,000 | | | | 13,931,250 | |
| | | | | | | | | | | | |
| | | |
| | | | | | | | | | | 53,009,887 | |
| | | | | | | | | | | | |
| | | | |
| | | |
| franklintempleton.com | | Annual Report | | 41 |
FRANKLIN INVESTORS SECURITIES TRUST
STATEMENT OF INVESTMENTS
| | | | | | | | | | | | |
Franklin Balanced Fund (continued) | |
| | | Country | | |
| Principal
Amount |
* | | | Value | |
| |
Corporate Bonds (continued) | | | | | | | | | | | | |
Information Technology 1.8% | | | | | | | | | | | | |
e CommScope Technologies LLC, senior bond, 144A, 5.00%, 3/15/27 | | | United States | | | $ | 20,000,000 | | | $ | 18,000,000 | |
e Dell International LLC/EMC Corp., senior secured note, first lien, 144A, 4.42%, 6/15/21 | | | United States | | | | 18,000,000 | | | | 18,160,738 | |
Fiserv Inc., senior bond, 4.20%, 10/01/28 | | | United States | | | | 15,000,000 | | | | 14,879,170 | |
Xilinx Inc., senior note, 2.95%, 6/01/24 | | | United States | | | | 11,000,000 | | | | 10,436,841 | |
| | | | | | | | | | | | |
| | | |
| | | | | | | | | | | 61,476,749 | |
| | | | | | | | | | | | |
Materials 0.6% | | | | | | | | | | | | |
e Syngenta Finance NV, senior note, 144A, 5.182%, 4/24/28 | | | Switzerland | | | | 20,000,000 | | | | 18,894,500 | |
| | | | | | | | | | | | |
Real Estate 1.7% | | | | | | | | | | | | |
HCP Inc., senior bond, 3.875%, 8/15/24 | | | United States | | | | 21,700,000 | | | | 21,166,523 | |
Healthcare Trust of America Holdings LP, senior note, 3.375%, 7/15/21 | | | United States | | | | 10,000,000 | | | | 9,902,387 | |
Prologis LP, senior note, 4.25%, 8/15/23 | | | United States | | | | 12,000,000 | | | | 12,345,231 | |
Realty Income Corp., senior bond, 3.875%, 7/15/24 | | | United States | | | | 15,000,000 | | | | 14,922,591 | |
| | | | | | | | | | | | |
| | | |
| | | | | | | | | | | 58,336,732 | |
| | | | | | | | | | | | |
Utilities 1.4% | | | | | | | | | | | | |
Duke Energy Corp., senior bond, 3.15%, 8/15/27 | | | United States | | | | 20,000,000 | | | | 18,378,480 | |
e,i EDF SA, junior sub. note, 144A, 5.25% to 1/29/23, FRN thereafter, Perpetual | | | France | | | | 10,000,000 | | | | 9,704,150 | |
PSEG Power LLC, senior note, 3.00%, 6/15/21 | | | United States | | | | 20,000,000 | | | | 19,683,363 | |
| | | | | | | | | | | | |
| | | | | | | | | | | 47,765,993 | |
| | | | | | | | | | | | |
Total Corporate Bonds (Cost $1,155,126,382) | | | | | | | | | | | 1,127,907,361 | |
| | | | | | | | | | | | |
U.S. Government and Agency Securities 5.2% | | | | | | | | | | | | |
U.S. Treasury Note, | | | | | | | | | | | | |
2.75%, 9/30/20 | | | United States | | | | 75,000,000 | | | | 74,838,867 | |
2.75%, 9/15/21 | | | United States | | | | 50,000,000 | | | | 49,758,789 | |
2.875%, 10/31/23 | | | United States | | | | 50,000,000 | | | | 49,756,836 | |
| | | | | | | | | | | | |
Total U.S. Government and Agency Securities
(Cost $174,668,254) | | | | | | | | | | | 174,354,492 | |
| | | | | | | | | | | | |
| | | |
| |
| Number of
Contracts |
| |
| Notional
Amount |
* | | | | |
Options Purchased (Cost $39,730,086) 1.9% | | | | | | | | | | | | |
Puts - Exchange-Traded | | | | | | | | | | | | |
S&P 500 Index, Put Option, Strike Price $2900, Expires 12/20/19 | | | 2,500 | | | | 250,000 | | | | 64,250,000 | |
| | | | | | | | | | | | |
Total Investments before Short Term Investments
(Cost $2,940,339,110) | | | | | | | | | | | 3,192,803,830 | |
| | | | | | | | | | | | |
| | | | |
| | | |
| 42 | | Annual Report | | franklintempleton.com |
FRANKLIN INVESTORS SECURITIES TRUST
STATEMENT OF INVESTMENTS
| | | | | | | | | | | | |
Franklin Balanced Fund (continued) | |
| | | Country | | | | Shares | | | | Value | |
| |
Short Term Investments (Cost $126,683,009) 3.8% | | | | | | | | | | | | |
| | | |
Money Market Funds 3.8% | | | | | | | | | | | | |
c,j Institutional Fiduciary Trust Money Market Portfolio, 1.83% | | | United States | | | | 126,683,009 | | | $ | 126,683,009 | |
| | | | | | | | | | | | |
Total Investments (Cost $3,067,022,119) 99.2% | | | | | | | | | | | 3,319,486,839 | |
Options Written (0.3)% | | | | | | | | | | | (8,390,000 | ) |
Other Assets, less Liabilities 1.1% | | | | | | | | | | | 35,470,060 | |
| | | | | | | | | | | | |
Net Assets 100.0% | | | | | | | | | | $ | 3,346,566,899 | |
| | | | | | | | | | | | |
| | | |
| |
| Number of
Contracts |
| |
| Notional
Amount |
* | | | | |
k Options Written (0.3)% | | | | | | | | | | | | |
Calls - Exchange-Traded | | | | | | | | | | | | |
Dominion Energy Inc., Call Option, Strike Price $75, Expires 12/21/18 | | | 2,500 | | | | 250,000 | | | | (187,500 | ) |
Ford Motor Co., Call Option, Strike Price $11, Expires 1/18/19 | | | 25,000 | | | | 2,500,000 | | | | (250,000 | ) |
Honeywell International Inc., Call Option, Strike Price $155, Expires 12/21/18 | | | 2,000 | | | | 200,000 | | | | (268,000 | ) |
Johnson & Johnson, Call Option, Strike Price $145, Expires 12/21/18 | | | 2,000 | | | | 200,000 | | | | (290,000 | ) |
Pfizer Inc., Call Option, Strike Price $45, Expires 12/21/18 | | | 5,000 | | | | 500,000 | | | | (195,000 | ) |
Philip Morris International Inc., Call Option, Strike Price $92.50, Expires 12/21/18 | | | 3,000 | | | | 300,000 | | | | (396,000 | ) |
Procter & Gamble Co., Call Option, Strike Price $92.50, Expires 1/18/19 | | | 3,000 | | | | 300,000 | | | | (372,000 | ) |
Sempra Energy, Call Option, Strike Price $120, Expires 11/16/18 | | | 1,500 | | | | 150,000 | | | | (15,000 | ) |
Texas Instruments Inc., Call Option, Strike Price $110, Expires 1/18/19 | | | 3,000 | | | | 300,000 | | | | (108,000 | ) |
Verizon Communications Inc., Call Option, Strike Price $60, Expires 12/21/18 | | | 5,000 | | | | 500,000 | | | | (280,000 | ) |
| | | | | | | | | | | | |
| | | |
| | | | | | | | | | | (2,361,500 | ) |
| | | | | | | | | | | | |
Puts - Exchange-Traded | | | | | | | | | | | | |
Alphabet Inc., Put Option, Strike Price $1050, Expires 12/21/18 | | | 150 | | | | 15,000 | | | | (433,500 | ) |
S&P 500 Index, Put Option, Strike Price $2500, Expires 12/21/18 | | | 2,500 | | | | 250,000 | | | | (5,595,000 | ) |
| | | | | | | | | | | | |
| | | |
| | | | | | | | | | | (6,028,500 | ) |
| | | | | | | | | | | | |
Total Options Written (Premiums received $10,407,129) | | | | | | | | | | $ | (8,390,000 | ) |
| | | | | | | | | | | | |
See Abbreviations on page 90.
*The principal/notional amount is stated in U.S. dollars unless otherwise indicated.
aA portion or all of the security is held in connection with written option contracts open at year end.
bNon-income producing.
cSee Note 3(f) regarding investments in affiliated management investment companies.
dSee Note 1(f) regarding equity-linked securities.
eSecurity was purchased pursuant to Rule 144A under the Securities Act of 1933 and may be sold in transactions exempt from registration only to qualified institutional buyers or in a public offering registered under the Securities Act of 1933. These securities have been deemed liquid under guidelines approved by the Trust’s Board of Trustees. At October 31, 2018, the aggregate value of these securities was $633,745,288, representing 18.9% of net assets.
fSee Note 1(e) regarding index-linked notes.
gSecurity pays a fixed 2.00% coupon rate and a variable coupon based on the distribution of the Morgan Stanley Custom Enhanced SPX B DT Index 20 Delta. The coupon rate shown represents the combined rate at period end. Cash payment at maturity or upon early redemption is based on the performance of the Morgan Stanley Custom Enhanced SPX B DT Index 20 Delta.
hThe coupon rate shown represents the rate at period end.
iPerpetual security with no stated maturity date.
jThe rate shown is the annualized seven-day effective yield at period end.
kSee Note 1(d) regarding written options.
| | | | |
| | | |
| franklintempleton.com | | The accompanying notes are an integral part of these financial statements. | Annual Report | | 43 |
FRANKLIN INVESTORS SECURITIES TRUST
Financial Highlights
Franklin Convertible Securities Fund
| | | | | | | | | | | | | | | | | | | | |
| | | Year Ended October 31, | |
| | | 2018 | | | 2017 | | | 2016 | | | 2015 | | | 2014 | |
Class A | | | | | | | | | | | | | | | | | | | | |
| | | | | |
| Per share operating performance | | | | | | | | | | | | | | | | | | | | |
(for a share outstanding throughout the year) | | | | | | | | | | | | | | | | | | | | |
| | | | | |
Net asset value, beginning of year | | | $20.68 | | | | $18.24 | | | | $18.00 | | | | $18.97 | | | | $17.82 | |
| | | | | |
Income from investment operationsa: | | | | | | | | | | | | | | | | | | | | |
| | | | | |
Net investment incomeb | | | 0.16 | | | | 0.27 | | | | 0.25 | | | | 0.24 | | | | 0.23 | |
| | | | | |
Net realized and unrealized gains (losses) | | | 1.35 | | | | 2.98 | | | | 0.85 | | | | (0.14 | ) | | | 1.32 | |
| | | | | |
Total from investment operations | | | 1.51 | | | | 3.25 | | | | 1.10 | | | | 0.10 | | | | 1.55 | |
| | | | | |
Less distributions from: | | | | | | | | | | | | | | | | | | | | |
| | | | | |
Net investment income | | | (0.49 | ) | | | (0.47 | ) | | | (0.50 | ) | | | (0.39 | ) | | | (0.33 | ) |
| | | | | |
Net realized gains | | | (1.05 | ) | | | (0.34 | ) | | | (0.36 | ) | | | (0.68 | ) | | | (0.07 | ) |
| | | | | |
Total distributions | | | (1.54 | ) | | | (0.81 | ) | | | (0.86 | ) | | | (1.07 | ) | | | (0.40 | ) |
| | | | | |
Net asset value, end of year | | | $20.65 | | | | $20.68 | | | | $18.24 | | | | $18.00 | | | | $18.97 | |
| | | | | |
Total returnc | | | 7.65% | | | | 18.39% | | | | 6.41% | | | | 0.66% | | | | 8.85% | |
| | | | | |
| Ratios to average net assets | | | | | | | | | | | | | | | | | | | | |
| | | | | |
Expenses before waiver and payments by affiliates | | | 0.86% | | | | 0.85% | | | | 0.86% | | | | 0.86% | | | | 0.88% | |
| | | | | |
Expenses net of waiver and payments by affiliatesd | | | 0.84% | | | | 0.84% | | | | 0.85% | | | | 0.86% | e | | | 0.88% | e |
| | | | | | |
Net investment income | | | 0.76% | | | | 1.39% | | | | 1.44% | | | | 1.33% | | | | 1.23% | |
| | | | | |
| Supplemental data | | | | | | | | | | | | | | | | | | | | |
| | | | | |
Net assets, end of year (000’s) | | | $1,153,875 | | | | $815,491 | | | | $768,553 | | | | $818,082 | | | | $921,134 | |
| | | | | |
Portfolio turnover rate | | | 35.90% | | | | 27.24% | | | | 28.03% | | | | 17.30% | | | | 23.05% | |
aThe amount shown for a share outstanding throughout the period may not correlate with the Statement of Operations for the period due to the timing of sales and repurchases of the Fund’s shares in relation to income earned and/or fluctuating fair value of the investments of the Fund.
bBased on average daily shares outstanding.
cTotal return does not reflect sales commissions or contingent deferred sales charges, if applicable.
dBenefit of expense reduction rounds to less than 0.01%.
eBenefit of waiver and payments by affiliates rounds to less than 0.01%.
| | | | |
| | | |
| 44 | | Annual Report | The accompanying notes are an integral part of these financial statements. | | franklintempleton.com |
FRANKLIN INVESTORS SECURITIES TRUST
FINANCIAL HIGHLIGHTS
Franklin Convertible Securities Fund (continued)
| | | | | | | | | | | | | | | | | | | | |
| | | Year Ended October 31, | |
| | | 2018 | | | 2017 | | | 2016 | | | 2015 | | | 2014 | |
| | | | | | |
Class C | | | | | | | | | | | | | | | | | | | | |
| | | | | |
| Per share operating performance | | | | | | | | | | | | | | | | | | | | |
(for a share outstanding throughout the year) | | | | | | | | | | | | | | | | | | | | |
| | | | | |
Net asset value, beginning of year | | | $20.37 | | | | $17.98 | | | | $17.75 | | | | $18.73 | | | | $17.60 | |
| | | | | |
Income from investment operationsa: | | | | | | | | | | | | | | | | | | | | |
| | | | | |
Net investment incomeb | | | (— | )c | | | 0.12 | | | | 0.12 | | | | 0.11 | | | | 0.09 | |
| | | | | |
Net realized and unrealized gains (losses) | | | 1.33 | | | | 2.93 | | | | 0.84 | | | | (0.16 | ) | | | 1.31 | |
| | | | | |
Total from investment operations | | | 1.33 | | | | 3.05 | | | | 0.96 | | | | (0.05 | ) | | | 1.40 | |
| | | | | |
Less distributions from: | | | | | | | | | | | | | | | | | | | | |
| | | | | |
Net investment income | | | (0.34 | ) | | | (0.32 | ) | | | (0.37 | ) | | | (0.25 | ) | | | (0.20 | ) |
| | | | | |
Net realized gains | | | (1.05 | ) | | | (0.34 | ) | | | (0.36 | ) | | | (0.68 | ) | | | (0.07 | ) |
| | | | | |
Total distributions | | | (1.39 | ) | | | (0.66 | ) | | | (0.73 | ) | | | (0.93 | ) | | | (0.27 | ) |
| | | | | |
Net asset value, end of year | | | $20.31 | | | | $20.37 | | | | $17.98 | | | | $17.75 | | | | $18.73 | |
| | | | | |
Total returnd | | | 6.84% | | | | 17.49% | | | | 5.65% | | | | (0.15)% | | | | 8.01% | |
| | | | | |
| Ratios to average net assets | | | | | | | | | | | | | | | | | | | | |
| | | | | |
Expenses before waiver and payments by affiliates | | | 1.61% | | | | 1.60% | | | | 1.61% | | | | 1.61% | | | | 1.63% | |
| | | | | |
Expenses net of waiver and payments by affiliatese | | | 1.59% | | | | 1.59% | | | | 1.60% | | | | 1.61% | f | | | 1.63% | f |
| | | | | | |
Net investment income | | | 0.01% | | | | 0.64% | | | | 0.69% | | | | 0.58% | | | | 0.48% | |
| | | | | |
| Supplemental data | | | | | | | | | | | | | | | | | | | | |
| | | | | |
Net assets, end of year (000’s) | | | $299,716 | | | | $303,243 | | | | $293,038 | | | | $311,951 | | | | $333,034 | |
| | | | | |
Portfolio turnover rate | | | 35.90% | | | | 27.24% | | | | 28.03% | | | | 17.30% | | | | 23.05% | |
aThe amount shown for a share outstanding throughout the period may not correlate with the Statement of Operations for the period due to the timing of sales and repurchases of the Fund’s shares in relation to income earned and/or fluctuating fair value of the investments of the Fund.
bBased on average daily shares outstanding.
cAmount rounds to less than $0.01 per share.
dTotal return does not reflect sales commissions or contingent deferred sales charges, if applicable.
eBenefit of expense reduction rounds to less than 0.01%.
fBenefit of waiver and payments by affiliates rounds to less than 0.01%.
| | | | |
| | | |
| franklintempleton.com | | The accompanying notes are an integral part of these financial statements. | Annual Report | | 45 |
FRANKLIN INVESTORS SECURITIES TRUST
FINANCIAL HIGHLIGHTS
Franklin Convertible Securities Fund (continued)
| | | | | | | | | | | | | | | | | | | | |
| | | Year Ended October 31, | |
| | | 2018 | | | 2017 | | | 2016 | | | 2015 | | | 2014a | |
| | | | | |
Class R6 | | | | | | | | | | | | | | | | | | | | |
| | | | | |
| Per share operating performance | | | | | | | | | | | | | | | | | | | | |
(for a share outstanding throughout the year) | | | | | | | | | | | | | | | | | | | | |
| | | | | |
Net asset value, beginning of year | | | $20.79 | | | | $18.33 | | | | $18.09 | | | | $18.99 | | | | $19.21 | |
| | | | | |
Income from investment operationsb: | | | | | | | | | | | | | | | | | | | | |
| | | | | |
Net investment incomec | | | 0.24 | | | | 0.34 | | | | 0.33 | | | | 0.30 | | | | 0.19 | |
| | | | | |
Net realized and unrealized gains (losses) | | | 1.36 | | | | 3.00 | | | | 0.84 | | | | (0.14 | ) | | | (0.17 | ) |
| | | | | |
Total from investment operations | | | 1.60 | | | | 3.34 | | | | 1.17 | | | | 0.16 | | | | 0.02 | |
| | | | | |
Less distributions from: | | | | | | | | | | | | | | | | | | | | |
| | | | | |
Net investment income | | | (0.56 | ) | | | (0.54 | ) | | | (0.57 | ) | | | (0.38 | ) | | | (0.24 | ) |
| | | | | |
Net realized gains | | | (1.05 | ) | | | (0.34 | ) | | | (0.36 | ) | | | (0.68 | ) | | | — | |
| | | | | |
Total distributions | | | (1.61 | ) | | | (0.88 | ) | | | (0.93 | ) | | | (1.06 | ) | | | (0.24 | ) |
| | | | | |
Net asset value, end of year | | | $20.78 | | | | $20.79 | | | | $18.33 | | | | $18.09 | | | | $18.99 | |
| | | | | |
Total returnd | | | 8.07% | | | | 18.84% | | | | 6.78% | | | | 0.99% | | | | 0.11% | |
| | | | | |
| Ratios to average net assetse | | | | | | | | | | | | | | | | | | | | |
| | | | | |
Expenses before waiver and payments by affiliates | | | 0.55% | | | | 0.49% | | | | 0.50% | | | | 0.50% | | | | 0.51% | |
| | | | | |
Expenses net of waiver and payments by affiliatesf | | | 0.49% | | | | 0.48% | | | | 0.49% | | | | 0.50% | g | | | 0.51% | g |
| | | | | | |
Net investment income | | | 1.11% | | | | 1.75% | | | | 1.80% | | | | 1.69% | | | | 1.60% | |
| | | | | |
| Supplemental data | | | | | | | | | | | | | | | | | | | | |
| | | | | |
Net assets, end of year (000’s) | | | $57,824 | | | | $22,950 | | | | $7,154 | | | | $5 | | | | $3,093 | |
| | | | | |
Portfolio turnover rate | | | 35.90% | | | | 27.24% | | | | 28.03% | | | | 17.30% | | | | 23.05% | |
aFor the period March 4, 2014 (effective date) to October 31, 2014.
bThe amount shown for a share outstanding throughout the period may not correlate with the Statement of Operations for the period due to the timing of sales and repurchases of the Fund’s shares in relation to income earned and/or fluctuating fair value of the investments of the Fund.
cBased on average daily shares outstanding.
dTotal return is not annualized for periods less than one year.
eRatios are annualized for periods less than one year.
fBenefit of expense reduction rounds to less than 0.01%.
gBenefit of waiver and payments by affiliates rounds to less than 0.01%.
| | | | |
| | | |
| 46 | | Annual Report | The accompanying notes are an integral part of these financial statements. | | franklintempleton.com |
FRANKLIN INVESTORS SECURITIES TRUST
FINANCIAL HIGHLIGHTS
Franklin Convertible Securities Fund (continued)
| | | | | | | | | | | | | | | | | | | | |
| | | Year Ended October 31, | |
| | | 2018 | | | 2017 | | | 2016 | | | 2015 | | | 2014 | |
| | | | | |
Advisor Class | | | | | | | | | | | | | | | | | | | | |
| | | | | |
| Per share operating performance | | | | | | | | | | | | | | | | | | | | |
(for a share outstanding throughout the year) | | | | | | | | | | | | | | | | | | | | |
| | | | | |
Net asset value, beginning of year | | | $20.68 | | | | $18.24 | | | | $18.00 | | | | $18.98 | | | | $17.83 | |
| | | | | |
Income from investment operationsa: | | | | | | | | | | | | | | | | | | | | |
| | | | | |
Net investment incomeb | | | 0.21 | | | | 0.32 | | | | 0.30 | | | | 0.29 | | | | 0.28 | |
| | | | | |
Net realized and unrealized gains (losses) | | | 1.35 | | | | 2.98 | | | | 0.85 | | | | (0.15 | ) | | | 1.32 | |
| | | | | |
Total from investment operations | | | 1.56 | | | | 3.30 | | | | 1.15 | | | | 0.14 | | | | 1.60 | |
| | | | | |
Less distributions from: | | | | | | | | | | | | | | | | | | | | |
| | | | | |
Net investment income | | | (0.54 | ) | | | (0.52 | ) | | | (0.55 | ) | | | (0.44 | ) | | | (0.38 | ) |
| | | | | |
Net realized gains | | | (1.05 | ) | | | (0.34 | ) | | | (0.36 | ) | | | (0.68 | ) | | | (0.07 | ) |
| | | | | |
Total distributions | | | (1.59 | ) | | | (0.86 | ) | | | (0.91 | ) | | | (1.12 | ) | | | (0.45 | ) |
| | | | | |
Net asset value, end of year | | | $20.65 | | | | $20.68 | | | | $18.24 | | | | $18.00 | | | | $18.98 | |
| | | | | |
Total return | | | 7.91% | | | | 18.69% | | | | 6.68% | | | | 0.87% | | | | 9.13% | |
| | | | | |
| Ratios to average net assets | | | | | | | | | | | | | | | | | | | | |
| | | | | |
Expenses before waiver and payments by affiliates | | | 0.61% | | | | 0.60% | | | | 0.61% | | | | 0.61% | | | | 0.63% | |
| | | | | |
Expenses net of waiver and payments by affiliatesc | | | 0.59% | | | | 0.59% | | | | 0.60% | | | | 0.61% | d | | | 0.63% | d |
| | | | | | |
Net investment income | | | 1.01% | | | | 1.64% | | | | 1.69% | | | | 1.58% | | | | 1.48% | |
| | | | | |
| Supplemental data | | | | | | | | | | | | | | | | | | | | |
| | | | | |
Net assets, end of year (000’s) | | | $2,189,462 | | | | $1,542,254 | | | | $1,080,346 | | | | $899,441 | | | | $877,190 | |
| | | | | |
Portfolio turnover rate | | | 35.90% | | | | 27.24% | | | | 28.03% | | | | 17.30% | | | | 23.05% | |
aThe amount shown for a share outstanding throughout the period may not correlate with the Statement of Operations for the period due to the timing of sales and repurchases of the Fund’s shares in relation to income earned and/or fluctuating fair value of the investments of the Fund.
bBased on average daily shares outstanding.
cBenefit of expense reduction rounds to less than 0.01%.
dBenefit of waiver and payments by affiliates rounds to less than 0.01%.
| | | | |
| | | |
| franklintempleton.com | | The accompanying notes are an integral part of these financial statements. | Annual Report | | 47 |
FRANKLIN INVESTORS SECURITIES TRUST
Statement of Investments, October 31, 2018
Franklin Convertible Securities Fund
| | | | | | | | | | | | |
| | | Country | | | Shares | | | Value | |
Common Stocks 2.6% | | | | | | | | | | | | |
Communication Services 0.5% | | | | | | | | | | | | |
a Take-Two Interactive Software Inc. | | | United States | | | | 156,263 | | | $ | 20,137,613 | |
| | | | | | | | | | | | |
Information Technology 1.5% | | | | | | | | | | | | |
a Proofpoint Inc. | | | United States | | | | 393,941 | | | | 35,828,934 | |
a VeriSign Inc. | | | United States | | | | 129,542 | | | | 18,464,917 | |
| | | | | | | | | | | | |
| | | |
| | | | | | | | | | | 54,293,851 | |
| | | | | | | | | | | | |
Real Estate 0.6% | | | | | | | | | | | | |
Forest City Realty Trust Inc., A | | | United States | | | | 832,495 | | | | 20,945,574 | |
| | | | | | | | | | | | |
| Total Common Stocks (Cost $70,226,320) | | | | | | | | | | | 95,377,038 | |
| | | | | | | | | | | | |
| | | |
| Convertible Preferred Stocks 16.4% | | | | | | | | | | | | |
Communication Services 1.1% | | | | | | | | | | | | |
b Mandatory Exchangeable Trust, 5.75%, cvt. pfd., 144A | | | China | | | | 251,500 | | | | 40,605,933 | |
| | | | | | | | | | | | |
Consumer Staples 3.2% | | | | | | | | | | | | |
Bunge Ltd., 4.875%, cvt. pfd. | | | United States | | | | 630,000 | | | | 65,205,000 | |
Post Holdings Inc., 2.50%, cvt. pfd. | | | United States | | | | 321,200 | | | | 52,985,698 | |
| | | | | | | | | | | | |
| | | |
| | | | | | | | | | | 118,190,698 | |
| | | | | | | | | | | | |
Health Care 1.8% | | | | | | | | | | | | |
Becton Dickinson and Co., 6.125%, cvt. pfd., A | | | United States | | | | 1,120,000 | | | | 65,710,400 | |
| | | | | | | | | | | | |
Industrials 4.9% | | | | | | | | | | | | |
Fortive Corp., 5.00%, cvt. pfd., A | | | United States | | | | 70,000 | | | | 68,754,700 | |
Rexnord Corp., 5.75%, cvt. pfd. | | | United States | | | | 1,017,500 | | | | 58,170,475 | |
Stanley Black & Decker Inc., 5.375%, cvt. pfd. | | | United States | | | | 592,000 | | | | 54,316,000 | |
| | | | | | | | | | | | |
| | | |
| | | | | | | | | | | 181,241,175 | |
| | | | | | | | | | | | |
Materials 1.8% | | | | | | | | | | | | |
a International Flavors & Fragrances Inc., 6.00%, cvt. pfd. | | | United States | | | | 1,192,242 | | | | 68,649,294 | |
| | | | | | | | | | | | |
Utilities 3.6% | | | | | | | | | | | | |
Black Hills Corp., 7.75%, cvt. pfd. | | | United States | | | | 606,000 | | | | 38,614,320 | |
Sempra Energy, 6.00%, cvt. pfd., A | | | United States | | | | 567,500 | | | | 56,273,300 | |
Sempra Energy, 6.75%, cvt. pfd., B | | | United States | | | | 206,000 | | | | 20,540,260 | |
South Jersey Industries Inc, 7.25%, cvt. pfd. | | | United States | | | | 360,000 | | | | 18,100,800 | |
| | | | | | | | | | | | |
| | | |
| | | | | | | | | | | 133,528,680 | |
| | | | | | | | | | | | |
Total Convertible Preferred Stocks (Cost $566,240,043) | | | | | | | | | | | 607,926,180 | |
| | | | | | | | | | | | |
| | | |
| | | | | | Principal Amount* | | | | |
| | | | | | | | | | | | |
| Convertible Bonds 76.4% | | | | | | | | | | | | |
Communication Services 7.9% | | | | | | | | | | | | |
Altaba Inc., cvt., zero cpn., 12/01/18 | | | United States | | | $ | 35,100,000 | | | | 39,406,208 | |
Dish Network Corp., cvt., senior bond, 3.375%, 8/15/26 | | | United States | | | | 45,900,000 | | | | 41,009,355 | |
b Liberty Interactive LLC, cvt., senior bond, 144A, 1.75%, 9/30/46 | | | United States | | | | 37,000,000 | | | | 41,358,600 | |
Liberty Media Corp.,
cvt., senior bond, 2.25%, 9/30/46 | | | United States | | | | 39,000,000 | | | | 20,408,973 | |
cvt., senior note, 1.375%, 10/15/23 | | | United States | | | | 21,200,000 | | | | 24,498,720 | |
b Weibo Corp., cvt., senior note, 144A, 1.25%, 11/15/22 | | | China | | | | 78,000,000 | | | | 69,586,530 | |
Zillow Group Inc., | | | | | | | | | | | | |
cvt., senior note, 2.00%, 12/01/21 | | | United States | | | | 34,500,000 | | | | 36,563,790 | |
cvt., senior note, 1.50%, 7/01/23 | | | United States | | | | 23,500,000 | | | | 21,479,000 | |
| | | | | | | | | | | | |
| | | |
| | | | | | | | | | | 294,311,176 | |
| | | | | | | | | | | | |
| | | | |
| | | |
| 48 | | Annual Report | | franklintempleton.com |
FRANKLIN INVESTORS SECURITIES TRUST
STATEMENT OF INVESTMENTS
| | | | | | | | | | | | |
Franklin Convertible Securities Fund (continued) | | | | | | | | | | | | |
| | | Country | | | Principal Amount* | | | Value | |
Convertible Bonds (continued) | | | | | | | | | | | | |
Consumer Discretionary 11.2% | | | | | | | | | | | | |
Ctrip.com International Ltd., cvt., senior note, 1.25%, 9/15/22 | | | China | | | $ | 75,000,000 | | | $ | 72,736,125 | |
b Etsy Inc., cvt., senior note, 144A, zero cpn., 3/01/23 | | | United States | | | | 40,000,000 | | | | 53,200,000 | |
GNC Holdings Inc., cvt., senior note, 1.50%, 8/15/20 | | | United States | | | | 5,000,000 | | | | 3,869,000 | |
b Liberty Expedia Holdings, cvt., 144A, 1.00%, 6/30/47 | | | United States | | | | 52,450,000 | | | | 52,287,405 | |
Mercadolibre Inc., cvt., 2.25%, 7/01/19 | | | Argentina | | | | 5,000,000 | | | | 12,876,350 | |
b MercadoLibre Inc., cvt., senior note, 144A, 2.00%, 8/15/28 | | | Argentina | | | | 60,000,000 | | | | 57,735,000 | |
The Priceline Group Inc., cvt., senior note, 0.35%, 6/15/20 | | | United States | | | | 35,000,000 | | | | 50,624,630 | |
b RH, cvt., senior note, 144A, zero cpn., 6/15/23 | | | United States | | | | 56,500,000 | | | | 49,866,222 | |
Wayfair Inc., cvt., senior note, 0.375%, 9/01/22 | | | United States | | | | 50,000,000 | | | | 61,850,000 | |
| | | | | | | | | | | | |
| | | |
| | | | | | | | | | | 415,044,732 | |
| | | | | | | | | | | | |
Energy 0.7% | | | | | | | | | | | | |
b Oil States International Inc., cvt., senior note, 144A, 1.50%, 2/15/23 | | | United States | | | | 28,000,000 | | | | 25,615,492 | |
| | | | | | | | | | | | |
Financials 2.0% | | | | | | | | | | | | |
b AXA SA, cvt., senior note, 144A, 7.25%, 5/15/21 | | | France | | | | 71,500,000 | | | | 73,737,950 | |
| | | | | | | | | | | | |
Health Care 15.5% | | | | | | | | | | | | |
Assertio Therapeutics Inc., cvt., senior note, 2.50%, 9/01/21 | | | United States | | | | 16,000,000 | | | | 12,322,080 | |
BioMarin Pharmaceutical Inc., cvt., senior sub. note, 1.50%, 10/15/20 | | | United States | | | | 28,200,000 | | | | 33,313,844 | |
Clovis Oncology Inc., cvt., senior note, 1.25%, 5/01/25 | | | United States | | | | 30,000,000 | | | | 18,470,880 | |
b Corium International Inc., cvt., senior note, 144A, 5.00%, 3/15/25 | | | United States | | | | 14,500,000 | | | | 14,499,275 | |
Dermira Inc., cvt., senior note, 3.00%, 5/15/22 | | | United States | | | | 41,120,000 | | | | 35,113,355 | |
DexCom Inc., cvt., senior note, 0.75%, 5/15/22 | | | United States | | | | 50,600,000 | | | | 73,039,582 | |
Fluidigm Corp., cvt., senior bond, 2.75%, 2/01/34 | | | United States | | | | 11,918,000 | | | | 12,366,737 | |
Illumina Inc., | | | | | | | | | | | | |
cvt., senior note, 0.50%, 6/15/21 | | | United States | | | | 32,500,000 | | | | 43,944,973 | |
b cvt., senior note, 144A, zero cpn., 8/15/23 | | | United States | | | | 32,750,000 | | | | 34,442,455 | |
b Insulet Corp., cvt., senior note, 144A, 1.375%, 11/15/24 | | | United States | | | | 51,300,000 | | | | 58,032,355 | |
Jazz Investments I Ltd., | | | | | | | | | | | | |
cvt., senior note, 1.875%, 8/15/21 | | | United States | | | | 35,000,000 | | | | 36,914,045 | |
cvt., senior note, 1.50%, 8/15/24 | | | United States | | | | 39,750,000 | | | | 39,728,972 | |
Neurocrine Biosciences Inc., cvt., senior note, 2.25%, 5/15/24 | | | United States | | | | 44,750,000 | | | | 69,068,806 | |
Novavax Inc., cvt., senior note, 3.75%, 2/01/23 | | | United States | | | | 29,000,000 | | | | 17,617,500 | |
NuVasive Inc., cvt., senior note, 2.25%, 3/15/21 | | | United States | | | | 12,000,000 | | | | 13,433,040 | |
b Sarepta Therapeutics Inc., cvt., senior note, 144A, 1.50%, 11/15/24 | | | United States | | | | 30,250,000 | | | | 59,696,862 | |
| | | | | | | | | | | | |
| | | |
| | | | | | | | | | | 572,004,761 | |
| | | | | | | | | | | | |
Industrials 0.5% | | | | | | | | | | | | |
The KeyW Holding Corp., cvt., senior note, 2.50%, 7/15/19 | | | United States | | | | 20,000,000 | | | | 19,896,400 | |
| | | | | | | | | | | | |
Information Technology 36.7% | | | | | | | | | | | | |
b Atlassian Inc., cvt., senior note, 144A, 0.625%, 5/01/23 | | | United States | | | | 65,000,000 | | | | 74,623,835 | |
b DocuSign Inc., cvt., senior note, 144A, 0.50%, 9/15/23 | | | United States | | | | 65,000,000 | | | | 61,262,500 | |
Electronics for Imaging Inc., cvt., senior note, 0.75%, 9/01/19 | | | United States | | | | 22,000,000 | | | | 21,673,542 | |
b Envestnet Inc., cvt., senior note, 144A, 1.75%, 6/01/23 | | | United States | | | | 51,500,000 | | | | 51,918,438 | |
Guidewire Software Inc., cvt., senior note, 1.25%, 3/15/25 | | | United States | | | | 49,000,000 | | | | 49,515,529 | |
HubSpot Inc., cvt., senior note, 0.25%, 6/01/22 | | | United States | | | | 43,875,000 | | | | 66,668,940 | |
Inphi Corp., cvt., senior note, 0.75%, 9/01/21 | | | United States | | | | 9,600,000 | | | | 8,928,000 | |
Integrated Device Technology Inc., cvt., senior note, 0.875%, 11/15/22 | | | United States | | | | 4,700,000 | | | | 7,066,309 | |
Intel Corp., cvt., junior sub. bond, 3.25%, 8/01/39 | | | United States | | | | 8,000,000 | | | | 18,174,520 | |
Microchip Technology Inc., cvt., 1.625%, 2/15/27 | | | United States | | | | 69,250,000 | | | | 65,807,513 | |
Micron Technology Inc., cvt., senior bond, G, 3.00%, 11/15/43 | | | United States | | | | 35,050,000 | | | | 45,757,635 | |
Novellus Systems Inc., cvt., senior note, 2.625%, 5/15/41 | | | United States | | | | 3,500,000 | | | | 15,017,454 | |
NXP Semiconductors NV, cvt., senior note, 1.00%, 12/01/19 | | | Netherlands | | | | 55,000,000 | | | | 55,751,300 | |
| | | | |
| | | |
| franklintempleton.com | | Annual Report | | 49 |
FRANKLIN INVESTORS SECURITIES TRUST
STATEMENT OF INVESTMENTS
| | | | | | | | | | | | |
Franklin Convertible Securities Fund (continued) | | | | | | | | | | | | |
| | | Country | | | Principal Amount* | | | Value | |
Convertible Bonds (continued) | | | | | | | | | | | | |
Information Technology (continued) | | | | | | | | | | | | |
b Okta Inc., cvt., senior note, 144A, 0.25%, 2/15/23 | | | United States | | | $ | 44,500,000 | | | $ | 60,757,674 | |
Palo Alto Networks Inc., | | | | | | | | | | | | |
b cvt., senior note, 144A, 0.75%, 7/01/23 | | | United States | | | | 53,000,000 | | | | 51,753,069 | |
cvt., senior note, zero cpn., 7/01/19 | | | United States | | | | 10,100,000 | | | | 16,711,359 | |
b Q2 Holdings Inc., cvt., 144A, 0.75%, 2/15/23 | | | United States | | | | 32,000,000 | | | | 35,188,064 | |
RealPage Inc., cvt., senior note, 1.50%, 11/15/22 | | | United States | | | | 40,850,000 | | | | 55,956,738 | |
Red Hat Inc., cvt., senior note, 0.25%, 10/01/19 | | | United States | | | | 29,250,000 | | | | 68,162,416 | |
ServiceNow Inc., cvt., senior note, zero cpn., 6/01/22 | | | United States | | | | 50,000,000 | | | | 70,814,200 | |
Silicon Laboratories Inc., cvt., senior note, 1.375%, 3/01/22 | | | United States | | | | 53,700,000 | | | | 58,076,228 | |
b Square Inc., cvt., senior note, 144A, 0.50%, 5/15/23 | | | United States | | | | 65,000,000 | | | | 77,771,200 | |
b Twilio Inc., cvt., senior note, 144A, 0.25%, 6/01/23 | | | United States | | | | 44,500,000 | | | | 55,612,140 | |
Viavi Solutions Inc., | | | | | | | | | | | | |
cvt., senior note, 1.00%, 3/01/24 | | | United States | | | | 20,000,000 | | | | 21,584,260 | |
b cvt., senior note, 144A, 1.75%, 6/01/23 | | | United States | | | | 40,969,000 | | | | 44,391,386 | |
b Wix.com Ltd., cvt., senior note, 144A, zero cpn., 7/01/23 | | | Israel | | | | 56,500,000 | | | | 55,528,200 | |
Workday Inc., cvt., senior note, 0.25%, 10/01/22 | | | United States | | | | 67,500,000 | | | | 75,311,707 | |
b Zendesk Inc., cvt., senior note, 144A, 0.25%, 3/15/23 | | | United States | | | | 63,500,000 | | | | 69,856,286 | |
| | | | | | | | | | | | |
| | | |
| | | | | | | | | | | 1,359,640,442 | |
| | | | | | | | | | | | |
Materials 1.2% | | | | | | | | | | | | |
Cemex SAB de CV, cvt., sub. note, 3.72%, 3/15/20 | | | Mexico | | | | 44,250,000 | | | | 43,608,641 | |
| | | | | | | | | | | | |
Real Estate 0.7% | | | | | | | | | | | | |
Forest City Enterprises Inc., cvt., senior note, A, 3.625%, 8/15/20 | | | United States | | | | 22,000,000 | | | | 24,257,992 | |
| | | | | | | | | | | | |
Total Convertible Bonds (Cost $2,612,654,696) | | | | | | | | | | | 2,828,117,586 | |
| | | | | | | | | | | | |
| | | |
| | | | | | Shares | | | | |
| | | |
Escrows and Litigation Trusts (Cost $22,362) 0.0% | | | | | | | | | | | | |
a,c Motors Liquidation Co., Escrow Account | | | United States | | | | 376,200 | | | | — | |
| | | | | | | | | | | | |
Total Investments before Short Term Investments
(Cost $3,249,143,421) | | | | | | | | | | | 3,531,420,804 | |
| | | | | | | | | | | | |
| | | |
Short Term Investments (Cost $163,242,682) 4.4% | | | | | | | | | | | | |
| | | |
Money Market Funds 4.4% | | | | | | | | | | | | |
d,e Institutional Fiduciary Trust Money Market Portfolio, 1.83% | | | United States | | | | 163,242,682 | | | | 163,242,682 | |
| | | | | | | | | | | | |
| | | |
Total Investments (Cost $3,412,386,103) 99.8% | | | | | | | | | | | 3,694,663,486 | |
Other Assets, less Liabilities 0.2% | | | | | | | | | | | 6,214,009 | |
| | | | | | | | | | | | |
Net Assets 100.0% | | | | | | | | | | | $3,700,877,495 | |
| | | | | | | | | | | | |
| | | | |
| | | |
| 50 | | Annual Report | | franklintempleton.com |
FRANKLIN INVESTORS SECURITIES TRUST
STATEMENT OF INVESTMENTS
Franklin Convertible Securities Fund (continued)
*The principal amount is stated in U.S. dollars unless otherwise indicated.
aNon-income producing.
bSecurity was purchased pursuant to Rule 144A under the Securities Act of 1933 and may be sold in transactions exempt from registration only to qualified institutional buyers or in a public offering registered under the Securities Act of 1933. These securities have been deemed liquid under guidelines approved by the Trust’s Board of Trustees. At October 31, 2018, the aggregate value of these securities was $1,269,326,871, representing 34.3% of net assets.
cFair valued using significant unobservable inputs. See Note 10 regarding fair value measurements.
dSee Note 3(f) regarding investments in affiliated management investment companies.
eThe rate shown is the annualized seven-day effective yield at period end.
| | | | |
| | | |
| franklintempleton.com | | The accompanying notes are an integral part of these financial statements. | Annual Report | | 51 |
FRANKLIN INVESTORS SECURITIES TRUST
Financial Highlights
Franklin Equity Income Fund
| | | | | | | | | | | | | | | | | | | | |
| | | Year Ended October 31, | |
| | | 2018 | | | 2017 | | | 2016 | | | 2015 | | | 2014 | |
Class A | | | | | | | | | | | | | | | | | | | | |
| | | | | |
Per share operating performance | | | | | | | | | | | | | | | | | | | | |
(for a share outstanding throughout the year) | | | | | | | | | | | | | | | | | | | | |
| | | | | |
Net asset value, beginning of year | | | $25.06 | | | | $22.50 | | | | $22.99 | | | | $23.93 | | | | $22.16 | |
| | | | |
| | | | | |
Income from investment operationsa: | | | | | | | | | | | | | | | | | | | | |
| | | | | |
Net investment incomeb | | | 0.42 | | | | 0.48 | | | | 0.47 | | | | 0.55 | | | | 0.66c | |
| | | | | |
Net realized and unrealized gains (losses) | | | 0.58 | | | | 3.55 | | | | 0.24 | | | | 0.26 | | | | 1.73 | |
| | | | |
| | | | | |
Total from investment operations | | | 1.00 | | | | 4.03 | | | | 0.71 | | | | 0.81 | | | | 2.39 | |
| | | | |
| | | | | |
Less distributions from: | | | | | | | | | | | | | | | | | | | | |
| | | | | |
Net investment income | | | (0.57) | | | | (0.58) | | | | (0.60) | | | | (0.69) | | | | (0.50) | |
| | | | | |
Net realized gains | | | (0.63) | | | | (0.89) | | | | (0.60) | | | | (1.06) | | | | (0.12) | |
| | | | |
| | | | | |
Total distributions | | | (1.20) | | | | (1.47) | | | | (1.20) | | | | (1.75) | | | | (0.62) | |
| | | | |
| | | | | |
Net asset value, end of year | | | $24.86 | | | | $25.06 | | | | $22.50 | | | | $22.99 | | | | $23.93 | |
| | | | |
| | | | | |
Total returnd | | | 3.98% | | | | 18.55% | | | | 3.31% | | | | 3.72% | | | | 10.99% | |
| | | | | |
Ratios to average net assets | | | | | | | | | | | | | | | | | | | | |
| | | | | |
Expenses before waiver and payments by affiliates | | | 0.85% | | | | 0.86% | | | | 0.87% | | | | 0.86% | | | | 0.87% | |
| | | | | |
Expenses net of waiver and payments by affiliatese | | | 0.84% | | | | 0.86%f | | | | 0.87%f | | | | 0.86%f | | | | 0.87%f | |
| | | | | |
Net investment income | | | 1.66% | | | | 2.02% | | | | 2.13% | | | | 2.37% | | | | 2.87%c | |
| | | | | |
Supplemental data | | | | | | | | | | | | | | | | | | | | |
| | | | | |
Net assets, end of year (000’s) | | | $1,752,181 | | | | $1,753,135 | | | | $1,700,712 | | | | $1,790,392 | | | | $1,762,318 | |
| | | | | |
Portfolio turnover rate | | | 28.40% | | | | 27.18% | | | | 50.05% | | | | 34.09% | | | | 20.15% | |
aThe amount shown for a share outstanding throughout the period may not correlate with the Statement of Operations for the period due to the timing of sales and repurchases of the Fund’s shares in relation to income earned and/or fluctuating fair value of the investments of the Fund.
bBased on average daily shares outstanding.
cNet investment income per share includes approximately $0.17 per share related to income received in the form of a special dividend in connection with certain Fund holdings. Excluding this amount, the ratio of net investment income to average net assets would have been 2.15%.
dTotal return does not reflect sales commissions or contingent deferred sales charges, if applicable.
eBenefit of expense reduction rounds to less than 0.01%.
fBenefit of waiver and payments by affiliates rounds to less than 0.01%.
| | | | |
| | | |
| 52 | | Annual Report | The accompanying notes are an integral part of these financial statements. | | franklintempleton.com |
FRANKLIN INVESTORS SECURITIES TRUST
FINANCIAL HIGHLIGHTS
Franklin Equity Income Fund (continued)
| | | | | | | | | | | | | | | | | | | | |
| | | Year Ended October 31, | |
| | | 2018 | | | 2017 | | | 2016 | | | 2015 | | | 2014 | |
Class C | | | | | | | | | | | | | | | | | | | | |
| | | | | |
Per share operating performance | | | | | | | | | | | | | | | | | | | | |
(for a share outstanding throughout the year) | | | | | | | | | | | | | | | | | | | | |
| | | | | |
Net asset value, beginning of year | | | $24.86 | | | | $22.32 | | | | $22.85 | | | | $23.79 | | | | $22.04 | |
| | | | |
| | | | | |
Income from investment operationsa: | | | | | | | | | | | | | | | | | | | | |
| | | | | |
Net investment incomeb | | | 0.26 | | | | 0.30 | | | | 0.30 | | | | 0.37 | | | | 0.49c | |
| | | | | |
Net realized and unrealized gains (losses) | | | 0.53 | | | | 3.54 | | | | 0.23 | | | | 0.27 | | | | 1.71 | |
| | | | |
| | | | | |
Total from investment operations | | | 0.79 | | | | 3.84 | | | | 0.53 | | | | 0.64 | | | | 2.20 | |
| | | | |
| | | | | |
Less distributions from: | | | | | | | | | | | | | | | | | | | | |
| | | | | |
Net investment income | | | (0.38) | | | | (0.41) | | | | (0.46) | | | | (0.52) | | | | (0.33) | |
| | | | | |
Net realized gains | | | (0.63) | | | | (0.89) | | | | (0.60) | | | | (1.06) | | | | (0.12) | |
| | | | |
| | | | | |
Total distributions | | | (1.01) | | | | (1.30) | | | | (1.06) | | | | (1.58) | | | | (0.45) | |
| | | | |
| | | | | |
Net asset value, end of year | | | $24.64 | | | | $24.86 | | | | $22.32 | | | | $22.85 | | | | $23.79 | |
| | | | |
| | | | | |
Total returnd | | | 3.16% | | | | 17.73% | | | | 2.51% | | | | 2.96% | | | | 10.14% | |
| | | | | |
Ratios to average net assets | | | | | | | | | | | | | | | | | | | | |
| | | | | |
Expenses before waiver and payments by affiliates | | | 1.60% | | | | 1.61% | | | | 1.62% | | | | 1.61% | | | | 1.62% | |
| | | | | |
Expenses net of waiver and payments by affiliatese | | | 1.59% | | | | 1.61%f | | | | 1.62%f | | | | 1.61%f | | | | 1.62%f | |
| | | | | |
Net investment income | | | 0.91% | | | | 1.27% | | | | 1.38% | | | | 1.62% | | | | 2.12%c | |
| | | | | |
Supplemental data | | | | | | | | | | | | | | | | | | | | |
| | | | | |
Net assets, end of year (000’s) | | | $204,402 | | | | $267,450 | | | | $257,156 | | | | $250,347 | | | | $241,566 | |
| | | | | |
Portfolio turnover rate | | | 28.40% | | | | 27.18% | | | | 50.05% | | | | 34.09% | | | | 20.15% | |
aThe amount shown for a share outstanding throughout the period may not correlate with the Statement of Operations for the period due to the timing of sales and repurchases of the Fund’s shares in relation to income earned and/or fluctuating fair value of the investments of the Fund.
bBased on average daily shares outstanding.
cNet investment income per share includes approximately $0.17 per share related to income received in the form of a special dividend in connection with certain Fund holdings. Excluding this amount, the ratio of net investment income to average net assets would have been 1.40%.
dTotal return does not reflect sales commissions or contingent deferred sales charges, if applicable.
eBenefit of expense reduction rounds to less than 0.01%.
fBenefit of waiver and payments by affiliates rounds to less than 0.01%.
| | | | |
| | | |
| franklintempleton.com | | The accompanying notes are an integral part of these financial statements. | Annual Report | | 53 |
FRANKLIN INVESTORS SECURITIES TRUST
FINANCIAL HIGHLIGHTS
Franklin Equity Income Fund (continued)
| | | | | | | | | | | | | | | | | | | | |
| | | Year Ended October 31, | |
| | | 2018 | | | 2017 | | | 2016 | | | 2015 | | | 2014 | |
Class R | | | | | | | | | | | | | | | | | | | | |
| | | | | |
Per share operating performance | | | | | | | | | | | | | | | | | | | | |
(for a share outstanding throughout the year) | | | | | | | | | | | | | | | | | | | | |
| | | | | |
Net asset value, beginning of year | | | $25.05 | | | | $22.49 | | | | $22.99 | | | | $23.93 | | | | $22.17 | |
| | | | |
| | | | | |
Income from investment operationsa: | | | | | | | | | | | | | | | | | | | | |
| | | | | |
Net investment incomeb | | | 0.36 | | | | 0.42 | | | | 0.41 | | | | 0.50 | | | | 0.61c | |
| | | | | |
Net realized and unrealized gains (losses) | | | 0.58 | | | | 3.56 | | | | 0.24 | | | | 0.25 | | | | 1.72 | |
| | | | |
| | | | | |
Total from investment operations | | | 0.94 | | | | 3.98 | | | | 0.65 | | | | 0.75 | | | | 2.33 | |
| | | | |
| | | | | |
Less distributions from: | | | | | | | | | | | | | | | | | | | | |
| | | | | |
Net investment income | | | (0.51) | | | | (0.53) | | | | (0.55) | | | | (0.63) | | | | (0.45) | |
| | | | | |
Net realized gains | | | (0.63) | | | | (0.89) | | | | (0.60) | | | | (1.06) | | | | (0.12) | |
| | | | |
| | | | | |
Total distributions | | | (1.14) | | | | (1.42) | | | | (1.15) | | | | (1.69) | | | | (0.57) | |
| | | | |
| | | | | |
Net asset value, end of year | | | $24.85 | | | | $25.05 | | | | $22.49 | | | | $22.99 | | | | $23.93 | |
| | | | |
| | | | | |
Total return | | | 3.75% | | | | 18.29% | | | | 3.05% | | | | 3.45% | | | | 10.67% | |
| | | | | |
Ratios to average net assets | | | | | | | | | | | | | | | | | | | | |
| | | | | |
Expenses before waiver and payments by affiliates | | | 1.08% | | | | 1.09% | | | | 1.11% | | | | 1.11% | | | | 1.12% | |
| | | | | |
Expenses net of waiver and payments by affiliatesd | | | 1.07% | | | | 1.09%e | | | | 1.11%e | | | | 1.11%e | | | | 1.12%e | |
| | | | | |
Net investment income | | | 1.43% | | | | 1.79% | | | | 1.89% | | | | 2.12% | | | | 2.62%c | |
| | | | | |
Supplemental data | | | | | | | | | | | | | | | | | | | | |
| | | | | |
Net assets, end of year (000’s) | | | $6,750 | | | | $7,074 | | | | $6,395 | | | | $6,265 | | | | $7,305 | |
| | | | | |
Portfolio turnover rate | | | 28.40% | | | | 27.18% | | | | 50.05% | | | | 34.09% | | | | 20.15% | |
aThe amount shown for a share outstanding throughout the period may not correlate with the Statement of Operations for the period due to the timing of sales and repurchases of the Fund’s shares in relation to income earned and/or fluctuating fair value of the investments of the Fund.
bBased on average daily shares outstanding.
cNet investment income per share includes approximately $0.17 per share related to income received in the form of a special dividend in connection with certain Fund holdings. Excluding this amount, the ratio of net investment income to average net assets would have been 1.90%.
dBenefit of expense reduction rounds to less than 0.01%.
eBenefit of waiver and payments by affiliates rounds to less than 0.01%.
| | | | |
| | | |
| 54 | | Annual Report | The accompanying notes are an integral part of these financial statements. | | franklintempleton.com |
FRANKLIN INVESTORS SECURITIES TRUST
FINANCIAL HIGHLIGHTS
Franklin Equity Income Fund (continued)
| | | | | | | | | | | | | | | | | | | | |
| | | Year Ended October 31, | |
| | | 2018 | | | 2017 | | | 2016 | | | 2015 | | | 2014 | |
Class R6 | | | | | | | | | | | | | | | | | | | | |
| | | | | |
Per share operating performance | | | | | | | | | | | | | | | | | | | | |
(for a share outstanding throughout the year) | | | | | | | | | | | | | | | | | | | | |
| | | | | |
Net asset value, beginning of year | | | $25.11 | | | | $22.54 | | | | $23.01 | | | | $23.95 | | | | $22.18 | |
| | | | |
| | | | | |
Income from investment operationsa: | | | | | | | | | | | | | | | | | | | | |
| | | | | |
Net investment incomeb | | | 0.50 | | | | 0.56 | | | | 0.43 | | | | 0.63 | | | | 0.75c | |
| | | | | |
Net realized and unrealized gains (losses) | | | 0.59 | | | | 3.57 | | | | 0.37 | | | | 0.27 | | | | 1.73 | |
| | | | |
| | | | | |
Total from investment operations | | | 1.09 | | | | 4.13 | | | | 0.80 | | | | 0.90 | | | | 2.48 | |
| | | | |
| | | | | |
Less distributions from: | | | | | | | | | | | | | | | | | | | | |
| | | | | |
Net investment income | | | (0.66) | | | | (0.67) | | | | (0.67) | | | | (0.78) | | | | (0.59) | |
| | | | | |
Net realized gains | | | (0.63) | | | | (0.89) | | | | (0.60) | | | | (1.06) | | | | (0.12) | |
| | | | |
| | | | | |
Total distributions | | | (1.29) | | | | (1.56) | | | | (1.27) | | | | (1.84) | | | | (0.71) | |
| | | | |
| | | | | |
Net asset value, end of year | | | $24.91 | | | | $25.11 | | | | $22.54 | | | | $23.01 | | | | $23.95 | |
| | | | |
| | | | | |
Total returnd | | | 4.35% | | | | 19.00% | | | | 3.72% | | | | 4.10% | | | | 11.38% | |
| | | | | |
Ratios to average net assets | | | | | | | | | | | | | | | | | | | | |
| | | | | |
Expenses before waiver and payments by affiliates | | | 0.52% | | | | 0.49% | | | | 0.49% | | | | 2.89% | | | | 1.78% | |
| | | | | |
Expenses net of waiver and payments by affiliatese | | | 0.50% | | | | 0.49%f | | | | 0.49%f | | | | 0.48% | | | | 0.50% | |
| | | | | |
Net investment income | | | 2.00% | | | | 2.39% | | | | 2.51% | | | | 2.75% | | | | 3.24%c | |
| | | | | |
Supplemental data | | | | | | | | | | | | | | | | | | | | |
| | | | | |
Net assets, end of year (000’s) | | | $81,171 | | | | $12,728 | | | | $10,537 | | | | $6 | | | | $6 | |
| | | | | |
Portfolio turnover rate | | | 28.40% | | | | 27.18% | | | | 50.05% | | | | 34.09% | | | | 20.15% | |
aThe amount shown for a share outstanding throughout the period may not correlate with the Statement of Operations for the period due to the timing of sales and repurchases of the Fund’s shares in relation to income earned and/or fluctuating fair value of the investments of the Fund.
bBased on average daily shares outstanding.
cNet investment income per share includes approximately $0.17 per share related to income received in the form of a special dividend in connection with certain Fund holdings. Excluding this amount, the ratio of net investment income to average net assets would have been 2.51%.
dTotal return is not annualized for periods less than one year.
eBenefit of expense reduction rounds to less than 0.01%.
fBenefit of waiver and payments by affiliates rounds to less than 0.01%.
| | | | |
| | | |
| franklintempleton.com | | The accompanying notes are an integral part of these financial statements. | Annual Report | | 55 |
FRANKLIN INVESTORS SECURITIES TRUST
FINANCIAL HIGHLIGHTS
Franklin Equity Income Fund (continued)
| | | | | | | | | | | | | | | | | | | | |
| | | Year Ended October 31, | |
| | | 2018 | | | 2017 | | | 2016 | | | 2015 | | | 2014 | |
Advisor Class | | | | | | | | | | | | | | | | | | | | |
| | | | | |
Per share operating performance | | | | | | | | | | | | | | | | | | | | |
(for a share outstanding throughout the year) | | | | | | | | | | | | | | | | | | | | |
| | | | | |
Net asset value, beginning of year | | | $25.10 | | | | $22.53 | | | | $23.02 | | | | $23.96 | | | | $22.19 | |
| | | | |
| | | | | |
Income from investment operationsa: | | | | | | | | | | | | | | | | | | | | |
| | | | | |
Net investment incomeb | | | 0.46 | | | | 0.50 | | | | 0.45 | | | | 0.60 | | | | 0.71c | |
| | | | | |
Net realized and unrealized gains (losses) | | | 0.60 | | | | 3.60 | | | | 0.31 | | | | 0.27 | | | | 1.74 | |
| | | | |
| | | | | |
Total from investment operations | | | 1.06 | | | | 4.10 | | | | 0.76 | | | | 0.87 | | | | 2.45 | |
| | | | |
| | | | | |
Less distributions from: | | | | | | | | | | | | | | | | | | | | |
| | | | | |
Net investment income | | | (0.63) | | | | (0.64) | | | | (0.65) | | | | (0.75) | | | | (0.56) | |
| | | | | |
Net realized gains | | | (0.63) | | | | (0.89) | | | | (0.60) | | | | (1.06) | | | | (0.12) | |
| | | | |
| | | | | |
Total distributions | | | (1.26) | | | | (1.53) | | | | (1.25) | | | | (1.81) | | | | (0.68) | |
| | | | |
| | | | | |
Net asset value, end of year | | | $24.90 | | | | $25.10 | | | | $22.53 | | | | $23.02 | | | | $23.96 | |
| | | | |
| | | | | |
Total return | | | 4.22% | | | | 18.88% | | | | 3.53% | | | | 3.98% | | | | 11.25% | |
| | | | | |
Ratios to average net assets | | | | | | | | | | | | | | | | | | | | |
| | | | | |
Expenses before waiver and payments by affiliates | | | 0.60% | | | | 0.61% | | | | 0.62% | | | | 0.61% | | | | 0.62% | |
| | | | | |
Expenses net of waiver and payments by affiliatesd | | | 0.59% | | | | 0.61%e | | | | 0.62%e | | | | 0.61%e | | | | 0.62%e | |
| | | | | |
Net investment income | | | 1.91% | | | | 2.27% | | | | 2.38% | | | | 2.62% | | | | 3.12%c | |
| | | | | |
Supplemental data | | | | | | | | | | | | | | | | | | | | |
| | | | | |
Net assets, end of year (000’s) | | | $109,435 | | | | $147,681 | | | | $80,422 | | | | $34,577 | | | | $30,166 | |
| | | | | |
Portfolio turnover rate | | | 28.40% | | | | 27.18% | | | | 50.05% | | | | 34.09% | | | | 20.15% | |
aThe amount shown for a share outstanding throughout the period may not correlate with the Statement of Operations for the period due to the timing of sales and repurchases of the Fund’s shares in relation to income earned and/or fluctuating fair value of the investments of the Fund.
bBased on average daily shares outstanding.
cNet investment income per share includes approximately $0.17 per share related to income received in the form of a special dividend in connection with certain Fund holdings. Excluding this amount, the ratio of net investment income to average net assets would have been 2.40%.
dBenefit of expense reduction rounds to less than 0.01%.
eBenefit of waiver and payments by affiliates rounds to less than 0.01%.
| | | | |
| | | |
| 56 | | Annual Report | The accompanying notes are an integral part of these financial statements. | | franklintempleton.com |
FRANKLIN INVESTORS SECURITIES TRUST
Statement of Investments, October 31, 2018
Franklin Equity Income Fund
| | | | | | | | | | | | |
| | | Country | | | Shares | | | Value | |
| Common Stocks 87.0% | | | | | | | | | |
| Communication Services 4.1% | | | | | | | | | |
Comcast Corp., A | | | United States | | | | 705,000 | | | $ | 26,888,700 | |
Rogers Communications Inc., B | | | Canada | | | | 310,000 | | | | 15,968,100 | |
TELUS Corp. | | | Canada | | | | 470,000 | | | | 16,098,165 | |
Verizon Communications Inc. | | | United States | | | | 525,000 | | | | 29,972,250 | |
| | | | | | | | | | | | |
| | | |
| | | | | | | | | | | 88,927,215 | |
| | | | | | | | | | | | |
Consumer Discretionary 3.4% | | | | | | | | | | | | |
Las Vegas Sands Corp. | | | United States | | | | 345,000 | | | | 17,605,350 | |
Lowe’s Cos. Inc. | | | United States | | | | 165,200 | | | | 15,730,344 | |
McDonald’s Corp. | | | United States | | | | 145,000 | | | | 25,650,500 | |
Target Corp. | | | United States | | | | 165,000 | | | | 13,798,950 | |
| | | | | | | | | | | | |
| | | |
| | | | | | | | | | | 72,785,144 | |
| | | | | | | | | | | | |
Consumer Staples 8.9% | | | | | | | | | | | | |
The Coca-Cola Co. | | | United States | | | | 885,000 | | | | 42,373,800 | |
The Kraft Heinz Co. | | | United States | | | | 191,600 | | | | 10,532,252 | |
PepsiCo Inc. | | | United States | | | | 460,500 | | | | 51,750,990 | |
The Procter & Gamble Co. | | | United States | | | | 567,500 | | | | 50,325,900 | |
Walmart Inc. | | | United States | | | | 370,000 | | | | 37,103,600 | |
| | | | | | | | | | | | |
| | | |
| | | | | | | | | | | 192,086,542 | |
| | | | | | | | | | | | |
Energy 8.4% | | | | | | | | | | | | |
Chevron Corp. | | | United States | | | | 453,900 | | | | 50,677,935 | |
Exxon Mobil Corp. | | | United States | | | | 455,934 | | | | 36,328,821 | |
Occidental Petroleum Corp. | | | United States | | | | 425,000 | | | | 28,504,750 | |
ONEOK Inc. | | | United States | | | | 262,000 | | | | 17,187,200 | |
Royal Dutch Shell PLC, A, ADR | | | United Kingdom | | | | 415,000 | | | | 26,223,850 | |
Suncor Energy Inc. | | | Canada | | | | 630,000 | | | | 20,985,300 | |
| | | | | | | | | | | | |
| | | |
| | | | | | | | | | | 179,907,856 | |
| | | | | | | | | | | | |
Financials 18.7% | | | | | | | | | | | | |
Arthur J. Gallagher & Co. | | | United States | | | | 297,800 | | | | 22,040,178 | |
Bank of America Corp. | | | United States | | | | 1,300,900 | | | | 35,774,750 | |
BB&T Corp. | | | United States | | | | 720,000 | | | | 35,395,200 | |
BlackRock Inc. | | | United States | | | | 87,500 | | | | 35,999,250 | |
JPMorgan Chase & Co. | | | United States | | | | 866,000 | | | | 94,411,320 | |
MetLife Inc. | | | United States | | | | 685,000 | | | | 28,215,150 | |
Morgan Stanley | | | United States | | | | 956,000 | | | | 43,650,960 | |
U.S. Bancorp | | | United States | | | | 879,300 | | | | 45,961,011 | |
Wells Fargo & Co. | | | United States | | | | 1,145,000 | | | | 60,948,350 | |
| | | | | | | | | | | | |
| | | |
| | | | | | | | | | | 402,396,169 | |
| | | | | | | | | | | | |
Health Care 13.4% | | | | | | | | | | | | |
Baxter International Inc. | | | United States | | | | 170,000 | | | | 10,626,700 | |
Bristol-Myers Squibb Co. | | | United States | | | | 215,000 | | | | 10,866,100 | |
Eli Lilly & Co. | | | United States | | | | 255,000 | | | | 27,652,200 | |
Johnson & Johnson | | | United States | | | | 365,000 | | | | 51,096,350 | |
Medtronic PLC | | | United States | | | | 500,000 | | | | 44,910,000 | |
Merck & Co. Inc. | | | United States | | | | 670,000 | | | | 49,318,700 | |
Pfizer Inc. | | | United States | | | | 1,184,300 | | | | 50,995,958 | |
UnitedHealth Group Inc. | | | United States | | | | 161,500 | | | | 42,208,025 | |
| | | | | | | | | | | | |
| | | |
| | | | | | | | | | | 287,674,033 | |
| | | | | | | | | | | | |
| | | | |
| | | |
| franklintempleton.com | | Annual Report | | 57 |
FRANKLIN INVESTORS SECURITIES TRUST
STATEMENT OF INVESTMENTS
Franklin Equity Income Fund (continued)
| | | | | | | | | | | | |
| | | Country | | | Shares | | | Value | |
| Common Stocks (continued) | | | | | | | | | |
| Industrials 8.8% | | | | | | | | | |
Cummins Inc. | | | United States | | | | 115,000 | | | $ | 15,719,350 | |
Illinois Tool Works Inc. | | | United States | | | | 82,500 | | | | 10,524,525 | |
Lockheed Martin Corp. | | | United States | | | | 100,600 | | | | 29,561,310 | |
Norfolk Southern Corp. | | | United States | | | | 163,500 | | | | 27,440,205 | |
Raytheon Co. | | | United States | | | | 215,000 | | | | 37,633,600 | |
Republic Services Inc. | | | United States | | | | 553,500 | | | | 40,228,380 | |
Stanley Black & Decker Inc. | | | United States | | | | 81,280 | | | | 9,470,746 | |
United Technologies Corp. | | | United States | | | | 161,600 | | | | 20,072,336 | |
| | | | | | | | | | | | |
| | | |
| | | | | | | | | | | 190,650,452 | |
| | | | | | | | | | | | |
| Information Technology 10.9% | | | | | | | | | |
Apple Inc. | | | United States | | | | 213,500 | | | | 46,726,610 | |
Broadcom Inc. | | | United States | | | | 23,530 | | | | 5,258,719 | |
Cisco Systems Inc. | | | United States | | | | 854,233 | | | | 39,081,160 | |
Intel Corp. | | | United States | | | | 433,402 | | | | 20,317,886 | |
Microsoft Corp. | | | United States | | | | 775,000 | | | | 82,777,750 | |
Oracle Corp. | | | United States | | | | 290,500 | | | | 14,188,020 | |
Texas Instruments Inc. | | | United States | | | | 286,000 | | | | 26,549,380 | |
| | | | | | | | | | | | |
| | | |
| | | | | | | | | | | 234,899,525 | |
| | | | | | | | | | | | |
| Materials 4.0% | | | | | | | | | |
BASF SE | | | Germany | | | | 262,500 | | | | 20,219,578 | |
DowDuPont Inc. | | | United States | | | | 522,000 | | | | 28,146,240 | |
International Paper Co. | | | United States | | | | 454,800 | | | | 20,629,728 | |
Linde PLC | | | United Kingdom | | | | 108,500 | | | | 17,953,495 | |
| | | | | | | | | | | | |
| | | |
| | | | | | | | | | | 86,949,041 | |
| | | | | | | | | | | | |
| Real Estate 1.6% | | | | | | | | | |
Equity Residential | | | United States | | | | 175,000 | | | | 11,368,000 | |
Host Hotels & Resorts Inc. | | | United States | | | | 1,193,000 | | | | 22,798,230 | |
| | | | | | | | | | | | |
| | | |
| | | | | | | | | | | 34,166,230 | |
| | | | | | | | | | | | |
| Utilities 4.8% | | | | | | | | | |
Duke Energy Corp. | | | United States | | | | 291,500 | | | | 24,086,645 | |
NextEra Energy Inc. | | | United States | | | | 255,300 | | | | 44,039,250 | |
Xcel Energy Inc. | | | United States | | | | 723,500 | | | | 35,458,735 | |
| | | | | | | | | | | | |
| | | |
| | | | | | | | | | | 103,584,630 | |
| | | | | | | | | | | | |
| | | |
Total Common Stocks (Cost $1,312,600,606) | | | | | | | | | | | 1,874,026,837 | |
| | | | | | | | | | | | |
| | | |
a Equity-Linked Securities 7.4% | | | | | | | | | | | | |
| Communication Services 1.2% | | | | | | | | | |
b Goldman Sachs International into Alphabet Inc., 5.00%, A, 144A | | | United States | | | | 23,900 | | | | 25,995,817 | |
| | | | | | | | | | | | |
| Consumer Discretionary 1.3% | | | | | | | | | |
b Wells Fargo Bank National Assn. into Amazon.com Inc., 6.00%, 144A | | | United States | | | | 18,000 | | | | 28,879,612 | |
| | | | | | | | | | | | |
| Energy 0.5% | | | | | | | | | |
b Credit Suisse AG London into Schlumberger Ltd., 6.50%, 144A | | | United States | | | | 210,000 | | | | 10,947,650 | |
| | | | | | | | | | | | |
| Financials 2.2% | | | | | | | | | |
b Morgan Stanley BV into Bank of America Corp., 6.50%, 144A | | | United States | | | | 800,000 | | | | 22,437,716 | |
b UBS AG London into The Charles Schwab Corp., 6.50%, 144A | | | United States | | | | 545,000 | | | | 25,531,378 | |
| | | | | | | | | | | | |
| | | |
| | | | | | | | | | | 47,969,094 | |
| | | | | | | | | | | | |
| Health Care 0.5% | | | | | | | | | |
b Deutsche Bank AG London into Baxter International Inc., 4.50%, 144A | | | United States | | | | 170,000 | | | | 10,691,798 | |
| | | | | | | | | | | | |
| | | | |
| | | |
| 58 | | Annual Report | | franklintempleton.com |
FRANKLIN INVESTORS SECURITIES TRUST
STATEMENT OF INVESTMENTS
Franklin Equity Income Fund (continued)
| | | | | | | | | | | | |
| | | Country | | | Shares | | | Value | |
| a Equity-Linked Securities (continued) | | | | | | | | | |
| Information Technology 1.7% | | | | | | | | | |
b Credit Suisse AG London into Broadcom Inc., 8.50%, 144A | | | United States | | | | 70,500 | | | $ | 16,273,778 | |
b Merrill Lynch International & Co. CV into Analog Devices Inc., 7.00%, 144A | | | United States | | | | 235,000 | | | | 19,671,729 | |
| | | | | | | | | | | | |
| | | |
| | | | | | | | | | | 35,945,507 | |
| | | | | | | | | | | | |
| | | |
Total Equity-Linked Securities (Cost $174,339,589) | | | | | | | | | | | 160,429,478 | |
| | | | | | | | | | | | |
| Convertible Preferred Stocks 2.7% | | | | | | | | | |
| Health Care 1.7% | | | | | | | | | |
Becton Dickinson and Co., 6.125%, cvt. pfd., A | | | United States | | | | 613,000 | | | | 35,964,710 | |
| | | | | | | | | | | | |
| Industrials 0.4% | | | | | | | | | |
Fortive Corp., 5.00% , cvt. pfd., A | | | United States | | | | 8,250 | | | | 8,103,233 | |
| | | | | | | | | | | | |
| Materials 0.6% | | | | | | | | | |
c International Flavors & Fragrances Inc., 6.00%, cvt. pfd. | | | United States | | | | 227,476 | | | | 13,098,068 | |
| | | | | | | | | | | | |
Total Convertible Preferred Stocks (Cost $52,546,621) | | | | | | | | | | | 57,166,011 | |
| | | | | | | | | | | | |
Total Investments before Short Term Investments
(Cost $1,539,486,816) | | | | | | | | | | | 2,091,622,326 | |
| | | | | | | | | | | | |
| | | |
Short Term Investments (Cost $70,527,817) 3.3% | | | | | | | | | | | | |
| | | |
Money Market Funds 3.3% | | | | | | | | | | | | |
d,e Institutional Fiduciary Trust Money Market Portfolio, 1.83% | | | United States | | | | 70,527,817 | | | | 70,527,817 | |
| | | | | | | | | | | | |
| | | |
Total Investments (Cost $1,610,014,633) 100.4% | | | | | | | | | | | 2,162,150,143 | |
Other Assets, less Liabilities (0.4)% | | | | | | | | | | | (8,212,231 | ) |
| | | | | | | | | | | | |
Net Assets 100.0% | | | | | | | | | | | $2,153,937,912 | |
| | | | | | | | | | | | |
See Abbreviations on page 90.
aSee Note 1(f) regarding equity-linked securities.
bSecurity was purchased pursuant to Rule 144A under the Securities Act of 1933 and may be sold in transactions exempt from registration only to qualified institutional buyers or in a public offering registered under the Securities Act of 1933. These securities have been deemed liquid under guidelines approved by the Trust’s Board of Trustees. At October 31, 2018, the aggregate value of these securities was $160,429,478 , representing 7.4% of net assets.
cNon-income producing.
dSee Note 3(f) regarding investments in affiliated management investment companies.
eThe rate shown is the annualized seven-day effective yield at period end.
| | | | |
| | | |
| franklintempleton.com | | The accompanying notes are an integral part of these financial statements. | Annual Report | | 59 |
FRANKLIN INVESTORS SECURITIES TRUST
Financial Highlights
Franklin Real Return Fund
| | | | | | | | | | | | | | | | | | | | |
| | | Year Ended October 31, | |
| | | 2018 | | | 2017 | | | 2016 | | | 2015 | | | 2014 | |
Class A | | | | | | | | | | | | | | | | | | | | |
| | | | | |
Per share operating performance | | | | | | | | | | | | | | | | | | | | |
(for a share outstanding throughout the year) | | | | | | | | | | | | | | | | | | | | |
| | | | | |
Net asset value, beginning of year | | | $10.14 | | | | $10.09 | | | | $9.92 | | | | $10.66 | | | | $10.82 | |
| | | | |
| | | | | |
Income from investment operationsa: | | | | | | | | | | | | | | | | | | | | |
| | | | | |
Net investment incomeb | | | 0.19 | | | | 0.17 | | | | 0.12 | | | | 0.05 | | | | 0.14 | |
| | | | | |
Net realized and unrealized gains (losses) | | | (0.25) | | | | 0.01 | | | | 0.15 | | | | (0.72) | | | | (0.06) | |
| | | | |
| | | | | |
Total from investment operations | | | (0.06) | | | | 0.18 | | | | 0.27 | | | | (0.67) | | | | 0.08 | |
| | | | |
| | | | | |
Less distributions from: | | | | | | | | | | | | | | | | | | | | |
| | | | | |
Net investment income | | | (0.33) | | | | (0.13) | | | | (0.09) | | | | (0.07) | | | | (0.24) | |
| | | | | |
Tax return of capital | | | — | | | | — | | | | (0.01) | | | | — | | | | — | |
| | | | |
| | | | | |
Total distributions | | | (0.33) | | | | (0.13) | | | | (0.10) | | | | (0.07) | | | | (0.24) | |
| | | | |
| | | | | |
Net asset value, end of year | | | $9.75 | | | | $10.14 | | | | $10.09 | | | | $9.92 | | | | $10.66 | |
| | | | |
| | | | | |
Total returnc | | | (0.69)% | | | | 1.77% | | | | 2.77% | | | | (6.32)% | | | | 0.75% | |
| | | | | |
Ratios to average net assets | | | | | | | | | | | | | | | | | | | | |
| | | | | |
Expenses before waiver and payments by affiliates | | | 1.16% | | | | 1.17% | | | | 1.12% | | | | 1.10% | | | | 1.10% | |
| | | | | |
Expenses net of waiver and payments by affiliatesd | | | 0.90% | | | | 0.90% | | | | 0.90% | | | | 0.90% | | | | 0.90% | |
| | | | | |
Net investment income | | | 1.92% | | | | 1.69% | | | | 1.18% | | | | 0.43% | | | | 1.34% | |
| | | | | |
Supplemental data | | | | | | | | | | | | | | | | | | | | |
| | | | | |
Net assets, end of year (000’s) | | | $132,772 | | | | $146,866 | | | | $161,541 | | | | $185,743 | | | | $248,313 | |
| | | | | |
Portfolio turnover rate | | | 27.83% | | | | 32.44% | | | | 31.82% | | | | 26.57% | | | | 33.02% | |
aThe amount shown for a share outstanding throughout the period may not correlate with the Statement of Operations for the period due to the timing of sales and repurchases of the Fund’s shares in relation to income earned, adjustments to interest income for the inflation-indexed bonds, and/or fluctuating fair value of the investments of the Fund.
bBased on average daily shares outstanding.
cTotal return does not reflect sales commissions or contingent deferred sales charges, if applicable.
dBenefit of expense reduction rounds to less than 0.01%.
| | | | |
| | | |
| 60 | | Annual Report | The accompanying notes are an integral part of these financial statements. | | franklintempleton.com |
FRANKLIN INVESTORS SECURITIES TRUST
FINANCIAL HIGHLIGHTS
Franklin Real Return Fund (continued)
| | | | | | | | | | | | | | | | | | | | |
| | | Year Ended October 31, | |
| | | 2018 | | | 2017 | | | 2016 | | | 2015 | | | 2014 | |
Class C | | | | | | | | | | | | | | | | | | | | |
| | | | | |
Per share operating performance | | | | | | | | | | | | | | | | | | | | |
(for a share outstanding throughout the year) | | | | | | | | | | | | | | | | | | | | |
| | | | | |
Net asset value, beginning of year | | | $10.03 | | | | $10.00 | | | | $9.82 | | | | $10.59 | | | | $10.76 | |
| | | | |
| | | | | |
Income from investment operationsa: | | | | | | | | | | | | | | | | | | | | |
| | | | | |
Net investment incomeb | | | 0.15 | | | | 0.13 | | | | 0.08 | | | | —c | | | | 0.10 | |
| | | | | |
Net realized and unrealized gains (losses) | | | (0.25) | | | | —c | | | | 0.16 | | | | (0.71) | | | | (0.07) | |
| | | | |
| | | | | |
Total from investment operations | | | (0.10) | | | | 0.13 | | | | 0.24 | | | | (0.71) | | | | 0.03 | |
| | | | |
| | | | | |
Less distributions from: | | | | | | | | | | | | | | | | | | | | |
| | | | | |
Net investment income | | | (0.29) | | | | (0.10) | | | | (0.05) | | | | (0.06) | | | | (0.20) | |
| | | | | |
Tax return of capital | | | — | | | | — | | | | (0.01) | | | | — | | | | — | |
| | | | |
| | | | | |
Total distributions | | | (0.29) | | | | (0.10) | | | | (0.06) | | | | (0.06) | | | | (0.20) | |
| | | | |
| | | | | |
Net asset value, end of year | | | $9.64 | | | | $10.03 | | | | $10.00 | | | | $9.82 | | | | $10.59 | |
| | | | |
| | | | | |
Total returnd | | | (1.06)% | | | | 1.30% | | | | 2.44% | | | | (6.70)% | | | | 0.22% | |
| | | | | |
Ratios to average net assets | | | | | | | | | | | | | | | | | | | | |
| | | | | |
Expenses before waiver and payments by affiliates | | | 1.56% | | | | 1.57% | | | | 1.52% | | | | 1.50% | | | | 1.50% | |
| | | | | |
Expenses net of waiver and payments by affiliatese | | | 1.30% | | | | 1.30% | | | | 1.30% | | | | 1.30% | | | | 1.30% | |
| | | | | |
Net investment income | | | 1.52% | | | | 1.29% | | | | 0.78% | | | | 0.04% | | | | 0.94% | |
| | | | | |
Supplemental data | | | | | | | | | | | | | | | | | | | | |
| | | | | |
Net assets, end of year (000’s) | | | $24,685 | | | | $33,844 | | | | $39,568 | | | | $48,084 | | | | $68,188 | |
| | | | | |
Portfolio turnover rate | | | 27.83% | | | | 32.44% | | | | 31.82% | | | | 26.57% | | | | 33.02% | |
aThe amount shown for a share outstanding throughout the period may not correlate with the Statement of Operations for the period due to the timing of sales and repurchases of the Fund’s shares in relation to income earned, adjustments to interest income for the inflation-indexed bonds, and/or fluctuating fair value of the investments of the Fund.
bBased on average daily shares outstanding.
cAmount rounds to less than $0.01 per share.
dTotal return does not reflect sales commissions or contingent deferred sales charges, if applicable.
eBenefit of expense reduction rounds to less than 0.01%.
| | | | |
| | | |
| franklintempleton.com | | The accompanying notes are an integral part of these financial statements. | Annual Report | | 61 |
FRANKLIN INVESTORS SECURITIES TRUST
FINANCIAL HIGHLIGHTS
Franklin Real Return Fund (continued)
| | | | | | | | | | | | | | | | | | | | |
| | | Year Ended October 31, | |
| | | 2018 | | | 2017 | | | 2016 | | | 2015 | | | 2014 | |
Class R6 | | | | | | | | | | | | | | | | | | | | |
| | | | | |
Per share operating performance | | | | | | | | | | | | | | | | | | | | |
(for a share outstanding throughout the year) | | | | | | | | | | | | | | | | | | | | |
| | | | | |
Net asset value, beginning of year | | | $10.19 | | | | $10.15 | | | | $9.98 | | | | $10.68 | | | | $10.85 | |
| | | | |
| | | | | |
Income from investment operationsa: | | | | | | | | | | | | | | | | | | | | |
| | | | | |
Net investment incomeb | | | 0.22 | | | | 0.22 | | | | 0.16 | | | | 0.10 | | | | 0.21 | |
| | | | | |
Net realized and unrealized gains (losses) | | | (0.24) | | | | (0.01) | | | | 0.16 | | | | (0.72) | | | | (0.10) | |
| | | | |
| | | | | |
Total from investment operations | | | (0.02) | | | | 0.21 | | | | 0.32 | | | | (0.62) | | | | 0.11 | |
| | | | |
| | | | | |
Less distributions from: | | | | | | | | | | | | | | | | | | | | |
| | | | | |
Net investment income | | | (0.36) | | | | (0.17) | | | | (0.14) | | | | (0.08) | | | | (0.28) | |
| | | | | |
Tax return of capital | | | — | | | | — | | | | (0.01) | | | | — | | | | — | |
| | | | |
| | | | | |
Total distributions | | | (0.36) | | | | (0.17) | | | | (0.15) | | | | (0.08) | | | | (0.28) | |
| | | | |
| | | | | |
Net asset value, end of year | | | $9.81 | | | | $10.19 | | | | $10.15 | | | | $9.98 | | | | $10.68 | |
| | | | |
| | | | | |
Total return | | | (0.21)% | | | | 2.09% | | | | 3.25% | | | | (5.87)% | | | | 1.04% | |
| | | | | |
Ratios to average net assets | | | | | | | | | | | | | | | | | | | | |
| | | | | |
Expenses before waiver and payments by affiliates | | | 0.81% | | | | 0.72% | | | | 0.71% | | | | 0.71% | | | | 0.70% | |
| | | | | |
Expenses net of waiver and payments by affiliatesc | | | 0.49% | | | | 0.49% | | | | 0.50% | | | | 0.50% | | | | 0.52% | |
| | | | | |
Net investment income | | | 2.33% | | | | 2.11% | | | | 1.58% | | | | 0.83% | | | | 1.72% | |
| | | | | |
Supplemental data | | | | | | | | | | | | | | | | | | | | |
| | | | | |
Net assets, end of year (000’s) | | | $14,475 | | | | $5,727 | | | | $5,326 | | | | $1,730 | | | | $2,034 | |
| | | | | |
Portfolio turnover rate | | | 27.83% | | | | 32.44% | | | | 31.82% | | | | 26.57% | | | | 33.02% | |
aThe amount shown for a share outstanding throughout the period may not correlate with the Statement of Operations for the period due to the timing of sales and repurchases of the Fund’s shares in relation to income earned, adjustments to interest income for the inflation-indexed bonds, and/or fluctuating fair value of the investments of the Fund.
bBased on average daily shares outstanding.
cBenefit of expense reduction rounds to less than 0.01%.
| | | | |
| | | |
| 62 | | Annual Report | The accompanying notes are an integral part of these financial statements. | | franklintempleton.com |
FRANKLIN INVESTORS SECURITIES TRUST
FINANCIAL HIGHLIGHTS
Franklin Real Return Fund (continued)
| | | | | | | | | | | | | | | | | | | | |
| | | Year Ended October 31, | |
| | | 2018 | | | 2017 | | | 2016 | | | 2015 | | | 2014 | |
Advisor Class | | | | | | | | | | | | | | | | | | | | |
| | | | | |
Per share operating performance | | | | | | | | | | | | | | | | | | | | |
(for a share outstanding throughout the year) | | | | | | | | | | | | | | | | | | | | |
| | | | | |
Net asset value, beginning of year | | | $10.18 | | | | $10.13 | | | | $9.96 | | | | $10.68 | | | | $10.85 | |
| | | | |
| | | | | |
Income from investment operationsa: | | | | | | | | | | | | | | | | | | | | |
| | | | | |
Net investment incomeb | | | 0.23 | | | | 0.20 | | | | 0.14 | | | | 0.05 | | | | 0.18 | |
| | | | | |
Net realized and unrealized gains (losses) | | | (0.27) | | | | —c | | | | 0.16 | | | | (0.70) | | | | (0.08) | |
| | | | |
| | | | | |
Total from investment operations | | | (0.04) | | | | 0.20 | | | | 0.30 | | | | (0.65) | | | | 0.10 | |
| | | | |
| | | | | |
Less distributions from: | | | | | | | | | | | | | | | | | | | | |
| | | | | |
Net investment income | | | (0.35) | | | | (0.15) | | | | (0.12) | | | | (0.07) | | | | (0.27) | |
| | | | | |
Tax return of capital | | | — | | | | — | | | | (0.01) | | | | — | | | | — | |
| | | | |
| | | | | |
Total distributions | | | (0.35) | | | | (0.15) | | | | (0.13) | | | | (0.07) | | | | (0.27) | |
| | | | |
| | | | | |
Net asset value, end of year | | | $9.79 | | | | $10.18 | | | | $10.13 | | | | $9.96 | | | | $10.68 | |
| | | | |
| | | | | |
Total return | | | (0.47)% | | | | 2.03% | | | | 3.04% | | | | (6.08)% | | | | 0.91% | |
| | | | | |
Ratios to average net assets | | | | | | | | | | | | | | | | | | | | |
| | | | | |
Expenses before waiver and payments by affiliates | | | 0.91% | | | | 0.92% | | | | 0.87% | | | | 0.85% | | | | 0.85% | |
| | | | | |
Expenses net of waiver and payments by affiliatesd | | | 0.65% | | | | 0.65% | | | | 0.65% | | | | 0.65% | | | | 0.65% | |
| | | | | |
Net investment income | | | 2.17% | | | | 1.94% | | | | 1.43% | | | | 0.68% | | | | 1.59% | |
| | | | | |
Supplemental data | | | | | | | | | | | | | | | | | | | | |
| | | | | |
Net assets, end of year (000’s) | | | $19,703 | | | | $40,077 | | | | $35,215 | | | | $37,758 | | | | $65,958 | |
| | | | | |
Portfolio turnover rate | | | 27.83% | | | | 32.44% | | | | 31.82% | | | | 26.57% | | | | 33.02% | |
aThe amount shown for a share outstanding throughout the period may not correlate with the Statement of Operations for the period due to the timing of sales and repurchases of the Fund’s shares in relation to income earned, adjustments to interest income for the inflation-indexed bonds, and/or fluctuating fair value of the investments of the Fund.
bBased on average daily shares outstanding.
cAmount rounds to less than $0.01 per share.
dBenefit of expense reduction rounds to less than 0.01%.
| | | | |
| | | |
| franklintempleton.com | | The accompanying notes are an integral part of these financial statements. | Annual Report | | 63 |
FRANKLIN INVESTORS SECURITIES TRUST
Statement of Investments, October 31, 2018
Franklin Real Return Fund
| | | | | | | | | | | | |
| | | Country | | | Shares | | | Value | |
| Common Stocks 10.0% | | | | | | | | | |
| Energy 5.8% | | | | | | | | | |
Anadarko Petroleum Corp. | | | United States | | | | 23,700 | | | $ | 1,260,840 | |
Canadian Natural Resources Ltd. | | | Canada | | | | 33,700 | | | | 920,684 | |
Chevron Corp. | | | United States | | | | 13,700 | | | | 1,529,605 | |
Exxon Mobil Corp. | | | United States | | | | 15,277 | | | | 1,217,271 | |
Halliburton Co. | | | United States | | | | 33,300 | | | | 1,154,844 | |
Noble Energy Inc. | | | United States | | | | 27,400 | | | | 680,890 | |
Occidental Petroleum Corp. | | | United States | | | | 18,200 | | | | 1,220,674 | |
Pioneer Natural Resources Co. | | | United States | | | | 4,700 | | | | 692,169 | |
Royal Dutch Shell PLC, A, ADR | | | United Kingdom | | | | 19,800 | | | | 1,251,162 | |
Schlumberger Ltd. | | | United States | | | | 20,850 | | | | 1,069,814 | |
a Weatherford International PLC | | | United States | | | | 119,400 | | | | 161,190 | |
| | | | | | | | | | | | |
| | | |
| | | | | | | | | | | 11,159,143 | |
| | | | | | | | | | | | |
| Materials 4.2% | | | | | | | | | |
BHP Billiton PLC, ADR | | | United Kingdom | | | | 32,700 | | | | 1,316,175 | |
DowDuPont Inc. | | | United States | | | | 26,600 | | | | 1,434,272 | |
Freeport-McMoRan Inc. | | | United States | | | | 53,046 | | | | 617,986 | |
Goldcorp Inc. | | | Canada | | | | 101,600 | | | | 916,432 | |
Nucor Corp. | | | United States | | | | 21,000 | | | | 1,241,520 | |
Nutrien Ltd. | | | Canada | | | | 19,624 | | | | 1,038,698 | |
Rio Tinto PLC, ADR | | | Australia | | | | 27,700 | | | | 1,365,333 | |
| | | | | | | | | | | | |
| | | |
| | | | | | | | | | | 7,930,416 | |
| | | | | | | | | | | | |
| | | |
Total Common Stocks (Cost $21,881,535) | | | | | | | | | | | 19,089,559 | |
| | | | | | | | | | | | |
| | | |
Management Investment Companies 10.2% | | | | | | | | | | | | |
| Diversified Financials 10.2% | | | | | | | | | |
b Franklin Pelagos Commodities Strategy Fund, Class R6 | | | United States | | | | 897,760 | | | | 5,808,508 | |
iShares Global Infrastructure ETF | | | United States | | | | 95,000 | | | | 3,853,200 | |
SPDR Dow Jones REIT ETF | | | United States | | | | 109,700 | | | | 9,969,536 | |
| | | | | | | | | | | | |
| | | |
Total Management Investment Companies (Cost $15,329,164) | | | | | | | | | | | 19,631,244 | |
| | | | | | | | | | | | |
| | | |
| | | | | | Principal
Amount | | | | |
| | | | | | | | | | | | |
U.S. Government and Agency Securities 73.1% | | | | | | | | | | | | |
c U.S. Treasury Bond, Index Linked, 0.625%, 1/15/24 | | | United States | | | $ | 8,104,643 | | | | 7,932,844 | |
c U.S. Treasury Note, | | | | | | | | | | | | |
Index Linked, 2.125%, 1/15/19 | | | United States | | | | 28,185,392 | | | | 28,194,384 | |
Index Linked, 0.125%, 4/15/19 | | | United States | | | | 19,691,856 | | | | 19,521,475 | |
Index Linked, 1.875%, 7/15/19 | | | United States | | | | 24,798,689 | | | | 24,987,747 | |
Index Linked, 1.375%, 1/15/20 | | | United States | | | | 12,359,528 | | | | 12,390,024 | |
Index Linked, 0.125%, 4/15/20 | | | United States | | | | 10,228,616 | | | | 10,053,744 | |
Index Linked, 0.125%, 4/15/21 | | | United States | | | | 12,340,738 | | | | 12,028,242 | |
Index Linked, 0.625%, 7/15/21 | | | United States | | | | 7,047,939 | | | | 6,988,611 | |
Index Linked, 0.125%, 7/15/24 | | | United States | | | | 8,495,120 | | | | 8,096,683 | |
Index Linked, 0.25%, 1/15/25 | | | United States | | | | 10,326,075 | | | | 9,814,834 | |
| | | | | | | | | | | | |
Total U.S. Government and Agency Securities
(Cost $142,263,552) | | | | | | | | | | | 140,008,588 | |
| | | | | | | | | | | | |
Total Investments before Short Term Investments
(Cost $179,474,251) | | | | | | | | | | | 178,729,391 | |
| | | | | | | | | | | | |
| | | | |
| | | |
| 64 | | Annual Report | | franklintempleton.com |
FRANKLIN INVESTORS SECURITIES TRUST
STATEMENT OF INVESTMENTS
Franklin Real Return Fund (continued)
| | | | | | | | | | | | |
| | | Country | | | Principal
Amount | | | Value | |
Short Term Investments (Cost $12,537,445) 6.5% | | | | | | | | | | | | |
| | | |
Repurchase Agreements 6.5% | | | | | | | | | | | | |
d Joint Repurchase Agreement, 2.191%, 11/01/18 (Maturity Value $12,538,208) | | | | | | | | | | | | |
BNP Paribas Securities Corp. (Maturity Value $5,793,655) | | | | | | | | | | | | |
Deutsche Bank Securities Inc. (Maturity Value $1,675,230) | | | | | | | | | | | | |
HSBC Securities (USA) Inc. (Maturity Value $5,069,323) | | | | | | | | | | | | |
Collateralized by U.S. Government Agency Securities, 3.00% - 4.50%,
6/15/39 - 6/20/48; U.S. Treasury Bond, 2.50%, 8/15/23; and U.S. Treasury
Note, 1.00% - 3.50%, 11/15/19 - 7/31/23 (valued at $12,789,879) | | | United States | | | $ | 12,537,445 | | | $ | 12,537,445 | |
| | | | | | | | | | | | |
Total Investments (Cost $192,011,696) 99.8% | | | | | | | | | | | 191,266,836 | |
Other Assets, less Liabilities 0.2% | | | | | | | | | | | 368,246 | |
| | | | | | | | | | | | |
Net Assets 100.0%. | | | | | | | | | | $ | 191,635,082 | |
| | | | | | | | | | | | |
See Abbreviations on page 90.
aNon-income producing.
bSee Note 3(f) regarding investments in affiliated management investment companies.
cPrincipal amount of security is adjusted for inflation. See Note 1(i).
dSee Note 1(c) regarding joint repurchase agreement.
| | | | |
| | | |
| franklintempleton.com | | The accompanying notes are an integral part of these financial statements. | Annual Report | | 65 |
FRANKLIN INVESTORS SECURITIES TRUST
Financial Statements
Statements of Assets and Liabilities
October 31, 2018
| | | | | | | | | | | | | | | | |
| | | Franklin
Balanced Fund | | | Franklin
Convertible
Securities Fund | | | Franklin Equity
Income Fund | | | Franklin Real
Return Fund | |
Assets: | | | | | | | | | | | | | | | | |
Investments in securities: | | | | | | | | | | | | | | | | |
Cost - Unaffiliated issuers | | | $2,873,753,610 | | | | $3,249,143,421 | | | | $1,539,486,816 | | | | $173,474,251 | |
Cost - Controlled affiliates (Note 3f) | | | 66,585,500 | | | | — | | | | — | | | | — | |
Cost - Non-controlled affiliates (Note 3f) | | | 126,683,009 | | | | 163,242,682 | | | | 70,527,817 | | | | 6,000,000 | |
Cost - Unaffiliated repurchase agreements | | | — | | | | — | | | | — | | | | 12,537,445 | |
| | | | |
Value - Unaffiliated issuers | | | $3,129,872,580 | | | | $3,531,420,804 | | | | $2,091,622,326 | | | | $172,920,883 | |
Value - Controlled affiliates (Note 3f) | | | 62,931,250 | | | | — | | | | — | | | | — | |
Value - Non-controlled affiliates (Note 3f) | | | 126,683,009 | | | | 163,242,682 | | | | 70,527,817 | | | | 5,808,508 | |
Value - Unaffiliated repurchase agreements | | | — | | | | — | | | | — | | | | 12,537,445 | |
Cash | | | 223,156 | | | | — | | | | — | | | | — | |
Foreign currency, at value (cost $—, $—, $— and $80,597, respectively) | | | — | | | | — | | | | — | | | | 80,414 | |
Receivables: | | | | | | | | | | | | | | | | |
Investment securities sold | | | 6,424,742 | | | | — | | | | 4,383,671 | | | | — | |
Capital shares sold | | | 2,904,693 | | | | 4,481,408 | | | | 1,347,135 | | | | 249,257 | |
Dividends and interest | | | 16,999,808 | | | | 13,552,165 | | | | 2,233,282 | | | | 428,474 | |
European Union tax reclaims | | | 93,707 | | | | — | | | | 67,349 | | | | — | |
Deposits with brokers for: | | | | | | | | | | | | | | | | |
Exchange traded options written | | | 15,750,000 | | | | — | | | | — | | | | — | |
Other assets | | | 1,044 | | | | 724 | | | | 665 | | | | 62 | |
| | | | |
| | | | |
Total assets | | | 3,361,883,989 | | | | 3,712,697,783 | | | | 2,170,182,245 | | | | 192,025,043 | |
| | | | |
Liabilities: | | | | | | | | | | | | | | | | |
Payables: | | | | | | | | | | | | | | | | |
Investment securities purchased | | | — | | | | — | | | | 12,424,637 | | | | — | |
Capital shares redeemed | | | 3,246,783 | | | | 9,040,382 | | | | 1,860,516 | | | | 202,815 | |
Management fees | | | 1,796,547 | | | | 1,335,044 | | | | 809,256 | | | | 59,798 | |
Distribution fees | | | 1,003,143 | | | | 543,227 | | | | 579,061 | | | | 43,244 | |
Transfer agent fees | | | 662,935 | | | | 732,766 | | | | 423,871 | | | | 19,862 | |
Professional fees | | | 51,979 | | | | 53,414 | | | | 42,417 | | | | 40,921 | |
Options written, at value (premiums received $10,407,129, $—, $— and $—, respectively) | | | 8,390,000 | | | | — | | | | — | | | | — | |
Accrued expenses and other liabilities | | | 165,703 | | | | 115,455 | | | | 104,575 | | | | 23,321 | |
| | | | |
| | | | |
Total liabilities | | | 15,317,090 | | | | 11,820,288 | | | | 16,244,333 | | | | 389,961 | |
| | | | |
| | | | |
Net assets, at value | | | $3,346,566,899 | | | | $3,700,877,495 | | | | $2,153,937,912 | | | | $191,635,082 | |
| | | | |
Net assets consist of: | | | | | | | | | | | | | | | | |
Paid-in capital | | | $3,083,999,531 | | | | $3,280,015,943 | | | | $1,512,423,816 | | | | $220,345,246 | |
Total distributable earnings (loss) | | | 262,567,368 | | | | 420,861,552 | | | | 641,514,096 | | | | (28,710,164 | ) |
| | | | |
| | | | |
Net assets, at value | | | $3,346,566,899 | | | | $3,700,877,495 | | | | $2,153,937,912 | | | | $191,635,082 | |
| | | | |
| | | | |
| | | |
| 66 | | Annual Report | The accompanying notes are an integral part of these financial statements. | | franklintempleton.com |
FRANKLIN INVESTORS SECURITIES TRUST
FINANCIAL STATEMENTS
Statements of Assets and Liabilities (continued)
October 31, 2018
| | | | | | | | | | | | | | | | |
| | | Franklin Balanced Fund | | | Franklin Convertible Securities Fund | | | Franklin Equity Income Fund | | | Franklin Real Return Fund | |
Class A: | | | | | | | | | | | | | | | | |
Net assets, at value | | $ | 2,586,245,501 | | | $ | 1,153,875,107 | | | $ | 1,752,181,235 | | | $ | 132,771,781 | |
| | | | |
Shares outstanding | | | 217,527,234 | | | | 55,885,263 | | | | 70,492,708 | | | | 13,624,269 | |
| | | | |
Net asset value per sharea | | | $11.89 | | | | $20.65 | | | | $24.86 | | | | $9.75 | |
| | | | |
Maximum offering price per share (net asset value per share ÷ 94.50%, 94.50%, 94.50% and 95.75%,respectively) | | | $12.58 | | | | $21.85 | | | | $26.31 | | | | $10.18 | |
| | | | |
Class C: | | | | | | | | | | | | | | | | |
Net assets, at value | | $ | 493,761,889 | | | $ | 299,716,003 | | | $ | 204,401,566 | | | $ | 24,685,147 | |
| | | | |
Shares outstanding | | | 41,918,260 | | | | 14,754,378 | | | | 8,294,179 | | | | 2,560,649 | |
| | | | |
Net asset value and maximum offering price per sharea | | | $11.78 | | | | $20.31 | | | | $24.64 | | | | $9.64 | |
| | | | |
Class R: | | | | | | | | | | | | | | | | |
Net assets, at value | | $ | 3,371,023 | | | | | | | $ | 6,749,558 | | | | | |
| | | | | | | | | | | | | | | | |
Shares outstanding | | | 282,776 | | | | | | | | 271,617 | | | | | |
| | | | | | | | | | | | | | | | |
Net asset value and maximum offering price per share | | | $11.92 | | | | | | | | $24.85 | | | | | |
| | | | | | | | | | | | | | | | |
Class R6: | | | | | | | | | | | | | | | | |
Net assets, at value | | $ | 138,923,091 | | | $ | 57,824,287 | | | $ | 81,170,505 | | | $ | 14,475,459 | |
| | | | |
Shares outstanding | | | 11,649,732 | | | | 2,782,885 | | | | 3,259,143 | | | | 1,476,188 | |
| | | | |
Net asset value and maximum offering price per share | | | $11.93 | | | | $20.78 | | | | $24.91 | | | | $9.81 | |
| | | | |
Advisor Class: | | | | | | | | | | | | | | | | |
Net assets, at value | | $ | 124,265,395 | | | $ | 2,189,462,098 | | | $ | 109,435,048 | | | $ | 19,702,695 | |
| | | | |
Shares outstanding | | | 10,427,576 | | | | 106,003,482 | | | | 4,394,958 | | | | 2,013,090 | |
| | | | |
Net asset value and maximum offering price per share | | | $11.92 | | | | $20.65 | | | | $24.90 | | | | $9.79 | |
| | | | |
aRedemption price is equal to net asset value less contingent deferred sales charges, if applicable.
| | | | |
| | | |
| franklintempleton.com | | The accompanying notes are an integral part of these financial statements. | Annual Report | | 67 |
FRANKLIN INVESTORS SECURITIES TRUST
FINANCIAL STATEMENTS
Statements of Operations
for the year ended October 31, 2018
| | | | | | | | | | | | | | | | |
| | | Franklin
Balanced Fund | | | Franklin
Convertible
Securities Fund | | | Franklin Equity Income Fund | | | Franklin Real Return Fund | |
| |
Investment income: | | | | | | | | | | | | | | | | |
Dividends: (net of foreign taxes)* | | | | | | | | | | | | | | | | |
Unaffiliated issuers | | | $ 54,938,665 | | | | $ 18,855,815 | | | | $ 54,471,743 | | | | $1,108,011 | |
Controlled affiliates (Note 3f) | | | 1,168,132 | | | | — | | | | — | | | | — | |
Non-controlled affiliates (Note 3f) | | | 1,038,400 | | | | 2,180,907 | | | | 670,617 | | | | 95,470 | |
Interest: (net of foreign taxes)~ | | | | | | | | | | | | | | | | |
Unaffiliated issuers: | | | | | | | | | | | | | | | | |
Inflation principal adjustments | | | — | | | | — | | | | — | | | | 3,931,171 | |
Paid in cash | | | 55,381,461 | | | | 29,381,862 | | | | 2,086 | | | | 614,182 | |
Income from securities loaned (net of fees and rebates) | | | 2,004 | | | | — | | | | — | | | | — | |
Other income (Note 1h) | | | 103,005 | | | | — | | | | 74,032 | | | | — | |
| | | | |
| | | | |
Total investment income | | | 112,631,667 | | | | 50,418,584 | | | | 55,218,478 | | | | 5,748,834 | |
| | | | |
| | | | |
Expenses: | | | | | | | | | | | | | | | | |
Management fees (Note 3a) | | | 21,953,802 | | | | 14,511,526 | | | | 10,176,295 | | | | 1,275,469 | |
Distribution fees: (Note 3c) | | | | | | | | | | | | | | | | |
Class A | | | 6,539,759 | | | | 2,432,654 | | | | 4,381,532 | | | | 345,485 | |
Class C | | | 5,963,860 | | | | 3,411,131 | | | | 2,688,723 | | | | 198,694 | |
Class R | | | 22,121 | | | | — | | | | 32,875 | | | | — | |
Transfer agent fees: (Note 3e) | | | | | | | | | | | | | | | | |
Class A | | | 3,145,733 | | | | 1,277,790 | | | | 2,096,341 | | | | 268,954 | |
Class C | | | 722,153 | | | | 448,630 | | | | 321,981 | | | | 59,528 | |
Class R | | | 5,330 | | | | — | | | | 8,244 | | | | — | |
Class R6 | | | 38,201 | | | | 24,227 | | | | 29,803 | | | | 10,072 | |
Advisor Class | | | 150,173 | | | | 2,340,456 | | | | 119,252 | | | | 47,253 | |
Custodian fees (Note 4) | | | 39,906 | | | | 22,182 | | | | 23,709 | | | | 5,607 | |
Reports to shareholders | | | 282,185 | | | | 211,875 | | | | 185,512 | | | | 43,533 | |
Registration and filing fees | | | 181,259 | | | | 242,049 | | | | 116,719 | | | | 70,591 | |
Professional fees | | | 99,412 | | | | 79,784 | | | | 70,624 | | | | 50,229 | |
Trustees’ fees and expenses | | | 41,982 | | | | 33,114 | | | | 26,222 | | | | 2,571 | |
Other | | | 72,000 | | | | 47,207 | | | | 45,841 | | | | 15,641 | |
| | | | |
| | | | |
Total expenses | | | 39,257,876 | | | | 25,082,625 | | | | 20,323,673 | | | | 2,393,627 | |
Expense reductions (Note 4) | | | (15,636 | ) | | | (3,504 | ) | | | (1,641 | ) | | | (693 | ) |
Expenses waived/paid by affiliates (Note 3f and 3g) | | | (302,496 | ) | | | (569,951 | ) | | | (197,721 | ) | | | (540,192 | ) |
| | | | |
| | | | |
Net expenses | | | 38,939,744 | | | | 24,509,170 | | | | 20,124,311 | | | | 1,852,742 | |
| | | | |
| | | | |
Net investment income | | | 73,691,923 | | | | 25,909,414 | | | | 35,094,167 | | | | 3,896,092 | |
| | | | |
| | | | |
Realized and unrealized gains (losses): | | | | | | | | | | | | | | | | |
Net realized gain (loss) from: | | | | | | | | | | | | | | | | |
Investments:# | | | | | | | | | | | | | | | | |
Unaffiliated issuers | | | 30,633,552 | | | | 245,578,005 | | | | 106,734,084 | | | | 4,153,170 | |
Controlled affiliates (Note 3f) | | | (642,330 | ) | | | — | | | | — | | | | — | |
Non-controlled affiliates (Note 3f) | | | — | | | | — | | | | — | | | | 36,927 | |
Written options | | | 8,548,278 | | | | — | | | | — | | | | — | |
Foreign currency transactions | | | 226,820 | | | | — | | | | 177,740 | | | | 38,980 | |
Capital gain distributions from management investment companies: | | | | | | | | | | | | | | | | |
Non-controlled affiliates (Note 3f) | | | — | | | | — | | | | — | | | | 85,233 | |
| | | | |
| | | | |
Net realized gain (loss) | | | 38,766,320 | | | | 245,578,005 | | | | 106,911,824 | | | | 4,314,310 | |
| | | | |
| | | | |
| | | |
| 68 | | Annual Report | The accompanying notes are an integral part of these financial statements. | | franklintempleton.com |
FRANKLIN INVESTORS SECURITIES TRUST
FINANCIAL STATEMENTS
Statements of Operations (continued)
for the year ended October 31, 2018
| | | | | | | | | | | | | | | | |
| | | Franklin
Balanced Fund | | | Franklin
Convertible
Securities Fund | | | Franklin Equity
Income Fund | | | Franklin Real
Return Fund | |
| |
Net change in unrealized appreciation (depreciation) on: | | | | | | | | | | | | | | | | |
Investments: | | | | | | | | | | | | | | | | |
Unaffiliated issuers | | $ | (81,114,494 | ) | | $ | (102,999,826 | ) | | $ | (57,111,745 | ) | | $ | (8,990,664 | ) |
Controlled affiliates (Note 3f) | | | (4,241,125 | ) | | | — | | | | — | | | | — | |
Non-controlled affiliates (Note 3f) | | | — | | | | — | | | | — | | | | (331,602 | ) |
Translation of other assets and liabilities denominated in foreign currencies | | | (43,156 | ) | | | — | | | | (21,957 | ) | | | 14,792 | |
Written options | | | 2,017,129 | | | | — | | | | — | | | | — | |
Change in deferred taxes on unrealized appreciation | | | — | | | | — | | | | — | | | | 20,403 | |
| | | | |
| | | | |
Net change in unrealized appreciation (depreciation) | | | (83,381,646 | ) | | | (102,999,826 | ) | | | (57,133,702 | ) | | | (9,287,071 | ) |
| | | | |
| | | | |
Net realized and unrealized gain (loss) | | | (44,615,326 | ) | | | 142,578,179 | | | | 49,778,122 | | | | (4,972,761 | ) |
| | | | |
| | | | |
Net increase (decrease) in net assets resulting from operations | | $ | 29,076,597 | | | $ | 168,487,593 | | | $ | 84,872,289 | | | $ | (1,076,669 | ) |
| | | | |
| | | | |
*Foreign taxes withheld on dividends | | $ | 1,619,504 | | | $ | 111,562 | | | $ | 786,387 | | | $ | 22,101 | |
~Foreign taxes withheld on interest | | $ | — | | | $ | — | | | $ | — | | | $ | 8,723 | |
#Net of foreign taxes | | $ | — | | | $ | — | | | $ | — | | | $ | 27,801 | |
| | | | |
| | | |
| franklintempleton.com | | The accompanying notes are an integral part of these financial statements. | Annual Report | | 69 |
FRANKLIN INVESTORS SECURITIES TRUST
FINANCIAL STATEMENTS
Statements of Changes in Net Assets
| | | | | | | | | | | | | | | | |
| | | Franklin Balanced Fund | | | Franklin Convertible Securities Fund | |
| | | | |
| | | Year Ended October 31, | | | Year Ended October 31, | |
| | | | |
| | | 2018 | | | 2017 | | | 2018 | | | 2017 | |
| |
Increase (decrease) in net assets: | | | | | | | | | | | | | | | | |
Operations: | | | | | | | | | | | | | | | | |
Net investment income | | $ | 73,691,923 | | | $ | 90,261,237 | | | $ | 25,909,414 | | | $ | 34,041,219 | |
Net realized gain (loss) | | | 38,766,320 | | | | 85,304,619 | | | | 245,578,005 | | | | 164,567,291 | |
Net change in unrealized appreciation (depreciation) | | | (83,381,646 | ) | | | 176,686,329 | | | | (102,999,826 | ) | | | 204,363,980 | |
| | | | |
| | | | |
Net increase (decrease) in net assets resulting from operations | | | 29,076,597 | | | | 352,252,185 | | | | 168,487,593 | | | | 402,972,490 | |
| | | | |
| | | | |
Distributions to shareholders: (Note 1i) | | | | | | | | | | | | | | | | |
Class A | | | (124,779,231 | ) | | | (114,824,322 | ) | | | (63,608,374 | ) | | | (32,458,251 | ) |
Class C | | | (24,853,963 | ) | | | (24,122,796 | ) | | | (21,106,601 | ) | | | (10,539,641 | ) |
Class R | | | (205,981 | ) | | | (199,225 | ) | | | — | | | | — | |
Class R6 | | | (6,906,404 | ) | | | (27,445 | ) | | | (2,162,200 | ) | | | (453,041 | ) |
Advisor Class | | | (6,100,753 | ) | | | (8,497,233 | ) | | | (124,290,867 | ) | | | (54,513,835 | ) |
| | | | |
| | | | |
Total distributions to shareholders | | | (162,846,332 | ) | | | (147,671,021 | ) | | | (211,168,042 | ) | | | (97,964,768 | ) |
| | | | |
| | | | |
Capital share transactions: (Note 2) | | | | | | | | | | | | | | | | |
Class A | | | 40,700,401 | | | | (40,657,348 | ) | | | 344,731,206 | | | | (49,842,077 | ) |
Class C | | | (116,913,479 | ) | | | (35,085,152 | ) | | | (1,890,826 | ) | | | (27,199,180 | ) |
Class R | | | (1,229,264 | ) | | | (4,205 | ) | | | — | | | | — | |
Class R6 | | | 144,466,333 | | | | 54,098 | | | | 35,475,394 | | | | 14,196,058 | |
Advisor Class | | | (115,174,213 | ) | | | 94,203,381 | | | | 681,304,202 | | | | 292,684,054 | |
| | | | |
| | | | |
Total capital share transactions | | | (48,150,222 | ) | | | 18,510,774 | | | | 1,059,619,976 | | | | 229,838,855 | |
| | | | |
| | | | |
Net increase (decrease) in net assets | | | (181,919,957 | ) | | | 223,091,938 | | | | 1,016,939,527 | | | | 534,846,577 | |
Net assets: | | | | | | | | | | | | | | | | |
Beginning of year | | | 3,528,486,856 | | | | 3,305,394,918 | | | | 2,683,937,968 | | | | 2,149,091,391 | |
| | | | |
| | | | |
End of year (Note 1i) | | $ | 3,346,566,899 | | | $ | 3,528,486,856 | | | $ | 3,700,877,495 | | | $ | 2,683,937,968 | |
| | | | |
| | | | |
| | | |
| 70 | | Annual Report | The accompanying notes are an integral part of these financial statements. | | franklintempleton.com |
FRANKLIN INVESTORS SECURITIES TRUST
FINANCIAL STATEMENTS
Statements of Changes in Net Assets (continued)
| | | | | | | | | | | | | | | | |
| | | Franklin Equity Income Fund | | | Franklin Real Return Fund | |
| | | | |
| | | Year Ended October 31, | | | Year Ended October 31, | |
| | | | |
| | | 2018 | | | 2017 | | | 2018 | | | 2017 | |
| |
Increase (decrease) in net assets: | | | | | | | | | | | | | | | | |
Operations: | | | | | | | | | | | | | | | | |
Net investment income | | $ | 35,094,167 | | | $ | 41,589,804 | | | $ | 3,896,092 | | | $ | 4,047,623 | |
Net realized gain (loss) | | | 106,911,824 | | | | 69,697,927 | | | | 4,314,310 | | | | (1,617,385 | ) |
Net change in unrealized appreciation (depreciation) | | | (57,133,702 | ) | | | 251,171,481 | | | | (9,287,071 | ) | | | 1,674,655 | |
| | | | |
| | | | |
Net increase (decrease) in net assets resulting from operations | | | 84,872,289 | | | | 362,459,212 | | | | (1,076,669 | ) | | | 4,104,893 | |
| | | | |
| | | | |
Distributions to shareholders: (Note 1i) | | | | | | | | | | | | | | | | |
Class A | | | (82,499,588 | ) | | | (108,557,974 | ) | | | (4,501,773 | ) | | | (1,941,335 | ) |
Class C | | | (10,790,019 | ) | | | (14,798,032 | ) | | | (905,045 | ) | | | (353,587 | ) |
Class R | | | (315,650 | ) | | | (428,927 | ) | | | — | | | | — | |
Class R6 | | | (3,914,155 | ) | | | (729,191 | ) | | | (372,274 | ) | | | (94,114 | ) |
Advisor Class | | | (4,738,259 | ) | | | (6,480,300 | ) | | | (829,402 | ) | | | (611,165 | ) |
| | | | |
| | | | |
Total distributions to shareholders | | | (102,257,671 | ) | | | (130,994,424 | ) | | | (6,608,494 | ) | | | (3,000,201 | ) |
| | | | |
| | | | |
Capital share transactions: (Note 2) | | | | | | | | | | | | | | | | |
Class A | | | 13,100,601 | | | | (135,418,963 | ) | | | (8,760,975 | ) | | | (15,477,267 | ) |
Class C | | | (61,548,993 | ) | | | (18,455,576 | ) | | | (8,013,165 | ) | | | (5,864,126 | ) |
Class R | | | (272,949 | ) | | | (80,399 | ) | | | — | | | | — | |
Class R6 | | | 69,294,512 | | | | 936,862 | | | | 9,265,304 | | | | 374,554 | |
Advisor Class | | | (37,318,550 | ) | | | 54,400,800 | | | | (19,684,992 | ) | | | 4,725,881 | |
| | | | |
| | | | |
Total capital share transactions | | | (16,745,379 | ) | | | (98,617,276 | ) | | | (27,193,828 | ) | | | (16,240,958 | ) |
| | | | |
| | | | |
Net increase (decrease) in net assets | | | (34,130,761 | ) | | | 132,847,512 | | | | (34,878,991 | ) | | | (15,136,266 | ) |
Net assets: | | | | | | | | | | | | | | | | |
Beginning of year | | | 2,188,068,673 | | | | 2,055,221,161 | | | | 226,514,073 | | | | 241,650,339 | |
| | | | |
| | | | |
End of year (Note 1i) | | $ | 2,153,937,912 | | | $ | 2,188,068,673 | | | $ | 191,635,082 | | | $ | 226,514,073 | |
| | | | |
| | | | |
| | | |
| franklintempleton.com | | The accompanying notes are an integral part of these financial statements. | Annual Report | | 71 |
FRANKLIN INVESTORS SECURITIES TRUST
Notes to Financial Statements
1. Organization and Significant Accounting Policies
Franklin Investors Securities Trust (Trust) is registered under the Investment Company Act of 1940 (1940 Act) as an open-end management investment company, consisting of eight separate funds, four of which are included in this report (Funds) and applies the specialized accounting and reporting guidance in U.S. Generally Accepted Accounting Principles (U.S. GAAP). The classes of shares offered within each of the Funds are indicated below. Beginning on October 19, 2018, Class C shares automatically convert to Class A shares after they have been held for 10 years. Each class of shares may differ by its initial sales load, contingent deferred sales charges, voting rights on matters affecting a single class, its exchange privilege and fees due to differing arrangements for distribution and transfer agent fees. Franklin Convertible Securities Fund was closed to new investors with limited exceptions effective at the close of market on August 29, 2018.
|
| Class A, Class C, Class R, Class R6 & Advisor Class |
Franklin Balanced Fund |
Franklin Equity Income Fund |
|
| Class A, Class C, Class R6 & Advisor Class |
Franklin Convertible Securities Fund |
Franklin Real Return Fund |
The following summarizes the Funds’ significant accounting policies.
a. Financial Instrument Valuation
The Funds’ investments in financial instruments are carried at fair value daily. Fair value is the price that would be received to sell an asset or paid to transfer a liability in an orderly transaction between market participants on the measurement date. The Funds calculate the net asset value (NAV) per share each business day as of 4 p.m. Eastern time or the regularly scheduled close of the New York Stock Exchange (NYSE), whichever is earlier. Under compliance policies and procedures approved by the Trust’s Board of Trustees (the Board), the Funds’ administrator has responsibility for oversight of valuation, including leading the cross-functional Valuation Committee (VC). The VC provides administration and oversight of the Funds’ valuation policies and procedures, which are approved annually by the Board. Among other things, these procedures allow the Funds to utilize independent pricing services, quotations from securities and financial instrument dealers, and other market sources to determine fair value.
Equity securities, exchange traded funds, and derivative financial instruments listed on an exchange or on the NASDAQ National Market System are valued at the last quoted sale price or the official closing price of the day, respectively. Foreign equity securities are valued as of the close of trading on the foreign stock exchange on which the security is primarily traded, or as of 4 p.m. Eastern time. The value is then converted into its U.S. dollar equivalent at the foreign exchange rate in effect at 4 p.m. Eastern time on the day that the value of the security is determined. Over-the-counter (OTC) securities are valued within the range of the most recent quoted bid and ask prices. Securities that trade in multiple markets or on multiple exchanges are valued according to the broadest and most representative market. Certain equity securities are valued based upon fundamental characteristics or relationships to similar securities.
Debt and certain preferred securities generally trade in the OTC market rather than on a securities exchange. The Funds’ pricing services use multiple valuation techniques to determine fair value. In instances where sufficient market activity exists, the pricing services may utilize a market-based approach through which quotes from market makers are used to determine fair value. In instances where sufficient market activity may not exist or is limited, the pricing services also utilize proprietary valuation models which may consider market characteristics such as benchmark yield curves, credit spreads, estimated default rates, anticipated market interest rate volatility, coupon rates, anticipated timing of principal repayments, underlying collateral, and other unique security features in order to estimate the relevant cash flows, which are then discounted to calculate the fair value.
Investments in open-end mutual funds are valued at the closing NAV. Investments in repurchase agreements are valued at cost, which approximates fair value.
Certain derivative financial instruments trade in the OTC market. The Funds’ pricing services use various techniques including industry standard option pricing models and proprietary discounted cash flow models to determine the fair value of those instruments. The Funds’ net benefit or obligation under the derivative contract, as measured by the fair value of the contract, is included in net assets.
The Funds have procedures to determine the fair value of financial instruments for which market prices are not reliable or readily available. Under these procedures, the VC convenes on
| | | | |
| | | |
| 72 | | Annual Report | | franklintempleton.com |
FRANKLIN INVESTORS SECURITIES TRUST
NOTES TO FINANCIAL STATEMENTS
a regular basis to review such financial instruments and considers a number of factors, including significant unobservable valuation inputs, when arriving at fair value. The VC primarily employs a market-based approach which may use related or comparable assets or liabilities, recent transactions, market multiples, book values, and other relevant information for the investment to determine the fair value of the investment. An income-based valuation approach may also be used in which the anticipated future cash flows of the investment are discounted to calculate fair value. Discounts may also be applied due to the nature or duration of any restrictions on the disposition of the investments. Due to the inherent uncertainty of valuations of such investments, the fair values may differ significantly from the values that would have been used had an active market existed. The VC employs various methods for calibrating these valuation approaches including a regular review of key inputs and assumptions, transactional back-testing or disposition analysis, and reviews of any related market activity.
Trading in securities on foreign securities stock exchanges and OTC markets may be completed before 4 p.m. Eastern time. In addition, trading in certain foreign markets may not take place on every Funds’ business day. Occasionally, events occur between the time at which trading in a foreign security is completed and 4 p.m. Eastern time that might call into question the reliability of the value of a portfolio security held by the Fund. As a result, differences may arise between the value of the Funds’ portfolio securities as determined at the foreign market close and the latest indications of value at 4 p.m. Eastern time. In order to minimize the potential for these differences, the VC monitors price movements following the close of trading in foreign stock markets through a series of country specific market proxies (such as baskets of American Depositary Receipts, futures contracts and exchange traded funds). These price movements are measured against established trigger thresholds for each specific market proxy to assist in determining if an event has occurred that may call into question the reliability of the values of the foreign securities held by the Funds. If such an event occurs, the securities may be valued using fair value procedures, which may include the use of independent pricing services.
When the last day of the reporting period is a non-business day, certain foreign markets may be open on those days that the Funds’ NAV is not calculated, which could result in differences between the value of the Funds’ portfolio securities on the last
business day and the last calendar day of the reporting period. Any significant security valuation changes due to an open foreign market are adjusted and reflected by the Funds for financial reporting purposes.
b. Foreign Currency Translation
Portfolio securities and other assets and liabilities denominated in foreign currencies are translated into U.S. dollars based on the exchange rate of such currencies against U.S. dollars on the date of valuation. The Funds may enter into foreign currency exchange contracts to facilitate transactions denominated in a foreign currency. Purchases and sales of securities, income and expense items denominated in foreign currencies are translated into U.S. dollars at the exchange rate in effect on the transaction date. Portfolio securities and assets and liabilities denominated in foreign currencies contain risks that those currencies will decline in value relative to the U.S. dollar. Occasionally, events may impact the availability or reliability of foreign exchange rates used to convert the U.S. dollar equivalent value. If such an event occurs, the foreign exchange rate will be valued at fair value using procedures established and approved by the Board.
The Funds do not separately report the effect of changes in foreign exchange rates from changes in market prices on securities held. Such changes are included in net realized and unrealized gain or loss from investments in the Statements of Operations.
Realized foreign exchange gains or losses arise from sales of foreign currencies, currency gains or losses realized between the trade and settlement dates on securities transactions and the difference between the recorded amounts of dividends, interest, and foreign withholding taxes and the U.S. dollar equivalent of the amounts actually received or paid. Net unrealized foreign exchange gains and losses arise from changes in foreign exchange rates on foreign denominated assets and liabilities other than investments in securities held at the end of the reporting period.
c. Joint Repurchase Agreement
Certain or all Funds enter into a joint repurchase agreement whereby their uninvested cash balance is deposited into a joint cash account with other funds managed by the investment manager or an affiliate of the investment manager and is used to invest in one or more repurchase agreements. The value and face amount of the joint repurchase agreement are allocated to the funds based on their pro-rata interest. A repurchase
| | | | |
| | | |
| franklintempleton.com | | Annual Report | | 73 |
FRANKLIN INVESTORS SECURITIES TRUST
NOTES TO FINANCIAL STATEMENTS
1. Organization and Significant Accounting
Policies (continued)
c. Joint Repurchase Agreement (continued)
agreement is accounted for as a loan by the Fund to the seller, collateralized by securities which are delivered to the Funds’ custodian. The fair value, including accrued interest, of the initial collateralization is required to be at least 102% of the dollar amount invested by the funds, with the value of the underlying securities marked to market daily to maintain coverage of at least 100%. Repurchase agreements are subject to the terms of Master Repurchase Agreements (MRAs) with approved counterparties (sellers). The MRAs contain various provisions, including but not limited to events of default and maintenance of collateral for repurchase agreements. In the event of default by either the seller or the Funds, certain MRAs may permit the non-defaulting party to net and close-out all transactions, if any, traded under such agreements. The Funds may sell securities it holds as collateral and apply the proceeds towards the repurchase price and any other amounts owed by the seller to the Funds in the event of default by the seller. This could involve costs or delays in addition to a loss on the securities if their value falls below the repurchase price owed by the seller. The joint repurchase agreement held by the Funds at year end, as indicated in the Statements of Investments, had been entered into on October 31, 2018.
d. Derivative Financial Instruments
Certain or all Funds invested in derivative financial instruments in order to manage risk or gain exposure to various other investments or markets. Derivatives are financial contracts based on an underlying or notional amount, require no initial investment or an initial net investment that is smaller than would normally be required to have a similar response to changes in market factors, and require or permit net settlement. Derivatives contain various risks including the potential inability of the counterparty to fulfill their obligations under the terms of the contract, the potential for an illiquid secondary market, and/or the potential for market movements which expose the Fund to gains or losses in excess of the amounts shown in the Statements of Assets and Liabilities. Realized gain and loss and unrealized appreciation and depreciation on these contracts for the period are included in the Statements of Operations.
Collateral requirements differ by type of derivative. Collateral or initial margin requirements are set by the broker or exchange clearing house for exchange traded and centrally cleared derivatives. Initial margin deposited is held at the exchange and can be in the form of cash and/or securities.
Certain or all Funds purchased or wrote exchange traded option contracts primarily to manage and/or gain exposure to equity price risk. An option is a contract entitling the holder to purchase or sell a specific amount of shares or units of an asset or notional amount of a swap (swaption), at a specified price. When an option is purchased or written, an amount equal to the premium paid or received is recorded as an asset or liability, respectively. Upon exercise of an option, the acquisition cost or sales proceeds of the underlying investment is adjusted by any premium received or paid. Upon expiration of an option, any premium received or paid is recorded as a realized gain or loss. Upon closing an option other than through expiration or exercise, the difference between the premium received or paid and the cost to close the position is recorded as a realized gain or loss.
See Note 8 regarding other derivative information.
e. Index-Linked Notes
Certain or all Funds invest in index-linked notes. Index-linked notes are senior, unsecured, subordinated debt securities issued by a financial institution, and the value is based on the price movements of the underlying index. Index-linked notes are designed to provide investors access to the returns of various market benchmarks and intended to replicate the economic effects that would apply had the Fund directly purchased the underlying referenced asset or basket of assets. The risks of investing in index-linked notes include unfavorable price movements in the underlying index and the credit risk of the issuing financial institution. There may be no guarantee of a return of principal with index-linked notes and the appreciation potential may be limited. Index-linked notes may be more volatile and less liquid than other investments held by the Funds.
f. Equity-Linked Securities
Certain or all Funds invest in equity-linked securities. Equity-linked securities are hybrid financial instruments that generally combine both debt and equity characteristics into a single note form. Income received from equity-linked securities is recorded as realized gains in the Statements of Operations
| | | | |
| | | |
| 74 | | Annual Report | | franklintempleton.com |
FRANKLIN INVESTORS SECURITIES TRUST
NOTES TO FINANCIAL STATEMENTS
and may be based on the performance of an underlying equity security, an equity index, or an option position. The risks of investing in equity-linked securities include unfavorable price movements in the underlying security and the credit risk of the issuing financial institution. There may be no guarantee of a return of principal with equity-linked securities and the appreciation potential may be limited. Equity-linked securities may be more volatile and less liquid than other investments held by the Funds.
g. Securities Lending
Certain or all Funds participate in an agency based securities lending program to earn additional income. The Fund receives cash collateral against the loaned securities in an amount equal to at least 102% of the fair value of the loaned securities. Collateral is maintained over the life of the loan in an amount not less than 100% of the fair value of loaned securities, as determined at the close of Fund business each day; any additional collateral required due to changes in security values is delivered to the Fund on the next business day. The collateral is deposited into a joint cash account with other funds and is used to invest in a money market fund managed by Franklin Advisers, Inc., an affiliate of the Funds, and/or a joint repurchase agreement. The Fund may receive income from the investment of cash collateral, in addition to lending fees and rebates paid by the borrower. Income from securities loaned, net of fees paid to the securities lending agent and/or third-party vendor, is reported separately in the Statements of Operations. The Fund bears the market risk with respect to the collateral investment, securities loaned, and the risk that the agent may default on its obligations to the Fund. If the borrower defaults on its obligation to return the securities loaned, the Fund has the right to repurchase the securities in the open market using the collateral received. The securities lending agent has agreed to indemnify the Fund in the event of default by a third party borrower. At October 31, 2018, Franklin Balanced Fund had no securities on loan.
h. Income and Deferred Taxes
It is each Fund’s policy to qualify as a regulated investment company under the Internal Revenue Code. Each Fund intends to distribute to shareholders substantially all of its taxable income and net realized gains to relieve it from federal income and excise taxes. As a result, no provision for U.S. federal income taxes is required.
The Funds may be subject to foreign taxation related to income received, capital gains on the sale of securities and certain foreign currency transactions in the foreign jurisdictions in which the Funds invest. Foreign taxes, if any, are recorded based on the tax regulations and rates that exist in the foreign markets in which the Funds invest. When a capital gain tax is determined to apply, certain or all Funds record an estimated deferred tax liability in an amount that would be payable if the securities were disposed of on the valuation date.
As a result of several court cases, in certain countries across the European Union, certain or all Funds filed additional tax reclaims for previously withheld taxes on dividends earned in those countries (EU reclaims). These additional filings are subject to various administrative proceedings by the local jurisdictions’ tax authorities within the European Union, as well as a number of related judicial proceedings. Income recognized, if any, for EU reclaims is reflected as other income in the Statements of Operations and any related receivable, if any, is reflected as European Union tax reclaims in the Statements of Assets and Liabilities. When uncertainty exists as to the ultimate resolution of these proceedings, the likelihood of receipt of these EU reclaims, and the potential timing of payment, no amounts are reflected in the financial statements. For U.S. income tax purposes, EU reclaims received by the Funds, if any, reduce the amounts of foreign taxes Fund shareholders can use as tax credits in their individual income tax returns.
Each Fund may recognize an income tax liability related to its uncertain tax positions under U.S. GAAP when the uncertain tax position has a less than 50% probability that it will be sustained upon examination by the tax authorities based on its technical merits. As of October 31, 2018, each Fund has determined that no tax liability is required in its financial statements related to uncertain tax positions for any open tax years (or expected to be taken in future tax years). Open tax years are those that remain subject to examination and are based on the statute of limitations in each jurisdiction in which the Fund invests.
i. Security Transactions, Investment Income, Expenses and Distributions
Security transactions are accounted for on trade date. Realized gains and losses on security transactions are determined on a specific identification basis. Interest income and estimated expenses are accrued daily. Amortization of premium and
| | | | |
| | | |
| franklintempleton.com | | Annual Report | | 75 |
FRANKLIN INVESTORS SECURITIES TRUST
NOTES TO FINANCIAL STATEMENTS
1. Organization and Significant Accounting
Policies (continued)
i. Security Transactions, Investment Income, Expenses and Distributions (continued)
accretion of discount on debt securities are included in interest income. Facility fees are recognized as income over the expected term of the loan. Dividend income and capital gain distributions by Underlying Funds are recorded on the ex-dividend date except for certain dividends from securities where the dividend rate is not available. In such cases, the dividend is recorded as soon as the information is received by the Funds. Distributions to shareholders are recorded on the ex-dividend date. Distributable earnings are determined according to income tax regulations (tax basis) and may differ from earnings recorded in accordance with U.S. GAAP. These differences may be permanent or temporary. Permanent differences are reclassified among capital accounts to reflect their tax character. These reclassifications have no impact on net assets or the results of operations. Temporary differences are not reclassified, as they may reverse in subsequent periods.*
Common expenses incurred by the Trust are allocated among the Funds based on the ratio of net assets of each Fund to the combined net assets of the Trust or based on the ratio of number of shareholders of each Fund to the combined number of shareholders of the Trust. Fund specific expenses are charged directly to the Fund that incurred the expense.
Realized and unrealized gains and losses and net investment income, excluding class specific expenses, are allocated daily to each class of shares based upon the relative proportion of net assets of each class. Differences in per share distributions by class are generally due to differences in class specific expenses.
Inflation-indexed bonds are adjusted for inflation through periodic increases or decreases in the security’s interest accruals, face amount, or principal redemption value, by amounts corresponding to the rate of inflation as measured by an index. Any increase or decrease in the face amount or principal redemption value will be included as inflation principal adjustments in the Statements of Operations.
j. Accounting Estimates
The preparation of financial statements in accordance with U.S. GAAP requires management to make estimates and assumptions that affect the reported amounts of assets and liabilities at the date of the financial statements and the amounts of income and expenses during the reporting period. Actual results could differ from those estimates.
k. Guarantees and Indemnifications
Under the Trust’s organizational documents, its officers and trustees are indemnified by the Trust against certain liabilities arising out of the performance of their duties to the Trust. Additionally, in the normal course of business, the Trust, on behalf of the Funds, enters into contracts with service providers that contain general indemnification clauses. The Trust’s maximum exposure under these arrangements is unknown as this would involve future claims that may be made against the Trust that have not yet occurred. Currently, the Trust expects the risk of loss to be remote.
| | | | |
| | | |
| 76 | | Annual Report | | franklintempleton.com |
FRANKLIN INVESTORS SECURITIES TRUST
NOTES TO FINANCIAL STATEMENTS
*Effective during the current reporting period, it is no longer required to present certain line items on the Statements of Changes in Net Assets. Such disclosure changes are included in the Statements of Changes in Net Assets, therefore prior period amounts are presented below.
For the year ended October 31, 2017, distributions to shareholders were as follows:
| | | | | | | | | | | | | | | | |
| | | Franklin
Balanced Fund | | | Franklin
Convertible
Securities Fund | | | Franklin Equity Income Fund | | | Franklin Real Return Fund | |
Distributions from net investment income: | | | | | | | | | | | | | | | | |
Class A | | | $(78,196,064 | ) | | | $(18,543,170 | ) | | | $(42,489,638 | ) | | | $(1,941,335 | ) |
Class C | | | (14,807,257 | ) | | | (5,076,900 | ) | | | (4,618,552 | ) | | | (353,587 | ) |
Class R | | | (133,912 | ) | | | — | | | | (158,369 | ) | | | — | |
Class R6 | | | (24,051 | ) | | | (292,682 | ) | | | (321,585 | ) | | | (94,114 | ) |
Advisor Class | | | (6,366,506 | ) | | | (34,146,214 | ) | | | (3,122,071 | ) | | | (611,165 | ) |
Distributions from net realized gains: | | | | | | | | | | | | | | | | |
Class A | | | (36,628,258 | ) | | | (13,915,081 | ) | | | (66,068,336 | ) | | | — | |
Class C | | | (9,315,539 | ) | | | (5,462,741 | ) | | | (10,179,480 | ) | | | — | |
Class R | | | (65,313 | ) | | | — | | | | (270,558 | ) | | | — | |
Class R6 | | | (3,394 | ) | | | (160,359 | ) | | | (407,606 | ) | | | — | |
Advisor Class | | | (2,130,727 | ) | | | (20,367,621 | ) | | | (3,358,229 | ) | | | — | |
For the year ended October 31, 2017, undistributed net investment income/distributions in excess of net investment income included in net assets were as follows:
| | | | | | | | | | |
| Fund | | Undistributed net
investment income | | | Distribution in excess of net investment
income | | | |
Franklin Balanced Fund | | | $6,028,150 | | | | $ — | | | |
Franklin Convertible Securities Fund | | | $ — | | | | $(26,290,348 | ) | | |
Franklin Equity Income Fund | | | $3,531,137 | | | | $ — | | | |
Franklin Real Return Fund | | | $ — | | | | $ (2,022,005 | ) | | |
2. Shares of Beneficial Interest
At October 31, 2018, there were an unlimited number of shares authorized (without par value). Transactions in the Funds’ shares were as follows:
| | | | | | | | | | | | | | | | |
| | | Franklin Balanced Fund | | | Franklin Convertible Securities Fund | |
| | | Shares | | | Amount | | | Shares | | | Amount | |
Class A Shares: | | | | | | | | | | | | | | | | |
Year ended October 31, 2018 | | | | | | | | | | | | | | | | |
Shares solda | | | 31,254,193 | | | $ | 380,495,174 | | | | 28,565,417 | | | $ | 600,371,738 | |
Shares issued in reinvestment of distributions | | | 9,972,235 | | | | 121,740,304 | | | | 3,028,430 | | | | 60,507,562 | |
Shares redeemed | | | (37,826,274 | ) | | | (461,535,077 | ) | | | (15,150,859 | ) | | | (316,148,094 | ) |
| | | | |
Net increase (decrease) | | | 3,400,154 | | | $ | 40,700,401 | | | | 16,442,988 | | | $ | 344,731,206 | |
| | | | |
Year ended October 31, 2017 | | | | | | | | | | | | | | | | |
Shares sold | | | 41,122,848 | | | $ | 493,473,430 | | | | 10,813,117 | | | $ | 208,458,475 | |
Shares issued in reinvestment of distributions | | | 9,374,533 | | | | 112,108,534 | | | | 1,667,207 | | | | 30,768,242 | |
Shares redeemed | | | (53,839,472 | ) | | | (646,239,312 | ) | | | (15,184,687 | ) | | | (289,068,794 | ) |
| | | | |
Net increase (decrease) | | | (3,342,091 | ) | | $ | (40,657,348 | ) | | | (2,704,363 | ) | | $ | (49,842,077 | ) |
| | | | |
| | | |
| franklintempleton.com | | Annual Report | | 77 |
FRANKLIN INVESTORS SECURITIES TRUST
NOTES TO FINANCIAL STATEMENTS
2. Shares of Beneficial Interest (continued)
| | | | | | | | | | | | | | | | |
| | | Franklin Balanced Fund | | | Franklin Convertible Securities Fund | |
| | | Shares | | | Amount | | | Shares | | | Amount | |
Class C Shares: | | | | | | | | | | | | | | | | |
Year ended October 31, 2018 | | | | | | | | | | | | | | | | |
Shares sold | | | 5,331,825 | | | $ | 64,522,420 | | | | 5,832,864 | | | $ | 120,961,542 | |
Shares issued in reinvestment of distributions | | | 1,966,557 | | | | 23,818,011 | | | | 963,682 | | | | 18,860,854 | |
Shares redeemeda | | | (17,061,942 | ) | | | (205,253,910 | ) | | | (6,928,441 | ) | | | (141,713,222 | ) |
| | | | |
Net increase (decrease) | | | (9,763,560 | ) | | $ | (116,913,479 | ) | | | (131,895 | ) | | $ | (1,890,826 | ) |
| | | | |
Year ended October 31, 2017 | | | | | | | | | | | | | | | | |
Shares sold | | | 9,430,439 | | | $ | 111,985,968 | | | | 2,390,323 | | | $ | 45,128,905 | |
Shares issued in reinvestment of distributions | | | 1,901,983 | | | | 22,527,563 | | | | 481,988 | | | | 8,729,846 | |
Shares redeemed | | | (14,220,032 | ) | | | (169,598,683 | ) | | | (4,287,078 | ) | | | (81,057,931 | ) |
| | | | |
Net increase (decrease) | | | (2,887,610 | ) | | $ | (35,085,152 | ) | | | (1,414,767 | ) | | $ | (27,199,180 | ) |
| | | | |
Class R Shares: | | | | | | | | | | | | | | | | |
Year ended October 31, 2018 | | | | | | | | | | | | | | | | |
Shares sold | | | 52,561 | | | $ | 644,571 | | | | | | | | | |
Shares issued in reinvestment of distributions | | | 16,814 | | | | 205,981 | | | | | | | | | |
Shares redeemed | | | (170,975 | ) | | | (2,079,816 | ) | | | | | | | | |
| | | | |
Net increase (decrease) | | | (101,600 | ) | | $ | (1,229,264 | ) | | | | | | | | |
| | | | |
Year ended October 31, 2017 | | | | | | | | | | | | | | | | |
Shares sold | | | 96,705 | | | $ | 1,160,206 | | | | | | | | | |
Shares issued in reinvestment of distributions | | | 16,618 | | | | 199,225 | | | | | | | | | |
Shares redeemed | | | (112,933 | ) | | | (1,363,636 | ) | | | | | | | | |
| | | | |
Net increase (decrease) | | | 390 | | | $ | (4,205 | ) | | | | | | | | |
| | | | |
Class R6 Shares: | | | | | | | | | | | | | | | | |
Year ended October 31, 2018 | | | | | | | | | | | | | | | | |
Shares sold | | | 14,240,369 | | | $ | 176,497,963 | | | | 2,814,780 | | | $ | 59,072,073 | |
Shares issued in reinvestment of distributions | | | 564,301 | | | | 6,905,816 | | | | 106,403 | | | | 2,160,058 | |
Shares redeemed | | | (3,182,549 | ) | | | (38,937,446 | ) | | | (1,242,069 | ) | | | (25,756,737 | ) |
| | | | |
Net increase (decrease) | | | 11,622,121 | | | $ | 144,466,333 | | | | 1,679,114 | | | $ | 35,475,394 | |
| | | | |
Year ended October 31, 2017 | | | | | | | | | | | | | | | | |
Shares sold | | | 101,768 | | | $ | 1,216,479 | | | | 825,661 | | | $ | 16,405,823 | |
Shares issued in reinvestment of distributions | | | 2,272 | | | | 27,446 | | | | 24,212 | | | | 452,646 | |
Shares redeemed | | | (96,433 | ) | | | (1,189,827 | ) | | | (136,289 | ) | | | (2,662,411 | ) |
| | | | |
Net increase (decrease) | | | 7,607 | | | $ | 54,098 | | | | 713,584 | | | $ | 14,196,058 | |
| | | | |
| | | |
| 78 | | Annual Report | | franklintempleton.com |
FRANKLIN INVESTORS SECURITIES TRUST
NOTES TO FINANCIAL STATEMENTS
| | | | | | | | | | | | | | | | |
| | | Franklin
Balanced Fund | | | Franklin
Convertible Securities Fund | |
| | | Shares | | | Amount | | | Shares | | | Amount | |
Advisor Class Shares: | | | | | | | | | | | | | | | | |
Year ended October 31, 2018 | | | | | | | | | | | | | | | | |
Shares sold | | | 3,903,537 | | | $ | 47,754,786 | | | | 71,119,463 | | | $ | 1,499,743,371 | |
Shares issued in reinvestment of distributions | | | 413,056 | | | | 5,051,434 | | | | 5,499,134 | | | | 109,979,709 | |
Shares redeemed | | | (13,562,421 | ) | | | (167,980,433 | ) | | | (45,190,202 | ) | | | (928,418,878 | ) |
| | | | |
Net increase (decrease) | | | (9,245,828 | ) | | $ | (115,174,213 | ) | | | 31,428,395 | | | $ | 681,304,202 | |
| | | | |
Year ended October 31, 2017 | | | | | | | | | | | | | | | | |
Shares sold | | | 15,399,254 | | | $ | 184,926,370 | | | | 28,693,593 | | | $ | 549,908,666 | |
Shares issued in reinvestment of distributions | | | 634,330 | | | | 7,621,151 | | | | 2,642,306 | | | | 49,040,409 | |
Shares redeemed | | | (8,197,066 | ) | | | (98,344,140 | ) | | | (15,989,308 | ) | | | (306,265,021 | ) |
| | | | |
Net increase (decrease) | | | 7,836,518 | | | $ | 94,203,381 | | | | 15,346,591 | | | $ | 292,684,054 | |
aMay include a portion of Class C shares that were automatically converted to Class A.
| | | | | | | | | | | | | | | | |
| | | Franklin
Equity Income Fund | | | Franklin
Real Return Fund | |
| | | Shares | | | Amount | | | Shares | | | Amount | |
Class A Shares: | | | | | | | | | | | | | | | | |
Year ended October 31, 2018 | | | | | | | | | | | | | | | | |
Shares solda | | | 8,522,436 | | | $ | 215,600,707 | | | | 2,394,029 | | | $ | 23,972,212 | |
Shares issued in reinvestment of distributions | | | 3,204,198 | | | | 80,643,785 | | | | 437,971 | | | | 4,406,173 | |
Shares redeemed | | | (11,186,923 | ) | | | (283,143,891 | ) | | | (3,697,499 | ) | | | (37,139,360 | ) |
| | | | |
Net increase (decrease) | | | 539,711 | | | $ | 13,100,601 | | | | (865,499 | ) | | $ | (8,760,975 | ) |
| | | | |
Year ended October 31, 2017 | | | | | | | | | | | | | | | | |
Shares sold | | | 7,935,217 | | | $ | 186,557,733 | | | | 3,149,721 | | | $ | 31,981,942 | |
Shares issued in reinvestment of distributions | | | 4,586,199 | | | | 106,137,449 | | | | 186,888 | | | | 1,895,555 | |
Shares redeemed | | | (18,170,067 | ) | | | (428,114,145 | ) | | | (4,857,880 | ) | | | (49,354,764 | ) |
| | | | |
Net increase (decrease) | | | (5,648,651 | ) | | $ | (135,418,963 | ) | | | (1,521,271 | ) | | $ | (15,477,267 | ) |
| | | | |
Class C Shares: | | | | | | | | | | | | | | | | |
Year ended October 31, 2018 | | | | | | | | | | | | | | | | |
Shares sold | | | 1,755,701 | | | $ | 44,156,220 | | | | 384,940 | | | $ | 3,821,041 | |
Shares issued in reinvestment of distributions | | | 419,604 | | | | 10,474,658 | | | | 88,631 | | | | 882,650 | |
Shares redeemeda | | | (4,640,390 | ) | | | (116,179,871 | ) | | | (1,285,936 | ) | | | (12,716,856 | ) |
| | | | |
Net increase (decrease) | | | (2,465,085 | ) | | $ | (61,548,993 | ) | | | (812,365 | ) | | $ | (8,013,165 | ) |
| | | | |
Year ended October 31, 2017 | | | | | | | | | | | | | | | | |
Shares sold | | | 1,668,212 | | | $ | 38,941,261 | | | | 630,519 | | | $ | 6,345,139 | |
Shares issued in reinvestment of distributions | | | 613,812 | | | | 14,082,715 | | | | 34,431 | | | | 345,545 | |
Shares redeemed | | | (3,042,070 | ) | | | (71,479,552 | ) | | | (1,248,666 | ) | | | (12,554,810 | ) |
| | | | |
Net increase (decrease) | | | (760,046 | ) | | $ | (18,455,576 | ) | | | (583,716 | ) | | $ | (5,864,126 | ) |
| | | | |
| | | |
| franklintempleton.com | | Annual Report | | 79 |
FRANKLIN INVESTORS SECURITIES TRUST
NOTES TO FINANCIAL STATEMENTS
2. Shares of Beneficial Interest (continued)
| | | | | | | | | | | | | | | | |
| | | Franklin
Equity Income Fund | | | Franklin
Real Return Fund | |
| | | Shares | | | Amount | | | Shares | | | Amount | |
Class R Shares: | | | | | | | | | | | | | | | | |
Year ended October 31, 2018 | | | | | | | | | | | | | | | | |
Shares sold | | | 41,575 | | | $ | 1,049,280 | | | | | | | | | |
Shares issued in reinvestment of distributions | | | 11,318 | | | | 284,867 | | | | | | | | | |
Shares redeemed | | | (63,625 | ) | | | (1,607,096 | ) | | | | | | | | |
| | | | |
Net increase (decrease) | | | (10,732 | ) | | $ | (272,949 | ) | | | | | | | | |
| | | | |
Year ended October 31, 2017 | | | | | | | | | | | | | | | | |
Shares sold | | | 64,993 | | | $ | 1,525,028 | | | | | | | | | |
Shares issued in reinvestment of distributions | | | 16,175 | | | | 374,199 | | | | | | | | | |
Shares redeemed | | | (83,128 | ) | | | (1,979,626 | ) | | | | | | | | |
| | | | |
Net increase (decrease) | | | (1,960 | ) | | $ | (80,399 | ) | | | | | | | | |
| | | | |
Class R6 Shares: | | | | | | | | | | | | | | | | |
Year ended October 31, 2018 | | | | | | | | | | | | | | | | |
Shares sold | | | 3,474,912 | | | $ | 87,644,288 | | | | 1,199,559 | | | $ | 12,138,483 | |
Shares issued in reinvestment of distributions | | | 126,940 | | | | 3,202,571 | | | | 26,854 | | | | 271,471 | |
Shares redeemed | | | (849,554 | ) | | | (21,552,347 | ) | | | (312,145 | ) | | | (3,144,650 | ) |
| | | | |
Net increase (decrease) | | | 2,752,298 | | | $ | 69,294,512 | | | | 914,268 | | | $ | 9,265,304 | |
| | | | |
Year ended October 31, 2017 | | | | | | | | | | | | | | | | |
Shares sold | | | 228,564 | | | $ | 5,407,737 | | | | 299,229 | | | $ | 3,051,514 | |
Shares issued in reinvestment of distributions | | | 479 | | | | 11,161 | | | | 5,063 | | | | 51,659 | |
Shares redeemed | | | (189,735 | ) | | | (4,482,036 | ) | | | (267,306 | ) | | | (2,728,619 | ) |
| | | | |
Net increase (decrease) | | | 39,308 | | | $ | 936,862 | | | | 36,986 | | | $ | 374,554 | |
| | | | |
Advisor Class Shares: | | | | | | | | | | | | | | | | |
Year ended October 31, 2018 | | | | | | | | | | | | | | | | |
Shares sold | | | 1,666,939 | | | $ | 42,390,161 | | | | 1,354,135 | | | $ | 13,625,198 | |
Shares issued in reinvestment of distributions | | | 167,247 | | | | 4,221,565 | | | | 79,839 | | | | 806,460 | |
Shares redeemed | | | (3,322,517 | ) | | | (83,930,276 | ) | | | (3,358,885 | ) | | | (34,116,650 | ) |
| | | | |
Net increase (decrease) | | | (1,488,331 | ) | | $ | (37,318,550 | ) | | | (1,924,911 | ) | | $ | (19,684,992 | ) |
| | | | |
Year ended October 31, 2017 | | | | | | | | | | | | | | | | |
Shares sold | | | 4,431,818 | | | $ | 104,388,733 | | | | 1,805,023 | | | $ | 18,433,312 | |
Shares issued in reinvestment of distributions | | | 260,564 | | | | 6,067,460 | | | | 58,212 | | | | 592,952 | |
Shares redeemed | | | (2,378,377 | ) | | | (56,055,393 | ) | | | (1,401,509 | ) | | | (14,300,383 | ) |
| | | | |
Net increase (decrease) | | | 2,314,005 | | | $ | 54,400,800 | | | | 461,726 | | | $ | 4,725,881 | |
aMay include a portion of Class C shares that were automatically converted to Class A.
| | | | |
| | | |
| 80 | | Annual Report | | franklintempleton.com |
FRANKLIN INVESTORS SECURITIES TRUST
NOTES TO FINANCIAL STATEMENTS
3. Transactions with Affiliates
Franklin Resources, Inc. is the holding company for various subsidiaries that together are referred to as Franklin Templeton Investments. Certain officers and trustees of the Trust are also officers and/or directors of the following subsidiaries:
| | | | |
| Subsidiary | | Affiliation | | |
Franklin Advisers, Inc. (Advisers) | | Investment manager | | |
Franklin Templeton Services, LLC (FT Services) | | Administrative manager | | |
Franklin Templeton Distributors, Inc. (Distributors) | | Principal underwriter | | |
Franklin Templeton Investor Services, LLC (Investor Services) | | Transfer agent | | |
a. Management Fees
Franklin Balanced Fund pays an investment management fee to Advisers based on the average daily net assets of the Fund as follows:
| | | | |
| Annualized Fee Rate | | Net Assets | | |
0.700% | | Up to and including $250 million | | |
0.675% | | Over $250 million, up to and including $500 million | | |
0.650% | | Over $500 million, up to and including $1 billion | | |
0.625% | | Over $1 billion, up to and including $2.5 billion | | |
0.600% | | Over $2.5 billion, up to and including $5 billion | | |
0.575% | | Over $5 billion, up to and including $10 billion | | |
0.550% | | Over $10 billion, up to and including $15 billion | | |
0.525% | | Over $15 billion, up to and including $20 billion | | |
0.500% | | In excess of $20 billion | | |
Franklin Convertible Securities Fund and Franklin Equity Income Fund pay an investment management fee to Advisers based on the month-end net assets of each of the Funds as follows:
| | | | |
| Annualized Fee Rate | | Net Assets | | |
0.625% | | Up to and including $100 million | | |
0.500% | | Over $100 million, up to and including $250 million | | |
0.450% | | Over $250 million, up to and including $7.5 billion | | |
0.440% | | Over $7.5 billion, up to and including $10 billion | | |
0.430% | | Over $10 billion, up to and including $12.5 billion | | |
0.420% | | Over $12.5 billion, up to and including $15 billion | | |
0.400% | | Over $15 billion, up to and including $17.5 billion | | |
0.380% | | Over $17.5 billion, up to and including $20 billion | | |
0.360% | | Over $20 billion, up to and including $35 billion | | |
0.355% | | Over $35 billion, up to and including $50 billion | | |
0.350% | | In excess of $50 billion | | |
| | | | |
| | | |
| franklintempleton.com | | Annual Report | | 81 |
FRANKLIN INVESTORS SECURITIES TRUST
NOTES TO FINANCIAL STATEMENTS
3. Transactions with Affiliates (continued)
a. Management Fees (continued)
Franklin Real Return Fund pays an investment management fee to Advisers based on the average daily net assets of the Fund as follows:
| | | | |
| Annualized Fee Rate | | Net Assets | | |
0.625% | | Up to and including $500 million | | |
0.525% | | Over $500 million, up to and including $1 billion | | |
0.480% | | Over $1 billion, up to and including $1.5 billion | | |
0.435% | | Over $1.5 billion, up to and including $6.5 billion | | |
0.415% | | Over $6.5 billion, up to and including $11.5 billion | | |
0.400% | | Over $11.5 billion, up to and including $16.5 billion | | |
0.390% | | Over $16.5 billion, up to and including $19 billion | | |
0.380% | | Over $19 billion, up to and including $21.5 billion | | |
0.370% | | In excess of $21.5 billion | | |
For the year ended October 31, 2018, each Fund’s gross effective investment management fee rate based on average daily net assets was as follows:
| | | | | | | | | | | | |
Franklin
Balanced Fund | | Franklin
Convertible
Securities Fund | | | Franklin Equity
Income Fund | | | Franklin Real
Return Fund | |
| |
0.631% | | | 0.463% | | | | 0.461% | | | | 0.625% | |
b. Administrative Fees
Under an agreement with Advisers, FT Services provides administrative services to the Funds. The fee is paid by Advisers based on each of the Funds’ average daily net assets, and is not an additional expense of the Funds.
c. Distribution Fees
The Board has adopted distribution plans for each share class, with the exception of Class R6 and Advisor Class shares, pursuant to Rule 12b-1 under the 1940 Act. Under the Funds’ Class A reimbursement distribution plans, the Funds reimburse Distributors for costs incurred in connection with the servicing, sale and distribution of each Fund’s shares up to the maximum annual plan rate for each class. Under the Class A reimbursement distribution plans, costs exceeding the maximum for the current plan year cannot be reimbursed in subsequent periods. In addition, under the Funds’ Class C and R compensation distribution plans, the Funds pay Distributors for costs incurred in connection with the servicing, sale and distribution of each Fund’s shares up to the maximum annual plan rate for each class. The plan year, for purposes of monitoring compliance with the maximum annual plan rates, is February 1 through January 31 for each Fund.
| | | | |
| | | |
| 82 | | Annual Report | | franklintempleton.com |
FRANKLIN INVESTORS SECURITIES TRUST
NOTES TO FINANCIAL STATEMENTS
The maximum annual plan rates, based on the average daily net assets, for each class, are as follows:
| | | | | | | | | | | | | | | | |
| | | Franklin
Balanced Fund | | | Franklin
Convertible
Securities Fund | | | Franklin Equity
Income Fund | | | Franklin Real
Return Fund | |
| |
Reimbursement Plans: | | | | | | | | | | | | | | | | |
Class A | | | 0.35% | | | | 0.25% | | | | 0.25% | | | | 0.25% | |
| | | | |
Compensation Plans: | | | | | | | | | | | | | | | | |
Class C | | | 1.00% | | | | 1.00% | | | | 1.00% | | | | 0.65% | |
Class R | | | 0.50% | | | | — | | | | 0.50% | | | | — | |
For Franklin Balanced Fund, the Board has set the current rate at 0.25% per year for Class A shares until further notice and approval by the Board.
d. Sales Charges/Underwriting Agreements
Front-end sales charges and contingent deferred sales charges (CDSC) do not represent expenses of the Funds. These charges are deducted from the proceeds of sales of fund shares prior to investment or from redemption proceeds prior to remittance, as applicable. Distributors has advised the Funds of the following commission transactions related to the sales and redemptions of the Funds’ shares for the year:
| | | | | | | | | | | | | | | | |
| | | Franklin
Balanced Fund | | | Franklin
Convertible
Securities Fund | | | Franklin Equity
Income Fund | | | Franklin Real
Return Fund | |
| |
Sales charges retained net of commissions paid to unaffiliated brokers/dealers | | | $743,787 | | | | $580,468 | | | | $359,473 | | | | $17,046 | |
CDSC retained | | | $ 40,173 | | | | $ 21,322 | | | | $ 14,772 | | | | $ 4,535 | |
Effective September 10, 2018, the Board approved changes to certain front-end sales charges and dealer commissions on Class A shares. Further details are disclosed in the Fund’s Prospectus.
e. Transfer Agent Fees
Each class of shares pays transfer agent fees to Investor Services for its performance of shareholder servicing obligations. Effective November 1, 2017, the fees are based on an annualized asset based fee of 0.02% plus a transaction based fee. Prior to November 1, 2017, the fees were account based fees that varied based on fund or account type. In addition, each class reimburses Investor Services for out of pocket expenses incurred and, except for Class R6, reimburses shareholder servicing fees paid to third parties. These fees are allocated daily based upon their relative proportion of such classes’ aggregate net assets. Class R6 pays Investor Services transfer agent fees specific to that class.
For the year ended October 31, 2018, the Funds paid transfer agent fees as noted in the Statements of Operations of which the following amounts were retained by Investor Services:
| | | | | | | | | | | | | | | | |
| | | Franklin
Balanced Fund | | | Franklin
Convertible
Securities Fund | | | Franklin Equity
Income Fund | | | Franklin Real
Return Fund | |
| |
Transfer agent fees | | | $1,520,098 | | | | $1,230,740 | | | | $961,808 | | | | $176,502 | |
| | | | |
| | | |
| franklintempleton.com | | Annual Report | | 83 |
FRANKLIN INVESTORS SECURITIES TRUST
NOTES TO FINANCIAL STATEMENTS
3. Transactions with Affiliates (continued)
f. Investments in Affiliated Management Investment Companies
Certain or all Funds invest in one or more affiliated management investment companies for purposes other than exercising a controlling influence over the management or policies. Management fees paid by the Funds are waived on assets invested in the affiliated management investment companies, as noted in the Statements of Operations, in an amount not to exceed the management and administrative fees paid directly or indirectly by each affiliate. During the year ended October 31, 2018, investments in affiliated management investment companies were as follows:
| | | | | | | | | | | | | | | | | | | | | | | | | | | | | | | | |
| | | Number of
Shares Held at Beginning
of Year | | | Gross Additions | | | Gross
Reductions | | | Number of
Shares Held at End of Year | | | Value at End of Year | | | Dividend
Income | | | Realized
Gain (Loss) | | | Net Change in Unrealized
Appreciation
(Depreciation) | |
| |
Franklin Balanced Fund | | | | | | | | | | | | | | | | | | | | | | | | | | | | | | | | |
Controlled Affiliates | | | | | | | | | | | | | | | | | | | | | | | | | | | | | | | | |
Franklin FTSE Europe Hedged ETF | | | — | | | | 1,350,000 | | | | — | | | | 1,350,000 | | | $ | 32,123,250 | | | $ | 525,298 | | | $ | — | | | $ | (1,589,375 | ) |
Franklin FTSE Japan Hedged ETF | | | — | | | | 1,250,000 | | | | — | | | | 1,250,000 | | | | 30,808,000 | | | | 27,033 | | | | — | | | | (2,064,875 | ) |
Franklin Liberty Investment Grade Corporate ETF | | | 750,000 | | | | 250,000 | | | | (1,000,000 | ) | | | — | | | | — | | | | 615,801 | | | | (642,330 | ) | | | (586,875 | ) |
| | | | | | | | | | | | | | | | | | | | |
| | | | |
Total Controlled Affiliates | | | $ | 62,931,250 | | | $ | 1,168,132 | | | $ | (642,330 | ) | | $ | (4,241,125 | ) |
| | | | | | | | | | | | | | | | | | | | |
Non-Controlled Affiliates | | | | | | | | | | | | | | | | | | | | | | | | | | | | | |
Institutional Fiduciary Trust Money Market Portfolio, 1.83% | | | 101,275,128 | | | | 1,587,015,818 | | | | (1,561,607,937 | ) | | | 126,683,009 | | | | 126,683,009 | | | | 1,038,400 | | | | — | | | | — | |
| | | | | | | | | | | | | | | | | | | | |
| | | | |
Total Affiliated Securities | | | $ | 189,614,259 | | | $ | 2,206,532 | | | $ | (642,330 | ) | | $ | (4,241,125 | ) |
| | | | | | | | | | | | | | | | | | | | |
Franklin Convertible Securities Fund | | | | | | | | | | | | | | | | | | | | | | | | | | | | | |
Non-Controlled Affiliates | | | | | | | | | | | | | | | | | | | | | | | | | | | | | |
Institutional Fiduciary Trust Money Market Portfolio, 1.83% | | | 69,852,661 | | | | 655,979,890 | | | | (562,589,869 | ) | | | 163,242,682 | | | $ | 163,242,682 | | | $ | 2,180,907 | | | $ | — | | | $ | — | |
| | | | | | | | | | | | | | | | | | | | |
Franklin Equity Income Fund | | | | | | | | | | | | | | | | | | | | | | | | | | | | | |
Non-Controlled Affiliates | | | | | | | | | | | | | | | | | | | | | | | | | | | | | |
Institutional Fiduciary Trust Money Market Portfolio, 1.83% | | | 36,691,548 | | | | 474,951,728 | | | | (441,115,459 | ) | | | 70,527,817 | | | $ | 70,527,817 | | | $ | 670,617 | | | $ | — | | | $ | — | |
| | | | | | | | | | | | | | | | | | | | |
Franklin Real Return Fund | | | | | | | | | | | | | | | | | | | | | | | | | | | | | |
Non-Controlled Affiliates | | | | | | | | | | | | | | | | | | | | | | | | | | | | | |
Franklin Lower Tier Floating Rate Fund | | | 305,899 | | | | 15,703 | | | | (321,602 | ) | | | — | | | $ | — | | | $ | 74,590 | | | $ | 140,938 | a | | $ | (149,933 | ) |
Franklin Middle Tier Floating Rate Fund | | | 112,671 | | | | 2,104 | | | | (114,775 | ) | | | — | | | | — | | | | 20,880 | | | | (18,778 | ) | | | 9,823 | |
Franklin Pelagos Commodities | | | | | | | | | | | | | | | | | | | | | | | | | | | | | | | | |
Strategy Fund, Class R6 | | | — | | | | 897,760 | | | | — | | | | 897,760 | | | | 5,808,508 | | | | — | | | | — | | | | (191,492 | ) |
| | | | | | | | | | | | | | | | | | | | |
| | | | |
Total Affiliated Securities | | | $ | 5,808,508 | | | $ | 95,470 | | | $ | 122,160 | | | $ | (331,602 | ) |
| | | | | | | | | | | | | | | | | | | | |
aIncludes capital gain
distributions received.
g. Waiver and Expense Reimbursements
Advisers and Investor Services have contractually agreed in advance to waive or limit their respective fees and to assume as their own expense certain expenses otherwise payable by the Franklin Real Return Fund so that the expenses (excluding distribution fees, acquired fund fees and expenses, and certain non-routine expenses or costs, including those relating to litigation, indemnification,
| | | | |
| | | |
| 84 | | Annual Report | | franklintempleton.com |
FRANKLIN INVESTORS SECURITIES TRUST
NOTES TO FINANCIAL STATEMENTS
reorganizations, and liquidations) for Class A, Class C, and Advisor Class of the Fund do not exceed 0.65%, and for Class R6 do not exceed 0.49%, based on the average net assets of each class until February 28, 2019. Total expenses waived or paid are not subject to recapture subsequent to the Fund’s fiscal year end.
For Franklin Balanced Fund, Franklin Convertible Securities Fund and Franklin Equity Income Fund, Investor Services has voluntarily agreed in advance to waive or limit its fees so that the Class R6 transfer agent fees do not exceed 0.03%, 0.02% and 0.03% based on the average net assets of the class, respectively. Investor Services may discontinue this waiver in the future.
h. Interfund Transactions
Franklin Real Return Fund engaged in purchases and sales of investments with funds or other accounts that have common investment managers (or affiliated investment managers), directors, trustees or officers. During the year ended October 31, 2018, these purchase and sale transactions aggregated $0 and $1,241,087, respectively.
4. Expense Offset Arrangement
The Funds have entered into an arrangement with their custodian whereby credits realized as a result of uninvested cash balances are used to reduce a portion of the Funds’ custodian expenses. During the year ended October 31, 2018, the custodian fees were reduced as noted in the Statements of Operations.
5. Income Taxes
For tax purposes, capital losses may be carried over to offset future capital gains.
At October 31, 2018, the capital loss carryforwards were as follows:
| | | | | | | | | | |
| | | Franklin Real
Return Fund | | | | | | | |
Capital loss carryforwards not subject to expiration: | | | | | | | | | | |
Short Term | | | $ 1,056,974 | | | | | | | |
Long Term | | | 25,062,261 | | | | | | | |
| | | | |
Total capital loss carryforwards | | | $26,119,235 | | | | | | | |
During the year ended October 31, 2018, the Franklin Real Return Fund utilized $1,422,523 of capital loss carryforwards.
On October 31, 2018, the Franklin Real Return Fund had expired capital loss carryforwards of $1,206,585, which were reclassified to paid-in capital.
The tax character of distributions paid during the years ended October 31, 2018 and 2017, was as follows:
| | | | | | | | | | | | | | | | |
| | | Franklin
Balanced Fund | | | Franklin
Convertible Securities Fund | |
| | | 2018 | | | 2017 | | | 2018 | | | 2017 | |
Distributions paid from: | | | | | | | | | | | | | | | | |
Ordinary income | | | $119,167,099 | | | | $ 99,527,790 | | | $ | 102,614,199 | | | $ | 94,056,058 | |
Long term capital gain | | | 43,679,233 | | | | 48,143,231 | | | | 108,553,843 | | | | 3,908,710 | |
| | | | |
| | | $162,846,332 | | | | $147,671,021 | | | $ | 211,168,042 | | | $ | 97,964,768 | |
| | | | |
| | | |
| franklintempleton.com | | Annual Report | | 85 |
FRANKLIN INVESTORS SECURITIES TRUST
NOTES TO FINANCIAL STATEMENTS
5. Income Taxes (continued)
| | | | | | | | | | | | | | | | |
| | | Franklin
Equity Income Fund | | | Franklin
Real Return Fund | |
| | | 2018 | | | 2017 | | | 2018 | | | 2017 | |
Distributions paid from: | | | | | | | | | | | | | | | | |
Ordinary income | | | $ 48,204,970 | | | $ | 50,710,215 | | | $ | 6,608,494 | | | $ | 3,000,201 | |
Long term capital gain | | | 54,052,701 | | | | 80,284,209 | | | | — | | | | — | |
| | | | |
| | | $102,257,671 | | | $ | 130,994,424 | | | $ | 6,608,494 | | | $ | 3,000,201 | |
At October 31, 2018, the cost of investments, net unrealized appreciation (depreciation), undistributed ordinary income and undistributed long term capital gains for income tax purposes were as follows:
| | | | | | | | | | | | | | | | |
| | | Franklin
Balanced Fund | | | Franklin
Convertible
Securities Fund | | | Franklin Equity
Income Fund | | | Franklin Real
Return Fund | |
Cost of investments | | $ | 3,086,276,230 | | | $ | 3,447,961,768 | | | $ | 1,609,561,538 | | | $ | 194,991,694 | |
| | | | |
Unrealized appreciation | | $ | 317,190,735 | | | $ | 392,199,924 | | | $ | 584,433,209 | | | $ | 7,488,059 | |
Unrealized depreciation | | | (102,777,255 | ) | | | (145,498,206 | ) | | | (31,844,604 | ) | | | (11,212,917 | ) |
| | | | |
Net unrealized appreciation (depreciation) | | $ | 214,413,480 | | | $ | 246,701,718 | | | $ | 552,588,605 | | | $ | (3,724,858 | ) |
| | | | |
Distributable earnings: | | | | | | | | | | | | | | | | |
Undistributed ordinary income | | $ | 803,761 | | | $ | 78,165,230 | | | $ | 2,979,631 | | | $ | 1,144,468 | |
Undistributed long term capital gains | | | 38,371,930 | | | | 95,639,294 | | | | 86,903,138 | | | | — | |
| | | | |
Total distributable earnings | | $ | 39,175,691 | | | $ | 173,804,524 | | | $ | 89,882,769 | | | $ | 1,144,468 | |
Differences between income and/or capital gains as determined on a book basis and a tax basis are primarily due to differing treatments of bond discounts and premiums, tax straddles, inflation related adjustments on foreign securities and wash sales.
The Funds except Franklin Real Return Fund, utilized a tax accounting practice to treat a portion of the proceeds from capital shares redeemed as a distribution from realized capital gains.
6. Investment Transactions
Purchases and sales of investments (excluding short term securities) for the year ended October 31, 2018, were as follows:
| | | | | | | | | | | | | | | | |
| | | Franklin Balanced Fund | | | Franklin
Convertible
Securities Fund | | | Franklin Equity
Income Fund | | | Franklin Real
Return Fund | |
| |
Purchases | | | $2,129,348,755 | | | | $1,836,202,850 | | | | $610,249,312 | | | | $53,348,319 | |
Sales | | | $2,232,336,640 | | | | $1,054,143,241 | | | | $708,981,472 | | | | $90,128,735 | |
7. Credit Risk
At October 31, 2018, Franklin Balanced Fund and Franklin Convertible Securities Fund had 8.6% and 73.9%, respectively, of their portfolio invested in high yield securities, or other securities rated below investment grade and unrated securities, if any. These securities may be more sensitive to economic conditions causing greater price volatility and are potentially subject to a greater risk of loss due to default than higher rated securities.
| | | | |
| | | |
| 86 | | Annual Report | | franklintempleton.com |
FRANKLIN INVESTORS SECURITIES TRUST
NOTES TO FINANCIAL STATEMENTS
8. Other Derivative Information
At October 31, 2018, the Fund’s investments in derivative contracts are reflected in the Statements of Assets and Liabilities as follows:
| | | | | | | | | | | | | | | | |
| | | Asset Derivatives | | | | | | Liability Derivatives | |
Derivative Contracts Not Accounted for as
Hedging Instruments | | Statements of Assets and Liabilities Location | | Fair Value | | | | | | Statements of Assets and Liabilities Location | | Fair Value | |
| |
Franklin Balanced Fund | | | | | | | | | | | | | | | | |
Equity contracts | | Investments in securities, at value | | | $64,250,000a | | | | | | | Options written, at value | | | $8,390,000 | |
| | | | | | | | | | | | | | | | |
aPurchased option contracts are included in investments in securities, at value in the Statements of Assets and Liabilities.
For the year ended October 31, 2018, the effect of derivative contracts in the Fund’s Statements of Operations was as follows:
| | | | | | | | | | | | |
Derivative Contracts Not Accounted for as
Hedging Instruments | | Statements of
Operations Location | | Net Realized
Gain (Loss) for
the Year | | | Statements of Operations Location | | Net Change in
Unrealized
Appreciation
(Depreciation)
for the Year | |
| |
| | Net realized gain (loss) from: | | | | | | Net change in unrealized appreciation (depreciation) on: | | | | |
| | | |
Franklin Balanced Fund | | | | | | | | | | |
Equity contracts | | Investments | | $ | (11,810,180)a | | | Investments | | $ | 24,519,914 | a |
| | Written options | | | 8,548,278 | | | Written options | | | 2,017,129 | |
| | | | | | | | | | | | |
Totals | | | | $ | (3,261,902) | | | | | $ | 26,537,043 | |
| | | | | | | | | | | | |
aPurchased option contracts are included in net realized gain (loss) from investments and net change in unrealized appreciation (depreciation) on investments in the Statements of Operations.
For the year ended October 31, 2018, the average month end notional amount of options represented $2,105,923.
See Note 1(d) regarding derivative financial instruments.
9. Credit Facility
The Funds, together with other U.S. registered and foreign investment funds (collectively, Borrowers), managed by Franklin Templeton Investments, are borrowers in a joint syndicated senior unsecured credit facility totaling $2 billion (Global Credit Facility) which matures on February 8, 2019. This Global Credit Facility provides a source of funds to the Borrowers for temporary and emergency purposes, including the ability to meet future unanticipated or unusually large redemption requests.
Under the terms of the Global Credit Facility, the Funds shall, in addition to interest charged on any borrowings made by the Funds and other costs incurred by the Funds, pay their share of fees and expenses incurred in connection with the implementation and maintenance of the Global Credit Facility, based upon their relative share of the aggregate net assets of all of the Borrowers,including an annual commitment fee of 0.15% based upon the unused portion of the Global Credit Facility. These fees are reflected in other expenses in the Statements of Operations. During the year ended October 31, 2018, the Funds did not use the Global Credit Facility.
| | | | |
| | | |
| franklintempleton.com | | Annual Report | | 87 |
FRANKLIN INVESTORS SECURITIES TRUST
NOTES TO FINANCIAL STATEMENTS
10. Fair Value Measurements
The Funds follow a fair value hierarchy that distinguishes between market data obtained from independent sources (observable inputs) and the Funds’ own market assumptions (unobservable inputs). These inputs are used in determining the value of the Funds’ financial instruments and are summarized in the following fair value hierarchy:
| | • | | Level 1 – quoted prices in active markets for identical financial instruments |
| | • | | Level 2 – other significant observable inputs (including quoted prices for similar financial instruments, interest rates, prepayment speed, credit risk, etc.) |
| | • | | Level 3 – significant unobservable inputs (including the Funds’ own assumptions in determining the fair value of financial instruments) |
The input levels are not necessarily an indication of the risk or liquidity associated with financial instruments at that level.
For movements between the levels within the fair value hierarchy, the Funds have adopted a policy of recognizing the transfers as of the date of the underlying event which caused the movement.
A summary of inputs used as of October 31, 2018, in valuing the Funds’ assets and liabilities carried at fair value, is as follows:
| | | | | | | | | | | | | | | | |
| | | Level 1 | | | Level 2 | | | Level 3 | | | Total | |
| |
| Franklin Balanced Fund | | | | | | | | | | | | | | | | |
Assets: | | | | | | | | | | | | | | | | |
Investments in Securities:a | | | | | | | | | | | | | | | | |
Equity Investmentsb | | $ | 1,427,580,402 | | | $ | — | | | $ | — | | | $ | 1,427,580,402 | |
Equity-Linked Securities | | | — | | | | 353,838,640 | | | | — | | | | 353,838,640 | |
Index-Linked Notes | | | — | | | | 33,322,500 | | | | — | | | | 33,322,500 | |
Convertible Bonds | | | — | | | | 11,550,435 | | | | — | | | | 11,550,435 | |
Corporate Bonds | | | — | | | | 1,127,907,361 | | | | — | | | | 1,127,907,361 | |
U.S. Government and Agency Securities | | | — | | | | 174,354,492 | | | | — | | | | 174,354,492 | |
Options Purchased | | | 64,250,000 | | | | — | | | | — | | | | 64,250,000 | |
Short Term Investments | | | 126,683,009 | | | | — | | | | — | | | | 126,683,009 | |
| | | | |
Total Investments in Securities | | $ | 1,618,513,411 | | | $ | 1,700,973,428 | | | $ | — | | | $ | 3,319,486,839 | |
| | | | |
| | | | |
Liabilities: | | | | | | | | | | | | | | | | |
Other Financial Instruments: | | | | | | | | | | | | | | | | |
Options Written | | $ | 8,390,000 | | | $ | — | | | $ | — | | | $ | 8,390,000 | |
| | | | |
| | | | |
Franklin Convertible Securities Fund | | | | | | | | | | | | | | | | |
Assets: | | | | | | | | | | | | | | | | |
Investments in Securities:a | | | | | | | | | | | | | | | | |
Equity Investments:b | | | | | | | | | | | | | | | | |
Communication Services | | $ | 20,137,613 | | | $ | 40,605,933 | | | $ | — | | | $ | 60,743,546 | |
Consumer Staples | | | 65,205,000 | | | | 52,985,698 | | | | — | | | | 118,190,698 | |
All Other Equity Investments | | | 524,368,974 | | | | — | | | | — | | | | 524,368,974 | |
Convertible Bonds | | | — | | | | 2,828,117,586 | | | | — | | | | 2,828,117,586 | |
Escrows and Litigation Trusts | | | — | | | | — | | | | — | c | | | — | |
Short Term Investments | | | 163,242,682 | | | | — | | | | — | | | | 163,242,682 | |
| | | | |
Total Investments in Securities | | $ | 772,954,269 | | | $ | 2,921,709,217 | | | $ | — | | | $ | 3,694,663,486 | |
| | | | |
| | | | |
| | | |
| 88 | | Annual Report | | franklintempleton.com |
FRANKLIN INVESTORS SECURITIES TRUST
NOTES TO FINANCIAL STATEMENTS
| | | | | | | | | | | | | | | | |
| | | Level 1 | | | Level 2 | | | Level 3 | | | Total | |
| |
Franklin Equity Income Fund | | | | | | | | | | | | | | | | |
Assets: | | | | | | | | | | | | | | | | |
Investments in Securities:a | | | | | | | | | | | | | | | | |
Equity Investmentsb | | $ | 1,931,192,848 | | | $ | — | | | $ | — | | | $ | 1,931,192,848 | |
Equity-Linked Securities | | | — | | | | 160,429,478 | | | | — | | | | 160,429,478 | |
Short Term Investments | | | 70,527,817 | | | | — | | | | — | | | | 70,527,817 | |
| | | | |
Total Investments in Securities | | $ | 2,001,720,665 | | | $ | 160,429,478 | | | $ | — | | | $ | 2,162,150,143 | |
| | | | |
| | | | |
Franklin Real Return Fund | | | | | | | | | | | | | | | | |
Assets: | | | | | | | | | | | | | | | | |
Investments in Securities:a | | | | | | | | | | | | | | | | |
Equity Investmentsb | | $ | 38,720,803 | | | $ | — | | | $ | — | | | $ | 38,720,803 | |
U.S. Government and Agency Securities | | | — | | | | 140,008,588 | | | | — | | | | 140,008,588 | |
Short Term Investments | | | — | | | | 12,537,445 | | | | — | | | | 12,537,445 | |
| | | | |
Total Investments in Securities | | $ | 38,720,803 | | | $ | 152,546,033 | | | $ | — | | | $ | 191,266,836 | |
| | | | |
aFor detailed categories, see the accompanying Statement of Investments.
bIncludes common, convertible preferred stocks and management investment companies.
cIncludes securities determined to have no value at October 31, 2018.
A reconciliation of assets in which Level 3 inputs are used in determining fair value is presented when there are significant Level 3 financial instruments at the beginning and/or end of the year.
11. New Accounting Pronouncements
In March 2017, the Financial Accounting Standards Board (FASB) issued Accounting Standards Update (ASU) No. 2017-08, Receivables—Nonrefundable Fees and Other Costs (Subtopic 310-20): Premium Amortization on Purchased Callable Debt Securities. The amendments in the ASU shorten the amortization period for certain callable debt securities acquired at a premium, to be amortized to the earliest call date. The ASU does not require an accounting change for securities acquired at a discount, which continues to be amortized to maturity. The ASU is effective for fiscal years and interim periods within those fiscal years beginning after December 15, 2018. Management has reviewed the requirements and believes the adoption of this ASU will not have a material impact on the financial statements.
In August 2018, FASB issued ASU No. 2018-13, Fair Value Measurement (Topic 820): Disclosure Framework—Changes to the Disclosure Requirements for Fair Value Measurements. The amendments in the ASU modify the disclosure requirements on fair value measurements in Topic 820. The ASU is effective for interim and annual reporting periods beginning after December 15, 2019. Management has reviewed the requirements and believes the adoption of this ASU will not have a material impact on the financial statements.
12. Subsequent Events
The Funds have evaluated subsequent events through the issuance of the financial statements and determined that no events have occurred that require disclosure, except for the following:
On October 23, 2018, the Board approved the repositioning of the Fund as an income/managed payout strategy. As part of the repositioning, on December 13 2018, the Board approved changing the Fund’s name to Franklin Managed Income Fund. The repositioning and the name change will not become effective until March 1, 2019.
| | | | |
| | | |
| franklintempleton.com | | Annual Report | | 89 |
FRANKLIN INVESTORS SECURITIES TRUST
NOTES TO FINANCIAL STATEMENTS
Abbreviations
| | | | | | |
| Currency | | Selected Portfolio |
|
| USD | | United States Dollar | | ADR | | American Depositary Receipt |
| | | | ETF | | Exchange Traded Fund |
| | | | FRN | | Floating Rate Note |
| | | | LIBOR | | London InterBank Offered Rate |
| | | | REIT | | Real Estate Investment Trust |
| | | | SPDR | | S&P Depositary Receipt |
| | | | |
| | | |
| 90 | | Annual Report | | franklintempleton.com |
FRANKLIN INVESTORS SECURITIES TRUST
Report of Independent Registered Public Accounting Firm
To the Board of Trustees of Franklin Investors Securities Trust and Shareholders of Franklin Balanced Fund, Franklin Convertible Securities Fund, Franklin Equity Income Fund and Franklin Real Return Fund
Opinions on the Financial Statements
We have audited the accompanying statements of assets and liabilities, including the statements of investments, of Franklin Balanced Fund, Franklin Convertible Securities Fund, Franklin Equity Income Fund and Franklin Real Return Fund (the “Funds”) as of October 31, 2018, the related statements of operations for the year ended October 31, 2018, the statements of changes in net assets for each of the two years in the period ended October 31, 2018, including the related notes, and the financial highlights for each of the periods indicated therein (collectively referred to as the “financial statements”). In our opinion, the financial statements present fairly, in all material respects, the financial position of each of the Funds as of October 31, 2018, the results of each of their operations for the year then ended, the changes in each of their net assets for each of the two years in the period ended October 31, 2018 and each of the financial highlights for each of the periods indicated therein in conformity with accounting principles generally accepted in the United States of America.
Basis for Opinions
These financial statements are the responsibility of the Funds’ management. Our responsibility is to express an opinion on the Funds’ financial statements based on our audits. We are a public accounting firm registered with the Public Company Accounting Oversight Board (United States) (“PCAOB”) and are required to be independent with respect to the Funds in accordance with the U.S. federal securities laws and the applicable rules and regulations of the Securities and Exchange Commission and the PCAOB.
We conducted our audits of these financial statements in accordance with the standards of the PCAOB. Those standards require that we plan and perform the audit to obtain reasonable assurance about whether the financial statements are free of material misstatement, whether due to error or fraud.
Our audits included performing procedures to assess the risks of material misstatement of the financial statements, whether due to error or fraud, and performing procedures that respond to those risks. Such procedures included examining, on a test basis, evidence regarding the amounts and disclosures in the financial statements. Our audits also included evaluating the accounting principles used and significant estimates made by management, as well as evaluating the overall presentation of the financial statements. Our procedures included confirmation of securities owned as of October 31, 2018 by correspondence with the custodian, transfer agent and brokers; when replies were not received from brokers, we performed other auditing procedures. We believe that our audits provide a reasonable basis for our opinions.
PricewaterhouseCoopers LLP
San Francisco, California
December 18, 2018
We have served as the auditor of one or more investment companies in the Franklin Templeton Group of Funds since 1948.
| | | | |
| | | |
| franklintempleton.com | | Annual Report | | 91 |
FRANKLIN INVESTORS SECURITIES TRUST
Tax Information (unaudited)
Under Section 852(b)(3)(C) of the Internal Revenue Code, the Funds hereby report the maximum amount allowable but no less than the following amounts as long term capital gain dividends for the fiscal year ended October 31, 2018:
| | | | | | | | | | |
Franklin
Balanced Fund | | | Franklin
Convertible
Securities Fund | | | Franklin Equity
Income Fund | |
| | |
| | $47,223,833 | | | | $140,282,409 | | | | $61,527,378 | |
Under Section 871(k)(2)(C) of the Internal Revenue Code, the Funds hereby report the maximum amount allowable but no less than the following amounts as short term capital gain dividends for purposes of the tax imposed under Section 871(a)(1)(A) of the Internal Revenue Code for the fiscal year ended October 31, 2018:
| | | | | | | | | | |
Franklin
Balanced Fund | | | Franklin
Convertible
Securities Fund | | | Franklin Equity
Income Fund | |
| | |
| | $13,487,645 | | | | $27,617,329 | | | | $111,590 | |
Under Section 854(b)(1)(A) of the Internal Revenue Code, the Funds hereby report the following percentage amounts of the ordinary income dividends as income qualifying for the dividends received deduction for the fiscal year ended October 31, 2018:
| | | | | | | | | | |
Franklin
Balanced Fund | | | Franklin
Convertible
Securities Fund | | | Franklin Equity
Income Fund | |
| | |
| | 33.34% | | | | 6.51% | | | | 94.29% | |
Under Section 854(b)(1)(B) of the Internal Revenue Code, the Funds hereby report the maximum amount allowable but no less than the following amounts as qualified dividends for purposes of the maximum rate under Section 1(h)(11) of the Internal Revenue Code for the fiscal year ended October 31, 2018:
| | | | | | | | | | | | | | |
Franklin
Balanced Fund | | | Franklin
Convertible
Securities Fund | | | Franklin Equity
Income Fund | | | Franklin Real
Return Fund | |
| | |
| | $51,437,775 | | | | $9,352,590 | | | | $50,789,814 | | | | $653,422 | |
Distributions, including qualified dividend income, paid during calendar year 2018 will be reported to shareholders on Form 1099-DIV by mid-February 2019. Shareholders are advised to check with their tax advisors for information on the treatment of these amounts on their individual income tax returns.
Under Section 871(k)(1)(C) of the Internal Revenue Code, the Funds hereby report the maximum amount allowable but no less than the following amounts as interest related dividends for purposes of the tax imposed under Section 871(a)(1)(A) of the Internal Revenue Code for the fiscal year ended October 31, 2018:
| | |
Franklin Convertible Securities Fund | |
| | |
| | $17,771,879 | |
| | | | |
| | | |
| 92 | | Annual Report | | franklintempleton.com |
FRANKLIN INVESTORS SECURITIES TRUST
Special Meeting of Shareholders
MEETING OF SHAREHOLDERS: OCTOBER 30, 2017 AND RECONVENED ON DECEMBER 15, 2017 AND DECEMBER 29, 2017
(UNAUDITED)
A Special Meeting of Shareholders of Franklin Investors Securities Trust was held at the offices of Franklin Templeton Investments, One Franklin Parkway, San Mateo, California on October 30, 2017 and reconvened on December 15, 2017 and December 29, 2017. The purpose of the meeting was to elect Trustees of Franklin Investors Securities Trust and to vote on the following proposals for each Fund: to approve the use of a “manager of managers” structure whereby the Fund’s investment manager would be able to hire and replace subadvisers without shareholder approval and to approve an amended fundamental investment restriction regarding investments in commodities. At the meeting, (i) the following persons were elected by the shareholders to serve as Trustees of Franklin Investors Securities Trust: Harris J. Ashton, Terrence J. Checki, Mary C. Choksi, Edith E. Holiday, Gregory E. Johnson, Rupert H. Johnson, Jr., J. Michael Luttig, Larry D. Thompson, and John B. Wilson; and (ii) the proposals to use a “manager of managers” structure and to approve an amended fundamental investment restriction regarding investments in commodities were approved by shareholders of each Fund, except for Franklin Real Return Fund. No other business was transacted at the meeting.
In connection with the meeting, management is aware that some shareholders received from the proxy solicitor numerous calls and mailings that may have been distracting. Management is taking steps to ensure that, in the future, for any new shareholder meeting solicitations that occur, such activity is not repeated. Management apologizes for any inconvenience that may have been caused as a result of such calls and mailings.
The results of the voting at the meeting are as follows:
Proposal 1. To elect a Board of Trustees:
| | | | | | | | |
| Name | | For | | | Withheld | |
| |
Harris J. Ashton | | | 1,140,629,120 | | | | 32,081,576 | |
Terrence J. Checki | | | 1,140,321,742 | | | | 32,388,956 | |
Mary C. Choksi | | | 1,140,407,572 | | | | 32,303,126 | |
Edith E. Holiday | | | 1,108,315,463 | | | | 64,395,237 | |
Gregory E. Johnson | | | 1,141,429,086 | | | | 31,281,610 | |
Rupert H. Johnson, Jr. | | | 1,140,181,429 | | | | 32,529,268 | |
J. Michael Luttig | | | 1,140,612,578 | | | | 32,098,122 | |
Larry D. Thompson | | | 1,140,871,851 | | | | 31,838,848 | |
John B. Wilson | | | 1,141,487,184 | | | | 31,223,513 | |
| | |
Total Trust Shares Outstanding*: 1,818,967,134 | | | | | | | | |
| | | | |
| | | |
| franklintempleton.com | | Annual Report | | 93 |
FRANKLIN INVESTORS SECURITIES TRUST
SPECIAL MEETING OF SHAREHOLDERS
| Proposal 2. | To approve the use of a “manager of managers” structure whereby the Fund’s investment manager would be able to hire and replace subadvisers without shareholder approval: |
Franklin Balanced Fund
| | | | |
| | | Shares | |
| |
For | | | 104,246,566 | |
Against | | | 8,903,975 | |
Abstain | | | 6,730,540 | |
Broker Non-Votes | | | 24,731,949 | |
Total Fund Shares Voted | | | 144,613,028 | |
Total Fund Shares Outstanding* | | | 288,495,988 | |
Franklin Convertible Securities Fund
| | | | |
| | | Shares | |
| |
For | | | 59,793,433 | |
Against | | | 2,620,815 | |
Abstain | | | 1,644,437 | |
Broker Non-Votes | | | 22,720,089 | |
Total Fund Shares Voted | | | 86,778,774 | |
Total Fund Shares Outstanding* | | | 128,499,691 | |
Franklin Equity Income Fund
| | | | |
| | | Shares | |
| |
For | | | 32,618,200 | |
Against | | | 2,669,239 | |
Abstain | | | 1,831,559 | |
Broker Non-Votes | | | 8,279,951 | |
Total Fund Shares Voted | | | 45,398,950 | |
Total Fund Shares Outstanding* | | | 88,573,120 | |
Franklin Real Return Fund
| | | | |
| | | Shares | |
| |
For | | | 9,226,088 | |
Against | | | 824,151 | |
Abstain | | | 584,830 | |
Broker Non-Votes | | | 3,920,546 | |
Total Fund Shares Voted | | | 14,555,622 | |
Total Fund Shares Outstanding* | | | 23,154,340 | |
| Proposal 3. | To approve an amended fundamental investment restriction regarding investments in commodities: |
Franklin Balanced Fund
| | | | |
| | | Shares | |
| |
For | | | 106,101,197 | |
Against | | | 5,525,418 | |
Abstain | | | 8,254,464 | |
Broker Non-Votes | | | 24,731,949 | |
Total Fund Shares Voted | | | 144,613,028 | |
Total Fund Shares Outstanding* | | | 288,495,988 | |
| | | | |
| | | |
| 94 | | Annual Report | | franklintempleton.com |
FRANKLIN INVESTORS SECURITIES TRUST
SPECIAL MEETING OF SHAREHOLDERS
Franklin Convertible Securities Fund
| | | | |
| | | Shares | |
| |
For | | | 59,902,307 | |
Against | | | 2,006,159 | |
Abstain | | | 2,150,219 | |
Broker Non-Votes | | | 22,720,089 | |
Total Fund Shares Voted | | | 86,778,774 | |
Total Fund Shares Outstanding* | | | 128,499,691 | |
Franklin Equity Income Fund
| | | | |
| | | Shares | |
| |
For | | | 32,960,417 | |
Against | | | 1,888,508 | |
Abstain | | | 2,270,074 | |
Broker Non-Votes | | | 8,279,951 | |
Total Fund Shares Voted | | | 45,398,950 | |
Total Fund Shares Outstanding* | | | 88,573,120 | |
Franklin Real Return Fund
| | | | |
| | | Shares | |
| |
For | | | 9,314,179 | |
Against | | | 637,451 | |
Abstain | | | 683,446 | |
Broker Non-Votes | | | 3,920,546 | |
Total Fund Shares Voted | | | 14,555,622 | |
Total Fund Shares Outstanding* | | | 23,154,340 | |
| | | | |
| | | |
| franklintempleton.com | | Annual Report | | 95 |
FRANKLIN INVESTORS SECURITIES TRUST
Board Members and Officers
The name, year of birth and address of the officers and board members, as well as their affiliations, positions held with the Trust, principal occupations during at least the past five years and number of U.S. registered portfolios overseen in the Franklin Templeton Investments fund complex, are shown below. Generally, each board member serves until that person’s successor is elected and qualified.
Independent Board Members
| | | | | | | | |
Name, Year of Birth and Address | | Position | | Length of Time Served | | Number of Portfolios in
Fund Complex Overseen
by Board Member* | | Other Directorships Held During at Least the Past 5 Years |
| | | | |
Harris J. Ashton (1932) One Franklin Parkway San Mateo, CA 94403-1906 | | Trustee | | Since 1986 | | 136 | | Bar-S Foods (meat packing company) (1981-2010). |
| | |
| Principal Occupation During at Least the Past 5 Years: | | | | |
Director of various companies; and formerly, Director, RBC Holdings, Inc. (bank holding company) (until 2002); and President, Chief Executive Officer and Chairman of the Board, General Host Corporation (nursery and craft centers) (until 1998). |
| | | | |
Terrence J. Checki (1945) One Franklin Parkway San Mateo, CA 94403-1906 | | Trustee | | Since December 2017 | | 112 | | Hess Corporation (exploration of oil and gas) (2014-present). |
| | |
| Principal Occupation During at Least the Past 5 Years: | | | | |
Member of the Council on Foreign Relations (1996-present); Member of the National Committee on U.S.-China Relations (1999-present);member of the Board of Trustees of the Economic Club of New York (2013 -present); member of the Board of Trustees of the Foreign Policy Association (2005-present) and member of various other boards of trustees and advisory boards; and formerly, Executive Vice President of the Federal Reserve Bank of New York and Head of its Emerging Markets and Internal Affairs Group and Member of Management Committee (1995-2014); and Visiting Fellow at the Council on Foreign Relations (2014). |
| | | | |
Mary C. Choksi (1950) One Franklin Parkway San Mateo, CA 94403-1906 | | Trustee | | Since 2014 | | 136 | | Avis Budget Group Inc. (car rental) (2007-present), Omnicom Group Inc. (advertising and marketing communications services) (2011-present) and White Mountains Insurance Group, Ltd. (holding company) (2017-present). |
| | |
| Principal Occupation During at Least the Past 5 Years: | | | | |
Director of various companies; and formerly, Founder and Senior Advisor, Strategic Investment Group (investment management group) (2015-2017); Founding Partner and Senior Managing Director, Strategic Investment Group (1987–2015); Founding Partner and Managing Director, Emerging Markets Management LLC (investment management firm) (1987-2011); and Loan Officer/Senior Loan Officer/Senior Pension Investment Officer, World Bank Group (international financial institution) (1977-1987). |
| | | | |
Edith E. Holiday (1952) One Franklin Parkway San Mateo, CA 94403-1906 | | Trustee | | Since 1998 | | 136 | | Hess Corporation (exploration of oil and gas) (1993-present), Canadian National Railway (railroad) (2001-present), White Mountains Insurance Group, Ltd. (holding company) (2004-present), Santander Consumer USA Holdings, Inc. (consumer finance) (2016-present), RTI International Metals, Inc. (manufacture and distribution of titanium) (1999-2015) and H.J. Heinz Company (processed foods and allied products) (1994-2013). |
| | |
| Principal Occupation During at Least the Past 5 Years: | | | | |
Director or Trustee of various companies and trusts; and formerly, Assistant to the President of the United States and Secretary of the Cabinet (1990-1993); General Counsel to the United States Treasury Department (1989-1990); and Counselor to the Secretary and Assistant Secretary for Public Affairs and Public Liaison-United States Treasury Department (1988-1989). |
| | | | |
J. Michael Luttig (1954) One Franklin Parkway San Mateo, CA 94403-1906 | | Trustee | | Since 2009 | | 136 | | Boeing Capital Corporation (aircraft financing) (2006-2013). |
| | |
| Principal Occupation During at Least the Past 5 Years: | | | | |
Executive Vice President, General Counsel and member of the Executive Council, The Boeing Company (aerospace company) (2006-present);and formerly, Federal Appeals Court Judge, U.S. Court of Appeals for the Fourth Circuit (1991-2006). |
| | | | |
| | | |
| 96 | | Annual Report | | franklintempleton.com |
FRANKLIN INVESTORS SECURITIES TRUST
Independent Board Members (continued)
| | | | | | | | |
Name, Year of Birth
and Address | | Position | | Length of Time Served | | Number of Portfolios in
Fund Complex Overseen
by Board Member* | | Other Directorships Held
During at Least the Past 5 Years |
| | | | |
Larry D. Thompson (1945) One Franklin Parkway San Mateo, CA 94403-1906 | | Trustee | | Since 2007 | | 136 | | The Southern Company (energy company) (2014-present; previously 2010-2012), Graham Holdings Company (education and media organization) (2011-present) and Cbeyond, Inc. (business communications provider) (2010-2012). |
| | |
| Principal Occupation During at Least the Past 5 Years: | | | | |
Director of various companies; Counsel, Finch McCranie, LLP (law firm) (2015-present); Independent Compliance Monitor and Auditor, Volkswagen AG (manufacturer of automobiles and commercial vehicles) (2017-present); John A. Sibley Professor of Corporate and Business Law, University of Georgia School of Law (2015-present; previously 2011-2012); and formerly, Executive Vice President - Government Affairs, General Counsel and Corporate Secretary, PepsiCo, Inc. (consumer products) (2012-2014); Senior Vice President - Government Affairs, General Counsel and Secretary, PepsiCo, Inc. (2004-2011); Senior Fellow of The Brookings Institution (2003-2004); Visiting Professor, University of Georgia School of Law (2004); and Deputy Attorney General, U.S. Department of Justice (2001-2003). |
| | | | |
John B. Wilson (1959) One Franklin Parkway San Mateo, CA 94403-1906 | | Lead Independent Trustee | | Trustee since 2007 and Lead Independent Trustee since 2008 | | 112 | | None |
| | |
| Principal Occupation During at Least the Past 5 Years: | | | | |
President and Founder, Hyannis Port Capital, Inc. (real estate and private equity investing) (2002-present); Senior Advisor, McKinsey & Co. (consulting) (2017-present); serves on private and non-profit boards; and formerly, President, Staples International and Head of Global Transformation (office supplies) (2012-2016); Chief Operating Officer and Executive Vice President, Gap, Inc. (retail) (1996-2000); Chief Financial Officer and Executive Vice President – Finance and Strategy, Staples, Inc. (1992-1996); Senior Vice President – Corporate Planning, Northwest Airlines, Inc. (airlines) (1990-1992); and Vice President and Partner, Bain & Company (consulting firm) (1986-1990). |
|
| Interested Board Members and Officers |
| | | | |
Name, Year of Birth
and Address | | Position | | Length of Time Served | | Number of Portfolios in
Fund Complex Overseen
by Board Member* | | Other Directorships Held During at Least the Past 5 Years |
| | | | |
**Gregory E. Johnson (1961) One Franklin Parkway San Mateo, CA 94403-1906 | | Trustee | | Since 2013 | | 150 | | None |
| | |
| Principal Occupation During at Least the Past 5 Years: | | | | |
Chairman of the Board, Member - Office of the Chairman, Director and Chief Executive Officer, Franklin Resources, Inc.; officer and/or director or trustee, as the case may be, of some of the other subsidiaries of Franklin Resources, Inc. and of 42 of the investment companies in Franklin Templeton Investments; Vice Chairman, Investment Company Institute; and formerly, President, Franklin Resources, Inc. (1994-2015). |
| | | | |
**Rupert H. Johnson, Jr. (1940) One Franklin Parkway San Mateo, CA 94403-1906 | | Chairman of the Board, Trustee and Vice President | | Chairman of the Board since 2013, Trustee since 1987 and Vice President since 1986 | | 136 | | None |
| | |
| Principal Occupation During at Least the Past 5 Years: | | | | |
Vice Chairman, Member - Office of the Chairman and Director, Franklin Resources, Inc.; Director, Franklin Advisers, Inc.; Senior Vice President, Franklin Advisory Services, LLC; and officer and/or director or trustee, as the case may be, of some of the other subsidiaries of Franklin Resources, Inc. and of 40 of the investment companies in Franklin Templeton Investments. |
| | | | |
| | | |
| franklintempleton.com | | Annual Report | | 97 |
FRANKLIN INVESTORS SECURITIES TRUST
Interested Board Members and Officers (continued)
| | | | | | | | |
Name, Year of Birth and Address | | Position | | Length of Time Served | | Number of Portfolios in
Fund Complex Overseen
by Board Member* | | Other Directorships Held
During at Least the Past 5 Years |
| | | | |
Alison E. Baur (1964) One Franklin Parkway San Mateo, CA 94403-1906 | | Vice President | | Since 2012 | | Not Applicable | | Not Applicable |
| | |
| Principal Occupation During at Least the Past 5 Years: | | | | |
Deputy General Counsel, Franklin Templeton Investments; and officer of some of the other subsidiaries of Franklin Resources, Inc. and of 44 of the investment companies in Franklin Templeton Investments. |
| | | | |
Mark Boyadjian (1964) One Franklin Parkway San Mateo, CA 94403-1906 | | Vice President | | Since 2003 | | Not Applicable | | Not Applicable |
| | |
| Principal Occupation During at Least the Past 5 Years: | | | | |
Senior Vice President, Franklin Advisers, Inc.; and officer of two of the investment companies in Franklin Templeton Investments. |
| | | | |
Gaston Gardey (1967) One Franklin Parkway San Mateo, CA 94403-1906 | | Chief Financial Officer, Chief Accounting Officer and Treasurer | | Since 2009 | | Not Applicable | | Not Applicable |
| | |
| Principal Occupation During at Least the Past 5 Years: | | | | |
Treasurer, U.S. Fund Administration & Reporting, Franklin Templeton Investments; and officer of 28 of the investment companies in Franklin Templeton Investments. |
| | | | |
Aliya S. Gordon (1973) One Franklin Parkway San Mateo, CA 94403-1906 | | Vice President | | Since 2009 | | Not Applicable | | Not Applicable |
| | |
| Principal Occupation During at Least the Past 5 Years: | | | | |
Senior Associate General Counsel, Franklin Templeton Investments; and officer of 44 of the investment companies in Franklin Templeton Investments. |
| | | | |
Steven J. Gray (1955) One Franklin Parkway San Mateo, CA 94403-1906 | | Vice President | | Since 2009 | | Not Applicable | | Not Applicable |
| | |
| Principal Occupation During at Least the Past 5 Years: | | | | |
Senior Associate General Counsel, Franklin Templeton Investments; Vice President, Franklin Templeton Distributors, Inc. and FASA, LLC; and officer of 44 of the investment companies in Franklin Templeton Investments. |
| | | | |
Matthew T. Hinkle (1971) One Franklin Parkway San Mateo, CA 94403-1906 | | Chief Executive Officer – Finance and Administration | | Since 2017 | | Not Applicable | | Not Applicable |
| | |
| Principal Occupation During at Least the Past 5 Years: | | | | |
Senior Vice President, Franklin Templeton Services, LLC; officer of 44 of the investment companies in Franklin Templeton Investments; and formerly, Vice President, Global Tax (2012-April 2017) and Treasurer/Assistant Treasurer, Franklin Templeton Investments (2009-2017). |
| | | | |
Edward B. Jamieson (1948) One Franklin Parkway San Mateo, CA 94403-1906 | | President and Chief Executive Officer – Investment Management | | Since 2002 | | Not Applicable | | Not Applicable |
| | |
| Principal Occupation During at Least the Past 5 Years: | | | | |
| President and Director, Franklin Advisers, Inc.; Executive Vice President, Franklin Templeton Institutional, LLC; and officer and/or trustee, as the case may be, of some of the other subsidiaries of Franklin Resources, Inc. and of 10 of the investment companies in Franklin Templeton Investments. |
| | | | |
| | | |
| 98 | | Annual Report | | franklintempleton.com |
FRANKLIN INVESTORS SECURITIES TRUST
Interested Board Members and Officers (continued)
| | | | | | | | |
Name, Year of Birth and Address | | Position | | Length of Time Served | | Number of Portfolios in
Fund Complex Overseen
by Board Member* | | Other Directorships Held
During at Least the Past 5 Years |
| | | | |
Madeline Lam (1969) One Franklin Parkway San Mateo, CA 94403-1906 | | Vice President | | Since 2010 | | Not Applicable | | Not Applicable |
| | |
| Principal Occupation During at Least the Past 5 Years: | | | | |
Vice President, Franklin Advisers, Inc.; and officer of two of the investment companies in Franklin Templeton Investments. |
| | | | |
Robert Lim (1948) One Franklin Parkway San Mateo, CA 94403-1906 | | Vice President – AML Compliance | | Since 2016 | | Not Applicable | | Not Applicable |
| | |
| Principal Occupation During at Least the Past 5 Years: | | | | |
Vice President, Franklin Templeton Companies, LLC; Chief Compliance Officer, Franklin Templeton Distributors, Inc. and Franklin Templeton Investor Services, LLC; and officer of 44 of the investment companies in Franklin Templeton Investments. |
| | | | |
Kimberly H. Novotny (1972) 300 S.E. 2nd Street Fort Lauderdale, FL 33301-1923 | | Vice President | | Since 2013 | | Not Applicable | | Not Applicable |
| | |
| Principal Occupation During at Least the Past 5 Years: | | | | |
Associate General Counsel, Franklin Templeton Investments; Vice President and Corporate Secretary, Fiduciary Trust International of the South; Vice President, Templeton Investment Counsel, LLC; Assistant Secretary, Franklin Resources, Inc.; and officer of 44 of the investment companies in Franklin Templeton Investments. |
| | | | |
Robert C. Rosselot (1960) 300 S.E. 2nd Street Fort Lauderdale, FL 33301-1923 | | Chief Compliance Officer | | Since 2013 | | Not Applicable | | Not Applicable |
| | |
| Principal Occupation During at Least the Past 5 Years: | | | | |
Director, Global Compliance, Franklin Templeton Investments; Vice President, Franklin Templeton Companies, LLC; officer of 44 of the investment companies in Franklin Templeton Investments; and formerly, Senior Associate General Counsel, Franklin Templeton Investments (2007-2013); and Secretary and Vice President, Templeton Group of Funds (2004-2013). |
| | | | |
Karen L. Skidmore (1952) One Franklin Parkway San Mateo, CA 94403-1906 | | Vice President and Secretary | | Since 2006 | | Not Applicable | | Not Applicable |
| | |
| Principal Occupation During at Least the Past 5 Years: | | | | |
Senior Associate General Counsel, Franklin Templeton Investments; and officer of 44 of the investment companies in Franklin Templeton Investments. |
| | | | |
Navid J. Tofigh (1972) One Franklin Parkway San Mateo, CA 94403-1906 | | Vice President | | Since 2015 | | Not Applicable | | Not Applicable |
| | |
| Principal Occupation During at Least the Past 5 Years: | | | | |
Associate General Counsel, Franklin Templeton Investments; and officer of 44 of the investment companies in Franklin Templeton Investments. |
| | | | |
Craig S. Tyle (1960) One Franklin Parkway San Mateo, CA 94403-1906 | | Vice President | | Since 2005 | | Not Applicable | | Not Applicable |
| | |
| Principal Occupation During at Least the Past 5 Years: | | | | |
General Counsel and Executive Vice President, Franklin Resources, Inc.; and officer of some of the other subsidiaries of Franklin Resources, Inc. and of 44 of the investment companies in Franklin Templeton Investments. |
| | | | |
| | | |
| franklintempleton.com | | Annual Report | | 99 |
FRANKLIN INVESTORS SECURITIES TRUST
Interested Board Members and Officers (continued)
| | | | | | | | |
Name, Year of Birth and Address | | Position | | Length of Time Served | | Number of Portfolios in
Fund Complex Overseen
by Board Member* | | Other Directorships Held
During at Least the Past 5 Years |
| | | | |
Lori A. Weber (1964) 300 S.E. 2nd Street Fort Lauderdale, FL 33301-1923 | | Vice President | | Since 2011 | | Not Applicable | | Not Applicable |
| | |
| Principal Occupation During at Least the Past 5 Years: | | | | |
Senior Associate General Counsel, Franklin Templeton Investments; Assistant Secretary, Franklin Resources, Inc.; Vice President and Secretary, Templeton Investment Counsel, LLC; and officer of 44 of the investment companies in Franklin Templeton Investments. |
*We base the number of portfolios on each separate series of the U.S. registered investment companies within the Franklin Templeton Investments fund complex. These portfolios have a common investment manager or affiliated investment managers.
**Gregory E. Johnson is considered to be an interested person of the Fund under the federal securities laws due to his position as an officer and director of Franklin Resources, Inc. (Resources), which is the parent company of the Fund’s investment manager and distributor. Rupert H. Johnson, Jr. is considered to be an interested person of the Fund under the federal securities laws due to his position as an officer and director and major shareholder of Resources.
Note 1: Rupert H. Johnson, Jr. is the uncle of Gregory E. Johnson.
Note 2: Officer information is current as of the date of this report. It is possible that after this date, information about officers may change.
The Sarbanes-Oxley Act of 2002 and Rules adopted by the Securities and Exchange Commission require the Fund to disclose whether the Fund’s Audit Committee includes at least one member who is an audit committee financial expert within the meaning of such Act and Rules. The Fund’s Board has determined that there is at least one such financial expert on the Audit Committee and has designated John B. Wilson as its audit committee financial expert. The Board believes that Mr. Wilson qualifies as such an expert in view of his extensive business background and experience, including service as chief financial officer of Staples, Inc. from 1992 to 1996. Mr. Wilson has been a Member and Chairman of the Fund’s Audit Committee since 2007. As a result of such background and experience, the Board believes that Mr. Wilson has acquired an understanding of generally accepted accounting principles and financial statements, the general application of such principles in connection with the accounting estimates, accruals and reserves, and analyzing and evaluating financial statements that present a breadth and level of complexity of accounting issues generally comparable to those of the Fund, as well as an understanding of internal controls and procedures for financial reporting and an understanding of audit committee functions. Mr. Wilson is an independent Board member as that term is defined under the relevant Securities and Exchange Commission Rules and Releases.
The Statement of Additional Information (SAI) includes additional information about the board members and is available, without charge, upon request. Shareholders may call (800) DIAL BEN/342-5236 to request the SAI.
| | | | |
| | | |
| 100 | | Annual Report | | franklintempleton.com |
FRANKLIN INVESTORS SECURITIES TRUST
Shareholder Information
Proxy Voting Policies and Procedures
The Trust’s investment manager has established Proxy Voting Policies and Procedures (Policies) that the Trust uses to determine how to vote proxies relating to portfolio securities. Shareholders may view the Trust’s complete Policies online at franklintempleton.com. Alternatively, shareholders may request copies of the Policies free of charge by calling the Proxy Group collect at (954) 527-7678 or by sending a written request to: Franklin Templeton Companies, LLC, 300 S.E. 2nd Street, Fort Lauderdale, FL 33301, Attention: Proxy Group. Copies of the Trust’s proxy voting records are also made available online at franklintempleton.com and posted on the U.S. Securities and Exchange Commission’s website at sec.gov and reflect the most recent 12-month period ended June 30.
Quarterly Statement of Investments
The Trust files a complete statement of investments with the U.S. Securities and Exchange Commission for the first and third quarters for each fiscal year on Form N-Q. Shareholders may view the filed Form N-Q by visiting the Commission’s website at sec.gov. The filed form may also be viewed and copied at the Commission’s Public Reference Room in Washington, DC. Information regarding the operations of the Public Reference Room may be obtained by calling (800) SEC-0330.
Householding of Reports and Prospectuses
You will receive each Fund’s financial reports every six months as well as an annual updated summary prospectus (prospectus available upon request). To reduce Fund expenses, we try to identify related shareholders in a household and send only one copy of the financial reports and summary prospectus. This process, called “householding,” will continue indefinitely unless you instruct us otherwise. If you prefer not to have these documents householded, please call us at (800) 632-2301. At any time you may view current prospectuses/summary prospectuses and financial reports on our website. If you choose, you may receive these documents through electronic delivery.
| | | | |
| | | |
| franklintempleton.com | | Annual Report | | 101 |
This page intentionally left blank.
This page intentionally left blank.
This page intentionally left blank.
| | |
 | | Annual Report and Shareholder Letter Franklin Investors Securities Trust Investment Manager Franklin Advisers, Inc. Distributor Franklin Templeton Distributors, Inc. (800) DIAL BEN® / 342-5236 franklintempleton.com Shareholder Services (800) 632-2301 |
Authorized for distribution only when accompanied or preceded by a summary prospectus and/or prospectus. Investors should carefully consider a fund’s investment goals, risks, charges and expenses before investing. A prospectus contains this and other information; please read it carefully before investing.
To help ensure we provide you with quality service, all calls to and from our service areas are monitored and/or recorded.
| | | | |
| © 2018 Franklin Templeton Investments. All rights reserved. | | | FIST1 A 12/18 | |

Franklin Templeton Investments
Successful investing begins with ambition. And achievement only comes when you reach for it. That’s why we continually strive to deliver better outcomes for investors. No matter what your goals are, our deep, global investment expertise allows us to offer solutions that can help.
During our more than 70 years of experience, we’ve managed through all kinds of markets—up, down and those in between. We’re always preparing for what may come next. It’s because of this, combined with our strength as one of the world’s largest asset managers that we’ve earned the trust of millions of investors around the world.
Dear Fellow Shareholder:
The 12 months ended October 31, 2018, benefited from mostly upbeat economic data as corporate earnings increased, the U.S. job market continued to improve and the unemployment rate declined.
Under new chairman Jerome Powell, the U.S. Federal Reserve (Fed) increased its federal funds rate by 0.25% three times in 2018, after a 0.25% increase in December 2017, bringing the rate from 1.25% to 2.25% by period-end. In September, the Fed cited business investment and household spending growth as more evidence of economic strength. The Fed noted inflation remained stable and longer-term inflation expectations had changed little. The 10-year U.S. Treasury yield began the period at 2.38% and ended the period at 3.15%.
In September 2018, the Standard & Poor’s 500® Index (S&P 500®) reached an all-time high, but experienced heightened volatility near period-end due to investor concerns about Fed interest-rate policies, higher U.S. Treasury yields, trade tensions, a potentially slower economy and some weaker-than-expected fourth-quarter 2018 revenue guidance. In this environment, U.S. securities, as measured by the S&P 500, increased 7.35%,1 representing a change in this total return index level from 5,002.03 to 5,369.49.2 Investment-grade bonds, as measured by the Bloomberg Barclays U.S. Aggregate
Bond Index, decreased 2.05%,1 representing a change in this total return index level from 2,039.64 to 1,997.76.3
We are committed to our long-term perspective and disciplined investment approach as we conduct a rigorous, fundamental analysis of securities with a regular emphasis on investment risk management.
We believe active, professional investment management serves investors well. We also recognize the important role of financial advisors in today’s markets and encourage investors to continue to seek their advice. Amid changing markets and economic conditions, we are confident investors with a well-diversified portfolio and a patient, long-term outlook should be well positioned for the years ahead.
Franklin Investors Securities Trust’s annual report, covering Franklin Adjustable U.S. Government Securities Fund, Franklin Floating Rate Daily Access Fund, Franklin Low Duration Total Return Fund and Franklin Total Return Fund, includes more detail about prevailing conditions and a discussion about investment decisions during the period. Please remember all securities markets fluctuate, as do mutual fund share prices.
1. Source: Morningstar.
2. Source: Copyright © 2018, S&P Dow Jones Indices LLC. All rights reserved. The index levels for the S&P 500 shown above are based on total returns, which include reinvestment of any income or distributions.
3. Source: Bloomberg Barclays Indices. The index levels for the Bloomberg Barclays U.S. Aggregate Bond Index shown above are based on total returns, which include reinvestment of any income or distributions.
The indexes are unmanaged and include reinvestment of any income or distributions.
See www.franklintempletondatasources.com for additional data provider information.
| | | | | | | | |
| | | | Not FDIC Insured | | | May Lose Value | | | No Bank Guarantee |
| | | | | | |
| | | |
franklintempleton.com | | Not part of the annual report | | | 1 | |
We thank you for investing with Franklin Templeton, welcome your questions and comments, and look forward to serving your future investment needs.
Sincerely,
Rupert H. Johnson, Jr.
Chairman
Franklin Investors Securities Trust
This letter reflects our analysis and opinions as of October 31, 2018, unless otherwise indicated. The information is not a complete analysis of every aspect of any market, country, industry, security or fund. Statements of fact are from sources considered reliable.
Contents
Visit franklintempleton.com for fund updates, to access your account, or to find helpful financial planning tools.
| | | | |
| | | |
| 2 | | Not part of the annual report | | franklintempleton.com |
Annual Report
Economic and Market Overview
The U.S. economy grew during the 12 months under review. The economy grew faster in 2018’s second quarter, driven by consumer spending, business investment, exports and government spending, but moderated in the third quarter due to declines in exports and housing investment. The manufacturing and services sectors expanded during the period. The unemployment rate declined from 4.1% in October 2017, as reported at the beginning of the 12-month period, to a nearly 49-year low of 3.7% at period-end.1 Annual inflation, as measured by the Consumer Price Index, increased from 2.0% in October 2017, as reported at the beginning of the period, to 2.5% at period-end.1
The U.S. Federal Reserve (Fed) raised its target range for the federal funds rate 0.25% at its December 2017 meeting and continued to reduce its balance sheet as part of its ongoing plan to normalize monetary policy. In his congressional testimonies in February and July 2018, as well as at the Fed symposium in August, Fed Chair Jerome Powell reiterated the Fed’s intention to gradually raise interest rates. As widely expected, the Fed further raised its target range for the federal funds rate 0.25% each at its March, June and September 2018 meetings, to 2.00%–2.25%. At its September meeting, the Fed raised its forecast for U.S. economic growth in 2018 and 2019 and projected one more rate increase in 2018. Minutes from the Fed’s September meeting (released in October) indicated that a few officials expected monetary policy to become modestly restrictive of economic growth, while some officials seemed to favor increasing the federal funds rate temporarily above what they consider to be its longer-term level to reduce the risk of overshooting the Fed’s inflation objective. In contrast, some officials indicated they would not favor a restrictive policy unless they see clear signs of an overheating economy and rising inflation.
The 10-year Treasury yield, which moves inversely to its price, increased during the period. The yield rose amid the passage of the tax reform bill in December 2017. Moreover, investor concerns about higher inflation and the Fed’s interest-rate path drove the yield to multi-year highs in February, April, May and October 2018. Expectations that other central banks might scale back monetary stimulus and better-than-expected U.S. economic reports also pushed the yield higher. However, some factors weighed on the Treasury yield at certain points during the period, including concerns about political turmoil in Italy, political uncertainties in the U.S., tensions between the U.S. and North Korea, the Trump administration’s protectionist trade policies, U.S. trade disputes with its allies and China, and economic turmoil in Turkey and Argentina. Overall, the 10-year Treasury yield rose from 2.38% at the beginning of the period to 3.15% at period-end.
The foregoing information reflects our analysis and opinions as of October 31, 2018. The information is not a complete analysis of every aspect of any market, country, industry, security or fund. Statements of fact are from sources considered reliable.
1. Source: Bureau of Labor Statistics.
| | | | |
| | | |
franklintempleton.com | | Annual Report | | 3 |
Franklin Adjustable U.S. Government Securities Fund
We are pleased to bring you Franklin Adjustable U.S. Government Securities Fund’s annual report for the fiscal year ended October 31, 2018.
Your Fund’s Goal and Main Investments
The Fund seeks to provide a high level of current income while providing lower volatility of principal than a fund that invests in fixed-rate securities by investing at least 80% of its net assets in adjustable-rate U.S. government mortgage securities, which are issued or guaranteed by the U.S. government, its agencies or instrumentalities.1 The Fund’s investments may include securities issued by Ginnie Mae (GNMA) and government-sponsored entities, such as Fannie Mae (FNMA) and Freddie Mac (FHLMC).2
Performance Overview
The Fund’s Class A shares posted a +0.65% cumulative total return for the 12 months under review. In comparison, the Fund’s benchmark, the Bloomberg Barclays U.S. Government Index: 1-2 Year Component, posted a +0.63% total return.3 The index measures public obligations of the U.S. Treasury with one to two years to final maturity and publicly issued debt of U.S. government agencies, quasi-federal corporations, and corporate or foreign debt guaranteed by the U.S. government. You can find the Fund’s long-term performance data in the Performance Summary beginning on page 6.
Performance data represent past performance, which does not guarantee future results. Investment return and principal value will fluctuate, and you may have a gain or loss when you sell your shares. Current performance may differ from figures shown. For most recent month-end performance, go to franklintempleton.com or call (800) 342-5236.
Investment Strategy
We employ a conservative investment strategy as we strive to produce solid performance in a variety of interest rate climates. We choose securities using a value-oriented approach, emphasizing the bonds’ economic fundamentals in relation to
Portfolio Composition
Based on Total Net Assets as of 10/31/18
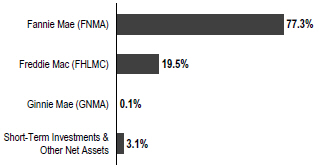
comparable securities as well as their historical prepayment performance.
Manager’s Discussion
The Fund employed a conservative strategy that invested primarily in adjustable-rate mortgage securities (ARMs) that are either explicitly or implicitly backed by the US government.1 During the period, the Fund invested predominantly in securities issued or guaranteed by FNMA and FHLMC. The Fund took a collateral-intensive research approach to analyze the prepayment behavior of individual ARMs to identify those with the most attractive prepayment profiles and focused on seasoned ARMs. Such securities have typically been through several interest-rate cycles and therefore tend to be less sensitive to changes in interest rates, compared to newer issued counterparts. We have found such securities historically to have experienced lower volatility than comparable maturity Treasuries and have provided more consistent income.
Over the period, we continued to focus on diverse, seasoned, post-reset FNMA and FHLMC ARMs with average coupons above 3% with larger loan counts and are well seasoned. With a shift toward a flatter yield curve this year, prepayments remained elevated, and we are cautious going forward. We do believe that with borrowers having been through a full year of mortgages resetting upward, a burnout effect could offset some of the refinance incentive which would help lower prepayment
1. Securities owned by the Fund, but not shares of the Fund, are issued or guaranteed by the U.S. government, its agencies or instrumentalities, including government-sponsored entities, as to timely payment of principal and interest.
2. Although U.S. government-sponsored entities may be chartered by acts of Congress, their securities are neither issued nor guaranteed by the U.S. Government. Please see the Fund’s prospectus for a detailed discussion regarding various levels of credit support for government agency or instrumentality securities. The Fund’s yield and share price are not guaranteed and will vary with market conditions.
3. Source: Morningstar.
The index is unmanaged and includes reinvestment of any income or distributions. It does not reflect any fees, expenses or sales charges. One cannot invest directly in an index, and an index is not representative of the Fund’s portfolio.
The dollar value, number of shares or principal amount, and names of all portfolio holdings are listed in the Fund’s Statement of Investments (SOI).
The SOI begins on page 37.
| | | | |
| | | |
4 | | Annual Report | | franklintempleton.com |
FRANKLIN ADJUSTABLE U.S. GOVERNMENT SECURITIES FUND
Dividend Distributions*
11/1/17–10/31/18
| | | | | | | | | | | | | | | | | | | | |
| | | Dividend per Share (cents) | |
| | | | |
Month | | Class A | | | Class A1 | | | Class C | | | Class R6 | | | Advisor
Class | |
November | | | 1.4899 | | | | 1.5998 | | | | 1.2256 | | | | 1.7092 | | | | 1.6640 | |
December | | | 1.3591 | | | | 1.4585 | | | | 1.0946 | | | | 1.5904 | | | | 1.5222 | |
January | | | 1.6155 | | | | 1.7311 | | | | 1.3181 | | | | 1.8465 | | | | 1.8035 | |
February | | | 1.5280 | | | | 1.6247 | | | | 1.2747 | | | | 1.7639 | | | | 1.6862 | |
March | | | 1.3929 | | | | 1.4950 | | | | 1.1332 | | | | 1.6403 | | | | 1.5561 | |
April | | | 1.6415 | | | | 1.7528 | | | | 1.3542 | | | | 1.9156 | | | | 1.8227 | |
May | | | 1.5564 | | | | 1.6628 | | | | 1.2773 | | | | 1.8132 | | | | 1.7310 | |
June | | | 1.5932 | | | | 1.6907 | | | | 1.3346 | | | | 1.8395 | | | | 1.7568 | |
July | | | 1.7037 | | | | 1.8151 | | | | 1.4177 | | | | 1.9797 | | | | 1.8849 | |
August | | | 1.6862 | | | | 1.7941 | | | | 1.4090 | | | | 1.9589 | | | | 1.8610 | |
September | | | 1.7229 | | | | 1.8191 | | | | 1.4738 | | | | 1.9699 | | | | 1.8803 | |
October | | | 2.0056 | | | | 2.1180 | | | | 1.7115 | | | | 2.3355 | | | | 2.1916 | |
Total | | | 19.2949 | | | | 20.5617 | | | | 16.0243 | | | | 22.3626 | | | | 21.3603 | |
*The distribution amount is the sum of all net investment income distributions for the period shown. Assumes shares were purchased and held for the entire accrual period. Since dividends accrue daily, your actual distributions will vary depending on the date you purchased your shares and any account activity. All Fund distributions will vary depending upon current market conditions, and past distributions are not indicative of future trends.
rates over the short to medium term. Hence we have been favoring those ARMs, linked to the London Interbank Offered Rate (LIBOR) index, which should demonstrate a better prepayment profile relative to constant maturity treasury index ARMs. The Fund’s LIBOR indexed ARMs were the most significant to performance, while ARMs indexed to US Treasuries were also additive.4 We have found such securities historically to have experienced lower volatility than comparable maturity Treasuries and have provided more consistent income.
Thank you for your continued participation in Franklin Adjustable U.S. Government Securities Fund. We look forward to serving your future investment needs.
| | |
 | | 
Paul Varunok |
| | |
 | | 
Roger A. Bayston, CFA |
| |
| | Portfolio Management Team |
The foregoing information reflects our analysis, opinions and portfolio holdings as of October 31, 2018, the end of the reporting period. The way we implement our main investment strategies and the resulting portfolio holdings may change depending on factors such as market and economic conditions. These opinions may not be relied upon as investment advice or an offer for a particular security. The information is not a complete analysis of every aspect of any market, country, industry, security or the Fund. Statements of fact are from sources considered reliable, but the investment manager makes no representation or warranty as to their completeness or accuracy. Although historical performance is no guarantee of future results, these insights may help you understand our investment management philosophy.
CFA® is a trademark owned by CFA Institute.
4. The London Interbank Offered Rate (LIBOR) is the interest rate banks charge each other for loans. LIBOR is a widely used benchmark for short-term interest rates.
See www.franklintempletondatasources.com for additional data provider information.
| | | | |
| | | |
franklintempleton.com | | Annual Report | | 5 |
FRANKLIN ADJUSTABLE U.S. GOVERNMENT SECURITIES FUND
Performance Summary as of October 31, 2018
The performance tables and graphs do not reflect any taxes that a shareholder would pay on Fund dividends, capital gain distributions, if any, or any realized gains on the sale of Fund shares. Total return reflects reinvestment of the Fund’s dividends and capital gain distributions, if any, and any unrealized gains or losses. Your dividend income will vary depending on dividends or interest paid by securities in the Fund’s portfolio, adjusted for operating expenses of each class. Capital gain distributions are net profits realized from the sale of portfolio securities.
Performance as of 10/31/181
Cumulative total return excludes sales charges. Average annual total return includes maximum sales charges. Sales charges will vary depending on the size of the investment and the class of share purchased. The maximum is 2.25% and the minimum is 0%. Class A: 2.25% maximum initial sales charge; Advisor Class: no sales charges. For other share classes, visit franklintempleton.com.
| | | | |
| Share Class | | Cumulative Total Return2 | | Average Annual Total Return3 |
| | |
A | | | | |
1-Year | | +0.65% | | -1.62% |
5-Year | | +0.59% | | -0.34% |
10-Year | | +10.04% | | +0.74% |
| | |
Advisor | | | | |
1-Year | | +0.78% | | +0.78% |
5-Year | | +1.73% | | +0.34% |
10-Year | | +12.70% | | +1.20% |
| | | | | | | | |
| | | Distribution Rate4 | | 30-Day Standardized Yield5 |
| Share Class | | (with waiver) | | | (without waiver) |
| | | |
A | | 2.61% | | | 1.44% | | | 1.43% |
Advisor | | 2.92% | | | 1.73% | | | 1.72% |
Performance data represent past performance, which does not guarantee future results. Investment return and principal value will fluctuate, and you may have a gain or loss when you sell your shares. Current performance may differ from figures shown. For most recent month-end performance, go to franklintempleton.com or call (800) 342-5236.
See page 8 for Performance Summary footnotes.
| | | | |
| | | |
6 | | Annual Report | | franklintempleton.com |
FRANKLIN ADJUSTABLE U.S. GOVERNMENT SECURITIES FUND
PERFORMANCE SUMMARY
Total Return Index Comparison for a Hypothetical $10,000 Investment1
Total return represents the change in value of an investment over the periods shown. It includes any applicable maximum sales charge, Fund expenses, account fees and reinvested distributions. The unmanaged index includes reinvestment of any income or distributions. It differs from the Fund in composition and does not pay management fees or expenses. One cannot invest directly in an index.
Class A (11/1/08–10/31/18)
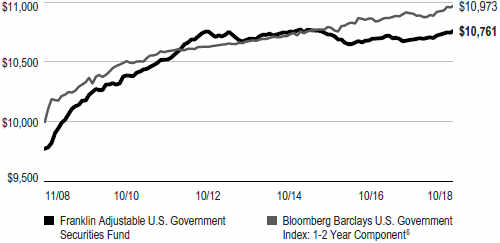
Advisor Class (11/1/08–10/31/18)
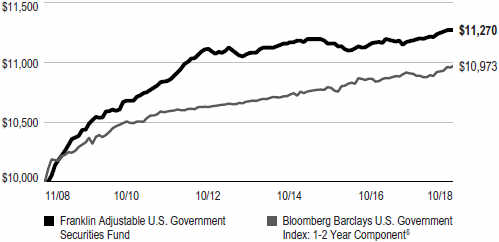
See page 8 for Performance Summary footnotes.
| | | | |
| | | |
franklintempleton.com | | Annual Report | | 7 |
FRANKLIN ADJUSTABLE U.S. GOVERNMENT SECURITIES FUND
PERFORMANCE SUMMARY
Distributions (11/1/17–10/31/18)
| | | | |
| Share Class | | Net Investment
Income | |
A | | | $0.192949 | |
A1 | | | $0.205617 | |
C | | | $0.160243 | |
R6 | | | $0.223626 | |
Advisor | | | $0.213603 | |
Total Annual Operating Expenses7
| | | | | | | | |
| Share Class | | With Waiver | | | Without Waiver | |
A | | | 0.93% | | | | 0.94% | |
Advisor | | | 0.68% | | | | 0.69% | |
Each class of shares is available to certain eligible investors and has different annual fees and expenses, as described in the prospectus.
All investments involve risks, including possible loss of principal. Interest rate movements, unscheduled mortgage prepayments and other risk factors will affect the Fund’s share price and yield. Bond prices generally move in the opposite direction of interest rates. As prices of bonds in the Fund adjust to a rise in interest rates, the Fund’s share price may decline. Changes in the financial strength of a bond issuer or in a bond’s credit rating may affect its value. The Fund is actively managed but there is no guarantee that the manager’s investment decisions will produce the desired results. The Fund’s prospectus also includes a description of the main investment risks.
1. The Fund has a fee waiver associated with any investment it makes in a Franklin Templeton money fund and/or other Franklin Templeton fund, contractually guaranteed through 2/28/19. Fund investment results reflect the fee waiver; without this waiver, the results would have been lower.
2. Cumulative total return represents the change in value of an investment over the periods indicated.
3. Average annual total return represents the average annual change in value of an investment over the periods indicated. Return for less than one year, if any, has not been annualized.
4. Distribution rate is based on an annualization of the sum of the respective class’s past 30 days’ daily distributions and the maximum offering price (NAV for Advisor Class) per share on 10/31/18.
5. The Fund’s 30-day standardized yield is calculated over a trailing 30-day period using the yield to maturity on bonds and/or the dividends accrued on stocks. It may not equal the Fund’s actual income distribution rate, which reflects the Fund’s past dividends paid to shareholders.
6. Source: Morningstar. The Bloomberg Barclays U.S. Government Index: 1-2 Year Component includes public obligations of the U.S. Treasury with at least one year up to, but not including, two years to final maturity and publicly issued debt of U.S. government agencies, quasi-federal corporations, and corporate or foreign debt guaranteed by the U.S. government.
7. Figures are as stated in the Fund’s current prospectus and may differ from the expense ratios disclosed in the Your Fund’s Expenses and Financial Highlights sections in this report. In periods of market volatility, assets may decline significantly, causing total annual Fund operating expenses to become higher than the figures shown.
See www.franklintempletondatasources.com for additional data provider information.
| | | | |
| | | |
8 | | Annual Report | | franklintempleton.com |
FRANKLIN ADJUSTABLE U.S. GOVERNMENT SECURITIES FUND
Your Fund’s Expenses
As a Fund shareholder, you can incur two types of costs: (1) transaction costs, including sales charges (loads) on Fund purchases and redemptions; and (2) ongoing Fund costs, including management fees, distribution and service (12b-1) fees, and other Fund expenses. All mutual funds have ongoing costs, sometimes referred to as operating expenses. The table below shows ongoing costs of investing in the Fund and can help you understand these costs and compare them with those of other mutual funds. The table assumes a $1,000 investment held for the six months indicated.
Actual Fund Expenses
The table below provides information about actual account values and actual expenses in the columns under the heading “Actual.” In these columns the Fund’s actual return, which includes the effect of Fund expenses, is used to calculate the “Ending Account Value” for each class of shares. You can estimate the expenses you paid during the period by following these steps (of course, your account value and expenses will differ from those in this illustration): Divide your account value by $1,000 (if your account had an $8,600 value, then $8,600 ÷ $1,000 = 8.6). Then multiply the result by the number in the row for your class of shares under the headings “Actual” and “Expenses Paid During Period” (if Actual Expenses Paid During Period were $7.50, then 8.6 x $7.50 = $64.50). In this illustration, the actual expenses paid this period are $64.50.
Hypothetical Example for Comparison with Other Funds
Under the heading “Hypothetical” in the table, information is provided about hypothetical account values and hypothetical expenses based on the Fund’s actual expense ratio and an assumed rate of return of 5% per year before expenses, which is not the Fund’s actual return. This information may not be used to estimate the actual ending account balance or expenses you paid for the period, but it can help you compare ongoing costs of investing in the Fund with those of other funds. To do so, compare this 5% hypothetical example for the class of shares you hold with the 5% hypothetical examples that appear in the shareholder reports of other funds.
Please note that expenses shown in the table are meant to highlight ongoing costs and do not reflect any transactional costs. Therefore, information under the heading “Hypothetical” is useful in comparing ongoing costs only, and will not help you compare total costs of owning different funds. In addition, if transactional costs were included, your total costs would have been higher.
| | | | | | | | | | | | | | | | | | |
| | | | | | | Actual (actual return after expenses) | | | | Hypothetical (5% annual return before expenses) | | | | |
Share Class | | Beginning
Account
Value 5/1/18 | | | | Ending
Account
Value 10/31/18 | | Expenses
Paid During
Period
5/1/18–10/31/181,2 | | | | Ending
Account
Value 10/31/18 | | Expenses
Paid During
Period
5/1/18–10/31/181,2 | | | | Net Annualized
Expense Ratio2 |
A | | $1,000 | | | | $1,005.20 | | $4.80 | | | | $1,020.42 | | $4.84 | | | | 0.95% |
A1 | | $1,000 | | | | $1,004.80 | | $4.04 | | | | $1,021.17 | | $4.08 | | | | 0.80% |
C | | $1,000 | | | | $1,002.00 | | $6.81 | | | | $1,018.40 | | $6.87 | | | | 1.35% |
R6 | | $1,000 | | | | $1,006.00 | | $2.78 | | | | $1,022.43 | | $2.80 | | | | 0.55% |
Advisor | | $1,000 | | | | $1,005.30 | | $3.54 | | | | $1,021.68 | | $3.57 | | | | 0.70% |
1. Expenses are equal to the annualized expense ratio for the six-month period as indicated above—in the far right column—multiplied by the simple average account value over the period indicated, and then multiplied by 184/365 to reflect the one-half year period.
| 2. | Reflects expenses after fee waivers and expense reimbursements. Does not include acquired fund fees and expenses. |
| | | | | | |
| franklintempleton.com | | Annual Report | | | 9 | |
Franklin Floating Rate Daily Access Fund
This annual report for Franklin Floating Rate Daily Access Fund covers the fiscal year ended October 31, 2018.
Your Fund’s Goal and Main Investments
The Fund seeks to provide a high level of current income and, secondarily, preservation of capital by investing at least 80% of its net assets in income-producing floating interest-rate corporate loans and corporate debt securities made to or issued by U.S. companies, non-U.S. entities and U.S. subsidiaries of non-U.S. entities.
| | |
What are corporate loans? Corporate loans are typically floating rate loans to corporate borrowers made by a group, or syndicate, of banks and other financial institutions. These loans provide capital to companies for varied purposes, such as merger and acquisition activity, leveraged buyouts or refinancings. These loans are typically syndicated to a group of investors. | | |
Performance Overview
The Fund’s Class A shares delivered a +2.97% cumulative total return for the 12 months under review. In comparison, the Credit Suisse Leveraged Loan Index (CS LLI), which is designed to mirror the investable universe of the U.S. dollar-denominated leveraged loan market, posted a +4.89% total return.1 You can find more of the Fund’s performance data in the Performance Summary beginning on page 14.
Performance data represent past performance, which does not guarantee future results. Investment return and principal value will fluctuate, and you may have a gain or loss when you sell your shares. Current performance may differ from figures shown. For most recent month-end performance, go to franklintempleton.com or call (800) 342-5236.
Corporate Loan Market Overview
Technical conditions were relatively more balanced during the period under review as an increase in issuance helped to offset healthy demand. Moderate inflows into loan retail vehicles combined with strong collateralized-loan-obligation (CLO) issuance provided strong support for loan prices. Although continued refinancing activity and more primary deals helped weaken principal returns, rising London Interbank Offered
Portfolio Composition*
Based on Total Net Assets as of 10/31/18
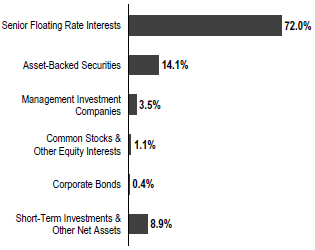
*Figures reflect certain derivatives held in the portfolio (or their underlying reference assets) and may not total 100% or may be negative due to rounding, use of derivatives, unsettled trades or other factors.
Rates (LIBOR) helped to increase income generation and offset the principal declines.
Higher U.S. Treasury yields and rising LIBOR spurred moderate flows into loan retail vehicles as more investors looked for lower duration assets. After the Federal Reserve hiked rates multiple times during the period and expectations for further hikes improved, interest from retail investors returned to the asset class. However, tight valuations and concerns surrounding credit risk helped to restrain investor interest compared to previous periods of inflows.
Although retail investor demand was moderate, CLO issuance continued at a strong pace as demand for floating-rate investments continued. As a result, liability spreads for the highest-rated tranches reached the tightest levels for vehicles launched after the financial crisis. However, spreads widened slightly toward the end of the period due to heavy issuance, challenging the arbitrage between liability and loan spreads and slowing new vehicles. Despite the moderate deceleration, CLO volumes in 2018 still managed to outpace previous years, due in part to a record number of managers issuing at least one new vehicle during the period.
1. Source: Credit Suisse Group.
The index is unmanaged and includes reinvestment of any income or distributions. It does not reflect any fees, expenses or sales charges. One cannot invest directly in an index, and an index is not representative of the Fund’s portfolio.
See www.franklintempletondatasources.com for additional data provider information.
The dollar value, number of shares or principal amount, and names of all portfolio holdings are listed in the Fund’s Statement of Investments (SOI).
The SOI begins on page 44.
| | | | |
| | | |
10 | | Annual Report | | franklintempleton.com |
FRANKLIN FLOATING RATE DAILY ACCESS FUND
New issuance in the loan market also increased, as more transactions related to mergers and acquisitions launched in the primary market. The increase in issuance helped to balance technical conditions and restrain extensive repricing activity, which had comprised a larger portion of primary market activity in the previous year. Net new issuance helped to push the institutional loan mark above $1 trillion outstanding, but new supply was concentrated disproportionately among B rated loans, while covenants and investor protections remained weaker.
Dividend Distributions*
11/1/17–10/31/18
| | | | | | | | | | | | | | | | |
| | | Dividend per Share (cents) | |
| | | | | | | | | | | | Advisor | |
| Month | | Class A | | | Class C | | | Class R6 | | | Class | |
November | | | 2.8700 | | | | 2.5832 | | | | 3.1035 | | | | 3.0503 | |
December | | | 3.3147 | | | | 3.0358 | | | | 3.5330 | | | | 3.4910 | |
January | | | 3.5520 | | | | 3.2346 | | | | 3.8085 | | | | 3.7534 | |
February | | | 3.0628 | | | | 2.8043 | | | | 3.2795 | | | | 3.2297 | |
March | | | 3.2845 | | | | 3.0036 | | | | 3.5110 | | | | 3.4574 | |
April | | | 3.8443 | | | | 3.5375 | | | | 4.1029 | | | | 4.0387 | |
May | | | 3.3824 | | | | 3.0851 | | | | 3.6413 | | | | 3.5714 | |
June | | | 3.0761 | | | | 2.8000 | | | | 3.3072 | | | | 3.2510 | |
July | | | 3.6111 | | | | 3.3054 | | | | 3.8671 | | | | 3.8035 | |
August | | | 3.2915 | | | | 2.9954 | | | | 3.5461 | | | | 3.4786 | |
September | | | 2.9008 | | | | 2.6336 | | | | 3.1293 | | | | 3.0690 | |
October | | | 3.5524 | | | | 3.2374 | | | | 3.8266 | | | | 3.7542 | |
| Total | | 39.7426 | | | 36.2559 | | | 42.6560 | | | 41.9482 | |
*The distribution amount is the sum of all net investment income distributions for the period shown. Assumes shares were purchased and held for the entire accrual period. Since dividends accrue daily, your actual distributions will vary depending on the date you purchased your shares and any account activity. All Fund distributions will vary depending upon current market conditions, and past distributions are not indicative of future trends.
The default rate increased to the highest level since 2015 during the period, following the widely expected default of a large broadcasting issuer. Although the rate declined from its highpoint as more issuers rolled off the calculation, the one-year default rate ended the period higher. Average first-lien debt leverage was also at a record high as more issuers came to the market launching only loans, rather than both loans and bonds, which diminished subordinated debt cushion for senior loan investors.
In anticipation of potential future volatility, we have maintained our overweighting in loans rated in the upper tier, which we would expect to outperform. Furthermore, we have increased portions of our portfolio with greater liquidity in terms of settlement, including CLO and open-end fund investments, which we could potentially sell in a period of
elevated redemptions, but could also provide relatively attractive credit exposure in low volatility periods. Although issuance has increased and resulted in many repricing transactions being curtailed, issuers have still been able to put forth looser loan documentation. Recent loan credit agreements have increasingly permitted issuers to change the reference rate from the LIBOR without lender approval, which has led us to not participate in many primary transactions, while maintaining relatively stronger lender protections among the loans within our portfolio.
Investment Strategy
We use a detailed credit analysis process to select corporate loan and corporate debt securities that meet our criteria. We conduct ongoing credit monitoring of our investments. To help manage the credit risk associated with investing in securities rated below investment grade (or if unrated, of comparable quality), we seek to diversify the Fund by investing in a large number of loans of companies that we have identified as having attractive risk/reward profiles, favorable capital structures, strong asset coverage and dominant market shares. This diversification potentially reduces credit risk by spreading assets across many different industries.
In addition, we seek to exploit market inefficiencies by assigning forward-looking credit-risk tiers to issuers based upon our forward-looking analysis of the issuers’ prospects in the near term. This independent analysis enables us to express differences between backward-looking rating assignments of credit-risk tiers and our analysts’ forward-looking assessment of credit risk, thereby allowing us to potentially take advantage of credit risks the market may be overstating or avoid uncompensated credit risks the market may not have adequately identified.
Manager’s Discussion
During the year under review, the Fund underperformed its benchmark, the CS LLI. The Fund maintained an overweighting in the upper tier of the market throughout the period, which detracted from performance as upper tier loans in the index returned 3.89%, middle tier returned 4.99%, and lower tier returned 8.99%, according to the CS LLI.1
The top contributors to performance included issuers that had previously experienced volatility or where we had built relatively large positions and through proactive engagement, were able to execute transactions that contributed to returns. The term loan of Ascena Retail Group, a specialty retailer with multiple core brands traded higher after the company reported better-than-expected earnings and the loan attracted demand
| | | | |
| | | |
| franklintempleton.com | | Annual Report | | 11 |
FRANKLIN FLOATING RATE DAILY ACCESS FUND
Top 10 Holdings
10/31/18
| | | | |
Company Sector/Industry | | % of Total
Net Assets | |
Fieldwood Energy LLC Oil & Gas Exploration & Production | | | 3.8 | % |
General Nutrition Centers Inc. Specialty Stores | | | 2.2 | % |
Ascena Retail Group Inc. Apparel Retail | | | 2.2 | % |
NRG Energy Inc. Independent Power Producers & Energy Traders | | | 1.8 | % |
Navistar Inc. Industrial Machinery | | | 1.7 | % |
JBS USA LUX SA Packaged Foods & Meats | | | 1.7 | % |
Delos Finance S.A.R.L. (AerCap) (Luxembourg) Aerospace & Defense | | | 1.6 | % |
Foresight Energy LLC Coal & Consumable Fuels | | | 1.5 | % |
Appvion Inc Forest Products | | | 1.5 | % |
Zayo Group LLC Integrated Telecommunication Services | | | 1.4 | % |
from CLOs due to its relatively higher spread and ratings. Fieldwood Energy, a provider of oil and gas, contributed to performance after the company completed a restructuring plan and the exit term loan also increased spread. However, the top detractors within our loan portfolio included issuers that had also emerged from bankruptcy. Remington Outdoor (a manufacturer of firearms and ammunition) detracted from performance after the company filed for bankruptcy due to weaker sales. Appvion, a paper products manufacturer, also filed for bankruptcy and detracted from performance as the company faced price declines in its products due to competition and higher costs for a key raw material.
The Fund maintained a significant overweighting in higher-rated loans, while also adding to positions in AAA to A rated CLO tranches. Other positions included two open-end funds, Franklin Middle Tier Floating Rate Fund and Franklin Lower Tier Floating Rate Fund. The investments allowed the Fund to have further exposure to credit, while providing a potential source of liquidity. The Fund also held protection in HYCDX, an index of high-yield bond credit default swaps providing synthetic exposure to the high-yield bond market, to protect against volatility in the credit markets.
CFA® is a trademark owned by CFA Institute.
Thank you for your continued participation in Franklin Floating Rate Daily Access Fund. We look forward to serving your future investment needs.
| | |
 | | 
Mark Boyadjian, CFA |
| | |
 | | 
Madeline Lam |
| |
| | Justin Ma, CFA |
| |
| | Portfolio Management Team |
| | | | |
| | | |
| 12 | | Annual Report | | franklintempleton.com |
FRANKLIN FLOATING RATE DAILY ACCESS FUND
The foregoing information reflects our analysis, opinions and portfolio holdings as of October 31, 2018, the end of the reporting period. The way we implement our main investment strategies and the resulting portfolio holdings may change depending on factors such as market and economic conditions. These opinions may not be relied upon as investment advice or an offer for a particular security. The information is not a complete analysis of every aspect of any market, country, industry, security or the Fund. Statements of fact are from sources considered reliable, but the investment manager makes no representation or warranty as to their completeness or accuracy. Although historical performance is no guarantee of future results, these insights may help you understand our investment management philosophy.
| | | | | | |
| | | |
| franklintempleton.com | | Annual Report | | | 13 | |
FRANKLIN FLOATING RATE DAILY ACCESS FUND
Performance Summary as of October 31, 2018
The performance tables and graphs do not reflect any taxes that a shareholder would pay on Fund dividends, capital gain distributions, if any, or any realized gains on the sale of Fund shares. Total return reflects reinvestment of the Fund’s dividends and capital gain distributions, if any, and any unrealized gains or losses. Your dividend income will vary depending on dividends or interest paid by securities in the Fund’s portfolio, adjusted for operating expenses of each class. Capital gain distributions are net profits realized from the sale of portfolio securities.
Performance as of 10/31/181
Cumulative total return excludes sales charges. Average annual total return includes maximum sales charges. Sales charges will vary depending on the size of the investment and the class of share purchased. The maximum is 2.25% and the minimum is 0%. Class A: 2.25% maximum initial sales charge; Advisor Class: no sales charges. For other share classes, visit franklintempleton.com.
| | | | |
Share Class | | Cumulative Total Return2 | | Average Annual Total Return3 |
| | |
A | | | | |
1-Year | | +2.97% | | +0.70% |
5-Year | | +16.45% | | +2.63% |
10-Year | | +71.76% | | +5.31% |
| | |
Advisor | | | | |
1-Year | | +3.35% | | +3.35% |
5-Year | | +18.04% | | +3.37% |
10-Year | | +76.28% | | +5.83% |
| | | | | | | | | | | | |
| | | Distribution Rate4 | | | 30-Day Standardized Yield5 | |
Share Class | | (with waiver) | | | (without waiver) | |
A | | | 4.41% | | | | 4.46% | | | | 4.42% | |
Advisor | | | 4.77% | | | | 4.82% | | | | 4.78% | |
Performance data represent past performance, which does not guarantee future results. Investment return and principal value will fluctuate, and you may have a gain or loss when you sell your shares. Current performance may differ from figures shown. For most recent month-end performance, go to franklintempleton.com or call (800) 342-5236.
See page 16 for Performance Summary footnotes.
| | | | |
| | | |
14 | | Annual Report | | franklintempleton.com |
FRANKLIN FLOATING RATE DAILY ACCESS FUND
PERFORMANCE SUMMARY
Total Return Index Comparison for a Hypothetical $10,000 Investment1
Total return represents the change in value of an investment over the periods shown. It includes any applicable maximum sales charge, Fund expenses, account fees and reinvested distributions. The unmanaged index includes reinvestment of any income or distributions. It differs from the Fund in composition and does not pay management fees or expenses. One cannot invest directly in an index.
Class A (11/1/08–10/31/18)
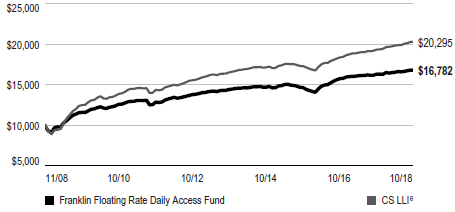
Advisor Class (11/1/08–10/31/18)
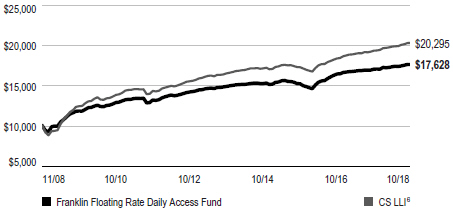
See page 16 for Performance Summary footnotes.
| | | | |
| | | |
franklintempleton.com | | Annual Report | | 15 |
FRANKLIN FLOATING RATE DAILY ACCESS FUND
PERFORMANCE SUMMARY
Distributions (11/1/17–10/31/18)
| | | | |
Share Class | | Net Investment
Income | |
A | | | $0.397426 | |
C | | | $0.362559 | |
R6 | | | $0.426560 | |
Advisor | | | $0.419482 | |
Total Annual Operating Expenses7
| | | | | | | | |
Share Class | | With Waiver | | | Without Waiver | |
A | | | 0.86% | | | | 0.91% | |
Advisor | | | 0.61% | | | | 0.66% | |
Each class of shares is available to certain eligible investors and has different annual fees and expenses, as described in the prospectus
All investments involve risks, including possible loss of principal. Investors should be aware that the Fund’s share price and yield will fluctuate with market conditions. The Fund should not be considered an alternative to money market funds or certificates of deposit (CDs). The floating rate loans and debt securities in which the Fund invests tend to be rated below investment grade. Investing in higher-yielding, lower-rated, floating rate loans and debt securities involves greater risk of default, which could result in loss of principal—a risk that may be heightened in a slowing economy. Interest earned on floating rate loans varies with changes in prevailing interest rates. Therefore, while floating rate loans offer higher interest income when interest rates rise, they will also generate less income when interest rates decline. Changes in the financial strength of a bond issuer or in a bond’s credit rating may affect its value. The Fund is actively managed but there is no guarantee that the manager’s investment decisions will produce the desired results. The Fund’s prospectus also includes a description of the main investment risks.
1. The Fund has a fee waiver associated with any investment it makes in a Franklin Templeton money fund and/or other Franklin Templeton fund, contractually guaranteed through 2/28/19. Fund investment results reflect the fee waiver; without this waiver, the results would have been lower.
2. Cumulative total return represents the change in value of an investment over the periods indicated.
3. Average annual total return represents the average annual change in value of an investment over the periods indicated. Return for less than one year, if any, has not been annualized.
4. Distribution rate is based on an annualization of the sum of the respective class’s past 30 days’ daily distributions and the maximum offering price (NAV for Advisor Class) per share on 10/31/18.
5. The Fund’s 30-day standardized yield is calculated over a trailing 30-day period using the yield to maturity on bonds and/or the dividends accrued on stocks. It may not equal the Fund’s actual income distribution rate, which reflects the Fund’s past dividends paid to shareholders.
6. Source: Credit Suisse Group. The CS LLI is designed to mirror the investable universe of the U.S. dollar-denominated leveraged loan market. Loans must be below investment grade and rated no higher than Baa/BB+ or Ba1/BBB+ by Moody’s or S&P.
7. Figures are as stated in the Fund’s current prospectus and may differ from the expense ratios disclosed in the Your Fund’s Expenses and Financial Highlights sections in this report. In periods of market volatility, assets may decline significantly, causing total annual Fund operating expenses to become higher than the figures shown.
See www.franklintempletondatasources.com for additional data provider information.
| | | | |
| | | |
16 | | Annual Report | | franklintempleton.com |
FRANKLIN FLOATING RATE DAILY ACCESS FUND
Your Fund’s Expenses
As a Fund shareholder, you can incur two types of costs: (1) transaction costs, including sales charges (loads) on Fund purchases and redemptions; and (2) ongoing Fund costs, including management fees, distribution and service (12b-1) fees, and other Fund expenses. All mutual funds have ongoing costs, sometimes referred to as operating expenses. The table below shows ongoing costs of investing in the Fund and can help you understand these costs and compare them with those of other mutual funds. The table assumes a $1,000 investment held for the six months indicated.
Actual Fund Expenses
The table below provides information about actual account values and actual expenses in the columns under the heading “Actual.” In these columns the Fund’s actual return, which includes the effect of Fund expenses, is used to calculate the “Ending Account Value” for each class of shares. You can estimate the expenses you paid during the period by following these steps (of course, your account value and expenses will differ from those in this illustration): Divide your account value by $1,000 (if your account had an $8,600 value, then $8,600 ÷ $1,000 = 8.6). Then multiply the result by the number in the row for your class of shares under the headings “Actual” and “Expenses Paid During Period” (if Actual Expenses Paid During Period were $7.50, then 8.6 x $7.50 = $64.50). In this illustration, the actual expenses paid this period are $64.50.
Hypothetical Example for Comparison with Other Funds
Under the heading “Hypothetical” in the table, information is provided about hypothetical account values and hypothetical expenses based on the Fund’s actual expense ratio and an assumed rate of return of 5% per year before expenses, which is not the Fund’s actual return. This information may not be used to estimate the actual ending account balance or expenses you paid for the period, but it can help you compare ongoing costs of investing in the Fund with those of other funds. To do so, compare this 5% hypothetical example for the class of shares you hold with the 5% hypothetical examples that appear in the shareholder reports of other funds.
Please note that expenses shown in the table are meant to highlight ongoing costs and do not reflect any transactional costs. Therefore, information under the heading “Hypothetical” is useful in comparing ongoing costs only, and will not help you compare total costs of owning different funds. In addition, if transactional costs were included, your total costs would have been higher.
| | | | | | | | | | | | | | | | | | |
| | | | | | | Actual (actual return after expenses) | | | | Hypothetical (5% annual return before expenses) | | | | |
Share Class | | Beginning
Account
Value 5/1/18 | | | | Ending
Account
Value 10/31/18 | | Expenses
Paid During
Period
5/1/18–10/31/181,2 | | | | Ending
Account
Value 10/31/18 | | Expenses
Paid During
Period
5/1/18–10/31/181,2 | | | | Net
Annualized
Expense
Ratio2 |
A | | $1,000 | | | | $1,014.70 | | $4.16 | | | | $1,021.07 | | $4.18 | | | | 0.82% |
C | | $1,000 | | | | $1,013.90 | | $6.19 | | | | $1,019.06 | | $6.21 | | | | 1.22% |
R6 | | $1,000 | | | | $1,017.60 | | $2.44 | | | | $1,022.79 | | $2.45 | | | | 0.48% |
Advisor | | $1,000 | | | | $1,016.00 | | $2.90 | | | | $1,022.33 | | $2.91 | | | | 0.57% |
1. Expenses are equal to the annualized expense ratio for the six-month period as indicated above—in the far right column—multiplied by the simple average account value over the period indicated, and then multiplied by 184/365 to reflect the one-half year period.
2. Reflects expenses after fee waivers and expense reimbursements. Does not include acquired fund fees and expenses.
| | | | |
| | | |
franklintempleton.com | | Annual Report | | 17 |
Franklin Low Duration Total Return Fund
We are pleased to bring you Franklin Low Duration Total Return Fund’s annual report for the fiscal year ended October 31, 2018.
Your Fund’s Goal and Main Investments
The Fund seeks a high level of current income as is consistent with prudent investing, while seeking capital preservation. The Fund invests primarily in investment-grade debt securities and investments, including government and corporate debt securities and mortgage- and asset-backed securities, targeting an estimated average portfolio duration of three years or less.
| | |
What is duration? Duration is a measure of a bond’s price sensitivity to interest-rate changes. In general, a portfolio of securities with a lower duration can be expected to be less sensitive to interest-rate changes than a portfolio with a higher duration. | | |
Performance Overview
The Fund’s Class A shares posted a +0.54% cumulative total return for the 12 months under review. In comparison, the Fund’s benchmark, the Bloomberg Barclays U.S. Government/Credit Index: 1-3 Year Component, posted a +0.34% total return.1 The index measures public obligations of the U.S. Treasury with one to three years to final maturity and publicly issued debt of U.S. government agencies, quasi-federal corporations, and corporate or foreign debt guaranteed by the U.S. government. You can find more of the Fund’s performance data in the Performance Summary beginning on page 21.
Performance data represent past performance, which does not guarantee future results. Investment return and principal value will fluctuate, and you may have a gain or loss when you sell your shares. Current performance may differ from figures shown. For most recent month-end performance, go to franklintempleton.com or call (800) 342-5236.
Investment Strategy
We seek to invest in a combination of fixed income securities, primarily from across the investment-grade debt universe. We analyze securities using proprietary and nonproprietary
Portfolio Composition*
Based on Total Net Assets as of 10/31/18
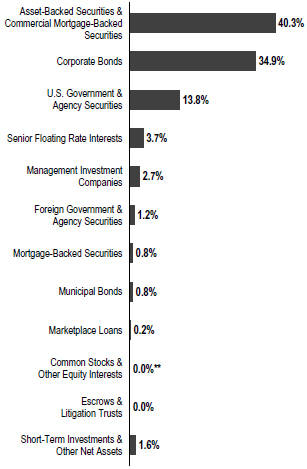
*Figures reflect certain derivatives held in the portfolio (or their underlying reference assets) and may not total 100% or may be negative due to rounding, use of derivatives, unsettled trades or other factors.
**Rounds to less than 0.1% of total net assets.
research to help us identify attractive investment opportunities across the entire fixed income opportunity set, on a relative basis. When making investment decisions, we evaluate
business cycles, yield curves, and values between and within markets. Through a low duration portfolio, we seek to position the Fund to be less affected by interest rate changes than a fund with a higher duration. In addition, we may use derivative transactions, such as forwards, futures contracts and swap
1. Source: Morningstar.
The index is unmanaged and includes reinvestment of any income or distributions. It does not reflect any fees, expenses or sales charges. One cannot invest directly in an index, and an index is not representative of the Fund’s portfolio.
See www.franklintempletondatasources.com for additional data provider information.
The dollar value, number of shares or principal amount, and names of all portfolio holdings are listed in the Fund’s Statement of Investments (SOI). The SOI begins on page 60.
| | | | |
| | | |
18 | | Annual Report | | franklintempleton.com |
FRANKLIN LOW DURATION TOTAL RETURN FUND
agreements to obtain net long or short exposures to select currencies, interest rates, countries, duration or credit risks.
| | |
What is the yield curve? A yield curve is a line that plots the yield to maturity of bonds having equal credit quality against their maturity dates. | | |
| | |
What is a currency forward contract? A currency forward contract is an agreement between the Fund and a counterparty to buy or sell a foreign currency in exchange for another currency at a specific exchange rate on a future date. Currency forward contracts are privately traded in the interbank market, not on a centralized exchange. | | |
| | |
What is a futures contract? A futures contract is an agreement between the Fund and a counterparty made through a U.S. or foreign futures exchange to buy or sell an underlying instrument or asset at a specific price on a future date. | | |
| | |
What are swap agreements? Swap agreements, such as interest rate, fixed income total return, currency, inflation index and credit default swaps, are contracts between the Fund and another party (the swap counterparty). In a basic swap transaction, the Fund agrees with the swap counterparty to exchange the returns (or differentials in rates of return) earned or realized on a particular “notional amount” of underlying instruments. The notional amount is the set amount selected by the parties as the basis on which to calculate the obligations that they have agreed to exchange. The parties typically do not actually exchange the notional amount. Instead, they agree to exchange the returns that would be earned or realized if the notional amount were invested in given instruments or at given interest rates. | | |
Manager’s Discussion
From a perspective of excess returns over Treasuries of similar duration, senior secured floating rate loans performed well. Other major fixed income sectors that delivered notable positive excess returns, as measured by Bloomberg Barclays indexes, included U.S. dollar-denominated high yield corporate credit, non-agency residential mortgage-backed securities (RMBS) and commercial mortgage-backed securities (CMBS). In contrast, agency mortgage-backed securities (MBS), U.S. investment-grade corporate bonds and emerging market bonds underperformed Treasuries.
During the period, the Fund’s exposure to non-agency RMBS was the most significant contributor to the Fund’s performance relative to its benchmark. Exposure across corporate credit
Dividend Distributions*
11/1/17–10/31/18
| | | | | | | | | | | | | | | | |
| | | Dividend per Share (cents) | |
| Month | | Class A | | | Class C | | | Class R6 | | | Advisor
Class | |
November | | | 2.1123 | | | | 1.7980 | | | | 2.4584 | | | | 2.3264 | |
December | | | 3.5363 | | | | 3.2116 | | | | 3.8780 | | | | 3.7499 | |
January | | | 2.2047 | | | | 1.8450 | | | | 2.5907 | | | | 2.4388 | |
February | | | 1.9354 | | | | 1.6306 | | | | 2.2571 | | | | 2.1330 | |
March | | | 2.2882 | | | | 1.9825 | | | | 2.6254 | | | | 2.4924 | |
April | | | 2.6070 | | | | 2.2595 | | | | 2.9608 | | | | 2.8338 | |
May | | | 2.5054 | | | | 2.1686 | | | | 2.8522 | | | | 2.7244 | |
June | | | 2.1828 | | | | 1.8896 | | | | 2.4837 | | | | 2.3736 | |
July | | | 2.6935 | | | | 2.3451 | | | | 3.0499 | | | | 2.9200 | |
August | | | 2.1386 | | | | 1.8343 | | | | 2.4500 | | | | 2.3358 | |
September | | | 2.3417 | | | | 2.0560 | | | | 2.6530 | | | | 2.5390 | |
October | | | 2.6296 | | | | 2.2716 | | | | 3.0087 | | | | 2.8572 | |
Total | | | 29.1755 | | | | 25.2924 | | | | 33.2679 | | | | 31.7243 | |
*The distribution amount is the sum of all net investment income distributions for the period shown. Assumes shares were purchased and held for the entire accrual period. Since dividends accrue daily, your actual distributions will vary depending on the date you purchased your shares and any account activity. All Fund distributions will vary depending upon current market conditions, and past distributions are not indicative of future trends.
sectors also benefitted returns, including high-yield and investment grade corporate credit. Allocations to collateralized loan obligations (CLOs) and senior secured floating rate loans were positive for returns, offsetting negative attribution from security selection within both sectors. U.S. yield curve positioning as yield curve movements had a positive impact relative to the benchmark. In contrast, the Fund’s currency forward exposure detracted from relative returns.
We maintained our largest sector allocation in investment-grade corporate credit and added exposure over the period. We also increased allocation to high yield corporate credit. We continue to find opportunities in the RMBS asset class and added exposure to the sector over the period. We prefer to remain allocated to the seasoned credit risk transfer and re-performing loan sectors, where fundamental and technical forces remain positive. We slightly pared our CMBS exposure, while cautiously maintaining exposure at the top of the capital structure due to our concerns that commercial real estate prices have surpassed pre-financial crisis levels, rent growth is slowing, and capitalization rates are trending higher. We initiated a small position in marketplace loans. We have continued to reduce our foreign-currency risk. Our foreign currency exposure is held primarily through a basket of developed market shorts versus a basket of emerging market longs.
| | | | |
| | | |
franklintempleton.com | | Annual Report | | 19 |
FRANKLIN LOW DURATION TOTAL RETURN FUND
During the period, the portfolio utilized derivatives, including credit default and currency swaps, inflation-linked swaps, currency forwards, Treasury futures, interest-rate swaps and credit default swap options, principally as a tool for efficient portfolio management and to manage overall portfolio risk. These derivative transactions may provide the same, or similar, net long or short exposure to select currencies, interest rates, countries, duration or credit risks in a less expensive way than by directly purchasing securities. In those markets where non-derivative securities are readily available, the cost difference in normal market conditions may be small.
Thank you for your continued participation in Franklin Low Duration Total Return Fund. We look forward to serving your future investment needs.
| | |
 | | 
Roger A. Bayston, CFA |
| | |
 | | 
Kent Burns, CFA |
| | Christopher J. Molumphy, CFA David Yuen, CFA, FRM Portfolio Management Team |
The foregoing information reflects our analysis, opinions and portfolio holdings as of October 31, 2018, the end of the reporting period. The way we implement our main investment strategies and the resulting portfolio holdings may change depending on factors such as market and economic conditions. These opinions may not be relied upon as investment advice or an offer for a particular security. The information is not a complete analysis of every aspect of any market, country, industry, security or the Fund. Statements of fact are from sources considered reliable, but the investment manager makes no representation or warranty as to their completeness or accuracy. Although historical performance is no guarantee of future results, these insights may help you understand our investment management philosophy.
| | | | |
| | | |
20 | | Annual Report | | franklintempleton.com |
FRANKLIN LOW DURATION TOTAL RETURN FUND
Performance Summary as of October 31, 2018
The performance tables and graphs do not reflect any taxes that a shareholder would pay on Fund dividends, capital gain distributions, if any, or any realized gains on the sale of Fund shares. Total return reflects reinvestment of the Fund’s dividends and capital gain distributions, if any, and any unrealized gains or losses. Your dividend income will vary depending on dividends or interest paid by securities in the Fund’s portfolio, adjusted for operating expenses of each class. Capital gain distributions are net profits realized from the sale of portfolio securities.
Performance as of 10/31/181
Cumulative total return excludes sales charges. Average annual total return includes maximum sales charges. Sales charges will vary depending on the size of the investment and the class of share purchased. The maximum is 2.25% and the minimum is 0%. Class A: 2.25% maximum initial sales charge; Advisor Class: no sales charges. For other share classes, visit franklintempleton.com.
| | | | |
| Share Class | | Cumulative Total Return2 | | Average Annual Total Return3 |
| | |
A | | | | |
1-Year | | +0.54% | | -1.76% |
5-Year | | +5.32% | | +0.59% |
10-Year | | +30.08% | | +2.43% |
| | |
Advisor | | | | |
1-Year | | +0.80% | | +0.80% |
5-Year | | +6.62% | | +1.29% |
10-Year | | +33.42% | | +2.93% |
| | | | | | | | | | |
| | | Distribution | | 30-Day Standardized Yield5 | |
| Share Class | | Rate4 | | (with waiver) | | | (without waiver) | |
A | | 3.21% | | | 2.98 | % | | | 2.71 | % |
Advisor | | 3.55% | | | 3.29 | % | | | 3.04 | % |
Performance data represent past performance, which does not guarantee future results. Investment return and principal value will fluctuate, and you may have a gain or loss when you sell your shares. Current performance may differ from figures shown. For most recent month-end performance, go to franklintempleton.com or call (800) 342-5236.
See page 23 for Performance Summary footnotes.
| | | | |
| | | |
franklintempleton.com | | Annual Report | | 21 |
FRANKLIN LOW DURATION TOTAL RETURN FUND
PERFORMANCE SUMMARY
Total Return Index Comparison for a Hypothetical $10,000 Investment1
Total return represents the change in value of an investment over the periods shown. It includes any applicable maximum sales charge, Fund expenses, account fees and reinvested distributions. The unmanaged indexes include reinvestment of any income or distributions. They differ from the Fund in composition and do not pay management fees or expenses. One cannot invest directly in an index.
Class A (11/1/08–10/31/18)
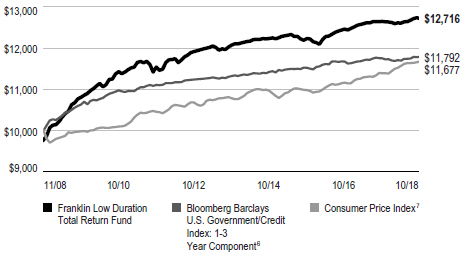
Advisor Class (11/1/08–10/31/18)
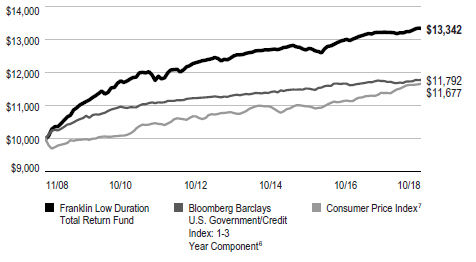
See page 23 for Performance Summary footnotes.
| | | | |
| | | |
22 | | Annual Report | | franklintempleton.com |
FRANKLIN LOW DURATION TOTAL RETURN FUND
PERFORMANCE SUMMARY
Distributions (11/1/17–10/31/18)
| | |
| | | Net Investment |
| Share Class | | Income |
A | | $0.291755 |
C | | $0.252924 |
R6 | | $0.332679 |
Advisor | | $0.317243 |
Total Annual Operating Expenses8
| | | | | | | | |
| Share Class | | With Waiver | | | Without Waiver | |
A | | | 0.71% | | | | 0.97% | |
Advisor | | | 0.46% | | | | 0.72% | |
Each class of shares is available to certain eligible investors and has different annual fees and expenses, as described in the prospectus.
All investments involve risks, including possible loss of principal. Interest-rate movements and mortgage prepayments will affect the Fund’s share price and yield. Bond prices generally move in the opposite direction of interest rates. Thus, as the prices of bonds in the Fund adjust to a rise in interest rates, the Fund’s share price may decline. Changes in the financial strength of a bond issuer or in a bond’s credit rating may affect its value. The risks associated with higher-yielding, lower-rated securities include higher risk of default and loss of principal. Investment in foreign securities also involves special risks, including currency fluctuations, and political and economic uncertainty. Derivatives, including currency management strategies, involve costs and can create economic leverage in the portfolio which may result in significant volatility and cause the Fund to participate in losses (as well as gains) on an amount that exceeds the Fund’s initial investment. The Fund may not achieve the anticipated benefits, and may realize losses when a counterparty fails to perform. The Fund is actively managed but there is no guarantee that the manager’s investment decisions will produce the desired results. The Fund’s prospectus also includes a description of the main investment risks.
1. The Fund has an expense reduction and a fee waiver associated with any investments it makes in a Franklin Templeton money fund and/or other Franklin Templeton fund, contractually guaranteed through 2/28/19. Fund investment results reflect the expense reduction and fee waiver; without these reductions, the results would have been lower.
2. Cumulative total return represents the change in value of an investment over the periods indicated.
3. Average annual total return represents the average annual change in value of an investment over the periods indicated. Return for less than one year, if any, has not been annualized.
4. Distribution rate is based on an annualization of the sum of the respective class’s past 30 days’ daily distributions and the maximum offering price (NAV for Advisor Class) per share on 10/31/18.
5. The Fund’s 30-day standardized yield is calculated over a trailing 30-day period using the yield to maturity on bonds and/or the dividends accrued on stocks. It may not equal the Fund’s actual income distribution rate, which reflects the Fund’s past dividends paid to shareholders.
6. Source: Morningstar. The Bloomberg Barclays U.S. Government/Credit Index: 1-3 Year Component includes dollar-denominated investment grade corporate debt and non-native currency agency and local authority debt, sovereign, supranational, and taxable municipal debt, public obligations of the U.S. Treasury with at least one year up to, but not including, three years to final maturity, and publicly issued debt of U.S. government agencies, quasi-federal corporations, and corporate or foreign debt guaranteed by the U.S. government.
7. Source: Bureau of Labor Statistics, bls.gov/cpi. The Consumer Price Index (CPI) is a commonly used measure of the inflation rate.
8. Figures are as stated in the Fund’s current prospectus and may differ from the expense ratios disclosed in the Your Fund’s Expenses and Financial Highlights sections in this report. In periods of market volatility, assets may decline significantly, causing total annual Fund operating expenses to become higher than the figures shown.
See www.franklintempletondatasources.com for additional data provider information.
| | | | |
| | | |
franklintempleton.com | | Annual Report | | 23 |
FRANKLIN LOW DURATION TOTAL RETURN FUND
Your Fund’s Expenses
As a Fund shareholder, you can incur two types of costs: (1) transaction costs, including sales charges (loads) on Fund purchases and redemptions; and (2) ongoing Fund costs, including management fees, distribution and service (12b-1) fees, and other Fund expenses. All mutual funds have ongoing costs, sometimes referred to as operating expenses. The table below shows ongoing costs of investing in the Fund and can help you understand these costs and compare them with those of other mutual funds. The table assumes a $1,000 investment held for the six months indicated.
Actual Fund Expenses
The table below provides information about actual account values and actual expenses in the columns under the heading “Actual.” In these columns the Fund’s actual return, which includes the effect of Fund expenses, is used to calculate the “Ending Account Value” for each class of shares. You can estimate the expenses you paid during the period by following these steps (of course, your account value and expenses will differ from those in this illustration): Divide your account value by $1,000 (if your account had an $8,600 value, then $8,600 ÷ $1,000 = 8.6). Then multiply the result by the number in the row for your class of shares under the headings “Actual” and “Expenses Paid During Period” (if Actual Expenses Paid During Period were $7.50, then 8.6 x $7.50 = $64.50). In this illustration, the actual expenses paid this period are $64.50.
Hypothetical Example for Comparison with Other Funds
Under the heading “Hypothetical” in the table, information is provided about hypothetical account values and hypothetical expenses based on the Fund’s actual expense ratio and an assumed rate of return of 5% per year before expenses, which is not the Fund’s actual return. This information may not be used to estimate the actual ending account balance or expenses you paid for the period, but it can help you compare ongoing costs of investing in the Fund with those of other funds. To do so, compare this 5% hypothetical example for the class of shares you hold with the 5% hypothetical examples that appear in the shareholder reports of other funds.
Please note that expenses shown in the table are meant to highlight ongoing costs and do not reflect any transactional costs. Therefore, information under the heading “Hypothetical” is useful in comparing ongoing costs only, and will not help you compare total costs of owning different funds. In addition, if transactional costs were included, your total costs would have been higher.
| | | | | | | | | | | | |
| | | | | Actual
(actual return after expenses) | | Hypothetical
(5% annual return before expenses) | | |
Share Class | | Beginning
Account
Value 5/1/18 | | Ending
Account
Value 10/31/18 | | Expenses Paid During
Period 5/1/18–10/31/181,2 | | Ending
Account
Value 10/31/18 | | Expenses Paid During
Period 5/1/18–10/31/181,2 | | Net
Annualized
Expense
Ratio2 |
| | | | | | |
A | | $1,000 | | $1,008.80 | | $3.49 | | $1,021.73 | | $3.52 | | 0.69% |
C | | $1,000 | | $1,006.80 | | $5.51 | | $1,019.71 | | $5.55 | | 1.09% |
R6 | | $1,000 | | $1,010.90 | | $1.47 | | $1,023.74 | | $1.48 | | 0.29% |
Advisor | | $1,000 | | $1,010.10 | | $2.23 | | $1,022.99 | | $2.24 | | 0.44% |
1. Expenses are equal to the annualized expense ratio for the six-month period as indicated above—in the far right column—multiplied by the simple average account value over the period indicated, and then multiplied by 184/365 to reflect the one-half year period.
2. Reflects expenses after fee waivers and expense reimbursements. Does not include acquired fund fees and expenses.
| | | | |
| 24 | | Annual Report | | franklintempleton.com |
Franklin Total Return Fund
This annual report for Franklin Total Return Fund covers the fiscal year ended October 31, 2018.
Your Fund’s Goal and Main Investments
The Fund seeks to provide high current income, consistent with preservation of capital. Capital appreciation over the long term is a secondary goal. The Fund invests primarily in investment-grade debt securities (including unrated securities of comparable quality) and other investments that provide exposure to such securities. The Fund currently focuses on government and corporate debt securities and mortgage- and asset-backed securities, but may invest in other securities and investments, such as floating-rate corporate loans and securities and municipal securities.
Performance Overview
The Fund’s Class A shares had a -2.57% cumulative total return for the 12 months under review. In comparison, the Fund’s benchmark, the Bloomberg Barclays U.S. Aggregate Bond Index had a -2.05% total return.1 The index measures the U.S. investment-grade, fixed-rate, taxable bond market with index components for government and corporate, mortgage pass-through and asset-backed securities. You can find the Fund’s long-term performance data in the Performance Summary beginning on page 28.
Performance data represent past performance, which does not guarantee future results. Investment return and principal value will fluctuate, and you may have a gain or loss when you sell your shares. Current performance may differ from figures shown. For most recent month-end performance, go to franklintempleton.com or call (800) 342-5236.
Investment Strategy
We seek to invest in a combination of fixed income securities, primarily from across the investment-grade debt universe. We analyze securities using proprietary and nonproprietary research to help us identify attractive investment opportunities, across the entire fixed income opportunity set, on a relative basis. The Fund may also invest up to 20% of its total assets in noninvestment-grade debt securities. In addition, we may use derivative transactions, such as currency and cross-currency forwards, futures contracts and swap agreements, to obtain net
Portfolio Composition*
Based on Total Investments as of 10/31/18
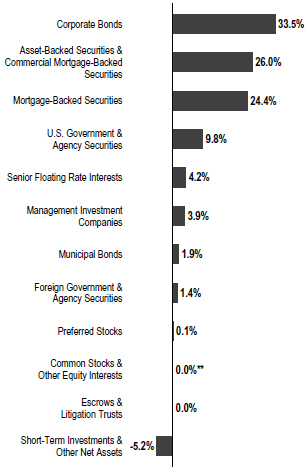
*Figures reflect certain derivatives held in the portfolio (or their underlying reference assets) and may not total 100% or may be negative due to rounding, use of derivatives, unsettled trades or other factors.
**Rounds to less than 0.1% of total net assets.
long or short exposures to select currencies, interest rates, countries, duration or credit risks.
| | |
What is a futures contract? A futures contract is an agreement between the Fund and a counterparty made through a U.S. or foreign futures exchange to buy or sell an underlying instrument or asset at a specific price on a future date. | | |
1. Source: Morningstar.
The index is unmanaged and includes reinvestment of any income or distributions. It does not reflect any fees, expenses or sales charges. One cannot invest directly in an index, and an index is not representative of the Fund’s portfolio.
See www.franklintempletondatasources.com for additional data provider information.
The dollar value, number of shares or principal amount, and names of all portfolio holdings are listed in the Fund’s Consolidated Statement of Investments (SOI). The Consolidated SOI begins on page 94.
| | | | |
| | | |
franklintempleton.com | | Annual Report | | 25 |
FRANKLIN TOTAL RETURN FUND
| | |
What is a currency forward contract? A currency forward contract is an agreement between the Fund and a counterparty to buy or sell a foreign currency in exchange for another currency at a specific exchange rate on a future date. Currency forward contracts are privately traded in the interbank market, not on a centralized exchange. | | |
| | |
What are swap agreements? Swap agreements, such as interest rate, fixed income total return, currency, inflation index and credit default swaps, are contracts between the Fund and another party (the swap counterparty). In a basic swap transaction, the Fund agrees with the swap counterparty to exchange the returns (or differentials in rates of return) earned or realized on a particular “notional amount” of underlying instruments. The notional amount is the set amount selected by the parties as the basis on which to calculate the obligations that they have agreed to exchange. The parties typically do not actually exchange the notional amount. Instead, they agree to exchange the returns that would be earned or realized if the notional amount were invested in given instruments or at given interest rates. | | |
Manager’s Discussion
From a perspective of excess returns over Treasuries of similar duration, senior secured floating rate loans performed well. Other major fixed income sectors that delivered notable positive excess returns, as measured by Bloomberg Barclays indexes, included U.S. dollar-denominated high-yield corporate credit, non-agency residential mortgage-backed securities (RMBS) and commercial mortgage-backed securities (CMBS). In contrast, agency mortgage-backed securities (MBS), U.S. investment-grade corporate bonds and emerging market bonds underperformed Treasuries.
During the period, the Fund’s exposure to corporate credit sectors benefitted returns, with high-yield corporate credit being a significant contributor to the Fund’s performance relative to its benchmark. Allocations to collateralized loan obligations (CLOs) and senior secured floating rate loans were positive for returns, offsetting negative attribution from security selection within both sectors. RMBS and tax-exempt municipal bonds also benefited relative performance. In contrast, the Fund’s exposure to foreign currency, security selection in MBS and sovereign emerging markets securities detracted from relative returns.
| | |
What is the yield curve? A yield curve is a line that plots the yield to maturity of bonds having equal credit quality against their maturity dates. | | |
We maintained our largest sector allocation in investment-grade corporate credit, but pared exposure over the period. We also reduced allocation to high-yield corporate credit on strong sector performance and allocated exposure to CLOs and senior secured floating-rate loans. We continue to find opportunities in the RMBS asset class and added exposure to the sector over the period. We prefer to remain allocated to the seasoned credit risk transfer and re-performing loan sectors, where fundamental and technical forces remain positive. We cautiously maintained our CMBS exposure at the top of the capital structure due to our concerns that commercial real estate prices have surpassed pre-financial crisis levels, rent growth is slowing, and capitalization rates are trending higher. We have continued to reduce our foreign-currency risk. Our foreign currency exposure is held primarily through a basket of developed-market shorts versus a basket of emerging-market longs.
During the period, the portfolio utilized derivatives, including credit default and currency swaps, currency forwards, Treasury futures, inflation index swaps and credit default swap options, principally as a tool for efficient portfolio management and to manage overall portfolio risk. These derivative transactions may provide the same, or similar, net long or short exposure to select currencies, interest rates, countries, duration or credit risks in a less expensive way than by directly purchasing securities. In those markets where non-derivative securities are readily available, the cost difference in normal market conditions may be small.
| | |
What is an option? An option is a contract to buy or sell a specific financial product known as the option’s underlying instrument at a specific price. The buyer of an option has the right, but not the obligation, to buy or sell the underlying instrument at or until a specified expiration date. Conversely, the seller (“writer”) of an option who opens a transaction is obligated to buy or sell the underlying instrument should the option holder exercise that right. | | |
| | | | |
| | | |
26 | | Annual Report | | franklintempleton.com |
FRANKLIN TOTAL RETURN FUND
Dividend Distributions*
11/1/17–10/31/18
| | | | | | | | | | | | | | | | | | | | |
| | | Dividend per Share (cents) | |
| Month | | Class A | | | Class C | | | Class R | | | Class R6 | | | Advisor
Class | |
November | | | 2.4928 | | | | 2.1570 | | | | 2.2888 | | | | 2.8250 | | | | 2.7092 | |
December | | | 4.4369 | | | | 4.1086 | | | | 4.2331 | | | | 4.7588 | | | | 4.6496 | |
January | | | 2.4671 | | | | 2.1009 | | | | 2.2392 | | | | 2.8279 | | | | 2.7023 | |
February | | | 2.2908 | | | | 1.9826 | | | | 2.0994 | | | | 2.5928 | | | | 2.4877 | |
March | | | 2.3005 | | | | 1.9875 | | | | 2.1157 | | | | 2.6108 | | | | 2.5026 | |
April | | | 1.1642 | | | | 0.9809 | | | | 1.0499 | | | | 1.3448 | | | | 1.2814 | |
May | | | 2.5422 | | | | 2.2065 | | | | 2.3327 | | | | 2.8758 | | | | 2.7581 | |
June | | | 1.8727 | | | | 1.6200 | | | | 1.7124 | | | | 2.1281 | | | | 2.0391 | |
July | | | 2.7685 | | | | 2.4191 | | | | 2.5531 | | | | 3.1125 | | | | 2.9931 | |
August | | | 1.1808 | | | | 1.0282 | | | | 1.0856 | | | | 1.3311 | | | | 1.2790 | |
September | | | 1.9436 | | | | 1.7148 | | | | 1.8024 | | | | 2.1697 | | | | 2.0911 | |
October | | | 2.6344 | | | | 2.2873 | | | | 2.4123 | | | | 2.9735 | | | | 2.8578 | |
| Total | | 28.0945 | | | 24.5934 | | | 25.9246 | | | 31.5508 | | | 30.3510 | |
*The distribution amount is the sum of all net investment income distributions for the period shown. Assumes shares were purchased and held for the entire accrual period. Since dividends accrue daily, your actual distributions will vary depending on the date you purchased your shares and any account activity. All Fund distributions will vary depending upon current market conditions, and past distributions are not indicative of future trends.
Thank you for your continued participation in Franklin Total Return Fund. We look forward to serving your future investment needs.
| | |
| |
Roger A. Bayston, CFA |
| |
| |
Kent Burns, CFA |
| |
| | Christopher J. Molumphy, CFA David Yuen, CFA, FRM Michael J. Materasso Portfolio Management Team |
The foregoing information reflects our analysis, opinions and portfolio holdings as of October 31, 2018, the end of the reporting period. The way we implement our main investment strategies and the resulting portfolio holdings may change depending on factors such as market and economic conditions. These opinions may not be relied upon as investment advice or an offer for a particular security. The information is not a complete analysis of every aspect of any market, country, industry, security or the Fund. Statements of fact are from sources considered reliable, but the investment manager makes no representation or warranty as to their completeness or accuracy. Although historical performance is no guarantee of future results, these insights may help you understand our investment management philosophy.
| | | | | | |
| | | |
| franklintempleton.com | | Annual Report | | | 27 | |
FRANKLIN TOTAL RETURN FUND
Performance Summary as of October 31, 2018
The performance tables and graphs do not reflect any taxes that a shareholder would pay on Fund dividends, capital gain distributions, if any, or any realized gains on the sale of Fund shares. Total return reflects reinvestment of the Fund’s dividends and capital gain distributions, if any, and any unrealized gains or losses. Your dividend income will vary depending on dividends or interest paid by securities in the Fund’s portfolio, adjusted for operating expenses of each class. Capital gain distributions are net profits realized from the sale of portfolio securities.
Performance as of 10/31/181
Cumulative total return excludes sales charges. Average annual total return includes maximum sales charges. Sales charges will vary depending on the size of the investment and the class of share purchased. The maximum is 4.25% and the minimum is 0%. Class A: 4.25% maximum initial sales charge; Advisor Class: no sales charges. For other share classes, visit franklintempleton.com.
| | | | |
| Share Class | | Cumulative Total Return2 | | Average Annual Total Return3 |
| | |
A | | | | |
1-Year | | -2.57% | | -6.74% |
5-Year | | +7.22% | | +0.52% |
10-Year | | +62.41% | | +4.52% |
| | |
Advisor | | | | |
1-Year | | -2.22% | | -2.22% |
5-Year | | +8.67% | | +1.68% |
10-Year | | +66.66% | | +5.24% |
| | | | | | | | |
| | | Distribution | | 30-Day Standardized Yield5 | |
| Share Class | | Rate4 | | (with waiver) | | (without waiver) | |
A | | 3.25% | | 3.14% | | | 3.10 | % |
Advisor | | 3.66% | | 3.55% | | | 3.51 | % |
Performance data represent past performance, which does not guarantee future results. Investment return and principal value will fluctuate, and you may have a gain or loss when you sell your shares. Current performance may differ from figures shown. For most recent month-end performance, go to franklintempleton.com or call (800) 342-5236.
See page 30 for Performance Summary footnotes.
| | | | |
| | | |
28 | | Annual Report | | franklintempleton.com |
FRANKLIN TOTAL RETURN FUND
PERFORMANCE SUMMARY
Total Return Index Comparison for a Hypothetical $10,000 Investment1
Total return represents the change in value of an investment over the periods shown. It includes any applicable maximum sales charge, Fund expenses, account fees and reinvested distributions. The unmanaged indexes include reinvestment of any income or distributions. They differ from the Fund in composition and do not pay management fees or expenses. One cannot invest directly in an index.
Class A (11/1/08–10/31/18)
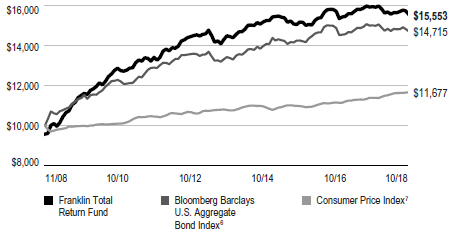
Advisor Class (11/1/08–10/31/18)
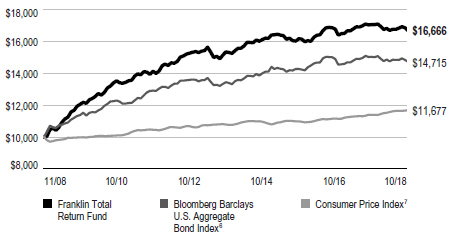
See page 30 for Performance Summary footnotes.
| | | | |
| | | |
franklintempleton.com | | Annual Report | | 29 |
FRANKLIN TOTAL RETURN FUND
PERFORMANCE SUMMARY
| | | | | | | | | | | | | | | | | | | | |
| | | | | |
Distributions (11/1/17–10/31/18) | | | | | | | | | | | | | | | | | | | | |
| Share Class | | Net Investment
Income | | | | | | Tax Return
of Capital | | | | | | Total | |
A | | | $0.274798 | | | | | | | | $0.006147 | | | | | | | | $0.280945 | |
| |
C | | | $0.240611 | | | | | | | | $0.005323 | | | | | | | | $0.245934 | |
| |
R | | | $0.253611 | | | | | | | | $0.005635 | | | | | | | | $0.259246 | |
| |
R6 | | | $0.308547 | | | | | | | | $0.006961 | | | | | | | | $0.315508 | |
| |
Advisor | | | $0.296832 | | | | | | | | $0.006678 | | | | | | | | $0.303510 | |
| |
Total Annual Operating Expenses8
| | | | | | | | | | | | | | | | | | | | |
Share Class | | | With Waiver | | | | | | | | | | | | Without Waiver | | | | | |
| |
A | | | 0.90 | % | | | | | | | | | | | 0.93 | % | | | | |
| |
Advisor | | | 0.65 | % | | | | | | | | | | | 0.68 | % | | | | |
| |
Each class of shares is available to certain eligible investors and has different annual fees and expenses, as described in the prospectus.
All investments involve risks, including possible loss of principal. Interest-rate movements and mortgage prepayments will affect the Fund’s share price and yield. Bond prices generally move in the opposite direction of interest rates. Thus, as prices of bonds in the Fund adjust to a rise in interest rates, the Fund’s share price may decline. Changes in the financial strength of a bond issuer or in a bond’s credit rating may affect its value. The risks associated with higher-yielding, lower-rated securities include higher risk of default and loss of principal. Investment in foreign securities also involves special risks, including currency fluctuations, and political and economic uncertainty. Derivatives, including currency management strategies, involve costs and can create economic leverage in the portfolio which may result in significant volatility and cause the Fund to participate in losses (as well as gains) on an amount that exceeds the Fund’s initial investment. The Fund may not achieve the anticipated benefits and may realize losses when a counterparty fails to perform as promised. The Fund is actively managed but there is no guarantee that the manager’s investment decisions will produce the desired results. The Fund’s prospectus also includes a description of the main investment risks.
1. The Fund has an expense reduction and a fee waiver associated with any investments it makes in a Franklin Templeton money fund and/or other Franklin Templeton fund, contractually guaranteed through 2/28/19. Fund investment results reflect the expense reduction and fee waiver; without these reductions, the results would have been lower.
2. Cumulative total return represents the change in value of an investment over the periods indicated.
3. Average annual total return represents the average annual change in value of an investment over the periods indicated. Return for less than one year, if any, has not been annualized.
4. Distribution rate is based on an annualization of the sum of the respective class’s past 30 days’ daily distributions and the maximum offering price (NAV for Advisor Class) per share on 10/31/18.
5. The Fund’s 30-day standardized yield is calculated over a trailing 30-day period using the yield to maturity on bonds and/or the dividends accrued on stocks. It may not equal the Fund’s actual income distribution rate, which reflects the Fund’s past dividends paid to shareholders.
6. Source: Morningstar. The Bloomberg Barclays U.S. Aggregate Bond Index is a market capitalization-weighted index representing the U.S. investment-grade, fixed-rate, taxable bond market with index components for government and corporate, mortgage pass-through and asset-backed securities. All issues included are SEC registered, taxable, dollar denominated and nonconvertible, must have at least one year to final maturity and must be rated investment grade (Baa3/BBB-/BBB- or higher) using the middle rating of Moody’s, Standard & Poor’s and Fitch, respectively.
7. Source: Bureau of Labor Statistics, bls.gov/cpi. The Consumer Price Index (CPI) is a commonly used measure of the inflation rate.
8. Figures are as stated in the Fund’s current prospectus and may differ from the expense ratios disclosed in the Your Fund’s Expenses and Financial Highlights sections in this report. In periods of market volatility, assets may decline significantly, causing total annual Fund operating expenses to become higher than the figures shown.
See www.franklintempletondatasources.com for additional data provider information.
| | | | |
| | | |
| 30 | | Annual Report | | franklintempleton.com |
FRANKLIN TOTAL RETURN FUND
Your Fund’s Expenses
As a Fund shareholder, you can incur two types of costs: (1) transaction costs, including sales charges (loads) on Fund purchases and redemptions; and (2) ongoing Fund costs, including management fees, distribution and service (12b-1) fees, and other Fund expenses. All mutual funds have ongoing costs, sometimes referred to as operating expenses. The table below shows ongoing costs of investing in the Fund and can help you understand these costs and compare them with those of other mutual funds. The table assumes a $1,000 investment held for the six months indicated.
Actual Fund Expenses
The table below provides information about actual account values and actual expenses in the columns under the heading “Actual.” In these columns the Fund’s actual return, which includes the effect of Fund expenses, is used to calculate the “Ending Account Value” for each class of shares. You can estimate the expenses you paid during the period by following these steps (of course, your account value and expenses will differ from those in this illustration): Divide your account value by $1,000 (if your account had an $8,600 value, then $8,600 ÷ $1,000 = 8.6). Then multiply the result by the number in the row for your class of shares under the headings “Actual” and “Expenses Paid During Period” (if Actual Expenses Paid During Period were $7.50, then 8.6 x $7.50 = $64.50). In this illustration, the actual expenses paid this period are $64.50.
Hypothetical Example for Comparison with Other Funds
Under the heading “Hypothetical” in the table, information is provided about hypothetical account values and hypothetical expenses based on the Fund’s actual expense ratio and an assumed rate of return of 5% per year before expenses, which is not the Fund’s actual return. This information may not be used to estimate the actual ending account balance or expenses you paid for the period, but it can help you compare ongoing costs of investing in the Fund with those of other funds. To do so, compare this 5% hypothetical example for the class of shares you hold with the 5% hypothetical examples that appear in the shareholder reports of other funds.
Please note that expenses shown in the table are meant to highlight ongoing costs and do not reflect any transactional costs. Therefore, information under the heading “Hypothetical” is useful in comparing ongoing costs only, and will not help you compare total costs of owning different funds. In addition, if transactional costs were included, your total costs would have been higher.
| | | | | | | | | | | | | | | | | | |
| | | | | | | Actual (actual return after expenses) | | | | Hypothetical (5% annual return before expenses) | | | | |
Share Class | | Beginning
Account
Value 5/1/18 | | | | Ending
Account Value 10/31/18 | | Expenses
Paid During
Period 5/1/18–10/31/181,2 | | | | Ending
Account
Value 10/31/18 | | Expenses
Paid During
Period 5/1/18–10/31/181,2 | | | | Net Annualized
Expense Ratio2 |
A | | $1,000 | | | | $997.70 | | $4.43 | | | | $1,020.77 | | $4.48 | | | | 0.88% |
C | | $1,000 | | | | $995.90 | | $6.44 | | | | $1,018.75 | | $6.51 | | | | 1.28% |
R | | $1,000 | | | | $997.70 | | $5.69 | | | | $1,019.51 | | $5.75 | | | | 1.13% |
R6 | | $1,000 | | | | $1,000.50 | | $2.47 | | | | $1,022.74 | | $2.50 | | | | 0.49% |
Advisor | | $1,000 | | | | $998.90 | | $3.17 | | | | $1,022.03 | | $3.21 | | | | 0.63% |
1.Expenses are equal to the annualized expense ratio for the six-month period as indicated above—in the far right column—multiplied by the simple average account value over the period indicated, and then multiplied by 184/365 to reflect the one-half year period.
2. Reflects expenses after fee waivers and expense reimbursements. Does not include acquired fund fees and expenses.
| | | | | | |
| | | |
| franklintempleton.com | | Annual Report | | | 31 | |
FRANKLIN INVESTORS SECURITIES TRUST
Financial Highlights
Franklin Adjustable U.S. Government Securities Fund
| | | | | | | | | | | | | | | | | | | | |
| | | Year Ended October 31, | |
| | | 2018 | | | 2017 | | | 2016 | | | 2015 | | | 2014 | |
Class A | | | | | | | | | | | | | | | | | | | | |
| | | | | |
Per share operating performance | | | | | | | | | | | | | | | | | | | | |
(for a share outstanding throughout the year) | | | | | | | | | | | | | | | | | | | | |
| | | | | |
Net asset value, beginning of year | | | $ 8.24 | | | | $ 8.40 | | | | $ 8.55 | | | | $ 8.67 | | | | $ 8.72 | |
| | | | | |
Income from investment operationsa: | | | | | | | | | | | | | | | | | | | | |
| | | | | |
Net investment income | | | 0.088b | | | | 0.026 | | | | 0.025 | | | | 0.019 | | | | 0.043 | |
| | | | | |
Net realized and unrealized gains (losses) | | | (0.035) | | | | (0.031) | | | | (0.053) | | | | (0.040) | | | | 0.006 | |
| | | | | |
Total from investment operations | | | 0.053 | | | | (0.005) | | | | (0.028) | | | | (0.021) | | | | 0.049 | |
| | | | | |
Less distributions from net investment income | | | (0.193) | | | | (0.155) | | | | (0.122) | | | | (0.099) | | | | (0.099) | |
| | | | | |
Net asset value, end of year | | | $ 8.10 | | | | $ 8.24 | | | | $ 8.40 | | | | $ 8.55 | | | | $ 8.67 | |
| | | | | |
Total returnc | | | 0.65% | | | | (0.06)% | | | | (0.32)% | | | | (0.24)% | | | | 0.56% | |
| | | | | |
Ratios to average net assets | | | | | | | | | | | | | | | | | | | | |
| | | | | |
Expenses before waiver and payments by affiliates | | | 0.96% | | | | 0.95% | | | | 0.92% | | | | 0.91% | | | | 0.93% | |
| | | | | |
Expenses net of waiver and payments by affiliatesd | | | 0.95% | | | | 0.94% | | | | 0.91% | | | | 0.91%e | | | | 0.93%e | |
| | | | | |
Net investment income | | | 1.07% | | | | 0.54% | | | | 0.43% | | | | 0.39% | | | | 0.48% | |
| | | | | |
Supplemental data | | | | | | | | | | | | | | | | | | | | |
| | | | | |
Net assets, end of year (000’s) | | | $419,055 | | | | $492,319 | | | | $667,671 | | | | $848,918 | | | | $1,058,838 | |
| | | | | |
Portfolio turnover rate | | | 11.39% | | | | 2.81% | | | | 11.49% | | | | 9.98% | | | | 14.18% | |
aThe amount shown for a share outstanding throughout the period may not correlate with the Statement of Operations for the period due to the timing of sales and repurchases of the Fund’s shares in relation to income earned and/or fluctuating fair value of the investments of the Fund.
bBased on average daily shares outstanding.
cTotal return does not reflect sales commissions or contingent deferred sales charges, if applicable.
dBenefit of expense reduction rounds to less than 0.01%.
eBenefit of waiver and payments by affiliates rounds to less than 0.01%.
| | | | |
| | | |
32 | | Annual Report | The accompanying notes are an integral part of these financial statements. | | franklintempleton.com |
FRANKLIN INVESTORS SECURITIES TRUST
FINANCIAL HIGHLIGHTS
Franklin Adjustable U.S. Government Securities Fund (continued)
| | | | | | | | | | | | | | | | | | | | |
| | | Year Ended October 31, | |
| | | 2018 | | | 2017 | | | 2016 | | | 2015 | | | 2014a | |
Class A1 | | | | | | | | | | | | | | | | | | | | |
| | | | | |
Per share operating performance | | | | | | | | | | | | | | | | | | | | |
(for a share outstanding throughout the year) | | | | | | | | | | | | | | | | | | | | |
| | | | | |
Net asset value, beginning of year | | | $ 8.24 | | | | $ 8.40 | | | | $ 8.54 | | | | $ 8.67 | | | | $ 8.68 | |
| | | | | |
Income from investment operationsb: | | | | | | | | | | | | | | | | | | | | |
| | | | | |
Net investment income | | | 0.100c | | | | 0.059 | | | | 0.049 | | | | 0.046 | | | | 0.018 | |
| | | | | |
Net realized and unrealized gains (losses) | | | (0.044) | | | | (0.051) | | | | (0.054) | | | | (0.062) | | | | 0.010 | |
| | | | | |
Total from investment operations | | | 0.056 | | | | 0.008 | | | | (0.005) | | | | (0.016) | | | | 0.028 | |
| | | | | |
Less distributions from net investment income | | | (0.206) | | | | (0.168) | | | | (0.135) | | | | (0.114) | | | | (0.038) | |
| | | | | |
Net asset value, end of year | | | $ 8.09 | | | | $ 8.24 | | | | $ 8.40 | | | | $ 8.54 | | | | $ 8.67 | |
| | | | | |
Total returnd | | | 0.68% | | | | 0.10% | | | | (0.05)% | | | | (0.19)% | | | | 0.32% | |
| | | | | |
Ratios to average net assetse | | | | | | | | | | | | | | | | | | | | |
| | | | | |
Expenses before waiver and payments by affiliates | | | 0.80% | | | | 0.79% | | | | 0.77% | | | | 0.75% | | | | 0.78% | |
| | | | | |
Expenses net of waiver and payments by affiliatesf | | | 0.79% | | | | 0.78% | | | | 0.76% | | | | 0.75%g | | | | 0.78%g | |
| | | | | |
Net investment income | | | 1.23% | | | | 0.70% | | | | 0.58% | | | | 0.55% | | | | 0.63% | |
| | | | | |
Supplemental data | | | | | | | | | | | | | | | | | | | | |
| | | | | |
Net assets, end of year (000’s) | | | $100,477 | | | | $121,012 | | | | $160,469 | | | | $198,670 | | | | $253,021 | |
| | | | | |
Portfolio turnover rate | | | 11.39% | | | | 2.81% | | | | 11.49% | | | | 9.98% | | | | 14.18% | |
aFor the period June 18, 2014 (effective date) to October 31, 2014.
bThe amount shown for a share outstanding throughout the period may not correlate with the Statement of Operations for the period due to the timing of sales and repurchases of the Fund’s shares in relation to income earned and/or fluctuating fair value of the investments of the Fund.
cBased on average daily shares outstanding.
dTotal return does not reflect sales commissions or contingent deferred sales charges, if applicable, and is not annualized for periods less than one year.
eRatios are annualized for periods less than one year.
fBenefit of expense reduction rounds to less than 0.01%.
gBenefit of waiver and payments by affiliates rounds to less than 0.01%.
| | | | |
| | | |
franklintempleton.com | | The accompanying notes are an integral part of these financial statements. | Annual Report | | 33 |
FRANKLIN INVESTORS SECURITIES TRUST
FINANCIAL HIGHLIGHTS
Franklin Adjustable U.S. Government Securities Fund (continued)
| | | | | | | | | | | | | | | | | | | | |
| | | Year Ended October 31, | |
| | | 2018 | | | 2017 | | | 2016 | | | 2015 | | | 2014 | |
Class C | | | | | | | | | | | | | | | | | | | | |
| | | | | |
Per share operating performance | | | | | | | | | | | | | | | | | | | | |
(for a share outstanding throughout the year) | | | | | | | | | | | | | | | | | | | | |
| | | | | |
Net asset value, beginning of year | | | $ 8.24 | | | | $ 8.40 | | | | $ 8.54 | | | | $ 8.66 | | | | $ 8.71 | |
| | | | | |
Income from investment operationsa: | | | | | | | | | | | | | | | | | | | | |
| | | | | |
Net investment income (loss) | | | 0.054b | | | | (0.014) | | | | (0.011) | | | | (0.013) | | | | (0.004) | |
| | | | | |
Net realized and unrealized gains (losses) | | | (0.044) | | | | (0.024) | | | | (0.041) | | | | (0.043) | | | | 0.018 | |
| | | | | |
Total from investment operations | | | 0.010 | | | | (0.038) | | | | (0.052) | | | | (0.056) | | | | 0.014 | |
| | | | | |
Less distributions from net investment income | | | (0.160) | | | | (0.122) | | | | (0.088) | | | | (0.064) | | | | (0.064) | |
| | | | | |
Net asset value, end of year | | | $ 8.09 | | | | $ 8.24 | | | | $ 8.40 | | | | $ 8.54 | | | | $ 8.66 | |
| | | | | |
Total returnc | | | 0.13% | | | | (0.45)% | | | | (0.61)% | | | | (0.65)% | | | | 0.16% | |
| | | | | |
Ratios to average net assets | | | | | | | | | | | | | | | | | | | | |
| | | | | |
Expenses before waiver and payments by affiliates | | | 1.36% | | | | 1.35% | | | | 1.32% | | | | 1.31% | | | | 1.33% | |
| | | | | |
Expenses net of waiver and payments by affiliatesd | | | 1.35% | | | | 1.34% | | | | 1.31% | | | | 1.31% | e | | | 1.33% | e |
| | | | | | |
Net investment income (loss) | | | 0.67% | | | | 0.14% | | | | 0.03% | | | | (0.01)% | | | | 0.08% | |
| | | | | |
Supplemental data | | | | | | | | | | | | | | | | | | | | |
| | | | | |
Net assets, end of year (000’s) | | | $126,585 | | | | $189,634 | | | | $266,186 | | | | $336,254 | | | | $428,031 | |
| | | | | |
Portfolio turnover rate | | | 11.39% | | | | 2.81% | | | | 11.49% | | | | 9.98% | | | | 14.18% | |
aThe amount shown for a share outstanding throughout the period may not correlate with the Statement of Operations for the period due to the timing of sales and repurchases of the Fund’s shares in relation to income earned and/or fluctuating fair value of the investments of the Fund.
bBased on average daily shares outstanding.
cTotal return does not reflect sales commissions or contingent deferred sales charges, if applicable.
dBenefit of expense reduction rounds to less than 0.01%.
eBenefit of waiver and payments by affiliates rounds to less than 0.01%.
| | | | |
| | | |
34 | | Annual Report | The accompanying notes are an integral part of these financial statements. | | franklintempleton.com |
FRANKLIN INVESTORS SECURITIES TRUST
FINANCIAL HIGHLIGHTS
Franklin Adjustable U.S. Government Securities Fund (continued)
| | | | | | | | | | | | | | | | | | | | |
| | | Year Ended October 31, | |
| | | 2018 | | | 2017 | | | 2016 | | | 2015 | | | 2014 | |
Class R6 | | | | | | | | | | | | | | | | | | | | |
| | | | | |
Per share operating performance | | | | | | | | | | | | | | | | | | | | |
(for a share outstanding throughout the year) | | | | | | | | | | | | | | | | | | | | |
| | | | | |
Net asset value, beginning of year | | | $ 8.25 | | | | $ 8.41 | | | | $ 8.55 | | | | $ 8.68 | | | | $ 8.73 | |
| | | | | |
Income from investment operationsa: | | | | | | | | | | | | | | | | | | | | |
| | | | | |
Net investment income | | | 0.121b | | | | 0.074 | | | | 0.066 | | | | 0.013 | | | | 0.088b | |
| | | | | |
Net realized and unrealized gains (losses) | | | (0.037) | | | | (0.046) | | | | (0.053) | | | | (0.010) | | | | (0.009) | |
| | | | | |
Total from investment operations | | | 0.084 | | | | 0.028 | | | | 0.013 | | | | 0.003 | | | | 0.079 | |
| | | | | |
Less distributions from net investment income | | | (0.224) | | | | (0.188) | | | | (0.153) | | | | (0.133) | | | | (0.129) | |
| | | | | |
Net asset value, end of year | | | $ 8.11 | | | | $ 8.25 | | | | $ 8.41 | | | | $ 8.55 | | | | $ 8.68 | |
| | | | | |
Total return | | | 1.03% | | | | 0.34% | | | | 0.15% | | | | 0.03% | | | | 0.92% | |
| | | | | |
Ratios to average net assets | | | | | | | | | | | | | | | | | | | | |
| | | | | |
Expenses before waiver and payments by affiliates | | | 0.62% | | | | 0.58% | | | | 0.56% | | | | 0.53% | | | | 0.56% | |
| | | | | |
Expenses net of waiver and payments by affiliatesc | | | 0.57% | | | | 0.55% | | | | 0.55% | | | | 0.53%d | | | | 0.56%d | |
| | | | | |
Net investment income | | | 1.45% | | | | 0.93% | | | | 0.79% | | | | 0.77% | | | | 0.85% | |
| | | | | |
Supplemental data | | | | | | | | | | | | | | | | | | | | |
| | | | | |
Net assets, end of year (000’s) | | | $36,026 | | | | $2,196 | | | | $2,374 | | | | $2,176 | | | | $7,193 | |
| | | | | |
Portfolio turnover rate | | | 11.39% | | | | 2.81% | | | | 11.49% | | | | 9.98% | | | | 14.18% | |
aThe amount shown for a share outstanding throughout the period may not correlate with the Statement of Operations for the period due to the timing of sales and repurchases of the Fund’s shares in relation to income earned and/or fluctuating fair value of the investments of the Fund.
bBased on average daily shares outstanding.
cBenefit of expense reduction rounds to less than 0.01%.
dBenefit of waiver and payments by affiliates rounds to less than 0.01%.
| | | | |
| | | |
franklintempleton.com | | The accompanying notes are an integral part of these financial statements. | Annual Report | | 35 |
FRANKLIN INVESTORS SECURITIES TRUST
FINANCIAL HIGHLIGHTS
Franklin Adjustable U.S. Government Securities Fund (continued)
| | | | | | | | | | | | | | | | | | | | |
| | | Year Ended October 31, | |
| | | 2018 | | | 2017 | | | 2016 | | | 2015 | | | 2014 | |
Advisor Class | | | | | | | | | | | | | | | | | | | | |
| | | | | |
Per share operating performance | | | | | | | | | | | | | | | | | | | | |
(for a share outstanding throughout the year) | | | | | | | | | | | | | | | | | | | | |
| | | | | |
Net asset value, beginning of year | | | $ 8.25 | | | | $ 8.41 | | | | $ 8.55 | | | | $ 8.68 | | | | $ 8.73 | |
| | | | | |
Income from investment operationsa: | | | | | | | | | | | | | | | | | | | | |
| | | | | |
Net investment income | | | 0.108b | | | | 0.052 | | | | 0.046 | | | | 0.040 | | | | 0.068 | |
| | | | | |
Net realized and unrealized gains (losses) | | | (0.044) | | | | (0.036) | | | | (0.043) | | | | (0.049) | | | | 0.003 | |
| | | | | |
Total from investment operations | | | 0.064 | | | | 0.016 | | | | 0.003 | | | | (0.009) | | | | 0.071 | |
| | | | | |
Less distributions from net investment income | | | (0.214) | | | | (0.176) | | | | (0.143) | | | | (0.121) | | | | (0.121) | |
| | | | | |
Net asset value, end of year | | | $ 8.10 | | | | $ 8.25 | | | | $ 8.41 | | | | $ 8.55 | | | | $ 8.68 | |
| | | | | |
Total return | | | 0.78% | | | | 0.20% | | | | 0.05% | | | | (0.11)% | | | | 0.82% | |
| | | | | |
Ratios to average net assets | | | | | | | | | | | | | | | | | | | | |
| | | | | |
Expenses before waiver and payments by affiliates | | | 0.71% | | | | 0.70% | | | | 0.67% | | | | 0.66% | | | | 0.68% | |
| | | | | |
Expenses net of waiver and payments by affiliatesc | | | 0.70% | | | | 0.69% | | | | 0.66% | | | | 0.66% | d | | | 0.68%d | |
| | | | | |
Net investment income | | | 1.32% | | | | 0.79% | | | | 0.68% | | | | 0.64% | | | | 0.73% | |
| | | | | |
Supplemental data | | | | | | | | | | | | | | | | | | | | |
| | | | | |
Net assets, end of year (000’s) | | | $112,441 | | | | $184,299 | | | | $227,599 | | | | $308,683 | | | | $416,854 | |
| | | | | |
Portfolio turnover rate | | | 11.39% | | | | 2.81% | | | | 11.49% | | | | 9.98% | | | | 14.18% | |
aThe amount shown for a share outstanding throughout the period may not correlate with the Statement of Operations for the period due to the timing of sales and repurchases of the Fund’s shares in relation to income earned and/or fluctuating fair value of the investments of the Fund.
bBased on average daily shares outstanding.
cBenefit of expense reduction rounds to less than 0.01%.
dBenefit of waiver and payments by affiliates rounds to less than 0.01%.
| | | | |
| | | |
36 | | Annual Report | The accompanying notes are an integral part of these financial statements. | | franklintempleton.com |
FRANKLIN INVESTORS SECURITIES TRUST
Statement of Investments, October 31, 2018
Franklin Adjustable U.S. Government Securities Fund
| | | | | | | | |
| | | Principal
Amount | | | Value | |
Mortgage-Backed Securities 96.9% | | | | | | | | |
a Federal Home Loan Mortgage Corp. (FHLMC) Adjustable Rate 19.5% | | | | | | | | |
FHLMC, 3.334%, (12-month USD LIBOR +/- MBS Margin), 1/01/36 | | $ | 3,411,023 | | | $ | 3,540,742 | |
FHLMC, 3.616%, (12-month USD LIBOR +/- MBS Margin), 2/01/36 | | | 3,186,149 | | | | 3,346,874 | |
FHLMC, 3.188% - 3.73%, (12-month USD LIBOR +/- MBS Margin), 12/01/34 - 8/01/37 | | | 7,211,402 | | | | 7,562,605 | |
FHLMC, 3.764%, (12-month USD LIBOR +/- MBS Margin), 12/01/35 | | | 3,450,927 | | | | 3,610,895 | |
FHLMC, 3.781%, (12-month USD LIBOR +/- MBS Margin), 12/01/35 | | | 3,318,416 | | | | 3,464,064 | |
FHLMC, 3.754% - 3.84%, (12-month USD LIBOR +/- MBS Margin), 3/01/37 - 4/01/40 | | | 6,470,294 | | | | 6,789,336 | |
FHLMC, 3.876%, (12-month USD LIBOR +/- MBS Margin), 9/01/37 | | | 19,997,128 | | | | 20,981,266 | |
FHLMC, 3.873% - 3.955%, (12-month USD LIBOR +/- MBS Margin), 1/01/37 - 5/01/38 | | | 5,958,708 | | | | 6,239,500 | |
FHLMC, 3.571% - 3.958%, (US 1 Year CMT T-Note +/- MBS Margin), 9/01/35 - 4/01/37 | | | 5,576,278 | | | | 5,875,601 | |
FHLMC, 3.958% - 4.051%, (12-month USD LIBOR +/- MBS Margin), 11/01/35 - 10/01/38 | | | 6,872,263 | | | | 7,186,547 | |
FHLMC, 3.993% - 4.06%, (US 1 Year CMT T-Note +/- MBS Margin), 4/01/34 - 11/01/36 | | | 5,230,535 | | | | 5,498,971 | |
FHLMC, 4.065% - 4.074%, (12-month USD LIBOR +/- MBS Margin), 4/01/37 - 3/01/38 | | | 6,377,449 | | | | 6,690,898 | |
FHLMC, 4.076%, (US 1 Year CMT T-Note +/- MBS Margin), 6/01/37 | | | 3,326,759 | | | | 3,518,968 | |
FHLMC, 4.086%, (12-month USD LIBOR +/- MBS Margin), 9/01/35 | | | 5,924,243 | | | | 6,123,796 | |
FHLMC, 3.965% - 4.089%, (6-month USD LIBOR +/- MBS Margin), 4/01/36 - 1/01/37 | | | 1,733,134 | | | | 1,793,805 | |
FHLMC, 4.111%, (12-month USD LIBOR +/- MBS Margin), 7/01/35 | | | 8,022,501 | | | | 8,424,388 | |
FHLMC, 4.079% - 4.16%, (12-month USD LIBOR +/- MBS Margin), 8/01/34 - 5/01/40 | | | 6,785,123 | | | | 7,113,274 | |
FHLMC, 4.175%, (12-month USD LIBOR +/- MBS Margin), 10/01/41 | | | 3,768,928 | | | | 3,941,461 | |
FHLMC, 4.191%, (12-month USD LIBOR +/- MBS Margin), 11/01/37 | | | 3,501,566 | | | | 3,661,636 | |
FHLMC, 4.221%, (US 1 Year CMT T-Note +/- MBS Margin), 3/01/35 | | | 3,943,930 | | | | 4,156,505 | |
FHLMC, 4.233%, (12-month USD LIBOR +/- MBS Margin), 6/01/37 | | | 7,738,298 | | | | 8,175,365 | |
FHLMC, 4.35%, (12-month USD LIBOR +/- MBS Margin), 11/01/40 | | | 4,717,837 | | | | 4,974,051 | |
FHLMC, 4.061% - 4.43%, (US 1 Year CMT T-Note +/- MBS Margin), 8/01/33 - 3/01/37 | | | 7,358,348 | | | | 7,759,387 | |
FHLMC, 4.168% - 4.546%, (12-month USD LIBOR +/- MBS Margin), 6/01/35 - 11/01/41 | | | 6,932,708 | | | | 7,267,920 | |
FHLMC, 4.601%, (12-month USD LIBOR +/- MBS Margin), 1/01/37 | | | 3,573,331 | | | | 3,807,605 | |
FHLMC, 4.635%, (12-month USD LIBOR +/- MBS Margin), 9/01/37 | | | 669,844 | | | | 705,596 | |
FHLMC, 4.717% - 5.376%, (US 1 Year CMT T-Note +/- MBS Margin), 8/01/34 - 7/01/35 | | | 2,873,155 | | | | 3,111,105 | |
| | | | | | | | |
| | | | | | | 155,322,161 | |
| | | | | | | | |
a Federal National Mortgage Association (FNMA) Adjustable Rate 77.3% | | | | | | | | |
FNMA, 2.213%, (12-month USD LIBOR +/- MBS Margin), 3/01/46 | | | 9,927,438 | | | | 9,927,254 | |
FNMA, 2.327%, (12-month USD LIBOR +/- MBS Margin), 4/01/45 | | | 5,370,234 | | | | 5,399,436 | |
FNMA, 1.684% - 2.791%, (11th District COF +/- MBS Margin), 1/01/19 - 11/01/40 | | | 7,476,760 | | | | 7,509,501 | |
FNMA, 3.015% - 3.388%, (12-month USD LIBOR +/- MBS Margin), 12/01/32 - 12/01/43 | | | 7,537,398 | | | | 7,811,836 | |
FNMA, 3.404%, (11th District COF +/- MBS Margin), 4/01/34 | | | 19,339,777 | | | | 19,813,726 | |
FNMA, 2.45% - 3.484%, (US 1 Year CMT T-Note +/- MBS Margin), 1/01/21 - 11/01/44 | | | 7,365,096 | | | | 7,465,187 | |
FNMA, 3.50%, (Federal COF +/- MBS Margin), 1/01/29 | | | 122 | | | | 122 | |
FNMA, 3.391% - 3.50%, (12-month USD LIBOR +/- MBS Margin), 11/01/32 - 12/01/39 | | | 7,627,771 | | | | 7,931,052 | |
FNMA, 3.502% - 3.546%, (12-month USD LIBOR +/- MBS Margin), 1/01/33 - 3/01/42 | | | 7,556,596 | | | �� | 7,895,309 | |
FNMA, 3.547% - 3.589%, (12-month USD LIBOR +/- MBS Margin), 3/01/33 - 1/01/41 | | | 7,108,681 | | | | 7,422,418 | |
FNMA, 3.594% - 3.631%, (12-month USD LIBOR +/- MBS Margin), 1/01/33 - 1/01/39 | | | 6,391,643 | | | | 6,687,774 | |
FNMA, 3.631% - 3.678%, (12-month USD LIBOR +/- MBS Margin), 12/01/32 - 2/01/41 | | | 6,795,920 | | | | 7,077,883 | |
FNMA, 3.679% - 3.721%, (12-month USD LIBOR +/- MBS Margin), 2/01/32 - 1/01/42 | | | 5,133,680 | | | | 5,350,232 | |
FNMA, 3.768%, (12-month USD LIBOR +/- MBS Margin), 1/01/36 | | | 4,318,714 | | | | 4,508,570 | |
FNMA, 3.722% - 3.778%, (12-month USD LIBOR +/- MBS Margin), 1/01/33 - 4/01/40 | | | 7,078,043 | | | | 7,370,978 | |
FNMA, 3.778% - 3.787%, (12-month USD LIBOR +/- MBS Margin), 1/01/34 - 3/01/40 | | | 4,891,105 | | | | 5,098,042 | |
FNMA, 3.801%, (12-month USD LIBOR +/- MBS Margin), 2/01/36 | | | 6,726,114 | | | | 6,965,406 | |
FNMA, 3.819%, (12-month USD LIBOR +/- MBS Margin), 1/01/36 | | | 3,927,423 | | | | 4,143,258 | |
FNMA, 3.788% - 3.82%, (12-month USD LIBOR +/- MBS Margin), 3/01/34 - 10/01/37 | | | 7,528,100 | | | | 7,924,306 | |
FNMA, 3.489% - 3.825%, (US 1 Year CMT T-Note +/- MBS Margin), 12/01/18 - 5/01/38 | | | 7,604,381 | | | | 7,909,000 | |
FNMA, 3.877%, (12-month USD LIBOR +/- MBS Margin), 5/01/39 | | | 6,590,742 | | | | 6,845,501 | |
FNMA, 3.82% - 3.879%, (12-month USD LIBOR +/- MBS Margin), 11/01/32 - 4/01/38 | | | 7,502,710 | | | | 7,837,065 | |
| | | | |
| | | |
franklintempleton.com | | Annual Report | | 37 |
FRANKLIN INVESTORS SECURITIES TRUST
STATEMENT OF INVESTMENTS
Franklin Adjustable U.S. Government Securities Fund (continued)
| | | | | | | | |
| | | Principal
Amount | | | Value | |
Mortgage-Backed Securities (continued) | | | | | | | | |
a Federal National Mortgage Association (FNMA) Adjustable Rate (continued) | | | | | | | | |
FNMA, 2.973% - 3.913%, (6-month USD LIBOR +/- MBS Margin), 6/01/21 - 3/01/38 | | $ | 7,689,889 | | | $ | 7,900,746 | |
FNMA, 3.921%, (12-month USD LIBOR +/- MBS Margin), 1/01/39 | | | 5,525,229 | | | | 5,772,088 | |
FNMA, 2.865% - 3.93%, (1-month USD LIBOR +/- MBS Margin), 10/01/26 - 10/01/34 | | | 490,091 | | | | 497,833 | |
FNMA, 3.887% - 3.939%, (12-month USD LIBOR +/- MBS Margin), 3/01/33 - 2/01/39 | | | 6,484,307 | | | | 6,783,372 | |
FNMA, 3.827% - 3.942%, (US 1 Year CMT T-Note +/- MBS Margin), 4/01/19 - 7/01/38 | | | 7,524,788 | | | | 7,799,467 | |
FNMA, 3.939% - 3.975%, (12-month USD LIBOR +/- MBS Margin), 6/01/33 - 11/01/42 | | | 7,391,588 | | | | 7,737,894 | |
FNMA, 4.001%, (US 1 Year CMT T-Note +/- MBS Margin), 1/01/38 | | | 4,890,810 | | | | 5,149,343 | |
FNMA, 4.007%, (12-month USD LIBOR +/- MBS Margin), 11/01/34 | | | 5,031,182 | | | | 5,268,449 | |
FNMA, 4.009%, (6-month USD LIBOR +/- MBS Margin), 12/01/34 | | | 4,707,002 | | | | 4,858,750 | |
FNMA, 3.913% - 4.01%, (6-month USD LIBOR +/- MBS Margin), 9/01/21 - 7/01/37 | | | 7,254,304 | | | | 7,499,232 | |
FNMA, 4.013%, (12-month USD LIBOR +/- MBS Margin), 2/01/36 | | | 4,167,229 | | | | 4,346,455 | |
FNMA, 3.978% - 4.021%, (12-month USD LIBOR +/- MBS Margin), 3/01/32 - 4/01/38 | | | 7,562,378 | | | | 7,903,752 | |
FNMA, 4.035%, (12-month USD LIBOR +/- MBS Margin), 9/01/40 | | | 3,180,042 | | | | 3,335,659 | |
FNMA, 4.021% - 4.041%, (12-month USD LIBOR +/- MBS Margin), 4/01/33 - 7/01/37 | | | 6,689,305 | | | | 7,005,469 | |
FNMA, 4.01% - 4.048%, (6-month USD LIBOR +/- MBS Margin), 4/01/33 - 2/01/37 | | | 5,969,104 | | | | 6,178,878 | |
FNMA, 4.052%, (12-month USD LIBOR +/- MBS Margin), 11/01/42 | | | 12,333,170 | | | | 12,890,023 | |
FNMA, 4.044% - 4.054%, (12-month USD LIBOR +/- MBS Margin), 7/01/33 - 11/01/41 | | | 5,711,297 | | | | 5,978,315 | |
FNMA, 4.058%, (12-month USD LIBOR +/- MBS Margin), 8/01/35 | | | 3,395,947 | | | | 3,562,811 | |
FNMA, 4.048% - 4.06%, (6-month USD LIBOR +/- MBS Margin), 5/01/33 - 12/01/36 | | | 7,671,358 | | | | 7,933,074 | |
FNMA, 4.054% - 4.06%, (12-month USD LIBOR +/- MBS Margin), 7/01/34 - 3/01/37 | | | 6,612,221 | | | | 6,918,680 | |
FNMA, 4.064%, (12-month USD LIBOR +/- MBS Margin), 3/01/35 | | | 7,847,807 | | | | 8,210,064 | |
FNMA, 4.061% - 4.07%, (12-month USD LIBOR +/- MBS Margin), 6/01/33 - 3/01/47 | | | 7,610,333 | | | | 7,943,571 | |
FNMA, 4.071%, (US 1 Year CMT T-Note +/- MBS Margin), 6/01/36 | | | 4,367,802 | | | | 4,598,807 | |
FNMA, 4.08%, (12-month USD LIBOR +/- MBS Margin), 2/01/42 | | | 4,233,681 | | | | 4,445,620 | |
FNMA, 3.946% - 4.083%, (US 1 Year CMT T-Note +/- MBS Margin), 4/01/19 - 9/01/39 | | | 7,549,028 | | | | 7,877,237 | |
FNMA, 4.077% - 4.089%, (12-month USD LIBOR +/- MBS Margin), 6/01/33 - 7/01/42 | | | 7,593,015 | | | | 7,945,358 | |
FNMA, 4.06% - 4.092%, (6-month USD LIBOR +/- MBS Margin), 8/01/33 - 8/01/37 | | | 7,589,490 | | | | 7,863,133 | |
FNMA, 4.109%, (12-month USD LIBOR +/- MBS Margin), 9/01/39 | | | 3,349,512 | | | | 3,511,925 | |
FNMA, 4.121%, (12-month USD LIBOR +/- MBS Margin), 3/01/41 | | | 5,835,037 | | | | 6,132,638 | |
FNMA, 4.09% - 4.126%, (12-month USD LIBOR +/- MBS Margin), 4/01/32 - 11/01/38 | | | 7,071,521 | | | | 7,366,759 | |
FNMA, 4.141%, (12-month USD LIBOR +/- MBS Margin), 5/01/40 | | | 3,902,801 | | | | 4,099,817 | |
FNMA, 4.153%, (12-month USD LIBOR +/- MBS Margin), 3/01/37 | | | 4,728,249 | | | | 4,929,625 | |
FNMA, 4.131% - 4.156%, (12-month USD LIBOR +/- MBS Margin), 5/01/33 - 11/01/36 | | | 7,221,433 | | | | 7,506,026 | |
FNMA, 4.156% - 4.184%, (12-month USD LIBOR +/- MBS Margin), 3/01/33 - 8/01/39 | | | 7,161,063 | | | | 7,495,083 | |
FNMA, 4.188%, (12-month USD LIBOR +/- MBS Margin), 2/01/36 | | | 4,007,383 | | | | 4,190,985 | |
FNMA, 4.19%, (12-month USD LIBOR +/- MBS Margin), 9/01/42 | | | 9,626,105 | | | | 10,041,742 | |
FNMA, 4.184% - 4.194%, (12-month USD LIBOR +/- MBS Margin), 9/01/32 - 7/01/38 | | | 7,256,975 | | | | 7,611,015 | |
FNMA, 4.194%, (12-month USD LIBOR +/- MBS Margin), 10/01/38 | | | 4,184,050 | | | | 4,387,448 | |
FNMA, 4.083% - 4.208%, (US 1 Year CMT T-Note +/- MBS Margin), 5/01/22 - 12/01/40 | | | 7,434,136 | | | | 7,776,905 | |
FNMA, 4.194% - 4.216%, (12-month USD LIBOR +/- MBS Margin), 4/01/33 - 5/01/38 | | | 5,714,456 | | | | 5,973,733 | |
FNMA, 4.216% - 4.222%, (12-month USD LIBOR +/- MBS Margin), 10/01/34 - 1/01/42 | | | 7,257,697 | | | | 7,602,854 | |
FNMA, 4.235%, (12-month USD LIBOR +/- MBS Margin), 5/01/38 | | | 4,882,636 | | | | 5,121,117 | |
FNMA, 4.259%, (12-month USD LIBOR +/- MBS Margin), 6/01/35 | | | 3,816,596 | | | | 4,016,486 | |
FNMA, 4.223% - 4.26%, (12-month USD LIBOR +/- MBS Margin), 5/01/33 - 4/01/44 | | | 7,166,339 | | | | 7,488,780 | |
FNMA, 4.265%, (12-month USD LIBOR +/- MBS Margin), 10/01/38 | | | 8,807,217 | | | | 9,271,880 | |
FNMA, 4.261% - 4.276%, (12-month USD LIBOR +/- MBS Margin), 8/01/33 - 9/01/36 | | | 5,476,369 | | | | 5,728,249 | |
FNMA, 4.284%, (12-month USD LIBOR +/- MBS Margin), 7/01/40 | | | 4,177,013 | | | | 4,387,550 | |
FNMA, 4.296%, (US 1 Year CMT T-Note +/- MBS Margin), 5/01/36 | | | 17,281,096 | | | | 18,231,871 | |
FNMA, 4.278% - 4.30%, (12-month USD LIBOR +/- MBS Margin), 8/01/33 - 6/01/37 | | | 7,087,976 | | | | 7,402,439 | |
FNMA, 4.208% - 4.308%, (US 1 Year CMT T-Note +/- MBS Margin), 6/01/19 - 9/01/39 | | | 7,452,521 | | | | 7,817,114 | |
FNMA, 4.325%, (12-month USD LIBOR +/- MBS Margin), 2/01/43 | | | 3,264,706 | | | | 3,430,020 | |
| | | | |
| | | |
38 | | Annual Report | | franklintempleton.com |
FRANKLIN INVESTORS SECURITIES TRUST
STATEMENT OF INVESTMENTS
Franklin Adjustable U.S. Government Securities Fund (continued)
| | | | | | | | |
| | | Principal
Amount | | | Value | |
Mortgage-Backed Securities (continued) | | | | | | | | |
a Federal National Mortgage Association (FNMA) Adjustable Rate (continued) | | | | | | | | |
FNMA, 4.30% - 4.335%, (12-month USD LIBOR +/- MBS Margin), 6/01/33 - 5/01/48 | | $ | 7,583,058 | | | $ | 7,936,007 | |
FNMA, 4.336% - 4.367%, (12-month USD LIBOR +/- MBS Margin), 8/01/33 - 12/01/40 | | | 6,019,075 | | | | 6,291,731 | |
FNMA, 4.367% - 4.389%, (12-month USD LIBOR +/- MBS Margin), 6/01/33 - 7/01/38 | | | 6,556,627 | | | | 6,836,605 | |
FNMA, 4.393% - 4.403%, (12-month USD LIBOR +/- MBS Margin), 1/01/33 - 11/01/38 | | | 5,098,730 | | | | 5,351,848 | |
FNMA, 4.403%, (12-month USD LIBOR +/- MBS Margin), 1/01/37 | | | 4,885,455 | | | | 5,140,411 | |
FNMA, 4.404% - 4.424%, (12-month USD LIBOR +/- MBS Margin), 8/01/33 - 7/01/42 | | | 7,554,058 | | | | 7,902,925 | |
FNMA, 4.31% - 4.438%, (US 1 Year CMT T-Note +/- MBS Margin), 5/01/19 - 9/01/39 | | | 7,515,022 | | | | 7,879,627 | |
FNMA, 4.453%, (12-month USD LIBOR +/- MBS Margin), 11/01/34 | | | 4,219,395 | | | | 4,408,723 | |
FNMA, 4.424% - 4.476%, (12-month USD LIBOR +/- MBS Margin), 7/01/33 - 5/01/48 | | | 7,184,729 | | | | 7,524,241 | |
FNMA, 3.473% - 4.487%, (US 5 Year CMT T-Note +/- MBS Margin), 6/01/25 - 2/01/30 | | | 128,385 | | | | 131,872 | |
FNMA, 4.50%, (12-month USD LIBOR +/- MBS Margin), 8/01/40 | | | 3,394,017 | | | | 3,560,452 | |
FNMA, 4.476% - 4.527%, (12-month USD LIBOR +/- MBS Margin), 9/01/32 - 10/01/41 | | | 7,266,719 | | | | 7,628,111 | |
FNMA, 4.536%, (12-month USD LIBOR +/- MBS Margin), 1/01/36 | | | 4,482,869 | | | | 4,725,161 | |
FNMA, 4.527% - 4.569%, (12-month USD LIBOR +/- MBS Margin), 6/01/33 - 9/01/40 | | | 7,457,765 | | | | 7,813,710 | |
FNMA, 4.569% - 4.605%, (12-month USD LIBOR +/- MBS Margin), 10/01/33 - 11/01/38 | | | 5,765,045 | | | | 6,037,968 | |
FNMA, 4.099% - 4.75%, (6-month USD LIBOR +/- MBS Margin), 11/01/23 - 8/01/37 | | | 7,604,939 | | | | 7,913,604 | |
FNMA, 4.44% - 4.864%, (US 1 Year CMT T-Note +/- MBS Margin), 3/01/20 - 7/01/38 | | | 7,090,987 | | | | 7,363,385 | |
FNMA, 2.621% - 4.97%, (US 3 Year CMT T-Note +/- MBS Margin), 12/01/19 - 1/01/35 | | | 668,150 | | | | 686,012 | |
FNMA, 4.607% - 5.183%, (12-month USD LIBOR +/- MBS Margin), 9/01/19 - 10/01/40 | | | 6,247,152 | | | | 6,613,651 | |
FNMA, 4.751% - 5.725%, (6-month USD LIBOR +/- MBS Margin), 2/01/33 - 6/01/38 | | | 1,771,971 | | | | 1,848,376 | |
FNMA, 4.901% - 6.735%, (US 1 Year CMT T-Note +/- MBS Margin), 10/01/22 - 9/01/37 | | | 2,545,465 | | | | 2,639,609 | |
FNMA, 2.798% - 6.989%, (11th District COF +/- MBS Margin), 1/01/19 - 11/01/36 | | | 2,714,734 | | | | 2,773,205 | |
FNMA, 3.75% - 7.67%, (6-month US T-Bill +/- MBS Margin), 6/01/19 - 11/01/34 | | | 214,857 | | | | 218,917 | |
| | | | | | | | |
| | | | | | | 613,846,148 | |
| | | | | | | | |
a Government National Mortgage Association (GNMA) Adjustable Rate 0.1% | | | | | | | | |
GNMA, 3.125% - 3.75%, (US 1 Year CMT T-Note +/- MBS Margin), 9/20/33 - 5/20/36 | | | 1,050,587 | | | | 1,074,013 | |
| | | | | | | | |
Total Mortgage-Backed Securities (Cost $773,029,163) | | | | | | | 770,242,322 | |
| | | | | | | | |
| | |
| | | Shares | | | | |
| | |
Short Term Investments (Cost $18,732,898) 2.4% | | | | | | | | |
| | |
Money Market Funds 2.4% | | | | | | | | |
b,c Institutional Fiduciary Trust Money Market Portfolio, 1.83% | | | 18,732,898 | | | | 18,732,898 | |
| | | | | | | | |
Total Investments (Cost $791,762,061) 99.3% | | | | | | | 788,975,220 | |
Other Assets, less Liabilities 0.7% | | | | | | | 5,609,436 | |
| | | | | | | | |
Net Assets 100.0% | | | | | | $ | 794,584,656 | |
| | | | | | | | |
See Abbreviations on page 158.
aAdjustable Rate Mortgage-Backed Security (ARM); the rate shown is the effective rate at period end. ARM rates are not based on a published reference rate and spread, but instead pass-through weighted average interest income inclusive of any caps or floors, if applicable, from the underlying mortgage loans in which the majority of mortgages pay interest based on the index shown at their designated reset dates plus a spread, less the applicable servicing and guaranty fee (MBS margin).
bSee Note 3(f) regarding investments in affiliated management investment companies.
cThe rate shown is the annualized seven-day effective yield at period end.
| | | | |
| | | |
franklintempleton.com | | The accompanying notes are an integral part of these financial statements. | Annual Report | | 39 |
FRANKLIN INVESTORS SECURITIES TRUST
Financial Highlights
Franklin Floating Rate Daily Access Fund
| | | | | | | | | | | | | | | | | | | | |
| | | Year Ended October 31, | |
| | | 2018 | | | 2017 | | | 2016 | | | 2015 | | | 2014 | |
Class A | | | | | | | | | | | | | | | | | | | | |
| | | | | |
Per share operating performance | | | | | | | | | | | | | | | | | | | | |
(for a share outstanding throughout the year) | | | | | | | | | | | | | | | | | | | | |
| | | | | |
Net asset value, beginning of year | | | $ 8.83 | | | | $ 8.84 | | | | $ 8.61 | | | | $ 9.04 | | | | $ 9.20 | |
| | | | | |
Income from investment operationsa: | | | | | | | | | | | | | | | | | | | | |
| | | | | |
Net investment income | | | 0.396 | | | | 0.307 | | | | 0.401 | | | | 0.406 | | | | 0.335 | |
| | | | | |
Net realized and unrealized gains (losses) | | | (0.129) | | | | (0.011) | | | | 0.228 | | | | (0.434) | | | | (0.160) | |
| | | | | |
Total from investment operations | | | 0.267 | | | | 0.296 | | | | 0.629 | | | | (0.028) | | | | 0.175 | |
| | | | | |
Less distributions from net investment income | | | (0.397) | | | | (0.306) | | | | (0.399) | | | | (0.402) | | | | (0.335) | |
| | | | | |
Net asset value, end of year | | | $ 8.70 | | | | $ 8.83 | | | | $ 8.84 | | | | $ 8.61 | | | | $ 9.04 | |
| | | | | |
Total returnb | | | 2.97% | | | | 3.51% | | | | 7.60% | | | | (0.37)% | | | | 1.91% | |
| | | | | |
Ratios to average net assets | | | | | | | | | | | | | | | | | | | | |
| | | | | |
Expenses before waiver and payments by affiliates | | | 0.87% | | | | 0.87% | | | | 0.88% | | | | 0.85% | | | | 0.84% | |
| | | | | |
Expenses net of waiver and payments by affiliatesc | | | 0.81% | | | | 0.82% | | | | 0.86% | | | | 0.84% | | | | 0.82% | |
| | | | | |
Net investment income | | | 4.53% | | | | 3.45% | | | | 4.72% | | | | 4.55% | | | | 3.64% | |
| | | | | |
Supplemental data | | | | | | | | | | | | | | | | | | | | |
| | | | | |
Net assets, end of year (000’s) | | | $1,344,473 | | | | $1,362,220 | | | | $1,359,862 | | | | $1,553,100 | | | | $1,874,867 | |
| | | | | |
Portfolio turnover rate | | | 58.07% | | | | 64.21% | | | | 34.10% | | | | 46.72% | | | | 83.93% | |
aThe amount shown for a share outstanding throughout the period may not correlate with the Statement of Operations for the period due to the timing of sales and repurchases of the Fund’s shares in relation to income earned and/or fluctuating fair value of the investments of the Fund.
bTotal return does not reflect sales commissions or contingent deferred sales charges, if applicable.
cBenefit of expense reduction rounds to less than 0.01%.
| | | | |
| | | |
40 | | Annual Report | The accompanying notes are an integral part of these financial statements. | | franklintempleton.com |
FRANKLIN INVESTORS SECURITIES TRUST
FINANCIAL HIGHLIGHTS
Franklin Floating Rate Daily Access Fund (continued)
| | | | | | | | | | | | | | | | | | | | |
| | | Year Ended October 31, |
| | | 2018 | | 2017 | | | 2016 | | | 2015 | | | 2014 | |
Class C | | | | | | | | | | | | | | | | | | | | |
| | | | | |
Per share operating performance | | | | | | | | | | | | | | | | | | | | |
(for a share outstanding throughout the year) | | | | | | | | | | | | | | | | | | | | |
| | | | | |
Net asset value, beginning of year | | | $ 8.83 | | | | $ 8.84 | | | | $ 8.61 | | | | $ 9.05 | | | | $ 9.20 | |
| | | | | |
Income from investment operationsa: | | | | | | | | | | | | | | | | | | | | |
| | | | | |
Net investment income | | | 0.364 | | | | 0.271 | | | | 0.366 | | | | 0.369 | | | | 0.298 | |
| | | | | |
Net realized and unrealized gains (losses) | | | (0.131) | | | | (0.010) | | | | 0.229 | | | | (0.443) | | | | (0.150) | |
| | | | | |
Total from investment operations | | | 0.233 | | | | 0.261 | | | | 0.595 | | | | (0.074) | | | | 0.148 | |
| | | | | |
Less distributions from net investment income | | | (0.363) | | | | (0.271) | | | | (0.365) | | | | (0.366) | | | | (0.298) | |
| | | | | |
Net asset value, end of year | | | $8.70 | | | | $8.83 | | | | $8.84 | | | | $8.61 | | | | $9.05 | |
| | | | | |
Total returnb | | | 2.68% | | | | 3.11% | | | | 7.18% | | | | (0.87)% | | | | 1.62% | |
| | | | | |
Ratios to average net assets | | | | | | | | | | | | | | | | | | | | |
| | | | | |
Expenses before waiver and payments by affiliates | | | 1.27% | | | | 1.27% | | | | 1.28% | | | | 1.25% | | | | 1.24% | |
| | | | | |
Expenses net of waiver and payments by affiliatesc | | | 1.21% | | | | 1.22% | | | | 1.26% | | | | 1.24% | | | | 1.22% | |
| | | | | |
Net investment income | | | 4.13% | | | | 3.05% | | | | 4.32% | | | | 4.15% | | | | 3.24% | |
| | | | | |
Supplemental data | | | | | | | | | | | | | | | | | | | | |
| | | | | |
Net assets, end of year (000’s) | | | $438,480 | | | | $550,797 | | | | $551,726 | | | | $627,805 | | | | $742,602 | |
| | | | | |
Portfolio turnover rate | | | 58.07% | | | | 64.21% | | | | 34.10% | | | | 46.72% | | | | 83.93% | |
aThe amount shown for a share outstanding throughout the period may not correlate with the Statement of Operations for the period due to the timing of sales and repurchases of the Fund’s shares in relation to income earned and/or fluctuating fair value of the investments of the Fund.
bTotal return does not reflect sales commissions or contingent deferred sales charges, if applicable.
cBenefit of expense reduction rounds to less than 0.01%.
| | | | |
| | | |
franklintempleton.com | | The accompanying notes are an integral part of these financial statements. | Annual Report | | 41 |
FRANKLIN INVESTORS SECURITIES TRUST
FINANCIAL HIGHLIGHTS
Franklin Floating Rate Daily Access Fund (continued)
| | | | | | | | | | | | | | | | | | | | |
| | | Year Ended October 31, |
| | | 2018 | | 2017 | | 2016 | | 2015 | | 2014 |
Class R6 | | | | | | | | | | | | | | | | | | | | |
| | | | | |
Per share operating performance | | | | | | | | | | | | | | | | | | | | |
(for a share outstanding throughout the year) | | | | | | | | | | | | | | | | | | | | |
| | | | | |
Net asset value, beginning of year | | | $ 8.84 | | | | $ 8.84 | | | | $ 8.60 | | | | $ 9.05 | | | | $ 9.21 | |
| | | | | |
Income from investment operationsa: | | | | | | | | | | | | | | | | | | | | |
Net investment income | | | 0.427 | | | | 0.338 | | | | 0.422 | | | | 0.437 | | | | 0.364 | |
| | | | | |
Net realized and unrealized gains (losses) | | | (0.130 | ) | | | (0.002 | ) | | | 0.245 | | | | (0.457 | ) | | | (0.159 | ) |
| | | | | |
Total from investment operations | | | 0.297 | | | | 0.336 | | | | 0.667 | | | | (0.020 | ) | | | 0.205 | |
| | | | | |
Less distributions from net investment income | | | (0.427 | ) | | | (0.336 | ) | | | (0.427 | ) | | | (0.430 | ) | | | (0.365 | ) |
| | | | | |
Net asset value, end of year | | | $ 8.71 | | | | $ 8.84 | | | | $ 8.84 | | | | $ 8.60 | | | | $ 9.05 | |
| | | | | |
Total return | | | 3.43% | | | | 3.85% | | | | 7.96% | | | | (0.16)% | | | | 2.36% | |
| | | | | |
Ratios to average net assets | | | | | | | | | | | | | | | | | | | | |
| | | | | |
Expenses before waiver and payments by affiliates | | | 0.55% | | | | 0.52% | | | | 0.53% | | | | 0.72% | | | | 0.52% | |
| | | | | |
Expenses net of waiver and payments by affiliatesb | | | 0.48% | | | | 0.47% | | | | 0.51% | | | | 0.51% | | | | 0.50% | |
| | | | | |
Net investment income | | | 4.86% | | | | 3.80% | | | | 5.07% | | | | 4.88% | | | | 3.96% | |
| | | | | |
Supplemental data | | | | | | | | | | | | | | | | | | | | |
| | | | | |
Net assets, end of year (000’s) | | | $142,075 | | | | $130,180 | | | | $12,333 | | | | $7 | | | | $465 | |
| | | | | |
Portfolio turnover rate | | | 58.07% | | | | 64.21% | | | | 34.10% | | | | 46.72% | | | | 83.93% | |
aThe amount shown for a share outstanding throughout the period may not correlate with the Statement of Operations for the period due to the timing of sales and repurchases of the Fund’s shares in relation to income earned and/or fluctuating fair value of the investments of the Fund.
bBenefit of expense reduction rounds to less than 0.01%.
| | | | |
| | | |
42 | | Annual Report | The accompanying notes are an integral part of these financial statements. | | franklintempleton.com |
FRANKLIN INVESTORS SECURITIES TRUST
FINANCIAL HIGHLIGHTS
Franklin Floating Rate Daily Access Fund (continued)
| | | | | | | | | | | | | | | | | | | | |
| | | Year Ended October 31, |
| | | 2018 | | 2017 | | 2016 | | 2015 | | 2014 |
Advisor Class | | | | | | | | | | | | | | | | | | | | |
| | | | | |
Per share operating performance | | | | | | | | | | | | | | | | | | | | |
(for a share outstanding throughout the year) | | | | | | | | | | | | | | | | | | | | |
| | | | | |
Net asset value, beginning of year | | | $ 8.84 | | | | $ 8.85 | | | | $ 8.61 | | | | $ 9.05 | | | | $ 9.20 | |
| | | | | |
Income from investment operationsa: | | | | | | | | | | | | | | | | | | | | |
Net investment income | | | 0.418 | | | | 0.327 | | | | 0.422 | | | | 0.427 | | | | 0.358 | |
| | | | | |
Net realized and unrealized gains (losses) | | | (0.129 | ) | | | (0.010 | ) | | | 0.239 | | | | (0.443 | ) | | | (0.150 | ) |
| | | | | |
Total from investment operations | | | 0.289 | | | | 0.317 | | | | 0.661 | | | | (0.016 | ) | | | 0.208 | |
| | | | | |
Less distributions from net investment income | | | (0.419 | ) | | | (0.327 | ) | | | (0.421 | ) | | | (0.424 | ) | | | (0.358 | ) |
| | | | | |
Net asset value, end of year | | | $ 8.71 | | | | $ 8.84 | | | | $ 8.85 | | | | $ 8.61 | | | | $ 9.05 | |
| | | | | |
Total return | | | 3.35% | | | | 3.64% | | | | 8.00% | | | | (0.23)% | | | | 2.28% | |
| | | | | |
Ratios to average net assets | | | | | | | | | | | | | | | | | | | | |
| | | | | |
Expenses before waiver and payments by affiliates | | | 0.62% | | | | 0.62% | | | | 0.63% | | | | 0.60% | | | | 0.59% | |
| | | | | |
Expenses net of waiver and payments by affiliatesb | | | 0.56% | | | | 0.57% | | | | 0.61% | | | | 0.59% | | | | 0.57% | |
| | | | | |
Net investment income | | | 4.78% | | | | 3.70% | | | | 4.97% | | | | 4.80% | | | | 3.89% | |
| | | | | |
Supplemental data | | | | | | | | | | | | | | | | | | | | |
| | | | | |
Net assets, end of year (000’s) | | | $1,743,880 | | | | $1,672,724 | | | | $1,108,692 | | | | $1,405,281 | | | | $2,019,477 | |
| | | | | |
Portfolio turnover rate | | | 58.07% | | | | 64.21% | | | | 34.10% | | | | 46.72% | | | | 83.93% | |
aThe amount shown for a share outstanding throughout the period may not correlate with the Statement of Operations for the period due to the timing of sales and repurchases of the Fund’s shares in relation to income earned and/or fluctuating fair value of the investments of the Fund.
bBenefit of expense reduction rounds to less than 0.01%.
| | | | |
| | | |
franklintempleton.com | | The accompanying notes are an integral part of these financial statements. | Annual Report | | 43 |
FRANKLIN INVESTORS SECURITIES TRUST
Statement of Investments, October 31, 2018
Franklin Floating Rate Daily Access Fund
| | | | | | | | | | | | |
| | | Country | | | Shares/ Units | | | Value | |
| |
Common Stocks and Other Equity Interests 1.1% | | | | | | | | | | | | |
Diversified Support Services 0.5% | | | | | | | | | | | | |
a,b,c,d Remington Outdoor Co. Inc. | | | United States | | | | 1,458,043 | | | $ | 18,876,774 | |
a,b,c,d Remington Outdoor Co. Inc., Litigation Units | | | United States | | | | 137,266 | | | | — | |
| | | | | | | | | | | | |
| | | |
| | | | | | | | | | | 18,876,774 | |
| | | | | | | | | | | | |
Forest Products 0.3% | | | | | | | | | | | | |
a,b,c,d Appvion Inc. | | | United States | | | | 1,132,044 | | | | 11,581,914 | |
| | | | | | | | | | | | |
Oil & Gas Exploration & Production 0.3% | | | | | | | | | | | | |
a Samson Resources II LLC | | | United States | | | | 432,778 | | | | 10,365,033 | |
| | | | | | | | | | | | |
| | | |
Total Common Stocks and Other Equity Interests
(Cost $86,183,848) | | | | | | | | | | | 40,823,721 | |
| | | | | | | | | | | | |
| | | |
Management Investment Companies 3.5% | | | | | | | | | | | | |
Other Diversified Financial Services 3.5% | | | | | | | | | | | | |
e Franklin Lower Tier Floating Rate Fund | | | United States | | | | 6,729,194 | | | | 64,398,391 | |
e Franklin Middle Tier Floating Rate Fund | | | United States | | | | 6,837,495 | | | | 64,272,450 | |
| | | | | | | | | | | | |
| | | |
Total Management Investment Companies
(Cost $137,283,610) | | | | | | | | | | | 128,670,841 | |
| | | | | | | | | | | | |
| | | |
| | | | | | Principal
Amount* | | | | |
Corporate Bonds (Cost $17,118,065) 0.4% | | | | | | | | | | | | |
Industrial Machinery 0.4% | | | | | | | | | | | | |
f Onsite Rental Group Operations Pty. Ltd., secured note, PIK, 6.10%, 10/26/23 | | | Australia | | | $ | 19,861,080 | | | | 15,392,337 | |
| | | | | | | | | | | | |
| | | |
g,hSenior Floating Rate Interests 72.0% | | | | | | | | | | | | |
Aerospace & Defense 3.3% | | | | | | | | | | | | |
Delos Finance S.A.R.L. (AerCap), New Loans, 4.136%, (3-month USD LIBOR + 1.75%), 10/06/23 | | | Luxembourg | | | | 59,610,818 | | | | 59,770,516 | |
Doncasters U.S. Finance LLC, | | | | | | | | | | | | |
Second Lien Term Loan, 10.636%, (3-month USD LIBOR + 8.25%), 10/09/20 | | | United States | | | | 5,818,610 | | | | 4,931,272 | |
Term B Loans, 5.886%, (3-month USD LIBOR + 3.50%), 4/09/20 | | | United States | | | | 27,222,852 | | | | 25,291,717 | |
Flying Fortress Holdings LLC (ILFC), New Loan, 4.136%, (3-month USD LIBOR + 1.75%), 10/30/22 | | | United States | | | | 30,062,918 | | | | 30,197,119 | |
| | | | | | | | | | | | |
| | | |
| | | | | | | | | | | 120,190,624 | |
| | | | | | | | | | | | |
Agricultural Products 0.1% | | | | | | | | | | | | |
Allflex Holdings III Inc., Second Lien Initial Term Loan, 9.477%, (3-month USD LIBOR + 7.00%), 7/19/21 | | | United States | | | | 2,028,781 | | | | 2,040,193 | |
| | | | | | | | | | | | |
Air Freight & Logistics 0.3% | | | | | | | | | | | | |
XPO Logistics Inc., Refinanced Term Loan, 4.509%, (3-month USD LIBOR + 2.00%), 2/24/25 | | | United States | | | | 10,200,000 | | | | 10,236,832 | |
| | | | | | | | | | | | |
Airlines 1.5% | | | | | | | | | | | | |
Air Canada, Term Loan, 4.295%, (1-month USD LIBOR + 2.00%), 10/06/23 | | | Canada | | | | 34,984,134 | | | | 35,100,736 | |
American Airlines Inc., | | | | | | | | | | | | |
2018 Replacement Term Loans, 4.045%, (1-month USD LIBOR + 1.75%), 6/27/25 | | | United States | | | | 16,384,617 | | | | 16,070,999 | |
2021 Replacement Term Loans, 4.277%, (3-month USD LIBOR + 2.00%), 10/10/21 | | | United States | | | | 5,376,611 | | | | 5,375,772 | |
| | | | | | | | | | | | |
| | | |
| | | | | | | | | | | 56,547,507 | |
| | | | | | | | | | | | |
| | | | |
| | | |
| 44 | | Annual Report | | franklintempleton.com |
FRANKLIN INVESTORS SECURITIES TRUST
STATEMENT OF INVESTMENTS
Franklin Floating Rate Daily Access Fund (continued)
| | | | | | | | | | | | | | |
| | | | | Country | | | Principal
Amount* | | | Value | |
| |
| | g,h Senior Floating Rate Interests (continued) | | | | | | | | | | | | |
| | Apparel Retail 2.2% | | | | | | | | | | | | |
| | Ascena Retail Group Inc., Tranche B Term Loan, 6.813%, (1-month USD LIBOR + 4.50%), 8/21/22 | | | United States | | | $ | 82,855,654 | | | $ | 80,597,838 | |
| | | | | | | | | | | | | | |
| | Application Software 0.4% | | | | | | | | | | | | |
| | TIBCO Software Inc., Term B-1 Loans, 5.80%, (1-month USD LIBOR + 3.50%), 12/04/20 | | | United States | | | | 14,540,557 | | | | 14,567,821 | |
| | | | | | | | | | | | | | |
| | Auto Parts & Equipment 1.6% | | | | | | | | | | | | |
| | Allison Transmission Inc., New Term Loans, 4.04%, (1-month USD LIBOR + 1.75%), 9/23/22 | | | United States | | | | 25,971,660 | | | | 26,133,983 | |
| | American Axle & Manufacturing, Inc., | | | | | | | | | | | | |
| | Tranche B Term Loan, 4.54%, (1-month USD LIBOR + 2.25%), 4/06/24 | | | United States | | | | 2,298,626 | | | | 2,298,626 | |
| | Tranche B Term Loan, 4.74%, (3-month USD LIBOR + 2.25%), 4/06/24 | | | United States | | | | 1,561,150 | | | | 1,561,150 | |
| | TI Group Automotive Systems LLC, Initial US Term Loan, 4.802%, (1-month USD LIBOR + 2.50%), 6/30/22 | | | United States | | | | 29,434,428 | | | | 29,324,048 | |
| | | | | | | | | | | | | | |
| | | | |
| | | | | | | | | | | | | 59,317,807 | |
| | | | | | | | | | | | | | |
| | Broadcasting 2.5% | | | | | | | | | | | | |
| | Gray Television Inc., Term B-2 Loan, 4.515%, (1-month USD LIBOR + 2.25%), 2/07/24 | | | United States | | | | 26,687,491 | | | | 26,731,979 | |
| | i,j Mission Broadcasting Inc., Term B-3 Loan, TBD, 1/17/24 | | | United States | | | | 1,550,088 | | | | 1,551,379 | |
| | i,j Nexstar Broadcasting Inc., | | | | | | | | | | | | |
| | Term A-4 Loan, TBD, 10/26/23 | | | United States | | | | 17,517,633 | | | | 17,532,225 | |
| | Term B-3 Loan, TBD, 7/17/24 | | | United States | | | | 9,689,978 | | | | 9,698,050 | |
| | Sinclair Television Group Inc., Tranche B Term Loans, 4.56%, (1-month USD LIBOR + 2.25%), 1/03/24 | | | United States | | | | 36,076,928 | | | | 36,099,476 | |
| | i,j WXXA-TV LLC and WLAJ-TV LLC, Term A-4 Loan, TBD, 10/26/23 | | | United States | | | | 484,835 | | | | 484,229 | |
| | | | | | | | | | | | | | |
| | | | |
| | | | | | | | | | | | | 92,097,338 | |
| | | | | | | | | | | | | | |
| | Building Products 0.5% | | | | | | | | | | | | |
| | i,j Resideo Technologies Inc., | | | | | | | | | | | | |
| | senior secured note, Term Loan, TBD, 10/25/25 | | | United States | | | | 1,719,565 | | | | 1,728,162 | |
| | Tranche A Term Loan, TBD, 10/25/23 | | | United States | | | | 17,400,000 | | | | 17,443,500 | |
| | | | | | | | | | | | | | |
| | | | |
| | | | | | | | | | | | | 19,171,662 | |
| | | | | | | | | | | | | | |
| | Cable & Satellite 2.5% | | | | | | | | | | | | |
| | Charter Communications Operating LLC, | | | | | | | | | | | | |
| | Term A-2 Loan, 3.81%, (1-month USD LIBOR + 1.50%), 3/31/23 | | | United States | | | | 33,234,209 | | | | 33,280,937 | |
| | Term B Loan, 4.31%, (1-month USD LIBOR + 2.00%), 4/30/25 | | | United States | | | | 5,969,925 | | | | 5,977,029 | |
| | CSC Holdings LLC, March 2017 Incremental Term Loans, 4.53%, (1-month USD LIBOR + 2.25%), 7/17/25 | | | United States | | | | 41,941,984 | | | | 41,784,198 | |
| | Mediacom Illinois LLC, Tranche N Term Loan, 3.97%, (1-week USD LIBOR + 1.75%), 2/15/24 | | | United States | | | | 9,984,120 | | | | 9,987,235 | |
| | | | | | | | | | | | | | |
| | | | |
| | | | | | | | | | | | | 91,029,399 | |
| | | | | | | | | | | | | | |
| | Casinos & Gaming 3.3% | | | | | | | | | | | | |
| | Aristocrat Technologies Inc., Term B-3 Loans, 4.219%, (3-month USD LIBOR + 1.75%), 10/19/24 | | | United States | | | | 16,848,724 | | | | 16,809,467 | |
| | Boyd Gaming Corp., | | | | | | | | | | | | |
| | Refinancing Term B Loans, 4.467%, (1-week USD LIBOR + 2.25%), 9/15/23 | | | United States | | | | 14,526,416 | | | | 14,564,025 | |
| | Term A Loan, 4.467%, (1-week USD LIBOR + 2.25%), 9/15/21 | | | United States | | | | 4,476,523 | | | | 4,484,916 | |
| | Caesars Resort Collection LLC/CRC Finco Inc., Term B Loans, 5.052%, (1-month USD LIBOR + 2.75%), 12/22/24 | | | United States | | | | 12,636,341 | | | | 12,656,647 | |
| | i CEOC LLC, Term B Loans, 4.302%, (1-month USD LIBOR + 2.00%), 10/06/24 | | | United States | | | | 8,861,331 | | | | 8,828,102 | |
| | | | |
| | | |
| franklintempleton.com | | Annual Report | | 45 |
FRANKLIN INVESTORS SECURITIES TRUST
STATEMENT OF INVESTMENTS
Franklin Floating Rate Daily Access Fund (continued)
| | | | | | | | | | | | | | |
| | | | | Country | | | Principal
Amount* | | | Value | |
| |
| | g,h Senior Floating Rate Interests (continued) | | | | | | | | | | | | |
| | Casinos & Gaming (continued) | | | | | | | | | | | | |
| | Eldorado Resorts Inc., Initial Term Loan, 4.563%, (1-month USD LIBOR + 2.25%), 4/17/24 | | | United States | | | $ | 12,873,438 | | | $ | 12,905,622 | |
| | Greektown Holdings LLC, Initial Term Loan, 5.052%, (1-month USD LIBOR + 2.75%), 4/25/24 | | | United States | | | | 15,310,581 | | | | 15,304,196 | |
| | Kingpin Intermediate Holdings LLC, Amendment No. 2 Term Loans, 5.81%, (1-month USD LIBOR + 3.50%), 7/03/24 | | | United States | | | | 2,772,000 | | | | 2,785,860 | |
| | Las Vegas Sands LLC, Term B Loans, 4.052%, (1-month USD LIBOR + 1.75%), 3/27/25 | | | United States | | | | 20,402,498 | | | | 20,357,286 | |
| | i Station Casinos LLC, Term B Facility Loans, 4.81%, (1-month USD LIBOR + 2.50%), 6/08/23 | | | United States | | | | 11,631,570 | | | | 11,639,363 | |
| | | | | | | | | | | | | | |
| | | | |
| | | | | | | | | | | | | 120,335,484 | |
| | | | | | | | | | | | | | |
| | Coal & Consumable Fuels 2.6% | | | | | | | | | | | | |
| | Bowie Resource Holdings LLC, | | | | | | | | | | | | |
| | First Lien Initial Term Loan, 8.052%, (1-month USD LIBOR + 5.75%), 8/14/20 | | | United States | | | | 35,504,254 | | | | 34,764,594 | |
| | Second Lien Initial Term Loan, 13.052%, (1-month USD LIBOR + 10.75%), 2/16/21 | | | United States | | | | 4,464,778 | | | | 4,286,187 | |
| | Foresight Energy LLC, Term Loans, 8.277%, (3-month USD LIBOR + 5.75%), 3/28/22 | | | United States | | | | 54,491,422 | | | | 54,707,099 | |
| | | | | | | | | | | | | | |
| | | | |
| | | | | | | | | | | | | 93,757,880 | |
| | | | | | | | | | | | | | |
| | Commodity Chemicals 0.6% | | | | | | | | | | | | |
| | Ineos U.S. Finance LLC, 2024 Dollar Term Loan, 4.302%, (1-month USD LIBOR + 2.00%), 3/31/24 | | | United States | | | | 21,636,198 | | | | 21,651,214 | |
| | | | | | | | | | | | | | |
| | Communications Equipment 0.7% | | | | | | | | | | | | |
| | Ciena Corp., senior secured note, 2018 Term Loan, 4.28%, (1-month USD LIBOR + 2.00%), 9/28/25 | | | United States | | | | 14,284,326 | | | | 14,324,493 | |
| | CommScope Inc., Tranche 5 Term Loans, 4.302%, (1-month USD LIBOR + 2.00%), 12/29/22 | | | United States | | | | 9,645,127 | | | | 9,681,297 | |
| | | | | | | | | | | | | | |
| | | | |
| | | | | | | | | | | | | 24,005,790 | |
| | | | | | | | | | | | | | |
| | Construction & Engineering 0.4% | | | | | | | | | | | | |
| | AECOM, Term B Loans, 4.052%, (1-month USD LIBOR + 1.75%), 3/13/25 | | | United States | | | | 15,932,501 | | | | 15,974,802 | |
| | | | | | | | | | | | | | |
| | Data Processing & Outsourced Services 0.7% | | | | | | | | | | | | |
| | Iron Mountain Information Management LLC, Term B Loan, 4.052%, (1-month USD LIBOR + 1.75%), 1/26/26 | | | United States | | | | 9,245,751 | | | | 9,130,179 | |
| | i Wex Inc., Term B-2 Loan, 4.552%, (1-month USD LIBOR + 2.25%), 7/01/23 | | | United States | | | | 18,004,449 | | | | 18,057,490 | |
| | | | | | | | | | | | | | |
| | | | |
| | | | | | | | | | | | | 27,187,669 | |
| | | | | | | | | | | | | | |
| | Diversified Chemicals 0.7% | | | | | | | | | | | | |
| | Chemours Co., Tranche B-2 US$ Term Loan, 4.05%, (1-month USD LIBOR + 1.75%), 4/03/25 | | | United States | | | | 18,318,472 | | | | 18,238,329 | |
| | i Univar USA Inc., Term B-3 Loans, 4.552%, (1-month USD LIBOR + 2.25%), 7/01/24 | | | United States | | | | 8,080,668 | | | | 8,086,558 | |
| | | | | | | | | | | | | | |
| | | | |
| | | | | | | | | | | | | 26,324,887 | |
| | | | | | | | | | | | | | |
| | Diversified Support Services 0.3% | | | | | | | | | | | | |
| | i,j United Rentals North America Inc., Initial Term Loans, TBD, 10/30/25 | | | United States | | | | 2,762,874 | | | | 2,778,415 | |
| | Ventia Pty. Ltd., Term B Loans (USD), 5.886%, (3-month USD LIBOR + 3.50%), 5/21/22 | | | Australia | | | | 9,756,638 | | | | 9,829,813 | |
| | | | | | | | | | | | | | |
| | | | |
| | | | | | | | | | | | | 12,608,228 | |
| | | | | | | | | | | | | | |
| | Electric Utilities 0.3% | | | | | | | | | | | | |
| | EFS Cogen Holdings I LLC (Linden), Term B Advance, 5.64%, (3-month USD LIBOR + 3.25%), 6/28/23 | | | United States | | | | 10,271,799 | | | | 10,270,884 | |
| | | | | | | | | | | | | | |
| | | | |
| | | |
| 46 | | Annual Report | | franklintempleton.com |
FRANKLIN INVESTORS SECURITIES TRUST
STATEMENT OF INVESTMENTS
Franklin Floating Rate Daily Access Fund (continued)
| | | | | | | | | | | | | | |
| | | | | Country | | | Principal
Amount* | | | Value | |
| |
| | g,h Senior Floating Rate Interests (continued) | | | | | | | | | | | | |
| | Fertilizers & Agricultural Chemicals 0.0%† | | | | | | | | | | | | |
| | Mosaic Co., Term Loan A, 3.78%, (1-month USD LIBOR + 1.50%), 11/18/21 | | | United States | | | $ | 435,893 | | | $ | 434,803 | |
| | | | | | | | | | | | | | |
| | Food Distributors 0.9% | | | | | | | | | | | | |
| | Aramark Corp., U.S. Term B-3 Loan, 4.052%, (1-month USD LIBOR + 1.75%), 3/11/25 | | | United States | | | | 18,524,719 | | | | 18,559,453 | |
| | Nutraceutical International Corp., Term Loan B, 5.552%, (1-month USD LIBOR + 3.25%), 8/22/23 | | | United States | | | | 5,069,600 | | | | 5,050,589 | |
| | U.S. Foods Inc., Initial Term Loans, 4.302%, (1-month USD LIBOR + 2.00%), 6/27/23 | | | United States | | | | 8,709,678 | | | | 8,706,978 | |
| | | | | | | | | | | | | | |
| | | | |
| | | | | | | | | | | | | 32,317,020 | |
| | | | | | | | | | | | | | |
| | Food Retail 0.9% | | | | | | | | | | | | |
| | BI-LO LLC (Southeastern Grocers), FILO Loan (ABL), 7.648%, (3-month USD LIBOR + 5.25%), 5/31/22 | | | United States | | | | 31,281,250 | | | | 31,281,250 | |
| | | | | | | | | | | | | | |
| | Forest Products 1.5% | | | | | | | | | | | | |
| | b Appvion Inc, Term Loan, 8.40%, (3-month USD LIBOR + 6.00%), 6/15/26 | | | United States | | | | 53,498,450 | | | | 53,498,450 | |
| | | | | | | | | | | | | | |
| | General Merchandise Stores 2.2% | | | | | | | | | | | | |
| | f 99 Cents Only Stores, First Lien Term Loan, PIK, 8.813% - 8.886%, (3-month USD LIBOR + 6.50%), 1/13/22 | | | United States | | | | 36,527,071 | | | | 35,180,135 | |
| | Evergreen AcqCo. 1 LP (Savers), Term Loan, 6.098% - 6.219%, (3-month USD LIBOR + 3.75%), 7/09/19 | | | United States | | | | 46,349,207 | | | | 45,132,541 | |
| | | | | | | | | | | | | | |
| | | | |
| | | | | | | | | | | | | 80,312,676 | |
| | | | | | | | | | | | | | |
| | Health Care Distributors 0.5% | | | | | | | | | | | | |
| | Mallinckrodt International Finance SA/CB LLC, Extended Term Loan B, 5.136%, (3-month USD LIBOR + 2.75%), 9/24/24 | | | Luxembourg | | | | 18,988,459 | | | | 18,791,986 | |
| | | | | | | | | | | | | | |
| | Health Care Facilities 0.4% | | | | | | | | | | | | |
| | HCA Inc., | | | | | | | | | | | | |
| | Term Loan B10, 4.302%, (1-month USD LIBOR + 2.00%), 3/13/25 | | | United States | | | | 8,119,001 | | | | 8,167,487 | |
| | Term Loan B11, 4.052%, (1-month USD LIBOR + 1.75%), 3/18/23 | | | United States | | | | 5,253,600 | | | | 5,280,335 | |
| | i,jUniversal Health Services Inc., Incremental Tranche B Term Loans, TBD, 10/31/25 | | | United States | | | | 1,976,511 | | | | 1,986,394 | |
| | | | | | | | | | | | | | |
| | | | |
| | | | | | | | | | | | | 15,434,216 | |
| | | | | | | | | | | | | | |
| | Health Care Services 2.0% | | | | | | | | | | | | |
| | Air Medical Group Holdings Inc., 2018 New Term Loans, 6.53%, (1-month USD LIBOR + 4.25%), 3/14/25 | | | United States | | | | 14,307,657 | | | | 14,080,523 | |
| | i Catalent Pharma Solutions Inc., Dollar Term Loan, 4.552%, (1-month USD LIBOR + 2.25%), 5/20/24 | | | United States | | | | 13,686,405 | | | | 13,762,173 | |
| | DaVita Healthcare Partners Inc., | | | | | | | | | | | | |
| | Tranche A Term Loan, 4.302%, (1-month USD LIBOR + 2.00%), 6/24/19 | | | United States | | | | 12,476,319 | | | | 12,507,510 | |
| | Tranche B Term Loan, 5.052%, (1-month USD LIBOR + 2.75%), 6/24/21 | | | United States | | | | 15,057,693 | | | | 15,108,227 | |
| | U.S. Renal Care Inc., Initial Term Loan, 6.636%, (3-month USD LIBOR + 4.25%), 12/31/22 | | | United States | | | | 18,196,938 | | | | 17,704,110 | |
| | | | | | | | | | | | | | |
| | | | |
| | | | | | | | | | | | | 73,162,543 | |
| | | | | | | | | | | | | | |
| | Health Care Technology 0.5% | | | | | | | | | | | | |
| | IQVIA Inc., | | | | | | | | | | | | |
| | Term B-1 Dollar Loans, 4.386%, (3-month USD LIBOR + 2.00%), 3/07/24 | | | United States | | | | 8,470,833 | | | | 8,500,481 | |
| | Term B-3 Dollar Loans, 4.136%, (3-month USD LIBOR + 1.75%), 6/11/25 | | | United States | | | | 8,778,000 | | | | 8,764,833 | |
| | | | | | | | | | | | | | |
| | | | |
| | | | | | | | | | | | | 17,265,314 | |
| | | | | | | | | | | | | | |
| | Hotels, Resorts & Cruise Lines 0.5% | | | | | | | | | | | | |
| | Hilton Worldwide Finance LLC, Series B-2 Term Loans, 4.031%, (1-month USD LIBOR + 1.75%), 10/25/23 | | | United States | | | | 17,083,972 | | | | 17,121,386 | |
| | | | | | | | | | | | | | |
| | | | |
| | | |
| franklintempleton.com | | Annual Report | | 47 |
FRANKLIN INVESTORS SECURITIES TRUST
STATEMENT OF INVESTMENTS
Franklin Floating Rate Daily Access Fund (continued)
| | | | | | | | | | | | | | |
| | | | | Country | | | Principal
Amount* | | | Value | |
| |
| | g,h Senior Floating Rate Interests (continued) | | | | | | | | | | | | |
| | Household Products 0.6% | | | | | | | | | | | | |
| | Spectrum Brands, Inc., | | | | | | | | | | | | |
| | USD Term Loans, 4.31%, (1-month USD LIBOR + 2.00%), 6/23/22 | | | United States | | | $ | 7,632,830 | | | $ | 7,650,325 | |
| | USD Term Loans, 4.33% - 4.40%, (2-month USD LIBOR + 2.00%), 6/23/22 | | | United States | | | | 10,145,391 | | | | 10,168,644 | |
| | USD Term Loans, 4.35%, (3-month USD LIBOR + 2.00%), 6/23/22 | | | United States | | | | 5,724,623 | | | | 5,737,744 | |
| | | | | | | | | | | | | | |
| | | | |
| | | | | | | | | | | | | 23,556,713 | |
| | | | | | | | | | | | | | |
| | Independent Power Producers & Energy Traders 1.8% | | | | | | | | | | | | |
| | NRG Energy Inc., Term Loan B, 4.136%, (3-month USD LIBOR + 1.75%), 6/30/23 | | | United States | | | | 65,952,628 | | | | 65,763,015 | |
| | | | | | | | | | | | | | |
| | Industrial Machinery 3.2% | | | | | | | | | | | | |
| | Altra Industrial Motion Corp., Term Loan, 4.302%, (1-month USD LIBOR + 2.00%), 10/01/25 | | | United States | | | | 14,886,097 | | | | 14,867,489 | |
| | Harsco Corp., Term Loan B-2, 4.563%, (1-month USD LIBOR + 2.25%), 12/10/24 | | | United States | | | | 17,858,533 | | | | 17,947,826 | |
| | Navistar Inc., Tranche B Term Loan, 5.78%, (1-month USD LIBOR + 3.50%), 11/06/24 | | | United States | | | | 61,898,050 | | | | 62,052,796 | |
| | Onsite Rental Group Operations Property Ltd., Term Loan, 6.781%, (1-month USD LIBOR + 4.50%), 10/25/22 | | | Australia | | | | 14,526,645 | | | | 14,381,378 | |
| | i RBS Global Inc. (Rexnord), Term B Loan, 4.295%, (1-month USD LIBOR + 2.00%), 8/21/24 | | | United States | | | | 8,700,000 | | | | 8,724,464 | |
| | | | | | | | | | | | | | |
| | | | |
| | | | | | | | | | | | | 117,973,953 | |
| | | | | | | | | | | | | | |
| | Integrated Telecommunication Services 1.9% | | | | | | | | | | | | |
| | Global Tel*Link Corp., | | | | | | | | | | | | |
| | Second Lien Term Loan, 10.636%, (3-month USD LIBOR + 8.25%), 11/23/20 | | | United States | | | | 6,033,937 | | | | 6,056,564 | |
| | Term Loan, 6.386%, (3-month USD LIBOR + 4.00%), 5/23/20 | | | United States | | | | 9,652,638 | | | | 9,694,869 | |
| | Securus Technologies Holdings Inc., Second Lien Initial Loan, 10.552%, (1-month USD LIBOR + 8.25%), 11/01/25 | | | United States | | | | 1,042,786 | | | | 1,046,696 | |
| | Zayo Group LLC, 2017 Incremental Refinancing B-1 Term Loan, 4.302%, (1-month USD LIBOR + 2.00%), 1/19/21 | | | United States | | | | 53,324,476 | | | | 53,413,368 | |
| | | | | | | | | | | | | | |
| | | | |
| | | | | | | | | | | | | 70,211,497 | |
| | | | | | | | | | | | | | |
| | Interactive Media & Services 0.5% | | | | | | | | | | | | |
| | i Ancestrycom Operations Inc., First Lien, Term Loan, 5.55%, (1-month USD LIBOR + 3.25%), 10/19/23 | | | United States | | | | 1,741,936 | | | | 1,748,468 | |
| | Go Daddy Operating Co. LLC, Tranche B-1 Term Loans, 4.552%, (1-month USD LIBOR + 2.25%), 2/15/24 | | | United States | | | | 17,887,750 | | | | 17,928,087 | |
| | | | | | | | | | | | | | |
| | | | |
| | | | | | | | | | | | | 19,676,555 | |
| | | | | | | | | | | | | | |
| | Internet Services & Infrastructure 0.0%† | | | | | | | | | | | | |
| | Legalzoom.com Inc., Initial Term Loan, 6.537%, (1-month USD LIBOR + 4.25%), 11/21/24 | | | United States | | | | 1,714,544 | | | | 1,729,546 | |
| | | | | | | | | | | | | | |
| | IT Consulting & Other Services 0.4% | | | | | | | | | | | | |
| | i Gartner Inc., Tranche A Term Loans, 4.052%, (1-month USD LIBOR + 1.75%), 3/21/22 | | | United States | | | | 9,236,322 | | | | 9,288,275 | |
| | Rackspace Hosting Inc., Term B Loans, 5.348%, (3-month USD LIBOR + 3.00%), 11/03/23 | | | United States | | | | 5,247,676 | | | | 5,104,467 | |
| | | | | | | | | | | | | | |
| | | | |
| | | | | | | | | | | | | 14,392,742 | |
| | | | | | | | | | | | | | |
| | Leisure Facilities 0.6% | | | | | | | | | | | | |
| | 24 Hour Fitness Worldwide Inc., Term Loan, 5.802%, (1-month USD LIBOR + 3.50%), 5/30/25 | | | United States | | | | 13,694,350 | | | | 13,745,705 | |
| | Equinox Holdings Inc., Term B-1 Loans, 5.302%, (1-month USD LIBOR + 3.00%), 3/08/24 | | | United States | | | | 8,578,338 | | | | 8,621,229 | |
| | | | | | | | | | | | | | |
| | | | |
| | | | | | | | | | | | | 22,366,934 | |
| | | | | | | | | | | | | | |
| | | | |
| | | |
| 48 | | Annual Report | | franklintempleton.com |
FRANKLIN INVESTORS SECURITIES TRUST
STATEMENT OF INVESTMENTS
Franklin Floating Rate Daily Access Fund (continued)
| | | | | | | | | | | | | | |
| | | | | Country | | | Principal
Amount* | | | Value | |
| |
| | g,h Senior Floating Rate Interests (continued) | | | | | | | | | | | | |
| | Life Sciences Tools & Services 0.4% | | | | | | | | | | | | |
| | Syneos Health Inc., Initial Term B Loans, 4.302%, (1-month USD LIBOR + 2.00%), 8/01/24 | | | United States | | | $ | 13,816,706 | | | $ | 13,801,370 | |
| | | | | | | | | | | | | | |
| | Marine 0.6% | | | | | | | | | | | | |
| | International Seaways Operating Corp., Initial Term Loans, 8.26%, (1-month USD LIBOR + 5.50%), 6/22/22 | | | United States | | | | 5,788,167 | | | | 5,824,343 | |
| | Navios Maritime Partners LP, Initial Term Loan, 7.34%, (3-month USD LIBOR + 5.00%), 9/14/20 | | | United States | | | | 15,360,658 | | | | 15,386,264 | |
| | | | | | | | | | | | | | |
| | | | |
| | | | | | | | | | | | | 21,210,607 | |
| | | | | | | | | | | | | | |
| | Metal & Glass Containers 0.7% | | | | | | | | | | | | |
| | i Berry Global Inc., Term Loan Q, 4.277%, (1-month USD LIBOR + 2.00%), 10/01/22 | | | United States | | | | 13,400,204 | | | | 13,410,669 | |
| | Crown Americas LLC, Dollar Term B Loan, 4.283%, (1-month USD LIBOR + 2.00%), 4/03/25 | | | United States | | | | 10,616,797 | | | | 10,653,298 | |
| | | | | | | | | | | | | | |
| | | | |
| | | | | | | | | | | | | 24,063,967 | |
| | | | | | | | | | | | | | |
| | Movies & Entertainment 1.3% | | | | | | | | | | | | |
| | AMC Entertainment Holdings Inc., | | | | | | | | | | | | |
| | 2016 Incremental Term Loans, 4.53%, (1-month USD LIBOR + 2.25%), 12/15/23 | | | United States | | | | 3,307,986 | | | | 3,314,189 | |
| | Initial Term Loans, 4.53%, (1-month USD LIBOR + 2.25%), 12/15/22 | | | United States | | | | 5,254,346 | | | | 5,264,199 | |
| | Lions Gate Capital Holdings LLC, Term A Loan, 4.052%, (1-month USD LIBOR + 1.75%), 3/22/23 | | | Canada | | | | 27,168,403 | | | | 27,202,364 | |
| | Live Nation Entertainment Inc., Term B-3 Loans, 4.063%, (1-month USD LIBOR + 1.75%), 10/ 31/23 | | | United States | | | | 11,968,678 | | | | 12,000,467 | |
| | | | | | | | | | | | | | |
| | | | |
| | | | | | | | | | | | | 47,781,219 | |
| | | | | | | | | | | | | | |
| | Oil & Gas Exploration & Production 5.1% | | | | | | | | | | | | |
| | Cantium LLC, Commitment, 8.39%, (3-month USD LIBOR + 6.00%), 6/13/20 | | | United States | | | | 20,820,742 | | | | 21,009,378 | |
| | Fieldwood Energy LLC, Closing Date Loans, 7.552%, (1-month USD LIBOR + 5.25%), 4/11/22 | | | United States | | | | 138,632,416 | | | | 139,759,498 | |
| | UTEX Industries Inc., First Lien Initial Term Loan, 6.302%, (1-month USD LIBOR + 4.00%), 5/21/21 | | | United States | | | | 28,637,363 | | | | 28,243,599 | |
| | | | | | | | | | | | | | |
| | | | |
| | | | | | | | | | | | | 189,012,475 | |
| | | | | | | | | | | | | | |
| | Oil & Gas Storage & Transportation 0.9% | | | | | | | | | | | | |
| | Centurion Pipeline Company LLC, senior secured note, Initial Term Loans, 5.636%, (3-month USD LIBOR + 3.75%), 9/28/25 | | | United States | | | | 6,502,154 | | | | 6,559,048 | |
| | OSG Bulk Ships Inc., Initial Term Loan, 6.77%, (6-month USD LIBOR + 4.25%), 8/05/19 | | | United States | | | | 19,016,612 | | | | 18,858,204 | |
| | Strike LLC, Term Loan, 10.386% - 10.594%, (3-month USD LIBOR + 8.00%), 11/30/22 | | | United States | | | | 6,825,500 | | | | 6,893,755 | |
| | | | | | | | | | | | | | |
| | | | |
| | | | | | | | | | | | | 32,311,007 | |
| | | | | | | | | | | | | | |
| | Other Diversified Financial Services 0.3% | | | | | | | | | | | | |
| | Asurion LLC, | | | | | | | | | | | | |
| | i Replacement B-4 Term Loans, 5.302%, (1-month USD LIBOR + 3.00%), 8/04/22 | | | United States | | | | 7,979,190 | | | | 8,001,627 | |
| | Replacement B-6 Term Loans, 5.302%, (1-month USD LIBOR + 3.00%), 11/03/23 | | | United States | | | | 3,481,929 | | | | 3,490,634 | |
| | | | | | | | | | | | | | |
| | | | |
| | | | | | | | | | | | | 11,492,261 | |
| | | | | | | | | | | | | | |
| | | | |
| | | |
| franklintempleton.com | | Annual Report | | 49 |
FRANKLIN INVESTORS SECURITIES TRUST
STATEMENT OF INVESTMENTS
Franklin Floating Rate Daily Access Fund (continued)
| | | | | | | | | | | | |
| | | Country | | | Principal
Amount* | | | Value | |
| |
g,h Senior Floating Rate Interests (continued) | | | | | | | | | | | | |
Packaged Foods & Meats 2.8% | | | | | | | | | | | | |
CSM Bakery Supplies LLC, | | | | | | | | | | | | |
Second Lien Term Loan, 10.16%, (3-month USD LIBOR + 7.75%), 7/03/21 | | | United States | | | $ | 12,540,519 | | | $ | 11,662,683 | |
Term Loans, 6.41%, (3-month USD LIBOR + 4.00%), 7/03/20 | | | United States | | | | 7,837,154 | | | | 7,562,853 | |
JBS USA LUX SA, New Initial Term Loans, 4.837% - 4.886%, (3-month USD LIBOR + 2.50%), 10/30/22 | | | United States | | | | 61,049,421 | | | | 61,120,971 | |
Post Holdings Inc., Series A Incremental Term Loans, 4.29%, (1-month USD LIBOR + 2.00%), 5/24/24 | | | United States | | | | 21,527,610 | | | | 21,519,192 | |
| | | | | | | | | | | | |
| | | |
| | | | | | | | | | | 101,865,699 | |
| | | | | | | | | | | | |
Paper Packaging 0.9% | | | | | | | | | | | | |
Caraustar Industries Inc., Refinancing Term Loans, 7.886%, (3-month USD LIBOR + 5.50%), 3/14/22 | | | United States | | | | 23,663,618 | | | | 23,800,394 | |
Reynolds Group Holdings Inc., U.S. Term Loans, 5.052%, (1-month USD LIBOR + 2.75%), 2/05/23 | | | United States | | | | 8,771,558 | | | | 8,790,057 | |
| | | | | | | | | | | | |
| | | |
| | | | | | | | | | | 32,590,451 | |
| | | | | | | | | | | | |
Personal Products 1.2% | | | | | | | | | | | | |
c FGI Operating Co. LLC (Freedom Group), | | | | | | | | | | | | |
DDTL Filo, 9.313%, (3-month USD LIBOR + 7.00%), 5/15/21 | | | United States | | | | 527,273 | | | | 522,560 | |
f Term Loan, PIK, 12.314%, (3-month USD LIBOR + 10.00%), 5/15/22 | | | United States | | | | 41,244,945 | | | | 40,180,612 | |
Term Loan FILO, 9.314%, (3-month USD LIBOR + 7.00%), 5/15/21 | | | United States | | | | 5,272,727 | | | | 5,225,600 | |
| | | | | | | | | | | | |
| | | |
| | | | | | | | | | | 45,928,772 | |
| | | | | | | | | | | | |
Pharmaceuticals 3.1% | | | | | | | | | | | | |
i Bausch Health Cos. Inc., Initial Term Loans, 5.274%, (1-month USD LIBOR + 3.00%), 6/02/25 | | | United States | | | | 18,276,953 | | | | 18,318,844 | |
Endo Luxembourg Finance Co. I S.A.R.L. and Endo LLC, Initial Term Loans, 6.563%, (1-month USD LIBOR + 4.25%), 4/29/24 | | | United States | | | | 26,290,366 | | | | 26,410,645 | |
Grifols Worldwide Operations USA Inc., Tranche B Term Loan, 4.467%, (1-week USD LIBOR + 2.25%), 1/31/25 | | | United States | | | | 30,660,104 | | | | 30,723,325 | |
i Horizon Pharma Inc., Fourth Amendment Refinancing Term Loan, 5.313%, (1-month USD LIBOR + 3.00%), 3/29/24 | | | United States | | | | 37,084,985 | | | | 37,131,341 | |
Innoviva Inc., Initial Term Loan, 6.812%, (3-month USD LIBOR + 4.50%), 8/18/22 | | | United States | | | | 172,970 | | | | 173,835 | |
| | | | | | | | | | | | |
| | | |
| | | | | | | | | | | 112,757,990 | |
| | | | | | | | | | | | |
Restaurants 0.8% | | | | | | | | | | | | |
KFC Holding Co./Pizza Hut Holdings LLC/Taco Bell of America LLC (Yum Brands), Term
Loan B, 4.037%, (1-month USD LIBOR + 1.75%), 4/03/25 | | | United States | | | | 19,595,398 | | | | 19,622,949 | |
NPC International Inc., Second Lien Initial Term Loan, 9.802%, (1-month USD LIBOR + 7.50%), 4/20/25 | | | United States | | | | 8,228,426 | | | | 8,331,281 | |
| | | | | | | | | | | | |
| | | |
| | | | | | | | | | | 27,954,230 | |
| | | | | | | | | | | | |
Security & Alarm Services 0.2% | | | | | | | | | | | | |
Prime Security Services Borrower LLC, Term B-1 Loans, 5.052%, (1-month USD LIBOR + 2.75%), 5/02/22 | | | United States | | | | 8,460,948 | | | | 8,474,544 | |
| | | | | | | | | | | | |
Semiconductors 0.8% | | | | | | | | | | | | |
ON Semiconductor Corp., 2018 New Replacement Term B-3 Loans, 4.052%, (1-month USD LIBOR + 1.75%), 3/31/23 | | | United States | | | | 28,274,740 | | | | 28,265,918 | |
| | | | | | | | | | | | |
| | | | |
| | | |
| 50 | | Annual Report | | franklintempleton.com |
FRANKLIN INVESTORS SECURITIES TRUST
STATEMENT OF INVESTMENTS
Franklin Floating Rate Daily Access Fund (continued)
| | | | | | | | | | | | |
| | | Country | | | Principal
Amount* | | | Value | |
| |
g,h Senior Floating Rate Interests (continued) | | | | | | | | | | | | |
Specialized Consumer Services 1.7% | | | | | | | | | | | | |
Avis Budget Car Rental LLC, Tranche B Term Loans, 4.31%, (1-month USD LIBOR + 2.00%), 2/13/25 | | | United States | | | $ | 30,610,267 | | | $ | 30,571,086 | |
NVA Holdings Inc., Term B-3 Loan, 5.052%, (1-month USD LIBOR + 2.75%), 2/02/25 | | | United States | | | | 15,821,024 | | | | 15,725,433 | |
Sabre GLBL Inc., | | | | | | | | | | | | |
2017 Other Term A Loans, 4.302%, (1-month USD LIBOR + 2.00%), 7/01/22 | | | United States | | | | 12,804,100 | | | | 12,824,100 | |
2018 Other Term B Loans, 4.302%, (1-month USD LIBOR + 2.00%), 2/22/24 | | | United States | | | | 1,868,281 | | | | 1,869,783 | |
| | | | | | | | | | | | |
| | | |
| | | | | | | | | | | 60,990,402 | |
| | | | | | | | | | | | |
Specialized Finance 0.4% | | | | | | | | | | | | |
Trans Union LLC, 2017 Replacement Term A-2 Loans, 4.052%, (1-month USD LIBOR + 1.75%), 8/09/22 | | | United States | | | | 13,757,054 | | | | 13,782,848 | |
| | | | | | | | | | | | |
Specialty Chemicals 2.7% | | | | | | | | | | | | |
Ashland LLC, Term B Loan, 4.03% - 4.052%, (1-month USD LIBOR + 1.75%), 5/17/24 | | | United States | | | | 16,919,357 | | | | 16,981,028 | |
Axalta Coating Systems U.S. Holdings Inc., Term B-3 Dollar Loan, 4.136%, (3-month USD LIBOR + 1.75%), 6/01/24 | | | United States | | | | 32,337,158 | | | | 32,301,263 | |
KMG Chemicals Inc., Initial Term Loan, 4.802%, (1-month USD LIBOR + 2.50%), 6/15/24 | | | United States | | | | 2,570,473 | | | | 2,573,686 | |
Oxbow Carbon LLC, | | | | | | | | | | | | |
Second Lien Term Loan, 9.802%, (1-month USD LIBOR + 7.50%), 1/04/24 | | | United States | | | | 14,095,184 | | | | 14,412,326 | |
Tranche A Term Loan, 4.552%, (1-month USD LIBOR + 2.25%), 1/04/22 | | | United States | | | | 12,950,000 | | | | 12,982,375 | |
Tranche B Term Loan, 5.802%, (1-month USD LIBOR + 3.50%), 1/04/23 | | | United States | | | | 10,674,125 | | | | 10,714,153 | |
WR Grace & Co., | | | | | | | | | | | | |
Term B-1 Loans, 4.136%, (3-month USD LIBOR + 1.75%), 4/03/25 | | | United States | | | | 3,896,405 | | | | 3,908,987 | |
Term B-2 Loans, 4.136%, (3-month USD LIBOR + 1.75%), 4/03/25 | | | United States | | | | 6,679,552 | | | | 6,701,120 | |
| | | | | | | | | | | | |
| | | |
| | | | | | | | | | | 100,574,938 | |
| | | | | | | | | | | | |
Specialty Stores 3.5% | | | | | | | | | | | | |
General Nutrition Centers Inc., | | | | | | | | | | | | |
FILO Term Loan (ABL), 9.31%, (1-month USD LIBOR + 7.00%), 12/31/22 | | | United States | | | | 26,060,479 | | | | 26,744,567 | |
Tranche B-2 Term Loans, 11.56%, (1-month USD LIBOR + 9.25%), 3/04/21 | | | United States | | | | 47,167,984 | | | | 46,171,560 | |
Tranche B-2 Term Loans, 13.50%, (Prime + 7.75%), 3/04/21 | | | United States | | | | 8,242,753 | | | | 8,068,625 | |
Harbor Freight Tools USA Inc., Refinancing Loans, 4.802%, (1-month USD LIBOR + 2.50%), 8/19/23 | | | United States | | | | 9,083,333 | | | | 8,957,729 | |
i Jo-Ann Stores Inc., Initial Loans, 7.477%, (3-month USD LIBOR + 5.00%), 10/23/23 | | | United States | | | | 8,263,158 | | | | 8,275,205 | |
Michaels Stores Inc., 2018 New Replacement Term B Loan, 4.787% - 4.797%, (1-month USD LIBOR + 2.50%), 1/28/23 | | | United States | | | | 27,860,000 | | | | 27,713,735 | |
i PETCO Animal Supplies Stores Inc., Second Amendment Term Loans, 5.777%, (3-month USD LIBOR + 3.25%), 1/26/23 | | | United States | | | | 2,800,000 | | | | 2,181,668 | |
| | | | | | | | | | | | |
| | | |
| | | | | | | | | | | 128,113,089 | |
| | | | | | | | | | | | |
Technology Distributors 0.2% | | | | | | | | | | | | |
CDW LLC, Term B Loan, 4.06%, (1-month USD LIBOR + 1.75%), 8/17/23 | | | United States | | | | 8,882,893 | | | | 8,910,652 | |
| | | | | | | | | | | | |
Technology Hardware, Storage & Peripherals 0.1% | | | | | | | | | | | | |
Western Digital Corp., US Term B-4 Loan, 4.044%, (1-month USD LIBOR + 1.75%), 4/29/23 | | | United States | | | | 5,608,213 | | | | 5,582,976 | |
| | | | | | | | | | | | |
Trucking 1.4% | | | | | | | | | | | | |
Hertz Corp., Tranche B-1 Term Loan, 5.06%, (1-month USD LIBOR + 2.75%), 6/30/23 | | | United States | | | | 51,403,696 | | | | 51,214,941 | |
| | | | | | | | | | | | |
| | | |
Total Senior Floating Rate Interests
(Cost $2,635,293,306) | | | | | | | | | | | 2,639,884,814 | |
| | | | | | | | | | | | |
| | | | |
| | | |
| franklintempleton.com | | Annual Report | | 51 |
FRANKLIN INVESTORS SECURITIES TRUST
STATEMENT OF INVESTMENTS
Franklin Floating Rate Daily Access Fund (continued)
| | | | | | | | | | | | |
| | | Country | | | Principal
Amount* | | | Value | |
| |
Asset-Backed Securities 14.1% | | | | | | | | | | | | |
Multi-Sector Holdings 0.5% | | | | | | | | | | | | |
k,l Atrium IX, 9A, CR, 144A, FRN, 4.861%, (3-month USD LIBOR + 2.55%), 5/28/30 | | | United States | | | $ | 3,511,200 | | | $ | 3,525,947 | |
k,l Madison Park Funding XXIII Ltd., 2017-23A, C, 144A, FRN, 4.859%, (3-month USD LIBOR + 2.35%), 7/27/30 | | | United States | | | | 3,000,000 | | | | 3,011,250 | |
k,l Magnetite XVIII Ltd., 2016-18A, C, 144A, FRN, 4.664%, (3-month USD LIBOR + 2.35%), 11/15/28 | | | United States | | | | 11,823,000 | | | | 11,833,523 | |
k,l Octagon Investment Partners XX Ltd., 2014-1A, AR, 144A, FRN, 3.468%, (3-month USD LIBOR + 1.13%), 8/12/26 | | | United States | | | | 1,063,164 | | | | 1,064,567 | |
| | | | | | | | | | | | |
| | | |
| | | | | | | | | | | 19,435,287 | |
| | | | | | | | | | | | |
Other Diversified Financial Services 13.6% | | | | | | | | | | | | |
k,l Alinea CLO Ltd., 2018-1A, C, 144A, FRN, 4.207%, (3-month USD LIBOR + 1.90%), 7/20/31 | | | United States | | | | 10,475,000 | | | | 10,414,873 | |
k,l AMMC CLO XII Ltd., 2013-12A, CR, 144A, FRN, 4.241%, (3-month USD LIBOR + 1.90%), 11/10/30 | | | United States | | | | 1,493,000 | | | | 1,478,563 | |
k,l Annisa CLO Ltd., 2016-2A, CR, 144A, FRN, 4.45%, (3-month USD LIBOR + 2.00%), 7/20/31 | | | United States | | | | 1,800,000 | | | | 1,785,366 | |
k,mARES XLIX CLO Ltd., 2018-49A, C, 144A, FRN, 4.293%, 7/22/30 | | | United States | | | | 10,000,000 | | | | 9,943,000 | |
k,l ARES XLVIII CLO Ltd., 2018-48A, C, 144A, FRN, 4.139%, (3-month USD LIBOR + 1.80%), 7/20/30 | | | United States | | | | 6,270,000 | | | | 6,228,555 | |
k,l ARES XXXVII CLO Ltd., 2015-4A, BR, 144A, FRN, 4.236%, (3-month USD LIBOR + 1.80%), 10/15/30 | | | United States | | | | 4,908,000 | | | | 4,877,325 | |
k,l Atrium XI, | | | | | | | | | | | | |
2011A, A2R, 144A, FRN, 3.617%,(3-month USD LIBOR + 1.14%), 10/23/25 | | | United States | | | | 1,149,026 | | | | 1,149,830 | |
2011A, CR, 144A, FRN, 4.627%,(3-month USD LIBOR + 2.15%), 10/23/25 | | | United States | | | | 574,513 | | | | 575,972 | |
k,m Atrium XIV LLC, | | | | | | | | | | | | |
14A, B, 144A, FRN, 4.01%, 8/23/30 | | | United States | | | | 6,300,000 | | | | 6,313,545 | |
14A, C, 144A, FRN, 4.26%, 8/23/30 | | | United States | | | | 6,000,000 | | | | 5,979,240 | |
k,l Betony CLO 2 Ltd., 2018-1A, B, 144A, FRN, 4.37%, (3-month USD LIBOR + 1.85%), 4/30/31 | | | United States | | | | 5,700,000 | | | | 5,622,594 | |
k,l BlueMountain CLO Ltd., 2012-2A, AR, 144A, FRN, 3.742%, (3-month USD LIBOR + 1.42%), 11/20/28 | | | United States | | | | 23,309,026 | | | | 23,319,748 | |
k,m BlueMountain CLO XXII Ltd., | | | | | | | | | | | | |
2018-1A, B, 144A, FRN, 4.22%, 7/30/30 | | | United States | | | | 10,330,510 | | | | 10,341,047 | |
2018-1A, C, 144A, FRN, 4.57%, 7/30/30 | | | United States | | | | 3,750,000 | | | | 3,747,263 | |
k,l Bristol Park CLO Ltd., 2016-1A, A, 144A, FRN, 3.856%, (3-month USD LIBOR + 1.42%), 4/15/29 | | | United States | | | | 40,000,000 | | | | 40,142,800 | |
k,l Carlyle Global Market Strategies CLO Ltd., | | | | | | | | | | | | |
2014-1A, A1R2, 144A, FRN, 3.419%,(3-month USD LIBOR + 0.97%), 4/17/31 | | | United States | | | | 2,880,000 | | | | 2,859,379 | |
2014-4RA, B, 144A, FRN, 4.336%,(3-month USD LIBOR + 1.90%), 7/15/30 | | | United States | | | | 6,560,000 | | | | 6,510,800 | |
2015-2A, A1R, 144A, FRN, 3.289%,(3-month USD LIBOR + 0.78%), 4/27/27 | | | United States | | | | 16,540,000 | | | | 16,535,700 | |
k,l Carlyle U.S. CLO Ltd., | | | | | | | | | | | | |
2017-1A, A1A, 144A, FRN, 3.769%,(3-month USD LIBOR + 1.30%), 4/20/31 | | | United States | | | | 24,000,000 | | | | 24,016,080 | |
2017-4A, B, 144A, FRN, 4.286%,(3-month USD LIBOR + 1.85%), 1/15/30 | | | United States | | | | 1,493,000 | | | | 1,487,775 | |
k,m Cent CLO, 2018-27A, B, 144A, FRN, 4.79%, 10/25/28 | | | United States | | | | 1,400,000 | | | | 1,400,000 | |
k,l Cent CLO LP, | | | | | | | | | | | | |
2014-22A, A1R, 144A, FRN, 3.753%,(3-month USD LIBOR + 1.41%), 11/07/26 | | | United States | | | | 5,000,000 | | | | 5,004,700 | |
2014-22A, BR, 144A, FRN, 5.293%,(3-month USD LIBOR + 2.95%), 11/07/26 | | | United States | | | | 9,123,539 | | | | 9,141,877 | |
| | | | |
| | | |
| 52 | | Annual Report | | franklintempleton.com |
FRANKLIN INVESTORS SECURITIES TRUST
STATEMENT OF INVESTMENTS
Franklin Floating Rate Daily Access Fund (continued)
| | | | | | | | | | | | |
| | | Country | | | Principal
Amount* | | | Value | |
| |
Asset-Backed Securities (continued) | | | | | | | | | | | | |
Other Diversified Financial Services (continued) | | | | | | | | | | | | |
k,m Dryden 40 Senior Loan Fund, 2015-40A, CR, 144A, FRN, 4.414%, 8/15/31 | | | United States | | | $ | 2,000,000 | | | $ | 2,003,820 | |
k,l Dryden CLO Ltd., 2018-58A, C, 144A, FRN, 4.121%, (3-month USD LIBOR + 1.80%), 7/17/31 | | | United States | | | | 11,000,000 | | | | 10,872,510 | |
k,l Dryden Senior Loan Fund, 2016-42A, CR, 144A, FRN, 4.486%, (3-month USD LIBOR + 2.05%), 7/15/30 | | | United States | | | | 6,200,000 | | | | 6,184,500 | |
k,m Eaton Vance CLO Ltd., 2014-1RA, C, 144A, FRN, 4.257%, 7/15/30 | | | United States | | | | 5,136,585 | | | | 5,114,446 | |
k Emerson Park CLO Ltd., 2013-1A, C2R, 144A, 4.055%, 7/15/25 | | | United States | | | | 3,600,000 | | | | 3,603,456 | |
k,l Flagship CLO VIII Ltd., 2014-8A, CRR, 144A, FRN, 4.236%, (3-month USD LIBOR + 1.80%), 1/16/26 | | | United States | | | | 6,700,000 | | | | 6,674,004 | |
k,l Galaxy XVIII CLO Ltd., 2018-28A, C, 144A, FRN, 4.289%, (3-month USD LIBOR + 1.95%), 7/15/31 | | | United States | | | | 5,300,000 | | | | 5,267,193 | |
k,m,nGalaxy XXV CLO Ltd., | | | | | | | | | | | | |
2018-25A, B, 144A, FRN, 10/25/31 | | | United States | | | | 4,000,000 | | | | 4,000,440 | |
2018-25A, C, 144A, FRN, 10/25/31 | | | United States | | | | 500,000 | | | | 492,485 | |
k,n,o Galaxy XXVI CLO Ltd., 2018-26A, C, 144A, FRN, 11/22/31 | | | United States | | | | 1,200,000 | | | | 1,200,000 | |
k,l Gilbert Park CLO Ltd., 2017-1A, C, 144A, FRN, 4.386%, (3-month USD LIBOR + 1.95%), 10/15/30 | | | United States | | | | 350,000 | | | | 350,308 | |
k,mLCM Loan Income Fund I Income Note Issuer Ltd., 2027A, C, 144A, FRN, 4.401%, 7/16/31 | | | United States | | | | 10,050,000 | | | | 10,037,438 | |
k,l LCM XV LP, 2015-A, CR, 144A, FRN, 4.869%, (3-month USD LIBOR + 2.40%), 7/20/30 | | | United States | | | | 6,500,000 | | | | 6,533,865 | |
k,l LCM XXIV Ltd., 24A, A, 144A, FRN, 3.779%, (3-month USD LIBOR + 1.31%), 3/20/30 | | | United States | | | | 52,000,000 | | | | 52,246,480 | |
k,l LCM XXV Ltd., 25A, A, 144A, FRN, 3.679%, (3-month USD LIBOR + 1.21%), 7/20/30 | | | United States | | | | 2,580,000 | | | | 2,582,864 | |
k,l Madison Park Funding Ltd., | | | | | | | | | | | | |
2016-21A, A1, 144A, FRN, 4.02%,(3-month USD LIBOR + 1.53%), 7/25/29 | | | United States | | | | 17,200,000 | | | | 17,307,156 | |
2018-28A, C, 144A, FRN, 4.187%,(3-month USD LIBOR + 1.85%), 7/15/30 | | | United States | | | | 13,350,000 | | | | 13,304,476 | |
k,l Madison Park Funding XI LTD., 2013-11, CR, 144A, FRN, 4.677%, (3-month USD LIBOR + 2.20%), 7/23/29 | | | United States | | | | 2,040,000 | | | | 2,044,712 | |
k,l Madison Park Funding XXII Ltd., 2016-22A, C, 144A, FRN, 4.89%, (3-month USD LIBOR + 2.40%), 10/25/29 | | | United States | | | | 3,317,500 | | | | 3,320,320 | |
k,l Madison Park Funding XXIV Ltd., 2016-24A, C1, 144A, FRN, 5.069%, (3-month USD LIBOR + 2.60%), 1/20/28 | | | United States | | | | 1,875,000 | | | | 1,885,500 | |
k,l Neuberger Berman CLO Ltd., 2017-26A, C, 144A, FRN, 4.195%, (3-month USD LIBOR + 1.75%), 10/18/30 | | | United States | | | | 746,000 | | | | 739,473 | |
k,l Octagon Investment Partners 26 Ltd., 2016-1A, CR, 144A, FRN, 4.236%, (3-month USD LIBOR + 1.80%), 7/15/30 | | | United States | | | | 10,220,000 | | | | 10,104,616 | |
k,m Octagon Investment Partners 27 Ltd., 2016-1A, CR, 144A, FRN, 4.536%, 7/15/30 | | | United States | | | | 7,435,000 | | | | 7,424,145 | |
k,l Octagon Investment Partners 30 Ltd., 144A, FRN, 3.789%, (3-month USD LIBOR + 1.32%), 3/17/30 | | | United States | | | | 23,071,429 | | | | 23,157,024 | |
k,l Octagon Investment Partners 31 LLC, 2017-1A, C, 144A, FRN, 4.869%, (3-month USD LIBOR + 2.40%), 7/20/30 | | | United States | | | | 4,208,540 | | | | 4,228,573 | |
k,l Octagon Investment Partners 37 Ltd., 2018-2A, B, 144A, FRN, 4.11%, (3-month USD LIBOR + 1.75%), 7/25/30 | | | United States | | | | 10,875,000 | | | | 10,746,349 | |
k,m Octagon Investment Partners 38, 2018-1A, A3A, 144A, FRN, 3.857%, 7/20/30 | | | United States | | | | 3,484,000 | | | | 3,486,613 | |
k,l Octagon Investment Partners XVI Ltd., 2013-1A, CR, 144A, FRN, 4.186%, (3-month USD LIBOR + 1.85%), 7/17/30 | | | United States | | | | 12,500,000 | | | | 12,395,750 | |
k,l Octagon Investment Partners XXII Ltd., 2014-1A, CRR, 144A, FRN, 4.369%, (3-month USD LIBOR + 1.90%), 1/22/30 | | | United States | | | | 3,000,000 | | | | 2,978,730 | |
k,m Race Point X CLO Ltd., 2016-10A, C1R, 144A, FRN, 4.49%, 7/25/31 | | | United States | | | | 7,000,000 | | | | 6,977,950 | |
| | | | |
| | | |
| franklintempleton.com | | Annual Report | | 53 |
FRANKLIN INVESTORS SECURITIES TRUST
STATEMENT OF INVESTMENTS
Franklin Floating Rate Daily Access Fund (continued)
| | | | | | | | | | | | |
| | | Country | | | Principal
Amount* | | | Value | |
| |
Asset-Backed Securities (continued) | | | | | | | | | | | | |
Other Diversified Financial Services (continued) | | | | | | | | | | | | |
k,l TCI-Cent CLO Income Note Issuer Ltd., 2017-1A, B, 144A, FRN, 4.84%, (3-month USD LIBOR + 2.35%), 7/25/30 | | | United States | | | $ | 9,671,118 | | | $ | 9,707,191 | |
k,l Venture XXIV CLO Ltd., 2016-24A, A1D, 144A, FRN, 3.889%, (3-month USD LIBOR + 1.42%), 10/20/28 | | | United States | | | | 34,000,000 | | | | 34,101,320 | |
k Voya CLO Ltd., | | | | | | | | | | | | |
m 2016-3A, BR, 144A, FRN, 4.671%, 10/18/31 | | | United States | | | | 10,000,000 | | | | 10,000,000 | |
l 2017-3A, B, 144A, FRN, 4.819%,(3-month USD LIBOR + 2.35%), 7/20/30 | | | United States | | | | 8,362,537 | | | | 8,389,799 | |
| | | | | | | | | | | | |
| | | |
| | | | | | | | | | | 498,339,538 | |
| | | | | | | | | | | | |
| | | |
Total Asset-Backed Securities (Cost $518,480,277) | | | | | | | | | | | 517,774,825 | |
| | | | | | | | | | | | |
Total Investments before Short Term Investments | | | | | | | | | | | | |
(Cost $3,394,359,106) | | | | | | | | | | | 3,342,546,538 | |
| | | | | | | | | | | | |
| | | |
Short Term Investments 11.6% | | | | | | | | | | | | |
| | | |
U.S. Government and Agency Securities (Cost $104,839,199) 2.8% | | | | | | | | | | | | |
p U.S. Treasury Bill, 3/28/19 | | | United States | | | | 105,750,000 | | | | 104,733,082 | |
| | | | | | | | | | | | |
| | | |
| | | | | | Shares | | | | |
Money Market Funds (Cost $219,846,906) 6.0% | | | | | | | | | | | | |
e,q Institutional Fiduciary Trust Money Market Portfolio, 1.83% | | | United States | | | | 219,846,906 | | | | 219,846,906 | |
| | | | | | | | | | | | |
| | | |
| | | | | | Principal
Amount* | | | | |
Repurchase Agreements (Cost $101,755,855) 2.8% | | | | | | | | | | | | |
r Joint Repurchase Agreement, 2.191%, 11/01/18 (Maturity Value $101,762,049) | | | | | | | | | | | | |
BNP Paribas Securities Corp. (Maturity Value $47,022,208) | | | | | | | | | | | | |
Deutsche Bank Securities Inc. (Maturity Value $13,596,427) | | | | | | | | | | | | |
HSBC Securities (USA) Inc. (Maturity Value $41,143,414) | | | | | | | | | | | | |
Collateralized by U.S. Government Agency Securities, 3.00% - 4.50%, 6/15/39 - 6/20/48; U.S. Treasury Bond, 2.50%, 8/15/23; and U.S. Treasury Note, 1.00% -3.50%, 11/15/19 - 7/31/23 (valued at $103,804,646) | | | United States | | | $ | 101,755,855 | | | | 101,755,855 | |
| | | | | | | | | | | | |
Total Investments (Cost $3,820,801,066) 102.7% | | | | | | | | | | | 3,768,882,381 | |
Other Assets, less Liabilities (2.7)% | | | | | | | | | | | (99,974,559 | ) |
| | | | | | | | | | | | |
| | | |
Net Assets 100.0% | | | | | | | | | | $ | 3,668,907,822 | |
| | | | | | | | | | | | |
| | | | |
| | | |
| 54 | | Annual Report | | franklintempleton.com |
FRANKLIN INVESTORS SECURITIES TRUST
STATEMENT OF INVESTMENTS
Franklin Floating Rate Daily Access Fund (continued)
†Rounds to less than 0.1% of net assets.
*The principal amount is stated in U.S. dollars unless otherwise indicated.
aNon-income producing.
bSee Note 10 regarding holdings of 5% voting securities.
cFair valued using significant unobservable inputs. See Note 12 regarding fair value measurements.
dSee Note 8 regarding restricted securities.
eSee Note 3(f) regarding investments in affiliated management investment companies.
fIncome may be received in additional securities and/or cash.
gThe coupon rate shown represents the rate at period end.
hSee Note 1(i) regarding senior floating rate interests.
iSecurity purchased on a delayed delivery basis. See Note 1(d).
jA portion or all of the security represents an unsettled loan commitment. The coupon rate is to-be determined (TBD) at the time of settlement and will be based upon a reference index/floor plus a spread.
kSecurity was purchased pursuant to Rule 144A under the Securities Act of 1933 and may be sold in transactions exempt from registration only to qualified institutional buyers or in a public offering registered under the Securities Act of 1933. These securities have been deemed liquid under guidelines approved by the Trust’s Board of Trustees. At October 31, 2018, the aggregate value of these securities was $517,774,825, representing 14.1% of net assets.
lThe coupon rate shown represents the rate inclusive of any caps or floors, if applicable, in effect at period end.
mAdjustable rate security with an interest rate that is not based on a published reference index and spread. The rate is based on the structure of the agreement and current market conditions. The coupon rate shown represents the rate at period end.
nThe coupon rate will be determined at time of issue.
oSecurity purchased on a when-issued basis. See Note 1(d).
pThe security was issued on a discount basis with no stated coupon rate.
qThe rate shown is the annualized seven-day effective yield at period end.
rSee Note 1(c) regarding joint repurchase agreement.
At October 31, 2018, the Fund had the following credit default swap contracts outstanding. See Note 1(e).
Credit Default Swap Contracts
| | | | | | | | | | | | | | | | | | | | | | | | | | | | | | | | |
| Description | | Periodic
Payment Rate
Received
(Paid) | | | Payment
Frequency | | | Maturity
Date | | | Notional
Amount | | | Value | | | Unamortized
Upfront
Payments
(Receipts) | | | Unrealized
Appreciation
(Depreciation) | | | Rating | |
| |
Centrally Cleared Swap Contracts | | | | | | | | | | | | | | | | | | | | | | | | | | | | | | | | |
Contracts to Buy Protectiona | | | | | | | | | | | | | | | | | | | | | | | | | | | | | | | | |
Traded Index | | | | | | | | | | | | | | | | | | | | | | | | | | | | | | | | |
CDX.NA.HY.26 | | | (5.00)% | | | | Quarterly | | | | 6/20/21 | | | $ | 50,176,000 | | | $ | (3,264,532 | ) | | $ | (2,491,366 | ) | | $ | (773,166 | ) | | | | |
| | | | | | | | | | | | | | | | | | | | | | | | |
aPerformance triggers for settlement of contract include failure to pay or bankruptcy of the underlying securities for traded index swaps.
See Note 9 regarding other derivative information.
See Abbreviations on page 158.
| | | | |
| | | |
| franklintempleton.com | | The accompanying notes are an integral part of these financial statements. | Annual Report | | 55 |
FRANKLIN INVESTORS SECURITIES TRUST
Financial Highlights
Franklin Low Duration Total Return Fund
| | | | | | | | | | | | | | | | | | | | |
| | | Year Ended October 31, | |
| | | 2018 | | | 2017 | | | 2016 | | | 2015 | | | 2014 | |
| | |
| | | | | |
Class A | | | | | | | | | | | | | | | | | | | | |
| | | | | |
Per share operating performance | | | | | | | | | | | | | | | | | | | | |
(for a share outstanding throughout the year) | | | | | | | | | | | | | | | | | | | | |
| | | | | |
Net asset value, beginning of year | | | $ 9.84 | | | | $ 9.89 | | | | $ 9.91 | | | | $ 10.11 | | | | $ 10.16 | |
| | | | | |
Income from investment operationsa: | | | | | | | | | | | | | | | | | | | | |
| | | | | |
Net investment income | | | 0.237 | | | | 0.170 | | | | 0.151 | | | | 0.134 | | | | 0.144 | |
| | | | | |
Net realized and unrealized gains (losses) | | | (0.185 | ) | | | (0.023 | ) | | | 0.031 | | | | (0.135 | ) | | | (0.011 | ) |
| | | | | |
Total from investment operations | | | 0.052 | | | | 0.147 | | | | 0.182 | | | | (0.001 | ) | | | 0.133 | |
| | | | | |
Less distributions from net investment income and net foreign currency gains | | | (0.292 | ) | | | (0.197 | ) | | | (0.202 | ) | | | (0.199 | ) | | | (0.183 | ) |
| | | | | |
Net asset value, end of year | | | $ 9.60 | | | | $ 9.84 | | | | $ 9.89 | | | | $ 9.91 | | | | $ 10.11 | |
| | | | | |
Total returnb | | | 0.54% | | | | 1.50% | | | | 1.88% | | | | (0.02)% | | | | 1.32% | |
| | | | | |
Ratios to average net assets | | | | | | | | | | | | | | | | | | | | |
| | | | | |
Expenses before waiver and payments by affiliates | | | 0.96% | | | | 0.96% | | | | 0.95% | | | | 0.96% | | | | 0.93% | |
| | | | | |
Expenses net of waiver and payments by affiliatesc | | | 0.72% | | | | 0.80% | | | | 0.80% | | | | 0.80% | | | | 0.80% | |
| | | | | |
Net investment income | | | 2.43% | | | | 1.73% | | | | 1.57% | | | | 1.27% | | | | 1.24% | |
| | | | | |
Supplemental data | | | | | | | | | | | | | | | | | | | | |
| | | | | |
Net assets, end of year (000’s) | | | $1,499,579 | | | | $1,519,902 | | | | $1,524,437 | | | | $1,656,001 | | | | $1,589,854 | |
| | | | | |
Portfolio turnover rate | | | 56.12% | | | | 50.40% | | | | 44.76% | | | | 41.28% | | | | 78.63% | |
| | | | | |
Portfolio turnover rate excluding mortgage dollar rollsd | | | 44.01% | | | | 45.29% | | | | 44.76% | | | | 41.28% | | | | 78.63% | |
aThe amount shown for a share outstanding throughout the period may not correlate with the Statement of Operations for the period due to the timing of sales and repurchases of the Fund’s shares in relation to income earned and/or fluctuating fair value of the investments of the Fund.
bTotal return does not reflect sales commissions or contingent deferred sales charges, if applicable.
cBenefit of expense reduction rounds to less than 0.01%.
dSee Note 1(h) regarding mortgage dollar rolls.
| | | | |
| | | |
| 56 | | Annual Report | The accompanying notes are an integral part of these financial statements. | | franklintempleton.com |
FRANKLIN INVESTORS SECURITIES TRUST
FINANCIAL HIGHLIGHTS
Franklin Low Duration Total Return Fund (continued)
| | | | | | | | | | | | | | | | | | | | |
| | | Year Ended October 31, | |
| | | 2018 | | | 2017 | | | 2016 | | | 2015 | | | 2014 | |
| | | | | | |
Class C | | | | | | | | | | | | | | | | | | | | |
| | | | | |
Per share operating performance | | | | | | | | | | | | | | | | | | | | |
(for a share outstanding throughout the year) | | | | | | | | | | | | | | | | | | | | |
| | | | | |
Net asset value, beginning of year | | | $ 9.80 | | | | $ 9.86 | | | | $ 9.90 | | | | $ 10.11 | | | | $ 10.16 | |
| | | | | |
Income from investment operationsa: | | | | | | | | | | | | | | | | | | | | |
| | | | | |
Net investment income | | | 0.168 | | | | 0.121 | | | | 0.113 | | | | 0.104 | | | | 0.098 | |
| | | | | |
Net realized and unrealized gains (losses) | | | (0.155 | ) | | | (0.015 | ) | | | 0.024 | | | | (0.145 | ) | | | (0.001 | ) |
| | | | | |
Total from investment operations | | | 0.013 | | | | 0.106 | | | | 0.137 | | | | (0.041 | ) | | | 0.097 | |
| | | | | |
Less distributions from net investment income and net foreign currency gains | | | (0.253 | ) | | | (0.166 | ) | | | (0.177 | ) | | | (0.169 | ) | | | (0.147 | ) |
| | | | | |
Net asset value, end of year | | | $ 9.56 | | | | $ 9.80 | | | | $ 9.86 | | | | $ 9.90 | | | | $ 10.11 | |
| | | | | |
Total returnb | | | 0.14% | | | | 1.08% | | | | 1.41% | | | | (0.41)% | | | | 0.96% | |
| | | | | |
Ratios to average net assets | | | | | | | | | | | | | | | | | | | | |
| | | | | |
Expenses before waiver and payments by affiliates | | | 1.36% | | | | 1.36% | | | | 1.35% | | | | 1.36% | | | | 1.33% | |
| | | | | |
Expenses net of waiver and payments by affiliatesc | | | 1.12% | | | | 1.20% | | | | 1.20% | | | | 1.20% | | | | 1.20% | |
| | | | | |
Net investment income | | | 2.03% | | | | 1.33% | | | | 1.17% | | | | 0.87% | | | | 0.84% | |
| | | | | |
Supplemental data | | | | | | | | | | | | | | | | | | | | |
| | | | | |
Net assets, end of year (000’s) | | | $130,206 | | | | $174,754 | | | | $218,066 | | | | $211,354 | | | | $165,952 | |
| | | | | |
Portfolio turnover rate | | | 56.12% | | | | 50.40% | | | | 44.76% | | | | 41.28% | | | | 78.63% | |
| | | | | |
Portfolio turnover rate excluding mortgage dollar rollsd | | | 44.01% | | | | 45.29% | | | | 44.76% | | | | 41.28% | | | | 78.63% | |
aThe amount shown for a share outstanding throughout the period may not correlate with the Statement of Operations for the period due to the timing of sales and repurchases of the Fund’s shares in relation to income earned and/or fluctuating fair value of the investments of the Fund.
bTotal return does not reflect sales commissions or contingent deferred sales charges, if applicable.
cBenefit of expense reduction rounds to less than 0.01%.
dSee Note 1(h) regarding mortgage dollar rolls.
| | | | |
| | | |
| franklintempleton.com | | The accompanying notes are an integral part of these financial statements. | Annual Report | | 57 |
FRANKLIN INVESTORS SECURITIES TRUST
FINANCIAL HIGHLIGHTS
Franklin Low Duration Total Return Fund (continued)
| | | | | | | | | | | | | | | | | | | | |
| | | Year Ended October 31, | |
| | | 2018 | | | 2017 | | | 2016 | | | 2015 | | | 2014 | |
| | | | | | |
Class R6 | | | | | | | | | | | | | | | | | | | | |
| | | | | |
Per share operating performance | | | | | | | | | | | | | | | | | | | | |
(for a share outstanding throughout the year) | | | | | | | | | | | | | | | | | | | | |
| | | | | |
Net asset value, beginning of year | | | $ 9.90 | | | | $ 9.94 | | | | $ 9.95 | | | | $ 10.14 | | | | $ 10.19 | |
| | | | | |
Income from investment operationsa: | | | | | | | | | | | | | | | | | | | | |
| | | | | |
Net investment income | | | 0.271 | | | | 0.214 | | | | 0.195 | | | | 0.165 | | | | 0.164 | b |
| | | | | | |
Net realized and unrealized gains (losses) | | | (0.178 | ) | | | (0.025 | ) | | | 0.021 | | | | (0.130 | ) | | | 0.003 | |
| | | | | |
Total from investment operations | | | 0.093 | | | | 0.189 | | | | 0.216 | | | | 0.035 | | | | 0.167 | |
| | | | | |
Less distributions from net investment income and net foreign currency gains | | | (0.333 | ) | | | (0.229 | ) | | | (0.226 | ) | | | (0.228 | ) | | | (0.217 | ) |
| | | | | |
Net asset value, end of year | | | $ 9.66 | | | | $ 9.90 | | | | $ 9.94 | | | | $ 9.95 | | | | $ 10.14 | |
| | | | | |
Total return | | | 0.96% | | | | 1.92% | | | | 2.22% | | | | 0.37% | | | | 1.66% | |
| | | | | |
Ratios to average net assets | | | | | | | | | | | | | | | | | | | | |
| | | | | |
Expenses before waiver and payments by affiliates | | | 0.55% | | | | 0.53% | | | | 0.53% | | | | 0.54% | | | | 0.55% | |
| | | | | |
Expenses net of waiver and payments by affiliatesc | | | 0.31% | | | | 0.39% | | | | 0.42% | | | | 0.42% | | | | 0.42% | |
| | | | | |
Net investment income | | | 2.84% | | | | 2.14% | | | | 1.95% | | | | 1.65% | | | | 1.62% | |
| | | | | |
Supplemental data | | | | | | | | | | | | | | | | | | | | |
| | | | | |
Net assets, end of year (000’s) | | | $1,017,856 | | | | $591,622 | | | | $553,233 | | | | $508,675 | | | | $418,539 | |
| | | | | |
Portfolio turnover rate | | | 56.12% | | | | 50.40% | | | | 44.76% | | | | 41.28% | | | | 78.63% | |
| | | | | |
Portfolio turnover rate excluding mortgage dollar rollsd | | | 44.01% | | | | 45.29% | | | | 44.76% | | | | 41.28% | | | | 78.63% | |
aThe amount shown for a share outstanding throughout the period may not correlate with the Statement of Operations for the period due to the timing of sales and repurchases of the Fund’s shares in relation to income earned and/or fluctuating fair value of the investments of the Fund.
bBased on average daily shares outstanding.
cBenefit of expense reduction rounds to less than 0.01%.
dSee Note 1(h) regarding mortgage dollar rolls.
| | | | |
| | | |
| 58 | | Annual Report | The accompanying notes are an integral part of these financial statements. | | franklintempleton.com |
FRANKLIN INVESTORS SECURITIES TRUST
FINANCIAL HIGHLIGHTS
Franklin Low Duration Total Return Fund (continued)
| | | | | | | | | | | | | | | | | | | | |
| | | Year Ended October 31, | |
| | | 2018 | | | 2017 | | | 2016 | | | 2015 | | | 2014 | |
| | | | | | |
Advisor Class | | | | | | | | | | | | | | | | | | | | |
| | | | | |
Per share operating performance | | | | | | | | | | | | | | | | | | | | |
(for a share outstanding throughout the year) | | | | | | | | | | | | | | | | | | | | |
| | | | | |
Net asset value, beginning of year | | | $ 9.89 | | | | $ 9.94 | | | | $ 9.95 | | | | $ 10.14 | | | | $ 10.19 | |
| | | | | |
Income from investment operationsa: | | | | | | | | | | | | | | | | | | | | |
| | | | | |
Net investment income | | | 0.264 | | | | 0.209 | | | | 0.184 | | | | 0.134 | | | | 0.166 | |
| | | | | |
Net realized and unrealized gains (losses) | | | (0.187 | ) | | | (0.042 | ) | | | 0.025 | | | | (0.106 | ) | | | (0.010 | ) |
| | | | | |
Total from investment operations | | | 0.077 | | | | 0.167 | | | | 0.209 | | | | 0.028 | | | | 0.156 | |
| | | | | |
Less distributions from net investment income and net foreign currency gains | | | (0.317 | ) | | | (0.217 | ) | | | (0.219 | ) | | | (0.218 | ) | | | (0.206 | ) |
| | | | | |
Net asset value, end of year | | | $ 9.65 | | | | $ 9.89 | | | | $ 9.94 | | | | $ 9.95 | | | | $ 10.14 | |
| | | | | |
Total return | | | 0.80% | | | | 1.70% | | | | 2.14% | | | | 0.27% | | | | 1.54% | |
| | | | | |
Ratios to average net assets | | | | | | | | | | | | | | | | | | | | |
| | | | | |
Expenses before waiver and payments by affiliates | | | 0.71% | | | | 0.71% | | | | 0.70% | | | | 0.71% | | | | 0.68% | |
| | | | | |
Expenses net of waiver and payments by affiliatesb | | | 0.47% | | | | 0.55% | | | | 0.55% | | | | 0.55% | | | | 0.55% | |
| | | | | |
Net investment income | | | 2.68% | | | | 1.98% | | | | 1.82% | | | | 1.52% | | | | 1.49% | |
| | | | | |
Supplemental data | | | | | | | | | | | | | | | | | | | | |
| | | | | |
Net assets, end of year (000’s) | | | $214,339 | | | | $428,838 | | | | $224,887 | | | | $150,464 | | | | $198,694 | |
| | | | | |
Portfolio turnover rate | | | 56.12% | | | | 50.40% | | | | 44.76% | | | | 41.28% | | | | 78.63% | |
| | | | | |
Portfolio turnover rate excluding mortgage dollar rollsc | | | 44.01% | | | | 45.29% | | | | 44.76% | | | | 41.28% | | | | 78.63% | |
aThe amount shown for a share outstanding throughout the period may not correlate with the Statement of Operations for the period due to the timing of sales and repurchases of the Fund’s shares in relation to income earned and/or fluctuating fair value of the investments of the Fund.
bBenefit of expense reduction rounds to less than 0.01%.
cSee Note 1(h) regarding mortgage dollar rolls.
| | | | |
| | | |
| franklintempleton.com | | The accompanying notes are an integral part of these financial statements. | Annual Report | | 59 |
FRANKLIN INVESTORS SECURITIES TRUST
Statement of Investments, October 31, 2018
Franklin Low Duration Total Return Fund
| | | | | | | | | | | | | | | | |
| | | Country | | | Shares/ Units/ Warrants | | | | | | Value | |
Common Stocks and Other Equity Interests 0.0%† | | | | | | | | | | | | | | | | |
Commercial & Professional Services 0.0%† | | | | | | | | | | | | | | | | |
a,b,c Remington Outdoor Co. Inc. | | | United States | | | | 72,043 | | | | | | | $ | 932,716 | |
a,b,c Remington Outdoor Co. Inc., Litigation Units | | | United States | | | | 6,782 | | | | | | | | — | |
| | | | | | | | | | | | | | | | |
| | | | |
| | | | | | | | | | | | | | | 932,716 | |
Energy 0.0%† | | | | | | | | | | | | | | | | |
a Halcon Resources Corp. | | | United States | | | | 98,168 | | | | | | | | 325,918 | |
a Halcon Resources Corp., wts., 9/09/20 | | | United States | | | | 8,753 | | | | | | | | 387 | |
a Riviera Resources Inc. | | | United States | | | | 2,964 | | | | | | | | 63,192 | |
a Roan Resources Inc. | | | United States | | | | 2,964 | | | | | | | | 48,224 | |
| | | | | | | | | | | | | | | | |
| | | | |
| | | | | | | | | | | | | | | 437,721 | |
Materials 0.0%† | | | | | | | | | | | | | | | | |
a Verso Corp., A | | | United States | | | | 1,387 | | | | | | | | 38,989 | |
a Verso Corp., wts., 7/25/23 | | | United States | | | | 146 | | | | | | | | 949 | |
| | | | | | | | | | | | | | | | |
| | | | |
| | | | | | | | | | | | | | | 39,938 | |
| | | | | | | | | | | | | | | | |
Retailing 0.0%† | | | | | | | | | | | | | | | | |
a,b,c K2016470219 South Africa Ltd., A | | | South Africa | | | | 12,326,925 | | | | | | | | 8,356 | |
a,b,c K2016470219 South Africa Ltd., B | | | South Africa | | | | 1,226,701 | | | | | | | | 831 | |
| | | | | | | | | | | | | | | | |
| | | | |
| | | | | | | | | | | | | | | 9,187 | |
| | | | | | | | | | | | | | | | |
Total Common Stocks and Other Equity Interests
(Cost $5,716,880) | | | | | | | | | | | | | | | 1,419,562 | |
| | | | | | | | | | | | | | | | |
| | | | |
Management Investment Companies 2.7% | | | | | | | | | | | | | | | | |
Diversified Financials 2.7% | | | | | | | | | | | | | | | | |
d Franklin Lower Tier Floating Rate Fund | | | United States | | | | 1,893,663 | | | | | | | | 18,122,357 | |
d Franklin Middle Tier Floating Rate Fund | | | United States | | | | 2,389,308 | | | | | | | | 22,459,491 | |
Invesco Senior Loan ETF | | | United States | | | | 1,550,000 | | | | | | | | 35,665,500 | |
| | | | | | | | | | | | | | | | |
| | | | |
Total Management Investment Companies
(Cost $77,256,419) | | | | | | | | | | | | | | | 76,247,348 | |
| | | | | | | | | | | | | | | | |
| | | | |
| | | | | | Principal
Amount* | | | | | | | |
Corporate Bonds 34.9% | | | | | | | | | | | | | | | | |
Automobiles & Components 0.4% | | | | | | | | | | | | | | | | |
Aptiv PLC, senior note, 3.15%, 11/19/20 | | | United States | | | | 10,500,000 | | | | | | | | 10,387,397 | |
| | | | | | | | | | | | | | | | |
Banks 9.4% | | | | | | | | | | | | | | | | |
e ANZ New Zealand International Ltd. of London, senior note, 144A, 2.85%, 8/06/20 | | | New Zealand | | | | 7,500,000 | | | | | | | | 7,417,834 | |
f Banca Monte dei Paschi di Siena SpA, secured note, Reg S, 2.875%, 4/16/59 | | | Italy | | | | 6,300,000 | | | | EUR | | | | 7,505,277 | |
f Banco Popular Espanol SA, secured note, Reg S, 1.00%, 3/03/22 | | | Spain | | | | 2,800,000 | | | | EUR | | | | 3,256,088 | |
Bank of America Corp.,
senior note, 2.65%, 4/01/19 | | | United States | | | | 9,300,000 | | | | | | | | 9,293,642 | |
senior note, 2.151%, 11/09/20 | | | United States | | | | 6,600,000 | | | | | | | | 6,441,758 | |
senior note, 2.369% to 7/20/20, FRN thereafter, 7/21/21 | | | United States | | | | 6,800,000 | | | | | | | | 6,671,398 | |
senior note, 3.55% to 3/05/23, FRN thereafter, 3/05/24 | | | United States | | | | 8,950,000 | | | | | | | | 8,788,807 | |
g senior note, FRN, 3.476%, (3-month USD LIBOR + 1.04%), 1/15/19 | | | United States | | | | 16,671,000 | | | | | | | | 16,703,995 | |
Barclays PLC, senior note, 3.25%, 1/12/21 | | | United Kingdom | | | | 7,000,000 | | | | | | | | 6,907,250 | |
| | | | |
| | | |
| 60 | | Annual Report | | franklintempleton.com |
FRANKLIN INVESTORS SECURITIES TRUST
STATEMENT OF INVESTMENTS
Franklin Low Duration Total Return Fund (continued)
| | | | | | | | | | | | | | | | |
| | | Country | | | Principal Amount* | | | | | | Value | |
| |
Corporate Bonds (continued) | | | | | | | | | | | | | | | | |
Banks (continued) | | | | | | | | | | | | | | | | |
g BB&T Corp., senior note, FRN, 3.003%, (3-month USD LIBOR + 0.66%), 2/01/19 | | | United States | | | | 2,000,000 | | | | | | | $ | 2,001,811 | |
Citigroup Inc., | | | | | | | | | | | | | | | | |
senior note, 2.40%, 2/18/20 | | | United States | | | | 11,300,000 | | | | | | | | 11,179,567 | |
senior note, 2.65%, 10/26/20 | | | United States | | | | 5,000,000 | | | | | | | | 4,925,991 | |
senior note, 2.35%, 8/02/21 | | | United States | | | | 5,400,000 | | | | | | | | 5,219,657 | |
senior note, 2.75%, 4/25/22 | | | United States | | | | 5,800,000 | | | | | | | | 5,607,630 | |
g senior note, FRN, 3.247%, (3-month USD LIBOR + 0.93%), 6/07/19 | | | United States | | | | 5,000,000 | | | | | | | | 5,022,183 | |
HSBC Holdings PLC, senior note, 3.40%, 3/08/21 | | | United Kingdom | | | | 3,300,000 | | | | | | | | 3,285,035 | |
Industrial & Commercial Bank of China Ltd., | | | | | | | | | | | | | | | | |
senior note, 3.231%, 11/13/19 | | | China | | | | 5,400,000 | | | | | | | | 5,383,854 | |
senior note, 2.957%, 11/08/22 | | | China | | | | 9,400,000 | | | | | | | | 9,055,772 | |
e,gING Bank NV, senior note, 144A, FRN, 3.086%, (3-month USD LIBOR + 0.69%), 10/01/19 | | | Netherlands | | | | 5,000,000 | | | | | | | | 5,022,900 | |
Intesa Sanpaolo SpA, senior note, 3.875%, 1/15/19 | | | Italy | | | | 10,100,000 | | | | | | | | 10,105,100 | |
JPMorgan Chase & Co., | | | | | | | | | | | | | | | | |
senior note, 1.85%, 3/22/19 | | | United States | | | | 8,000,000 | | | | | | | | 7,968,070 | |
senior note, 2.20%, 10/22/19 | | | United States | | | | 21,400,000 | | | | | | | | 21,216,859 | |
senior note, 2.40%, 6/07/21 | | | United States | | | | 2,600,000 | | | | | | | | 2,534,032 | |
e Norddeutsche Landesbank Girozentrale, secured note, 144A, 2.00%, 2/05/19 | | | Germany | | | | 6,500,000 | | | | | | | | 6,484,101 | |
PHH Corp., senior note, 7.375%, 9/01/19 | | | United States | | �� | | 1,800,000 | | | | | | | | 1,851,750 | |
PNC Bank NA, senior note, 2.00%, 5/19/20 | | | United States | | | | 10,600,000 | | | | | | | | 10,396,816 | |
Regions Financial Corp., senior note, 3.20%, 2/08/21 | | | United States | | | | 9,300,000 | | | | | | | | 9,224,565 | |
Royal Bank of Canada, secured note, 2.10%, 10/14/21 | | | Canada | | | | 6,300,000 | | | | | | | | 6,165,261 | |
e Standard Chartered PLC, senior note, 144A, 3.885% to 3/15/23, FRN thereafter, 3/15/24 | | | United Kingdom | | | | 7,800,000 | | | | | | | | 7,588,425 | |
g SunTrust Bank of Atlanta, senior note, FRN, 3.525%, 10/26/21 | | | United States | | | | 5,000,000 | | | | | | | | 4,999,453 | |
e The Toronto-Dominion Bank, secured note, 144A, 2.25%, 3/15/22 | | | Canada | | | | 12,700,000 | | | | | | | | 12,403,648 | |
f Turkiye Vakiflar Bankasi TAO, secured note, Reg S, 2.375%, 11/04/22 | | | Turkey | | | | 1,800,000 | | | | EUR | | | | 1,962,184 | |
Wells Fargo & Co., | | | | | | | | | | | | | | | | |
senior note, 2.50%, 3/04/21 | | | United States | | | | 2,600,000 | | | | | | | | 2,534,753 | |
g senior note, FRN, 3.349%, (3-month USD LIBOR + 0.88%), 7/22/20 | | | United States | | | | 13,700,000 | | | | | | | | 13,818,957 | |
e Westpac Banking Corp., | | | | | | | | | | | | | | | | |
secured note, 144A, 2.10%, 2/25/22 | | | Australia | | | | 9,700,000 | | | | | | | | 9,446,733 | |
senior secured note, 144A, 2.25%, 11/09/21 | | | Australia | | | | 6,300,000 | | | | | | | | 6,176,457 | |
e Woori Bank, sub. note, 144A, 4.75%, 4/30/24 | | | South Korea | | | | 5,300,000 | | | | | | | | 5,297,164 | |
| | | | | | | | | | | | | | | | |
| | | | |
| | | | | | | | | | | | | | | 269,864,777 | |
| | | | | | | | | | | | | | | | |
Capital Goods 0.7% | | | | | | | | | | | | | | | | |
CNH Industrial Capital LLC, senior note, 3.875%, 10/15/21 | | | United States | | | | 5,100,000 | | | | | | | | 5,091,604 | |
John Deere Capital Corp., senior note, 1.95%, 3/04/19 | | | United States | | | | 3,750,000 | | | | | | | | 3,739,998 | |
Lockheed Martin Corp., senior note, 1.85%, 11/23/18 | | | United States | | | | 4,200,000 | | | | | | | | 4,197,969 | |
United Technologies Corp., senior note, 4.50%, 4/15/20 | | | United States | | | | 7,500,000 | | | | | | | | 7,620,959 | |
| | | | | | | | | | | | | | | | |
| | | | |
| | | | | | | | | | | | | | | 20,650,530 | |
| | | | | | | | | | | | | | | | |
Consumer Services 0.3% | | | | | | | | | | | | | | | | |
Marriott International Inc., senior note, 2.875%, 3/01/21 | | | United States | | | | 10,000,000 | | | | | | | | 9,873,172 | |
| | | | | | | | | | | | | | | | |
| | | | |
| | | |
| franklintempleton.com | | Annual Report | | 61 |
FRANKLIN INVESTORS SECURITIES TRUST
STATEMENT OF INVESTMENTS
Franklin Low Duration Total Return Fund (continued)
| | | | | | | | | | | | | | | | |
| | | | | | | | | | | | | | | | |
| | | Country | | | Principal Amount* | | | | | | Value | |
Corporate Bonds (continued) | | | | | | | | | | | | | | | | |
Diversified Financials 5.8% | | | | | | | | | | | | | | | | |
American Express Co., senior note, 3.70%, 8/03/23 | | | United States | | | | 6,800,000 | | | | | | | $ | 6,735,755 | |
g Bank of New York Mellon Corp., senior note, FRN, 3.182%, (3-month USD LIBOR + 0.87%), 8/17/20 | | | United States | | | | 6,400,000 | | | | | | | | 6,476,677 | |
Capital One Bank USA NA, senior note, 2.30%, 6/05/19 | | | United States | | | | 11,900,000 | | | | | | | | 11,854,758 | |
Capital One Financial Corp., | | | | | | | | | | | | | | | | |
senior note, 2.50%, 5/12/20 | | | United States | | | | 3,900,000 | | | | | | | | 3,845,897 | |
senior note, 3.45%, 4/30/21 | | | United States | | | | 6,800,000 | | | | | | | | 6,774,490 | |
senior note, 3.05%, 3/09/22 | | | United States | | | | 13,600,000 | | | | | | | | 13,278,730 | |
g Deutsche Bank AG, senior note, FRN, 3.632%, (3-month USD LIBOR + 1.31%), 8/20/20 | | | Germany | | | | 7,500,000 | | | | | | | | 7,491,600 | |
e Dexia Credit Local SA, senior note, 144A, 2.375%, 9/20/22 | | | France | | | | 4,550,000 | | | | | | | | 4,389,089 | |
GE Capital International Funding Co., senior note, 2.342%, 11/15/20 | | | United States | | | | 2,000,000 | | | | | | | | 1,939,554 | |
The Goldman Sachs Group Inc., | | | | | | | | | | | | | | | | |
senior note, 2.625%, 4/25/21 | | | United States | | | | 12,000,000 | | | | | | | | 11,739,968 | |
senior note, 2.35%, 11/15/21 | | | United States | | | | 4,000,000 | | | | | | | | 3,851,940 | |
g senior note, FRN, 3.534%, (3-month USD LIBOR + 1.20%), 9/15/20 | | | United States | | | | 23,000,000 | | | | | | | | 23,325,946 | |
Morgan Stanley, | | | | | | | | | | | | | | | | |
senior note, 2.65%, 1/27/20 | | | United States | | | | 4,000,000 | | | | | | | | 3,972,717 | |
senior note, 2.80%, 6/16/20 | | | United States | | | | 6,600,000 | | | | | | | | 6,543,302 | |
g senior note, FRN, 3.649%, (3-month USD LIBOR + 1.14%), 1/27/20 | | | United States | | | | 22,400,000 | | | | | | | | 22,619,544 | |
Navient Corp., | | | | | | | | | | | | | | | | |
senior bond, 8.00%, 3/25/20 | | | United States | | | | 1,150,000 | | | | | | | | 1,203,188 | |
senior note, 5.50%, 1/15/19 | | | United States | | | | 4,350,000 | | | | | | | | 4,371,750 | |
senior note, 5.00%, 10/26/20 | | | United States | | | | 2,000,000 | | | | | | | | 2,016,000 | |
e Pricoa Global Funding I, | | | | | | | | | | | | | | | | |
secured note, 144A, 2.55%, 11/24/20 | | | United States | | | | 5,600,000 | | | | | | | | 5,498,733 | |
secured note, 144A, 3.45%, 9/01/23 | | | United States | | | | 7,200,000 | | | | | | | | 7,119,586 | |
e Protective Life Global Funding, | | | | | | | | | | | | | | | | |
secured note, 144A, 2.262%, 4/08/20 | | | United States | | | | 7,000,000 | | | | | | | | 6,899,270 | |
senior secured note, 144A, 1.722%, 4/15/19 | | | United States | | | | 4,300,000 | | | | | | | | 4,276,573 | |
e,g Seven and Seven Ltd., senior note, 144A, FRN, 3.542%, (6-month USD LIBOR + 1.00%), 9/11/19 | | | South Korea | | | | 400,000 | | | | | | | | 397,498 | |
| | | | | | | | | | | | | | | | |
| | | | |
| | | | | | | | | | | | | | | 166,622,565 | |
| | | | | | | | | | | | | | | | |
Energy 2.6% | | | | | | | | | | | | | | | | |
Anadarko Petroleum Corp., senior note, 4.85%, 3/15/21 | | | United States | | | | 6,100,000 | | | | | | | | 6,235,594 | |
e California Resources Corp., secured note, second lien, 144A, 8.00%, 12/15/22 | | | United States | | | | 1,656,000 | | | | | | | | 1,477,980 | |
Devon Energy Corp., senior bond, 3.25%, 5/15/22 | | | United States | | | | 5,300,000 | | | | | | | | 5,153,587 | |
Enable Midstream Partners LP, senior note, 2.40%, 5/15/19 | | | United States | | | | 3,700,000 | | | | | | | | 3,680,819 | |
Energy Transfer Operating LP, senior note, 4.20%, 9/15/23 | | | United States | | | | 2,800,000 | | | | | | | | 2,790,591 | |
Enterprise Products Operating LLC, senior note, 2.55%, 10/15/19 | | | United States | | | | 7,500,000 | | | | | | | | 7,458,842 | |
g Equinor ASA, senior note, FRN, 2.803%, (3-month USD LIBOR + 0.46%), 11/08/18 | | | Norway | | | | 6,900,000 | | | | | | | | 6,900,656 | |
Kinder Morgan Inc., | | | | | | | | | | | | | | | | |
senior note, 3.05%, 12/01/19 | | | United States | | | | 4,500,000 | | | | | | | | 4,484,756 | |
senior note, 3.15%, 1/15/23 | | | United States | | | | 9,300,000 | | | | | | | | 8,976,231 | |
Sabine Pass Liquefaction LLC, senior secured note, first lien, 5.625%, 2/01/21 | | | United States | | | | 10,400,000 | | | | | | | | 10,765,959 | |
Sanchez Energy Corp., senior note, 7.75%, 6/15/21 | | | United States | | | | 1,900,000 | | | | | | | | 959,500 | |
| | | | |
| | | |
| 62 | | Annual Report | | franklintempleton.com |
FRANKLIN INVESTORS SECURITIES TRUST
STATEMENT OF INVESTMENTS
Franklin Low Duration Total Return Fund (continued)
| | | | | | | | | | | | | | | | |
| | | Country | | | Principal
Amount* | | | | Value | |
Corporate Bonds (continued) | | | | | | | | | | | | | | | | |
Energy (continued) | | | | | | | | | | | | | | | | |
e Sinopec Group Overseas Development 2015 Ltd., senior note, 144A, 2.50%, 4/28/20 | | | China | | | | 7,400,000 | | | | | | | | $ 7,292,589 | |
e Sinopec Group Overseas Development 2017 Ltd., senior note, 144A, 2.375%, 4/12/20 | | | China | | | | 5,100,000 | | | | | | | | 5,019,752 | |
e Sunoco LP/Sunoco Finance Corp., senior note, 144A, 4.875%, 1/15/23 | | | United States | | | | 2,500,000 | | | | | | | | 2,415,625 | |
The Williams Cos. Inc., senior note, 4.125%, 11/15/20 | | | United States | | | | 1,700,000 | | | | | | | | 1,716,235 | |
| | | | | | | | | | | | | | | | |
| | | | |
| | | | | | | | | | | | | | | 75,328,716 | |
| | | | | | | | | | | | | | | | |
Food & Staples Retailing 0.3% | | | | | | | | | | | | | | | | |
The Kroger Co., senior note, 2.60%, 2/01/21 | | | United States | | | | 7,500,000 | | | | | | | | 7,342,071 | |
| | | | | | | | | | | | | | | | |
Food, Beverage & Tobacco 1.7% | | | | | | | | | | | | | | | | |
Anheuser-Busch InBev Finance Inc., senior note, 2.65%, 2/01/21 | | | Belgium | | | | 8,500,000 | | | | | | | | 8,336,120 | |
Bunge Ltd. Finance Corp., senior note, 3.50%, 11/24/20 | | | United States | | | | 3,100,000 | | | | | | | | 3,094,867 | |
Coca-Cola Femsa SAB de CV, | | | | | | | | | | | | | | | | |
senior note, 2.375%, 11/26/18 | | | Mexico | | | | 2,500,000 | | | | | | | | 2,497,600 | |
senior note, 4.625%, 2/15/20 | | | Mexico | | | | 1,400,000 | | | | | | | | 1,420,839 | |
e Imperial Brands Finance PLC, senior note, 144A, 2.95%, 7/21/20 | | | United Kingdom | | | | 6,000,000 | | | | | | | | 5,931,894 | |
Kraft Heinz Foods Co., | | | | | | | | | | | | | | | | |
senior bond, 3.50%, 6/06/22 | | | United States | | | | 10,000,000 | | | | | | | | 9,891,562 | |
senior note, 3.50%, 7/15/22 | | | United States | | | | 5,700,000 | | | | | | | | 5,634,990 | |
senior note, 4.00%, 6/15/23 | | | United States | | | | 10,700,000 | | | | | | | | 10,655,326 | |
g Mondelez International Inc., senior note, FRN, 2.863%, (3-month USD LIBOR + 0.52%), 2/01/19 | | | United States | | | | 500,000 | | | | | | | | 500,476 | |
| | | | | | | | | | | | | | | | |
| | | | |
| | | | | | | | | | | | | | | 47,963,674 | |
| | | | | | | | | | | | | | | | |
Health Care Equipment & Services 2.0% | | | | | | | | | | | | | | | | |
Anthem Inc., senior note, 2.50%, 11/21/20 | | | United States | | | | 7,800,000 | | | | | | | | 7,645,764 | |
e CHS/Community Health Systems Inc., senior note, 144A, 8.125%, 6/30/24 | | | United States | | | | 1,500,000 | | | | | | | | 1,192,500 | |
CVS Health Corp., | | | | | | | | | | | | | | | | |
senior note, 2.80%, 7/20/20 | | | United States | | | | 2,800,000 | | | | | | | | 2,771,536 | |
senior note, 2.125%, 6/01/21 | | | United States | | | | 4,100,000 | | | | | | | | 3,954,319 | |
senior note, 3.70%, 3/09/23 | | | United States | | | | 7,000,000 | | | | | | | | 6,922,956 | |
Express Scripts Holding Co., senior note, 4.75%, 11/15/21 | | | United States | | | | 6,700,000 | | | | | | | | 6,899,472 | |
e Halfmoon Parent Inc., | | | | | | | | | | | | | | | | |
senior note, 144A, 3.40%, 9/17/21 | | | United States | | | | 5,800,000 | | | | | | | | 5,761,220 | |
senior secured note, 144A, 3.75%, 7/15/23 | | | United States | | | | 3,900,000 | | | | | | | | 3,872,393 | |
Stryker Corp., senior note, 2.00%, 3/08/19 | | | United States | | | | 10,100,000 | | | | | | | | 10,068,586 | |
Tenet Healthcare Corp., senior note, 5.50%, 3/01/19 | | | United States | | | | 1,825,000 | | | | | | | | 1,836,406 | |
Zimmer Holdings Inc., senior note, 2.70%, 4/01/20 | | | United States | | | | 7,500,000 | | | | | | | | 7,418,902 | |
| | | | | | | | | | | | | | | | |
| | | | |
| | | | | | | | | | | | | | | 58,344,054 | |
| | | | | | | | | | | | | | | | |
Household & Personal Products 0.1% | | | | | | | | | | | | | | | | |
The Procter & Gamble Co., senior note, 1.70%, 11/03/21 | | | United States | | | | 3,200,000 | | | | | | | | 3,065,717 | |
| | | | | | | | | | | | | | | | |
Insurance 1.2% | | | | | | | | | | | | | | | | |
e Jackson National Life Global Funding, secured note, 144A, 2.25%, 4/29/21 | | | United States | | | | 7,600,000 | | | | | | | | 7,388,143 | |
e Metropolitan Life Global Funding I, senior secured bond, 144A, 3.875%, 4/11/22 | | | United States | | | | 5,900,000 | | | | | | | | 5,931,583 | |
e New York Life Global Funding, | | | | | | | | | | | | | | | | |
secured note, 144A, 2.10%, 1/02/19 | | | United States | | | | 10,000,000 | | | | | | | | 9,991,483 | |
secured note, 144A, 2.15%, 6/18/19 | | | United States | | | | 6,400,000 | | | | | | | | 6,368,868 | |
| | | | |
| | | |
| franklintempleton.com | | Annual Report | | 63 |
FRANKLIN INVESTORS SECURITIES TRUST
STATEMENT OF INVESTMENTS
Franklin Low Duration Total Return Fund (continued)
| | | | | | | | | | | | | | | | |
| | | Country | | | Principal Amount* | | | | | | Value | |
Corporate Bonds (continued) | | | | | | | | | | | | | | | | |
Insurance (continued) | | | | | | | | | | | | | | | | |
e Nuveen Finance LLC, senior note, 144A, 2.95%, 11/01/19 | | | United States | | | | 4,200,000 | | | | | | | $ | 4,192,812 | |
| | | | | | | | | | | | | | | | |
| | | | |
| | | | | | | | | | | | | | | 33,872,889 | |
| | | | | | | | | | | | | | | | |
Materials 0.6% | | | | | | | | | | | | | | | | |
e FMG Resources (August 2006) Pty. Ltd., senior note, 144A, 4.75%, 5/15/22 | | | Australia | | | | 2,000,000 | | | | | | | | 1,940,980 | |
e Glencore Finance Canada Ltd., senior bond, 144A, 4.95%, 11/15/21 | | | Switzerland | | | | 3,500,000 | | | | | | | | 3,594,148 | |
e Glencore Funding LLC, | | | | | | | | | | | | | | | | |
senior note, 144A, 3.00%, 10/27/22 | | | Switzerland | | | | 2,200,000 | | | | | | | | 2,107,248 | |
senior note, 144A, 4.125%, 5/30/23 | | | Switzerland | | | | 4,300,000 | | | | | | | | 4,252,999 | |
LyondellBasell Industries NV, senior note, 6.00%, 11/15/21 | | | United States | | | | 4,900,000 | | | | | | | | 5,170,492 | |
| | | | | | | | | | | | | | | | |
| | | | |
| | | | | | | | | | | | | | | 17,065,867 | |
| | | | | | | | | | | | | | | | |
Media & Entertainment 1.5% | | | | | | | | | | | | | | | | |
e Altice Financing SA, secured bond, 144A, 7.50%, 5/15/26 | | | Luxembourg | | | | 2,000,000 | | | | | | | | 1,890,000 | |
CBS Corp., senior note, 2.30%, 8/15/19 | | | United States | | | | 8,437,000 | | | | | | | | 8,384,566 | |
CSC Holdings LLC, senior bond, 8.625%, 2/15/19 | | | United States | | | | 3,000,000 | | | | | | | | 3,037,500 | |
DISH DBS Corp., senior bond, 5.875%, 7/15/22 | | | United States | | | | 3,000,000 | | | | | | | | 2,846,250 | |
e NBCUniversal Enterprise Inc., senior note, 144A, 1.974%, 4/15/19 | | | United States | | | | 10,000,000 | | | | | | | | 9,959,803 | |
e Tencent Holdings Ltd., senior note, 144A, 2.985%, 1/19/23 | | | China | | | | 8,000,000 | | | | | | | | 7,714,480 | |
Time Warner Inc., senior note, 2.10%, 6/01/19 | | | United States | | | | 8,500,000 | | | | | | | | 8,456,030 | |
| | | | | | | | | | | | | | | | |
| | | | |
| | | | | | | | | | | | | | | 42,288,629 | |
| | | | | | | | | | | | | | | | |
Pharmaceuticals, Biotechnology & Life Sciences 1.8% | | | | | | | | | | | | | | | | |
Allergan Funding SCS, senior note, 3.45%, 3/15/22 | | | United States | | | | 10,500,000 | | | | | | | | 10,335,862 | |
Amgen Inc., | | | | | | | | | | | | | | | | |
senior note, 1.85%, 8/19/21 | | | United States | | | | 1,000,000 | | | | | | | | 957,487 | |
senior note, 3.875%, 11/15/21 | | | United States | | | | 6,800,000 | | | | | | | | 6,867,331 | |
g senior note, FRN, 2.91%, (3-month USD LIBOR + 0.60%), 5/22/19 | | | United States | | | | 6,200,000 | | | | | | | | 6,210,865 | |
e Bayer U.S. Finance II LLC, senior note, 144A, 3.875%, 12/15/23 | | | Germany | | | | 3,400,000 | | | | | | | | 3,352,320 | |
Biogen Inc., senior note, 2.90%, 9/15/20 | | | United States | | | | 11,500,000 | | | | | | | | 11,395,222 | |
Celgene Corp., | | | | | | | | | | | | | | | | |
senior note, 2.25%, 8/15/21 | | | United States | | | | 7,900,000 | | | | | | | | 7,629,729 | |
senior note, 2.75%, 2/15/23 | | | United States | | | | 3,700,000 | | | | | | | | 3,522,790 | |
| | | | | | | | | | | | | | | | |
| | | | |
| | | | | | | | | | | | | | | 50,271,606 | |
| | | | | | | | | | | | | | | | |
Real Estate 0.4% | | | | | | | | | | | | | | | | |
American Tower Corp., senior note, 3.40%, 2/15/19 | | | United States | | | | 6,200,000 | | | | | | | | 6,207,392 | |
Crown Castle International Corp., senior note, 3.15%, 7/15/23 | | | United States | | | | 6,000,000 | | | | | | | | 5,765,320 | |
| | | | | | | | | | | | | | | | |
| | | | |
| | | | | | | | | | | | | | | 11,972,712 | |
| | | | | | | | | | | | | | | | |
Retailing 1.4% | | | | | | | | | | | | | | | | |
Alibaba Group Holding Ltd., | | | | | | | | | | | | | | | | |
senior note, 2.50%, 11/28/19 | | | China | | | | 11,900,000 | | | | | | | | 11,821,757 | |
senior note, 3.125%, 11/28/21 | | | China | | | | 5,400,000 | | | | | | | | 5,325,399 | |
Amazon.com Inc., senior note, 2.40%, 2/22/23 | | | United States | | | | 4,150,000 | | | | | | | | 3,968,652 | |
Dollar Tree Inc., senior note, 3.70%, 5/15/23 | | | United States | | | | 8,800,000 | | | | | | | | 8,584,691 | |
JD.com Inc., senior note, 3.125%, 4/29/21 | | | China | | | | 5,300,000 | | | | | | | | 5,117,813 | |
b,c,h K2016470219 South Africa Ltd., senior secured note, 144A, PIK, 3.00%, 12/31/22 | | | South Africa | | | | 948,323 | | | | | | | | 1,174 | |
c,h K2016470260 South Africa Ltd., senior secured note, 144A, PIK, 25.00%, 12/31/22 | | | South Africa | | | | 183,405 | | | | | | | | 13,544 | |
e PetSmart Inc., senior note, 144A, 7.125%, 3/15/23 | | | United States | | | | 5,500,000 | | | | | | | | 3,877,500 | |
| | | | | | | | | | | | | | | | |
| | | | |
| | | | | | | | | | | | | | | 38,710,530 | |
| | | | | | | | | | | | | | | | |
| | | | |
| | | |
| 64 | | Annual Report | | franklintempleton.com |
FRANKLIN INVESTORS SECURITIES TRUST
STATEMENT OF INVESTMENTS
Franklin Low Duration Total Return Fund (continued)
| | | | | | | | | | | | | | | | |
| | | Country | | | Principal Amount* | | | | | | Value | |
Corporate Bonds (continued) | | | | | | | | | | | | | | | | |
Semiconductors & Semiconductor Equipment 0.5% | | | | | | | | | | | | | | | | |
Broadcom Corp./Broadcom Cayman Finance Ltd., senior note, 2.375%, 1/15/20 | | | United States | | | | 8,700,000 | | | | | | | $ | 8,593,362 | |
Maxim Integrated Products Inc., senior note, 2.50%, 11/15/18 | | | United States | | | | 5,200,000 | | | | | | | | 5,197,707 | |
| | | | | | | | | | | | | | | | |
| | | | |
| | | | | | | | | | | | | | | 13,791,069 | |
| | | | | | | | | | | | | | | | |
Software & Services 0.4% | | | | | | | | | | | | | | | | |
Fiserv Inc., senior note, 2.70%, 6/01/20 | | | United States | | | | 11,300,000 | | | | | | | | 11,183,327 | |
| | | | | | | | | | | | | | | | |
Technology Hardware & Equipment 0.8% | | | | | | | | | | | | | | | | |
e Dell International LLC/EMC Corp., senior secured note, first lien, 144A, 3.48%, 6/01/19 | | | United States | | | | 6,400,000 | | | | | | | | 6,408,885 | |
Juniper Networks Inc., | | | | | | | | | | | | | | | | |
senior note, 3.125%, 2/26/19 | | | United States | | | | 7,500,000 | | | | | | | | 7,503,718 | |
senior note, 3.30%, 6/15/20 | | | United States | | | | 500,000 | | | | | | | | 498,864 | |
e Sanmina Corp., senior note, first lien, 144A, 4.375%, 6/01/19 | | | United States | | | | 6,500,000 | | | | | | | | 6,508,125 | |
Tech Data Corp., senior note, 3.70%, 2/15/22 | | | United States | | | | 800,000 | | | | | | | | 783,637 | |
| | | | | | | | | | | | | | | | |
| | | | |
| | | | | | | | | | | | | | | 21,703,229 | |
| | | | | | | | | | | | | | | | |
Telecommunication Services 0.8% | | | | | | | | | | | | | | | | |
e Sprint Spectrum Co. LLC/Sprint Spectrum Co. II LLC, | | | | | | | | | | | | | | | | |
first lien, 144A, 3.36%, 3/20/23 | | | United States | | | | 1,875,000 | | | | | | | | 1,860,938 | |
senior secured bond, first lien, 144A, 4.738%, 9/20/29 | | | United States | | | | 6,600,000 | | | | | | | | 6,601,980 | |
Telefonica Emisiones S.A.U., senior bond, 5.134%, 4/27/20 | | | Spain | | | | 6,900,000 | | | | | | | | 7,071,913 | |
T-Mobile USA Inc., senior note, 4.00%, 4/15/22 | | | United States | | | | 1,800,000 | | | | | | | | 1,782,000 | |
Verizon Communications Inc., senior note, 3.00%, 11/01/21 | | | United States | | | | 6,800,000 | | | | | | | | 6,707,331 | |
| | | | | | | | | | | | | | | | |
| | | | |
| | | | | | | | | | | | | | | 24,024,162 | |
| | | | | | | | | | | | | | | | |
Transportation 0.4% | | | | | | | | | | | | | | | | |
e American Airlines Group Inc., senior note, 144A, 5.50%, 10/01/19 | | | United States | | | | 1,780,000 | | | | | | | | 1,804,475 | |
e DAE Funding LLC, senior note, 144A, 4.00%, 8/01/20 | | | United Arab Emirates | | | | 2,100,000 | | | | | | | | 2,087,242 | |
FedEx Corp., senior note, 0.50%, 4/09/20 | | | United States | | | | 7,100,000 | | | | EUR | | | | 8,104,131 | |
| | | | | | | | | | | | | | | | |
| | | | |
| | | | | | | | | | | | | | | 11,995,848 | |
| | | | | | | | | | | | | | | | |
Utilities 1.8% | | | | | | | | | | | | | | | | |
Calpine Corp., senior note, 5.375%, 1/15/23 | | | United States | | | | 7,600,000 | | | | | | | | 7,229,500 | |
Dominion Energy Inc., | | | | | | | | | | | | | | | | |
junior sub. note, 2.579%, 7/01/20 | | | United States | | | | 5,200,000 | | | | | | | | 5,122,503 | |
senior note, 2.50%, 12/01/19 | | | United States | | | | 9,500,000 | | | | | | | | 9,445,082 | |
e Korea East-West Power Co. Ltd., senior note, 144A, 3.875%, 7/19/23 | | | South Korea | | | | 3,300,000 | | | | | | | | 3,293,945 | |
PSEG Power LLC, senior note, 3.00%, 6/15/21 | | | United States | | | | 7,700,000 | | | | | | | | 7,578,095 | |
The Southern Co., senior note, 2.35%, 7/01/21 | | | United States | | | | 6,500,000 | | | | | | | | 6,291,953 | |
e State Grid Overseas Investment 2014 Ltd., senior note, 144A, 2.75%, 5/07/19 | | | China | | | | 2,200,000 | | | | | | | | 2,193,587 | |
e State Grid Overseas Investment 2016 Ltd., senior note, 144A, 2.75%, 5/04/22 | | | China | | | | 9,400,000 | | | | | | | | 9,075,559 | |
e Talen Energy Supply LLC, senior note, 144A, 9.50%, 7/15/22 | | | United States | | | | 2,400,000 | | | | | | | | 2,448,000 | |
| | | | | | | | | | | | | | | | |
| | | | |
| | | | | | | | | | | | | | | 52,678,224 | |
| | | | | | | | | | | | | | | | |
| | | | |
Total Corporate Bonds (Cost $1,013,415,528) | | | | | | | | | | | | | | | 999,000,765 | |
| | | | | | | | | | | | | | | | |
| | | | |
| | | |
| franklintempleton.com | | Annual Report | | 65 |
FRANKLIN INVESTORS SECURITIES TRUST
STATEMENT OF INVESTMENTS
Franklin Low Duration Total Return Fund (continued)
| | | | | | | | | | | | | | | | |
| | | Country | | | Principal Amount* | | | | | | Value | |
g,i Senior Floating Rate Interests 3.7% | | | | | | | | | | | | | | | | |
Automobiles & Components 0.1% | | | | | | | | | | | | | | | | |
Allison Transmission Inc., New Term Loans, 4.04%, (1-month USD LIBOR + 1.75%), 9/23/22 | | | United States | | | | 847,557 | | | | | | | $ | 852,855 | |
TI Group Automotive Systems LLC, Initial US Term Loan, 4.802%, (1-month USD LIBOR + 2.50%), 6/30/22 | | | United States | | | | 1,293,631 | | | | | | | | 1,288,779 | |
| | | | | | | | | | | | | | | | |
| | | | |
| | | | | | | | | | | | | | | 2,141,634 | |
| | | | | | | | | | | | | | | | |
Capital Goods 0.0%† | | | | | | | | | | | | | | | | |
Altra Industrial Motion Corp., Term Loan, 4.302%, (1-month USD LIBOR + 2.00%), 10/01/25 | | | United States | | | | 630,998 | | | | | | | | 630,209 | |
Harsco Corp., Term Loan B-2, 4.563%, (1-month USD LIBOR + 2.25%), 12/10/24 | | | United States | | | | 133,869 | | | | | | | | 134,539 | |
| | | | | | | | | | | | | | | | |
| | | | |
| | | | | | | | | | | | | | | 764,748 | |
| | | | | | | | | | | | | | | | |
Commercial & Professional Services 0.2% | | | | | | | | | | | | | | | | |
KAR Auction Services Inc., Tranche B-5 Term Loans, 4.938%, (3-month USD LIBOR + 2.50%), 3/09/23 | | | United States | | | | 701,548 | | | | | | | | 703,074 | |
j,k United Rentals North America Inc., Initial Term Loans, TBD, 10/30/25 | | | United States | | | | 4,730,841 | | | | | | | | 4,757,452 | |
| | | | | | | | | | | | | | | | |
| | | | |
| | | | | | | | | | | | | | | 5,460,526 | |
| | | | | | | | | | | | | | | | |
Consumer Services 0.4% | | | | | | | | | | | | | | | | |
Aristocrat Technologies Inc., Term B-3 Loans, 4.219%, (3-month USD LIBOR + 1.75%), 10/19/24 | | | United States | | | | 3,400,334 | | | | | | | | 3,392,412 | |
Avis Budget Car Rental LLC, Tranche B Term Loans, 4.31%, (1-month USD LIBOR + 2.00%), 2/13/25 | | | United States | | | | 1,536,238 | | | | | | | | 1,534,271 | |
Eldorado Resorts Inc., Initial Term Loan, 4.563%, (1-month USD LIBOR + 2.25%), 4/17/24 | | | United States | | | | 1,587,555 | | | | | | | | 1,591,524 | |
Greektown Holdings LLC, Initial Term Loan, 5.052%, (1-month USD LIBOR + 2.75%), 4/25/24 | | | United States | | | | 3,300,563 | | | | | | | | 3,299,187 | |
Las Vegas Sands LLC, Term B Loans, 4.052%, (1-month USD LIBOR + 1.75%), 3/27/25 | | | United States | | | | 995,000 | | | | | | | | 992,795 | |
| | | | | | | | | | | | | | | | |
| | | | |
| | | | | | | | | | | | | | | 10,810,189 | |
| | | | | | | | | | | | | | | | |
Diversified Financials 0.1% | | | | | | | | | | | | | | | | |
j,k First Eagle Holdings Inc., Initial Term Loans, TBD, 12/01/24 | | | United States | | | | 877,094 | | | | | | | | 879,287 | |
Trans Union LLC, 2017 Replacement Term A-2 Loans, 4.052%, (1-month USD LIBOR + 1.75%), 8/09/22 | | | United States | | | | 1,015,378 | | | | | | | | 1,017,282 | |
| | | | | | | | | | | | | | | | |
| | | | |
| | | | | | | | | | | | | | | 1,896,569 | |
| | | | | | | | | | | | | | | | |
Energy 0.3% | | | | | | | | | | | | | | | | |
Bowie Resource Holdings LLC, First Lien Initial Term Loan, 8.052%, (1-month USD LIBOR + 5.75%), 8/14/20 | | | United States | | | | 1,638,735 | | | | | | | | 1,604,595 | |
Fieldwood Energy LLC, Closing Date Loans, 7.552%, (1-month USD LIBOR + 5.25%), 4/11/22 | | | United States | | | | 5,036,382 | | | | | | | | 5,077,328 | |
Foresight Energy LLC, Term Loans, 8.277%, (3-month USD LIBOR + 5.75%), 3/28/22 | | | United States | | | | 1,207,845 | | | | | | | | 1,212,626 | |
OSG Bulk Ships Inc., Initial Term Loan, 6.77%, (6-month USD LIBOR + 4.25%), 8/05/19 | | | United States | | | | 867,152 | | | | | | | | 859,929 | |
| | | | | | | | | | | | | | | | |
| | | | |
| | | | | | | | | | | | | | | 8,754,478 | |
| | | | | | | | | | | | | | | | |
| | | | |
| | | |
| 66 | | Annual Report | | franklintempleton.com |
FRANKLIN INVESTORS SECURITIES TRUST
STATEMENT OF INVESTMENTS
| | | | | | | | | | | | | | | | |
Franklin Low Duration Total Return Fund (continued) | | | | | | | | | | | | | | | | |
| | | Country | | | Principal Amount* | | | | | | Value | |
g,i Senior Floating Rate Interests (continued) | | | | | | | | | | | | | | | | |
Food & Staples Retailing 0.0%† | | | | | | | | | | | | | | | | |
Aramark Corp., U.S. Term B-3 Loan, 4.052%, (1-month USD LIBOR + 1.75%), 3/11/25 | | | United States | | | | 95,905 | | | | | | | $ | 96,085 | |
Smart & Final Stores LLC, First Lien Term Loan, 5.802%, (1-month USD LIBOR + 3.50%), 11/15/22 | | | United States | | | | 1,217,455 | | | | | | | | 1,177,887 | |
| | | | | | | | | | | | | | | | |
| | | | |
| | | | | | | | | | | | | | | 1,273,972 | |
| | | | | | | | | | | | | | | | |
Food, Beverage & Tobacco 0.3% | | | | | | | | | | | | | | | | |
JBS USA LUX SA, New Initial Term Loans, 4.837% - 4.886%, (3-month USD LIBOR + 2.50%), 10/30/22 | | | United States | | | | 6,768,963 | | | | | | | | 6,776,897 | |
Post Holdings Inc., Series A Incremental Term Loans, 4.29%, (1-month USD LIBOR + 2.00%), 5/24/24 | | | United States | | | | 1,426,159 | | | | | | | | 1,425,601 | |
| | | | | | | | | | | | | | | | |
| | | | |
| | | | | | | | | | | | | | | 8,202,498 | |
| | | | | | | | | | | | | | | | |
Health Care Equipment & Services 0.3% | | | | | | | | | | | | | | | | |
DaVita Healthcare Partners Inc., Tranche B Term Loan, 5.052%, (1-month USD LIBOR + 2.75%), 6/24/21 | | | United States | | | | 2,348,273 | | | | | | | | 2,356,154 | |
HCA Inc., Term Loan B11, 4.052%, (1-month USD LIBOR + 1.75%), 3/18/23 | | | United States | | | | 1,326,148 | | | | | | | | 1,332,896 | |
Quintiles IMS Inc., Term B-2 Dollar Loans, 4.386%, (3-month USD LIBOR + 2.00%), 1/20/25 | | | United States | | | | 3,568,237 | | | | | | | | 3,578,831 | |
U.S. Renal Care Inc., Initial Term Loan, 6.636%, (3-month USD LIBOR + 4.25%), 12/31/22 | | | United States | | | | 1,908,825 | | | | | | | | 1,857,128 | |
| | | | | | | | | | | | | | | | |
| | | | |
| | | | | | | | | | | | | | | 9,125,009 | |
| | | | | | | | | | | | | | | | |
Household & Personal Products 0.1% | | | | | | | | | | | | | | | | |
Spectrum Brands, Inc., | | | | | | | | | | | | | | | | |
USD Term Loans, 4.31%, (1-month USD LIBOR + 2.00%), 6/23/22 | | | United States | | | | 593,484 | | | | | | | | 594,844 | |
USD Term Loans, 4.33% - 4.40%, (2-month USD LIBOR + 2.00%), 6/23/22 | | | United States | | | | 788,846 | | | | | | | | 790,654 | |
USD Term Loans, 4.35%, (3-month USD LIBOR + 2.00%), 6/23/22 | | | United States | | | | 445,113 | | | | | | | | 446,133 | |
| | | | |
| | | | | | | | | | | | | | | | |
| | | | |
| | | | | | | | | | | | | | | 1,831,631 | |
| | | | | | | | | | | | | | | | |
Materials 0.3% | | | | | | | | | | | | | | | | |
Ashland LLC, Term B Loan, 4.03% - 4.052%, (1-month USD LIBOR + 1.75%), 5/17/24 | | | United States | | | | 4,216,328 | | | | | | | | 4,231,696 | |
Chemours Co., Tranche B-2 US$ Term Loan, 4.05%, (1-month USD LIBOR + 1.75%), 4/03/25 | | | United States | | | | 1,766,414 | | | | | | | | 1,758,686 | |
Crown Americas LLC, Dollar Term B Loan, 4.283%, (1-month USD LIBOR + 2.00%), 4/03/25 | | | United States | | | | 1,871,972 | | | | | | | | 1,878,408 | |
Oxbow Carbon LLC, | | | | | | | | | | | | | | | | |
Tranche A Term Loan, 4.552%, (1-month USD LIBOR + 2.25%), 1/04/22 | | | United States | | | | 1,276,500 | | | | | | | | 1,279,691 | |
Tranche B Term Loan, 5.802%, (1-month USD LIBOR + 3.50%), 1/04/23 | | | United States | | | | 577,500 | | | | | | | | 579,666 | |
| | | | | | | | | | | | | | | | |
| | | | |
| | | | | | | | | | | | | | | 9,728,147 | |
| | | | | | | | | | | | | | | | |
| | | | |
| | | |
| franklintempleton.com | | Annual Report | | 67 |
FRANKLIN INVESTORS SECURITIES TRUST
STATEMENT OF INVESTMENTS
Franklin Low Duration Total Return Fund (continued)
| | | | | | | | | | | | | | | | |
| | | Country | | | Principal Amount* | | | | | | Value | |
g,i Senior Floating Rate Interests (continued) | | | | | | | | | | | | | | | | |
Media & Entertainment 0.5% | | | | | | | | | | | | | | | | |
Altice U.S. Finance I Corp., March 2017 Refinancing Term Loan Commitments, 4.552%, (1-month USD LIBOR + 2.25%), 7/28/25 | | | United States | | | | 114,644 | | | | | | | $ | 114,549 | |
AMC Entertainment Holdings Inc,. | | | | | | | | | | | | | | | | |
2016 Incremental Term Loans, 4.53%, (1-month USD LIBOR + 2.25%), 12/15/23 | | | United States | | | | 504,194 | | | | | | | | 505,140 | |
Initial Term Loans, 4.53%, (1-month USD LIBOR + 2.25%), 12/15/22 | | | United States | | | | 4,071,438 | | | | | | | | 4,079,072 | |
Charter Communications Operating LLC, Term A-2 Loan, 3.81%, (1-month USD LIBOR + 1.50%), 3/31/23 | | | United States | | | | 1,192,765 | | | | | | | | 1,194,442 | |
CSC Holdings LLC, March 2017 Incremental Term Loans, 4.53%, (1-month USD LIBOR + 2.25%), 7/17/25 | | | United States | | | | 2,215,369 | | | | | | | | 2,207,035 | |
Lions Gate Capital Holdings LLC, Term A Loan, 4.052%, (1-month USD LIBOR + 1.75%), 3/22/23 | | | Canada | | | | 148,475 | | | | | | | | 148,660 | |
Mediacom Illinois LLC, Tranche N Term Loan, 3.97%, (1-week USD LIBOR + 1.75%), 2/15/24 | | | United States | | | | 4,508,902 | | | | | | | | 4,510,309 | |
| | | | | | | | | | | | | | | | |
| | | | |
| | | | | | | | | | | | | | | 12,759,207 | |
| | | | | | | | | | | | | | | | |
Pharmaceuticals, Biotechnology & Life Sciences 0.3% | | | | | | | | | | | | | | | | |
Bausch Health Cos. Inc., Initial Term Loans, 5.274%, (1-month USD LIBOR + 3.00%), 6/02/25 | | | United States | | | | 536,398 | | | | | | | | 537,627 | |
Endo Luxembourg Finance Co. I S.A.R.L. and Endo LLC, Initial Term Loans, 6.563%, (1-month USD LIBOR + 4.25%), 4/29/24 | | | United States | | | | 3,411,647 | | | | | | | | 3,427,255 | |
Grifols Worldwide Operations USA Inc., Tranche B Term Loan, 4.467%, (1-week USD LIBOR + 2.25%), 1/31/25 | | | United States | | | | 1,435,073 | | | | | | | | 1,438,032 | |
Syneos Health Inc., Initial Term B Loans, 4.302%, (1-month USD LIBOR + 2.00%), 8/01/24 | | | United States | | | | 3,771,660 | | | | | | | | 3,767,474 | |
| | | | | | | | | | | | | | | | |
| | | | |
| | | | | | | | | | | | | | | 9,170,388 | |
| | | | | | | | | | | | | | | | |
Retailing 0.3% | | | | | | | | | | | | | | | | |
Ascena Retail Group Inc., Tranche B Term Loan, 6.813%, (1-month USD LIBOR + 4.50%), 8/21/22 | | | United States | | | | 2,802,088 | | | | | | | | 2,725,731 | |
General Nutrition Centers Inc., | | | | | | | | | | | | | | | | |
Tranche B-2 Term Loans, 11.56%, (1-month USD LIBOR + 9.25%), 3/04/21 | | | United States | | | | 1,292,222 | | | | | | | | 1,264,924 | |
Tranche B-2 Term Loans, 13.50%, (Prime + 7.75%), 3/04/21 | | | United States | | | | 225,820 | | | | | | | | 221,049 | |
Harbor Freight Tools USA Inc., Refinancing Loans, 4.802%, (1-month USD LIBOR + 2.50%), 8/19/23 | | | United States | | | | 3,492,403 | | | | | | | | 3,444,110 | |
Jo-Ann Stores Inc., Initial Loans, 7.477%, (3-month USD LIBOR + 5.00%), 10/23/23 | | | United States | | | | 2,010,470 | | | | | | | | 2,013,402 | |
| | | | | | | | | | | | | | | | |
| | | | |
| | | | | | | | | | | | | | | 9,669,216 | |
| | | | | | | | | | | | | | | | |
Semiconductors & Semiconductor Equipment 0.1% | | | | | | | | | | | | | | | | |
MKS Instruments Inc., Tranche B-4 Term Loan, 4.052%, (1-month USD LIBOR + 1.75%), 4/29/23 | | | United States | | | | 112,434 | | | | | | | | 112,821 | |
ON Semiconductor Corp., 2018 New Replacement Term B-3 Loans, 4.052%, (1-month USD LIBOR + 1.75%), 3/31/23 | | | United States | | | | 3,234,379 | | | | | | | | 3,233,370 | |
| | | | | | | | | | | | | | | | |
| | | | |
| | | | | | | | | | | | | | | 3,346,191 | |
| | | | | | | | | | | | | | | | |
| | | | |
| | | |
| 68 | | Annual Report | | franklintempleton.com |
FRANKLIN INVESTORS SECURITIES TRUST
STATEMENT OF INVESTMENTS
Franklin Low Duration Total Return Fund (continued)
| | | | | | | | | | | | | | | | |
| | | Country | | | Principal
Amount* | | | | | | Value | |
g,i Senior Floating Rate Interests (continued) | | | | | | | | | | | | | | | | |
Software & Services 0.1% | | | | | | | | | | | | | | | | |
Rackspace Hosting Inc., Term B Loans, 5.348%, (3-month USD LIBOR + 3.00%), 11/03/23 | | | United States | | | | 1,703,798 | | | | | | | $ | 1,657,302 | |
| | | | |
Wex Inc., Term B-2 Loan, 4.552%, (1-month USD LIBOR + 2.25%), 7/01/23 | | | United States | | | | 384,146 | | | | | | | | 385,277 | |
| | | | | | | | | | | | | | | | |
| | | | |
| | | | | | | | | | | | | | | 2,042,579 | |
| | | | | | | | | | | | | | | | |
Technology Hardware & Equipment 0.0%† | | | | | | | | | | | | | | | | |
CommScope Inc., Tranche 5 Term Loans, 4.302%, (1-month USD LIBOR + 2.00%), 12/29/22 | | | United States | | | | 1,174,731 | | | | | | | | 1,179,136 | |
| | | | | | | | | | | | | | | | |
Telecommunication Services 0.0%† | | | | | | | | | | | | | | | | |
Global Tel*Link Corp., Term Loan, 6.386%, (3-month USD LIBOR + 4.00%), 5/23/20 | | | United States | | | | 258,582 | | | | | | | | 259,713 | |
| | | | | | | | | | | | | | | | |
Transportation 0.2% | | | | | | | | | | | | | | | | |
Air Canada, Term Loan, 4.295%, (1-month USD LIBOR + 2.00%), 10/06/23 | | | Canada | | | | 46,329 | | | | | | | | 46,484 | |
American Airlines Inc., 2021 Replacement Term Loans, 4.277%, (3-month USD LIBOR + 2.00%), 10/10/21 | | | United States | | | | 1,011,678 | | | | | | | | 1,011,521 | |
International Seaways Operating Corp., Initial Term Loans, 8.26%, (1-month USD LIBOR + 5.50%), 6/22/22 | | | United States | | | | 690,640 | | | | | | | | 694,956 | |
Navios Maritime Midstream Partners LP, Initial Term Loan, 6.84%, (3-month USD LIBOR + 4.50%), 6/18/20 | | | Marshall Islands | | | | 1,197,245 | | | | | | | | 1,155,341 | |
Navios Maritime Partners LP, Initial Term Loan, 7.34%, (3-month USD LIBOR + 5.00%), 9/14/20 | | | United States | | | | 2,081,253 | | | | | | | | 2,084,722 | |
| | | | | | | | | | | | | | | | |
| | | | |
| | | | | | | | | | | | | | | 4,993,024 | |
| | | | | | | | | | | | | | | | |
Utilities 0.1% | | | | | | | | | | | | | | | | |
EFS Cogen Holdings I LLC (Linden), Term B Advance, 5.64%, | | | | | | | | | | | | | | | | |
(3-month USD LIBOR + 3.25%), 6/28/23 | | | United States | | | | 145,511 | | | | | | | | 145,499 | |
NRG Energy Inc., Term Loan B, 4.136%, (3-month USD LIBOR + | | | | | | | | | | | | | | | | |
1.75%), 6/30/23 | | | United States | | | | 2,111,499 | | | | | | | | 2,105,428 | |
| | | | | | | | | | | | | | | | |
| | | | |
| | | | | | | | | | | | | | | 2,250,927 | |
| | | | | | | | | | | | | | | | |
Total Senior Floating Rate Interests
(Cost $105,495,248) | | | | | | | | | | | | | | | 105,659,782 | |
| | | | | | | | | | | | | | | | |
| | | | |
l Marketplace Loans (Cost $5,245,826) 0.2% | | | | | | | | | | | | | | | | |
Diversified Financials 0.2% | | | | | | | | | | | | | | | | |
b Lending Club, 10.08% - 27.27%, 9/19/21 - 11/13/23 | | | United States | | | | 5,245,826 | | | | | | | | 5,225,292 | |
| | | | | | | | | | | | | | | | |
| | | | |
Foreign Government and Agency Securities 1.2% | | | | | | | | | | | | | | | | |
e The Export-Import Bank of China, senior note, 144A, 2.50%, 7/31/19 | | | China | | | | 8,000,000 | | | | | | | | 7,954,840 | |
The Export-Import Bank of Korea, senior note, 2.25%, 1/21/20 | | | South Korea | | | | 11,200,000 | | | | | | | | 11,074,896 | |
Government of Mexico, senior note, M 10, 8.50%, 12/13/18 | | | Mexico | | | | 1,060,000 | m | | | MXN | | | | 5,219,668 | |
e Harvest Operations Corp., senior note, 144A, 4.20%, 6/01/23 | | | South Korea | | | | 1,900,000 | | | | | | | | 1,921,442 | |
The Korea Development Bank, senior note, 3.375%, 3/12/23 | | | South Korea | | | | 6,500,000 | | | | | | | | 6,401,493 | |
Nota Do Tesouro Nacional, 10.00%, 1/01/21 | | | Brazil | | | | 2,350 | n | | | BRL | | | | 652,908 | |
| | | | | | | | | | | | | | | | |
| | | | |
Total Foreign Government and Agency Securities
(Cost $34,069,291) | | | | | | | | | | | | | | | 33,225,247 | |
| | | | | | | | | | | | | | | | |
| | | | |
| | | |
| franklintempleton.com | | Annual Report | | 69 |
FRANKLIN INVESTORS SECURITIES TRUST
STATEMENT OF INVESTMENTS
Franklin Low Duration Total Return Fund (continued)
| | | | | | | | | | | | | | | | |
| | | Country | | | Principal Amount* | | | | | Value | |
U.S. Government and Agency Securities 13.8% | | | | | | | | | | | | | | | | |
U.S. Treasury Note, | | | | | | | | | | | | | | | | |
2.125%, 1/31/21 | | | United States | | | | 38,000,000 | | | | | | | $ | 37,369,883 | |
2.25%, 7/31/21 | | | United States | | | | 39,000,000 | | | | | | | | 38,315,977 | |
2.00%, 8/31/21 | | | United States | | | | 45,000,000 | | | | | | | | 43,879,395 | |
2.125%, 9/30/21 | | | United States | | | | 55,000,000 | | | | | | | | 53,772,168 | |
2.00%, 10/31/21 | | | United States | | | | 30,000,000 | | | | | | | | 29,202,539 | |
1.75%, 3/31/22 | | | United States | | | | 54,000,000 | | | | | | | | 51,916,992 | |
1.875%, 3/31/22 | | | United States | | | | 50,000,000 | | | | | | | | 48,268,554 | |
o Index Linked, 1.875%, 7/15/19 | | | United States | | | | 9,730,533 | | | | | | | | 9,804,716 | |
o Index Linked, 1.375%, 1/15/20 | | | United States | | | | 25,488,611 | | | | | | | | 25,551,503 | |
o Index Linked, 0.125%, 4/15/21 | | | United States | | | | 19,149,421 | | | | | | | | 18,664,514 | |
o Index Linked, 0.125%, 1/15/22 | | | United States | | | | 40,104,729 | | | | | | | | 38,926,322 | |
| | | | | | | | | | | | | | | | |
| | | | |
Total U.S. Government and Agency Securities
(Cost $403,526,100) | | | | | | | | | | | | | | | 395,672,563 | |
| | | | | | | | | | | | | | | | |
| | | | |
Asset-Backed Securities and Commercial Mortgage-Backed Securities 40.3% | | | | | | | | | | | | | | | | |
Automobiles & Components 0.0%† | | | | | | | | | | | | | | | | |
p Countrywide Asset-Backed Certificates, 2002-3, 1A1, FRN, 3.021%, (1-month USD LIBOR + 0.74%), 5/25/32 | | | United States | | | | 1,404 | | | | | | | | 1,364 | |
| | | | | | | | | | | | | | | | |
Banks 0.3% | | | | | | | | | | | | | | | | |
q CD Commercial Mortgage Trust, 2005-CD1, E, FRN, 5.254%, 7/15/44 | | | United States | | | | 427,112 | | | | | | | | 426,517 | |
Citigroup Commercial Mortgage Trust, 2006-C5, AJ, 5.482%, 10/15/49 | | | United States | | | | 388,364 | | | | | | | | 375,866 | |
q Commercial Mortgage Trust, | | | | | | | | | | | | | | | | |
2006-GG7, AJ, FRN, 5.667%, 7/10/38 | | | United States | | | | 3,818,000 | | | | | | | | 3,518,681 | |
p CWABS Inc. Asset-Backed Certificates, 2004-1, M1, FRN, 3.031%, (1-month USD LIBOR + 0.75%), 3/25/34 | | | United States | | | | 192,152 | | | | | | | | 193,540 | |
p FNMA Connecticut Avenue Securities, 2016-C03, 2M1, FRN, 4.481%, (1-month USD LIBOR + 2.20%), 10/25/28 | | | United States | | | | 230,904 | | | | | | | | 231,233 | |
q GE Capital Commercial Mortgage Corp. Trust, 2007-C1, AM, FRN, 5.606%, 12/10/49 | | | United States | | | | 858,348 | | | | | | | | 858,251 | |
q 2006-GG7, AM, FRN, 5.667%, 7/10/38 | | | United States | | | | 181,770 | | | | | | | | 181,951 | |
p Impac Secured Assets Corp., 2004-4, M1, FRN, 3.046%, (1-month USD LIBOR + 0.765%), 2/25/35 | | | United States | | | | 482,091 | | | | | | | | 483,549 | |
p Merrill Lynch Mortgage Investors Trust, 2003-A, 1A, FRN, 3.021%, (1-month USD LIBOR + 0.74%), 3/25/28 | | | United States | | | | 337,348 | | | | | | | | 325,984 | |
p Morgan Stanley ABS Capital I Inc. Trust, 2005-WMC, M2, FRN, 3.016%, (1-month USD LIBOR + 0.735%), 1/25/35 | | | United States | | | | 90,698 | | | | | | | | 90,856 | |
q Wells Fargo Mortgage Backed Securities Trust, | | | | | | | | | | | | | | | | |
2005-AR, 1A1, FRN, 3.847%, 2/25/35 | | | United States | | | | 970,747 | | | | | | | | 997,846 | |
2005-AR9, 2A2, FRN, 4.675%, 10/25/33 | | | United States | | | | 127,651 | | | | | | | | 127,999 | |
| | | | | | | | | | | | | | | | |
| | | | |
| | | | | | | | | | | | | | | 7,812,273 | |
| | | | | | | | | | | | | | | | |
Diversified Financials 39.5% | | | | | | | | | | | | | | | | |
e,p Alinea CLO Ltd., 2018-1A, B, 144A, FRN, 3.957%, (3-month USD LIBOR + 1.65%), 7/20/31 | | | United States | | | | 3,000,000 | | | | | | | | 2,998,530 | |
American Express Credit Account Master Trust, | | | | | | | | | | | | | | | | |
2017-1, B, 2.10%, 9/15/22 | | | United States | | | | 13,480,000 | | | | | | | | 13,303,787 | |
2017-6, A, 2.04%, 5/15/23 | | | United States | | | | 16,300,000 | | | | | | | | 15,952,324 | |
2018-1, A, 2.67%, 10/17/22 | | | United States | | | | 12,000,000 | | | | | | | | 11,929,927 | |
| | | | |
| | | |
| 70 | | Annual Report | | franklintempleton.com |
FRANKLIN INVESTORS SECURITIES TRUST
STATEMENT OF INVESTMENTS
Franklin Low Duration Total Return Fund (continued)
| | | | | | | | | | | | |
| | | Country | | | Principal
Amount* | | | Value | |
Asset-Backed Securities and Commercial Mortgage-Backed
Securities (continued) | | | | | | | | | | | | |
Diversified Financials (continued) | | | | | | | | | | | | |
p American Home Mortgage Investment Trust, | | | | | | | | | | | | |
2004-3, 4A, FRN, 4.034%, (6-month USD LIBOR + 1.50%), 10/25/34 | | | United States | | | | 1,895,701 | | | $ | 1,881,257 | |
2005-1, 6A, FRN, 4.592%, (6-month USD LIBOR + 2.00%), 6/25/45 | | | United States | | | | 972,820 | | | | 1,001,772 | |
p Ameriquest Mortgage Securities Inc. Asset-Backed Pass-Through Certificates, 2004-R4, M1, FRN, 3.106%, (1-month USD LIBOR + 0.825%), 6/25/34 | | | United States | | | | 550,884 | | | | 554,554 | |
e,p AMMC CLO XI Ltd., | | | | | | | | | | | | |
2012-11A, BR2, 144A, FRN, 4.12%, (3-month USD LIBOR + 1.60%), 4/30/31 | | | United States | | | | 1,700,000 | | | | 1,673,106 | |
2012-11A, CR2, 144A, FRN, 4.42%, (3-month USD LIBOR + 1.90%), 4/30/31 | | | United States | | | | 450,000 | | | | 449,438 | |
2012-11A, DR2, 144A, FRN, 5.37%, (3-month USD LIBOR + 2.85%), 4/30/31 | | | United States | | | | 400,000 | | | | 393,044 | |
e,p Antares CLO Ltd., 2018-1A, B, 144A, FRN, 4.119%, (3-month USD LIBOR + 1.65%), 4/20/31 | | | United States | | | | 5,400,000 | | | | 5,402,970 | |
e,p ARES CLO Ltd., 2018-48A, B, 144A, FRN, 3.919%, (3-month USD LIBOR + 1.58%), 7/20/30 | | | United States | | | | 1,000,000 | | | | 996,480 | |
p Argent Securities Inc. Asset-Backed Pass-Through Certificates, 2005-W2, A2C, FRN, 2.641%, (1-month USD LIBOR + 0.36%), 10/25/35 | | | United States | | | | 426,449 | | | | 428,198 | |
e,p Atrium IX, 9A, AR, 144A, FRN, 3.551%, (3-month USD LIBOR + 1.24%), 5/28/30 | | | United States | | | | 2,000,000 | | | | 2,003,380 | |
e,p Atrium XI, 2011A, CR, 144A, FRN, 4.627%, (3-month USD LIBOR + 2.15%), 10/23/25 | | | United States | | | | 6,750,000 | | | | 6,767,145 | |
e,p Atrium XIII, | | | | | | | | | | | | |
2013A, B, 144A, FRN, 3.977%, (3-month USD LIBOR + 1.50%), 11/21/30 | | | United States | | | | 1,000,000 | | | | 998,300 | |
2013A, C, 144A, FRN, 4.277%, (3-month USD LIBOR + 1.80%), 11/21/30 | | | United States | | | | 1,000,000 | | | | 992,420 | |
e,q Atrium XIV LLC, 14A, B, 144A, FRN, 4.01%, 8/23/30 | | | United States | | | | 2,400,000 | | | | 2,405,160 | |
e,p Bain Capital Credit CLO, 2018-1A, A1, 144A, FRN, 3.437%, (3-month USD LIBOR + 0.96%), 4/23/31 | | | United States | | | | 2,000,000 | | | | 1,982,740 | |
e BAMLL Commercial Mortgage Securities Trust, 2012-PARK, A, 144A, 2.959%, 12/10/30 | | | United States | | | | 3,200,000 | | | | 3,154,749 | |
q,r Bank, 2018-BN13, XA, IO, FRN, 0.522%, 8/15/61 | | | United States | | | | 108,608,987 | | | | 3,893,947 | |
e,q BBC Middle Market CLO LLC, 2018-1A, A2, 144A, FRN, 4.369%, 10/20/30 | | | United States | | | | 2,100,000 | | | | 2,099,454 | |
p Bear Stearns ALT-A Trust, 2004-13, A2, FRN, 3.161%, (1-month USD LIBOR + 0.88%), 11/25/34 | | | United States | | | | 22,984 | | | | 22,975 | |
e,p Bellemeade Re Ltd., 2018-1A, M1B, 144A, FRN, 3.881%, (1-month USD LIBOR + 1.60%), 4/25/28 | | | Bermuda | | | | 5,870,000 | | | | 5,903,711 | |
e,p BetonyCLO 2Ltd., | | | | | | | | | | | | |
2018-1A, A2, 144A, FRN, 4.12%, (3-month USD LIBOR + 1.60%), 4/30/31 | | | United States | | | | 3,500,000 | | | | 3,496,640 | |
2018-1A, C, 144A, FRN, 5.42%, (3-month USD LIBOR + 2.90%), 4/30/31 | | | United States | | | | 300,000 | | | | 299,700 | |
| | | | |
| | | |
| franklintempleton.com | | Annual Report | | 71 |
FRANKLIN INVESTORS SECURITIES TRUST
STATEMENT OF INVESTMENTS
Franklin Low Duration Total Return Fund (continued)
| | | | | | | | | | | | |
| | | Country | | | Principal
Amount* | | | Value | |
Asset-Backed Securities and Commercial Mortgage-Backed Securities (continued) | | | | | | | | | | | | |
Diversified Financials (continued) | | | | | | | | | | | | |
e,q BlueMountain CLO Ltd., | | | | | | | | | | | | |
2014-2A, A2R2, 144A, FRN, 3.869%, 10/20/30 | | | United States | | | | 974,225 | | | $ | 974,834 | |
2014-2A, CR2, 144A, FRN, 4.669%, 10/20/30 | | | United States | | | | 1,000,000 | | | | 1,000,000 | |
2018-3A, B, 144A, FRN, 4.206%, 10/25/30 | | | United States | | | | 4,000,000 | | | | 3,999,280 | |
2018-3A, C, 144A, FRN, 4.636%, 10/25/30 | | | United States | | | | 1,785,715 | | | | 1,785,394 | |
e,p BlueMountain Fuji U.S. CLO I Ltd., 2017-1A, C, 144A, FRN, 4.819%, (3-month USD LIBOR + 2.35%), 7/20/29 | | | United States | | | | 1,361,000 | | | | 1,368,935 | |
e,p BlueMountain Fuji U.S. CLO II Ltd., | | | | | | | | | | | | |
2017-2A, A1A, 144A, FRN, 3.548%, (3-month USD LIBOR + 1.20%), 10/20/30 | | | United States | | | | 3,500,000 | | | | 3,517,430 | |
2017-2A, B, 144A, FRN, 4.498%, (3-month USD LIBOR + 2.15%), 10/20/30 | | | United States | | | | 1,000,000 | | | | 1,003,750 | |
e,p BlueMountain Fuji U.S. CLO III Ltd., 2017-3A, C, 144A, FRN, 4.039%, (3-month USD LIBOR + 1.70%), 1/15/30 | | | United States | | | | 500,000 | | | | 494,275 | |
e,p Burnham Park CLO Ltd., 2016-1A, A, 144A, FRN, 3.899%, (3-month USD LIBOR + 1.43%), 10/20/29 | | | United States | | | | 2,240,000 | | | | 2,253,597 | |
e,q BX Commercial Mortgage Trust, 2018-IND, A, 144A, FRN, 3.03%, 11/15/35 | | | United States | | | | 7,090,000 | | | | 7,158,171 | |
Capital One Multi-Asset Execution Trust, | | | | | | | | | | | | |
p 2004-B3, B3, FRN, 3.01%, (1-month USD LIBOR + 0.73%), 1/18/22 | | | United States | | | | 2,220,000 | | | | 2,224,464 | |
2017-A4, A4, 1.99%, 7/17/23 | | | United States | | | | 14,230,000 | | | | 13,926,769 | |
e,p Carlyle Global Market Strategies CLO Ltd., | | | | | | | | | | | | |
2012-4A, AR, 144A, FRN, 3.919%, (3-month USD LIBOR + 1.45%), 1/20/29 | | | United States | | | | 2,800,000 | | | | 2,805,740 | |
2014-1A, A2R2, 144A, FRN, 3.579%, (3-month USD LIBOR + 1.13%), 4/17/31 | | | United States | | | | 1,200,000 | | | | 1,200,000 | |
2014-4RA, A2, 144A, FRN, 4.036%, (3-month USD LIBOR + 1.60%), 7/15/30 | | | United States | | | | 12,000,000 | | | | 12,015,360 | |
e,q Carlyle GMS Finance MM CLO LLC, 2015-1A, A2R, 144A, FRN, 4.636%, 10/15/31 | | | United States | | | | 6,500,000 | | | | 6,511,375 | |
e,p Carlyle U.S. CLO Ltd., | | | | | | | | | | | | |
2017-1A, A1A, 144A, FRN, 3.769%, (3-month USD LIBOR + 1.30%), 4/20/31 | | | United States | | | | 1,000,000 | | | | 1,000,670 | |
2017-2A, B, 144A, FRN, 4.869%, (3-month USD LIBOR + 2.40%), 7/20/31 | | | United States | | | | 2,110,000 | | | | 2,116,604 | |
2017-3A, B, 144A, FRN, 4.819%, (3-month USD LIBOR + 2.35%), 7/20/29 | | | United States | | | | 1,250,000 | | | | 1,253,163 | |
2017-5A, B, 144A, FRN, 4.269%, (3-month USD LIBOR + 1.80%), 1/20/30 | | | United States | | | | 2,200,000 | | | | 2,162,842 | |
e,p Catamaran CLO Ltd., 2014-2A, BR, 144A, FRN, 5.395%, (3-month USD LIBOR + 2.95%), 10/18/26 | | | United States | | | | 3,011,300 | | | | 3,021,388 | |
e,p Cent CLO LP, | | | | | | | | | | | | |
2014-22A, A1R, 144A, FRN, 3.753%, (3-month USD LIBOR + 1.41%), 11/07/26 | | | United States | | | | 2,800,000 | | | | 2,802,632 | |
2014-22A, BR, 144A, FRN, 5.293%, (3-month USD LIBOR + 2.95%), 11/07/26 | | | United States | | | | 4,050,000 | | | | 4,058,141 | |
| | | | |
| | | |
| 72 | | Annual Report | | franklintempleton.com |
FRANKLIN INVESTORS SECURITIES TRUST
STATEMENT OF INVESTMENTS
Franklin Low Duration Total Return Fund (continued)
| | | | | | | | | | | | |
| | | Country | | | Principal
Amount* | | | Value | |
Asset-Backed Securities and Commercial Mortgage-Backed
Securities (continued) | | | | | | | | | | | | |
Diversified Financials (continued) | | | | | | | | | | | | |
e Centerline REIT Inc., 2004-RR3, B, 144A, 5.04%, 9/21/45 | | | United States | | | | 2,185,390 | | | $ | 2,152,588 | |
p Chase Issuance Trust, 2014-A5, A5, FRN, 2.65%, (1-month USD LIBOR + 0.37%), 4/15/21 | | | United States | | | | 7,310,000 | | | | 7,319,626 | |
e,q CIM Trust, 2018-INV1, A4, 144A, FRN, 4.00%, 8/25/48 | | | United States | | | | 9,131,668 | | | | 9,077,456 | |
Citibank Credit Card Issuance Trust, | | | | | | | | | | | | |
2017-A3, A3, 1.92%, 4/07/22 | | | United States | | | | 11,000,000 | | | | 10,816,991 | |
2018-A1, A1, 2.49%, 1/20/23 | | | United States | | | | 13,700,000 | | | | 13,497,718 | |
e,q Colombia Cent CLO 27 Ltd., 2018-27A, A2A, 144A, FRN, 4.899%, 10/25/28 | | | United States | | | | 1,538,462 | | | | 1,539,231 | |
e,q COMM Mortgage Trust, 2014-277P, A, 144A, FRN, 3.611%, 8/10/49 | | | United States | | | | 2,980,000 | | | | 2,972,078 | |
q Conseco Finance Securitizations Corp., 2002-2, M1, FRN, 7.424%, 3/01/33. | | | United States | | | | 723,394 | | | | 791,316 | |
q Conseco Financial Corp., 1998-6, A8, 6.66%, 6/01/30 | | | United States | | | | 4,191,088 | | | | 4,394,301 | |
e,q Consumer Loan Underlying Bond (CLUB) Certificate Issuer Trust I, | | | | | | | | | | | | |
2018-14, PT, 144A, FRN, 9.57%, 9/16/41 | | | United States | | | | 4,942,998 | | | | 4,929,947 | |
2018-8, 144A, FRN, 8.93%, 6/17/41 | | | United States | | | | 4,104,361 | | | | 4,104,478 | |
e,p Cook Park CLO Ltd., 2018-1A, A2, 144A, FRN, 3.569%, (3-month USD LIBOR + 1.12%), 4/17/30 | | | United States | | | | 1,000,000 | | | | 996,480 | |
e Core Industrial Trust, 2015-CALW, A, 144A, 3.04%, 2/10/34 | | | United States | | | | 12,678,992 | | | | 12,547,886 | |
q Countrywide Home Loans, 2004-11, 2A1, FRN, 3.605%, 7/25/34 | | | United States | | | | 1,460,623 | | | | 1,462,281 | |
Credit Suisse First Boston Mortgage Securities Corp., 2004-6, 3A1, 5.00%, 9/25/19 | | | United States | | | | 215,472 | | | | 223,537 | |
e,q CSMC Trust, 2014-IVR3, A1, 144A, FRN, 3.50%, 7/25/44 | | | United States | | | | 2,043,189 | | | | 1,990,293 | |
Discover Card Execution Note Trust, | | | | | | | | | | | | |
p 2014-A1, A1, FRN, 2.71%, (1-month USD LIBOR + 0.43%), 7/15/21 | | | United States | | | | 7,690,000 | | | | 7,695,771 | |
2018-A4, A4, 3.11%, 1/16/24 | | | United States | | | | 8,230,000 | | | | 8,214,645 | |
e,p Dryden 33 Senior Loan Fund, 2014-33A, AR, 144A, FRN, 3.866%, (3-month USD LIBOR + 1.43%), 10/15/28 | | | United States | | | | 12,415,000 | | | | 12,433,498 | |
e,p Dryden 41 Senior Loan Fund, 2015-41A, AR, 144A, FRN, 3.406%, (3-month USD LIBOR + 0.97%), 4/15/31 | | | United States | | | | 1,875,000 | | | | 1,863,638 | |
e,q Dryden 45 Senior Loan Fund, 2016-45A, CR, 144A, FRN, 4.636%, 10/15/30 | | | United States | | | | 625,000 | | | | 625,025 | |
e,p Dryden 49 Senior Loan Fund, 2017-49A, C, 144A, FRN, 4.799%, (3-month USD LIBOR + 2.35%), 7/18/30 | | | United States | | | | 870,000 | | | | 871,836 | |
e,p Dryden 50 Senior Loan Fund, | | | | | | | | | | | | |
2017-50A, A1, 144A, FRN, 3.656%, (3-month USD LIBOR + 1.22%), 7/15/30 | | | United States | | | | 2,640,000 | | | | 2,644,171 | |
2017-50A, C, 144A, FRN, 4.686%, (3-month USD LIBOR + 2.25%), 7/15/30 | | | United States | | | | 2,150,000 | | | | 2,154,064 | |
e,p Dryden 53 CLO Ltd., | | | | | | | | | | | | |
2017-53A, B, 144A, FRN, 3.836%, (3-month USD LIBOR + 1.40%), 1/15/31 | | | United States | | | | 700,000 | | | | 692,930 | |
2017-53A, C, 144A, FRN, 4.136%, (3-month USD LIBOR + 1.70%), 1/15/31 | | | United States | | | | 1,000,000 | | | | 987,100 | |
e,p Dryden 55 CLO Ltd., | | | | | | | | | | | | |
2018-55A, A1, 144A, FRN, 3.456%, (3-month USD LIBOR + 1.02%), 4/15/31 | | | United States | | | | 3,000,000 | | | | 2,994,720 | |
2018-55A, D, 144A, FRN, 5.286%, (3-month USD LIBOR + 2.85%), 4/15/31 | | | United States | | | | 300,000 | | | | 299,883 | |
| | | | |
| | | |
| franklintempleton.com | | Annual Report | | 73 |
FRANKLIN INVESTORS SECURITIES TRUST
STATEMENT OF INVESTMENTS
Franklin Low Duration Total Return Fund (continued)
| | | | | | | | | | | | |
| | | Country | | | Principal
Amount* | | | Value | |
Asset-Backed Securities and Commercial Mortgage-Backed
Securities (continued) | | | | | | | | | | | | |
Diversified Financials (continued) | | | | | | | | | | | | |
e,p Dryden 64 CLO Ltd., | | | | | | | | | | | | |
2018-64A, A, 144A, FRN, 3.415%, (3-month USD LIBOR + 0.97%), 4/18/31 | | | United States | | | | 1,500,000 | | | $ | 1,492,635 | |
2018-64A, D, 144A, FRN, 5.095%, (3-month USD LIBOR + 2.65%), 4/18/31 | | | United States | | | | 500,000 | | | | 490,605 | |
e,p Dryden CLO Ltd., | | | | | | | | | | | | |
2018-55A, C, 144A, FRN, 4.336%, (3-month USD LIBOR + 1.90%), 4/15/31 | | | United States | | | | 600,000 | | | | 597,882 | |
2018-58A, A2, 144A, FRN, 3.571%, (3-month USD LIBOR + 1.25%), 7/17/31 | | | United States | | | | 1,600,000 | | | | 1,599,488 | |
2018-58A, B, 144A, FRN, 3.821%, (3-month USD LIBOR + 1.50%), 7/17/31 | | | United States | | | | 11,000,000 | | | | 10,996,040 | |
2018-58A, D, 144A, FRN, 5.021%, (3-month USD LIBOR + 2.70%), 7/17/31 | | | United States | | | | 1,000,000 | | | | 999,610 | |
e,q Eaton Vance CLO Ltd., 2014-1RA, C, 144A, FRN, 4.257%, 7/15/30 | | | United States | | | | 789,030 | | | | 785,629 | |
e,p Ellington CLO III Ltd., 2018-3A, A1, 144A, FRN, 4.119%, (3-month USD LIBOR + 1.65%), 7/20/30 | | | United States | | | | 3,400,000 | | | | 3,398,062 | |
FHLMC Structured Agency Credit Risk Debt Notes, | | | | | | | | | | | | |
p 2014-DN1, M2, FRN, 4.481%, (1-month USD LIBOR + 2.20%), 2/25/24 | | | United States | | | | 1,232,831 | | | | 1,265,171 | |
p 2014-DN2, M3, FRN, 5.881%, (1-month USD LIBOR + 3.60%), 4/25/24 | | | United States | | | | 14,350,000 | | | | 15,831,996 | |
p 2014-DN3, M3, FRN, 6.281%, (1-month USD LIBOR + 4.00%), 8/25/24 | | | United States | | | | 2,254,665 | | | | 2,451,170 | |
p 2014-DN4, M3, FRN, 6.831%, (1-month USD LIBOR + 4.55%), 10/25/24 | | | United States | | | | 8,829,098 | | | | 9,763,616 | |
p 2014-HQ1, M2, FRN, 4.781%, (1-month USD LIBOR + 2.50%), 8/25/24 | | | United States | | | | 455,345 | | | | 456,710 | |
p 2014-HQ1, M3, FRN, 6.381%, (1-month USD LIBOR + 4.10%), 8/25/24 | | | United States | | | | 5,200,000 | | | | 5,672,571 | |
p 2014-HQ2, M3, FRN, 6.031%, (1-month USD LIBOR + 3.75%), 9/25/24 | | | United States | | | | 12,060,000 | | | | 13,825,208 | |
p 2014-HQ3, M3, FRN, 7.031%, (1-month USD LIBOR + 4.75%), 10/25/24 | | | United States | | | | 3,297,006 | | | | 3,641,227 | |
p 2015-DN1, M3, FRN, 6.431%, (1-month USD LIBOR + 4.15%), 1/25/25 | | | United States | | | | 16,866,895 | | | | 18,072,227 | |
p 2015-DNA1, M2, FRN, 4.131%, (1-month USD LIBOR + 1.85%), 10/25/27 | | | United States | | | | 8,987,572 | | | | 9,132,083 | |
p 2015-DNA1, M3, FRN, 5.581%, (1-month USD LIBOR + 3.30%), 10/25/27 | | | United States | | | | 4,500,000 | | | | 5,038,624 | |
p 2015-DNA2, M2, FRN, 4.881%, (1-month USD LIBOR + 2.60%), 12/25/27 | | | United States | | | | 5,315,883 | | | | 5,419,223 | |
p 2015-DNA2, M3, FRN, 6.181%, (1-month USD LIBOR + 3.90%), 12/25/27 | | | United States | | | | 18,171,000 | | | | 20,048,068 | |
p 2015-DNA3, M2, FRN, 5.131%, (1-month USD LIBOR + 2.85%), 4/25/28 | | | United States | | | | 5,195,209 | | | | 5,363,064 | |
p 2015-DNA3, M3, FRN, 6.981%, (1-month USD LIBOR + 4.70%), 4/25/28 | | | United States | | | | 6,970,000 | | | | 8,248,508 | |
p 2015-HQ1, M2, FRN, 4.487%, (1-month USD LIBOR + 2.20%), 3/25/25 | | | United States | | | | 774,861 | | | | 776,928 | |
| | | | |
| | | |
| 74 | | Annual Report | | franklintempleton.com |
FRANKLIN INVESTORS SECURITIES TRUST
STATEMENT OF INVESTMENTS
Franklin Low Duration Total Return Fund (continued)
| | | | | | | | | | | | |
| | | Country | | | Principal
Amount* | | | Value | |
Asset-Backed Securities and Commercial Mortgage-Backed
Securities (continued) | | | | | | | | | | | | |
Diversified Financials (continued) | | | | | | | | | | | | |
FHLMC Structured Agency Credit Risk Debt Notes, (continued) | | | | | | | | | | | | |
p 2015-HQ1, M3, FRN, 6.087%, (1-month USD LIBOR + 3.80%), 3/25/25 | | | United States | | | | 13,295,000 | | | $ | 14,094,095 | |
p 2015-HQ2, M3, FRN, 5.537%, (1-month USD LIBOR + 3.25%), 5/25/25 | | | United States | | | | 6,860,000 | | | | 7,632,958 | |
p 2015-HQA1, M2, FRN, 4.931%, (1-month USD LIBOR + 2.65%), 3/25/28 | | | United States | | | | 5,183,080 | | | | 5,267,891 | |
p 2015-HQA1, M3, FRN, 6.981%, (1-month USD LIBOR + 4.70%), 3/25/28 | | | United States | | | | 13,500,000 | | | | 15,373,550 | |
p 2015-HQA2, M2, FRN, 5.081%, (1-month USD LIBOR + 2.80%), 5/25/28 | | | United States | | | | 6,511,748 | | | | 6,686,716 | |
p 2016-DNA1, M2, FRN, 5.187%, (1-month USD LIBOR + 2.90%), 7/25/28 | | | United States | | | | 261,670 | | | | 267,504 | |
p 2016-DNA1, M3, FRN, 7.837%, (1-month USD LIBOR + 5.55%), 7/25/28 | | | United States | | | | 13,460,000 | | | | 16,198,165 | |
p 2016-DNA2, M2, FRN, 4.481%, (1-month USD LIBOR + 2.20%), 10/25/28 | | | United States | | | | 1,138,578 | | | | 1,149,535 | |
p 2016-DNA2, M3, FRN, 6.931%, (1-month USD LIBOR + 4.65%), 10/25/28 | | | United States | | | | 10,047,000 | | | | 11,532,469 | |
p 2016-HQA1, M2, FRN, 5.031%, (1-month USD LIBOR + 2.75%), 9/25/28 | | | United States | | | | 790,649 | | | | 806,842 | |
p 2016-HQA2, M2, FRN, 4.531%, (1-month USD LIBOR + 2.25%), 11/25/28 | | | United States | | | | 880,705 | | | | 898,662 | |
p 2016-HQA2, M3, FRN, 7.431%, (1-month USD LIBOR + 5.15%), 11/25/28 | | | United States | | | | 9,640,000 | | | | 11,322,296 | |
p 2016-HQA3, M2, FRN, 3.631%, (1-month USD LIBOR + 1.35%), 3/25/29 | | | United States | | | | 250,000 | | | | 253,721 | |
p 2018-HQA1, M1, FRN, 2.981%, (1-month USD LIBOR + 0.70%), 9/25/30 | | | United States | | | | 7,730,800 | | | | 7,746,865 | |
q HQA1, M2, FRN, 5.831%, 8/25/29 | | | United States | | | | 15,764,156 | | | | 17,218,923 | |
e,p Flagship CLO VIII Ltd., | | | | | | | | | | | | |
2014-8A, ARR, 144A, FRN, 3.286%, (3-month USD LIBOR + 0.85%), 1/16/26 | | | United States | | | | 6,385,000 | | | | 6,376,572 | |
2014-8A, DR, 144A, FRN, 5.486%, (3-month USD LIBOR + 3.05%), 1/16/26 | | | United States | | | | 2,000,000 | | | | 1,998,180 | |
e,q Flagstar Mortgage Trust, 2018-6RR, 1A3, 144A, FRN, 4.00%, 10/25/48 | | | United States | | | | 10,000,000 | | | | 10,019,930 | |
FNMA Connecticut Avenue Securities, | | | | | | | | | | | | |
p 2013-C01, M1, FRN, 4.281%, (1-month USD LIBOR + 2.00%), 10/25/23 | | | United States | | | | 118,913 | | | | 119,071 | |
p 2013-C01, M2, FRN, 7.531%, (1-month USD LIBOR + 5.25%), 10/25/23 | | | United States | | | | 15,760,000 | | | | 18,059,135 | |
p 2014-C01, M1, FRN, 3.881%, (1-month USD LIBOR + 1.60%), 1/25/24 | | | United States | | | | 4,073,298 | | | | 4,091,891 | |
p 2014-C02, 1M2, FRN, 4.881%, (1-month USD LIBOR + 2.60%), 5/25/24 | | | United States | | | | 13,645,000 | | | | 14,513,860 | |
p 2014-C02, 2M2, FRN, 4.881%, (1-month USD LIBOR + 2.60%), 5/25/24 | | | United States | | | | 1,448,525 | | | | 1,533,640 | |
p 2014-C03, 1M2, FRN, 5.281%, (1-month USD LIBOR + 3.00%), 7/25/24 | | | United States | | | | 15,583,330 | | | | 16,611,771 | |
| | | | |
| | | |
| franklintempleton.com | | Annual Report | | 75 |
FRANKLIN INVESTORS SECURITIES TRUST
STATEMENT OF INVESTMENTS
Franklin Low Duration Total Return Fund (continued)
| | | | | | | | | | | | |
| | | Country | | | Principal
Amount* | | | Value | |
Asset-Backed Securities and Commercial Mortgage-Backed
Securities (continued) | | | | | | | | | | | | |
Diversified Financials (continued) | | | | | | | | | | | | |
FNMA Connecticut Avenue Securities, (continued) | | | | | | | | | | | | |
p 2014-C03, 2M2, FRN, 5.181%, (1-month USD LIBOR + 2.90%), 7/25/24 | | | United States | | | | 13,321,531 | | | $ | 14,245,885 | |
p 2014-C04, 1M1, FRN, 7.181%, (1-month USD LIBOR + 4.90%), 11/25/24 | | | United States | | | | 12,698,274 | | | | 14,519,472 | |
p 2014-C04, 2M2, FRN, 7.281%, (1-month USD LIBOR + 5.00%), 11/25/24 | | | United States | | | | 6,136,294 | | | | 6,921,255 | |
p 2015-C01, 1M2, FRN, 6.581%, (1-month USD LIBOR + 4.30%), 2/25/25 | | | United States | | | | 13,279,543 | | | | 14,581,759 | |
p 2015-C01, 2M2, FRN, 6.831%, (1-month USD LIBOR + 4.55%), 2/25/25 | | | United States | | | | 7,258,880 | | | | 7,832,476 | |
p 2015-C02, 1M2, FRN, 6.281%, (1-month USD LIBOR + 4.00%), 5/25/25 | | | United States | | | | 13,839,974 | | | | 15,181,551 | |
p 2015-C02, 2M2, FRN, 6.281%, (1-month USD LIBOR + 4.00%), 5/25/25 | | | United States | | | | 8,867,920 | | | | 9,567,491 | |
p 2015-C03, 1M2, FRN, 7.281%, (1-month USD LIBOR + 5.00%), 7/25/25 | | | United States | | | | 12,635,968 | | | | 14,224,749 | |
p 2015-C03, 2M2, FRN, 7.281%, (1-month USD LIBOR + 5.00%), 7/25/25 | | | United States | | | | 8,302,918 | | | | 9,230,442 | |
q 2016-C01, 2M2, FRN, FRN,FRN, 9.231%, 8/25/28 | | | United States | | | | 10,159,286 | | | | 11,947,132 | |
p 2017-C01, 1M2, FRN, 5.831%, (1-month USD LIBOR + 3.55%), 7/25/29 | | | United States | | | | 6,805,000 | | | | 7,377,525 | |
p 2018-C02, 2M1, FRN, 2.931%, (1-month USD LIBOR + 0.65%), 8/25/30 | | | United States | | | | 7,800,678 | | | | 7,810,672 | |
e,s,t Galaxy CLO Ltd., 2018-26A, D, 144A, FRN, 11/22/31 | | | United States | | | | 293,478 | | | | 293,478 | |
e,q,t Galaxy XXV CLO Ltd., 2018-25A, B, 144A, FRN, 10/25/31 | | | United States | | | | 2,000,000 | | | | 2,000,220 | |
e,s,t Galaxy XXVI CLO Ltd., | | | | | | | | | | | | |
2018-26A, A, 144A, FRN, 11/22/31 | | | United States | | | | 3,429,602 | | | | 3,429,602 | |
2018-26A, B, 144A, FRN, 11/22/31 | | | United States | | | | 2,100,000 | | | | 2,100,000 | |
e,p Galaxy XXVII CLO Ltd., | | | | | | | | | | | | |
2018-27A, A, 144A, FRN, 3.335%, (3-month USD LIBOR + 1.02%), 5/16/31 | | | United States | | | | 1,500,000 | | | | 1,493,280 | |
2018-27A, C, 144A, FRN, 5.065%, (3-month USD LIBOR + 2.75%), 5/16/31 | | | United States | | | | 250,000 | | | | 249,138 | |
q Greenpoint Manufactured Housing, 1999-5, M1A, FRN, 8.30%, 10/15/26 | | | United States | | | | 549,176 | | | | 586,788 | |
q,r GS Mortgage Securities Corp. II, 2015-GC30, XA, IO, FRN, 0.863%, 5/10/50 | | | United States | | | | 7,846,863 | | | | 289,353 | |
p GSAA Home Equity Trust, | | | | | | | | | | | | |
2005-5, M3, FRN, 3.226%, (1-month USD LIBOR + 0.945%), 2/25/35 | | | United States | | | | 3,325,381 | | | | 3,351,584 | |
2005-6, A3, FRN, 2.651%, (1-month USD LIBOR + 0.37%), 6/25/35 | | | United States | | | | 144,147 | | | | 144,409 | |
p GSAMP Trust, 2005-HE3, M2, FRN, 3.286%, (1-month USD LIBOR + 1.005%), 6/25/35 | | | United States | | | | 295,764 | | | | 296,514 | |
q GSR Mortgage Loan Trust, 2005-AR1, 1A1, FRN, 4.517%, 1/25/35 | | | United States | | | | 304,543 | | | | 305,287 | |
e,p Halcyon Loan Advisors Funding Ltd., 2018-1A, A2, 144A, FRN, 4.183%, (3-month USD LIBOR + 1.80%), 7/21/31 | | | United States | | | | 5,000,000 | | | | 4,984,400 | |
e,p HayFin Kingsland IX Ltd., 2013-6A, BR, 144A, FRN, 4.309%, (3-month USD LIBOR + 1.80%), 4/28/31 | | | United States | | | | 5,200,000 | | | | 5,222,880 | |
| | | | |
| | | |
| 76 | | Annual Report | | franklintempleton.com |
FRANKLIN INVESTORS SECURITIES TRUST
STATEMENT OF INVESTMENTS
Franklin Low Duration Total Return Fund (continued)
| | | | | | | | | | | | |
| | | Country | | | Principal
Amount* | | | Value | |
Asset-Backed Securities and Commercial Mortgage-Backed
Securities (continued) | | | | | | | | | | | | |
Diversified Financials (continued) | | | | | | | | | | | | |
e,q HPS Loan Management Ltd., | | | | | | | | | | | | |
2013A-18, A2, 144A, FRN, 3.886%, 10/15/30 | | | United States | | | | 1,400,000 | | | $ | 1,400,224 | |
2013A-18, C, 144A, FRN, 4.586%, 10/15/30 | | | United States | | | | 500,000 | | | | 499,915 | |
e Invitation Homes Trust, | | | | | | | | | | | | |
p 2017-SFR2, A, 144A, FRN, 3.14%, (1-month USD LIBOR + 0.85%), 12/17/36 | | | United States | | | | 14,055,582 | | | | 14,091,963 | |
p 2018-SFR3, A, 144A, FRN, 3.29%, (1-month USD LIBOR + 1.00%), 7/17/37 | | | United States | | | | 11,464,804 | | | | 11,472,307 | |
q,s 2018-SFR4, A, 144A, FRN, 3.35%, 1/17/38 | | | United States | | | | 9,400,000 | | | | 9,400,000 | |
q JP Morgan Chase Commercial Mortgage Securities Trust, 2005-LPD5, F, FRN, 5.706%, 12/15/44 | | | United States | | | | 852,794 | | | | 851,709 | |
q JP Morgan Mortgage Trust, 2004-A1, 5A1, FRN, 3.756%, 2/25/34 | | | United States | | | | 62,160 | | | | 63,888 | |
e,p LCM 26 Ltd., | | | | | | | | | | | | |
26A, B, 144A, FRN, 3.869%, (3-month USD LIBOR + 1.40%), 1/20/31 | | | United States | | | | 4,500,000 | | | | 4,446,945 | |
26A, C, 144A, FRN, 4.269%, (3-month USD LIBOR + 1.80%), 1/20/31 | | | United States | | | | 2,000,000 | | | | 1,977,980 | |
e,p LCM XXIII Ltd., 23A, A2, 144A, FRN, 4.319%, (3-month USD LIBOR + 1.85%), 10/20/29 | | | United States | | | | 1,000,000 | | | | 1,003,110 | |
p Lehman XS Trust, 2005-4, 1A4, FRN, 2.841%, (1-month USD LIBOR + 0.56%), 10/25/35 | | | United States | | | | 487,195 | | | | 480,748 | |
e,p Long Point Park CLO Ltd., | | | | | | | | | | | | |
2017-1A, A2, 144A, FRN, 3.824%, (3-month USD LIBOR + 1.375%), 1/17/30 | | | United States | | | | 2,400,000 | | | | 2,378,928 | |
2017-1A, B, 144A, FRN, 4.149%, (3-month USD LIBOR + 1.70%), 1/17/30 | | | United States | | | | 1,000,000 | | | | 982,140 | |
e,q Mach One ULC, 2004-1A, M, 144A, FRN, 5.45%, 5/28/40 | | | United States | | | | 555,194 | | | | 547,429 | |
p Madison Avenue Manufactured Housing Contract Trust, 2002-A, B1, FRN, 5.531%, (1-month USD LIBOR + 3.25%), 3/25/32 | | | United States | | | | 334,633 | | | | 338,180 | |
e,p Madison Park Funding Ltd., 2018-28A, B, 144A, FRN, 3.937%, (3-month USD LIBOR + 1.60%), 7/15/30 | | | United States | | | | 2,000,000 | | | | 2,004,920 | |
e,q Madison Park Funding XIV Ltd., | | | | | | | | | | | | |
2014-14A, BRR, 144A, FRN, 4.169%, 10/22/30 | | | United States | | | | 1,000,000 | | | | 999,720 | |
2014-14A, CRR, 144A, FRN, 4.669%, 10/22/30 | | | United States | | | | 375,000 | | | | 374,888 | |
e,p Madison Park Funding XXIII Ltd., | | | | | | | | | | | | |
2017-23A, B, 144A, FRN, 4.209%, (3-month USD LIBOR + 1.70%), 7/27/30 | | | United States | | | | 4,000,000 | | | | 3,999,120 | |
2017-23A, C, 144A, FRN, 4.859%, (3-month USD LIBOR + 2.35%), 7/27/30 | | | United States | | | | 1,300,000 | | | | 1,304,875 | |
e,s,t Madison Park Funding XXIX Ltd., | | | | | | | | | | | | |
2018-29A, A2, 144A, FRN, 10/18/30 | | | United States | | | | 7,945,455 | | | | 7,945,455 | |
2018-29A, B, 144A, FRN, 10/18/30 | | | United States | | | | 4,000,000 | | | | 4,000,000 | |
2018-29A, C, 144A, FRN, 10/18/30 | | | United States | | | | 995,968 | | | | 995,968 | |
2018-29A, D, 144A, FRN, 10/18/30 | | | United States | | | | 800,000 | | | | 800,000 | |
e,p Madison Park Funding XXVII Ltd., 2018-27A, A1B, 144A, FRN, 3.599%, (3-month USD LIBOR + 1.13%), 4/20/30 | | | United States | | | | 3,061,000 | | | | 3,060,633 | |
e,p Madison Park Funding XXVIII Ltd., 2018-28A, D, 144A, FRN, 5.037%, (3-month USD LIBOR + 2.70%), 7/15/30 | | | United States | | | | 500,000 | | | | 490,040 | |
e,q Magnetite Ltd., 2015-14RA, A1, 144A, FRN, 3.559%, 10/18/31 | | | United States | | | | 11,000,000 | | | | 10,999,670 | |
e,p Magnetite XVIII Ltd., 2016-18A, B, 144A, FRN, 4.064%, (3-month USD LIBOR + 1.75%), 11/15/28 | | | United States | | | | 3,000,000 | | | | 3,003,720 | |
| | | | |
| | | |
| franklintempleton.com | | Annual Report | | 77 |
FRANKLIN INVESTORS SECURITIES TRUST
STATEMENT OF INVESTMENTS
Franklin Low Duration Total Return Fund (continued)
| | | | | | | | | | | | |
| | | Country | | | Principal
Amount* | | | Value | |
Asset-Backed Securities and Commercial Mortgage-Backed
Securities (continued) | | | | | | | | | | | | |
Diversified Financials (continued) | | | | | | | | | | | | |
p Manufactured Housing Contract Trust Pass Through Certificates, 2001-1, IIM2, FRN, 3.73%, (1-month USD LIBOR + 1.45%), 4/20/32 | | | United States | | | | 4,573,249 | | | $ | 4,532,675 | |
MASTR Alternative Loan Trust, | | | | | | | | | | | | |
2003-1, 3A1, 5.00%, 6/25/23 | | | United States | | | | 13,493 | | | | 13,962 | |
2003-6, 2A1, 5.00%, 8/25/20 | | | United States | | | | 24,079 | | | | 24,083 | |
q 2004-11, 2A1, FRN, 5.475%, 11/25/19 | | | United States | | | | 158,556 | | | | 160,769 | |
2004-4, 5A1, 5.50%, 4/25/19 | | | United States | | | | 42,998 | | | | 43,112 | |
p Merrill Lynch Mortgage Investors Trust, 2005-A10, A, FRN, 2.491%, (1-month USD LIBOR + 0.21%), 2/25/36 | | | United States | | | | 2,369,635 | | | | 2,292,488 | |
p Merrill Lynch Mortgage Investors Trust Inc., 2003-E, A1, FRN, 2.901%, (1-month USD LIBOR + 0.62%), 10/25/28 | | | United States | | | | 610,979 | | | | 608,309 | |
q Merrill Lynch Mortgage Trust, 2005-CKI1, D, FRN, 5.376%, 11/12/37 | | | United States | | | | 2,920 | | | | 2,915 | |
e,q Mill City Mortgage Loan Trust, | | | | | | | | | | | | |
2017-3, A1, 144A, FRN, 2.75%, 1/25/61 | | | United States | | | | 8,460,774 | | | | 8,278,181 | |
2018-1, A1, 144A, FRN, 3.25%, 5/25/62 | | | United States | | | | 15,228,297 | | | | 15,092,739 | |
e,q Morgan Stanley Capital I Trust, 2011-C1, A4, 144A, FRN, 5.033%, 9/15/47 | | | United States | | | | 3,869,870 | | | | 3,971,267 | |
e,q Neuberger Berman CLO Ltd., | | | | | | | | | | | | |
2016-22A, A2R, 144A, FRN, 3.849%, 10/17/30 | | | United States | | | | 1,400,000 | | | | 1,400,000 | |
2016-22A, BR, 144A, FRN, 4.099%, 10/17/30 | | | United States | | | | 900,000 | | | | 900,000 | |
e,p Neuberger Berman Loan Advisers CLO Ltd., | | | | | | | | | | | | |
2017-26A, B, 144A, FRN, 3.945%, (3-month USD LIBOR + 1.50%), 10/18/30 | | | United States | | | | 1,078,945 | | | | 1,073,076 | |
e,p Neuberger Berman CLO XVI-S Ltd., | | | | | | | | | | | | |
2017-16SA, B, 144A, FRN, 3.686%, (3-month USD LIBOR + 1.25%), 1/15/28 | | | United States | | | | 400,000 | | | | 395,644 | |
2017-16SA, C, 144A, FRN, 4.036%, (3-month USD LIBOR + 1.60%), 1/15/28 | | | United States | | | | 400,000 | | | | 396,380 | |
2018-27A, C, 144A, FRN, 4.136%, (3-month USD LIBOR + 1.70%), 1/15/30 | | | United States | | | | 500,000 | | | | 498,305 | |
p New York Mortgage Trust, 2005-3, M1, FRN, 2.956%, (1-month USD LIBOR + 0.675%), 2/25/36 | | | United States | | | | 247,550 | | | | 227,054 | |
e,p NZCG Funding Ltd., 2015-1A, A2R, 144A, FRN, 3.861%, (3-month USD LIBOR + 1.55%), 2/26/31 | | | United States | | | | 6,600,000 | | | | 6,545,682 | |
e OBP Depositor LLC Trust, 2010-OBP, A, 144A, 4.646%, 7/15/45 | | | United States | | | | 5,834,000 | | | | 5,932,172 | |
e,p OBX Trust, 2018-1, A2, 144A, FRN, 2.931%, (1-month USD LIBOR + 0.65%), 6/25/57 | | | United States | | | | 4,569,052 | | | | 4,568,528 | |
e,p Octagon Investment Partners 18-R Ltd., 2018-18A, C, 144A, FRN, 5.136%, (3-month USD LIBOR + 2.70%), 4/16/31 | | | United States | | | | 1,000,000 | | | | 991,540 | |
e,p Octagon Investment Partners 26 Ltd., | | | | | | | | | | | | |
2016-1A, A2R, 144A, FRN, 3.786%, (3-month USD LIBOR + 1.35%), 7/15/30 | | | United States | | | | 1,600,000 | | | | 1,601,184 | |
2016-1A, BR, 144A, FRN, 4.036%, (3-month USD LIBOR + 1.60%), 7/15/30 | | | United States | | | | 2,000,000 | | | | 2,001,200 | |
| | | | |
| | | |
| 78 | | Annual Report | | franklintempleton.com |
FRANKLIN INVESTORS SECURITIES TRUST
STATEMENT OF INVESTMENTS
Franklin Low Duration Total Return Fund (continued)
| | | | | | | | | | | | |
| | | Country | | | Principal
Amount* | | | Value | |
Asset-Backed Securities and Commercial Mortgage-Backed
Securities (continued) | | | | | | | | | | | | |
Diversified Financials (continued) | | | | | | | | | | | | |
e,p Octagon Investment Partners 31 LLC, 2017-1A, C, 144A, FRN, 4.869%, (3-month USD LIBOR + 2.40%), 7/20/30 | | | United States | | | | 280,761 | | | $ | 282,097 | |
e,p Octagon Investment Partners 35 Ltd., 2018-1A, A1B, 144A, FRN, 3.569%, (3-month USD LIBOR + 1.10%), 1/20/31 | | | United States | | | | 2,000,000 | | | | 1,997,960 | |
e,p Octagon Investment Partners 37 Ltd., 2018-2A, A2, 144A, FRN, 3.94%, (3-month USD LIBOR + 1.58%), 7/25/30 | | | United States | | | | 1,000,000 | | | | 999,870 | |
e,p Octagon Investment Partners XVI Ltd., 2013-1A, BR, 144A, FRN, 3.936%, (3-month USD LIBOR + 1.60%), 7/17/30 | | | United States | | | | 4,000,000 | | | | 3,982,840 | |
e,p Octagon Investment Partners XX Ltd., 2014-1A, AR, 144A, FRN, 3.468%, (3-month USD LIBOR + 1.13%), 8/12/26 | | | United States | | | | 3,500,000 | | | | 3,504,620 | |
e,p Octagon Investment Partners XXIII Ltd., | | | | | | | | | | | | |
2015-1A, CR, 144A, FRN, 4.286%, (3-month USD LIBOR + 1.85%), 7/15/27 | | | United States | | | | 250,000 | | | | 250,330 | |
2015-1A, DR, 144A, FRN, 4.986%, (3-month USD LIBOR + 2.55%), 7/15/27 | | | United States | | | | 300,000 | | | | 298,491 | |
e Progress Residential Trust, | | | | | | | | | | | | |
2015-SFR2, A, 144A, 2.74%, 6/12/32 | | | United States | | | | 863,029 | | | | 849,459 | |
2017-SFR1, A, 144A, 2.768%, 8/17/34 | | | United States | | | | 408,687 | | | | 393,743 | |
2018-SFR2, A, 144A, 3.712%, 8/17/35 | | | United States | | | | 2,967,000 | | | | 2,937,327 | |
p RAAC, 2004-SP1, AII, FRN, 2.981%, (1-month USD LIBOR + 0.70%), 3/25/34 | | | United States | | | | 376,572 | | | | 370,297 | |
e,q Race Point X CLO Ltd., 2016-10A, B1R, 144A, FRN, 4.14%, 7/25/31 | | | United States | | | | 700,000 | | | | 701,400 | |
e,p Radnor RE Ltd., 2018-1, M1, 144A, FRN, 3.681%, (1-month USD LIBOR + 1.40%), 3/25/28 | | | United States | | | | 5,790,000 | | | | 5,801,665 | |
q Structured ARM Loan Trust, 2004-12, 3A1, FRN, 4.328%, 9/25/34 | | | United States | | | | 1,914,954 | | | | 1,914,687 | |
p Structured Asset Mortgage Investments II Trust, 2004-AR6, A1A, FRN, 2.982%, (1-month USD LIBOR + 0.70%), 2/19/35 | | | United States | | | | 1,479,905 | | | | 1,448,794 | |
e,p TCI-Cent CLO Income Note Issuer Ltd., 2017-1A, B, 144A, FRN, 4.84%, (3-month USD LIBOR + 2.35%), 7/25/30 | | | United States | | | | 583,989 | | | | 586,167 | |
e,p TCI-Flatiron CLO Ltd., 2017-1A, C, 144A, FRN, 4.162%, (3-month USD LIBOR + 1.85%), 11/17/30 | | | United States | | | | 500,000 | | | | 495,915 | |
Thornburg Mortgage Securities Trust, | | | | | | | | | | | | |
p 2004-3, A, FRN, 3.021%, (1-month USD LIBOR + 0.74%), 9/25/44 | | | United States | | | | 837,314 | | | | 827,379 | |
q 2005-1, A3, FRN, 3.518%, 4/25/45 | | | United States | | | | 272,408 | | | | 275,631 | |
e Towd Point Mortgage Trust, | | | | | | | | | | | | |
q 2015-2, 2A1, 144A, FRN, 3.75%, 11/25/57 | | | United States | | | | 884,181 | | | | 885,370 | |
q 2015-3, A1B, 144A, FRN, 3.00%, 3/25/54 | | | United States | | | | 1,410,886 | | | | 1,399,683 | |
q 2016-1, A1, 144A, FRN, 3.50%, 2/25/55 | | | United States | | | | 6,079,953 | | | | 6,062,952 | |
q 2016-3, A1, 144A, FRN, 2.25%, 4/25/56 | | | United States | | | | 10,923,524 | | | | 10,685,036 | |
q 2016-4, A1, 144A, FRN, 2.25%, 7/25/56 | | | United States | | | | 15,341,484 | | | | 14,938,362 | |
q 2016-5, A1, 144A, FRN, 2.50%, 10/25/56 | | | United States | | | | 4,935,529 | | | | 4,816,434 | |
q 2017-1, A1, 144A, FRN, 2.75%, 10/25/56 | | | United States | | | | 14,059,198 | | | | 13,773,466 | |
q 2017-2, A1, 144A, FRN, 2.75%, 4/25/57 | | | United States | | | | 14,573,357 | | | | 14,274,346 | |
q 2017-4, A1, 144A, FRN, 2.75%, 6/25/57 | | | United States | | | | 14,863,251 | | | | 14,471,711 | |
p 2017-5, A1, 144A, FRN, 2.887%, (1-month USD LIBOR + 0.60%), 2/25/57 | | | United States | | | | 3,922,757 | | | | 3,928,194 | |
q 2018-1, A1, 144A, FRN, 3.00%, 1/25/58 | | | United States | | | | 3,072,253 | | | | 3,011,681 | |
q 2018-2, A1, 144A, FRN, 3.25%, 3/25/58 | | | United States | | | | 8,107,018 | | | | 8,001,129 | |
q 2018-3, A1, 144A, FRN, 3.75%, 5/25/58 | | | United States | | | | 13,035,685 | | | | 13,005,208 | |
q 2018-3, A1A, 144A, FRN, 3.50%, 3/25/54 | | | United States | | | | 3,055,286 | | | | 3,048,481 | |
q 2018-4, A1, 144A, FRN, 3.00%, 6/25/58 | | | United States | | | | 13,058,060 | | | | 12,689,992 | |
| | | | |
| | | |
| franklintempleton.com | | Annual Report | | 79 |
FRANKLIN INVESTORS SECURITIES TRUST
STATEMENT OF INVESTMENTS
Franklin Low Duration Total Return Fund (continued)
| | | | | | | | | | | | |
| | | Country | | | Principal
Amount* | | | Value | |
Asset-Backed Securities and Commercial Mortgage-Backed
Securities (continued) | | | | | | | | | | | | |
Diversified Financials (continued) | | | | | | | | | | | | |
e Towd Point Mortgage Trust, (continued) | | | | | | | | | | | | |
q 2018-5, A1A, 144A, FRN, 3.25%, 7/25/58 | | | United States | | | | 4,548,256 | | | $ | 4,495,717 | |
e Voya CLO Ltd., | | | | | | | | | | | | |
p 2012-4A, A2R, 144A, FRN, 4.286%, (3-month USD LIBOR + 1.85%), 10/15/28 | | | United States | | | | 7,660,000 | | | | 7,669,881 | |
p 2013-2A, CR, 144A, FRN, 5.24%, (3-month USD LIBOR + 2.75%), 4/25/31 | | | United States | | | | 375,000 | | | | 367,429 | |
p 2014-1A, CR2, 144A, FRN, 5.245%, (3-month USD LIBOR + 2.80%), 4/18/31 | | | United States | | | | 600,000 | | | | 597,006 | |
q 2016-3A, A1R, 144A, FRN, 3.661%, 10/18/31 | | | United States | | | | 1,800,000 | | | | 1,800,000 | |
q 2016-3A, A2R, 144A, FRN, 3.871%, 10/18/31 | | | United States | | | | 818,182 | | | | 818,182 | |
q 2016-3A, CR, 144A, FRN, 5.721%, 10/18/31 | | | United States | | | | 1,698,113 | | | | 1,698,113 | |
p 2017-3A, B, 144A, FRN, 4.819%, (3-month USD LIBOR + 2.35%), 7/20/30 | | | United States | | | | 507,690 | | | | 509,345 | |
p 2018-2A, A2, 144A, FRN, 3.624%, (3-month USD LIBOR + 1.25%), 7/15/31 | | | United States | | | | 2,500,000 | | | | 2,499,325 | |
p 2018-2A, D, 144A, FRN, 5.124%, (3-month USD LIBOR + 2.75%), 7/15/31 | | | United States | | | | 300,000 | | | | 295,356 | |
p WaMu Mortgage Pass-Through Certificates, | | | | | | | | | | | | |
2005-AR19, A1A1, FRN, 2.551%, (1-month USD LIBOR + 0.27%), 12/25/45 | | | United States | | | | 2,533,967 | | | | 2,531,817 | |
2005-AR8, 1A1A, FRN, 2.861%, (1-month USD LIBOR + 0.58%), 7/25/45 | | | United States | | | | 978,148 | | | | 976,860 | |
e,p Webster Park CLO Ltd., 2015-1A, A2R, 144A, FRN, 4.069%, (3-month USD LIBOR + 1.60%), 7/20/30 | | | United States | | | | 1,750,000 | | | | 1,755,530 | |
Wells Fargo Commercial Mortgage Trust, 2016-NXS6, A2, 2.399%, 11/15/49 | | | United States | | | | 6,534,000 | | | | 6,357,460 | |
e,q Wells Fargo Mortgage Backed Securities, 2018-1, A3, 144A, FRN, 3.50%, 7/25/47 | | | United States | | | | 6,200,000 | | | | 6,104,513 | |
q Wells Fargo Mortgage Backed Securities Trust, | | | | | | | | | | | | |
2004-W, A9, FRN, 4.69%, 11/25/34. | | | United States | | | | 75,800 | | | | 78,105 | |
2005-AR10, 2A3, FRN, 4.315%, 6/25/35 | | | United States | | | | 439,915 | | | | 445,330 | |
e,p West CLO Ltd., | | | | | | | | | | | | |
2014-1A, A2R, 144A, FRN, 3.795%, (3-month USD LIBOR + 1.35%), 7/18/26 | | | United States | | | | 1,360,000 | | | | 1,360,000 | |
2014-1A, BR, 144A, FRN, 4.295%, (3-month USD LIBOR + 1.85%), 7/18/26 | | | United States | | | | 2,410,000 | | | | 2,414,290 | |
| | | | | | | | | | | | |
| | | |
| | | | | | | | | | | 1,130,412,655 | |
| | | | | | | | | | | | |
Real Estate 0.5% | | | | | | | | | | | | |
e American Homes 4 Rent, 2015-SFR1, A, 144A, 3.467%, 4/17/52 | | | United States | | | | 5,747,369 | | | | 5,609,644 | |
e,p Colony American Homes, 2015-1A, A, 144A, FRN, 3.487%, (1-month USD LIBOR + 1.20%), 7/17/32 | | | United States | | | | 9,181,007 | | | | 9,189,185 | |
| | | | | | | | | | | | |
| | | |
| | | | | | | | | | | 14,798,829 | |
| | | | | | | | | | | | |
Total Asset-Backed Securities and Commercial | | | | | | | | | | | | |
Mortgage-Backed Securities (Cost $1,155,164,714) | | | | | | | | | | | 1,153,025,121 | |
| | | | | | | | | | | | |
| | | | |
| | | |
| 80 | | Annual Report | | franklintempleton.com |
FRANKLIN INVESTORS SECURITIES TRUST
STATEMENT OF INVESTMENTS
Franklin Low Duration Total Return Fund (continued)
| | | | | | | | | | | | |
| | | Country | | | Principal
Amount* | | | Value | |
Mortgage-Backed Securities 0.8% | | | | | | | | | | | | |
u Federal Home Loan Mortgage Corp. (FHLMC) Adjustable Rate 0.1% | | | | | | | | | | | | |
FHLMC, 3.742% - 4.233%, (12-month USD LIBOR +/- MBS Margin), 10/01/36 - 6/01/37 | | | United States | | | | 1,852,554 | | | $ | 1,952,935 | |
| | | | | | | | | | | | |
Federal Home Loan Mortgage Corp. (FHLMC) Fixed Rate 0.0%† | | | | | | | | | | | | |
FHLMC Gold 15 Year, 5.00%, 10/01/23 | | | United States | | | | 107,066 | | | | 108,510 | |
FHLMC Gold 15 Year, 6.00%, 6/01/23 | | | United States | | | | 18,522 | | | | 18,933 | |
FHLMC Gold 30 Year, 5.00%, 1/01/39 | | | United States | | | | 123,585 | | | | 130,486 | |
| | | | | | | | | | | | |
| | | |
| | | | | | | | | | | 257,929 | |
| | | | | | | | | | | | |
u Federal National Mortgage Association (FNMA) Adjustable Rate 0.6% | | | | | | | | | | | | |
FNMA, 3.225% - 3.293%, (1-month USD LIBOR +/- MBS Margin), 4/01/28 - 7/01/34 | | | United States | | | | 281,610 | | | | 289,832 | |
FNMA, 3.372% - 3.50%, (Federal COF +/- MBS Margin), 1/01/29 -10/01/29 | | | United States | | | | 13,542 | | | | 13,887 | |
FNMA, 3.146% - 4.354%, (1 Year CMT +/- MBS Margin), 1/01/31 -6/01/43 | | | United States | | | | 148,578 | | | | 150,049 | |
FNMA, 2.873% - 4.461%, (US 3 Year CMT T-Note +/- MBS Margin), 3/01/21 - 6/01/34 | | | United States | | | | 70,296 | | | | 72,003 | |
FNMA, 4.487%, (US 5 Year CMT T-Note +/- MBS Margin), 2/01/30 | | | United States | | | | 66,471 | | | | 68,897 | |
FNMA, 4.75%, (6-month US T-Bill +/- MBS Margin), 8/01/32 | | | United States | | | | 102,449 | | | | 104,379 | |
FNMA, 2.77% - 4.873%, (US 1 Year CMT T-Note +/- MBS Margin), 2/01/21 - 10/01/44 | | | United States | | | | 2,921,861 | | | | 3,013,557 | |
FNMA, 3.09% - 4.984%, (12-month USD LIBOR +/- MBS Margin), 11/01/32 - 2/01/44 | | | United States | | | | 12,404,817 | | | | 12,990,700 | |
FNMA, 3.425% - 5.644%, (6-month USD LIBOR +/- MBS Margin), 9/01/22 - 8/01/37 | | | United States | | | | 1,364,274 | | | | 1,398,715 | |
FNMA, 2.10% - 5.75%, (11th District COF +/- MBS Margin), 5/01/19 -12/01/36 | | | United States | | | | 131,527 | | | | 134,735 | |
| | | | | | | | | | | | |
| | | |
| | | | | | | | | | | 18,236,754 | |
| | | | | | | | | | | | |
Federal National Mortgage Association (FNMA) Fixed Rate 0.1% | | | | | | | | | | | | |
FNMA 15 Year, 3.50%, 10/01/25 | | | United States | | | | 856,599 | | | | 856,507 | |
FNMA 15 Year, 4.00%, 12/01/25 | | | United States | | | | 1,284,029 | | | | 1,306,250 | |
FNMA 15 Year, 4.50%, 5/01/23 - 6/01/25 | | | United States | | | | 967,585 | | | | 992,552 | |
FNMA 30 Year, 5.00%, 3/01/38 | | | United States | | | | 23,757 | | | | 24,941 | |
| | | | | | | | | | | | |
| | | |
| | | | | | | | | | | 3,180,250 | |
| | | | | | | | | | | | |
u Government National Mortgage Association (GNMA) Adjustable Rate 0.0%† | | | | | | | | | | | | |
GNMA, 3.625% - 3.75%, (US 1 Year CMT T-Note +/- MBS Margin), 4/20/26 - 9/20/26 | | | United States | | | | 19,045 | | | | 19,463 | |
| | | | | | | | | | | | |
Total Mortgage-Backed Securities
(Cost $23,795,320) | | | | | | | | | | | 23,647,331 | |
| | | | | | | | | | | | |
Municipal Bonds 0.8% | | | | | | | | | | | | |
Industry Public Facilities Authority Tax Allocation Revenue, Transportation District, Industrial Redevelopment Project No. 2, Refunding, Series B, AGMC Insured, 3.389%, 1/01/20 | | | United States | | | | 5,900,000 | | | | 5,913,039 | |
Pennsylvania State GO, Refunding, Second Series, 5.00%, 1/15/20 | | | United States | | | | 6,500,000 | | | | 6,717,815 | |
San Jose RDA Successor Agency Tax Allocation, | | | | | | | | | | | | |
Senior, Refunding, Series A-T, 2.48%, 8/01/21 | | | United States | | | | 1,595,000 | | | | 1,568,938 | |
Senior, Refunding, Series A-T, 2.63%, 8/01/22 | | | United States | | | | 5,320,000 | | | | 5,213,813 | |
| | | | |
| | | |
| franklintempleton.com | | Annual Report | | 81 |
FRANKLIN INVESTORS SECURITIES TRUST
STATEMENT OF INVESTMENTS
Franklin Low Duration Total Return Fund (continued)
| | | | | | | | | | | | |
| | | Country | | | Principal
Amount* | | | Value | |
Municipal Bonds (continued) | | | | | | | | | | | | |
Texas State GO, Transportation Commission Highway Improvement,
Series A, 5.00%, 4/01/21 | | | United States | | | | 2,685,000 | | | $ | 2,863,364 | |
| | | | | | | | | | | | |
| | | |
Total Municipal Bonds (Cost $22,475,215) | | | | | | | | | | | 22,276,969 | |
| | | | | | | | | | | | |
| | | |
| | | | | | Shares | | | | |
Escrows and Litigation Trusts 0.0% | | | | | | | | | | | | |
a,b NewPage Corp., Litigation Trust | | | United States | | | | 500,000 | | | | — | |
a,b T-Mobile USA Inc., Escrow Account | | | United States | | | | 1,800,000 | | | | — | |
| | | | | | | | | | | | |
Total Escrows and Litigation Trusts (Cost $—) | | | | | | | | | | | — | |
| | | | | | | | | | | | |
Total Investments before Short Term Investments
(Cost $2,846,160,541) | | | | | | | | | | | 2,815,399,980 | |
| | | | | | | | | | | | |
| | | |
Short Term Investments (Cost $58,057,813) 2.0% | | | | | | | | | | | | |
| | | |
Money Market Funds 2.0% | | | | | | | | | | | | |
d,v Institutional Fiduciary Trust Money Market Portfolio, 1.83% | | | United States | | | | 58,057,813 | | | | 58,057,813 | |
| | | | | | | | | | | | |
Total Investments (Cost $2,904,218,354) 100.4% | | | | | | | | | | | 2,873,457,793 | |
Other Assets, less Liabilities (0.4)% | | | | | | | | | | | (11,478,271 | ) |
| | | | | | | | | | | | |
Net Assets 100.0% | | | | | | | | | | $ | 2,861,979,522 | |
| | | | | | | | | | | | |
| | | | |
| | | |
| 82 | | Annual Report | | franklintempleton.com |
FRANKLIN INVESTORS SECURITIES TRUST
STATEMENT OF INVESTMENTS
Franklin Low Duration Total Return Fund (continued)
†Rounds to less than 0.1% of net assets.
*The principal amount is stated in U.S. dollars unless otherwise indicated.
aNon-income producing.
bFair valued using significant unobservable inputs. See Note 12 regarding fair value measurements.
cSee Note 8 regarding restricted securities.
dSee Note 3(f) regarding investments in affiliated management investment companies.
eSecurity was purchased pursuant to Rule 144A under the Securities Act of 1933 and may be sold in transactions exempt from registration only to qualified institutional buyers or in a public offering registered under the Securities Act of 1933. These securities have been deemed liquid under guidelines approved by the Trust’s Board of Trustees. At October 31, 2018, the aggregate value of these securities was $812,112,123, representing 28.4% of net assets.
fSecurity was purchased pursuant to Regulation S under the Securities Act of 1933, which exempts from registration securities offered and sold outside of the United States. Such a security cannot be sold in the United States without either an effective registration statement filed pursuant to the Securities Act of 1933, or pursuant to an exemption from registration. These securities have been deemed liquid under guidelines approved by the Trust’s Board of Trustees. At October 31, 2018, the aggregate value of these securities was $12,723,549, representing 0.4% of net assets.
gThe coupon rate shown represents the rate at period end.
hIncome may be received in additional securities and/or cash.
iSee Note 1(i) regarding senior floating rate interests.
jSecurity purchased on a delayed delivery basis. See Note 1(d).
kA portion or all of the security represents an unsettled loan commitment. The coupon rate is to-be determined (TBD) at the time of settlement and will be based upon a reference index/floor plus a spread.
lSee Note 1(j) regarding Marketplace Lending.
mPrincipal amount is stated in 100 Mexican Peso Units.
nPrincipal amount is stated in 1,000 Brazilian Real Units.
oPrincipal amount of security is adjusted for inflation. See Note 1(l).
pThe coupon rate shown represents the rate inclusive of any caps or floors, if applicable, in effect at period end.
qAdjustable rate security with an interest rate that is not based on a published reference index and spread. The rate is based on the structure of the agreement and current market conditions. The coupon rate shown represents the rate at period end.
rInvestment in an interest-only security entitles holders to receive only the interest payment on the underlying instruments. The principal amount shown is the notional amount of the underlying instruments.
sSecurity purchased on a when-issued basis. See Note 1(d).
tThe coupon rate will be determined at time of issue.
uAdjustable Rate Mortgage-Backed Security (ARM); the rate shown is the effective rate at period end. ARM rates are not based on a published reference rate and spread, but instead pass-through weighted average interest income inclusive of any caps or floors, if applicable, from the underlying mortgage loans in which the majority of mortgages pay interest based on the index shown at their designated reset dates plus a spread, less the applicable servicing and guaranty fee (MBS margin).
vThe rate shown is the annualized seven-day effective yield at period end.
At October 31, 2018, the Fund had the following futures contracts outstanding. See Note 1(e).
Futures Contracts
| | | | | | | | | | | | | | | | | | | | |
| Description | | | Type | | |
| Number of
Contracts |
| |
| Notional
Amount* |
| |
| Expiration
Date |
| |
| Value/
Unrealized
Appreciation
(Depreciation) |
|
| |
Interest Rate Contracts | | | | | | | | | | | | | | | | | | | | |
Canadian 10 Yr. Bond | | | Long | | | | 49 | | | | $ 4,919,918 | | | | 12/18/18 | | | | $ (66,260) | |
CME Ultra Long Term U.S. Treasury Bond | | | Short | | | | 5 | | | | 746,094 | | | | 12/19/18 | | | | 50,494 | |
U.S. Treasury 2 Yr. Note | | | Long | | | | 1,980 | | | | 417,099,375 | | | | 12/31/18 | | | | (1,170,228) | |
U.S. Treasury 5 Yr. Note | | | Short | | | | 242 | | | | 27,196,640 | | | | 12/31/18 | | | | 240,463 | |
U.S. Treasury 10 Yr. Note | | | Short | | | | 244 | | | | 28,898,750 | | | | 12/19/18 | | | | 459,579 | |
| | | | | | | | | | | | | | | | | | | | |
| | | | | |
Total Futures Contracts | | | | | | | | | | | | | | | | | | | $ (485,952) | |
| | | | | | | | | | | | | | | | | | | | |
*As of period end.
| | | | |
| | | |
| franklintempleton.com | | Annual Report | | 83 |
FRANKLIN INVESTORS SECURITIES TRUST
STATEMENT OF INVESTMENTS
Franklin Low Duration Total Return Fund (continued)
At October 31, 2018, the Fund had the following forward exchange contracts outstanding. See Note 1(e).
Forward Exchange Contracts
| | | | | | | | | | | | | | | | | | | | | | | | | | | | |
| Currency | | Counterpartya | | | Type | | | Quantity | | | Contract
Amount | | | Settlement
Date | | | Unrealized
Appreciation | | | Unrealized
Depreciation | |
| |
OTC Forward Exchange Contracts | | | | | | | | | | | | | | | | | | | | | | | | | |
Brazilian Real | | | JPHQ | | | | Buy | | | | 7,500,000 | | | $ | 1,870,371 | | | | 2/04/19 | | | $ | 126,689 | | | $ | — | |
Indian Rupee | | | DBAB | | | | Buy | | | | 135,900,000 | | | | 1,817,088 | | | | 2/04/19 | | | | — | | | | (6,263 | ) |
Indian Rupee | | | JPHQ | | | | Buy | | | | 145,000,000 | | | | 1,938,114 | | | | 2/04/19 | | | | — | | | | (6,034 | ) |
Indonesian Rupiah | | | JPHQ | | | | Buy | | | | 45,365,000,000 | | | | 2,901,874 | | | | 2/04/19 | | | | 27,697 | | | | — | |
Mexican Peso | | | JPHQ | | | | Buy | | | | 145,950,000 | | | | 7,354,348 | | | | 2/05/19 | | | | — | | | | (286,071 | ) |
Canadian Dollar | | | JPHQ | | | | Sell | | | | 3,300,000 | | | | 2,580,474 | | | | 3/14/19 | | | | 66,972 | | | | — | |
Euro | | | BZWS | | | | Sell | | | | 194,860 | | | | 231,079 | | | | 3/14/19 | | | | 7,685 | | | | — | |
Euro | | | CITI | | | | Sell | | | | 391,262 | | | | 464,279 | | | | 3/14/19 | | | | 15,724 | | | | — | |
Euro | | | DBAB | | | | Sell | | | | 6,267,136 | | | | 7,428,436 | | | | 3/14/19 | | | | 243,596 | | | | — | |
Euro | | | GSCO | | | | Sell | | | | 420,000 | | | | 497,750 | | | | 3/14/19 | | | | 16,249 | | | | — | |
Euro | | | JPHQ | | | | Sell | | | | 6,459,354 | | | | 7,663,507 | | | | 3/14/19 | | | | 258,302 | | | | — | |
Polish Zloty | | | JPHQ | | | | Buy | | | | 7,680,000 | | | | 2,095,041 | | | | 3/14/19 | | | | — | | | | (85,664 | ) |
Swedish Krona | | | JPHQ | | | | Buy | | | | 32,420,000 | | | | 3,684,777 | | | | 3/14/19 | | | | — | | | | (98,505 | ) |
Swedish Krona | | | JPHQ | | | | Sell | | | | 14,700,000 | | | | 1,694,489 | | | | 3/14/19 | | | | 68,388 | | | | — | |
Australian Dollar | | | JPHQ | | | | Sell | | | | 3,640,000 | | | | 2,580,014 | | | | 4/11/19 | | | | — | | | | (2,724 | ) |
Brazilian Real | | | JPHQ | | | | Buy | | | | 7,800,000 | | | | 1,848,341 | | | | 4/11/19 | | | | 216,987 | | | | — | |
Brazilian Real | | | JPHQ | | | | Sell | | | | 7,420,000 | | | | 1,941,392 | | | | 4/11/19 | | | | — | | | | (23,317 | ) |
Chinese Yuan Renminbi | | | JPHQ | | | | Sell | | | | 18,000,000 | | | | 2,569,777 | | | | 4/11/19 | | | | 7,616 | | | | — | |
Philippine Peso | | | JPHQ | | | | Sell | | | | 62,900,000 | | | | 1,142,909 | | | | 4/11/19 | | | | — | | | | (21,776 | ) |
South Korean Won | | | JPHQ | | | | Sell | | | | 2,920,000,000 | | | | 2,581,215 | | | | 4/11/19 | | | | 6,577 | | | | — | |
| | | | | | | | | | | | | | | | | | | | | | | | |
Total Forward Exchange Contracts | | | | | | | | | | | | | | | | | | | | | | $ | 1,062,482 | | | $ | (530,354 | ) |
| | | | | | | | | | | | | | | | | | | | | | | | |
Net unrealized appreciation (depreciation) | | | | | | | | | | | | | | | | | | | $ | 532,128 | | | | | |
| | | | | | | | | | | | | | | | | | | | | | | | | | | | |
aMay be comprised of multiple contracts with the same counterparty, currency and settlement date.
At October 31, 2018, the Fund had the following credit default swap contracts outstanding. See Note 1(e).
Credit Default Swap Contracts
| | | | | | | | | | | | | | | | | | | | | | | | | | | | | | | | | | | | |
| Description | | Periodic
Payment Rate
Received
(Paid) | | | Payment
Frequency | | | Counter-
party | | | Maturity
Date | | | Notional
Amounta | | | Value | | | Unamortized
Upfront
Payments
(Receipts) | | | Unrealized
Appreciation
(Depreciation) | | | Ratingb | |
| |
Centrally Cleared Swap Contracts | | | | | | | | | | | | | | | | | | | | | | | | | | | | | | | | | |
Contracts to Buy Protectionc | | | | | | | | | | | | | | | | | | | | | | | | | | | | | | | | | |
Single Name | | | | | | | | | | | | | | | | | | | | | | | | | | | | | | | | | | | | |
Navient Corp | | | (5.00 | )% | | | Quarterly | | | | | | | | 3/20/19 | | | $ | 2,350,000 | | | $ | (55,841 | ) | | $ | (37,173 | ) | | $ | (18,668 | ) | | | | |
Contracts to Sell Protectionc,d | | | | | | | | | | | | | | | | | | | | | | | | | | | | | | | | | |
Traded Index | | | | | | | | | | | | | | | | | | | | | | | | | | | | | | | | | | | | |
CDX.EM.30 | | | 1.00 | % | | | Quarterly | | | | | | | | 12/20/23 | | | | 12,300,000 | | | | (570,893 | ) | | | (541,780 | ) | | | (29,113 | ) | | | Investment | |
| | | | | | | | | | | | | | | | | | | | | | | | | | | | | | | | | | | Grade | |
CDX.NA.HY.30 | | | 5.00 | % | | | Quarterly | | | | | | | | 6/20/23 | | | | 46,140,000 | | | | 3,031,041 | | | | 2,496,641 | | | | 534,400 | | | | Non- | |
| | | | | | | | | | | | | | | | | | | | | | | | | | | | |
| | | | | | | | | | | | | | | | | | | | | | | | | | | | | | | | | | | Investment | |
| | | | | | | | | | | | | | | | | | | | | | | | | | | | | | | | | | | Grade | |
| | | | |
| | | |
| 84 | | Annual Report | | franklintempleton.com |
FRANKLIN INVESTORS SECURITIES TRUST
STATEMENT OF INVESTMENTS
Franklin Low Duration Total Return Fund (continued)
Credit Default Swap Contracts (continued)
| | | | | | | | | | | | | | | | | | | | | | | | | | | | | | | | | | | | |
| Description | | Periodic
Payment Rate
Received
(Paid) | | | Payment
Frequency | | | Counter-
party | | | Maturity
Date | | | Notional
Amounta | | | Value | | | Unamortized
Upfront
Payments
(Receipts) | | | Unrealized
Appreciation
(Depreciation) | | | Ratingb | |
| |
Centrally Cleared Swap Contracts (continued) | | | | | | | | | | | | | | | | | | | | | | | | | | | | | |
Contracts to Sell Protectionc,d (continued) | | | | | | | | | | | | | | | | | | | | | | | | | | | | | | | | | |
Traded Index (continued) | | | | | | | | | | | | | | | | | | | | | | | | | | | | | | | | | |
CDX.NA.HY.31 | | | 5.00% | | | | Quarterly | | | | | | | | 12/20/23 | | | $ | 7,200,000 | | | $ | 422,745 | | | $ | 388,766 | | | $ | 33,979 | | | | Non- | |
| | | | | | | | | | | | | | | | | | | | | | | | | | | | |
| | | | | | | | | | | | | | | | | | | | | | | | | | | | | | | | | | | Investment | |
| | | | | | | | | | | | | | | | | | | | | | | | | | | | | | | | | | | Grade | |
Total Centrally Cleared Swap Contracts | | | | | | | | | | | | | | | | | | | $ | 2,827,052 | | | $ | 2,306,454 | | | $ | 520,598 | | | | | |
| | | | | | | | | | | | | | | | | | | | | | | | | | | | |
OTC Swap Contracts | | | | | | | | | | | | | | | | | | | | | | | | | | | | | | | | | |
Contracts to Buy Protectionc | | | | | | | | | | | | | | | | | | | | | | | | | | | | | | | | | |
Single Name | | | | | | | | | | | | | | | | | | | | | | | | | | | | | | | | | |
The AES Corp. | | | (5.00)% | | | | Quarterly | | | | JPHQ | | | | 6/20/22 | | | $ | 7,600,000 | | | $ | (1,140,089 | ) | | $ | (748,298 | ) | | $ | (391,791 | ) | | | | |
Ally Financial Inc. | | | (5.00)% | | | | Quarterly | | | | CITI | | | | 12/20/22 | | | | 1,500,000 | | | | (228,594 | ) | | | (226,525 | ) | | | (2,069 | ) | | | | |
Ally Financial Inc. | | | (5.00)% | | | | Quarterly | | | | JPHQ | | | | 12/20/22 | | | | 800,000 | | | | (121,917 | ) | | | (122,169 | ) | | | 252 | | | | | |
Ally Financial Inc. | | | (5.00)% | | | | Quarterly | | | | JPHQ | | | | 12/20/22 | | | | 1,900,000 | | | | (289,553 | ) | | | (288,426 | ) | | | (1,127 | ) | | | | |
American Airlines | | | | | | | | | | | | | | | | | | | | | | | | | | | | | | | | | | | | |
Group Inc. | | | (5.00)% | | | | Quarterly | | | | CITI | | | | 12/20/19 | | | | 1,780,000 | | | | (101,574 | ) | | | (83,284 | ) | | | (18,290 | ) | | | | |
CSC Holdings LLC | | | (5.00)% | | | | Quarterly | | | | GSCO | | | | 3/20/19 | | | | 3,000,000 | | | | (72,425 | ) | | | (13,711 | ) | | | (58,714 | ) | | | | |
DISH DBS Corp. | | | (5.00)% | | | | Quarterly | | | | JPHQ | | | | 6/20/21 | | | | 4,400,000 | | | | (293,982 | ) | | | (191,797 | ) | | | (102,185 | ) | | | | |
Government of Italy | | | (1.00)% | | | | Quarterly | | | | BZWS | | | | 6/20/23 | | | | 4,100,000 | | | | 90,951 | | | | 41,409 | | | | 49,542 | | | | | |
Government of Turkey | | | (1.00)% | | | | Quarterly | | | | BZWS | | | | 12/20/19 | | | | 900,000 | | | | 21,296 | | | | 47,790 | | | | (26,494 | ) | | | | |
Government of Turkey | | | (1.00)% | | | | Quarterly | | | | BZWS | | | | 12/20/23 | | | | 1,845,000 | | | | 222,045 | | | | 234,686 | | | | (12,641 | ) | | | | |
Nabors Industries Inc. | | | (1.00)% | | | | Quarterly | | | | JPHQ | | | | 6/20/20 | | | | 1,950,000 | | | | (4,100 | ) | | | 28,907 | | | | (33,007 | ) | | | | |
Navient Corp. | | | (5.00)% | | | | Quarterly | | | | JPHQ | | | | 3/20/20 | | | | 1,150,000 | | | | (75,459 | ) | | | (58,027 | ) | | | (17,432 | ) | | | | |
PHH Corp. | | | (5.00)% | | | | Quarterly | | | | GSCO | | | | 9/20/19 | | | | 1,800,000 | | | | (85,967 | ) | | | 4,118 | | | | (90,085 | ) | | | | |
Sanmina Corp. | | | (5.00)% | | | | Quarterly | | | | GSCO | | | | 6/20/19 | | | | 6,500,000 | | | | (235,813 | ) | | | (181,682 | ) | | | (54,131 | ) | | | | |
Tenet Healthcare Corp. | | | (5.00)% | | | | Quarterly | | | | DBAB | | | | 3/20/19 | | | | 1,825,000 | | | | (43,285 | ) | | | (18,342 | ) | | | (24,943 | ) | | | | |
Contracts to Sell Protectionc,d | | | | | | | | | | | | | | | | | | | | | | | | | | | | | | | | | |
Single Name | | | | | | | | | | | | | | | | | | | | | | | | | | | | | | | | | |
American Tower Corp. | | | 1.00% | | | | Quarterly | | | | GSCO | | | | 3/20/21 | | | $ | 6,500,000 | | | $ | (3,813 | ) | | $ | (58,066 | ) | | $ | 54,253 | | | | BBB- | |
Dish DBS Corp. | | | 5.00% | | | | Quarterly | | | | JPHQ | | | | 6/20/23 | | | | 4,400,000 | | | | (21,260 | ) | | | (34,184 | ) | | | 12,924 | | | | B | |
General Electric Co. | | | 1.00% | | | | Quarterly | | | | BZWS | | | | 12/20/23 | | | | 2,840,000 | | | | (58,405 | ) | | | (11,709 | ) | | | (46,696 | ) | | | BBB+ | |
General Electric Co. | | | 1.00% | | | | Quarterly | | | | CITI | | | | 12/20/23 | | | | 5,770,000 | | | | (118,662 | ) | | | 28,029 | | | | (146,691 | ) | | | BBB+ | |
General Electric Co. | | | 1.00% | | | | Quarterly | | | | CITI | | | | 12/20/23 | | | | 2,930,000 | | | | (60,256 | ) | | | (14,113 | ) | | | (46,143 | ) | | | BBB+ | |
General Electric Co. | | | 1.00% | | | | Quarterly | | | | JPHQ | | | | 12/20/23 | | | | 1,425,000 | | | | (27,347 | ) | | | (29,010 | ) | | | 1,663 | | | | BBB+ | |
Government of Argentina | | | 5.00% | | | | Quarterly | | | | BZWS | | | | 6/20/23 | | | | 1,135,000 | | | | (37,175 | ) | | | 23,131 | | | | (60,306 | ) | | | B+ | |
Government of Argentina | | | 5.00% | | | | Quarterly | | | | CITI | | | | 6/20/23 | | | | 1,950,000 | | | | (63,869 | ) | | | (46,639 | ) | | | (17,230 | ) | | | B+ | |
Government of Argentina | | | 5.00% | | | | Quarterly | | | | CITI | | | | 12/20/23 | | | | 2,000,000 | | | | (76,268 | ) | | | (116,369 | ) | | | 40,101 | | | | B+ | |
Government of Colombia | | | 1.00% | | | | Quarterly | | | | JPHQ | | | | 12/20/23 | | | | 5,225,000 | | | | (62,860 | ) | | | (36,850 | ) | | | (26,010 | ) | | | BBB- | |
Government of Indonesia | | | 1.00% | | | | Quarterly | | | | CITI | | | | 12/20/23 | | | | 5,225,000 | | | | (129,686 | ) | | | (116,132 | ) | | | (13,554 | ) | | | BBB- | |
Government of Italy | | | 1.00% | | | | Quarterly | | | | BZWS | | | | 6/20/23 | | | | 4,100,000 | | | | (258,986 | ) | | | (181,586 | ) | | | (77,400 | ) | | | NR | |
Government of Italy | | | 1.00% | | | | Quarterly | | | | JPHQ | | | | 12/20/23 | | | | 2,850,000 | | | | (203,583 | ) | | | (203,145 | ) | | | (438 | ) | | | NR | |
Government of Mexico | | | 1.00% | | | | Quarterly | | | | CITI | | | | 12/20/23 | | | | 7,250,000 | | | | (139,686 | ) | | | (58,798 | ) | | | (80,888 | ) | | | BBB+ | |
Nabors Industries Inc. | | | 1.00% | | | | Quarterly | | | | JPHQ | | | | 6/20/22 | | | | 1,950,000 | | | | (118,589 | ) | | | (185,649 | ) | | | 67,060 | | | | BB | |
| | | | |
| | | |
| franklintempleton.com | | Annual Report | | 85 |
FRANKLIN INVESTORS SECURITIES TRUST
STATEMENT OF INVESTMENTS
Franklin Low Duration Total Return Fund (continued)
Credit Default Swap Contracts (continued)
| | | | | | | | | | | | | | | | | | | | | | | | | | | | | | | | | | | | |
| Description | |
| Periodic
Payment Rate
Received
(Paid) |
| |
| Payment
Frequency |
| |
| Counter-
party |
| |
| Maturity
Date |
| |
| Notional
Amount |
a | | | Value | | |
| Unamortized
Upfront
Payments
(Receipts) |
| |
| Unrealized
Appreciation
(Depreciation) |
| | | Ratingb | |
| |
OTC Swap Contracts (continued) | | | | | | | | | | | | | | | | | | | | | | | | | | | | | | | | | |
Contracts to Sell Protectionc,d (continued) | | | | | | | | | | | | | | | | | | | | | | | | | | | | | | | | | |
Traded Index | | | | | | | | | | | | | | | | | | | | | | | | | | | | | | | | | |
eBNP Paribas Bespoke | | | | | | | | | | | | | | | | | | | | | | | | | | | | | | | | | | | | |
Bordeaux Index, | | | | | | | | | | | | | | | | | | | | | | | | | | | | | | | | | | | | |
Mezzanine Tranche 5-7% | | | 2.00% | | | | Quarterly | | | | BNDP | | | | 12/20/20 | | | $ | 3,600,000 | | | $ | (36,038 | ) | | $ | — | | | $ | (36,038 | ) | | | Non- | |
| | | | | | | | | | | | | | | | | | | | | | | | | | | | | | | | | | | Investment | |
| | | | | | | | | | | | | | | | | | | | | | | | | | | | | | | | | | | Grade | |
eCitibank Bespoke | | | | | | | | | | | | | | | | | | | | | | | | | | | | | | | | | | | | |
Cambridge Index, Equity | | | | | | | | | | | | | | | | | | | | | | | | | | | | | | | | | | | | |
Tranche 0-3% | | | 0.00% | | | | Quarterly | | | | CITI | | | | 12/20/19 | | | | 2,700,000 | | | | (472,120 | ) | | | (251,283 | ) | | | (220,837 | ) | | | Non- | |
| | | | | | | | | | | | | | | | | | | | | | | | | | | | | | | | | | | Investment | |
| | | | | | | | | | | | | | | | | | | | | | | | | | | | | | | | | | | Grade | |
eCitibank Bespoke Hong | | | | | | | | | | | | | | | | | | | | | | | | | | | | | | | | | | | | |
Kong Index, Mezzanine | | | | | | | | | | | | | | | | | | | | | | | | | | | | | | | | | | | | |
Tranche 3-5% | | | 1.00% | | | | Quarterly | | | | CITI | | | | 12/20/18 | | | | 7,000,000 | | | | 9,195 | | | | (20,524 | ) | | | 29,719 | | | | Non- | |
| | | | | | | | | | | | | | | | | | | | | | | | | | | | | | | | | | | Investment | |
| | | | | | | | | | | | | | | | | | | | | | | | | | | | | | | | | | | Grade | |
eCitibank Bespoke Index, | | | | | | | | | | | | | | | | | | | | | | | | | | | | | | | | | | | | |
Mezzanine Tranche | | | | | | | | | | | | | | | | | | | | | | | | | | | | | | | | | | | | |
6-10% | | | 0.63% | | | | Quarterly | | | | CITI | | | | 12/20/18 | | | | 10,000,000 | | | | 5,993 | | | | — | | | | 5,993 | | | | Non- | |
| | | | | | | | | | | | | | | | | | | | | | | | | | | | | | | | | | | Investment | |
| | | | | | | | | | | | | | | | | | | | | | | | | | | | | | | | | | | Grade | |
eCitibank Bespoke Lisbon | | | | | | | | | | | | | | | | | | | | | | | | | | | | | | | | | | | | |
Index, Equity Tranche | | | | | | | | | | | | | | | | | | | | | | | | | | | | | | | | | | | | |
0-3% | | | 0.00% | | | | Quarterly | | | | CITI | | | | 6/20/19 | | | | 1,300,000 | | | | (82,979 | ) | | | (97,758 | ) | | | 14,779 | | | | Non- | |
| | | | | | | | | | | | | | | | | | | | | | | | | | | | | | | | | | | Investment | |
| | | | | | | | | | | | | | | | | | | | | | | | | | | | | | | | | | | Grade | |
eCitibank Bespoke Lisbon | | | | | | | | | | | | | | | | | | | | | | | | | | | | | | | | | | | | |
Index, Mezzanine Tranche | | | | | | | | | | | | | | | | | | | | | | | | | | | | | | | | | | | | |
3-7% | | | 0.79% | | | | Quarterly | | | | CITI | | | | 6/20/19 | | | | 4,000,000 | | | | (7,115 | ) | | | — | | | | (7,115 | ) | | | Non- | |
| | | | | | | | | | | | | | | | | | | | | | | | | | | | | | | | | | | Investment | |
| | | | | | | | | | | | | | | | | | | | | | | | | | | | | | | | | | | Grade | |
eCitibank Bespoke Verona | | | | | | | | | | | | | | | | | | | | | | | | | | | | | | | | | | | | |
Index, Equity Tranche | | | | | | | | | | | | | | | | | | | | | | | | | | | | | | | | | | | | |
0-3% | | | 0.00% | | | | Quarterly | | | | CITI | | | | 12/20/19 | | | | 2,100,000 | | | | (307,911 | ) | | | (239,907 | ) | | | (68,004 | ) | | | Non- | |
| | | | | | | | | | | | | | | | | | | | | | | | | | | | | | | | | | | Investment | |
| | | | | | | | | | | | | | | | | | | | | | | | | | | | | | | | | | | Grade | |
eCitibank Bespoke Verona | | | | | | | | | | | | | | | | | | | | | | | | | | | | | | | | | | | | |
Index, Mezzanine Tranche | | | | | | | | | | | | | | | | | | | | | | | | | | | | | | | | | | | | |
7-15% | | | 0.40% | | | | Quarterly | | | | CITI | | | | 12/20/19 | | | | 4,000,000 | | | | 11,780 | | | | — | | | | 11,780 | | | | Non- | |
| | | | | | | | | | | | | | | | | | | | | | | | | | | | |
| | | | | | | | | | | | | | | | | | | | | | | | | | | | | | | | | | | Investment | |
| | | | | | | | | | | | | | | | | | | | | | | | | | | | | | | | | | | Grade | |
Total OTC Swap Contracts | | | | | | | | | | | | | | | | | | | $ | (4,618,106 | ) | | $ | (3,225,913) | | | $ | (1,392,193 | ) | | | | |
| | | | | | | | | | | | | | | | | | | | | | | | | | | | |
Total Credit Default Swap Contracts | | | | | | | | | | | | | | | | | | | $ | (1,791,054 | ) | | $ | (919,459) | | | $ | (871,595 | ) | | | | |
| | | | | | | | | | | | | | | | | | | | | | | | | | | | |
| | | | |
| | | |
| 86 | | Annual Report | | franklintempleton.com |
FRANKLIN INVESTORS SECURITIES TRUST
STATEMENT OF INVESTMENTS
Franklin Low Duration Total Return Fund (continued)
Credit Default Swap Contracts (continued)
aIn U.S. dollars unless otherwise indicated. For contracts to sell protection, the notional amount is equal to the maximum potential amount of the future payments and no recourse provisions have been entered into in association with the contracts.
bBased on Standard and Poor’s (S&P) Rating for single name swaps and internal ratings for index swaps. Internal ratings based on mapping into equivalent ratings from external vendors.
cPerformance triggers for settlement of contract include default, bankruptcy or restructuring for single name swaps, and failure to pay or bankruptcy of the underlying securities for traded index swaps.
dThe fund enters contracts to sell protection to create a long credit position.
eRepresents a custom index comprised of a basket of underlying issuers.
At October 31, 2018, the Fund had the following cross-currency swap contracts outstanding. See Note 1(e).
Cross-Currency Swap Contracts
| | | | | | | | | | | | | | | | | | | | | | | | |
| Description | | Payment
Frequency | | | Counter-
party | | | Maturity
Date | | | Notional
Amount | | | | | | Value/
Unrealized
Appreciation (Depreciation) | |
| |
OTC Swap Contracts | | | | | | | | | | | | | | | | | | | | | | | | |
Receive Fixed 2.393% | | | Semi-Annual | | | | | | | | | | | | 7,916,500 | | | | USD | | | | | |
Pay Fixed 0.50% | | | Annual | | | | JPHQ | | | | 4/09/20 | | | | 7,100,000 | | | | EUR | | | | $(310,288 | ) |
Receive Floating 3-month USD LIBOR + 2.870% | | | Quarterly | | | | | | | | | | | | 1,743,000 | | | | USD | | | | | |
Pay Fixed 2.50% | | | Annual | | | | CITI | | | �� | 5/04/21 | | | | 1,500,000 | | | | EUR | | | | 52,348 | |
| | | | | | | | | | | | | | | | | | | | | | | | |
Total Cross Currency Swap Contracts | | | | | | | | | | | | | | | | | | | | | | | $(257,940 | ) |
| | | | | | | | | | | | | | | | | | | | | | | | |
At October 31, 2018, the Fund had the following interest rate swap contracts outstanding. See Note 1(e).
Interest Rate Swap Contracts
| | | | | | | | | | | | | | | | | | | | | | |
| Description | | Payment
Frequency | | | Maturity
Date | | | Notional
Amount | | | Value | | | Unamortized
Upfront
Payments
(Receipts) | | Unrealized
Appreciation
(Depreciation) | |
| |
Centrally Cleared Swap Contracts | | | | | | | | | | | | | | | | | | | | | | |
Receive Fixed 2.75% | | | Semi-Annual | | | | | | | | | | | | | | | | | | | |
Pay Floating 3-month USD LIBOR | | | Quarterly | | | | 3/20/21 | | | | $147,720,000 | | | | $(1,169,230 | ) | | $(518,420) | | | $(650,810 | ) |
Receive Fixed 2.75% | | | Semi-Annual | | | | | | | | | | | | | | | | | | | |
Pay Floating 3-month USD LIBOR | | | Quarterly | | | | 3/20/21 | | | | 40,670,000 | | | | (321,910 | ) | | (139,918) | | | (181,992 | ) |
| | | | | | | | | | | | | | | | |
| | | | | | |
Total Interest Rate Swap Contracts | | | | | | | | | | | | | | | $(1,491,140 | ) | | $(658,338) | | | $(832,802 | ) |
| | | | | | | | | | | | | | | | |
At October 31, 2018, the Fund had the following inflation index swap contracts outstanding. See Note 1(e).
Inflation Index Swap Contracts
| | | | | | | | | | | | | | | | |
| Description | | Payment
Frequency | | | Maturity
Date | | | Notional
Amount | | | Value/
Unrealized
Appreciation
(Depreciation) | |
Centrally Cleared Swap Contracts | | | | | | | | | | | | | | | | |
Receive variable change in USA-CPI-U | | | At maturity | | | | | | | | | | | | | |
Pay Fixed 1.96% | | | At maturity | | | | 8/31/24 | | | | $25,200,000 | | | | $527,845 | |
| | | | | | | | | | | | | | | | |
| | | | |
| | | |
| franklintempleton.com | | Annual Report | | 87 |
FRANKLIN INVESTORS SECURITIES TRUST
STATEMENT OF INVESTMENTS
Franklin Low Duration Total Return Fund (continued)
At October 31, 2018, the Fund had the following total return swap contracts outstanding. See Note 1(e).
Total Return Swap Contracts
| | | | | | | | | | | | | | | | | | | | | | | | |
| Underlying Instruments | | Financing Rate | | | Payment
Frequency | | | Counterparty | | | Maturity
Date | | | Notional
Value | | | Value/
Unrealized
Appreciation
(Depreciation) | |
| |
OTC Swap Contracts | | | | | | | | | | | | | | | | | | | | | | | | |
Longa | | | | | | | | | | | | | | | | | | | | | | | | |
iBoxx USD Liquid High Yield Index | | | 3-month USD LIBOR | | | | Quarterly | | | | GSCO | | | | 12/20/18 | | | | $ 8,500,000 | | | | $ (94,601 | ) |
iBoxx USD Liquid High Yield Index | | | 3-month USD LIBOR | | | | Quarterly | | | | BNDP | | | | 3/20/19 | | | | 2,500,000 | | | | (19,086 | ) |
iBoxx USD Liquid High Yield Index | | | 3-month USD LIBOR | | | | Quarterly | | | | FBCO | | | | 3/20/19 | | | | 4,900,000 | | | | (38,313 | ) |
iBoxx USD Liquid High Yield Index | | | 3-month USD LIBOR | | | | Quarterly | | | | BOFA | | | | 6/20/19 | | | | 20,000,000 | | | | (67,587 | ) |
iBoxx USD Liquid High Yield Index | | | 3-month USD LIBOR | | | | Quarterly | | | | CITI | | | | 6/20/19 | | | | 13,800,000 | | | | (76,140 | ) |
Markit iBoxx USD Liquid Leveraged Loan Index | | | 3-month USD LIBOR | | | | Quarterly | | | | GSCO | | | | 3/20/19 | | | | 8,600,000 | | | | (48,851 | ) |
Markit iBoxx USD Liquid Leveraged Loan Index | | | 3-month USD LIBOR | | | | Quarterly | | | | CITI | | | | 9/20/19 | | | | 18,500,000 | | | | (205,400 | ) |
Markit iBoxx USD Liquid Leveraged Loan Index | | | 3-month USD LIBOR | | | | Quarterly | | | | GSCO | | | | 9/20/19 | | | | 4,300,000 | | | | (57,429 | ) |
| | | | | | | | | | | | | | | | | | | | | | | | |
Total Return Swap Contracts | | | | | | | | | | | | | | | | | | | | | | | $(607,407 | ) |
| | | | | | | | | | | | | | | | | | | | | | | | |
aThe Fund receives the total return on the underlying instrument and pays a variable financing rate.
See Note 9 regarding other derivative information.
See Abbreviations on page 158.
| | | | | | |
| | | |
| 88 | | Annual Report | The accompanying notes are an integral part of these financial statements. | | franklintempleton.com |
FRANKLIN INVESTORS SECURITIES TRUST
Consolidated Financial Highlights
Franklin Total Return Fund
| | | | | | | | | | | | | | | | | | | | |
| | | Year Ended October 31, | |
| | | 2018 | | | 2017 | | | 2016 | | | 2015 | | | 2014 | |
Class A | | | | | | | | | | | | | | | | | | | | |
| | | | | |
Per share operating performance | | | | | | | | | | | | | | | | | | | | |
(for a share outstanding throughout the year) | | | | | | | | | | | | | | | | | | | | |
| | | | | |
Net asset value, beginning of year | | | $ 9.84 | | | | $ 9.93 | | | | $ 9.87 | | | | $ 10.18 | | | | $ 10.05 | |
| | | | | |
Income from investment operationsa: | | | | | | | | | | | | | | | | | | | | |
| | | | | |
Net investment income | | | 0.269 | | | | 0.251 | b | | | 0.231 | | | | 0.217 | | | | 0.257 | |
| | | | | |
Net realized and unrealized gains (losses) | | | (0.518 | ) | | | (0.110 | ) | | | 0.107 | | | | (0.220 | ) | | | 0.214 | |
| | | | | |
Total from investment operations | | | (0.249 | ) | | | 0.141 | | | | 0.338 | | | | (0.003 | ) | | | 0.471 | |
| | | | | |
Less distributions from: | | | | | | | | | | | | | | | | | | | | |
| | | | | |
Net investment income and net foreign currency gains | | | (0.275 | ) | | | (0.231 | ) | | | (0.278 | ) | | | (0.307 | ) | | | (0.341 | ) |
| | | | | |
Tax return of capital | | | (0.006 | ) | | | — | | | | — | | | | — | | | | — | |
| | | | | |
Total distributions | | | (0.281 | ) | | | (0.231 | ) | | | (0.278 | ) | | | (0.307 | ) | | | (0.341 | ) |
| | | | | |
Net asset value, end of year | | | $ 9.31 | | | | $ 9.84 | | | | $ 9.93 | | | | $ 9.87 | | | | $ 10.18 | |
| | | | | |
Total returnc | | | (2.57)% | | | | 1.47% | | | | 3.53% | | | | (0.05)% | | | | 4.80% | |
| | | | | |
Ratios to average net assets | | | | | | | | | | | | | | | | | | | | |
| | | | | |
Expenses before waiver and payments by affiliates | | | 0.91% | | | | 0.91% | | | | 0.90% | | | | 0.91% | | | | 0.93% | |
| | | | | |
Expenses net of waiver and payments by affiliatesd | | | 0.88% | | | | 0.87% | | | | 0.85% | | | | 0.87% | | | | 0.88% | |
| | | | | |
Net investment income | | | 2.91% | | | | 2.58% | | | | 2.32% | | | | 2.08% | | | | 2.46% | |
| | | | | |
Supplemental data | | | | | | | | | | | | | | | | | | | | |
| | | | | |
Net assets, end of year (000’s) | | | $2,763,774 | | | | $3,153,751 | | | | $3,623,035 | | | | $3,527,479 | | | | $3,213,446 | |
| | | | | |
Portfolio turnover rate | | | 151.77% | | | | 101.07% | | | | 287.38% | | | | 294.80% | | | | 273.96% | |
| | | | | |
Portfolio turnover rate excluding mortgage dollar rollse | | | 84.86% | | | | 78.46% | | | | 146.15% | | | | 95.06% | | | | 85.03% | |
aThe amount shown for a share outstanding throughout the period may not correlate with the Consolidated Statement of Operations for the period due to the timing of sales and repurchases of the Fund’s shares in relation to income earned and/or fluctuating fair value of the investments of the Fund.
bBased on average daily shares outstanding.
cTotal return does not reflect sales commissions or contingent deferred sales charges, if applicable.
dBenefit of expense reduction rounds to less than 0.01%.
eSee Note 1(h) regarding mortgage dollar rolls.
| | | | | | |
| | | | |
| franklintempleton.com | | The accompanying notes are an integral part of these financial statements. | | | Annual Report | | 89 |
FRANKLIN INVESTORS SECURITIES TRUST
CONSOLIDATED FINANCIAL HIGHLIGHTS
Franklin Total Return Fund (continued)
| | | | | | | | | | | | | | | | | | | | |
| | | Year Ended October 31, | |
| | | 2018 | | | 2017 | | | 2016 | | | 2015 | | | 2014 | |
Class C | | | | | | | | | | | | | | | | | | | | |
| | | | | |
Per share operating performance | | | | | | | | | | | | | | | | | | | | |
(for a share outstanding throughout the year) | | | | | | | | | | | | | | | | | | | | |
| | | | | |
Net asset value, beginning of year | | | $ 9.77 | | | | $ 9.87 | | | | $ 9.84 | | | | $ 10.16 | | | | $ 10.03 | |
| | | | | |
Income from investment operationsa: | | | | | | | | | | | | | | | | | | | | |
| | | | | |
Net investment income | | | 0.183 | | | | 0.212 | b | | | 0.189 | | | | 0.172 | | | | 0.201 | |
| | | | | |
Net realized and unrealized gains (losses) | | | (0.457 | ) | | | (0.109 | ) | | | 0.100 | | | | (0.214 | ) | | | 0.232 | |
| | | | | |
Total from investment operations | | | (0.274 | ) | | | 0.103 | | | | 0.289 | | | | (0.042 | ) | | | 0.433 | |
| | | | | |
Less distributions from: | | | | | | | | | | | | | | | | | | | | |
| | | | | |
Net investment income and net foreign currency gains | | | (0.241 | ) | | | (0.203 | ) | | | (0.259 | ) | | | (0.278 | ) | | | (0.303 | ) |
| | | | | |
Tax return of capital. | | | (0.005 | ) | | | — | | | | — | | | | — | | | | — | |
| | | | | |
Total distributions | | | (0.246 | ) | | | (0.203 | ) | | | (0.259 | ) | | | (0.278 | ) | | | (0.303 | ) |
| | | | | |
Net asset value, end of year | | | $ 9.25 | | | | $ 9.77 | | | | $ 9.87 | | | | $ 9.84 | | | | $ 10.16 | |
| | | | | |
Total returnc | | | (2.84)% | | | | 0.98% | | | | 3.13% | | | | (0.43)% | | | | 4.42% | |
| | | | | |
Ratios to average net assets | | | | | | | | | | | | | | | | | | | | |
| | | | | |
Expenses before waiver and payments by affiliates | | | 1.31% | | | | 1.31% | | | | 1.30% | | | | 1.31% | | | | 1.33% | |
| | | | | |
Expenses net of waiver and payments by affiliatesd | | | 1.28% | | | | 1.27% | | | | 1.25% | | | | 1.27% | | | | 1.28% | |
| | | | | |
Net investment income | | | 2.51% | | | | 2.18% | | | | 1.92% | | | | 1.68% | | | | 2.06% | |
| | | | | |
Supplemental data | | | | | | | | | | | | | | | | | | | | |
| | | | | |
Net assets, end of year (000’s) | | | $243,068 | | | | $354,269 | | | | $449,274 | | | | $444,253 | | | | $432,767 | |
| | | | | |
Portfolio turnover rate | | | 151.77% | | | | 101.07% | | | | 287.38% | | | | 294.80% | | | | 273.96% | |
| | | | | |
Portfolio turnover rate excluding mortgage dollar rollse | | | 84.86% | | | | 78.46% | | | | 146.15% | | | | 95.06% | | | | 85.03% | |
aThe amount shown for a share outstanding throughout the period may not correlate with the Consolidated Statement of Operations for the period due to the timing of sales and repurchases of the Fund’s shares in relation to income earned and/or fluctuating fair value of the investments of the Fund.
bBased on average daily shares outstanding.
cTotal return does not reflect sales commissions or contingent deferred sales charges, if applicable.
dBenefit of expense reduction rounds to less than 0.01%.
eSee Note 1(h) regarding mortgage dollar rolls.
| | | | | | |
| | | | |
| 90 | | Annual Report | | | The accompanying notes are an integral part of these financial statements. | | franklintempleton.com |
FRANKLIN INVESTORS SECURITIES TRUST
CONSOLIDATED FINANCIAL HIGHLIGHTS
Franklin Total Return Fund (continued)
| | | | | | | | | | | | | | | | | | | | |
| | | Year Ended October 31, | |
| | | 2018 | | | 2017 | | | 2016 | | | 2015 | | | 2014 | |
Class R | | | | | | | | | | | | | | | | | | | | |
| | | | | |
Per share operating performance | | | | | | | | | | | | | | | | | | | | |
(for a share outstanding throughout the year) | | | | | | | | | | | | | | | | | | | | |
| | | | | |
Net asset value, beginning of year | | | $ 9.80 | | | | $ 9.90 | | | | $ 9.85 | | | | $ 10.17 | | | | $ 10.04 | |
| | | | | |
Income from investment operationsa: | | | | | | | | | | | | | | | | | | | | |
| | | | | |
Net investment income | | | 0.182 | | | | 0.228 | b | | | 0.199 | | | | 0.198 | | | | 0.209 | |
| | | | | |
Net realized and unrealized gains (losses) | | | (0.453 | ) | | | (0.115 | ) | | | 0.117 | | | | (0.229 | ) | | | 0.238 | |
| | | | | |
Total from investment operations | | | (0.271 | ) | | | 0.113 | | | | 0.316 | | | | (0.031 | ) | | | 0.447 | |
| | | | | |
Less distributions from: | | | | | | | | | | | | | | | | | | | | |
| | | | | |
Net investment income and net foreign currency gains | | | (0.253 | ) | | | (0.213 | ) | | | (0.266 | ) | | | (0.289 | ) | | | (0.317 | ) |
| | | | | |
Tax return of capital | | | (0.006 | ) | | | — | | | | — | | | | — | | | | — | |
| | | | | |
Total distributions | | | (0.259 | ) | | | (0.213 | ) | | | (0.266 | ) | | | (0.289 | ) | | | (0.317 | ) |
| | | | | |
Net asset value, end of year | | | $ 9.27 | | | | $ 9.80 | | | | $ 9.90 | | | | $ 9.85 | | | | $ 10.17 | |
| | | | | |
Total return | | | (2.70)% | | | | 1.19% | | | | 3.31% | | | | (0.32)% | | | | 4.56% | |
| | | | | |
Ratios to average net assets | | | | | | | | | | | | | | | | | | | | |
| | | | | |
Expenses before waiver and payments by affiliates | | | 1.16% | | | | 1.16% | | | | 1.15% | | | | 1.16% | | | | 1.18% | |
| | | | | |
Expenses net of waiver and payments by affiliatesc | | | 1.13% | | | | 1.12% | | | | 1.10% | | | | 1.12% | | | | 1.13% | |
| | | | | |
Net investment income | | | 2.66% | | | | 2.33% | | | | 2.07% | | | | 1.83% | | | | 2.21% | |
| | | | | |
Supplemental data | | | | | | | | | | | | | | | | | | | | |
| | | | | |
Net assets, end of year (000’s) | | | $23,620 | | | | $36,337 | | | | $58,715 | | | | $70,506 | | | | $59,307 | |
| | | | | |
Portfolio turnover rate | | | 151.77% | | | | 101.07% | | | | 287.38% | | | | 294.80% | | | | 273.96% | |
| | | | | |
Portfolio turnover rate excluding mortgage dollar rollsd | | | 84.86% | | | | 78.46% | | | | 146.15% | | | | 95.06% | | | | 85.03% | |
aThe amount shown for a share outstanding throughout the period may not correlate with the Consolidated Statement of Operations for the period due to the timing of sales and repurchases of the Fund’s shares in relation to income earned and/or fluctuating fair value of the investments of the Fund.
bBased on average daily shares outstanding.
cBenefit of expense reduction rounds to less than 0.01%.
dSee Note 1(h) regarding mortgage dollar rolls.
| | | | | | |
| | | | |
| franklintempleton.com | | The accompanying notes are an integral part of these financial statements. | | | Annual Report | | 91 |
FRANKLIN INVESTORS SECURITIES TRUST
CONSOLIDATED FINANCIAL HIGHLIGHTS
Franklin Total Return Fund (continued)
| | | | | | | | | | | | | | | | | | | | |
| | | Year Ended October 31, | |
| | | 2018 | | | 2017 | | | 2016 | | | 2015 | | | 2014 | |
Class R6 | | | | | | | | | | | | | | | | | | | | |
| | | | | |
Per share operating performance | | | | | | | | | | | | | | | | | | | | |
(for a share outstanding throughout the year) | | | | | | | | | | | | | | | | | | | | |
| | | | | |
Net asset value, beginning of year | | | $ 9.90 | | | | $ 9.98 | | | | $ 9.91 | | | | $ 10.20 | | | | $ 10.07 | |
| | | | | |
Income from investment operationsa: | | | | | | | | | | | | | | | | | | | | |
| | | | | |
Net investment income | | | 0.308 | | | | 0.296 | b | | | 0.195 | | | | 0.255 | b | | | 0.317 | b |
| | | | | | |
Net realized and unrealized gains (losses) | | | (0.512 | ) | | | (0.117 | ) | | | 0.173 | | | | (0.209 | ) | | | 0.191 | |
| | | | | |
Total from investment operations | | | (0.204 | ) | | | 0.179 | | | | 0.368 | | | | 0.046 | | | | 0.508 | |
| | | | | |
Less distributions from: | | | | | | | | | | | | | | | | | | | | |
| | | | | |
Net investment income and net foreign currency gains | | | (0.309 | ) | | | (0.259 | ) | | | (0.298 | ) | | | (0.336 | ) | | | (0.378 | ) |
| | | | | |
Tax return of capital. | | | (0.007 | ) | | | — | | | | — | | | | — | | | | — | |
| | | | | |
Total distributions | | | (0.316 | ) | | | (0.259 | ) | | | (0.298 | ) | | | (0.336 | ) | | | (0.378 | ) |
| | | | | |
Net asset value, end of year | | | $ 9.38 | | | | $ 9.90 | | | | $ 9.98 | | | | $ 9.91 | | | | $ 10.20 | |
| | | | | |
Total return | | | (2.10)% | | | | 1.75% | | | | 3.94% | | | | 0.44% | | | | 5.18% | |
| | | | | |
Ratios to average net assets | | | | | | | | | | | | | | | | | | | | |
| | | | | |
Expenses before waiver and payments by affiliates | | | 0.54% | | | | 0.50% | | | | 0.51% | | | | 0.50% | | | | 0.50% | |
| | | | | |
Expenses net of waiver and payments by affiliatesc | | | 0.49% | | | | 0.48% | | | | 0.46% | | | | 0.46% | | | | 0.48% | |
| | | | | |
Net investment income | | | 3.30% | | | | 2.97% | | | | 2.71% | | | | 2.49% | | | | 2.86% | |
| | | | | |
Supplemental data | | | | | | | | | | | | | | | | | | | | |
| | | | | |
Net assets, end of year (000’s) | | | $430,637 | | | | $398,732 | | | | $93,892 | | | | $68,848 | | | | $26,123 | |
| | | | | |
Portfolio turnover rate | | | 151.77% | | | | 101.07% | | | | 287.38% | | | | 294.80% | | | | 273.96% | |
| | | | | |
Portfolio turnover rate excluding mortgage dollar rollsd | | | 84.86% | | | | 78.46% | | | | 146.15% | | | | 95.06% | | | | 85.03% | |
aThe amount shown for a share outstanding throughout the period may not correlate with the Consolidated Statement of Operations for the period due to the timing of sales and repurchases of the Fund’s shares in relation to income earned and/or fluctuating fair value of the investments of the Fund.
bBased on average daily shares outstanding.
cBenefit of expense reduction rounds to less than 0.01%.
dSee Note 1(h) regarding mortgage dollar rolls.
| | | | | | |
| | | | |
| 92 | | Annual Report | | | The accompanying notes are an integral part of these financial statements. | | franklintempleton.com |
FRANKLIN INVESTORS SECURITIES TRUST
CONSOLIDATED FINANCIAL HIGHLIGHTS
Franklin Total Return Fund (continued)
| | | | | | | | | | | | | | | | | | | | |
| | | Year Ended October 31, | |
| | | 2018 | | | 2017 | | | 2016 | | | 2015 | | | 2014 | |
Advisor Class | | | | | | | | | | | | | | | | | | | | |
| | | | | |
Per share operating performance | | | | | | | | | | | | | | | | | | | | |
(for a share outstanding throughout the year) | | | | | | | | | | | | | | | | | | | | |
| | | | | |
Net asset value, beginning of year | | | $ 9.89 | | | | $ 9.98 | | | | $ 9.91 | | | | $ 10.20 | | | | $ 10.07 | |
| | | | | |
Income from investment operationsa: | | | | | | | | | | | | | | | | | | | | |
| | | | | |
Net investment income | | | 0.291 | | | | 0.275 | b | | | 0.218 | | | | 0.127 | | | | 0.288 | |
| | | | | |
Net realized and unrealized gains (losses) | | | (0.507 | ) | | | (0.116 | ) | | | 0.142 | | | | (0.092 | ) | | | 0.206 | |
| | | | | |
Total from investment operations | | | (0.216 | ) | | | 0.159 | | | | 0.360 | | | | 0.035 | | | | 0.494 | |
| | | | | |
Less distributions from: | | | | | | | | | | | | | | | | | | | | |
| | | | | |
Net investment income and net foreign currency gains | | | (0.297 | ) | | | (0.249 | ) | | | (0.290 | ) | | | (0.325 | ) | | | (0.364 | ) |
| | | | | |
Tax return of capital | | | (0.007 | ) | | | — | | | | — | | | | — | | | | — | |
| | | | | |
Total distributions | | | (0.304 | ) | | | (0.249 | ) | | | (0.290 | ) | | | (0.325 | ) | | | (0.364 | ) |
| | | | | |
Net asset value, end of year | | | $ 9.37 | | | | $ 9.89 | | | | $ 9.98 | | | | $ 9.91 | | | | $ 10.20 | |
| | | | | |
Total return | | | (2.22)% | | | | 1.65% | | | | 3.75% | | | | 0.33% | | | | 5.03% | |
| | | | | |
Ratios to average net assets | | | | | | | | | | | | | | | | | | | | |
| | | | | |
Expenses before waiver and payments by affiliates | | | 0.66% | | | | 0.66% | | | | 0.65% | | | | 0.66% | | | | 0.68% | |
| | | | | |
Expenses net of waiver and payments by affiliatesc | | | 0.63% | | | | 0.62% | | | | 0.60% | | | | 0.62% | | | | 0.63% | |
| | | | | |
Net investment income | | | 3.16% | | | | 2.83% | | | | 2.57% | | | | 2.33% | | | | 2.71% | |
| | | | | |
Supplemental data | | | | | | | | | | | | | | | | | | | | |
| | | | | |
Net assets, end of year (000’s) | | | $620,803 | | | | $595,239 | | | | $740,046 | | | | $526,749 | | | | $1,281,151 | |
| | | | | |
Portfolio turnover rate | | | 151.77% | | | | 101.07% | | | | 287.38% | | | | 294.80% | | | | 273.96% | |
| | | | | |
Portfolio turnover rate excluding mortgage dollar rollsd | | | 84.86% | | | | 78.46% | | | | 146.15% | | | | 95.06% | | | | 85.03% | |
aThe amount shown for a share outstanding throughout the period may not correlate with the Consolidated Statement of Operations for the period due to the timing of sales and repurchases of the Fund’s shares in relation to income earned and/or fluctuating fair value of the investments of the Fund.
bBased on average daily shares outstanding.
cBenefit of expense reduction rounds to less than 0.01%.
dSee Note 1(h) regarding mortgage dollar rolls.
| | | | | | |
| | | | |
| franklintempleton.com | | The accompanying notes are an integral part of these financial statements. | | | Annual Report | | 93 |
FRANKLIN INVESTORS SECURITIES TRUST
Consolidated Statement of Investments, October 31, 2018
Franklin Total Return Fund
| | | | | | | | | | | | | | | | | | |
| | | | | Country | | | Shares/
Warrants | | | | | | Value | |
| | | Common Stocks and Other Equity Interests 0.0%† | | | | | | | |
| | | Consumer Services 0.0%† | | | | | | | | | | | | |
| a,aa,b | | Turtle Bay Resort | | | United States | | | | 1,550,568 | | | | | | | $ | 34,113 | |
| | | | | | | | | | | | | | | | | | |
| | | Energy 0.0%† | | | | | | | | | | | | |
| a | | Halcon Resources Corp. | | | United States | | | | 229,059 | | | | | | | | 760,476 | |
| a | | Halcon Resources Corp., wts., 9/09/20 | | | United States | | | | 20,425 | | | | | | | | 903 | |
| a | | Riviera Resources Inc. | | | United States | | | | 13,179 | | | | | | | | 280,976 | |
| a | | Roan Resources Inc. | | | United States | | | | 13,179 | | | | | | | | 214,422 | |
| | | | | | | | | | | | | | | | | | |
| | | | | |
| | | | | | | | | | | | | | | | | 1,256,777 | |
| | | | | | | | | | | | | | | | | | |
| | | Materials 0.0%† | | | | | | | | | | | | |
| a | | Verso Corp., A. | | | United States | | | | 6,954 | | | | | | | | 195,477 | |
| a | | Verso Corp., wts., 7/25/23 | | | United States | | | | 732 | | | | | | | | 4,758 | |
| | | | | | | | | | | | | | | | | | |
| | | | | |
| | | | | | | | | | | | | | | | | 200,235 | |
| | | | | | | | | | | | | | | | | | |
| | | Retailing 0.0%† | | | | | | | | | | | | |
| a,b,c | | K2016470219 South Africa Ltd., A | | | South Africa | | | | 28,762,824 | | | | | | | | 19,497 | |
| a,b,c | | K2016470219 South Africa Ltd., B | | | South Africa | | | | 2,862,311 | | | | | | | | 1,940 | |
| | | | | | | | | | | | | | | | | | |
| | | | | |
| | | | | | | | | | | | | | | | | 21,437 | |
| | | | | | | | | | | | | | | | | | |
| | Total Common Stocks and Other Equity Interests
(Cost $7,129,066) | | | | | | | | | | | | | | | 1,512,562 | |
| | | | | | | | | | | | | | | | | | |
| | | | | |
| | Management Investment Companies 3.9% | | | | | | | | | | | | | | | | |
| | | Diversified Financials 3.9% | | | | | | | | | | | | |
| d | | Franklin Flexible Alpha Bond Fund, Class R6 | | | United States | | | | 10,172,940 | | | | | | | | 99,287,894 | |
| d | | Franklin Liberty Investment Grade Corporate ETF | | | United States | | | | 400,000 | | | | | | | | 9,218,000 | |
| d | | Franklin Liberty Senior Loan ETF | | | United States | | | | 299,900 | | | | | | | | 7,548,483 | |
| d | | Franklin Lower Tier Floating Rate Fund | | | United States | | | | 997,589 | | | | | | | | 9,546,927 | |
| d | | Franklin Middle Tier Floating Rate Fund | | | United States | | | | 1,889,310 | | | | | | | | 17,759,516 | |
| | Invesco Senior Loan ETF | | | United States | | | | 672,210 | | | | | | | | 15,467,552 | |
| | | | | | | | | | | | | | | | | | |
| | Total Management Investment Companies
(Cost $160,787,719) | | | | | | | | | | | | | | | 158,828,372 | |
| | | | | | | | | | | | | | | | | | |
| | | | | |
| | Preferred Stocks (Cost $2,325,000) 0.1% | | | | | | | | | | | | | | | | |
| | | Diversified Financials 0.1% | | | | | | | | | | | | |
| e | | Citigroup Capital XIII, 8.137%, pfd. | | | United States | | | | 93,000 | | | | | | | | 2,461,710 | |
| | | | | | | | | | | | | | | | | | |
| | | | | |
| | | | | | | |
| Principal
Amount |
* | | | | | | | | |
| | Corporate Bonds 33.5% | | | | | | | | | | | | | | | | |
| | | Automobiles & Components 0.1% | | | | | | | | | | | | |
| | Aptiv Corp., senior bond, 4.15%, 3/15/24 | | | United States | | | | 5,100,000 | | | | | | | | 5,080,758 | |
| | | | | | | | | | | | | | | | | | |
| | | Banks 6.5% | | | | | | | | | | | | |
| f | | Banca Monte dei Paschi di Siena SpA, secured note, Reg S, 2.125%, 11/26/63. | | | Italy | | | | 20,000,000 | | | | EUR | | | | 23,143,982 | |
| | Bank of America Corp., | | | | | | | | | | | | | | | | |
| | senior bond, 3.875%, 8/01/25 | | | United States | | | | 6,000,000 | | | | | | | | 5,919,147 | |
| | senior note, 3.50%, 4/19/26 | | | United States | | | | 20,400,000 | | | | | | | | 19,426,600 | |
| f | | Barclays Bank PLC, senior sub. bond, Reg S, 6.00%, 1/14/21 | | | United Kingdom | | | | 8,000,000 | | | | EUR | | | | 10,005,775 | |
| | Barclays PLC, sub. note, 4.375%, 9/11/24 | | | United Kingdom | | | | 500,000 | | | | | | | | 477,815 | |
| | Citigroup Inc., | | | | | | | | | | | | | | | | |
| | senior bond, 8.125%, 7/15/39 | | | United States | | | | 4,400,000 | | | | | | | | 6,158,443 | |
| | senior note, 3.40%, 5/01/26 | | | United States | | | | 20,000,000 | | | | | | | | 18,804,584 | |
| | | | |
| | | |
| 94 | | Annual Report | | franklintempleton.com |
FRANKLIN INVESTORS SECURITIES TRUST
CONSOLIDATED STATEMENT OF INVESTMENTS
Franklin Total Return Fund (continued)
| | | | | | | | | | | | | | | | |
| | | Country | | | Principal Amount* | | | | | | Value | |
Corporate Bonds (continued) | | | | | | | | | | | | | | | | |
Banks (continued) | | | | | | | | | | | | | | | | |
HSBC Holdings PLC, | | | | | | | | | | | | | | | | |
senior note, 3.60%, 5/25/23 | | | United Kingdom | | | | 10,900,000 | | | | | | | $ | 10,746,910 | |
senior note, 4.30%, 3/08/26 | | | United Kingdom | | | | 16,600,000 | | | | | | | | 16,371,418 | |
g ICICI Bank Ltd./Dubai, senior note, 144A, 3.80%, 12/14/27 | | | India | | | | 11,200,000 | | | | | | | | 10,060,439 | |
Industrial & Commercial Bank of China Ltd., senior note, 2.957%, 11/08/22 | | | China | | | | 11,300,000 | | | | | | | | 10,886,194 | |
g Intesa Sanpaolo SpA, senior note, 144A, 6.50%, 2/24/21 | | | Italy | | | | 1,000,000 | | | | | | | | 1,023,070 | |
JPMorgan Chase & Co., | | | | | | | | | | | | | | | | |
h junior sub. bond, X, 6.10% to 10/01/24, FRN thereafter, Perpetual | | | United States | | | | 10,400,000 | | | | | | | | 10,585,120 | |
senior bond, 3.30%, 4/01/26 | | | United States | | | | 22,000,000 | | | | | | | | 20,799,178 | |
senior bond, 3.20%, 6/15/26 | | | United States | | | | 10,800,000 | | | | | | | | 10,118,237 | |
senior note, 2.40%, 6/07/21 | | | United States | | | | 10,000,000 | | | | | | | | 9,746,277 | |
senior note, 3.25%, 9/23/22 | | | United States | | | | 11,400,000 | | | | | | | | 11,249,597 | |
g Norddeutsche Landesbank Girozentrale, secured note, 144A, 2.00%, 2/05/19 | | | Germany | | | | 7,000,000 | | | | | | | | 6,982,878 | |
PHH Corp., senior note, 7.375%, 9/01/19 | | | United States | | | | 5,400,000 | | | | | | | | 5,555,250 | |
Royal Bank of Canada, secured note, 2.10%, 10/14/21 | | | Canada | | | | 11,500,000 | | | | | | | | 11,254,048 | |
SVB Financial Group, senior note, 3.50%, 1/29/25 | | | United States | | | | 6,000,000 | | | | | | | | 5,764,212 | |
f Turkiye Vakiflar Bankasi TAO, secured note, Reg S, 2.375%, 11/04/22 | | | Turkey | | | | 3,100,000 | | | | EUR | | | | 3,379,316 | |
Wells Fargo & Co., | | | | | | | | | | | | | | | | |
h junior sub. bond, S, 5.90% to 6/15/24, FRN thereafter, Perpetual | | | United States | | | | 5,500,000 | | | | | | | | 5,520,460 | |
sub. bond, 4.65%, 11/04/44 | | | United States | | | | 10,000,000 | | | | | | | | 9,426,687 | |
g Westpac Banking Corp., senior secured note, 144A, 2.25%, 11/09/21 | | | Australia | | | | 10,800,000 | | | | | | | | 10,588,212 | |
g Woori Bank, sub. note, 144A, 4.75%, 4/30/24 | | | South Korea | | | | 9,750,000 | | | | | | | | 9,744,784 | |
| | | | | | | | | | | | | | | | |
| | | | |
| | | | | | | | | | | | | | | 263,738,633 | |
| | | | | | | | | | | | | | | | |
Capital Goods 1.4% | | | | | | | | | | | | | | | | |
Aircastle Ltd., senior note, 4.125%, 5/01/24 | | | United States | | | | 4,500,000 | | | | | | | | 4,376,601 | |
g Amcor Finance USA Inc., senior note, 144A, 3.625%, 4/28/26 | | | Australia | | | | 11,800,000 | | | | | | | | 11,045,260 | |
g Beacon Roofing Supply Inc., senior note, 144A, 4.875%, 11/01/25 | | | United States | | | | 6,600,000 | | | | | | | | 5,956,500 | |
CNH Industrial Capital LLC, senior note, 3.875%, 10/15/21 | | | United States | | | | 3,400,000 | | | | | | | | 3,394,403 | |
CNH Industrial NV, senior bond, 3.85%, 11/15/27 | | | United Kingdom | | | | 4,600,000 | | | | | | | | 4,285,935 | |
Lockheed Martin Corp., senior bond, 4.70%, 5/15/46 | | | United States | | | | 13,900,000 | | | | | | | | 14,145,597 | |
United Technologies Corp., senior bond, 7.50%, 9/15/29 | | | United States | | | | 8,000,000 | | | | | | | | 10,055,677 | |
g Vertiv Group Corp., senior note, 144A, 9.25%, 10/15/24 | | | United States | | | | 4,100,000 | | | | | | | | 4,100,000 | |
| | | | | | | | | | | | | | | | |
| | | | |
| | | | | | | | | | | | | | | 57,359,973 | |
| | | | | | | | | | | | | | | | |
Commercial & Professional Services 0.3% | | | | | | | | | | | | | | | | |
g IHS Markit Ltd., senior note, 144A, 4.00%, 3/01/26 | | | United States | | | | 4,100,000 | | | | | | | | 3,864,250 | |
Republic Services Inc., senior note, 2.90%, 7/01/26 | | | United States | | | | 4,500,000 | | | | | | | | 4,162,879 | |
g West Corp., senior note, 144A, 8.50%, 10/15/25 | | | United States | | | | 5,000,000 | | | | | | | | 4,537,500 | |
| | | | | | | | | | | | | | | | |
| | | | |
| | | | | | | | | | | | | | | 12,564,629 | |
| | | | | | | | | | | | | | | | |
Consumer Services 0.8% | | | | | | | | | | | | | | | | |
g Ascend Learning LLC, senior note, 144A, 6.875%, 8/01/25 | | | United States | | | | 5,000,000 | | | | | | | | 4,987,500 | |
Marriott International Inc., senior bond, 3.75%, 10/01/25 | | | United States | | | | 18,400,000 | | | | | | | | 17,802,738 | |
g Stars Group Holdings BV/Stars Group U.S. Co-Borrower LLC, senior note, 144A, 7.00%, 7/15/26 | | | Canada | | | | 2,500,000 | | | | | | | | 2,543,750 | |
| | | | |
| | | |
| franklintempleton.com | | Annual Report | | 95 |
FRANKLIN INVESTORS SECURITIES TRUST
CONSOLIDATED STATEMENT OF INVESTMENTS
Franklin Total Return Fund (continued)
| | | | | | | | | | | | | | | | |
| | | Country | | | Principal
Amount* | | | | | | Value | |
Corporate Bonds (continued) | | | | | | | | | | | | | | | | |
Consumer Services (continued) | | | | | | | | | | | | | | | | |
g Wynn Las Vegas LLC/Wynn Las Vegas Capital Corp., senior bond,
144A, 5.25%, 5/15/27 | | | United States | | | | 5,500,000 | | | | | | | $ | 4,984,375 | |
| | | | | | | | | | | | | | | | |
| | | | |
| | | | | | | | | | | | | | | 30,318,363 | |
| | | | | | | | | | | | | | | | |
Diversified Financials 2.6% | | | | | | | | | | | | | | | | |
g Bayer US Finance LLC, senior note, 144A, 3.00%, 10/08/21 | | | Germany | | | | 3,600,000 | | | | | | | | 3,524,830 | |
Capital One Bank USA NA, sub. bond, 3.375%, 2/15/23 | | | United States | | | | 6,000,000 | | | | | | | | 5,805,625 | |
Capital One Financial Corp., senior note, 3.20%, 2/05/25 | | | United States | | | | 9,700,000 | | | | | | | | 9,076,361 | |
g FirstCash Inc., senior note, 144A, 5.375%, 6/01/24 | | | United States | | | | 2,800,000 | | | | | | | | 2,772,000 | |
GE Capital International Funding Co., senior bond, 3.373%, 11/15/25 | | | United States | | | | 17,000,000 | | | | | | | | 15,464,696 | |
The Goldman Sachs Group Inc., | | | | | | | | | | | | | | | | |
senior note, 3.75%, 5/22/25 | | | United States | | | | 7,700,000 | | | | | | | | 7,466,639 | |
senior note, 3.75%, 2/25/26 | | | United States | | | | 21,300,000 | | | | | | | | 20,469,271 | |
Morgan Stanley, | | | | | | | | | | | | | | | | |
senior bond, 4.30%, 1/27/45 | | | United States | | | | 10,000,000 | | | | | | | | 9,227,676 | |
senior note, 3.875%, 1/27/26 | | | United States | | | | 20,500,000 | | | | | | | | 19,880,481 | |
Navient Corp., | | | | | | | | | | | | | | | | |
senior bond, 8.00%, 3/25/20 | | | United States | | | | 5,000,000 | | | | | | | | 5,231,250 | |
senior note, 7.25%, 9/25/23 | | | United States | | | | 5,500,000 | | | | | | | | 5,749,590 | |
Springleaf Finance Corp., senior note, 6.00%, 6/01/20 | | | United States | | | | 700,000 | | | | | | | | 717,500 | |
| | | | | | | | | | | | | | | | |
| | | | |
| | | | | | | | | | | | | | | 105,385,919 | |
| | | | | | | | | | | | | | | | |
Energy 3.2% | | | | | | | | | | | | | | | | |
g California Resources Corp., secured note, second lien, 144A, 8.00%, 12/15/22 | | | United States | | | | 4,000,000 | | | | | | | | 3,570,000 | |
Cheniere Corpus Christi Holdings LLC, | | | | | | | | | | | | | | | | |
senior secured note, first lien, 7.00%, 6/30/24 | | | United States | | | | 2,300,000 | | | | | | | | 2,492,625 | |
senior secured note, first lien, 5.875%, 3/31/25 | | | United States | | | | 1,600,000 | | | | | | | | 1,648,000 | |
Cheniere Energy Partners LP, senior secured note, first lien, 5.25%, 10/01/25 | | | United States | | | | 4,000,000 | | | | | | | | 3,935,000 | |
CNOOC Finance 2013 Ltd., senior note, 3.00%, 5/09/23 | | | China | | | | 14,000,000 | | | | | | | | 13,375,320 | |
CNOOC Finance 2015 USA LLC, senior note, 3.50%, 5/05/25 | | | China | | | | 11,000,000 | | | | | | | | 10,471,945 | |
Enable Midstream Partners LP, | | | | | | | | | | | | | | | | |
senior bond, 5.00%, 5/15/44 | | | United States | | | | 1,200,000 | | | | | | | | 1,045,602 | |
senior note, 3.90%, 5/15/24 | | | United States | | | | 3,600,000 | | | | | | | | 3,471,601 | |
Energy Transfer Operating LP, senior bond, 5.15%, 2/01/43 | | | United States | | | | 6,000,000 | | | | | | | | 5,306,237 | |
Ensco PLC, senior bond, 5.75%, 10/01/44 | | | United States | | | | 3,700,000 | | | | | | | | 2,603,875 | |
Exxon Mobil Corp., senior note, 2.222%, 3/01/21 | | | United States | | | | 2,000,000 | | | | | | | | 1,954,755 | |
g,i Gaz Capital SA, (OJSC Gazprom), loan participation, senior note, 144A, 3.85%, 2/06/20 | | | Russia | | | | 10,000,000 | | | | | | | | 9,957,650 | |
MPLX LP, senior bond, 4.00%, 2/15/25 | | | United States | | | | 4,600,000 | | | | | | | | 4,498,915 | |
Oceaneering International Inc., senior note, 4.65%, 11/15/24 | | | United States | | | | 7,900,000 | | | | | | | | 7,345,291 | |
Sabine Pass Liquefaction LLC, senior secured bond, first lien, 5.00%, 3/15/27 | | | United States | | | | 3,700,000 | | | | | | | | 3,719,967 | |
Sanchez Energy Corp., senior note, 6.125%, 1/15/23 | | | United States | | | | 3,000,000 | | | | | | | | 1,132,500 | |
g Sinopec Group Overseas Development 2015 Ltd., senior note, 144A, 3.25%, 4/28/25 | | | China | | | | 16,400,000 | | | | | | | | 15,370,654 | |
g Sinopec Group Overseas Development 2016 Ltd., senior note, 144A, 2.75%, 9/29/26 | | | China | | | | 11,000,000 | | | | | | | | 9,758,980 | |
Sunoco Logistics Partners Operations LP, senior note, 4.25%, 4/01/24 | | | United States | | | | 9,300,000 | | | | | | | | 9,182,285 | |
Valero Energy Corp., senior bond, 4.90%, 3/15/45 | | | United States | | | | 6,700,000 | | | | | | | | 6,412,944 | |
| | | | |
| | | |
| 96 | | Annual Report | | franklintempleton.com |
FRANKLIN INVESTORS SECURITIES TRUST
CONSOLIDATED STATEMENT OF INVESTMENTS
Franklin Total Return Fund (continued)
| | | | | | | | | | | | | | | | |
| | | Country | | | Principal
Amount* | | | | | | Value | |
| |
Corporate Bonds (continued) | | | | | | | | | | | | | | | | |
Energy (continued) | | | | | | | | | | | | | | | | |
Weatherford International Ltd., | | | | | | | | | | | | | | | | |
senior note, 7.75%, 6/15/21 | | | United States | | | | 1,600,000 | | | | | | | $ | 1,330,000 | |
senior note, 8.25%, 6/15/23 | | | United States | | | | 2,000,000 | | | | | | | | 1,540,000 | |
g Woodside Finance Ltd., | | | | | | | | | | | | | | | | |
senior bond, 144A, 3.70%, 3/15/28 | | | Australia | | | | 5,500,000 | | | | | | | | 5,111,425 | |
senior note, 144A, 3.70%, 9/15/26 | | | Australia | | | | 4,000,000 | | | | | | | | 3,768,645 | |
| | | | | | | | | | | | | | | | |
| | | | |
| | | | | | | | | | | | | | | 129,004,216 | |
| | | | | | | | | | | | | | | | |
Food & Staples Retailing 0.4% | | | | | | | | | | | | | | | | |
g Aramark Services Inc., senior bond, 144A, 5.00%, 2/01/28 | | | United States | | | | 2,700,000 | | | | | | | | 2,568,375 | |
The Kroger Co., senior note, 4.00%, 2/01/24 | | | United States | | | | 15,400,000 | | | | | | | | 15,325,904 | |
| | | | | | | | | | | | | | | | |
| | | | |
| | | | | | | | | | | | | | | 17,894,279 | |
| | | | | | | | | | | | | | | | |
Food, Beverage & Tobacco 1.4% | | | | | | | | | | | | | | | | |
Anheuser-Busch Inbev Finance Inc., senior bond, 3.65%, 2/01/26 | | | Belgium | | | | 17,000,000 | | | | | | | | 16,149,530 | |
Bunge Ltd. Finance Corp., senior note, 3.25%, 8/15/26 | | | United States | | | | 12,000,000 | | | | | | | | 10,772,653 | |
Kraft Heinz Foods Co., | | | | | | | | | | | | | | | | |
senior bond, 3.00%, 6/01/26 | | | United States | | | | 19,300,000 | | | | | | | | 17,256,003 | |
senior note, 3.50%, 7/15/22 | | | United States | | | | 3,100,000 | | | | | | | | 3,064,644 | |
Reynolds American Inc., senior bond, 5.70%, 8/15/35 | | | United Kingdom | | | | 9,300,000 | | | | | | | | 9,571,816 | |
| | | | | | | | | | | | | | | | |
| | | | |
| | | | | | | | | | | | | | | 56,814,646 | |
| | | | | | | | | | | | | | | | |
Health Care Equipment & Services 1.1% | | | | | | | | | | | | | | | | |
g Avantor Inc., senior secured note, first lien, 144A, 6.00%, 10/01/24 | | | United States | | | | 2,400,000 | | | | | | | | 2,400,000 | |
g Centene Corp., senior note, 144A, 5.375%, 6/01/26 | | | United States | | | | 4,700,000 | | | | | | | | 4,782,250 | |
CHS/Community Health Systems Inc., senior secured note, first lien, 6.25%, 3/31/23 | | | United States | | | | 5,000,000 | | | | | | | | 4,617,250 | |
CVS Health Corp., senior bond, 4.30%, 3/25/28 | | | United States | | | | 7,000,000 | | | | | | | | 6,841,097 | |
Edwards Lifesciences Corp., senior note, 4.30%, 6/15/28 | | | United States | | | | 1,700,000 | | | | | | | | 1,691,220 | |
g Halfmoon Parent Inc., senior secured note, 144A, 4.125%, 11/15/25 | | | United States | | | | 5,900,000 | | | | | | | | 5,841,236 | |
HCA Inc., senior secured bond, first lien, 5.50%, 6/15/47 | | | United States | | | | 9,000,000 | | | | | | | | 8,878,500 | |
Tenet Healthcare Corp., senior note, 5.50%, 3/01/19 | | | United States | | | | 9,660,000 | | | | | | | | 9,720,375 | |
| | | | | | | | | | | | | | | | |
| | | | |
| | | | | | | | | | | | | | | 44,771,928 | |
| | | | | | | | | | | | | | | | |
Insurance 1.1% | | | | | | | | | | | | | | | | |
Aflac Inc., senior note, 0.932%, 1/25/27 | | | United States | | | | 1,400,000,000 | | | | JPY | | | | 12,558,912 | |
g Liberty Mutual Group Inc., senior note, 144A, 4.95%, 5/01/22 | | | United States | | | | 12,000,000 | | | | | | | | 12,364,403 | |
g Teachers Insurance & Annuity Assn. of America, sub. bond, 144A, 4.90%, 9/15/44 | | | United States | | | | 20,400,000 | | | | | | | | 21,101,057 | |
| | | | | | | | | | | | | | | | |
| | | | |
| | | | | | | | | | | | | | | 46,024,372 | |
| | | | | | | | | | | | | | | | |
Materials 1.8% | | | | | | | | | | | | | | | | |
ArcelorMittal, senior note, 5.50%, 3/01/21 | | | France | | | | 1,300,000 | | | | | | | | 1,345,116 | |
g Ardagh Packaging Finance PLC/Ardagh MP Holdings USA Inc., senior note, 144A, 6.00%, 2/15/25 | | | Luxembourg | | | | 5,000,000 | | | | | | | | 4,693,750 | |
g BWAY Holding Co., senior note, 144A, 7.25%, 4/15/25 | | | United States | | | | 4,000,000 | | | | | | | | 3,800,000 | |
g Cemex SAB de CV, senior secured bond, first lien, 144A, 5.70%, 1/11/25 | | | Mexico | | | | 4,000,000 | | | | | | | | 3,897,460 | |
The Chemours Co., senior note, 5.375%, 5/15/27 | | | United States | | | | 5,000,000 | | | | | | | | 4,662,500 | |
g First Quantum Minerals Ltd., senior note, 144A, 7.25%, 4/01/23 | | | Zambia | | | | 4,100,000 | | | | | | | | 3,802,750 | |
g FMG Resources (August 2006) Pty. Ltd., | | | | | | | | | | | | | | | | |
senior note, 144A, 5.125%, 3/15/23 | | | Australia | | | | 900,000 | | | | | | | | 870,750 | |
senior note, 144A, 5.125%, 5/15/24 | | | Australia | | | | 1,900,000 | | | | | | | | 1,813,341 | |
Freeport-McMoRan Inc., senior bond, 3.875%, 3/15/23 | | | United States | | | | 4,000,000 | | | | | | | | 3,710,000 | |
| | | | |
| | | |
| franklintempleton.com | | Annual Report | | 97 |
FRANKLIN INVESTORS SECURITIES TRUST
CONSOLIDATED STATEMENT OF INVESTMENTS
Franklin Total Return Fund (continued)
| | | | | | | | | | | | | | | | |
| | | Country | | | Principal
Amount* | | | | | | Value | |
| |
Corporate Bonds (continued) | | | | | | | | | | | | | | | | |
Materials (continued) | | | | | | | | | | | | | | | | |
g Glencore Finance Canada Ltd., senior bond, 144A, 4.95%, 11/15/21 | | | Switzerland | | | | 4,700,000 | | | | | | | $ | 4,826,427 | |
LYB International Finance BV, senior note, 4.00%, 7/15/23 | | | United States | | | | 18,400,000 | | | | | | | | 18,356,760 | |
g New Gold Inc., senior note, 144A, 6.375%, 5/15/25 | | | Canada | | | | 1,800,000 | | | | | | | | 1,451,250 | |
g Northwest Acquisitions ULC/Dominion Finco Inc., | | | | | | | | | | | | | | | | |
secured note, second lien, 144A, 7.125%, 11/01/22 | | | Canada | | | | 1,300,000 | | | | | | | | 1,312,155 | |
g OI European Group BV, senior note, 144A, 4.00%, 3/15/23 | | | United States | | | | 5,000,000 | | | | | | | | 4,693,750 | |
g Plastipak Holdings Inc., senior note, 144A, 6.25%, 10/15/25 | | | United States | | | | 2,300,000 | | | | | | | | 2,116,000 | |
Reliance Steel & Aluminum Co., senior note, 4.50%, 4/15/23 | | | United States | | | | 5,600,000 | | | | | | | | 5,636,574 | |
g Reynolds Group Issuer Inc./Reynolds Group Issuer LLC/Reynolds | | | | | | | | | | | | | | | | |
Group Issuer Luxembourg SA, | | | | | | | | | | | | | | | | |
senior note, 144A, 7.00%, 7/15/24. | | | United States | | | | 800,000 | | | | | | | | 803,500 | |
senior secured note, first lien, 144A, 5.125%, 7/15/23 | | | United States | | | | 1,600,000 | | | | | | | | 1,568,000 | |
g SunCoke Energy Partners LP/SunCoke Energy Partners Finance | | | | | | | | | | | | | | | | |
Corp., senior note, 144A, 7.50%, 6/15/25 | | | United States | | | | 4,200,000 | | | | | | | | 4,284,000 | |
| | | | | | | | | | | | | | | | |
| | | | |
| | | | | | | | | | | | | | | 73,644,083 | |
| | | | | | | | | | | | | | | | |
Media & Entertainment 1.4% | | | | | | | | | | | | | | | | |
21st Century Fox America Inc., senior note, 3.70%, 10/15/25 | | | United States | | | | 2,300,000 | | | | | | | | 2,271,414 | |
g Altice US Finance I Corp., senior secured note, first lien, 144A, 5.50%, 5/15/26 | | | United States | | | | 5,000,000 | | | | | | | | 4,882,800 | |
g CCO Holdings LLC/CCO Holdings Capital Corp., | | | | | | | | | | | | | | | | |
senior bond, 144A, 5.375%, 5/01/25 | | | United States | | | | 3,200,000 | | | | | | | | 3,140,000 | |
senior bond, 144A, 5.00%, 2/01/28 | | | United States | | | | 1,500,000 | | | | | | | | 1,404,375 | |
Comcast Corp., senior bond, 3.15%, 2/15/28 | | | United States | | | | 8,100,000 | | | | | | | | 7,451,830 | |
CSC Holdings LLC, | | | | | | | | | | | | | | | | |
senior bond, 8.625%, 2/15/19 | | | United States | | | | 9,000,000 | | | | | | | | 9,112,500 | |
g senior bond, 144A, 5.375%, 2/01/28 | | | United States | | | | 3,000,000 | | | | | | | | 2,835,000 | |
g Tencent Holdings Ltd., senior note, 144A, 3.595%, 1/19/28 | | | China | | | | 13,200,000 | | | | | | | | 12,113,046 | |
Time Warner Inc., senior bond, 2.95%, 7/15/26 | | | United States | | | | 16,200,000 | | | | | | | | 14,361,113 | |
| | | | | | | | | | | | | | | | |
| | | | |
| | | | | | | | | | | | | | | 57,572,078 | |
| | | | | | | | | | | | | | | | |
Pharmaceuticals, Biotechnology & Life Sciences 1.4% | | | | | | | | | | | | | | | | |
Actavis Funding SCS, senior bond, 4.55%, 3/15/35 | | | United States | | | | 7,800,000 | | | | | | | | 7,380,316 | |
Amgen Inc., senior bond, 4.95%, 10/01/41 | | | United States | | | | 1,000,000 | | | | | | | | 992,115 | |
g Bausch Health Cos. Inc., senior bond, 144A, 6.125%, 4/15/25 | | | United States | | | | 4,800,000 | | | | | | | | 4,426,560 | |
g Bayer US Finance II LLC, senior bond, 144A, 4.375%, 12/15/28 | | | Germany | | | | 3,900,000 | | | | | | | | 3,784,406 | |
Biogen Inc., senior bond, 5.20%, 9/15/45 | | | United States | | | | 18,200,000 | | | | | | | | 18,296,571 | |
Celgene Corp., senior bond, 3.45%, 11/15/27 | | | United States | | | | 6,500,000 | | | | | | | | 5,935,383 | |
PerkinElmer Inc., senior note, 5.00%, 11/15/21 | | | United States | | | | 13,200,000 | | | | | | | | 13,591,384 | |
g SABIC Capital II BV, senior note, 144A, 4.50%, 10/10/28 | | | Saudi Arabia | | | | 4,200,000 | | | | | | | | 4,122,594 | |
| | | | | | | | | | | | | | | | |
| | | | |
| | | | | | | | | | | | | | | 58,529,329 | |
| | | | | | | | | | | | | | | | |
Real Estate 1.1% | | | | | | | | | | | | | | | | |
American Homes 4 Rent LP, senior bond, 4.25%, 2/15/28 | | | United States | | | | 5,900,000 | | | | | | | | 5,603,479 | |
American Tower Corp., | | | | | | | | | | | | | | | | |
senior bond, 3.50%, 1/31/23 | | | United States | | | | 6,200,000 | | | | | | | | 6,077,028 | |
senior bond, 4.40%, 2/15/26 | | | United States | | | | 9,400,000 | | | | | | | | 9,329,218 | |
senior bond, 3.375%, 10/15/26 | | | United States | | | | 6,500,000 | | | | | | | | 5,981,929 | |
National Retail Properties Inc., senior bond, 4.30%, 10/15/28 | | | United States | | | | 9,700,000 | | | | | | | | 9,565,976 | |
Prologis LP, senior bond, 3.75%, 11/01/25 | | | United States | | | | 9,400,000 | | | | | | | | 9,328,292 | |
| | | | | | | | | | | | | | | | |
| | | | |
| | | | | | | | | | | | | | | 45,885,922 | |
| | | | | | | | | | | | | | | | |
| | | | |
| | | |
| 98 | | Annual Report | | franklintempleton.com |
FRANKLIN INVESTORS SECURITIES TRUST
CONSOLIDATED STATEMENT OF INVESTMENTS
| | | | | | | | | | | | | | | | |
| Franklin Total Return Fund (continued) | | | | | | | | | | | | | | | | |
| | | Country | | | Principal
Amount* | | | | | | Value | |
| |
Corporate Bonds (continued) | | | | | | | | | | | | | | | | |
Retailing 1.5% | | | | | | | | | | | | | | | | |
Alibaba Group Holding Ltd., | | | | | | | | | | | | | | | | |
senior bond, 4.50%, 11/28/34 | | | China | | | | 10,000,000 | | | | | | | $ | 9,560,000 | |
senior bond, 4.40%, 12/06/57 | | | China | | | | 2,800,000 | | | | | | | | 2,445,912 | |
Amazon.com Inc., senior note, 2.80%, 8/22/24 | | | United States | | | | 6,400,000 | | | | | | | | 6,112,549 | |
Dollar Tree Inc., senior note, 4.00%, 5/15/25 | | | United States | | | | 13,100,000 | | | | | | | | 12,605,800 | |
Home Depot Inc., senior note, 2.125%, 9/15/26 | | | United States | | | | 14,200,000 | | | | | | | | 12,653,660 | |
JD.com Inc., senior note, 3.125%, 4/29/21 | | | China | | | | 1,900,000 | | | | | | | | 1,834,688 | |
b,c,j K2016470219 South Africa Ltd., senior secured note, 144A, PIK, 3.00%, 12/31/22 | | | South Africa | | | | 2,212,754 | | | | | | | | 2,739 | |
c,j K2016470260 South Africa Ltd., senior secured note, 144A, PIK, 25.00%, 12/31/22 | | | South Africa | | | | 427,950 | | | | | | | | 31,602 | |
g Party City Holdings Inc., senior note, 144A, 6.625%, 8/01/26 | | | United States | | | | 2,100,000 | | | | | | | | 2,047,500 | |
g PetSmart Inc., senior note, 144A, 7.125%, 3/15/23 | | | United States | | | | 16,500,000 | | | | | | | | 11,632,500 | |
| | | | | | | | | | | | | | | | |
| | | | |
| | | | | | | | | | | | | | | 58,926,950 | |
| | | | | | | | | | | | | | | | |
Semiconductors & Semiconductor Equipment 0.7% | | | | | | | | | | | | | | | | |
Maxim Integrated Products Inc., senior note, 3.375%, 3/15/23 | | | United States | | | | 22,000,000 | | | | | | | | 21,516,898 | |
g Qorvo Inc., senior note, 144A, 5.50%, 7/15/26 | | | United States | | | | 5,000,000 | | | | | | | | 5,025,000 | |
| | | | | | | | | | | | | | | | |
| | | | |
| | | | | | | | | | | | | | | 26,541,898 | |
| | | | | | | | | | | | | | | | |
Software & Services 0.2% | | | | | | | | | | | | | | | | |
Fiserv Inc., senior bond, 3.85%, 6/01/25. | | | United States | | | | 9,300,000 | | | | | | | | 9,185,218 | |
| | | | | | | | | | | | | | | | |
Technology Hardware & Equipment 1.0% | | | | | | | | | | | | | | | | |
g Dell International LLC/EMC Corp., senior secured note, first lien, 144A, 3.48%, 6/01/19 | | | United States | | | | 12,000,000 | | | | | | | | 12,016,658 | |
Juniper Networks Inc., | | | | | | | | | | | | | | | | |
senior bond, 4.50%, 3/15/24 | | | United States | | | | 4,500,000 | | | | | | | | 4,538,583 | |
senior bond, 4.35%, 6/15/25 | | | United States | | | | 9,300,000 | | | | | | | | 9,181,526 | |
g Sanmina Corp., senior note, first lien, 144A, 4.375%, 6/01/19 | | | United States | | | | 11,100,000 | | | | | | | | 11,113,875 | |
Tech Data Corp., senior bond, 4.95%, 2/15/27 | | | United States | | | | 1,800,000 | | | | | | | | 1,740,284 | |
g Tempo Acquisition LLC/Tempo Acquisition Finance Corp., senior note, 144A, 6.75%, 6/01/25 | | | United States | | | | 4,000,000 | | | | | | | | 3,818,800 | |
| | | | | | | | | | | | | | | | |
| | | | |
| | | | | | | | | | | | | | | 42,409,726 | |
| | | | | | | | | | | | | | | | |
Telecommunication Services 1.1% | | | | | | | | | | | | | | | | |
g Sprint Spectrum Co. LLC, senior secured bond, first lien, 144A, 5.152%, 9/20/29 | | | United States | | | | 15,600,000 | | | | | | | | 15,639,000 | |
Telefonica Emisiones S.A.U., | | | | | | | | | | | | | | | | |
senior note, 4.57%, 4/27/23 | | | Spain | | | | 3,000,000 | | | | | | | | 3,072,450 | |
senior note, 4.103%, 3/08/27 | | | Spain | | | | 7,600,000 | | | | | | | | 7,234,744 | |
Verizon Communications Inc., | | | | | | | | | | | | | | | | |
senior bond, 2.625%, 8/15/26 | | | United States | | | | 10,700,000 | | | | | | | | 9,615,752 | |
senior bond, 4.812%, 3/15/39 | | | United States | | | | 11,065,000 | | | | | | | | 10,737,478 | |
| | | | | | | | | | | | | | | | |
| | | | |
| | | | | | | | | | | | | | | 46,299,424 | |
| | | | | | | | | | | | | | | | |
Transportation 0.4% | | | | | | | | | | | | | | | | |
Burlington Northern and Santa Fe 99-2 Trust, secured bond, 7.57%, 1/02/21 | | | United States | | | | 36,134 | | | | | | | | 37,241 | |
g DAE Funding LLC, senior note, 144A, 5.00%, 8/01/24 | | | United Arab Emirates | | | | 3,900,000 | | | | | | | | 3,802,500 | |
g DP World Ltd., senior bond, 144A, 6.85%, 7/02/37 | | | United Arab Emirates | | | | 3,700,000 | | | | | | | | 4,135,083 | |
g Transurban Finance Co. Pty. Ltd., senior secured bond, 144A, 4.125%, 2/02/26 | | | Australia | | | | 8,200,000 | | | | | | | | 8,032,597 | |
| | | | |
| | | |
| franklintempleton.com | | Annual Report | | 99 |
FRANKLIN INVESTORS SECURITIES TRUST
CONSOLIDATED STATEMENT OF INVESTMENTS
Franklin Total Return Fund (continued)
| | | | | | | | | | | | | | | | |
| | | Country | | | Principal
Amount* | | | | | | Value | |
Corporate Bonds (continued) | | | | | | | | | | | | | | | | |
Transportation (continued) | | | | | | | | | | | | | | | | |
Union Pacific Railroad Co. 2005 Pass Through Trust, 2005-1, 5.082%, 1/02/29 | | | United States | | | | 136,812 | | | | | | | $ | 142,479 | |
| | | | | | | | | | | | | | | | |
| | | | |
| | | | | | | | | | | | | | | 16,149,900 | |
| | | | | | | | | | | | | | | | |
Utilities 4.0% | | | | | | | | | | | | | | | | |
Calpine Corp., senior note, 5.375%, 1/15/23 | | | United States | | | | 13,275,000 | | | | | | | | 12,627,844 | |
g Colbun SA, senior note, 144A, 3.95%, 10/11/27 | | | Chile | | | | 4,300,000 | | | | | | | | 3,964,449 | |
Commonwealth Edison Co., secured bond, 6.45%, 1/15/38 | | | United States | | | | 700,000 | | | | | | | | 866,958 | |
Dominion Energy Inc., senior bond, 3.90%, 10/01/25 | | | United States | | | | 12,200,000 | | | | | | | | 11,920,706 | |
Duke Energy Corp., senior bond, 3.15%, 8/15/27 | | | United States | | | | 18,400,000 | | | | | | | | 16,908,202 | |
Duke Energy Indiana Inc., senior secured bond, 3.75%, 7/15/20 | | | United States | | | | 2,015,000 | | | | | | | | 2,034,193 | |
g,h EDF SA, junior sub. note, 144A, 5.25% to 1/29/23, FRN thereafter, Perpetual | | | France | | | | 24,000,000 | | | | | | | | 23,289,960 | |
g EDP Finance BV, senior note, 144A, 3.625%, 7/15/24 | | | Portugal | | | | 10,800,000 | | | | | | | | 10,261,890 | |
g Enogex LLC, senior bond, 144A, 6.25%, 3/15/20 | | | United States | | | | 5,000,000 | | | | | | | | 5,146,446 | |
Georgia Power Co., senior bond, 4.30%, 3/15/42 | | | United States | | | | 9,000,000 | | | | | | | | 8,270,503 | |
g Israel Electric Corp. Ltd., secured bond, 144A, 4.25%, 8/14/28 | | | Israel | | | | 6,700,000 | | | | | | | | 6,355,821 | |
PacifiCorp., secured bond, 6.10%, 8/01/36 | | | United States | | | | 10,200,000 | | | | | | | | 12,237,197 | |
The Southern Co., senior bond, 3.25%, 7/01/26 | | | United States | | | | 14,350,000 | | | | | | | | 13,329,668 | |
g State Grid Overseas Investment 2016 Ltd., | | | | | | | | | | | | | | | | |
senior note, 144A, 3.50%, 5/04/27 | | | China | | | | 10,700,000 | | | | | | | | 10,055,004 | |
senior note, 144A, 4.25%, 5/02/28 | | | China | | | | 6,700,000 | | | | | | | | 6,637,489 | |
g Talen Energy Supply LLC, senior note, 144A, 9.50%, 7/15/22 | | | United States | | | | 5,100,000 | | | | | | | | 5,202,000 | |
g Three Gorges Finance I Cayman Islands Ltd., senior note, 144A, 3.70%, 6/10/25 | | | China | | | | 12,800,000 | | | | | | | | 12,373,312 | |
Virginia Electric & Power Co., senior bond, 6.35%, 11/30/37 | | | United States | | | | 520,000 | | | | | | | | 630,751 | |
| | | | | | | | | | | | | | | | |
| | | | |
| | | | | | | | | | | | | | | 162,112,393 | |
| | | | | | | | | | | | | | | | |
| | | | |
Total Corporate Bonds (Cost $1,421,632,350) | | | | | | | | | | | | | | | 1,366,214,637 | |
| | | | | | | | | | | | | | | | |
| k,l Senior Floating Rate Interests 4.2% | | | | | | | | | | | | | | | | |
Automobiles & Components 0.2% | | | | | | | | | | | | | | | | |
Allison Transmission Inc., New Term Loans, 4.04%, (1-month USD LIBOR + 1.75%), 9/23/22 | | | United States | | | | 6,053,983 | | | | | | | | 6,091,821 | |
TI Group Automotive Systems LLC, Initial US Term Loan, 4.802%, (1-month USD LIBOR + 2.50%), 6/30/22 | | | United States | | | | 1,199,210 | | | | | | | | 1,194,713 | |
| | | | | | | | | | | | | | | | |
| | | | |
| | | | | | | | | | | | | | | 7,286,534 | |
| | | | | | | | | | | | | | | | |
Capital Goods 0.0%† | | | | | | | | | | | | | | | | |
Altra Industrial Motion Corp., Term Loan, 4.302%, (1-month USD LIBOR + 2.00%), 10/01/25 | | | United States | | | | 630,998 | | | | | | | | 630,209 | |
Harsco Corp., Term Loan B-2, 4.563%, (1-month USD LIBOR + 2.25%), 12/10/24 | | | United States | | | | 271,181 | | | | | | | | 272,538 | |
| | | | | | | | | | | | | | | | |
| | | | |
| | | | | | | | | | | | | | | 902,747 | |
| | | | | | | | | | | | | | | | |
Commercial & Professional Services 0.3% | | | | | | | | | | | | | | | | |
Prime Security Services Borrower LLC, Term B-1 Loans, 5.052%, (1-month USD LIBOR + 2.75%), 5/02/22. | | | United States | | | | 6,467,254 | | | | | | | | 6,477,648 | |
m,n United Rentals North America Inc., Initial Term Loans, TBD, 10/30/25 | | | United States | | | | 6,623,178 | | | | | | | | 6,660,433 | |
| | | | | | | | | | | | | | | | |
| | | | |
| | | | | | | | | | | | | | | 13,138,081 | |
| | | | | | | | | | | | | | | | |
| | | | |
| | | |
| 100 | | Annual Report | | franklintempleton.com |
FRANKLIN INVESTORS SECURITIES TRUST
CONSOLIDATED STATEMENT OF INVESTMENTS
Franklin Total Return Fund (continued)
| | | | | | | | | | | | | | | | |
| | | Country | | | Principal
Amount* | | | | | | Value | |
| k,l Senior Floating Rate Interests (continued) | | | | | | | | | | | | | | | | |
Consumer Services 0.3% | | | | | | | | | | | | | | | | |
Aristocrat Technologies Inc., Term B-3 Loans, 4.219%, (3-month USD LIBOR + 1.75%), 10/19/24 | | | United States | | | | 730,341 | | | | | | | $ | 728,639 | |
Avis Budget Car Rental LLC, Tranche B Term Loans, 4.31%, (1-month USD LIBOR + 2.00%), 2/13/25 | | | United States | | | | 5,025,962 | | | | | | | | 5,019,529 | |
Eldorado Resorts Inc., Initial Term Loan, 4.563%, (1-month USD LIBOR + 2.25%), 4/17/24 | | | United States | | | | 3,318,231 | | | | | | | | 3,326,527 | |
Greektown Holdings LLC, Initial Term Loan, 5.052%, (1-month USD LIBOR + 2.75%), 4/25/24 | | | United States | | | | 376,480 | | | | | | | | 376,323 | |
Las Vegas Sands LLC, Term B Loans, 4.052%, (1-month USD LIBOR + 1.75%), 3/27/25 | | | United States | | | | 1,393,000 | | | | | | | | 1,389,913 | |
| | | | | | | | | | | | | | | | |
| | | | |
| | | | | | | | | | | | | | | 10,840,931 | |
| | | | | | | | | | | | | | | | |
Diversified Financials 0.2% | | | | | | | | | | | | | | | | |
FinCo I LLC (Fortress Investment Group), 2018 Replacement Term Loan, 4.302%, (1-month USD LIBOR + 2.00%), 12/27/22 | | | United States | | | | 4,825,782 | | | | | | | | 4,830,005 | |
Trans Union LLC, 2017 Replacement Term A-2 Loans, 4.052%, (1-month USD LIBOR + 1.75%), 8/09/22 | | | United States | | | | 2,639,982 | | | | | | | | 2,644,932 | |
| | | | | | | | | | | | | | | | |
| | | | |
| | | | | | | | | | | | | | | 7,474,937 | |
| | | | | | | | | | | | | | | | |
Energy 0.3% | | | | | | | | | | | | | | | | |
Bowie Resource Holdings LLC, | | | | | | | | | | | | | | | | |
First Lien Initial Term Loan, 8.052%, (1-month USD LIBOR + 5.75%), 8/14/20 | | | United States | | | | 2,430,168 | | | | | | | | 2,379,540 | |
Second Lien Initial Term Loan, 13.052%, (1-month USD LIBOR + 10.75%), 2/16/21 | | | United States | | | | 592,359 | | | | | | | | 568,664 | |
Fieldwood Energy LLC, Closing Date Loans, 7.552%, (1-month USD LIBOR + 5.25%), 4/11/22 | | | United States | | | | 6,287,342 | | | | | | | | 6,338,458 | |
Foresight Energy LLC, Term Loans, 8.277%, (3-month USD LIBOR + 5.75%), 3/28/22 | | | United States | | | | 1,529,357 | | | | | | | | 1,535,411 | |
| | | | | | | | | | | | | | | | |
| | | | |
| | | | | | | | | | | | | | | 10,822,073 | |
| | | | | | | | | | | | | | | | |
Food & Staples Retailing 0.2% | | | | | | | | | | | | | | | | |
Aramark Corp., | | | | | | | | | | | | | | | | |
U.S. Term B-2 Loan, 4.052%, (1-month USD LIBOR + 1.75%), 3/28/24 | | | United States | | | | 4,252,500 | | | | | | | | 4,256,051 | |
U.S. Term B-3 Loan, 4.052%, (1-month USD LIBOR + 1.75%), 3/11/25 | | | United States | | | | 1,834,185 | | | | | | | | 1,837,624 | |
Smart & Final Stores LLC, First Lien Term Loan, 5.802%, (1-month USD LIBOR + 3.50%), 11/15/22 | | | United States | | | | 1,556,745 | | | | | | | | 1,506,151 | |
| | | | | | | | | | | | | | | | |
| | | | |
| | | | | | | | | | | | | | | 7,599,826 | |
| | | | | | | | | | | | | | | | |
Food, Beverage & Tobacco 0.2% | | | | | | | | | | | | | | | | |
JBS USA LUX SA, New Initial Term Loans, 4.837% - 4.886%, (3-month USD LIBOR + 2.50%), 10/30/22 | | | United States | | | | 7,667,585 | | | | | | | | 7,676,571 | |
Post Holdings Inc., Series A Incremental Term Loans, 4.29%, (1-month USD LIBOR + 2.00%), 5/24/24 | | | United States | | | | 1,771,793 | | | | | | | | 1,771,100 | |
| | | | | | | | | | | | | | | | |
| | | | |
| | | | | | | | | | | | | | | 9,447,671 | |
| | | | | | | | | | | | | | | | |
| | | | |
| | | |
| franklintempleton.com | | Annual Report | | 101 |
FRANKLIN INVESTORS SECURITIES TRUST
CONSOLIDATED STATEMENT OF INVESTMENTS
Franklin Total Return Fund (continued)
| | | | | | | | | | | | | | | | |
| | | Country | | | Principal
Amount* | | | | | Value | |
k,l Senior Floating Rate Interests (continued) | | | | | | | | | | | | | | | | |
Health Care Equipment & Services 0.2% | | | | | | | | | | | | | | | | |
DaVita Healthcare Partners Inc., Tranche B Term Loan, 5.052%, (1-month USD LIBOR + 2.75%), 6/24/21 | | | United States | | | | 2,063,834 | | | | | | | $ | 2,070,760 | |
HCA Inc., Term Loan B11, 4.052%, (1-month USD LIBOR + 1.75%), 3/18/23 | | | United States | | | | 1,816,246 | | | | | | | | 1,825,489 | |
IQVIA Inc., Term B-3 Dollar Loans, 4.136%, (3-month USD LIBOR + 1.75%), 6/11/25 | | | United States | | | | 2,917,998 | | | | | | | | 2,913,621 | |
Quintiles IMS Inc., Term B-2 Dollar Loans, 4.386%, (3-month USD LIBOR + 2.00%), 1/20/25 | | | United States | | | | 1,018,668 | | | | | | | | 1,021,692 | |
U.S. Renal Care Inc., Initial Term Loan, 6.636%, (3-month USD LIBOR + 4.25%), 12/31/22 | | | United States | | | | 2,154,637 | | | | | | | | 2,096,283 | |
| | | | | | | | | | | | | | | | |
| | | | |
| | | | | | | | | | | | | | | 9,927,845 | |
| | | | | | | | | | | | | | | | |
Household & Personal Products 0.1% | | | | | | | | | | | | | | | | |
Spectrum Brands, Inc., | | | | | | | | | | | | | | | | |
USD Term Loans, 4.31%, (1-month USD LIBOR + 2.00%), 6/23/22 | | | United States | | | | 871,246 | | | | | | | | 873,243 | |
USD Term Loans, 4.33% - 4.40%, (2-month USD LIBOR + 2.00%), 6/23/22 | | | United States | | | | 1,158,041 | | | | | | | | 1,160,695 | |
USD Term Loans, 4.35%, (3-month USD LIBOR + 2.00%), 6/23/22 | | | United States | | | | 653,435 | | | | | | | | 654,933 | |
| | | | | | | | | | | | | | | | |
| | | | |
| | | | | | | | | | | | | | | 2,688,871 | |
| | | | | | | | | | | | | | | | |
Materials 0.4% | | | | | | | | | | | | | | | | |
Ashland LLC, Term B Loan, 4.03% - 4.052%, (1-month USD LIBOR + 1.75%), 5/17/24 | | | United States | | | | 6,113,568 | | | | | | | | 6,135,852 | |
Axalta Coating Systems U.S. Holdings Inc., Term B-3 Dollar Loan, 4.136%, (3-month USD LIBOR + 1.75%), 6/01/24 | | | United States | | | | 953,845 | | | | | | | | 952,786 | |
Chemours Co., Tranche B-2 US$ Term Loan, 4.05%, (1-month USD LIBOR + 1.75%), 4/03/25 | | | United States | | | | 1,541,151 | | | | | | | | 1,534,408 | |
Crown Americas LLC, Dollar Term B Loan, 4.283%, (1-month USD LIBOR + 2.00%), 4/03/25 | | | United States | | | | 1,899,170 | | | | | | | | 1,905,699 | |
Oxbow Carbon LLC, | | | | | | | | | | | | | | | | |
Second Lien Term Loan, 9.802%, (1-month USD LIBOR + 7.50%), 1/04/24 | | | United States | | | | 36,943 | | | | | | | | 37,774 | |
Tranche A Term Loan, 4.552%, (1-month USD LIBOR + 2.25%), 1/04/22 | | | United States | | | | 2,035,000 | | | | | | | | 2,040,088 | |
Tranche B Term Loan, 5.802%, (1-month USD LIBOR + 3.50%), 1/04/23 | | | United States | | | | 3,455,375 | | | | | | | | 3,468,333 | |
| | | | | | | | | | | | | | | | |
| | | | |
| | | | | | | | | | | | | | | 16,074,940 | |
| | | | | | | | | | | | | | | | |
Media & Entertainment 0.6% | | | | | | | | | | | | | | | | |
Altice U.S. Finance I Corp., March 2017 Refinancing Term Loan Commitments, 4.552%, (1-month USD LIBOR + 2.25%), 7/28/25 | | | United States | | | | 231,974 | | | | | | | | 231,781 | |
AMC Entertainment Holdings Inc., 2016 Incremental Term Loans, 4.53%, (1-month USD LIBOR + 2.25%), 12/15/23 | | | United States | | | | 89,932 | | | | | | | | 90,101 | |
Initial Term Loans, 4.53%, (1-month USD LIBOR + 2.25%), 12/15/22 | | | United States | | | | 1,534,834 | | | | | | | | 1,537,712 | |
CSC Holdings LLC, March 2017 Incremental Term Loans, 4.53%, (1-month USD LIBOR + 2.25%), 7/17/25 | | | United States | | | | 1,082,826 | | | | | | | | 1,078,753 | |
Go Daddy Operating Co. LLC, Tranche B-1 Term Loans, 4.552%, (1-month USD LIBOR + 2.25%), 2/15/24 | | | United States | | | | 6,467,219 | | | | | | | | 6,481,803 | |
| | | | |
| | | |
102 | | Annual Report | | franklintempleton.com |
FRANKLIN INVESTORS SECURITIES TRUST
CONSOLIDATED STATEMENT OF INVESTMENTS
Franklin Total Return Fund (continued)
| | | | | | | | | | | | | | | | |
| | | Country | | | Principal
Amount* | | | | | Value | |
k,l Senior Floating Rate Interests (continued) | | | | | | | | | | | | | | | | |
Media & Entertainment (continued) | | | | | | | | | | | | | | | | |
Lions Gate Capital Holdings LLC, Term A Loan, 4.052%, (1-month USD LIBOR + 1.75%), 3/22/23 | | | Canada | | | | 1,669,963 | | | | | | | $ | 1,672,050 | |
Live Nation Entertainment Inc., Term B-3 Loans, 4.063%, (1-month USD LIBOR + 1.75%), 10/31/23 | | | United States | | | | 6,465,543 | | | | | | | | 6,482,715 | |
Mediacom Illinois LLC, Tranche N Term Loan, 3.97%, (1-week USD LIBOR + 1.75%), 2/15/24 | | | United States | | | | 6,175,236 | | | | | | | | 6,177,162 | |
| | | | | | | | | | | | | | | | |
| | | | |
| | | | | | | | | | | | | | | 23,752,077 | |
| | | | | | | | | | | | | | | | |
Pharmaceuticals, Biotechnology & Life Sciences 0.4% | | | | | | | | | | | | | | | | |
Bausch Health Cos. Inc., Initial Term Loans, 5.274%, (1-month USD LIBOR + 3.00%), 6/02/25 | | | United States | | | | 344,827 | | | | | | | | 345,617 | |
Endo Luxembourg Finance Co. I S.A.R.L. and Endo LLC, Initial Term Loans, 6.563%, (1-month USD LIBOR + 4.25%), 4/29/24 | | | United States | | | | 3,000,969 | | | | | | | | 3,014,698 | |
Grifols Worldwide Operations USA Inc., Tranche B Term Loan, 4.467%, (1-week USD LIBOR + 2.25%), 1/31/25 | | | United States | | | | 2,410,139 | | | | | | | | 2,415,109 | |
Horizon Pharma Inc., Fourth Amendment Refinancing Term Loans, 5.313%, (1-month USD LIBOR + 3.00%), 3/29/24 | | | United States | | | | 6,221,469 | | | | | | | | 6,244,800 | |
Syneos Health Inc., Initial Term B Loans, 4.302%, (1-month USD LIBOR + 2.00%), 8/01/24 | | | United States | | | | 3,791,328 | | | | | | | | 3,787,119 | |
| | | | | | | | | | | | | | | | |
| | | | |
| | | | | | | | | | | | | | | 15,807,343 | |
| | | | | | | | | | | | | | | | |
Retailing 0.3% | | | | | | | | | | | | | | | | |
Ascena Retail Group Inc., Tranche B Term Loan, 6.813%, (1-month USD LIBOR + 4.50%), 8/21/22 | | | United States | | | | 2,841,665 | | | | | | | | 2,764,229 | |
General Nutrition Centers Inc., | | | | | | | | | | | | | | | | |
Tranche B-2 Term Loans, 11.56%, (1-month USD LIBOR + 9.25%), 3/04/21 | | | United States | | | | 1,967,140 | | | | | | | | 1,925,584 | |
Tranche B-2 Term Loans, 13.50%, (Prime + 7.75%), 3/04/21 | | | United States | | | | 343,764 | | | | | | | | 336,502 | |
m Harbor Freight Tools USA Inc., Refinancing Loans, 4.802%, (1-month USD LIBOR + 2.50%), 8/19/23 | | | United States | | | | 3,966,667 | | | | | | | | 3,911,816 | |
Jo-Ann Stores Inc., Initial Loans, 7.477%, (3-month USD LIBOR + 5.00%), 10/23/23 | | | United States | | | | 1,063,165 | | | | | | | | 1,064,715 | |
| | | | | | | | | | | | | | | | |
| | | | |
| | | | | | | | | | | | | | | 10,002,846 | |
| | | | | | | | | | | | | | | | |
Semiconductors & Semiconductor Equipment 0.0%† | | | | | | | | | | | | | | | | |
MKS Instruments Inc., Tranche B-4 Term Loan, 4.052%, (1-month USD LIBOR + 1.75%), 4/29/23 | | | United States | | | | 102,440 | | | | | | | | 102,793 | |
ON Semiconductor Corp., 2018 New Replacement Term B-3 Loans, 4.052%, (1-month USD LIBOR + 1.75%), 3/31/23 | | | United States | | | | 1,245,405 | | | | | | | | 1,245,016 | |
| | | | | | | | | | | | | | | | |
| | | | |
| | | | | | | | | | | | | | | 1,347,809 | |
| | | | | | | | | | | | | | | | |
Software & Services 0.0%† | | | | | | | | | | | | | | | | |
Rackspace Hosting Inc., Term B Loans, 5.348%, (3-month USD LIBOR + 3.00%), 11/03/23 | | | United States | | | | 450,819 | | | | | | | | 438,516 | |
| | | | | | | | | | | | | | | | |
Technology Hardware & Equipment 0.0%† | | | | | | | | | | | | | | | | |
CommScope Inc., Tranche 5 Term Loans, 4.302%, (1-month USD LIBOR + 2.00%), 12/29/22 | | | United States | | | | 1,135,498 | | | | | | | | 1,139,756 | |
| | | | | | | | | | | | | | | | |
Telecommunication Services 0.0%† | | | | | | | | | | | | | | | | |
Global Tel*Link Corp., Term Loan, 6.386%, (3-month USD LIBOR + 4.00%), 5/23/20 | | | United States | | | | 258,582 | | | | | | | | 259,713 | |
| | | | | | | | | | | | | | | | |
| | | | |
| | | |
franklintempleton.com | | Annual Report | | 103 |
FRANKLIN INVESTORS SECURITIES TRUST
CONSOLIDATED STATEMENT OF INVESTMENTS
Franklin Total Return Fund (continued)
| | | | | | | | | | | | | | | | |
| | | Country | | | Principal
Amount* | | | | | Value | |
k,l Senior Floating Rate Interests (continued) | | | | | | | | | | | | | | | | |
Transportation 0.4% | | | | | | | | | | | | | | | | |
Air Canada, Term Loan, 4.295%, (1-month USD LIBOR + 2.00%), 10/06/23 | | | Canada | | | | 54,505 | | | | | | | $ | 54,687 | |
American Airlines Inc., | | | | | | | | | | | | | | | | |
2018 Replacement Term Loans, 4.045%, (1-month USD LIBOR + 1.75%), 6/27/25 | | | United States | | | | 6,450,000 | | | | | | | | 6,326,541 | |
2021 Replacement Term Loans, 4.277%, (3-month USD LIBOR + 2.00%), 10/10/21 | | | United States | | | | 1,311,435 | | | | | | | | 1,311,230 | |
Hertz Corp., Tranche B-1 Term Loan, 5.06%, (1-month USD LIBOR + 2.75%), 6/30/23 | | | United States | | | | 3,889,447 | | | | | | | | 3,875,165 | |
Navios Maritime Midstream Partners LP, Initial Term Loan, 6.84%, (3-month USD LIBOR + 4.50%), 6/18/20 | | | Marshall Islands | | | | 1,683,626 | | | | | | | | 1,624,699 | |
Navios Maritime Partners LP, Initial Term Loan, 7.34%, (3-month USD LIBOR + 5.00%), 9/14/20 | | | United States | | | | 2,775,003 | | | | | | | | 2,779,629 | |
| | | | | | | | | | | | | | | | |
| | | | |
| | | | | | | | | | | | | | | 15,971,951 | |
| | | | | | | | | | | | | | | | |
Utilities 0.1% | | | | | | | | | | | | | | | | |
EFS Cogen Holdings I LLC (Linden), Term B Advance, 5.64%, (3-month USD LIBOR + 3.25%), 6/28/23 | | | United States | | | | 4,823,511 | | | | | | | | 4,823,082 | |
NRG Energy Inc., Term Loan B, 4.136%, (3-month USD LIBOR + 1.75%), 6/30/23 | | | United States | | | | 1,026,375 | | | | | | | | 1,023,424 | |
| | | | | | | | | | | | | | | | |
| | | | |
| | | | | | | | | | | | | | | 5,846,506 | |
| | | | | | | | | | | | | | | | |
Total Senior Floating Rate Interests
(Cost $170,674,394) | | | | | | | | | | | | | | | 170,770,973 | |
| | | | | | | | | | | | | | | | |
Foreign Government and Agency Securities 1.4% | | | | | | | | | | | | | | | | |
g The Export-Import Bank of China, senior note, 144A, 3.625%, 7/31/24 | | | China | | | | 11,300,000 | | | | | | | | 11,084,622 | |
g The Export-Import Bank of India, senior note, 144A, 3.875%, 2/01/28 | | | India | | | | 11,400,000 | | | | | | | | 10,478,059 | |
The Export-Import Bank of Korea, senior note, 2.25%, 1/21/20 | | | South Korea | | | | 18,800,000 | | | | | | | | 18,590,004 | |
Government of Mexico, senior note, M 10, 8.50%, 12/13/18 | | | Mexico | | | | 2,000,000 | o | | | MXN | | | | 9,848,431 | |
g Government of Ukraine, | | | | | | | | | | | | | | | | |
144A, 7.75%, 9/01/20 | | | Ukraine | | | | 292,000 | | | | | | | | 291,175 | |
144A, 7.75%, 9/01/21 | | | Ukraine | | | | 229,000 | | | | | | | | 225,617 | |
144A, 7.75%, 9/01/22 | | | Ukraine | | | | 229,000 | | | | | | | | 222,531 | |
144A, 7.75%, 9/01/23 | | | Ukraine | | | | 229,000 | | | | | | | | 218,552 | |
144A, 7.75%, 9/01/24 | | | Ukraine | | | | 229,000 | | | | | | | | 215,530 | |
144A, 7.75%, 9/01/25 | | | Ukraine | | | | 229,000 | | | | | | | | 211,395 | |
144A, 7.75%, 9/01/26 | | | Ukraine | | | | 229,000 | | | | | | | | 207,594 | |
144A, 7.75%, 9/01/27 | | | Ukraine | | | | 229,000 | | | | | | | | 205,470 | |
a,p 144A, VRI, GDP Linked Security, 5/31/40 | | | Ukraine | | | | 474,000 | | | | | | | | 244,470 | |
g Harvest Operations Corp., senior note, 144A, 4.20%, 6/01/23 | | | South Korea | | | | 3,800,000 | | | | | | | | 3,842,883 | |
| | | | | | | | | | | | | | | | |
Total Foreign Government and Agency Securities
(Cost $58,948,656) | | | | | | | | | | | | | | | 55,886,333 | |
| | | | | | | | | | | | | | | | |
U.S. Government and Agency Securities 9.8% | | | | | | | | | | | | | | | | |
U.S. Treasury Bond, 3.75%, 8/15/41 | | | United States | | | | 11,600,000 | | | | | | | | 12,315,484 | |
2.875%, 5/15/43 | | | United States | | | | 38,100,000 | | | | | | | | 34,848,850 | |
3.00%, 11/15/44 | | | United States | | | | 13,000,000 | | | | | | | | 12,132,656 | |
2.875%, 8/15/45 | | | United States | | | | 5,000,000 | | | | | | | | 4,546,973 | |
2.50%, 2/15/46 | | | United States | | | | 50,000,000 | | | | | | | | 42,048,828 | |
| | | | |
| | | |
104 | | Annual Report | | franklintempleton.com |
FRANKLIN INVESTORS SECURITIES TRUST
CONSOLIDATED STATEMENT OF INVESTMENTS
Franklin Total Return Fund (continued)
| | | | | | | | | | | | | | |
| | | Country | | | Principal
Amount* | | | | Value | |
U.S. Government and Agency Securities (continued) | | | | | | | | | | | | | | |
U.S. Treasury Bond, (continued) 2.50%, 5/15/46 | | | United States | | | | 60,000,000 | | | | | $ | 50,409,375 | |
2.25%, 8/15/46 | | | United States | | | | 52,500,000 | | | | | | 41,718,018 | |
2.75%, 11/15/47 | | | United States | | | | 11,500,000 | | | | | | 10,140,664 | |
3.125%, 5/15/48 | | | United States | | | | 6,500,000 | | | | | | 6,180,967 | |
3.00%, 8/15/48 | | | United States | | | | 10,000,000 | | | | | | 9,275,000 | |
U.S. Treasury Note, 2.125%, 6/30/21 | | | United States | | | | 27,500,000 | | | | | | 26,951,074 | |
2.00%, 8/31/21 | | | United States | | | | 30,000,000 | | | | | | 29,252,930 | |
2.00%, 10/31/22 | | | United States | | | | 20,000,000 | | | | | | 19,277,734 | |
2.00%, 11/30/22 | | | United States | | | | 26,900,000 | | | | | | 25,907,012 | |
2.75%, 6/30/25 | | | United States | | | | 15,000,000 | | | | | | 14,719,043 | |
q Index Linked, 0.125%, 7/15/24 | | | United States | | | | 64,244,349 | | | | | | 61,231,164 | |
| | | | | | | | | | | | | | |
Total U.S. Government and Agency Securities
(Cost $430,297,506) | | | | | | | | | | | | | 400,955,772 | |
| | | | | | | | | | | | | | |
Asset-Backed Securities and Commercial Mortgage-Backed Securities 26.0% | | | | | | | | | | | | | | |
Banks 0.6% | | | | | | | | | | | | | | |
Citigroup Commercial Mortgage Trust, 2006-C5, AJ, 5.482%, 10/15/49 | | | United States | | | | 3,320,532 | | | | | | 3,213,677 | |
r Commercial Mortgage Trust, 2006-GG7, AJ, FRN, 5.667%, 7/10/38 | | | United States | | | | 7,281,000 | | | | | | 6,710,192 | |
2006-GG7, AM, FRN, 5.667%, 7/10/38 | | | United States | | | | 1,290,290 | | | | | | 1,291,580 | |
g,r CSMC, 2009-15R, 3A1, 144A, FRN, 3.966%, 3/26/36 | | | United States | | | | 1,402,389 | | | | | | 1,410,247 | |
s CWABS Inc. Asset-Backed Certificates, 2004-1, M1, FRN, 3.031%, (1-month USD LIBOR + 0.75%), 3/25/34 | | | United States | | | | 1,037,131 | | | | | | 1,044,621 | |
g,s DBCG Mortgage Trust, 2017-BBG, A, 144A, FRN, 2.98%, (1-month USD LIBOR + 0.70%), 6/15/34 | | | United States | | | | 9,840,000 | | | | | | 9,844,949 | |
s FNMA, 2005-122, FN, FRN, 2.631%, (1-month USD LIBOR + 0.35%), 1/25/36 | | | United States | | | | 410,522 | | | | | | 410,723 | |
r,t GE Capital Commercial Mortgage Corp. Trust, 2007-C1, AM, FRN, 5.606%, 12/10/49 | | | United States | | | | 1,687,435 | | | | | | 1,687,244 | |
s Merrill Lynch Mortgage Investors Trust, 2003-A, 1A, FRN, 3.021%, (1-month USD LIBOR + 0.74%), 3/25/28 | | | United States | | | | 981,562 | | | | | | 948,495 | |
s Morgan Stanley ABS Capital I Inc. Trust, 2005-WMC, M2, FRN, 3.016%, (1-month USD LIBOR + 0.735%), 1/25/35 | | | United States | | | | 544,185 | | | | | | 545,138 | |
b Weyerhaeuser Mortgage Co., 1984-A, 7.43%, 1/01/24 | | | United States | | | | 12,079 | | | | | | 12,079 | |
| | | | | | | | | | | | | | |
| | | | |
| | | | | | | | | | | | | 27,118,945 | |
| | | | | | | | | | | | | | |
Diversified Financials 25.4% | | | | | | | | | | | | | | |
s American Home Mortgage Investment Trust, 2004-3, 4A, FRN, 4.034%, (6-month USD LIBOR + 1.50%), 10/25/34 | | | United States | | | | 1,114,852 | | | | | | 1,106,358 | |
s Ameriquest Mortgage Securities Inc. Asset-Backed Pass-Through Certificates, 2004-R4, M1, FRN, 3.106%, (1-month USD LIBOR + 0.825%), 6/25/34 | | | United States | | | | 2,966,528 | | | | | | 2,986,289 | |
g,s AMMC CLO 21 Ltd., 2017-21A, C, 144A, FRN, 4.449%, (3-month USD LIBOR + 2.10%), 11/02/30 | | | United States | | | | 1,000,000 | | | | | | 988,520 | |
| | | | |
| | | |
franklintempleton.com | | Annual Report | | 105 |
FRANKLIN INVESTORS SECURITIES TRUST
CONSOLIDATED STATEMENT OF INVESTMENTS
Franklin Total Return Fund (continued)
| | | | | | | | | | | | | | |
| | | Country | | | Principal
Amount* | | | | Value | |
Asset-Backed Securities and Commercial Mortgage-Backed Securities (continued) | | | | | | | | | | | | | | |
Diversified Financials (continued) | | | | | | | | | | | | | | |
g,s AMMC CLO XI Ltd., | | | | | | | | | | | | | | |
2012-11A, BR2, 144A, FRN, 4.12%, (3-month USD LIBOR + 1.60%), 4/30/31 | | | United States | | | | 5,050,000 | | | | | $ | 4,970,109 | |
2012-11A, CR2, 144A, FRN, 4.42%, (3-month USD LIBOR + 1.90%), 4/30/31 | | | United States | | | | 3,750,000 | | | | | | 3,745,312 | |
2012-11A, DR2, 144A, FRN, 5.37%, (3-month USD LIBOR + 2.85%), 4/30/31 | | | United States | | | | 1,750,000 | | | | | | 1,719,568 | |
g,s Antares CLO Ltd., 2018-1A, B, 144A, FRN, 4.119%, (3-month USD LIBOR + 1.65%), 4/20/31 | | | United States | | | | 12,900,000 | | | | | | 12,907,095 | |
g,s Ares CLO Ltd., 2018-48A, D, 144A, FRN, 5.039%, (3-month USD LIBOR + 2.70%), 7/20/30 | | | United States | | | | 2,000,000 | | | | | | 1,978,000 | |
s Argent Securities Inc. Asset-Backed Pass-Through Certificates, 2005-W2, A2C, FRN, 2.641%, (1-month USD LIBOR + 0.36%), 10/25/35 | | | United States | | | | 2,298,393 | | | | | | 2,307,821 | |
g,s Atrium IX, 9A, AR, 144A, FRN, 3.551%, (3-month USD LIBOR + 1.24%), 5/28/30 | | | United States | | | | 4,500,000 | | | | | | 4,507,605 | |
g,s Atrium XIII, 2013A, B, 144A, FRN, 3.977%, (3-month USD LIBOR + 1.50%), 11/21/30 | | | United States | | | | 2,700,000 | | | | | | 2,695,410 | |
2013A, C, 144A, FRN, 4.277%, (3-month USD LIBOR + 1.80%), 11/21/30 | | | United States | | | | 3,753,500 | | | | | | 3,725,048 | |
2013A, D, 144A, FRN, 5.177%, (3-month USD LIBOR + 2.70%), 11/21/30 | | | United States | | | | 5,500,000 | | | | | | 5,438,565 | |
g,r Atrium XIV LLC, 14A, A2A, 144A, FRN, 3.76%, 8/23/30 | | | United States | | | | 7,400,000 | | | | | | 7,395,856 | |
g,s Bain Capital Credit CLO, | | | | | | | | | | | | | | |
2018-1A, A1, 144A, FRN, 3.437%, (3-month USD LIBOR + 0.96%), 4/23/31 | | | United States | | | | 12,000,000 | | | | | | 11,896,440 | |
2018-1A, A2, 144A, FRN, 3.627%, (3-month USD LIBOR + 1.15%), 4/23/31 | | | United States | | | | 5,100,000 | | | | | | 5,112,138 | |
g,r BBC Middle Market CLO LLC, 2018-1A, A2, 144A, FRN, 4.369%, 10/20/30 | | | United States | | | | 5,100,000 | | | | | | 5,098,674 | |
s Bear Stearns ALT-A Trust, 2004-13, A2, FRN, 3.161%, (1-month USD LIBOR + 0.88%), 11/25/34 | | | United States | | | | 211,240 | | | | | | 211,154 | |
g,s Bellemeade Re Ltd., 2018-1A, M1B, 144A, FRN, 3.881%, (1-month USD LIBOR + 1.60%), 4/25/28 | | | Bermuda | | | | 9,850,000 | | | | | | 9,906,569 | |
g,s Betony CLO 2 Ltd., 2018-1A, C, 144A, FRN, 5.42%, (3-month USD LIBOR + 2.90%), 4/30/31 | | | United States | | | | 5,000,000 | | | | | | 4,995,000 | |
g,r BlueMountain CLO Ltd., | | | | | | | | | | | | | | |
2014-2A, A2R2, 144A, FRN, 3.869%, 10/20/30 | | | United States | | | | 5,775,775 | | | | | | 5,779,385 | |
2014-2A, CR2, 144A, FRN, 4.669%, 10/20/30 | | | United States | | | | 3,600,000 | | | | | | 3,600,000 | |
2018-3A, B, 144A, FRN, 4.206%, 10/25/30 | | | United States | | | | 2,000,000 | | | | | | 1,999,640 | |
2018-3A, C, 144A, FRN, 4.636%, 10/25/30 | | | United States | | | | 1,071,430 | | | | | | 1,071,237 | |
g,r BlueMountain CLO XXII Ltd., 2018-1A, B, 144A, FRN, 4.22%, 7/30/30 | | | United States | | | | 272,725 | | | | | | 273,003 | |
g,s BlueMountain Fuji U.S. CLO II Ltd., 2017-2A, B, 144A, FRN, 4.498%, (3-month USD LIBOR + 2.15%), 10/20/30 | | | United States | | | | 4,010,000 | | | | | | 4,025,037 | |
g,s BlueMountain Fuji U.S. CLO III Ltd., | | | | | | | | | | | | | | |
2017-3A, C, 144A, FRN, 4.039%, (3-month USD LIBOR + 1.70%), 1/15/30 | | | United States | | | | 1,500,000 | | | | | | 1,482,825 | |
2017-3A, D, 144A, FRN, 4.739%, (3-month USD LIBOR + 2.40%), 1/15/30 | | | United States | | | | 1,600,000 | | | | | | 1,559,216 | |
| | | | |
| | | |
106 | | Annual Report | | franklintempleton.com |
FRANKLIN INVESTORS SECURITIES TRUST
CONSOLIDATED STATEMENT OF INVESTMENTS
Franklin Total Return Fund (continued)
| | | | | | | | | | | | | | |
| | | Country | | | Principal
Amount* | | | | Value | |
Asset-Backed Securities and Commercial Mortgage-Backed Securities (continued) | | | | | | | | | | | | | | |
Diversified Financials (continued) | | | | | | | | | | | | | | |
g,r Buttermilk Park CLO Ltd., 2018-1A, C, 144A, FRN, 4.438%, 10/15/31 | | | United States | | | | 1,452,380 | | | | | $ | 1,451,320 | |
g,s Carlyle Global Market Strategies CLO Ltd., | | | | | | | | | | | | | | |
2012-4A, AR, 144A, FRN, 3.919%, (3-month USD LIBOR + 1.45%), 1/20/29 | | | United States | | | | 6,280,000 | | | | | | 6,292,874 | |
2014-1A, A1R2, 144A, FRN, 3.419%, (3-month USD LIBOR + 0.97%), 4/17/31 | | | United States | | | | 725,000 | | | | | | 719,809 | |
2014-1A, A2R2, 144A, FRN, 3.579%, (3-month USD LIBOR + 1.13%), 4/17/31 | | | United States | | | | 6,300,000 | | | | | | 6,300,000 | |
2014-4RA, C, 144A, FRN, 5.336%, (3-month USD LIBOR + 2.90%), 7/15/30 | | | United States | | | | 2,950,000 | | | | | | 2,928,229 | |
g,r Carlyle GMS Finance MM CLO LLC, 2015-1A, A2R, 144A, FRN, 4.636%, 10/15/31 | | | United States | | | | 10,000,000 | | | | | | 10,017,500 | |
g,s Carlyle U.S. CLO Ltd., 2017-1A, A1A, 144A, FRN, 3.769%, (3-month USD LIBOR + 1.30%), 4/20/31 | | | United States | | | | 18,160,000 | | | | | | 18,172,167 | |
2017-2A, A1B, 144A, FRN, 3.689%, (3-month USD LIBOR + 1.22%), 7/20/31 | | | United States | | | | 10,650,000 | | | | | | 10,673,323 | |
2017-2A, B, 144A, FRN, 4.869%, (3-month USD LIBOR + 2.40%), 7/20/31 | | | United States | | | | 8,829,000 | | | | | | 8,856,635 | |
2017-3A, B, 144A, FRN, 4.819%, (3-month USD LIBOR + 2.35%), 7/20/29 | | | United States | | | | 1,000,000 | | | | | | 1,002,530 | |
2017-4A, C, 144A, FRN, 5.236%, (3-month USD LIBOR + 2.80%), 1/15/30 | | | United States | | | | 545,000 | | | | | | 536,945 | |
2017-5A, A2, 144A, FRN, 3.869%, (3-month USD LIBOR + 1.40%), 1/20/30 | | | United States | | | | 2,000,000 | | | | | | 1,971,280 | |
2017-5A, B, 144A, FRN, 4.269%, (3-month USD LIBOR + 1.80%), 1/20/30 | | | United States | | | | 7,000,000 | | | | | | 6,881,770 | |
g,s Catamaran CLO Ltd., | | | | | | | | | | | | | | |
2014-2A, BR, 144A, FRN, 5.395%, (3-month USD LIBOR + 2.95%), 10/18/26 | | | United States | | | | 6,401,000 | | | | | | 6,422,443 | |
2015-1A, C2R, 144A, FRN, 4.419%, (3-month USD LIBOR + 1.95%), 4/22/27 | | | United States | | | | 7,600,000 | | | | | | 7,608,816 | |
g,s Cent CLO LP, | | | | | | | | | | | | | | |
2014-22A, A1R, 144A, FRN, 3.753%, (3-month USD LIBOR + 1.41%), 11/07/26 | | | United States | | | | 6,280,000 | | | | | | 6,285,903 | |
2014-22A, C, 144A, FRN, 6.093%, (3-month USD LIBOR + 3.75%), 11/07/26 | | | United States | | | | 2,500,000 | | | | | | 2,506,375 | |
g,r CIM Trust, 2018-INV1, A4, 144A, FRN, 4.00%, 8/25/48 | | | United States | | | | 13,341,722 | | | | | | 13,262,516 | |
g,r Citigroup Mortgage Loan Trust, 2013-A, A, 144A, FRN, 3.00%, 5/25/42 | | | United States | | | | 1,179,210 | | | | | | 1,161,693 | |
g,r Colombia Cent CLO 27 Ltd., 2018-27A, A2A, 144A, FRN, 4.899%, 10/25/28 | | | United States | | | | 769,230 | | | | | | 769,615 | |
g,r Consumer Loan Underlying Bond (CLUB) Certificate Issuer Trust I, 2018-14, PT, 144A, FRN, 9.57%, 9/16/41 | | | United States | | | | 7,593,789 | | | | | | 7,573,739 | |
g,s Cook Park CLO Ltd., 2018-1A, A2, 144A, FRN, 3.569%, (3-month USD LIBOR + 1.12%), 4/17/30 | | | United States | | | | 6,000,000 | | | | | | 5,978,880 | |
Credit Suisse First Boston Mortgage Securities Corp., 2004-6, 3A1, 5.00%, 9/25/19 | | | United States | | | | 156,541 | | | | | | 162,400 | |
g,s Dryden 33 Senior Loan Fund, 2014-33A, AR, 144A, FRN, 3.866%, (3-month USD LIBOR + 1.43%), 10/15/28 | | | United States | | | | 12,185,000 | | | | | | 12,203,156 | |
| | | | |
| | | |
franklintempleton.com | | Annual Report | | 107 |
FRANKLIN INVESTORS SECURITIES TRUST
CONSOLIDATED STATEMENT OF INVESTMENTS
Franklin Total Return Fund (continued)
| | | | | | | | | | | | | | |
| | | Country | | | Principal
Amount* | | | | Value | |
Asset-Backed Securities and Commercial Mortgage-Backed Securities (continued) | | | | | | | | | | | | | | |
Diversified Financials (continued) | | | | | | | | | | | | | | |
g,s Dryden 41 Senior Loan Fund, 2015-41A, AR, 144A, FRN, 3.406%, (3-month USD LIBOR + 0.97%), 4/15/31 | | | United States | | | | 18,000,000 | | | | | $ | 17,890,920 | |
g,s Dryden 42 Senior Loan Fund, 2016-42A, DR, 144A, FRN, 5.366%, (3-month USD LIBOR + 2.93%), 7/15/30 | | | United States | | | | 800,000 | | | | | | 793,008 | |
g,r Dryden 45 Senior Loan Fund, 2016-45A, CR, 144A, FRN, 4.636%, 10/15/30 | | | United States | | | | 1,250,000 | | | | | | 1,250,050 | |
g,s Dryden 49 Senior Loan Fund, | | | | | | | | | | | | | | |
2017-49A, A, 144A, FRN, 3.659%, (3-month USD LIBOR + 1.21%), 7/18/30 | | | United States | | | | 7,030,000 | | | | | | 7,037,944 | |
2017-49A, C, 144A, FRN, 4.799%, (3-month USD LIBOR + 2.35%), 7/18/30 | | | United States | | | | 5,320,000 | | | | | | 5,331,225 | |
g,s Dryden 50 Senior Loan Fund, | | | | | | | | | | | | | | |
2017-50A, A1, 144A, FRN, 3.656%, (3-month USD LIBOR + 1.22%), 7/15/30 | | | United States | | | | 5,660,000 | | | | | | 5,668,943 | |
2017-50A, C, 144A, FRN, 4.686%, (3-month USD LIBOR + 2.25%), 7/15/30 | | | United States | | | | 2,600,000 | | | | | | 2,604,914 | |
g,s Dryden 53 CLO Ltd., | | | | | | | | | | | | | | |
2017-53A, B, 144A, FRN, 3.836%, (3-month USD LIBOR + 1.40%), 1/15/31 | | | United States | | | | 2,200,000 | | | | | | 2,177,780 | |
2017-53A, C, 144A, FRN, 4.136%, (3-month USD LIBOR + 1.70%), 1/15/31 | | | United States | | | | 7,200,000 | | | | | | 7,107,120 | |
2017-53A, D, 144A, FRN, 4.836%, (3-month USD LIBOR + 2.40%), 1/15/31 | | | United States | | | | 5,400,000 | | | | | | 5,206,032 | |
g,s Dryden 55 CLO Ltd., | | | | | | | | | | | | | | |
2018-55A, A1, 144A, FRN, 3.456%, (3-month USD LIBOR + 1.02%), 4/15/31 | | | United States | | | | 17,000,000 | | | | | | 16,970,080 | |
2018-55A, D, 144A, FRN, 5.286%, (3-month USD LIBOR + 2.85%), 4/15/31 | | | United States | | | | 2,000,000 | | | | | | 1,999,220 | |
g,s Dryden 64 CLO Ltd., | | | | | | | | | | | | | | |
2018-64A, A, 144A, FRN, 3.415%, (3-month USD LIBOR + 0.97%), 4/18/31 | | | United States | | | | 1,200,000 | | | | | | 1,194,108 | |
2018-64A, D, 144A, FRN, 5.095%, (3-month USD LIBOR + 2.65%), 4/18/31 | | | United States | | | | 4,000,000 | | | | | | 3,924,840 | |
g,r Eleven Madison Trust Mortgage Trust, 2015-11MD, A, 144A, FRN, 3.555%, 9/10/35 | | | United States | | | | 3,255,000 | | | | | | 3,214,584 | |
g,s Ellington CLO III Ltd., 2018-3A, A1, 144A, FRN, 4.119%, (3-month USD LIBOR + 1.65%), 7/20/30 | | | United States | | | | 5,400,000 | | | | | | 5,396,922 | |
s FHLMC Structured Agency Credit Risk Debt Notes, | | | | | | | | | | | | | | |
2014-DN1, M2, FRN, 4.481%, (1-month USD LIBOR + 2.20%), 2/25/24 | | | United States | | | | 2,273,447 | | | | | | 2,333,084 | |
2014-DN3, M3, FRN, 6.281%, (1-month USD LIBOR + 4.00%), 8/25/24 | | | United States | | | | 15,097,300 | | | | | | 16,413,103 | |
2014-DN4, M3, FRN, 6.831%, (1-month USD LIBOR + 4.55%), 10/25/24 | | | United States | | | | 9,904,340 | | | | | | 10,952,667 | |
2015-DN1, M3, FRN, 6.431%, (1-month USD LIBOR + 4.15%), 1/25/25 | | | United States | | | | 12,918,402 | | | | | | 13,841,570 | |
2015-DNA2, M3, FRN, 6.181%, (1-month USD LIBOR + 3.90%), 12/25/27 | | | United States | | | | 25,057,000 | | | | | | 27,645,393 | |
2015-DNA3, M2, FRN, 5.131%, (1-month USD LIBOR + 2.85%), 4/25/28 | | | United States | | | | 14,271,926 | | | | | | 14,733,048 | |
| | | | |
| | | |
108 | | Annual Report | | franklintempleton.com |
FRANKLIN INVESTORS SECURITIES TRUST
CONSOLIDATED STATEMENT OF INVESTMENTS
Franklin Total Return Fund (continued)
| | | | | | | | | | | | | | |
| | | Country | | | Principal
Amount* | | | | Value | |
Asset-Backed Securities and Commercial Mortgage-Backed Securities (continued) | | | | | | | | | | | | | | |
Diversified Financials (continued) | | | | | | | | | | | | | | |
s FHLMC Structured Agency Credit Risk Debt Notes, (continued) | | | | | | | | | | | | | | |
2015-DNA3, M3, FRN, 6.981%, (1-month USD LIBOR + 4.70%), 4/25/28 | | | United States | | | | 3,330,000 | | | | | $ | 3,940,822 | |
2015-HQ1, M3, FRN, 6.087%, (1-month USD LIBOR + 3.80%), 3/25/25 | | | United States | | | | 28,711,666 | | | | | | 30,437,378 | |
2015-HQ2, M3, FRN, 5.537%, (1-month USD LIBOR + 3.25%), 5/25/25 | | | United States | | | | 780,000 | | | | | | 867,887 | |
2015-HQA1, M2, FRN, 4.931%, (1-month USD LIBOR + 2.65%), 3/25/28 | | | United States | | | | 12,332,662 | | | | | | 12,534,462 | |
2015-HQA2, M2, FRN, 5.081%, (1-month USD LIBOR + 2.80%), 5/25/28 | | | United States | | | | 1,833,021 | | | | | | 1,882,273 | |
2016-DNA1, M2, FRN, 5.187%, (1-month USD LIBOR + 2.90%), 7/25/28 | | | United States | | | | 5,391,987 | | | | | | 5,512,210 | |
2016-DNA1, M3, FRN, 7.837%, (1-month USD LIBOR + 5.55%), 7/25/28 | | | United States | | | | 29,600,000 | | | | | | 35,621,522 | |
2016-DNA2, M2, FRN, 4.481%, (1-month USD LIBOR + 2.20%), 10/25/28 | | | United States | | | | 17,690,599 | | | | | | 17,860,843 | |
2016-HQA1, M2, FRN, 5.031%, (1-month USD LIBOR + 2.75%), 9/25/28 | | | United States | | | | 9,963,752 | | | | | | 10,167,815 | |
2016-HQA2, M2, FRN, 4.531%, (1-month USD LIBOR + 2.25%), 11/25/28 | | | United States | | | | 16,716,683 | | | | | | 17,057,526 | |
2016-HQA2, M3, FRN, 7.431%, (1-month USD LIBOR + 5.15%), 11/25/28 | | | United States | | | | 11,120,000 | | | | | | 13,060,573 | |
2016-HQA3, M2, FRN, 3.631%, (1-month USD LIBOR + 1.35%), 3/25/29 | | | United States | | | | 2,250,000 | | | | | | 2,283,493 | |
g,s Flagship CLO VIII Ltd., | | | | | | | | | | | | | | |
2014-8A, ARR, 144A, FRN, 3.286%, (3-month USD LIBOR + 0.85%), 1/16/26 | | | United States | | | | 5,900,000 | | | | | | 5,892,212 | |
2014-8A, DR, 144A, FRN, 5.486%, (3-month USD LIBOR + 3.05%), 1/16/26 | | | United States | | | | 5,500,000 | | | | | | 5,494,995 | |
s FNMA Connecticut Avenue Securities, | | | | | | | | | | | | | | |
2014-C02, 1M2, FRN, 4.881%, (1-month USD LIBOR + 2.60%), 5/25/24 | | | United States | | | | 14,520,000 | | | | | | 15,444,577 | |
2014-C02, 2M2, FRN, 4.881%, (1-month USD LIBOR + 2.60%), 5/25/24 | | | United States | | | | 3,244,357 | | | | | | 3,434,996 | |
2014-C03, 1M2, FRN, 5.281%, (1-month USD LIBOR + 3.00%), 7/25/24 | | | United States | | | | 17,576,931 | | | | | | 18,736,942 | |
2014-C03, 2M2, FRN, 5.181%, (1-month USD LIBOR + 2.90%), 7/25/24 | | | United States | | | | 3,473,023 | | | | | | 3,714,009 | |
2014-C04, 1M1, FRN, 7.181%, (1-month USD LIBOR + 4.90%), 11/25/24 | | | United States | | | | 15,422,786 | | | | | | 17,634,736 | |
2014-C04, 2M2, FRN, 7.281%, (1-month USD LIBOR + 5.00%), 11/25/24 | | | United States | | | | 4,383,329 | | | | | | 4,944,049 | |
2015-C01, 1M2, FRN, 6.581%, (1-month USD LIBOR + 4.30%), 2/25/25 | | | United States | | | | 3,565,130 | | | | | | 3,914,733 | |
2015-C01, 2M2, FRN, 6.831%, (1-month USD LIBOR + 4.55%), 2/25/25 | | | United States | | | | 15,363,844 | | | | | | 16,577,895 | |
2015-C02, 1M2, FRN, 6.281%, (1-month USD LIBOR + 4.00%), 5/25/25 | | | United States | | | | 16,743,266 | | | | | | 18,366,275 | |
2015-C02, 2M2, FRN, 6.281%, (1-month USD LIBOR + 4.00%), 5/25/25 | | | United States | | | | 5,047,454 | | | | | | 5,445,637 | |
| | | | |
| | | |
franklintempleton.com | | Annual Report | | 109 |
FRANKLIN INVESTORS SECURITIES TRUST
CONSOLIDATED STATEMENT OF INVESTMENTS
Franklin Total Return Fund (continued)
| | | | | | | | | | | | | | |
| | | Country | | | Principal
Amount* | | | | | Value | |
Asset-Backed Securities and Commercial Mortgage-Backed Securities (continued) | | | | | | | | | | | | | | |
Diversified Financials (continued) | | | | | | | | | | | | | | |
s FNMA Connecticut Avenue Securities, (continued) | | | | | | | | | | | | | | |
2015-C03, 1M2, FRN, 7.281%, (1-month USD LIBOR + 5.00%), 7/25/25 | | | United States | | | | 11,884,229 | | | | | $ | 13,378,490 | |
2015-C03, 2M2, FRN, 7.281%, (1-month USD LIBOR + 5.00%), 7/25/25 | | | United States | | | | 5,127,286 | | | | | | 5,700,058 | |
2017-C01, 1B1, FRN, 8.031%, (1-month USD LIBOR + 5.75%), 7/25/29 | | | United States | | | | 5,375,000 | | | | | | 6,498,482 | |
g,r FREMF Mortgage Trust, 2018-K72, B, 144A, FRN, 3.992%, 12/25/50 | | | United States | | | | 17,900,000 | | | | | | 17,204,338 | |
g,u,v Galaxy CLO Ltd., 2018-26A, D, 144A, FRN, 11/22/31 | | | United States | | | | 586,957 | | | | | | 586,957 | |
g,s Galaxy XXVII CLO Ltd., | | | | | | | | | | | | | | |
2018-27A, A, 144A, FRN, 3.335%, (3-month USD LIBOR + 1.02%), 5/16/31 | | | United States | | | | 1,000,000 | | | | | | 995,520 | |
2018-27A, C, 144A, FRN, 5.065%, (3-month USD LIBOR + 2.75%), 5/16/31 | | | United States | | | | 750,000 | | | | | | 747,413 | |
g,s Gilbert Park CLO Ltd., | | | | | | | | | | | | | | |
2017-1A, B, 144A, FRN, 4.036%, (3-month USD LIBOR + 1.60%), 10/15/30 | | | United States | | | | 1,000,000 | | | | | | 1,000,550 | |
2017-1A, D, 144A, FRN, 5.386%, (3-month USD LIBOR + 2.95%), 10/15/30 | | | United States | | | | 2,600,000 | | | | | | 2,603,250 | |
s GSAA Home Equity Trust, 2005-5, M3, FRN, 3.226%, (1-month USD LIBOR + 0.945%), 2/25/35 | | | United States | | | | 1,984,051 | | | | | | 1,999,684 | |
g,s Halcyon Loan Advisors Funding Ltd., 2018-1A, A2, 144A, FRN, 4.183%, (3-month USD LIBOR + 1.80%), 7/21/31 | | | United States | | | | 8,500,000 | | | | | | 8,473,480 | |
g,s HayFin Kingsland IX Ltd., 2013-6A, BR, 144A, FRN, 4.309%, (3-month USD LIBOR + 1.80%), 4/28/31 | | | United States | | | | 14,500,000 | | | | | | 14,563,800 | |
s Home Equity Mortgage Trust, 2004-4, M3, FRN, 3.256%, (1-month USD LIBOR + 0.975%), 12/25/34 | | | United States | | | | 1,115,998 | | | | | | 1,117,638 | |
g,r HPS Loan Management Ltd., 2013A-18, A2, 144A, FRN, 3.886%, 10/15/30 | | | United States | | | | 8,600,000 | | | | | | 8,601,376 | |
2013A-18, C, 144A, FRN, 4.586%, 10/15/30 | | | United States | | | | 3,000,000 | | | | | | 2,999,490 | |
g,s Invitation Homes Trust, 2017-SFR2, A, 144A, FRN, 3.14%, (1-month USD LIBOR + 0.85%), 12/17/36 | | | United States | | | | 9,767,438 | | | | | | 9,792,720 | |
g,s LCM 26 Ltd., | | | | | | | | | | | | | | |
26A, B, 144A, FRN, 3.869%, (3-month USD LIBOR + 1.40%), 1/20/31 | | | United States | | | | 2,000,000 | | | | | | 1,976,420 | |
26A, C, 144A, FRN, 4.269%, (3-month USD LIBOR + 1.80%), 1/20/31 | | | United States | | | | 9,600,000 | | | | | | 9,494,304 | |
26A, D, 144A, FRN, 4.969%, (3-month USD LIBOR + 2.50%), 1/20/31 | | | United States | | | | 600,000 | | | | | | 584,640 | |
g,s LCM XVI LP, 2016A, DR, 144A, FRN, 5.436%, (3-month USD LIBOR + 3.00%), 7/15/26 | | | United States | | | | 2,750,000 | | | | | | 2,750,467 | |
g,s LCM XVIII LP, 2018A, CR, 144A, FRN, 4.319%, (3-month USD LIBOR + 1.85%), 4/20/31 | | | United States | | | | 2,000,000 | | | | | | 1,983,180 | |
g,s LCM XXIII Ltd., 23A, A2, 144A, FRN, 4.319%, (3-month USD LIBOR + 1.85%), 10/20/29 | | | United States | | | | 2,000,000 | | | | | | 2,006,220 | |
g,s LCM XXV Ltd., 25A, C2, 144A, FRN, 4.769%, (3-month USD LIBOR + 2.30%), 7/20/30 | | | United States | | | | 443,666 | | | | | | 445,796 | |
| | | | |
| | | |
110 | | Annual Report | | franklintempleton.com |
FRANKLIN INVESTORS SECURITIES TRUST
CONSOLIDATED STATEMENT OF INVESTMENTS
Franklin Total Return Fund (continued)
| | | | | | | | | | | | | | |
| | | Country | | | Principal
Amount* | | | | Value | |
Asset-Backed Securities and Commercial Mortgage-Backed Securities (continued) | | | | | | | | | | | | | | |
Diversified Financials (continued) | | | | | | | | | | | | | | |
g,s Long Point Park CLO Ltd., | | | | | | | | | | | | | | |
2017-1A, A2, 144A, FRN, 3.824%, (3-month USD LIBOR + 1.375%), 1/17/30 | | | United States | | | | 5,800,000 | | | | | $ | 5,749,076 | |
2017-1A, B, 144A, FRN, 4.149%, (3-month USD LIBOR + 1.70%), 1/17/30 | | | United States | | | | 2,700,000 | | | | | | 2,651,778 | |
2017-1A, C, 144A, FRN, 4.849%, (3-month USD LIBOR + 2.40%), 1/17/30 | | | United States | | | | 3,100,000 | | | | | | 3,014,223 | |
g,u,v Madison Park Funding XXIX Ltd., | | | | | | | | | | | | | | |
2018-29A, A2, 144A, FRN, 10/18/30 | | | United States | | | | 1,727,273 | | | | | | 1,727,273 | |
g Madison Park Funding XXIII Ltd., | | | | | | | | | | | | | | |
s 2017-23A, B, 144A, FRN, 4.209%, (3-month USD LIBOR + 1.70%), 7/27/30 | | | United States | | | | 3,840,000 | | | | | | 3,839,155 | |
s 2017-23A, C, 144A, FRN, 4.859%, (3-month USD LIBOR + 2.35%), 7/27/30 | | | United States | | | | 1,000,000 | | | | | | 1,003,750 | |
u,v 2018-29A, C, 144A, FRN, 10/18/30 | | | United States | | | | 1,072,581 | | | | | | 1,072,581 | |
g,s Madison Park Funding XXVII Ltd., 2018-27A, A1B, 144A, FRN, 3.599%, (3-month USD LIBOR + 1.13%), 4/20/30 | | | United States | | | | 6,837,000 | | | | | | 6,836,180 | |
g,s Madison Park Funding XXVIII Ltd., 2018-28A, D, 144A, FRN, 5.037%, (3-month USD LIBOR + 2.70%), 7/15/30 | | | United States | | | | 2,000,000 | | | | | | 1,960,160 | |
g,s Magnetite IX Ltd., 2014-9A, BR, 144A, FRN, 4.49%, (3-month USD LIBOR + 2.00%), 7/25/26 | | | United States | | | | 1,010,000 | | | | | | 1,012,545 | |
g,r Magnetite Ltd., 2015-14RA, A1, 144A, FRN, 3.559%, 10/18/31 | | | United States | | | | 15,000,000 | | | | | | 14,999,550 | |
g,s Magnetite XVIII Ltd., 2016-18A, B, 144A, FRN, 4.064%, (3-month USD LIBOR + 1.75%), 11/15/28 | | | United States | | | | 6,000,000 | | | | | | 6,007,440 | |
g,r Neuberger Berman CLO Ltd., | | | | | | | | | | | | | | |
2016-22A, A2R, 144A, FRN, 3.849%, 10/17/30 | | | United States | | | | 8,300,000 | | | | | | 8,300,000 | |
2016-22A, CR, 144A, FRN, 4.649%, 10/17/30 | | | United States | | | | 3,194,445 | | | | | | 3,194,413 | |
g,s Neuberger Berman CLO XVI-S Ltd., | | | | | | | | | | | | | | |
2017-16SA, C, 144A, FRN, 4.036%, (3-month USD LIBOR + 1.60%), 1/15/28 | | | United States | | | | 2,350,000 | | | | | | 2,328,732 | |
2017-16SA, D, 144A, FRN, 4.936%, (3-month USD LIBOR + 2.50%), 1/15/28 | | | United States | | | | 650,000 | | | | | | 645,372 | |
g,s Neuberger Berman Loan Advisers CLO Ltd., | | | | | | | | | | | | | | |
2017-26A, B, 144A, FRN, 3.945%, (3-month USD LIBOR + 1.50%), 10/18/30 | | | United States | | | | 5,772,370 | | | | | | 5,740,968 | |
2018-27A, C, 144A, FRN, 4.136%, (3-month USD LIBOR + 1.70%), 1/15/30 | | | United States | | | | 4,900,000 | | | | | | 4,883,389 | |
g,s NZCG Funding Ltd., 2015-1A, A2R, 144A, FRN, 3.861%, (3-month USD LIBOR + 1.55%), 2/26/31 | | | United States | | | | 11,200,000 | | | | | | 11,107,824 | |
g,s Octagon Investment Partners 18-R Ltd., 2018-18A, C, 144A, FRN, 5.136%, (3-month USD LIBOR + 2.70%), 4/16/31 | | | United States | | | | 9,050,000 | | | | | | 8,973,437 | |
g,s Octagon Investment Partners 31 LLC, 2017-1A, C, 144A, FRN, 4.869%, (3-month USD LIBOR + 2.40%), 7/20/30 | | | United States | | | | 1,707,068 | | | | | | 1,715,194 | |
g,s Octagon Investment Partners 33 Ltd., | | | | | | | | | | | | | | |
2017-1A, A2, 144A, FRN, 3.969%, (3-month USD LIBOR + 1.50%), 1/20/31 | | | United States | | | | 400,000 | | | | | | 398,548 | |
2017-1A, C, 144A, FRN, 5.219%, (3-month USD LIBOR + 2.75%), 1/20/31 | | | United States | | | | 2,800,000 | | | | | | 2,780,932 | |
| | | | |
| | | |
franklintempleton.com | | Annual Report | | 111 |
FRANKLIN INVESTORS SECURITIES TRUST
CONSOLIDATED STATEMENT OF INVESTMENTS
Franklin Total Return Fund (continued)
| | | | | | | | | | | | | | |
| | | Country | | | Principal
Amount* | | | | Value | |
Asset-Backed Securities and Commercial Mortgage-Backed Securities (continued) | | | | | | | | | | | | | | |
Diversified Financials (continued) | | | | | | | | | | | | | | |
g,s Octagon Investment Partners 35 Ltd., | | | | | | | | | | | | | | |
2018-1A, A1B, 144A, FRN, 3.569%, (3-month USD LIBOR + 1.10%), 1/20/31 | | | United States | | | | 3,325,000 | | | | | $ | 3,321,608 | |
2018-1A, B, 144A, FRN, 4.169%, (3-month USD LIBOR + 1.70%), 1/20/31 | | | United States | | | | 450,000 | | | | | | 442,526 | |
g,s Octagon Investment Partners 36 Ltd., | | | | | | | | | | | | | | |
2018-1A, A1, 144A, FRN, 3.406%, (3-month USD LIBOR + 0.97%), 4/15/31 | | | United States | | | | 9,000,000 | | | | | | 8,953,200 | |
2018-1A, A2, 144A, FRN, 3.636%, (3-month USD LIBOR + 1.20%), 4/15/31 | | | United States | | | | 8,500,000 | | | | | | 8,431,745 | |
g,s Octagon Investment Partners 37 Ltd., | | | | | | | | | | | | | | |
2018-2A, C, 144A, FRN, 5.21%, (3-month USD LIBOR + 2.85%), 7/25/30 | | | United States | | | | 2,000,000 | | | | | | 1,990,560 | |
g,r Octagon Investment Partners 38 Ltd., 2018-1A, C, 144A, FRN, 5.137%, 7/20/30 | | | United States | | | | 4,000,000 | | | | | | 3,996,520 | |
g,s Octagon Investment Partners XVII Ltd., 2013-1A, CR2, 144A, FRN, 4.19%, (3-month USD LIBOR + 1.70%), 1/25/31 | | | United States | | | | 5,250,000 | | | | | | 5,160,750 | |
g,s Octagon Investment Partners XX Ltd., 2014-1A, AR, 144A, FRN, 3.468%, (3-month USD LIBOR + 1.13%), 8/12/26 | | | United States | | | | 6,500,000 | | | | | | 6,508,580 | |
g,s Octagon Investment Partners XXIII Ltd., | | | | | | | | | | | | | | |
2015-1A, BR, 144A, FRN, 3.636%, (3-month USD LIBOR + 1.20%), 7/15/27 | | | United States | | | | 1,170,000 | | | | | | 1,168,865 | |
2015-1A, CR, 144A, FRN, 4.286%, (3-month USD LIBOR + 1.85%), 7/15/27 | | | United States | | | | 2,700,000 | | | | | | 2,703,564 | |
2015-1A, DR, 144A, FRN, 4.986%, (3-month USD LIBOR + 2.55%), 7/15/27 | | | United States | | | | 1,000,000 | | | | | | 994,970 | |
g,s Race Point IX CLO Ltd., 2015-9A, A1AR, 144A, FRN, 3.646%, (3-month USD LIBOR + 1.21%), 10/15/30 | | | United States | | | | 1,175,000 | | | | | | 1,177,491 | |
g,r Race Point X CLO Ltd., 2016-10A, B1R, 144A, FRN, 4.14%, 7/25/31 . | | | United States | | | | 3,600,000 | | | | | | 3,607,200 | |
g,s Radnor RE Ltd., 2018-1, M1, 144A, FRN, 3.681%, (1-month USD LIBOR + 1.40%), 3/25/28 | | | United States | | | | 6,557,000 | | | | | | 6,570,210 | |
g,s TCI-Cent CLO Income Note Issuer Ltd., | | | | | | | | | | | | | | |
2017-1A, B, 144A, FRN, 4.84%, (3-month USD LIBOR + 2.35%), 7/25/30 | | | United States | | | | 3,069,687 | | | | | | 3,081,137 | |
2017-1A, C, 144A, FRN, 6.14%, (3-month USD LIBOR + 3.65%), 7/25/30 | | | United States | | | | 1,000,000 | | | | | | 1,005,440 | |
g,s TCI-Flatiron CLO Ltd., | | | | | | | | | | | | | | |
2017-1A, B, 144A, FRN, 3.872%, (3-month USD LIBOR + 1.56%), 11/17/30 | | | United States | | | | 3,500,000 | | | | | | 3,489,605 | |
2017-1A, C, 144A, FRN, 4.162%, (3-month USD LIBOR + 1.85%), 11/17/30 | | | United States | | | | 2,800,000 | | | | | | 2,777,124 | |
2017-1A, D, 144A, FRN, 5.062%, (3-month USD LIBOR + 2.75%), 11/17/30 | | | United States | | | | 11,800,000 | | | | | | 11,642,352 | |
g,r Towd Point Mortgage Trust, | | | | | | | | | | | | | | |
2017-1, A2, 144A, FRN, 3.50%, 10/25/56 | | | United States | | | | 8,862,000 | | | | | | 8,632,980 | |
2017-2, A1, 144A, FRN, 2.75%, 4/25/57 | | | United States | | | | 4,631,982 | | | | | | 4,536,945 | |
| | | | |
| | | |
112 | | Annual Report | | franklintempleton.com |
FRANKLIN INVESTORS SECURITIES TRUST
CONSOLIDATED STATEMENT OF INVESTMENTS
Franklin Total Return Fund (continued)
| | | | | | | | | | | | | | |
| | | Country | | | Principal
Amount* | | | | Value | |
Asset-Backed Securities and Commercial Mortgage-Backed Securities (continued) | | | | | | | | | | | | | | |
Diversified Financials (continued) | | | | | | | | | | | | | | |
g Voya CLO Ltd., | | | | | | | | | | | | | | |
s 2013-2A, CR, 144A, FRN, 5.24%, (3-month USD LIBOR + 2.75%), 4/25/31 | | | United States | | | | 1,650,000 | | | | | $ | 1,616,687 | |
s 2014-1A, BR2, 144A, FRN, 4.345%, (3-month USD LIBOR + 1.90%), 4/18/31 | | | United States | | | | 1,000,000 | | | | | | 998,800 | |
s 2014-1A, CR2, 144A, FRN, 5.245%, (3-month USD LIBOR + 2.80%), 4/18/31 | | | United States | | | | 4,000,000 | | | | | | 3,980,040 | |
r 2015-2A, AR, 144A, FRN, 3.447%, 7/23/27 | | | United States | | | | 4,840,000 | | | | | | 4,839,564 | |
r 2016-3A, CR, 144A, FRN, 5.721%, 10/18/31 | | | United States | | | | 2,547,170 | | | | | | 2,547,170 | |
s 2017-3A, B, 144A, FRN, 4.819%, (3-month USD LIBOR + 2.35%), 7/20/30 | | | United States | | | | 3,091,704 | | | | | | 3,101,783 | |
s 2018-2A, A2, 144A, FRN, 3.624%, (3-month USD LIBOR + 1.25%), 7/15/31 | | | United States | | | | 1,500,000 | | | | | | 1,499,595 | |
s 2018-2A, C1, 144A, FRN, 4.224%, (3-month USD LIBOR + 1.85%), 7/15/31 | | | United States | | | | 700,000 | | | | | | 698,488 | |
s 2018-2A, D, 144A, FRN, 5.124%, (3-month USD LIBOR + 2.75%), 7/15/31 | | | United States | | | | 2,000,000 | | | | | | 1,969,040 | |
g,s Webster Park CLO Ltd., 2015-1A, BR, 144A, FRN, 4.269%, (3-month USD LIBOR + 1.80%), 7/20/30 | | | United States | | | | 2,000,000 | | | | | | 1,993,660 | |
Wells Fargo Mortgage Backed Securities Trust, | | | | | | | | | | | | | | |
r 2004-W, A9, FRN, 4.69%, 11/25/34 | | | United States | | | | 797,678 | | | | | | 821,940 | |
2007-3, 3A1, 5.50%, 4/25/22 | | | United States | | | | 99,357 | | | | | | 101,026 | |
g,s West CLO Ltd., | | | | | | | | | | | | | | |
2014-1A, A2R, 144A, FRN, 3.795%, (3-month USD LIBOR + 1.35%), 7/18/26 | | | United States | | | | 2,860,000 | | | | | | 2,860,000 | |
2014-1A, BR, 144A, FRN, 4.295%, (3-month USD LIBOR + 1.85%), 7/18/26 | | | United States | | | | 5,060,000 | | | | | | 5,069,007 | |
| | | | | | | | | | | | | | |
| | | | |
| | | | | | | | | | | | | 1,035,473,172 | |
| | | | | | | | | | | | | | |
Total Asset-Backed Securities and Commercial Mortgage-Backed Securities
(Cost $1,061,273,808) | | | | | | | | | | | | | 1,062,592,117 | |
| | | | | | | | | | | | | | |
Mortgage-Backed Securities 24.4% | | | | | | | | | | | | | | |
w Federal Home Loan Mortgage Corp. (FHLMC) Adjustable Rate 0.0%† | | | | | | | | | | | | | | |
FHLMC, 2.268%, (11th District COF +/- MBS Margin), 11/01/27 | | | United States | | | | 1,376,870 | | | | | | 1,370,803 | |
| | | | | | | | | | | | | | |
Federal Home Loan Mortgage Corp. (FHLMC) Fixed Rate 15.4% | | | | | | | | | | | | | | |
FHLMC 30 Year, 4.00%, 8/01/48 | | | United States | | | | 95,772,933 | | | | | | 95,906,112 | |
FHLMC 30 Year, 4.00%, 10/01/48 | | | United States | | | | 50,904,080 | | | | | | 50,972,241 | |
FHLMC 30 Year, 6.00%, 6/01/37 | | | United States | | | | 32,437 | | | | | | 35,435 | |
FHLMC 30 Year, 6.50%, 8/01/25 - 11/01/31 | | | United States | | | | 85,249 | | | | | | 93,951 | |
FHLMC 30 Year, 7.00%, 7/01/31 | | | United States | | | | 6,016 | | | | | | 6,204 | |
FHLMC 30 Year, 8.00%, 2/01/30 | | | United States | | | | 19,521 | | | | | | 21,822 | |
FHLMC 30 Year, 8.50%, 10/01/24 | | | United States | | | | 3,938 | | | | | | 4,240 | |
FHLMC Gold 15 Year, 5.50%, 11/01/22 | | | United States | | | | 59,274 | | | | | | 59,609 | |
FHLMC Gold 15 Year, 6.00%, 10/01/21 - 9/01/22 | | | United States | | | | 224,055 | | | | | | 228,706 | |
FHLMC Gold 30 Year, 3.50%, 12/01/47 | | | United States | | | | 89,330,717 | | | | | | 87,063,978 | |
FHLMC Gold 30 Year, 3.50%, 4/01/48 | | | United States | | | | 119,866,542 | | | | | | 116,818,786 | |
x FHLMC Gold 30 Year, 3.50%, 10/01/48 | | | United States | | | | 90,500,000 | | | | | | 88,117,680 | |
FHLMC Gold 30 Year, 4.00%, 5/01/48 | | | United States | | | | 73,130,317 | | | | | | 73,228,951 | |
| | | | |
| | | |
franklintempleton.com | | Annual Report | | 113 |
FRANKLIN INVESTORS SECURITIES TRUST
CONSOLIDATED STATEMENT OF INVESTMENTS
Franklin Total Return Fund (continued)
| | | | | | | | | | | | | | | | |
| | | Country | | | Principal
Amount* | | | | | Value | |
Mortgage-Backed Securities (continued) | | | | | | | | | | | | | | | | |
Federal Home Loan Mortgage Corp. (FHLMC) Fixed Rate (continued) | | | | | | | | | | | | | | | | |
x FHLMC Gold 30 Year, 4.00%, 11/01/48 | | | United States | | | | 99,655,000 | | | | | | | $ | 99,697,325 | |
FHLMC Gold 30 Year, 4.50%, 3/01/39 | | | United States | | | | 1,696,316 | | | | | | | | 1,747,746 | |
FHLMC Gold 30 Year, 5.00%, 8/01/33 - 2/01/39 | | | United States | | | | 9,827,445 | | | | | | | | 10,374,448 | |
FHLMC Gold 30 Year, 5.50%, 1/01/35 - 12/01/37 | | | United States | | | | 813,247 | | | | | | | | 871,809 | |
FHLMC Gold 30 Year, 6.00%, 5/01/33 - 4/01/38 | | | United States | | | | 1,058,990 | | | | | | | | 1,162,934 | |
FHLMC Gold 30 Year, 6.50%, 4/01/28 - 3/01/39 | | | United States | | | | 807,810 | | | | | | | | 890,645 | |
FHLMC Gold 30 Year, 7.00%, 1/01/28 - 7/01/32 | | | United States | | | | 61,659 | | | | | | | | 68,044 | |
FHLMC Gold 30 Year, 7.50%, 3/01/32 | | | United States | | | | 14,978 | | | | | | | | 17,008 | |
FHLMC Gold 30 Year, 8.50%, 8/01/30 | | | United States | | | | 1,416 | | | | | | | | 1,545 | |
FHLMC Gold 30 Year, 9.00%, 1/01/22 | | | United States | | | | 317 | | | | | | | | 319 | |
FHLMC Gold 30 Year, 10.00%, 10/01/30 | | | United States | | | | 3,794 | | | | | | | | 3,803 | |
| | | | | | | | | | | | | | | | |
| | | | |
| | | | | | | | | | | | | | | 627,393,341 | |
| | | | | | | | | | | | | | | | |
w Federal National Mortgage Association (FNMA) Adjustable Rate 0.1% | | | | | | | | | | | | | | | | |
FNMA, 3.345% - 3.69%, (12-month USD LIBOR +/- MBS Margin), 2/01/34 - 3/01/37 | | | United States | | | | 1,012,792 | | | | | | | | 1,050,406 | |
FNMA, 3.861%, (6-month USD LIBOR +/- MBS Margin), 10/01/32 | | | United States | | | | 151,150 | | | | | | | | 153,575 | |
FNMA, 4.015%, (US 3 Year CMT T-Note +/- MBS Margin), 12/01/24 | | | United States | | | | 9,478 | | | | | | | | 9,685 | |
FNMA, 2.268% - 4.107%, (11th District COF +/- MBS Margin), 12/01/27 - 9/01/34 | | | United States | | | | 2,863,825 | | | | | | | | 2,923,025 | |
FNMA, 3.55% - 4.749%, (US 1 Year CMT T-Note +/- MBS Margin), 5/01/25 - 10/01/36 | | | United States | | | | 263,558 | | | | | | | | 276,239 | |
| | | | | | | | | | | | | | | | |
| | | | |
| | | | | | | | | | | | | | | 4,412,930 | |
| | | | | | | | | | | | | | | | |
Federal National Mortgage Association (FNMA) Fixed Rate 6.7% | | | | | | | | | | | | | | | | |
FNMA 15 Year, 4.50%, 3/01/19 - 6/01/19 | | | United States | | | | 7,379 | | | | | | | | 7,487 | |
FNMA 15 Year, 5.50%, 12/01/22 - 12/01/23 | | | United States | | | | 101,134 | | | | | | | | 103,482 | |
FNMA 15 Year, 6.00%, 9/01/22 | | | United States | | | | 46,490 | | | | | | | | 47,083 | |
FNMA 30 Year, 3.50%, 11/01/47 | | | United States | | | | 119,256,199 | | | | | | | | 116,223,508 | |
FNMA 30 Year, 3.50%, 4/01/48 | | | United States | | | | 51,663,600 | | | | | | | | 50,338,774 | |
x FNMA 30 Year, 3.50%, 10/01/48 | | | United States | | | | 92,400,000 | | | | | | | | 89,956,456 | |
FNMA 30 Year, 5.00%, 6/01/36 - 5/01/39 | | | United States | | | | 1,666,478 | | | | | | | | 1,758,725 | |
FNMA 30 Year, 5.50%, 6/01/33 - 8/01/37 | | | United States | | | | 5,755,654 | | | | | | | | 6,173,838 | |
FNMA 30 Year, 6.00%, 9/01/32 - 9/01/38 | | | United States | | | | 7,233,089 | | | | | | | | 7,891,012 | |
FNMA 30 Year, 6.50%, 8/01/28 - 5/01/37 | | | United States | | | | 191,458 | | | | | | | | 208,909 | |
FNMA 30 Year, 7.00%, 11/01/25 | | | United States | | | | 3,222 | | | | | | | | 3,233 | |
FNMA 30 Year, 7.50%, 1/01/30 | | | United States | | | | 11,389 | | | | | | | | 12,986 | |
FNMA 30 Year, 8.50%, 4/01/30 - 5/01/32 | | | United States | | | | 63,715 | | | | | | | | 73,772 | |
FNMA 30 Year, 9.00%, 11/01/26 - 5/01/27 | | | United States | | | | 63,666 | | | | | | | | 64,910 | |
| | | | | | | | | | | | | | | | |
| | | | |
| | | | | | | | | | | | | | | 272,864,175 | |
| | | | | | | | | | | | | | | | |
w Government National Mortgage Association (GNMA) Adjustable Rate 0.0%† | | | | | | | | | | | | | | | | |
GNMA, 3.125% - 3.375%, (US 1 Year CMT T-Note +/- MBS Margin), 1/20/23 - 10/20/26 | | | United States | | | | 32,656 | | | | | | | | 33,478 | |
| | | | | | | | | | | | | | | | |
Government National Mortgage Association (GNMA) Fixed Rate 2.2% | | | | | | | | | | | | | | | | |
GNMA I SF 30 Year, 4.50%, 9/20/48 | | | United States | | | | 85,449,422 | | | | | | | | 87,811,124 | |
GNMA I SF 30 Year, 6.00%, 1/15/39 | | | United States | | | | 166,913 | | | | | | | | 179,021 | |
GNMA I SF 30 Year, 6.50%, 10/15/31 - 7/15/38 | | | United States | | | | 21,430 | | | | | | | | 23,393 | |
GNMA I SF 30 Year, 7.00%, 10/15/27 - 6/15/31 | | | United States | | | | 30,175 | | | | | | | | 33,296 | |
GNMA I SF 30 Year, 7.50%, 2/15/22 - 5/15/26 | | | United States | | | | 49,916 | | | | | | | | 50,725 | |
| | | | |
| | | |
114 | | Annual Report | | franklintempleton.com |
FRANKLIN INVESTORS SECURITIES TRUST
CONSOLIDATED STATEMENT OF INVESTMENTS
Franklin Total Return Fund (continued)
| | | | | | | | | | | | | | | | |
| | | Country | | | Principal
Amount* | | | | | Value | |
Mortgage-Backed Securities (continued) | | | | | | | | | | | | | | | | |
Government National Mortgage Association (GNMA) Fixed Rate (continued) | | | | | | | | | | | | | | | | |
GNMA I SF 30 Year, 9.00%, 9/15/25 - 1/15/31 | | | United States | | | | 1,395 | | | | | | | $ | 1,423 | |
GNMA II SF 30 Year, 6.00%, 5/20/31 | | | United States | | | | 3,888 | | | | | | | | 4,201 | |
GNMA II SF 30 Year, 6.50%, 3/20/28 - 7/20/38 | | | United States | | | | 371,451 | | | | | | | | 417,998 | |
GNMA II SF 30 Year, 7.50%, 8/20/30 - 1/20/33 | | | United States | | | | 40,818 | | | | | | | | 46,013 | |
| | | | | | | | | | | | | | | | |
| | | | |
| | | | | | | | | | | | | | | 88,567,194 | |
| | | | | | | | | | | | | | | | |
Total Mortgage-Backed Securities
(Cost $1,014,179,777) | | | | | | | | | | | | | | | 994,641,921 | |
| | | | | | | | | | | | | | | | |
| | | | |
Municipal Bonds 1.9% | | | | | | | | | | | | | | | | |
California State GO, Various Purpose, 6.00%, 11/01/39 | | | United States | | | | 2,385,000 | | | | | | | | 2,477,276 | |
Chicago Transit Authority Sales and Transfer Tax Receipts Revenue, Pension Funding, Series A, 6.899%, 12/01/40 | | | United States | | | | 800,000 | | | | | | | | 1,001,432 | |
Industry Public Facilities Authority Tax Allocation Revenue, Transportation District, Industrial Redevelopment Project No. 2, Refunding, Series B, AGMC Insured, 4.294%, 1/01/23 | | | United States | | | | 10,000,000 | | | | | | | | 10,221,100 | |
Minnesota State GO, Various Purpose, Refunding, Series F, 4.00%, 10/01/24 | | | United States | | | | 5,760,000 | | | | | | | | 6,179,155 | |
New Jersey EDA Revenue, School Facilities Construction, Refunding, Series NN, 5.00%, 3/01/30 | | | United States | | | | 3,300,000 | | | | | | | | 3,456,585 | |
Orlando Health Obligated Group, 3.777%, 10/01/28 | | | United States | | | | 2,810,000 | | | | | | | | 2,731,038 | |
Port Authority of New York and New Jersey Revenue, | | | | | | | | | | | | | | | | |
Consolidated, One Hundred Ninety-First Series, 4.823%, 6/01/45 | | | United States | | | | 4,570,000 | | | | | | | | 4,698,691 | |
Consolidated, Refunding, One Hundred Ninety-Second Series, 4.81%, 10/15/65 | | | United States | | | | 15,000,000 | | | | | | | | 15,905,100 | |
Providence St. Joseph Health Obligated Group, 2.746%, 10/01/26 | | | United States | | | | 8,875,000 | | | | | | | | 8,135,818 | |
y Puerto Rico Electric Power Authority Power Revenue, Series A, 6.75%, 7/01/36 | | | United States | | | | 12,000,000 | | | | | | | | 7,770,000 | |
San Jose RDA Successor Agency Tax Allocation, Senior, Refunding, Series A-T, 3.226%, 8/01/27 | | | United States | | | | 6,150,000 | | | | | | | | 5,894,898 | |
University of California Revenue, Limited Project, Refunding, Series J, 4.131%, 5/15/45 | | | United States | | | | 10,750,000 | | | | | | | | 10,444,807 | |
| | | | | | | | | | | | | | | | |
Total Municipal Bonds (Cost $82,366,774) | | | | | | | | | | | | | | | 78,915,900 | |
| | | | | | | | | | | | | | | | |
| | | | |
| | | | | | | Shares | | | | | | | | | |
Escrows and Litigation Trusts 0.0% | | | | | | | | | | | | | | | | |
a,b Motors Liquidation Co., Escrow Account, cvt. pfd., C | | | United States | | | | 43,500 | | | | | | | | — | |
a,b NewPage Corp., Litigation Trust | | | United States | | | | 2,500,000 | | | | | | | | — | |
| | | | | | | | | | | | | | | | |
Total Escrows and Litigation Trusts (Cost $2,307) | | | | | | | | | | | | | | | — | |
| | | | | | | | | | | | | | | | |
Total Investments before Short Term Investments
(Cost $4,409,617,357) | | | | | | | | | | | | | | | 4,292,780,297 | |
| | | | | | | | | | | | | | | | |
| | | | |
| | | |
franklintempleton.com | | Annual Report | | 115 |
FRANKLIN INVESTORS SECURITIES TRUST
CONSOLIDATED STATEMENT OF INVESTMENTS
Franklin Total Return Fund (continued)
| | | | | | | | | | | | | | | | |
| | | Country | | | Shares | | | | | Value | |
Short Term Investments (Cost $39,095,058) 0.9% | | | | | | | | | | | | | | | | |
| | | | |
Money Market Funds 0.9% | | | | | | | | | | | | | | | | |
d,z Institutional Fiduciary Trust Money Market Portfolio, 1.83% | | | United States | | | | 39,095,058 | | | | | | | $ | 39,095,058 | |
| | | | | | | | | | | | | | | | |
Total Investments (Cost $4,448,712,415) 106.1% | | | | | | | | | | | | | | | 4,331,875,355 | |
Other Assets, less Liabilities (6.1)% | | | | | | | | | | | | | | | (249,974,338 | ) |
| | | | | | | | | | | | | | | | |
Net Assets 100.0% | | | | | | | | | | | | | | $ | 4,081,901,017 | |
| | | | | | | | | | | | | | | | |
†Rounds to less than 0.1% of net assets.
*The principal amount is stated in U.S. dollars unless otherwise indicated.
aNon-income producing.
aaThe security is owned by FT Holdings Corporation I, a wholly-owned subsidiary of the Fund. See Note 1(g).
bFair valued using significant unobservable inputs. See Note 12 regarding fair value measurements.
cSee Note 8 regarding restricted securities.
dSee Note 3(f) regarding investments in affiliated management investment companies.
eVariable rate security. The rate shown represents the yield at period end.
fSecurity was purchased pursuant to Regulation S under the Securities Act of 1933, which exempts from registration securities offered and sold outside of the United States. Such a security cannot be sold in the United States without either an effective registration statement filed pursuant to the Securities Act of 1933, or pursuant to an exemption from registration. These securities have been deemed liquid under guidelines approved by the Trust’s Board of Trustees. At October 31, 2018, the aggregate value of these securities was $36,529,073, representing 0.9% of net assets.
gSecurity was purchased pursuant to Rule 144A under the Securities Act of 1933 and may be sold in transactions exempt from registration only to qualified institutional buyers or in a public offering registered under the Securities Act of 1933. These securities have been deemed liquid under guidelines approved by the Trust’s Board of Trustees. At October 31, 2018, the aggregate value of these securities was $1,112,927,229, representing 27.3% of net assets.
hPerpetual security with no stated maturity date.
iSee Note 1(f) regarding loan participation notes.
jIncome may be received in additional securities and/or cash.
kThe coupon rate shown represents the rate at period end.
lSee Note 1(i) regarding senior floating rate interests.
mA portion or all of the security purchased on a delayed delivery basis. See Note 1(d).
nA portion or all of the security represents an unsettled loan commitment. The coupon rate is to-be determined (TBD) at the time of settlement and will be based upon a reference index/floor plus a spread.
oPrincipal amount is stated in 100 Mexican Peso Units.
pThe principal represents the notional amount. See Note 1(e) regarding value recovery instruments.
qPrincipal amount of security is adjusted for inflation. See Note 1(l).
rAdjustable rate security with an interest rate that is not based on a published reference index and spread. The rate is based on the structure of the agreement and current market conditions. The coupon rate shown represents the rate at period end.
sThe coupon rate shown represents the rate inclusive of any caps or floors, if applicable, in effect at period end.
tThe bond pays interest and/or principal based upon the issuer’s ability to pay, which may be less than the stated interest rate or principal paydown.
uSecurity purchased on a when-issued basis. See Note 1(d).
vThe coupon rate will be determined at time of issue.
wAdjustable Rate Mortgage-Backed Security (ARM); the rate shown is the effective rate at period end. ARM rates are not based on a published reference rate and spread, but instead pass-through weighted average interest income inclusive of any caps or floors, if applicable, from the underlying mortgage loans in which the majority of mortgages pay interest based on the index shown at their designated reset dates plus a spread, less the applicable servicing and guaranty fee (MBS margin).
xSecurity purchased on a to-be-announced (TBA) basis. See Note 1(d).
ySee Note 7 regarding defaulted securities.
zThe rate shown is the annualized seven-day effective yield at period end.
| | | | |
| | | |
116 | | Annual Report | | franklintempleton.com |
FRANKLIN INVESTORS SECURITIES TRUST
CONSOLIDATED STATEMENT OF INVESTMENTS
Franklin Total Return Fund (continued)
At October 31, 2018, the Fund had the following futures contracts outstanding. See Note 1(e).
Futures Contracts
| | | | | | | | | | | | | | | | | | | | |
| Description | | Type | | | Number of
Contracts | | | Notional
Amount* | | | Expiration
Date | | | Value/
Unrealized
Appreciation
(Depreciation) | |
Interest Rate Contracts | | | | | | | | | | | | | | | | | | | | |
Australian 10 Yr. Bond | | | Long | | | | 280 | | | $ | 25,649,334 | | | | 12/17/18 | | | $ | (40,979 | ) |
Canadian 10 Yr. Bond | | | Long | | | | 332 | | | | 33,334,954 | | | | 12/18/18 | | | | (448,944 | ) |
CME Ultra Long Term U.S. Treasury Bond | | | Long | | | | 70 | | | | 10,445,313 | | | | 12/19/18 | | | | (737,380 | ) |
Euro-Bund | | | Short | | | | 420 | | | | 76,210,839 | | | | 12/06/18 | | | | (195,947 | ) |
U.S. Treasury 5 Yr. Note | | | Long | | | | 1,323 | | | | 148,682,461 | | | | 12/31/18 | | | | (527,936 | ) |
U.S. Treasury 10 Yr. Note | | | Long | | | | 370 | | | | 43,821,875 | | | | 12/19/18 | | | | (139,730 | ) |
U.S. Treasury 30 Yr. Bond | | | Long | | | | 1,095 | | | | 151,246,875 | | | | 12/19/18 | | | | (6,880,925 | ) |
Ultra 10 Yr. U.S. Treasury Note | | | Long | | | | 162 | | | | 20,267,719 | | | | 12/19/18 | | | | (379,023 | ) |
| | | | | | | | | | | | | | | | | | | | |
| | | | | |
Total Futures Contracts | | | | | | | | | | | | | | | | | | $ | (9,350,864 | ) |
| | | | | | | | | | | | | | | | | | | | |
*As of period end.
At October 31, 2018, the Fund had the following forward exchange contracts outstanding. See Note 1(e).
Forward Exchange Contracts
| | | | | | | | | | | | | | | | | | | | | | | | | | | | |
| Currency | | Counterpartya | | | Type | | | Quantity | | | Contract
Amount | | | Settlement
Date | | | Unrealized
Appreciation | | | Unrealized
Depreciation | |
OTC Forward Exchange Contracts | | | | | | | | | | | | | | | | | | | | | |
Japanese Yen | | | JPHQ | | | | Sell | | | | 1,400,000,000 | | | $ | 12,917,274 | | | | 1/23/19 | | | $ | 419,572 | | | $ | — | |
Indian Rupee | | | DBAB | | | | Buy | | | | 631,935,000 | | | | 8,449,459 | | | | 2/04/19 | | | | — | | | | (29,122 | ) |
Indian Rupee | | | JPHQ | | | | Buy | | | | 386,000,000 | | | | 5,159,393 | | | | 2/04/19 | | | | — | | | | (16,064 | ) |
Indonesian Rupiah | | | DBAB | | | | Buy | | | | 139,844,100,000 | | | | 8,975,873 | | | | 2/04/19 | | | | 54,950 | | | | — | |
Indonesian Rupiah | | | JPHQ | | | | Buy | | | | 6,900,000,000 | | | | 441,374 | | | | 2/04/19 | | | | 4,213 | | | | — | |
Mexican Peso | | | DBAB | | | | Buy | | | | 138,200,000 | | | | 7,222,518 | | | | 2/05/19 | | | | — | | | | (529,570 | ) |
Mexican Peso | | | JPHQ | | | | Buy | | | | 261,250,000 | | | | 13,017,647 | | | | 2/05/19 | | | | — | | | | (365,456 | ) |
Canadian Dollar | | | JPHQ | | | | Sell | | | | 15,760,000 | | | | 12,323,717 | | | | 3/14/19 | | | | 319,842 | | | | — | |
Euro | | | DBAB | | | | Sell | | | | 11,401,350 | | | | 13,514,019 | | | | 3/14/19 | | | | 443,157 | | | | — | |
Euro | | | JPHQ | | | | Sell | | | | 6,401,460 | | | | 7,594,821 | | | | 3/14/19 | | | | 255,987 | | | | — | |
Polish Zloty | | | JPHQ | | | | Buy | | | | 31,600,000 | | | | 8,620,219 | | | | 3/14/19 | | | | — | | | | (352,471 | ) |
Swedish Krona | | | JPHQ | | | | Buy | | | | 131,600,000 | | | | 14,957,333 | | | | 3/14/19 | | | | — | | | | (399,852 | ) |
Swedish Krona | | | JPHQ | | | | Sell | | | | 62,400,000 | | | | 7,192,934 | | | | 3/14/19 | | | | 290,299 | | | | — | |
Australian Dollar | | | JPHQ | | | | Sell | | | | 16,750,000 | | | | 11,872,316 | | | | 4/11/19 | | | | — | | | | (12,537 | ) |
Brazilian Real | | | JPHQ | | | | Buy | | | | 44,800,000 | | | | 10,616,114 | | | | 4/11/19 | | | | 1,246,283 | | | | — | |
Brazilian Real | | | JPHQ | | | | Sell | | | | 19,500,000 | | | | 5,102,041 | | | | 4/11/19 | | | | — | | | | (61,279 | ) |
Chinese Yuan Renminbi | | | JPHQ | | | | Sell | | | | 86,300,000 | | | | 12,320,651 | | | | 4/11/19 | | | | 36,513 | | | | — | |
Philippine Peso | | | JPHQ | | | | Sell | | | | 454,000,000 | | | | 8,224,761 | | | | 4/11/19 | | | | — | | | | (181,712 | ) |
South Korean Won | | | JPHQ | | | | Sell | | | | 14,000,000,000 | | | | 12,375,691 | | | | 4/11/19 | | | | 31,536 | | | | — | |
| | | | | | | | | | | | | | | | | | | | | | | | |
| | | | | | |
Total Forward Exchange Contracts | | | | | | | | | | | | | | | | | | | $ | 3,102,352 | | | $ | (1,948,063 | ) |
| | | | | | | | | | | | | | | | | | | | | | | | |
| | | | | |
Net unrealized appreciation (depreciation) | | | | | | | | | | | | | | | $ | 1,154,289 | | | | | |
| | | | | | | | | | | | | | | | | | | | | | | | | | | | |
aMay be comprised of multiple contracts with the same counterparty, currency and settlement date.
| | | | |
| | | |
franklintempleton.com | | Annual Report | | 117 |
FRANKLIN INVESTORS SECURITIES TRUST
CONSOLIDATED STATEMENT OF INVESTMENTS
Franklin Total Return Fund (continued)
At October 31, 2018, the Fund had the following credit default swap contracts outstanding. See Note 1(e).
Credit Default Swap Contracts
| | | | | | | | | | | | | | | | | | | | | | | | | | | | | | | | | | | | |
| Description | | Periodic
Payment Rate
Received
(Paid) | | | Payment
Frequency | | | Counter-
party | | | Maturity
Date | | | Notional
Amounta | | | Value | | | Unamortized
Upfront
Payments
(Receipts) | | | Unrealized
Appreciation
(Depreciation) | | | Ratingb | |
Centrally Cleared Swap Contracts | | | | | | | | | | | | | | | | | | | | | | | | | | | | | | | | | |
Contracts to Sell Protectionc,d | | | | | | | | | | | | | | | | | | | | | | | | | | | | | | | | | |
Traded Index | | | | | | | | | | | | | | | | | | | | | | | | | | | | | | | | | | | | |
CDX.EM.30 | | | 1.00% | | | | Quarterly | | | | | | | | 12/20/23 | | | $ | 56,100,000 | | | $ | (2,603,829) | | | $ | (2,471,224) | | | $ | (132,605) | | | | Investment | |
| | | | | | | | | | | | | | | | | | | | | | | | | | | | | | | | | | | Grade | |
CDX.NA.HY.31 | | | 5.00% | | | | Quarterly | | | | | | | | 12/20/23 | | | | 20,600,000 | | | | 1,209,504 | | | | 1,097,290 | | | | 112,214 | | | | Non- | |
| | | | | | | | | | | | | | | | | | | | | | | | | | | | | | | | | | | Investment | |
| | | | | | | | | | | | | | | | | | | | | | | | | | | | | | | | | | | Grade | |
CDX.NA.IG.24 | | | 1.00% | | | | Quarterly | | | | | | | | 6/20/25 | | | | 25,000,000 | | | | 53,270 | | | | (38,872) | | | | 92,142 | | | | Investment | |
| | | | | | | | | | | | | | | | | | | | | | | | | | | | | | | | | | | Grade | |
CDX.NA.IG.30 | | | 1.00% | | | | Quarterly | | | | | | | | 6/20/23 | | | | 13,850,000 | | | | 236,413 | | | | 258,534 | | | | (22,121) | | | | Investment | |
| | | | | | | | | | | | | | | | | | | | | | | | | | | | | | | | | | | Grade | |
CDX.NA.IG.31 | | | 1.00% | | | | Quarterly | | | | | | | | 12/20/23 | | | | 24,500,000 | | | | 392,324 | | | | 462,634 | | | | (70,310) | | | | Investment | |
| | | | | | | | | | | | | | | | | | | | | | | | | | | | |
Total Centrally Cleared Swap Contracts | | | | | | | | | | | | | | | $ | (712,318) | | | $ | (691,638) | | | $ | (20,680) | | | | Grade | |
| | | | | | | | | | | | | | | | | | | | | | | | | | | | |
OTC Swap Contracts | | | | | | | | | | | | | | | | | | | | | | | | | | | | | | | | | |
Contracts to Buy Protectionc | | | | | | | | | | | | | | | | | | | | | | | | | | | | | |
Single Name | | | | | | | | | | | | | | | | | | | | | | | | | | | | | | | | | | | | |
The AES Corp. | | | (5.00)% | | | | Quarterly | | | | JPHQ | | | | 6/20/22 | | | $ | 13,275,000 | | | $ | (1,991,406) | | | $ | (1,305,500) | | | $ | (685,906) | | | | | |
Ally Financial Inc. | | | (5.00)% | | | | Quarterly | | | | CITI | | | | 12/20/22 | | | | 5,200,000 | | | | (792,461) | | | | (785,287) | | | | (7,174) | | | | | |
Ally Financial Inc. | | | (5.00)% | | | | Quarterly | | | | JPHQ | | | | 12/20/22 | | | | 2,600,000 | | | | (396,230) | | | | (397,048) | | | | 818 | | | | | |
Ally Financial Inc. | | | (5.00)% | | | | Quarterly | | | | JPHQ | | | | 12/20/22 | | | | 6,200,000 | | | | (944,857) | | | | (941,181) | | | | (3,676) | | | | | |
CSC Holdings LLC | | | (5.00)% | | | | Quarterly | | | | GSCO | | | | 3/20/19 | | | | 9,000,000 | | | | (217,274) | | | | (45,718) | | | | (171,556) | | | | | |
Dish DBS Corp. | | | (5.00)% | | | | Quarterly | | | | JPHQ | | | | 6/20/21 | | | | 6,520,000 | | | | (435,628) | | | | (251,823) | | | | (183,805) | | | | | |
Government of Italy | | | (1.00)% | | | | Quarterly | | | | BZWS | | | | 6/20/23 | | | | 10,600,000 | | | | 235,142 | | | | 107,058 | | | | 128,084 | | | | | |
Government of Turkey | | | (1.00)% | | | | Quarterly | | | | BZWS | | | | 12/20/19 | | | | 3,466,666 | | | | 82,029 | | | | 184,078 | | | | (102,049) | | | | | |
Government of Turkey | | | (1.00)% | | | | Quarterly | | | | BZWS | | | | 12/20/23 | | | | 8,415,000 | | | | 1,012,743 | | | | 1,070,400 | | | | (57,657) | | | | | |
Nabors Industries Inc. | | | (1.00)% | | | | Quarterly | | | | JPHQ | | | | 6/20/20 | | | | 3,350,000 | | | | (7,043) | | | | 49,628 | | | | (56,671) | | | | | |
Navient Corp. | | | (5.00)% | | | | Quarterly | | | | JPHQ | | | | 3/20/20 | | | | 5,000,000 | | | | (328,083) | | | | (252,861) | | | | (75,222) | | | | | |
PHH Corp. | | | (5.00)% | | | | Quarterly | | | | GSCO | | | | 9/20/19 | | | | 5,400,000 | | | | (257,902) | | | | 8,321 | | | | (266,223) | | | | | |
Sanmina Corp. | | | (5.00)% | | | | Quarterly | | | | BZWS | | | | 6/20/19 | | | | 3,600,000 | | | | (130,604) | | | | (101,893) | | | | (28,711) | | | | | |
Sanmina Corp. | | | (5.00)% | | | | Quarterly | | | | GSCO | | | | 6/20/19 | | | | 7,500,000 | | | | (272,092) | | | | (209,633) | | | | (62,459) | | | | | |
Springleaf Finance Corp. | | | (5.00)% | | | | Quarterly | | | | GSCO | | | | 6/20/20 | | | | 700,000 | | | | (51,079) | | | | (13,837) | | | | (37,242) | | | | | |
Tenet Healthcare Corp. | | | (5.00)% | | | | Quarterly | | | | BZWS | | | | 3/20/19 | | | | 2,325,000 | | | | (55,144) | | | | (21,593) | | | | (33,551) | | | | | |
Tenet Healthcare Corp. | | | (5.00)% | | | | Quarterly | | | | GSCO | | | | 3/20/19 | | | | 7,335,000 | | | | (173,969) | | | | (57,895) | | | | (116,074) | | | | | |
Contracts to Sell Protectionc,d | | | | | | | | | | | | | | | | | | | | | | | | | | | | | |
Single Name | | | | | | | | | | | | | | | | | | | | | | | | | | | | | | | | | | | | |
Capital One Financial Corp. | | | 1.00% | | | | Quarterly | | | | JPHQ | | | | 12/20/22 | | | $ | 5,200,000 | | | $ | 86,986 | | | $ | 74,651 | | | $ | 12,335 | | | | BBB | |
Dish DBS Corp. | | | 5.00% | | | | Quarterly | | | | JPHQ | | | | 6/20/23 | | | | 6,520,000 | | | | (31,503) | | | | (79,999) | | | | 48,496 | | | | B | |
General Electric Co. | | | 1.00% | | | | Quarterly | | | | BZWS | | | | 12/20/23 | | | | 4,000,000 | | | | (82,261) | | | | (16,492) | | | | (65,769) | | | | BBB+ | |
General Electric Co. | | | 1.00% | | | | Quarterly | | | | CITI | | | | 12/20/23 | | | | 8,350,000 | | | | (171,721) | | | | 40,561 | | | | (212,282) | | | | BBB+ | |
General Electric Co. | | | 1.00% | | | | Quarterly | | | | CITI | | | | 12/20/23 | | | | 4,350,000 | | | | (89,459) | | | | (20,953) | | | | (68,506) | | | | BBB+ | |
General Electric Co. | | | 1.00% | | | | Quarterly | | | | JPHQ | | | | 12/20/23 | | | | 1,950,000 | | | | (37,422) | | | | (39,697) | | | | 2,275 | | | | BBB+ | |
| | | | |
| | | |
118 | | Annual Report | | franklintempleton.com |
FRANKLIN INVESTORS SECURITIES TRUST
CONSOLIDATED STATEMENT OF INVESTMENTS
Franklin Total Return Fund (continued)
| | | | | | | | | | | | | | | | | | | | | | | | | | | | | | | | | | | | |
| Credit Default Swap Contracts (continued) | | | | | | | | | | | | | |
| | | | | | | | | |
| Description | | Periodic
Payment Rate
Received
(Paid) | | | Payment
Frequency | | | Counter-
party | | | Maturity
Date | | | Notional
Amounta | | | Value | | | Unamortized
Upfront
Payments
(Receipts) | | | Unrealized
Appreciation
(Depreciation) | | | Ratingb | |
OTC Swap Contracts (continued) | | | | | | | | | | | | | | | | | | | | | | | | | | | | | |
Contracts to Sell Protectionc,d (continued) | | | | | | | | | | | | | | | | | | | | | | | | | |
Single Name (continued) | | | | | | | | | | | | | | | | | | | | | | | | | | | | | | | | | |
Goldman Sachs | | | | | | | | | | | | | | | | | | | | | | | | | | | | | | | | | | | | |
Group Inc. | | | 1.00% | | | | Quarterly | | | | BZWS | | | | 12/20/22 | | | $ | 7,850,000 | | | $ | 127,576 | | | $ | 122,972 | | | $ | 4,604 | | | | BBB+ | |
Goldman Sachs Group Inc. | | | 1.00% | | | | Quarterly | | | | JPHQ | | | | 12/20/22 | | | | 6,150,000 | | | | 99,948 | | | | 95,016 | | | | 4,932 | | | | BBB+ | |
Government of Argentina | | | 5.00% | | | | Quarterly | | | | BZWS | | | | 6/20/23 | | | | 2,150,000 | | | | (70,419 | ) | | | 43,817 | | | | (114,236 | ) | | | B+ | |
Government of Argentina | | | 5.00% | | | | Quarterly | | | | CITI | | | | 6/20/23 | | | | 4,200,000 | | | | (137,563 | ) | | | (100,453 | ) | | | (37,110 | ) | | | B+ | |
Government of Argentina | | | 5.00% | | | | Quarterly | | | | CITI | | | | 12/20/23 | | | | 4,200,000 | | | | (160,163 | ) | | | (244,374 | ) | | | 84,211 | | | | B+ | |
Government of Colombia | | | 1.00% | | | | Quarterly | | | | JPHQ | | | | 12/20/23 | | | | 24,300,000 | | | | (292,346 | ) | | | (171,380 | ) | | | (120,966 | ) | | | BBB- | |
Government of Indonesia | | | 1.00% | | | | Quarterly | | | | CITI | | | | 12/20/23 | | | | 22,650,000 | | | | (562,181 | ) | | | (503,424 | ) | | | (58,757 | ) | | | BBB- | |
Government of Italy | | | 1.00% | | | | Quarterly | | | | BZWS | | | | 6/20/23 | | | | 10,600,000 | | | | (669,574 | ) | | | (469,467 | ) | | | (200,107 | ) | | | NR | |
Government of Italy | | | 1.00% | | | | Quarterly | | | | JPHQ | | | | 12/20/23 | | | | 6,000,000 | | | | (428,596 | ) | | | (427,673 | ) | | | (923 | ) | | | NR | |
Government of Mexico | | | 1.00% | | | | Quarterly | | | | CITI | | | | 12/20/23 | | | | 21,400,000 | | | | (412,313 | ) | | | (173,554 | ) | | | (238,759 | ) | | | BBB+ | |
Morgan Stanley | | | 1.00% | | | | Quarterly | | | | BZWS | | | | 12/20/22 | | | | 8,800,000 | | | | 167,274 | | | | 154,059 | | | | 13,215 | | | | BBB+ | |
Nabors Industries Inc | | | 1.00% | | | | Quarterly | | | | JPHQ | | | | 6/20/22 | | | | 3,350,000 | | | | (203,730 | ) | | | (318,877 | ) | | | 115,147 | | | | BB | |
Prudential Financial Inc . | | | 1.00% | | | | Quarterly | | | | BOFA | | | | 12/20/21 | | | | 8,800,000 | | | | 177,391 | | | | (81,678 | ) | | | 259,069 | | | | A | |
Traded Index | | | | | | | | | | | | | | | | | | | | | | | | | | | | | | | | | | | | |
eBNP Paribas Bespoke Bordeaux Index, Mezzanine Tranche 5-7% | | | 2.00% | | | | Quarterly | | | | BNDP | | | | 12/20/20 | | | | 5,300,000 | | | | (53,056 | ) | | | — | | | | (53,056 | ) | | | Non- | |
| | | | | | | | | | | | | | | | | | | | | | | | | | | | | | | | | | | Investment | |
| | | | | | | | | | | | | | | | | | | | | | | | | | | | | | | | | | | Grade | |
eBNP Paribas Bespoke Bordeaux Index, Mezzanine Tranche 7-10% | | | 2.10% | | | | Quarterly | | | | BNDP | | | | 6/20/20 | | | | 5,150,000 | | | | 4,167 | | | | — | | | | 4,167 | | | | Non- | |
| | | | | | | | | | | | | | | | | | | | | | | | | | | | | | | | | | | Investment | |
| | | | | | | | | | | | | | | | | | | | | | | | | | | | | | | | | | | Grade | |
eCitibank Bespoke Broker Index, Mezzanine Tranche 3-7% | | | 1.30% | | | | Quarterly | | | | CITI | | | | 6/20/19 | | | | 11,100,000 | | | | 23,658 | | | | — | | | | 23,658 | | | | Non- | |
| | | | | | | | | | | | | | | | | | | | | | | | | | | | | | | | | | | Investment | |
| | | | | | | | | | | | | | | | | | | | | | | | | | | | | | | | | | | Grade | |
eCitibank Bespoke Broker Index, Mezzanine Tranche 3-7% | | | 1.40% | | | | Quarterly | | | | CITI | | | | 6/20/19 | | | | 9,100,000 | | | | 26,186 | | | | — | | | | 26,186 | | | | Non- | |
| | | | | | | | | | | | | | | | | | | | | | | | | | | | | | | | | | | Investment | |
| | | | | | | | | | | | | | | | | | | | | | | | | | | | | | | | | | | Grade | |
eCitibank Bespoke Cambridge Index, Equity Tranche 0-3% | | | 0.00% | | | | Quarterly | | | | CITI | | | | 12/20/19 | | | | 10,400,000 | | | | (1,818,536 | ) | | | (967,904 | ) | | | (850,632 | ) | | | Non- | |
| | | | | | | | | | | | | | | | | | | | | | | | | | | | | | | | | | | Investment | |
| | | | | | | | | | | | | | | | | | | | | | | | | | | | | | | | | | | Grade | |
| | | | |
| | | |
franklintempleton.com | | Annual Report | | 119 |
FRANKLIN INVESTORS SECURITIES TRUST
CONSOLIDATED STATEMENT OF INVESTMENTS
Franklin Total Return Fund (continued)
Credit Default Swap Contracts (continued)
| | | | | | | | | | | | | | | | | | | | | | | | | | | | | | | | | | | | |
| Description | | Periodic
Payment Rate
Received
(Paid) | | | Payment
Frequency | | | Counter-
party | | | Maturity
Date | | | Notional
Amounta | | | Value | | | Unamortized
Upfront
Payments
(Receipts) | | | Unrealized
Appreciation
(Depreciation) | | | Ratingb | |
OTC Swap Contracts (continued) | | | | | | | | | | | | | | | | | | | | | | | | | | | | | |
Contracts to Sell Protectionc,d (continued) | | | | | | | | | | | | | | | | | | | | | | | | | |
Traded Index (continued) | | | | | | | | | | | | | | | | | | | | | | | | | |
eCitibank Bespoke Hong Kong Index, Mezzanine Tranche 3-5% | | | 1.00% | | | | Quarterly | | | | CITI | | | | 12/20/18 | | | $ | 13,100,000 | | | $ | 17,208 | | | $ | (38,409 | ) | | $ | 55,617 | | | | Non- | |
| | | | | | | | | | | | | | | | | | | | | | | | | | | | | | | | | | | Investment | |
| | | | | | | | | | | | | | | | | | | | | | | | | | | | | | | | | | | Grade | |
eCitibank Bespoke Lima Index, Mezzanine Tranche 5-7% | | | 2.13% | | | | Quarterly | | | | CITI | | | | 12/20/19 | | | | 10,500,000 | | | | 61,625 | | | | — | | | | 61,625 | | | | Non- | |
| | | | | | | | | | | | | | | | | | | | | | | | | | | | | | | | | | | Investment | |
| | | | | | | | | | | | | | | | | | | | | | | | | | | | | | | | | | | Grade | |
eCitibank Bespoke Lisbon Index, Equity Tranche 0-3% | | | 0.00% | | | | Quarterly | | | | CITI | | | | 6/20/19 | | | | 3,600,000 | | | | (229,787 | ) | | | (270,713 | ) | | | 40,926 | | | | Non- | |
| | | | | | | | | | | | | | | | | | | | | | | | | | | | | | | | | | | Investment | |
| | | | | | | | | | | | | | | | | | | | | | | | | | | | | | | | | | | Grade | |
eCitibank Bespoke Verona Index, Equity Tranche 0-3% | | | 0.00% | | | | Quarterly | | | | CITI | | | | 12/20/19 | | | | 7,500,000 | | | | (1,099,682 | ) | | | (856,812 | ) | | | (242,870 | ) | | | Non- | |
| | | | | | | | | | | | | | | | | | | | | | | | | | | | | | | | | | | Investment | |
| | | | | | | | | | | | | | | | | | | | | | | | | | | | | | | | | | | Grade | |
eCitibank Bespoke Verona Index, Mezzanine Tranche 7-15% | | | 0.40% | | | | Quarterly | | | | CITI | | | | 12/20/19 | | | | 21,000,000 | | | | 61,846 | | | | — | | | | 61,846 | | | | Non- | |
| | | | | | | | | | | | | | | | | | | | | | | | | | | | | | | | | | | Investment | |
| | | | | | | | | | | | | | | | | | | | | | | | | | | | | | | | | | | Grade | |
MCDX.NA.30 | | | 1.00% | | | | Quarterly | | | | CITI | | | | 6/20/23 | | | | 2,325,000 | | | | 58,241 | | | | 50,454 | | | | 7,787 | | | | Investment | |
| | | | | |
Total OTC Swap Contracts | | | | | | | $ | (10,362,064 | ) | | $ | (7,165,113 | ) | | $ | (3,196,951 | ) | | | Grade | |
| | | | | |
Total Credit Default Swap Contracts | | | | | | | $ | (11,074,382 | ) | | $ | (7,856,751 | ) | | $ | (3,217,631 | ) | | | | |
aIn U.S. dollars unless otherwise indicated. For contracts to sell protection, the notional amount is equal to the maximum potential amount of the future payments and no recourse provisions have been entered into in association with the contracts.
bBased on Standard and Poor’s (S&P) Rating for single name swaps. Internal ratings based on mapping into equivalent ratings from external vendors.
cPerformance triggers for settlement of contract include default, bankruptcy or restructuring for single name swaps, and failure to pay or bankruptcy of the underlying securities for traded index swaps.
dThe fund enters contracts to sell protection to create a long credit position.
eRepresents a custom index comprised of a basket of underlying instruments.
| | | | |
| | | |
120 | | Annual Report | | franklintempleton.com |
FRANKLIN INVESTORS SECURITIES TRUST
CONSOLIDATED STATEMENT OF INVESTMENTS
Franklin Total Return Fund (continued)
At October 31, 2018, the Fund had the following cross-currency swap contracts outstanding. See Note 1(e).
Cross-Currency Swap Contracts
| | | | | | | | | | | | | | | | | | | | | | | | |
| Description | | Payment
Frequency | | | Counter-
party | | | Maturity
Date | | | Notional
Amount | | | | | | Value/
Unrealized
Appreciation
(Depreciation) | |
OTC Swap Contracts | | | | | | | | | | | | | | | | | | | | | | | | |
Receive Floating 3-month USD LIBOR + 2.870% | | | Quarterly | | | | | | | | | | | | 3,137,400 | | | | USD | | | | | |
Pay Fixed 2.50% | | | Annual | | | | CITI | | | | 5/04/21 | | | | 2,700,000 | | | | EUR | | | | $ 94,227 | |
Receive Floating 3-month USD LIBOR + 1.44% | | | Quarterly | | | | | | | | | | | | 1,428,000 | | | | USD | | | | | |
Pay Fixed 1.50% | | | Annual | | | | HSBK | | | | 11/26/25 | | | | 1,200,000 | | | | EUR | | | | 82,955 | |
Receive Floating 3-month USD LIBOR + 1.395% | | | Quarterly | | | | | | | | | | | | 10,277,000 | | | | USD | | | | | |
Pay Fixed 1.50% | | | Annual | | | | HSBK | | | | 11/26/25 | | | | 8,600,000 | | | | EUR | | | | 610,309 | |
Receive Floating 3-month USD LIBOR + 1.415% | | | Quarterly | | | | | | | | | | | | 12,209,400 | | | | USD | | | | | |
Pay Fixed 1.50% | | | Annual | | | | HSBK | | | | 11/26/25 | | | | 10,200,000 | | | | EUR | | | | 746,528 | |
| | | | | | | | | | | | | | | | | | | | | | | | |
| | | | | | |
Total Cross Currency Swap Contracts | | | | | | | | | | | | | | | | | | | | | | | $1,534,019 | |
| | | | | | | | | | | | | | | | | | | | | | | | |
At October 31, 2018, the Fund had the following inflation index swap contracts outstanding. See Note 1(e).
Inflation Index Swap Contracts
| | | | | | | | | | | | | | | | | | | | |
| Description | | Payment
Frequency | | | Counterparty | | | Maturity
Date | | | Notional
Amount | | | Value/
Unrealized
Appreciaton
(Depreciation) | |
Centrally Cleared Swap Contracts | | | | | | | | | | | | | | | | | | | | |
Receive variable change in USA-CPI-U | | | At maturity | | | | | | | | | | | | | | | | | |
Pay Fixed 1.96% | | | At maturity | | | | | | | | 8/31/24 | | | $ | 24,600,000 | | | | $ 515,278 | |
| | | | | |
OTC Swap Contracts | | | | | | | | | | | | | | | | | | | | |
Receive variable change in USA-CPI-U | | | At maturity | | | | | | | | | | | | | | | | | |
Pay Fixed 1.782% | | | At maturity | | | | JPHQ | | | | 5/27/24 | | | | 35,700,000 | | | | 1,304,925 | |
| | | | | | | | | | | | | | | | | | | | |
| | | | | |
Total Inflation Index Swap Contracts | | | | | | | | | | | | | | | | | | | $1,820,203 | |
| | | | | | | | | | | | | | | | | | | | |
At October 31, 2018, the Fund had the following total return swap contracts outstanding. See Note 1(e).
Total Return Swap Contracts
| | | | | | | | | | | | | | | | | | | | | | | | |
| Underlying Instruments | | Financing Rate | | | Payment
Frequency | | | Counterparty | | | Maturity
Date | | | Notional
Value | | | Value/
Unrealized
Appreciation
(Depreciation) | |
OTC Swap Contracts | | | | | | | | | | | | | | | | | | | | | | | | |
Longa | | | | | | | | | | | | | | | | | | | | | | | | |
iBoxx USD Liquid High Yield Index | | | 3-month USD LIBOR | | | | Quarterly | | | | BNDP | | | | 3/20/19 | | | $ | 5,000,000 | | | $ | (38,172 | ) |
iBoxx USD Liquid High Yield Index | | | 3-month USD LIBOR | | | | Quarterly | | | | FBCO | | | | 3/20/19 | | | | 11,700,000 | | | | (105,234 | ) |
iBoxx USD Liquid High Yield Index | | | 3-month USD LIBOR | | | | Quarterly | | | | BOFA | | | | 6/20/19 | | | | 40,000,000 | | | | (135,175 | ) |
iBoxx USD Liquid High Yield Index | | | 3-month USD LIBOR | | | | Quarterly | | | | CITI | | | | 6/20/19 | | | | 28,000,000 | | | | (154,488 | ) |
Markit iBoxx USD Liquid Leveraged Loan Index | | | 3-month USD LIBOR | | | | Quarterly | | | | CITI | | | | 6/20/19 | | | | 36,200,000 | | | | (238,233 | ) |
Markit iBoxx USD Liquid Leveraged Loan Index | | | 3-month USD LIBOR | | | | Quarterly | | | | GSCO | | | | 6/20/19 | | | | 38,000,000 | | | | (172,524 | ) |
| | | | |
| | | |
franklintempleton.com | | Annual Report | | 121 |
FRANKLIN INVESTORS SECURITIES TRUST
CONSOLIDATED STATEMENT OF INVESTMENTS
Franklin Total Return Fund (continued)
Total Return Swap Contracts (continued)
| | | | | | | | | | | | | | | | | | | | | | | | |
| Underlying Instruments | | Financing Rate | | | Payment
Frequency | | | Counterparty | | | Maturity
Date | | | Notional
Value | | | Value/
Unrealized
Appreciation
(Depreciation) | |
OTC Swap Contracts (continued) | | | | | | | | | | | | | | | | | | | | | | | | |
Longa (continued) | | | | | | | | | | | | | | | | | | | | | | | | |
Markit iBoxx USD Liquid Leveraged Loan Index | | | 3-month USD LIBOR | | | | Quarterly | | | | CITI | | | | 9/20/19 | | | $ | 42,650,000 | | | $ | (446,963 | ) |
| | | | | | | | | | | | | | | | | | | | | | | | |
Total Return Swap Contracts | | | | | | | | | | | | | | | | | | | | | | $ | (1,290,789 | ) |
| | | | | | | | | | | | | | | | | | | | | | | | |
aThe Fund receives the total return on the underlying instrument and pays a variable financing rate.
See Note 9 regarding other derivative information.
See Abbreviations on page 158.
| | | | |
| | | |
122 | | Annual Report | The accompanying notes are an integral part of these financial statements. | | franklintempleton.com |
FRANKLIN INVESTORS SECURITIES TRUST
Financial Statements
Statements of Assets and Liabilities
October 31, 2018
| | | | | | | | | | | | | | | | |
| | | Franklin
Adjustable
U.S. Government
Securities Fund | | | Franklin Floating Rate
Daily Access
Fund | | | Franklin Low Duration Total Return Fund | | | Franklin Total Return Funda | |
Assets: | | | | | | | | | | | | | | | | |
Investments in securities: | | | | | | | | | | | | | | | | |
Cost - Unaffiliated issuers | | | $773,029,163 | | | $ | 3,224,324,731 | | | $ | 2,804,709,369 | | | $ | 4,264,411,674 | |
Cost - Controlled affiliates (Note 3f and 10) | | | — | | | | — | | | | — | | | | 9,635,000 | |
Cost - Non-controlled affiliates (Note 3f and 10) | | | 18,732,898 | | | | 494,720,480 | | | | 99,508,985 | | | | 174,665,741 | |
Cost - Unaffiliated repurchase agreements | | | — | | | | 101,755,855 | | | | — | | | | — | |
Value - Unaffiliated issuers | | | $770,242,322 | | | $ | 3,234,651,641 | | | $ | 2,774,818,132 | | | $ | 4,149,419,477 | |
Value - Controlled affiliates (Note 3f and 10) | | | — | | | | — | | | | — | | | | 9,218,000 | |
Value - Non-controlled affiliates (Note 3f and 10) | | | 18,732,898 | | | | 432,474,885 | | | | 98,639,661 | | | | 173,237,878 | |
Value - Unaffiliated repurchase agreements | | | — | | | | 101,755,855 | | | | — | | | | — | |
Cash | | | — | | | | 4,586,363 | | | | 5,426,526 | | | | 5,489,884 | |
Foreign currency, at value (cost $—, $—, $96,943 and $747,188, respectively) | | | — | | | | — | | | | 96,943 | | | | 747,188 | |
Receivables: | | | | | | | | | | | | | | | | |
Investment securities sold | | | 3,597,574 | | | | 4,786,468 | | | | 34,203 | | | | 40,365 | |
Capital shares sold | | | 1,487,701 | | | | 6,975,019 | | | | 12,331,615 | | | | 2,892,560 | |
Dividends and interest | | | 2,877,348 | | | | 10,503,035 | | | | 11,940,273 | | | | 24,596,768 | |
Deposits with brokers for: | | | | | | | | | | | | | | | | |
OTC derivative contracts | | | — | | | | — | | | | 4,490,000 | | | | 9,210,000 | |
TBA transactions | | | — | | | | — | | | | — | | | | 713,000 | |
Futures contracts | | | — | | | | — | | | | 748,699 | | | | 6,413,847 | |
Centrally cleared swap contracts | | | — | | | | 1,055,397 | | | | 6,512,125 | | | | 11,039,878 | |
Variation margin on centrally cleared swap contracts | | | — | | | | — | | | | — | | | | 67,199 | |
OTC swap contracts (upfront payments $—, $—, $458,360 and $2,240,582) | | | — | | | | — | | | | 408,070 | | | | 2,001,015 | |
Unrealized appreciation on OTC forward exchange contracts | | | — | | | | — | | | | 1,062,482 | | | | 3,102,352 | |
Unrealized appreciation on OTC swap contracts | | | — | | | | — | | | | 340,414 | | | | 3,793,942 | |
FT Subsidiary deferred tax benefit (Note 1g) | | | — | | | | — | | | | — | | | | 137,519 | |
Other assets | | | 262 | | | | 1,012 | | | | 906 | | | | 2,453 | |
| | | | |
Total assets | | | 796,938,105 | | | | 3,796,789,675 | | | | 2,916,850,049 | | | | 4,402,123,325 | |
Liabilities: | | | | | | | | | | | | | | | | |
Payables: | | | | | | | | | | | | | | | | |
Investment securities purchased | | | — | | | | 111,198,226 | | | | 38,388,078 | | | | 290,014,065 | |
Capital shares redeemed | | | 1,360,316 | | | | 10,323,095 | | | | 6,465,745 | | | | 8,270,259 | |
Management fees | �� | | 332,300 | | | | 1,408,054 | | | | 502,733 | | | | 1,475,156 | |
Distribution fees | | | 171,165 | | | | 540,858 | | | | 391,608 | | | | 747,026 | |
Transfer agent fees | | | 189,137 | | | | 652,798 | | | | 365,611 | | | | 876,062 | |
Distributions to shareholders | | | 128,023 | | | | 3,470,225 | | | | 1,595,605 | | | | 470,503 | |
Variation margin on futures contracts | | | — | | | | — | | | | 129,385 | | | | 1,596,663 | |
Variation margin on centrally cleared swap contracts | | | — | | | | 54,518 | | | | 38,732 | | | | — | |
OTC swap contracts (upfront receipts $—, $—, $6,250,354 and $15,524,275) | | | — | | | | — | | | | 3,633,983 | | | | 9,166,128 | |
Unrealized depreciation on OTC forward exchange contracts | | | — | | | | — | | | | 530,354 | | | | 1,948,063 | |
Unrealized depreciation on OTC swap contracts | | | — | | | | — | | | | 2,597,954 | | | | 5,442,738 | |
Accrued expenses and other liabilities | | | 172,508 | | | | 234,079 | | | | 230,739 | | | | 215,645 | |
| | | | |
| | | |
franklintempleton.com | | The accompanying notes are an integral part of these financial statements. | Annual Report | | 123 |
FRANKLIN INVESTORS SECURITIES TRUST
FINANCIAL STATEMENTS
Statements of Assets and Liabilities (continued)
October 31, 2018
| | | | | | | | | | | | | | | | |
| | | Franklin
Adjustable
U.S. Government
Securities Fund | | | Franklin Floating Rate Daily Access Fund | | | Franklin Low Duration Total Return Fund | | | Franklin Total Return Funda | |
Total liabilities | | $ | 2,353,449 | | | | $ 127,881,853 | | | $ | 54,870,527 | | | $ | 320,222,308 | |
Net assets, at value | | $ | 794,584,656 | | | | $3,668,907,822 | | | $ | 2,861,979,522 | | | $ | 4,081,901,017 | |
Net assets consist of: | | | | | | | | | | | | | | | | |
Paid-in capital | | $ | 937,692,279 | | | | $3,920,681,479 | | | $ | 3,013,316,361 | | | $ | 4,401,121,104 | |
Total distributable earnings (loss) | | | (143,107,623 | ) | | | (251,773,657 | ) | | | (151,336,839 | ) | | | (319,220,087 | ) |
Net assets, at value | | $ | 794,584,656 | | | | $3,668,907,822 | | | $ | 2,861,979,522 | | | $ | 4,081,901,017 | |
| Class A: | | | | | | | | | | | | | | | | |
Net assets, at value | | $ | 419,054,758 | | | | $1,344,472,845 | | | | $1,499,579,055 | | | | $2,763,774,381 | |
Shares outstanding | | | 51,761,788 | | | | 154,475,045 | | | | 156,229,240 | | | | 296,767,705 | |
Net asset value per shareb | | | $8.10 | | | | $8.70 | | | | $9.60 | | | | $9.31 | |
Maximum offering price per share (net asset value per share ÷ 97.75%, 97.75%, 97.75% and 95.75%, respectively) | | | $8.29 | | | | $8.90 | | | | $9.82 | | | | $9.72 | |
| Class A1: | | | | | | | | | | | | | | | | |
Net assets, at value | | $ | 100,477,301 | | | | | | | | | | | | | |
Shares outstanding | | | 12,414,521 | | | | | | | | | | | | | |
Net asset value per shareb | | $ | 8.09 | | | | | | | | | | | | | |
Maximum offering price per share (net asset value per share ÷ 97.75%) | | $ | 8.28 | | | | | | | | | | | | | |
| Class C: | | | | | | | | | | | | | | | | |
Net assets, at value | | $ | 126,585,421 | | | $ | 438,479,656 | | | $ | 130,205,824 | | | $ | 243,067,518 | |
Shares outstanding. | | | 15,646,377 | | | | 50,371,775 | | | | 13,620,794 | | | | 26,289,988 | |
Net asset value and maximum offering price per shareb | | | $8.09 | | | | $8.70 | | | | $9.56 | | | | $9.25 | |
| Class R: | | | | | | | | | | | | | | | | |
Net assets, at value | | | | | | | | | | | | | | $ | 23,619,888 | |
Shares outstanding | | | | | | | | | | | | | | | 2,546,792 | |
Net asset value and maximum offering price per share | | | | | | | | | | | | | | $ | 9.27 | |
| Class R6: | | | | | | | | | | | | | | | | |
Net assets, at value | | $ | 36,026,197 | | | $ | 142,075,487 | | | $ | 1,017,855,608 | | | $ | 430,636,638 | |
Shares outstanding | | | 4,442,377 | | | | 16,318,903 | | | | 105,386,142 | | | | 45,930,073 | |
Net asset value and maximum offering price per share | | | $8.11 | | | | $8.71 | | | | $9.66 | | | | $9.38 | |
| Advisor Class: | | | | | | | | | | | | | | | | |
Net assets, at value | | $ | 112,440,979 | | | $ | 1,743,879,834 | | | $ | 214,339,035 | | | $ | 620,802,592 | |
| | | | |
Shares outstanding | | | 13,874,319 | | | | 200,274,779 | | | | 22,213,248 | | | | 66,269,794 | |
| | | | |
Net asset value and maximum offering price per share | | | $8.10 | | | | $8.71 | | | | $9.65 | | | | $9.37 | |
aConsolidated financial statement. See Note 1(g).
bRedemption price is equal to net asset value less contingent deferred sales charges, if applicable.
| | | | |
| | | |
124 | | Annual Report | The accompanying notes are an integral part of these financial statements. | | franklintempleton.com |
FRANKLIN INVESTORS SECURITIES TRUST
FINANCIAL STATEMENTS
Statements of Operations
for the year ended October 31, 2018
| | | | | | | | | | | | | | | | |
| | | Franklin
Adjustable
U.S. Government
Securities Fund | | | Franklin
Floating Rate
Daily Access
Fund | | | Franklin
Low Duration
Total Return
Fund | | | Franklin
Total Return
Funda | |
Investment income: | | | | | | | | | | | | | | | | |
Dividends: | | | | | | | | | | | | | | | | |
Unaffiliated issuers | | $ | — | | | $ | 238,892 | | | $ | 1,585,463 | | | $ | 1,230,821 | |
Controlled affiliates (Note 3f and 10) | | | — | | | | — | | | | — | | | | 353,025 | |
Non-controlled affiliates (Note 3f and 10) | | | 347,344 | | | | 14,670,189 | | | | 4,264,428 | | | | 5,426,431 | |
Interest: (net of foreign taxes)~ | | | | | | | | | | | | | | | | |
Non-controlled affiliates (Note 10) | | | — | | | | 1,730,358 | | | | — | | | | — | |
Unaffiliated issuers: | | | | | | | | | | | | | | | | |
Paydown gain (loss) | | | (11,213,136 | ) | | | — | | | | (3,038,646 | ) | | | (3,551,299 | ) |
Paid in cash | | | 28,536,642 | | | | 174,009,741 | | | | 82,503,402 | | | | 160,457,073 | |
Other income (net of taxes of $112,444) (Note 1g) | | | — | | | | — | | | | — | | | | 505,209 | |
| | | | |
Total investment income | | | 17,670,850 | | | | 190,649,180 | | | | 85,314,647 | | | | 164,421,260 | |
Expenses: | | | | | | | | | | | | | | | | |
Management fees (Note 3a) | | | 4,390,541 | | | | 17,811,083 | | | | 13,417,611 | | | | 20,499,183 | |
Distribution fees: (Note 3c) | | | | | | | | | | | | | | | | |
Class A | | | 1,103,996 | | | | 3,166,379 | | | | 3,656,134 | | | | 7,323,094 | |
Class A1 | | | 100,395 | | | | — | | | | — | | | | — | |
Class C | | | 1,059,481 | | | | 3,364,694 | | | | 1,012,995 | | | | 2,049,779 | |
Class R | | | — | | | | — | | | | — | | | | 150,823 | |
Transfer agent fees: (Note 3e) | | | | | | | | | | | | | | | | |
Class A | | | 645,850 | | | | 1,292,388 | | | | 2,567,232 | | | | 4,536,915 | |
Class A1 | | | 156,083 | | | | — | | | | — | | | | — | |
Class C | | | 238,382 | | | | 528,164 | | | | 275,218 | | | | 488,394 | |
Class R | | | — | | | | — | | | | — | | | | 46,892 | |
Class R6 | | | 16,291 | | | | 36,573 | | | | 198,909 | | | | 122,453 | |
Advisor Class | | | 203,292 | | | | 1,681,704 | | | | 376,779 | | | | 981,209 | |
Custodian fees (Note 4) | | | 7,935 | | | | 27,644 | | | | 33,315 | | | | 104,280 | |
Reports to shareholders | | | 111,003 | | | | 225,755 | | | | 260,029 | | | | 597,038 | |
Registration and filing fees | | | 103,747 | | | | 128,660 | | | | 172,337 | | | | 197,654 | |
Professional fees | | | 63,474 | | | | 115,043 | | | | 127,370 | | | | 190,066 | |
Trustees’ fees and expenses | | | 11,027 | | | | 43,407 | | | | 26,895 | | | | 53,266 | |
Loan service fees (Note 1j) | | | — | | | | — | | | | 4,274 | | | | — | |
Other | | | 217,327 | | | | 87,710 | | | | 256,580 | | | | 472,956 | |
| | | | |
Total expenses | | | 8,428,824 | | | | 28,509,204 | | | | 22,385,678 | | | | 37,814,002 | |
Expense reductions (Note 4) | | | (37 | ) | | | (23,118 | ) | | | (24,095 | ) | | | (51,513 | ) |
Expenses waived/paid by affiliates (Note 3f and 3g) | | | (102,279 | ) | | | (2,009,719 | ) | | | (6,387,126 | ) | | | (1,504,628 | ) |
| | | | |
Net expenses | | | 8,326,508 | | | | 26,476,367 | | | | 15,974,457 | | | | 36,257,861 | |
| | | | |
Net investment income | | | 9,344,342 | | | | 164,172,813 | | | | 69,340,190 | | | | 128,163,399 | |
Realized and unrealized gains (losses): | | | | | | | | | | | | | | | | |
Net realized gain (loss) from: | | | | | | | | | | | | | | | | |
Investments: | | | | | | | | | | | | | | | | |
Unaffiliated issuers | | | (7,313 | ) | | | (36,351,865 | ) | | | (15,820,851 | ) | | | (75,407,439 | ) |
Foreign currency transactions | | | — | | | | 79 | | | | 157,553 | | | | (931,695 | ) |
Forward exchange contracts | | | — | | | | — | | | | (840,981 | ) | | | (3,017,344 | ) |
Futures contracts | | | — | | | | — | | | | (5,926,753 | ) | | | (22,319,051 | ) |
TBA sale commitments | | | — | | | | — | | | | — | | | | 256,598 | |
Swap contracts | | | — | | | | (1,599,940 | ) | | | 339,099 | | | | 1,165,893 | |
Capital gain distributions from management investment companies: | | | | | | | | | | | | | | | | |
Non-controlled affiliates (Note 3f) | | | — | | | | 1,510,184 | | | | 523,977 | | | | 374,711 | |
| | | | |
| | | |
franklintempleton.com | | The accompanying notes are an integral part of these financial statements. | Annual Report | | 125 |
FRANKLIN INVESTORS SECURITIES TRUST
FINANCIAL STATEMENTS
Statements of Operations (continued)
for the year ended October 31, 2018
| | | | | | | | | | | | | | | | |
| | | Franklin
Adjustable
U.S. Government
Securities Fund | | | Franklin
Floating Rate
Daily Access
Fund | | | Franklin
Low Duration
Total Return
Fund | | | Franklin
Total Return
Funda | |
Capital gain distribution received in FT Subsidiary (net of taxes of $1,980,057) (Note 1g) | | $ | — | | | $ | — | | | $ | — | | | $ | 4,678,986 | |
| | | | |
Net realized gain (loss) | | | (7,313 | ) | | | (36,441,542 | ) | | | (21,567,956 | ) | | | (95,199,341 | ) |
Net change in unrealized appreciation (depreciation) on: | | | | | | | | | | | | | | | | |
Investments: | | | | | | | | | | | | | | | | |
Unaffiliated issuers | | | (4,194,916 | ) | | | 43,982,814 | | | | (27,855,934 | ) | | | (131,897,603 | ) |
Controlled affiliates (Note 3f and 10) | | | — | | | | — | | | | — | | | | (694,000 | ) |
Non-controlled affiliates (Note 3f and 10) | | | — | | | | (61,646,070 | ) | | | (2,613,124 | ) | | | (2,590,266 | ) |
Translation of other assets and liabilities denominated in foreign currencies | | | — | | | | — | | | | 13,356 | | | | 27,170 | |
Forward exchange contracts | | | — | | | | — | | | | (206,490 | ) | | | (2,259,058 | ) |
Futures contracts | | | — | | | | — | | | | 863,806 | | | | (3,318,505 | ) |
Swap contracts | | | — | | | | 405,854 | | | | 190,378 | | | | (1,300,615 | ) |
Change in FT Subsidiary deferred tax benefit (Note 1g) | | | — | | | | — | | | | — | | | | 137,519 | |
| | | | |
Net change in unrealized appreciation (depreciation) | | | (4,194,916 | ) | | | (17,257,402 | ) | | | (29,608,008 | ) | | | (141,895,358 | ) |
| | | | |
Net realized and unrealized gain (loss) | | | (4,202,229 | ) | | | (53,698,944 | ) | | | (51,175,964 | ) | | | (237,094,699 | ) |
| | | | |
Net increase (decrease) in net assets resulting from operations | | | $5,142,113 | | | $ | 110,473,869 | | | $ | 18,164,226 | | | $ | (108,931,300 | ) |
| | | | |
~Foreign taxes withheld on interest | | $ | — | | | $ | — | | | $ | 1,789 | | | $ | 1,342 | |
aConsolidated financial statement. See Note 1(g).
| | | | |
| | | |
126 | | Annual Report | The accompanying notes are an integral part of these financial statements. | | franklintempleton.com |
FRANKLIN INVESTORS SECURITIES TRUST
FINANCIAL STATEMENTS
Statements of Changes in Net Assets
| | | | | | | | | | | | | | | | |
| | | Franklin Adjustable U.S. Government Securities Fund | | | Franklin Floating Rate Daily Access Fund | |
| | | Year Ended October 31, | | | Year Ended October 31, | |
| | | 2018 | | | 2017 | | | 2018 | | | 2017 | |
Increase (decrease) in net assets: | | | | | | | | | | | | | | | | |
Operations: | | | | | | | | | | | | | | | | |
Net investment income | | $ | 9,344,342 | | | $ | 6,086,122 | | | $ | 164,172,813 | | | $ | 128,801,212 | |
Net realized gain (loss) | | | (7,313 | ) | | | 96,773 | | | | (36,441,542 | ) | | | (27,985,552 | ) |
Net change in unrealized appreciation (depreciation) | | | (4,194,916 | ) | | | (7,106,295 | ) | | | (17,257,402 | ) | | | 20,553,230 | |
| | | | |
Net increase (decrease) in net assets resulting from operations | | | 5,142,113 | | | | (923,400 | ) | | | 110,473,869 | | | | 121,368,890 | |
Distributions to shareholders: (Note 1l) | | | | | | | | | | | | | | | | |
Class A | | | (10,399,916 | ) | | | (10,816,412 | ) | | | (57,420,220 | ) | | | (49,009,035 | ) |
Class A1 | | | (2,680,182 | ) | | | (2,796,558 | ) | | | — | | | | — | |
Class C | | | (3,179,693 | ) | | | (3,300,858 | ) | | | (21,410,984 | ) | | | (17,722,222 | ) |
Class R6 | | | (749,735 | ) | | | (52,994 | ) | | | (6,632,500 | ) | | | (2,953,451 | ) |
Advisor Class | | | (3,615,201 | ) | | | (4,370,331 | ) | | | (78,812,669 | ) | | | (58,557,532 | ) |
| | | | |
Total distributions to shareholders | | | (20,624,727 | ) | | | (21,337,153 | ) | | | (164,276,373 | ) | | | (128,242,240 | ) |
Capital share transactions: (Note 2) | | | | | | | | | | | | | | | | |
Class A | | | (65,465,520 | ) | | | (164,170,469 | ) | | | 1,323,344 | | | | 3,631,210 | |
Class A1 | | | (18,641,058 | ) | | | (36,788,901 | ) | | | — | | | | — | |
Class C | | | (60,178,017 | ) | | | (72,203,722 | ) | | | (104,757,060 | ) | | | (257,800 | ) |
Class R6 | | | 34,338,586 | | | | (132,241 | ) | | | 13,923,525 | | | | 118,459,347 | |
Advisor Class | | | (69,446,005 | ) | | | (39,282,849 | ) | | | 96,300,188 | | | | 568,347,099 | |
| | | | |
Total capital share transactions | | | (179,392,014 | ) | | | (312,578,182 | ) | | | 6,789,997 | | | | 690,179,856 | |
Net increase (decrease) in net assets | | | (194,874,628 | ) | | | (334,838,735 | ) | | | (47,012,507 | ) | | | 683,306,506 | |
Net assets: | | | | | | | | | | | | | | | | |
Beginning of year | | | 989,459,284 | | | | 1,324,298,019 | | | | 3,715,920,329 | | | | 3,032,613,823 | |
| | | | |
End of year (Note 1l) | | $ | 794,584,656 | | | $ | 989,459,284 | | | $ | 3,668,907,822 | | | $ | 3,715,920,329 | |
| | | | | | |
| | | |
| franklintempleton.com | | The accompanying notes are an integral part of these financial statements. | Annual Report | | | 127 | |
FRANKLIN INVESTORS SECURITIES TRUST
FINANCIAL STATEMENTS
Statements of Changes in Net Assets (continued)
| | | | | | | | | | | | | | | | |
| | | Franklin Low Duration Total Return Fund | | | Franklin Total Return Funda | |
| | | Year Ended October 31, | | | Year Ended October 31, | |
| | | 2018 | | | 2017 | | | 2018 | | | 2017 | |
Increase (decrease) in net assets: | | | | | | | | | | | | | | | | |
Operations: | | | | | | | | | | | | | | | | |
Net investment income | | $ | 69,340,190 | | | $ | 46,895,267 | | | $ | 128,163,399 | | | $ | 120,030,375 | |
Net realized gain (loss) | | | (21,567,956 | ) | | | (1,156,974 | ) | | | (95,199,341 | ) | | | (48,258,255 | ) |
Net change in unrealized appreciation (depreciation) | | | (29,608,008 | ) | | | (6,135,070 | ) | | | (141,895,358 | ) | | | (10,230,159 | ) |
| | | | |
Net increase (decrease) in net assets resulting from operations | | | 18,164,226 | | | | 39,603,223 | | | | (108,931,300 | ) | | | 61,541,961 | |
Distributions to shareholders: (Note 1l) | | | | | | | | | | | | | | | | |
Class A | | | (44,054,661 | ) | | | (29,407,853 | ) | | | (84,620,684 | ) | | | (79,166,327 | ) |
Class C | | | (4,116,896 | ) | | | (3,436,954 | ) | | | (8,070,593 | ) | | | (8,606,867 | ) |
Class R | | | — | | | | — | | | | (821,725 | ) | | | (1,159,298 | ) |
Class R6 | | | (29,893,839 | ) | | | (12,604,268 | ) | | | (13,679,438 | ) | | | (2,523,966 | ) |
Advisor Class | | | (7,005,174 | ) | | | (7,048,480 | ) | | | (19,582,562 | ) | | | (20,532,154 | ) |
| | | | |
Distributions from tax return of capital: | | | | | | | | | | | | | | | | |
Class A | | | — | | | | — | | | | (1,864,025 | ) | | | — | |
Class C | | | — | | | | — | | | | (173,121 | ) | | | — | |
Class R | | | — | | | | — | | | | (17,375 | ) | | | — | |
Class R6 | | | — | | | | — | | | | (312,827 | ) | | | — | |
Advisor Class | | | — | | | | — | | | | (438,993 | ) | | | — | |
| | | | |
Total distributions to shareholders | | | (85,070,570 | ) | | | (52,497,555 | ) | | | (129,581,343 | ) | | | (111,988,612 | ) |
Capital share transactions: (Note 2) | | | | | | | | | | | | | | | | |
Class A | | | 16,141,095 | | | | 3,455,292 | | | | (228,420,356 | ) | | | (430,205,619 | ) |
Class C | | | (40,573,740 | ) | | | (42,037,863 | ) | | | (93,634,238 | ) | | | (89,548,811 | ) |
Class R | | | — | | | | — | | | | (11,028,558 | ) | | | (21,629,393 | ) |
Class R6 | | | 447,306,561 | | | | 40,905,255 | | | | 55,069,872 | | | | 304,494,859 | |
Advisor Class | | | (209,104,674 | ) | | | 205,066,211 | | | | 60,100,000 | | | | (139,300,499 | ) |
| | | | |
Total capital share transactions | | | 213,769,242 | | | | 207,388,895 | | | | (217,913,280 | ) | | | (376,189,463 | ) |
Net increase (decrease) in net assets | | | 146,862,898 | | | | 194,494,563 | | | | (456,425,923 | ) | | | (426,636,114 | ) |
Net assets: | | | | | | | | | | | | | | | | |
Beginning of year | | | 2,715,116,624 | | | | 2,520,622,061 | | | | 4,538,326,940 | | | | 4,964,963,054 | |
| | | | |
End of year (Note 1l) | | $ | 2,861,979,522 | | | $ | 2,715,116,624 | | | $ | 4,081,901,017 | | | $ | 4,538,326,940 | |
aConsolidated financial statement. See Note 1(g).
| | | | | | |
| | | |
| 128 | | Annual Report | The accompanying notes are an integral part of these financial statements. | | | franklintempleton.com | |
FRANKLIN INVESTORS SECURITIES TRUST
Notes to Financial Statements
1. Organization and Significant Accounting Policies
Franklin Investors Securities Trust (Trust) is registered under the Investment Company Act of 1940 (1940 Act) as an open-end management investment company, consisting of eight separate funds, four of which are included in this report (Funds) and applies the specialized accounting and reporting guidance in U.S. Generally Accepted Accounting Principles (U.S. GAAP). The classes of shares offered within each of the Funds are indicated below. Beginning on October 19, 2018, Class C shares automatically convert to Class A shares after they have been held for 10 years. Each class of shares may differ by its initial sales load, contingent deferred sales charges, voting rights on matters affecting a single class, its exchange privilege and fees due to differing arrangements for distribution and transfer agent fees.
|
| Class A, Class A1, Class C, Class R6 & Advisor Class |
Franklin Adjustable U.S. Government Securities Fund |
|
| Class A, Class C, Class R6 & Advisor Class |
Franklin Floating Rate Daily Access Fund Franklin Low Duration Total Return Fund |
|
| Class A, Class C, Class R, Class R6 & Advisor Class |
Franklin Total Return Fund |
The following summarizes the Funds’ significant accounting policies.
a. Financial Instrument Valuation
The Funds’ investments in financial instruments are carried at fair value daily. Fair value is the price that would be received to sell an asset or paid to transfer a liability in an orderly transaction between market participants on the measurement date. The Funds calculate the net asset value (NAV) per share each business day as of 4 p.m. Eastern time or the regularly scheduled close of the New York Stock Exchange (NYSE), whichever is earlier. Under compliance policies and procedures approved by the Trust’s Board of Trustees (the Board), the Funds’ administrator has responsibility for oversight of valuation, including leading the cross-functional Valuation Committee (VC). The VC provides administration and oversight of the Funds’ valuation policies and procedures, which are approved annually by the Board. Among other things, these procedures allow the Funds to utilize independent pricing services, quotations from securities and financial instrument dealers, and other market sources to determine fair value.
Equity securities, exchange traded funds and derivative financial instruments listed on an exchange or on the NASDAQ National Market System are valued at the last quoted sale price or the official closing price of the day, respectively. Foreign equity securities are valued as of the close of trading on the foreign stock exchange on which the security is primarily traded, or as of 4 p.m. Eastern time. The value is then converted into its U.S. dollar equivalent at the foreign exchange rate in effect at 4 p.m. Eastern time on the day that the value of the security is determined. Over-the-counter (OTC) securities are valued within the range of the most recent quoted bid and ask prices. Securities that trade in multiple markets or on multiple exchanges are valued according to the broadest and most representative market. Certain equity securities are valued based upon fundamental characteristics or relationships to similar securities.
Debt securities generally trade in the OTC market rather than on a securities exchange. The Funds’ pricing services use multiple valuation techniques to determine fair value. In instances where sufficient market activity exists, the pricing services may utilize a market-based approach through which quotes from market makers are used to determine fair value. In instances where sufficient market activity may not exist or is limited, the pricing services also utilize proprietary valuation models which may consider market characteristics such as benchmark yield curves, credit spreads, estimated default rates, anticipated market interest rate volatility, coupon rates, anticipated timing of principal repayments, underlying collateral, and other unique security features in order to estimate the relevant cash flows, which are then discounted to calculate the fair value. Securities denominated in a foreign currency are converted into their U.S. dollar equivalent at the foreign exchange rate in effect at 4 p.m. Eastern time on the date that the values of the foreign debt securities are determined.
Investments in open-end mutual funds are valued at the closing NAV. Investments in repurchase agreements are valued at cost, which approximates fair value.
Certain derivative financial instruments are centrally cleared or trade in the OTC market. The Funds’ pricing services use various techniques including industry standard option pricing models and proprietary discounted cash flow models to determine the fair value of those instruments. The Funds’ net benefit or obligation under the derivative contract, as measured by the fair value of the contract, is included in net assets.
| | | | |
| | | |
franklintempleton.com | | Annual Report | | 129 |
FRANKLIN INVESTORS SECURITIES TRUST
NOTES TO FINANCIAL STATEMENTS
1. Organization and Significant Accounting Policies (continued)
a. Financial Instrument Valuation (continued)
The Funds have procedures to determine the fair value of financial instruments for which market prices are not reliable or readily available. Under these procedures, the VC convenes on a regular basis to review such financial instruments and considers a number of factors, including significant unobservable valuation inputs, when arriving at fair value. The VC primarily employs a market-based approach which may use related or comparable assets or liabilities, recent transactions, market multiples, book values, and other relevant information for the investment to determine the fair value of the investment. An income-based valuation approach may also be used in which the anticipated future cash flows of the investment are discounted to calculate fair value. Discounts may also be applied due to the nature or duration of any restrictions on the disposition of the investments. Due to the inherent uncertainty of valuations of such investments, the fair values may differ significantly from the values that would have been used had an active market existed. The VC employs various methods for calibrating these valuation approaches including a regular review of key inputs and assumptions, transactional back-testing or disposition analysis, and reviews of any related market activity.
Trading in securities on foreign securities stock exchanges and OTC markets may be completed before 4 p.m. Eastern time. In addition, trading in certain foreign markets may not take place on every Funds’ business day. Occasionally, events occur between the time at which trading in a foreign security is completed and 4 p.m. Eastern time that might call into question the reliability of the value of a portfolio security held by the Fund. As a result, differences may arise between the value of the Funds’ portfolio securities as determined at the foreign market close and the latest indications of value at 4 p.m. Eastern time. In order to minimize the potential for these differences, the VC monitors price movements following the close of trading in foreign stock markets through a series of country specific market proxies (such as baskets of American Depositary Receipts, futures contracts and exchange traded funds). These price movements are measured against established trigger thresholds for each specific market proxy to assist in determining if an event has occurred that may call into question the reliability of the values of the foreign securities
held by the Funds. If such an event occurs, the securities may be valued using fair value procedures, which may include the use of independent pricing services.
When the last day of the reporting period is a non-business day, certain foreign markets may be open on those days that the Funds’ NAV is not calculated, which could result in differences between the value of the Funds’ portfolio securities on the last business day and the last calendar day of the reporting period. Any significant security valuation changes due to an open foreign market are adjusted and reflected by the Funds for financial reporting purposes.
b. Foreign Currency Translation
Portfolio securities and other assets and liabilities denominated in foreign currencies are translated into U.S. dollars based on the exchange rate of such currencies against U.S. dollars on the date of valuation. The Funds may enter into foreign currency exchange contracts to facilitate transactions denominated in a foreign currency. Purchases and sales of securities, income and expense items denominated in foreign currencies are translated into U.S. dollars at the exchange rate in effect on the transaction date. Portfolio securities and assets and liabilities denominated in foreign currencies contain risks that those currencies will decline in value relative to the U.S. dollar. Occasionally, events may impact the availability or reliability of foreign exchange rates used to convert the U.S. dollar equivalent value. If such an event occurs, the foreign exchange rate will be valued at fair value using procedures established and approved by the Board.
The Funds do not separately report the effect of changes in foreign exchange rates from changes in market prices on securities held. Such changes are included in net realized and unrealized gain or loss from investments in the Statements of Operations.
Realized foreign exchange gains or losses arise from sales of foreign currencies, currency gains or losses realized between the trade and settlement dates on securities transactions and the difference between the recorded amounts of dividends, interest, and foreign withholding taxes and the U.S. dollar equivalent of the amounts actually received or paid. Net unrealized foreign exchange gains and losses arise from changes in foreign exchange rates on foreign denominated assets and liabilities other than investments in securities held at the end of the reporting period.
| | | | |
| | | |
130 | | Annual Report | | franklintempleton.com |
FRANKLIN INVESTORS SECURITIES TRUST
NOTES TO FINANCIAL STATEMENTS
c. Joint Repurchase Agreement
Certain or all Funds enter into a joint repurchase agreement whereby their uninvested cash balance is deposited into a joint cash account with other funds managed by the investment manager or an affiliate of the investment manager and is used to invest in one or more repurchase agreements. The value and face amount of the joint repurchase agreement are allocated to the funds based on their pro-rata interest. A repurchase agreement is accounted for as a loan by the Fund to the seller, collateralized by securities which are delivered to the Funds’ custodian. The fair value, including accrued interest, of the initial collateralization is required to be at least 102% of the dollar amount invested by the funds, with the value of the underlying securities marked to market daily to maintain coverage of at least 100%. Repurchase agreements are subject to the terms of Master Repurchase Agreements (MRAs) with approved counterparties (sellers). The MRAs contain various provisions, including but not limited to events of default and maintenance of collateral for repurchase agreements. In the event of default by either the seller or the Funds, certain MRAs may permit the non-defaulting party to net and close-out all transactions, if any, traded under such agreements. The Funds may sell securities it holds as collateral and apply the proceeds towards the repurchase price and any other amounts owed by the seller to the Funds in the event of default by the seller. This could involve costs or delays in addition to a loss on the securities if their value falls below the repurchase price owed by the seller. The joint repurchase agreement held by the Funds at year end, as indicated in the Statements of Investments, had been entered into on October 31, 2018.
d. Securities Purchased on a When-Issued, Delayed Delivery and TBA Basis
Certain or all Funds purchase securities on a when-issued or delayed delivery and to-be-announced (TBA) basis, with payment and delivery scheduled for a future date. These transactions are subject to market fluctuations and are subject to the risk that the value at delivery may be more or less than the trade date purchase price. Although the Funds will generally purchase these securities with the intention of holding the securities, they may sell the securities before the settlement date. Sufficient assets have been segregated for these securities and collateral has been pledged and/or received for open TBA trades.
e. Derivative Financial Instruments
Certain or all Funds invested in derivative financial instruments in order to manage risk or gain exposure to various other investments or markets. Derivatives are financial contracts based on an underlying or notional amount, require no initial investment or an initial net investment that is smaller than would normally be required to have a similar response to changes in market factors, and require or permit net settlement. Derivatives contain various risks including the potential inability of the counterparty to fulfill their obligations under the terms of the contract, the potential for an illiquid secondary market, and/or the potential for market movements which expose the Fund to gains or losses in excess of the amounts shown in the Statements of Assets and Liabilities. Realized gain and loss and unrealized appreciation and depreciation on these contracts for the period are included in the Statements of Operations.
Derivative counterparty credit risk is managed through a formal evaluation of the creditworthiness of all potential counter-parties. Certain or all Funds attempt to reduce their exposure to counterparty credit risk on OTC derivatives, whenever possible, by entering into International Swaps and Derivatives Association (ISDA) master agreements with certain counterparties. These agreements contain various provisions, including but not limited to collateral requirements, events of default, or early termination. Termination events applicable to the counterparty include certain deteriorations in the credit quality of the counterparty. Termination events applicable to the Funds include failure of the Funds to maintain certain net asset levels and/or limit the decline in net assets over various periods of time. In the event of default or early termination, the ISDA master agreement gives the non-defaulting party the right to net and close-out all transactions traded, whether or not arising under the ISDA agreement, to one net amount payable by one counterparty to the other. However, absent an event of default or early termination, OTC derivative assets and liabilities are presented gross and not offset in the Statements of Assets and Liabilities. Early termination by the counterparty may result in an immediate payment by the Funds of any net liability owed to that counterparty under the ISDA agreement.
Collateral requirements differ by type of derivative. Collateral or initial margin requirements are set by the broker or exchange clearing house for exchange traded and centrally cleared derivatives. Initial margin deposited is held at the exchange and can be in the form of cash and/or securities. For OTC
| | | | |
| | | |
franklintempleton.com | | Annual Report | | 131 |
FRANKLIN INVESTORS SECURITIES TRUST
NOTES TO FINANCIAL STATEMENTS
1. Organization and Significant Accounting Policies (continued)
e. Derivative Financial Instruments (continued)
derivatives traded under an ISDA master agreement, posting of collateral is required by either the Fund or the applicable counterparty if the total net exposure of all OTC derivatives with the applicable counterparty exceeds the minimum transfer amount, which typically ranges from $100,000 to $250,000, and can vary depending on the counterparty and the type of the agreement. Generally, collateral is determined at the close of Fund business each day and any additional collateral required due to changes in derivative values may be delivered by the Fund or the counterparty the next business day, or within a few business days. Collateral pledged and/or received by the Fund for OTC derivatives, if any, is held in segregated accounts with the Fund’s custodian/counterparty broker and can be in the form of cash and/or securities. Unrestricted cash may be invested according to the Funds’ investment objectives. To the extent that the amounts due to the Fund from its counterparties are not subject to collateralization or are not fully collateralized, the Fund bears the risk of loss from counterparty non-performance.
Certain or all Funds entered into exchange traded futures contracts primarily to manage and/or gain exposure to interest rate risk. A futures contract is an agreement between the Fund and a counterparty to buy or sell an asset at a specified price on a future date. Required initial margins are pledged by the Fund, and the daily change in fair value is accounted for as a variation margin payable or receivable in the Statements of Assets and Liabilities.
Certain or all Funds entered into OTC forward exchange contracts primarily to manage and/or gain exposure to certain foreign currencies. A forward exchange contract is an agreement between the Fund and a counterparty to buy or sell a foreign currency at a specific exchange rate on a future date.
Certain or all Funds entered into credit default swap contracts primarily to manage and/or gain exposure to credit risk. A credit default swap is an agreement between the Fund and a counterparty whereby the buyer of the contract receives credit protection and the seller of the contract guarantees the credit worthiness of a referenced debt obligation. These agreements may be privately negotiated in the over-the-counter market (OTC credit default swaps) or may be executed in a multilateral trade facility platform, such as a registered exchange (centrally cleared credit default swaps). The underlying referenced debt
obligation may be a single issuer of corporate or sovereign debt, a credit index, a basket of issuers or indices, or a tranche of a credit index or basket of issuers or indices. In the event of a default of the underlying referenced debt obligation, the buyer is entitled to receive the notional amount of the credit default swap contract from the seller in exchange for the referenced debt obligation, a net settlement amount equal to the notional amount of the credit default swap less the recovery value of the referenced debt obligation, or other agreed upon amount. For centrally cleared credit default swaps, required initial margins are pledged by the Fund, and the daily change in fair value is accounted for as a variation margin payable or receivable in the Statements of Assets and Liabilities. Over the term of the contract, the buyer pays the seller a periodic stream of payments, provided that no event of default has occurred. Such periodic payments are accrued daily as an unrealized appreciation or depreciation until the payments are made, at which time they are realized. Upfront payments and receipts are reflected in the Statements of Assets and Liabilities and represent compensating factors between stated terms of the credit default swap agreement and prevailing market conditions (credit spreads and other relevant factors). These upfront payments and receipts are amortized over the term of the contract as a realized gain or loss in the Statements of Operations.
Certain or all Funds entered into OTC cross currency swap contracts primarily to manage and/or gain exposure to interest rate risk and certain foreign currencies. A cross currency swap is an agreement between the Fund and a counterparty to exchange cash flows (determined using either a fixed or floating rate) based on the notional amounts of two different currencies. The notional amounts are typically determined based on the spot exchange rates at the opening of the contract. Cross currency swaps may require the exchange of notional amounts at the opening and/or closing of the contract. Over the term of the contract, contractually required payments to be paid and to be received are accrued daily and recorded as unrealized depreciation and appreciation until the payments are made, at which time they are realized. Upfront payments and receipts are reflected in the Statements of Assets and Liabilities and represent compensating factors between stated terms of the cross currency swap contract and prevailing market conditions (interest rate spreads and other relevant factors). These upfront payments and receipts are amortized over the term of the contract as a realized gain or loss in the Statements of Operations.
| | | | |
| | | |
132 | | Annual Report | | franklintempleton.com |
FRANKLIN INVESTORS SECURITIES TRUST
NOTES TO FINANCIAL STATEMENTS
Certain or all Funds entered into inflation index swap contracts primarily to manage and/or gain exposure to inflation risk. An inflation index swap is an agreement between the Fund and a counterparty to exchange cash flows whereby one party makes payments based on the percentage change in an index that serves as a measure of inflation and the other party makes a regular payment based on a compounded fixed rate, applied to a notional amount. These agreements may be privately negotiated in the over-the-counter market (OTC inflation index swap) or may be executed on a registered exchange (centrally cleared inflation index swap). For centrally cleared inflation index swaps, required initial margins are pledged by the Fund, and the daily change in fair value is accounted for as a variation margin payable or receivable. Over the term of the contract, contractually required payments to be paid and to be received are accrued daily and recorded as unrealized depreciation and appreciation until the payments are made, at which time they are realized. Typically, an inflation index swap has payment obligations netted and exchanged upon maturity.
Certain or all Funds entered into interest rate swap contracts primarily to manage interest rate risk. An interest rate swap is an agreement between the Fund and a counterparty to exchange cash flows based on the difference between two interest rates, applied to a notional amount. These agreements may be privately negotiated in the over-the-counter market (OTC interest rate swaps) or may be executed on a registered exchange (centrally cleared interest rate swaps). For centrally cleared interest rate swaps, required initial margins are pledged by the Fund, and the daily change in fair value is accounted for as a variation margin payable or receivable in the Statements of Assets and Liabilities. Over the term of the contract, contractually required payments to be paid and to be received are accrued daily and recorded as unrealized depreciation and appreciation until the payments are made, at which time they are realized.
Certain or all Funds entered into OTC total return swap contracts primarily to manage and/or gain exposure to interest rate risk of an underlying instrument such as a stock, bond, index or basket of securities or indices. A total return swap is an agreement between the Fund and a counterparty to exchange a return linked to an underlying instrument for a floating or fixed rate payment, both based upon a notional amount. Over the term of the contract, contractually required payments to be paid or
received are accrued daily and recorded as unrealized appreciation or depreciation until the payments are made, at which time they are recognized as realized gain or loss.
Certain or all Funds invest in value recovery instruments (VRI) primarily to gain exposure to economic growth. Periodic payments from VRI are dependent on established benchmarks for underlying variables. VRI has a notional amount, which is used to calculate amounts of payments to holders. Payments are recorded upon receipt as realized gains in the Statements of Operations. The risks of investing in VRI include growth risk, liquidity, and the potential loss of investment.
See Note 9 regarding other derivative information.
f. Loan Participation Notes
Certain or all Funds invest in loan participation notes (Participations). Participations are loans originally issued to a borrower by one or more financial institutions (the Lender) and subsequently sold to other investors, such as the Funds. Participations typically result in the Fund having a contractual relationship only with the Lender and not with the borrower. The Funds have the right to receive from the Lender any payments of principal, interest and fees which the Lender received from the borrower. The Funds generally have no rights to either enforce compliance by the borrower with the terms of the loan agreement or to any collateral relating to the original loan. As a result, the Funds assume the credit risk of both the borrower and the Lender that is selling the Participation. The Participations may also involve interest rate risk and liquidity risk, including the potential default or insolvency of the borrower and/or the Lender.
g. FT Holdings Corporation I (FT Subsidiary)
Franklin Total Return Fund invests in certain financial instruments through its investment in the FT Subsidiary. FT Subsidiary is a Delaware Corporation, is a wholly-owned subsidiary of the Fund, and is able to invest in certain financial instruments consistent with the investment objective of the Fund. At October 31, 2018, FT Subsidiary’s investment, Turtle Bay Resort, as well as any other assets and liabilities of FT Subsidiary are reflected in the Fund’s Consolidated Statement of Investments and Consolidated Statement of Assets and Liabilities.
| | | | |
| | | |
franklintempleton.com | | Annual Report | | 133 |
FRANKLIN INVESTORS SECURITIES TRUST
NOTES TO FINANCIAL STATEMENTS
1. Organization and Significant Accounting Policies (continued)
g. FT Holdings Corporation I (FT Subsidiary) (continued)
During the year ended October 31, 2018, Turtle Bay Resort paid a distribution to FT Subsidiary upon the sale of a majority of its assets to a third party. The distribution received is reflected net of taxes as other income and capital gain distribution received in FT Subsidiary in the Consolidated Statement of Operations. For U.S. income tax purposes, this distribution is taxable to FT Subsidiary, and as such a tax expense was recorded in FT Subsidiary. The tax expense was calculated using FT Subsidiary’s prior year effective federal rate of 34%, and a blended Hawaii state rate of 4% of the 2017 estimated capital gain and 6.4% of the 2017 estimated ordinary income. In addition, a deferred tax benefit was recorded on the unrealized depreciation of the security. When the Fund disposes of the security, the deferred asset is relieved and the Fund should incur a realized tax benefit. The estimated deferred tax benefit was calculated using a federal rate of 21% and a Hawaii state rate (net of federal tax benefit) of 3%. This is reflected as FT Subsidiary deferred tax benefit in the Consolidated Statement of Assets and Liabilities.
The financial statements have been consolidated and include the accounts of the Fund and FT Subsidiary. All intercompany transactions and balances have been eliminated. At October 31, 2018, the net assets of FT Subsidiary were $5,211,476, representing 0.1% of the Fund’s consolidated net assets. The Fund’s investment in FT Subsidiary is limited to 25% of consolidated assets.
h. Mortgage Dollar Rolls
Certain or all Funds enter into mortgage dollar rolls, typically on a TBA basis. Mortgage dollar rolls are agreements between the Fund and a financial institution where the Fund sells (or buys) mortgage-backed securities for delivery on a specified date and simultaneously contracts to repurchase (or sell) substantially similar (same type, coupon, and maturity) securities at a future date and at a predetermined price. Gains or losses are realized on the initial sale, and the difference between the repurchase price and the sale price is recorded as an unrealized gain or loss to the Fund upon entering into the mortgage dollar roll. In addition, the Fund may invest the cash proceeds that are received from the initial sale. During the period between the sale and repurchase, the Fund is not entitled to principal and interest paid on the mortgage backed securities.
Transactions in mortgage dollar rolls are accounted for as purchases and sales and may result in an increase to the Fund’s portfolio turnover rate. The risks of mortgage dollar roll transactions include the potential inability of the counterparty to fulfill its obligations.
i. Senior Floating Rate Interests
Certain or all Funds invest in senior secured corporate loans that pay interest at rates which are periodically reset by reference to a base lending rate plus a spread. These base lending rates are generally the prime rate offered by a designated U.S. bank or the London InterBank Offered Rate (LIBOR). Senior secured corporate loans often require prepayment of principal from excess cash flows or at the discretion of the borrower. As a result, actual maturity may be substantially less than the stated maturity. Senior secured corporate loans in which the Funds invest are generally readily marketable, but may be subject to certain restrictions on resale.
j. Marketplace Lending
Certain or all Funds invest in loans obtained through marketplace lending. Marketplace lending, sometimes referred to as peer-to-peer lending, is a method of financing in which a platform facilitates the borrowing and lending of money. It is considered an alternative to more traditional forms of debt financing. Prospective borrowers are required to provide certain financial information to the platform, including, but not limited to, the intended purpose of the loan, income, employment information, credit score, debt-to-income ratio, credit history (including defaults and delinquencies) and home ownership status. Based on this and other information, the platform assigns its own credit rating to the borrower and sets the interest rate for the requested loan. The platform then posts the borrowing requests online, giving investors the opportunity to purchase the loans based on factors such as the interest rates and expected yields of the loans, the borrower background data, and the credit rating assigned by the platform.
When the Fund invests in these loans, it usually purchases all rights, title and interest in the loans pursuant to a loan purchase agreement directly from the platform. The platform or a third-party servicer typically continues to service the loans, collecting payments and distributing them to the Fund, less any servicing fees assessed. The servicer is typically responsible for taking actions against a borrower in the event of a default on the loan. Servicing fees are included in loan service fees in the Statements of Operations. The Fund, as an investor in a loan,
| | | | |
| | | |
134 | | Annual Report | | franklintempleton.com |
FRANKLIN INVESTORS SECURITIES TRUST
NOTES TO FINANCIAL STATEMENTS
would be entitled to receive payment only from the borrower and would not be able to recover any deficiency from the platform, except under very narrow circumstances. The loans in which the Fund may invest are unsecured.
k. Income and Deferred Taxes
It is each Fund’s policy to qualify as a regulated investment company under the Internal Revenue Code. Each Fund intends to distribute to shareholders substantially all of its taxable income and net realized gains to relieve it from federal income and excise taxes. As a result, no provision for U.S. federal income taxes is required.
The Funds may be subject to foreign taxation related to income received, capital gains on the sale of securities and certain foreign currency transactions in the foreign jurisdictions in which the Funds invest. Foreign taxes, if any, are recorded based on the tax regulations and rates that exist in the foreign markets in which the Funds invest. When a capital gain tax is determined to apply, certain or all Funds record an estimated deferred tax liability in an amount that would be payable if the securities were disposed of on the valuation date.
Each Fund may recognize an income tax liability related to its uncertain tax positions under U.S. GAAP when the uncertain tax position has a less than 50% probability that it will be sustained upon examination by the tax authorities based on its technical merits. As of October 31, 2018, each Fund has determined that no tax liability is required in its financial statements related to uncertain tax positions for any open tax years (or expected to be taken in future tax years). Open tax years are those that remain subject to examination and are based on the statute of limitations in each jurisdiction in which the Fund invests.
l. Security Transactions, Investment Income, Expenses and Distributions
Security transactions are accounted for on trade date. Realized gains and losses on security transactions are determined on a specific identification basis. Interest income and estimated expenses are accrued daily. Amortization of premium and accretion of discount on debt securities are included in interest income. Paydown gains and losses are recorded separately in the Statements of Operations. Facility fees are recognized as income over the expected term of the loan. Dividend income and capital gain distributions are recorded on the ex-dividend date except for certain dividends from securities where the
dividend rate is not available. In such cases, the dividend is recorded as soon as the information is received by the Funds. Dividends from net investment income are normally declared daily; these dividends may be reinvested or paid monthly to shareholders. Distributions to shareholders are recorded on the ex-dividend date. Distributable earnings are determined according to income tax regulations (tax basis) and may differ from earnings recorded in accordance with U.S. GAAP. These differences may be permanent or temporary. Permanent differences are reclassified among capital accounts to reflect their tax character. These reclassifications have no impact on net assets or the results of operations. Temporary differences are not reclassified, as they may reverse in subsequent periods.*
Common expenses incurred by the Trust are allocated among the Funds based on the ratio of net assets of each Fund to the combined net assets of the Trust or based on the ratio of number of shareholders of each Fund to the combined number of shareholders of the Trust. Fund specific expenses are charged directly to the Fund that incurred the expense.
Net investment income, excluding class specific expenses, is allocated daily to each class of shares based upon the relative value of the settled shares of each class. Realized and unrealized gains and losses are allocated daily to each class of shares based upon the relative proportion of net assets of each class. Differences in per share distributions by class are generally due to differences in class specific expenses.
Inflation-indexed bonds are adjusted for inflation through periodic increases or decreases in the security’s interest accruals, face amount, or principal redemption value, by amounts corresponding to the rate of inflation as measured by an index. Any increase or decrease in the face amount or principal redemption value will be included as interest income/inflation principal adjustments in the Statements of Operations.
m. Accounting Estimates
The preparation of financial statements in accordance with U.S. GAAP requires management to make estimates and assumptions that affect the reported amounts of assets and liabilities at the date of the financial statements and the amounts of income and expenses during the reporting period. Actual results could differ from those estimates.
| | | | |
| | | |
franklintempleton.com | | Annual Report | | 135 |
FRANKLIN INVESTORS SECURITIES TRUST
NOTES TO FINANCIAL STATEMENTS
1. Organization and Significant Accounting Policies (continued)
n. Guarantees and Indemnifications
Under the Trust’s organizational documents, its officers and trustees are indemnified by the Trust against certain liabilities arising out of the performance of their duties to the Trust. Additionally, in the normal course of business, the Trust, on
behalf of the Funds, enters into contracts with service providers that contain general indemnification clauses. The Trust’s maximum exposure under these arrangements is unknown as this would involve future claims that may be made against the Trust that have not yet occurred. Currently, the Trust expects the risk of loss to be remote.
*Effective during the current reporting period, it is no longer required to present certain line items on the Statements of Changes in Net Assets. Such disclosure changes are included in the Statements of Changes in Net Assets, therefore prior period amounts are presented below.
For the year ended October 31, 2017, distributions to shareholders were as follows:
| | | | | | | | | | | | | | | | |
| | | Franklin Adjustable U.S.
Government Securities Fund | | | Franklin Floating
Rate Daily Access Fund | | | Franklin Low
Duration
Total Return Fund | | | Franklin Total
Return Fund | |
| Distributions from net investment income: | | | | | | | | | | | | | | | | |
Class A | | | $(10,816,412 | ) | | | $(49,009,035 | ) | | | $(29,407,853 | ) | | | $(79,166,327 | ) |
Class A1 | | | (2,796,558 | ) | | | — | | | | — | | | | — | |
Class C | | | (3,300,858 | ) | | | (17,722,222 | ) | | | (3,436,954 | ) | | | (8,606,867 | ) |
Class R | | | — | | | | — | | | | — | | | | (1,159,298 | ) |
Class R6 | | | (52,994 | ) | | | (2,953,451 | ) | | | (12,604,268 | ) | | | (2,523,966 | ) |
Advisor Class | | | (4,370,331 | ) | | | (58,557,532 | ) | | | (7,048,480 | ) | | | (20,532,154 | ) |
For the year ended October 31, 2017, undistributed net investment income (loss) and distributions in excess of net investment income included in net assets were as follows:
| | | | | | | | |
| Fund | | Undistributed net
investment income | | | Distribution in
excess
of net investment
income | |
Franklin Adjustable U.S. Government Securities Fund | | | $ 67,121 | | | | $ — | |
Franklin Floating Rate Daily Access Fund | | | $2,598,773 | | | | $ — | |
Franklin Low Duration Total Return Fund | | | $ — | | | | $(3,889,428 | ) |
Franklin Total Return Fund | | | $ — | | | | $(5,810,566 | ) |
| | | | |
| | | |
136 | | Annual Report | | franklintempleton.com |
FRANKLIN INVESTORS SECURITIES TRUST
NOTES TO FINANCIAL STATEMENTS
2. Shares of Beneficial Interest
At October 31, 2018, there were an unlimited number of shares authorized (without par value). Transactions in the Funds’ shares were as follows:
| | | | | | | | | | | | | | | | |
| | | Franklin Adjustable U.S. Government Securities Fund | | | Franklin Floating Rate Daily Access Fund | |
| | | | |
| | | Shares | | | Amount | | | Shares | | | Amount | |
Class A Shares: | | | | | | | | | | | | | | | | |
Year ended October 31, 2018 | | | | | | | | | | | | | | | | |
Shares solda | | | 12,980,707 | | | $ | 105,938,933 | | | | 40,041,598 | | | $ | 350,572,136 | |
Shares issued in reinvestment of distributions | | | 1,209,703 | | | | 9,874,447 | | | | 6,091,861 | | | | 53,389,454 | |
Shares redeemed | | | (22,167,585 | ) | | | (181,278,900 | ) | | | (45,866,654 | ) | | | (402,638,246 | ) |
| | | | |
| | | | |
Net increase (decrease) | | | (7,977,175 | ) | | $ | (65,465,520 | ) | | | 266,805 | | | $ | 1,323,344 | |
| | | | |
| | | | |
Year ended October 31, 2017 | | | | | | | | | | | | | | | | |
Shares sold | | | 15,064,447 | | | $ | 125,693,039 | | | | 44,354,738 | | | $ | 393,140,477 | |
Shares issued in reinvestment of distributions | | | 1,228,691 | | | | 10,224,922 | | | | 5,153,232 | | | | 45,658,928 | |
Shares redeemed | | | (36,005,848 | ) | | | (300,088,430 | ) | | | (49,104,181 | ) | | | (435,168,195 | ) |
| | | | |
| | | | |
Net increase (decrease) | | | (19,712,710 | ) | | $ | (164,170,469 | ) | | | 403,789 | | | $ | 3,631,210 | |
| | | | |
| | | | |
Class A1 Shares: | | | | | | | | | | | | | | | | |
Year ended October 31, 2018 | | | | | | | | | | | | | | | | |
Shares sold | | | 748,665 | | | $ | 6,097,241 | | | | | | | | | |
Shares issued in reinvestment of distributions | | | 309,106 | | | | 2,522,673 | | | | | | | | | |
Shares redeemed | | | (3,331,933 | ) | | | (27,260,972 | ) | | | | | | | | |
| | | | | | | | | | | | |
| | | | |
Net increase (decrease) | | | (2,274,162 | ) | | $ | (18,641,058 | ) | | | | | | | | |
| | | | | | | | | | | | |
| | | | |
Year ended October 31, 2017 | | | | | | | | | | | | | | | | |
Shares sold | | | 460,357 | | | $ | 3,832,460 | | | | | | | | | |
Shares issued in reinvestment of distributions | | | 318,104 | | | | 2,645,959 | | | | | | | | | |
Shares redeemed | | | (5,191,278 | ) | | | (43,267,320 | ) | | | | | | | | |
| | | | | | | | | | | | |
| | | | |
Net increase (decrease) | | | (4,412,817 | ) | | $ | (36,788,901 | ) | | | | | | | | |
| | | | | | | | | | | | |
Class C Shares: | | | | | | | | | | | | | | | | |
Year ended October 31, 2018 | | | | | | | | | | | | | | | | |
Shares sold | | | 1,531,585 | | | $ | 12,510,001 | | | | 9,725,663 | | | $ | 85,257,879 | |
Shares issued in reinvestment of distributions | | | 364,009 | | | | 2,969,738 | | | | 2,281,358 | | | | 19,996,858 | |
Shares redeemeda | | | (9,275,058 | ) | | | (75,657,756 | ) | | | (23,980,411 | ) | | | (210,011,797 | ) |
| | | | |
| | | | |
Net increase (decrease) | | | (7,379,464 | ) | | $ | (60,178,017 | ) | | | (11,973,390 | ) | | $ | (104,757,060 | ) |
| | | | |
| | | | |
Year ended October 31, 2017 | | | | | | | | | | | | | | | | |
Shares sold | | | 1,689,775 | | | $ | 14,082,487 | | | | 15,908,252 | | | $ | 141,059,930 | |
Shares issued in reinvestment of distributions | | | 368,575 | | | | 3,064,421 | | | | 1,836,285 | | | | 16,269,098 | |
Shares redeemed | | | (10,729,636 | ) | | | (89,350,630 | ) | | | (17,787,164 | ) | | | (157,586,828 | ) |
| | | | |
| | | | |
Net increase (decrease) | | | (8,671,286 | ) | | $ | (72,203,722 | ) | | | (42,627 | ) | | $ | (257,800 | ) |
| | | | |
| | | | |
| | | |
franklintempleton.com | | Annual Report | | 137 |
FRANKLIN INVESTORS SECURITIES TRUST
NOTES TO FINANCIAL STATEMENTS
2. Shares of Beneficial Interest (continued)
| | | | | | | | | | | | | | | | |
| | | Franklin Adjustable U.S. Government Securities Fund | | | Franklin Floating Rate Daily Access Fund | |
| | | | |
| | | Shares | | | Amount | | | Shares | | | Amount | |
Class R6 Shares: | | | | | | | | | | | | | | | | |
Year ended October 31, 2018 | | | | | | | | | | | | | | | | |
Shares sold | | | 5,030,194 | | | $ | 41,324,507 | | | | 4,483,095 | | | $ | 39,317,573 | |
Shares issued in reinvestment of distributions | | | 91,803 | | | | 749,678 | | | | 746,119 | | | | 6,539,786 | |
Shares redeemed | | | (945,757 | ) | | | (7,735,599 | ) | | | (3,642,765 | ) | | | (31,933,834 | ) |
| | | | |
| | | | |
Net increase (decrease) | | | 4,176,240 | | | $ | 34,338,586 | | | | 1,586,449 | | | $ | 13,923,525 | |
| | | | |
| | | | |
Year ended October 31, 2017 | | | | | | | | | | | | | | | | |
Shares sold | | | 51,545 | | | $ | 430,037 | | | | 15,034,860 | | | $ | 133,480,154 | |
Shares issued in reinvestment of distributions | | | 6,366 | | | | 52,994 | | | | 326,520 | | | | 2,890,725 | |
Shares redeemed | | | (73,967 | ) | | | (615,272 | ) | | | (2,023,706 | ) | | | (17,911,532 | ) |
| | | | |
| | | | |
Net increase (decrease) | | | (16,056 | ) | | $ | (132,241 | ) | | | 13,337,674 | | | $ | 118,459,347 | |
| | | | |
| | | | |
Advisor Class Shares: | | | | | | | | | | | | | | | | |
Year ended October 31, 2018 | | | | | | | | | | | | | | | | |
Shares sold | | | 8,026,624 | | | $ | 65,714,269 | | | | 72,581,582 | | | $ | 636,947,305 | |
Shares issued in reinvestment of distributions | | | 386,115 | | | | 3,155,976 | | | | 5,110,153 | | | | 44,798,000 | |
Shares redeemed | | | (16,879,585 | ) | | | (138,316,250 | ) | | | (66,685,337 | ) | | | (585,445,117 | ) |
| | | | |
| | | | |
Net increase (decrease) | | | (8,466,846 | ) | | $ | (69,446,005 | ) | | | 11,006,398 | | | $ | 96,300,188 | |
| | | | |
| | | | |
Year ended October 31, 2017 | | | | | | | | | | | | | | | | |
Shares sold | | | 11,485,012 | | | $ | 95,774,135 | | | | 125,873,007 | | | $ | 1,117,140,394 | |
Shares issued in reinvestment of distributions | | | 473,291 | | | | 3,940,955 | | | | 3,348,529 | | | | 29,668,881 | |
Shares redeemed | | | (16,675,962 | ) | | | (138,997,939 | ) | | | (65,298,771 | ) | | | (578,462,176 | ) |
| | | | |
| | | | |
Net increase (decrease) | | | (4,717,659 | ) | | $ | (39,282,849 | ) | | | 63,922,765 | | | $ | 568,347,099 | |
| | | | |
| |
| aMay include a portion of Class C shares that were automatically converted to Class A. | | | | | |
| | |
| | | Franklin Low Duration Total Return Fund | | | Franklin Total Return Fund | |
| | | | |
| | | Shares | | | Amount | | | Shares | | | Amount | |
Class A Shares: | | | | | | | | | | | | | | | | |
Year ended October 31, 2018 | | | | | | | | | | | | | | | | |
Shares solda | | | 45,754,362 | | | $ | 443,188,528 | | | | 46,213,804 | | | $ | 442,391,448 | |
Shares issued in reinvestment of distributions | | | 3,715,625 | | | | 35,982,102 | | | | 8,890,356 | | | | 85,021,536 | |
Shares redeemed | | | (47,715,588 | ) | | | (463,029,535 | ) | | | (78,958,900 | ) | | | (755,833,340 | ) |
| | | | |
| | | | |
Net increase (decrease) | | | 1,754,399 | | | $ | 16,141,095 | | | | (23,854,740 | ) | | $ | (228,420,356 | ) |
| | | | |
| | | | |
Year ended October 31, 2017 | | | | | | | | | | | | | | | | |
Shares sold | | | 67,556,193 | | | $ | 665,223,690 | | | | 60,861,062 | | | $ | 593,317,133 | |
Shares issued in reinvestment of distributions | | | 2,577,144 | | | | 25,374,436 | | | | 7,998,920 | | | | 77,657,172 | |
Shares redeemed | | | (69,776,656 | ) | | | (687,142,834 | ) | | | (113,164,691 | ) | | | (1,101,179,924 | ) |
| | | | |
| | | | |
Net increase (decrease) | | | 356,681 | | | $ | 3,455,292 | | | | (44,304,709 | ) | | $ | (430,205,619 | ) |
| | | | |
| | | | |
| | | |
138 | | Annual Report | | franklintempleton.com |
FRANKLIN INVESTORS SECURITIES TRUST
NOTES TO FINANCIAL STATEMENTS
| | | | | | | | | | | | | | | | |
| | | Franklin Low Duration Total Return Fund | | | Franklin Total Return Fund | |
| | | | |
| | | Shares | | | Amount | | | Shares | | | Amount | |
Class C Shares: | | | | | | | | | | | | | | | | |
Year ended October 31, 2018 | | | | | | | | | | | | | | | | |
Shares sold | | | 3,413,048 | | | $ | 32,944,334 | | | | 3,654,316 | | | $ | 34,887,774 | |
Shares issued in reinvestment of distributions | | | 360,095 | | | | 3,473,725 | | | | 817,226 | | | | 7,767,582 | |
Shares redeemeda | | | (7,985,724 | ) | | | (76,991,799 | ) | | | (14,440,705 | ) | | | (136,289,594 | ) |
| | | | |
| | | | |
Net increase (decrease) | | | (4,212,581 | ) | | $ | (40,573,740 | ) | | | (9,969,163 | ) | | $ | (93,634,238 | ) |
| | | | |
Year ended October 31, 2017 | | | | | | | | | | | | | | | | |
Shares sold | | | 4,898,935 | | | $ | 48,093,413 | | | | 5,424,433 | | | $ | 52,538,301 | |
Shares issued in reinvestment of distributions | | | 284,264 | | | | 2,789,104 | | | | 820,431 | | | | 7,915,305 | |
Shares redeemed | | | (9,466,240 | ) | | | (92,920,380 | ) | | | (15,488,386 | ) | | | (150,002,417 | ) |
| | | | |
| | | | |
Net increase (decrease) | | | (4,283,041 | ) | | $ | (42,037,863 | ) | | | (9,243,522 | ) | | $ | (89,548,811 | ) |
| | | | |
Class R Shares: | | | | | | | | | | | | | | | | |
Year ended October 31, 2018 | | | | | | | | | | | | | | | | |
Shares sold | | | | | | | | | | | 492,019 | | | $ | 4,681,884 | |
Shares issued in reinvestment of distributions | | | | | | | | | | | 82,563 | | | | 787,630 | |
Shares redeemed | | | | | | | | | | | (1,736,019 | ) | | | (16,498,072 | ) |
| | | | | | | | | | | | |
| | | | |
Net increase (decrease) | | | | | | | | | | | (1,161,437 | ) | | $ | (11,028,558 | ) |
| | | | | | | | | | | | |
Year ended October 31, 2017 | | | | | | | | | | | | | | | | |
Shares sold | | | | | | | | | | | 902,022 | | | $ | 8,746,669 | |
Shares issued in reinvestment of distributions | | | | | | | | | | | 114,619 | | | | 1,108,621 | |
Shares redeemed | | | | | | | | | | | (3,240,307 | ) | | | (31,484,683 | ) |
| | | | | | | | | | | | |
| | | | |
Net increase (decrease) | | | | | | | | | | | (2,223,666 | ) | | $ | (21,629,393 | ) |
| | | | | | | | | | | | |
Class R6 Shares: | | | | | | | | | | | | | | | | |
Year ended October 31, 2018 | | | | | | | | | | | | | | | | |
Shares sold | | | 70,752,923 | | | $ | 691,874,381 | | | | 16,699,247 | | | $ | 161,014,195 | |
Shares issued in reinvestment of distributions | | | 2,699,247 | | | | 26,294,764 | | | | 1,317,931 | | | | 12,670,874 | |
Shares redeemed | | | (27,828,421 | ) | | | (270,862,584 | ) | | | (12,370,887 | ) | | | (118,615,197 | ) |
| | | | |
| | | | |
Net increase (decrease) | | | 45,623,749 | | | $ | 447,306,561 | | | | 5,646,291 | | | $ | 55,069,872 | |
| | | | |
Year ended October 31, 2017 | | | | | | | | | | | | | | | | |
Shares sold | | | 14,784,998 | | | $ | 146,559,335 | | | | 38,903,238 | | | $ | 383,335,522 | |
Shares issued in reinvestment of distributions | | | 1,264,112 | | | | 12,513,346 | | | | 18,879 | | | | 184,469 | |
Shares redeemed | | | (11,934,303 | ) | | | (118,167,426 | ) | | | (8,043,063 | ) | | | (79,025,132 | ) |
| | | | |
| | | | |
Net increase (decrease) | | | 4,114,807 | | | $ | 40,905,255 | | | | 30,879,054 | | | $ | 304,494,859 | |
| | | | |
Advisor Class Shares: | | | | | | | | | | | | | | | | |
Year ended October 31, 2018 | | | | | | | | | | | | | | | | |
Shares sold | | | 12,420,216 | | | $ | 121,011,438 | | | | 22,751,004 | | | $ | 220,031,575 | |
Shares issued in reinvestment of distributions | | | 625,164 | | | | 6,089,056 | | | | 1,828,038 | | | | 17,566,461 | |
Shares redeemed | | | (34,195,050 | ) | | | (336,205,168 | ) | | | (18,489,847 | ) | | | (177,498,036 | ) |
| | | | |
| | | | |
Net increase (decrease) | | | (21,149,670 | ) | | $ | (209,104,674 | ) | | | 6,089,195 | | | $ | 60,100,000 | |
| | | | |
Year ended October 31, 2017 | | | | | | | | | | | | | | | | |
Shares sold | | | 37,677,301 | | | $ | 372,780,265 | | | | 48,423,990 | | | $ | 474,423,563 | |
Shares issued in reinvestment of distributions | | | 639,191 | | | | 6,323,130 | | | | 1,856,741 | | | | 18,132,064 | |
Shares redeemed | | | (17,587,989 | ) | | | (174,037,184 | ) | | | (64,272,380 | ) | | | (631,856,126 | ) |
| | | | |
| | | | |
Net increase (decrease) | | | 20,728,503 | | | $ | 205,066,211 | | | | (13,991,649 | ) | | $ | (139,300,499 | ) |
| | | | |
aMay include a portion of Class C shares that were automatically converted to Class A.
| | | | |
| | | |
franklintempleton.com | | Annual Report | | 139 |
FRANKLIN INVESTORS SECURITIES TRUST
NOTES TO FINANCIAL STATEMENTS
3. Transactions with Affiliates
Franklin Resources, Inc. is the holding company for various subsidiaries that together are referred to as Franklin Templeton Investments. Certain officers and trustees of the Trust are also officers and/or directors of the following subsidiaries:
| | | | |
| Subsidiary | | Affiliation | | |
Franklin Advisers, Inc. (Advisers) | | Investment manager | | |
Franklin Templeton Institutional, LLC (FT Institutional) | | Investment manager | | |
Franklin Templeton Services, LLC (FT Services) | | Administrative manager | | |
Franklin Templeton Distributors, Inc. (Distributors) | | Principal underwriter | | |
Franklin Templeton Investor Services, LLC (Investor Services) | | Transfer agent | | |
a. Management Fees
Franklin Adjustable U.S. Government Securities Fund pays an investment management fee to Advisers based on the average daily net assets of the Fund as follows:
| | | | |
| Annualized Fee Rate | | Net Assets | | |
0.500% | | Up to and including $5 billion | | |
0.440% | | Over $5 billion, up to and including $10 billion | | |
0.410% | | Over $10 billion, up to and including $15 billion | | |
0.380% | | In excess of $15 billion | | |
Franklin Floating Rate Daily Access Fund pays an investment management fee to Advisers based on the average daily net assets of the Fund as follows:
| | | | |
| Annualized Fee Rate | | Net Assets | | |
0.650% | | Up to and including $500 million | | |
0.550% | | Over $500 million, up to and including $1 billion | | |
0.500% | | Over $1 billion, up to and including $1.5 billion | | |
0.450% | | Over $1.5 billion, up to and including $6.5 billion | | |
0.425% | | Over $6.5 billion, up to and including $11.5 billion | | |
0.400% | | Over $11.5 billion, up to and including $16.5 billion | | |
0.390% | | Over $16.5 billion, up to and including $19 billion | | |
0.380% | | Over $19 billion, up to and including $21.5 billion | | |
0.370% | | In excess of $21.5 billion | | |
| | | | |
| | | |
140 | | Annual Report | | franklintempleton.com |
FRANKLIN INVESTORS SECURITIES TRUST
NOTES TO FINANCIAL STATEMENTS
Franklin Low Duration Total Return Fund and Franklin Total Return Fund pay an investment management fee to Advisers based on the average daily net assets of each of the Funds as follows:
| | | | |
| Annualized Fee Rate | | Net Assets | | |
0.625% | | Up to and including $500 million | | |
0.525% | | Over $500 million, up to and including $1 billion | | |
0.480% | | Over $1 billion, up to and including $1.5 billion | | |
0.435% | | Over $1.5 billion, up to and including $6.5 billion | | |
0.415% | | Over $6.5 billion, up to and including $11.5 billion | | |
0.400% | | Over $11.5 billion, up to and including $16.5 billion | | |
0.390% | | Over $16.5 billion, up to and including $19 billion | | |
0.380% | | Over $19 billion, up to and including $21.5 billion | | |
0.370% | | In excess of $21.5 billion | | |
Under a subadvisory agreement, FT Institutional, an affiliate of Advisers, provides subadvisory services to Franklin Total Return Fund. The subadvisory fee is paid by Advisers based on the Fund’s average daily net assets, and is not an additional expense of the Fund.
For the year ended October 31, 2018, each Fund’s gross effective investment management fee rate based on average daily net assets was as follows:
| | | | | | | | | | | | |
Franklin
Adjustable
U.S. Government
Securities Fund | | Franklin
Floating Rate
Daily Access
Fund | | | Franklin
Low Duration
Total Return
Fund | | | Franklin
Total Return
Fund | |
0.500% | | | 0.499% | | | | 0.495% | | | | 0.473% | |
b. Administrative Fees
Under an agreement with Advisers, FT Services provides administrative services to the Funds. The fee is paid by Advisers based on each of the Funds’ average daily net assets, and is not an additional expense of the Funds.
c. Distribution Fees
The Board has adopted distribution plans for each share class, with the exception of Class R6 and Advisor Class shares, pursuant to Rule 12b-1 under the 1940 Act. Under the Funds’ Class A and A1 reimbursement distribution plans, the Funds reimburse Distributors for costs incurred in connection with the servicing, sale and distribution of each Fund’s shares up to the maximum annual plan rate for each class. Under the Class A and A1 reimbursement distribution plans, costs exceeding the maximum for the current plan year cannot be reimbursed in subsequent periods. In addition, under the Funds’ Class C and R compensation distribution plans, the Funds pay Distributors for costs incurred in connection with the servicing, sale and distribution of each Fund’s shares up to the maximum annual plan rate for each class. The plan year, for purposes of monitoring compliance with the maximum annual plan rates, is February 1 through January 31 for each Fund.
| | | | |
| | | |
franklintempleton.com | | Annual Report | | 141 |
FRANKLIN INVESTORS SECURITIES TRUST
NOTES TO FINANCIAL STATEMENTS
3. Transactions with Affiliates (continued)
c. Distribution Fees (continued)
The maximum annual plan rates, based on the average daily net assets, for each class, are as follows:
| | | | | | | | | | | | | | | | |
| | | Franklin
Adjustable
U.S. Government Securities Fund | | | Franklin
Floating Rate Daily Access Fund | | | Franklin
Low Duration Total Return
Fund | | | Franklin
Total Return Fund | |
Reimbursement Plans: | | | | | | | | | | | | | | | | |
Class A | | | 0.25% | | | | 0.25% | | | | 0.25% | | | | 0.25% | |
Class A1 | | | 0.10% | | | | —% | | | | —% | | | | —% | |
Compensation Plans: | | | | | | | | | | | | | | | | |
Class C | | | 0.65% | | | | 0.65% | | | | 0.65% | | | | 0.65% | |
Class R | | | —% | | | | —% | | | | —% | | | | 0.50% | |
d. Sales Charges/Underwriting Agreements
Front-end sales charges and contingent deferred sales charges (CDSC) do not represent expenses of the Funds. These charges are deducted from the proceeds of sales of fund shares prior to investment or from redemption proceeds prior to remittance, as applicable. Distributors has advised the Funds of the following commission transactions related to the sales and redemptions of the Funds’ shares for the year:
| | | | | | | | | | | | | | | | |
| | | Franklin
Adjustable
U.S. Government
Securities Fund | | | Franklin
Floating Rate
Daily Access
Fund | | | Franklin
Low Duration
Total Return
Fund | | | Franklin
Total Return
Fund | |
Sales charges retained net of commissions paid to unaffiliated brokers/dealers | | | $43,548 | | | | $130,514 | | | | $165,015 | | | | $470,241 | |
CDSC retained | | | $19,675 | | | | $ 47,751 | | | | $ 34,371 | | | | $ 29,217 | |
Effective September 10, 2018, the Board approved changes to certain front-end sales charges and dealer commissions on Class A and A1 shares. Further details are disclosed in the Fund’s Prospectus.
e. Transfer Agent Fees
Each class of shares pays transfer agent fees to Investor Services for its performance of shareholder servicing obligations. Effective November 1, 2017, the fees are based on an annualized asset based fee of 0.02% plus a transaction based fee. Prior to November 1, 2017, the fees were account based fees that varied based on fund or account type. In addition, each class reimburses Investor Services for out of pocket expenses incurred and, except for Class R6, reimburses shareholder servicing fees paid to third parties. These fees are allocated daily based upon their relative proportion of such classes’ aggregate net assets. Class R6 pays Investor Services transfer agent fees specific to that class.
For the year ended October 31, 2018, the Funds paid transfer agent fees as noted in the Statements of Operations of which the following amounts were retained by Investor Services:
| | | | | | | | | | | | | | | | |
| | | Franklin
Adjustable
U.S. Government
Securities Fund | | | Franklin
Floating Rate
Daily Access
Fund | | | Franklin
Low Duration
Total Return
Fund | | | Franklin
Total Return
Fund | |
Transfer agent fees | | | $593,263 | | | | $1,465,381 | | | | $977,729 | | | | $2,012,001 | |
| | | | |
| | | |
142 | | Annual Report | | franklintempleton.com |
FRANKLIN INVESTORS SECURITIES TRUST
NOTES TO FINANCIAL STATEMENTS
f. Investments in Affiliated Management Investment Companies
Certain or all Funds invest in one or more affiliated management investment companies for purposes other than exercising a controlling influence over the management or policies. Management fees paid by the Funds are waived on assets invested in the affiliated management investment companies, as noted in the Statements of Operations, in an amount not to exceed the management and administrative fees paid directly or indirectly by each affiliate. During the year ended October 31, 2018, investments in affiliated management investment companies were as follows:
| | | | | | | | | | | | | | | | | | | | | | | | | | | | | | | | |
| | | Number of
Shares Held
at Beginning
of Year | | | Gross
Additions | | | Gross
Reductions | | | Number of
Shares
Held at End
of Year | | | Value
at End
of Year | | | Dividend
Income | | | Realized
Gain (Loss) | | | Net Change in
Unrealized
Appreciation
(Depreciation) | |
Franklin Adjustable U.S. Government Securities Fund | | | | | | | | | | | | | | | | | | | | | | | | | | | | | |
Non-Controlled Affiliates | | | | | | | | | | | | | | | | | | | | | | | | | | | | | | | | |
Institutional Fiduciary Trust Money Market Portfolio, 1.83% | | | 33,319,558 | | | | 273,953,211 | | | | (288,539,871 | ) | | | 18,732,898 | | | $ | 18,732,898 | | | $ | 347,344 | | | $ | — | | | $ | — | |
| | | | | | | | | | | | | | | | | | | | |
Franklin Floating Rate Daily Access Fund | | | | | | | | | | | | | |
Non-Controlled Affiliates | | | | | | | | | | | | | | | | | | | | | | | | | | | | | | | | |
Franklin Lower Tier Floating Rate Fund | | | 5,419,982 | | | | 1,309,212 | | | | — | | | | 6,729,194 | | | $ | 64,398,391 | | | $ | 5,725,917 | | | $ | 1,510,184 | a | | $ | (5,268,578 | ) |
Franklin Middle Tier Floating Rate Fund | | | 5,706,221 | | | | 1,131,274 | | | | — | | | | 6,837,495 | | | | 64,272,450 | | | | 4,523,357 | | | | — | | | | (2,744,666 | ) |
Institutional Fiduciary Trust Money Market Portfolio, 1.83% | | | 368,263,476 | | | | 1,141,943,569 | | | | (1,290,360,139 | ) | | | 219,846,906 | | | | 219,846,906 | | | | 4,420,915 | | | | — | | | | — | |
| | | | | | | | | | | | | | | | | | | | |
Total Affiliated Securities | | | | | | | $ | 348,517,747 | | | $ | 14,670,189 | | | $ | 1,510,184 | | | $ | (8,013,244 | ) |
| | | | | | | | | | | | | | | | | | | | |
Franklin Low Duration Total Return Fund | | | | | | | | | | | | | | | | | | | | | |
Non-Controlled Affiliates | | | | | | | | | | | | | | | | | | | | | | | | | | | | | | | | |
Franklin Lower Tier Floating Rate Fund | | | 1,893,663 | | | | — | | | | — | | | | 1,893,663 | | | $ | 18,122,357 | | | $ | 1,699,720 | | | $ | 523,977 | a | | $ | (1,609,614 | ) |
Franklin Middle Tier Floating Rate Fund | | | 2,389,308 | | | | — | | | | — | | | | 2,389,308 | | | | 22,459,491 | | | | 1,655,766 | | | | — | | | | (1,003,510 | ) |
Institutional Fiduciary Trust Money Market Portfolio, 1.83% | | | 79,803,015 | | | | 1,063,247,833 | | | | (1,084,993,035 | ) | | | 58,057,813 | | | | 58,057,813 | | | | 908,942 | | | | — | | | | — | |
| | | | | | | | | | | | | | | | | | | | |
Total Affiliated Securities | | | | | | | | | | | $ | 98,639,661 | | | $ | 4,264,428 | | | $ | 523,977 | | | $ | (2,613,124 | ) |
| | | | | | | | | | | | | | | | | | | | |
Franklin Total Return Fund | | | | | | | | | | | | | | | | | | | | | | | | | | | | | | | | |
Controlled Affiliates | | | | | | | | | | | | | | | | | | | | | | | | | | | | | | | | |
Franklin Liberty Investment Grade Corporate ETF | | | 400,000 | | | | — | | | | — | | | | 400,000 | | | $ | 9,218,000 | | | $ | 353,025 | | | $ | — | | | $ | (694,000 | ) |
| | | | | | | | | | | | | | | | | | | | |
Non-Controlled Affiliates | | | | | | | | | | | | | | | | | | | | | | | | | | | | | | | | |
Franklin Flexible Alpha Bond Fund, Class R6 | | | 10,172,940 | | | | — | | | | — | | | | 10,172,940 | | | | 99,287,894 | | | | 2,269,837 | | | $ | 98,678 | a | | | (915,565 | ) |
Franklin Liberty Senior Loan ETF | | | — | | | | 299,900 | | | | — | | | | 299,900 | | | | 7,548,483 | | | | 94,566 | | | | — | | | | (33,240 | ) |
Franklin Lower Tier Floating Rate Fund Franklin Middle Tier | | | 997,589 | | | | — | | | | — | | | | 997,589 | | | | 9,546,927 | | | | 895,419 | | | | 276,033 | a | | | (847,951 | ) |
Floating Rate Fund | | | 1,889,310 | | | | — | | | | — | | | | 1,889,310 | | | | 17,759,516 | | | | 1,309,273 | | | | — | | | | (793,510 | ) |
| | | | |
| | | |
franklintempleton.com | | Annual Report | | 143 |
FRANKLIN INVESTORS SECURITIES TRUST
NOTES TO FINANCIAL STATEMENTS
3. Transactions with Affiliates (continued)
f. Investments in Affiliated Management Investment Companies (continued)
| | | | | | | | | | | | | | | | | | | | | | | | | | | | | | | | |
| | | Number of
Shares Held
at Beginning
of Year | | | Gross
Additions | | | Gross
Reductions | | | Number of
Shares
Held at End
of Year | | | Value
at End
of Year | | | Dividend
Income | | | Realized
Gain (Loss) | | | Net Change in
Unrealized
Appreciation
(Depreciation) | |
Franklin Total Return Fund | | | | | | | | | | | | | | | | | | | | | | | | | | | | | | | | |
Non-Controlled Affiliates | | | | | | | | | | | | | | | | | | | | | | | | | | | | | | | | |
Institutional Fiduciary Trust Money Market Portfolio, 1.83% | | | 122,271,638 | | | | 1,455,731,750 | | | | (1,538,908,330 | ) | | | 39,095,058 | | | $ | 39,095,058 | | | $ | 857,336 | | | | — | | | $ | — | |
| | | | | | | | | | | | | | | | | | | | |
Total Non-Controlled Affiliates | | | | | | | | | | | $ | 173,237,878 | | | $ | 5,426,431 | | | $ | 374,711 | | | $ | (2,590,266 | ) |
| | | | | | | | | | | | | | | | | | | | |
Total Affiliated Securities | | | | | | | | | | | $ | 182,455,878 | | | $ | 5,779,456 | | | $ | 374,711 | | | $ | (3,284,266 | ) |
| | | | | | | | | | | | | | | | | | | | |
aIncludes capital gain distributions received.
g. Waiver and Expense Reimbursements
Advisers and Investor Services have contractually agreed in advance to waive or limit their respective fees and to assume as their own expense certain expenses otherwise payable by Franklin Low Duration Total Return Fund and Franklin Total Return Fund so that the expenses (excluding distribution fees and acquired fund fees and expenses and certain non-routine expenses or costs, including those relating to litigation, indemnification, reorganizations, and liquidations) for Class A, Class A1, Class C, Class R and Advisor Class of the Funds do not exceed 0.44% and 0.63%, respectively, and for Class R6 do not exceed 0.28% and 0.49%, respectively, based on the average net assets of each class until February 28, 2019. Total expenses waived or paid are not subject to recapture subsequent to the Funds’ fiscal year end.
Prior to February 1, 2018, expenses (excluding certain fees and expenses as previously disclosed) for Franklin Low Duration Total Return Fund for Class A, Class C, and Advisor Class were limited to 0.55% and expenses for Class R6 were limited to 0.38% based on the average net assets of each class.
For Franklin Adjustable U.S. Government Fund and Franklin Floating Rate Daily Access Fund, Investor Services has voluntarily agreed in advance to waive or limit its fees so that the Class R6 transfer agent fees do not exceed 0.03% and 0.02%, respectively, based on the average net assets of the class. Investor Services may discontinue this waiver in the future.
h. Other Affiliated Transactions
At October 31, 2018, one or more of the funds in Franklin Fund Allocator Series owned a percentage of the following Funds’ outstanding shares:
| | | | | | | | | | |
Franklin
Floating Rate
Daily Access
Fund | | | | | | Franklin
Low Duration
Total Return
Fund | |
| | 3.2% | | | | | | | | 15.8% | |
| | | | |
| | | |
144 | | Annual Report | | franklintempleton.com |
FRANKLIN INVESTORS SECURITIES TRUST
NOTES TO FINANCIAL STATEMENTS
i. Interfund Transactions
Certain or all Funds engaged in purchases and sales of investments with funds or other accounts that have common investment managers (or affiliated investment managers), directors, trustees or officers. These purchases and sales for the year ended October 31, 2018, were as follows:
| | | | |
| | | Franklin
Floating Rate Daily Access Fund | |
Purchases | | | $29,551,449 | |
Sales | | | $ — | |
4. Expense Offset Arrangement
The Funds have entered into an arrangement with their custodian whereby credits realized as a result of uninvested cash balances are used to reduce a portion of the Funds’ custodian expenses. During the year ended October 31, 2018, the custodian fees were reduced as noted in the Statements of Operations.
5. Income Taxes
For tax purposes, capital losses may be carried over to offset future capital gains. Capital loss carryforwards with no expiration, if any, must be fully utilized before those losses with expiration dates.
At October 31, 2018, the capital loss carryforwards were as follows:
| | | | | | | | | | | | | | | | |
| | | Franklin
Adjustable
U.S. Government
Securities Fund | | | Franklin
Floating Rate Daily Access
Fund | | | Franklin
Low Duration
Total Return
Fund | | | Franklin
Total Return
Fund | |
Capital loss carryforwards subject to expiration: | | | | | | | | | | | | | | | | |
2019 | | | $ 21,934,756 | | | | $ 10,282,409 | | | | $ 5,327,487 | | | | $ — | |
Capital loss carryforwards not subject to expiration: | | | | | | | | | | | | | | | | |
Short Term | | | 22,082,842 | | | | 16,361,915 | | | | 38,638,818 | | | | 81,811,543 | |
Long Term | | | 96,340,256 | | | | 173,848,030 | | | | 68,039,297 | | | | 117,031,294 | |
| | | | |
Total capital loss carryforwards | | | $140,357,854 | | | | $200,492,354 | | | | $112,005,602 | | | | $198,842,837 | |
| | | | |
On October 31, 2018, Franklin Adjustable U.S. Government Securities Fund had expired capital loss carryforwards of $39,689,305, which were reclassified to paid-in capital.
The tax character of distributions paid during the years ended October 31, 2018 and 2017, was as follows:
| | | | | | | | | | | | | | | | |
| | | Franklin Adjustable U.S. Government Securities Fund | | | Franklin Floating Rate Daily Access Fund | |
| | | | |
| | | 2018 | | | 2017 | | | 2018 | | | 2017 | |
Distributions paid from ordinary income | | | $20,624,727 | | | | $21,337,153 | | | | $164,276,373 | | | | $128,242,240 | |
| | | | |
| | | | |
| | | |
franklintempleton.com | | Annual Report | | 145 |
FRANKLIN INVESTORS SECURITIES TRUST
NOTES TO FINANCIAL STATEMENTS
5. Income Taxes (continued)
| | | | | | | | | | | | | | | | |
| | | Franklin Low Duration
Total Return Fund | | | Franklin Total
Return Fund | |
| | | | |
| | | 2018 | | | 2017 | | | 2018 | | | 2017 | |
Distributions paid from ordinary income | | $ | 85,070,570 | | | $ | 52,497,555 | | | $ | 129,581,343 | | | $ | 111,988,612 | |
Return of capital | | | — | | | | — | | | | 2,794,205 | | | | — | |
| | | | |
| | $ | 85,070,570 | | | $ | 52,497,555 | | | $ | 132,375,548 | | | $ | 111,988,612 | |
| | | | |
At October 31, 2018, the cost of investments, net unrealized appreciation (depreciation) and undistributed ordinary income for income tax purposes were as follows:
| | | | | | | | | | | | | | | | |
| | | Franklin
Adjustable
U.S. Government
Securities Fund | | | Franklin
Floating Rate
Daily Access
Fund | | | Franklin
Low Duration
Total Return
Fund | | | Franklin
Total Return
Fund | |
Cost of investments | | | $791,762,061 | | | | $3,819,144,354 | | | | $2,908,206,996 | | | | $4,440,439,770 | |
| | | | |
| | | | |
Unrealized appreciation | | | $ 3,337,379 | | | | $ 23,887,607 | | | | $ 11,081,352 | | | | $ 38,833,228 | |
Unrealized depreciation | | | (6,124,220 | ) | | | (77,698,699 | ) | | | (49,411,631 | ) | | | (164,019,957 | ) |
| | | | |
Net unrealized appreciation (depreciation) | | | $ (2,786,841 | ) | | | $ (53,811,092 | ) | | | $ (38,330,279 | ) | | | $ (125,186,729 | ) |
| | | | |
| | | | |
Distributable earnings – undistributed ordinary income | | | $ 165,095 | | | | $ 6,000,027 | | | | $ 549,332 | | | | $ — | |
| | | | |
Differences between income and/or capital gains as determined on a book basis and a tax basis are primarily due to differing treatments of defaulted securities, foreign currency transactions, paydown losses, bond discounts and premiums, swaps, tax straddles, short term capital gains distributions from Underlying Funds and ETFs and financial futures transactions.
6. Investment Transactions
Purchases and sales of investments (excluding short term securities) for the year ended October 31, 2018, were as follows:
| | | | | | | | | | | | | | | | |
| | | Franklin
Adjustable
U.S. Government
Securities Fund | | | Franklin
Floating Rate
Daily Access
Fund | | | Franklin
Low Duration
Total Return
Fund | | | Franklin
Total Return
Fund | |
Purchases | | | $ 96,298,495 | | | | $1,916,342,882 | | | | $1,723,077,089 | | | | $6,885,828,576 | |
Sales | | | $261,267,325 | | | | $1,882,086,064 | | | | $1,492,025,909 | | | | $7,052,760,442 | |
7. Credit Risk and Defaulted Securities
At October 31, 2018, Franklin Floating Rate Daily Access Fund, Franklin Low Duration Total Return Fund and Franklin Total Return Fund had 62.4%, 12.9% and 13.9% respectively, of their portfolio invested in high yield securities, senior secured floating rate loans, or other securities rated below investment grade and unrated securities, if any. These securities may be more sensitive to economic conditions causing greater price volatility and are potentially subject to a greater risk of loss due to default than higher rated securities.
| | | | |
| | | |
146 | | Annual Report | | franklintempleton.com |
FRANKLIN INVESTORS SECURITIES TRUST
NOTES TO FINANCIAL STATEMENTS
Franklin Total Return Fund held a defaulted security and/or other securities for which the income has been deemed uncollectible. At October 31, 2018, the value of this security was $7,770,000, representing 0.2% of the Fund’s net assets . The Fund discontinues accruing income on securities for which income has been deemed uncollectible and provides an estimate for losses on interest receivable. The security has been identified in the accompanying Consolidated Statement of Investments.
8. Restricted Securities
Certain or all Funds invest in securities that are restricted under the Securities Act of 1933 (1933 Act). Restricted securities are often purchased in private placement transactions, and cannot be sold without prior registration unless the sale is pursuant to an exemption under the 1933 Act. Disposal of these securities may require greater effort and expense, and prompt sale at an acceptable price may be difficult. The Funds may have registration rights for restricted securities. The issuer generally incurs all registration costs.
At October 31, 2018, investments in restricted securities, excluding securities exempt from registration under the 1933 Act deemed to be liquid, were as follows:
| | | | | | | | | | | | | | | | |
Principal
Amount/
Shares/
Units | | | Issuer | | Acquisition
Date | | | Cost | | | Value | |
| | Franklin Floating Rate Daily Access Fund | | | | | | | | | | | | |
| | 1,132,044 | | | a Appvion Inc | | | 6/14/18 | | | $ | 11,602,730 | | | $ | 11,581,914 | |
| | 1,458,043 | | | Remington Outdoor Co. Inc | | | 5/08/17 | | | | 72,633,617 | | | | 18,876,774 | |
| | 137,266 | | | Remington Outdoor Co. Inc., Litigation Units | | | 5/16/18 | | | | — | | | | — | |
| | | | | | | | | | | | |
| | | | Total Restricted Securities (Value is 0.8% of Net Assets) | | | | | | $ | 84,236,347 | | | $ | 30,458,688 | |
| | | | | | | | | | | | |
| | Franklin Low Duration Total Return Fund | | | | | | | | | | | | |
| | 12,326,925 | | | K2016470219 South Africa Ltd., A | | | 4/15/13 - 2/01/17 | | | $ | 92,078 | | | $ | 8,356 | |
| | 1,226,701 | | | K2016470219 South Africa Ltd., B | | | 2/01/17 | | | | 911 | | | | 831 | |
| | 948,323 | | | K2016470219 South Africa Ltd., senior secured note, 144A, PIK, 3.00%, 12/31/22 | | | 4/15/13 - 7/05/18 | | | | 1,458,480 | | | | 1,174 | |
| | 183,405 | | | K2016470260 South Africa Ltd., senior secured note, 144A, PIK, 25.00%, 12/31/22 | | | 2/01/17 - 7/05/18 | | | | 161,352 | | | | 13,544 | |
| | 72,043 | | | Remington Outdoor Co. Inc | | | 3/08/17 | | | | 3,564,519 | | | | 932,716 | |
| | 6,782 | | | Remington Outdoor Co. Inc., Litigation Units | | | 5/16/18 | | | | — | | | | — | |
| | | | | | | | | | | | |
| | | | Total Restricted Securities (Value is 0.0%† of Net Assets) | | | | | | $ | 5,277,340 | | | $ | 956,621 | |
| | | | | | | | | | | | |
| | Franklin Total Return Fund | | | | | | | | | | | | |
| | 28,762,824 | | | K2016470219 South Africa Ltd., A | | | 4/15/13 - 2/01/17 | | | $ | 221,469 | | | $ | 19,497 | |
| | 2,862,311 | | | K2016470219 South Africa Ltd., B | | | 2/01/17 | | | | 2,125 | | | | 1,940 | |
| | 2,212,754 | | | K2016470219 South Africa Ltd., senior secured note, 144A, PIK, 3.00%, 12/31/22 | | | 4/15/13 - 7/05/18 | | | | 3,476,740 | | | | 2,739 | |
| | 427,950 | | | K2016470260 South Africa Ltd., senior secured note, 144A, PIK, 25.00%, 12/31/22 | | | 2/01/17 - 7/05/18 | | | | 376,488 | | | | 31,602 | |
| | | | | | | | | | | | |
| | | | Total Restricted Securities (Value is 0.0%† of Net Assets) | | | | | | $ | 4,076,822 | | | $ | 55,778 | |
| | | | | | | | | | | | |
†Rounds to less than 0.1% of net assets.
aThe Fund also invests in unrestricted securities of the issuer, valued at $53,498,450 as of October 31, 2018.
| | | | |
| | | |
franklintempleton.com | | Annual Report | | 147 |
FRANKLIN INVESTORS SECURITIES TRUST
NOTES TO FINANCIAL STATEMENTS
9. Other Derivative Information
At October 31, 2018, the Fund’s investments in derivative contracts are reflected in the Statements of Assets and Liabilities as follows:
| | | | | | | | | | | | | | | | |
| | | Asset Derivatives | | | | | | Liability Derivatives | |
Derivative Contracts Not Accounted for as Hedging Instruments | | Statements of
Assets and Liabilities
Location | | Fair Value | | | | | | Statements of
Assets and Liabilities
Location | | Fair Value | |
Franklin Floating Rate Daily Access Fund | | | | | | | | | | | | | | |
Credit contracts | | Variation margin on centrally cleared swap contracts | | $ | — | | | | | | | Variation margin on centrally cleared swap contracts | | $ | 773,166 | a |
| | | | | | | | | | | | | | | | |
Franklin Low Duration Total Return Fund | | | | | | | | | | | | | | |
Interest rate contracts | | Variation margin on futures contracts | | $ | 750,536 | a | | | | | | Variation margin on futures contracts | | $
|
1,236,488 |
a |
| | Variation margin on centrally cleared swap contracts | | | — | | | | | | | Variation margin on centrally cleared swap contracts | | | 832,802 | a |
| | Unrealized appreciation on OTC swap contracts | | | 52,348 | | | | | | | Unrealized depreciation on OTC swap contracts | | | 917,695 | |
Foreign exchange contracts | | Unrealized appreciation on OTC forward exchange contracts | | | 1,062,482 | | | | | | | Unrealized depreciation on OTC forward exchange contracts | | | 530,354 | |
Credit contracts | | Variation margin on centrally cleared swap contracts | | | 568,379 | a | | | | | | Variation margin on centrally cleared swap contracts | | | 47,781 | a |
| | OTC swap contracts (upfront payments) | | | 408,070 | | | | | | | OTC swap contracts (upfront receipts) | | | 3,633,983 | |
| | Unrealized appreciation on OTC swap contracts | | | 288,066 | | | | | | | Unrealized depreciation on OTC swap contracts | | | 1,680,259 | |
Inflation contracts | | Variation margin on centrally cleared swap contracts | | | 527,845 | a | | | | | | Variation margin on centrally cleared swap contracts | | | — | |
| | | | | | | | | | | | | | | | |
Totals | | | | $ | 3,657,726 | | | | | | | | | $ | 8,879,362 | |
| | | | | | | | | | | | | | | | |
Franklin Total Return Fund | | | | | | | | | | | | | | | | |
Interest rate contracts | | Variation margin on futures contracts | | $ | — | | | | | | | Variation margin on futures contracts | | $ | 9,350,864 | a |
| | Unrealized appreciation on OTC swap contracts | | | 1,534,019 | | | | | | | Unrealized depreciation on OTC swap contracts | | | 1,290,789 | |
Foreign exchange contracts | | Unrealized appreciation on OTC forward exchange contracts | | | 3,102,352 | | | | | | | Unrealized depreciation on OTC forward exchange contracts | | | 1,948,063 | |
Credit contracts | | Variation margin on centrally cleared swap contracts | | | 204,356 | a | | | | | | Variation margin on centrally cleared swap contracts | | | 225,036 | a |
| | OTC swap contracts (upfront payments) | | | 2,001,015 | | | | | | | OTC swap contracts (upfront receipts) | | | 9,166,128 | |
| | Unrealized appreciation on OTC swap contracts | | | 954,998 | | | | | | | Unrealized depreciation on OTC swap contracts | | | 4,151,949 | |
Inflation contracts | | Variation margin on centrally cleared swap contracts | | | 515,278 | a | | | | | | Variation margin on centrally cleared swap contracts | | | — | |
| | Unrealized appreciation on OTC swap contracts | | | 1,304,925 | | | | | | | Unrealized depreciation on OTC swap contracts | | | — | |
Value recovery instruments | | Investments in securities, at value | | | 244,470 | b | | | | | | | | | | |
| | | | | | | | | | | | | | | | |
Totals | | | | $ | 9,861,413 | | | | | | | | | $ | 26,132,829 | |
| | | | | | | | | | | | | | | | |
aThis amount reflects the cumulative appreciation (depreciation) of futures contracts and centrally cleared swap contracts as reported in the Statement of Investments. Only the variation margin receivable/payable at year end is separately reported within the Statements of Assets and Liabilities. Prior variation margin movements were recorded to cash upon receipt or payment.
bVRI are included in investments in securities, at value in the Statements of Assets and Liabilities.
| | | | |
| | | |
148 | | Annual Report | | franklintempleton.com |
FRANKLIN INVESTORS SECURITIES TRUST
NOTES TO FINANCIAL STATEMENTS
For the year ended October 31, 2018, the effect of derivative contracts in the Funds’ Statements of Operations was as follows:
| | | | | | | | | | | | | | | | |
Derivative Contracts Not Accounted for as Hedging Instruments | | Statements of Operations
Location | | Net Realized
Gain (Loss) for
the Year | | | | | | Statements of Operations Location | | Net Change in
Unrealized
Appreciation
(Depreciation)
for the Year | |
| | Net realized gain (loss) from: | | | | | | | | | | Net change in unrealized appreciation (depreciation) on: | | | | |
Franklin Floating Rate Daily Access Fund | | | | | | | | | | | | | | |
Credit contracts | | Swap contracts | | $ | (1,599,940 | ) | | | | | | Swap contracts | | $ | 405,854 | |
Franklin Low Duration Total Return Fund | | | | | | | | | | | | | | |
Interest rate contracts | | Futures contracts | | $ | (5,926,753 | ) | | | | | | Futures contracts | | $ | 863,806 | |
| | Swap contracts | | | (1,337,478 | ) | | | | | | Swap contracts | | | (1,297,878 | ) |
Foreign exchange contracts | | Forward exchange contracts | | | (840,981 | ) | | | | | | Forward exchange contracts | | | (206,490 | ) |
Credit contracts | | Swap contracts | | | 1,060,437 | | | | | | | Swap contracts | | | 1,417,705 | |
Inflation contracts | | Swap contracts | | | 616,140 | | | | | | | Swap contracts | | | 70,551 | |
| | | | | | | | | | | | | | | | |
Totals | | | | $ | (6,428,635 | ) | | | | | | | | $ | 847,694 | |
| | | | | | | | | | | | | | | | |
Franklin Total Return Fund | | | | | | | | | | | | | | |
Interest rate contracts | | Futures contracts | | $ | (22,319,051 | ) | | | | | | Futures contracts | | $ | (3,318,505 | ) |
| | Swap contracts | | | (1,334,056 | ) | | | | | | Swap contracts | | | (2,049,918 | ) |
Foreign exchange contracts | | Forward exchange contracts | | | (3,017,344 | ) | | | | | | Forward exchange contracts | | | (2,259,058 | ) |
Credit contracts | | Swap contracts | | | 253,503 | | | | | | | Swap contracts | | | 1,633,231 | |
Inflation contracts | | Swap contracts | | | 2,246,446 | | | | | | | Swap contracts | | | (883,928 | ) |
Value recovery instruments | | Investments | | | — | | | | | | | Investments | | | (27,796 | )a |
| | | | | | | | | | | | | | | | |
Totals | | | | $ | (24,170,502 | ) | | | | | | | | $ | (6,905,974 | ) |
| | | | | | | | | | | | | | | | |
aVRI are included in net change in unrealized appreciation (depreciation) on investments in the Statements of Operations.
For the year ended October 31, 2018, the average month end notional amount of futures contracts and swap contracts and the average month end contract value for forward exchange contracts, and average month end fair value of VRI, were as follows:
| | | | | | | | | | | | |
| | | Franklin Floating Rate
Daily Access Fund | | | Franklin
Low Duration
Total Return Fund | | | Franklin Total
Return Fund | |
Futures Contracts | | | $ — | | | | $464,707,320 | | | | $542,583,360 | |
Swap contracts | | | 50,176,000 | | | | 507,850,414 | | | | 950,753,671 | |
Forward exchange contracts | | | — | | | | 94,349,601 | | | | 347,924,426 | |
VRI | | | — | | | | — | | | | 291,070 | |
| | | | |
| | | |
franklintempleton.com | | Annual Report | | 149 |
FRANKLIN INVESTORS SECURITIES TRUST
NOTES TO FINANCIAL STATEMENTS
9. Other Derivative Information (continued)
At October 31, 2018, the Funds’ OTC derivative assets and liabilities are as follows:
| | | | | | | | | | |
| | | | | Gross Amounts of Assets and Liabilities Presented
in the Statements of Assets and Liabilities | |
| | | | | Assetsa | | | Liabilitiesa | |
Derivatives | | | | | | | | | | |
Franklin Low Duration | | | | | | | | | | |
Total Return Fund | | | | | | | | | | |
Forward exchange contracts | | | | | $1,062,482 | | | | $ 530,354 | |
Swap contracts | | | | | 748,484 | | | | 6,231,937 | |
| | | | | | |
Total | | | | | $1,810,966 | | | | $ 6,762,291 | |
| | | | | | |
Franklin Total | | | | | | | | | | |
Return Fund | | | | | | | | | | |
Forward exchange contracts | | | | | $3,102,352 | | | | $ 1,948,063 | |
Swap contracts | | | | | 5,794,957 | | | | 14,608,866 | |
| | | | | | |
Total | | | | | $8,897,309 | | | | $16,556,929 | |
| | | | | | |
aAbsent an event of default or early termination, OTC derivative assets and liabilities are presented gross and not offset in the Statements of Assets and Liabilities.
At October 31, 2018, the Funds’ OTC derivative assets, which may be offset against the Funds’ OTC derivative liabilities and collateral received from the counterparty, are as follows:
| | | | | | | | | | | | | | | | | | | | |
| | | | | | Amounts Not Offset in the Statements of Assets and Liabilities | | | | |
| | | Gross Amounts of
Assets Presented in the Statements of
Assets and Liabilities | | | Financial
Instruments
Available
for Offset | | | Financial
Instruments
Collateral
Receiveda | | | Cash
Collateral
Received | | | Net Amount
(Not less
than zero) | |
Franklin Low Duration Total Return Fund | | | | | | | | | | | | | | | | | | | | |
Counterparty | | | | | | | | | | | | | | | | | | | | |
BNDP | | | $ — | | | | $ — | | | | $ — | | | | $ — | | | | $ — | |
BOFA | | | — | | | | — | | | | — | | | | — | | | | — | |
BZWS. | | | 404,243 | | | | (404,243 | ) | | | — | | | | — | | | | — | |
CITI | | | 198,473 | | | | (198,473 | ) | | | — | | | | — | | | | — | |
DBAB | | | 243,596 | | | | (49,548 | ) | | | (100,546 | ) | | | — | | | | 93,502 | |
FBCO | | | — | | | | — | | | | — | | | | — | | | | — | |
GSCO | | | 74,620 | | | | (74,620 | ) | | | — | | | | — | | | | — | |
JPHQ | | | 890,034 | | | | (890,034 | ) | | | — | | | | — | | | | — | |
| | | | |
Total | | | $1,810,966 | | | | $(1,616,918 | ) | | | $(100,546 | ) | | | $ — | | | | $93,502 | |
| | | | |
| | | | |
| | | |
150 | | Annual Report | | franklintempleton.com |
FRANKLIN INVESTORS SECURITIES TRUST
NOTES TO FINANCIAL STATEMENTS
| | | | | | | | | | | | | | | | | | | | |
| | | | | | Amounts Not Offset in the Statements of Assets and Liabilities | | | | |
| | | Gross Amounts of
Assets Presented in
the Statements of
Assets and Liabilities | | | Financial
Instruments
Available
for Offset | | | Financial
Instruments
Collateral
Receiveda,b | | | Cash
Collateral
Received | | | Net Amount
(Not less
than zero) | |
Franklin Total Return Fund | | | | | | | | | | | | | | | | | | | | |
Counterparty | | | | | | | | | | | | | | | | | | | | |
BNDP | | | $ 4,167 | | | | $ (4,167 | ) | | | $ — | | | | $ — | | | | $ — | |
BOFA | | | 259,069 | | | | (216,853 | ) | | | — | | | | — | | | | 42,216 | |
BZWS | | | 1,828,287 | | | | (1,211,525 | ) | | | (616,762 | ) | | | — | | | | — | |
CITI | | | 547,098 | | | | (547,098 | ) | | | — | | | | — | | | | — | |
DBAB | | | 498,107 | | | | (498,107 | ) | | | — | | | | — | | | | — | |
FBCO | | | — | | | | — | | | | — | | | | — | | | | — | |
GSCO | | | 8,321 | | | | (8,321 | ) | | | — | | | | — | | | | — | |
HSBK | | | 1,439,792 | | | | — | | | | (1,159,736 | ) | | | — | | | | 280,056 | |
JPHQ | | | 4,312,468 | | | | (4,312,468 | ) | | | — | | | | — | | | | — | |
| | | | |
Total | | | $8,897,309 | | | | $(6,798,539 | ) | | | $(1,776,498 | ) | | | $ — | | | | $322,272 | |
| | | | |
At October 31, 2018, the Funds’ OTC derivative liabilities, which may be offset against the Funds’ OTC derivative assets and collateral pledged to the counterparty, are as follows:
| | | | | | | | | | | | | | | | | | | | |
| | | | | | Amounts Not Offset in the Statements of Assets and Liabilities | | | | |
| | | Gross Amounts of
Liabilities Presented in
the Statements of
Assets and Liabilities | | | Financial
Instruments
Available
for Offset | | | Financial
Instruments
Collateral
Pledged | | | Cash
Collateral
Pledgedb | | | Net Amount
(Not less
than zero) | |
| Franklin Low Duration Total Return Fund Counterparty | | | | | | | | | | | | | | | | | | | | |
BNDP | | | $ 55,124 | | | | $ — | | | | $ — | | | | $ — | | | | $ 55,124 | |
BOFA | | | 67,587 | | | | — | | | | — | | | | (67,587 | ) | | | — | |
BZWS | | | 416,832 | | | | (404,243 | ) | | | — | | | | — | | | | 12,589 | |
CITI | | | 2,173,693 | | | | (198,473 | ) | | | — | | | | (1,760,000 | ) | | | 215,220 | |
DBAB | | | 49,548 | | | | (49,548 | ) | | | — | | | | — | | | | — | |
FBCO | | | 38,313 | | | | — | | | | — | | | | — | | | | 38,313 | |
GSCO | | | 657,270 | | | | (74,620 | ) | | | — | | | | (510,000 | ) | | | 72,650 | |
JPHQ | | | 3,303,924 | | | | (890,034 | ) | | | — | | | | (2,090,000 | ) | | | 323,890 | |
| | | | |
Total | | | $6,762,291 | | | | $(1,616,918 | ) | | | $ — | | | | $(4,427,587 | ) | | | $717,786 | |
| | | | |
| | | | |
| | | |
franklintempleton.com | | Annual Report | | 151 |
FRANKLIN INVESTORS SECURITIES TRUST
NOTES TO FINANCIAL STATEMENTS
9. Other Derivative Information (continued)
| | | | | | | | | | | | | | | | | | | | |
| | | | | | Amounts Not Offset in the Statements of Assets and Liabilities | | | | |
| | | Gross Amounts of
Liabilities Presented in
the Statements of
Assets and Liabilities | | | Financial
Instruments
Available
for Offset | | | Financial
Instruments
Collateral
Pledged | | | Cash
Collateral
Pledgedb | | | Net Amount
(Not less
than zero) | |
Franklin Total Return Fund | | | | | | | | | | | | | | | | | | | | |
Counterparty | | | | | | | | | | | | | | | | | | | | |
BNDP | | | $ 91,228 | | | | $ (4,167 | ) | | | $ — | | | | $ — | | | | $ 87,061 | |
BOFA | | | 216,853 | | | | (216,853 | ) | | | — | | | | — | | | | — | |
BZWS | | | 1,211,525 | | | | (1,211,525 | ) | | | — | | | | — | | | | — | |
CITI | | | 6,517,657 | | | | (547,098 | ) | | | — | | | | (5,970,559 | ) | | | — | |
DBAB | | | 558,692 | | | | (498,107 | ) | | | — | | | | — | | | | 60,585 | |
FBCO | | | 105,234 | | | | — | | | | — | | | | (105,234 | ) | | | — | |
GSCO | | | 1,153,161 | | | | (8,321 | ) | | | — | | | | (1,030,000 | ) | | | 114,840 | |
HSBK | | | — | | | | — | | | | — | | | | — | | | | — | |
JPHQ | | | 6,702,579 | | | | (4,312,468 | ) | | | — | | | | (2,050,000 | ) | | | 340,111 | |
| | | | |
Total | | | $16,556,929 | | | | $(6,798,539 | ) | | | $ — | | | | $(9,155,793 | ) | | | $602,597 | |
| | | | |
aAt October 31, 2018, the Fund received United Kingdom Treasury Bonds and U.S. Treasury Bonds as collateral for derivatives.
bIn some instances, the collateral amounts disclosed in the table above were adjusted due to the requirement to limit collateral amounts to avoid the effect of overcollateralization. Actual collateral received and/or pledged may be more than the amounts disclosed herein.
See Note 1(e) regarding derivative financial instruments.
See Abbreviations on page 158.
10. Holdings of 5% Voting Securities of Portfolio Companies
The 1940 Act defines “affiliated companies” to include investments in portfolio companies in which a fund owns 5% or more of the outstanding voting securities. During the year ended October 31, 2018, investments in “affiliated companies” were as follows:
| | | | | | | | | | | | | | | | | | | | | | | | | | | | | | | | |
| Name of Issuer | | Number of
Held
at Beginning
of Year | | | Gross
Additions | | | Gross
Reductions | | | Number of
Held
at End
of Year | | | Value
at End
of Year | | | Investment
Income | | | Realized
Gain
(Loss) | | | Net Change in
Unrealized
Appreciation
(Depreciation) | |
| | | | | | | | |
| Franklin Floating Rate Daily Access Fund | | | | | | | | | | | | | | | | | | | | | | | | | | | | | | | | |
| Non-Controlled Affiliates | | | | | | | | | | | | | | | | | | | | | | | | | | | | | | | | |
| | | | | | | | | | | | | | | | | | | | | | | Dividends | | | | | | | | | |
| | | | | | | | | | | | | | | | | | | | | | | | | | | | | | | | |
Appvion Inc. | | | — | | | | 1,132,044 | | | | — | | | | 1,132,044 | | | $ | 11,581,914 | | | $ | — | | | $ | — | | | $ | (20,816 | ) |
Remington Outdoor Co. Inc. | | | — | | | | 1,458,043 | | | | — | | | | 1,458,043 | | | | 18,876,774 | | | | — | | | | — | | | | (53,756,843 | ) |
Remington Outdoor Co. Inc., Litigation | | | | | | | | | | | | | | | | | | | | | | | | | | | | | | | | |
Units | | | — | | | | 137,266 | | | | — | | | | 137,266 | | | | — | | | | — | | | | — | | | | — | |
| | | | | | | | | | | | | | | | | | | | |
| | | | | | | | | | | | | | | | | | $ | 30,458,688 | | | $ | — | | | $ | — | | | $ | (53,777,659 | ) |
| | | | | | | | | | | | | | | | | | | | |
| | | | | | | | |
| | | | | | | | | | | | | | | | | | | | | | | Interest | | | | | | | | | |
| | | | | | | | | | | | | | | | | | | | | | | | | | | | | | | | |
Appvion Inc, Term Loan, 8.40%,
(3-month USD LIBOR + 6.00%), 6/15/26 | | | — | | | | 53,657,654 | | | | (159,204 | ) | | | 53,498,450 | | | | 53,498,450 | | | | 1,730,358 | | | | — | | | | 144,833 | |
| | | | | | | | | | | | | | | | | | | | |
Total Affiliated Securities (Value is 2.3% of Net Assets) | | | | | | | | | | | $ | 83,957,138 | | | $ | 1,730,358 | | | $ | — | | | $ | (53,632,826 | ) |
| | | | | | | | | | | | | | | | | | | | |
| | | | |
| | | |
152 | | Annual Report | | franklintempleton.com |
FRANKLIN INVESTORS SECURITIES TRUST
NOTES TO FINANCIAL STATEMENTS
11. Credit Facility
The Funds, together with other U.S. registered and foreign investment funds (collectively, Borrowers), managed by Franklin Templeton Investments, are borrowers in a joint syndicated senior unsecured credit facility totaling $2 billion (Global Credit Facility) which matures on February 8, 2019. This Global Credit Facility provides a source of funds to the Borrowers for temporary and emergency purposes, including the ability to meet future unanticipated or unusually large redemption requests.
Under the terms of the Global Credit Facility, the Funds shall, in addition to interest charged on any borrowings made by the Funds and other costs incurred by the Funds, pay their share of fees and expenses incurred in connection with the implementation and maintenance of the Global Credit Facility, based upon their relative share of the aggregate net assets of all of the Borrowers, including an annual commitment fee of 0.15% based upon the unused portion of the Global Credit Facility. These fees are reflected in other expenses in the Statements of Operations. During the year ended October 31, 2018, the Funds did not use the Global Credit Facility.
12. Fair Value Measurements
The Funds follow a fair value hierarchy that distinguishes between market data obtained from independent sources (observable inputs) and the Funds’ own market assumptions (unobservable inputs). These inputs are used in determining the value of the Funds’ financial instruments and are summarized in the following fair value hierarchy:
| | • | | Level 1 – quoted prices in active markets for identical financial instruments |
| | • | | Level 2 – other significant observable inputs (including quoted prices for similar financial instruments, interest rates, prepayment speed, credit risk, etc.) |
| | • | | Level 3 – significant unobservable inputs (including the Funds’ own assumptions in determining the fair value of financial instruments) |
The input levels are not necessarily an indication of the risk or liquidity associated with financial instruments at that level.
For movements between the levels within the fair value hierarchy, the Funds have adopted a policy of recognizing the transfers as of the date of the underlying event which caused the movement.
A summary of inputs used as of October 31, 2018, in valuing the Funds’ assets and liabilities carried at fair value, is as follows:
| | | | | | | | | | | | | | | | |
| | | Level 1 | | | Level 2 | | | Level 3 | | | Total | |
| | | | | | | | | | | | | | | | |
Franklin Adjustable U.S. Government Securities Fund | | | | | | | | | |
Assets: | | | | | | | | | | | | | | | | |
Investments in Securities:a | | | | | | | | | | | | | | | | |
Mortgage-Backed Securities | | $ | — | | | $ | 770,242,322 | | | $ | — | | | $ | 770,242,322 | |
Short Term Investments | | | 18,732,898 | | | | — | | | | — | | | | 18,732,898 | |
| | | | |
Total Investments in Securities | | $ | 18,732,898 | | | $ | 770,242,322 | | | $ | — | | | $ | 788,975,220 | |
| | | | |
| | | | |
| | | |
franklintempleton.com | | Annual Report | | 153 |
FRANKLIN INVESTORS SECURITIES TRUST
NOTES TO FINANCIAL STATEMENTS
12. Fair Value Measurements (continued)
| | | | | | | | | | | | | | | | |
| | | Level 1 | | | Level 2 | | | Level 3 | | | Total | |
| | | | | | | | | | | | | | | | |
Franklin Floating Rate Daily Access Fund | | | | | | | | | | | | | | | | |
Assets: | | | | | | | | | | | | | | | | |
Investments in Securities:a | | | | | | | | | | | | | | | | |
Equity Investments:b | | | | | | | | | | | | | | | | |
Diversified Support Services | | $ | — | | | $ | — | | | $ | 18,876,774 | c | | $ | 18,876,774 | |
Forest Products | | | — | | | | — | | | | 11,581,914 | | | | 11,581,914 | |
Oil & Gas Exploration & Production | | | — | | | | 10,365,033 | | | | — | | | | 10,365,033 | |
All Other Equity Investments | | | 128,670,841 | | | | — | | | | — | | | | 128,670,841 | |
Corporate Bonds | | | — | | | | 15,392,337 | | | | — | | | | 15,392,337 | |
Senior Floating Rate Interests: | | | | | | | | | | | | | | | | |
Personal Products | | | — | | | | — | | | | 45,928,772 | | | | 45,928,772 | |
All Other Senior Floating Rate Interests | | | — | | | | 2,593,956,042 | | | | — | | | | 2,593,956,042 | |
Asset-Backed Securities | | | — | | | | 517,774,825 | | | | — | | | | 517,774,825 | |
Short Term Investments | | | 324,579,988 | | | | 101,755,855 | | | | — | | | | 426,335,843 | |
| | | | |
Total Investments in Securities | | $ | 453,250,829 | | | $ | 3,239,244,092 | | | $ | 76,387,460 | | | $ | 3,768,882,381 | |
| | | | |
Liabilities: | | | | | | | | | | | | | | | | |
Other Financial Instruments: | | | | | | | | | | | | | | | | |
Swap Contracts | | $ | — | | | $ | 773,166 | | | $ | — | | | $ | 773,166 | |
| | | | |
Franklin Low Duration Total Return Fund | | | | | | | | | | | | | | | | |
Assets: | | | | | | | | | | | | | | | | |
Investments in Securities:a | | | | | | | | | | | | | | | | |
Equity Investments:b | | | | | | | | | | | | | | | | |
Commercial & Professional Services | | $ | — | | | $ | — | | | $ | 932,716 | c | | $ | 932,716 | |
Retailing | | | — | | | | — | | | | 9,187 | | | | 9,187 | |
All Other Equity Investments | | | 76,725,007 | | | | — | | | | — | | | | 76,725,007 | |
Corporate Bonds: | | | | | | | | | | | | | | | | |
Retailing | | | — | | | | 38,709,356 | | | | 1,174 | | | | 38,710,530 | |
All Other Corporate Bonds | | | — | | | | 960,290,235 | | | | — | | | | 960,290,235 | |
Senior Floating Rate Interests | | | — | | | | 105,659,782 | | | | — | | | | 105,659,782 | |
Foreign Government and Agency Securities | | | — | | | | 33,225,247 | | | | — | | | | 33,225,247 | |
U.S. Government and Agency Securities | | | — | | | | 395,672,563 | | | | — | | | | 395,672,563 | |
Marketplace Loans | | | — | | | | — | | | | 5,225,292 | | | | 5,225,292 | |
Asset-Backed Securities and Commercial Mortgage-Backed Securities | | | — | | | | 1,153,025,121 | | | | — | | | | 1,153,025,121 | |
Mortgage-Backed Securities | | | — | | | | 23,647,331 | | | | — | | | | 23,647,331 | |
Municipal Bonds | | | — | | | | 22,276,969 | | | | — | | | | 22,276,969 | |
Escrows and Litigation Trusts | | | — | | | | — | | | | — | c | | | — | |
Short Term Investments | | | 58,057,813 | | | | — | | | | — | | | | 58,057,813 | |
| | | | |
Total Investments in Securities | | $ | 134,782,820 | | | $ | 2,732,506,604 | | | $ | 6,168,369 | | | $ | 2,873,457,793 | |
| | | | |
Other Financial Instruments: | | | | | | | | | | | | | | | | |
Futures Contracts | | $ | 750,536 | | | $ | — | | | $ | — | | | $ | 750,536 | |
Forward Exchange Contracts | | | — | | | | 1,062,482 | | | | — | | | | 1,062,482 | |
Swap Contracts | | | — | | | | 1,436,638 | | | | — | | | | 1,436,638 | |
| | | | |
Total Other Financial Instruments | | $ | 750,536 | | | $ | 2,499,120 | | | $ | — | | | $ | 3,249,656 | |
| | | | |
Liabilities: | | | | | | | | | | | | | | | | |
Other Financial Instruments: | | | | | | | | | | | | | | | | |
Futures Contracts | | $ | 1,236,488 | | | $ | — | | | $ | — | | | $ | 1,236,488 | |
Forward Exchange Contracts | | | — | | | | 530,354 | | | | — | | | | 530,354 | |
Swap Contracts | | | — | | | | 3,478,537 | | | | — | | | | 3,478,537 | |
| | | | |
Total Other Financial Instruments | | $ | 1,236,488 | | | $ | 4,008,891 | | | $ | — | | | $ | 5,245,379 | |
| | | | |
| | | | |
| | | |
154 | | Annual Report | | franklintempleton.com |
FRANKLIN INVESTORS SECURITIES TRUST
NOTES TO FINANCIAL STATEMENTS
12. Fair Value Measurements (continued)
| | | | | | | | | | | | | | | | |
| | | Level 1 | | | Level 2 | | | Level 3 | | | Total | |
| | | | | | | | | | | | | | | | |
| | | | |
| Franklin Total Return Fund | | | | | | | | | | | | | | | | |
Assets: | | | | | | | | | | | | | | | | |
Investments in Securities:a | | | | | | | | | | | | | | | | |
Equity Investments:b | | | | | | | | | | | | | | | | |
Consumer Services | | $ | — | | | $ | — | | | $ | 34,113 | | | $ | 34,113 | |
Retailing | | | — | | | | — | | | | 21,437 | | | | 21,437 | |
All Other Equity Investments | | | 162,747,094 | | | | — | | | | — | | | | 162,747,094 | |
Corporate Bonds: | | | | | | | | | | | | | | | | |
Retailing | | | — | | | | 58,924,211 | | | | 2,739 | | | | 58,926,950 | |
All Other Corporate Bonds | | | — | | | | 1,307,287,687 | | | | — | | | | 1,307,287,687 | |
Senior Floating Rate Interests | | | — | | | | 170,770,973 | | | | — | | | | 170,770,973 | |
Foreign Government and Agency Securities | | | — | | | | 55,886,333 | | | | — | | | | 55,886,333 | |
U.S. Government and Agency Securities | | | — | | | | 400,955,772 | | | | — | | | | 400,955,772 | |
Asset-Backed Securities and Commercial Mortgage-Backed Securities: | | | | | | | | | | | | | | | | |
Banks | | | — | | | | 27,106,866 | | | | 12,079 | | | | 27,118,945 | |
All Other Asset-Backed Securities and Commercial Mortgage-Backed Securities | | | — | | | | 1,035,473,172 | | | | — | | | | 1,035,473,172 | |
Mortgage-Backed Securities | | | — | | | | 994,641,921 | | | | — | | | | 994,641,921 | |
Municipal Bonds | | | — | | | | 78,915,900 | | | | — | | | | 78,915,900 | |
Escrows and Litigation Trusts | | | — | | | | — | | | | — | c | | | — | |
Short Term Investments | | | 39,095,058 | | | | — | | | | — | | | | 39,095,058 | |
| | | | |
Total Investments in Securities | | $ | 201,842,152 | | | $ | 4,129,962,835 | | | $ | 70,368 | | | $ | 4,331,875,355 | |
| | | | |
Other Financial Instruments: | | | | | | | | | | | | | | | | |
Forward Exchange Contracts | | $ | — | | | $ | 3,102,352 | | | $ | — | | | $ | 3,102,352 | |
Swap Contracts | | | — | | | | 4,513,576 | | | | — | | | | 4,513,576 | |
| | | | |
Total Other Financial Instruments | | $ | — | | | $ | 7,615,928 | | | $ | — | | | $ | 7,615,928 | |
| | | | |
Liabilities: | | | | | | | | | | | | | | | | |
Other Financial Instruments: | | | | | | | | | | | | | | | | |
Futures Contracts | | $ | 9,350,864 | | | $ | — | | | $ | — | | | $ | 9,350,864 | |
Forward Exchange Contracts | | | — | | | | 1,948,063 | | | | — | | | | 1,948,063 | |
Swap Contracts. | | | — | | | | 5,667,774 | | | | — | | | | 5,667,774 | |
| | | | |
Total Other Financial Instruments | | $ | 9,350,864 | | | $ | 7,615,837 | | | $ | — | | | $ | 16,966,701 | |
| | | | |
aFor detailed categories, see the accompanying Statement of Investments.
bIncludes common and preferred stocks and management investment companies as well as other equity interests.
cIncludes securities determined to have no value at October 31, 2018.
| | | | |
| | | |
franklintempleton.com | | Annual Report | | 155 |
FRANKLIN INVESTORS SECURITIES TRUST
NOTES TO FINANCIAL STATEMENTS
12. Fair Value Measurements (continued)
A reconciliation of assets in which Level 3 inputs are used in determining fair value is presented when there are significant Level 3 financial instruments at the beginning and/or end of the year. At October 31, 2018, the reconciliation of assets is as follows:
| | | | | | | | | | | | | | | | | | | | | | | | | | | | | | | | | | | | | | | | |
| | | Balance at
Beginning of
Year | | | Purchases | | | Sales | | | Transfer
Into
Level 3a | | | Transfer
Out of
Level 3b | | | Cost Basis
Adjustments | | | Net
Realized
Gain
(Loss) | | | Net
Unrealized
Appreciation
(Depreciation) | | | Balance
at End
of Year | | | Net Change in
Unrealized
Appreciation
(Depreciation)
on Assets
Held at
Year End | |
| | | | | | | | | | |
Franklin Floating Rate Daily Access
Fund | | | | | | | | | | | | | | | | | | | | | | | | | | | | | | | | | | | | | | | | |
| Assets: | | | | | | | | | | | | | | | | | | | | | | | | | | | | | | | | | | | | | | | | |
Investments in Securities: | | | | | | | | | | | | | | | | | | | | | | | | | | | | | | | | | | | | | | | | |
Equity Investments:c | | | | | | | | | | | | | | | | | | | | | | | | | | | | | | | | | | | | | | | | |
Diversified Support Services | | $ | — | | | | $ — | | | | $— | | | $ | 18,105,222 | | | $ | — | | | | $— | | | | $— | | | | $771,552 | | | $ | 18,876,774 | d | | | $771,552 | |
Forest Products | | | — | | | | — | | | | — | | | | 11,602,730 | | | | — | | | | — | | | | — | | | | (20,816 | ) | | | 11,581,914 | | | | (20,816 | ) |
Senior Floating Rate Interests: | | | | | | | | | | | | | | | | | | | | | | | | | | | | | | | | | | | | | | | | |
Paper & Forest Products | | | 30,211,103 | | | | — | | | | — | | | | — | | | | (30,211,103 | ) | | | — | | | | — | | | | — | | | | — | | | | — | |
Personal Products | | | — | | | | 506,182 | | | | — | | | | 45,992,958 | | | | — | | | | — | | | | — | | | | (570,368 | ) | | | 45,928,772 | | | | (570,368 | ) |
Short Term Investments | | | 27,942,353 | | | | — | | | | — | | | | — | | | | (27,942,353 | ) | | | — | | | | — | | | | — | | | | — | | | | — | |
| | | | |
| | | | | | | | | | |
Total Investments in Securities | | $ | 58,153,456 | | | | $506,182 | | | | $— | | | $ | 75,700,910 | | | $ | (58,153,456 | ) | | | $— | | | | $— | | | | $180,368 | | | $ | 76,387,460 | | | | $180,368 | |
| | | | |
Other Financial Instruments: | | | | | | | | | | | | | | | | | | | | | | | | | | | | | | | | | | | | | | | | |
Unfunded Loan Commitments | | $ | 576,475 | | | | $ — | | | | $— | | | $ | — | | | $ | (576,475 | ) | | | $— | | | | $— | | | | $ — | | | $ | — | | | | $ — | |
| | | | |
Total Other Financial Instruments | | $ | 576,475 | | | | $ — | | | | $— | | | $ | — | | | $ | (576,475 | ) | | | $— | | | | $— | | | | $ — | | | $ | — | | | | $ — | |
| | | | |
aThe investments were transferred into Level 3 as a result of the unavailability of a quoted market price in an active market for identical securities and other significant observable valuation inputs. May include amounts related to a corporate action.
bThe investments were transferred out of Level 3 as a result of the availability of a quoted price in an active market for identical securities and other significant observable valuation inputs. May include amounts related to a corporate action.
cIncludes common stocks and other equity interests.
dIncludes securities determined to have no value.
| | | | |
| | | |
156 | | Annual Report | | franklintempleton.com |
FRANKLIN INVESTORS SECURITIES TRUST
NOTES TO FINANCIAL STATEMENTS
Significant unobservable valuation inputs for material Level 3 financial instruments and impact to fair value as a result of changes in unobservable valuation inputs as of October 31, 2018, are as follows:
| | | | | | | | | | | | | | | | | | |
| Description | | Fair Value
at End of
Year | | | Valuation Technique | | | Unobservable Input | | Amount/
Range | | | Impact to Fair
Value if Input
Increasesa | |
| | | | | |
| Franklin Floating Rate Daily Access | | | | | | | | | | | | | | | | | | |
| Fund | | | | | | | | | | | | | | | | | | |
| Assets: | | | | | | | | | | | | | | | | | | |
Investments in Securities: | | | | | | | | | | | | | | | | | | |
Equity Investments: | | | | | | | | | | | | | | | | | | |
Diversified Support Services | | $ | 18,876,774 | b | |
| Discounted cash
flow |
| | Discount for lack of marketability | | | 20.0% | | | | Decrease | |
| | | | | | | | | | Long-term revenue growth rate | | | 1.0% | | | | Increase | |
| | | | | | | | | | Weighted average cost of capital | | | 12.8% | | | | Decrease | c |
| | | | | | | | Consensus Pricing | | | Offered / Bid quotes | | | $8.00 - $10.00 | | | | Increase | |
Forest Products | | | 11,581,914 | | | | Market Comparables | | | Discount for lack of marketability | | | 20.0% | | | | Decrease | d |
| | | | | | | | | | | EV/EBITDA multiple | | | 5.4x | | | | Increase | d |
Senior Floating Rate Interests: | | | | | | | | | | | | | | | | | | |
Personal Products | | | 45,406,212 | | |
| Discounted cash
flow |
| | Discount rate | | | 12.1% - 13.1% | | | | Decrease | c |
| | | | | | | | | | | Free cash flow | | | $66.6 (mil) | | | | Increase | c |
All other investmentse | | | 522,560 | b | | | | | | | | | | | | | | |
| | | | | |
Total | | $ | 76,387,460 | | | | | | | | | | | | | | | |
aRepresents the directional change in the fair value of the Level 3 financial instruments that would result from a significant and reasonable increase in the corresponding input. A significant and reasonable decrease in the input would have the opposite effect. Significant impacts, if any, to fair value and/or net assets have been indicated.
bIncludes securities determined to have no value at October 31, 2018.
cRepresents a significant impact to fair value and net assets.
dRepresents a significant impact to fair value but not net assets.
eIncludes financial instruments with values derived using private transaction prices or non-public third party pricing information which is unobservable. May also include fair value of immaterial financial instruments and developed using various valuation techniques and unobservable inputs.
Abbreviations List
EBITDA - Earnings before interest, taxes, depreciation and amortization
EV - Enterprise value
13. New Accounting Pronouncements
In March 2017, the Financial Accounting Standards Board (FASB) issued Accounting Standards Update (ASU) No. 2017-08, Receivables—Nonrefundable Fees and Other Costs (Subtopic 310-20): Premium Amortization on Purchased Callable Debt Securities. The amendments in the ASU shorten the amortization period for certain callable debt securities acquired at a premium, to be amortized to the earliest call date. The ASU does not require an accounting change for securities acquired at a discount, which continues to be amortized to maturity. The ASU is effective for fiscal years and interim periods within those fiscal years beginning after December 15, 2018. Management has reviewed the requirements and believes the adoption of this ASU will not have a material impact on the financial statements.
| | | | |
| | | |
franklintempleton.com | | Annual Report | | 157 |
FRANKLIN INVESTORS SECURITIES TRUST
NOTES TO FINANCIAL STATEMENTS
13. New Accounting Pronouncements (continued)
In August 2018, FASB issued ASU No. 2018-13, Fair Value Measurement (Topic 820): Disclosure Framework—Changes to the Disclosure Requirements for Fair Value Measurements. The amendments in the ASU modify the disclosure requirements on fair value measurements in Topic 820. The ASU is effective for interim and annual reporting periods beginning after December 15, 2019. Management has reviewed the requirements and believes the adoption of this ASU will not have a material impact on the financial statements.
14. Subsequent Events
The Funds have evaluated subsequent events through the issuance of the financial statements and determined that no events have occurred that require disclosure.
Abbreviations
| | | | | | | | | | | | |
| Counterparty/Exchange | | Currency | | Selected Portfolio | | |
| BNDP | | BNP Paribas SA | | BRL | | Brazilian Real | | AGMC | | Assured Guaranty Municipal Corp. | | |
| BOFA | | Bank of America Corp. | | EUR | | Euro | | ARM | | Adjustable Rate Mortgage | | |
| BZWS | | Barclays Bank PLC | | JPY | | Japanese Yen | | CLO | | Collateralized Loan Obligation | | |
| CITI | | Citigroup, Inc. | | MXN | | Mexican Peso | | CMT | | Constant Maturity Treasury Index | | |
| CME | | Chicago Mercantile Exchange | | USD | | United States Dollar | | COF | | Cost of Funds | | |
| DBAB | | Deutsche Bank AG | | | | | | EDA | | Economic Development Authority | | |
| FBCO | | Credit Suisse Group AG | | | | | | ETF | | Exchange Traded Fund | | |
| GSCO | | The Goldman Sachs Group, Inc. | | | | | | FRN | | Floating Rate Note | | |
| HSBK | | HSBC Bank PLC | | | | | | GDP | | Gross Domestic Product | | |
| JPHQ | | JP Morgan Chase & Co. | | | | | | GO | | General Obligation | | |
| | | | | | | | LIBOR | | London InterBank Offered Rate | | |
| | | | | | | | MBS | | Mortgage-Backed Security | | |
| | | | | | | | PIK | | Payment-In-Kind | | |
| | | | | | | | SF | | Single Family | | |
| | | | | | | | T-Note | | Treasury Note | | |
| | | | | | | | VRI | | Value Recovery Instruments | | |
| | | | |
| Index | | | | |
| CDX.EM.Series number | | CDX Emerging Markets Index | | |
| CDX.NA.HY.Series number | | CDX North America High Yield Index | | |
| CDX.NA.IG.Series number | | CDX North America Investment Grade Index | | |
| MCDX.NA.Series number | | MCDX North America Index | | |
| | | | |
| | | |
158 | | Annual Report | | franklintempleton.com |
FRANKLIN INVESTORS SECURITIES TRUST
Report of Independent Registered Public Accounting Firm
To the Board of Trustees of Franklin Investors Securities Trust and Shareholders of Franklin Adjustable U.S. Government Securities Fund, Franklin Floating Rate Daily Access Fund, Franklin Low Duration Total Return Fund and Franklin Total Return Fund
Opinions on the Financial Statements
We have audited the accompanying statements of assets and liabilities, including the statements of investments, of Franklin Adjustable U.S. Government Securities Fund, Franklin Floating Rate Daily Access Fund, Franklin Low Duration Total Return Fund and Franklin Total Return Fund (the “Funds”) as of October 31, 2018, the related statements of operations for the year ended October 31, 2018, the statements of changes in net assets for each of the two years in the period ended October 31, 2018, including the related notes, and the financial highlights for each of the periods indicated therein (collectively referred to as the “financial statements”). In our opinion, the financial statements present fairly, in all material respects, the financial position of each of the Funds as of October 31, 2018, the results of each of their operations for the year then ended, the changes in each of their net assets for each of the two years in the period ended October 31, 2018 and each of the financial highlights for each of the periods indicated therein in conformity with accounting principles generally accepted in the United States of America.
Basis for Opinions
These financial statements are the responsibility of the Funds’ management. Our responsibility is to express an opinion on the Funds’ financial statements based on our audits. We are a public accounting firm registered with the Public Company Accounting Oversight Board (United States) (“PCAOB”) and are required to be independent with respect to the Funds in accordance with the U.S. federal securities laws and the applicable rules and regulations of the Securities and Exchange Commission and the PCAOB.
We conducted our audits of these financial statements in accordance with the standards of the PCAOB. Those standards require that we plan and perform the audit to obtain reasonable assurance about whether the financial statements are free of material misstatement, whether due to error or fraud.
Our audits included performing procedures to assess the risks of material misstatement of the financial statements, whether due to error or fraud, and performing procedures that respond to those risks. Such procedures included examining, on a test basis, evidence regarding the amounts and disclosures in the financial statements. Our audits also included evaluating the accounting principles used and significant estimates made by management, as well as evaluating the overall presentation of the financial statements. Our procedures included confirmation of securities owned as of October 31, 2018 by correspondence with the custodian, transfer agent and brokers; when replies were not received from brokers, we performed other auditing procedures. We believe that our audits provide a reasonable basis for our opinions.
PricewaterhouseCoopers LLP
San Francisco, California
December 18, 2018
We have served as the auditor of one or more investment companies in the Franklin Templeton Group of Funds since 1948.
| | | | |
| | | |
franklintempleton.com | | Annual Report | | 159 |
FRANKLIN INVESTORS SECURITIES TRUST
Tax Information (unaudited)
Under Section 871(k)(1)(C) of the Internal Revenue Code, the Funds hereby report the maximum amount allowable but no less than the following amounts as interest related dividends for purposes of the tax imposed under Section 871(a)(1)(A) of the Internal Revenue Code for the fiscal year ended October 31, 2018:
| | | | | | | | | | | | | | | | | | |
Franklin Adjustable U.S. Government Securities Fund | | | Franklin
Floating Rate
Daily Access
Fund | | | Franklin
Low Duration
Total Return
Fund | | | Franklin Total Return
Fund | | | | |
| | $20,347,095 | | | | $149,590,171 | | | | $68,499,229 | | | | $112,855,871 | | | | | |
| | | | |
| | | |
160 | | Annual Report | | franklintempleton.com |
FRANKLIN INVESTORS SECURITIES TRUST
Special Meeting of Shareholders
MEETING OF SHAREHOLDERS: OCTOBER 30, 2017 AND RECONVENED ON DECEMBER 15, 2017 AND DECEMBER 29, 2017
(UNAUDITED)
A Special Meeting of Shareholders of Franklin Investors Securities Trust was held at the offices of Franklin Templeton Investments, One Franklin Parkway, San Mateo, California on October 30, 2017 and reconvened on December 15, 2017 and December 29, 2017. The purpose of the meeting was to elect Trustees of Franklin Investors Securities Trust and to vote on the following proposals for each Fund: to approve the use of a “manager of managers” structure whereby the Fund’s investment manager would be able to hire and replace subadvisers without shareholder approval and to approve an amended fundamental investment restriction regarding investments in commodities. At the meeting, (i) the following persons were elected by the shareholders to serve as Trustees of Franklin Investors Securities Trust: Harris J. Ashton, Terrence J. Checki, Mary C. Choksi, Edith E. Holiday, Gregory E. Johnson, Rupert H. Johnson, Jr., J. Michael Luttig, Larry D. Thompson, and John B. Wilson; and (ii) the proposals to use a “manager of managers” structure and to approve an amended fundamental investment restriction regarding investments in commodities were approved by shareholders of each Fund, except for Franklin Adjustable U.S. Government Securities Fund. No other business was transacted at the meeting.
In connection with the meeting, management is aware that some shareholders received from the proxy solicitor numerous calls and mailings that may have been distracting. Management is taking steps to ensure that, in the future, for any new shareholder meeting solicitations that occur, such activity is not repeated. Management apologizes for any inconvenience that may have been caused as a result of such calls and mailings.
The results of the voting at the meeting are as follows:
Proposal 1. To elect a Board of Trustees:
| | | | | | | | | | | | |
| Name | | For | | | | | | Withheld | |
Harris J. Ashton | | | 1,140,629,120 | | | | | | | | 32,081,576 | |
Terrence J. Checki | | | 1,140,321,742 | | | | | | | | 32,388,956 | |
Mary C. Choksi | | | 1,140,407,572 | | | | | | | | 32,303,126 | |
Edith E. Holiday | | | 1,108,315,463 | | | | | | | | 64,395,237 | |
Gregory E. Johnson | | | 1,141,429,086 | | | | | | | | 31,281,610 | |
Rupert H. Johnson, Jr. | | | 1,140,181,429 | | | | | | | | 32,529,268 | |
J. Michael Luttig | | | 1,140,612,578 | | | | | | | | 32,098,122 | |
Larry D. Thompson | | | 1,140,871,851 | | | | | | | | 31,838,848 | |
John B. Wilson | | | 1,141,487,184 | | | | | | | | 31,223,513 | |
Total Trust Shares Outstanding*: 1,818,967,134
| | | | |
| | | |
franklintempleton.com | | Annual Report | | 161 |
FRANKLIN INVESTORS SECURITIES TRUST
SPECIAL MEETING OF SHAREHOLDERS
| Proposal 2. | To approve the use of a “manager of managers” structure whereby the Fund’s investment manager would be able to hire and replace subadvisers without shareholder approval: |
Franklin Adjustable U.S. Government Securities Fund
| | | | |
| | | Shares | |
| |
For | | | 39,826,044 | |
Against | | | 3,205,365 | |
Abstain | | | 2,311,308 | |
Broker Non-Votes | | | 30,028,215 | |
Total Fund Shares Voted | | | 75,370,934 | |
Total Fund Shares Outstanding* | | | 125,633,216 | |
Franklin Floating Rate Daily Access Fund
| | | | |
| | | Shares | |
| |
For | | | 243,290,272 | |
Against | | | 7,257,391 | |
Abstain | | | 5,415,717 | |
Broker Non-Votes | | | 144,713,604 | |
Total Fund Shares Voted | | | 400,676,982 | |
Total Fund Shares Outstanding* | | | 436,512,931 | |
Franklin Low Duration Total Return Fund
| | | | |
| | | Shares | |
| |
For | | | 132,279,760 | |
Against | | | 5,197,232 | |
Abstain | | | 6,859,902 | |
Broker Non-Votes | | | 21,783,108 | |
Total Fund Shares Voted | | | 166,120,009 | |
Total Fund Shares Outstanding* | | | 266,594,979 | |
Franklin Total Return Fund
| | | | |
| | | Shares | |
| |
For | | | 168,186,368 | |
Against | | | 11,905,018 | |
Abstain | | | 9,209,163 | |
Broker Non-Votes | | | 49,895,855 | |
Total Fund Shares Voted | | | 239,196,399 | |
Total Fund Shares Outstanding* | | | 461,502,868 | |
| Proposal 3. | To approve an amended fundamental investment restriction regarding investments in commodities: |
Franklin Adjustable U.S. Government Securities Fund
| | | | |
| | | Shares | |
| |
For | | | 40,233,929 | |
Against | | | 2,302,824 | |
Abstain | | | 2,805,966 | |
Broker Non-Votes | | | 30,028,215 | |
Total Fund Shares Voted | | | 75,370,934 | |
Total Fund Shares Outstanding* | | | 125,633,216 | |
| | | | |
| | | |
162 | | Annual Report | | franklintempleton.com |
FRANKLIN INVESTORS SECURITIES TRUST
SPECIAL MEETING OF SHAREHOLDERS
Franklin Floating Rate Daily Access Fund
| | | | |
| | | Shares | |
| |
For | | | 244,030,871 | |
Against | | | 5,014,609 | |
Abstain | | | 6,917,899 | |
Broker Non-Votes | | | 144,713,604 | |
Total Fund Shares Voted | | | 400,676,982 | |
Total Fund Shares Outstanding* | | | 436,512,931 | |
Franklin Low Duration Total Return Fund
| | | | |
| | | Shares | |
| |
For | | | 133,181,434 | |
Against | | | 3,615,575 | |
Abstain | | | 7,539,891 | |
Broker Non-Votes | | | 21,783,108 | |
Total Fund Shares Voted | | | 166,120,009 | |
Total Fund Shares Outstanding* | | | 266,594,979 | |
Franklin Total Return Fund
| | | | |
| | | Shares | |
| |
For | | | 170,238,568 | |
Against | | | 7,831,326 | |
Abstain | | | 11,230,650 | |
Broker Non-Votes | | | 49,895,855 | |
Total Fund Shares Voted | | | 239,196,399 | |
Total Fund Shares Outstanding* | | | 461,502,868 | |
| | | | |
| | | |
franklintempleton.com | | Annual Report | | 163 |
FRANKLIN INVESTORS SECURITIES TRUST
Board Members and Officers
The name, year of birth and address of the officers and board members, as well as their affiliations, positions held with the Fund, principal occupations during at least the past five years and number of U.S. registered portfolios overseen in the Franklin Templeton Investments fund complex are shown below. Generally, each board member serves a three-year term that continues until that person’s successor is elected and qualified.
Independent Board Members
| | | | | | | | |
Name, Year of Birth and Address | | Position | | Length of
Time Served | | Number of Portfolios in Fund Complex Overseen by Board Member* | | Other Directorships Held During at Least the Past 5 Years |
| | | | |
Harris J. Ashton (1932) One Franklin Parkway San Mateo, CA 94403-1906 | | Trustee | | Since 1986 | | 136 | | Bar-S Foods (meat packing company) (1981-2010). |
| | |
| Principal Occupation During at Least the Past 5 Years: | | | | |
| Director of various companies; and formerly, Director, RBC Holdings, Inc. (bank holding company) (until 2002); and President, Chief Executive Officer and Chairman of the Board, General Host Corporation (nursery and craft centers) (until 1998). |
| | | | |
Terrence J. Checki (1945) One Franklin Parkway San Mateo, CA 94403-1906 | | Trustee | | Since December 2017 | | 112 | | Hess Corporation (exploration of oil and gas) (2014-present). |
| | |
| Principal Occupation During at Least the Past 5 Years: | | | | |
| Member of the Council on Foreign Relations (1996-present); Member of the National Committee on U.S.-China Relations (1999-present); member of the Board of Trustees of the Economic Club of New York (2013 -present); member of the Board of Trustees of the Foreign Policy Association (2005-present) and member of various other boards of trustees and advisory boards; and formerly, Executive Vice President of the Federal Reserve Bank of New York and Head of its Emerging Markets and Internal Affairs Group and Member of Management Committee (1995-2014); and Visiting Fellow at the Council on Foreign Relations (2014). |
| | | | |
Mary C. Choksi (1950) One Franklin Parkway San Mateo, CA 94403-1906 | | Trustee | | Since 2014 | | 136 | | Avis Budget Group Inc. (car rental) (2007-present), Omnicom Group Inc. (advertising and marketing communications services) (2011-present) and White Mountains Insurance Group, Ltd. (holding company) (2017-present). |
| | |
| Principal Occupation During at Least the Past 5 Years: | | | | |
| Director of various companies; and formerly, Founder and Senior Advisor, Strategic Investment Group (investment management group) (2015-2017); Founding Partner and Senior Managing Director, Strategic Investment Group (1987–2015); Founding Partner and Managing Director, Emerging Markets Management LLC (investment management firm) (1987-2011); and Loan Officer/Senior Loan Officer/Senior Pension Investment Officer, World Bank Group (international financial institution) (1977-1987). |
| | | | |
Edith E. Holiday (1952) One Franklin Parkway San Mateo, CA 94403-1906 | | Trustee | | Since 1998 | | 136 | | Hess Corporation (exploration of oil and gas) (1993-present), Canadian National Railway (railroad) (2001-present), White Mountains Insurance Group, Ltd. (holding company) (2004-present), Santander Consumer USA Holdings, Inc. (consumer finance) (2016-present), RTI International Metals, Inc. (manufacture and distribution of titanium) (1999-2015) and H.J. Heinz Company (processed foods and allied products) (1994-2013). |
| | |
| Principal Occupation During at Least the Past 5 Years: | | | | |
| Director or Trustee of various companies and trusts; and formerly, Assistant to the President of the United States and Secretary of the Cabinet (1990-1993); General Counsel to the United States Treasury Department (1989-1990); and Counselor to the Secretary and Assistant Secretary for Public Affairs and Public Liaison-United States Treasury Department (1988-1989). |
| | | | |
J. Michael Luttig (1954) One Franklin Parkway San Mateo, CA 94403-1906 | | Trustee | | Since 2009 | | 136 | | Boeing Capital Corporation (aircraft financing) (2006-2013). |
| | |
| Principal Occupation During at Least the Past 5 Years: | | | | |
| Executive Vice President, General Counsel and member of the Executive Council, The Boeing Company (aerospace company) (2006-present); and formerly, Federal Appeals Court Judge, U.S. Court of Appeals for the Fourth Circuit (1991-2006). |
| | | | |
| | | |
164 | | Annual Report | | franklintempleton.com |
FRANKLIN INVESTORS SECURITIES TRUST
Independent Board Members (continued)
| | | | | | | | |
Name, Year of Birth and Address | | Position | | Length of Time Served | | Number of Portfolios in Fund Complex Overseen by Board Member* | | Other Directorships Held During at Least the Past 5 Years |
| | | | |
Larry D. Thompson (1945) One Franklin Parkway San Mateo, CA 94403-1906 | | Trustee | | Since 2007 | | 136 | | The Southern Company (energy company) (2014-present; previously 2010-2012), Graham Holdings Company (education and media organization) (2011-present) and Cbeyond, Inc. (business communications provider) (2010-2012). |
| | |
| Principal Occupation During at Least the Past 5 Years: | | | | |
| Director of various companies; Counsel, Finch McCranie, LLP (law firm) (2015-present); Independent Compliance Monitor and Auditor, Volkswagen AG (manufacturer of automobiles and commercial vehicles) (2017-present); John A. Sibley Professor of Corporate and Business Law, University of Georgia School of Law (2015-present; previously 2011-2012); and formerly, Executive Vice President - Government Affairs, General Counsel and Corporate Secretary, PepsiCo, Inc. (consumer products) (2012-2014); Senior Vice President - Government Affairs, General Counsel and Secretary, PepsiCo, Inc. (2004-2011); Senior Fellow of The Brookings Institution (2003-2004); Visiting Professor, University of Georgia School of Law (2004); and Deputy Attorney General, U.S. Department of Justice (2001-2003). |
| | | | |
John B. Wilson (1959) One Franklin Parkway San Mateo, CA 94403-1906 | | Lead Independent Trustee | | Trustee since 2007 and Lead Independent Trustee since 2008 | | 112 | | None |
| | |
| Principal Occupation During at Least the Past 5 Years: | | | | |
| President and Founder, Hyannis Port Capital, Inc. (real estate and private equity investing) (2002-present); Senior Advisor, McKinsey & Co. (consulting) (2017-present); serves on private and non-profit boards; and formerly, President, Staples International and Head of Global Transformation (office supplies) (2012-2016); Chief Operating Officer and Executive Vice President, Gap, Inc. (retail) (1996-2000); Chief Financial Officer and Executive Vice President – Finance and Strategy, Staples, Inc. (1992-1996); Senior Vice President – Corporate Planning, Northwest Airlines, Inc. (airlines) (1990-1992); and Vice President and Partner, Bain & Company (consulting firm) (1986-1990). |
Interested Board Members and Officers
| | | | | | | | |
Name, Year of Birth and Address | | Position | | Length of Time Served | | Number of Portfolios in Fund Complex Overseen by Board Member* | | Other Directorships Held During at Least the Past 5 Years |
| | | | |
**Gregory E. Johnson (1961) One Franklin Parkway San Mateo, CA 94403-1906 | | Trustee | | Since 2013 | | 150 | | None |
| | |
| Principal Occupation During at Least the Past 5 Years: | | | | |
| Chairman of the Board, Member - Office of the Chairman, Director and Chief Executive Officer, Franklin Resources, Inc.; officer and/or director or trustee, as the case may be, of some of the other subsidiaries of Franklin Resources, Inc. and of 42 of the investment companies in Franklin Templeton Investments; Vice Chairman, Investment Company Institute; and formerly, President, Franklin Resources, Inc. (1994-2015). |
| | | | |
**Rupert H. Johnson, Jr. (1940) One Franklin Parkway San Mateo, CA 94403-1906 | | Chairman of the Board, Trustee and Vice President | | Chairman of the Board since 2013, Trustee since 1987 and Vice President since 1986 | | 136 | | None |
| | |
| Principal Occupation During at Least the Past 5 Years: | | | | |
| Vice Chairman, Member - Office of the Chairman and Director, Franklin Resources, Inc.; Director, Franklin Advisers, Inc.; Senior Vice President, Franklin Advisory Services, LLC; and officer and/or director or trustee, as the case may be, of some of the other subsidiaries of Franklin Resources, Inc. and of 40 of the investment companies in Franklin Templeton Investments. |
| | | | |
| | | |
franklintempleton.com | | Annual Report | | 165 |
FRANKLIN INVESTORS SECURITIES TRUST
Interested Board Members and Officers (continued)
| | | | | | | | |
Name, Year of Birth
and Address | | Position | | Length of
Time Served | | Number of Portfolios in
Fund Complex Overseen
by Board Member* | | Other Directorships Held
During at Least the Past 5 Years |
| | | | |
Alison E. Baur (1964) One Franklin Parkway San Mateo, CA 94403-1906 | | Vice President | | Since 2012 | | Not Applicable | | Not Applicable |
|
| Principal Occupation During at Least the Past 5 Years: |
| Deputy General Counsel, Franklin Templeton Investments; and officer of some of the other subsidiaries of Franklin Resources, Inc. and of 44 of the investment companies in Franklin Templeton Investments. |
| | | | |
Mark Boyadjian (1964) One Franklin Parkway San Mateo, CA 94403-1906 | | Vice President | | Since 2003 | | Not Applicable | | Not Applicable |
|
| Principal Occupation During at Least the Past 5 Years: |
| Senior Vice President, Franklin Advisers, Inc.; and officer of two of the investment companies in Franklin Templeton Investments. |
| | | | |
Gaston Gardey (1967) One Franklin Parkway San Mateo, CA 94403-1906 | | Chief
Financial
Officer, Chief
Accounting
Officer and
Treasurer | | Since 2009 | | Not Applicable | | Not Applicable |
|
| Principal Occupation During at Least the Past 5 Years: |
| Treasurer, U.S. Fund Administration & Reporting, Franklin Templeton Investments; and officer of 28 of the investment companies in Franklin Templeton Investments. |
| | | | |
Aliya S. Gordon (1973) One Franklin Parkway San Mateo, CA 94403-1906 | | Vice President | | Since 2009 | | Not Applicable | | Not Applicable |
|
| Principal Occupation During at Least the Past 5 Years: |
| Senior Associate General Counsel, Franklin Templeton Investments; and officer of 44 of the investment companies in Franklin Templeton Investments. |
| | | | |
Steven J. Gray (1955) One Franklin Parkway San Mateo, CA 94403-1906 | | Vice President | | Since 2009 | | Not Applicable | | Not Applicable |
|
| Principal Occupation During at Least the Past 5 Years: |
| Senior Associate General Counsel, Franklin Templeton Investments; Vice President, Franklin Templeton Distributors, Inc. and FASA, LLC; and officer of 44 of the investment companies in Franklin Templeton Investments. |
| | | | |
Matthew T. Hinkle (1971) One Franklin Parkway San Mateo, CA 94403-1906 | | Chief Executive
Officer –
Finance and Administration | | Since 2017 | | Not Applicable | | Not Applicable |
|
| Principal Occupation During at Least the Past 5 Years: |
| Senior Vice President, Franklin Templeton Services, LLC; officer of 44 of the investment companies in Franklin Templeton Investments; and formerly, Vice President, Global Tax (2012-April 2017) and Treasurer/Assistant Treasurer, Franklin Templeton Investments (2009-2017). |
| | | | |
Edward B. Jamieson (1948) One Franklin Parkway San Mateo, CA 94403-1906 | | President and
Chief Executive
Officer –
Investment
Management | | Since 2002 | | Not Applicable | | Not Applicable |
|
| Principal Occupation During at Least the Past 5 Years: |
| President and Director, Franklin Advisers, Inc.; Executive Vice President, Franklin Templeton Institutional, LLC; and officer and/or trustee, as the case may be, of some of the other subsidiaries of Franklin Resources, Inc. and of 10 of the investment companies in Franklin Templeton Investments. |
| | | | |
| | | |
166 | | Annual Report | | franklintempleton.com |
FRANKLIN INVESTORS SECURITIES TRUST
Interested Board Members and Officers (continued)
| | | | | | | | |
Name, Year of Birth
and Address | | Position | | Length of
Time Served | | Number of Portfolios in
Fund Complex Overseen
by Board Member* | | Other Directorships Held
During at Least the Past 5 Years |
| | | | |
Madeline Lam (1969) One Franklin Parkway San Mateo, CA 94403-1906 | | Vice President | | Since 2010 | | Not Applicable | | Not Applicable |
|
| Principal Occupation During at Least the Past 5 Years: |
| Vice President, Franklin Advisers, Inc.; and officer of two of the investment companies in Franklin Templeton Investments. |
| | | | |
Robert Lim (1948) One Franklin Parkway San Mateo, CA 94403-1906 | | Vice
President
– AML
Compliance | | Since 2016 | | Not Applicable | | Not Applicable |
|
| Principal Occupation During at Least the Past 5 Years: |
| Vice President, Franklin Templeton Companies, LLC; Chief Compliance Officer, Franklin Templeton Distributors, Inc. and Franklin Templeton Investor Services, LLC; and officer of 44 of the investment companies in Franklin Templeton Investments. |
| | | | |
Kimberly H. Novotny (1972) 300 S.E. 2nd Street Fort Lauderdale, FL 33301-1923 | | Vice President | | Since 2013 | | Not Applicable | | Not Applicable |
|
| Principal Occupation During at Least the Past 5 Years: |
| Associate General Counsel, Franklin Templeton Investments; Vice President and Corporate Secretary, Fiduciary Trust International of the South; Vice President, Templeton Investment Counsel, LLC; Assistant Secretary, Franklin Resources, Inc.; and officer of 44 of the investment companies in Franklin Templeton Investments. |
| | | | |
Robert C. Rosselot (1960) 300 S.E. 2nd Street Fort Lauderdale, FL 33301-1923 | | Chief
Compliance
Officer | | Since 2013 | | Not Applicable | | Not Applicable |
|
| Principal Occupation During at Least the Past 5 Years: |
| Director, Global Compliance, Franklin Templeton Investments; Vice President, Franklin Templeton Companies, LLC; officer of 44 of the investment companies in Franklin Templeton Investments; and formerly, Senior Associate General Counsel, Franklin Templeton Investments (2007-2013); and Secretary and Vice President, Templeton Group of Funds (2004-2013). |
| | | | |
Karen L. Skidmore (1952) One Franklin Parkway San Mateo, CA 94403-1906 | | Vice President
and Secretary | | Since 2006 | | Not Applicable | | Not Applicable |
|
| Principal Occupation During at Least the Past 5 Years: |
| Senior Associate General Counsel, Franklin Templeton Investments; and officer of 44 of the investment companies in Franklin Templeton Investments. |
| | | | |
Navid J. Tofigh (1972) One Franklin Parkway San Mateo, CA 94403-1906 | | Vice President | | Since 2015 | | Not Applicable | | Not Applicable |
|
| Principal Occupation During at Least the Past 5 Years: |
| Associate General Counsel, Franklin Templeton Investments; and officer of 44 of the investment companies in Franklin Templeton Investments. |
| | | | |
Craig S. Tyle (1960) One Franklin Parkway San Mateo, CA 94403-1906 | | Vice President | | Since 2005 | | Not Applicable | | Not Applicable |
|
| Principal Occupation During at Least the Past 5 Years: |
| General Counsel and Executive Vice President, Franklin Resources, Inc.; and officer of some of the other subsidiaries of Franklin Resources, Inc. and of 44 of the investment companies in Franklin Templeton Investments. |
| | | | |
| | | |
franklintempleton.com | | Annual Report | | 167 |
FRANKLIN INVESTORS SECURITIES TRUST
Interested Board Members and Officers (continued)
| | | | | | | | |
Name, Year of Birth
and Address | | Position | | Length of
Time Served | | Number of Portfolios in
Fund Complex Overseen
by Board Member* | | Other Directorships Held
During at Least the Past 5 Years |
| | | | |
Lori A. Weber (1964) 300 S.E. 2nd Street Fort Lauderdale, FL 33301-1923 | | Vice President | | Since 2011 | | Not Applicable | | Not Applicable |
|
| Principal Occupation During at Least the Past 5 Years: |
| Senior Associate General Counsel, Franklin Templeton Investments; Assistant Secretary, Franklin Resources, Inc.; Vice President and Secretary, Templeton Investment Counsel, LLC; and officer of 44 of the investment companies in Franklin Templeton Investments. |
*We base the number of portfolios on each separate series of the U.S. registered investment companies within the Franklin Templeton Investments fund complex. These portfolios have a common investment manager or affiliated investment managers.
**Gregory E. Johnson is considered to be an interested person of the Fund under the federal securities laws due to his position as an officer and director of Franklin
Resources, Inc. (Resources), which is the parent company of the Fund’s investment manager and distributor. Rupert H. Johnson, Jr. is considered to be an interested person of the Fund under the federal securities laws due to his position as officer and director and major shareholder of Resources.
Note 1: Rupert H. Johnson, Jr. is the uncle of Gregory E. Johnson.
Note 2: Officer information is current as of the date of this report. It is possible that after this date, information about officers may change.
The Sarbanes-Oxley Act of 2002 and Rules adopted by the Securities and Exchange Commission require the Fund to disclose whether the Fund’s Audit Committee includes at least one member who is an audit committee financial expert within the meaning of such Act and Rules. The Fund’s Board has determined that there is at least one such financial expert on the Audit Committee and has designated John B. Wilson as its audit committee financial expert. The Board believes that Mr. Wilson qualifies as such an expert in view of his extensive business background and experience, including service as chief financial officer of Staples, Inc. from 1992 to 1996. Mr. Wilson has been a Member and Chairman of the Fund’s Audit Committee since 2006. As a result of such background and experience, the Board believes that Mr. Wilson has acquired an understanding of generally accepted accounting principles and financial statements, the general application of such principles in connection with the accounting estimates, accruals and reserves, and analyzing and evaluating financial statements that present a breadth and level of complexity of accounting issues generally comparable to those of the Fund, as well as an understanding of internal controls and procedures for financial reporting and an understanding of audit committee functions. Mr. Wilson is an independent Board member as that term is defined under the relevant Securities and Exchange Commission Rules and Releases.
The Statement of Additional Information (SAI) includes additional information about the board members and is available, without charge, upon request. Shareholders may call (800) DIAL BEN/342-5236 to request the SAI.
| | | | |
| | | |
168 | | Annual Report | | franklintempleton.com |
FRANKLIN INVESTORS SECURITIES TRUST
Shareholder Information
Proxy Voting Policies and Procedures
The Trust’s investment manager has established Proxy Voting Policies and Procedures (Policies) that the Trust uses to determine how to vote proxies relating to portfolio securities. Shareholders may view the Trust’s complete Policies online at franklintempleton.com. Alternatively, shareholders may request copies of the Policies free of charge by calling the Proxy Group collect at (954) 527-7678 or by sending a written request to: Franklin Templeton Companies, LLC, 300 S.E. 2nd Street, Fort Lauderdale, FL 33301, Attention: Proxy Group. Copies of the Trust’s proxy voting records are also made available online at franklintempleton.com and posted on the U.S. Securities and Exchange Commission’s website at sec.gov and reflect the most recent 12-month period ended June 30.
Quarterly Statement of Investments
The Trust files a complete statement of investments with the U.S. Securities and Exchange Commission for the first and third quarters for each fiscal year on Form N-Q. Shareholders may view the filed Form N-Q by visiting the Commission’s website at sec.gov. The filed form may also be viewed and copied at the Commission’s Public Reference Room in Washington, DC. Information regarding the operations of the Public Reference Room may be obtained by calling (800) SEC-0330.
Householding of Reports and Prospectuses
You will receive each Fund’s financial reports every six months as well as an annual updated summary prospectus (prospectus available upon request). To reduce Fund expenses, we try to identify related shareholders in a household and send only one copy of the financial reports and summary prospectus. This process, called “householding,” will continue indefinitely unless you instruct us otherwise. If you prefer not to have these documents householded, please call us at (800) 632-2301. At any time you may view current prospectuses/summary prospectuses and financial reports on our website. If you choose, you may receive these documents through electronic delivery.
| | | | |
| | | |
franklintempleton.com | | Annual Report | | 169 |
This page intentionally left blank.
This page intentionally left blank.
This page intentionally left blank.
| | |
| |
| | Annual Report and Shareholder Letter
Franklin Investors Securities Trust |
| | Investment Manager Franklin Advisers, Inc. |
| | Subadvisor |
| | Franklin Templeton Institutional, LLC |
| | Distributor |
| | Franklin Templeton Distributors, Inc. (800) DIAL BEN® / 342-5236 franklintempleton.com |
| |
| | Shareholder Services |
| | (800) 632-2301 |
Authorized for distribution only when accompanied or preceded by a summary prospectus and/or prospectus. Investors should carefully consider a fund’s investment goals, risks, charges and expenses before investing. A prospectus contains this and other information; please read it carefully before investing.
To help ensure we provide you with quality service, all calls to and from our service areas are monitored and/or recorded.
| | | | |
© 2018 Franklin Templeton Investments. All rights reserved. | | | FIST2 A 12/18 | |
(a) The Registrant has adopted a code of ethics that applies to its principal executive officers and principal financial and accounting officer.
(c) N/A
(d) N/A
(f) Pursuant to Item 12(a)(1), the Registrant is attaching as an exhibit a copy of its code of ethics that applies to its principal executive officers and principal financial and accounting officer.
| Item 3. | Audit Committee Financial Expert. |
(a) (1) The Registrant has an audit committee financial expert serving on its audit committee.
(2) The audit committee financial expert is John B. Wilson and he is “independent” as defined under the relevant Securities and Exchange Commission Rules and Releases.
| Item 4. | Principal Accountant Fees and Services. |
(a) Audit Fees
The aggregate fees paid to the principal accountant for professional services rendered by the principal accountant for the audit of the registrant’s annual financial statements or for services that are normally provided by the principal accountant in connection with statutory and regulatory filings or engagements were $439,976 for the fiscal year ended October 31, 2018 and $457,608 for the fiscal year ended October 31, 2017.
(b) Audit-Related Fees
There were no fees paid to the principal accountant for assurance and related services rendered by the principal accountant to the registrant that are reasonably related to the performance of the audit of the registrant’s financial statements and are not reported under paragraph (a) of Item 4.
There were no fees paid to the principal accountant for assurance and related services rendered by the principal accountant to the registrant’s investment adviser and any entity controlling, controlled by or under common control with the investment adviser that provides ongoing services to the registrant that are reasonably related to the performance of the audit of their financial statements.
(c) Tax Fees
There were no fees paid to the principal accountant for professional services rendered by the principal accountant to the registrant for tax compliance, tax advice and tax planning.
The aggregate fees paid to the principal accountant for professional services rendered by the principal accountant to the registrant’s investment adviser and any entity controlling, controlled by or under common control with the investment adviser that provides ongoing
services to the registrant for tax compliance, tax advice and tax planning were $194,500 for the fiscal year ended October 31, 2018 and $32,500 for the fiscal year ended October 31, 2017. The services for which these fees were paid included tax compliance services related to year end, and tax consulting services related to the operating agreement and term sheet for the launch of a new fund.
(d) All Other Fees
The aggregate fees paid to the principal accountant for products and services rendered by the principal accountant to the registrant not reported in paragraphs (a)-(c) of Item 4 were $7,209 for the fiscal year ended October 31, 2018 and $0 for the fiscal year ended October 31, 2017. The services for which these fees were paid included review of materials provided to the fund Board in connection with the investment management contract renewal process.
The aggregate fees paid to the principal accountant for products and services rendered by the principal accountant to the registrant’s investment adviser and any entity controlling, controlled by or under common control with the investment adviser that provides ongoing services to the registrant not reported in paragraphs (a)-(c) of Item 4 were $61,500 for the fiscal year ended October 31, 2018 and $40,225 for the fiscal year ended October 31, 2017. The services for which these fees were paid included compliance examination for Investment Advisor Act rule 204-2 and 206-4(2), account maintenance project, training on partnership tax accounting and capital account maintenance, benchmarking services in connection with the ICI TA survey, assets under management certification, and the issuance of an Auditors’ Certificate for South Korean regulatory shareholder disclosures.
(e) (1) The registrant’s audit committee is directly responsible for approving the services to be provided by the auditors, including:
(i) pre-approval of all audit and audit related services;
(ii) pre-approval of all non-audit related services to be provided to the Fund by the auditors;
(iii) pre-approval of all non-audit related services to be provided to the registrant by the auditors to the registrant’s investment adviser or to any entity that controls, is controlled by or is under common control with the registrant’s investment adviser and that provides ongoing services to the registrant where the non-audit services relate directly to the operations or financial reporting of the registrant; and
(iv) establishment by the audit committee, if deemed necessary or appropriate, as an alternative to committee pre-approval of services to be provided by the auditors, as required by paragraphs (ii) and (iii) above, of policies and procedures to permit such services to be pre-approved by other means, such as through establishment of guidelines or by action of a designated member or members of the committee; provided the policies and procedures are detailed as to the particular service and the committee is informed of each service and such policies and procedures do not include delegation of audit committee responsibilities, as contemplated under the Securities Exchange Act of 1934, to management; subject, in the case of
(ii) through (iv), to any waivers, exceptions or exemptions that may be available under applicable law or rules.
(e) (2) None of the services provided to the registrant described in paragraphs (b)-(d) of Item 4 were approved by the audit committee pursuant to paragraph (c)(7)(i)(C) of Rule 2-01 of regulation S-X.
(f) No disclosures are required by this Item 4(f).
(g) The aggregate non-audit fees paid to the principal accountant for services rendered by the principal accountant to the registrant and the registrant’s investment adviser and any entity controlling, controlled by or under common control with the investment adviser that provides ongoing services to the registrant were $263,209 for the fiscal year ended October 31, 2018 and $72,725 for the fiscal year ended October 31, 2017.
(h) The registrant’s audit committee of the board has considered whether the provision of non-audit services that were rendered to the registrant’s investment adviser (not including any sub-adviser whose role is primarily portfolio management and is subcontracted with or overseen by another investment adviser), and any entity controlling, controlled by, or under common control with the investment adviser that provides ongoing services to the registrant that were not pre-approved pursuant to paragraph (c)(7)(ii) of Rule 2-01 of Regulation S-X is compatible with maintaining the principal accountant’s independence.
| Item 5. | Audit Committee of Listed Registrants. N/A |
| Item 6. | Schedule of Investments. N/A |
| Item 7. | Disclosure of Proxy Voting Policies and Procedures for Closed-End Management Investment Companies. N/A |
| Item 8. | Portfolio Managers of Closed-End Management Investment Companies. N/A |
| Item 9. | Purchases of Equity Securities by Closed-End Management Investment Company and Affiliated Purchasers. N/A |
| Item 10. | Submission of Matters to a Vote of Security Holders. |
There have been no changes to the procedures by which shareholders may recommend nominees to the Registrant’s Board of Trustees that would require disclosure herein.
| Item 11. | Controls and Procedures. |
(a) Evaluation of Disclosure Controls and Procedures. The Registrant maintains disclosure controls and procedures that are designed to provide reasonable assurance that information required to be disclosed in the Registrant’s filings under the Securities Exchange Act of 1934, as amended, and the Investment Company Act of 1940 is recorded, processed, summarized and reported within the periods specified in the rules and forms of the Securities and Exchange Commission. Such information is accumulated and communicated to the Registrant’s management, including its principal executive officer and principal financial officer, as appropriate, to allow timely decisions regarding required disclosure. The Registrant’s management, including the principal executive officer and the principal financial officer, recognizes that any set of controls and procedures, no matter how well designed and operated, can provide only reasonable assurance of achieving the desired control objectives.
Within 90 days prior to the filing date of this Shareholder Report on Form N-CSR, the Registrant had carried out an evaluation, under the supervision and with the participation of the Registrant’s management, including the Registrant’s principal executive officer and the Registrant’s principal financial officer, of the effectiveness of the design and operation of the Registrant’s disclosure controls and procedures. Based on such evaluation, the Registrant’s principal executive officer and principal financial officer concluded that the Registrant’s disclosure controls and procedures are effective.
(b) Changes in Internal Controls. There have been no changes in the Registrant’s internal control over financial reporting that occurred during the period covered by this report that has materially affected, or is reasonably likely to materially affect the internal control over financial reporting.
| Item 12. | Disclosure of Securities Lending Activities for Closed-End Management Investment Company. N/A |
(a) (1) Code of Ethics
(a) (2) Certifications pursuant to Section 302 of the Sarbanes-Oxley Act of 2002 of Matthew T. Hinkle, Chief Executive Officer – Finance and Administration, and Gaston Gardey, Chief Financial Officer and Chief Accounting Officer
(b) Certifications pursuant to Section 906 of the Sarbanes-Oxley Act of 2002 of Matthew T. Hinkle, Chief Executive Officer – Finance and Administration, and Gaston Gardey, Chief Financial Officer and Chief Accounting Officer
SIGNATURES
Pursuant to the requirements of the Securities Exchange Act of 1934 and the Investment Company Act of 1940, the registrant has duly caused this report to be signed on its behalf by the undersigned, thereunto duly authorized.
| | |
| FRANKLIN INVESTORS SECURITIES TRUST |
| |
| By | | /s/MATTHEW T. HINKLE |
| | Matthew T. Hinkle Chief Executive Officer – Finance and Administration |
| Date | | December 27, 2018 |
Pursuant to the requirements of the Securities Exchange Act of 1934 and the Investment Company Act of 1940, this report has been signed below by the following persons on behalf of the registrant and in the capacities and on the dates indicated.
| | |
| |
| By | | /s/MATTHEW T. HINKLE |
| | Matthew T. Hinkle Chief Executive Officer – Finance and Administration |
| Date | | December 27, 2018 |
| | |
| |
| By | | /s/GASTON GARDEY |
| | Gaston Gardey Chief Financial Officer and Chief Accounting Officer |
| Date | | December 27, 2018 |