UNITED STATES
SECURITIES AND EXCHANGE COMMISSION
Washington, DC 20549
FORM N-CSRS
CERTIFIED SHAREHOLDER REPORT OF REGISTERED
MANAGEMENT INVESTMENT COMPANIES
Investment Company Act file number 811-04986
Franklin Investors Securities Trust
(Exact name of registrant as specified in charter)
One Franklin Parkway, San Mateo, CA 94403-1906
(Address of principal executive offices) (Zip code)
Craig S. Tyle, One Franklin Parkway, San Mateo, CA 94403-1906
(Name and address of agent for service)
Registrant’s telephone number, including area code: 650 312-2000
Date of fiscal year end: 10/31
Date of reporting period: 4/30/20
| Item 1. | Reports to Stockholders. |
| Franklin Convertible Securities Fund | Franklin Managed Income Fund | |||||||
|
| |||||||
| Franklin Equity Income Fund | ||||||||
| ||||||||
| Sign up for electronic delivery at franklintempleton.com/edelivery | ||||||||
Internet Delivery of Fund Reports Unless You Request Paper Copies: Effective January 1, 2021, as permitted by the SEC, paper copies of the Fund’s shareholder reports will no longer be sent by mail, unless you specifically request them from the Fund or your financial intermediary. Instead, the reports will be made available on a website, and you will be notified by mail each time a report is posted and provided with a website link to access the report.
If you already elected to receive shareholder reports electronically, you will not be affected by this change and you need not take any action. If you have not signed up for electronic delivery, we would encourage you to join fellow shareholders who have. You may elect to receive shareholder reports and other communications electronically from the Fund by calling (800) 632-2301 or by contacting your financial intermediary.
You may elect to continue to receive paper copies of all your future shareholder reports free of charge by contacting your financial intermediary or, if you invest directly with a Fund, calling (800) 632-2301 to let the Fund know of your request. Your election to receive reports in paper will apply to all funds held in your account.
SHAREHOLDER LETTER
Dear Shareholder:
During the six months ended April 30, 2020, the U.S. economy showed mixed results, growing moderately through the end of 2019 amid concerns about trade, but contracting in 2020’s first quarter in response to the novel coronavirus (COVID-19) pandemic. The U.S. Federal Reserve (Fed), having lowered the federal funds rate in October for the third time during 2019, held the rate unchanged through February 2020. However, given larger economic risks posed by COVID-19, the Fed lowered its key rate by 0.50% on March 3 and further by 1.00% on March 15, decreasing the rate during the period from 1.75% to 0.25%. In its efforts to support U.S. economic activity, the Fed also announced broad quantitative easing measures to support credit markets.
In this environment, the prices of U.S. stocks, as measured by the Standard & Poor’s® 500 Index (S&P 500®), dropped 4.12%, (the index decreasing from 3,037.56 to 2,912.43).1,2 Investment-grade bonds, as measured by the Bloomberg Barclays U.S. Aggregate Bond Index (Bloomberg Index), posted a +4.86% total return (an index increase from 2,227.69 to 2,335.85), which includes reinvestment of interest.3
We are committed to our long-term perspective and disciplined investment approach as we conduct a rigorous, fundamental analysis of securities with a regular emphasis on investment risk management.
We believe active, professional investment management serves investors well. We also recognize the important role of financial advisors in today’s markets and encourage investors to continue to seek their advice. Amid changing
markets and economic conditions, we are confident investors with a well-diversified portfolio and a patient, long-term outlook should be well-positioned for the years ahead.
Franklin Investors Securities Trust’s semiannual report, covering Franklin Convertible Securities Fund, Franklin Equity Income Fund and Franklin Managed Income Fund, includes more detail about prevailing conditions and a discussion about investment decisions during the period. Please remember all securities markets fluctuate, as do mutual fund share prices.
We thank you for investing with Franklin, welcome your questions and comments, and look forward to serving your future investment needs.
Sincerely,

Rupert H. Johnson, Jr.
Chairman
Franklin Investors Securities Trust
This letter reflects our analysis and opinions as of April 30, 2020, unless otherwise indicated. The information is not a complete analysis of every aspect of any market, country, industry, security or fund. Statements of fact are from sources considered reliable.
1. Source: Copyright © 2020, S&P Dow Jones Indices LLC. All rights reserved.
2. Source: Morningstar. The changes in index prices shown for the S&P 500 do not include reinvestments of income and distributions, which are included in its total return, which was: S&P 500 -3.16% (index total return resulting in a decrease from 6,138.73 to 5,944.68).
3. Sources: Morningstar and Bloomberg Barclays Indices. For the Bloomberg Index, only total return as shown is available, not price change without the inclusion of reinvested income and distributions.
See www.franklintempletondatasources.com for additional data provider information.
|
Not FDIC Insured | May Lose Value | No Bank Guarantee
|
|
franklintempleton.com | Not part of the semiannual report | 1 | ||
| ||||
Semiannual Report | ||||
| 3 | ||||
| 4 | ||||
| 9 | ||||
| 15 | ||||
| 24 | ||||
| 53 | ||||
| 59 | ||||
| 75 | ||||
| Visit franklintempleton.com for fund updates, to access your account, or to find helpful financial planning tools. |
|
2 |
| Semiannual Report | franklintempleton.com | ||
SEMIANNUAL REPORT
U.S. equities, as measured by the Standard & Poor’s 500 Index (S&P 500), declined during the six months under review. Equities advanced strongly throughout the first half of the reporting period, aided by relatively steady economic growth, easing trade tensions and the U.S. Federal Reserve’s (Fed’s) supportive monetary policy. However, a sharp selloff began in late February 2020 amid investor fears of a global economic slowdown due to the novel coronavirus (COVID-19) pandemic. Concerns about global supply chain disruptions and subdued consumer spending drove many investors to sell equity holdings in favor of perceived safe investments such as government bonds and cash.
Before the pandemic, the Fed maintained the federal funds target rate at a range of 1.50%–1.75%. The labor market remained strong through February 2020 and supported consumer spending.
However, economic activity contracted considerably as the COVID-19 pandemic spread and many state and local governments issued stay-at-home orders, which included business closures and restrictions. Layoffs in many industries, particularly retail, restaurants and hospitality, led to approximately 30 million workers filing for unemployment benefits in the last six weeks of the reporting period. As a result, the unemployment rate rose from a 50-year low of 3.5% in February 2020 to 14.7% at period-end, the highest level since the Great Depression.1
In an effort to buffer the sharp drop in economic activity, the Fed cut the federal funds target rate twice to a range of 0.00%–0.25% and announced broad quantitative easing measures aimed at ensuring the free flow of credit to borrowers and supporting credit markets with unlimited amounts of bond purchases. Meanwhile, Congress passed the Coronavirus Aid, Relief and Economic Security Act to provide economic relief for individuals and businesses, as well as additional funding for small businesses, while also considering proposals for longer-term economic stimulus. Investor sentiment was bolstered by the fiscal and monetary stimulus measures, anticipated development of COVID-19 treatments and gradual easing of social distancing policies beginning in late April 2020. U.S. stocks, as measured by the S&P 500,
bounced from multi-year lows, but still finished the reporting period with negative returns.
The foregoing information reflects our analysis and opinions as of April 30, 2020. The information is not a complete analysis of every aspect of any market, country, industry, security or fund. Statements of fact are from sources considered reliable.
1. Source: Bureau of Labor Statistics
franklintempleton.com | Semiannual Report | 3 | ||||
Franklin Convertible Securities Fund
This semiannual report for Franklin Convertible Securities Fund covers the period ended April 30, 2020. The Fund closed to new investors with limited exceptions on August 29, 2018. Existing investors may continue to purchase additional shares of the Fund.
Your Fund’s Goal and Main Investments
The Fund seeks to maximize total return, consistent with reasonable risk, by seeking to optimize capital appreciation and high current income under varying market conditions. The Fund normally invests at least 80% of its net assets in convertible securities and common stock received upon conversion of convertible securities.
Performance Overview
For the six months under review, the Fund’s Class A shares posted a +3.15% cumulative total return. In comparison, the Fund’s benchmark, the ICE BofA Merrill Lynch (BofAML) All Alternatives U.S. Convertibles Index, which tracks the domestic convertible securities market, posted a +1.57% total return.1 You can find the Fund’s long-term performance data in the Performance Summary beginning on page 6.
Performance data represent past performance, which does not guarantee future results. Investment return and principal value will fluctuate, and you may have a gain or loss when you sell your shares. Current performance may differ from figures shown. For most recent month-end performance, go to franklintempleton.com or call (800) 342-5236.
Investment Strategy
When choosing convertible securities for the Fund, we attempt to maintain a balance in the portfolio between the equity and debt characteristics of convertible securities with an emphasis on the equity features. We also consider the company’s long-term earnings, asset value and cash flow potential. By investing in convertible securities, the Fund seeks the opportunity to participate in the capital appreciation of underlying stocks, while at the same time relying on the fixed income aspect of the convertible securities to provide current income and reduced price volatility, which can limit the risk of loss in a down equity
Portfolio Composition
Based on Total Net Assets as of 4/30/20
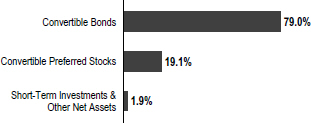
market. Some of the convertible securities in which the Fund may invest have been structured to provide enhanced yield, increased equity exposure or enhanced downside protection. These securities typically provide a benefit to the issuer in exchange for the enhanced features, such as a conversion premium that is paid by the Fund. We may invest in convertible securities of companies of any capitalization size, but we generally seek to make the portfolio representative of the entire convertible securities market.
Manager’s Discussion
The health care, information technology (IT) and consumer discretionary sectors contributed most to Fund performance during the period. In health care, the Fund’s holdings of convertible bonds issued by medical device manufacturers Dexcom and Insulet were top contributors. DexCom continued to offer leading technology in a growing market and reported strong first-quarter 2020 results, and we believe the company’s underlying operational momentum may largely offset potential COVID-19 disruptions. Among a number of IT positions that contributed notably to performance, the Fund’s holdings of convertible bonds issued by cloud-based electronic signature solutions provider DocuSign, enterprise IT management software provider ServiceNow and software hosting services provider Atlassian were top contributors. DocuSign’s revenue was boosted by broadened product offerings after the company introduced the DocuSign Agreement Cloud last year and maintained strong growth from its eSignature products. In consumer discretionary, our holdings of convertible bonds issued by online home-goods retailer Wayfair and e-commerce company Etsy contributed to performance.
1. Source: Morningstar.
The index is unmanaged and includes reinvestment of any income or distributions. It does not reflect any fees, expenses or sales charges. One cannot invest directly in an index, and an index is not representative of the Fund’s portfolio.
See www.franklintempletondatasources.com for additional data provider information.
The dollar value, number of shares or principal amount, and names of all portfolio holdings are listed in the Fund’s Statement of Investments (SOI).
The SOI begins on page 28.
4 | Semiannual Report | franklintempleton.com | ||
FRANKLIN CONVERTIBLE SECURITIES FUND
Wayfair struggled in February after the company disclosed a fourth-quarter operating loss, weak first-quarter guidance and supply chain disruptions. However, in April, increased home furnishing purchases by consumers subject to stay-at-home orders due to the COVID-19 pandemic helped the company.
In contrast, the energy, utilities and communication services sectors detracted from Fund performance. In energy, our holdings in convertible bonds issued by oil and gas services company Oil States International detracted from performance. Oil States International suffered consecutive quarterly net losses due to a significant decline in U.S. land-based operational activity, and the company pledged to preserve liquidity and control expenses. In utilities and communication services, common stocks issued by electric power and energy infrastructure company NextEra Energy and convertible bonds issued by satellite TV provider Dish Network hurt results.
In other sectors, the Fund’s holdings in convertible bonds issued by online travel provider Booking Holdings, network and optical products provider Viavi Solutions and common and convertible preferred stocks issued by power and hand tools provider Stanley Black & Decker also hurt results. Booking Holdings experienced declining travel reservations due to the COVID-19 pandemic, which disrupted the company’s most profitable hotel business in western Europe as well as its business in the Asia Pacific region. Although Viavi Solutions reported record second-quarter revenue and growing earnings due to an unexpected recovery in its datacenter market, anticipation of poor third-quarter results, given a business downturn amid the COVID-19 pandemic, hurt the company.
Thank you for your continued participation in Franklin Convertible Securities Fund. We look forward to serving your future investment needs.
 |
Alan E. Muschott, CFA Lead Portfolio Manager | |
Eric Webster, CFA Portfolio Manager | ||

CFA® is a trademark owned by CFA Institute.
| Top 10 Holdings | ||||
| 4/30/20 | ||||
Company Sector/Industry | % of Total Net Assets | |||
DexCom Inc. Health Care | 2.7% | |||
Wayfair Inc. Consumer Discretionary | 2.3% | |||
DocuSign Inc. Information Technology | 2.2% | |||
Microchip Technology Inc. Information Technology | | 2.2% | | |
Okta Inc. Information Technology | | 2.2% | | |
Atlassian Inc. Information Technology | | 2.2% | | |
Etsy Inc. Consumer Discretionary | | 2.1% | | |
MercadoLibre Inc. Consumer Discretionary | | 2.1% | | |
Insulet Corp. Health Care | | 2.1% | | |
Broadcom Inc. Information Technology | | 2.1% | | |
The foregoing information reflects our analysis, opinions and portfolio holdings as of April 30, 2020, the end of the reporting period. The way we implement our main investment strategies and the resulting portfolio holdings may change depending on factors such as market and economic conditions. These opinions may not be relied upon as investment advice or an offer for a particular security. The information is not a complete analysis of every aspect of any market, country, industry, security or the Fund. Statements of fact are from sources considered reliable, but the investment manager makes no representation or warranty as to their completeness or accuracy. Although historical performance is no guarantee of future results, these insights may help you understand our investment management philosophy.
franklintempleton.com | Semiannual Report | 5 | ||||
FRANKLIN CONVERTIBLE SECURITIES FUND
Performance Summary as of April 30, 2020
The performance tables do not reflect any taxes that a shareholder would pay on Fund dividends, capital gain distributions, if any, or any realized gains on the sale of Fund shares. Total return reflects reinvestment of the Fund’s dividends and capital gain distributions, if any, and any unrealized gains or losses. Your dividend income will vary depending on dividends or interest paid by securities in the Fund’s portfolio, adjusted for operating expenses of each class. Capital gain distributions are net profits realized from the sale of portfolio securities.
Performance as of 4/30/201
Cumulative total return excludes sales charges. Average annual total return includes maximum sales charges. Sales charges will vary depending on the size of the investment and the class of share purchased. The maximum is 5.50% and the minimum is 0%. Class A: 5.50% maximum initial sales charge; Advisor Class: no sales charges. For other share classes, visit franklintempleton.com.
| Share Class | Cumulative Total Return2 | Average Annual Total Return3 | ||
| A4 | ||||
6-Month
| +3.15% | -2.53% | ||
1-Year
|
+2.93% |
-2.73% | ||
5-Year
|
+56.42% |
+8.13% | ||
10-Year
|
+147.94% |
+8.89% | ||
Advisor
| ||||
6-Month
| +3.27% | +3.27% | ||
1-Year
|
+3.18% |
+3.18% | ||
5-Year
|
+58.45% |
+9.64% | ||
10-Year
|
+154.16% |
+9.78% | ||
| Distribution | 30-Day Standardized Yield6 | |||||||||
| Share Class | Rate5 | (with fee waiver) | (without fee waiver) | |||||||
A
| 1.40%
| 1.86%
| 1.86%
| |||||||
Advisor
| 1.77%
| 2.20%
| 2.20%
| |||||||
Performance data represent past performance, which does not guarantee future results. Investment return and principal value will fluctuate, and you may have a gain or loss when you sell your shares. Current performance may differ from figures shown. For most recent month-end performance, go to franklintempleton.com or call (800) 342-5236.
See page 7 for Performance Summary footnotes.
6 |
Semiannual Report |
franklintempleton.com | ||
FRANKLIN CONVERTIBLE SECURITIES FUND
PERFORMANCE SUMMARY
Distributions (11/1/19–4/30/20)
| Share Class | Net Investment Income | Short-Term Capital Gain | Long-Term Capital Gain | Total | ||||||||||||
A
| $0.1775 | $0.5120 | $1.0963 | $1.7858 | ||||||||||||
C
|
|
$0.0778 |
|
|
$0.5120 |
|
|
$1.0963 |
|
|
$1.6861 |
| ||||
R6
|
|
$0.2227 |
|
|
$0.5120 |
|
|
$1.0963 |
|
|
$1.8310 |
| ||||
Advisor
|
|
$0.2101 |
|
|
$0.5120 |
|
|
$1.0963 |
|
|
$1.8184 |
| ||||
Total Annual Operating Expenses7
|
| |||||||||||||||
| Share Class | With Fee Waiver | Without Fee Waiver | ||||||||||||||
A
|
|
0.84%
|
|
|
0.86%
|
| ||||||||||
Advisor
|
|
0.59%
|
|
|
0.61%
|
| ||||||||||
Each class of shares is available to certain eligible investors and has different annual fees and expenses, as described in the prospectus.
All investments involve risks, including possible loss of principal. Convertible securities are subject to the risks of stocks when the underlying stock price is high relative to the conversion price (because more of the security’s value resides in the conversion feature) and debt securities when the underlying stock price is low relative to the conversion price (because the conversion feature is less valuable). A convertible security is not as sensitive to interest rate changes as a similar non-convertible debt security, and generally has less potential for gain or loss than the underlying stock. The Fund may invest in high-yielding, fixed income securities. High yields reflect the higher credit risk associated with these lower-rated securities and, in some cases, the lower market prices for these instruments. Interest rate movements may affect the Fund’s share price and yield. Bond prices generally move in the opposite direction of interest rates. As prices of bonds in the Fund adjust to a rise in interest rates, the Fund’s share price may decline. The Fund may also invest in foreign securities, which involve special risks, including political uncertainty and currency volatility. Unexpected events and their aftermaths, such as the spread of deadly diseases; natural, environmental or man-made disasters; financial, political or social disruptions; terrorism and war; and other tragedies or catastrophes, can cause investor fear and panic, which can adversely affect the economies of many companies, sectors, nations, regions and the market in general, in ways that cannot necessarily be foreseen. The Fund’s prospectus also includes a description of the main investment risks.
1. The Fund has a fee waiver associated with any investment it makes in a Franklin Templeton money fund and/or other Franklin Templeton fund, contractually guaranteed through 2/28/21. Fund investment results reflect the fee waiver; without this reduction, the results would have been lower.
2. Cumulative total return represents the change in value of an investment over the periods indicated.
3. Average annual total return represents the average annual change in value of an investment over the periods indicated. Return for less than one year, if any, has not been annualized.
4. Prior to 9/10/18, these shares were offered at a higher initial sales charge of 5.75%, thus actual returns (with sales charges) would have differed. Average annual total returns (with sales charges) have been restated to reflect the current maximum initial sales charge of 5.50%.
5. Distribution rate is based on an annualization of the respective class’s past four quarterly dividends and the maximum offering price (NAV for Advisor Class) per share on 4/30/20.
6. The Fund’s 30-day standardized yield is calculated over a trailing 30-day period using the yield to maturity on bonds and/or the dividends accrued on stocks. It may not equal the Fund’s actual income distribution rate, which reflects the Fund’s past dividends paid to shareholders.
7. Figures are as stated in the Fund’s current prospectus and may differ from the expense ratios disclosed in the Your Fund’s Expenses and Financial Highlights sections in this report. In periods of market volatility, assets may decline significantly, causing total annual Fund operating expenses to become higher than the figures shown.
franklintempleton.com | Semiannual Report | 7 | ||||
FRANKLIN CONVERTIBLE SECURITIES FUND
Your Fund’s Expenses
As a Fund shareholder, you can incur two types of costs: (1) transaction costs, including sales charges (loads) on Fund purchases and redemptions; and (2) ongoing Fund costs, including management fees, distribution and service (12b-1) fees, and other Fund expenses. All mutual funds have ongoing costs, sometimes referred to as operating expenses. The table below shows ongoing costs of investing in the Fund and can help you understand these costs and compare them with those of other mutual funds. The table assumes a $1,000 investment held for the six months indicated.
Actual Fund Expenses
The table below provides information about actual account values and actual expenses in the columns under the heading “Actual.” In these columns the Fund’s actual return, which includes the effect of Fund expenses, is used to calculate the “Ending Account Value” for each class of shares. You can estimate the expenses you paid during the period by following these steps (of course, your account value and expenses will differ from those in this illustration): Divide your account value by $1,000 (if your account had an $8,600 value, then $8,600 ÷ $1,000 = 8.6). Then multiply the result by the number in the row for your class of shares under the headings “Actual” and “Expenses Paid During Period” (if Actual Expenses Paid During Period were $7.50, then 8.6 x $7.50 = $64.50). In this illustration, the actual expenses paid this period are $64.50.
Hypothetical Example for Comparison with Other Funds
Under the heading “Hypothetical” in the table, information is provided about hypothetical account values and hypothetical expenses based on the Fund’s actual expense ratio and an assumed rate of return of 5% per year before expenses, which is not the Fund’s actual return. This information may not be used to estimate the actual ending account balance or expenses you paid for the period, but it can help you compare ongoing costs of investing in the Fund with those of other funds. To do so, compare this 5% hypothetical example for the class of shares you hold with the 5% hypothetical examples that appear in the shareholder reports of other funds.
Please note that expenses shown in the table are meant to highlight ongoing costs and do not reflect any transactional costs. Therefore, information under the heading “Hypothetical” is useful in comparing ongoing costs only, and will not help you compare total costs of owning different funds. In addition, if transactional costs were included, your total costs would have been higher.
Actual (actual return after expenses) | Hypothetical (5% annual return before expenses) | |||||||||||||||||
|
| |||||||||||||||||
| Share Class | Beginning Account Value 11/1/19 | Ending Account Value 4/30/20 | Expenses Paid During | Ending Account Value 4/30/20 | Expenses Paid During | Net Annualized Expense Ratio2 | ||||||||||||
|
|
|
| |||||||||||||||
| A | $1,000 | $1,031.50 | $4.24 | $1,020.69 | $4.22 | 0.84% | ||||||||||||
| C | $1,000 | $1,027.90 | $8.02 | $1,016.96 | $7.97 | 1.59% | ||||||||||||
| R6 | $1,000 | $1,033.10 | $2.53 | $1,022.38 | $2.51 | 0.50% | ||||||||||||
| Advisor | $1,000 | $1,032.70 | $2.98 | $1,021.93 | $2.97 | 0.59% | ||||||||||||
1. Expenses are equal to the annualized expense ratio for the six-month period as indicated above—in the far right column—multiplied by the simple average account value over the period indicated, and then multiplied by 182/366 to reflect the one-half year period.
2. Reflects expenses after fee waivers and expense reimbursements. Does not include acquired fund fees and expenses.
8 | Semiannual Report | franklintempleton.com | ||
This semiannual report for Franklin Equity Income Fund covers the period ended April 30, 2020.
Your Fund’s Goal and Main Investments
The Fund seeks to maximize total return by emphasizing high current income and long-term capital appreciation, consistent with reasonable risk, by normally investing at least 80% of its net assets in equity securities, including securities convertible into common stocks. The Fund generally invests the remainder of its assets in other equity-related instruments such as convertible securities and equity-linked notes (ELNs), and may also invest in foreign securities, including emerging markets.
Performance Overview
For the six months under review, the Fund’s Class A shares posted a -9.64% cumulative total return. In comparison, the Fund’s new primary benchmark, the Russell 1000® Value Index, which measures performance of the largest companies in the Russell 3000® Index, and represents the majority of the U.S. market’s total capitalization, posted a -13.66% total return.1 The Fund’s new secondary benchmark and former primary benchmark, the Standard & Poor’s 500 Index (S&P 500), which tracks the broad U.S. stock market, posted a -3.16% total return.1 The Russell 1000® Value Index is replacing the S&P 500 Index as the Fund’s primary benchmark because the investment manager believes that the Russell 1000® Value Index more accurately reflects the Fund’s investment strategy. You can find the Fund’s long-term performance data in the Performance Summary beginning on page 12.
Performance data represent past performance, which does not guarantee future results. Investment return and principal value will fluctuate, and you may have a gain or loss when you sell your shares. Current performance may differ from figures shown. For most recent month-end performance, go to franklintempleton.com or call (800) 342-5236.
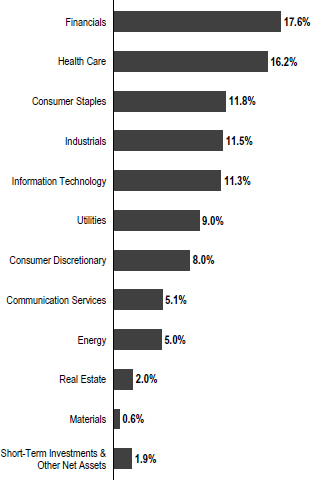
Portfolio Composition
Based on Total Net Assets as of 4/30/20
Investment Strategy
We seek to invest in a broadly diversified portfolio of equity securities that we consider to be financially strong, with a focus on blue chip companies. We apply a bottom-up approach to investing in individual securities. We will assess the market price of a company’s securities relative to our evaluation of the company’s long-term earnings, cash flow potential and balance sheet strength. We also consider a company’s price/earnings ratio, return on capital, profit
1. Source: Morningstar.
Frank Russell Company is the source and owner of the trademarks, service marks and copyrights related to the Russell Indexes. Russell® is a trademark of Frank Russell Company.
The indexes are unmanaged and include reinvestment of any income or distributions. They do not include any fees, expenses or sales charges. One cannot invest directly in an index, and an index is not representative of the Fund’s portfolio.
See www.franklintempletondatasources.com for additional data provider information.
The dollar value, number of shares or principal amount, and names of all portfolio holdings are listed in the Fund’s Statement of Investments (SOI).
The SOI begins on page 37.
franklintempleton.com | Semiannual Report | 9 | ||||
FRANKLIN EQUITY INCOME FUND
margins and asset value. We consider dividend yield and the opportunity for dividend growth in selecting stocks for the Fund because we believe that, over time, dividend income can contribute significantly to total return and can be a more consistent source of investment return than capital appreciation. We seek to take advantage of price dislocations that result from the market’s short-term focus and choose to invest in those companies that, in our opinion, offer the best trade-off between growth opportunity, business and financial risk, and valuation.
Manager’s Discussion
The information technology (IT), health care and consumer discretionary sectors contributed to Fund performance during the period. Within IT, information software and services firm Microsoft and personal computing device manufacturer and service provider Apple were notable contributors. Microsoft’s shares rose during the period on strong earnings reports for the last two quarters, with their Intelligent Cloud line of products performing particularly well. Nearly every major business became more relevant as a result of the COVID-19 pandemic and the broader digital transformation opportunity. In health care, health care products and services provider Johnson & Johnson, managed care provider UnitedHealth Group and medical and environmental technology products company Danaher were notable contributors. Johnson & Johnson reported strong first-quarter 2020 sales growth driven by its pharmaceutical products, particularly for oncology, as well as its consumer products, although the company reduced its 2020 guidance due to the impact of the COVID-19 pandemic.
In consumer discretionary, online marketplace and web services operator Amazon.com contributed to absolute results as shares of the company rose during the COVID-19 pandemic in 2020’s first quarter. Consumers increasingly turned to the online retailer for basic goods as they spent growing amounts of time at home, boosting sales. The company also benefited from the increase in remote working, which has made more companies reliant on technology infrastructure provided by Amazon Web Services. In other sectors, discount general merchandise retailer Walmart also helped results.
In contrast, the financials, industrials and energy sectors detracted most from performance. Financials sector holdings, including leading banks JPMorgan Chase and Bank of America, struggled with declining interest rates, fears of elevated credit losses, and the need to build reserves as recessionary conditions took hold due to the pandemic. In industrials, aerospace and defense company Raytheon Company merged with United Technologies on
| Top 10 Holdings | ||||
| 4/30/20 | ||||
| Company Sector/Industry | % of Total Net Assets | |||
JPMorgan Chase & Co. Financials | 3.8% | |||
Johnson & Johnson Health Care | 3.3% | |||
The Procter & Gamble Co. Consumer Staples | | 2.9% | | |
Microsoft Corp. Information Technology | | 2.7% | | |
NextEra Energy Inc. Utilities | | 2.5% | | |
Verizon Communications Inc. Communication Services | | 2.5% | | |
Chevron Corp. Energy | | 2.5% | | |
PepsiCo Inc. Consumer Staples | | 2.4% | | |
Morgan Stanley Financials | | 2.4% | | |
Duke Energy Corp. Utilities | | 2.4% | | |
April 3, 2020, to form Raytheon Technologies. Despite the negative impact of recently declining aviation demand, the newly combined company expects to introduce breakthrough technologies at an accelerated pace across high-value areas of commercial aerospace and defense. In energy, integrated energy company Suncor Energy and oil exploration and production firm Royal Dutch Shell hindered performance. In other sectors, nonalcoholic beverage producer Coca-Cola also hurt results.
10 | Semiannual Report | franklintempleton.com | ||
FRANKLIN EQUITY INCOME FUND
Thank you for your continued participation in Franklin Equity Income Fund. We look forward to serving your future investment needs.
 |
Matthew D. Quinlan | |
 |
Alan E. Muschott, CFA | |
| Todd Brighton, CFA | ||
| Portfolio Management Team | ||

The foregoing information reflects our analysis, opinions and portfolio holdings as of April 30, 2020, the end of the reporting period. The way we implement our main investment strategies and the resulting portfolio holdings may change depending on factors such as market and economic conditions. These opinions may not be relied upon as investment advice or an offer for a particular security. The information is not a complete analysis of every aspect of any market, country, industry, security or the Fund. Statements of fact are from sources considered reliable, but the investment manager makes no representation or warranty as to their completeness or accuracy. Although historical performance is no guarantee of future results, these insights may help you understand our investment management philosophy.
franklintempleton.com | Semiannual Report | 11 | ||||
FRANKLIN EQUITY INCOME FUND
Performance Summary as of April 30, 2020
The performance tables do not reflect any taxes that a shareholder would pay on Fund dividends, capital gain distributions, if any, or any realized gains on the sale of Fund shares. Total return reflects reinvestment of the Fund’s dividends and capital gain distributions, if any, and any unrealized gains or losses. Your dividend income will vary depending on dividends or interest paid by securities in the Fund’s portfolio, adjusted for operating expenses of each class. Capital gain distributions are net profits realized from the sale of portfolio securities.
Performance as of 4/30/201
Cumulative total return excludes sales charges. Average annual total return includes maximum sales charges. Sales charges will vary depending on the size of the investment and the class of share purchased. The maximum is 5.50% and the minimum is 0%. Class A: 5.50% maximum initial sales charge; Advisor Class: no sales charges. For other share classes, visit franklintempleton.com.
Share Class | Cumulative Total Return2 | | Average Annual Total Return | 3 | ||
A4 6-Month | -9.64% | -14.62% | ||||
1-Year | -6.09% | -11.27% | ||||
5-Year | +29.99% | +4.20% | ||||
10-Year | +130.07% | +8.08% | ||||
Advisor 6-Month | -9.51% | -9.51% | ||||
1-Year | -5.80% | -5.80% | ||||
5-Year | +31.65% | +5.65% | ||||
10-Year | +136.02% | +8.97% |
| Distribution | 30-Day Standardized Yield6 | |||||||||
| Share Class | Rate5 | (with fee waiver) | (without fee waiver) | |||||||
A | 2.75% | 2.10% | 2.09% | |||||||
Advisor | 3.19% | 2.46% | 2.46% | |||||||
Performance data represent past performance, which does not guarantee future results. Investment return and principal value will fluctuate, and you may have a gain or loss when you sell your shares. Current performance may differ from figures shown. For most recent month-end performance, go to franklintempleton.com or call (800) 342-5236.
See page 13 for Performance Summary footnotes.
12 |
Semiannual Report |
franklintempleton.com | ||
FRANKLIN EQUITY INCOME FUND
PERFORMANCE SUMMARY
Distributions (11/1/19–4/30/20)
| Share Class | Net Investment Income | Long-Term Capital Gain | Total | |||||||||
A | $0.3263 | $0.7586 | $1.0849 | |||||||||
C | $0.2097 | $0.7586 | $0.9683 | |||||||||
R | $0.2886 | $0.7586 | $1.0472 | |||||||||
R6 | $0.3798 | $0.7586 | $1.1384 | |||||||||
Advisor | $0.3652 | $0.7586 | $1.1238 | |||||||||
Total Annual Operating Expenses7
|
| |||||||||||
| Share Class | With Fee Waiver | Without Fee Waiver | ||||||||||
A | 0.86% | 0.87% | ||||||||||
Advisor | 0.61% | 0.62% | ||||||||||
Each class of shares is available to certain eligible investors and has different annual fees and expenses, as described in the prospectus.
All investments involve risks, including possible loss of principal. Stock prices fluctuate, sometimes rapidly and dramatically, due to factors affecting individual companies, particular industries or sectors, or general market conditions. Convertible securities are subject to the risks of stocks when the underlying stock price is high relative to the conversion price and debt securities when the underlying stock price is low relative to the conversion price. Investments in ELNs often have risks similar to their underlying securities, which could include management risk, market risk and, as applicable, foreign securities and currency risks. The Fund’s investment in foreign securities also involves special risks, including currency fluctuations and economic as well as political uncertainty. Unexpected events and their aftermaths, such as the spread of deadly diseases; natural, environmental or man-made disasters; financial, political or social disruptions; terrorism and war; and other tragedies or catastrophes, can cause investor fear and panic, which can adversely affect the economies of many companies, sectors, nations, regions and the market in general, in ways that cannot necessarily be foreseen. The Fund’s prospectus also includes a description of the main investment risks.
1. The Fund has a fee waiver associated with any investment it makes in a Franklin Templeton money fund and/or other Franklin Templeton fund, contractually guaranteed through 2/28/21. Fund investment results reflect the fee waiver; without this reduction, the results would have been lower.
2. Cumulative total return represents the change in value of an investment over the periods indicated.
3. Average annual total return represents the average annual change in value of an investment over the periods indicated. Return for less than one year, if any, has not been annualized.
4. Prior to 9/10/18, these shares were offered at a higher initial sales charge of 5.75%, thus actual returns (with sales charges) would have differed. Average annual total returns (with sales charges) have been restated to reflect the current maximum initial sales charge of 5.50%.
5. Distribution rate is based on an annualization of the respective class’s current quarterly dividend and the maximum offering price (NAV for Advisor Class) per share on 4/30/20.
6. The Fund’s 30-day standardized yield is calculated over a trailing 30-day period using the yield to maturity on bonds and/or the dividends accrued on stocks. It may not equal the Fund’s actual income distribution rate, which reflects the Fund’s past dividends paid to shareholders.
7. Figures are as stated in the Fund’s current prospectus and may differ from the expense ratios disclosed in the Your Fund’s Expenses and Financial Highlights sections in this report. In periods of market volatility, assets may decline significantly, causing total annual Fund operating expenses to become higher than the figures shown.
franklintempleton.com | Semiannual Report | 13 | ||||
FRANKLIN EQUITY INCOME FUND
Your Fund’s Expenses
As a Fund shareholder, you can incur two types of costs: (1) transaction costs, including sales charges (loads) on Fund purchases and redemptions; and (2) ongoing Fund costs, including management fees, distribution and service (12b-1) fees, and other Fund expenses. All mutual funds have ongoing costs, sometimes referred to as operating expenses. The table below shows ongoing costs of investing in the Fund and can help you understand these costs and compare them with those of other mutual funds. The table assumes a $1,000 investment held for the six months indicated.
Actual Fund Expenses
The table below provides information about actual account values and actual expenses in the columns under the heading “Actual.” In these columns the Fund’s actual return, which includes the effect of Fund expenses, is used to calculate the “Ending Account Value” for each class of shares. You can estimate the expenses you paid during the period by following these steps (of course, your account value and expenses will differ from those in this illustration): Divide your account value by $1,000 (if your account had an $8,600 value, then $8,600 ÷ $1,000 = 8.6). Then multiply the result by the number in the row for your class of shares under the headings “Actual” and “Expenses Paid During Period” (if Actual Expenses Paid During Period were $7.50, then 8.6 x $7.50 = $64.50). In this illustration, the actual expenses paid this period are $64.50.
Hypothetical Example for Comparison with Other Funds
Under the heading “Hypothetical” in the table, information is provided about hypothetical account values and hypothetical expenses based on the Fund’s actual expense ratio and an assumed rate of return of 5% per year before expenses, which is not the Fund’s actual return. This information may not be used to estimate the actual ending account balance or expenses you paid for the period, but it can help you compare ongoing costs of investing in the Fund with those of other funds. To do so, compare this 5% hypothetical example for the class of shares you hold with the 5% hypothetical examples that appear in the shareholder reports of other funds.
Please note that expenses shown in the table are meant to highlight ongoing costs and do not reflect any transactional costs. Therefore, information under the heading “Hypothetical” is useful in comparing ongoing costs only, and will not help you compare total costs of owning different funds. In addition, if transactional costs were included, your total costs would have been higher.
Actual (actual return after expenses) | Hypothetical (5% annual return before expenses) | |||||||||||||||||
|
| |||||||||||||||||
| Share Class | Beginning Account Value 11/1/19 | Ending Account Value 4/30/20 | Expenses Paid During Period | Ending Account Value 4/30/20 | Expenses Paid During Period 11/1/19–4/30/201, 2 | Net Annualized Expense Ratio2 | ||||||||||||
|
|
|
| |||||||||||||||
| A | $1,000 | $903.60 | $3.93 | $1,020.74 | $4.17 | 0.83% | ||||||||||||
| C | $1,000 | $900.10 | $7.46 | $1,017.01 | $7.92 | 1.58% | ||||||||||||
| R | $1,000 | $902.90 | $5.02 | $1,019.59 | $5.32 | 1.06% | ||||||||||||
| R6 | $1,000 | $905.10 | $2.37 | $1,022.38 | $2.51 | 0.50% | ||||||||||||
| Advisor | $1,000 | $904.90 | $2.75 | $1,021.98 | $2.92 | 0.58% | ||||||||||||
1. Expenses are equal to the annualized expense ratio for the six-month period as indicated above—in the far right column—multiplied by the simple average account value over the period indicated, and then multiplied by 182/366 to reflect the one-half year period.
2. Reflects expenses after fee waivers and expense reimbursements. Does not include acquired fund fees and expenses.
14 | Semiannual Report | franklintempleton.com | ||
This semiannual report for Franklin Managed Income Fund covers the period ended April 30, 2020.
Your Fund’s Goal and Main Investments
The Fund seeks to maximize income to support monthly distributions, while maintaining the prospects for capital appreciation by investing, under normal market conditions, in a diversified portfolio of stocks (substantially dividend paying) and debt securities. The Fund normally invests at least 25% of its total assets in debt securities, including bonds, notes, debentures and money market securities, and at least 25% of its total assets in equity securities, primarily common and preferred stock.
Portfolio Composition*
4/30/20
| % of Total Net Assets | ||||
Stocks | 60.5% | |||
Common Stocks | 36.5% | |||
Equity-Linked Securities | 14.1% | |||
Convertible Preferred Stocks | 6.0% | |||
Management Investment Companies | 2.8% | |||
Options Purchased | 0.7% | |||
Preferred Stocks | 0.4% | |||
Bonds | 38.7% | |||
Corporate Bonds | 30.4% | |||
U.S. Government and Agency Securities | 4.5% | |||
Mortgage-Backed Securities
|
| 3.8%
|
| |
Short-Term Investments & Other Net Assets**
|
| 0.8%
|
| |
*Figures reflect certain derivatives held in the portfolio (or their underlying reference assets) and may not total 100% or may be negative due to rounding, use of derivatives, unsettled trades or other factors.
**Includes money market funds and other net assets (including derivatives).
Performance Overview
For the six months under review, the Fund’s Class A shares posted a cumulative total return of -5.15%. In comparison, the Fund’s new primary and former secondary benchmark, the blended 25% ICE BofA Merrill Lynch (BofAML) U.S. Corporate & High Yield Index, 25% Bloomberg Barclays U.S. Aggregate Bond Index and 50% MSCI USA High Dividend Yield Index (Blended Benchmark), which is a combination of
leading stock and bond indexes, posted a -3.16% total return.1 The ICE BofAML U.S. Corporate & High Yield Index tracks the performance of U.S. dollar-denominated investment-grade corporate debt publicly issued in the U.S. domestic market, and below investment grade, but not in default, U.S. dollar-denominated corporate bonds publicly issued in the U.S. domestic market, and includes issues with a credit rating of BBB or below, as rated by credit rating agencies Moody’s and Standard & Poor’s. The Bloomberg Barclays U.S. Aggregate Bond Index tracks the U.S. investment-grade, taxable bond market. The MSCI USA High Dividend Yield Index is designed to reflect the performance of equities in the MSCI USA Index (excluding REITs) with higher dividend income and quality characteristics than average dividend yields that are both sustainable and persistent. The Fund’s new secondary and former primary benchmark, the Bloomberg Barclays U.S. Aggregate Bond Index, posted a +4.86% total return.2 The Fund’s third benchmark, the Standard & Poor’s 500 Index (S&P 500), which is a broad measure of U.S. stock performance, posted a -3.16% total return.2 You can find the Fund’s long-term performance data in the Performance Summary beginning on page 19.
Performance data represent past performance, which does not guarantee future results. Investment return and principal value will fluctuate, and you may have a gain or loss when you sell your shares. Current performance may differ from figures shown. For most recent month-end performance, go to franklintempleton.com or call (800) 342-5236.
Investment Strategy
We apply a bottom-up approach to investing in individual securities. We will assess the market price of a company’s securities relative to our evaluation of the company’s long-term earnings, asset value and cash flow potential. We also consider a company’s price/earnings ratio, profit margins and liquidation value. In determining an optimal mix of equity and fixed income investments for the Fund, we assess changing economic, market and industry conditions. The Fund seeks income by investing in a combination of corporate, agency and government bonds issued in the U.S.
1. Source: FactSet. The Blended Benchmark was calculated internally and rebalanced monthly.
2. Source: Morningstar.
The indexes are unmanaged and include reinvestment of any income or distributions. One cannot invest directly in an index, and an index is not representative of the Fund’s portfolio.
See www.franklintempletondatasources.com for additional data provider information.
The dollar value, number of shares or principal amount, and names of all portfolio holdings are listed in the Fund’s Statement of Investments (SOI).
The SOI begins on page 46.
franklintempleton.com | Semiannual Report | 15 | ||||
FRANKLIN MANAGED INCOME FUND
and other countries, as well as common stocks in any market capitalization and convertible securities. The Fund seeks capital appreciation by investing in equity securities and convertible securities of companies from a variety of industries. We may, from time to time, use for various purposes equity-related derivatives, including call and put options and futures on equity securities and equity indexes, options on equity index futures, as well as interest-rate, currency and credit-related derivatives. These purposes include enhancing Fund returns, increasing liquidity, gaining exposure to particular instruments or markets in more efficient or less expensive ways and/or hedging risks. The use of such derivative transactions may allow the Fund to obtain net long or short exposures to selected securities, markets, interest rates, countries, currencies, credits or durations.
What are put and call options? |
A put option is a contract giving the owner the right, but not the obligation, to sell a specified amount of an underlying security at a specified price within a specified time. Put options are most commonly used to protect against the decline of a stock price below a certain price. Conversely, a call option gives the holder the right to buy shares at a specified price within a specified time, regardless of the price in the future before the expiration date. If the stock price rises, the holder of the call option has the right to buy at the agreed-upon price, which could be lower.
|
What is a future? |
A future is an agreement between the Fund and a counterparty made through a U.S. or foreign futures exchange to buy or sell an underlying instrument or asset at a specific price on a future date.
|
What is duration? |
Duration is a measure of a bond’s price sensitivity to interest-rate changes. In general, a portfolio of securities with a lower duration can be expected to be less sensitive to interest-rate changes than a portfolio with a higher duration.
|
Manager’s Discussion
The period under review was characterized by significant shifts in sentiment and fundamentals that ultimately led to meaningful declines across risk assets. Slowing growth and rising recessionary fears in many economies at the start of the period gradually gave way to signs of improving growth as trade tensions eased, particularly between the U.S. and China. Equities rose to start 2020 buoyed by the prospects for a resumption of revenue and earnings growth before
ultimately succumbing to the devastating human and economic effects of the COVID-19 global pandemic.
Dividend Distributions*
11/1/19–4/30/20
| Dividend per Share (cents) | ||||||||||||||||||||
| Month | Class A | Class C | Class R | Class R6 | Advisor Class | |||||||||||||||
November | 3.58 | 2.87 | 3.34 | 3.90 | 3.82 | |||||||||||||||
December | 3.58 | 2.87 | 3.34 | 3.90 | 3.82 | |||||||||||||||
January | 3.93 | 3.11 | 3.68 | 4.29 | 4.21 | |||||||||||||||
February | 3.93 | 3.11 | 3.68 | 4.29 | 4.21 | |||||||||||||||
March | 3.93 | 3.11 | 3.68 | 4.29 | 4.21 | |||||||||||||||
April | 3.93 | 3.11 | 3.68 | 4.29 | 4.21 | |||||||||||||||
Total | 22.88 | 18.18 | 21.40 | 24.96 | 24.48 | |||||||||||||||
*The distribution amount is the sum of all estimated tax-basis net investment income distributions for the period shown. A portion or all of the distribution may be reclassified as return of capital or short-term or long-term capital gains once final tax designations are known. All Fund distributions will vary depending upon current market conditions, and past distributions are not indicative of future trends.
At period-end, the global economy remained largely sidelined due to broad shelter-in-place restrictions designed to curtail the spread of COVID-19 with varying degrees of re-opening timelines beginning to come into focus. U.S. gross domestic product (GDP) declined 5.0% in 2020’s first quarter and a bleak outlook developed for 2020’s second quarter with declines of as much as 25% expected for U.S. GDP.
Weakening demand for energy due to the sharp contraction in economic activity as a result of the global pandemic was compounded by a market share battle as negotiations broke down between major Organization of the Petroleum Exporting Countries (OPEC) and other oil producers, including Saudi Arabia and Russia. Oil prices collapsed as a result, falling over 60% during the period. As markets struggled with record volatility, assets perceived by investors to have lower risk, U.S. Treasuries particularly, rallied as investors sought havens from the turmoil dominating global markets. The yield on 10-year U.S. Treasuries declined during the period from 1.69% to 0.64%.
The Fund posted a negative total return as the global pandemic triggered the fastest bear market on record from a previous all-time record high, despite a fairly sharp recovery over the final five weeks of the period after the dramatic market selloff that began on February 20, 2020. Dividend stocks underperformed and the equity component of the Fund’s blended benchmark declined as the MSCI USA High Dividend Yield Index returned -9.16% for the six-month period. Corporate credit struggled initially in the market selloff given the rapidly deteriorating company fundamentals,
16 | Semiannual Report | franklintempleton.com | ||
FRANKLIN MANAGED INCOME FUND
but unprecedented policy intervention, both monetary and fiscal, helped loosen the flow of credit across the market as we moved toward period-end. Buoyed by the rally in U.S. Treasuries, the benchmark Bloomberg Barclays U.S. Aggregate Bond Index returned +4.86%, while the ICE BofAML U.S. Corporate & High Yield Index returned +0.21%.
The Fund entered the period with a fairly balanced weighting across fixed income and equity securities, while also holding a healthy balance of 8.9% in cash equivalents, which muted losses experienced in the broader equity markets. The portfolio underwent a shift in asset allocation over the period under review in our effort to uncover opportunities presented by the market dislocation, ending with an equity weighting of 60.5%, a fixed income weighting of 38.7% and 0.8% in cash.
During the period, the Fund’s fixed income weighting declined from 43.6% to 38.7%, as outperformance relative to equities was offset by shifts in asset allocation as we reduced holdings of U.S. Treasuries and agency mortgage-backed securities (MBS) to take advantage of lower equity prices and more attractive valuations during a period of peak dislocation in the equity markets. Accommodative monetary policy intervention in the market for U.S. Treasuries, agency MBS and corporate credit led to a substantial decline in yields toward period-end, which resulted in additional reductions to fixed income with sales in the investment-grade corporate side of the portfolio.
Given active reallocation as opportunities presented themselves, U.S. Treasuries began the period at 8.0% of net assets and ended the period at 4.5%, Agency MBS began the period at 1.1% and ended the period at 3.8%, corporate investment-grade securities began the period at 26.5% and ended the period at 22.5%, and high-yield corporate securities began the period at 7.6% and ended the period at 7.9%.
Fixed income sector dispersion was broad-based during the reporting period with the largest gains from health care, U.S. Treasuries and consumer staples followed by modest gains from communication services, information technology (IT) and agency MBS. Positive performance from defensive positions in U.S. Treasury as well as agency MBS served as a ballast to the portfolio during the market dislocations during the period. Health care positions in Bristol-Myers Squibb and CVS Health also paced gains during the period as did communication services holdings in T-Mobile as it successfully completed its merger with Sprint.
Weakness in fixed income was felt acutely in the energy sector due to the double hit from extreme demand destruction as a result of the global pandemic and rising
Top Five Equity Holdings
4/30/20
Company Sector/Industry | % of Total Net Assets | |||
Intel Corp. Information Technology | 2.4% | |||
Amazon.com Inc. Consumer Discretionary | 2.1% | |||
Apple Inc. Information Technology | 2.0% | |||
Dominion Energy Inc. Utilities | 1.8% | |||
Broadcom Inc. Information Technology | 1.8% | |||
supplies due to the market share war following the breakdown in cooperation among OPEC and other oil producers during the period. Chesapeake Energy (not held at period-end), The Williams Co. (not held at period-end) and Calumet Specialty Products were key detractors.
Other meaningful detractors from absolute returns among fixed income sectors included financials and consumer discretionary. Financials came under pressure as interest rates collapsed and fears of rising credit losses negatively impacted the sector. The Fund experienced modest losses in fixed income holdings of Prudential Financial, Capital One Financial and Truist Financial. Consumer discretionary holdings struggled as business across the country succumbed to COVID-19 containment measures, causing many businesses to shut completely and urging consumers to stay home to stop the spread. As a result, holdings in casino operators Las Vegas Sands and Wynn Resorts suffered modest losses as did auto manufacturer Ford Motor, which ceased auto production as sales dried up and the shutdown gripped the U.S. economy.
Equity holdings began the period at approximately 47.5% of the portfolio and ended the period at 60.5%. As an asset class, our equity holdings underperformed during the period. We used the weakness and volatility during March to shift assets out of areas that outperformed, including U.S. Treasuries, agency MBS and investment-grade corporate bonds, while adding to common stocks, convertible securities and equity-linked notes. Common equity positioning increased from 32.6% to 36.5% of the portfolio over the course of the period under review, while equity-linked notes increased from 11.7% to 14.1% and preferred instruments increased from 1.8% to 6.4%.
In terms of equity sector performance during the period, the IT, health care and consumer discretionary sectors were
franklintempleton.com | Semiannual Report | 17 | ||||
FRANKLIN MANAGED INCOME FUND
positive contributors. A number of positive individual contributors made substantial gains resulting from the market bottoming at the end of March. Medical diagnostics company Quest Diagnostics was a major individual contributor to performance during the period along with IT company Intel. Our consumer discretionary position in Amazon.com was also a key performer given the increased demand for goods and services in an economy where consumers were largely idled toward period-end.
Financials sector holdings struggled with rapidly falling interest rates and fears of elevated credit losses as recessionary conditions took hold due to the global pandemic. Holdings of Wells Fargo, JPMorgan Chase, Bank of America and Toronto-Dominion Bank (not held at period-end) all negatively impacted results. Additionally, losses in energy companies also weighed on performance during the period with minimal differentiation related to long-term viability. Losses were extreme among both oil and gas producers and oilfield services companies, with sharp declines experienced by Schlumberger, Royal Dutch Shell, Exxon Mobil and Chevron. The speed of the contraction in economic activity also led to losses in industrial players Boeing (not held at period-end), Raytheon Technologies, General Dynamics and Honeywell.
The Fund used equity call and put options during the period largely to sell covered calls and sell puts aligned with our price targets for selling and reducing positions on the upside (covered calls) or initiating and adding to positions at lower levels (put selling). The Fund also used equity index put spreads during the period, which generated losses by period-end.
Top Five Fixed Income Holdings
4/30/20
Company Sector/Industry | % of Total Net Assets | |||
U.S. Treasury Note Financials | 4.5% | |||
GNMA II SF 30 Year Financials | 2.4% | |||
CHS/Community Health Systems Inc. Health Care | 1.6% | |||
FNMA 30 Year Financials | 1.3% | |||
CVS Health Corp. Health Care | 1.0% | |||
Thank you for your continued participation in Franklin Managed Income Fund. We look forward to serving your future investment needs.
 |
Edward Perks, CFA Co-Lead Portfolio Manager |

 |
Brendan Circle, CFA Co-Lead Portfolio Manager |

Todd Brighton, CFA Portfolio Manager |
18 | Semiannual Report | franklintempleton.com | ||
FRANKLIN MANAGED INCOME FUND
The foregoing information reflects our analysis, opinions and portfolio holdings as of April 30, 2020, the end of the reporting period. The way we implement our main investment strategies and the resulting portfolio holdings may change depending on factors such as market and economic conditions. These opinions may not be relied upon as investment advice or an offer for a particular security. The information is not a complete analysis of every aspect of any market, country, industry, security or the Fund. Statements of fact are from sources considered reliable, but the investment manager makes no representation or warranty as to their completeness or accuracy. Although historical performance is no guarantee of future results, these insights may help you understand our investment management philosophy.
franklintempleton.com | Semiannual Report | 19 | ||||
FRANKLIN MANAGED INCOME FUND
Performance Summary as of April 30, 2020
The performance tables do not reflect any taxes that a shareholder would pay on Fund dividends, capital gain distributions, if any, or any realized gains on the sale of Fund shares. Total return reflects reinvestment of the Fund’s dividends and capital gain distributions, if any, and any unrealized gains or losses. Your dividend income will vary depending on dividends or interest paid by securities in the Fund’s portfolio, adjusted for operating expenses of each class. Capital gain distributions are net profits realized from the sale of portfolio securities.
Performance as of 4/30/201
Cumulative total return excludes sales charges. Average annual total return includes maximum sales charges. Sales charges will vary depending on the size of the investment and the class of share purchased. The maximum is 5.50% and the minimum is 0%. Class A: 5.50% maximum initial sales charge; Advisor Class: no sales charges. For other share classes, visit franklintempleton.com.
| Share Class | Cumulative Total Return2 | Average Annual Total Return3 | ||
A4 6-Month | -5.15% | -10.34% | ||
| 1-Year | -0.80% | -6.22% | ||
| 5-Year | +22.96% | +3.05% | ||
| 10-Year | +92.90% | +6.18% | ||
Advisor 6-Month | -5.09% | -5.09% | ||
| 1-Year | -0.55% | -0.55% | ||
| 5-Year | +24.54% | +4.49% | ||
| 10-Year | +98.42% | +7.09% | ||
| Distribution | 30-Day Standardized Yield6 | |||||||
| Share Class | Rate5 | (with fee waiver) | (without fee waiver) | |||||
A | 3.88% | 2.38% | 2.36% | |||||
Advisor | 4.39% | 2.76% | 2.75% | |||||
Performance data represent past performance, which does not guarantee future results. Investment return and principal value will fluctuate, and you may have a gain or loss when you sell your shares. Current performance may differ from figures shown. For most recent month-end performance, go to franklintempleton.com or call (800) 342-5236.
See page 22 for Performance Summary footnotes.
20 | Semiannual Report | franklintempleton.com | ||
FRANKLIN MANAGED INCOME FUND
PERFORMANCE SUMMARY
Net Asset Value
| Share Class (Symbol) | 4/30/20 | 10/31/19 | Change | |||||||||||||||||||||||||
A (FBLAX)
|
| $11.47
|
|
| $12.80
|
|
| -$1.33
|
| |||||||||||||||||||
C (FBMCX)
|
| $11.35
|
|
| $12.67
|
|
| -$1.32
|
| |||||||||||||||||||
R (FBFQX)
|
| $11.50
|
|
| $12.84
|
|
| -$1.34
|
| |||||||||||||||||||
R6 (FBFRX)
|
| $11.51
|
|
| $12.85
|
|
| -$1.34
|
| |||||||||||||||||||
Advisor (FBFZX)
|
| $11.50
|
|
| $12.84
|
|
| -$1.34
|
| |||||||||||||||||||
| Distributions (11/1/19–4/30/20) |
| |||||||||||||||||||||||||||
| Net Investment | Short-Term | Long-Term | ||||||||||||||||||||||||||
| Share Class | Income | Capital Gain | Capital Gain | Total | ||||||||||||||||||||||||
A
|
| $0.2288
|
|
| $0.0943
|
|
| $0.3878
|
|
| $0.7109
|
| ||||||||||||||||
C
|
| $0.1818
|
|
| $0.0943
|
|
| $0.3878
|
|
| $0.6639
|
| ||||||||||||||||
R
|
| $0.2140
|
|
| $0.0943
|
|
| $0.3878
|
|
| $0.6961
|
| ||||||||||||||||
R6
|
| $0.2496
|
|
| $0.0943
|
|
| $0.3878
|
|
| $0.7317
|
| ||||||||||||||||
Advisor
|
| $0.2448
|
|
| $0.0943
|
|
| $0.3878
|
|
| $0.7269
|
| ||||||||||||||||
| Total Annual Operating Expenses7 |
| |||||||||||||||||||||||||||
| With Fee | Without Fee | |||||||||||||||||||||||||||
| Share Class | Waiver | Waiver | ||||||||||||||||||||||||||
A
|
| 0.93%
|
|
| 0.97%
|
| ||||||||||||||||||||||
Advisor
|
| 0.68%
|
|
| 0.72%
|
| ||||||||||||||||||||||
See page 22 for Performance Summary footnotes.
franklintempleton.com | Semiannual Report | 21 | ||||
FRANKLIN MANAGED INCOME FUND
PERFORMANCE SUMMARY
Each class of shares is available to certain eligible investors and has different annual fees and expenses, as described in the prospectus.
All investments involve risks, including possible loss of principal. The Fund’s share price and yield will be affected by interest rate movements. Bond prices generally move in the opposite direction of interest rates. As the prices of bonds in the Fund adjust to a rise in interest rates, the Fund’s share price may decline. Stock prices fluctuate, sometimes rapidly and dramatically, due to factors affecting individual companies, particular industries or sectors, or general market conditions. Unexpected events and their aftermaths, such as the spread of deadly diseases; natural, environmental or man-made disasters; financial, political or social disruptions; terrorism and war; and other tragedies or catastrophes, can cause investor fear and panic, which can adversely affect the economies of many companies, sectors, nations, regions and the market in general, in ways that cannot necessarily be foreseen. The Fund’s prospectus also includes a description of the main investment risks.
The Fund is not guaranteed to achieve its investment goal of making monthly distributions, while maintaining prospects for capital appreciation nor is there any guarantee that the Fund will provide sufficient income at or through the investor’s retirement. In addition, some of its distributions may be treated in part as a return of capital, which will decrease shareholders’ cost basis in the Fund and affect the amount of any capital gain or loss that they realize when selling or exchanging fund shares. The annual payout rate may be adjusted higher or lower from year to year and could vary substantially over time. It is possible for the Fund to suffer substantial investment losses and simultaneously experience additional asset reductions as a result of its distributions to shareholders under the managed distribution policy. Investors who hold the Fund within a tax-advantaged retirement account should consult their tax advisors to discuss tax consequences of receiving cash distributions. In addition, use of the Fund or election of the option to receive distribution payments in cash may be restricted in certain retirement plans by the terms of the governing plan documents and/or the discretion of the plan administrator. Investors are strongly advised to consult with their financial advisor for assistance before selecting the appropriate fund, based on their goals and personal situations, including time horizon, retirement income needs, risk tolerance and tax bracket.
1. The Fund has an expense reduction and a fee waiver associated with any investments it makes in a Franklin Templeton money fund and/or other Franklin Templeton fund, contractually guaranteed through 2/28/21. Fund investment results reflect the expense reduction and fee waiver; without these reductions, the results would have been lower.
2. Cumulative total return represents the change in value of an investment over the periods indicated.
3. Average annual total return represents the average annual change in value of an investment over the periods indicated. Return for less than one year, if any, has not been annualized.
4. Prior to 9/10/18, these shares were offered at a higher initial sales charge of 5.75%, thus actual returns (with sales charges) would have differed. Average annual total returns (with sales charges) have been restated to reflect the current maximum initial sales charge of 5.50%.
5. Distribution rate is based on an annualization of the respective class’s April dividend and the maximum offering price (NAV for Advisor Class) per share on 4/30/20.
6. The Fund’s 30-day standardized yield is calculated over a trailing 30-day period using the yield to maturity on bonds and/or the dividends accrued on stocks. It may not equal the Fund’s actual income distribution rate, which reflects the Fund’s past dividends paid to shareholders.
7. Figures are as stated in the Fund’s current prospectus and may differ from the expense ratios disclosed in the Your Fund’s Expenses and Financial Highlights sections in this report. In periods of market volatility, assets may decline significantly, causing total annual Fund operating expenses to become higher than the figures shown.
22 |
Semiannual Report |
franklintempleton.com | ||
FRANKLIN MANAGED INCOME FUND
Your Fund’s Expenses
As a Fund shareholder, you can incur two types of costs: (1) transaction costs, including sales charges (loads) on Fund purchases and redemptions; and (2) ongoing Fund costs, including management fees, distribution and service (12b-1) fees, and other Fund expenses. All mutual funds have ongoing costs, sometimes referred to as operating expenses. The table below shows ongoing costs of investing in the Fund and can help you understand these costs and compare them with those of other mutual funds. The table assumes a $1,000 investment held for the six months indicated.
Actual Fund Expenses
The table below provides information about actual account values and actual expenses in the columns under the heading “Actual.” In these columns the Fund’s actual return, which includes the effect of Fund expenses, is used to calculate the “Ending Account Value” for each class of shares. You can estimate the expenses you paid during the period by following these steps (of course, your account value and expenses will differ from those in this illustration): Divide your account value by $1,000 (if your account had an $8,600 value, then $8,600 ÷ $1,000 = 8.6). Then multiply the result by the number in the row for your class of shares under the headings “Actual” and “Expenses Paid During Period” (if Actual Expenses Paid During Period were $7.50, then 8.6 x $7.50 = $64.50). In this illustration, the actual expenses paid this period are $64.50.
Hypothetical Example for Comparison with Other Funds
Under the heading “Hypothetical” in the table, information is provided about hypothetical account values and hypothetical expenses based on the Fund’s actual expense ratio and an assumed rate of return of 5% per year before expenses, which is not the Fund’s actual return. This information may not be used to estimate the actual ending account balance or expenses you paid for the period, but it can help you compare ongoing costs of investing in the Fund with those of other funds. To do so, compare this 5% hypothetical example for the class of shares you hold with the 5% hypothetical examples that appear in the shareholder reports of other funds.
Please note that expenses shown in the table are meant to highlight ongoing costs and do not reflect any transactional costs. Therefore, information under the heading “Hypothetical” is useful in comparing ongoing costs only, and will not help you compare total costs of owning different funds. In addition, if transactional costs were included, your total costs would have been higher.
Actual (actual return after expenses) | Hypothetical (5% annual return before expenses) | |||||||||||||||||||||
| Share Class | Beginning Account Value 11/1/19 | Ending Account Value 4/30/20 | Expenses Paid During Period 11/1/19–4/30/201, 2 | Ending Account Value 4/30/20 | Expenses Paid During Period 11/1/19–4/30/201, 2 | Net Annualized Expense Ratio2 | ||||||||||||||||
A | $1,000 | $948.50 | $4.36 | $1,020.39 | $4.52 | 0.90% | ||||||||||||||||
C | $1,000 | $945.00 | $7.98 | $1,016.66 | $8.27 | 1.65% | ||||||||||||||||
R | $1,000 | $946.70 | $5.57 | $1,019.14 | $5.77 | 1.15% | ||||||||||||||||
R6 | $1,000 | $949.50 | $2.81 | $1,021.98 | $2.92 | 0.58% | ||||||||||||||||
Advisor | $1,000 | $949.10 | $3.15 | $1,021.63 | $3.27 | 0.65% | ||||||||||||||||
1. Expenses are equal to the annualized expense ratio for the six-month period as indicated above—in the far right column—multiplied by the simple average account value over the period indicated, and then multiplied by 182/366 to reflect the one-half year period.
2. Reflects expenses after fee waivers and expense reimbursements. Does not include acquired fund fees and expenses.
franklintempleton.com | Semiannual Report | 23 | ||||
FRANKLIN INVESTORS SECURITIES TRUST
Franklin Convertible Securities Fund
| Six Months Ended April 30, 2020 | Year Ended October 31, | |||||||||||||||||||||||
| (unaudited) | 2019 | 2018 | 2017 | 2016 | 2015 | |||||||||||||||||||
| Class A | ||||||||||||||||||||||||
| Per share operating performance (for a share outstanding throughout the period) | ||||||||||||||||||||||||
Net asset value, beginning of period | $22.13 | $20.65 | $20.68 | $18.24 | $18.00 | $18.97 | ||||||||||||||||||
|
| |||||||||||||||||||||||
Income from investment operationsa: | ||||||||||||||||||||||||
Net investment incomeb | 0.12 | 0.21 | 0.16 | 0.27 | 0.25 | 0.24 | ||||||||||||||||||
Net realized and unrealized gains (losses) | 0.59 | 2.47 | 1.35 | 2.98 | 0.85 | (0.14 | ) | |||||||||||||||||
|
| |||||||||||||||||||||||
Total from investment operations | 0.71 | 2.68 | 1.51 | 3.25 | 1.10 | 0.10 | ||||||||||||||||||
|
| |||||||||||||||||||||||
Less distributions from: | ||||||||||||||||||||||||
Net investment income | (0.18 | ) | (0.45 | ) | (0.49 | ) | (0.47 | ) | (0.50 | ) | (0.39 | ) | ||||||||||||
Net realized gains | (1.61 | ) | (0.75 | ) | (1.05 | ) | (0.34 | ) | (0.36 | ) | (0.68 | ) | ||||||||||||
|
| |||||||||||||||||||||||
Total distributions | (1.79 | ) | (1.20 | ) | (1.54 | ) | (0.81 | ) | (0.86 | ) | (1.07 | ) | ||||||||||||
|
| |||||||||||||||||||||||
Net asset value, end of period | $21.05 | $22.13 | $20.65 | $20.68 | $18.24 | $18.00 | ||||||||||||||||||
|
| |||||||||||||||||||||||
Total returnc | 3.15% | 13.84% | 7.65% | 18.39% | 6.41% | 0.66% | ||||||||||||||||||
| Ratios to average net assetsd | ||||||||||||||||||||||||
Expenses before waiver and payments by affiliates | 0.84% | 0.85% | 0.86% | 0.85% | 0.86% | 0.86% | ||||||||||||||||||
Expenses net of waiver and payments by affiliatese | 0.84% | f | 0.83% | 0.84% | 0.84% | 0.85% | 0.86%f | |||||||||||||||||
Net investment income | 1.11% | 0.97% | 0.76% | 1.39% | 1.44% | 1.33% | ||||||||||||||||||
| Supplemental data | ||||||||||||||||||||||||
Net assets, end of period (000’s) | $1,087,248 | $1,169,928 | $1,153,875 | $815,491 | $768,553 | $818,082 | ||||||||||||||||||
Portfolio turnover rate | 6.59% | 26.83% | 35.90% | 27.24% | 28.03% | 17.30% | ||||||||||||||||||
aThe amount shown for a share outstanding throughout the period may not correlate with the Statement of Operations for the period due to the timing of sales and repurchases of the Fund’s shares in relation to income earned and/or fluctuating fair value of the investments of the Fund.
bBased on average daily shares outstanding.
cTotal return does not reflect sales commissions or contingent deferred sales charges, if applicable, and is not annualized for periods less than one year.
dRatios are annualized for periods less than one year.
eBenefit of expense reduction rounds to less than 0.01%.
fBenefit of waiver and payments by affiliates rounds to less than 0.01%.
24 | Semiannual Report | The accompanying notes are an integral part of these financial statements. | franklintempleton.com | ||
FRANKLIN INVESTORS SECURITIES TRUST
FINANCIAL HIGHLIGHTS
Franklin Convertible Securities Fund (continued)
| Six Months Ended April 30, 2020 | Year Ended October 31, | |||||||||||||||||||||||
|
| |||||||||||||||||||||||
| (unaudited) | 2019 | 2018 | 2017 | 2016 | 2015 | |||||||||||||||||||
| ||||||||||||||||||||||||
| Class C | ||||||||||||||||||||||||
| Per share operating performance (for a share outstanding throughout the period) | ||||||||||||||||||||||||
Net asset value, beginning of period | $21.77 | $20.31 | $20.37 | $17.98 | $17.75 | $ | 18.73 | |||||||||||||||||
|
| |||||||||||||||||||||||
Income from investment operationsa: | ||||||||||||||||||||||||
Net investment incomeb | 0.04 | 0.04 | (— | )c | 0.12 | 0.12 | 0.11 | |||||||||||||||||
Net realized and unrealized gains (losses) | 0.58 | 2.45 | 1.33 | 2.93 | 0.84 | (0.16 | ) | |||||||||||||||||
|
| |||||||||||||||||||||||
Total from investment operations | 0.62 | 2.49 | 1.33 | 3.05 | 0.96 | (0.05 | ) | |||||||||||||||||
|
| |||||||||||||||||||||||
Less distributions from: | ||||||||||||||||||||||||
Net investment income | (0.08 | ) | (0.28 | ) | (0.34 | ) | (0.32 | ) | (0.37 | ) | (0.25 | ) | ||||||||||||
Net realized gains | (1.61 | ) | (0.75 | ) | (1.05 | ) | (0.34 | ) | (0.36 | ) | (0.68 | ) | ||||||||||||
|
| |||||||||||||||||||||||
Total distributions | (1.69 | ) | (1.03 | ) | (1.39 | ) | (0.66 | ) | (0.73 | ) | (0.93 | ) | ||||||||||||
|
| |||||||||||||||||||||||
Net asset value, end of period | $20.70 | $21.77 | $20.31 | $20.37 | $17.98 | $ | 17.75 | |||||||||||||||||
|
| |||||||||||||||||||||||
Total returnd | 2.79% | 13.03% | 6.84% | 17.49% | 5.65% | (0.15)% | ||||||||||||||||||
| Ratios to average net assetse | ||||||||||||||||||||||||
Expenses before waiver and payments by affiliates | 1.59% | 1.60% | 1.61% | 1.60% | 1.61% | 1.61% | ||||||||||||||||||
Expenses net of waiver and payments by affiliatesf | 1.59% | g | 1.58% | 1.59% | 1.59% | 1.60% | 1.61% | g | ||||||||||||||||
Net investment income | 0.36% | 0.22% | 0.01% | 0.64% | 0.69% | 0.58% | ||||||||||||||||||
| Supplemental data | ||||||||||||||||||||||||
Net assets, end of period (000’s) | $225,600 | $256,075 | $299,716 | $303,243 | $293,038 | $311,951 | ||||||||||||||||||
Portfolio turnover rate | 6.59% | 26.83% | 35.90% | 27.24% | 28.03% | 17.30% | ||||||||||||||||||
aThe amount shown for a share outstanding throughout the period may not correlate with the Statement of Operations for the period due to the timing of sales and repurchases of the Fund’s shares in relation to income earned and/or fluctuating fair value of the investments of the Fund.
bBased on average daily shares outstanding.
cAmount rounds to less than $0.01 per share.
dTotal return does not reflect sales commissions or contingent deferred sales charges, if applicable, and is not annualized for periods less than one year.
eRatios are annualized for periods less than one year.
fBenefit of expense reduction rounds to less than 0.01%.
gBenefit of waiver and payments by affiliates rounds to less than 0.01%.
franklintempleton.com | The accompanying notes are an integral part of these financial statements. | Semiannual Report | 25 | ||||
FRANKLIN INVESTORS SECURITIES TRUST
FINANCIAL HIGHLIGHTS
Franklin Convertible Securities Fund (continued)
| Six Months Ended April 30, 2020 | Year Ended October 31, | |||||||||||||||||||||||
| (unaudited) | 2019 | 2018 | 2017 | 2016 | 2015 | |||||||||||||||||||
| Class R6 | ||||||||||||||||||||||||
| Per share operating performance (for a share outstanding throughout the period) | ||||||||||||||||||||||||
Net asset value, beginning of period | $ | 22.28 | $ | 20.78 | $ | 20.79 | $ | 18.33 | $ | 18.09 | $ | 18.99 | ||||||||||||
|
| |||||||||||||||||||||||
| Income from investment operationsa: | ||||||||||||||||||||||||
Net investment incomeb | 0.16 | 0.28 | 0.24 | 0.34 | 0.33 | 0.30 | ||||||||||||||||||
Net realized and unrealized gains (losses) | 0.58 | 2.50 | 1.36 | 3.00 | 0.84 | (0.14 | ) | |||||||||||||||||
|
| |||||||||||||||||||||||
Total from investment operations | 0.74 | 2.78 | 1.60 | 3.34 | 1.17 | 0.16 | ||||||||||||||||||
|
| |||||||||||||||||||||||
Less distributions from: | ||||||||||||||||||||||||
Net investment income | (0.22 | ) | (0.53 | ) | (0.56 | ) | (0.54 | ) | (0.57 | ) | (0.38 | ) | ||||||||||||
Net realized gains | (1.61 | ) | (0.75 | ) | (1.05 | ) | (0.34 | ) | (0.36 | ) | (0.68 | ) | ||||||||||||
|
| |||||||||||||||||||||||
Total distributions | (1.83 | ) | (1.28 | ) | (1.61 | ) | (0.88 | ) | (0.93 | ) | (1.06 | ) | ||||||||||||
|
| |||||||||||||||||||||||
Net asset value, end of period | $ | 21.19 | $ | 22.28 | $ | 20.78 | $ | 20.79 | $ | 18.33 | $ | 18.09 | ||||||||||||
|
| |||||||||||||||||||||||
Total returnc | 3.31% | 14.26% | 8.07% | 18.84% | 6.78% | 0.99% | ||||||||||||||||||
| Ratios to average net assetsd | ||||||||||||||||||||||||
Expenses before waiver and payments by affiliates | 0.50% | 0.54% | 0.55% | 0.49% | 0.50% | 0.50% | ||||||||||||||||||
Expenses net of waiver and payments by affiliatese | 0.50% | f | 0.49% | 0.49% | 0.48% | 0.49% | 0.50% | f | ||||||||||||||||
Net investment income | 1.45% | 1.31% | 1.11% | 1.75% | 1.80% | 1.69% | ||||||||||||||||||
| Supplemental data | ||||||||||||||||||||||||
Net assets, end of period (000’s) | $82,895 | $51,791 | $57,824 | $22,950 | $7,154 | $5 | ||||||||||||||||||
Portfolio turnover rate | 6.59% | 26.83% | 35.90% | 27.24% | 28.03% | 17.30% | ||||||||||||||||||
aThe amount shown for a share outstanding throughout the period may not correlate with the Statement of Operations for the period due to the timing of sales and repurchases of the Fund’s shares in relation to income earned and/or fluctuating fair value of the investments of the Fund.
bBased on average daily shares outstanding.
cTotal return is not annualized for periods less than one year.
dRatios are annualized for periods less than one year.
eBenefit of expense reduction rounds to less than 0.01%.
fBenefit of waiver and payments by affiliates rounds to less than 0.01%.
26 | Semiannual Report | The accompanying notes are an integral part of these financial statements. | franklintempleton.com | ||
FRANKLIN INVESTORS SECURITIES TRUST
FINANCIAL HIGHLIGHTS
Franklin Convertible Securities Fund (continued)
| Six Months Ended April 30, 2020 | Year Ended October 31, | |||||||||||||||||||||||
| (unaudited) | 2019 | 2018 | 2017 | 2016 | 2015 | |||||||||||||||||||
| Advisor Class | ||||||||||||||||||||||||
| Per share operating performance (for a share outstanding throughout the period) | ||||||||||||||||||||||||
Net asset value, beginning of period | $22.14 | $20.65 | $20.68 | $18.24 | $18.00 | $18.98 | ||||||||||||||||||
|
| |||||||||||||||||||||||
| Income from investment operationsa: | ||||||||||||||||||||||||
Net investment incomeb | 0.15 | 0.26 | 0.21 | 0.32 | 0.30 | 0.29 | ||||||||||||||||||
Net realized and unrealized gains (losses) | 0.58 | 2.49 | 1.35 | 2.98 | 0.85 | (0.15 | ) | |||||||||||||||||
|
| |||||||||||||||||||||||
Total from investment operations | 0.73 | 2.75 | 1.56 | 3.30 | 1.15 | 0.14 | ||||||||||||||||||
|
| |||||||||||||||||||||||
| Less distributions from: | ||||||||||||||||||||||||
Net investment income | (0.21 | ) | (0.51 | ) | (0.54 | ) | (0.52 | ) | (0.55 | ) | (0.44 | ) | ||||||||||||
Net realized gains | (1.61 | ) | (0.75 | ) | (1.05 | ) | (0.34 | ) | (0.36 | ) | (0.68 | ) | ||||||||||||
|
| |||||||||||||||||||||||
Total distributions | (1.82 | ) | (1.26 | ) | (1.59 | ) | (0.86 | ) | (0.91 | ) | (1.12 | ) | ||||||||||||
|
| |||||||||||||||||||||||
Net asset value, end of period | $21.05 | $22.14 | $20.65 | $20.68 | $18.24 | $18.00 | ||||||||||||||||||
|
| |||||||||||||||||||||||
Total returnc | 3.27% | 14.18% | 7.91% | 18.69% | 6.68% | 0.87% | ||||||||||||||||||
| Ratios to average net assetsd | ||||||||||||||||||||||||
Expenses before waiver and payments by affiliates | 0.59% | 0.60% | 0.61% | 0.60% | 0.61% | 0.61% | ||||||||||||||||||
Expenses net of waiver and payments by affiliatese | 0.59% | f | 0.58% | 0.59% | 0.59% | 0.60% | 0.61% | f | ||||||||||||||||
Net investment income | 1.36% | 1.22% | 1.01% | 1.64% | 1.69% | 1.58% | ||||||||||||||||||
| Supplemental data | ||||||||||||||||||||||||
Net assets, end of period (000’s) | $2,091,827 | $2,379,435 | $2,189,462 | $1,542,254 | $1,080,346 | $899,441 | ||||||||||||||||||
Portfolio turnover rate | 6.59% | 26.83% | 35.90% | 27.24% | 28.03% | 17.30% | ||||||||||||||||||
aThe amount shown for a share outstanding throughout the period may not correlate with the Statement of Operations for the period due to the timing of sales and repurchases of the Fund’s shares in relation to income earned and/or fluctuating fair value of the investments of the Fund.
bBased on average daily shares outstanding.
cTotal return is not annualized for periods less than one year.
dRatios are annualized for periods less than one year.
eBenefit of expense reduction rounds to less than 0.01%.
fBenefit of waiver and payments by affiliates rounds to less than 0.01%.
franklintempleton.com | The accompanying notes are an integral part of these financial statements. | Semiannual Report | 27 | ||||
FRANKLIN INVESTORS SECURITIES TRUST
Statement of Investments, April 30, 2020 (unaudited)
Franklin Convertible Securities Fund
| Country | Shares | Value | ||||||||||||
Convertible Preferred Stocks 19.1% | ||||||||||||||
Consumer Staples 1.7% | ||||||||||||||
Bunge Ltd., 4.875%, cvt. pfd. | United States | 630,000 | $ | 58,942,800 | ||||||||||
|
| |||||||||||||
| Health Care 4.2% | ||||||||||||||
Avantor Inc., 6.25%, cvt. pfd., A | United States | 820,000 | 47,215,600 | |||||||||||
Becton Dickinson and Co., 6.125%, cvt. pfd., A | United States | 389,600 | 23,079,904 | |||||||||||
Change Healthcare Inc., 6.00%, cvt. pfd. | United States | 300,000 | 13,878,000 | |||||||||||
Danaher Corp., 4.75%, cvt. pfd., A | United States | 54,000 | 64,212,480 | |||||||||||
|
| |||||||||||||
| 148,385,984 | ||||||||||||||
|
| |||||||||||||
| Industrials 2.2% | ||||||||||||||
Fortive Corp., 5.00%, cvt. pfd., A | United States | 34,350 | 28,502,943 | |||||||||||
Stanley Black & Decker Inc., 5.375%, cvt. pfd. | United States | 592,000 | 47,389,600 | |||||||||||
|
| |||||||||||||
| 75,892,543 | ||||||||||||||
|
| |||||||||||||
| Information Technology 2.1% | ||||||||||||||
Broadcom Inc., 8.00%, cvt. pfd., A | United States | 71,100 | 72,339,984 | |||||||||||
|
| |||||||||||||
| Materials 1.6% | ||||||||||||||
International Flavors & Fragrances Inc., 6.00%, cvt. pfd. | United States | 1,192,242 | 56,691,107 | |||||||||||
|
| |||||||||||||
| Utilities 7.3% | ||||||||||||||
American Electric Power Co. Inc., 6.125%, cvt. pfd. | United States | 440,000 | 22,352,000 | |||||||||||
DTE Energy Co., 6.25%, cvt. pfd. | United States | 800,000 | 33,440,000 | |||||||||||
Essential Utilities Inc., 6.00%, cvt. pfd. | United States | 770,000 | 43,967,000 | |||||||||||
| a | NextEra Energy Inc., 5.279%, cvt. pfd. | United States | 1,100,000 | 47,509,000 | ||||||||||
Sempra Energy, 6.00%, cvt. pfd., A | United States | 417,500 | 42,714,425 | |||||||||||
Sempra Energy, 6.75%, cvt. pfd., B | United States | 206,000 | 20,869,860 | |||||||||||
South Jersey Industries Inc., 7.25%, cvt. pfd. | United States | 360,000 | 16,131,600 | |||||||||||
The Southern Co., 6.75%, cvt. pfd. | United States | 550,000 | 26,037,000 | |||||||||||
|
| |||||||||||||
| 253,020,885 | ||||||||||||||
|
| |||||||||||||
Total Convertible Preferred Stocks (Cost $693,575,591) | 665,273,303 | |||||||||||||
|
| |||||||||||||
Principal Amount* | ||||||||||||||
|
| |||||||||||||
Convertible Bonds 79.0% | ||||||||||||||
| Communication Services 10.2% | ||||||||||||||
iQIYI Inc., | ||||||||||||||
cvt., senior note, 3.75%, 12/01/23 | China | $ | 40,000,000 | 38,100,000 | ||||||||||
cvt., senior note, 2.00%, 4/01/25 | China | 26,000,000 | 22,129,100 | |||||||||||
| b | Liberty Interactive LLC, cvt., senior bond, 144A, 1.75%, 9/30/46 | United States | 37,000,000 | 54,504,552 | ||||||||||
Liberty Media Corp., | ||||||||||||||
cvt., senior bond, 2.25%, 9/30/46 | United States | 37,000,000 | 18,059,700 | |||||||||||
cvt., senior note, 1.375%, 10/15/23 | United States | 21,200,000 | 22,207,341 | |||||||||||
| b | Sea Ltd., cvt., senior note, 144A, 1.00%, 12/01/24 | Taiwan | 33,000,000 | 42,579,139 | ||||||||||
| b | Snap Inc., cvt., senior note, 144A, 0.75%, 8/01/26 | United States | 59,000,000 | 61,256,143 | ||||||||||
Weibo Corp., cvt., senior note, 1.25%, 11/15/22 | China | 63,000,000 | 57,484,902 | |||||||||||
Zillow Group Inc., cvt., senior note, 2.00%, 12/01/21 | United States | 34,500,000 | 38,187,187 | |||||||||||
|
| |||||||||||||
| 354,508,064 | ||||||||||||||
|
| |||||||||||||
28 |
Semiannual Report |
franklintempleton.com | ||
FRANKLIN INVESTORS SECURITIES TRUST
STATEMENT OF INVESTMENTS (UNAUDITED)
Franklin Convertible Securities Fund (continued)
| Country | | Principal Amount | * | Value | ||||||||||
Convertible Bonds (continued) | ||||||||||||||
Consumer Discretionary 12.2% | ||||||||||||||
Booking Holdings Inc., | ||||||||||||||
cvt., senior note, 0.35%, 6/15/20 | United States | $ | 25,000,000 | $ | 28,520,600 | |||||||||
cvt., senior note, 0.90%, 9/15/21 | United States | 32,500,000 | 32,940,655 | |||||||||||
b cvt., senior note, 144A, 0.75%, 5/01/25 | United States | 9,000,000 | 10,199,709 | |||||||||||
| b | Burlington Stores Inc., cvt., senior note, 144A, 2.25%, 4/15/25 | United States | 5,000,000 | 5,323,476 | ||||||||||
Etsy Inc., cvt., senior note, zero cpn., 3/01/23 | United States | 40,000,000 | 74,381,641 | |||||||||||
MercadoLibre Inc., cvt., senior note, 2.00%, 8/15/28 | Argentina | 50,000,000 | 74,047,910 | |||||||||||
| b | Pinduoduo Inc., cvt., senior note, 144A, zero cpn., 10/01/24 | China | 44,000,000 | 55,819,015 | ||||||||||
RH, | ||||||||||||||
b cvt., senior note, 144A, zero cpn., 9/15/24 | United States | 24,000,000 | 21,915,080 | |||||||||||
cvt., senior note, zero cpn., 6/15/23 | United States | 44,500,000 | 43,470,937 | |||||||||||
Wayfair Inc., | ||||||||||||||
cvt., senior note, 0.375%, 9/01/22 | United States | 19,000,000 | 24,557,500 | |||||||||||
cvt., senior note, 1.125%, 11/01/24 | United States | 22,000,000 | 27,101,250 | |||||||||||
b cvt., senior note, 144A, 1.00%, 8/15/26 | United States | 28,000,000 | 28,560,308 | |||||||||||
|
| |||||||||||||
| 426,838,081 | ||||||||||||||
|
| |||||||||||||
| Energy 0.3% | ||||||||||||||
Oil States International Inc., cvt., senior note, 1.50%, 2/15/23 | United States | 28,000,000 | 10,733,457 | |||||||||||
|
| |||||||||||||
| Financials 1.8% | ||||||||||||||
| b | AXA SA, cvt., senior note, 144A, 7.25%, 5/15/21 | France | 71,500,000 | 62,964,688 | ||||||||||
|
| |||||||||||||
| Health Care 15.2% | ||||||||||||||
BioMarin Pharmaceutical Inc., cvt., senior sub. note, 1.50%, 10/15/20 | United States | 28,200,000 | 30,528,249 | |||||||||||
DexCom Inc., cvt., senior note, 0.75%, 12/01/23 | United States | 44,000,000 | 92,792,526 | |||||||||||
Illumina Inc., | ||||||||||||||
cvt., senior note, 0.50%, 6/15/21 | United States | 32,500,000 | 43,724,384 | |||||||||||
cvt., senior note, zero cpn., 8/15/23 | United States | 25,750,000 | 26,569,923 | |||||||||||
| b | Insulet Corp., cvt., senior note, 144A, 0.375%, 9/01/26 | United States | 65,000,000 | 73,246,875 | ||||||||||
Intercept Pharmaceuticals Inc., cvt., senior note, 2.00%, 5/15/26 | United States | 21,000,000 | 21,577,928 | |||||||||||
Jazz Investments I Ltd., | ||||||||||||||
cvt., senior note, 1.875%, 8/15/21 | United States | 35,000,000 | 34,188,895 | |||||||||||
cvt., senior note, 1.50%, 8/15/24 | United States | 39,750,000 | 36,604,409 | |||||||||||
Neurocrine Biosciences Inc., cvt., senior note, 2.25%, 5/15/24 | United States | 44,750,000 | 62,924,854 | |||||||||||
| b | PTC Therapeutics Inc., cvt., senior note, 144A, 1.50%, 9/15/26 | United States | 48,000,000 | 58,076,347 | ||||||||||
| b | Revance Therapeutics Inc., cvt., senior note, 144A, 1.75%, 2/15/27 | United States | 27,000,000 | 22,707,148 | ||||||||||
Sarepta Therapeutics Inc., cvt., senior note, 1.50%, 11/15/24 | United States | 16,000,000 | 28,256,000 | |||||||||||
|
| |||||||||||||
| 531,197,538 | ||||||||||||||
|
| |||||||||||||
| Industrials 1.1% | ||||||||||||||
Fortive Corp., cvt., senior note, 0.875%, 2/15/22 | United States | 40,270,000 | 38,879,801 | |||||||||||
|
| |||||||||||||
| Information Technology 38.2% | ||||||||||||||
| b | Alteryx Inc., | |||||||||||||
cvt., senior note, 144A, 0.50%, 8/01/24 | United States | 8,000,000 | 7,647,784 | |||||||||||
cvt., senior note, 144A, 1.00%, 8/01/26 | United States | 8,000,000 | 7,584,800 | |||||||||||
franklintempleton.com | Semiannual Report | 29 | ||||
FRANKLIN INVESTORS SECURITIES TRUST
STATEMENT OF INVESTMENTS (UNAUDITED)
Franklin Convertible Securities Fund (continued)
| Country | | Principal Amount | * | Value | ||||||||||
Convertible Bonds (continued) | ||||||||||||||
| Information Technology (continued) | ||||||||||||||
Atlassian Inc., cvt., senior note, 0.625%, 5/01/23 | United States | $ | 38,500,000 | $ | 74,830,872 | |||||||||
| b | Blackline Inc., cvt., senior note, 144A, 0.125%, 8/01/24 | United States | 9,500,000 | 10,122,211 | ||||||||||
| b | Coupa Software Inc., cvt., senior note, 144A, 0.125%, 6/15/25 | United States | 21,000,000 | 26,807,424 | ||||||||||
DocuSign Inc., cvt., senior note, 0.50%, 9/15/23 | United States | 50,000,000 | 78,155,000 | |||||||||||
Envestnet Inc., cvt., senior note, 1.75%, 6/01/23 | United States | 51,500,000 | 57,486,875 | |||||||||||
Guidewire Software Inc., cvt., senior note, 1.25%, 3/15/25 | United States | 44,000,000 | 46,227,500 | |||||||||||
HubSpot Inc., cvt., senior note, 0.25%, 6/01/22 | United States | 38,875,000 | 71,444,869 | |||||||||||
Inphi Corp., | ||||||||||||||
cvt., senior note, 0.75%, 9/01/21 | United States | 7,600,000 | 13,333,250 | |||||||||||
b cvt., senior note, 144A, 0.75%, 4/15/25 | United States | 4,000,000 | 4,229,520 | |||||||||||
Microchip Technology Inc., cvt., senior sub. note, 1.625%, 2/15/27 | United States | 62,250,000 | 77,948,205 | |||||||||||
New Relic Inc., cvt., senior note, 0.50%, 5/01/23 | United States | 24,000,000 | 21,734,400 | |||||||||||
| b | Okta Inc., cvt., senior note, 144A, 0.125%, 9/01/25 | United States | 73,000,000 | 77,438,039 | ||||||||||
Palo Alto Networks Inc., cvt., senior note, 0.75%, 7/01/23 | United States | 43,000,000 | 44,161,000 | |||||||||||
Pluralsight Inc., cvt., senior note, 0.375%, 3/01/24 | United States | 39,000,000 | 33,013,500 | |||||||||||
Q2 Holdings Inc., cvt., senior note, 0.75%, 2/15/23 | United States | 32,000,000 | 47,282,675 | |||||||||||
RealPage Inc., cvt., senior note, 1.50%, 11/15/22 | United States | 40,850,000 | 65,572,912 | |||||||||||
ServiceNow Inc., cvt., senior note, zero cpn., 6/01/22 | United States | 23,000,000 | 60,407,144 | |||||||||||
Silicon Laboratories Inc., cvt., senior note, 1.375%, 3/01/22 | United States | 53,700,000 | 64,664,038 | |||||||||||
Splunk Inc., cvt., senior note, 1.125%, 9/15/25 | United States | 22,500,000 | 26,386,020 | |||||||||||
Square Inc., cvt., senior note, 0.50%, 5/15/23 | United States | 55,000,000 | 61,943,750 | |||||||||||
Twilio Inc., cvt., senior note, 0.25%, 6/01/23 | United States | 37,500,000 | 62,401,761 | |||||||||||
Viavi Solutions Inc., | ||||||||||||||
cvt., senior note, 1.75%, 6/01/23 | United States | 40,969,000 | 45,245,139 | |||||||||||
cvt., senior note, 1.00%, 3/01/24 | United States | 20,000,000 | 22,512,500 | |||||||||||
Wix.com Ltd., cvt., senior note, zero cpn., 7/01/23 | Israel | 56,500,000 | 65,364,859 | |||||||||||
Workday Inc., cvt., senior note, 0.25%, 10/01/22 | United States | 57,500,000 | 70,626,388 | |||||||||||
| b | Workiva Inc., cvt., senior note, 144A, 1.125%, 8/15/26 | United States | 22,000,000 | 17,798,943 | ||||||||||
Zendesk Inc., cvt., senior note, 0.25%, 3/15/23 | United States | 51,500,000 | 69,786,694 | |||||||||||
|
| |||||||||||||
| 1,332,158,072 | ||||||||||||||
|
| |||||||||||||
Total Convertible Bonds (Cost $2,321,032,402) | 2,757,279,701 | |||||||||||||
|
| |||||||||||||
| Shares | ||||||||||||||
Escrows and Litigation Trusts (Cost $22,362) 0.0% | ||||||||||||||
| a,c | Motors Liquidation Co., Escrow Account | United States | 376,200 | — | ||||||||||
|
| |||||||||||||
Total Investments before Short Term Investments | 3,422,553,004 | |||||||||||||
|
| |||||||||||||
30 |
Semiannual Report |
franklintempleton.com | ||
FRANKLIN INVESTORS SECURITIES TRUST
STATEMENT OF INVESTMENTS (UNAUDITED)
Franklin Convertible Securities Fund (continued)
| Country | Shares | Value | ||||||||||||
Short Term Investments (Cost $54,630,045) 1.6% | ||||||||||||||
Money Market Funds 1.6% | ||||||||||||||
d,e | Institutional Fiduciary Trust Money Market Portfolio, 0.01% | United States | 54,630,045 | $ | 54,630,045 | |||||||||
Total Investments (Cost $3,069,260,400) 99.7% | 3,477,183,049 | |||||||||||||
Other Assets, less Liabilities 0.3% | 10,385,910 | |||||||||||||
Net Assets 100.0% | $ | 3,487,568,959 | ||||||||||||
*The principal amount is stated in U.S. dollars unless otherwise indicated.
aNon-income producing.
bSecurity was purchased pursuant to Rule 144A under the Securities Act of 1933 and may be sold in transactions exempt from registration only to qualified institutional buyers or in a public offering registered under the Securities Act of 1933. At April 30, 2020, the aggregate value of these securities was $648,781,201, representing 18.6% of net assets.
cFair valued using significant unobservable inputs. See Note 11 regarding fair value measurements.
dSee Note 3(f) regarding investments in affiliated management investment companies.
eThe rate shown is the annualized seven-day effective yield at period end.
franklintempleton.com | The accompanying notes are an integral part of these financial statements. | Semiannual Report | 31 | ||||
FRANKLIN INVESTORS SECURITIES TRUST
Financial Highlights
Franklin Equity Income Fund
| Six Months Ended April 30, 2020 | Year Ended October 31, | |||||||||||||||||||||||
| (unaudited) | 2019 | 2018 | 2017 | 2016 | 2015 | |||||||||||||||||||
| Class A | ||||||||||||||||||||||||
| Per share operating performance (for a share outstanding throughout the period) | ||||||||||||||||||||||||
Net asset value, beginning of period | $26.23 | $24.86 | $25.06 | $22.50 | $22.99 | $23.93 | ||||||||||||||||||
| Income from investment operationsa: | ||||||||||||||||||||||||
Net investment incomeb | 0.24 | 0.46 | 0.42 | 0.48 | 0.47 | 0.55 | ||||||||||||||||||
Net realized and unrealized gains (losses) | (2.67 | ) | 2.49 | 0.58 | 3.55 | 0.24 | 0.26 | |||||||||||||||||
| Total from investment operations | (2.43) | 2.95 | 1.00 | 4.03 | 0.71 | 0.81 | ||||||||||||||||||
Less distributions from: | ||||||||||||||||||||||||
Net investment income | (0.33 | ) | (0.58 | ) | (0.57 | ) | (0.58 | ) | (0.60 | ) | (0.69 | ) | ||||||||||||
Net realized gains | (0.76 | ) | (1.00 | ) | (0.63 | ) | (0.89 | ) | (0.60 | ) | (1.06 | ) | ||||||||||||
Total distributions | (1.09 | ) | (1.58 | ) | (1.20 | ) | (1.47 | ) | (1.20 | ) | (1.75 | ) | ||||||||||||
| Net asset value, end of period | $22.71 | $26.23 | $24.86 | $25.06 | $22.50 | $22.99 | ||||||||||||||||||
Total returnc | (9.64)% | 12.73% | 3.98% | �� | 18.55% | 3.31% | 3.72% | |||||||||||||||||
| Ratios to average net assetsd | ||||||||||||||||||||||||
Expenses before waiver and payments by affiliates | 0.84% | 0.86% | 0.85% | 0.86% | 0.87% | 0.86% | ||||||||||||||||||
Expenses net of waiver and payments by affiliatese | 0.83% | 0.85% | 0.84% | 0.86% | f | 0.87% | f | 0.86% | f | |||||||||||||||
Net investment income | 1.91% | 1.85% | 1.66% | 2.02% | 2.13% | 2.37% | ||||||||||||||||||
| Supplemental data | ||||||||||||||||||||||||
Net assets, end of period (000’s) | $1,822,077 | $2,017,910 | $1,752,181 | $1,753,135 | $1,700,712 | $1,790,392 | ||||||||||||||||||
Portfolio turnover rate | 16.53% | 23.23% | 28.40% | 27.18% | 50.05% | 34.09% | ||||||||||||||||||
aThe amount shown for a share outstanding throughout the period may not correlate with the Statement of Operations for the period due to the timing of sales and repurchases of the Fund’s shares in relation to income earned and/or fluctuating fair value of the investments of the Fund.
bBased on average daily shares outstanding.
cTotal return does not reflect sales commissions or contingent deferred sales charges, if applicable, and is not annualized for periods less than one year.
dRatios are annualized for periods less than one year.
eBenefit of expense reduction rounds to less than 0.01%.
f Benefit of waiver and payments by affiliates rounds to less than 0.01%.
32 | Semiannual Report | The accompanying notes are an integral part of these financial statements. | franklintempleton.com | ||
FRANKLIN INVESTORS SECURITIES TRUST
FINANCIAL HIGHLIGHTS
Franklin Equity Income Fund (continued)
| Six Months Ended April 30, 2020 | Year Ended October 31, | |||||||||||||||||||||||
| (unaudited) | 2019 | 2018 | 2017 | 2016 | 2015 | |||||||||||||||||||
| Class C | ||||||||||||||||||||||||
| Per share operating performance (for a share outstanding throughout the period) | ||||||||||||||||||||||||
Net asset value, beginning of period | $26.01 | $24.64 | $24.86 | $22.32 | $22.85 | $23.79 | ||||||||||||||||||
| Income from investment operationsa: | ||||||||||||||||||||||||
Net investment incomeb | 0.15 | 0.28 | 0.26 | 0.30 | 0.30 | 0.37 | ||||||||||||||||||
Net realized and unrealized gains (losses) | (2.65 | ) | 2.47 | 0.53 | 3.54 | 0.23 | 0.27 | |||||||||||||||||
Total from investment operations | (2.50 | ) | 2.75 | 0.79 | 3.84 | 0.53 | 0.64 | |||||||||||||||||
Less distributions from: | ||||||||||||||||||||||||
Net investment income | (0.21 | ) | (0.38 | ) | (0.38 | ) | (0.41 | ) | (0.46 | ) | (0.52 | ) | ||||||||||||
Net realized gains | (0.76 | ) | (1.00 | ) | (0.63 | ) | (0.89 | ) | (0.60 | ) | (1.06 | ) | ||||||||||||
Total distributions | (0.97 | ) | (1.38 | ) | (1.01 | ) | (1.30 | ) | (1.06 | ) | (1.58) | |||||||||||||
Net asset value, end of period | $22.54 | $26.01 | $24.64 | $24.86 | $22.32 | $22.85 | ||||||||||||||||||
Total returnc | (9.99)% | 11.91% | 3.16% | 17.73% | 2.51% | 2.96% | ||||||||||||||||||
| Ratios to average net assetsd | ||||||||||||||||||||||||
Expenses before waiver and payments by affiliates | 1.59% | 1.61% | 1.60% | 1.61% | 1.62% | 1.61% | ||||||||||||||||||
Expenses net of waiver and payments by affiliatese | 1.58% | 1.60% | 1.59% | 1.61% | f | 1.62% | f | 1.61% | f | |||||||||||||||
Net investment income | 1.16% | 1.10% | 0.91% | 1.27% | 1.38% | 1.62% | ||||||||||||||||||
| Supplemental data | ||||||||||||||||||||||||
Net assets, end of period (000’s) | $174,693 | $208,734 | $204,402 | $267,450 | $257,156 | $250,347 | ||||||||||||||||||
Portfolio turnover rate | 16.53% | 23.23% | 28.40% | 27.18% | 50.05% | 34.09% | ||||||||||||||||||
aThe amount shown for a share outstanding throughout the period may not correlate with the Statement of Operations for the period due to the timing of sales and repurchases of the Fund’s shares in relation to income earned and/or fluctuating fair value of the investments of the Fund.
bBased on average daily shares outstanding.
cTotal return does not reflect sales commissions or contingent deferred sales charges, if applicable, and is not annualized for periods less than one year.
dRatios are annualized for periods less than one year.
eBenefit of expense reduction rounds to less than 0.01%.
fBenefit of waiver and payments by affiliates rounds to less than 0.01%.
franklintempleton.com | The accompanying notes are an integral part of these financial statements. | Semiannual Report | 33 | ||||
FRANKLIN INVESTORS SECURITIES TRUST
FINANCIAL HIGHLIGHTS
Franklin Equity Income Fund (continued)
| Six Months Ended April 30, 2020 | Year Ended October 31, | |||||||||||||||||||||||
| (unaudited) | 2019 | 2018 | 2017 | 2016 | 2015 | |||||||||||||||||||
| Class R | ||||||||||||||||||||||||
| Per share operating performance (for a share outstanding throughout the period) | ||||||||||||||||||||||||
Net asset value, beginning of period | $26.23 | $24.85 | $25.05 | $22.49 | $22.99 | $23.93 | ||||||||||||||||||
Income from investment operationsa: | ||||||||||||||||||||||||
Net investment incomeb | 0.21 | 0.41 | 0.36 | 0.42 | 0.41 | 0.50 | ||||||||||||||||||
Net realized and unrealized gains (losses) | (2.66 | ) | 2.49 | 0.58 | 3.56 | 0.24 | 0.25 | |||||||||||||||||
Total from investment operations | (2.45 | ) | 2.90 | 0.94 | 3.98 | 0.65 | 0.75 | |||||||||||||||||
Less distributions from: | ||||||||||||||||||||||||
Net investment income | (0.29 | ) | (0.52 | ) | (0.51 | ) | (0.53 | ) | (0.55 | ) | (0.63 | ) | ||||||||||||
Net realized gains | (0.76 | ) | (1.00 | ) | (0.63 | ) | (0.89 | ) | (0.60 | ) | (1.06 | ) | ||||||||||||
Total distributions | (1.05 | ) | (1.52 | ) | (1.14 | ) | (1.42 | ) | (1.15 | ) | (1.69 | ) | ||||||||||||
Net asset value, end of period | $22.73 | $26.23 | $24.85 | $25.05 | $22.49 | $22.99 | ||||||||||||||||||
Total returnc | (9.71)% | 12.50% | 3.75% | 18.29% | 3.05% | 3.45% | ||||||||||||||||||
| Ratios to average net assetsd | ||||||||||||||||||||||||
Expenses before waiver and payments by affiliates | 1.07% | 1.09% | 1.08% | 1.09% | 1.11% | 1.11% | ||||||||||||||||||
Expenses net of waiver and payments by affiliatese | 1.06% | 1.08% | 1.07% | 1.09% | f | 1.11% | f | 1.11% | f | |||||||||||||||
Net investment income | 1.68% | 1.62% | 1.43% | 1.79% | 1.89% | 2.12% | ||||||||||||||||||
| Supplemental data | ||||||||||||||||||||||||
Net assets, end of period (000’s) | $5,748 | $7,284 | $6,750 | $7,074 | $6,395 | $6,265 | ||||||||||||||||||
Portfolio turnover rate | 16.53% | 23.23% | 28.40% | 27.18% | 50.05% | 34.09% | ||||||||||||||||||
aThe amount shown for a share outstanding throughout the period may not correlate with the Statement of Operations for the period due to the timing of sales and repurchases of the Fund’s shares in relation to income earned and/or fluctuating fair value of the investments of the Fund.
bBased on average daily shares outstanding.
cTotal return is not annualized for periods less than one year.
dRatios are annualized for periods less than one year.
eBenefit of expense reduction rounds to less than 0.01%.
fBenefit of waiver and payments by affiliates rounds to less than 0.01%.
34 | Semiannual Report | The accompanying notes are an integral part of these financial statements. | franklintempleton.com | ||
FRANKLIN INVESTORS SECURITIES TRUST
FINANCIAL HIGHLIGHTS
Franklin Equity Income Fund (continued)
| Six Months Ended April 30, 2020 | Year Ended October 31, | |||||||||||||||||||||||
| (unaudited) | 2019 | 2018 | 2017 | 2016 | 2015 | |||||||||||||||||||
| Class R6 | ||||||||||||||||||||||||
| Per share operating performance (for a share outstanding throughout the period) | ||||||||||||||||||||||||
Net asset value, beginning of period | $26.29 | $24.91 | $25.11 | $22.54 | $23.01 | $23.95 | ||||||||||||||||||
|
| |||||||||||||||||||||||
Income from investment operationsa: | ||||||||||||||||||||||||
Net investment incomeb | 0.28 | 0.54 | 0.50 | 0.56 | 0.43 | 0.63 | ||||||||||||||||||
Net realized and unrealized gains (losses) | (2.68 | ) | 2.50 | 0.59 | 3.57 | 0.37 | 0.27 | |||||||||||||||||
|
| |||||||||||||||||||||||
| Total from investment operations | (2.40 | ) | 3.04 | 1.09 | 4.13 | 0.80 | 0.90 | |||||||||||||||||
|
| |||||||||||||||||||||||
| Less distributions from: | ||||||||||||||||||||||||
Net investment income | (0.38 | ) | (0.66 | ) | (0.66 | ) | (0.67 | ) | (0.67 | ) | (0.78 | ) | ||||||||||||
Net realized gains | (0.76 | ) | (1.00 | ) | (0.63 | ) | (0.89 | ) | (0.60 | ) | (1.06 | ) | ||||||||||||
|
| |||||||||||||||||||||||
Total distributions | (1.14 | ) | (1.66 | ) | (1.29 | ) | (1.56 | ) | (1.27 | ) | (1.84 | ) | ||||||||||||
|
| |||||||||||||||||||||||
| Net asset value, end of period | $22.75 | $26.29 | $24.91 | $25.11 | $22.54 | $23.01 | ||||||||||||||||||
|
| |||||||||||||||||||||||
Total returnc | (9.49)% | 13.12% | 4.35% | 19.00% | 3.72% | 4.10% | ||||||||||||||||||
| Ratios to average net assetsd | ||||||||||||||||||||||||
Expenses before waiver and payments by affiliates | 0.52% | 0.53% | 0.52% | 0.49% | 0.49% | 2.89% | ||||||||||||||||||
Expenses net of waiver and payments by affiliatese | 0.50% | 0.51% | 0.50% | 0.49% | f | 0.49% | f | 0.48% | ||||||||||||||||
Net investment income | 2.24% | 2.19% | 2.00% | 2.39% | 2.51% | 2.75% | ||||||||||||||||||
| Supplemental data | ||||||||||||||||||||||||
Net assets, end of period (000’s) | $88,889 | $96,406 | $81,171 | $12,728 | $10,537 | $6 | ||||||||||||||||||
Portfolio turnover rate | 16.53% | 23.23% | 28.40% | 27.18% | 50.05% | 34.09% | ||||||||||||||||||
aThe amount shown for a share outstanding throughout the period may not correlate with the Statement of Operations for the period due to the timing of sales and repurchases of the Fund’s shares in relation to income earned and/or fluctuating fair value of the investments of the Fund.
bBased on average daily shares outstanding.
cTotal return is not annualized for periods less than one year.
dRatios are annualized for periods less than one year.
eBenefit of expense reduction rounds to less than 0.01%.
fBenefit of waiver and payments by affiliates rounds to less than 0.01%.
franklintempleton.com | The accompanying notes are an integral part of these financial statements. | Semiannual Report | 35 | ||||
FRANKLIN INVESTORS SECURITIES TRUST
FINANCIAL HIGHLIGHTS
Franklin Equity Income Fund (continued)
| Six Months Ended April 30, 2020 | Year Ended October 31, | |||||||||||||||||||||||
| (unaudited) | 2019 | 2018 | 2017 | 2016 | 2015 | |||||||||||||||||||
| Advisor Class | ||||||||||||||||||||||||
| Per share operating performance (for a share outstanding throughout the period) | ||||||||||||||||||||||||
Net asset value, beginning of period | $26.27 | $24.90 | $25.10 | $22.53 | $23.02 | $23.96 | ||||||||||||||||||
|
| |||||||||||||||||||||||
Income from investment operationsa: | ||||||||||||||||||||||||
Net investment incomeb | 0.26 | 0.50 | 0.46 | 0.50 | 0.45 | 0.60 | ||||||||||||||||||
Net realized and unrealized gains (losses) | (2.65 | ) | 2.51 | 0.60 | 3.60 | 0.31 | 0.27 | |||||||||||||||||
|
| |||||||||||||||||||||||
| Total from investment operations | (2.39 | ) | 3.01 | 1.06 | 4.10 | 0.76 | 0.87 | |||||||||||||||||
|
| |||||||||||||||||||||||
| Less distributions from: | ||||||||||||||||||||||||
Net investment income | (0.37 | ) | (0.64 | ) | (0.63 | ) | (0.64 | ) | (0.65 | ) | (0.75 | ) | ||||||||||||
Net realized gains | (0.76 | ) | (1.00 | ) | (0.63 | ) | (0.89 | ) | (0.60 | ) | (1.06 | ) | ||||||||||||
|
| |||||||||||||||||||||||
Total distributions | (1.13 | ) | (1.64 | ) | (1.26 | ) | (1.53 | ) | (1.25 | ) | (1.81 | ) | ||||||||||||
|
| |||||||||||||||||||||||
| Net asset value, end of period | $22.75 | $26.27 | $24.90 | $25.10 | $22.53 | $23.02 | ||||||||||||||||||
|
| |||||||||||||||||||||||
Total returnc | (9.51)% | 13.04% | 4.22% | 18.88% | 3.53% | 3.98% | ||||||||||||||||||
| Ratios to average net assetsd | ||||||||||||||||||||||||
Expenses before waiver and payments by affiliates | 0.59% | 0.61% | 0.60% | 0.61% | 0.62% | 0.61% | ||||||||||||||||||
Expenses net of waiver and payments by affiliatese | 0.58% | 0.60% | 0.59% | 0.61% | f | 0.62% | f | 0.61% | f | |||||||||||||||
Net investment income | 2.16% | 2.10% | 1.91% | 2.27% | 2.38% | 2.62% | ||||||||||||||||||
| Supplemental data | ||||||||||||||||||||||||
Net assets, end of period (000’s) | $180,254 | $173,739 | $109,435 | $147,681 | $80,422 | $34,577 | ||||||||||||||||||
Portfolio turnover rate | 16.53% | 23.23% | 28.40% | 27.18% | 50.05% | 34.09% | ||||||||||||||||||
aThe amount shown for a share outstanding throughout the period may not correlate with the Statement of Operations for the period due to the timing of sales and repurchases of the Fund’s shares in relation to income earned and/or fluctuating fair value of the investments of the Fund.
bBased on average daily shares outstanding.
cTotal return is not annualized for periods less than one year.
dRatios are annualized for periods less than one year.
eBenefit of expense reduction rounds to less than 0.01%.
fBenefit of waiver and payments by affiliates rounds to less than 0.01%.
36 | Semiannual Report | The accompanying notes are an integral part of these financial statements. | franklintempleton.com | ||
FRANKLIN INVESTORS SECURITIES TRUST
Statement of Investments, April 30, 2020 (unaudited)
Franklin Equity Income Fund
| Country | Shares | Value | ||||||||||||
Common Stocks 83.1% | ||||||||||||||
| Communication Services 5.1% | ||||||||||||||
Comcast Corp., A | United States | 1,029,500 | $ | 38,740,085 | ||||||||||
Rogers Communications Inc., B | Canada | 245,000 | 10,245,900 | |||||||||||
TELUS Corp. | Canada | 645,000 | 10,543,002 | |||||||||||
Verizon Communications Inc. | United States | 1,000,000 | 57,450,000 | |||||||||||
|
| |||||||||||||
| 116,978,987 | ||||||||||||||
|
| |||||||||||||
| Consumer Discretionary 4.5% | ||||||||||||||
Lowe’s Cos. Inc. | United States | 176,000 | 18,436,000 | |||||||||||
McDonald’s Corp. | United States | 210,000 | 39,387,600 | |||||||||||
Target Corp. | United States | 401,500 | 44,060,610 | |||||||||||
|
| |||||||||||||
| 101,884,210 | ||||||||||||||
|
| |||||||||||||
| Consumer Staples 11.8% | ||||||||||||||
The Coca-Cola Co. | United States | 1,165,000 | 53,461,850 | |||||||||||
Nestle SA | Switzerland | 200,000 | 21,110,421 | |||||||||||
PepsiCo Inc. | United States | 415,000 | 54,900,350 | |||||||||||
The Procter & Gamble Co. | United States | 560,000 | 66,007,200 | |||||||||||
Unilever NV, N.Y. shs. | United Kingdom | 475,000 | 23,474,500 | |||||||||||
Walmart Inc. | United States | 410,000 | 49,835,500 | |||||||||||
|
| |||||||||||||
| 268,789,821 | ||||||||||||||
|
| |||||||||||||
| Energy 5.0% | ||||||||||||||
Canadian Natural Resources Ltd. | Canada | 650,000 | 10,894,000 | |||||||||||
Chevron Corp. | United States | 615,000 | 56,580,000 | |||||||||||
Exxon Mobil Corp. | United States | 254,534 | 11,828,195 | |||||||||||
Royal Dutch Shell PLC, A, ADR | United Kingdom | 725,000 | 24,019,250 | |||||||||||
Suncor Energy Inc. | Canada | 615,000 | 10,977,750 | |||||||||||
|
| |||||||||||||
| 114,299,195 | ||||||||||||||
|
| |||||||||||||
| Financials 16.7% | ||||||||||||||
Apollo Global Management Inc., A | United States | 435,000 | 17,613,150 | |||||||||||
Ares Management Corp., A | United States | 550,000 | 18,452,500 | |||||||||||
Arthur J. Gallagher & Co. | United States | 195,500 | 15,346,750 | |||||||||||
Bank of America Corp. | United States | 2,007,708 | 48,285,377 | |||||||||||
BlackRock Inc. | United States | 44,500 | 22,340,780 | |||||||||||
Citigroup Inc. | United States | 900,000 | 43,704,000 | |||||||||||
JPMorgan Chase & Co. | United States | 900,000 | 86,184,000 | |||||||||||
MetLife Inc. | United States | 775,000 | 27,962,000 | |||||||||||
Morgan Stanley | United States | 1,390,000 | 54,807,700 | |||||||||||
Truist Financial Corp. | United States | 1,175,000 | 43,851,000 | |||||||||||
|
| |||||||||||||
| 378,547,257 | ||||||||||||||
|
| |||||||||||||
| Health Care 12.3% | ||||||||||||||
Baxter International Inc. | United States | 210,000 | 18,643,800 | |||||||||||
HCA Healthcare Inc. | United States | 135,000 | 14,833,800 | |||||||||||
Johnson & Johnson | United States | 494,000 | 74,119,760 | |||||||||||
Medtronic PLC | United States | 540,000 | 52,720,200 | |||||||||||
Merck & Co. Inc. | United States | 425,000 | 33,719,500 | |||||||||||
Pfizer Inc. | United States | 1,184,300 | 45,429,748 | |||||||||||
franklintempleton.com | Semiannual Report | 37 | ||||
FRANKLIN INVESTORS SECURITIES TRUST
STATEMENT OF INVESTMENTS (UNAUDITED)
Franklin Equity Income Fund (continued)
| Country | Shares | Value | ||||||||||||
Common Stocks (continued) | ||||||||||||||
Health Care (continued) | ||||||||||||||
UnitedHealth Group Inc. | United States | 135,000 | $ | 39,483,450 | ||||||||||
|
| |||||||||||||
| 278,950,258 | ||||||||||||||
|
| |||||||||||||
| Industrials 9.2% | ||||||||||||||
Emerson Electric Co. | United States | 389,000 | 22,184,670 | |||||||||||
Fastenal Co. | United States | 175,000 | 6,338,500 | |||||||||||
Illinois Tool Works Inc. | United States | 47,000 | 7,637,500 | |||||||||||
Lockheed Martin Corp. | United States | 83,500 | 32,486,510 | |||||||||||
Norfolk Southern Corp. | United States | 216,000 | 36,957,600 | |||||||||||
| a | Otis Worldwide Corp. | United States | 137,500 | 7,000,125 | ||||||||||
Raytheon Technologies Corp. | United States | 804,999 | 52,171,985 | |||||||||||
Republic Services Inc. | United States | 485,000 | 37,994,900 | |||||||||||
Stanley Black & Decker Inc. | United States | 51,780 | 5,706,156 | |||||||||||
|
| |||||||||||||
| 208,477,946 | ||||||||||||||
|
| |||||||||||||
| Information Technology 8.0% | ||||||||||||||
Analog Devices Inc. | United States | 165,000 | 18,084,000 | |||||||||||
Apple Inc. | United States | 95,000 | 27,911,000 | |||||||||||
Cisco Systems Inc. | United States | 639,733 | 27,111,884 | |||||||||||
Intel Corp. | United States | 268,402 | 16,098,752 | |||||||||||
Microsoft Corp. | United States | 338,000 | 60,572,980 | |||||||||||
Oracle Corp. | United States | 107,200 | 5,678,384 | |||||||||||
Texas Instruments Inc. | United States | 216,500 | 25,129,155 | |||||||||||
|
| |||||||||||||
| 180,586,155 | ||||||||||||||
|
| |||||||||||||
| Materials 0.6% | ||||||||||||||
BASF SE | Germany | 275,000 | 14,067,007 | |||||||||||
|
| |||||||||||||
| Real Estate 2.0% | ||||||||||||||
Equity Residential | United States | 300,000 | 19,518,000 | |||||||||||
Host Hotels & Resorts Inc. | United States | 495,000 | 6,093,450 | |||||||||||
Prologis Inc. | United States | 227,500 | 20,299,825 | |||||||||||
|
| |||||||||||||
| 45,911,275 | ||||||||||||||
|
| |||||||||||||
| Utilities 7.9% | ||||||||||||||
Duke Energy Corp. | United States | 635,000 | 53,759,100 | |||||||||||
Entergy Corp. | United States | 230,000 | 21,967,300 | |||||||||||
NextEra Energy Inc. | United States | 250,000 | 57,780,000 | |||||||||||
Xcel Energy Inc. | United States | 723,500 | 45,985,660 | |||||||||||
|
| |||||||||||||
| 179,492,060 | ||||||||||||||
|
| |||||||||||||
Total Common Stocks (Cost $1,477,662,213) | 1,887,984,171 | |||||||||||||
|
| |||||||||||||
| b | Equity-Linked Securities 8.8% | |||||||||||||
Consumer Discretionary 3.5% | ||||||||||||||
| c | JPMorgan Chase Bank NA into The TJX Cos. Inc., 5.50%, 144A | United States | 326,000 | 16,092,173 | ||||||||||
| c | Royal Bank of Canada into Lowe’s Cos. Inc., 7.00%, 144A | United States | 115,000 | 11,986,631 | ||||||||||
| c | Royal Bank of Canada into Tractor Supply Co., 6.00%, 144A | United States | 200,000 | 19,542,388 | ||||||||||
| c | Wells Fargo Bank NA into Amazon.com Inc., 6.00%, 144A | United States | 14,500 | 31,080,964 | ||||||||||
|
| |||||||||||||
| 78,702,156 | ||||||||||||||
|
| |||||||||||||
38 |
Semiannual Report |
franklintempleton.com | ||
FRANKLIN INVESTORS SECURITIES TRUST
STATEMENT OF INVESTMENTS (UNAUDITED)
Franklin Equity Income Fund (continued)
| Country | Shares | Value | ||||||||||||
| b | Equity-Linked Securities (continued) | |||||||||||||
| Financials 0.9% | ||||||||||||||
| c | Credit Suisse AG into Bank of America Corp., 7.00%, 144A | United States | 850,000 | $ | 20,878,593 | |||||||||
|
| |||||||||||||
| Health Care 0.7% | ||||||||||||||
| c | Goldman Sachs International into HCA Holdings Inc., 6.00%, 144A | United States | 145,000 | 16,433,746 | ||||||||||
|
| |||||||||||||
| Industrials 1.2% | ||||||||||||||
| c | Citigroup Global Markets Holdings Inc. into Fastenal Co., 7.00%, 144A | United States | 360,000 | 12,869,911 | ||||||||||
| c | Goldman Sachs International into Stanley Black & Decker Inc., 7.00%, 144A | United States | 115,000 | 13,474,899 | ||||||||||
|
| |||||||||||||
| 26,344,810 | ||||||||||||||
|
| |||||||||||||
| Information Technology 2.5% | ||||||||||||||
| c | Barclays Bank PLC into Broadcom Inc., 10.00%, 144A | United States | 67,000 | 18,531,360 | ||||||||||
| c | Barclays Bank PLC into Microsoft Corp., 6.50%, 144A | United States | 110,000 | 16,747,203 | ||||||||||
| c | Barclays Bank PLC into Oracle Corp., 6.50%, 144A | United States | 440,000 | 22,563,297 | ||||||||||
|
| |||||||||||||
| 57,841,860 | ||||||||||||||
|
| |||||||||||||
Total Equity-Linked Securities (Cost $212,412,417) | 200,201,165 | |||||||||||||
|
| |||||||||||||
| Convertible Preferred Stocks 6.2% | ||||||||||||||
Health Care 3.2% | ||||||||||||||
| Becton Dickinson and Co., 6.125%, cvt. pfd., A | United States | 735,000 | 43,541,400 | |||||||||||
Danaher Corp., 4.75%, cvt. pfd., A | United States | 25,000 | 29,728,000 | |||||||||||
|
| |||||||||||||
| 73,269,400 | ||||||||||||||
|
| |||||||||||||
Industrials 1.1% | ||||||||||||||
| Fortive Corp., 5.00%, cvt. pfd., A | United States | 30,300 | 25,142,334 | |||||||||||
|
| |||||||||||||
Information Technology 0.8% | ||||||||||||||
| Broadcom Inc., 8.00%, cvt. pfd., A | United States | 18,000 | 18,313,920 | |||||||||||
|
| |||||||||||||
Utilities 1.1% | ||||||||||||||
| Essential Utilities Inc., 6.00%, cvt. pfd | United States | 440,000 | 25,124,000 | |||||||||||
|
| |||||||||||||
Total Convertible Preferred Stocks (Cost $139,990,643) | 141,849,654 | |||||||||||||
|
| |||||||||||||
Total Investments before Short Term Investments | 2,230,034,990 | |||||||||||||
|
| |||||||||||||
Short Term Investments (Cost $38,078,591) 1.7% | ||||||||||||||
| Money Market Funds 1.7% | ||||||||||||||
| d,e | Institutional Fiduciary Trust Money Market Portfolio, 0.01% | United States | 38,078,591 | 38,078,591 | ||||||||||
|
| |||||||||||||
| Total Investments (Cost $1,868,143,864) 99.8% | 2,268,113,581 | |||||||||||||
Other Assets, less Liabilities 0.2% | 3,546,891 | |||||||||||||
|
| |||||||||||||
| Net Assets 100.0% | $ | 2,271,660,472 | ||||||||||||
|
| |||||||||||||
franklintempleton.com | Semiannual Report | 39 | ||||
FRANKLIN INVESTORS SECURITIES TRUST
STATEMENT OF INVESTMENTS (UNAUDITED)
Franklin Equity Income Fund (continued)
See Abbreviations on page 74.
aNon-income producing.
bSee Note 1(e) regarding equity-linked securities.
cSecurity was purchased pursuant to Rule 144A under the Securities Act of 1933 and may be sold in transactions exempt from registration only to qualified institutional buyers or in a public offering registered under the Securities Act of 1933. At April 30, 2020, the aggregate value of these securities was $200,201,165, representing 8.8% of net assets.
dSee Note 3(f) regarding investments in affiliated management investment companies.
eThe rate shown is the annualized seven-day effective yield at period end.
40 | Semiannual Report | The accompanying notes are an integral part of these financial statements. | franklintempleton.com | ||
FRANKLIN INVESTORS SECURITIES TRUST
Financial Highlights
Franklin Managed Income Fund
Six Months Ended April 30, 2020 (unaudited) | Year Ended October 31, | |||||||||||||||||||||||
|
| |||||||||||||||||||||||
| 2019 | 2018 | 2017 | 2016 | 2015 | ||||||||||||||||||||
| ||||||||||||||||||||||||
| Class A | ||||||||||||||||||||||||
| Per share operating performance (for a share outstanding throughout the period) | ||||||||||||||||||||||||
Net asset value, beginning of period | $12.80 | $11.89 | $12.36 | $11.65 | $11.40 | $ 11.86 | ||||||||||||||||||
|
| |||||||||||||||||||||||
Income from investment operationsa: | ||||||||||||||||||||||||
Net investment incomeb | 0.15 | 0.29 | 0.27 | 0.33 | 0.30 | 0.30 | ||||||||||||||||||
Net realized and unrealized gains (losses) | (0.77 | ) | 1.17 | (0.16 | ) | 0.91 | 0.31 | (0.24 | ) | |||||||||||||||
|
| |||||||||||||||||||||||
Total from investment operations | (0.62 | ) | 1.46 | 0.11 | 1.24 | 0.61 | 0.06 | |||||||||||||||||
|
| |||||||||||||||||||||||
Less distributions from: | ||||||||||||||||||||||||
Net investment income | (0.23 | ) | (0.41 | ) | (0.38 | ) | (0.36 | ) | (0.36 | ) | (0.36 | ) | ||||||||||||
Net realized gains | (0.48 | ) | (0.14 | ) | (0.20 | ) | (0.17 | ) | (— | )c | (0.16 | ) | ||||||||||||
|
| |||||||||||||||||||||||
Total distributions | (0.71 | ) | (0.55 | ) | (0.58 | ) | (0.53 | ) | (0.36 | ) | (0.52 | ) | ||||||||||||
|
| |||||||||||||||||||||||
Net asset value, end of period | $11.47 | $12.80 | $11.89 | $12.36 | $11.65 | $ 11.40 | ||||||||||||||||||
|
| |||||||||||||||||||||||
Total returnd | (5.15)% | 12.64% | 0.89% | 10.88% | 5.54% | 0.51% | ||||||||||||||||||
| Ratios to average net assetse | ||||||||||||||||||||||||
Expenses before waiver and payments by affiliates | 0.92% | 0.96% | 1.02% | 1.02% | 1.02% | 1.06% | ||||||||||||||||||
Expenses net of waiver and payments by affiliatesf | 0.90% | 0.94% | 1.01% | 1.00% | 1.01% | 1.06% | g | |||||||||||||||||
Net investment income | 2.51% | 2.36% | 2.22% | 2.72% | 2.62% | 2.56% | ||||||||||||||||||
| Supplemental data | ||||||||||||||||||||||||
Net assets, end of period (000’s) | $2,760,082 | $2,966,899 | $2,586,246 | $2,646,599 | $2,532,459 | $2,371,133 | ||||||||||||||||||
Portfolio turnover rate | 28.82% | 53.02% | 63.64% | 34.99% | 46.03% | 69.23% | ||||||||||||||||||
aThe amount shown for a share outstanding throughout the period may not correlate with the Statement of Operations for the period due to the timing of sales and repurchases of the Fund’s shares in relation to income earned and/or fluctuating fair value of the investments of the Fund.
bBased on average daily shares outstanding.
cAmount rounds to less than $0.01 per share.
dTotal return does not reflect sales commissions or contingent deferred sales charges, if applicable, and is not annualized for periods less than one year.
eRatios are annualized for periods less than one year.
fBenefit of expense reduction rounds to less than 0.01%.
gBenefit of waiver and payments by affiliates rounds to less than 0.01%.
franklintempleton.com | The accompanying notes are an integral part of these financial statements. | Semiannual Report | 41 | ||||
FRANKLIN INVESTORS SECURITIES TRUST
FINANCIAL HIGHLIGHTS
Franklin Managed Income Fund (continued)
Six Months Ended April 30, 2020 (unaudited) | Year Ended October 31, | |||||||||||||||||||||||
|
| |||||||||||||||||||||||
| 2019 | 2018 | 2017 | 2016 | 2015 | ||||||||||||||||||||
| ||||||||||||||||||||||||
| Class C | ||||||||||||||||||||||||
| Per share operating performance (for a share outstanding throughout the period) | ||||||||||||||||||||||||
Net asset value, beginning of period | $12.67 | $11.78 | $12.25 | $11.55 | $11.31 | $11.77 | ||||||||||||||||||
|
| |||||||||||||||||||||||
| Income from investment operationsa: | ||||||||||||||||||||||||
Net investment incomeb | 0.11 | 0.20 | 0.19 | 0.24 | 0.21 | 0.21 | ||||||||||||||||||
Net realized and unrealized gains (losses) | (0.77 | ) | 1.15 | (0.17 | ) | 0.90 | 0.31 | (0.23) | ||||||||||||||||
|
| |||||||||||||||||||||||
Total from investment operations | (0.66 | ) | 1.35 | 0.02 | 1.14 | 0.52 | (0.02) | |||||||||||||||||
|
| |||||||||||||||||||||||
Less distributions from: | ||||||||||||||||||||||||
Net investment income | (0.18 | ) | (0.32 | ) | (0.29 | ) | (0.27 | ) | (0.28 | ) | (0.28) | |||||||||||||
Net realized gains | (0.48 | ) | (0.14 | ) | (0.20 | ) | (0.17 | ) | (— | )c | (0.16) | |||||||||||||
|
| |||||||||||||||||||||||
Total distributions | (0.66 | ) | (0.46 | ) | (0.49 | ) | (0.44 | ) | (0.28 | ) | (0.44) | |||||||||||||
|
| |||||||||||||||||||||||
Net asset value, end of period | $11.35 | $12.67 | $11.78 | $12.25 | $11.55 | $11.31 | ||||||||||||||||||
|
| |||||||||||||||||||||||
Total returnd | (5.50)% | 11.79% | 0.14% | 10.06% | 4.73% | (0.20)% | ||||||||||||||||||
| Ratios to average net assetse | ||||||||||||||||||||||||
Expenses before waiver and payments by affiliates | 1.67% | 1.71% | 1.76% | 1.77% | 1.77% | 1.77% | ||||||||||||||||||
Expenses net of waiver and payments by affiliatesf | 1.65% | 1.69% | 1.75% | 1.75% | 1.76% | 1.77% | g | |||||||||||||||||
Net investment income | 1.76% | 1.61% | 1.48% | 1.97% | 1.87% | 1.85% | ||||||||||||||||||
| Supplemental data | ||||||||||||||||||||||||
Net assets, end of period (000’s) | $423,454 | $491,751 | $493,762 | $633,108 | $630,110 | $563,419 | ||||||||||||||||||
Portfolio turnover rate | 28.82% | 53.02% | 63.64% | 34.99% | 46.03% | 69.23% | ||||||||||||||||||
aThe amount shown for a share outstanding throughout the period may not correlate with the Statement of Operations for the period due to the timing of sales and repurchases of the Fund’s shares in relation to income earned and/or fluctuating fair value of the investments of the Fund.
bBased on average daily shares outstanding.
cAmount rounds to less than $0.01 per share.
dTotal return does not reflect sales commissions or contingent deferred sales charges, if applicable, and is not annualized for periods less than one year.
eRatios are annualized for periods less than one year.
fBenefit of expense reduction rounds to less than 0.01%.
gBenefit of waiver and payments by affiliates rounds to less than 0.01%.
42 | Semiannual Report | The accompanying notes are an integral part of these financial statements. | franklintempleton.com | ||
FRANKLIN INVESTORS SECURITIES TRUST
FINANCIAL HIGHLIGHTS
Franklin Managed Income Fund (continued)
| Six Months Ended April 30, 2020 | Year Ended October 31, | |||||||||||||||||||||||
| (unaudited) | 2019 | 2018 | 2017 | 2016 | 2015 | |||||||||||||||||||
| Class R | ||||||||||||||||||||||||
| Per share operating performance (for a share outstanding throughout the period) | ||||||||||||||||||||||||
Net asset value, beginning of period | $12.84 | $11.92 | $12.39 | $11.67 | $11.42 | $11.89 | ||||||||||||||||||
|
| |||||||||||||||||||||||
| Income from investment operationsa: | ||||||||||||||||||||||||
Net investment incomeb | 0.14 | 0.26 | 0.26 | 0.30 | 0.27 | 0.27 | ||||||||||||||||||
Net realized and unrealized gains (losses) | (0.79 | ) | 1.18 | (0.18 | ) | 0.92 | 0.32 | (0.24) | ||||||||||||||||
|
| |||||||||||||||||||||||
Total from investment operations | (0.65 | ) | 1.44 | 0.08 | 1.22 | 0.59 | 0.03 | |||||||||||||||||
|
| |||||||||||||||||||||||
Less distributions from: | ||||||||||||||||||||||||
Net investment income | (0.21 | ) | (0.38 | ) | (0.35 | ) | (0.33 | ) | (0.34 | ) | (0.34) | |||||||||||||
Net realized gains | (0.48 | ) | (0.14 | ) | (0.20 | ) | (0.17 | ) | (— | )c | (0.16) | |||||||||||||
|
| |||||||||||||||||||||||
Total distributions | (0.69 | ) | (0.52 | ) | (0.55 | ) | (0.50 | ) | (0.34 | ) | (0.50) | |||||||||||||
|
| |||||||||||||||||||||||
Net asset value, end of period | $11.50 | $12.84 | $11.92 | $12.39 | $11.67 | $11.42 | ||||||||||||||||||
|
| |||||||||||||||||||||||
Total returnd | (5.33)% | 12.43% | 0.63% | 10.66% | 5.28% | 0.21% | ||||||||||||||||||
| Ratios to average net assetse | ||||||||||||||||||||||||
Expenses before waiver and payments by affiliates | 1.17% | 1.21% | 1.27% | 1.27% | 1.27% | 1.27% | ||||||||||||||||||
Expenses net of waiver and payments by affiliatesf | 1.15% | 1.19% | 1.26% | 1.25% | 1.26% | 1.27% | g | |||||||||||||||||
Net investment income | 2.26% | 2.11% | 1.97% | 2.47% | 2.37% | 2.35% | ||||||||||||||||||
| Supplemental data | ||||||||||||||||||||||||
Net assets, end of period (000’s) | $3,738 | $4,081 | $3,371 | $4,763 | $4,482 | $4,699 | ||||||||||||||||||
Portfolio turnover rate | 28.82% | 53.02% | 63.64% | 34.99% | 46.03% | 69.23% | ||||||||||||||||||
aThe amount shown for a share outstanding throughout the period may not correlate with the Statement of Operations for the period due to the timing of sales and repurchases of the Fund’s shares in relation to income earned and/or fluctuating fair value of the investments of the Fund.
bBased on average daily shares outstanding.
cAmount rounds to less than $0.01 per share.
dTotal return is not annualized for periods less than one year.
eRatios are annualized for periods less than one year.
fBenefit of expense reduction rounds to less than 0.01%.
gBenefit of waiver and payments by affiliates rounds to less than 0.01%.
franklintempleton.com | The accompanying notes are an integral part of these financial statements. | Semiannual Report | �� | 43 | |||
FRANKLIN INVESTORS SECURITIES TRUST
FINANCIAL HIGHLIGHTS
Franklin Managed Income Fund (continued)
| Six Months Ended April 30, 2020 | Year Ended October 31, | |||||||||||||||||||||||
| (unaudited) | 2019 | 2018 | 2017 | 2016 | 2015 | |||||||||||||||||||
| Class R6 | ||||||||||||||||||||||||
| Per share operating performance (for a share outstanding throughout the period) | ||||||||||||||||||||||||
Net asset value, beginning of period | $12.85 | $11.93 | $12.39 | $11.67 | $11.42 | $11.89 | ||||||||||||||||||
|
| |||||||||||||||||||||||
| Income from investment operationsa: | ||||||||||||||||||||||||
Net investment incomeb | 0.17 | 0.33 | 0.31 | 0.41 | 0.34 | 0.35 | ||||||||||||||||||
Net realized and unrealized gains (losses) | (0.78 | ) | 1.18 | (0.14 | ) | 0.88 | 0.31 | (0.25 | ) | |||||||||||||||
|
| |||||||||||||||||||||||
Total from investment operations | (0.61 | ) | 1.51 | 0.17 | 1.29 | 0.65 | 0.10 | |||||||||||||||||
|
| |||||||||||||||||||||||
Less distributions from: | ||||||||||||||||||||||||
Net investment income | (0.25 | ) | (0.45 | ) | (0.43 | ) | (0.40 | ) | (0.40 | ) | (0.41) | |||||||||||||
Net realized gains | (0.48 | ) | (0.14 | ) | (0.20 | ) | (0.17 | ) | (— | )c | (0.16) | |||||||||||||
|
| |||||||||||||||||||||||
Total distributions | (0.73 | ) | (0.59 | ) | (0.63 | ) | (0.57 | ) | (0.40 | ) | (0.57 | ) | ||||||||||||
|
| |||||||||||||||||||||||
Net asset value, end of period | $11.51 | $12.85 | $11.93 | $12.39 | $11.67 | $11.42 | ||||||||||||||||||
|
| |||||||||||||||||||||||
Total returnd | (5.05)% | 13.14% | 1.23% | 11.33% | 5.90% | 0.81% | ||||||||||||||||||
| Ratios to average net assetse | ||||||||||||||||||||||||
Expenses before waiver and payments by affiliates | 0.60% | 0.63% | 0.68% | 0.71% | 0.73% | 0.70% | ||||||||||||||||||
Expenses net of waiver and payments by affiliatesf | 0.58% | 0.61% | 0.66% | 0.64% | 0.66% | 0.67% | ||||||||||||||||||
Net investment income | 2.83% | 2.69% | 2.56% | 3.08% | 2.97% | 2.95% | ||||||||||||||||||
| Supplemental data | ||||||||||||||||||||||||
Net assets, end of period (000’s) | $151,912 | $159,877 | $138,923 | $342 | $233 | $221 | ||||||||||||||||||
Portfolio turnover rate | 28.82% | 53.02% | 63.64% | 34.99% | 46.03% | 69.23% | ||||||||||||||||||
aThe amount shown for a share outstanding throughout the period may not correlate with the Statement of Operations for the period due to the timing of sales and repurchases of the Fund’s shares in relation to income earned and/or fluctuating fair value of the investments of the Fund.
bBased on average daily shares outstanding.
cAmount rounds to less than $0.01 per share.
dTotal return is not annualized for periods less than one year.
eRatios are annualized for periods less than one year.
fBenefit of expense reduction rounds to less than 0.01%.
44 | Semiannual Report | The accompanying notes are an integral part of these financial statements. | franklintempleton.com | ||
FRANKLIN INVESTORS SECURITIES TRUST
FINANCIAL HIGHLIGHTS
Franklin Managed Income Fund (continued)
| Six Months Ended April 30, 2020 | Year Ended October 31, | |||||||||||||||||||||||
| (unaudited) | 2019 | 2018 | 2017 | 2016 | 2015 | |||||||||||||||||||
| Advisor Class | ||||||||||||||||||||||||
| Per share operating performance (for a share outstanding throughout the period) | ||||||||||||||||||||||||
Net asset value, beginning of period | $12.84 | $11.92 | $12.39 | $11.67 | $11.42 | $11.88 | ||||||||||||||||||
|
| |||||||||||||||||||||||
| Income from investment operationsa: | ||||||||||||||||||||||||
Net investment incomeb | 0.17 | 0.32 | 0.30 | 0.35 | 0.29 | 0.33 | ||||||||||||||||||
Net realized and unrealized gains (losses) | (0.79) | 1.18 | (0.16) | 0.93 | 0.35 | (0.24) | ||||||||||||||||||
|
| |||||||||||||||||||||||
Total from investment operations | (0.62) | 1.50 | 0.14 | 1.28 | 0.64 | 0.09 | ||||||||||||||||||
|
| |||||||||||||||||||||||
Less distributions from: | ||||||||||||||||||||||||
Net investment income | (0.24) | (0.44) | (0.41) | (0.39) | (0.39) | (0.39) | ||||||||||||||||||
Net realized gains | (0.48) | (0.14) | (0.20) | (0.17) | (—) | c | (0.16) | |||||||||||||||||
|
| |||||||||||||||||||||||
Total distributions | (0.72) | (0.58) | (0.61) | (0.56) | (0.39) | (0.55) | ||||||||||||||||||
|
| |||||||||||||||||||||||
Net asset value, end of period | $11.50 | $12.84 | $11.92 | $12.39 | $11.67 | $11.42 | ||||||||||||||||||
|
| |||||||||||||||||||||||
Total returnd | (5.09)% | 12.96% | 1.14% | 11.21% | 5.79% | 0.81% | ||||||||||||||||||
| Ratios to average net assetse | ||||||||||||||||||||||||
Expenses before waiver and payments by affiliates | 0.67% | 0.71% | 0.77% | 0.77% | 0.77% | 0.77% | ||||||||||||||||||
Expenses net of waiver and payments by affiliatesf | 0.65% | 0.69% | 0.76% | 0.75% | 0.76% | 0.77% | g | |||||||||||||||||
Net investment income | 2.76% | 2.61% | 2.47% | 2.97% | 2.87% | 2.85% | ||||||||||||||||||
| Supplemental data | ||||||||||||||||||||||||
Net assets, end of period (000’s) | $164,352 | $180,882 | $124,265 | $243,674 | $138,111 | $54,881 | ||||||||||||||||||
Portfolio turnover rate | 28.82% | 53.02% | 63.64% | 34.99% | 46.03% | 69.23% | ||||||||||||||||||
aThe amount shown for a share outstanding throughout the period may not correlate with the Statement of Operations for the period due to the timing of sales and repurchases of the Fund’s shares in relation to income earned and/or fluctuating fair value of the investments of the Fund.
bBased on average daily shares outstanding.
cAmount rounds to less than $0.01 per share.
dTotal return is not annualized for periods less than one year.
eRatios are annualized for periods less than one year.
fBenefit of expense reduction rounds to less than 0.01%.
gBenefit of waiver and payments by affiliates rounds to less than 0.01%.
franklintempleton.com | The accompanying notes are an integral part of these financial statements. | Semiannual Report | 45 | ||||
FRANKLIN INVESTORS SECURITIES TRUST
Statement of Investments, April 30, 2020 (unaudited)
Franklin Managed Income Fund
| Country | Shares | Value | ||||||||||||
Common Stocks 36.5% | ||||||||||||||
Communication Services 3.1% | ||||||||||||||
| a | Comcast Corp., A | United States | 500,000 | $ | 18,815,000 | |||||||||
| b | Deutsche Telekom AG | Germany | 1,200,000 | 17,520,242 | ||||||||||
| a | Verizon Communications Inc. | United States | 1,000,000 | 57,450,000 | ||||||||||
Vodafone Group PLC | �� | United Kingdom | 10,000,000 | 14,123,472 | ||||||||||
|
| |||||||||||||
| 107,908,714 | ||||||||||||||
|
| |||||||||||||
| Consumer Discretionary 2.4% | ||||||||||||||
General Motors Co. | United States | 500,000 | 11,145,000 | |||||||||||
| a | The Home Depot Inc. | United States | 160,000 | 35,172,800 | ||||||||||
| a,b | Peloton Interactive Inc., A | United States | 500,000 | 15,750,000 | ||||||||||
| a | Target Corp. | United States | 200,000 | 21,948,000 | ||||||||||
|
| |||||||||||||
| 84,015,800 | ||||||||||||||
|
| |||||||||||||
| Consumer Staples 4.1% | ||||||||||||||
The Coca-Cola Co. | United States | 650,200 | 29,837,678 | |||||||||||
Nestle SA | Switzerland | 500,000 | 52,400,000 | |||||||||||
| a | PepsiCo Inc. | United States | 187,200 | 24,764,688 | ||||||||||
| a | The Procter & Gamble Co. | United States | 300,000 | 35,361,000 | ||||||||||
|
| |||||||||||||
| 142,363,366 | ||||||||||||||
|
| |||||||||||||
| Energy 3.3% | ||||||||||||||
BP PLC, ADR | United Kingdom | 1,100,000 | 26,180,000 | |||||||||||
Chevron Corp. | United States | 400,000 | 36,800,000 | |||||||||||
Exxon Mobil Corp. | United States | 600,000 | 27,882,000 | |||||||||||
Royal Dutch Shell PLC, A, ADR | United Kingdom | 775,000 | 25,675,750 | |||||||||||
|
| |||||||||||||
| 116,537,750 | ||||||||||||||
|
| |||||||||||||
| Financials 6.7% | ||||||||||||||
Bank of America Corp. | United States | 1,046,715 | 25,173,496 | |||||||||||
| a | BlackRock Inc. | United States | 50,000 | 25,102,000 | ||||||||||
JPMorgan Chase & Co. | United States | 500,000 | 47,880,000 | |||||||||||
| a | Morgan Stanley | United States | 875,000 | 34,501,250 | ||||||||||
| a | The Travelers Cos. Inc. | United States | 200,000 | 20,242,000 | ||||||||||
Truist Financial Corp. | United States | 500,000 | 18,660,000 | |||||||||||
U.S. Bancorp | United States | 800,000 | 29,200,000 | |||||||||||
Wells Fargo & Co. | United States | 1,100,000 | 31,955,000 | |||||||||||
|
| |||||||||||||
| 232,713,746 | ||||||||||||||
|
| |||||||||||||
| Health Care 6.5% | ||||||||||||||
| a | AbbVie Inc. | United States | 500,000 | 41,100,000 | ||||||||||
AstraZeneca PLC, ADR | United Kingdom | 1,100,000 | 57,508,000 | |||||||||||
CVS Health Corp. | United States | 170,000 | 10,463,500 | |||||||||||
| a | Johnson & Johnson | United States | 250,000 | 37,510,000 | ||||||||||
Pfizer Inc. | United States | 1,000,000 | 38,360,000 | |||||||||||
Quest Diagnostics Inc. | United States | 400,000 | 44,044,000 | |||||||||||
|
| |||||||||||||
| 228,985,500 | ||||||||||||||
|
| |||||||||||||
46 | Semiannual Report | franklintempleton.com | ||
FRANKLIN INVESTORS SECURITIES TRUST
STATEMENT OF INVESTMENTS (UNAUDITED)
Franklin Managed Income Fund (continued)
| Country | Shares | Value | ||||||||||||
Common Stocks (continued) | ||||||||||||||
Industrials 4.0% | ||||||||||||||
| Fastenal Co. | United States | 750,000 | $ | 27,165,000 | ||||||||||
| a | General Dynamics Corp. | United States | 200,000 | 26,124,000 | ||||||||||
| a | Honeywell International Inc. | United States | 225,000 | 31,927,500 | ||||||||||
| a | Northrop Grumman Corp. | United States | 42,900 | 14,185,743 | ||||||||||
| Raytheon Technologies Corp. | United States | 607,048 | 39,342,781 | |||||||||||
|
| |||||||||||||
| 138,745,024 | ||||||||||||||
|
| |||||||||||||
| Information Technology 3.6% | ||||||||||||||
| a | Analog Devices Inc. | United States | 350,000 | 38,360,000 | ||||||||||
| a | Intel Corp. | United States | 685,000 | 41,086,300 | ||||||||||
| a | International Business Machines Corp. | United States | 200,000 | 25,112,000 | ||||||||||
| a | Texas Instruments Inc. | United States | 197,000 | 22,865,790 | ||||||||||
|
| |||||||||||||
| 127,424,090 | ||||||||||||||
|
| |||||||||||||
| Real Estate 0.7% | ||||||||||||||
| Host Hotels & Resorts Inc. | United States | 2,000,000 | 24,620,000 | |||||||||||
|
| |||||||||||||
| Utilities 2.1% | ||||||||||||||
| a | Dominion Energy Inc. | United States | 500,000 | 38,565,000 | ||||||||||
| DTE Energy Co. | United States | 200,000 | 20,748,000 | |||||||||||
| Duke Energy Corp. | United States | 175,000 | 14,815,500 | |||||||||||
|
| |||||||||||||
| 74,128,500 | ||||||||||||||
|
| |||||||||||||
| Total Common Stocks (Cost $1,159,597,933) | 1,277,442,490 | |||||||||||||
|
| |||||||||||||
| Management Investment Companies 2.8% | ||||||||||||||
| Financials 2.8% | ||||||||||||||
| c | Franklin FTSE United Kingdom ETF | United States | 2,000,000 | 37,840,000 | ||||||||||
| c | Franklin Liberty Systematic Style Premia ETF | United States | 1,175,000 | 26,061,500 | ||||||||||
| c | Franklin Liberty U.S. Low Volatility ETF | United States | 1,000,000 | 34,540,000 | ||||||||||
|
| |||||||||||||
Total Management Investment Companies | 98,441,500 | |||||||||||||
|
| |||||||||||||
| d | Equity-Linked Securities 14.1% | |||||||||||||
| Consumer Discretionary 2.6% | ||||||||||||||
| e | Goldman Sachs International into Amazon.com Inc., 7.50%, 144A | United States | 38,000 | 72,318,190 | ||||||||||
| e | JPMorgan Chase Bank NA into Target Corp., 9.00%, 144A | United States | 190,000 | 20,376,986 | ||||||||||
|
| |||||||||||||
| 92,695,176 | ||||||||||||||
|
| |||||||||||||
| Energy 0.4% | ||||||||||||||
| e | Societe Generale SA into Schlumberger Ltd., 2.312%, 144A | United States | 715,000 | 13,876,876 | ||||||||||
|
| |||||||||||||
| Financials 1.6% | ||||||||||||||
| e | Barclays Bank PLC into Bank of America Corp., 8.50%, 144A | United States | 750,000 | 18,917,614 | ||||||||||
| e,f | Credit Suisse AG London into The Charles Schwab Corp., 6.50%, 144A | United States | 1,007,000 | 36,726,085 | ||||||||||
|
| |||||||||||||
| 55,643,699 | ||||||||||||||
|
| |||||||||||||
| Health Care 0.6% | ||||||||||||||
| e | UBS AG London into CVS Health Corp., 8.50%, 144A | United States | 350,000 | 20,427,030 | ||||||||||
|
| |||||||||||||
franklintempleton.com | Semiannual Report | 47 | ||||
FRANKLIN INVESTORS SECURITIES TRUST
STATEMENT OF INVESTMENTS (UNAUDITED)
Franklin Managed Income Fund (continued)
| Country | Shares | Value | ||||||||||||
| d | Equity-Linked Securities (continued) | |||||||||||||
| Information Technology 8.9% | ||||||||||||||
| e | Barclays Bank PLC into Broadcom Inc., 10.00%, 144A | United States | 130,000 | $ | 35,956,371 | |||||||||
| e | Citigroup Global Markets Holdings Inc. into Cisco Systems Inc., 7.00%, 144A | United States | 743,000 | 31,860,271 | ||||||||||
| e | JPMorgan Chase Bank NA into Apple Inc., 7.00%, 144A | United States | 320,000 | 71,542,137 | ||||||||||
| e | Merrill Lynch International & Co. C.V. into Microsoft Corp., 6.00%, 144A | United States | 340,000 | 49,337,356 | ||||||||||
| e | Royal Bank of Canada into Intel Corp., 8.00%, 144A | United States | 800,000 | 41,575,301 | ||||||||||
| e | Wells Fargo Bank National Assn. into NVIDIA Corp., 10.00%, 144A | United States | 260,000 | 47,335,802 | ||||||||||
| e | Wells Fargo Bank National Assn. into Texas Instruments Inc., 7.50%, 144A | United States | 300,000 | 35,107,165 | ||||||||||
|
| |||||||||||||
| 312,714,403 | ||||||||||||||
|
| |||||||||||||
| Total Equity-Linked Securities (Cost $498,155,115) | 495,357,184 | |||||||||||||
|
| |||||||||||||
| Convertible Preferred Stocks 6.0% | ||||||||||||||
| Health Care 0.3% | ||||||||||||||
| Change Healthcare Inc., 6.00%, cvt. pfd. | United States | 215,000 | 9,945,900 | |||||||||||
|
| |||||||||||||
| Information Technology 0.7% | ||||||||||||||
| Broadcom Inc., 8.00%, cvt. pfd., A | United States | 25,000 | 25,436,000 | |||||||||||
|
| |||||||||||||
| Materials 0.3% | ||||||||||||||
| International Flavors & Fragrances Inc., 6.00%, cvt. pfd. | United States | 250,000 | 11,887,500 | |||||||||||
|
| |||||||||||||
| Utilities 4.7% | ||||||||||||||
| American Electric Power Co. Inc., 6.125%, cvt. pfd. | United States | 250,000 | 12,700,000 | |||||||||||
| Dominion Energy Inc., 7.25%, cvt. pfd., A | United States | 250,000 | 24,557,500 | |||||||||||
| DTE Energy Co., 6.25%, cvt. pfd. | United States | 500,000 | 20,900,000 | |||||||||||
| b | NextEra Energy Inc., 5.279%, cvt. pfd. | United States | 750,000 | 32,392,500 | ||||||||||
| Sempra Energy, 6.00%, cvt. pfd., A | United States | 250,000 | 25,577,500 | |||||||||||
| The Southern Co., 6.75%, cvt. pfd. | United States | 1,000,000 | 47,340,000 | |||||||||||
|
| |||||||||||||
| 163,467,500 | ||||||||||||||
|
| |||||||||||||
| Total Convertible Preferred Stocks (Cost $210,454,536) | 210,736,900 | |||||||||||||
|
| |||||||||||||
| Preferred Stocks (Cost $11,727,500) 0.4% | ||||||||||||||
| Financials 0.4% | ||||||||||||||
| JPMorgan Chase & Co., 6.00%, pfd., EE, 6/01/67 | United States | 469,100 | 12,825,194 | |||||||||||
|
| |||||||||||||
| | Principal Amount | * | ||||||||||||
| Corporate Bonds 30.4% | ||||||||||||||
| Communication Services 3.1% | ||||||||||||||
| e | CCO Holdings LLC/CCO Holdings Capital Corp., senior bond, 144A, 5.125%, 5/01/27 | United States | $ | 15,000,000 | 15,645,000 | |||||||||
| DISH DBS Corp., senior bond, 5.875%, 7/15/22 | United States | 12,000,000 | 12,164,400 | |||||||||||
| e | Sirius XM Radio Inc., senior bond, 144A, 5.375%, 4/15/25 | United States | 15,000,000 | 15,543,750 | ||||||||||
| Sprint Corp., senior note, 7.625%, 2/15/25 | United States | 10,000,000 | 11,613,500 | |||||||||||
| e | Sprint Spectrum Co. LLC/Sprint Spectrum Co. II LLC, senior secured bond, first lien, 144A, | United States | 25,000,000 | 26,495,000 | ||||||||||
| e | T-Mobile USA Inc., senior secured bond, 144A, 3.875%, 4/15/30 | United States | 25,000,000 | 27,471,250 | ||||||||||
|
| |||||||||||||
| 108,932,900 | ||||||||||||||
|
| |||||||||||||
48 | Semiannual Report | franklintempleton.com | ||
FRANKLIN INVESTORS SECURITIES TRUST
STATEMENT OF INVESTMENTS (UNAUDITED)
Franklin Managed Income Fund (continued)
| Country | | Principal Amount | * | Value | ||||||||||
Corporate Bonds (continued) | ||||||||||||||
| Consumer Discretionary 3.3% | ||||||||||||||
Dollar General Corp., senior bond, 3.875%, 4/15/27 | United States | $ | 10,000,000 | $ | 11,024,978 | |||||||||
| Dollar Tree Inc., senior note, 4.00%, 5/15/25 | United States | 15,000,000 | 16,222,821 | |||||||||||
| Ford Motor Credit Co. LLC, senior note, 5.113%, 5/03/29 | United States | 25,000,000 | 21,687,500 | |||||||||||
| Las Vegas Sands Corp., senior bond, 3.90%, 8/08/29 | United States | 10,000,000 | 9,232,066 | |||||||||||
| NIKE Inc., senior bond, 2.375%, 11/01/26 | United States | 20,000,000 | 21,435,677 | |||||||||||
| e | Nordstrom Inc., senior note, 144A, 8.75%, 5/15/25 | United States | 15,000,000 | 16,109,130 | ||||||||||
| e | Vail Resorts Inc, senior note, 144A, 6.25%, 5/15/25 | United States | 10,000,000 | 10,375,000 | ||||||||||
| e | Wynn Las Vegas LLC/Wynn Las Vegas Capital Corp., senior bond, 144A, 5.50%, 3/01/25 | United States | 10,000,000 | 8,962,000 | ||||||||||
|
| |||||||||||||
| 115,049,172 | ||||||||||||||
|
| |||||||||||||
| Consumer Staples 3.2% | ||||||||||||||
| Anheuser-Busch Cos. LLC/InBev Worldwide Inc., senior bond, 4.90%, 2/01/46 | Belgium | 10,000,000 | 11,506,191 | |||||||||||
| BAT Capital Corp., senior note, 3.557%, 8/15/27 | United Kingdom | 15,000,000 | 15,432,836 | |||||||||||
| The Clorox Co., senior bond, 3.10%, 10/01/27 | United States | 5,000,000 | 5,528,368 | |||||||||||
| The Procter & Gamble Co., senior note, 2.70%, 2/02/26 | United States | 25,000,000 | 27,359,704 | |||||||||||
| Reynolds American Inc., senior note, 4.45%, 6/12/25 | United Kingdom | 15,000,000 | 16,326,285 | |||||||||||
| Tyson Foods Inc., senior bond, 3.95%, 8/15/24 | United States | 12,100,000 | 13,269,202 | |||||||||||
| Walmart Inc., senior bond, 3.25%, 7/08/29 | United States | 20,000,000 | 22,830,272 | |||||||||||
|
| |||||||||||||
| 112,252,858 | ||||||||||||||
|
| |||||||||||||
| Energy 0.4% | ||||||||||||||
| e | Calumet Specialty Products Partners LP/Calumet Finance Corp., senior note, 144A, 11.00%, 4/15/25 | United States | 20,000,000 | 15,625,000 | ||||||||||
|
| |||||||||||||
| Financials 4.4% | ||||||||||||||
| Bank of America Corp., | ||||||||||||||
senior bond, 3.419% to 12/20/27, FRN thereafter, 12/20/28 | United States | 15,000,000 | 16,096,352 | |||||||||||
sub. bond, 4.183%, 11/25/27 | United States | 10,000,000 | 10,910,073 | |||||||||||
| Barclays PLC, senior note, 3.65%, 3/16/25 | United Kingdom | 15,000,000 | 15,657,900 | |||||||||||
| Capital One Financial Corp., | ||||||||||||||
senior note, 3.75%, 3/09/27 | United States | 10,000,000 | 10,197,357 | |||||||||||
sub. note, 3.75%, 7/28/26 | United States | 10,000,000 | 9,932,895 | |||||||||||
| Citigroup Inc., sub. bond, 4.125%, 7/25/28 | United States | 20,000,000 | 21,616,247 | |||||||||||
| The Goldman Sachs Group Inc., senior note, 3.50%, 11/16/26 | United States | 15,000,000 | 15,943,397 | |||||||||||
| e | Liberty Mutual Group Inc., senior note, 144A, 4.95%, 5/01/22 | United States | 7,100,000 | 7,496,775 | ||||||||||
| Morgan Stanley, senior sub. bond, 4.35%, 9/08/26 | United States | 15,000,000 | 16,546,772 | |||||||||||
| Prudential Financial Inc., junior sub. bond, 5.70% to 9/15/28, FRN thereafter, 9/15/48 | United States | 5,400,000 | 5,568,745 | |||||||||||
| g | Truist Financial Corp., junior sub. bond, 4.80% to 9/01/24, FRN thereafter, Perpetual | United States | 25,000,000 | 23,388,875 | ||||||||||
|
| |||||||||||||
| 153,355,388 | ||||||||||||||
|
| |||||||||||||
| Health Care 7.5% | ||||||||||||||
| Anthem Inc., senior bond, 3.65%, 12/01/27 | United States | 10,000,000 | 10,925,049 | |||||||||||
| e | Bausch Health Cos. Inc., | |||||||||||||
senior bond, 144A, 6.125%, 4/15/25 | United States | 6,300,000 | 6,399,698 | |||||||||||
senior secured note, first lien, 144A, 5.50%, 11/01/25 | United States | 10,000,000 | 10,445,000 | |||||||||||
franklintempleton.com | Semiannual Report | 49 | ||||
FRANKLIN INVESTORS SECURITIES TRUST
STATEMENT OF INVESTMENTS (UNAUDITED)
Franklin Managed Income Fund (continued)
| Country | | Principal Amount | * | Value | ||||||||||
Corporate Bonds (continued) | ||||||||||||||
| Health Care (continued) | ||||||||||||||
| e | Bayer U.S. Finance II LLC, senior note, 144A, 4.25%, 12/15/25 | Germany | $ | 15,000,000 | $ | 16,634,890 | ||||||||
| e | Bristol-Myers Squibb Co., | |||||||||||||
senior bond, 144A, 3.40%, 7/26/29 | United States | 10,000,000 | 11,442,264 | |||||||||||
senior bond, 144A, 4.25%, 10/26/49 | United States | 10,000,000 | 13,069,364 | |||||||||||
| e | Centene Corp., senior bond, 144A, 4.625%, 12/15/29 | United States | 20,000,000 | 21,993,000 | ||||||||||
| e | CHS/Community Health Systems Inc., | |||||||||||||
senior note, 144A, 9.875%, 6/30/23 | United States | 5,000,000 | 3,714,000 | |||||||||||
senior secured note, 144A, 6.625%, 2/15/25 | United States | 25,000,000 | 23,093,750 | |||||||||||
senior secured note, 144A, 8.00%, 3/15/26 | United States | 30,000,000 | 28,898,400 | |||||||||||
Cigna Corp., | ||||||||||||||
senior note, 3.75%, 7/15/23 | United States | 13,292,000 | 14,200,113 | |||||||||||
e senior note, 144A, 3.40%, 3/01/27 | United States | 15,000,000 | 16,053,092 | |||||||||||
CVS Health Corp., | ||||||||||||||
senior bond, 5.05%, 3/25/48 | United States | 15,000,000 | 18,938,753 | |||||||||||
senior note, 3.875%, 7/20/25 | United States | 15,000,000 | 16,430,244 | |||||||||||
Edwards Lifesciences Corp., senior note, 4.30%, 6/15/28 | United States | 9,700,000 | 11,107,144 | |||||||||||
Mylan Inc., senior bond, 4.55%, 4/15/28 | United States | 19,000,000 | 20,859,147 | |||||||||||
Tenet Healthcare Corp., senior secured note, first lien, 4.625%, 7/15/24 | United States | 17,000,000 | 16,860,600 | |||||||||||
|
| |||||||||||||
| 261,064,508 | ||||||||||||||
|
| |||||||||||||
| Industrials 2.0% | ||||||||||||||
| e | Ashtead Capital Inc., secured note, second lien, 144A, 4.125%, 8/15/25 | United Kingdom | 21,000,000 | 20,842,500 | ||||||||||
CNH Industrial NV, senior bond, 3.85%, 11/15/27 | United Kingdom | 7,500,000 | 7,496,304 | |||||||||||
Lockheed Martin Corp., senior bond, 3.55%, 1/15/26 | United States | 20,000,000 | 22,463,939 | |||||||||||
United Rentals North America Inc., senior note, 4.625%, 10/15/25 | United States | 20,000,000 | 19,696,000 | |||||||||||
|
| |||||||||||||
| 70,498,743 | ||||||||||||||
|
| |||||||||||||
| Information Technology 2.3% | ||||||||||||||
| e | CommScope Technologies LLC, senior bond, 144A, 5.00%, 3/15/27 | United States | 20,000,000 | 17,226,000 | ||||||||||
| e | Dell International LLC/EMC Corp., senior secured note, first lien, 144A, 4.42%, 6/15/21 | United States | 18,000,000 | 18,355,251 | ||||||||||
Fiserv Inc., senior bond, 4.20%, 10/01/28 | United States | 20,000,000 | 22,816,688 | |||||||||||
Microchip Technology Inc., senior secured note, 4.333%, 6/01/23 | United States | 15,000,000 | 15,565,575 | |||||||||||
Xilinx Inc., senior note, 2.95%, 6/01/24 | United States | 6,000,000 | 6,335,774 | |||||||||||
|
| |||||||||||||
| 80,299,288 | ||||||||||||||
|
| |||||||||||||
| Materials 1.9% | ||||||||||||||
| e | Cleveland-Cliffs Inc., secured note, 144A, 9.875%, 10/17/25 | United States | 15,000,000 | 14,887,500 | ||||||||||
DuPont de Nemours Inc., senior note, 4.493%, 11/15/25 | United States | 20,000,000 | 22,044,876 | |||||||||||
Freeport-McMoRan Inc., senior bond, 5.25%, 9/01/29 | United States | 10,000,000 | 9,921,500 | |||||||||||
| e | Syngenta Finance NV, senior note, 144A, 5.182%, 4/24/28 | Switzerland | 20,000,000 | 20,272,469 | ||||||||||
|
| |||||||||||||
| 67,126,345 | ||||||||||||||
|
| |||||||||||||
| Real Estate 1.4% | ||||||||||||||
American Tower Corp., senior bond, 3.375%, 10/15/26 | United States | 15,000,000 | 16,171,888 | |||||||||||
Healthpeak Properties Inc., senior bond, 3.875%, 8/15/24 | United States | 5,000,000 | 5,149,895 | |||||||||||
Prologis LP, senior note, 4.25%, 8/15/23 | United States | 12,000,000 | 13,093,092 | |||||||||||
Realty Income Corp., senior bond, 3.875%, 7/15/24 | United States | 15,000,000 | 15,858,682 | |||||||||||
|
| |||||||||||||
| 50,273,557 | ||||||||||||||
|
| |||||||||||||
50 |
Semiannual Report |
franklintempleton.com | ||
FRANKLIN INVESTORS SECURITIES TRUST
STATEMENT OF INVESTMENTS (UNAUDITED)
Franklin Managed Income Fund (continued)
| Country | | Principal Amount | * | Value | ||||||||||
Corporate Bonds (continued) | ||||||||||||||
| Utilities 0.9% | ||||||||||||||
Duke Energy Corp., senior bond, 3.15%, 8/15/27 | United States | $ | 10,000,000 | $ | 10,675,306 | |||||||||
| e | Vistra Operations Co. LLC, senior secured bond, first lien, 144A, 4.30%, 7/15/29 | United States | 20,000,000 | 19,915,954 | ||||||||||
|
| |||||||||||||
| 30,591,260 | ||||||||||||||
|
| |||||||||||||
| Total Corporate Bonds (Cost $1,006,879,593) | 1,065,069,019 | |||||||||||||
|
| |||||||||||||
| U.S. Government and Agency Securities 4.5% | ||||||||||||||
U.S. Treasury Note, | ||||||||||||||
2.75%, 9/30/20 | United States | 50,000,000 | 50,544,922 | |||||||||||
2.75%, 9/15/21 | United States | 50,000,000 | 51,762,696 | |||||||||||
2.875%, 10/31/23 | United States | 50,000,000 | 54,494,140 | |||||||||||
|
| |||||||||||||
Total U.S. Government and Agency Securities | 156,801,758 | |||||||||||||
|
| |||||||||||||
Mortgage-Backed Securities 3.8% | ||||||||||||||
Federal Home Loan Mortgage Corp. (FHLMC) Fixed Rate 0.1% | ||||||||||||||
FHLMC 30 Year, 4.00%, 10/01/49 | United States | 1,966,677 | 2,097,690 | |||||||||||
|
| |||||||||||||
Federal National Mortgage Association (FNMA) Fixed Rate 1.3% | ||||||||||||||
FNMA 30 Year, 4.00%, 8/01/49 - 2/01/50 | United States | 11,698,681 | 12,579,004 | |||||||||||
FNMA 30 Year, 4.00%, 12/01/49 | United States | 30,801,174 | 32,853,051 | |||||||||||
|
| |||||||||||||
| 45,432,055 | ||||||||||||||
|
| |||||||||||||
Government National Mortgage Association (GNMA) Fixed Rate 2.4% | ||||||||||||||
GNMA II SF 30 Year, 3.50%, 11/20/49 | United States | 40,930,521 | 43,539,490 | |||||||||||
GNMA II SF 30 Year, 3.50%, 12/20/49 | United States | 2,840,806 | 3,025,280 | |||||||||||
GNMA II SF 30 Year, 4.00%, 9/20/49 - 12/20/49 | United States | 9,908,196 | 10,558,832 | |||||||||||
GNMA II SF 30 Year, 4.00%, 11/20/49 | United States | 26,212,104 | 27,930,311 | |||||||||||
|
| |||||||||||||
| 85,053,913 | ||||||||||||||
|
| |||||||||||||
Total Mortgage-Backed Securities | 132,583,658 | |||||||||||||
|
| |||||||||||||
| Number of Contracts | Notional Amount | |||||||||||||
|
|
|
| |||||||||||
Options Purchased 0.7% | ||||||||||||||
Puts - Exchange-Traded | ||||||||||||||
SPDR S&P 500 ETF Trust, December Strike Price $280.00, Expires 12/18/20 | 5,000 | 500,000 | 12,055,000 | |||||||||||
SPDR S&P 500 ETF Trust, July Strike Price $285.00, Expires 7/17/20 | 10,000 | 1,000,000 | 14,300,000 | |||||||||||
|
| |||||||||||||
Total Options Purchased | 26,355,000 | |||||||||||||
|
| |||||||||||||
Total Investments before Short Term Investments | 3,475,612,703 | |||||||||||||
|
| |||||||||||||
franklintempleton.com | Semiannual Report | 51 | ||||
FRANKLIN INVESTORS SECURITIES TRUST
STATEMENT OF INVESTMENTS (UNAUDITED)
Franklin Managed Income Fund (continued)
| Country | Shares | Value | ||||||||||||
Short Term Investments (Cost $76,785,972) 2.2% | ||||||||||||||
| Money Market Funds 2.2% | ||||||||||||||
| c,h | Institutional Fiduciary Trust Money Market Portfolio, 0.01% | United States | 76,785,972 | $ | 76,785,972 | |||||||||
|
| |||||||||||||
Total Investments (Cost $3,387,339,945) 101.4% | 3,552,398,675 | |||||||||||||
Options Written (0.2)% | (6,050,214 | ) | ||||||||||||
Other Assets, less Liabilities (1.2)% | (42,809,847 | ) | ||||||||||||
|
| |||||||||||||
Net Assets 100.0% | $ | 3,503,538,614 | ||||||||||||
|
| |||||||||||||
| Number of Contracts | Notional Amount | |||||||||||||
|
|
|
| |||||||||||
| i | Options Written (0.2)% | |||||||||||||
Calls - Exchange-Traded | ||||||||||||||
AbbVie Inc., June Strike Price $90.00, Expires 6/19/20 | 2,500 | 250,000 | (310,000 | ) | ||||||||||
Analog Devices Inc., June Strike Price $135.00, Expires 6/19/20 | 3,500 | 350,000 | (105,000 | ) | ||||||||||
BlackRock Inc., May Strike Price $500.00, Expires 5/15/20 | 500 | 50,000 | (825,000 | ) | ||||||||||
Comcast Corp., July Strike Price $45.00, A, Expires 7/17/20 | 2,500 | 250,000 | (50,000 | ) | ||||||||||
Dominion Energy Inc., May Strike Price $85.00, Expires 5/15/20 | 2,500 | 250,000 | (37,500 | ) | ||||||||||
General Dynamics Corp., May Strike Price $155.00, Expires 5/15/20 | 2,000 | 200,000 | (6,000 | ) | ||||||||||
The Home Depot Inc., May Strike Price $220.00, Expires 5/15/20 | 1,600 | 160,000 | (1,038,400 | ) | ||||||||||
Honeywell International Inc., June Strike Price $165.00, Expires 6/19/20 | 2,250 | 225,000 | (191,250 | ) | ||||||||||
Intel Corp., June Strike Price $65.00, Expires 6/19/20 | 3,000 | 300,000 | (366,000 | ) | ||||||||||
International Business Machines Corp., June Strike Price $135.00, Expires 6/19/20 | 2,000 | 200,000 | (390,000 | ) | ||||||||||
Johnson & Johnson, May Strike Price $150.00, Expires 5/15/20 | 2,500 | 250,000 | (737,500 | ) | ||||||||||
Morgan Stanley, June Strike Price $48.00, Expires 6/19/20 | 4,000 | 400,000 | (116,000 | ) | ||||||||||
Northrop Grumman Corp., May Strike Price $375.00, Expires 5/15/20 | 429 | 42,900 | (2,574 | ) | ||||||||||
Peloton Interactive Inc., July Strike Price $45.00, A, Expires 7/17/20 | 5,000 | 500,000 | (585,000 | ) | ||||||||||
PepsiCo Inc., May Strike Price $155.00, Expires 5/15/20 | 1,800 | 180,000 | (1,800 | ) | ||||||||||
The Procter & Gamble Co., June Strike Price $130.00, Expires 6/19/20 | 3,000 | 300,000 | (198,000 | ) | ||||||||||
Target Corp., June Strike Price $120.00, Expires 6/19/20 | 2,000 | 200,000 | (482,000 | ) | ||||||||||
Texas Instruments Inc., June Strike Price $125.00, Expires 6/19/20 | 1,970 | 197,000 | (53,190 | ) | ||||||||||
The Travelers Cos. Inc., July Strike Price $115.00, Expires 7/17/20 | 1,000 | 100,000 | (145,000 | ) | ||||||||||
Verizon Communications Inc., June Strike Price $60.00, Expires 6/19/20 | 5,000 | 500,000 | (410,000 | ) | ||||||||||
|
| |||||||||||||
Total Options Written (Premiums received $6,856,387) | $ | (6,050,214 | ) | |||||||||||
|
| |||||||||||||
See Abbreviations on page 74.
*The principal amount is stated in U.S. dollars unless otherwise indicated.
aA portion or all of the security is held in connection with written option contracts open at period end.
bNon-income producing.
cSee Note 3(f) regarding investments in affiliated management investment companies.
dSee Note 1(e) regarding equity-linked securities.
eSecurity was purchased pursuant to Rule 144A under the Securities Act of 1933 and may be sold in transactions exempt from registration only to qualified institutional buyers or in a public offering registered under the Securities Act of 1933. At April 30, 2020, the aggregate value of these securities was $902,323,221, representing 25.8% of net assets.
fSecurity purchased on a delayed delivery basis. See Note 1(c).
gPerpetual security with no stated maturity date.
hThe rate shown is the annualized seven-day effective yield at period end.
iSee Note 1(d) regarding written options.
52 | Semiannual Report | The accompanying notes are an integral part of these financial statements. | franklintempleton.com | ||
FRANKLIN INVESTORS SECURITIES TRUST
Statements of Assets and Liabilities
April 30, 2020 (unaudited)
| Franklin Convertible Securities Fund | Franklin Equity Income Fund | Franklin Managed Income Fund | ||||||||||
| ||||||||||||
Assets: | ||||||||||||
Investments in securities: | ||||||||||||
Cost - Unaffiliated issuers | $3,014,630,355 | $1,830,065,273 | $3,197,907,410 | |||||||||
Cost - Controlled affiliates (Note 3f) | — | — | 112,646,563 | |||||||||
Cost - Non-controlled affiliates (Note 3f) | 54,630,045 | 38,078,591 | 76,785,972 | |||||||||
|
| |||||||||||
Value - Unaffiliated issuers | $3,422,553,004 | $2,230,034,990 | $3,377,171,203 | |||||||||
Value - Controlled affiliates (Note 3f) | — | — | 98,441,500 | |||||||||
Value - Non-controlled affiliates (Note 3f) | 54,630,045 | 38,078,591 | 76,785,972 | |||||||||
Receivables: | ||||||||||||
Investment securities sold | — | 5,932,482 | 19,661,971 | |||||||||
Capital shares sold | 7,661,463 | 2,135,746 | 4,344,352 | |||||||||
Dividends and interest | 11,121,812 | 2,702,526 | 15,492,388 | |||||||||
European Union tax reclaims | — | 63,183 | 87,911 | |||||||||
Other assets | 4,140 | 2,703 | 3,964 | |||||||||
|
| |||||||||||
Total assets | 3,495,970,464 | 2,278,950,221 | 3,591,989,261 | |||||||||
|
| |||||||||||
Liabilities: | ||||||||||||
Payables: | ||||||||||||
Investment securities purchased | — | 3,699,428 | 76,440,908 | |||||||||
Capital shares redeemed | 5,805,956 | 1,798,255 | 2,952,141 | |||||||||
Management fees | 1,315,305 | 861,604 | 1,497,172 | |||||||||
Distribution fees | 383,934 | 498,945 | 893,148 | |||||||||
Transfer agent fees | 663,108 | 293,738 | 384,681 | |||||||||
Trustees’ fees and expenses | 1,973 | 164 | 529 | |||||||||
Options written, at value (premiums received $—, $— and $6,856,387, respectively) | — | — | 6,050,214 | |||||||||
Accrued expenses and other liabilities | 231,229 | 137,615 | 231,854 | |||||||||
|
| |||||||||||
Total liabilities | 8,401,505 | 7,289,749 | 88,450,647 | |||||||||
|
| |||||||||||
Net assets, at value | $3,487,568,959 | $2,271,660,472 | $3,503,538,614 | |||||||||
|
| |||||||||||
Net assets consist of: | ||||||||||||
Paid-in capital | $3,055,742,174 | $1,844,312,137 | $3,394,685,253 | |||||||||
Total distributable earnings (losses) | 431,826,785 | 427,348,335 | 108,853,361 | |||||||||
|
| |||||||||||
Net assets, at value | $3,487,568,959 | $2,271,660,472 | $3,503,538,614 | |||||||||
|
| |||||||||||
franklintempleton.com | The accompanying notes are an integral part of these financial statements. | Semiannual Report | 53 | ||||
FRANKLIN INVESTORS SECURITIES TRUST
FINANCIAL STATEMENTS
Statements of Assets and Liabilities (continued)
April 30, 2020 (unaudited)
| Franklin Convertible Securities Fund | Franklin Equity Income Fund | Franklin Managed Income Fund | ||||||||||
| Class A: | ||||||||||||
Net assets, at value | $1,087,247,849 | $1,822,076,799 | $2,760,082,227 | |||||||||
|
| |||||||||||
Shares outstanding | 51,650,119 | 80,219,993 | 240,615,405 | |||||||||
|
| |||||||||||
Net asset value per sharea | $21.05 | $22.71 | $11.47 | |||||||||
|
| |||||||||||
Maximum offering price per share (net asset value per share ÷ 94.50%) | $22.28 | $24.03 | $12.14 | |||||||||
|
| |||||||||||
| Class C: | ||||||||||||
Net assets, at value | $ 225,599,810 | $ 174,692,934 | $ 423,454,185 | |||||||||
|
| |||||||||||
Shares outstanding | 10,896,667 | 7,750,932 | 37,307,645 | |||||||||
|
| |||||||||||
Net asset value and maximum offering price per sharea | $20.70 | $22.54 | $11.35 | |||||||||
|
| |||||||||||
| Class R: | ||||||||||||
Net assets, at value | $ 5,747,625 | $ 3,738,162 | ||||||||||
|
| |||||||||||
Shares outstanding | 252,908 | 324,928 | ||||||||||
|
| |||||||||||
Net asset value and maximum offering price per share | $22.73 | $11.50 | ||||||||||
|
| |||||||||||
| Class R6: | ||||||||||||
Net assets, at value | $ 82,894,759 | $ 88,888,863 | $ 151,911,895 | |||||||||
|
| |||||||||||
Shares outstanding | 3,911,730 | 3,906,494 | 13,199,084 | |||||||||
|
| |||||||||||
Net asset value and maximum offering price per share | $21.19 | $22.75 | $11.51 | |||||||||
|
| |||||||||||
| Advisor Class: | ||||||||||||
Net assets, at value | $2,091,826,541 | $ 180,254,251 | $ 164,352,145 | |||||||||
|
| |||||||||||
Shares outstanding | 99,364,064 | 7,924,101 | 14,289,781 | |||||||||
|
| |||||||||||
Net asset value and maximum offering price per share | $21.05 | $22.75 | $11.50 | |||||||||
|
| |||||||||||
aRedemption price is equal to net asset value less contingent deferred sales charges, if applicable.
54 | Semiannual Report | The accompanying notes are an integral part of these financial statements. | franklintempleton.com | ||
FRANKLIN INVESTORS SECURITIES TRUST
FINANCIAL STATEMENTS
Statements of Operations
for the six months ended April 30, 2020 (unaudited)
| Franklin Convertible Securities Fund | Franklin Equity Income Fund | Franklin Managed Income Fund | ||||||||||
| ||||||||||||
Investment income: | ||||||||||||
Dividends: (net of foreign taxes)* | ||||||||||||
Unaffiliated issuers | $ | 19,637,567 | $ 33,377,940 | $ | 25,543,561 | |||||||
Controlled affiliates (Note 3f) | — | — | 265,700 | |||||||||
Non-controlled affiliates (Note 3f) | 435,821 | 196,676 | 774,033 | |||||||||
Interest: | ||||||||||||
Unaffiliated issuers | 16,445,069 | — | 36,469,951 | |||||||||
Income from securities loaned: | ||||||||||||
Unaffiliated entities (net of fees and rebates) | 18,945 | 229 | 3,901 | |||||||||
Non-controlled affiliates (Note 3f) | 17,040 | 82 | 745 | |||||||||
|
| |||||||||||
Total investment income | 36,554,442 | 33,574,927 | 63,057,891 | |||||||||
|
| |||||||||||
Expenses: | ||||||||||||
Management fees (Note 3a) | 8,555,055 | 5,586,531 | 10,147,656 | |||||||||
Distribution fees: (Note 3c) | ||||||||||||
Class A | 1,438,672 | 2,470,844 | 3,632,217 | |||||||||
Class C | 1,225,255 | 995,702 | 2,323,824 | |||||||||
Class R | — | 16,084 | 9,579 | |||||||||
Transfer agent fees: (Note 3e) | ||||||||||||
Class A | 668,502 | 1,106,588 | 1,459,940 | |||||||||
Class C | 142,342 | 111,504 | 233,535 | |||||||||
Class R | — | 3,783 | 1,937 | |||||||||
Class R6 | 12,996 | 19,230 | 24,885 | |||||||||
Advisor Class | 1,324,047 | 100,062 | 86,473 | |||||||||
Custodian fees (Note 4) | 14,413 | 15,273 | 19,568 | |||||||||
Reports to shareholders | 154,435 | 88,406 | 119,994 | |||||||||
Registration and filing fees | 95,274 | 89,565 | 89,389 | |||||||||
Professional fees | 38,380 | 36,034 | 49,399 | |||||||||
Trustees’ fees and expenses | 22,563 | 13,046 | 20,131 | |||||||||
Other | 37,086 | 27,257 | 32,307 | |||||||||
|
| |||||||||||
Total expenses | 13,729,020 | 10,679,909 | 18,250,834 | |||||||||
Expense reductions (Note 4) | (1,194 | ) | (92 | ) | (3,426 | ) | ||||||
Expenses waived/paid by affiliates (Note 3f and 3g) | (143,903 | ) | (70,682 | ) | (305,597 | ) | ||||||
|
| |||||||||||
Net expenses | 13,583,923 | 10,609,135 | 17,941,811 | |||||||||
|
| |||||||||||
Net investment income | 22,970,519 | 22,965,792 | 45,116,080 | |||||||||
|
| |||||||||||
Realized and unrealized gains (losses): | ||||||||||||
Net realized gain (loss) from: | ||||||||||||
Investments: | ||||||||||||
Unaffiliated issuers | 54,449,436 | 29,436,156 | (136,279 | ) | ||||||||
Written options | — | — | (27,710,725 | ) | ||||||||
Foreign currency transactions | — | 22,388 | (16,999 | ) | ||||||||
|
| |||||||||||
Net realized gain (loss) | 54,449,436 | 29,458,544 | (27,864,003 | ) | ||||||||
|
| |||||||||||
Net change in unrealized appreciation (depreciation) on: | ||||||||||||
Investments: | ||||||||||||
Unaffiliated issuers | 10,308,196 | (298,941,619 | ) | (201,358,111 | ) | |||||||
Controlled affiliates (Note 3f) | — | — | (14,194,363 | ) | ||||||||
Translation of other assets and liabilities denominated in foreign currencies | — | 2,396 | 14,014 | |||||||||
Written options | — | — | (4,352,831 | ) | ||||||||
|
| |||||||||||
franklintempleton.com | The accompanying notes are an integral part of these financial statements. | Semiannual Report | 55 | ||||
FRANKLIN INVESTORS SECURITIES TRUST
FINANCIAL STATEMENTS
Statements of Operations (continued)
for the six months ended April 30, 2020 (unaudited)
| Franklin Convertible Securities Fund | Franklin Equity Income Fund | Franklin Managed Income Fund | ||||||||||
| ||||||||||||
Net change in unrealized appreciation (depreciation) | $10,308,196 | $(298,939,223 | ) | $(219,891,291 | ) | |||||||
|
| |||||||||||
Net realized and unrealized gain (loss) | 64,757,632 | (269,480,679 | ) | (247,755,294 | ) | |||||||
|
| |||||||||||
Net increase (decrease) in net assets resulting from operations | $87,728,151 | $(246,514,887 | ) | $(202,639,214 | ) | |||||||
|
| |||||||||||
*Foreign taxes withheld on dividends | $ — | $ 541,780 | $ 418,898 | |||||||||
56 | Semiannual Report | The accompanying notes are an integral part of these financial statements. | franklintempleton.com | ||
FRANKLIN INVESTORS SECURITIES TRUST
FINANCIAL STATEMENTS
Statements of Changes in Net Assets
| Franklin Convertible Securities Fund | Franklin Equity Income Fund | |||||||||||||||
| Six Months Ended April 30, 2020 (unaudited) | Year Ended October 31, 2019 | Six Months Ended April 30, 2020 (unaudited) | Year Ended October 31, 2019 | |||||||||||||
Increase (decrease) in net assets: | ||||||||||||||||
Operations: | ||||||||||||||||
Net investment income | $ 22,970,519 | $ 40,894,875 | $ 22,965,792 | $ 41,731,072 | ||||||||||||
Net realized gain (loss) | 54,449,436 | 324,390,042 | 29,458,544 | 91,535,502 | ||||||||||||
Net change in unrealized appreciation (depreciation) | 10,308,196 | 115,337,070 | (298,939,223 | ) | 146,788,898 | |||||||||||
|
| |||||||||||||||
Net increase (decrease) in net assets resulting from operations | 87,728,151 | 480,621,987 | (246,514,887 | ) | 280,055,472 | |||||||||||
|
| |||||||||||||||
Distributions to shareholders: | ||||||||||||||||
Class A | (93,857,828 | ) | (66,139,328 | ) | (84,233,204 | ) | (113,557,485 | ) | ||||||||
Class C | (19,330,207 | ) | (14,733,353 | ) | (7,694,163 | ) | (11,317,759 | ) | ||||||||
Class R | — | — | (283,249 | ) | (419,288 | ) | ||||||||||
Class R6 | (7,783,225 | ) | (3,516,561 | ) | (4,251,682 | ) | (5,532,461 | ) | ||||||||
Advisor Class | (190,055,441 | ) | (131,568,983 | ) | (7,782,914 | ) | (8,002,666 | ) | ||||||||
|
| |||||||||||||||
Total distributions to shareholders | (311,026,701 | ) | (215,958,225 | ) | (104,245,212 | ) | (138,829,659 | ) | ||||||||
|
| |||||||||||||||
Capital share transactions: (Note 2) | ||||||||||||||||
Class A | (19,260,010 | ) | (66,639,987 | ) | 86,684,007 | 152,902,721 | ||||||||||
Class C | (17,085,981 | ) | (64,918,362 | ) | (6,113,629 | ) | (7,886,644 | ) | ||||||||
Class R | — | — | (605,160 | ) | 93,237 | |||||||||||
Class R6 | 36,202,314 | (9,724,781 | ) | 6,397,744 | 9,835,991 | |||||||||||
Advisor Class | (146,218,398 | ) | 32,971,457 | 31,985,808 | 53,962,771 | |||||||||||
|
| |||||||||||||||
Total capital share transactions | (146,362,075 | ) | (108,311,673 | ) | 118,348,770 | 208,908,076 | ||||||||||
|
| |||||||||||||||
Net increase (decrease) in net assets | (369,660,625 | ) | 156,352,089 | (232,411,329 | ) | 350,133,889 | ||||||||||
Net assets: | ||||||||||||||||
Beginning of period | 3,857,229,584 | 3,700,877,495 | 2,504,071,801 | 2,153,937,912 | ||||||||||||
|
| |||||||||||||||
End of period | $3,487,568,959 | $3,857,229,584 | $2,271,660,472 | $2,504,071,801 | ||||||||||||
|
| |||||||||||||||
franklintempleton.com | The accompanying notes are an integral part of these financial statements. | Semiannual Report | 57 | ||||
FRANKLIN INVESTORS SECURITIES TRUST
FINANCIAL STATEMENTS
Statements of Changes in Net Assets (continued)
| Franklin Managed Income Fund | ||||||||
| Six Months Ended April 30, 2020 (unaudited) | Year Ended October 31, 2019 | |||||||
Increase (decrease) in net assets: | ||||||||
Operations: | ||||||||
Net investment income | $ 45,116,080 | $ 81,744,524 | ||||||
Net realized gain (loss) | (27,864,003 | ) | 214,188,559 | |||||
Net change in unrealized appreciation (depreciation) | (219,891,291 | ) | 131,291,446 | |||||
|
| |||||||
Net increase (decrease) in net assets resulting from operations | (202,639,214 | ) | 427,224,529 | |||||
|
| |||||||
Distributions to shareholders: | ||||||||
Class A | (167,432,434 | ) | (122,327,719 | ) | ||||
Class C | (25,463,233 | ) | (19,053,022 | ) | ||||
Class R | (212,393 | ) | (160,782 | ) | ||||
Class R6 | (9,326,534 | ) | (6,990,241 | ) | ||||
Advisor Class | (10,340,658 | ) | (7,106,607 | ) | ||||
|
| |||||||
Total distributions to shareholders | (212,775,252 | ) | (155,638,371 | ) | ||||
|
| |||||||
Capital share transactions: (Note 2) | ||||||||
Class A | 118,836,135 | 170,733,085 | ||||||
Class C | (15,839,263 | ) | (39,706,617 | ) | ||||
Class R | 86,159 | 422,350 | ||||||
Class R6 | 9,876,258 | 9,808,027 | ||||||
Advisor Class | 2,503,466 | 44,080,423 | ||||||
|
| |||||||
Total capital share transactions | 115,462,755 | 185,337,268 | ||||||
|
| |||||||
Net increase (decrease) in net assets | (299,951,711 | ) | 456,923,426 | |||||
Net assets: | ||||||||
Beginning of period | 3,803,490,325 | 3,346,566,899 | ||||||
|
| |||||||
End of period | $3,503,538,614 | $3,803,490,325 | ||||||
|
| |||||||
58 | Semiannual Report | The accompanying notes are an integral part of these financial statements. | franklintempleton.com | ||
FRANKLIN INVESTORS SECURITIES TRUST
Notes to Financial Statements (unaudited)
1. Organization and Significant Accounting Policies
Franklin Investors Securities Trust (Trust) is registered under the Investment Company Act of 1940 (1940 Act) as an open-end management investment company, consisting of seven separate funds, three of which are included in this report (Funds) and applies the specialized accounting and reporting guidance in U.S. Generally Accepted Accounting Principles (U.S. GAAP). Class C shares automatically convert to Class A shares after they have been held for 10 years. Each class of shares may differ by its initial sales load, contingent deferred sales charges, voting rights on matters affecting a single class, its exchange privilege and fees due to differing arrangements for distribution and transfer agent fees.
Class A, Class C, Class R, Class R6 & Advisor Class
Franklin Managed Income Fund
Franklin Equity Income Fund
Class A, Class C, Class R6 & Advisor Class
Franklin Convertible Securities Fund
The following summarizes the Funds’ significant accounting policies.
a. Financial Instrument Valuation
The Funds’ investments in financial instruments are carried at fair value daily. Fair value is the price that would be received to sell an asset or paid to transfer a liability in an orderly transaction between market participants on the measurement date. The Funds calculate the net asset value (NAV) per share each business day as of 4 p.m. Eastern time or the regularly scheduled close of the New York Stock Exchange (NYSE), whichever is earlier. Under compliance policies and procedures approved by the Trust’s Board of Trustees (the Board), the Funds’ administrator has responsibility for oversight of valuation, including leading the cross-functional Valuation Committee (VC). The Funds may utilize independent pricing services, quotations from securities and financial instrument dealers, and other market sources to determine fair value.
Equity securities, exchange traded funds and derivative financial instruments listed on an exchange or on the NASDAQ National Market System are valued at the last quoted sale price or the official closing price of the day, respectively. Foreign equity securities are valued as of the close of trading on the foreign stock exchange on which the
security is primarily traded, or as of 4 p.m. Eastern time. The value is then converted into its U.S. dollar equivalent at the foreign exchange rate in effect at 4 p.m. Eastern time on the day that the value of the security is determined. Over-the-counter (OTC) securities are valued within the range of the most recent quoted bid and ask prices. Securities that trade in multiple markets or on multiple exchanges are valued according to the broadest and most representative market. Certain equity securities are valued based upon fundamental characteristics or relationships to similar securities.
Debt and certain preferred securities generally trade in the OTC market rather than on a securities exchange. The Funds’ pricing services use multiple valuation techniques to determine fair value. In instances where sufficient market activity exists, the pricing services may utilize a market-based approach through which quotes from market makers are used to determine fair value. In instances where sufficient market activity may not exist or is limited, the pricing services also utilize proprietary valuation models which may consider market characteristics such as benchmark yield curves, credit spreads, estimated default rates, anticipated market interest rate volatility, coupon rates, anticipated timing of principal repayments, underlying collateral, and other unique security features in order to estimate the relevant cash flows, which are then discounted to calculate the fair value.
Investments in open-end mutual funds are valued at the closing NAV.
Certain derivative financial instruments trade in the OTC market. The Funds’ pricing services use various techniques including industry standard option pricing models and proprietary discounted cash flow models to determine the fair value of those instruments. The Funds’ net benefit or obligation under the derivative contract, as measured by the fair value of the contract, is included in net assets.
The Funds have procedures to determine the fair value of financial instruments for which market prices are not reliable or readily available. Under these procedures, the Funds primarily employ a market-based approach which may use related or comparable assets or liabilities, recent transactions, market multiples, book values, and other relevant information for the investment to determine the fair value of the investment. An income-based valuation approach may also be used in which the anticipated future cash flows of the investment are discounted to calculate fair value. Discounts may also be applied due to the nature or duration of any
franklintempleton.com | Semiannual Report | 59 | ||||
FRANKLIN INVESTORS SECURITIES TRUST
NOTES TO FINANCIAL STATEMENTS (UNAUDITED)
1. Organization and Significant Accounting Policies (continued)
a. Financial Instrument Valuation (continued)
restrictions on the disposition of the investments. Due to the inherent uncertainty of valuations of such investments, the fair values may differ significantly from the values that would have been used had an active market existed.
Trading in securities on foreign securities stock exchanges and OTC markets may be completed before 4 p.m. Eastern time. In addition, trading in certain foreign markets may not take place on every Funds’ business day. Occasionally, events occur between the time at which trading in a foreign security is completed and 4 p.m. Eastern time that might call into question the reliability of the value of a portfolio security held by the Fund. As a result, differences may arise between the value of the Funds’ portfolio securities as determined at the foreign market close and the latest indications of value at 4 p.m. Eastern time. In order to minimize the potential for these differences, the VC monitors price movements following the close of trading in foreign stock markets through a series of country specific market proxies (such as baskets of American Depositary Receipts, futures contracts and exchange traded funds). These price movements are measured against established trigger thresholds for each specific market proxy to assist in determining if an event has occurred that may call into question the reliability of the values of the foreign securities held by the Funds. If such an event occurs, the securities may be valued using fair value procedures, which may include the use of independent pricing services. At April 30, 2020, a market event occurred resulting in a portion of the securities held by certain or all Funds being valued using fair value procedures.
When the last day of the reporting period is a non-business day, certain foreign markets may be open on those days that the Funds’ NAV is not calculated, which could result in differences between the value of the Funds’ portfolio securities on the last business day and the last calendar day of the reporting period. Any significant security valuation changes due to an open foreign market are adjusted and reflected by the Funds for financial reporting purposes.
b. Foreign Currency Translation
Portfolio securities and other assets and liabilities denominated in foreign currencies are translated into U.S. dollars based on the exchange rate of such currencies
against U.S. dollars on the date of valuation. The Funds may enter into foreign currency exchange contracts to facilitate transactions denominated in a foreign currency. Purchases and sales of securities, income and expense items denominated in foreign currencies are translated into U.S. dollars at the exchange rate in effect on the transaction date. Portfolio securities and assets and liabilities denominated in foreign currencies contain risks that those currencies will decline in value relative to the U.S. dollar. Occasionally, events may impact the availability or reliability of foreign exchange rates used to convert the U.S. dollar equivalent value. If such an event occurs, the foreign exchange rate will be valued at fair value using procedures established and approved by the Board.
The Funds do not separately report the effect of changes in foreign exchange rates from changes in market prices on securities held. Such changes are included in net realized and unrealized gain or loss from investments in the Statements of Operations.
Realized foreign exchange gains or losses arise from sales of foreign currencies, currency gains or losses realized between the trade and settlement dates on securities transactions and the difference between the recorded amounts of dividends, interest, and foreign withholding taxes and the U.S. dollar equivalent of the amounts actually received or paid. Net unrealized foreign exchange gains and losses arise from changes in foreign exchange rates on foreign denominated assets and liabilities other than investments in securities held at the end of the reporting period.
c. Securities Purchased on a Delayed Delivery Basis
Certain or all Funds purchase securities on a delayed delivery basis, with payment and delivery scheduled for a future date. These transactions are subject to market fluctuations and are subject to the risk that the value at delivery may be more or less than the trade date purchase price. Although the Funds will generally purchase these securities with the intention of holding the securities, they may sell the securities before the settlement date. Sufficient assets have been segregated for these securities.
d. Derivative Financial Instruments
Certain or all Funds invested in derivative financial instruments in order to manage risk or gain exposure to various other investments or markets. Derivatives are financial contracts based on an underlying or notional
| 60 |
Semiannual Report | franklintempleton.com | ||
FRANKLIN INVESTORS SECURITIES TRUST
NOTES TO FINANCIAL STATEMENTS (UNAUDITED)
amount, require no initial investment or an initial net investment that is smaller than would normally be required to have a similar response to changes in market factors, and require or permit net settlement. Derivatives contain various risks including the potential inability of the counterparty to fulfill their obligations under the terms of the contract, the potential for an illiquid secondary market, and/or the potential for market movements which expose the Fund to gains or losses in excess of the amounts shown in the Statements of Assets and Liabilities. Realized gain and loss and unrealized appreciation and depreciation on these contracts for the period are included in the Statements of Operations.
Collateral requirements differ by type of derivative. Collateral or initial margin requirements are set by the broker or exchange clearing house for exchange traded and centrally cleared derivatives. Initial margin deposited is held at the exchange and can be in the form of cash and/or securities.
Certain or all Funds purchased or wrote exchange traded option contracts primarily to manage and/or gain exposure to equity volatility risk. An option is a contract entitling the holder to purchase or sell a specific amount of shares or units of an asset or notional amount of a swap (swaption), at a specified price. When an option is purchased or written, an amount equal to the premium paid or received is recorded as an asset or liability, respectively. Upon exercise of an option, the acquisition cost or sales proceeds of the underlying investment is adjusted by any premium received or paid. Upon expiration of an option, any premium received or paid is recorded as a realized gain or loss. Upon closing an option other than through expiration or exercise, the difference between the premium received or paid and the cost to close the position is recorded as a realized gain or loss.
See Note 9 regarding other derivative information.
e. Equity-Linked Securities
Certain or all Funds invest in equity-linked securities. Equity-linked securities are hybrid financial instruments that generally combine both debt and equity characteristics into a single note form. Income received from equity-linked securities is recorded as realized gains in the Statements of Operations and may be based on the performance of an underlying equity security, an equity index, or an option position. The risks of investing in equity-linked securities include unfavorable price movements in the underlying security and the credit risk of the issuing financial institution. There may be no guarantee of a return of principal with
equity-linked securities and the appreciation potential may be limited. Equity-linked securities may be more volatile and less liquid than other investments held by the Funds.
f. Securities Lending
Certain or all Funds participate in an agency based securities lending program to earn additional income. The Fund receives cash collateral against the loaned securities in an amount equal to at least 102% of the fair value of the loaned securities. Collateral is maintained over the life of the loan in an amount not less than 100% of the fair value of loaned securities, as determined at the close of Fund business each day; any additional collateral required due to changes in security values is delivered to the Fund on the next business day. The collateral is deposited into a joint cash account with other funds and is used to invest in a money market fund managed by Franklin Advisers, Inc., an affiliate of the Funds, and/or a joint repurchase agreement. The Fund may receive income from the investment of cash collateral, in addition to lending fees and rebates paid by the borrower. Income from securities loaned, net of fees paid to the securities lending agent and/or third-party vendor, is reported separately in the Statements of Operations. The Fund bears the market risk with respect to the collateral investment, securities loaned, and the risk that the agent may default on its obligations to the Fund. If the borrower defaults on its obligation to return the securities loaned, the Fund has the right to repurchase the securities in the open market using the collateral received. The securities lending agent has agreed to indemnify the Fund in the event of default by a third party borrower. At April 30, 2020, the Funds had no securities on loan.
g. Income and Deferred Taxes
It is each Fund’s policy to qualify as a regulated investment company under the Internal Revenue Code. Each Fund intends to distribute to shareholders substantially all of its taxable income and net realized gains to relieve it from federal income and excise taxes. As a result, no provision for U.S. federal income taxes is required.
The Funds may be subject to foreign taxation related to income received, capital gains on the sale of securities and certain foreign currency transactions in the foreign jurisdictions in which the Funds invest. Foreign taxes, if any, are recorded based on the tax regulations and rates that exist in the foreign markets in which the Funds invest. When a capital gain tax is determined to apply, certain or all Funds
franklintempleton.com | Semiannual Report | 61 | ||||
FRANKLIN INVESTORS SECURITIES TRUST
NOTES TO FINANCIAL STATEMENTS (UNAUDITED)
1. Organization and Significant Accounting Policies (continued)
g. Income and Deferred Taxes (continued)
record an estimated deferred tax liability in an amount that would be payable if the securities were disposed of on the valuation date.
As a result of several court cases, in certain countries across the European Union, certain or all Funds filed additional tax reclaims for previously withheld taxes on dividends earned in those countries (EU reclaims). These additional filings are subject to various administrative proceedings by the local jurisdictions’ tax authorities within the European Union, as well as a number of related judicial proceedings. Income recognized, if any, for EU reclaims is reflected as other income in the Statements of Operations and any related receivable, if any, is reflected as European Union tax reclaims in the Statements of Assets and Liabilities. When uncertainty exists as to the ultimate resolution of these proceedings, the likelihood of receipt of these EU reclaims, and the potential timing of payment, no amounts are reflected in the financial statements. For U.S. income tax purposes, EU reclaims received by the Funds, if any, reduce the amounts of foreign taxes Fund shareholders can use as tax credits in their individual income tax returns.
Each Fund may recognize an income tax liability related to its uncertain tax positions under U.S. GAAP when the uncertain tax position has a less than 50% probability that it will be sustained upon examination by the tax authorities based on its technical merits. As of April 30, 2020, the each Fund has determined that no tax liability is required in its financial statements related to uncertain tax positions for any open tax years (or expected to be taken in future tax years). Open tax years are those that remain subject to examination and are based on the statute of limitations in each jurisdiction in which the Fund invests.
h. Security Transactions, Investment Income, Expenses and Distributions
Security transactions are accounted for on trade date. Realized gains and losses on security transactions are determined on a specific identification basis. Interest income and estimated expenses are accrued daily. Amortization of premium and accretion of discount on debt securities are included in interest income. Facility fees are recognized as income over the expected term of the loan. Dividend income
and capital gain distributions by Underlying Funds are recorded on the ex-dividend date except for certain dividends from securities where the dividend rate is not available. In such cases, the dividend is recorded as soon as the information is received by the Funds. Distributions to shareholders are recorded on the ex-dividend date. The Franklin Managed Income Fund employs a managed distribution policy. Under this policy, the fund will distribute level monthly distributions in any given year regardless of the performance of the fund; however, the twelfth monthly payment may be greater than the initially anticipated amount if additional income or capital gains are required to be distributed. These distributions may include income and capital gains generated by the Fund, as well as a possible return of capital component, if necessary, to meet the annual distribution rate. The annual payout rate may be adjusted higher or lower from year to year in response to market conditions. Distributable earnings are determined according to income tax regulations (tax basis) and may differ from earnings recorded in accordance with U.S. GAAP. These differences may be permanent or temporary. Permanent differences are reclassified among capital accounts to reflect their tax character. These reclassifications have no impact on net assets or the results of operations. Temporary differences are not reclassified, as they may reverse in subsequent periods.
Common expenses incurred by the Trust are allocated among the Funds based on the ratio of net assets of each Fund to the combined net assets of the Trust or based on the ratio of number of shareholders of each Fund to the combined number of shareholders of the Trust. Fund specific expenses are charged directly to the Fund that incurred the expense.
Realized and unrealized gains and losses and net investment income, excluding class specific expenses, are allocated daily to each class of shares based upon the relative proportion of net assets of each class. Differences in per share distributions by class are generally due to differences in class specific expenses.
i. Accounting Estimates
The preparation of financial statements in accordance with U.S. GAAP requires management to make estimates and assumptions that affect the reported amounts of assets and liabilities at the date of the financial statements and the amounts of income and expenses during the reporting period. Actual results could differ from those estimates.
| 62 |
Semiannual Report | franklintempleton.com | ||
FRANKLIN INVESTORS SECURITIES TRUST
NOTES TO FINANCIAL STATEMENTS (UNAUDITED)
j. Guarantees and Indemnifications
Under the Trust’s organizational documents, its officers and trustees are indemnified by the Trust against certain liabilities arising out of the performance of their duties to the Trust. Additionally, in the normal course of business, the Trust, on behalf of the Funds, enters into contracts with service
providers that contain general indemnification clauses. The Trust’s maximum exposure under these arrangements is unknown as this would involve future claims that may be made against the Trust that have not yet occurred. Currently, the Trust expects the risk of loss to be remote.
2. Shares of Beneficial Interest
At April 30, 2020, there were an unlimited number of shares authorized (without par value). Transactions in the Funds’ shares were as follows:
| Franklin Convertible Securities Fund | Franklin Equity Income Fund | |||||||||||||||
| Shares | Amount | Shares | Amount | |||||||||||||
| Class A Shares: | ||||||||||||||||
| Six Months ended April 30, 2020 | ||||||||||||||||
| Shares solda | 2,467,007 | $ | 52,658,302 | 8,336,025 | $ | 201,102,424 | ||||||||||
| Shares issued in reinvestment of distributions | 4,234,200 | 89,983,867 | 3,300,219 | 82,444,719 | ||||||||||||
| Shares redeemed | (7,917,293 | ) | (161,902,179) | (8,354,221 | ) | (196,863,136) | ||||||||||
|
| |||||||||||||||
Net increase (decrease) | (1,216,086 | ) | $ | (19,260,010 | ) | 3,282,023 | $ | 86,684,007 | ||||||||
|
| |||||||||||||||
| Year ended October 31, 2019 | ||||||||||||||||
| Shares solda | 6,419,478 | $ | 138,547,580 | 12,618,566 | $ | 311,210,362 | ||||||||||
| Shares issued in reinvestment of distributions | 3,246,558 | 63,366,459 | 4,757,293 | 111,013,154 | ||||||||||||
| Shares redeemed | (12,685,094 | ) | (268,554,026) | (10,930,597 | ) | (269,320,795) | ||||||||||
|
| |||||||||||||||
Net increase (decrease) | (3,019,058 | ) | $ | (66,639,987 | ) | 6,445,262 | $ | 152,902,721 | ||||||||
|
| |||||||||||||||
| Class C Shares: | ||||||||||||||||
| Six Months ended April 30, 2020 | ||||||||||||||||
| Shares sold | 332,770 | $ | 7,062,327 | 1,141,183 | $ | 28,329,291 | ||||||||||
| Shares issued in reinvestment of distributions | 798,400 | 16,781,426 | 295,306 | 7,434,547 | ||||||||||||
| Shares redeemeda | (1,997,479 | ) | (40,929,734) | (1,711,726 | ) | (41,877,467) | ||||||||||
|
| |||||||||||||||
Net increase (decrease) | (866,309 | ) | $ | (17,085,981 | ) | (275,237 | ) | $ | (6,113,629 | ) | ||||||
|
| |||||||||||||||
| Year ended October 31, 2019 | ||||||||||||||||
| Shares sold | 840,031 | $ | 17,694,676 | 1,754,938 | $ | 42,669,455 | ||||||||||
| Shares issued in reinvestment of distributions | 685,031 | 13,012,703 | 476,082 | 10,958,143 | ||||||||||||
| Shares redeemeda | (4,516,464 | ) | (95,625,741 | ) | (2,499,030 | ) | (61,514,242) | |||||||||
|
| |||||||||||||||
Net increase (decrease) | (2,991,402 | ) | $ | (64,918,362 | ) | (268,010 | ) | $ | (7,886,644 | ) | ||||||
|
| |||||||||||||||
franklintempleton.com | Semiannual Report | 63 | ||||
FRANKLIN INVESTORS SECURITIES TRUST
NOTES TO FINANCIAL STATEMENTS (UNAUDITED)
2. Shares of Beneficial Interest (continued)
| Franklin Convertible Securities Fund | Franklin Equity Income Fund | |||||||||||||||
| Shares | Amount | Shares | Amount | |||||||||||||
| Class R Shares: | ||||||||||||||||
| Six Months ended April 30, 2020 | ||||||||||||||||
| Shares sold | 19,264 | $ | 494,123 | |||||||||||||
| Shares issued in reinvestment of distributions | 10,701 | 269,299 | ||||||||||||||
| Shares redeemed | (54,727 | ) | (1,368,582 | ) | ||||||||||||
|
| |||||||||||||||
Net increase (decrease) | (24,762 | ) | $ | (605,160 | ) | |||||||||||
|
| |||||||||||||||
| Year ended October 31, 2019 | ||||||||||||||||
| Shares sold | 44,565 | $ | 1,076,955 | |||||||||||||
| Shares issued in reinvestment of distributions | 16,690 | 388,732 | ||||||||||||||
| Shares redeemed | (55,202 | ) | (1,372,450 | ) | ||||||||||||
|
| |||||||||||||||
Net increase (decrease) | 6,053 | $ | 93,237 | |||||||||||||
|
| |||||||||||||||
| Class R6 Shares: | ||||||||||||||||
| Six Months ended April 30, 2020 | ||||||||||||||||
| Shares sold | 2,575,878 | $ | 57,745,910 | 733,840 | $ | 18,299,336 | ||||||||||
| Shares issued in reinvestment of distributions | 363,725 | 7,771,404 | 135,116 | 3,359,538 | ||||||||||||
| Shares redeemed | (1,352,824 | ) | (29,315,000 | ) | (629,992 | ) | (15,261,130 | ) | ||||||||
|
| |||||||||||||||
Net increase (decrease) | 1,586,779 | $ | 36,202,314 | 238,964 | $ | 6,397,744 | ||||||||||
|
| |||||||||||||||
| Year ended October 31, 2019 | ||||||||||||||||
| Shares sold | 865,814 | $ | 18,678,428 | 958,941 | $ | 23,746,953 | ||||||||||
| Shares issued in reinvestment of distributions | 178,341 | 3,515,052 | 187,558 | 4,394,439 | ||||||||||||
| Shares redeemed | (1,502,089 | ) | (31,918,261 | ) | (738,112 | ) | (18,305,401 | ) | ||||||||
|
| |||||||||||||||
Net increase (decrease) | (457,934 | ) | $ | (9,724,781 | ) | 408,387 | $ | 9,835,991 | ||||||||
|
| |||||||||||||||
| Advisor Class Shares: | ||||||||||||||||
| Six Months ended April 30, 2020 | ||||||||||||||||
| Shares sold | 13,625,671 | $ | 288,642,472 | 2,419,118 | $ | 56,758,053 | ||||||||||
| Shares issued in reinvestment of distributions | 7,738,678 | 164,244,811 | 288,886 | 7,186,404 | ||||||||||||
| Shares redeemed | (29,480,577 | ) | (599,105,681 | ) | (1,396,280 | ) | (31,958,649 | ) | ||||||||
|
| |||||||||||||||
Net increase (decrease) | (8,116,228 | ) | $ | (146,218,398 | ) | 1,311,724 | $ | 31,985,808 | ||||||||
|
| |||||||||||||||
| Year ended October 31, 2019 | ||||||||||||||||
| Shares sold | 31,898,944 | $ | 682,438,950 | 3,482,614 | $ | 85,115,695 | ||||||||||
| Shares issued in reinvestment of distributions | 5,813,623 | 113,983,447 | 310,395 | 7,308,854 | ||||||||||||
| Shares redeemed | (36,235,757 | ) | (763,450,940 | ) | (1,575,590 | ) | (38,461,778 | ) | ||||||||
|
| |||||||||||||||
Net increase (decrease) | 1,476,810 | $ | 32,971,457 | 2,217,419 | $ | 53,962,771 | ||||||||||
|
| |||||||||||||||
aMay include a portion of Class C shares that were automatically converted to Class A.
| 64 |
Semiannual Report | franklintempleton.com | ||
FRANKLIN INVESTORS SECURITIES TRUST
NOTES TO FINANCIAL STATEMENTS (UNAUDITED)
| Franklin Managed Income Fund | ||||||||
| Shares | Amount | |||||||
| Class A Shares: | ||||||||
| Six Months ended April 30, 2020 | ||||||||
| Shares solda | 22,990,022 | $ | 275,222,089 | |||||
| Shares issued in reinvestment of distributions | 13,264,332 | 163,489,518 | ||||||
| Shares redeemed | (27,369,327) | (319,875,472) | ||||||
|
| |||||||
Net increase (decrease) | 8,885,027 | $ | 118,836,135 | |||||
|
| |||||||
| Year ended October 31, 2019 | ||||||||
| Shares solda | 39,624,179 | $ | 481,294,589 | |||||
| Shares issued in reinvestment of distributions | 9,892,242 | 119,363,850 | ||||||
| Shares redeemed | (35,313,277) | (429,925,354) | ||||||
|
| |||||||
Net increase (decrease) | 14,203,144 | $ | 170,733,085 | |||||
|
| |||||||
| Class C Shares: | ||||||||
| Six Months ended April 30, 2020 | ||||||||
| Shares sold | 3,133,352 | $ | 37,165,474 | |||||
| Shares issued in reinvestment of distributions | 1,994,145 | 24,394,878 | ||||||
| Shares redeemeda | (6,619,081) | (77,399,615) | ||||||
|
| |||||||
Net increase (decrease) | (1,491,584) | $ | (15,839,263 | ) | ||||
|
| |||||||
| Year ended October 31, 2019 | ||||||||
| Shares sold | 6,705,072 | $ | 79,963,632 | |||||
| Shares issued in reinvestment of distributions | 1,528,493 | 18,200,268 | ||||||
| Shares redeemeda | (11,352,596) | (137,870,517) | ||||||
|
| |||||||
Net increase (decrease) | (3,119,031) | $ | (39,706,617 | ) | ||||
|
| |||||||
| Class R Shares: | ||||||||
| Six Months ended April 30, 2020 | ||||||||
| Shares sold | 17,646 | $ | 219,715 | |||||
| Shares issued in reinvestment of distributions | 17,163 | 212,218 | ||||||
| Shares redeemed | (27,736) | (345,774) | ||||||
|
| |||||||
Net increase (decrease) | 7,073 | $ | 86,159 | |||||
|
| |||||||
| Year ended October 31, 2019 | ||||||||
| Shares sold | 79,143 | $ | 961,918 | |||||
| Shares issued in reinvestment of distributions | 13,269 | 160,596 | ||||||
| Shares redeemed | (57,333) | (700,164) | ||||||
|
| |||||||
Net increase (decrease) | 35,079 | $ | 422,350 | |||||
|
| |||||||
franklintempleton.com | Semiannual Report | 65 | ||||
FRANKLIN INVESTORS SECURITIES TRUST
NOTES TO FINANCIAL STATEMENTS (UNAUDITED)
2. Shares of Beneficial Interest (continued)
| Franklin Managed Income Fund | ||||||||
| Shares | Amount | |||||||
| Class R6 Shares: | ||||||||
| Six Months ended April 30, 2020 | ||||||||
| Shares sold | 1,627,531 | $ | 19,775,196 | |||||
| Shares issued in reinvestment of distributions | 754,049 | 9,311,707 | ||||||
| Shares redeemed | (1,629,088) | (19,210,645) | ||||||
|
| |||||||
Net increase (decrease) | 752,492 | $ | 9,876,258 | |||||
|
| |||||||
| Year ended October 31, 2019 | ||||||||
| Shares sold | 2,981,043 | $ | 36,633,670 | |||||
| Shares issued in reinvestment of distributions | 576,916 | 6,987,353 | ||||||
| Shares redeemed | (2,761,099) | (33,812,996) | ||||||
|
| |||||||
Net increase (decrease) | 796,860 | $ | 9,808,027 | |||||
|
| |||||||
| Advisor Class Shares: | ||||||||
| Six Months ended April 30, 2020 | ||||||||
| Shares sold | 3,009,851 | $ | 36,040,423 | |||||
| Shares issued in reinvestment of distributions | 733,058 | 9,058,317 | ||||||
| Shares redeemed | (3,544,903) | (42,595,274) | ||||||
|
| |||||||
Net increase (decrease) | 198,006 | $ | 2,503,466 | |||||
|
| |||||||
| Year ended October 31, 2019 | ||||||||
| Shares sold | 6,300,058 | $ | 76,396,303 | |||||
| Shares issued in reinvestment of distributions | 504,313 | 6,125,151 | ||||||
| Shares redeemed | (3,140,172) | (38,441,031) | ||||||
|
| |||||||
Net increase (decrease) | 3,664,199 | $ | 44,080,423 | |||||
|
| |||||||
aMay include a portion of Class C shares that were automatically converted to Class A.
3. Transactions with Affiliates
Franklin Resources, Inc. is the holding company for various subsidiaries that together are referred to as Franklin Templeton. Certain officers and trustees of the Trust are also officers and/or directors of the following subsidiaries:
| Subsidiary | Affiliation | |
Franklin Advisers, Inc. (Advisers)
| Investment manager
| |
Franklin Templeton Services, LLC (FT Services)
| Administrative manager
| |
Franklin Templeton Distributors, Inc. (Distributors)
| Principal underwriter
| |
Franklin Templeton Investor Services, LLC (Investor Services)
| Transfer agent
| |
| 66 |
Semiannual Report | franklintempleton.com | ||
FRANKLIN INVESTORS SECURITIES TRUST
NOTES TO FINANCIAL STATEMENTS (UNAUDITED)
a. Management Fees
Franklin Managed Income Fund pays an investment management fee to Advisers based on the average daily net assets of the Fund as follows:
| Annualized Fee Rate | Net Assets | |
0.620%
| Up to and including $250 million
| |
0.595%
| Over $250 million, up to and including $500 million
| |
0.570%
| Over $500 million, up to and including $1 billion
| |
0.545%
| Over $1 billion, up to and including $2.5 billion
| |
0.520%
| Over $2.5 billion, up to and including $5 billion
| |
0.495%
| Over $5 billion, up to and including $10 billion
| |
0.470%
| Over $10 billion, up to and including $15 billion
| |
0.445%
| Over $15 billion, up to and including $20 billion
| |
0.420%
| In excess of $20 billion
| |
Franklin Convertible Securities Fund and Franklin Equity Income Fund pay an investment management fee to Advisers based on the month-end net assets of each of the Funds as follows:
| Annualized Fee Rate | Net Assets | |
0.625%
| Up to and including $100 million
| |
0.500% | Over $100 million, up to and including $250 million
| |
0.450% | Over $250 million, up to and including $7.5 billion
| |
0.440% | Over $7.5 billion, up to and including $10 billion
| |
0.430% | Over $10 billion, up to and including $12.5 billion
| |
0.420% | Over $12.5 billion, up to and including $15 billion
| |
0.400% | Over $15 billion, up to and including $17.5 billion
| |
0.380% | Over $17.5 billion, up to and including $20 billion
| |
0.360% | Over $20 billion, up to and including $35 billion
| |
0.355% | Over $35 billion, up to and including $50 billion
| |
0.350% | In excess of $50 billion
| |
For the period ended April 30, 2020, each Fund’s annualized gross effective investment management fee rate based on average daily net assets was as follows:
| Franklin Convertible Securities Fund | Franklin Equity Income Fund | Franklin Managed Income Fund | ||
0.455% | 0.456% | 0.549% | ||
b. Administrative Fees
Under an agreement with Advisers, FT Services provides administrative services to the Funds. The fee is paid by Advisers based on each of the Funds’ average daily net assets, and is not an additional expense of the Funds.
franklintempleton.com | Semiannual Report | 67 | ||||
FRANKLIN INVESTORS SECURITIES TRUST
NOTES TO FINANCIAL STATEMENTS (UNAUDITED)
3. Transactions with Affiliates (continued)
c. Distribution Fees
The Board has adopted distribution plans for each share class, with the exception of Class R6 and Advisor Class shares, pursuant to Rule 12b-1 under the 1940 Act. Under the Funds’ Class A reimbursement distribution plans, the Funds reimburse Distributors for costs incurred in connection with the servicing, sale and distribution of each Fund’s shares up to the maximum annual plan rate for each class. Under the Class A reimbursement distribution plans, costs exceeding the maximum for the current plan year cannot be reimbursed in subsequent periods. In addition, under the Funds’ Class C and R compensation distribution plans, the Funds pay Distributors for costs incurred in connection with the servicing, sale and distribution of each Fund’s shares up to the maximum annual plan rate for each class. The plan year, for purposes of monitoring compliance with the maximum annual plan rates, is February 1 through January 31 for each Fund.
The maximum annual plan rates, based on the average daily net assets, for each class, are as follows:
| Franklin Convertible Securities Fund | Franklin Equity Income Fund | Franklin Managed Income Fund | ||||||||||
Reimbursement Plans: | ||||||||||||
Class A | 0.25% | 0.25% | 0.35% | |||||||||
Compensation Plans: | ||||||||||||
Class C | 1.00% | 1.00% | 1.00% | |||||||||
Class R | — | 0.50% | 0.50% | |||||||||
For Franklin Managed Income Fund, the Board has set the current rate at 0.25% per year for Class A shares until further notice and approval by the Board.
d. Sales Charges/Underwriting Agreements
Front-end sales charges and contingent deferred sales charges (CDSC) do not represent expenses of the Funds. These charges are deducted from the proceeds of sales of fund shares prior to investment or from redemption proceeds prior to remittance, as applicable. Distributors has advised the Funds of the following commission transactions related to the sales and redemptions of the Funds’ shares for the period:
| Franklin Convertible Securities Fund | Franklin Equity Income Fund | Franklin Managed Income Fund | ||||||||||
Sales charges retained net of commissions paid to unaffiliated brokers/dealers | $22,168 | $220,265 | $285,254 | |||||||||
CDSC retained | $10,744 | $ 13,546 | $ 27,517 | |||||||||
e. Transfer Agent Fees
Each class of shares pays transfer agent fees to Investor Services for its performance of shareholder servicing obligations. The fees are based on an annualized asset based fee of 0.02% plus a transaction based fee. In addition, each class reimburses Investor Services for out of pocket expenses incurred and, except for Class R6, reimburses shareholder servicing fees paid to third parties. These fees are allocated daily based upon their relative proportion of such classes’ aggregate net assets. Class R6 pays Investor Services transfer agent fees specific to that class.
| 68 |
Semiannual Report | franklintempleton.com | ||
FRANKLIN INVESTORS SECURITIES TRUST
NOTES TO FINANCIAL STATEMENTS (UNAUDITED)
For the period ended April 30, 2020, the Funds paid transfer agent fees as noted in the Statements of Operations of which the following amounts were retained by Investor Services:
| Franklin | ||||||||||||||||||||
| Convertible | Franklin Equity | Franklin Managed | ||||||||||||||||||
Securities Fund
| Income Fund
| Income Fund
| ||||||||||||||||||
Transfer agent fees | $667,011 | $549,092 | $829,177 | |||||||||||||||||
f. Investments in Affiliated Management Investment Companies
Certain or all Funds invest in one or more affiliated management investment companies for purposes other than exercising a controlling influence over the management or policies. Management fees paid by the Funds are waived on assets invested in the affiliated management investment companies, as noted in the Statements of Operations, in an amount not to exceed the management and administrative fees paid directly or indirectly by each affiliate. During the period ended April 30, 2020, investments in affiliated management investment companies were as follows:
Value at
| Purchases
| Sales
| Realized
| Net Change in
| Value at
| Number of
| Investment
| |||||||||||||||||||||||||
Franklin Convertible Securities Fund | ||||||||||||||||||||||||||||||||
Non-Controlled Affiliates | ||||||||||||||||||||||||||||||||
| Dividends | ||||||||||||||||||||||||||||||||
Institutional Fiduciary Trust Money Market Portfolio, 0.01% | $ 89,909,657 | $ | 487,678,039 | $ | (522,957,651 | ) | $ | — | $ | — | $ | 54,630,045 | 54,630,045 | $ 435,821 | ||||||||||||||||||
| Income from | ||||||||||||||||||||||||||||||||
| securities | ||||||||||||||||||||||||||||||||
| loaned | ||||||||||||||||||||||||||||||||
Institutional Fiduciary Trust Money Market Portfolio, 0.01% | — | 75,196,000 | (75,196,000 | ) | — | — | —a | — | 17,040 | |||||||||||||||||||||||
Total Affiliated Securities | $ 89,909,657 | $ | 562,874,039 | $ | (598,153,651 | ) | $ | — | $ | — | $ | 54,630,045 | $ 452,861 | |||||||||||||||||||
Franklin Equity Income Fund | ||||||||||||||||||||||||||||||||
Non-Controlled Affiliates | ||||||||||||||||||||||||||||||||
| Dividends | ||||||||||||||||||||||||||||||||
Institutional Fiduciary Trust Money Market Portfolio, 0.01% | $ 69,588,667 | $ | 224,105,280 | $ | (255,615,356 | ) | $ | — | $ | — | $ | 38,078,591 | 38,078,591 | $ 196,676 | ||||||||||||||||||
| Income from | ||||||||||||||||||||||||||||||||
| securities | ||||||||||||||||||||||||||||||||
| loaned | ||||||||||||||||||||||||||||||||
Institutional Fiduciary Trust Money Market Portfolio, 0.01% | — | 174,000 | (174,000 | ) | — | — | —a | — | 82 | |||||||||||||||||||||||
Total Affiliated Securities | $ 69,588,667 | $ | 224,279,280 | $ | (255,789,356 | ) | $ | — | $ | — | $ | 38,078,591 | $ 196,758 | |||||||||||||||||||
franklintempleton.com | Semiannual Report | 69 | ||||
FRANKLIN INVESTORS SECURITIES TRUST
NOTES TO FINANCIAL STATEMENTS (UNAUDITED)
3. Transactions with Affiliates (continued)
f. Investments in Affiliated Management Investment Companies (continued)
Value at
| Purchases
| Sales
| Realized
| Net Change in
| Value at End of Period
| Number of
| Investment
| |||||||||||||||||||||||||
Franklin Managed Income Fund | ||||||||||||||||||||||||||||||||
Controlled Affiliates | ||||||||||||||||||||||||||||||||
| Dividends | ||||||||||||||||||||||||||||||||
Franklin FTSE United Kingdom ETF | $ | — | $ | 46,079,500 | $ | — | $ | — | $ | (8,239,500 | ) | $ | 37,840,000 | 2,000,000 | $ | — | ||||||||||||||||
Franklin Liberty Systematic Style Premia ETF | — | 29,959,563 | — | — | (3,898,063 | ) | 26,061,500 | 1,175,000 | — | |||||||||||||||||||||||
Franklin Liberty U.S. Low Volatility ETF | 36,596,800 | — | — | — | (2,056,800 | ) | 34,540,000 | 1,000,000 | 265,700 | |||||||||||||||||||||||
Total Controlled Affiliates | $ | 36,596,800 | $ | 76,039,063 | $ | — | $ | — | $ | (14,194,363 | ) | $ | 98,441,500 | $ | 265,700 | |||||||||||||||||
Non-Controlled Affiliates | ||||||||||||||||||||||||||||||||
| Dividends | ||||||||||||||||||||||||||||||||
Institutional Fiduciary Trust Money Market Portfolio, 0.01% | 331,668,940 | 649,249,409 | (904,132,377 | ) | — | — | 76,785,972 | 76,785,972 | 774,033 | |||||||||||||||||||||||
| Income from | ||||||||||||||||||||||||||||||||
| securities | ||||||||||||||||||||||||||||||||
| loaned | ||||||||||||||||||||||||||||||||
Institutional Fiduciary Trust Money Market Portfolio, 0.01% | — | 7,829,000 | (7,829,000 | ) | — | — | —a | — | 745 | |||||||||||||||||||||||
Total Non-Controlled Affiliates | $ | 331,668,940 | $ | 657,078,409 | $ | (911,961,377 | ) | $ | — | $ | — | $ | 76,785,972 | $ | 774,778 | |||||||||||||||||
Total Affiliated Securities | $ | 368,265,740 | $ | 733,117,472 | $ | (911,961,377 | ) | $ | — | $ | (14,194,363 | ) | $ | 175,227,472 | $ | 1,040,478 | ||||||||||||||||
aAs of April 30, 2020, no longer held by the Fund.
g. Waiver and Expense Reimbursements
Effective March 1, 2020, Advisers and Investor Services have contractually agreed in advance to waive or limit their respective fees and to assume as their own expense certain expenses otherwise payable by Franklin Managed Income Fund so that the expenses (including acquired fund fees and expenses but excluding distribution fees, and certain non-routine expenses or costs such as those relating to litigation, indemnification, reorganizations, and liquidations) for Class A, Class C, Class R, Advisor Class and for Class R6 of the Fund do not exceed 0.68% and 0.60% respectively, based on the average net assets of each class until February 28, 2021. Total expenses waived or paid are not subject to recapture subsequent to the Fund’s fiscal year end.
For Franklin Convertible Securities Fund and Franklin Equity Income Fund, Investor Services has contractually agreed in advance to waive or limit its fees so that the Class R6 transfer agent fees do not exceed 0.03% based on the average net assets of the class until February 28, 2021.
h. Interfund Transactions
Franklin Managed Income Fund engaged in purchases and sales of investments with funds or other accounts that have common investment managers (or affiliated investment managers), directors, trustees or officers. During the period ended April 30, 2020, these purchase and sale transactions aggregated $0 and $13,406,250, respectively.
| 70 |
Semiannual Report | franklintempleton.com | ||
FRANKLIN INVESTORS SECURITIES TRUST
NOTES TO FINANCIAL STATEMENTS (UNAUDITED)
4. Expense Offset Arrangement
The Funds have entered into an arrangement with their custodian whereby credits realized as a result of uninvested cash balances are used to reduce a portion of the Funds’ custodian expenses. During the period ended April 30, 2020, the custodian fees were reduced as noted in the Statements of Operations.
5. Income Taxes
At April 30, 2020, the cost of investments and net unrealized appreciation (depreciation) for income tax purposes were as follows:
| Franklin | ||||||||||||
| Convertible | Franklin Equity | Franklin Managed | ||||||||||
Securities Fund
| Income Fund
| Income Fund
| ||||||||||
Cost of investments |
| $3,100,542,678
|
|
| $1,865,289,124
|
|
| $3,383,273,757
|
| |||
Unrealized appreciation | $ 536,069,468 | $ 508,851,060 | $ 329,177,461 | |||||||||
Unrealized depreciation |
| (159,429,097
| )
|
| (106,026,603
| )
|
| (172,959,144
| )
| |||
Net unrealized appreciation (depreciation) |
| $ 376,640,371
|
|
| $ 402,824,457
|
|
| $ 156,218,317
|
| |||
Differences between income and/or capital gains as determined on a book basis and a tax basis are primarily due to differing treatments of bond discounts and premiums and equity-linked securities.
The Funds utilized a tax accounting practice to treat a portion of the proceeds from capital shares redeemed as a distribution from realized capital gains.
6. Investment Transactions
Purchases and sales of investments (excluding short term securities) for the period ended April 30, 2020, were as follows:
| Franklin | ||||||||||||
| Convertible | Franklin Equity | Franklin Managed | ||||||||||
Securities Fund
| Income Fund
| Income Fund
| ||||||||||
Purchases | $242,153,327 | $501,325,360 | $1,279,133,043 | |||||||||
Sales | $682,372,313 | $396,193,049 | $1,019,695,185 | |||||||||
7. Credit Risk
At April 30, 2020, Franklin Convertible Securities Fund and Franklin Managed Income Fund had 76.5% and 7.8%, respectively, of their portfolio invested in high yield securities, senior secured floating rate loans, or other securities rated below investment grade and unrated securities, if any. These securities may be more sensitive to economic conditions causing greater price volatility and are potentially subject to a greater risk of loss due to default than higher rated securities.
8. Novel Coronavirus Pandemic
The global outbreak of the novel coronavirus disease, known as COVID-19, has caused adverse effects on many companies, sectors, nations, regions and the markets in general, and may continue for an unpredictable duration. The effects of this pandemic may materially impact the value and performance of the Funds, their ability to buy and sell fund investments at appropriate valuations and their ability to achieve their investment objectives.
franklintempleton.com | Semiannual Report | 71 | ||||
FRANKLIN INVESTORS SECURITIES TRUST
NOTES TO FINANCIAL STATEMENTS (UNAUDITED)
9. Other Derivative Information
At April 30, 2020, investments in derivative contracts are reflected in the Statements of Assets and Liabilities as follows:
Asset Derivatives
| Liability Derivatives
| |||||||||||||||
| Derivative Contracts | Statements of | Statements of | ||||||||||||||
| Not Accounted for as | Assets and Liabilities | Assets and Liabilities | ||||||||||||||
Hedging Instruments
| Location
| Fair Value
| Location
| Fair Value
| ||||||||||||
Franklin Managed Income Fund | ||||||||||||||||
Equity contracts
| Investments in securities, at value
| $
| 26,355,000
| a
| Options written, at value
| $
| 6,050,214
|
| ||||||||
aPurchased option contracts are included in investments in securities, at value in the Statements of Assets and Liabilities.
For the period ended April 30, 2020, the effect of derivative contracts in the Statements of Operations was as follows:
| Net Change in | ||||||||||||
| Unrealized | ||||||||||||
| Derivative Contracts | Net Realized | Appreciation | ||||||||||
| Not Accounted for as | Statements of | Gain (Loss) for | Statements of | (Depreciation) | ||||||||
Hedging Instruments
| Operations Location
| the Period
| Operations Location
| for the Period
| ||||||||
Net realized gain (loss) from: |
Net change in unrealized | |||||||||||
| Franklin Managed Income Fund | ||||||||||||
Equity contracts | Investments | $ 16,866,067 | a | Investments | $ 6,453,437 | a | ||||||
| Written options |
| (27,710,725
| )
| Written options |
| (4,352,831
| )
| |||||
Totals |
| $(10,844,658
| )
|
| $ 2,100,606
|
| ||||||
aPurchased option contracts are included in net realized gain (loss) from investments and net change in unrealized appreciation (depreciation) on investments in the Statements of Operations.
For the period ended April 30, 2020, the average month end notional amount of options represented 5,571,414 shares.
See Note 1(d) regarding derivative financial instruments.
10. Credit Facility
The Funds, together with other U.S. registered and foreign investment funds (collectively, Borrowers), managed by Franklin Templeton, are borrowers in a joint syndicated senior unsecured credit facility totaling $2 billion (Global Credit Facility) which matures on February 5, 2021. This Global Credit Facility provides a source of funds to the Borrowers for temporary and emergency purposes, including the ability to meet future unanticipated or unusually large redemption requests.
Under the terms of the Global Credit Facility, the Funds shall, in addition to interest charged on any borrowings made by the Funds and other costs incurred by the Funds, pay their share of fees and expenses incurred in connection with the implementation and maintenance of the Global Credit Facility, based upon their relative share of the aggregate net assets of all of the Borrowers, including an annual commitment fee of 0.15% based upon the unused portion of the Global Credit Facility. These fees are reflected in other expenses in the Statements of Operations. During the period ended April 30, 2020, the Funds did not use the Global Credit Facility.
72 | Semiannual Report | franklintempleton.com | ||
FRANKLIN INVESTORS SECURITIES TRUST
NOTES TO FINANCIAL STATEMENTS (UNAUDITED)
11. Fair Value Measurements
The Funds follow a fair value hierarchy that distinguishes between market data obtained from independent sources (observable inputs) and the Funds’ own market assumptions (unobservable inputs). These inputs are used in determining the value of the Funds’ financial instruments and are summarized in the following fair value hierarchy:
| • | Level 1 – quoted prices in active markets for identical financial instruments |
| • | Level 2 – other significant observable inputs (including quoted prices for similar financial instruments, interest rates, prepayment speed, credit risk, etc.) |
| • | Level 3 – significant unobservable inputs (including the Funds’ own assumptions in determining the fair value of financial instruments) |
The input levels are not necessarily an indication of the risk or liquidity associated with financial instruments at that level.
A summary of inputs used as of April 30, 2020, in valuing the Funds’ assets and liabilities carried at fair value, is as follows:
| Level 1 | Level 2 | Level 3 | Total | |||||||||||||
| Franklin Convertible Securities Fund | ||||||||||||||||
Assets: | ||||||||||||||||
Investments in Securities:a | ||||||||||||||||
Equity Investments:b | ||||||||||||||||
Consumer Staples | $ | — | $ | 58,942,800 | $ | — | $ | 58,942,800 | ||||||||
All Other Equity Investments | 606,330,503 | — | — | 606,330,503 | ||||||||||||
Convertible Bonds | — | 2,757,279,701 | — | 2,757,279,701 | ||||||||||||
Escrows and Litigation Trusts | — | — | — | c | — | |||||||||||
Short Term Investments | 54,630,045 | — | — | 54,630,045 | ||||||||||||
|
| |||||||||||||||
Total Investments in Securities | $ | 660,960,548 | $ | 2,816,222,501 | $ | — | $ | 3,477,183,049 | ||||||||
|
| |||||||||||||||
| Franklin Equity Income Fund | ||||||||||||||||
Assets: | ||||||||||||||||
Investments in Securities:a | ||||||||||||||||
Equity Investmentsb | $ | 2,029,833,825 | $ | — | $ | — | $ | 2,029,833,825 | ||||||||
Equity-Linked Securities | — | 200,201,165 | — | 200,201,165 | ||||||||||||
Short Term Investments | 38,078,591 | — | — | 38,078,591 | ||||||||||||
|
| |||||||||||||||
Total Investments in Securities | $ | 2,067,912,416 | $ | 200,201,165 | $ | — | $ | 2,268,113,581 | ||||||||
|
| |||||||||||||||
| Franklin Managed Income Fund | ||||||||||||||||
Assets: | ||||||||||||||||
Investments in Securities:a | ||||||||||||||||
Equity Investmentsb | $ | 1,599,446,084 | $ | — | $ | — | $ | 1,599,446,084 | ||||||||
Equity-Linked Securities | — | 495,357,184 | — | 495,357,184 | ||||||||||||
Corporate Bonds | — | 1,065,069,019 | — | 1,065,069,019 | ||||||||||||
U.S. Government and Agency Securities | — | 156,801,758 | — | 156,801,758 | ||||||||||||
Mortgage-Backed Securities | — | 132,583,658 | — | 132,583,658 | ||||||||||||
Options Purchased | 26,355,000 | — | — | 26,355,000 | ||||||||||||
Short Term Investments | 76,785,972 | — | — | 76,785,972 | ||||||||||||
|
| |||||||||||||||
Total Investments in Securities | $ | 1,702,587,056 | $ | 1,849,811,619 | $ | — | $ | 3,552,398,675 | ||||||||
|
| |||||||||||||||
franklintempleton.com | Semiannual Report | 73 | ||||
FRANKLIN INVESTORS SECURITIES TRUST
NOTES TO FINANCIAL STATEMENTS (UNAUDITED)
11. Fair Value Measurements (continued)
| Level 1 | Level 2 | Level 3 | Total | |||||||||||||
| Franklin Managed Income Fund (continued) | ||||||||||||||||
Liabilities: | ||||||||||||||||
Other Financial Instruments: | ||||||||||||||||
Options Written | $ | 6,050,214 | $ | — | $ | — | $ | 6,050,214 | ||||||||
|
| |||||||||||||||
aFor detailed categories, see the accompanying Statement of Investments.
bIncludes common, preferred, convertible preferred stocks and management investment companies.
cIncludes securities determined to have no value at April 30, 2020.
A reconciliation in which Level 3 inputs are used in determining fair value is presented when there are significant Level 3 assets and/or liabilities at the beginning and/or end of the period.
12. New Accounting Pronouncements
In March 2020, the Financial Accounting Standards Board issued an Accounting Standards Update (ASU) which provides optional temporary financial reporting relief from the effect of certain types of contract modifications due to the planned discontinuation of the London Interbank Offered Rate (LIBOR) and interbank-offered based reference rates as of the end of 2021. The ASU is effective for certain reference rate-related contract modifications that occur during the period March 12, 2020 through December 31, 2022. Management is currently evaluating the impact, if any, of applying this ASU.
13. Subsequent Events
The Funds have evaluated subsequent events through the issuance of the financial statements and determined that no events have occurred that require disclosure.
Abbreviations
Selected Portfolio
| ||
| ADR | American Depositary Receipt | |
| ETF | Exchange Traded Fund | |
| FRN | Floating Rate Note | |
| SF | Single Family | |
| SPDR | S&P Depositary Receipt | |
74 | Semiannual Report | franklintempleton.com | ||
FRANKLIN INVESTORS SECURITIES TRUST
Board Approval of Investment
Management Agreements
FRANKLIN INVESTORS SECURITIES TRUST
Franklin Convertible Securities Fund
Franklin Equity Income Fund
Franklin Managed Income Fund
(each a Fund)
At an in-person meeting held on February 25, 2020 (Meeting), the Board of Trustees (Board) of Franklin Investors Securities Trust (Trust), including a majority of the trustees who are not “interested persons” as defined in the Investment Company Act of 1940 (Independent Trustees), reviewed and approved the continuance of the investment management agreement between Franklin Advisers, Inc. (Manager) and the Trust, on behalf of each Fund (each a Management Agreement) for an additional one-year period. The Independent Trustees received advice from and met separately with Independent Trustee counsel in considering whether to approve the continuation of each Management Agreement. Although the Management Agreements for the Funds were considered at the same Board meeting, the Board considered the information provided to it about the Funds together and with respect to each Fund separately as the Board deemed appropriate.
In considering the continuation of each Management Agreement, the Board reviewed and considered information provided by the Manager at the Meeting and throughout the year at meetings of the Board and its committees. The Board also reviewed and considered information provided in response to a detailed set of requests for information submitted to the Manager by Independent Trustee counsel on behalf of the Independent Trustees in connection with the annual contract renewal process. In addition, prior to the Meeting, the Independent Trustees held a telephonic contract renewal meeting at which the Independent Trustees conferred amongst themselves and Independent Trustee counsel about contract renewal matters and, in some cases, requested additional information from the Manager relating to the contract. The Board reviewed and considered all of the factors it deemed relevant in approving the continuance of each Management Agreement, including, but not limited to: (i) the nature, extent and quality of the services provided by the Manager; (ii) the investment performance of each Fund; (iii) the costs of the services provided and profits realized by the Manager and its affiliates from the relationship with each Fund; (iv) the extent to which economies of scale are realized as each Fund grows; and
(v) whether fee levels reflect these economies of scale for the benefit of Fund investors.
In approving the continuance of each Management Agreement, the Board, including a majority of the Independent Trustees, determined that the terms of the Management Agreement are fair and reasonable and that the continuance of such Management Agreement is in the interests of the applicable Fund and its shareholders. While attention was given to all information furnished, the following discusses some primary factors relevant to the Board’s determination.
Nature, Extent and Quality of Services
The Board reviewed and considered information regarding the nature, extent and quality of investment management services provided by the Manager and its affiliates to the Funds and their shareholders. This information included, among other things, the qualifications, background and experience of the senior management and investment personnel of the Manager, as well as information on succession planning where appropriate; the structure of investment personnel compensation; oversight of third-party service providers; investment performance reports and related financial information for each Fund; reports on expenses and shareholder services; legal and compliance matters; risk controls; pricing and other services provided by the Manager and its affiliates; and management fees charged by the Manager and its affiliates to US funds and other accounts, including management’s explanation of differences among accounts where relevant. The Board also reviewed and considered an annual report on payments made by Franklin Templeton (FT) or the Funds to financial intermediaries, as well as a memorandum relating to third-party servicing arrangements, which included discussion of the changing distribution landscape for the Funds. The Board noted management’s continuing efforts and expenditures in establishing effective business continuity plans and developing strategies to address areas of heightened concern in the mutual fund industry, such as cybersecurity and liquidity risk management.
The Board also reviewed and considered the benefits provided to Fund shareholders of investing in a fund that is part of the FT family of funds. The Board noted the financial position of Franklin Resources, Inc. (FRI), the Manager’s parent, and its commitment to the mutual fund business as evidenced by its continued introduction of new funds, reassessment of the fund offerings in response to the market environment and project initiatives and capital
franklintempleton.com | Semiannual Report | 75 | ||||
FRANKLIN INVESTORS SECURITIES TRUST
SHAREHOLDER INFORMATION
investments relating to the services provided to the Funds by the FT organization. The Board specifically noted FT’s commitment to enhancing services and controlling costs, as reflected in its plan to outsource certain administrative functions, and growth opportunities, as evidenced by its upcoming acquisition of the Legg Mason companies. The Board acknowledged the change in leadership at FRI and the opportunity to hear from Jennifer Johnson, President and Chief Executive Officer of FRI, about goals she has for the company that will benefit the Funds.
Following consideration of such information, the Board was satisfied with the nature, extent and quality of services provided by the Manager and its affiliates to the Funds and their shareholders.
Fund Performance
The Board reviewed and considered the performance results of each Fund over various time periods ended December 31, 2019. The Board considered the performance returns for each Fund in comparison to the performance returns of mutual funds deemed comparable to the Fund included in a universe (Performance Universe) selected by Broadridge Financial Solutions, Inc. (Broadridge), an independent provider of investment company data. The Board received a description of the methodology used by Broadridge to select the mutual funds included in a Performance Universe. The Board also reviewed and considered Fund performance reports provided and discussions that occurred with portfolio managers at Board meetings throughout the year. A summary of each Fund’s performance results is below.
Franklin Convertible Securities Fund – The Performance Universe for the Fund included the Fund and all retail and institutional convertible securities funds. The Board noted that the Fund’s annualized income return for the one-, three-and five-year periods was below the median of its Performance Universe, but for the 10-year period was above the median of its Performance Universe. The Board also noted that the Fund’s annualized total return for the one-year period was below the median of its Performance Universe, but for the three-, five- and 10-year periods was above the median and in the first quintile (best) of its Performance Universe. The Board concluded that the Fund’s performance was acceptable. In doing so, the Board noted that, while below the median, the annualized total return for the one-year period was 23.88%.
Franklin Equity Income Fund – The Performance Universe for the Fund included the Fund and all retail and institutional equity income funds. The Board noted that the Fund’s
annualized income return and annualized total return for the one-, three-, five- and 10-year periods were above the medians of its Performance Universe. The Board concluded that the Fund’s performance was satisfactory.
Franklin Managed Income Fund – The Performance Universe for the Fund included the Fund and all retail and institutional mixed-asset target allocation moderate funds. The Board noted that the Fund’s annualized income return for the one-, three-, five- and 10-year periods was above the median and in the first quintile (best) of its Performance Universe. The Board noted that the Fund’s annualized total return for the three-year period was below the median of its Performance Universe, but for the one-, five- and 10-year periods was above the median of its Performance Universe. The Board further noted that, effective March 1, 2019, the Fund changed its name and repositioned its investment strategy to become an income strategy. The Board concluded that the Fund’s performance was satisfactory.
Comparative Fees and Expenses
The Board reviewed and considered information regarding each Fund’s actual total expense ratio and its various components, including, as applicable, management fees; transfer agent expenses; underlying fund expenses; Rule 12b-1 and non-Rule 12b-1 service fees; and other non-management fees. The Board also noted the quarterly and annual reports it receives on all marketing support payments made by FT to financial intermediaries. The Board considered the actual total expense ratio and, separately, the contractual management fee rate, without the effect of fee waivers, if any (Management Rate) of each Fund in comparison to the median expense ratio and median Management Rate, respectively, of other mutual funds deemed comparable to and with a similar expense structure to the Fund selected by Broadridge (Expense Group). Broadridge fee and expense data is based upon information taken from each fund’s most recent annual report, which reflects historical asset levels that may be quite different from those currently existing, particularly in a period of market volatility. While recognizing such inherent limitation and the fact that expense ratios and Management Rates generally increase as assets decline and decrease as assets grow, the Board believed the independent analysis conducted by Broadridge to be an appropriate measure of comparative fees and expenses. The Broadridge Management Rate includes administrative charges, and the actual total expense ratio, for comparative consistency, was shown for Class A shares for each Fund and for each of the other funds in each respective Expense Group. The Board
| 76 |
Semiannual Report | franklintempleton.com | ||
FRANKLIN INVESTORS SECURITIES TRUST
SHAREHOLDER INFORMATION
received a description of the methodology used by Broadridge to select the mutual funds included in an Expense Group.
Franklin Convertible Securities Fund and Franklin Equity Income Fund – The Expense Group for the Franklin Convertible Securities Fund included the Fund and nine other convertible securities funds. The Expense Group for the Franklin Equity Income Fund included the Fund and 12 other equity income funds. The Board noted that the Management Rates and actual total expense ratios for the Funds were below the medians of their respective Expense Groups. The Board concluded that the Management Rates charged to the Funds are reasonable.
Franklin Managed Income Fund – The Expense Group for the Fund included the Fund and eight other mixed-asset target allocation moderate funds. The Board noted that the Management Rate for the Fund was slightly above the median of its Expense Group. The Board also noted that the actual total expense ratio for the Fund was below the median and in the second quintile of its Expense Group. The Board concluded that the Management Rate charged to the Fund is reasonable. In doing so, the Board noted that, effective March 1, 2019, the Fund implemented a reduced Management Rate in connection with the repositioning of its investment strategy. The Board further noted that the actual total expense ratio for the Fund reflected a fee waiver from management.
Profitability
The Board reviewed and considered information regarding the profits realized by the Manager and its affiliates in connection with the operation of each Fund. In this respect, the Board considered the Fund profitability analysis provided by the Manager that addresses the overall profitability of FT’s US fund business, as well as its profits in providing investment management and other services to each of the individual funds during the 12-month period ended September 30, 2019, being the most recent fiscal year-end for FRI. The Board noted that although management continually makes refinements to its methodologies used in calculating profitability in response to organizational and product-related changes, the overall methodology has remained consistent with that used in the Funds’ profitability report presentations from prior years. Additionally, PricewaterhouseCoopers LLP, auditor to FRI and certain FT funds, was engaged by the Manager to review and assess the allocation methodologies to be used solely by the Funds’ Board with respect to the profitability analysis.
The Board noted management’s belief that costs incurred in establishing the infrastructure necessary for the type of mutual fund operations conducted by the Manager and its affiliates may not be fully reflected in the expenses allocated to each Fund in determining its profitability, as well as the fact that the level of profits, to a certain extent, reflected operational cost savings and efficiencies initiated by management. As part of this evaluation, the Board considered the initiative currently underway to outsource certain operations, which effort would require considerable upfront expenditures by the Manager but, over the long run is expected to result in greater efficiencies. The Board also noted management’s expenditures in improving shareholder services provided to the Funds, as well as the need to implement systems and meet additional regulatory and compliance requirements resulting from recent US Securities and Exchange Commission and other regulatory requirements, notably in the area of cybersecurity protections.
The Board also considered the extent to which the Manager and its affiliates might derive ancillary benefits from fund operations, including revenues generated from transfer agent services, potential benefits resulting from personnel and systems enhancements necessitated by fund growth, as well as increased leverage with service providers and counterparties. Based upon its consideration of all these factors, the Board concluded that the level of profits realized by the Manager and its affiliates from providing services to each Fund was not excessive in view of the nature, extent, and quality of services provided to each Fund.
Economies of Scale
The Board reviewed and considered the extent to which the Manager may realize economies of scale, if any, as each Fund grows larger and whether each Fund’s management fee structure reflects any economies of scale for the benefit of shareholders. With respect to possible economies of scale, the Board noted the existence of management fee breakpoints, which operate generally to share any economies of scale with a Fund’s shareholders by reducing the Fund’s effective management fees as the Fund grows in size. The Board considered the Manager’s view that any analyses of potential economies of scale in managing a particular fund are inherently limited in light of the joint and common costs and investments the Manager incurs across the FT family of funds as a whole. The Board concluded that to the extent economies of scale may be realized by the Manager and its affiliates, each Fund’s management fee
franklintempleton.com | Semiannual Report | 77 | ||||
FRANKLIN INVESTORS SECURITIES TRUST
SHAREHOLDER INFORMATION
structure provided a sharing of benefits with the Fund and its shareholders as the Fund grows.
Conclusion
Based on its review, consideration and evaluation of all factors it believed relevant, including the above-described factors and conclusions, the Board unanimously approved the continuation of each Management Agreement for an additional one-year period.
Proxy Voting Policies and Procedures
The Trust’s investment manager has established Proxy Voting Policies and Procedures (Policies) that the Trust uses to determine how to vote proxies relating to portfolio securities. Shareholders may view the Trust’s complete Policies online at franklintempleton.com. Alternatively, shareholders may request copies of the Policies free of charge by calling the Proxy Group collect at (954) 527-7678 or by sending a written request to: Franklin Templeton Companies, LLC, 300 S.E. 2nd Street, Fort Lauderdale, FL 33301, Attention: Proxy Group. Copies of the Trust’s proxy voting records are also made available online at franklintempleton.com and posted on the U.S. Securities and Exchange Commission’s website at sec.gov and reflect the most recent 12-month period ended June 30.
Quarterly Statement of Investments
The Trust files a complete statement of investments with the U.S. Securities and Exchange Commission for the first and third quarters for each fiscal year as an exhibit to its report on Form N-PORT. Shareholders may view the filed Form N-PORT by visiting the Commission’s website at sec.gov. The filed form may also be viewed and copied at the Commission’s Public Reference Room in Washington, DC. Information regarding the operations of the Public Reference Room may be obtained by calling (800) SEC-0330.
| 78 |
Semiannual Report | franklintempleton.com | ||
This page intentionally left blank.
This page intentionally left blank.
Authorized for distribution only when accompanied or preceded by a summary prospectus and/or prospectus. Investors should carefully consider a fund’s investment goals, risks, charges and expenses before investing. A prospectus contains this and other information; please read it carefully before investing.
To help ensure we provide you with quality service, all calls to and from our service areas are monitored and/or recorded.
|
Semiannual Report and Shareholder Letter | |||||
| Franklin Investors Securities Trust | ||||||
| Investment Manager | Distributor | Shareholder Services | ||||
| Franklin Advisers, Inc. | Franklin Templeton Distributors, Inc. | (800) 632-2301 | ||||
| (800) DIAL BEN® / 342-5236 | ||||||
| franklintempleton.com | ||||||
| © 2020 Franklin Templeton Investments. All rights reserved. | FIST1 S 06/20 |
| Franklin Adjustable U.S. Government Securities Fund | Franklin Low Duration Total Return Fund
Franklin Total Return Fund | |||||||
Franklin Floating Rate Daily Access Fund |
Sign up for electronic delivery at franklintempleton.com/edelivery
Internet Delivery of Fund Reports Unless You Request Paper Copies: Effective January 1, 2021, as permitted by the SEC, paper copies of the Fund’s shareholder reports will no longer be sent by mail, unless you specifically request them from the Fund or your financial intermediary. Instead, the reports will be made available on a website, and you will be notified by mail each time a report is posted and provided with a website link to access the report.
If you already elected to receive shareholder reports electronically, you will not be affected by this change and you need not take any action. If you have not signed up for electronic delivery, we would encourage you to join fellow shareholders who have. You may elect to receive shareholder reports and other communications electronically from the Fund by calling (800) 632-2301 or by contacting your financial intermediary.
You may elect to continue to receive paper copies of all your future shareholder reports free of charge by contacting your financial intermediary or, if you invest directly with a Fund, calling (800) 632-2301 to let the Fund know of your request. Your election to receive reports in paper will apply to all funds held in your account.
SHAREHOLDER LETTER
Dear Shareholder:
During the six months ended April 30, 2020, the U.S. economy showed mixed results, growing moderately through the end of 2019 amid concerns about trade, but contracting in 2020’s first quarter in response to the novel coronavirus (COVID-19) pandemic. The U.S. Federal Reserve (Fed), having lowered the federal funds rate in October for the third time during 2019, held the rate unchanged through February 2020. However, given larger economic risks posed by COVID-19, the Fed lowered its key rate by 0.50% on March 3 and further by 1.00% on March 15, decreasing the rate during the period from 1.75% to 0.25%. In its efforts to support U.S. economic activity, the Fed also announced broad quantitative easing measures to support credit markets.
In this environment, the prices of U.S. stocks, as measured by the Standard & Poor’s® 500 Index (S&P 500®), dropped 4.12%, (the index decreasing from 3,037.56 to 2,912.43).1,2 Investment-grade bonds, as measured by the Bloomberg Barclays U.S. Aggregate Bond Index (Bloomberg Index), posted a +4.86% total return (an index increase from 2,227.69 to 2,335.85), which includes reinvestment of interest.3
We are committed to our long-term perspective and disciplined investment approach as we conduct a rigorous, fundamental analysis of securities with a regular emphasis on investment risk management.
We believe active, professional investment management serves investors well. We also recognize the important role of financial advisors in today’s markets and encourage investors to continue to seek their advice. Amid changing markets and economic conditions, we are confident investors
with a well-diversified portfolio and a patient, long-term outlook should be well-positioned for the years ahead.
Franklin Investors Securities Trust’s semiannual report, covering Franklin Adjustable U.S. Government Securities Fund, Franklin Floating Rate Daily Access Fund, Franklin Low Duration Total Return Fund and Franklin Total Return Fund, includes more detail about prevailing conditions and a discussion about investment decisions during the period. Please remember all securities markets fluctuate, as do mutual fund share prices.
We thank you for investing with Franklin Templeton, welcome your questions and comments, and look forward to serving your future investment needs.
Sincerely,
Rupert H. Johnson, Jr.
Chairman
Franklin Investors Securities Trust
This letter reflects our analysis and opinions as of April 30, 2020, unless otherwise indicated. The information is not a complete analysis of every aspect of any market, country, industry, security or fund. Statements of fact are from sources considered reliable.
1. Source: Copyright © 2020, S&P Dow Jones Indices LLC. All rights reserved.
2. Source: Morningstar. The changes in index prices shown for the S&P 500 do not include reinvestments of income and distributions, which are included in its total return, which was: S&P 500 -3.16% (index total return resulting in a decrease from 6,138.73 to 5,944.68).
3. Sources: Morningstar and Bloomberg Barclays Indices. For the Bloomberg Index, only total return as shown is available, not price change without the inclusion of reinvested income and distributions.
See www.franklintempletondatasources.com for additional data provider information.
|
Not FDIC Insured | May Lose Value | No Bank Guarantee
|
|
franklintempleton.com | Not part of the semiannual report | 1 | ||
| ||||
Semiannual Report | ||||
| 3 | ||||
| 4 | ||||
| 9 | ||||
| 16 | ||||
| 22 | ||||
| 28 | ||||
| 133 | ||||
| 139 | ||||
| 173 | ||||
Visit franklintempleton.com for fund updates, to access your account, or to find helpful financial planning tools. | ||
| 2 |
Semiannual Report | franklintempleton.com | ||
SEMIANNUAL REPORT
The U.S. bond market’s performance during the six-month period, as measured by the Bloomberg Barclays U.S. Aggregate Bond Index, was defined by two distinct phases: before and during the outbreak of the novel coronavirus (COVID-19). Until late February 2020, prices for most U.S. bonds rose, and their yields declined, driven by low inflation, interest-rate cuts and strong demand for yield. In late February, as more countries adopted social distancing and lockdown measures to slow the global pandemic, the U.S. bond market began pricing in the adverse impact on economic activity. Higher-quality, longer-term bonds rallied, while riskier, lower-rated corporate bonds declined sharply, reflecting a reversal in many investors’ risk appetite.
The U.S. Federal Reserve (Fed) enacted two emergency rate cuts in March 2020 in response to the COVID-19 pandemic, lowering the federal funds target rate to a range of 0.00%—0.25%. In addition, the Fed announced unlimited, open-ended purchasing of government-backed and corporate bonds to help keep markets functioning, significantly expanding its balance sheet. Meanwhile, Congress passed the Coronavirus Aid, Relief and Economic Security Act to provide economic relief, which will likely lead to a sizable amount in U.S. Treasury debt issuance in 2020, according to the Congressional Budget Office.
U.S. Treasury bonds, as measured by the Bloomberg Barclays U.S. Treasury Index, rose significantly during the reporting period. Bond purchasing by the Fed and robust demand for investments perceived as safe drove the U.S. Treasury market higher despite the widening budget deficit and the massive increase in issuance. The yield on 10-year U.S. Treasury bonds declined to historic lows near period-end, while some short-term U.S. Treasury yields briefly dropped below zero. Mortgage-backed securities (MBS), as measured by the Bloomberg Barclays MBS Index, also posted positive returns, aided by the Fed’s decision to purchase agency MBS.
U.S. corporate bond performance was hampered by investor concerns about the pandemic-related economic disruption and the potential credit downgrades of many companies amid high levels of indebtedness. However, investment-grade corporate bonds, as represented by the Bloomberg Barclays U.S. Corporate Bond Index, rebounded near period-end to post positive returns overall as the Fed supported the corporate bond market by facilitating new bond issuance and buying bonds from investors. In contrast, high-yield corporate bonds, as
represented by the Bloomberg Barclays U.S. Corporate High Yield Bond Index, declined significantly due to investor concerns about a potential increase in credit defaults.
The foregoing information reflects our analysis and opinions as of April 30, 2020. The information is not a complete analysis of every aspect of any market, country, industry, security or fund. Statements of fact are from sources considered reliable.
| franklintempleton.com |
Semiannual Report | 3 | ||
Franklin Adjustable U.S. Government Securities Fund
This semiannual report for Franklin Adjustable U.S. Government Securities Fund covers the period ended April 30, 2020.
Your Fund’s Goal and Main Investments
The Fund seeks to provide a high level of current income while providing lower volatility of principal than a fund that invests in fixed-rate securities by investing at least 80% of its net assets in adjustable-rate U.S. government mortgage securities, which are issued or guaranteed by the U.S. government, its agencies or instrumentalities.1 The Fund’s investments may include securities issued by Ginnie Mae (GNMA) and government-sponsored entities, such as Fannie Mae (FNMA) and Freddie Mac (FHLMC).2
Performance Overview
The Fund’s Class A shares posted a +0.25% cumulative total return for the six months under review. In comparison, the Fund’s benchmark, the Bloomberg Barclays U.S. Government Index: 1-2 Year Component posted a +2.57% total return.3 The index measures public obligations of the U.S. Treasury with one to two years to final maturity and publicly issued debt of U.S. government agencies, quasi-federal corporations, and corporate or foreign debt guaranteed by the U.S. government. You can find the Fund’s long-term performance data in the Performance Summary beginning on page 6.
Performance data represent past performance, which does not guarantee future results. Investment return and principal value will fluctuate, and you may have a gain or loss when you sell your shares. Current performance may differ from figures shown. For most recent month-end performance, go to franklintempleton.com or call (800) 342-5236.
Investment Strategy
We employ a conservative investment strategy as we strive to produce solid performance in a variety of interest rate climates. We choose securities using a value-oriented
Portfolio Composition
Based on Total Net Assets as of 4/30/20
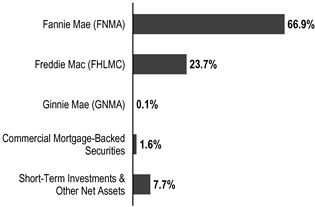
approach, emphasizing the bonds’ economic fundamentals in relation to comparable securities as well as their historical prepayment performance.
Manager’s Discussion
The Fund employed a conservative strategy that invested primarily in adjustable-rate mortgage securities (ARMs) that are either explicitly or implicitly backed by the U.S. government.1 During the period, the Fund invested predominantly in securities issued or guaranteed by FNMA and FHLMC. The Fund took a collateral-intensive research approach to analyze the prepayment behavior of individual ARMs to identify those with the most attractive prepayment profiles and focused on seasoned ARMs. Such securities have typically been through several interest-rate cycles and therefore tend to be less sensitive to changes in interest rates, compared to newer issued counterparts. We have found such securities historically to have experienced lower volatility than comparable maturity Treasuries and have provided more consistent income.
During the period, the Fund’s primary focus continued to be on seasoned, shorter-maturity, high-quality ARMs that tend to be less sensitive to interest-rate changes and supported
1. Securities owned by the Fund, but not shares of the Fund, are issued or guaranteed by the U.S. government, its agencies or instrumentalities, including government sponsored entities, as to timely payment of principal and interest.
2. Although U.S. government-sponsored entities may be chartered by acts of Congress, their securities are neither issued nor guaranteed by the U.S. Government. Please see the Fund’s prospectus for a detailed discussion regarding various levels of credit support for government agency or instrumentality securities. The Fund’s yield and share price are not guaranteed and will vary with market conditions.
3. Source: Morningstar.
The index is unmanaged and includes reinvestment of any income or distributions. It does not reflect any fees, expenses or sales charges. One cannot invest directly in an index, and an index is not representative of the Fund’s portfolio.
The dollar value, number of shares or principal amount, and names of all portfolio holdings are listed in the Fund’s Statement of Investments (SOI).
The SOI begins on page 33.
| 4 |
Semiannual Report | franklintempleton.com | ||
FRANKLIN ADJUSTABLE U.S. GOVERNMENT SECURITIES FUND
Dividend Distributions*
11/1/19–4/30/20
| Dividend per Share (cents) | ||||||||||||||||||||
| Month | Class A | Class A1 | Class C | Class R6 | Advisor Class | |||||||||||||||
November | 1.7765 | 1.8723 | 1.5274 | 2.0223 | 1.9383 | |||||||||||||||
December | 1.8580 | 1.9623 | 1.5773 | 2.1213 | 2.0350 | |||||||||||||||
January | 1.7421 | 1.8432 | 1.4703 | 1.9934 | 1.9134 | |||||||||||||||
February | 1.6620 | 1.7542 | 1.4158 | 1.8916 | 1.8181 | |||||||||||||||
March | 1.5517 | 1.6569 | 1.2710 | 1.8098 | 1.7286 | |||||||||||||||
April | 1.4064 | 1.5022 | 1.1460 | 1.6465 | 1.5688 | |||||||||||||||
Total | 9.9967 | 10.5911 | 8.4078 | 11.4849 | 11.0022 | |||||||||||||||
*The distribution amount is the sum of all estimated tax-basis net investment income distributions for the period shown. A portion or all of the distribution may be reclassified as return of capital or short-term or long-term capital gains once final tax designations are known. Assumes shares were purchased and held for the entire accrual period. Since dividends accrue daily, your actual distributions will vary depending on the date you purchased your shares and any account activity. All Fund distributions will vary depending upon current market conditions, and past distributions are not indicative of future trends.
performance. Additionally, we deployed capital into agency collateralized mortgage obligation (CMO) floaters and 15-year fixed-rate agency mortgage backed securities markets as we found them to be appealing yield alternatives to the agency hybrid ARM markets. We continued to focus on diverse, seasoned, post-reset FNMA and FHLMC ARMs with average coupons above 3% and larger loan counts, as well as sequential CMO floaters backed by seasoned collateral. Secondary flows during March 2020 were particularly heavy as many real estate investment trusts (REITs) struggled to meet margin calls and were forced to unwind their agency mortgage portfolios including post reset hybrids, which put pressure on clearing levels but the secondary market activity of CMO floaters in our view, continued to be relatively healthy.
Prepayment rate uncertainty hampered both the fixed-rate and ARM markets outlook as they remained significantly elevated. We continued to be cautious about future prepayment speeds given a significant rally in mortgage rates and with securities trading at considerable premiums. The outlook for prepayments has been a bit mixed given the COVID-19 virus but we do feel they will be elevated in the long run and lead to a downward pressure on the U.S. dollar. With a shift toward a flatter yield curve, and absolute prepayments continuing to be elevated, we remain cautious going forward. We do believe that with borrowers having experienced a full year of mortgages resetting upward, a burnout effect could offset some of the refinance incentive,
which would help lower prepayment rates at some point in the future. Our preference remains towards bonds linked to the London Interbank Offered Rate (LIBOR) index,4 which we believe would have slower speeds relative to those indexed off of the Constant Maturity Treasury Index. Given the high probability of elevated speeds for the foreseeable future in a market where the premiums are quite significant, we have retained a slightly higher cash allocation.
Thank you for your continued participation in Franklin Adjustable U.S. Government Securities Fund. We look forward to serving your future investment needs.
 |
Paul Varunok Lead Portfolio Manager |

The foregoing information reflects our analysis, opinions and portfolio holdings as of April 30, 2020, the end of the reporting period. The way we implement our main investment strategies and the resulting portfolio holdings may change depending on factors such as market and economic conditions. These opinions may not be relied upon as investment advice or an offer for a particular security. The information is not a complete analysis of every aspect of any market, country, industry, security or the Fund. Statements of fact are from sources considered reliable, but the investment manager makes no representation or warranty as to their completeness or accuracy. Although historical performance is no guarantee of future results, these insights may help you understand our investment management philosophy.
4. The London Interbank Offered Rate (LIBOR) is the interest rate banks charge each other for loans. LIBOR is a widely used benchmark for short-term interest rates. See www.franklintempletondatasources.com for additional data provider information.
franklintempleton.com | Semiannual Report | 5 | ||
FRANKLIN ADJUSTABLE U.S. GOVERNMENT SECURITIES FUND
Performance Summary as of April 30, 2020
The performance tables do not reflect any taxes that a shareholder would pay on Fund dividends, capital gain distributions, if any, or any realized gains on the sale of Fund shares. Total return reflects reinvestment of the Fund’s dividends and capital gain distributions, if any, and any unrealized gains or losses. Your dividend income will vary depending on dividends or interest paid by securities in the Fund’s portfolio, adjusted for operating expenses of each class. Capital gain distributions are net profits realized from the sale of portfolio securities.
Performance as of 4/30/201
Cumulative total return excludes sales charges. Average annual total return includes maximum sales charges. Sales charges will vary depending on the size of the investment and the class of share purchased. The maximum is 2.25% and the minimum is 0%. Class A: 2.25% maximum initial sales charge; Advisor Class: no sales charges. For other share classes, visit franklintempleton.com.
Share Class | Cumulative Total Return2 | | Average Annual Total Return | 3 | ||
A 6-Month | +0.25% | -1.95% | ||||
1-Year | +1.39% | -0.95% | ||||
5-Year | +2.18% | �� | -0.03% | |||
10-Year | +6.68% | +0.42% | ||||
Advisor 6-Month | +0.38% | +0.38% | ||||
1-Year | +1.65% | +1.65% | ||||
5-Year | +3.48% | +0.69% | ||||
10-Year | +9.39% | +0.90% | ||||
| Distribution | 30-Day Standardized Yield5 | |||||||||||||
| Share Class | Rate4 | (with fee waiver) | (without fee waiver) | |||||||||||
A | 2.11% | 1.17% | 1.16% | |||||||||||
Advisor | 2.40% | 1.45% | 1.43% | |||||||||||
Performance data represent past performance, which does not guarantee future results. Investment return and principal value will fluctuate, and you may have a gain or loss when you sell your shares. Current performance may differ from figures shown. For most recent month-end performance, go to franklintempleton.com or call (800) 342-5236.
See page 7 for Performance Summary footnotes.
| 6 |
Semiannual Report | franklintempleton.com | ||||
FRANKLIN ADJUSTABLE U.S. GOVERNMENT SECURITIES FUND
PERFORMANCE SUMMARY
Distributions (11/1/19–4/30/20)
| Share Class | Net Investment Income | |
A | $0.099967 | |
A1 | $0.105911 | |
C | $0.084078 | |
R6 | $0.114849 | |
Advisor | $0.110022 | |
Total Annual Operating Expenses6
| Share Class | With Fee Waiver | Without Fee Waiver | ||||||||
A | 0.95% | 0.96% | ||||||||
Advisor | 0.70% | 0.71% | ||||||||
All investments involve risks, including possible loss of principal. Interest rate movements, unscheduled mortgage prepayments and other risk factors will affect the Fund’s share price and yield. Bond prices generally move in the opposite direction of interest rates. As the pries of bonds in a Fund adjust to a rise in interest rates, the Fund’s share price may decline. Changes in the financial strength of a bond issuer or in a bond’s credit rating may affect its value. Unexpected events and their aftermaths, such as the spread of deadly diseases; natural, environmental or man-made disasters; financial, political or social disruptions; terrorism and war; and other tragedies or catastrophes, can cause investor fear and panic, which can adversely affect the economies of many companies, sectors, nations, regions and the market in general, in ways that cannot necessarily be foreseen. The Fund’s prospectus also includes a description of the main investment risks.
1. The Fund has a fee waiver associated with any investment it makes in a Franklin Templeton money fund and/or other Franklin Templeton fund, contractually guaranteed through 2/28/21. Fund investment results reflect the fee waiver; without this waiver, the results would have been lower.
2. Cumulative total return represents the change in value of an investment over the periods indicated.
3. Average annual total return represents the average annual change in value of an investment over the periods indicated. Return for less than one year, if any, has not been annualized.
4. Distribution rate is based on an annualization of the sum of the respective class’s past month’s daily distributions and the maximum offering price (NAV for Advisor Class) per share on 4/30/20.
5. The Fund’s 30-day standardized yield is calculated over a trailing 30-day period using the yield to maturity on bonds and/or the dividends accrued on stocks. It may not equal the Fund’s actual income distribution rate, which reflects the Fund’s past dividends paid to shareholders.
6. Figures are as stated in the Fund’s current prospectus and may differ from the expense ratios disclosed in the Your Fund’s Expenses and Financial Highlights sections in this report. In periods of market volatility, assets may decline significantly, causing total annual Fund operating expenses to become higher than the figures shown.
franklintempleton.com | Semiannual Report | 7 | ||||
FRANKLIN ADJUSTABLE U.S. GOVERNMENT SECURITIES FUND
Your Fund’s Expenses
As a Fund shareholder, you can incur two types of costs: (1) transaction costs, including sales charges (loads) on Fund purchases and redemptions; and (2) ongoing Fund costs, including management fees, distribution and service (12b-1) fees, and other Fund expenses. All mutual funds have ongoing costs, sometimes referred to as operating expenses. The table below shows ongoing costs of investing in the Fund and can help you understand these costs and compare them with those of other mutual funds. The table assumes a $1,000 investment held for the six months indicated.
Actual Fund Expenses
The table below provides information about actual account values and actual expenses in the columns under the heading “Actual.” In these columns the Fund’s actual return, which includes the effect of Fund expenses, is used to calculate the “Ending Account Value” for each class of shares. You can estimate the expenses you paid during the period by following these steps (of course, your account value and expenses will differ from those in this illustration): Divide your account value by $1,000 (if your account had an $8,600 value, then $8,600 ÷ $1,000 = 8.6). Then multiply the result by the number in the row for your class of shares under the headings “Actual” and “Expenses Paid During Period” (if Actual Expenses Paid During Period were $7.50, then 8.6 x $7.50 = $64.50). In this illustration, the actual expenses paid this period are $64.50.
Hypothetical Example for Comparison with Other Funds
Under the heading “Hypothetical” in the table, information is provided about hypothetical account values and hypothetical expenses based on the Fund’s actual expense ratio and an assumed rate of return of 5% per year before expenses, which is not the Fund’s actual return. This information may not be used to estimate the actual ending account balance or expenses you paid for the period, but it can help you compare ongoing costs of investing in the Fund with those of other funds. To do so, compare this 5% hypothetical example for the class of shares you hold with the 5% hypothetical examples that appear in the shareholder reports of other funds.
Please note that expenses shown in the table are meant to highlight ongoing costs and do not reflect any transactional costs. Therefore, information under the heading “Hypothetical” is useful in comparing ongoing costs only, and will not help you compare total costs of owning different funds. In addition, if transactional costs were included, your total costs would have been higher.
Actual (actual return after expenses) | Hypothetical (5% annual return before expenses) | |||||||||||||||||
|
| |||||||||||||||||
Share Class | Beginning Account Value 11/1/19 | Ending Account Value 4/30/20 | Expenses Paid During Period 11/1/19–4/30/201, 2 | Ending Account Value 4/30/20 | Expenses Paid During Period 11/1/19–4/30/201, 2 | Net Annualized Expense Ratio2 | ||||||||||||
|
|
|
| |||||||||||||||
| A | $1,000 | $1,002.50 | $4.78 | $1,020.09 | $4.82 | 0.96% | ||||||||||||
| A1 | $1,000 | $1,003.30 | $4.03 | $1,020.84 | $4.07 | 0.81% | ||||||||||||
| C | $1,000 | $1,000.50 | $6.76 | $1,018.10 | $6.82 | 1.36% | ||||||||||||
| R6 | $1,000 | $1,005.60 | $2.94 | $1,021.93 | $2.97 | 0.59% | ||||||||||||
| Advisor | $1,000 | $1,003.80 | $3.54 | $1,021.33 | $3.57 | 0.71% | ||||||||||||
1. Expenses are equal to the annualized expense ratio for the six-month period as indicated above—in the far right column—multiplied by the simple average account value over the period indicated, and then multiplied by 182/366 to reflect the one-half year period.
2. Reflects expenses after fee waivers and expense reimbursements. Does not include acquired fund fees and expenses.
8 |
Semiannual Report |
franklintempleton.com | ||
Franklin Floating Rate Daily Access Fund
This semiannual report for Franklin Floating Rate Daily Access Fund covers the period ended April 30, 2020.
Your Fund’s Goal and Main Investments
The Fund seeks to provide a high level of current income and, secondarily, preservation of capital by investing at least 80% of its net assets in income-producing floating interest-rate corporate loans and corporate debt securities made to or issued by U.S. companies, non-U.S. entities and U.S. subsidiaries of non-U.S. entities.
What are corporate loans?
Corporate loans are typically floating rate loans to corporate borrowers made by a group, or syndicate, of banks and other financial institutions. These loans provide capital to companies for varied purposes, such as merger and acquisition activity, leveraged buyouts or refinancings. These loans are typically syndicated to a group of investors.
|
Performance Overview
The Fund’s Class A shares posted a -9.66% cumulative total return for the six months under review. In comparison, the Credit Suisse Leveraged Loan Index (CS LLI), which is designed to mirror the investable universe of the U.S. dollar-denominated leveraged loan market, posted a -7.50% total return.1 You can find more of the Fund’s performance data in the Performance Summary beginning on page 13.
Performance data represent past performance, which does not guarantee future results. Investment return and principal value will fluctuate, and you may have a gain or loss when you sell your shares. Current performance may differ from figures shown. For most recent month-end performance, go to franklintempleton.com or call (800) 342-5236.
Corporate Loan Market Overview
Favorable investor sentiment at the beginning of the period led to solid returns, as many investors expected future rate cuts to be on hold. Outflows from retail loan investment vehicles decelerated and many investors turned to discounted, lower-rated companies in order to put cash to work. However, as fears of the impact of COVID-19 on the
Portfolio Composition*
Based on Total Net Assets as of 4/30/20
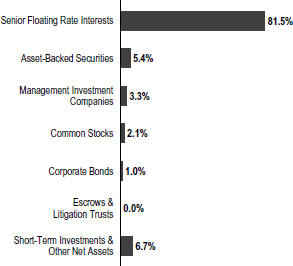
*Figures reflect certain derivatives held in the portfolio (or their underlying reference assets) and may not total 100% or may be negative due to rounding, use of derivatives, unsettled trades or other factors.
global economy surfaced, the loan market entered a risk-off mode in March 2020, which recorded some of the worst daily declines since the global financial crisis more than a decade ago. While the market partially retraced the worst declines by period-end, the technical environment remained relatively weak, and aggressive credit rating downgrades furthered price separation across the market.
At the beginning of the period, outflows from retail investors moderated and the asset class reported modest weekly inflows. However, the increasing likelihood of a global recession and aggressive U.S. Federal Reserve (Fed) interest-rate cuts in response to the economic slowdown resulted in heavy outflows from retail loan investment vehicles. The accommodative action from the Fed led to declines in Rising London Interbank Offered Rates (LIBOR), resulting in lowered coupons throughout the loan market as most loans had not instituted LIBOR’s protective floors. Elevated redemption activity led managers to sell loans across the credit quality spectrum, leading to significant
1. Source: Credit Suisse Group.
The index is unmanaged and includes reinvestment of any income or distributions. It does not reflect any fees, expenses or sales charges. One cannot invest directly in an index, and an index is not representative of the Fund’s portfolio.
See www.franklintempletondatasources.com for additional data provider information.
The dollar value, number of shares or principal amount, and names of all portfolio holdings are listed in the Fund’s Statement of Investments (SOI). The SOI begins on page 41.
franklintempleton.com | Semiannual Report | 9 | ||||
FRANKLIN FLOATING RATE DAILY ACCESS FUND
dislocation in prices and wide bid-ask spreads. Although collateralized loan obligations (CLOs) issuance had supported loan demand earlier in the period, the volume stalled in March as spreads widened. After the announcement of fiscal stimulus in the U.S., investor sentiment and technical conditions improved as severe outflows eventually subsided and modest CLO activity resumed. Loan prices rallied as a result, and gains were led by higher-rated loans and those in industries perceived to be less impacted by the crisis. However, technical conditions were still relatively weak as CLO spreads remained wide and lower income generation resulted in restrained demand from retail investors at period-end.
Dividend Distributions*
11/1/19–4/30/20
| Dividend per Share (cents) | ||||||||||||||||
| Advisor | ||||||||||||||||
| Month | Class A | Class C | Class R6 | Class | ||||||||||||
November | 3.2911 | 3.0343 | 3.5181 | 3.4540 | ||||||||||||
December** | 4.0324 | 3.7464 | 4.2934 | 4.2162 | ||||||||||||
January | 3.5002 | 3.2207 | 3.7526 | 3.6769 | ||||||||||||
February | 2.8759 | 2.6231 | 3.1087 | 3.0360 | ||||||||||||
March | 2.6089 | 2.3447 | 2.8482 | 2.7733 | ||||||||||||
April | 3.1701 | 2.9350 | 3.3826 | 3.3268 | ||||||||||||
Total | 19.4786 | 17.9042 | 20.9036 | 20.4832 | ||||||||||||
*The distribution amount is the sum of all estimated tax-basis net investment income distributions for the period shown. A portion or all of the distribution may be reclassified as return of capital or short-term or long-term capital gains once final tax designations are known. Assumes shares were purchased and held for the entire accrual period. Since dividends accrue daily, your actual distributions will vary depending on the date you purchased your shares and any account activity. All Fund distributions will vary depending upon current market conditions, and past distributions are not indicative of future trends.
**Includes additional income distributions made in order to meet excise tax requirements.
While a stronger technical environment and higher loan prices at the beginning of the period led to a significant repricing wave in January 2020, new issuance was on hold for much of March. Primary activity eventually resumed, but new loan deals were sparse and included issuers that needed liquidity and offered wider spreads. New issuance picked up slightly by the end of the period, but expectations for robust volume was subdued amid weaker demand from traditional loan retail investors and CLOs. Among issuers that had bonds and loans, more looked to raise capital with high-yield bonds in consideration of stronger technical conditions in the high-yield bond market.
Loan default activity was muted for much of the period but increased sharply as more issuers experienced impacts from the slowdown in economic activity. At the end of the period, the default rate approached its historical average and the
rate by issuer count was the highest since 2010. Despite the partial recovery in the market, a significant share of loans continued to trade at distressed levels. Furthermore, the pace of credit rating downgrades accelerated, particularly within cyclical industries that were more sensitive to the impacts of both weaker consumer demand and mandated shutdowns. As a result, fundamental conditions and prices diverged between higher-quality issuers and those with weaker liquidity.
Investment Strategy
We use a detailed credit analysis process to select corporate loan and corporate debt securities that meet our criteria. We conduct ongoing credit monitoring of our investments. To help manage the credit risk associated with investing in securities rated below investment grade (or if unrated, of comparable quality), we seek to diversify the Fund by investing in a large number of loans of companies that we have identified as having attractive risk/reward profiles, favorable capital structures, strong asset coverage and dominant market shares. This diversification potentially reduces credit risk by spreading assets across many different industries.
Manager’s Discussion
During the six-month period under review, the Fund underperformed its benchmark, the CS LLI. The Fund maintained an overweight in the upper tier of the market throughout the period, which contributed to performance as upper tier loans in the index returned -4.88%, middle tier returned -7.48%, and lower tier returned -20.36%, according to the CS LLI. Although upper tier loans outperformed over the period, performance was primarily driven by loan selection, especially loans that were more impacted by COVID-19 shutdowns, travel restrictions and declines in oil prices, including those in the energy, gaming/leisure, and retail industries.
The top contributors to performance included loans that investors perceived to be more insulated from the impact of COVID-19 or completed transactions that contributed to performance during the period. The equity and term loan position of Appvion Operations (a manufacturer of carbonless paper) contributed to performance as the term loan provided attractive income generation despite dealing with difficult market conditions. The company maintained good liquidity and the proceeds of an asset sale paid down a portion of the term loan position at par. The term loans of Doncasters U.S. Finance, a manufacturer of components for the aerospace and industrial markets, contributed to performance as it completed its restructuring process and a
10 |
Semiannual Report |
franklintempleton.com | ||
FRANKLIN FLOATING RATE DAILY ACCESS FUND
Top 10 Holdings
4/30/20
Company Sector/Industry | % of Total Net Assets | |||
FGI Operating Co. LLC (Freedom Group) Personal Products | 3.8% | |||
CSC Holdings LLC Cable & Satellite | 2.3% | |||
Berry Global Inc. Paper Packaging | 2.3% | |||
General Nutrition Centers, Inc. Specialty Stores | 2.3% | |||
JBS USA Lux SA Packaged Foods & Meats | 2.2% | |||
CSM Bakery Supplies LLC Packaged Foods & Meats | 2.1% | |||
99 Cents Only Stores General Merchandise Stores | 2.0% | |||
Navistar Inc. Industrial Machinery | 2.0% | |||
Appvion Operations Inc. Forest Products | 1.9% | |||
Onsite Rental Group Operations Pty. Ltd. ( ) Industrial Machinery | 1.8% | |||
new management team looked to implement its turnaround strategy. However, as oil prices declined to unprecedented levels amid a falloff in demand, issuers exposed to energy prices were among the top detractors from performance. The term loan of Fieldwood Energy, a producer of oil and gas, declined as the sharp drop in oil prices was expected to negatively impact the company’s cash flow and liquidity. The lower price of crude oil also led to declines for the term loans of Utex Industries, a manufacturer and provider of sealing products, as demand for its products from customers in the energy sector was expected to weaken.
Throughout the period, we looked to reduce our exposures to large oversized volatile positions and execute on our long-term strategy of diversifying the portfolio in terms of the number of positions held. This included further reductions in our Fieldwood Energy position and exiting our last coal position with coal producer, Wolverine Fuels (not held at period-end). However, as the market experienced more volatility, we looked to add to our cash balances both for potential elevated redemptions and opportunities to pick up higher-quality assets at depressed levels. Our largest sells during the period included companies in industries that we believed would continue to see further weakness due to depressed demand and COVID-19 shutdowns, such as
retail, foodservice, energy and aerospace. In addition, the Fund reduced its investment in CLOs by selling A rated tranches.
The Fund continued to maintain a significant overweight in higher-rated loans as upper tier loans were slightly less than half of the loan portfolio at the end of the period, compared to around a quarter for the index. In addition, we maintained the Fund’s investment in the Franklin Floating Rate Income Fund, which allowed the Fund to have further exposure to credit, while providing a potential source of liquidity. In an effort to protect against volatility in the credit markets, the Fund held a high-yield bond credit default swap index that provided synthetic exposure to the high-yield bond market.
Thank you for your continued participation in Franklin Floating Rate Daily Access Fund. We look forward to serving your future investment needs.
|
Reema Agarwal, CFA | |
|
Justin Ma, CFA | |
| Margaret Chiu, CFA | ||
| Judy Sher | ||
| Portfolio Management Team | ||


| franklintempleton.com |
Semiannual Report | 11 | ||||
FRANKLIN FLOATING RATE DAILY ACCESS FUND
The foregoing information reflects our analysis, opinions and portfolio holdings as of April 30, 2020, the end of the reporting period. The way we implement our main investment strategies and the resulting portfolio holdings may change depending on factors such as market and economic conditions. These opinions may not be relied upon as investment advice or an offer for a particular security. The information is not a complete analysis of every aspect of any market, country, industry, security or the Fund. Statements of fact are from sources considered reliable, but the investment manager makes no representation or warranty as to their completeness or accuracy. Although historical performance is no guarantee of future results, these insights may help you understand our investment management philosophy.
12 |
Semiannual Report |
franklintempleton.com | ||
FRANKLIN FLOATING RATE DAILY ACCESS FUND
Performance Summary as of April 30, 2020
The performance tables do not reflect any taxes that a shareholder would pay on Fund dividends, capital gain distributions, if any, or any realized gains on the sale of Fund shares. Total return reflects reinvestment of the Fund’s dividends and capital gain distributions, if any, and any unrealized gains or losses. Your dividend income will vary depending on dividends or interest paid by securities in the Fund’s portfolio, adjusted for operating expenses of each class. Capital gain distributions are net profits realized from the sale of portfolio securities.
Performance as of 4/30/201
Cumulative total return excludes sales charges. Average annual total return includes maximum sales charges. Sales charges will vary depending on the size of the investment and the class of share purchased. The maximum is 2.25% and the minimum is 0%. Class A: 2.25% maximum initial sales charge; Advisor Class: no sales charges. For other share classes, visit franklintempleton.com.
| Share Class | Cumulative Total Return2 | Average Annual Total Return3 | ||
A 6-Month
| -9.66%
| -11.71%
| ||
1-Year
| -11.13%
| -13.16%
| ||
5-Year
| +0.12%
| -0.44%
| ||
10-Year
| +22.62%
| +1.83%
| ||
Advisor 6-Month
| -9.54%
| -9.54%
| ||
1-Year
| -11.01%
| -11.01%
| ||
5-Year
| +1.37%
| +0.27%
| ||
10-Year
| +25.71%
| +2.31%
| ||
| Distribution | 30-Day Standardized Yield5 | |||||||||
| Share Class | Rate4 | (with fee waiver) | (without fee waiver) | |||||||
A
|
5.23%
|
6.85%
|
6.81%
| |||||||
Advisor
|
5.61%
|
7.27%
|
7.23%
| |||||||
Performance data represent past performance, which does not guarantee future results. Investment return and principal value will fluctuate, and you may have a gain or loss when you sell your shares. Current performance may differ from figures shown. For most recent month-end performance, go to franklintempleton.com or call (800) 342-5236.
See page 14 for Performance Summary footnotes.
| franklintempleton.com |
Semiannual Report | 13 | ||||
FRANKLIN FLOATING RATE DAILY ACCESS FUND
PERFORMANCE SUMMARY
Distributions (11/1/19–4/30/20)
| Share Class | Net Investment Income | |||||||
A
| $0.194786
| |||||||
C
| $0.179042
| |||||||
R6
| $0.209036
| |||||||
Advisor
| $0.204832
| |||||||
Total Annual Operating Expenses6
| ||||||||
| Share Class | With Fee Waiver | Without Fee Waiver | ||||||
A
|
0.89% |
0.92% | ||||||
Advisor
|
0.64%
|
0.67%
| ||||||
Each class of shares is available to certain eligible investors and has different annual fees and expenses, as described in the prospectus
All investments involve risks, including loss of principal. Investors should be aware that the Fund’s share price and yield will fluctuate with market conditions. The Fund should not be considered alternative to money market funds or certificates of deposit (CDs). The floating rate loans and debt securities in which the Fund invests tend to be rated below investment grade. Investing in higher-yielding, lower-rated, floating rate loans and debt securities involved greater risk of default, which could result in loss of principal—a risk that may be heightened in a slowing economy. Interest earned on floating rate loans varies with changes in prevailing interest rates. Therefore, while floating rate loans offer higher interest income when interest rates rise, they will also generate less income when interest rates decline. Changes in the financial strength of a bond issuer or in a bond’s credit rating may affect its value. Unexpected events and their aftermaths, such as the spread of deadly diseases; natural, environmental or man-made disasters; financial, political or social disruptions; terrorism and war; and other tragedies or catastrophes, can cause investor fear and panic, which can adversely affect the economies of many companies, sectors, nations, regions and the market in general, in ways that cannot necessarily be foreseen. The Fund’s prospectus also includes a description of the main investment risks.
1. The Fund has a fee waiver associated with any investment it makes in a Franklin Templeton money fund and/or other Franklin Templeton fund, contractually guaranteed through 2/28/21. Fund investment results reflect the fee waiver; without this waiver, the results would have been lower.
2. Cumulative total return represents the change in value of an investment over the periods indicated.
3. Average annual total return represents the average annual change in value of an investment over the periods indicated. Return for less than one year, if any, has not been annualized.
4. Distribution rate is based on an annualization of the sum of the respective class’s past month’s daily distributions and the maximum offering price (NAV for Advisor Class) per share on 4/30/20.
5. The Fund’s 30-day standardized yield is calculated over a trailing 30-day period using the yield to maturity on bonds and/or the dividends accrued on stocks. It may not equal the Fund’s actual income distribution rate, which reflects the Fund’s past dividends paid to shareholders.
6. Figures are as stated in the Fund’s current prospectus and may differ from the expense ratios disclosed in the Your Fund’s Expenses and Financial Highlights sections in this report. In periods of market volatility, assets may decline significantly, causing total annual Fund operating expenses to become higher than the figures shown.
| 14 | Semiannual Report |
franklintempleton.com | ||
FRANKLIN FLOATING RATE DAILY ACCESS FUND
Your Fund’s Expenses
As a Fund shareholder, you can incur two types of costs: (1) transaction costs, including sales charges (loads) on Fund purchases and redemptions; and (2) ongoing Fund costs, including management fees, distribution and service (12b-1) fees, and other Fund expenses. All mutual funds have ongoing costs, sometimes referred to as operating expenses. The table below shows ongoing costs of investing in the Fund and can help you understand these costs and compare them with those of other mutual funds. The table assumes a $1,000 investment held for the six months indicated.
Actual Fund Expenses
The table below provides information about actual account values and actual expenses in the columns under the heading “Actual.” In these columns the Fund’s actual return, which includes the effect of Fund expenses, is used to calculate the “Ending Account Value” for each class of shares. You can estimate the expenses you paid during the period by following these steps (of course, your account value and expenses will differ from those in this illustration): Divide your account value by $1,000 (if your account had an $8,600 value, then $8,600 ÷ $1,000 = 8.6). Then multiply the result by the number in the row for your class of shares under the headings “Actual” and “Expenses Paid During Period” (if Actual Expenses Paid During Period were $7.50, then 8.6 x $7.50 = $64.50). In this illustration, the actual expenses paid this period are $64.50.
Hypothetical Example for Comparison with Other Funds
Under the heading “Hypothetical” in the table, information is provided about hypothetical account values and hypothetical expenses based on the Fund’s actual expense ratio and an assumed rate of return of 5% per year before expenses, which is not the Fund’s actual return. This information may not be used to estimate the actual ending account balance or expenses you paid for the period, but it can help you compare ongoing costs of investing in the Fund with those of other funds. To do so, compare this 5% hypothetical example for the class of shares you hold with the 5% hypothetical examples that appear in the shareholder reports of other funds.
Please note that expenses shown in the table are meant to highlight ongoing costs and do not reflect any transactional costs. Therefore, information under the heading “Hypothetical” is useful in comparing ongoing costs only, and will not help you compare total costs of owning different funds. In addition, if transactional costs were included, your total costs would have been higher.
Actual (actual return after expenses) | Hypothetical (5% annual return before expenses) | |||||||||||||||||
|
| |||||||||||||||||
| Share Class | Beginning Account Value 11/1/19 | Ending Account Value 4/30/20 | Expenses Paid During Period | Ending Account Value 4/30/20 | Expenses Paid During Period | Net Annualized Expense Ratio2 | ||||||||||||
|
|
|
| |||||||||||||||
A | $1,000 | $903.40 | $4.40 | $1,020.24 | $4.67 | 0.93% | ||||||||||||
C | $1,000 | $901.60 | $6.29 | $1,018.25 | $6.67 | 1.33% | ||||||||||||
R6 | $1,000 | $905.20 | $2.75 | $1,021.98 | $2.92 | 0.58% | ||||||||||||
Advisor | $1,000 | $904.60 | $3.22 | $1,021.48 | $3.42 | 0.68% | ||||||||||||
1. Expenses are equal to the annualized expense ratio for the six-month period as indicated above—in the far right column—multiplied by the simple average account value over the period indicated, and then multiplied by 182/366 to reflect the one-half year period.
2. Reflects expenses after fee waivers and expense reimbursements. Does not include acquired fund fees and expenses.
franklintempleton.com | Semiannual Report | 15 | ||||
Franklin Low Duration Total Return Fund
This semiannual report for Franklin Low Duration Total Return Fund covers the period ended April 30, 2020.
Your Fund’s Goal and Main Investments
The Fund seeks a high level of current income as is consistent with prudent investing, while seeking capital preservation. The Fund invests primarily in investment-grade debt securities and investments, including government and corporate debt securities and mortgage- and asset-backed securities, targeting an estimated average portfolio duration of three years or less.
Performance Overview
The Fund’s Class A shares posted a -4.39% cumulative total return for the six months under review. In comparison, the Fund’s benchmark, the Bloomberg Barclays U.S. Government/Credit Index: 1-3 Year Component, posted a +2.58% total return.1 The index measures public obligations of the U.S. Treasury with one to three years to final maturity and publicly issued debt of U.S. government agencies, quasi-federal corporations, and corporate or foreign debt guaranteed by the U.S. government. You can find more of the Fund’s performance data in the Performance Summary beginning on page 19.
Performance data represent past performance, which does not guarantee future results. Investment return and principal value will fluctuate, and you may have a gain or loss when you sell your shares. Current performance may differ from figures shown. For most recent month-end performance, go to franklintempleton.com or call (800) 342-5236.
Investment Strategy
We seek to invest in a combination of fixed income securities, primarily from across the investment-grade debt universe. We analyze securities using proprietary and nonproprietary research to help us identify attractive investment opportunities across the entire fixed income opportunity set, on a relative basis. When making investment decisions, we evaluate business cycles, yield curves, and values between and within markets. Through a low duration portfolio, we seek to position the Fund to be less affected by
Portfolio Composition*
Based on Total Net Assets as of 4/30/20
*Figures reflect certain derivatives held in the portfolio (or their underlying reference assets) and may not total 100% or may be negative due to rounding, use of derivatives, unsettled trades or other factors.
**Includes non-agency residential mortgage backed securities, collateralized loan obligations and consumer loan certificates.
***Rounds to less than 0.1% of total net assets.
interest-rate changes than a fund with a higher duration. In addition, we may use derivative transactions, such as forwards, futures contracts and swap agreements to obtain net long or short exposures to select currencies, interest rates, countries, duration or credit risks.
1. Source: Morningstar.
The index is unmanaged and includes reinvestment of any income or distributions. It does not reflect any fees, expenses or sales charges. One cannot invest directly in an index, and an index is not representative of the Fund’s portfolio.
See www.franklintempletondatasources.com for additional data provider information.
The dollar value, number of shares or principal amount, and names of all portfolio holdings are listed in the Fund’s Statement of Investments (SOI).
The SOI begins on page 57.
16 | Semiannual Report | franklintempleton.com | ||
FRANKLIN LOW DURATION TOTAL RETURN FUND
What is duration?
| ||
Duration is a measure of a bond’s price sensitivity to interest-rate changes. In general, a portfolio of securities with a lower duration can be expected to be less sensitive to interest-rate changes than a portfolio with a higher duration.
|
What is the yield curve?
| ||
A yield curve is a line that plots the yield to maturity of bonds having equal credit quality against their maturity dates.
|
What is a currency forward contract?
| ||
A currency forward contract is an agreement between the Fund and a counterparty to buy or sell a foreign currency in exchange for another currency at a specific exchange rate on a future date. Currency forward contracts are privately traded in the interbank market, not on a centralized exchange.
|
What is a futures contract?
| ||
A futures contract is an agreement between the Fund and a counterparty made through a U.S. or foreign futures exchange to buy or sell an underlying instrument or asset at a specific price on a future date.
|
What are swap agreements?
| ||
Swap agreements, such as interest rate, fixed income total return, currency, inflation index and credit default swaps, are contracts between the Fund and another party (the swap counterparty). In a basic swap transaction, the Fund agrees with the swap counterparty to exchange the returns (or differentials in rates of return) earned or realized on a particular “notional amount” of underlying instruments. The notional amount is the set amount selected by the parties as the basis on which to calculate the obligations that they have agreed to exchange. The parties typically do not actually exchange the notional amount. Instead, they agree to exchange the returns that would be earned or realized if the notional amount were invested in given instruments or at given interest rates.
|
Manager’s Discussion
From a perspective of excess returns over Treasuries of similar duration, most fixed income sectors underperformed. As measured by Bloomberg Barclays indexes, higher quality agency mortgage sectors outperformed U.S. Treasuries while emerging market bonds, corporate credit (inclusive of high-yield and investment-grade corporate bonds, senior secured floating rate loans and collateralized loan obligations (CLOs)) and non-agency residential mortgage-backed securities (RMBS) underperformed Treasuries.
Dividend Distributions*
11/1/19–4/30/20
| Dividend per Share (cents) | ||||||||||||||||||||
| Month | Class A | Class C | Class R | Class R6 | Advisor Class | |||||||||||||||
November
|
| 2.1480
|
|
| 1.8357
|
|
| 2.0158
|
|
| 2.4549
|
|
| 2.3517
|
| |||||
December**
|
| 5.4798
|
|
| 5.1527
|
|
| 5.2954
|
|
| 5.8230
|
|
| 5.7054
|
| |||||
January
|
| 2.3595
|
|
| 2.0239
|
|
| 2.1553
|
|
| 2.6882
|
|
| 2.5803
|
| |||||
February
|
| 2.2401
|
|
| 1.9340
|
|
| 2.0794
|
|
| 2.5414
|
|
| 2.4401
|
| |||||
March
|
| 2.5903
|
|
| 2.2940
|
|
| 2.4243
|
|
| 2.8739
|
|
| 2.7892
|
| |||||
April
|
| 2.3682
|
|
| 2.0823
|
|
| 2.2095
|
|
| 2.6271
|
|
| 2.5539
|
| |||||
Total
|
| 17.1859
|
|
| 15.3226
|
|
| 16.1797
|
|
| 19.0085
|
|
| 18.4206
|
| |||||
*The distribution amount is the sum of all estimated tax-basis net investment income distributions for the period shown. A portion or all of the distribution may be reclassified as return of capital or short-term or long-term capital gains once final tax designations are known. Assumes shares were purchased and held for the entire accrual period. Since dividends accrue daily, your actual distributions will vary depending on the date you purchased your shares and any account activity. All Fund distributions will vary depending upon current market conditions, and past distributions are not indicative of future trends.
**Includes additional income distributions made in order to meet excise tax requirements.
During the period, our positioning was diversified from a risk perspective and was targeted into parts of the fixed income market where we felt valuations were attractive and fundamentals remained strong. Our largest exposures were in investment-grade corporate credit, RMBS, CLOs and Treasury Inflation-Protected Securities (TIPS).
While the Fund’s largest sector allocation was to investment-grade corporate credit, we were underweight the sector relative to the benchmark, which was a major contributor to the Fund’s relative performance. The Fund’s non-U.S. yield curve positioning and non-dollar emerging markets securities were also positive for returns. In contrast, RMBS was the largest detractor from performance relative to the benchmark. We were overweight RMBS to take advantage of the strong housing market in the U.S. In our RMBS exposures, we remain allocated to the seasoned credit risk transfer deals, which have strong principal protection but experienced outsized spread widening and negative price movement. Security selection in CLOs, high-yield and senior secured floating rate loans was positive but offset by negative performance from sector allocation. Overweight allocations relative to the benchmark in sovereign emerging markets securities and TIPS also hurt performance. The Fund’s underweight to the short end of the U.S. yield curve also detracted from returns.
Toward the latter part of the period, given the weakness in the credit markets, we found select opportunities in many higher-quality sectors and added to investment-grade corporate credit as spreads widened. We also increased our
franklintempleton.com | Semiannual Report | 17 | ||||
FRANKLIN LOW DURATION TOTAL RETURN FUND
allocation to TIPS, high-yield corporate credit and sovereign emerging markets securities. We pared our exposure to U.S. Treasuries, RMBS, asset-backed securities and tax-exempt municipal bonds as we found better relative opportunities.
During the period, the portfolio utilized derivatives, including credit default and currency swaps, inflation-linked swaps, currency forwards, Treasury futures, interest-rate swaps and credit default swap options, principally as a tool for efficient portfolio management and to manage overall portfolio risk, in our view. These derivative transactions may provide the same, or similar, net long or short exposure to select currencies, interest rates, countries, duration or credit risks in a less expensive way than by directly purchasing securities. In those markets where non-derivative securities are readily available, the cost difference in normal market conditions may be small.
Thank you for your continued participation in Franklin Low Duration Total Return Fund. We look forward to serving your future investment needs.
 |
| |
Sonal Desai, Ph.D. Co-Lead Portfolio Manager |

 |
David Yuen, CFA, FRM Co-Lead Portfolio Manager | |
Tina Chou Co-Lead Portfolio Manager | ||
Kent Burns, CFA Co-Lead Portfolio Manager | ||

The foregoing information reflects our analysis, opinions and portfolio holdings as of April 30, 2020, the end of the reporting period. The way we implement our main investment strategies and the resulting portfolio holdings may change depending on factors such as market and economic conditions. These opinions may not be relied upon as investment advice or an offer for a particular security. The information is not a complete analysis of every aspect of any market, country, industry, security or the Fund. Statements of fact are from sources considered reliable, but the investment manager makes no representation or warranty as to their completeness or accuracy. Although historical performance is no guarantee of future results, these insights may help you understand our investment management philosophy.
18 | Semiannual Report | franklintempleton.com | ||
FRANKLIN LOW DURATION TOTAL RETURN FUND
Performance Summary as of April 30, 2020
The performance tables do not reflect any taxes that a shareholder would pay on Fund dividends, capital gain distributions, if any, or any realized gains on the sale of Fund shares. Total return reflects reinvestment of the Fund’s dividends and capital gain distributions, if any, and any unrealized gains or losses. Your dividend income will vary depending on dividends or interest paid by securities in the Fund’s portfolio, adjusted for operating expenses of each class. Capital gain distributions are net profits realized from the sale of portfolio securities.
Performance as of 4/30/201
Cumulative total return excludes sales charges. Average annual total return includes maximum sales charges. Sales charges will vary depending on the size of the investment and the class of share purchased. The maximum is 2.25% and the minimum is 0%. Class A: 2.25% maximum initial sales charge; Advisor Class: no sales charges. For other share classes, visit franklintempleton.com.
Share Class | | Cumulative Total Return | 2 | | Average Annual Total Return | 3 | ||
A 6-Month | -4.39% | -6.52% | ||||||
1-Year | -3.04% | -5.19% | ||||||
5-Year | +2.47% | +0.03% | ||||||
10-Year | +13.22% | +1.02% | ||||||
Advisor 6-Month | -4.25% | -4.25% | ||||||
1-Year | -2.77% | -2.77% | ||||||
5-Year | +3.72% | +0.73% | ||||||
10-Year | +16.07% | +1.50% |
| Distribution | 30-Day Standardized Yield5 | |||||||||||||||
| Share Class | Rate4 | (with fee waiver) | (without fee waiver) | |||||||||||||
A | 3.35% | 2.81% | 2.54% | |||||||||||||
Advisor | 3.67% | 3.12% | 2.86% | |||||||||||||
Performance data represent past performance, which does not guarantee future results. Investment return and principal value will fluctuate, and you may have a gain or loss when you sell your shares. Current performance may differ from figures shown. For most recent month-end performance, go to franklintempleton.com or call (800) 342-5236.
See page 20 for Performance Summary footnotes.
| franklintempleton.com | Semiannual Report |
|
19 |
| ||
FRANKLIN LOW DURATION TOTAL RETURN FUND
PERFORMANCE SUMMARY
Distributions (11/1/19–4/30/20)
| Share Class | Net Investment Income | |
A | $0.171859 | |
C | $0.153226 | |
R | $0.161797 | |
R6 | $0.190085 | |
Advisor | $0.184206 | |
Total Annual Operating Expenses6
| Share Class | With Fee Waiver | Without Fee Waiver | ||||||||
A | 0.71% | 0.96% | ||||||||
Advisor | 0.46% | 0.71% | ||||||||
Each class of shares is available to certain eligible investors and has different annual fees and expenses, as described in the prospectus.
All investments involve risks, including loss of principal. Interest rate movements and mortgage prepayments will affect the Fund’s share price and yield. Bond prices generally move in the opposite direction of interest rates. Thus, as the prices of bonds in the Fund adjust to a rise in interest rates, the Fund’s share price may decline. Changes in the financial strength of a bond issuer or in a bond’s credit rating may affect its value. The risks associated with higher-yielding, lower-rated securities include higher risk of default and loss of principal. Investment in foreign securities also involves special risks, including currency fluctuations, and political and economic uncertainty. Derivatives, including currency management strategies, involve costs and can create economic leverage in the portfolio which may result in significant volatility and cause the Fund to participate in losses (as well as gains) on an amount that exceeds the Fund’s initial investment. The Fund may not achieve the anticipated benefits, and may realize losses when a counterparty fails to perform. Unexpected events and their aftermaths, such as the spread of deadly diseases; natural, environmental or man-made disasters; financial, political or social disruptions; terrorism and war; and other tragedies or catastrophes, can cause investor fear and panic, which can adversely affect the economies of many companies, sectors, nations, regions and the market in general, in ways that cannot necessarily be foreseen. The Fund’s prospectus also includes a description of the main investment risks.
1. The Fund has an expense reduction and a fee waiver associated with any investments it makes in a Franklin Templeton money fund and/or other Franklin Templeton fund, contractually guaranteed through 2/28/21. Fund investment results reflect the expense reduction and fee waiver; without these reductions, the results would have been lower.
2. Cumulative total return represents the change in value of an investment over the periods indicated.
3. Average annual total return represents the average annual change in value of an investment over the periods indicated. Return for less than one year, if any, has not been annualized.
4. Distribution rate is based on an annualization of the sum of the respective class’s past month’s daily distributions and the maximum offering price (NAV for Advisor Class) per share on 4/30/20.
5. The Fund’s 30-day standardized yield is calculated over a trailing 30-day period using the yield to maturity on bonds and/or the dividends accrued on stocks. It may not equal the Fund’s actual income distribution rate, which reflects the Fund’s past dividends paid to shareholders.
6. Figures are as stated in the Fund’s current prospectus and may differ from the expense ratios disclosed in the Your Fund’s Expenses and Financial Highlights sections in this report. In periods of market volatility, assets may decline significantly, causing total annual Fund operating expenses to become higher than the figures shown.
20 | Semiannual Report | franklintempleton.com | ||
FRANKLIN LOW DURATION TOTAL RETURN FUND
Your Fund’s Expenses
As a Fund shareholder, you can incur two types of costs: (1) transaction costs, including sales charges (loads) on Fund purchases and redemptions; and (2) ongoing Fund costs, including management fees, distribution and service (12b-1) fees, and other Fund expenses. All mutual funds have ongoing costs, sometimes referred to as operating expenses. The table below shows ongoing costs of investing in the Fund and can help you understand these costs and compare them with those of other mutual funds. The table assumes a $1,000 investment held for the six months indicated.
Actual Fund Expenses
The table below provides information about actual account values and actual expenses in the columns under the heading “Actual.” In these columns the Fund’s actual return, which includes the effect of Fund expenses, is used to calculate the “Ending Account Value” for each class of shares. You can estimate the expenses you paid during the period by following these steps (of course, your account value and expenses will differ from those in this illustration): Divide your account value by $1,000 (if your account had an $8,600 value, then $8,600 ÷ $1,000 = 8.6). Then multiply the result by the number in the row for your class of shares under the headings “Actual” and “Expenses Paid During Period” (if Actual Expenses Paid During Period were $7.50, then 8.6 x $7.50 = $64.50). In this illustration, the actual expenses paid this period are $64.50.
Hypothetical Example for Comparison with Other Funds
Under the heading “Hypothetical” in the table, information is provided about hypothetical account values and hypothetical expenses based on the Fund’s actual expense ratio and an assumed rate of return of 5% per year before expenses, which is not the Fund’s actual return. This information may not be used to estimate the actual ending account balance or expenses you paid for the period, but it can help you compare ongoing costs of investing in the Fund with those of other funds. To do so, compare this 5% hypothetical example for the class of shares you hold with the 5% hypothetical examples that appear in the shareholder reports of other funds.
Please note that expenses shown in the table are meant to highlight ongoing costs and do not reflect any transactional costs. Therefore, information under the heading “Hypothetical” is useful in comparing ongoing costs only, and will not help you compare total costs of owning different funds. In addition, if transactional costs were included, your total costs would have been higher.
Actual (actual return after expenses) | Hypothetical (5% annual return before expenses) | |||||||||||||||||
|
| |||||||||||||||||
| Share Class | Beginning Account Value 11/1/19 | Ending Account Value 4/30/20 | Expenses Paid During Period 11/1/19–4/30/201, 2 | Ending Account Value 4/30/20 | Expenses Paid During Period 11/1/19–4/30/201, 2 | Net Annualized Expense Ratio2 | ||||||||||||
|
|
|
| |||||||||||||||
| A | $1,000 | $956.10 | $3.26 | $1,021.53 | $3.37 | 0.67% | ||||||||||||
| C | $1,000 | $954.00 | $5.20 | $1,019.54 | $5.37 | 1.07% | ||||||||||||
| R | $1,000 | $955.00 | $4.47 | $1,020.29 | $4.62 | 0.92% | ||||||||||||
| R6 | $1,000 | $958.20 | $1.46 | $1,023.37 | $1.51 | 0.30% | ||||||||||||
| Advisor | $1,000 | $957.50 | $2.04 | $1,022.77 | $2.11 | 0.42% | ||||||||||||
1. Expenses are equal to the annualized expense ratio for the six-month period as indicated above—in the far right column—multiplied by the simple average account value over the period indicated, and then multiplied by 182/366 to reflect the one-half year period.
2. Reflects expenses after fee waivers and expense reimbursements. Does not include acquired fund fees and expenses.
franklintempleton.com | Semiannual Report | 21 | ||||
This semiannual report for Franklin Total Return Fund covers the period ended April 30, 2020.
Your Fund’s Goal and Main Investments
The Fund seeks to provide high current income, consistent with preservation of capital. Capital appreciation over the long term is a secondary goal. The Fund invests primarily in investment-grade debt securities (including unrated securities of comparable quality) and other investments that provide exposure to such securities. The Fund currently focuses on government and corporate debt securities and mortgage- and asset-backed securities, but may invest in other securities and investments, such as floating-rate corporate loans and securities and municipal securities.
Performance Overview
The Fund’s Class A shares posted a -1.41% cumulative total return for the six months under review. In comparison, the Fund’s benchmark, the Bloomberg Barclays U.S. Aggregate Bond Index posted a +4.86% total return.1 The index measures the U.S. investment-grade, fixed-rate, taxable bond market with index components for government and corporate, mortgage pass-through and asset-backed securities. You can find the Fund’s long-term performance data in the Performance Summary beginning on page 25.
Performance data represent past performance, which does not guarantee future results. Investment return and principal value will fluctuate, and you may have a gain or loss when you sell your shares. Current performance may differ from figures shown. For most recent month-end performance, go to franklintempleton.com or call (800) 342-5236.
Investment Strategy
We seek to invest in a combination of fixed income securities, primarily from across the investment-grade debt universe. We analyze securities using proprietary and nonproprietary research to help us identify attractive investment opportunities, across the entire fixed income opportunity set, on a relative basis. The Fund may also invest up to 20% of its total assets in noninvestment-grade debt securities. In addition, we may use derivative
Portfolio Composition*
Based on Total Net Assets as of 4/30/20
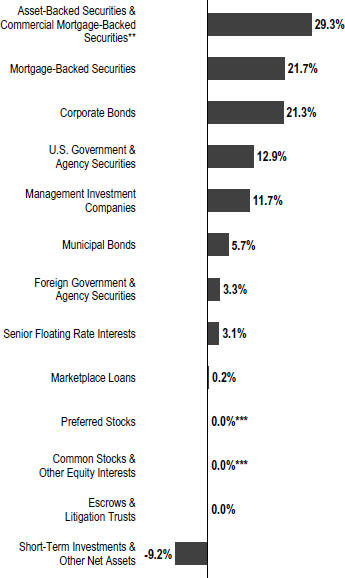
*Figures reflect certain derivatives held in the portfolio (or their underlying reference assets) and may not total 100% or may be negative due to rounding, use of derivatives, unsettled trades or other factors.
**Includes non-agency residential mortgage backed securities, collateralized loan obligations and consumer loan certificates.
***Rounds to less than 0.1% of total net assets.
transactions, such as currency and cross-currency forwards, futures contracts and swap agreements, to obtain net long or short exposures to select currencies, interest rates, countries, duration or credit risks.
1. Source: Morningstar.
The index is unmanaged and includes reinvestment of any income or distributions. It does not reflect any fees, expenses or sales charges. One cannot invest directly in an index, and an index is not representative of the Fund’s portfolio.
See www.franklintempletondatasources.com for additional data provider information.
The dollar value, number of shares or principal amount, and names of all portfolio holdings are listed in the Fund’s Consolidated Statement of Investments (SOI). The Consolidated SOI begins on page 99.
22 | Semiannual Report | franklintempleton.com | ||
FRANKLIN TOTAL RETURN FUND
What is a futures contract?
A futures contract is an agreement between the Fund and a counterparty made through a U.S. or foreign futures exchange to buy or sell an underlying instrument or asset at a specific price on a future date.
|
What is a currency forward contract?
A currency forward contract is an agreement between the Fund and a counterparty to buy or sell a foreign currency in exchange for another currency at a specific exchange rate on a future date. Currency forward contracts are privately traded in the interbank market, not on a centralized exchange.
|
What are swap agreements?
Swap agreements, such as interest rate, fixed income total return, currency, inflation index and credit default swaps, are contracts between the Fund and another party (the swap counterparty). In a basic swap transaction, the Fund agrees with the swap counterparty to exchange the returns (or differentials in rates of return) earned or realized on a particular “notional amount” of underlying instruments. The notional amount is the set amount selected by the parties as the basis on which to calculate the obligations that they have agreed to exchange. The parties typically do not actually exchange the notional amount. Instead, they agree to exchange the returns that would be earned or realized if the notional amount were invested in given instruments or at given interest rates.
|
What is the yield curve?
A yield curve is a line that plots the yield to maturity of bonds having equal credit quality against their maturity dates.
|
What is an option?
An option is a contract to buy or sell a specific financial product known as the option’s underlying instrument at a specific price. The buyer of an option has the right, but not the obligation, to buy or sell the underlying instrument at or until a specified expiration date. Conversely, the seller (“writer”) of an option who opens a transaction is obligated to buy or sell the underlying instrument should the option holder exercise that right.
|
Manager’s Discussion
From a perspective of excess returns over Treasuries of similar duration, most fixed income sectors underperformed. As measured by Bloomberg Barclays indexes, higher quality agency mortgage sectors outperformed U.S. Treasuries while emerging market bonds, corporate credit (inclusive of
high-yield and investment-grade corporate bonds, senior secured floating rate loans and collateralized loan obligations (CLOs)) and non-agency residential mortgage-backed securities (RMBS) underperformed Treasuries.
During the period, our positioning was diversified from a risk perspective and was targeted into parts of the fixed income market where we felt valuations were attractive and fundamentals remained strong. Our largest exposures were in investment-grade corporate credit, fixed-rate agency mortgage-backed securities (MBS), RMBS and CLOs.
While the Fund’s largest sector allocation was to investment-grade corporate credit, we were underweight the sector relative to the benchmark, which was a major contributor to the Fund’s performance. The Fund’s exposure to commercial mortgage-backed securities also benefited results. In contrast, the Fund’s exposure to RMBS was the largest detractor from performance relative to the benchmark. We were overweight RMBS to take advantage of the strong housing market in the U.S. In our RMBS exposures, we remain allocated to the seasoned credit risk transfer deals, which have strong principal protection but experienced outsized spread widening and negative price movement. We also had meaningful positions in Treasury Inflation-Protected Securities (TIPS), and smaller exposure to high-yield corporate credit, emerging market debt and senior secured floating rate loans, all which detracted from relative returns. In rates, our overall duration was close to neutral, but we were positioned with less U.S. duration than the benchmark, while having developed market duration in Europe, Canada, and Australia. As investors sought safety in U.S. Treasuries, foreign rates did not keep pace with the drop in U.S. yields as COVID-19 had struck Italy particularly hard. The underweight in U.S. duration detracted from performance.
Toward the latter part of the period, given the weakness in the credit markets, we found select opportunities in many higher quality sectors and added to investment-grade corporate credit as spreads widened. We also increased our exposure to TIPS, taxable municipal bonds and high-yield corporate credit, while paring our exposure to MBS, Treasuries positions, CLOs and foreign bonds.
During the period, the portfolio utilized derivatives, including credit default and currency swaps, currency forwards, Treasury futures, inflation index swaps and credit default swap options, principally as a tool for efficient portfolio management and to manage overall portfolio risk. These derivative transactions may provide the same, or similar, net long or short exposure to select currencies, interest rates, countries, duration or credit risks in a less expensive way
franklintempleton.com | Semiannual Report | 23 | ||||
FRANKLIN TOTAL RETURN FUND
Dividend Distributions*
11/1/19–4/30/20
| Dividend per Share (cents) | ||||||||||||||||||||
| Month | Class A | Class C | Class R | Class R6 | Advisor Class | |||||||||||||||
November
|
| 2.2441
|
|
| 1.9199
|
|
| 2.0434
|
|
| 2.5439
|
|
| 2.4561
|
| |||||
December**
|
| 6.9761
|
|
| 6.6123
|
|
| 6.7494
|
|
| 7.3095
|
|
| 7.2103
|
| |||||
January
|
| 2.7478
|
|
| 2.3950
|
|
| 2.5274
|
|
| 3.0656
|
|
| 2.9756
|
| |||||
February
|
| 2.2778
|
|
| 1.9564
|
|
| 2.0848
|
|
| 2.5622
|
|
| 2.4873
|
| |||||
March
|
| 2.6346
|
|
| 2.2874
|
|
| 2.4085
|
|
| 2.9485
|
|
| 2.8605
|
| |||||
April
|
| 2.4321
|
|
| 2.1044
|
|
| 2.2221
|
|
| 2.7585
|
|
| 2.6400
|
| |||||
Total
|
| 19.3125
|
|
| 17.2754
|
|
| 18.0356
|
|
| 21.1882
|
|
| 20.6298
|
| |||||
*The distribution amount is the sum of all estimated tax-basis net investment income distributions for the period shown. A portion or all of the distribution may be reclassified as return of capital or short-term or long-term capital gains once final tax designations are known. Assumes shares were purchased and held for the entire accrual period. Since dividends accrue daily, your actual distributions will vary depending on the date you purchased your shares and any account activity. All Fund distributions will vary depending upon current market conditions, and past distributions are not indicative of future trends.
**Includes additional income distributions made in order to meet excise tax requirements.
than by directly purchasing securities. In those markets where non-derivative securities are readily available, the cost difference in normal market conditions may be small.
Thank you for your continued participation in Franklin Total Return Fund. We look forward to serving your future investment needs.
|
| |
Sonal Desai, Ph.D. Co-Lead Portfolio Manager |
 |
| |
Tina Chou Co-Lead Portfolio Manager | ||
David Yuen, CFA, FRM Co-Lead Portfolio Manager | ||
Patrick Klein, Ph.D. Co-Lead Portfolio Manager | ||

The foregoing information reflects our analysis, opinions and portfolio holdings as of April 30, 2020, the end of the reporting period. The way we implement our main investment strategies and the resulting portfolio holdings may change depending on factors such as market and economic conditions. These opinions may not be relied upon as investment advice or an offer for a particular security. The information is not a complete analysis of every aspect of any market, country, industry, security or the Fund. Statements of fact are from sources considered reliable, but the investment manager makes no representation or warranty as to their completeness or accuracy. Although historical performance is no guarantee of future results, these insights may help you understand our investment management philosophy.
24 | Semiannual Report | franklintempleton.com | ||
FRANKLIN TOTAL RETURN FUND
Performance Summary as of April 30, 2020
The performance tables do not reflect any taxes that a shareholder would pay on Fund dividends, capital gain distributions, if any, or any realized gains on the sale of Fund shares. Total return reflects reinvestment of the Fund’s dividends and capital gain distributions, if any, and any unrealized gains or losses. Your dividend income will vary depending on dividends or interest paid by securities in the Fund’s portfolio, adjusted for operating expenses of each class. Capital gain distributions are net profits realized from the sale of portfolio securities.
Performance as of 4/30/201
Cumulative total return excludes sales charges. Average annual total return includes maximum sales charges. Sales charges will vary depending on the size of the investment and the class of share purchased. The maximum is 3.75% and the minimum is 0%. Class A: 3.75% maximum initial sales charge; Advisor Class: no sales charges. For other share classes, visit franklintempleton.com.
Share Class | | Cumulative Total Return | 2 | | Average Annual Total Return | 3 | ||
| ||||||||
| A4 | ||||||||
6-Month
| -1.41% | -5.14% | ||||||
1-Year
| +2.86% | -1.03% | ||||||
5-Year
| +9.25% | +1.02% | ||||||
10-Year
| +38.86% | +2.94% | ||||||
| Advisor | ||||||||
6-Month
| -1.27% | -1.27% | ||||||
1-Year
| +3.11% | +3.11% | ||||||
5-Year
| +10.67% | +2.05% | ||||||
10-Year
| +42.51% | +3.61% | ||||||
| Distribution Rate5 | 30-Day Standardized Yield6 | |||||||||||||||||||
| Share Class | (with fee waiver) | (without fee waiver) | ||||||||||||||||||
| ||||||||||||||||||||
A
| 2.93% | 2.94% | 2.89% | |||||||||||||||||
| ||||||||||||||||||||
Advisor
| 3.28% | 3.32% | 3.26% | |||||||||||||||||
| ||||||||||||||||||||
Performance data represent past performance, which does not guarantee future results. Investment return and principal value will fluctuate, and you may have a gain or loss when you sell your shares. Current performance may differ from figures shown. For most recent month-end performance, go to franklintempleton.com or call (800) 342-5236.
See page 26 for Performance Summary footnotes.
franklintempleton.com | Semiannual Report | 25 | ||||
FRANKLIN TOTAL RETURN FUND
PERFORMANCE SUMMARY
Distributions (11/1/19–4/30/20)
| Share Class | Net Investment Income | |||
A | $0.193125 | |||
C | $0.172754 | |||
R | $0.180356 | |||
R6 | $0.211882 | |||
Advisor | $0.206298 | |||
Total Annual Operating Expenses7
| Share Class | With Fee Waiver | Without Fee Waiver | ||||||
A | 0.88% | 0.93% | ||||||
Advisor | 0.63% | 0.68% | ||||||
Each class of shares is available to certain eligible investors and has different annual fees and expenses, as described in the prospectus.
All investments involve risks, including loss of principal. Interest rate movements and mortgage prepayments will affect the Fund’s share price and yield. Bond prices generally move in the opposite direction of interest rates. Thus, as the prices of bonds in the Fund adjust to a rise in interest rates, the Fund’s share price may decline. Changes in the financial strength of a bond issuer or in a bond’s credit rating may affect its value. The risks associated with higher-yielding, lower-rated securities include higher risk of default and loss of principal. Investment in foreign securities also involves special risks, including currency fluctuations, and political and economic uncertainty. Derivatives, including currency management strategies, involve costs and can create economic leverage in the portfolio which may result in significant volatility and cause the Fund to participate in losses (as well as gains) on an amount that exceeds the Fund’s initial investment. The Fund may not achieve the anticipated benefits, and may realize losses when a counterparty fails to perform. Unexpected events and their aftermaths, such as the spread of deadly diseases; natural, environmental or man-made disasters; financial, political or social disruptions; terrorism and war; and other tragedies or catastrophes, can cause investor fear and panic, which can adversely affect the economies of many companies, sectors, nations, regions and the market in general, in ways that cannot necessarily be foreseen. The Fund’s prospectus also includes a description of the main investment risks.
1. The Fund has an expense reduction and a fee waiver associated with any investments it makes in a Franklin Templeton money fund and/or other Franklin Templeton fund, contractually guaranteed through 2/28/21. Fund investment results reflect the expense reduction and fee waiver; without these reductions, the results would have been lower.
2. Cumulative total return represents the change in value of an investment over the periods indicated.
3. Average annual total return represents the average annual change in value of an investment over the periods indicated. Return for less than one year, if any, has not been annualized.
4. Prior to 3/1/19, these shares were offered at a higher initial sales charge of 4.25%, thus actual returns (with sales charges) would have differed. Average annual total returns (with sales charges) have been restated to reflect the current maximum initial sales charge of 3.75%.
5. Distribution rate is based on an annualization of the sum of the respective class’s past month’s daily distributions and the maximum offering price (NAV for Advisor Class) per share on 4/30/20.
6. The Fund’s 30-day standardized yield is calculated over a trailing 30-day period using the yield to maturity on bonds and/or the dividends accrued on stocks. It may not equal the Fund’s actual income distribution rate, which reflects the Fund’s past dividends paid to shareholders.
7. Figures are as stated in the Fund’s current prospectus and may differ from the expense ratios disclosed in the Your Fund’s Expenses and Financial Highlights sections in this report. In periods of market volatility, assets may decline significantly, causing total annual Fund operating expenses to become higher than the figures shown.
| 26 |
Semiannual Report | franklintempleton.com | ||
FRANKLIN TOTAL RETURN FUND
Your Fund’s Expenses
As a Fund shareholder, you can incur two types of costs: (1) transaction costs, including sales charges (loads) on Fund purchases and redemptions; and (2) ongoing Fund costs, including management fees, distribution and service (12b-1) fees, and other Fund expenses. All mutual funds have ongoing costs, sometimes referred to as operating expenses. The table below shows ongoing costs of investing in the Fund and can help you understand these costs and compare them with those of other mutual funds. The table assumes a $1,000 investment held for the six months indicated.
Actual Fund Expenses
The table below provides information about actual account values and actual expenses in the columns under the heading “Actual.” In these columns the Fund’s actual return, which includes the effect of Fund expenses, is used to calculate the “Ending Account Value” for each class of shares. You can estimate the expenses you paid during the period by following these steps (of course, your account value and expenses will differ from those in this illustration): Divide your account value by $1,000 (if your account had an $8,600 value, then $8,600 ÷ $1,000 = 8.6). Then multiply the result by the number in the row for your class of shares under the headings “Actual” and “Expenses Paid During Period” (if Actual Expenses Paid During Period were $7.50, then 8.6 x $7.50 = $64.50). In this illustration, the actual expenses paid this period are $64.50.
Hypothetical Example for Comparison with Other Funds
Under the heading “Hypothetical” in the table, information is provided about hypothetical account values and hypothetical expenses based on the Fund’s actual expense ratio and an assumed rate of return of 5% per year before expenses, which is not the Fund’s actual return. This information may not be used to estimate the actual ending account balance or expenses you paid for the period, but it can help you compare ongoing costs of investing in the Fund with those of other funds. To do so, compare this 5% hypothetical example for the class of shares you hold with the 5% hypothetical examples that appear in the shareholder reports of other funds.
Please note that expenses shown in the table are meant to highlight ongoing costs and do not reflect any transactional costs. Therefore, information under the heading “Hypothetical” is useful in comparing ongoing costs only, and will not help you compare total costs of owning different funds. In addition, if transactional costs were included, your total costs would have been higher.
Actual (actual return after expenses) | Hypothetical (5% annual return before expenses) | |||||||||||||||||
| Share Class | Beginning Account Value 11/1/19 | Ending Account Value 4/30/20 | Expenses 11/1/19–4/30/201, 2 | Ending Account Value 4/30/20 | Expenses 11/1/19–4/30/201, 2 | Net Annualized Expense Ratio2 | ||||||||||||
| A | $1,000 | $985.90 | $4.15 | $1,020.69 | $4.22 | 0.84% | ||||||||||||
| C | $1,000 | $983.80 | $6.12 | $1,018.70 | $6.22 | 1.24% | ||||||||||||
| R | $1,000 | $984.60 | $5.38 | $1,019.44 | $5.47 | 1.09% | ||||||||||||
| R6 | $1,000 | $987.90 | $2.37 | $1,022.48 | $2.41 | 0.48% | ||||||||||||
| Advisor | $1,000 | $987.30 | $2.92 | $1,021.93 | $2.97 | 0.59% | ||||||||||||
1. Expenses are equal to the annualized expense ratio for the six-month period as indicated above—in the far right column—multiplied by the simple average account value over the period indicated, and then multiplied by 182/366 to reflect the one-half year period.
2. Reflects expenses after fee waivers and expense reimbursements. Does not include acquired fund fees and expenses.
franklintempleton.com | Semiannual Report | 27 | ||||
FRANKLIN INVESTORS SECURITIES TRUST
Franklin Adjustable U.S. Government Securities Fund
| | Six Months Ended April 30, 2020 (unaudited) |
|
| Year Ended October 31, |
| |||||||||||||||||||
2019 |
2018 |
2017 |
2016 |
2015 | ||||||||||||||||||||
| Class A | ||||||||||||||||||||||||
| Per share operating performance (for a share outstanding throughout the period) | ||||||||||||||||||||||||
Net asset value, beginning of period | $ 8.02 | $ 8.10 | $ 8.24 | $ 8.40 | $ 8.55 | $ 8.67 | ||||||||||||||||||
Income from investment operationsa: | ||||||||||||||||||||||||
Net investment income | 0.060 | b | 0.140 | b | 0.088 | b | 0.026 | 0.025 | 0.019 | |||||||||||||||
Net realized and unrealized gains (losses) | (0.040 | ) | 0.021 | (0.035 | ) | (0.031 | ) | (0.053 | ) | (0.040 | ) | |||||||||||||
Total from investment operations | 0.020 | 0.161 | 0.053 | (0.005 | ) | (0.028 | ) | (0.021 | ) | |||||||||||||||
Less distributions from: | ||||||||||||||||||||||||
Net investment income | (0.100 | ) | (0.241 | ) | (0.193 | ) | (0.155 | ) | (0.122 | ) | (0.099 | ) | ||||||||||||
Net asset value, end of period | $ 7.94 | $ 8.02 | $ 8.10 | $ 8.24 | $ 8.40 | $ 8.55 | ||||||||||||||||||
Total returnc | 0.25% | 2.01% | 0.65% | (0.06)% | (0.32)% | (0.24)% | ||||||||||||||||||
| Ratios to average net assetsd | ||||||||||||||||||||||||
Expenses before waiver and payments by affiliates | 0.98% | 0.95% | 0.96% | 0.95% | 0.92% | 0.91% | ||||||||||||||||||
Expenses net of waiver and payments by affiliates | 0.96% | 0.94% | e | 0.95% | e | 0.94% | e | 0.91% | e | 0.91% | e,f | |||||||||||||
Net investment income | 1.50% | 1.73% | 1.07% | 0.54% | 0.43% | 0.39% | ||||||||||||||||||
| Supplemental data | ||||||||||||||||||||||||
Net assets, end of period (000’s) | $435,540 | $393,736 | $419,055 | $492,319 | $667,671 | $848,918 | ||||||||||||||||||
Portfolio turnover rate | 13.12% | 12.72% | 11.39% | 2.81% | 11.49% | 9.98% | ||||||||||||||||||
aThe amount shown for a share outstanding throughout the period may not correlate with the Statement of Operations for the period due to the timing of sales and repurchases of the Fund’s shares in relation to income earned and/or fluctuating fair value of the investments of the Fund.
bBased on average daily shares outstanding.
cTotal return does not reflect sales commissions or contingent deferred sales charges, if applicable, and is not annualized for periods less than one year.
dRatios are annualized for periods less than one year.
eBenefit of expense reduction rounds to less than 0.01%.
fBenefit of waiver and payments by affiliates rounds to less than 0.01%.
28 | Semiannual Report | The accompanying notes are an integral part of these financial statements. | franklintempleton.com | ||
FRANKLIN INVESTORS SECURITIES TRUST
FINANCIAL HIGHLIGHTS
Franklin Adjustable U.S. Government Securities Fund (continued)
Six Months Ended (unaudited) | Year Ended October 31, | |||||||||||||||||||||||
| 2019 | 2018 | 2017 | 2016 | 2015 | ||||||||||||||||||||
| Class A1 | ||||||||||||||||||||||||
Per share operating performance (for a share outstanding throughout the period) | ||||||||||||||||||||||||
Net asset value, beginning of period | $ 8.02 | $ 8.09 | $ 8.24 | $ 8.40 | $ 8.54 | $ 8.67 | ||||||||||||||||||
| Income from investment operationsa: | ||||||||||||||||||||||||
Net investment income | 0.066 | b | 0.151 | b | 0.100 | b | 0.059 | 0.049 | 0.046 | |||||||||||||||
Net realized and unrealized gains (losses) | (0.040 | ) | 0.031 | (0.044 | ) | (0.051 | ) | (0.054 | ) | (0.062 | ) | |||||||||||||
Total from investment operations | 0.026 | 0.182 | 0.056 | 0.008 | (0.005 | ) | (0.016 | ) | ||||||||||||||||
Less distributions from: | ||||||||||||||||||||||||
Net investment income | (0.106 | ) | (0.252 | ) | (0.206 | ) | (0.168 | ) | (0.135 | ) | (0.114 | ) | ||||||||||||
Net asset value, end of period | $ 7.94 | $ 8.02 | $ 8.09 | $ 8.24 | $ 8.40 | $ 8.54 | ||||||||||||||||||
Total returnc | 0.33% | 2.29% | 0.68% | 0.10% | (0.05)% | (0.19)% | ||||||||||||||||||
| Ratios to average net assetsd | ||||||||||||||||||||||||
Expenses before waiver and payments by affiliates | 0.83% | 0.80% | 0.80% | 0.79% | 0.77% | 0.75% | ||||||||||||||||||
Expenses net of waiver and payments by affiliates | 0.81% | 0.79% | e | 0.79% | e | 0.78% | e | 0.76% | e | 0.75% | e,f | |||||||||||||
Net investment income | 1.65% | 1.88% | 1.23% | 0.70% | 0.58% | 0.55% | ||||||||||||||||||
| Supplemental data | ||||||||||||||||||||||||
Net assets, end of period (000’s) | $80,220 | $86,471 | $100,477 | $121,012 | $160,469 | $198,670 | ||||||||||||||||||
Portfolio turnover rate | 13.12% | 12.72% | 11.39% | 2.81% | 11.49% | 9.98% | ||||||||||||||||||
aThe amount shown for a share outstanding throughout the period may not correlate with the Statement of Operations for the period due to the timing of sales and repurchases of the Fund’s shares in relation to income earned and/or fluctuating fair value of the investments of the Fund.
bBased on average daily shares outstanding.
cTotal return does not reflect sales commissions or contingent deferred sales charges, if applicable, and is not annualized for periods less than one year.
dRatios are annualized for periods less than one year.
eBenefit of expense reduction rounds to less than 0.01%.
fBenefit of waiver and payments by affiliates rounds to less than 0.01%.
franklintempleton.com | The accompanying notes are an integral part of these financial statements. | Semiannual Report | 29 | ||||
FRANKLIN INVESTORS SECURITIES TRUST
FINANCIAL HIGHLIGHTS
Franklin Adjustable U.S. Government Securities Fund (continued)
Six Months Ended April 30, 2020 | Year Ended October 31, | |||||||||||||||||||||||
| (unaudited) | 2019 | 2018 | 2017 | 2016 | 2015 | |||||||||||||||||||
| Class C | ||||||||||||||||||||||||
| Per share operating performance (for a share outstanding throughout the period) | ||||||||||||||||||||||||
Net asset value, beginning of period | $ 8.02 | $ 8.09 | $ 8.24 | $ 8.40 | $ 8.54 | $ 8.66 | ||||||||||||||||||
| Income from investment operationsa: | ||||||||||||||||||||||||
Net investment income (loss) | 0.043 | b | 0.106 | b | 0.054 | b | (0.014 | ) | (0.011 | ) | (0.013 | ) | ||||||||||||
Net realized and unrealized gains (losses) | (0.039 | ) | 0.032 | (0.044 | ) | (0.024 | ) | (0.041 | ) | (0.043 | ) | |||||||||||||
Total from investment operations | 0.004 | 0.138 | 0.010 | (0.038 | ) | (0.052 | ) | (0.056 | ) | |||||||||||||||
Less distributions from: | ||||||||||||||||||||||||
Net investment income | (0.084 | ) | (0.208 | ) | (0.160 | ) | (0.122 | ) | (0.088 | ) | (0.064 | ) | ||||||||||||
Net asset value, end of period | $ 7.94 | $ 8.02 | $ 8.09 | $ 8.24 | $ 8.40 | $ 8.54 | ||||||||||||||||||
Total returnc | 0.05% | 1.73% | 0.13% | (0.45)% | (0.61)% | (0.65)% | ||||||||||||||||||
| Ratios to average net assetsd | ||||||||||||||||||||||||
Expenses before waiver and payments by affiliates | 1.38% | 1.35% | 1.36% | 1.35% | 1.32% | 1.31% | ||||||||||||||||||
Expenses net of waiver and payments by affiliates | 1.36% | 1.34% | e | 1.35% | e | 1.34% | e | 1.31% | e | 1.31% | e,f | |||||||||||||
Net investment income (loss) | 1.10% | 1.33% | 0.67% | 0.14% | 0.03% | (0.01)% | ||||||||||||||||||
| Supplemental data | ||||||||||||||||||||||||
Net assets, end of period (000’s) | $82,326 | $84,685 | $126,585 | $189,634 | $266,186 | $336,254 | ||||||||||||||||||
Portfolio turnover rate | 13.12% | 12.72% | 11.39% | 2.81% | 11.49% | 9.98% | ||||||||||||||||||
aThe amount shown for a share outstanding throughout the period may not correlate with the Statement of Operations for the period due to the timing of sales and repurchases of the Fund’s shares in relation to income earned and/or fluctuating fair value of the investments of the Fund.
bBased on average daily shares outstanding.
cTotal return does not reflect sales commissions or contingent deferred sales charges, if applicable, and is not annualized for periods less than one year.
dRatios are annualized for periods less than one year.
eBenefit of expense reduction rounds to less than 0.01%.
fBenefit of waiver and payments by affiliates rounds to less than 0.01%.
| 30 |
Semiannual Report | The accompanying notes are an integral part of these financial statements. | franklintempleton.com | ||
FRANKLIN INVESTORS SECURITIES TRUST
FINANCIAL HIGHLIGHTS
Franklin Adjustable U.S. Government Securities Fund (continued)
| Six Months Ended April 30, 2020 | Year Ended October 31, | |||||||||||||||||||||||
| (unaudited) | 2019 | 2018 | 2017 | 2016 | 2015 | |||||||||||||||||||
| Class R6 | ||||||||||||||||||||||||
| Per share operating performance (for a share outstanding throughout the period) | ||||||||||||||||||||||||
Net asset value, beginning of period | $ 8.03 | $ 8.11 | $ 8.25 | $ 8.41 | $ 8.55 | $ 8.68 | ||||||||||||||||||
| Income from investment operationsa: | ||||||||||||||||||||||||
Net investment income | 0.074 | b | 0.169 | b | 0.121 | b | 0.074 | 0.066 | 0.013 | |||||||||||||||
Net realized and unrealized gains (losses) | (0.029 | ) | 0.021 | (0.037 | ) | (0.046 | ) | (0.053 | ) | (0.010 | ) | |||||||||||||
Total from investment operations | 0.045 | 0.190 | 0.084 | 0.028 | 0.013 | 0.003 | ||||||||||||||||||
| Less distributions from: | ||||||||||||||||||||||||
Net investment income | (0.115 | ) | (0.270 | ) | (0.224 | ) | (0.188 | ) | (0.153 | ) | (0.133 | ) | ||||||||||||
| Net asset value, end of period | $ 7.96 | $ 8.03 | $ 8.11 | $ 8.25 | $ 8.41 | $ 8.55 | ||||||||||||||||||
| Total returnc | 0.56% | 2.39% | 1.03% | 0.34% | 0.15% | 0.03% | ||||||||||||||||||
| Ratios to average net assetsd | ||||||||||||||||||||||||
Expenses before waiver and payments by affiliates | 0.64% | 0.62% | 0.62% | 0.58% | 0.56% | 0.53% | ||||||||||||||||||
Expenses net of waiver and payments by affiliates | 0.59% | 0.58% | e | 0.57% | e | 0.55% | e | 0.55% | e | 0.53% | e,f | |||||||||||||
Net investment income | 1.87% | 2.09% | 1.45% | 0.93% | 0.79% | 0.77% | ||||||||||||||||||
| Supplemental data | ||||||||||||||||||||||||
Net assets, end of period (000’s) | $30,189 | $31,953 | $36,026 | $2,196 | $2,374 | $2,176 | ||||||||||||||||||
Portfolio turnover rate | 13.12% | 12.72% | 11.39% | 2.81% | 11.49% | 9.98% | ||||||||||||||||||
aThe amount shown for a share outstanding throughout the period may not correlate with the Statement of Operations for the period due to the timing of sales and repurchases of the Fund’s shares in relation to income earned and/or fluctuating fair value of the investments of the Fund.
bBased on average daily shares outstanding.
cTotal return is not annualized for periods less than one year.
dRatios are annualized for periods less than one year.
eBenefit of expense reduction rounds to less than 0.01%.
fBenefit of waiver and payments by affiliates rounds to less than 0.01%.
franklintempleton.com | The accompanying notes are an integral part of these financial statements. | Semiannual Report | 31 | ||||
FRANKLIN INVESTORS SECURITIES TRUST
FINANCIAL HIGHLIGHTS
Franklin Adjustable U.S. Government Securities Fund (continued)
Six Months Ended April 30, 2020 | Year Ended October 31, | |||||||||||||||||||||||
| (unaudited) | 2019 | 2018 | 2017 | 2016 | 2015 | |||||||||||||||||||
| Advisor Class | ||||||||||||||||||||||||
Per share operating performance (for a share outstanding throughout the period) | ||||||||||||||||||||||||
Net asset value, beginning of period | $ 8.03 | $ 8.10 | $ 8.25 | $ 8.41 | $ 8.55 | $ 8.68 | ||||||||||||||||||
| Income from investment operationsa: | ||||||||||||||||||||||||
Net investment income | 0.070 | b | 0.160 | b | 0.108 | b | 0.052 | 0.046 | 0.040 | |||||||||||||||
Net realized and unrealized gains (losses) | (0.040 | ) | 0.031 | (0.044 | ) | (0.036 | ) | (0.043 | ) | (0.049 | ) | |||||||||||||
Total from investment operations | 0.030 | 0.191 | 0.064 | 0.016 | 0.003 | (0.009 | ) | |||||||||||||||||
Less distributions from: | ||||||||||||||||||||||||
Net investment income | (0.110 | ) | (0.261 | ) | (0.214 | ) | (0.176 | ) | (0.143 | ) | (0.121 | ) | ||||||||||||
Net asset value, end of period | $ 7.95 | $ 8.03 | $ 8.10 | $ 8.25 | $ 8.41 | $ 8.55 | ||||||||||||||||||
Total returnc | 0.38% | 2.39% | 0.78% | 0.20% | 0.05% | (0.11)% | ||||||||||||||||||
| Ratios to average net assetsd | ||||||||||||||||||||||||
Expenses before waiver and payments by affiliates | 0.73% | 0.70% | 0.71% | 0.70% | 0.67% | 0.66% | ||||||||||||||||||
Expenses net of waiver and payments by affiliates | 0.71% | 0.69% | e | 0.70% | e | 0.69% | e | 0.66% | e | 0.66% | e,f | |||||||||||||
Net investment income | 1.75% | 1.98% | 1.32% | 0.79% | 0.68% | 0.64% | ||||||||||||||||||
| Supplemental data | ||||||||||||||||||||||||
Net assets, end of period (000’s) | $110,039 | $103,639 | $112,441 | $184,299 | $227,599 | $308,683 | ||||||||||||||||||
Portfolio turnover rate | 13.12% | 12.72% | 11.39% | 2.81% | 11.49% | 9.98% | ||||||||||||||||||
aThe amount shown for a share outstanding throughout the period may not correlate with the Statement of Operations for the period due to the timing of sales and repurchases of the Fund’s shares in relation to income earned and/or fluctuating fair value of the investments of the Fund.
bBased on average daily shares outstanding.
cTotal return is not annualized for periods less than one year.
dRatios are annualized for periods less than one year.
eBenefit of expense reduction rounds to less than 0.01%.
fBenefit of waiver and payments by affiliates rounds to less than 0.01%.
| 32 |
Semiannual Report | The accompanying notes are an integral part of these financial statements. | franklintempleton.com | ||
FRANKLIN INVESTORS SECURITIES TRUST
Statement of Investments, April 30, 2020 (unaudited)
Franklin Adjustable U.S. Government Securities Fund
| Principal Amount | Value | |||||||||
Commercial Mortgage-Backed Securities 1.6% | ||||||||||
a | GNMA, 2010-12, FD, FRN, 1.394%, 1/16/40 | 1,187,994 | $ | 1,191,462 | ||||||
a | FHLMC, 4845, QF, FRN, 1.114%, 12/15/48 | 10,298,235 | 10,210,117 | |||||||
|
| |||||||||
Total Commercial Mortgage-Backed Securities (Cost $11,413,572) | 11,401,579 | |||||||||
|
| |||||||||
Mortgage-Backed Securities 90.7% | ||||||||||
b | Federal Home Loan Mortgage Corp. (FHLMC) Adjustable Rate 14.7% | |||||||||
FHLMC, 3.361% - 3.435%, (6-month USD LIBOR +/- MBS Margin), 4/01/36 - 1/01/37 | $ | 1,158,232 | 1,181,549 | |||||||
FHLMC, 3.529%, (12-month USD LIBOR +/- MBS Margin), 5/01/45 | 6,994,695 | 7,224,318 | ||||||||
FHLMC, 3.746%, (12-month USD LIBOR +/- MBS Margin), 9/01/35 | 4,107,724 | 4,218,779 | ||||||||
FHLMC, 3.372% - 3.781%, (12-month USD LIBOR +/- MBS Margin), 1/01/36 - 4/01/40 | 6,612,375 | 6,847,333 | ||||||||
FHLMC, 3.782% - 3.83%, (12-month USD LIBOR +/- MBS Margin), 12/01/35 - 8/01/37 | 5,814,321 | 6,060,126 | ||||||||
FHLMC, 3.841% - 3.931%, (12-month USD LIBOR +/- MBS Margin), 12/01/34 - 12/01/37 | 6,429,368 | 6,715,641 | ||||||||
FHLMC, 3.936%, (12-month USD LIBOR +/- MBS Margin), 9/01/37 | 13,097,519 | 13,688,954 | ||||||||
FHLMC, 3.938% - 4.008%, (12-month USD LIBOR +/- MBS Margin), 2/01/36 - 12/01/37 | 5,173,506 | 5,381,241 | ||||||||
FHLMC, 4.015% - 4.081%, (12-month USD LIBOR +/- MBS Margin), 11/01/35 - 10/01/38 | 7,110,116 | 7,373,885 | ||||||||
FHLMC, 3.806% - 4.16%, (US 1 Year CMT T-Note +/- MBS Margin), 4/01/34 - 4/01/37 | 6,809,046 | 7,105,714 | ||||||||
FHLMC, 4.174%, (12-month USD LIBOR +/- MBS Margin), 7/01/35 | 5,376,783 | 5,628,472 | ||||||||
FHLMC, 4.098% - 4.241%, (12-month USD LIBOR +/- MBS Margin), 9/01/36 - 11/01/41 | 6,930,508 | 7,198,455 | ||||||||
FHLMC, 4.325%, (12-month USD LIBOR +/- MBS Margin), 6/01/37 | 5,101,061 | 5,372,008 | ||||||||
FHLMC, 4.394%, (US 1 Year CMT T-Note +/- MBS Margin), 3/01/35 | 2,730,910 | 2,849,867 | ||||||||
FHLMC, 4.476%, (12-month USD LIBOR +/- MBS Margin), 11/01/40 | 3,047,778 | 3,194,049 | ||||||||
FHLMC, 4.19% - 4.625%, (US 1 Year CMT T-Note +/- MBS Margin), 8/01/33 - 6/01/37 | 6,896,388 | 7,199,837 | ||||||||
FHLMC, 4.687%, (12-month USD LIBOR +/- MBS Margin), 1/01/37 | 2,583,666 | 2,750,976 | ||||||||
FHLMC, 4.262% - 4.697%, (12-month USD LIBOR +/- MBS Margin), 8/01/34 - 11/01/37 | 6,468,545 | 6,725,634 | ||||||||
FHLMC, 4.944% - 5.476%, (US 1 Year CMT T-Note +/- MBS Margin), 8/01/34 - 7/01/35 | 1,828,660 | 1,936,023 | ||||||||
|
| |||||||||
| 108,652,861 | ||||||||||
|
| |||||||||
| Federal Home Loan Mortgage Corp. (FHLMC) Fixed Rate 9.0% | ||||||||||
FHLMC 15 Year, 2.50%, 3/01/35 | 22,785,333 | 24,004,698 | ||||||||
FHLMC 15 Year, 2.50%, 3/01/35 | 25,762,845 | 27,124,435 | ||||||||
FHLMC 15 Year, 2.50%, 4/01/35 | 15,000,000 | 15,713,470 | ||||||||
|
| |||||||||
| 66,842,603 | ||||||||||
|
| |||||||||
b | Federal National Mortgage Association (FNMA) Adjustable Rate 59.2% | |||||||||
FNMA, 2.631%, (12-month USD LIBOR +/- MBS Margin), 3/01/46 | 4,252,009 | 4,375,850 | ||||||||
FNMA, 1.74% - 2.805%, (1-month USD LIBOR +/- MBS Margin), 10/01/26 - 10/01/34 | 311,020 | 313,299 | ||||||||
FNMA, 2.467% - 3.146%, (6-month USD LIBOR +/- MBS Margin), 6/01/21 - 3/01/38 | 6,771,723 | 6,858,010 | ||||||||
FNMA, 3.16% - 3.26%, (6-month USD LIBOR +/- MBS Margin), 10/01/22 - 1/01/37 | 7,074,586 | 7,187,770 | ||||||||
FNMA, 3.319%, (11th District COF +/- MBS Margin), 4/01/34 | 13,861,913 | 14,010,605 | ||||||||
FNMA, 3.354%, (6-month USD LIBOR +/- MBS Margin), 12/01/34 | 3,149,059 | 3,197,803 | ||||||||
FNMA, 3.26% - 3.358%, (6-month USD LIBOR +/- MBS Margin), 9/01/21 - 7/01/37 | 6,215,897 | 6,305,867 | ||||||||
FNMA, 2.711% - 3.372%, (12-month USD LIBOR +/- MBS Margin), 3/01/33 - 4/01/38 | 7,114,846 | 7,247,868 | ||||||||
FNMA, 3.374% - 3.502%, (12-month USD LIBOR +/- MBS Margin), 3/01/32 - 3/01/42 | 6,242,837 | 6,373,797 | ||||||||
FNMA, 3.502% - 3.537%, (12-month USD LIBOR +/- MBS Margin), 12/01/32 - 10/01/37 | 5,707,862 | 5,870,359 | ||||||||
FNMA, 3.537% - 3.563%, (12-month USD LIBOR +/- MBS Margin), 1/01/33 - 4/01/45 | 6,942,251 | 7,137,140 | ||||||||
FNMA, 3.572%, (12-month USD LIBOR +/- MBS Margin), 2/01/36 | 4,278,122 | 4,415,757 | ||||||||
FNMA, 3.574%, (12-month USD LIBOR +/- MBS Margin), 11/01/34 | 3,275,887 | 3,395,574 | ||||||||
franklintempleton.com | Semiannual Report | 33 | ||||
FRANKLIN INVESTORS SECURITIES TRUST
STATEMENT OF INVESTMENTS (UNAUDITED)
Franklin Adjustable U.S. Government Securities Fund (continued)
| Principal Amount | Value | |||||||||
Mortgage-Backed Securities (continued) | ||||||||||
| b | Federal National Mortgage Association (FNMA) Adjustable Rate (continued) | |||||||||
FNMA, 3.565% - 3.593%, (12-month USD LIBOR +/- MBS Margin), 11/01/32 - 11/01/38 | $ | 6,571,044 | $ | 6,731,537 | ||||||
FNMA, 3.62%, (12-month USD LIBOR +/- MBS Margin), 3/01/35 | 5,132,872 | 5,336,002 | ||||||||
FNMA, 3.594% - 3.624%, (12-month USD LIBOR +/- MBS Margin), 12/01/32 - 4/01/44 | 6,583,876 | 6,799,551 | ||||||||
FNMA, 3.071% - 3.652%, (US 1 Year CMT T-Note +/- MBS Margin), 1/01/21 - 11/01/44 | 7,204,754 | 7,274,922 | ||||||||
FNMA, 3.624% - 3.655%, (12-month USD LIBOR +/- MBS Margin), 11/01/32 - 3/01/38 | 6,273,173 | 6,417,330 | ||||||||
FNMA, 3.667%, (12-month USD LIBOR +/- MBS Margin), 5/01/39 | 4,157,737 | 4,290,430 | ||||||||
FNMA, 3.675%, (12-month USD LIBOR +/- MBS Margin), 1/01/39 | 4,103,380 | 4,263,612 | ||||||||
FNMA, 3.655% - 3.699%, (12-month USD LIBOR +/- MBS Margin), 11/01/32 - 5/01/39 | 6,989,742 | 7,231,179 | ||||||||
FNMA, 3.699%, (12-month USD LIBOR +/- MBS Margin), 1/01/36 | 2,962,427 | 3,078,201 | ||||||||
FNMA, 3.699% - 3.729%, (12-month USD LIBOR +/- MBS Margin), 1/01/33 - 11/01/42 | 6,919,216 | 7,113,434 | ||||||||
FNMA, 3.365% - 3.74%, (6-month USD LIBOR +/- MBS Margin), 12/01/22 - 8/01/37 | 7,169,229 | 7,288,851 | ||||||||
FNMA, 3.729% - 3.756%, (12-month USD LIBOR +/- MBS Margin), 5/01/33 - 7/01/38 | 6,250,111 | 6,408,410 | ||||||||
FNMA, 3.762%, (12-month USD LIBOR +/- MBS Margin), 3/01/37 | 2,906,420 | 3,014,647 | ||||||||
FNMA, 3.756% - 3.802%, (12-month USD LIBOR +/- MBS Margin), 8/01/33 - 11/01/42 | 6,881,424 | 7,098,935 | ||||||||
FNMA, 3.803% - 3.824%, (12-month USD LIBOR +/- MBS Margin), 10/01/33 - 3/01/47 | 5,847,618 | 6,020,386 | ||||||||
FNMA, 3.846%, (12-month USD LIBOR +/- MBS Margin), 5/01/40 | 6,182,428 | 6,469,040 | ||||||||
FNMA, 3.828% - 3.848%, (12-month USD LIBOR +/- MBS Margin), 10/01/33 - 1/01/41 | 6,382,059 | 6,650,089 | ||||||||
FNMA, 3.85%, (12-month USD LIBOR +/- MBS Margin), 11/01/42 | 7,622,899 | 7,919,867 | ||||||||
FNMA, 3.86%, (12-month USD LIBOR +/- MBS Margin), 2/01/36 | 2,772,152 | 2,880,461 | ||||||||
FNMA, 3.849% - 3.874%, (12-month USD LIBOR +/- MBS Margin), 11/01/32 - 7/01/42 | 5,982,192 | 6,164,852 | ||||||||
FNMA, 3.656% - 3.875%, (US 1 Year CMT T-Note +/- MBS Margin), 7/01/21 - 4/01/38 | 7,222,026 | 7,350,844 | ||||||||
FNMA, 3.874% - 3.88%, (12-month USD LIBOR +/- MBS Margin), 9/01/33 - 11/01/41 | 6,643,459 | 6,905,908 | ||||||||
FNMA, 3.894%, (US 1 Year CMT T-Note +/- MBS Margin), 1/01/38 | 3,206,008 | 3,350,290 | ||||||||
FNMA, 3.881% - 3.906%, (12-month USD LIBOR +/- MBS Margin), 9/01/32 - 9/01/38 | 6,599,573 | 6,841,311 | ||||||||
c | FNMA, 3.924%, (12-month USD LIBOR +/- MBS Margin), 8/01/44 | 7,962,924 | 8,303,440 | |||||||
FNMA, 3.91% - 3.925%, (12-month USD LIBOR +/- MBS Margin), 9/01/34 - 9/01/39 | 6,857,667 | 7,104,716 | ||||||||
FNMA, 3.928%, (12-month USD LIBOR +/- MBS Margin), 4/01/40 | 7,237,219 | 7,538,211 | ||||||||
FNMA, 3.926% - 3.944%, (12-month USD LIBOR +/- MBS Margin), 3/01/35 - 9/01/38 | 5,501,945 | 5,706,738 | ||||||||
FNMA, 3.948%, (12-month USD LIBOR +/- MBS Margin), 11/01/34 | 4,095,857 | 4,259,005 | ||||||||
FNMA, 3.949%, (12-month USD LIBOR +/- MBS Margin), 2/01/36 | 2,981,908 | 3,091,234 | ||||||||
FNMA, 3.945% - 3.955%, (12-month USD LIBOR +/- MBS Margin), 5/01/34 - 3/01/40 | 6,647,456 | 6,917,594 | ||||||||
c | FNMA, 3.959%, (12-month USD LIBOR +/- MBS Margin), 7/01/42 | 7,848,717 | 8,199,501 | |||||||
FNMA, 3.957% - 3.963%, (12-month USD LIBOR +/- MBS Margin), 7/01/34 - 8/01/39 | 5,959,108 | 6,172,384 | ||||||||
FNMA, 3.963% - 3.995%, (12-month USD LIBOR +/- MBS Margin), 9/01/32 - 10/01/41 | 5,490,553 | 5,670,594 | ||||||||
FNMA, 4.007%, (12-month USD LIBOR +/- MBS Margin), 7/01/42 | 6,207,062 | 6,474,325 | ||||||||
FNMA, 3.995% - 4.01%, (12-month USD LIBOR +/- MBS Margin), 7/01/33 - 2/01/43 | 6,827,017 | 7,084,909 | ||||||||
FNMA, 4.01%, (12-month USD LIBOR +/- MBS Margin), 10/01/38 | 2,875,231 | 2,994,416 | ||||||||
FNMA, 3.875% - 4.016%, (US 1 Year CMT T-Note +/- MBS Margin), 8/01/22 - 9/01/39 | 7,092,192 | 7,321,122 | ||||||||
FNMA, 4.048%, (12-month USD LIBOR +/- MBS Margin), 5/01/38 | 3,154,209 | 3,288,212 | ||||||||
FNMA, 4.048%, (12-month USD LIBOR +/- MBS Margin), 8/01/40 | 2,556,229 | 2,658,538 | ||||||||
FNMA, 4.015% - 4.053%, (12-month USD LIBOR +/- MBS Margin), 5/01/33 - 3/01/41 | 6,956,058 | 7,155,133 | ||||||||
FNMA, 4.078%, (12-month USD LIBOR +/- MBS Margin), 9/01/42 | 5,335,318 | 5,567,308 | ||||||||
FNMA, 4.055% - 4.094%, (12-month USD LIBOR +/- MBS Margin), 8/01/33 - 1/01/42 | 6,518,861 | 6,708,619 | ||||||||
FNMA, 4.099%, (12-month USD LIBOR +/- MBS Margin), 10/01/38 | 5,804,061 | 6,048,531 | ||||||||
FNMA, 4.10%, (12-month USD LIBOR +/- MBS Margin), 2/01/43 | 6,531,436 | 6,817,230 | ||||||||
FNMA, 4.129%, (US 1 Year CMT T-Note +/- MBS Margin), 6/01/36 | 2,691,692 | 2,805,946 | ||||||||
| 34 |
Semiannual Report | franklintempleton.com | ||
FRANKLIN INVESTORS SECURITIES TRUST
STATEMENT OF INVESTMENTS (UNAUDITED)
Franklin Adjustable U.S. Government Securities Fund (continued)
| Principal Amount | Value | |||||||||
Mortgage-Backed Securities (continued) | ||||||||||
b | Federal National Mortgage Association (FNMA) Adjustable Rate (continued) | |||||||||
FNMA, 4.094% - 4.136%, (12-month USD LIBOR +/- MBS Margin), 6/01/33 - 9/01/37 | $ | 6,444,381 | $ | 6,686,540 | ||||||
FNMA, 4.164%, (12-month USD LIBOR +/- MBS Margin), 7/01/40 | 2,498,124 | 2,612,184 | ||||||||
FNMA, 4.018% - 4.183%, (US 1 Year CMT T-Note +/- MBS Margin), 11/01/20 - 12/01/40 | 7,206,762 | 7,368,056 | ||||||||
FNMA, 4.187%, (12-month USD LIBOR +/- MBS Margin), 3/01/41 | 3,554,823 | 3,709,191 | ||||||||
FNMA, 4.138% - 4.241%, (12-month USD LIBOR +/- MBS Margin), 7/01/33 - 9/01/40 | 6,461,158 | 6,639,644 | ||||||||
FNMA, 4.242%, (US 1 Year CMT T-Note +/- MBS Margin), 5/01/36 | 11,447,743 | 11,948,165 | ||||||||
FNMA, 4.245%, (12-month USD LIBOR +/- MBS Margin), 1/01/36 | 2,716,145 | 2,837,007 | ||||||||
FNMA, 4.287%, (12-month USD LIBOR +/- MBS Margin), 1/01/37 | 3,221,627 | 3,365,025 | ||||||||
FNMA, 4.243% - 4.351%, (12-month USD LIBOR +/- MBS Margin), 5/01/33 - 5/01/48 | 6,726,738 | 6,964,823 | ||||||||
FNMA, 4.187% - 4.47%, (US 1 Year CMT T-Note +/- MBS Margin), 8/01/21 - 1/01/40 | 7,215,245 | 7,367,796 | ||||||||
FNMA, 4.485%, (12-month USD LIBOR +/- MBS Margin), 6/01/35 | 2,419,857 | 2,522,961 | ||||||||
FNMA, 4.354% - 4.501%, (12-month USD LIBOR +/- MBS Margin), 6/01/33 - 5/01/37 | 7,192,883 | 7,381,560 | ||||||||
FNMA, 3.479% - 4.762%, (US 5 Year CMT T-Note +/- MBS Margin), 5/01/26 - 2/01/30 | 91,331 | 91,723 | ||||||||
FNMA, 3.385% - 4.985%, (US 3 Year CMT T-Note +/- MBS Margin), 6/01/21 - 1/01/35 | 491,061 | 494,760 | ||||||||
FNMA, 4.502% - 5.183%, (12-month USD LIBOR +/- MBS Margin), 6/01/33 - 5/01/40 | 4,124,436 | 4,202,598 | ||||||||
FNMA, 3.745% - 5.729%, (6-month USD LIBOR +/- MBS Margin), 11/01/23 - 6/01/38 | 2,608,898 | 2,648,514 | ||||||||
FNMA, 2.234% - 6.445%, (11th District COF +/- MBS Margin), 10/01/20 - 11/01/40 | 7,073,478 | 7,028,205 | ||||||||
FNMA, 4.478% - 6.729%, (US 1 Year CMT T-Note +/- MBS Margin), 10/01/22 - 9/01/37 | 5,305,109 | 5,360,375 | ||||||||
FNMA, 3.74% - 7.67%, (6-month US T-Bill +/- MBS Margin), 12/01/21 - 11/01/34 | 157,282 | 159,958 | ||||||||
|
| |||||||||
| 436,866,579 | ||||||||||
|
| |||||||||
| Federal National Mortgage Association (FNMA) Fixed Rate 7.7% | ||||||||||
FNMA 15 Year, 2.50%, 11/01/34 | 28,210,771 | 29,544,220 | ||||||||
FNMA 15 Year, 2.50%, 1/01/35 | 13,551,829 | 14,193,862 | ||||||||
FNMA 15 Year, 2.50%, 3/01/35 | 12,463,440 | 13,133,508 | ||||||||
|
| |||||||||
| 56,871,590 | ||||||||||
|
| |||||||||
b | Government National Mortgage Association (GNMA) Adjustable Rate 0.1% | |||||||||
GNMA, 3.00% - 3.875%, (US 1 Year CMT T-Note +/- MBS Margin), 9/20/33 - 5/20/36 | 683,198 | 695,857 | ||||||||
|
| |||||||||
Total Mortgage-Backed Securities (Cost $674,097,224) | 669,929,490 | |||||||||
|
| |||||||||
Total Investments before Short Term Investments | 681,331,069 | |||||||||
|
| |||||||||
| Shares | ||||||||||
|
| |||||||||
Short Term Investments 9.0% | ||||||||||
| Money Market Funds (Cost $36,861,475) 5.0% | ||||||||||
d,e | Institutional Fiduciary Trust Money Market Portfolio, 0.01% | 36,861,475 | 36,861,475 | |||||||
|
| |||||||||
franklintempleton.com | Semiannual Report | 35 | ||||
FRANKLIN INVESTORS SECURITIES TRUST
STATEMENT OF INVESTMENTS (UNAUDITED)
Franklin Adjustable U.S. Government Securities Fund (continued)
| �� | Principal Amount | Value | ||||||||
Short Term Investments (continued) | ||||||||||
| Repurchase Agreements (Cost $29,701,565) 4.0% | ||||||||||
f | Joint Repurchase Agreement, 0.028%, 5/01/2020 (Maturity Value $29,701,588) | |||||||||
BNP Paribas Securities Corp. (Maturity Value $22,743,397) | ||||||||||
Deutsche Bank Securities Inc. (Maturity Value $4,228,912) | ||||||||||
HSBC Securities (USA) Inc. (Maturity Value $2,729,279) | ||||||||||
Collateralized by U.S. Government Agency Securities, 4.00% - 4.50%, 11/20/48 - 4/20/50; gU.S. Treasury Bills, 8/13/20; and U.S. Treasury Notes, 0.17% - 2.00%, 10/31/20 - 7/31/24 (valued at $30,301,367) | 29,701,565 | $ | 29,701,565 | |||||||
|
| |||||||||
Total Investments (Cost $752,073,836) 101.3% | 747,894,109 | |||||||||
Other Assets, less Liabilities (1.3)% | (9,580,493 | ) | ||||||||
|
| |||||||||
Net Assets 100.0% | $ | 738,313,616 | ||||||||
|
| |||||||||
See Abbreviations on page 171.
aAdjustable rate security with an interest rate that is not based on a published reference index and spread. The rate is based on the structure of the agreement and current market conditions. The coupon rate shown represents the rate at period end.
bAdjustable Rate Mortgage-Backed Security (ARM); the rate shown is the effective rate at period end. ARM rates are not based on a published reference rate and spread, but instead pass-through weighted average interest income inclusive of any caps or floors, if applicable, from the underlying mortgage loans in which the majority of mortgages pay interest based on the index shown at their designated reset dates plus a spread, less the applicable servicing and guaranty fee (MBS margin).
cA portion or all of the security purchased on a delayed delivery basis. See Note 1(d).
dSee Note 3(f) regarding investments in affiliated management investment companies.
eThe rate shown is the annualized seven-day effective yield at period end.
fSee Note 1(c) regarding joint repurchase agreement.
gThe security was issued on a discount basis with no stated coupon rate.
| 36 |
Semiannual Report | The accompanying notes are an integral part of these financial statements. | franklintempleton.com | ||
FRANKLIN INVESTORS SECURITIES TRUST
Financial Highlights
Franklin Floating Rate Daily Access Fund
Six Months Ended April 30, 2020 (unaudited) | Year Ended October 31, | |||||||||||||||||||||||
2019 | 2018 | 2017 | 2016 | 2015 | ||||||||||||||||||||
| Class A | ||||||||||||||||||||||||
| Per share operating performance (for a share outstanding throughout the period) | ||||||||||||||||||||||||
Net asset value, beginning of period | $ 8.18 | $ 8.70 | $ 8.83 | $ 8.84 | $ 8.61 | $ 9.04 | ||||||||||||||||||
Income from investment operationsa: | ||||||||||||||||||||||||
Net investment income | 0.189 | b | 0.441 | b | 0.396 | 0.307 | 0.401 | 0.406 | ||||||||||||||||
Net realized and unrealized gains (losses) | (0.964 | ) | (0.515 | ) | (0.129 | ) | (0.011 | ) | 0.228 | (0.434 | ) | |||||||||||||
Total from investment operations | (0.775 | ) | (0.074 | ) | 0.267 | 0.296 | 0.629 | (0.028 | ) | |||||||||||||||
Less distributions from: | ||||||||||||||||||||||||
Net investment income | (0.195 | ) | (0.446 | ) | (0.397 | ) | (0.306 | ) | (0.399 | ) | (0.402 | ) | ||||||||||||
Net asset value, end of period | $ 7.21 | $ 8.18 | $ 8.70 | $ 8.83 | $ 8.84 | $ 8.61 | ||||||||||||||||||
Total returnc | (9.66)% | (0.88)% | 2.97% | 3.51% | 7.60% | (0.37)% | ||||||||||||||||||
| Ratios to average net assetsd | ||||||||||||||||||||||||
Expenses before waiver and payments by affiliates | 0.96% | 0.89% | 0.87% | 0.87% | 0.88% | 0.85% | ||||||||||||||||||
Expenses net of waiver and payments by affiliatese | 0.93% | 0.86% | 0.81% | 0.82% | 0.86% | 0.84% | ||||||||||||||||||
Net investment income | 4.79% | 5.21% | 4.53% | 3.45% | 4.72% | 4.55% | ||||||||||||||||||
| Supplemental data | ||||||||||||||||||||||||
Net assets, end of period (000’s) | $757,159 | $1,049,359 | $1,344,473 | $1,362,220 | $1,359,862 | $1,553,100 | ||||||||||||||||||
Portfolio turnover rate | 13.45% | 23.23% | f | 58.07% | 64.21% | 34.10% | 46.72% | |||||||||||||||||
aThe amount shown for a share outstanding throughout the period may not correlate with the Statement of Operations for the period due to the timing of sales and repurchases of the Fund’s shares in relation to income earned and/or fluctuating fair value of the investments of the Fund.
bBased on average daily shares outstanding.
cTotal return does not reflect sales commissions or contingent deferred sales charges, if applicable, and is not annualized for periods less than one year.
dRatios are annualized for periods less than one year.
eBenefit of expense reduction rounds to less than 0.01%.
fExcludes the value of portfolio activity as a result of in-kind transactions.
franklintempleton.com | The accompanying notes are an integral part of these financial statements. | Semiannual Report | 37 | ||||
FRANKLIN INVESTORS SECURITIES TRUST
FINANCIAL HIGHLIGHTS
Franklin Floating Rate Daily Access Fund (continued)
Six Months Ended (unaudited) | Year Ended October 31, | |||||||||||||||||||||||
| 2019 | 2018 | 2017 | 2016 | 2015 | ||||||||||||||||||||
| Class C | ||||||||||||||||||||||||
| Per share operating performance (for a share outstanding throughout the period) | ||||||||||||||||||||||||
Net asset value, beginning of period | $ 8.18 | $ 8.70 | $ 8.83 | $ 8.84 | $ 8.61 | $ 9.05 | ||||||||||||||||||
| Income from investment operationsa: | ||||||||||||||||||||||||
Net investment income | 0.174 | b | 0.407 | b | 0.364 | 0.271 | 0.366 | 0.369 | ||||||||||||||||
Net realized and unrealized gains (losses) | (0.965 | ) | (0.514 | ) | (0.131 | ) | (0.010 | ) | 0.229 | (0.443 | ) | |||||||||||||
Total from investment operations | (0.791 | ) | (0.107 | ) | 0.233 | 0.261 | 0.595 | (0.074 | ) | |||||||||||||||
Less distributions from: | ||||||||||||||||||||||||
Net investment income | (0.179 | ) | (0.413 | ) | (0.363 | ) | (0.271 | ) | (0.365 | ) | (0.366 | ) | ||||||||||||
Net asset value, end of period | $ 7.21 | $ 8.18 | $ 8.70 | $ 8.83 | $ 8.84 | $ 8.61 | ||||||||||||||||||
Total returnc | (9.84)% | (1.39)% | 2.68% | 3.11% | 7.18% | (0.87)% | ||||||||||||||||||
| Ratios to average net assetsd | ||||||||||||||||||||||||
Expenses before waiver and payments by affiliates | 1.36% | 1.29% | 1.27% | 1.27% | 1.28% | 1.25% | ||||||||||||||||||
Expenses net of waiver and payments by affiliatese | 1.33% | 1.26% | 1.21% | 1.22% | 1.26% | 1.24% | ||||||||||||||||||
Net investment income | 4.39% | 4.81% | 4.13% | 3.05% | 4.32% | 4.15% | ||||||||||||||||||
| Supplemental data | ||||||||||||||||||||||||
Net assets, end of period (000’s) | $203,141 | $296,134 | $438,480 | $550,797 | $551,726 | $627,805 | ||||||||||||||||||
Portfolio turnover rate | 13.45% | 23.23% | f | 58.07% | 64.21% | 34.10% | 46.72% | |||||||||||||||||
aThe amount shown for a share outstanding throughout the period may not correlate with the Statement of Operations for the period due to the timing of sales and repurchases of the Fund’s shares in relation to income earned and/or fluctuating fair value of the investments of the Fund.
bBased on average daily shares outstanding.
cTotal return does not reflect sales commissions or contingent deferred sales charges, if applicable, and is not annualized for periods less than one year.
dRatios are annualized for periods less than one year.
eBenefit of expense reduction rounds to less than 0.01%.
fExcludes the value of portfolio activity as a result of in-kind transactions.
| 38 |
Semiannual Report | The accompanying notes are an integral part of these financial statements. | franklintempleton.com | ||
FRANKLIN INVESTORS SECURITIES TRUST
FINANCIAL HIGHLIGHTS
Franklin Floating Rate Daily Access Fund (continued)
Six Months Ended (unaudited) | Year Ended October 31, | |||||||||||||||||||||||
2019 | 2018 | 2017 | 2016 | 2015 | ||||||||||||||||||||
| Class R6 | ||||||||||||||||||||||||
| Per share operating performance (for a share outstanding throughout the period) | ||||||||||||||||||||||||
Net asset value, beginning of period | $ 8.19 | $ 8.71 | $ 8.84 | $ 8.84 | $ 8.60 | $ 9.05 | ||||||||||||||||||
| Income from investment operationsa: | ||||||||||||||||||||||||
Net investment income | 0.205 | b | 0.463 | b | 0.427 | 0.338 | 0.422 | 0.437 | ||||||||||||||||
Net realized and unrealized gains (losses) | (0.966 | ) | (0.508 | ) | (0.130 | ) | (0.002 | ) | 0.245 | (0.457 | ) | |||||||||||||
Total from investment operations | (0.761 | ) | (0.045 | ) | 0.297 | 0.336 | 0.667 | (0.020 | ) | |||||||||||||||
| Less distributions from: | ||||||||||||||||||||||||
Net investment income | (0.209 | ) | (0.475 | ) | (0.427 | ) | (0.336 | ) | (0.427 | ) | (0.430 | ) | ||||||||||||
| Net asset value, end of period | $ 7.22 | $ 8.19 | $ 8.71 | $ 8.84 | $ 8.84 | $ 8.60 | ||||||||||||||||||
Total returnc | (9.48)% | (0.54)% | 3.43% | 3.85% | 7.96% | (0.16)% | ||||||||||||||||||
| Ratios to average net assetsd | ||||||||||||||||||||||||
Expenses before waiver and payments by affiliates | 0.68% | 0.57% | 0.55% | 0.52% | 0.53% | 0.72% | ||||||||||||||||||
Expenses net of waiver and payments by affiliatese | 0.58% | 0.53% | 0.48% | 0.47% | 0.51% | 0.51% | ||||||||||||||||||
Net investment income | 5.14% | 5.54% | 4.86% | 3.80% | 5.07% | 4.88% | ||||||||||||||||||
| Supplemental data | ||||||||||||||||||||||||
Net assets, end of period (000’s) | $12,166 | $18,764 | $142,075 | $130,180 | $12,333 | $7 | ||||||||||||||||||
Portfolio turnover rate | 13.45% | 23.23% | f | 58.07% | 64.21% | 34.10% | 46.72% | |||||||||||||||||
aThe amount shown for a share outstanding throughout the period may not correlate with the Statement of Operations for the period due to the timing of sales and repurchases of the Fund’s shares in relation to income earned and/or fluctuating fair value of the investments of the Fund.
bBased on average daily shares outstanding.
cTotal return is not annualized for periods less than one year.
dRatios are annualized for periods less than one year.
eBenefit of expense reduction rounds to less than 0.01%.
fExcludes the value of portfolio activity as a result of in-kind transactions.
| franklintempleton.com |
The accompanying notes are an integral part of these financial statements. | Semiannual Report | 39 | ||||
FRANKLIN INVESTORS SECURITIES TRUST
FINANCIAL HIGHLIGHTS
Franklin Floating Rate Daily Access Fund (continued)
| Six Months Ended April 30, 2020 | Year Ended October 31, | |||||||||||||||||||||||
| (unaudited) | 2019 | 2018 | 2017 | 2016 | 2015 | |||||||||||||||||||
Advisor Class | ||||||||||||||||||||||||
Per share operating performance (for a share outstanding throughout the period) | ||||||||||||||||||||||||
Net asset value, beginning of period | $ 8.18 | $ 8.71 | $ 8.84 | $ 8.85 | $ 8.61 | $ 9.05 | ||||||||||||||||||
|
| |||||||||||||||||||||||
| Income from investment operationsa: | ||||||||||||||||||||||||
Net investment income | 0.200 | b | 0.463 | b | 0.418 | 0.327 | 0.422 | 0.427 | ||||||||||||||||
Net realized and unrealized gains (losses) | (0.965 | ) | (0.525 | ) | (0.129 | ) | (0.010 | ) | 0.239 | (0.443 | ) | |||||||||||||
|
| |||||||||||||||||||||||
Total from investment operations | (0.765 | ) | (0.062 | ) | 0.289 | 0.317 | 0.661 | (0.016 | ) | |||||||||||||||
|
| |||||||||||||||||||||||
| Less distributions from: | ||||||||||||||||||||||||
Net investment income | (0.205 | ) | (0.468 | ) | (0.419 | ) | (0.327 | ) | (0.421 | ) | (0.424 | ) | ||||||||||||
|
| |||||||||||||||||||||||
Net asset value, end of period | $ 7.21 | $ 8.18 | $ 8.71 | $ 8.84 | $ 8.85 | $ 8.61 | ||||||||||||||||||
|
| |||||||||||||||||||||||
Total returnc | (9.54)% | (0.74)% | 3.35% | 3.64% | 8.00% | (0.23)% | ||||||||||||||||||
| Ratios to average net assetsd | ||||||||||||||||||||||||
Expenses before waiver and payments by affiliates | 0.71% | 0.64% | 0.62% | 0.62% | 0.63% | 0.60% | ||||||||||||||||||
Expenses net of waiver and payments by affiliatese | 0.68% | 0.61% | 0.56% | 0.57% | 0.61% | 0.59% | ||||||||||||||||||
Net investment income | 5.04% | 5.46% | 4.78% | 3.70% | 4.97% | 4.80% | ||||||||||||||||||
| Supplemental data | ||||||||||||||||||||||||
Net assets, end of period (000’s) | $515,032 | $858,071 | $1,743,880 | $1,672,724 | $1,108,692 | $1,405,281 | ||||||||||||||||||
Portfolio turnover rate | 13.45% | 23.23% | f | 58.07% | 64.21% | 34.10% | 46.72% | |||||||||||||||||
aThe amount shown for a share outstanding throughout the period may not correlate with the Statement of Operations for the period due to the timing of sales and repurchases of the Fund’s shares in relation to income earned and/or fluctuating fair value of the investments of the Fund.
bBased on average daily shares outstanding.
cTotal return is not annualized for periods less than one year.
dRatios are annualized for periods less than one year.
eBenefit of expense reduction rounds to less than 0.01%.
fExcludes the value of portfolio activity as a result of in-kind transactions.
| 40 |
Semiannual Report | The accompanying notes are an integral part of these financial statements. | franklintempleton.com | ||
FRANKLIN INVESTORS SECURITIES TRUST
Statement of Investments, April 30, 2020 (unaudited)
Franklin Floating Rate Daily Access Fund
| Country | Shares | Value | ||||||||||||
Common Stocks 2.1% | ||||||||||||||
Diversified Support Services 0.1% | ||||||||||||||
| a,b | Remington Outdoor Co. Inc. | United States | 1,808,932 | $ | 904,466 | |||||||||
|
| |||||||||||||
Forest Products 1.5% | ||||||||||||||
| a,b,c,d | Appvion Operations Inc. | United States | 1,219,956 | 22,625,485 | ||||||||||
|
| |||||||||||||
Oil & Gas Exploration & Production 0.5% | ||||||||||||||
| a | Samson Resources II LLC | United States | 432,778 | 7,140,837 | ||||||||||
|
| |||||||||||||
Total Common Stocks (Cost $87,820,268) |
|
30,670,788 |
| |||||||||||
|
| |||||||||||||
Management Investment Companies (Cost $67,471,245) 3.3% | ||||||||||||||
| Other Diversified Financial Services 3.3% | ||||||||||||||
| e | Franklin Floating Rate Income Fund | United States | 6,837,495 | 48,477,837 | ||||||||||
|
| |||||||||||||
|
Principal |
| ||||||||||||
Corporate Bonds (Cost $21,572,625) 1.0% | ||||||||||||||
Industrial Machinery 1.0% | ||||||||||||||
| c,f | Onsite Rental Group Operations Pty. Ltd., secured note, PIK, 6.10%, 10/26/23 | Australia | $ | 21,096,262 | 15,426,642 | |||||||||
|
| |||||||||||||
| g,h | Senior Floating Rate Interests 81.5% | |||||||||||||
Aerospace & Defense 1.9% | ||||||||||||||
| i,j | AI Convoy US Borrower LLC, Facility B Loan (USD), TBD, 1/15/27 | United States | 3,668,000 | 3,489,185 | ||||||||||
f | Alloy Finco Ltd., Term Loan B, PIK, 14.00%, 3/06/25 | United States | 14,427,402 | 7,033,358 | ||||||||||
Doncasters U.S. Finance LLC, Term Loan B, 8.50%, (3-month USD LIBOR + 6.50%), 3/06/24 | United States | 12,106,986 | 10,381,740 | |||||||||||
| i | Dynasty Acquisition Co. Inc., | |||||||||||||
Initial Term B-1 Loan, 4.95%, (3-month USD LIBOR + 3.50%), 4/04/26 | United States | 5,410,424 | 4,785,969 | |||||||||||
Initial Term B-2 Loan (CAD), 4.95%, (3-month USD LIBOR + 3.50%), 4/04/26 | United States | 2,908,830 | 2,573,102 | |||||||||||
|
| |||||||||||||
|
28,263,354 |
| ||||||||||||
|
| |||||||||||||
Air Freight & Logistics 0.7% | ||||||||||||||
XPO Logistics Inc., Refinanced Term Loan, 3.613%, (3-month USD LIBOR + 2.00%), 2/24/25 | United States | 10,200,000 | 9,919,500 | |||||||||||
|
| |||||||||||||
Airlines 2.0% | ||||||||||||||
Air Canada, Term Loans, 2.468%, (1-month USD LIBOR + 1.75%), 10/06/23 | Canada | 3,345,051 | 3,052,359 | |||||||||||
Allegiant Travel Co., Class B Term Loan, 4.707%, (3-month USD LIBOR + 3.00%), 2/05/24 | United States | 19,622,000 | 15,697,600 | |||||||||||
American Airlines Inc., 2017 Class B Term Loan, 2.814%, (3-month USD LIBOR + 2.00%), 12/14/23 | United States | 2,000,000 | 1,547,142 | |||||||||||
| i,j | Delta Air Lines Inc., Term Loan, TBD, 4/29/23 | United States | 2,136,480 | 2,129,804 | ||||||||||
Westjet Airlines Ltd., Initial Term Loan, 4.00%, (1-month USD LIBOR + 3.00%), 12/11/26 | Canada | 8,155,478 | 6,695,647 | |||||||||||
|
| |||||||||||||
|
29,122,552 |
| ||||||||||||
|
| |||||||||||||
Alternative Carriers 0.5% | ||||||||||||||
Lineage Logistics LLC, Term Loans, 4.00%, (1-month USD LIBOR + 3.00%), 2/27/25 | United States | 2,294,148 | 2,223,531 | |||||||||||
Zayo Group Holdings Inc (Front Range BidCo), Initial Dollar Term Loan, 3.404%, (1-month USD LIBOR + 3.00%), 3/09/27 | United States | 5,899,900 | 5,558,815 | |||||||||||
|
| |||||||||||||
|
7,782,346 |
| ||||||||||||
|
| |||||||||||||
franklintempleton.com | Semiannual Report | 41 | ||||
FRANKLIN INVESTORS SECURITIES TRUST
STATEMENT OF INVESTMENTS (UNAUDITED)
Franklin Floating Rate Daily Access Fund (continued)
| Country | | Principal Amount | * | Value | ||||||||||
| g,h | Senior Floating Rate Interests (continued) | |||||||||||||
Aluminum 0.1% | ||||||||||||||
Arconic Corp., Initial Term Loans, 3.24%, (1-month USD LIBOR + 2.75%), 2/04/27 | United States | $ | 2,098,000 | $ | 2,087,510 | |||||||||
|
| |||||||||||||
Apparel Retail 0.2% | ||||||||||||||
Ascena Retail Group, Inc., | ||||||||||||||
Tranche B Term Loan, 5.25%, (1-month USD LIBOR + 4.50%), 8/21/22 | United States | 6,954,574 | 1,647,364 | |||||||||||
Tranche B Term Loan, 6.00%, (3-month USD LIBOR + 4.50%), 8/21/22 | United States | 7,039,055 | 1,667,376 | |||||||||||
|
| |||||||||||||
| 3,314,740 | ||||||||||||||
|
| |||||||||||||
Apparel, Accessories & Luxury Goods 0.2% | ||||||||||||||
Champ Acquisition Corp., Initial Term Loan, 6.572%, (3-month USD LIBOR + 5.50%), 12/21/25 | United States | 3,080,280 | 2,764,551 | |||||||||||
|
| |||||||||||||
Application Software 0.1% | ||||||||||||||
Ceridian HCM Holding Inc., Initial Term Loans, 2.637%, (1-week USD LIBOR + 2.50%), 4/30/25 | United States | 1,895,190 | 1,798,061 | |||||||||||
|
| |||||||||||||
Asset Management & Custody Banks 0.7% | ||||||||||||||
Russell Investments US Institutional Holdco Inc., Term Loan B, 3.822%, (3-month USD LIBOR + 2.75%), 6/01/23 | United States | 10,512,434 | 9,681,952 | |||||||||||
|
| |||||||||||||
Auto Parts & Equipment 2.6% | ||||||||||||||
Adient U.S. LLC, Initial Term Loans, 5.45% - 5.742%, (3-month USD LIBOR + 4.00%), 5/06/24 | United States | 11,427,076 | 10,373,637 | |||||||||||
Clarios Global LP (Power Solutions), Initial Dollar Term Loan, 3.904%, (1-month USD LIBOR + 3.50%), 4/30/26 | United States | 13,231,909 | 12,024,497 | |||||||||||
TI Group Automotive Systems LLC, Initial US Term Loan, 3.25%, (1-month USD LIBOR + 2.50%), 6/30/22 | United States | 17,286,480 | 16,119,643 | |||||||||||
|
| |||||||||||||
| 38,517,777 | ||||||||||||||
|
| |||||||||||||
Automobile Manufacturers 0.7% | ||||||||||||||
Thor Industries Inc., Initial USD Term Loans, 4.625% - 4.75%, (1-month USD LIBOR + 3.75%), 2/01/26 | United States | 10,561,601 | 9,721,077 | |||||||||||
|
| |||||||||||||
Automotive Retail 0.2% | ||||||||||||||
Wand NewCo.3 Inc. (Caliber Collision), Initial Term Loan, 4.072%, (3-month USD LIBOR + 3.00%), 2/05/26 | United States | 3,473,794 | 3,145,955 | |||||||||||
|
| |||||||||||||
Broadcasting 5.4% | ||||||||||||||
Diamond Sports Group LLC, Term Loan, 3.82%, (1-month USD LIBOR + 3.25%), 8/24/26 | United States | 18,630,216 | 15,288,421 | |||||||||||
Gray Television Inc., Term B-2 Loan, 3.243%, (1-month USD LIBOR + 2.25%), 2/07/24 | United States | 26,687,491 | 25,561,599 | |||||||||||
Mission Broadcasting Inc., Term B-3 Loan, 3.235%, (1-month USD LIBOR + 2.25%), 1/17/24 | United States | 2,050,625 | 1,938,866 | |||||||||||
Nexstar Broadcasting Inc., | ||||||||||||||
Term B-3 Loan, 2.654%, (1-month USD LIBOR + 2.25%), 10/26/25 | United States | 7,971,063 | 7,536,640 | |||||||||||
Term B-4 Loan, 3.735%, (1-month USD LIBOR + 2.75%), 9/19/26 | United States | 1,599,473 | 1,509,903 | |||||||||||
Sinclair Television Group Inc., Tranche B Term Loans, 2.66%, (1-month USD LIBOR + 2.25%), 1/03/24 | United States | 29,962,331 | 28,108,412 | |||||||||||
|
| |||||||||||||
| 79,943,841 | ||||||||||||||
|
| |||||||||||||
Building Products 1.1% | ||||||||||||||
Resideo Funding Inc., Tranche A Term Loan, 3.71%, (3-month USD LIBOR + 2.25%), 10/25/23 | United States | 16,312,500 | 16,230,938 | |||||||||||
|
| |||||||||||||
42 |
Semiannual Report |
franklintempleton.com | ||
FRANKLIN INVESTORS SECURITIES TRUST
STATEMENT OF INVESTMENTS (UNAUDITED)
Franklin Floating Rate Daily Access Fund (continued)
| Country | | Principal Amount | * | Value | ||||||||||
g,h | Senior Floating Rate Interests (continued) | |||||||||||||
| Cable & Satellite 2.9% | ||||||||||||||
Charter Communications Operating LLC (CCO Safari III LLC), Term B-2 Loan, 2.16%, (1-month USD LIBOR + 1.75%), 2/01/27 | United States | $ | 4,906,564 | $ | 4,737,465 | |||||||||
CSC Holdings LLC, March 2017 Incremental Term Loans, 3.064%, (1-month USD LIBOR + 2.25%), 7/17/25 | United States | 36,129,940 | 34,702,807 | |||||||||||
WideOpenWest Finance LLC, Term B Loan, 4.25%, (1-month USD LIBOR + 3.25%), 8/19/23 | United States | 3,910,974 | 3,671,426 | |||||||||||
|
| |||||||||||||
| 43,111,698 | ||||||||||||||
|
| |||||||||||||
| Casinos & Gaming 3.7% | ||||||||||||||
Aristocrat Technologies Inc., Term B-3 Loans, 2.859%, (3-month USD LIBOR + 1.75%), 10/19/24 | United States | 3,940,069 | 3,756,198 | |||||||||||
Boyd Gaming Corp., | ||||||||||||||
Refinancing Term B Loans, 2.387%, (1-week USD LIBOR + 2.25%), 9/15/23 | United States | 9,727,379 | 9,149,816 | |||||||||||
Term A Loan, 2.137%, (1-week USD LIBOR + 2.00%), 9/15/21 | United States | 4,159,948 | 4,055,949 | |||||||||||
Caesars Resort Collection LLC, Term B Loans, 3.154%, (1-month USD LIBOR + 2.75%), 12/22/24 | United States | 16,419,861 | 13,881,630 | |||||||||||
Eldorado Resorts Inc., Initial Term Loan, 3.25%, (3-month USD LIBOR + 2.25%), 4/17/24 | United States | 8,108,851 | 7,762,538 | |||||||||||
Stars Group Holdings BV, Stars Group (US), USD Term Loan, 4.95%, (3-month USD LIBOR + 3.50%), 7/10/25 | United States | 9,519,281 | 9,433,017 | |||||||||||
Station Casinos LLC, Term B-1 Facility Loans, 2.66%, (1-month USD LIBOR + 2.25%), 2/07/27 | United States | 7,735,949 | 6,895,740 | |||||||||||
|
| |||||||||||||
| 54,934,888 | ||||||||||||||
|
| |||||||||||||
| Commodity Chemicals 0.9% | ||||||||||||||
i | Cyanco Intermediate Corp., Initial Term Loans, 3.904%, (1-month USD LIBOR + 3.50%), 3/16/25 | United States | 4,007,294 | 3,794,407 | ||||||||||
Univar Solutions USA Inc., first lien, Term B-5 Loans, 3.45%, (3-month USD LIBOR + 2.00%), 7/01/26 | United States | 1,144,995 | 1,100,149 | |||||||||||
Univar USA Inc., Term B-3 Loans, 3.70%, (3-month USD LIBOR + 2.25%), 7/01/24 | United States | 8,306,001 | 8,056,821 | |||||||||||
|
| |||||||||||||
| 12,951,377 | ||||||||||||||
|
| |||||||||||||
| Communications Equipment 0.9% | ||||||||||||||
CommScope Inc., Initial Term Loans, 3.654%, (1-month USD LIBOR + 3.25%), 4/04/26 | United States | 13,949,331 | 13,248,377 | |||||||||||
|
| |||||||||||||
| Construction & Engineering 0.9% | ||||||||||||||
Strike, LLC, | ||||||||||||||
Term Loan, 9.45%, (3-month USD LIBOR + 8.00%), 11/30/22 | United States | 245,065 | 208,305 | |||||||||||
Term Loan, 9.072%, (6-month USD LIBOR + 8.00%), 11/30/22 | United States | 16,174,286 | 13,748,143 | |||||||||||
|
| |||||||||||||
| 13,956,448 | ||||||||||||||
|
| |||||||||||||
| Consumer Finance 0.1% | ||||||||||||||
Realogy Group LLC, Initial Term A Loan, 3.243%, (1-month USD LIBOR + 2.25%), 2/08/23 | United States | 947,533 | 846,462 | |||||||||||
|
| |||||||||||||
| Data Processing & Outsourced Services 0.7% | ||||||||||||||
Neustar, Inc., | ||||||||||||||
TLB5, 5.572%, (1-month USD LIBOR + 4.50%), 8/08/24 | United States | 8,179,597 | 6,717,493 | |||||||||||
TLB5, 5.95%, (3-month USD LIBOR + 4.50%), 8/08/24 | United States | 20,708 | 17,007 | |||||||||||
WEX Inc., Term B-3 Loan, 2.654%, (1-month USD LIBOR + 2.25%), 5/17/26 | United States | 4,090,415 | 3,876,944 | |||||||||||
|
| |||||||||||||
| 10,611,444 | ||||||||||||||
|
| |||||||||||||
franklintempleton.com | Semiannual Report | 43 | ||||
FRANKLIN INVESTORS SECURITIES TRUST
STATEMENT OF INVESTMENTS (UNAUDITED)
Franklin Floating Rate Daily Access Fund (continued)
| Country | | Principal Amount | * | Value | ||||||||||||||
g,h | Senior Floating Rate Interests (continued) | |||||||||||||||||
Diversified Support Services 1.2% | ||||||||||||||||||
Ventia Pty. Ltd., Term B Loans, 4.95%, (3-month USD LIBOR + 3.50%), 5/21/26 | Australia | $ | 18,906,520 | $ | 17,393,998 | |||||||||||||
|
| |||||||||||||||||
Electric Utilities 0.4% | ||||||||||||||||||
EFS Cogen Holdings I LLC (Linden), | ||||||||||||||||||
Term B Advance, 4.25%, (1-month USD LIBOR + 3.25%), 6/28/23 | United States | 1,587,062 | 1,537,219 | |||||||||||||||
Term B Advance, 4.71%, (3-month USD LIBOR + 3.25%), 6/28/23 | United States | 3,825,479 | 3,705,336 | |||||||||||||||
Vistra Operations Company LLC, 2018 Incremental Term Loans, 2.154% - 2.501%, (1-month USD LIBOR + 1.75%), 12/31/25 | United States | 704,937 | 685,331 | |||||||||||||||
|
| |||||||||||||||||
| 5,927,886 | ||||||||||||||||||
|
| |||||||||||||||||
Environmental & Facilities Services 0.6% | ||||||||||||||||||
Harsco Corp., Term Loan B-2, 2.688%, (1-month USD LIBOR + 2.25%), 12/10/24 | United States | 8,514,574 | 8,301,710 | |||||||||||||||
|
| |||||||||||||||||
Food Distributors 0.3% | ||||||||||||||||||
Nutraceutical International Corp., Term Loans, 4.25%, (1-month USD LIBOR + 3.25%), 8/22/23 | United States | 4,992,982 | 4,375,100 | |||||||||||||||
|
| |||||||||||||||||
Food Retail 1.6% | ||||||||||||||||||
BI-LO LLC (Southeastern Grocers), FILO Loan (ABL), 6.863%, (3-month USD LIBOR + 5.25%), 5/31/22 | United States | 23,968,750 | 22,650,469 | |||||||||||||||
Whatabrands LLC (Whataburger), 2020 Refinancing Term Loans, 3.732%, (1-month USD LIBOR + 2.75%), 8/02/26 | United States | 1,280,984 | 1,191,315 | |||||||||||||||
|
| |||||||||||||||||
| 23,841,784 | ||||||||||||||||||
|
| |||||||||||||||||
Forest Products 1.9% | ||||||||||||||||||
| b | Appvion Operations Inc., | |||||||||||||||||
Term Loan, 7.00%, (3-month USD LIBOR + 6.00%), 6/15/26 | United States | 28,988,125 | 28,408,362 | |||||||||||||||
Term Loan, 8.25%, (Prime + 5.00%), 6/15/26 | United States | 120,820 | 118,404 | |||||||||||||||
|
| |||||||||||||||||
| 28,526,766 | ||||||||||||||||||
|
| |||||||||||||||||
General Merchandise Stores 2.1% | ||||||||||||||||||
| f | 99 Cents Only Stores, First Lien Term Loan, PIK, 7.572% - 8.09%, (6-month USD LIBOR + 6.50%), 1/13/22 | United States | 39,856,807 | 29,504,002 | ||||||||||||||
| i | BJ’s Wholesale Club Inc., Tranche B Term Loans, 2/03/24 | United States | 2,000,000 | 1,952,500 | ||||||||||||||
|
| |||||||||||||||||
| 31,456,502 | ||||||||||||||||||
|
| |||||||||||||||||
Health Care Distributors 0.1% | ||||||||||||||||||
Mallinckrodt International Finance SA & Mallinckrodt CB LLC, 2017 Term B Loans, 4.20%, (3-month USD LIBOR + 2.75%), 9/24/24 | Luxembourg | 2,155,191 | 1,537,882 | |||||||||||||||
|
| |||||||||||||||||
Health Care Facilities 0.0%† | ||||||||||||||||||
US Anesthesia Partners Inc., First Lien Term Loan, 4.00%, (3-month USD LIBOR + 3.00%), 6/23/24 | United States | 797,949 | 686,236 | |||||||||||||||
|
| |||||||||||||||||
Health Care Services 2.4% | ||||||||||||||||||
Air Medical Group Holdings Inc., 2018 New Term Loans, 5.863%, (3-month USD LIBOR + 4.25%), 3/14/25 | United States | 4,814,596 | 4,337,147 | |||||||||||||||
Catalent Pharma Solutions Inc., Dollar Term B-2 Loan, 3.25%, (1-month USD LIBOR + 2.25%), 5/17/26 | United States | 8,003,733 | 7,903,686 | |||||||||||||||
DaVita Inc., Tranche B-1 Term Loan, 2.154%, (1-month USD LIBOR + 1.75%), 8/12/26 | United States | 7,003,959 | 6,840,899 | |||||||||||||||
| i | Gentiva Health Services Inc., Term B Loans, 3.688%, (1-month USD LIBOR + 3.25%), 7/02/25 | United States | 6,500,000 | 6,158,750 | ||||||||||||||
| 44 |
Semiannual Report | franklintempleton.com | ||
FRANKLIN INVESTORS SECURITIES TRUST
STATEMENT OF INVESTMENTS (UNAUDITED)
Franklin Floating Rate Daily Access Fund (continued)
| Country | Principal Amount* | Value | ||||||||||||
g,h | Senior Floating Rate Interests (continued) | |||||||||||||
| Health Care Services (continued) | ||||||||||||||
National Mentor Holdings Inc., | ||||||||||||||
Initial Term C Loans, 5.71%, (3-month USD LIBOR + 4.25%), 3/08/26 | United States | $ | 506,281 | $ | 483,499 | |||||||||
Initial Term Loans, 4.66%, (1-month USD LIBOR + 4.25%), 3/08/26 | United States | 7,999,245 | 7,639,279 | |||||||||||
Initial Term Loans, 5.71%, (3-month USD LIBOR + 4.25%), 3/08/26 | United States | 3,148,372 | 3,006,695 | |||||||||||
|
| |||||||||||||
| 36,369,955 | ||||||||||||||
|
| |||||||||||||
| Health Care Technology 1.3% | ||||||||||||||
i,j | Change Healthcare Holdings LLC, Closing Date Term Loan, TBD, 3/01/24 | United States | 2,000,000 | 1,935,416 | ||||||||||
i | Inovalon Holdings Inc., Refinancing Date Term Loans, FRN, 3.875%, (1-month USD LIBOR + 3.00%), 4/02/25 | United States | 295,066 | 286,952 | ||||||||||
IQVIA Inc., | ||||||||||||||
Term B-1 Dollar Loans, 2.50%, (1-month USD LIBOR + 1.75%), 3/07/24 | United States | 8,470,833 | 8,187,060 | |||||||||||
Term B-3 Dollar Loans, 3.20%, (3-month USD LIBOR + 1.75%), 6/11/25 | United States | 8,646,000 | 8,352,036 | |||||||||||
|
| |||||||||||||
| 18,761,464 | ||||||||||||||
|
| |||||||||||||
| Household Products 0.1% | ||||||||||||||
Reynolds Consumer Products LLC, Initial Term Loans, 2.154%, (1-month USD LIBOR + 1.75%), 2/04/27 | United States | 1,629,333 | 1,573,470 | |||||||||||
|
| |||||||||||||
| Industrial Machinery 3.5% | ||||||||||||||
Altra Industrial Motion Corp., Term Loan, 2.404%, (1-month USD LIBOR + 2.00%), 10/01/25 | United States | 9,753,089 | 9,277,625 | |||||||||||
Navistar Inc., Tranche B Term Loan, 4.22%, (1-month USD LIBOR + 3.50%), 11/06/24 | United States | 32,283,929 | 29,485,978 | |||||||||||
Onsite Rental Group Operations Pty. Ltd., Term Loan, 5.50%, (1-month USD LIBOR + 4.50%), 10/25/22 | Australia | 15,430,072 | 12,729,810 | |||||||||||
|
| |||||||||||||
| 51,493,413 | ||||||||||||||
|
| |||||||||||||
| Insurance Brokers 0.5% | ||||||||||||||
i | Alliant Holdings Intermediate LLC/Alliant Holdings Co-Issue, Initial Term Loan, 3.154%, (1-month USD LIBOR + 2.75%), 5/10/25 | United States | 8,342,589 | 7,839,431 | ||||||||||
|
| |||||||||||||
| Integrated Telecommunication Services 1.6% | ||||||||||||||
Aventiv Technologies LLC, | ||||||||||||||
Initial Term Loan, 5.50%, (2-month USD LIBOR + 4.50%), 11/01/24 | United States | 22,727 | 19,091 | |||||||||||
Initial Term Loan, 5.50%, (3-month USD LIBOR + 4.50%), 11/01/24 | United States | 8,863,636 | 7,445,454 | |||||||||||
Global Tel*Link Corp., | ||||||||||||||
First Lien Term Loan, 5.70%, (3-month USD LIBOR + 4.25%), 11/29/25 | United States | 11,511,930 | 10,092,923 | |||||||||||
Second Lien Term Loan, 9.70%, (3-month USD LIBOR + 8.25%), 11/29/26 | United States | 7,895,150 | 6,381,910 | |||||||||||
|
| |||||||||||||
| 23,939,378 | ||||||||||||||
|
| |||||||||||||
| Internet Services & Infrastructure 2.4% | ||||||||||||||
Informatica LLC, Dollar 2020 Term Loan, 3.654%, (1-month USD LIBOR + 3.25%), 2/25/27 | United States | 5,370,000 | 5,067,937 | |||||||||||
LegalZoom.com Inc., 2018 Term Loans, 4.904%, (1-month USD LIBOR + 4.50%), 11/21/24 | United States | 8,334,940 | 7,772,331 | |||||||||||
TIBCO Software Inc., Term B-3 Loans, 4.16%, (1-month USD LIBOR + 3.75%), 7/31/26 | United States | 19,745,148 | 18,622,143 | |||||||||||
i | Verscend Holding Corp., Term B Loans, 4.904%, (1-month USD LIBOR + 4.50%), 7/27/25 | United States | 4,391,139 | 4,162,664 | ||||||||||
|
| |||||||||||||
| 35,625,075 | ||||||||||||||
|
| |||||||||||||
franklintempleton.com | Semiannual Report | 45 | ||||
FRANKLIN INVESTORS SECURITIES TRUST
STATEMENT OF INVESTMENTS (UNAUDITED)
Franklin Floating Rate Daily Access Fund (continued)
| Country | Principal Amount* | Value | ||||||||||||
g,h | Senior Floating Rate Interests (continued) | |||||||||||||
| Leisure Facilities 1.2% | ||||||||||||||
24 Hour Fitness Worldwide Inc., Term Loan, 4.95%, (3-month USD LIBOR + 3.50%), 5/30/25 | United States | $ | 25,531,904 | $ | 6,969,418 | |||||||||
Equinox Holdings Inc., Term B-1 Loans, 4.072%, (1-month USD LIBOR + 3.00%), 3/08/24 | United States | 5,183,208 | 4,141,705 | |||||||||||
NASCAR Holdings Inc., Initial Term Loans, 3.375%, (1-month USD LIBOR + 2.75%), 10/18/26 | United States | 7,588,595 | 7,129,895 | |||||||||||
|
| |||||||||||||
| 18,241,018 | ||||||||||||||
|
| |||||||||||||
| Leisure Products 0.6% | ||||||||||||||
Playtika Holding Corp., Term B Loans, 7.072%, (3-month USD LIBOR + 6.00%), 12/10/24 | United States | 9,239,050 | 9,181,306 | |||||||||||
|
| |||||||||||||
| Life & Health Insurance 0.3% | ||||||||||||||
i | AssuredPartners Inc., 2020 February Refinancing Term Loans, 3.904%, (1-month USD LIBOR + 3.50%), 2/13/27 | United States | 5,290,500 | 4,981,006 | ||||||||||
|
| |||||||||||||
| Life Sciences Tools & Services 0.3% | ||||||||||||||
Syneos Health Inc. (INC Research LLC), Initial Term B Loans, 2.154%, (1-month USD LIBOR + 1.75%), 8/01/24 | United States | 5,153,637 | 5,024,796 | |||||||||||
|
| |||||||||||||
| Managed Health Care 0.3% | ||||||||||||||
Phoenix Guarantor Inc., Tranche B-1 Term Loan, 4.079%, (1-month USD LIBOR + 3.25%), 3/05/26 | United States | 4,939,027 | 4,642,686 | |||||||||||
|
| |||||||||||||
| Metal & Glass Containers 0.2% | ||||||||||||||
i,j | Mauser Packaging Solutions Holding Co., Initial Term Loan, TBD, 4/03/24 | United States | 3,900,000 | 3,383,250 | ||||||||||
|
| |||||||||||||
| Movies & Entertainment 1.4% | ||||||||||||||
i,j | Banijay Group US Holding Inc., Facility B (USD) Loan, TBD, 2/03/25 | France | 4,259,000 | 3,950,222 | ||||||||||
Lions Gate Capital Holdings LLC, Term A Loan, 2.154%, (1-month USD LIBOR + 1.75%), 3/22/23 | Canada | 17,571,904 | 16,561,520 | |||||||||||
|
| |||||||||||||
|
20,511,742 |
| ||||||||||||
|
| |||||||||||||
| Office Services & Supplies 0.7% | ||||||||||||||
Intrado Corp., Term B Loans, 5.45%, (3-month USD LIBOR + 4.00%), 10/10/24 | United States | 4,819,123 | 3,799,580 | |||||||||||
Pitney Bowes Inc., Incremental Tranche Term B Loans, 5.91%, (1-month USD LIBOR + 5.50%), 1/07/25 | United States | 7,001,118 | 6,067,638 | |||||||||||
|
| |||||||||||||
| 9,867,218 | ||||||||||||||
|
| |||||||||||||
| Oil & Gas Exploration & Production 1.8% | ||||||||||||||
k | Fieldwood Energy LLC, Closing Date Loans, 6.25%, (3-month USD LIBOR + 5.25%), 4/11/22 | United States | 74,275,433 | 18,940,235 | ||||||||||
Utex Industries Inc., | ||||||||||||||
Initial Term Loan (First Lien), 5.311%, (3-month USD LIBOR + 4.00%), 5/21/21 | United States | 30,608,607 | 8,468,392 | |||||||||||
Second Lien Initial Term Loan, 8.561%, (3-month USD LIBOR + 7.25%), 5/20/22 | United States | 253,504 | 35,068 | |||||||||||
|
| |||||||||||||
| 27,443,695 | ||||||||||||||
|
| |||||||||||||
| Oil & Gas Storage & Transportation 0.4% | ||||||||||||||
Centurion Pipeline Co. LLC, Initial Term Loans, 3.654%, (1-month USD LIBOR + 3.25%), 9/28/25 | United States | 6,420,877 | 5,666,424 | |||||||||||
|
| |||||||||||||
| 46 |
Semiannual Report | franklintempleton.com | ||
FRANKLIN INVESTORS SECURITIES TRUST
STATEMENT OF INVESTMENTS (UNAUDITED)
Franklin Floating Rate Daily Access Fund (continued)
| Country | | Principal Amount | * | Value | ||||||||||
g,h | Senior Floating Rate Interests (continued) | |||||||||||||
| Other Diversified Financial Services 1.2% | ||||||||||||||
Asurion LLC, | ||||||||||||||
AM No. 14 Replacement B-4 Term Loans, 4.00%, (1-month USD LIBOR + 3.00%), 8/04/22 | United States | $ | 6,528,119 | $ | 6,314,324 | |||||||||
Replacement B-6 Term Loans, 3.404%, (1-month USD LIBOR + 3.00%), 11/03/23 | United States | 9,185,169 | 8,813,932 | |||||||||||
Second Lien Replacement B-2 Term Loans, 6.904%, (1-month USD LIBOR + 6.50%), 8/04/25 | United States | 169,003 | 163,017 | |||||||||||
Maverick Purchaser Sub LLC, Initial Term Loans, 4.404%, (1-month USD LIBOR + 4.00%), 1/31/27 | United States | 2,700,000 | 2,603,812 | |||||||||||
|
| |||||||||||||
| 17,895,085 | ||||||||||||||
|
| |||||||||||||
| Packaged Foods & Meats 4.4% | ||||||||||||||
B&G Foods Inc., Tranche B-4 Term Loan, 2.904%, (1-month USD LIBOR + 2.50%), 10/10/26 | United States | 1,989,697 | 1,940,369 | |||||||||||
CSM Bakery Supplies LLC, | ||||||||||||||
Second Lien Term Loan, 9.10%, (3-month USD LIBOR + 7.75%), 7/03/21 | United States | 15,995,244 | 12,263,026 | |||||||||||
Term Loans, 5.35%, (3-month USD LIBOR + 4.00%), 7/03/20 | United States | 21,563,389 | 18,760,148 | |||||||||||
JBS USA Lux SA, New Term Loans, 3.072%, (3-month USD LIBOR + 2.00%), 5/01/26 | United States | 33,479,555 | 32,490,870 | |||||||||||
|
| |||||||||||||
| 65,454,413 | ||||||||||||||
|
| |||||||||||||
| Paper Packaging 2.7% | ||||||||||||||
Berry Global Inc., | ||||||||||||||
Term W Loans, 2.829%, (1-month USD LIBOR + 2.00%), 10/01/22 | United States | 13,400,204 | 13,118,236 | |||||||||||
Term Y Loans, 2.829%, (1-month USD LIBOR + 2.00%), 7/01/26 | United States | 21,649,328 | 21,377,775 | |||||||||||
Reynolds Group Holdings Inc., U.S. Term Loans, 3.154%, (1-month USD LIBOR + 2.75%), 2/05/23 | United States | 6,090,888 | 5,831,484 | |||||||||||
|
| |||||||||||||
| 40,327,495 | ||||||||||||||
|
| |||||||||||||
| Personal Products 4.5% | ||||||||||||||
c | FGI Operating Co. LLC (Freedom Group), | |||||||||||||
f Term Loan, PIK, 12.00%, (3-month USD LIBOR + 10.00%), 5/15/22 | United States | 49,349,194 | 43,109,853 | |||||||||||
Term Loan FILO, 9.50%, (3-month USD LIBOR + 7.50%), 5/15/21 | United States | 13,405,115 | 13,345,062 | |||||||||||
Knowlton Development Corp., Initial Term Loan, 4.154%, (1-month USD LIBOR + 3.75%), 12/21/25 | United States | 2,995,727 | 2,703,644 | |||||||||||
Sunshine Luxembourg VII SARL (Nestle Skin Health), Facility B1 Commitments, 5.322%, (6-month USD LIBOR + 4.25%), 9/25/26 | Luxembourg | 7,820,400 | 7,198,029 | |||||||||||
|
| |||||||||||||
| 66,356,588 | ||||||||||||||
|
| |||||||||||||
| Pharmaceuticals 4.0% | ||||||||||||||
e | Research Technology Inc., Initial Term Loan, 5.50%, (1-month USD LIBOR + 4.50%), 2/04/27 | United States | 4,709,586 | 4,467,485 | ||||||||||
Grifols Worldwide Operations USA Inc., Dollar Tranche B Term Loan, 2.137%, (1-week USD LIBOR + 2.00%), 11/15/27 | United States | 14,452,951 | 14,280,037 | |||||||||||
Horizon Pharma Inc., Seventh Amendment Refinancing Term Loans, 3.25%, (1-month USD LIBOR + 2.25%), 5/22/26 | United States | 18,951,094 | 18,587,859 | |||||||||||
Valeant Pharmaceuticals International, Initial Term Loans, 3.718%, (1-month USD LIBOR + 3.00%), 6/02/25 | United States | 22,514,785 | 21,829,952 | |||||||||||
|
| |||||||||||||
| 59,165,333 | ||||||||||||||
|
| |||||||||||||
franklintempleton.com | Semiannual Report | 47 | ||||
FRANKLIN INVESTORS SECURITIES TRUST
STATEMENT OF INVESTMENTS (UNAUDITED)
Franklin Floating Rate Daily Access Fund (continued)
| Country | | Principal Amount | * | Value | ||||||||||||||
g,h | Senior Floating Rate Interests (continued) | |||||||||||||||||
Railroads 0.1% | ||||||||||||||||||
Genesee & Wyoming Inc., Initial Term Loan, 3.45%, (3-month USD LIBOR + 2.00%), 12/30/26 | United States | $ | 1,871,747 | $ | 1,830,217 | |||||||||||||
|
| |||||||||||||||||
Real Estate Services 0.1% | ||||||||||||||||||
Cushman & Wakefield U.S. Borrower LLC, Replacement Term Loan, 3.154%, (1-month USD LIBOR + 2.75%), 8/21/25 | United States | 2,000,000 | 1,862,142 | |||||||||||||||
|
| |||||||||||||||||
Research & Consulting Services 0.2% | ||||||||||||||||||
Nielsen Finance LLC (VNU Inc.), Class B-4 Term Loans, 2.864%, (1-month USD LIBOR + 2.00%), 10/04/23 | United States | 3,258,015 | 3,158,239 | |||||||||||||||
|
| |||||||||||||||||
Restaurants 0.2% | ||||||||||||||||||
1011778 B.C. ULC, Term B-4 Loan, 2.154%, (1-month USD LIBOR + 1.75%), 11/19/26 | Canada | 3,000,000 | 2,836,251 | |||||||||||||||
j,k | NPC International Inc., Second Lien Initial Term Loan, TBD, 4/20/25 | United States | 8,228,426 | 215,996 | ||||||||||||||
|
| |||||||||||||||||
| 3,052,247 | ||||||||||||||||||
|
| |||||||||||||||||
Specialized Finance 0.1% | ||||||||||||||||||
i | First Eagle Holdings Inc., Initial Term Loan, 3.95%, (3-month USD LIBOR + 2.50%), 2/01/27 | United States | 1,333,333 | 1,243,333 | ||||||||||||||
|
| |||||||||||||||||
Specialty Chemicals 0.5% | ||||||||||||||||||
Axalta Coating Systems U.S. Holdings Inc. (DuPont Performance Coatings), Term B-3 Dollar Loan, 3.20%, (3-month USD LIBOR + 1.75%), 6/01/24 | United States | 8,062,106 | 7,872,646 | |||||||||||||||
Oxbow Carbon LLC, Tranche B Term Loan, 4.154%, (1-month USD LIBOR + 3.75%), 1/04/23 | United States | 48,337 | 43,745 | |||||||||||||||
|
| |||||||||||||||||
| 7,916,391 | ||||||||||||||||||
|
| |||||||||||||||||
Specialty Stores 4.0% | ||||||||||||||||||
General Nutrition Centers Inc., FILO Term Loan (ABL), 7.41%, (1-month USD LIBOR + 7.00%), 12/31/22 | United States | 7,778,686 | 6,973,040 | |||||||||||||||
i | General Nutrition Centers, Inc., | |||||||||||||||||
Tranche B-2 Term Loans, 9.50%, (1-month USD LIBOR + 8.75%), 3/04/21 | United States | 20,222,144 | 14,269,251 | |||||||||||||||
Tranche B-2 Term Loans, 10.37%, (3-month USD LIBOR + 8.75%), 3/04/21 | United States | 27,251,801 | 19,229,552 | |||||||||||||||
Harbor Freight Tools USA Inc., Refinancing Loans, 3.25%, (1-month USD LIBOR + 2.50%), 8/19/23 | United States | 2,420,352 | 2,305,385 | |||||||||||||||
Jo-Ann Stores Inc., Initial Loans, 6.00%, (3-month USD LIBOR + 5.00%), 10/23/23 | United States | 6,594,024 | 2,103,494 | |||||||||||||||
Michaels Stores, Inc., | ||||||||||||||||||
2018 New Replacement Term B Loan, 3.50%, (1-month USD LIBOR + 2.50%), 1/28/23 | United States | 4,238,524 | 3,496,782 | |||||||||||||||
2018 New Replacement Term B Loan, 3.558% - 3.568%, (3-month USD LIBOR + 2.50%), 1/28/23 | United States | 4,985,882 | 4,113,353 | |||||||||||||||
PetSmart Inc., Amended Loan, 5.00%, (6-month USD LIBOR + 4.00%), 3/11/22 | United States | 4,249,319 | 4,134,587 | |||||||||||||||
Staples Inc., 2019 Refinancing Term B-1 Loans, 6.016%, (1-month USD LIBOR + 5.00%), 4/12/26 | United States | 3,994,325 | 3,210,438 | |||||||||||||||
|
| |||||||||||||||||
| 59,835,882 | ||||||||||||||||||
|
| |||||||||||||||||
Systems Software 4.2% | ||||||||||||||||||
Athenahealth Inc (VVC Holding Corp.), Term B Loans, 5.284%, (3-month USD LIBOR + 4.50%), 2/11/26 | United States | 4,244,332 | 3,963,145 | |||||||||||||||
DCert Buyer Inc., Initial Term Loans, 4.404%, (1-month USD LIBOR + 4.00%), 10/16/26 | United States | 7,862,169 | 7,462,511 | |||||||||||||||
i | Finastra USA Inc., Dollar Term Loan, 4.50%, (3-month USD LIBOR + 3.50%), 6/13/24 | United States | 9,828,939 | 8,592,134 | ||||||||||||||
| 48 |
Semiannual Report | franklintempleton.com | ||
FRANKLIN INVESTORS SECURITIES TRUST
STATEMENT OF INVESTMENTS (UNAUDITED)
Franklin Floating Rate Daily Access Fund (continued)
| Country | | Principal Amount | * | Value | ||||||||||||||
g,h | Senior Floating Rate Interests (continued) | |||||||||||||||||
Systems Software (continued) | ||||||||||||||||||
Go Daddy Operating Co. LLC, Tranche B-2 Term Loan, 2.154%, (1-month USD LIBOR + 1.75%), 2/15/24 | United States | $ | 8,869,335 | $ | 8,629,127 | |||||||||||||
Hyland Software Inc., Term Loans, 4.00%, (1-month USD LIBOR + 3.25%), 7/01/24 | United States | 5,013,538 | 4,831,170 | |||||||||||||||
i | Idera Inc., Initial Term Loans, 5.08%, (3-month USD LIBOR + 4.00%), 6/29/24 | United States | 4,122,727 | 3,731,068 | ||||||||||||||
Infor (U.S.) Inc. (Lawson), Tranche B-6 Term Loan, 3.75%, (1-month USD LIBOR + 2.75%), 2/01/22 | United States | 4,877,429 | 4,808,331 | |||||||||||||||
Perforce Software Inc., New Term Loan, 4.154%, (1-month USD LIBOR + 3.75%), 7/08/26 | United States | 5,685,251 | 5,287,284 | |||||||||||||||
Quest Software US Holdings Inc., Term Loan B, 5.01%, (3-month USD LIBOR + 4.25%), 5/18/25 | United States | 1,920,252 | 1,771,433 | |||||||||||||||
Surf Holdings LLC (Sophos), Dollar Tranche Term Loan, 4.814%, (3-month USD LIBOR + 3.50%), 3/05/27 | United States | 5,788,380 | 5,339,780 | |||||||||||||||
Vertafore Inc., Initial Term Loans, 3.654%, (1-month USD LIBOR + 3.25%), 7/02/25 | United States | 2,992,424 | 2,765,655 | |||||||||||||||
i | Waystar (Navicure Inc), Initial Term Loans, 4.404%, (1-month USD LIBOR + 4.00%), 10/22/26 | United States | 5,500,000 | 5,170,000 | ||||||||||||||
|
| |||||||||||||||||
| 62,351,638 | ||||||||||||||||||
|
| |||||||||||||||||
Trucking 1.4% | ||||||||||||||||||
Avis Budget Car Rental LLC, Tranche B Term Loans, 2.66%, (1-month USD LIBOR + 2.25%), 8/06/27 | United States | 18,972,535 | 13,242,829 | |||||||||||||||
Hertz Corp., Tranche B-1 Term Loan, 3.51%, (3-month USD LIBOR + 2.75%), 6/30/23 | United States | 6,379,526 | 4,019,102 | |||||||||||||||
i | The Kenan Advantage Group Inc., Initial Canadian Term Loan, 4.00%, (1-month USD LIBOR + 3.00%), 7/29/22 | United States | 701,310 | 588,516 | �� | |||||||||||||
i | Kenan Advantage Group Inc., Initial U.S. Term Loans, 4.00%, (1-month USD LIBOR + 3.00%), 7/31/22 | United States | 2,949,142 | 2,474,822 | ||||||||||||||
|
| |||||||||||||||||
| 20,325,269 | ||||||||||||||||||
|
| |||||||||||||||||
Wireless Telecommunication Services 0.2% | ||||||||||||||||||
i,j | T-Mobile USA Inc., Term Loan B, TBD, 4/01/27 | United States | 3,531,733 | 3,513,742 | ||||||||||||||
|
| |||||||||||||||||
Total Senior Floating Rate Interests | 1,212,836,053 | |||||||||||||||||
|
| |||||||||||||||||
Asset-Backed Securities 5.4% | ||||||||||||||||||
Other Diversified Financial Services 5.4% | ||||||||||||||||||
l,m | Alinea CLO Ltd., 2018-1A, C, 144A, FRN, 3.035%, (3-month USD LIBOR + 1.90%), 7/20/31 | United States | 7,000,000 | 6,352,288 | ||||||||||||||
l,n | Atrium XIV LLC, 14A, B, 144A, FRN, 2.876%, 8/23/30 | United States | 6,300,000 | 5,922,027 | ||||||||||||||
l,n | BlueMountain CLO XXII Ltd., 2018-1A, B, 144A, FRN, 2.46%, 7/30/30 | United States | 10,330,510 | 9,579,265 | ||||||||||||||
l,n | Dryden 40 Senior Loan Fund, 2015-40A, CR, 144A, FRN, 3.792%, 8/15/31 | United States | 2,000,000 | 1,809,799 | ||||||||||||||
l,n | Dryden 70 CLO Ltd., 2018-70A, B, 144A, FRN, 2.876%, 1/16/32 | United States | 5,880,435 | 5,552,688 | ||||||||||||||
l | Emerson Park CLO Ltd., 2013-1A, C2R, 144A, 4.055%, 7/15/25 | United States | 2,519,731 | 2,519,030 | ||||||||||||||
l,n | Galaxy XXV CLO Ltd., | |||||||||||||||||
2018-25A, B, 144A, FRN, 2.641%, 10/25/31 | United States | 4,000,000 | 3,753,337 | |||||||||||||||
2018-25A, C, 144A, FRN, 2.991%, 10/25/31 | United States | 500,000 | 448,826 | |||||||||||||||
franklintempleton.com | Semiannual Report | 49 | ||||
FRANKLIN INVESTORS SECURITIES TRUST
STATEMENT OF INVESTMENTS (UNAUDITED)
Franklin Floating Rate Daily Access Fund (continued)
| Country | Principal Amount* | Value | ||||||||||||||||
Asset-Backed Securities (continued) | ||||||||||||||||||
| Other Diversified Financial Services (continued) | ||||||||||||||||||
l,n | LCM XVI LP, 2016A, BR2, 144A, FRN, 2.969%, 10/15/31 | United States | $ | 6,399,083 | $ | 5,934,287 | ||||||||||||
l,m | LCM XXIV Ltd., 24A, A, 144A, FRN, 2.445%, (3-month USD LIBOR + 1.31%), 3/20/30 | United States | 17,000,000 | 16,557,921 | ||||||||||||||
l,m | Madison Park Funding XI Ltd., 2013-11, CR, 144A, FRN, 3.243%, (3-month USD LIBOR + 2.20%), 7/23/29 | United States | 2,040,000 | 1,882,955 | ||||||||||||||
l,n | Octagon Investment Partners 38, 2018-1A, A3A, 144A, FRN, 2.805%, 7/20/30 | United States | 3,484,000 | 3,285,053 | ||||||||||||||
l,n | Voya CLO Ltd., | |||||||||||||||||
2018-4A, B, 144A, FRN, 3.069%, 1/15/32 | United States | 14,285,714 | 13,635,813 | |||||||||||||||
2018-4A, C1, 144A, FRN, 3.769%, 1/15/32 | United States | 3,000,000 | 2,781,652 | |||||||||||||||
|
| |||||||||||||||||
Total Asset-Backed Securities (Cost $84,744,246) | 80,014,941 | |||||||||||||||||
|
| |||||||||||||||||
| | Shares/ Units | | ||||||||||||||||
|
| |||||||||||||||||
Escrows and Litigation Trusts 0.0% | ||||||||||||||||||
a,c | Millennium Corporate Claim Trust, Escrow Account | United States | 13,585,836 | — | ||||||||||||||
a,c | Millennium Lender Claim Trust, Escrow Account | United States | 13,585,837 | — | ||||||||||||||
a,b,c,d | Remington Outdoor Co. Inc., Litigation Units | United States | 170,300 | — | ||||||||||||||
|
| |||||||||||||||||
Total Escrows and Litigation Trusts | — | |||||||||||||||||
|
| |||||||||||||||||
Total Investments before Short Term Investments | 1,387,426,261 | |||||||||||||||||
|
| |||||||||||||||||
| Shares | ||||||||||||||||||
|
| |||||||||||||||||
Short Term Investments 7.2% | ||||||||||||||||||
| Money Market Funds (Cost $89,457,226) 6.0% | ||||||||||||||||||
e,o | Institutional Fiduciary Trust Money Market Portfolio, 0.01% | United States | 89,457,226 | 89,457,226 | ||||||||||||||
|
| |||||||||||||||||
| | Principal Amount | * | ||||||||||||||||
|
| |||||||||||||||||
| Repurchase Agreements (Cost $18,286,788) 1.2% | ||||||||||||||||||
p | Joint Repurchase Agreement, 0.028%, 5/01/2020 (Maturity Value $18,286,802) | |||||||||||||||||
BNP Paribas Securities Corp. (Maturity Value $14,002,753) | ||||||||||||||||||
Deutsche Bank Securities Inc. (Maturity Value $2,603,675) | ||||||||||||||||||
HSBC Securities (USA) Inc. (Maturity Value $1,680,374) | ||||||||||||||||||
Collateralized by U.S. Government Agency Securities, 4.00% - 4.50%, 11/20/48 -4/20/50; qU.S. Treasury Bills, 8/13/20; and U.S. Treasury Notes, 0.17% - 2.00%, 10/31/20 - 7/31/24 (valued at $18,656,077) | United States | $ | 18,286,788 | 18,286,788 | ||||||||||||||
|
| |||||||||||||||||
Total Investments (Cost $1,817,712,422) 100.5% | 1,495,170,275 | |||||||||||||||||
Other Assets, less Liabilities (0.5)% | (7,673,308 | ) | ||||||||||||||||
|
| |||||||||||||||||
Net Assets 100.0% | $ | 1,487,496,967 | ||||||||||||||||
|
| |||||||||||||||||
50 | Semiannual Report | franklintempleton.com | ||
FRANKLIN INVESTORS SECURITIES TRUST
STATEMENT OF INVESTMENTS (UNAUDITED)
Franklin Floating Rate Daily Access Fund (continued)
See Abbreviations on page 171.
†Rounds to less than 0.1% of net assets.
*The principal amount is stated in U.S. dollars unless otherwise indicated.
aNon-income producing.
bSee Note 11 regarding holdings of 5% voting securities.
cFair valued using significant unobservable inputs. See Note 14 regarding fair value measurements.
dSee Note 9 regarding restricted securities.
eSee Note 3(f) regarding investments in affiliated management investment companies.
fIncome may be received in additional securities and/or cash.
gThe coupon rate shown represents the rate at period end.
hSee Note 1(j) regarding senior floating rate interests.
iA portion or all of the security purchased on a delayed delivery basis. See Note 1(d).
jA portion or all of the security represents an unsettled loan commitment. The coupon rate is to-be determined (TBD) at the time of settlement and will be based upon a reference index/floor plus a spread.
kSee Note 7 regarding defaulted securities.
lSecurity was purchased pursuant to Rule 144A under the Securities Act of 1933 and may be sold in transactions exempt from registration only to qualified institutional buyers or in a public offering registered under the Securities Act of 1933. At April 30, 2020, the aggregate value of these securities was $80,014,941, representing 5.4% of net assets.
mThe coupon rate shown represents the rate inclusive of any caps or floors, if applicable, in effect at period end.
nAdjustable rate security with an interest rate that is not based on a published reference index and spread. The rate is based on the structure of the agreement and current market conditions. The coupon rate shown represents the rate at period end.
oThe rate shown is the annualized seven-day effective yield at period end.
pSee Note 1(c) regarding joint repurchase agreement.
qThe security was issued on a discount basis with no stated coupon rate.
franklintempleton.com | The accompanying notes are an integral part of these financial statements. | Semiannual Report | 51 | ||||
FRANKLIN INVESTORS SECURITIES TRUST
Financial Highlights
Franklin Low Duration Total Return Fund
Six Months Ended April 30, 2020 (unaudited) | Year Ended October 31, | |||||||||||||||||||||||
| 2019 | 2018 | 2017 | 2016 | 2015 | ||||||||||||||||||||
Class A | ||||||||||||||||||||||||
Per share operating performance (for a share outstanding throughout the period) | ||||||||||||||||||||||||
Net asset value, beginning of period | $ 9.65 | $ 9.60 | $ 9.84 | $ 9.89 | $ 9.91 | $ 10.11 | ||||||||||||||||||
| Income from investment operationsa: | ||||||||||||||||||||||||
Net investment income | 0.125 | b | 0.290 | 0.237 | 0.170 | 0.151 | 0.134 | |||||||||||||||||
Net realized and unrealized gains (losses) | (0.543 | ) | 0.068 | (0.185 | ) | (0.023 | ) | 0.031 | (0.135 | ) | ||||||||||||||
Total from investment operations | (0.418 | ) | 0.358 | 0.052 | 0.147 | 0.182 | (0.001 | ) | ||||||||||||||||
Less distributions from: | ||||||||||||||||||||||||
Net investment income and net foreign currency gains | (0.172 | ) | (0.308 | ) | (0.292 | ) | (0.197 | ) | (0.202 | ) | (0.199 | ) | ||||||||||||
Net asset value, end of period | $ 9.06 | $ 9.65 | $ 9.60 | $ 9.84 | $ 9.89 | $ 9.91 | ||||||||||||||||||
Total returnc | (4.39)% | 3.78% | 0.54% | 1.50% | 1.88% | (0.02)% | ||||||||||||||||||
| Ratios to average net assetsd | ||||||||||||||||||||||||
Expenses before waiver and payments by affiliates | 0.93% | 0.94% | 0.96% | 0.96% | 0.95% | 0.96% | ||||||||||||||||||
Expenses net of waiver and payments by affiliatese | 0.67% | 0.68% | 0.72% | 0.80% | 0.80% | 0.80% | ||||||||||||||||||
Net investment income | 2.67% | 2.99% | 2.43% | 1.73% | 1.57% | 1.27% | ||||||||||||||||||
| Supplemental data | ||||||||||||||||||||||||
Net assets, end of period (000’s) | $1,626,929 | $1,631,123 | $1,499,579 | $1,519,902 | $1,524,437 | $1,656,001 | ||||||||||||||||||
Portfolio turnover rate | 51.09% | 51.93% | f | 56.12% | 50.40% | 44.76% | 41.28% | |||||||||||||||||
Portfolio turnover rate excluding mortgage dollar rolls | 39.16% | g | 51.93% | f | 44.01% | g | 45.29% | g | 44.76% | g | 41.28% | g | ||||||||||||
aThe amount shown for a share outstanding throughout the period may not correlate with the Statement of Operations for the period due to the timing of sales and repurchases of the Fund’s shares in relation to income earned and/or fluctuating fair value of the investments of the Fund.
bBased on average daily shares outstanding.
cTotal return does not reflect sales commissions or contingent deferred sales charges, if applicable, and is not annualized for periods less than one year.
dRatios are annualized for periods less than one year, except for non-recurring expenses, if any.
eBenefit of expense reduction rounds to less than 0.01%.
fExcludes the value of portfolio activity as a result of in-kind transactions.
gSee Note 1(i) regarding mortgage dollar rolls.
52 | Semiannual Report | The accompanying notes are an integral part of these financial statements. | franklintempleton.com | ||
FRANKLIN INVESTORS SECURITIES TRUST
FINANCIAL HIGHLIGHTS
Franklin Low Duration Total Return Fund (continued)
Six Months Ended (unaudited) | Year Ended October 31, | |||||||||||||||||||||||
| 2019 | 2018 | 2017 | 2016 | 2015 | ||||||||||||||||||||
Class C | ||||||||||||||||||||||||
Per share operating performance (for a share outstanding throughout the period) | ||||||||||||||||||||||||
Net asset value, beginning of period | $ 9.61 | $ 9.56 | $ 9.80 | $ 9.86 | $ 9.90 | $ 10.11 | ||||||||||||||||||
| Income from investment operationsa: | ||||||||||||||||||||||||
Net investment income | 0.106 | b | 0.251 | 0.168 | 0.121 | 0.113 | 0.104 | |||||||||||||||||
Net realized and unrealized gains (losses) | (0.543 | ) | 0.068 | (0.155 | ) | (0.015 | ) | 0.024 | (0.145 | ) | ||||||||||||||
Total from investment operations | (0.437 | ) | 0.319 | 0.013 | 0.106 | 0.137 | (0.041 | ) | ||||||||||||||||
Less distributions from: | ||||||||||||||||||||||||
Net investment income and net foreign currency gains | (0.153 | ) | (0.269 | ) | (0.253 | ) | (0.166 | ) | (0.177 | ) | (0.169) | |||||||||||||
Net asset value, end of period | $ 9.02 | $ 9.61 | $ 9.56 | $ 9.80 | $ 9.86 | $ 9.90 | ||||||||||||||||||
Total returnc | (4.60)% | 3.38% | 0.14% | 1.08% | 1.41% | (0.41)% | ||||||||||||||||||
| Ratios to average net assetsd | ||||||||||||||||||||||||
Expenses before waiver and payments by affiliates | 1.33% | 1.34% | 1.36% | 1.36% | 1.35% | 1.36% | ||||||||||||||||||
Expenses net of waiver and payments by affiliatese | 1.07% | 1.08% | 1.12% | 1.20% | 1.20% | 1.20% | ||||||||||||||||||
Net investment income | 2.27% | 2.59% | 2.03% | 1.33% | 1.17% | 0.87% | ||||||||||||||||||
| Supplemental data | ||||||||||||||||||||||||
Net assets, end of period (000’s) | $131,452 | $135,372 | $130,206 | $174,754 | $218,066 | $211,354 | ||||||||||||||||||
Portfolio turnover rate | 51.09% | 51.93% | f | 56.12% | 50.40% | 44.76% | 41.28% | |||||||||||||||||
Portfolio turnover rate excluding mortgage dollar rolls | 39.16% | g | 51.93% | f | 44.01% | g | 45.29% | g | 44.76% | g | 41.28% | g | ||||||||||||
aThe amount shown for a share outstanding throughout the period may not correlate with the Statement of Operations for the period due to the timing of sales and repurchases of the Fund’s shares in relation to income earned and/or fluctuating fair value of the investments of the Fund.
bBased on average daily shares outstanding.
cTotal return does not reflect sales commissions or contingent deferred sales charges, if applicable, and is not annualized for periods less than one year.
dRatios are annualized for periods less than one year, except for non-recurring expenses, if any.
eBenefit of expense reduction rounds to less than 0.01%.
fExcludes the value of portfolio activity as a result of in-kind transactions.
gSee Note 1(i) regarding mortgage dollar rolls.
franklintempleton.com | The accompanying notes are an integral part of these financial statements. | Semiannual Report | 53 | ||||
FRANKLIN INVESTORS SECURITIES TRUST
FINANCIAL HIGHLIGHTS
Franklin Low Duration Total Return Fund (continued)
Six Months Ended April 30, 2020 (unaudited) | Year Ended October 31, 2019a | |||||||
Class R | ||||||||
Per share operating performance (for a share outstanding throughout the period) | ||||||||
Net asset value, beginning of period | $ 9.65 | $ 9.65 | ||||||
| Income from investment operationsb: | ||||||||
Net investment income | 0.112 | c | 0.012 | |||||
Net realized and unrealized gains (losses) | (0.530 | ) | 0.001 | |||||
Total from investment operations | (0.418 | ) | 0.013 | |||||
Less distributions from: | ||||||||
Net investment income | (0.162 | ) | (0.013 | ) | ||||
Net asset value, end of period | $ 9.07 | $ 9.65 | ||||||
Total returnd | (4.50)% | 0.14% | ||||||
| Ratios to average net assetse | ||||||||
Expenses before waiver and payments by affiliates | 1.18% | 1.19% | ||||||
Expenses net of waiver and payments by affiliatesf | 0.92% | 0.93% | ||||||
Net investment income | 2.42% | 2.73% | ||||||
| Supplemental data | ||||||||
Net assets, end of period (000’s) | $173 | $18 | ||||||
Portfolio turnover rate | 51.09% | 51.93% | g | |||||
Portfolio turnover rate excluding mortgage dollar rolls | 39.16% | h | 51.93% | g | ||||
aFor the period October 15, 2019 (effective date) to October 31, 2019.
bThe amount shown for a share outstanding throughout the period may not correlate with the Statement of Operations for the period due to the timing of sales and repurchases of the Fund’s shares in relation to income earned and/or fluctuating fair value of the investments of the Fund.
cBased on average daily shares outstanding.
dTotal return is not annualized for periods less than one year.
eRatios are annualized for periods less than one year, except for non-recurring expenses, if any.
fBenefit of expense reduction rounds to less than 0.01%.
gExcludes the value of portfolio activity as a result of in-kind transactions.
hSee Note 1(i) regarding mortgage dollar rolls.
| 54 |
Semiannual Report | The accompanying notes are an integral part of these financial statements. | franklintempleton.com | ||
FRANKLIN INVESTORS SECURITIES TRUST
FINANCIAL HIGHLIGHTS
Franklin Low Duration Total Return Fund (continued)
| Six Months Ended April 30, 2020 | Year Ended October 31, | |||||||||||||||||||||||
| (unaudited) | 2019 | 2018 | 2017 | 2016 | 2015 | |||||||||||||||||||
| Class R6 | ||||||||||||||||||||||||
Per share operating performance (for a share outstanding throughout the period) | ||||||||||||||||||||||||
Net asset value, beginning of period | $ 9.71 | $ 9.66 | $ 9.90 | $ 9.94 | $ 9.95 | $ 10.14 | ||||||||||||||||||
|
| |||||||||||||||||||||||
| Income from investment operationsa: | ||||||||||||||||||||||||
Net investment income | 0.144 | b | 0.326 | 0.271 | 0.214 | 0.195 | 0.165 | |||||||||||||||||
Net realized and unrealized gains (losses) | (0.544 | ) | 0.071 | (0.178 | ) | (0.025 | ) | 0.021 | (0.130 | ) | ||||||||||||||
|
| |||||||||||||||||||||||
Total from investment operations | (0.400 | ) | 0.397 | 0.093 | 0.189 | 0.216 | 0.035 | |||||||||||||||||
|
| |||||||||||||||||||||||
Less distributions from: | ||||||||||||||||||||||||
Net investment income and net foreign currency gains | (0.190 | ) | (0.347 | ) | (0.333 | ) | (0.229 | ) | (0.226 | ) | (0.228 | ) | ||||||||||||
|
| |||||||||||||||||||||||
Net asset value, end of period | $ 9.12 | $ 9.71 | $ 9.66 | $ 9.90 | $ 9.94 | $ 9.95 | ||||||||||||||||||
|
| |||||||||||||||||||||||
Total returnc | (4.18)% | 4.17% | 0.96% | 1.92% | 2.22% | 0.37% | ||||||||||||||||||
| Ratios to average net assetsd | ||||||||||||||||||||||||
Expenses before waiver and payments by affiliates | 0.56% | 0.56% | 0.55% | 0.53% | 0.53% | 0.54% | ||||||||||||||||||
Expenses net of waiver and payments by affiliatese | 0.30% | 0.30% | 0.31% | 0.39% | 0.42% | 0.42% | ||||||||||||||||||
Net investment income | 3.04% | 3.37% | 2.84% | 2.14% | 1.95% | 1.65% | ||||||||||||||||||
| Supplemental data | ||||||||||||||||||||||||
Net assets, end of period (000’s) | $1,131,790 | $1,003,208 | $1,017,856 | $591,622 | $553,233 | $508,675 | ||||||||||||||||||
Portfolio turnover rate | 51.09% | 51.93% | f | 56.12% | 50.40% | 44.76% | 41.28% | |||||||||||||||||
Portfolio turnover rate excluding mortgage dollar rolls | 39.16% | g | 51.93% | f | 44.01% | g | 45.29% | g | 44.76% | g | 41.28% | g | ||||||||||||
aThe amount shown for a share outstanding throughout the period may not correlate with the Statement of Operations for the period due to the timing of sales and repurchases of the Fund’s shares in relation to income earned and/or fluctuating fair value of the investments of the Fund.
bBased on average daily shares outstanding.
cTotal return is not annualized for periods less than one year.
dRatios are annualized for periods less than one year, except for non-recurring expenses, if any.
eBenefit of expense reduction rounds to less than 0.01%.
fExcludes the value of portfolio activity as a result of in-kind transactions.
gSee Note 1(i) regarding mortgage dollar rolls.
| franklintempleton.com |
The accompanying notes are an integral part of these financial statements. | Semiannual Report | 55 | ||||
FRANKLIN INVESTORS SECURITIES TRUST
FINANCIAL HIGHLIGHTS
Franklin Low Duration Total Return Fund (continued)
| Six Months Ended April 30, 2020 | Year Ended October 31, | |||||||||||||||||||||||
| (unaudited) | 2019 | 2018 | 2017 | 2016 | 2015 | |||||||||||||||||||
| Advisor Class | ||||||||||||||||||||||||
Per share operating performance (for a share outstanding throughout the period) | ||||||||||||||||||||||||
Net asset value, beginning of period | $ 9.70 | $ 9.65 | $ 9.89 | $ 9.94 | $ 9.95 | $ 10.14 | ||||||||||||||||||
|
| |||||||||||||||||||||||
| Income from investment operationsa: | ||||||||||||||||||||||||
Net investment income | 0.138 | b | 0.315 | 0.264 | 0.209 | 0.184 | 0.134 | |||||||||||||||||
Net realized and unrealized gains (losses) | (0.544 | ) | 0.069 | (0.187 | ) | (0.042 | ) | 0.025 | (0.106 | ) | ||||||||||||||
|
| |||||||||||||||||||||||
Total from investment operations | (0.406 | ) | 0.384 | 0.077 | 0.167 | 0.209 | 0.028 | |||||||||||||||||
|
| |||||||||||||||||||||||
Less distributions from: | ||||||||||||||||||||||||
Net investment income and net foreign currency gains | (0.184 | ) | (0.334 | ) | (0.317 | ) | (0.217 | ) | (0.219 | ) | (0.218 | ) | ||||||||||||
|
| |||||||||||||||||||||||
Net asset value, end of period | $ 9.11 | $ 9.70 | $ 9.65 | $ 9.89 | $ 9.94 | $ 9.95 | ||||||||||||||||||
|
| |||||||||||||||||||||||
Total returnc | (4.25)% | 4.04% | 0.80% | 1.70% | 2.14% | 0.27% | ||||||||||||||||||
| Ratios to average net assetsd | ||||||||||||||||||||||||
Expenses before waiver and payments by affiliates | 0.68% | 0.69% | 0.71% | 0.71% | 0.70% | 0.71% | ||||||||||||||||||
Expenses net of waiver and payments by affiliatese | 0.42% | 0.43% | 0.47% | 0.55% | 0.55% | 0.55% | ||||||||||||||||||
Net investment income | 2.92% | 3.24% | 2.68% | 1.98% | 1.82% | 1.52% | ||||||||||||||||||
| Supplemental data | ||||||||||||||||||||||||
Net assets, end of period (000’s) | $199,831 | $254,314 | $214,339 | $428,838 | $224,887 | $150,464 | ||||||||||||||||||
Portfolio turnover rate | 51.09% | 51.93% | f | 56.12% | 50.40% | 44.76% | 41.28% | |||||||||||||||||
Portfolio turnover rate excluding mortgage dollar rolls | 39.16% | g | 51.93% | f | 44.01% | g | 45.29% | g | 44.76% | g | 41.28% | g | ||||||||||||
aThe amount shown for a share outstanding throughout the period may not correlate with the Statement of Operations for the period due to the timing of sales and repurchases of the Fund’s shares in relation to income earned and/or fluctuating fair value of the investments of the Fund.
bBased on average daily shares outstanding.
cTotal return is not annualized for periods less than one year.
dRatios are annualized for periods less than one year, except for non-recurring expenses, if any.
eBenefit of expense reduction rounds to less than 0.01%.
fExcludes the value of portfolio activity as a result of in-kind transactions.
gSee Note 1(i) regarding mortgage dollar rolls.
| 56 |
Semiannual Report | The accompanying notes are an integral part of these financial statements. | franklintempleton.com | ||
FRANKLIN INVESTORS SECURITIES TRUST
Statement of Investments, April 30, 2020 (unaudited)
Franklin Low Duration Total Return Fund
| | Country/ Organization |
| | Shares/ Warrants | | Value | ||||||||||
Common Stocks and Other Equity Interests 0.0%† | ||||||||||||||||
Commercial & Professional Services 0.0%† | ||||||||||||||||
| a | Remington Outdoor Co. Inc. | United States | 170,787 | $ | 85,393 | |||||||||||
|
| |||||||||||||||
Energy 0.0%† | ||||||||||||||||
| a | Battalion Oil Corp. | United States | 227 | 1,112 | ||||||||||||
| a,b | Battalion Oil Corp., wts., A, 10/08/22 | United States | 1,093 | 3,238 | ||||||||||||
| a,b | Battalion Oil Corp., wts., B, 10/08/22 | United States | 1,366 | 4,000 | ||||||||||||
| a,b | Battalion Oil Corp., wts., C, 10/08/22 | United States | 1,757 | 5,070 | ||||||||||||
Riviera Resources Inc. | United States | 2,835 | 7,825 | |||||||||||||
|
| |||||||||||||||
| 21,245 | ||||||||||||||||
|
| |||||||||||||||
| Materials 0.0%† | ||||||||||||||||
| a,b,c | Appvion Operations Inc. | United States | 24,740 | 458,820 | ||||||||||||
| a | Verso Corp., A | United States | 1,387 | 19,266 | ||||||||||||
| a | Verso Corp., wts., 7/25/23 | United States | 146 | 219 | ||||||||||||
|
| |||||||||||||||
| 478,305 | ||||||||||||||||
|
| |||||||||||||||
Retailing 0.0% | ||||||||||||||||
| a,b,c | K2016470219 South Africa Ltd., A | South Africa | 12,326,925 | — | ||||||||||||
| a,b,c | K2016470219 South Africa Ltd., B | South Africa | 1,226,701 | — | ||||||||||||
|
| |||||||||||||||
| — | ||||||||||||||||
|
| |||||||||||||||
Total Common Stocks and Other Equity Interests | 584,943 | |||||||||||||||
|
| |||||||||||||||
Management Investment Companies 1.6% | ||||||||||||||||
Diversified Financials 1.6% | ||||||||||||||||
| d | Franklin Floating Rate Income Fund | United States | 2,389,308 | 16,940,191 | ||||||||||||
Invesco Senior Loan ETF | United States | 1,629,000 | 34,176,420 | |||||||||||||
|
| |||||||||||||||
Total Management Investment Companies | 51,116,611 | |||||||||||||||
|
| |||||||||||||||
| Principal Amount* | ||||||||||||||||
Corporate Bonds 29.9% | ||||||||||||||||
Automobiles & Components 0.0%† | ||||||||||||||||
Aptiv Corp., senior bond, 4.15%, 3/15/24 | United States | 900,000 | 916,245 | |||||||||||||
|
| |||||||||||||||
Banks 6.9% | ||||||||||||||||
| e | Akbank T.A.S., senior note, 144A, 5.125%, 3/31/25 | Turkey | 2,200,000 | 2,018,938 | ||||||||||||
| f | Banca Monte dei Paschi di Siena SpA, | |||||||||||||||
secured note, Reg S, 2.875%, 4/16/59 | Italy | 6,300,000 | EUR | 7,075,483 | ||||||||||||
secured note, Reg S, 2.875%, 7/16/62 | Italy | 1,500,000 | EUR | 1,794,127 | ||||||||||||
secured note, Reg S, 2.125%, 11/26/63 | Italy | 2,000,000 | EUR | 2,349,490 | ||||||||||||
| f | Banca Popolare di Milano Scarl, | |||||||||||||||
secured note, Reg S, 0.875%, 9/14/23 | Italy | 900,000 | EUR | 1,000,968 | ||||||||||||
secured note, Reg S, 0.625%, 6/08/24 | Italy | 2,800,000 | EUR | 3,081,152 | ||||||||||||
franklintempleton.com | Semiannual Report | 57 | ||||
FRANKLIN INVESTORS SECURITIES TRUST
STATEMENT OF INVESTMENTS (UNAUDITED)
Franklin Low Duration Total Return Fund (continued)
| | Country/ Organization | | | Principal Amount* | | Value | ||||||||||
Corporate Bonds (continued) | ||||||||||||||||
Banks (continued) | ||||||||||||||||
| f | Banco BPM SpA, secured note, Reg S, 0.75%, 3/31/23 | Italy | 1,700,000 | EUR | $ | 1,883,532 | ||||||||||
Bank of America Corp., | ||||||||||||||||
senior note, 2.369% to 7/20/20, FRN thereafter, 7/21/21 | United States | 6,800,000 | 6,806,200 | |||||||||||||
senior note, 3.55% to 3/05/23, FRN thereafter, 3/05/24 | United States | 10,350,000 | 10,897,890 | |||||||||||||
| f | Bank of China Ltd., senior note, Reg S, 2.875%, 4/20/22 | China | 1,000,000 | 1,024,626 | ||||||||||||
Bank of Montreal, senior note, 1.85%, 5/01/25 | Canada | 5,900,000 | 5,921,639 | |||||||||||||
Bank of Nova Scotia, secured note, 1.875%, 4/26/22 | Canada | 100,000 | 101,239 | |||||||||||||
Barclays PLC, senior note, 4.61% to 2/14/22, FRN thereafter, 2/15/23 | United Kingdom | 6,300,000 | 6,552,979 | |||||||||||||
| e | BPCE SA, senior note, 144A, 2.375%, 1/14/25 | France | 7,000,000 | 6,977,450 | ||||||||||||
| f | China Construction Bank Corp., senior note, Reg S, 2.75%, 12/04/20 | China | 1,000,000 | 1,008,465 | ||||||||||||
Citibank NA, senior note, 3.165% to 2/19/22, FRN thereafter, 2/19/22 | United States | 5,950,000 | 6,024,595 | |||||||||||||
Citigroup Inc., | ||||||||||||||||
senior note, 2.65%, 10/26/20 | United States | 6,050,000 | 6,092,726 | |||||||||||||
senior note, 2.35%, 8/02/21 | United States | 5,400,000 | 5,453,308 | |||||||||||||
senior note, 2.90%, 12/08/21 | United States | 6,000,000 | 6,113,832 | |||||||||||||
senior note, 2.75%, 4/25/22 | United States | 5,800,000 | 5,942,426 | |||||||||||||
Fifth Third Bancorp, | ||||||||||||||||
senior note, 1.625%, 5/05/23 | United States | 4,100,000 | 4,097,376 | |||||||||||||
senior note, 2.55%, 5/05/27 | United States | 3,500,000 | 3,493,105 | |||||||||||||
HSBC Holdings PLC, | ||||||||||||||||
senior note, 4.30%, 3/08/26 | United Kingdom | 800,000 | 886,911 | |||||||||||||
senior note, 3.262% to 3/13/22, FRN thereafter, 3/13/23 | United Kingdom | 1,400,000 | 1,436,604 | |||||||||||||
Industrial & Commercial Bank of China Ltd., | ||||||||||||||||
senior note, 2.452%, 10/20/21 | China | 1,900,000 | 1,930,190 | |||||||||||||
senior note, 2.957%, 11/08/22 | China | 9,400,000 | 9,851,801 | |||||||||||||
JPMorgan Chase & Co., | ||||||||||||||||
senior note, 2.083% to 4/22/25, FRN thereafter, 4/22/26 | United States | 18,200,000 | 18,466,956 | |||||||||||||
sub. note, 3.875%, 9/10/24 | United States | 8,400,000 | 9,048,034 | |||||||||||||
| e | Kookmin Bank, secured note, 144A, 2.25%, 2/03/22 | South Korea | 1,800,000 | 1,814,850 | ||||||||||||
Lloyds Banking Group PLC, senior note, 3.87%, 7/09/25 | United Kingdom | 2,300,000 | 2,422,471 | |||||||||||||
| f | Realkredit Danmark A/S, secured bond, Reg S, 1.00%, 4/01/27 | Denmark | 36,840,000 | DKK | 5,760,998 | |||||||||||
Royal Bank of Canada, secured note, 2.10%, 10/14/21 | Canada | 6,400,000 | 6,439,765 | |||||||||||||
| e | Standard Chartered PLC, senior note, 144A, 3.885% to 3/15/23, FRN thereafter, 3/15/24 | United Kingdom | 10,000,000 | 10,302,009 | ||||||||||||
| e | The Toronto-Dominion Bank, secured note, 144A, 2.25%, 3/15/22 | Canada | 12,900,000 | 13,069,990 | ||||||||||||
Truist Bank, senior note, 3.525% to 10/25/20, FRN thereafter, 10/26/21 | United States | 5,000,000 | 5,054,133 | |||||||||||||
| f | Turkiye Vakiflar Bankasi TAO, secured note, Reg S, 2.375%, 11/04/22 | Turkey | 5,600,000 | EUR | 6,011,662 | |||||||||||
Wells Fargo & Co., senior note, 2.188% to 4/30/25, FRN thereafter, 4/30/26 | United States | 8,400,000 | 8,453,153 | |||||||||||||
| e | Westpac Banking Corp., | |||||||||||||||
secured note, 144A, 2.10%, 2/25/22 | Australia | 9,700,000 | 9,801,784 | |||||||||||||
senior secured note, 144A, 2.25%, 11/09/21 | Australia | 6,300,000 | 6,347,578 | |||||||||||||
|
| |||||||||||||||
| 212,810,435 | ||||||||||||||||
|
| |||||||||||||||
58 | Semiannual Report | franklintempleton.com | ||
FRANKLIN INVESTORS SECURITIES TRUST
STATEMENT OF INVESTMENTS (UNAUDITED)
Franklin Low Duration Total Return Fund (continued)
| | Country/ Organization | | | Principal Amount* | | Value | ||||||||||
Corporate Bonds (continued) | ||||||||||||||||
Capital Goods 1.0% | ||||||||||||||||
Caterpillar Inc., senior note, 2.60%, 4/09/30 | United States | 4,500,000 | $ | 4,774,042 | ||||||||||||
| e | Cloud Crane LLC, secured note, second lien, 144A, 10.125%, 8/01/24 | United States | 5,000,000 | 4,741,000 | ||||||||||||
CNH Industrial Capital LLC, senior note, 3.875%, 10/15/21 | United States | 5,100,000 | 5,162,884 | |||||||||||||
Emerson Electric Co., senior note, 1.80%, 10/15/27 | United States | 3,800,000 | 3,808,680 | |||||||||||||
General Electric Co., | ||||||||||||||||
senior note, 3.375%, 3/11/24 | United States | 8,000,000 | 8,285,994 | |||||||||||||
senior note, 3.45%, 5/01/27 | United States | 2,290,000 | 2,332,147 | |||||||||||||
| e | Navistar International Corp., senior secured note, 144A, 9.50%, 5/01/25 | United States | 1,300,000 | 1,368,250 | ||||||||||||
| b,g | Onsite Rental Group Operations Pty. Ltd., secured note, PIK, 6.10%, 10/26/23 | Australia | 347,593 | 254,177 | ||||||||||||
|
| |||||||||||||||
| 30,727,174 | ||||||||||||||||
|
| |||||||||||||||
Consumer Services 0.4% | ||||||||||||||||
| e | 1011778 BC ULC/New Red Finance Inc., senior secured note, first lien, 144A, 4.25%, 5/15/24 | Canada | 4,000,000 | 4,019,560 | ||||||||||||
Marriott International Inc., senior note, 2.875%, 3/01/21 | United States | 10,000,000 | 9,806,789 | |||||||||||||
|
| |||||||||||||||
| 13,826,349 | ||||||||||||||||
|
| |||||||||||||||
Diversified Financials 4.7% | ||||||||||||||||
American Express Co., senior note, 3.70%, 8/03/23 | United States | 6,800,000 | 7,223,190 | |||||||||||||
The Bank of New York Mellon Corp.senior note, 1.60%, 4/24/25 | United States | 6,500,000 | 6,606,482 | |||||||||||||
Capital One Financial Corp., | ||||||||||||||||
senior note, 2.50%, 5/12/20 | United States | 3,900,000 | 3,900,925 | |||||||||||||
senior note, 3.45%, 4/30/21 | United States | 6,800,000 | 6,902,214 | |||||||||||||
senior note, 3.05%, 3/09/22 | United States | 13,800,000 | 14,020,626 | |||||||||||||
| h | Cia Securitizadora de Creditos Financeiros Vert-Fintech, senior secured note, FRN, 5.96%, (BZDIOVRA + 5.75%), 2/14/24 | Brazil | 7,676 | i | BRL | 1,530,012 | ||||||||||
| h | Deutsche Bank AG, senior note, FRN, 3.005%, (3-month USD LIBOR + 1.31%), 8/20/20 | Germany | 7,600,000 | 7,534,753 | ||||||||||||
| e | Dexia Credit Local SA, senior note, 144A, 2.375%, 9/20/22 | France | 4,800,000 | 4,998,704 | ||||||||||||
| e | FirstCash Inc., senior note, 144A, 5.375%, 6/01/24 | United States | 5,000,000 | 5,049,000 | ||||||||||||
The Goldman Sachs Group Inc., | ||||||||||||||||
senior note, 2.625%, 4/25/21 | United States | 12,000,000 | 12,141,890 | |||||||||||||
senior note, 2.35%, 11/15/21 | United States | 4,000,000 | 4,015,991 | |||||||||||||
senior note, 3.75%, 5/22/25 | United States | 1,000,000 | 1,069,319 | |||||||||||||
h senior note, FRN, 1.941%, (3-month USD LIBOR + 1.20%), 9/15/20 | United States | 23,500,000 | 23,532,674 | |||||||||||||
| e | ICBCIL Finance Co. Ltd., senior note, 144A, 2.50%, 9/29/21 | China | 500,000 | 501,418 | ||||||||||||
Jyske Realkredit A/S, secured note, 1.00%, 4/01/26 | Denmark | 61,260,000 | DKK | 9,542,243 | ||||||||||||
Morgan Stanley, | ||||||||||||||||
senior note, 2.80%, 6/16/20 | United States | 6,600,000 | 6,612,152 | |||||||||||||
senior note, 3.70%, 10/23/24 | United States | 1,400,000 | 1,512,542 | |||||||||||||
senior unsecured note, 2.188% to 4/28/25, FRN thereafter, 4/28/26 | United States | 1,300,000 | 1,315,696 | |||||||||||||
franklintempleton.com | Semiannual Report | 59 | ||||
FRANKLIN INVESTORS SECURITIES TRUST
STATEMENT OF INVESTMENTS (UNAUDITED)
Franklin Low Duration Total Return Fund (continued)
| | Country/ Organization | | | Principal Amount* | | Value | ||||||||||
Corporate Bonds (continued) | ||||||||||||||||
Diversified Financials (continued) | ||||||||||||||||
| e | Pricoa Global Funding I, secured note, 144A, 3.45%, 9/01/23 | United States | 7,200,000 | $ | 7,717,406 | |||||||||||
Springleaf Finance Corp., senior note, 6.125%, 3/15/24 | United States | 5,000,000 | 4,719,300 | |||||||||||||
| e | UBS AG/London, senior note, 144A, 1.75%, 4/21/22 | Switzerland | 14,900,000 | 14,973,006 | ||||||||||||
|
| |||||||||||||||
| 145,419,543 | ||||||||||||||||
|
| |||||||||||||||
Energy 2.8% | ||||||||||||||||
| e | Aker BP ASA, senior note, 144A, 4.75%, 6/15/24 | Norway | 1,800,000 | 1,669,840 | ||||||||||||
Baker Hughes a GE Co. LLC/Baker Hughes Co-Obligor Inc., | ||||||||||||||||
senior note, 4.486%, 5/01/30 | United States | 500,000 | 514,350 | |||||||||||||
senior note, 2.773%, 12/15/22 | United States | 8,800,000 | 8,886,235 | |||||||||||||
CNOOC Finance 2015 USA LLC, senior note, 3.50%, 5/05/25 | China | 1,700,000 | 1,808,392 | |||||||||||||
Crestwood Midstream Partners LP/Crestwood Midstream Finance Corp., senior note, | United States | 1,200,000 | 882,240 | |||||||||||||
EnLink Midstream Partners LP, senior bond, 4.40%, 4/01/24 | United States | 3,800,000 | 2,417,750 | |||||||||||||
Enterprise Products Operating LLC, senior note, 3.35%, 3/15/23 | United States | 850,000 | 881,979 | |||||||||||||
Equinor ASA, senior note, 2.875%, 4/06/25 | Norway | 15,300,000 | 16,065,201 | |||||||||||||
Exxon Mobil Corp., senior note, 1.571%, 4/15/23 | United States | 19,000,000 | 19,282,861 | |||||||||||||
| e | Harvest Operations Corp., senior note, 144A, 4.20%, 6/01/23 | South Korea | 2,900,000 | 3,120,690 | ||||||||||||
Kinder Morgan Inc., senior note, 3.15%, 1/15/23 | United States | 9,300,000 | 9,498,332 | |||||||||||||
MPLX LP, senior note, 4.875%, 12/01/24 | United States | 6,800,000 | 6,762,377 | |||||||||||||
Oceaneering International Inc., senior note, 4.65%, 11/15/24 | United States | 50,000 | 26,187 | |||||||||||||
Sabine Pass Liquefaction LLC, senior secured note, first lien, 5.625%, 2/01/21 | United States | 10,400,000 | 10,402,252 | |||||||||||||
| j | Sanchez Energy Corp., senior note, 7.75%, 6/15/21 | United States | 1,900,000 | 10,735 | ||||||||||||
| e | Sinopec Group Overseas Development 2015 Ltd., senior note, 144A, 3.25%, 4/28/25 | China | 1,000,000 | 1,051,524 | ||||||||||||
The Williams Cos. Inc., senior bond, 4.125%, 11/15/20 | United States | 1,700,000 | 1,705,674 | |||||||||||||
|
| |||||||||||||||
| 84,986,619 | ||||||||||||||||
|
| |||||||||||||||
Food & Staples Retailing 0.3% | ||||||||||||||||
| e | Cencosud SA, senior note, 144A, 4.375%, 7/17/27 | Chile | 2,900,000 | 2,727,718 | ||||||||||||
Costco Wholesale Corp., senior note, 1.375%, 6/20/27 | United States | 5,900,000 | 5,937,805 | |||||||||||||
|
| |||||||||||||||
| 8,665,523 | ||||||||||||||||
|
| |||||||||||||||
Food, Beverage & Tobacco 0.5% | ||||||||||||||||
Anheuser-Busch InBev Worldwide Inc., senior bond, 3.50%, 6/01/30 | Belgium | 4,600,000 | 4,916,641 | |||||||||||||
BAT Capital Corp., senior note, 2.764%, 8/15/22 | United Kingdom | 3,000,000 | 3,042,501 | |||||||||||||
Bunge Ltd. Finance Corp., senior note, 3.50%, 11/24/20 | United States | 3,100,000 | 3,116,923 | |||||||||||||
The Coca-Cola Co., senior note, 1.45%, 6/01/27 | United States | 2,000,000 | 1,995,684 | |||||||||||||
| e | Imperial Brands Finance PLC, | |||||||||||||||
senior note, 144A, 3.125%, 7/26/24 | United Kingdom | 700,000 | 690,272 | |||||||||||||
senior note, 144A, 4.25%, 7/21/25 | United Kingdom | 1,695,000 | 1,736,580 | |||||||||||||
Reynolds American Inc., senior note, 4.45%, 6/12/25 | United Kingdom | 100,000 | 108,842 | |||||||||||||
|
| |||||||||||||||
| 15,607,443 | ||||||||||||||||
|
| |||||||||||||||
60 | Semiannual Report | franklintempleton.com | ||
FRANKLIN INVESTORS SECURITIES TRUST
STATEMENT OF INVESTMENTS (UNAUDITED)
Franklin Low Duration Total Return Fund (continued)
| | Country/ Organization | | | Principal Amount* | | Value | ||||||||||
Corporate Bonds (continued) | ||||||||||||||||
Health Care Equipment & Services 1.5% | ||||||||||||||||
Anthem Inc., | ||||||||||||||||
senior note, 2.50%, 11/21/20 | United States | 7,800,000 | $ | 7,858,215 | ||||||||||||
senior note, 2.95%, 12/01/22 | United States | 100,000 | 103,917 | |||||||||||||
senior note, 2.375%, 1/15/25 | United States | 2,400,000 | 2,480,135 | |||||||||||||
Centene Corp., | ||||||||||||||||
e senior bond, 144A, 3.375%, 2/15/30 | United States | 2,700,000 | 2,731,995 | |||||||||||||
senior note, 4.75%, 5/15/22 | United States | 4,000,000 | 4,057,800 | |||||||||||||
CHS/Community Health Systems Inc., | ||||||||||||||||
e senior note, 144A, 8.125%, 6/30/24 | United States | 1,500,000 | 1,010,625 | |||||||||||||
senior secured note, first lien, 6.25%, 3/31/23 | United States | 3,000,000 | 2,808,750 | |||||||||||||
Cigna Corp., | ||||||||||||||||
senior note, 3.40%, 9/17/21 | United States | 5,800,000 | 5,967,152 | |||||||||||||
senior note, 3.75%, 7/15/23 | United States | 2,592,000 | 2,769,086 | |||||||||||||
CVS Health Corp., | ||||||||||||||||
senior note, 2.80%, 7/20/20 | United States | 2,800,000 | 2,799,782 | |||||||||||||
senior note, 2.125%, 6/01/21 | United States | 4,100,000 | 4,135,086 | |||||||||||||
senior note, 3.70%, 3/09/23 | United States | 7,000,000 | 7,430,063 | |||||||||||||
Edwards Lifesciences Corp., senior note, 4.30%, 6/15/28 | United States | 300,000 | 343,520 | |||||||||||||
| e | MPH Acquisition Holdings LLC, senior note, 144A, 7.125%, 6/01/24 | United States | 1,100,000 | 987,217 | ||||||||||||
|
| |||||||||||||||
| 45,483,343 | ||||||||||||||||
|
| |||||||||||||||
Household & Personal Products 0.3% | ||||||||||||||||
Avon Products Inc., senior bond, 7.00%, 3/15/23 | United Kingdom | 5,835,000 | 5,591,447 | |||||||||||||
The Procter & Gamble Co., senior note, 1.70%, 11/03/21 | United States | 3,200,000 | 3,263,340 | |||||||||||||
|
| |||||||||||||||
| 8,854,787 | ||||||||||||||||
|
| |||||||||||||||
Insurance 1.6% | ||||||||||||||||
Aflac Inc., | ||||||||||||||||
senior bond, 3.625%, 11/15/24 | United States | 8,000,000 | 8,775,675 | |||||||||||||
senior note, 3.60%, 4/01/30 | United States | 2,800,000 | 3,143,526 | |||||||||||||
| e | Athene Global Funding, secured note, 144A, 2.75%, 6/25/24 | United States | 1,100,000 | 1,092,800 | ||||||||||||
| e | Jackson National Life Global Funding, | |||||||||||||||
secured note, 144A, 2.25%, 4/29/21 | United States | 50,000 | 50,401 | |||||||||||||
secured note, 144A, 2.10%, 10/25/21 | United States | 25,000 | 25,184 | |||||||||||||
secured note, 144A, 3.30%, 2/01/22 | United States | 12,000,000 | 12,358,669 | |||||||||||||
| e | Metropolitan Life Global Funding I, | |||||||||||||||
secured note, 144A, 3.375%, 1/11/22 | United States | 8,400,000 | 8,690,493 | |||||||||||||
senior note, 144A, 2.95%, 4/09/30 | United States | 9,400,000 | 10,102,609 | |||||||||||||
senior secured bond, 144A, 3.875%, 4/11/22 | United States | 5,900,000 | 6,216,837 | |||||||||||||
|
| |||||||||||||||
| 50,456,194 | ||||||||||||||||
|
| |||||||||||||||
Materials 1.3% | ||||||||||||||||
Air Products and Chemicals Inc., senior note, 1.50%, 10/15/25 | United States | 2,000,000 | 2,018,099 | |||||||||||||
| e | Braskem Netherlands Finance BV, senior bond, 144A, 4.50%, 1/31/30 | Brazil | 7,100,000 | 5,768,750 | ||||||||||||
| f | CNAC HK Finbridge Co. Ltd., senior note, Reg S, 3.875%, 6/19/29 | China | 4,700,000 | 4,777,411 | ||||||||||||
| e | FMG Resources (August 2006) Pty. Ltd., senior note, 144A, 4.75%, 5/15/22 | Australia | 4,900,000 | 4,943,855 | ||||||||||||
franklintempleton.com | Semiannual Report | 61 | ||||
FRANKLIN INVESTORS SECURITIES TRUST
STATEMENT OF INVESTMENTS (UNAUDITED)
Franklin Low Duration Total Return Fund (continued)
| | Country/ Organization | | | Principal Amount* | | Value | ||||||||||
Corporate Bonds (continued) | ||||||||||||||||
Materials (continued) | ||||||||||||||||
| e | Glencore Finance Canada Ltd., senior bond, 144A, 4.95%, 11/15/21 | Switzerland | 3,500,000 | $ | 3,599,382 | |||||||||||
| e | Glencore Funding LLC, senior note, 144A, 3.00%, 10/27/22 | Switzerland | 2,200,000 | 2,184,763 | ||||||||||||
| e | Owens-Brockway Glass Container Inc., | |||||||||||||||
senior bond, 144A, 5.375%, 1/15/25 | United States | 5,000,000 | 4,911,500 | |||||||||||||
senior note, 144A, 5.875%, 8/15/23 | United States | 4,000,000 | 4,060,800 | |||||||||||||
| e | SABIC Capital II BV, senior note, 144A, 4.50%, 10/10/28 | Saudi Arabia | 400,000 | 428,017 | ||||||||||||
| e | Sealed Air Corp., senior bond, 144A, 5.25%, 4/01/23 | United States | 950,000 | 985,815 | ||||||||||||
| e | TPC Group Inc., secured note, 144A, 10.50%, 8/01/24 | United States | 6,000,000 | 4,936,200 | ||||||||||||
|
| |||||||||||||||
| 38,614,592 | ||||||||||||||||
|
| |||||||||||||||
Media & Entertainment 1.8% | ||||||||||||||||
| e | Altice Financing SA, secured bond, 144A, 7.50%, 5/15/26 | Luxembourg | 2,000,000 | 2,099,300 | ||||||||||||
Baidu Inc., senior note, 4.375%, 5/14/24 | China | 6,500,000 | 6,943,761 | |||||||||||||
| e | CCO Holdings LLC / CCO Holdings Capital Corp., senior note, 144A, 4.00%, 3/01/23 | United States | 3,200,000 | 3,242,720 | ||||||||||||
Charter Communications Operating LLC/Charter Communications Operating Capital, senior bond, 2.80%, 4/01/31 | United States | 3,800,000 | 3,830,325 | |||||||||||||
CSC Holdings LLC, senior bond, 5.25%, 6/01/24 | United States | 4,000,000 | 4,180,400 | |||||||||||||
DISH DBS Corp., | ||||||||||||||||
senior bond, 5.875%, 7/15/22 | United States | 3,000,000 | 3,041,100 | |||||||||||||
senior note, 5.875%, 11/15/24 | United States | 1,500,000 | 1,450,560 | |||||||||||||
Fox Corp., senior note, 3.05%, 4/07/25 | United States | 5,300,000 | 5,614,200 | |||||||||||||
Netflix Inc., senior bond, 5.75%, 3/01/24 | United States | 1,800,000 | 1,970,460 | |||||||||||||
| e | Nexstar Broadcasting Inc., senior note, 144A, 5.625%, 8/01/24 | United States | 5,000,000 | 4,888,500 | ||||||||||||
| e | Sirius XM Radio Inc., senior note, 144A, 4.625%, 7/15/24 | United States | 700,000 | 717,360 | ||||||||||||
| e | Tencent Holdings Ltd., senior note, 144A, 2.985%, 1/19/23 | China | 9,200,000 | 9,418,040 | ||||||||||||
| e | Univision Communications Inc., senior secured note, first lien, 144A, 5.125%, 2/15/25 | United States | 3,700,000 | 3,269,875 | ||||||||||||
| e | WMG Acquisition Corp., secured note, first lien, 144A, 5.00%, 8/01/23 | United States | 5,000,000 | 5,061,500 | ||||||||||||
|
| |||||||||||||||
| 55,728,101 | ||||||||||||||||
|
| |||||||||||||||
Pharmaceuticals, Biotechnology & Life Sciences 1.6% | ||||||||||||||||
| e | AbbVie Inc., | |||||||||||||||
senior note, 144A, 2.30%, 11/21/22 | United States | 7,500,000 | 7,696,631 | |||||||||||||
senior note, 144A, 2.95%, 11/21/26 | United States | 500,000 | 530,133 | |||||||||||||
Allergan Funding SCS, | ||||||||||||||||
senior bond, 3.80%, 3/15/25 | United States | 600,000 | 641,108 | |||||||||||||
senior note, 3.45%, 3/15/22 | United States | 10,500,000 | 10,767,727 | |||||||||||||
| e | Bausch Health Cos. Inc., senior note, 144A, 5.50%, 3/01/23 | United States | 3,000,000 | 2,985,000 | ||||||||||||
| e | Bayer U.S. Finance II LLC, senior note, 144A, 3.875%, 12/15/23 | Germany | 5,800,000 | 6,165,030 | ||||||||||||
Biogen Inc., | ||||||||||||||||
senior bond, 2.25%, 5/01/30 | United States | 2,200,000 | 2,192,158 | |||||||||||||
senior note, 2.90%, 9/15/20 | United States | 11,500,000 | 11,535,855 | |||||||||||||
| e | Bristol-Myers Squibb Co., senior note, 144A, 2.25%, 8/15/21 | United States | 7,900,000 | 8,030,970 | ||||||||||||
|
| |||||||||||||||
| 50,544,612 | ||||||||||||||||
|
| |||||||||||||||
62 | Semiannual Report | franklintempleton.com | ||
FRANKLIN INVESTORS SECURITIES TRUST
STATEMENT OF INVESTMENTS (UNAUDITED)
Franklin Low Duration Total Return Fund (continued)
| | Country/ Organization | | | Principal Amount* | | Value | ||||||||||
Corporate Bonds (continued) | ||||||||||||||||
Real Estate 0.4% | ||||||||||||||||
| f | China Overseas Finance Cayman VII Ltd., senior note, Reg S, 4.25%, 4/26/23 | China | 2,500,000 | $ | 2,628,937 | |||||||||||
MPT Operating Partnership LP/MPT Finance Corp., senior note, 6.375%, 3/01/24 | United States | 3,900,000 | 4,039,776 | |||||||||||||
Simon Property Group LP, senior bond, 3.375%, 10/01/24 | United States | 5,600,000 | 5,578,599 | |||||||||||||
|
| |||||||||||||||
| 12,247,312 | ||||||||||||||||
|
| |||||||||||||||
Retailing 0.5% | ||||||||||||||||
Alibaba Group Holding Ltd., senior note, 2.80%, 6/06/23 | China | 1,100,000 | 1,137,896 | |||||||||||||
Amazon.com Inc., senior note, 2.40%, 2/22/23 | United States | 4,150,000 | 4,350,713 | |||||||||||||
Dollar Tree Inc., senior note, 3.70%, 5/15/23 | United States | 8,800,000 | 9,228,366 | |||||||||||||
| b,e,g | K2016470219 South Africa Ltd., senior secured note, 144A, PIK, 3.00%, 12/31/22 | South Africa | 991,640 | 1,227 | ||||||||||||
| b,e,g | K2016470260 South Africa Ltd., senior secured note, 144A, PIK, 25.00%, 12/31/22 | South Africa | 261,139 | 1,205 | ||||||||||||
| e | Party City Holdings Inc., senior note, 144A, 6.125%, 8/15/23 | United States | 2,600,000 | 253,500 | ||||||||||||
|
| |||||||||||||||
| 14,972,907 | ||||||||||||||||
|
| |||||||||||||||
Semiconductors & Semiconductor Equipment 0.2% | ||||||||||||||||
Maxim Integrated Products Inc., senior note, 3.45%, 6/15/27 | United States | 800,000 | 841,741 | |||||||||||||
Micron Technology Inc., senior note, 2.497%, 4/24/23 | United States | 4,500,000 | 4,586,676 | |||||||||||||
|
| |||||||||||||||
| 5,428,417 | ||||||||||||||||
|
| |||||||||||||||
Technology Hardware & Equipment 0.1% | ||||||||||||||||
| e | CommScope Inc., senior bond, 144A, 5.50%, 6/15/24 | United States | 5,000,000 | 4,508,150 | ||||||||||||
|
| |||||||||||||||
Telecommunication Services 0.2% | ||||||||||||||||
CenturyLink Inc., senior note, Series S, 6.45%, 6/15/21 | United States | 4,700,000 | 4,839,590 | |||||||||||||
| e | Sprint Spectrum Co. LLC/Sprint Spectrum Co. II LLC/Sprint Spectrum Co. III LLC, first lien, 144A, 3.36%, 3/20/23 | United States | 937,500 | 942,797 | ||||||||||||
|
| |||||||||||||||
| 5,782,387 | ||||||||||||||||
|
| |||||||||||||||
Transportation 1.2% | ||||||||||||||||
American Airlines Pass Through Trust, first lien, 2016-2, AA, 3.20%, 12/15/29 | United States | 42,725 | 39,311 | |||||||||||||
| e | DAE Funding LLC, senior note, 144A, 4.00%, 8/01/20 | United Arab Emirates | 4,100,000 | 4,057,770 | ||||||||||||
FedEx Corp., | ||||||||||||||||
senior bond, 3.20%, 2/01/25 | United States | 850,000 | 892,338 | |||||||||||||
senior note, 3.40%, 1/14/22 | United States | 3,900,000 | 4,027,040 | |||||||||||||
senior note, 3.80%, 5/15/25 | United States | 13,400,000 | 14,335,721 | |||||||||||||
| e | Kazakhstan Temir Zholy Finance BV, senior bond, 144A, 6.95%, 7/10/42 | Kazakhstan | 4,200,000 | 4,845,855 | ||||||||||||
| e | Mexico City Airport Trust, senior secured bond, first lien, 144A, 5.50%, 7/31/47 | Mexico | 2,400,000 | 2,012,640 | ||||||||||||
| f,k | RZD Capital PLC, (Russian Railways), loan participation, senior bond, Reg S, | Russia | 5,900,000 | 6,213,290 | ||||||||||||
|
| |||||||||||||||
| 36,423,965 | ||||||||||||||||
|
| |||||||||||||||
franklintempleton.com | Semiannual Report | 63 | ||||
FRANKLIN INVESTORS SECURITIES TRUST
STATEMENT OF INVESTMENTS (UNAUDITED)
Franklin Low Duration Total Return Fund (continued)
| | Country/ Organization | | | Principal Amount* |
| Value | ||||||||||||
Corporate Bonds (continued) | ||||||||||||||||||
Utilities 2.6% | ||||||||||||||||||
AES Corp., senior note, 4.00%, 3/15/21 | United States | 2,750,000 | $ | 2,758,663 | ||||||||||||||
Calpine Corp., senior note, 5.50%, 2/01/24 | United States | 5,400,000 | 5,386,500 | |||||||||||||||
| f | CGNPC International Ltd., senior note, Reg S, 3.75%, 12/11/27 | China | 2,100,000 | 2,275,068 | ||||||||||||||
Dominion Energy Inc., | ||||||||||||||||||
junior sub. note, 2.579%, 7/01/20 | United States | 5,200,000 | 5,201,768 | |||||||||||||||
senior bond, 2.85%, 8/15/26 | United States | 1,300,000 | 1,348,537 | |||||||||||||||
Duke Energy Indiana Inc., senior secured bond, 3.75%, 7/15/20 | United States | 100,000 | 100,494 | |||||||||||||||
| e,l | EDF SA, junior sub. bond, 144A, 5.625% to 1/22/24, FRN thereafter, Perpetual | France | 2,200,000 | 2,179,529 | ||||||||||||||
Exelon Corp., senior bond, 4.05%, 4/15/30 | United States | 13,500,000 | 15,425,451 | |||||||||||||||
| e | Israel Electric Corp. Ltd., secured bond, 144A, 4.25%, 8/14/28 | Israel | 1,400,000 | 1,483,839 | ||||||||||||||
| e | Korea East-West Power Co. Ltd., | |||||||||||||||||
senior note, 144A, 3.875%, 7/19/23 | South Korea | 4,800,000 | 5,127,809 | |||||||||||||||
m senior note, 144A, 1.75%, 5/06/25 | South Korea | 8,500,000 | 8,490,743 | |||||||||||||||
PSEG Power LLC, senior note, 3.00%, 6/15/21 | United States | 7,700,000 | 7,808,471 | |||||||||||||||
The Southern Co., | ||||||||||||||||||
senior bond, 3.25%, 7/01/26 | United States | 850,000 | 909,191 | |||||||||||||||
senior bond, 3.70%, 4/30/30 | United States | 12,200,000 | 13,566,568 | |||||||||||||||
senior note, 2.35%, 7/01/21 | United States | 6,500,000 | 6,580,205 | |||||||||||||||
| e | Three Gorges Finance I Cayman Islands Ltd., senior note, 144A, 3.70%, 6/10/25 | China | 2,100,000 | 2,278,307 | ||||||||||||||
|
| |||||||||||||||||
| 80,921,143 | ||||||||||||||||||
|
| |||||||||||||||||
| Total Corporate Bonds (Cost $921,756,291) | 922,925,241 | |||||||||||||||||
|
| |||||||||||||||||
| h,n | Senior Floating Rate Interests 3.4% | |||||||||||||||||
Automobiles & Components 0.2% | ||||||||||||||||||
Adient U.S. LLC, Initial Term Loans, 5.45% - 5.742%, (3-month USD LIBOR + 4.00%), 5/06/24 | United States | 4,049,450 | 3,676,139 | |||||||||||||||
Clarios Global LP (Power Solutions), Initial Dollar Term Loan, 3.904%, (1-month USD LIBOR + 3.50%), 4/30/26 | United States | 588,521 | 534,819 | |||||||||||||||
Thor Industries Inc., Initial USD Term Loans, 4.625% - 4.75%, (1-month USD LIBOR + 3.75%), 2/01/26 | United States | 1,710,407 | 1,574,287 | |||||||||||||||
|
| |||||||||||||||||
| 5,785,245 | ||||||||||||||||||
|
| |||||||||||||||||
Capital Goods 0.1% | ||||||||||||||||||
Alloy Finco Ltd., Term Loan B, PIK, 14.00%, 3/06/25 | United States | 193,048 | 94,111 | |||||||||||||||
Altra Industrial Motion Corp., Term Loan, 2.404%, (1-month USD LIBOR + 2.00%), 10/01/25 | United States | 779,133 | 741,150 | |||||||||||||||
| o | Dynasty Acquisition Co. Inc., | |||||||||||||||||
Initial Term B-1 Loan, 4.95%, (3-month USD LIBOR + 3.50%), 4/04/26 | United States | 542,430 | 479,825 | |||||||||||||||
Initial Term B-2 Loan (CAD), 4.95%, (3-month USD LIBOR + 3.50%), 4/04/26 | United States | 291,629 | 257,970 | |||||||||||||||
Navistar Inc., Tranche B Term Loan, 4.22%, (1-month USD LIBOR + 3.50%), 11/06/24 | United States | 1,339,431 | 1,223,347 | |||||||||||||||
Onsite Rental Group Operations Pty. Ltd., Term Loan, 5.50%, (1-month USD LIBOR + 4.50%), 10/25/22 | Australia | 254,234 | 209,743 | |||||||||||||||
|
| |||||||||||||||||
| 3,006,146 | ||||||||||||||||||
|
| |||||||||||||||||
64 | Semiannual Report | franklintempleton.com | ||
FRANKLIN INVESTORS SECURITIES TRUST
STATEMENT OF INVESTMENTS (UNAUDITED)
Franklin Low Duration Total Return Fund (continued)
| | Country/ Organization |
| | Principal Amount* |
| Value | ||||||||||||
| h,n | Senior Floating Rate Interests (continued) | |||||||||||||||||
Commercial & Professional Services 0.1% | ||||||||||||||||||
Pitney Bowes Inc., Incremental Tranche Term B Loans, 5.91%, (1-month USD LIBOR + 5.50%), 1/07/25 | United States | 1,114,616 | $ | 966,001 | ||||||||||||||
Prime Security Services Borrower LLC, Term B-1, 4.266%, (1-month USD LIBOR + 3.25%), 9/12/26 | United States | 1,121,875 | 1,074,429 | |||||||||||||||
United Rentals North America Inc., Initial Term Loans, 2.154%, (1-month USD LIBOR + 1.75%), 10/31/25 | United States | 2,764,689 | 2,657,803 | |||||||||||||||
|
| |||||||||||||||||
| 4,698,233 | ||||||||||||||||||
|
| |||||||||||||||||
Consumer Durables & Apparel 0.0%† | ||||||||||||||||||
Champ Acquisition Corp., Initial Term Loan, 6.572%, (3-month USD LIBOR + 5.50%), 12/21/25 | United States | 377,583 | 338,881 | |||||||||||||||
Playtika Holding Corp., Term B Loans, 7.072%, (3-month USD LIBOR + 6.00%), 12/10/24 | United States | 286,375 | 284,585 | |||||||||||||||
|
| |||||||||||||||||
| 623,466 | ||||||||||||||||||
|
| |||||||||||||||||
Consumer Services 0.3% | ||||||||||||||||||
Aristocrat Technologies Inc., Term B-3 Loans, 2.859%, (3-month USD LIBOR + 1.75%), 10/19/24 | United States | 2,021,272 | 1,926,946 | |||||||||||||||
Boyd Gaming Corp., Refinancing Term B Loans, 2.387%, (1-week USD LIBOR + 2.25%), 9/15/23 | United States | 2,000,000 | 1,881,250 | |||||||||||||||
Caesars Resort Collection LLC, Term B Loans, 3.154%, (1-month USD LIBOR + 2.75%), 12/22/24 | United States | 1,496,174 | 1,264,890 | |||||||||||||||
Eldorado Resorts Inc., Initial Term Loan, 3.25%, (3-month USD LIBOR + 2.25%), 4/17/24 | United States | 810,993 | 776,357 | |||||||||||||||
KFC Holding Co./Pizza Hut Holdings LLC/Taco Bell of America LLC (Yum Brands), Term Loan B, 2.468%, (1-month USD LIBOR + 1.75%), 4/03/25 | United States | 1,781,818 | 1,714,164 | |||||||||||||||
NASCAR Holdings Inc., Initial Term Loans, 3.375%, (1-month USD LIBOR + 2.75%), 10/18/26 | United States | 2,500,000 | 2,348,885 | |||||||||||||||
|
| |||||||||||||||||
| 9,912,492 | ||||||||||||||||||
|
| |||||||||||||||||
Diversified Financials 0.0%† | ||||||||||||||||||
| o | Asurion LLC, Replacement B-6 Term Loans, 3.404%, (1-month USD LIBOR + 3.00%), 11/03/23 | United States | 1,306,556 | 1,253,749 | ||||||||||||||
|
| |||||||||||||||||
Energy 0.1% | ||||||||||||||||||
Buckeye Partners LP, Initial Term Loans, 3.766%, (1-month USD LIBOR + 2.75%), 11/01/26 | United States | 838,491 | 791,326 | |||||||||||||||
| o | Centurion Pipeline Co. LLC, Initial Term Loans, 3.654%, (1-month USD LIBOR + 3.25%), 9/28/25 | United States | 520,000 | 458,900 | ||||||||||||||
| j | Fieldwood Energy LLC, Closing Date Loans, 6.25%, (3-month USD LIBOR + 5.25%), 4/11/22 | United States | 4,260,617 | 1,086,457 | ||||||||||||||
Utex Industries Inc., | ||||||||||||||||||
Initial Term Loan (First Lien), 5.311%, (3-month USD LIBOR + 4.00%), 5/21/21 | United States | 680,976 | 188,404 | |||||||||||||||
Second Lien Initial Term Loan, 8.561%, (3-month USD LIBOR + 7.25%), 5/20/22 | United States | 71,338 | 9,868 | |||||||||||||||
|
| |||||||||||||||||
| 2,534,955 | ||||||||||||||||||
|
| |||||||||||||||||
Food & Staples Retailing 0.0%† | ||||||||||||||||||
Whatabrands LLC (Whataburger), 2020 Refinancing Term Loans, 3.732%, (1-month USD LIBOR + 2.75%), 8/02/26 | United States | 293,839 | 273,270 | |||||||||||||||
|
| |||||||||||||||||
franklintempleton.com | Semiannual Report | 65 | ||||
FRANKLIN INVESTORS SECURITIES TRUST
STATEMENT OF INVESTMENTS (UNAUDITED)
Franklin Low Duration Total Return Fund (continued)
| | Country/ Organization | | | Principal Amount* |
| Value | ||||||||||||
| h,n | Senior Floating Rate Interests (continued) | |||||||||||||||||
| Food, Beverage & Tobacco 0.2% | ||||||||||||||||||
B&G Foods Inc., Tranche B-4 Term Loan, 2.904%, (1-month USD LIBOR + 2.50%), 10/10/26 | United States | 1,073,601 | $ | 1,046,984 | ||||||||||||||
CSM Bakery Supplies LLC, Second Lien Term Loan, 9.10%, (3-month USD LIBOR + 7.75%), 7/03/21 | United States | 772,195 | 592,016 | |||||||||||||||
JBS USA Lux SA, New Term Loans, 3.072%, (3-month USD LIBOR + 2.00%), 5/01/26 | United States | 3,766,763 | 3,655,527 | |||||||||||||||
|
| |||||||||||||||||
| 5,294,527 | ||||||||||||||||||
|
| |||||||||||||||||
| Health Care Equipment & Services 0.5% | ||||||||||||||||||
Catalent Pharma Solutions Inc., Dollar Term B-2 Loan, 3.25%, (1-month USD LIBOR + 2.25%), 5/17/26 | United States | 3,690,680 | 3,644,547 | |||||||||||||||
DaVita Inc., Tranche B-1 Term Loan, 2.154%, (1-month USD LIBOR + 1.75%), 8/12/26 | United States | 2,693,250 | 2,630,549 | |||||||||||||||
Gentiva Health Services Inc., Term B Loans, 3.688%, (1-month USD LIBOR + 3.25%), 7/02/25 | United States | 2,000,000 | 1,895,000 | |||||||||||||||
IQVIA Inc., Term B-2 Dollar Loans, 2.154%, (1-month USD LIBOR + 1.75%), 1/20/25 | United States | 3,514,173 | 3,396,448 | |||||||||||||||
National Mentor Holdings Inc., | ||||||||||||||||||
Initial Term C Loans, 5.71%, (3-month USD LIBOR + 4.25%), 3/08/26 | United States | 16,808 | 16,051 | |||||||||||||||
Initial Term Loans, 3/08/26 | United States | 370,084 | 353,431 | |||||||||||||||
Phoenix Guarantor Inc., Tranche B-1 Term Loan, 4.079%, (1-month USD LIBOR + 3.25%), 3/05/26 | United States | 1,085,359 | 1,020,237 | |||||||||||||||
Inovalon Holdings Inc., Refinancing Date Term Loans, FRN, 3.875%, (1-month USD LIBOR + 3.00%), 4/02/25 | United States | 997,323 | 969,897 | |||||||||||||||
US Anesthesia Partners Inc., First Lien Term Loan, 4.00%, (3-month USD LIBOR + 3.00%), 6/23/24 | United States | 232,735 | 200,152 | |||||||||||||||
|
| |||||||||||||||||
| 14,126,312 | ||||||||||||||||||
|
| |||||||||||||||||
| Household & Personal Products 0.2% | ||||||||||||||||||
| b | FGI Operating Co. LLC (Freedom Group), | |||||||||||||||||
g Term Loan, PIK, 12.00%, (3-month USD LIBOR + 10.00%), 5/15/22 | United States | 1,127,822 | 985,228 | |||||||||||||||
Term Loan FILO, 9.50%, (3-month USD LIBOR + 7.50%), 5/15/21 | United States | 2,140,156 | 2,130,569 | |||||||||||||||
Knowlton Development Corp., Initial Term Loan, 4.154%, (1-month USD LIBOR + 3.75%), 12/21/25 | United States | 273,079 | 246,454 | |||||||||||||||
| o | Sunshine Luxembourg VII SARL (Nestle Skin Health), Facility B1 Commitments, 5.322%, (6-month USD LIBOR + 4.25%), 9/25/26 | Luxembourg | 1,995,000 | 1,836,232 | ||||||||||||||
|
| |||||||||||||||||
| 5,198,483 | ||||||||||||||||||
|
| |||||||||||||||||
| Insurance 0.1% | ||||||||||||||||||
Alliant Holdings Intermediate LLC/Alliant Holdings Co-Issue, Initial Term Loan, 3.154%, (1-month USD LIBOR + 2.75%), 5/10/25 | United States | 1,271,928 | 1,195,216 | |||||||||||||||
AssuredPartners Inc., 2020 February Refinancing Term Loans, 3.904%, (1-month USD LIBOR + 3.50%), 2/13/27 | United States | 997,500 | 939,146 | |||||||||||||||
|
| |||||||||||||||||
| 2,134,362 | ||||||||||||||||||
|
| |||||||||||||||||
66 | Semiannual Report | franklintempleton.com | ||
FRANKLIN INVESTORS SECURITIES TRUST
STATEMENT OF INVESTMENTS (UNAUDITED)
Franklin Low Duration Total Return Fund (continued)
| | Country/ Organization | | | Principal Amount* |
| Value | ||||||||||||
| h,n | Senior Floating Rate Interests (continued) | |||||||||||||||||
Materials 0.2% | ||||||||||||||||||
Appvion Operations Inc., Term Loan, 6/15/26 | United States | 360,146 | $ | 352,943 | ||||||||||||||
| o | Arconic Corp., Initial Term Loans, 3.24%, (1-month USD LIBOR + 2.75%), 2/04/27 | United States | 2,870,000 | 2,855,650 | ||||||||||||||
Axalta Coating Systems U.S. Holdings Inc. (DuPont Performance Coatings), Term B-3 Dollar Loan, 3.20%, (3-month USD LIBOR + 1.75%), 6/01/24 | United States | 1,645,198 | 1,606,536 | |||||||||||||||
Berry Global Inc., Term Y Loans, 2.829%, (1-month USD LIBOR + 2.00%), 7/01/26 | United States | 1,595,980 | 1,530,256 | |||||||||||||||
| o,p | Mauser Packaging Solutions Holding Co., Initial Term Loan, TBD, 4/03/24 | United States | 560,000 | 485,800 | ||||||||||||||
Oxbow Carbon LLC, Tranche B Term Loan, 4.154%, (1-month USD LIBOR + 3.75%), 1/04/23 | United States | 532,500 | 481,912 | |||||||||||||||
|
| |||||||||||||||||
| 7,313,097 | ||||||||||||||||||
|
| |||||||||||||||||
Media & Entertainment 0.3% | ||||||||||||||||||
| o,p | Banijay Group US Holding Inc., Facility B (USD) Loan, TBD, 2/03/25 | France | 410,000 | 380,275 | ||||||||||||||
Charter Communications Operating LLC, Term A-2 Loan, 1.91%, (1-month USD LIBOR + 1.50%), 3/31/23 | United States | 1,099,823 | 1,077,826 | |||||||||||||||
CSC Holdings LLC, March 2017 Incremental Term Loans, 3.064%, (1-month USD LIBOR + 2.25%), 7/17/25 | United States | 2,181,632 | 2,095,458 | |||||||||||||||
Diamond Sports Group LLC, Term Loan, 3.82%, (1-month USD LIBOR + 3.25%), 8/24/26 | United States | 1,745,614 | 1,432,495 | |||||||||||||||
Gray Television Inc., Term C Loan, 3.493%, (1-month USD LIBOR + 2.50%), 1/02/26 | United States | 321,812 | 305,118 | |||||||||||||||
Lions Gate Capital Holdings LLC, Term A Loan, 2.154%, (1-month USD LIBOR + 1.75%), 3/22/23 | Canada | 141,051 | 132,941 | |||||||||||||||
Mediacom Illinois LLC, Tranche N Term Loan, 1.90%, (1-week USD LIBOR + 1.75%), 2/15/24 | United States | 2,355,286 | 2,281,683 | |||||||||||||||
WideOpenWest Finance LLC, Term B Loan, 4.25%, (1-month USD LIBOR + 3.25%), 8/19/23 | United States | 214,834 | 201,675 | |||||||||||||||
|
| |||||||||||||||||
| 7,907,471 | ||||||||||||||||||
|
| |||||||||||||||||
| Pharmaceuticals, Biotechnology & Life Sciences 0.3% | ||||||||||||||||||
eResearch Technology Inc., Initial Term Loan, 5.50%, (1-month USD LIBOR + 4.50%), 2/04/27 | United States | 214,545 | 203,517 | |||||||||||||||
Grifols Worldwide Operations USA Inc., Dollar Tranche B Term Loan, 2.137%, (1-week USD LIBOR + 2.00%), 11/15/27 | United States | 2,218,546 | 2,192,003 | |||||||||||||||
Horizon Pharma Inc., Seventh Amendment Refinancing Term Loans, 3.25%, (1-month USD LIBOR + 2.25%), 5/22/26 | United States | 1,452,527 | 1,424,687 | |||||||||||||||
Syneos Health Inc. (INC Research LLC), Initial Term B Loans, 2.154%, (1-month USD LIBOR + 1.75%), 8/01/24 | United States | 2,398,559 | 2,338,595 | |||||||||||||||
Valeant Pharmaceuticals International, | ||||||||||||||||||
First Incremental Term Loan, 3.468%, (1-month USD LIBOR + 2.75%), 11/27/25 | United States | 1,700,000 | 1,643,232 | |||||||||||||||
Initial Term Loans, 3.718%, (1-month USD LIBOR + 3.00%), 6/02/25 | United States | 453,875 | 440,069 | |||||||||||||||
|
| |||||||||||||||||
| 8,242,103 | ||||||||||||||||||
|
| |||||||||||||||||
Real Estate 0.0%† | ||||||||||||||||||
Cushman & Wakefield U.S. Borrower LLC, Replacement Term Loan, 3.154%, (1-month USD LIBOR + 2.75%), 8/21/25 | United States | 1,327,973 | 1,236,437 | |||||||||||||||
|
| |||||||||||||||||
| franklintempleton.com |
Semiannual Report | 67 | ||||
FRANKLIN INVESTORS SECURITIES TRUST
STATEMENT OF INVESTMENTS (UNAUDITED)
Franklin Low Duration Total Return Fund (continued)
| | Country/ Organization | | | Principal Amount* |
| Value | ||||||||||||
| h,n | Senior Floating Rate Interests (continued) | |||||||||||||||||
| Retailing 0.1% | ||||||||||||||||||
Ascena Retail Group Inc., Tranche B Term Loan, 8/21/22 | United States | 663,642 | $ | 157,200 | ||||||||||||||
Bass Pro Group LLC, Initial Term Loans, 6.072%, (3-month USD LIBOR + 5.00%), 9/25/24 | United States | 1,074,511 | 899,366 | |||||||||||||||
General Nutrition Centers Inc., Tranche B-2 Term Loans, 3/04/21 | United States | 1,068,819 | 754,186 | |||||||||||||||
Harbor Freight Tools USA Inc., Refinancing Loans, 3.25%, (1-month USD LIBOR + 2.50%), 8/19/23 | United States | 812,590 | 773,991 | |||||||||||||||
Staples Inc., 2019 Refinancing Term B-1 Loans, 6.016%, (1-month USD LIBOR + 5.00%), 4/12/26 | United States | 486,579 | 391,088 | |||||||||||||||
|
| |||||||||||||||||
| 2,975,831 | ||||||||||||||||||
|
| |||||||||||||||||
| Semiconductors & Semiconductor Equipment 0.1% | ||||||||||||||||||
ON Semiconductor Corp., 2019 Replacement Term B-4 Loans, 2.404%, (1-month USD LIBOR + 2.00%), 9/18/26 | United States | 3,218,207 | 3,105,570 | |||||||||||||||
|
| |||||||||||||||||
| Software & Services 0.3% | ||||||||||||||||||
DCert Buyer Inc., Initial Term Loans, 4.404%, (1-month USD LIBOR + 4.00%), 10/16/26 | United States | 400,000 | 379,667 | |||||||||||||||
Go Daddy Operating Co. LLC, Tranche B-2 Term Loan, 2.154%, (1-month USD LIBOR + 1.75%), 2/15/24 | United States | 1,341,043 | 1,304,724 | |||||||||||||||
| o | Hyland Software Inc., Term Loans, 4.00%, (1-month USD LIBOR + 3.25%), 7/01/24 | United States | 217,500 | 209,588 | ||||||||||||||
Infor (U.S.) Inc. (Lawson), Tranche B-6 Term Loan, 3.75%, (1-month USD LIBOR + 2.75%), 2/01/22 | United States | 994,872 | 980,777 | |||||||||||||||
LegalZoom.com Inc., 2018 Term Loans, 4.904%, (1-month USD LIBOR + 4.50%), 11/21/24 | United States | 1,794,992 | 1,673,830 | |||||||||||||||
| o | Solera LLC, Dollar Term Loan, 4.363%, (3-month USD LIBOR + 2.75%), 3/03/23 | United States | 320,000 | 304,533 | ||||||||||||||
Surf Holdings LLC (Sophos), Dollar Tranche Term Loan, 4.814%, (3-month USD LIBOR + 3.50%), 3/05/27 | United States | 545,578 | 503,295 | |||||||||||||||
TIBCO Software Inc., Term B-3 Loans, 4.16%, (1-month USD LIBOR + 3.75%), 7/31/26 | United States | 1,373,100 | 1,295,005 | |||||||||||||||
Verscend Holding Corp., Term B Loans, 4.904%, (1-month USD LIBOR + 4.50%), 7/27/25 | United States | 299,240 | 283,671 | |||||||||||||||
Waystar (Navicure Inc), Initial Term Loans, 4.404%, (1-month USD LIBOR + 4.00%), 10/22/26 | United States | 590,000 | 554,600 | |||||||||||||||
WEX Inc., Term B-3 Loan, 2.654%, (1-month USD LIBOR + 2.25%), 5/17/26 | United States | 1,695,718 | 1,607,222 | |||||||||||||||
|
| |||||||||||||||||
| 9,096,912 | ||||||||||||||||||
|
| |||||||||||||||||
| Technology Hardware & Equipment 0.1% | ||||||||||||||||||
CommScope Inc., Initial Term Loans, 3.654%, (1-month USD LIBOR + 3.25%), 4/04/26 | United States | 1,795,489 | 1,705,265 | |||||||||||||||
|
| |||||||||||||||||
| Telecommunication Services 0.1% | ||||||||||||||||||
Aventiv Technologies LLC, | ||||||||||||||||||
Initial Term Loan, 11/01/24 | United States | 346,455 | 291,023 | |||||||||||||||
Second Lien Initial Loan, 9.25%, (3-month USD LIBOR + 8.25%), 11/01/25 | United States | 790,636 | 494,147 | |||||||||||||||
68 | Semiannual Report | franklintempleton.com | ||
FRANKLIN INVESTORS SECURITIES TRUST
STATEMENT OF INVESTMENTS (UNAUDITED)
Franklin Low Duration Total Return Fund (continued)
| | Country/ Organization | | | Principal Amount | * | Value | ||||||||||||
| h,n | Senior Floating Rate Interests (continued) | |||||||||||||||||
Telecommunication Services (continued) | ||||||||||||||||||
Global Tel*Link Corp., | ||||||||||||||||||
First Lien Term Loan, 5.70%, (3-month USD LIBOR + 4.25%), 11/29/25 | United States | 948,332 | $ | 831,436 | ||||||||||||||
Second Lien Term Loan, 9.70%, (3-month USD LIBOR + 8.25%), 11/29/26 | United States | 242,354 | 195,903 | |||||||||||||||
Zayo Group Holdings Inc (Front Range BidCo), Initial Dollar Term Loan, 3.404%, (1-month USD LIBOR + 3.00%), 3/09/27 | United States | 680,000 | 640,688 | |||||||||||||||
|
| |||||||||||||||||
| 2,453,197 | ||||||||||||||||||
|
| |||||||||||||||||
Transportation 0.1% | ||||||||||||||||||
Air Canada, Term Loans, 2.468%, (1-month USD LIBOR + 1.75%), 10/06/23 | Canada | 34,396 | 31,386 | |||||||||||||||
Allegiant Travel Co., Class B Term Loan, 4.707%, (3-month USD LIBOR + 3.00%), 2/05/24 | United States | 1,977,945 | 1,582,356 | |||||||||||||||
Avis Budget Car Rental LLC, Tranche B Term Loans, 2.66%, (1-month USD LIBOR + 2.25%), 8/06/27 | United States | 1,146,172 | 800,028 | |||||||||||||||
Westjet Airlines Ltd., Initial Term Loan, 4.00%, (1-month USD LIBOR + 3.00%), 12/11/26 | Canada | 2,783,143 | 2,284,960 | |||||||||||||||
|
| |||||||||||||||||
| 4,698,730 | ||||||||||||||||||
|
| |||||||||||||||||
Utilities 0.0%† | ||||||||||||||||||
EFS Cogen Holdings I LLC (Linden), Term B Advance, 6/28/23 | United States | 137,861 | 133,531 | |||||||||||||||
|
| |||||||||||||||||
Total Senior Floating Rate Interests (Cost $114,948,300) | 103,709,384 | |||||||||||||||||
|
| |||||||||||||||||
| q | Marketplace Loans 0.9% | |||||||||||||||||
Diversified Financials 0.9% | ||||||||||||||||||
| b | Lending Club, 6.00% - 28.80%, 15.554%, 8/25/23, 9/19/21 - 12/31/24 | United States | 24,302,556 | 21,260,351 | ||||||||||||||
| b | Lending Club LCX, 6.46% - 23.05%, 14.617%, 1/08/24, 4/23/22 - 2/14/25 | United States | 4,463,898 | 3,950,046 | ||||||||||||||
| b | Upgrade, 13.64% - 30.51%, 25.414%, 7/25/23, 9/05/22 - 1/25/25 | United States | 3,504,705 | 3,200,276 | ||||||||||||||
|
| |||||||||||||||||
Total Marketplace Loans (Cost $32,025,663) | 28,410,673 | |||||||||||||||||
|
| |||||||||||||||||
Foreign Government and Agency Securities 4.9% | ||||||||||||||||||
| e | Angolan Government International Bond, senior note, 144A, 8.25%, 5/09/28 | Angola | 8,900,000 | 3,960,669 | ||||||||||||||
| f | Banque Centrale de Tunisie International Bond, senior note, Reg S, 5.625%, 2/17/24 | Tunisia | 8,700,000 | EUR | 7,939,885 | |||||||||||||
| e | Banque Ouest Africaine de Developpement, senior note, 144A, 5.00%, 7/27/27 | Supranational | r | 3,900,000 | 3,641,937 | |||||||||||||
| e | Dominican Republic, senior note, 144A, 8.90%, 2/15/23 | Dominican Republic | 331,200,000 | DOP | 5,410,844 | |||||||||||||
| e | The Export-Import Bank of China, senior note, 144A, 3.625%, 7/31/24 | China | 2,100,000 | 2,263,507 | ||||||||||||||
| e | The Export-Import Bank of India, senior note, 144A, 3.875%, 2/01/28 | India | 3,400,000 | 3,375,785 | ||||||||||||||
The Export-Import Bank of Korea, senior note, 2.875%, 1/21/25 | South Korea | 2,000,000 | 2,118,150 | |||||||||||||||
| e | Government of Belarus International Bond, senior note, 144A, 7.625%, 6/29/27 | Belarus | 6,900,000 | 6,842,074 | ||||||||||||||
franklintempleton.com | Semiannual Report | 69 | ||||
FRANKLIN INVESTORS SECURITIES TRUST
STATEMENT OF INVESTMENTS (UNAUDITED)
Franklin Low Duration Total Return Fund (continued)
| | Country/ Organization | | | Principal Amount | * | Value | ||||||||||||
Foreign Government and Agency Securities (continued) |
| |||||||||||||||||
Government of Colombia, | ||||||||||||||||||
senior bond, 9.85%, 6/28/27 | Colombia | 21,735,000,000 | COP | $ | 6,291,133 | |||||||||||||
senior bond, 5.00%, 6/15/45 | Colombia | 7,000,000 | 7,052,500 | |||||||||||||||
| e | Government of Gabon, | |||||||||||||||||
144A, 6.375%, 12/12/24 | Gabon | 3,689,022 | 2,673,877 | |||||||||||||||
senior note, 144A, 6.625%, 2/06/31 | Gabon | 5,900,000 | 4,208,379 | |||||||||||||||
| e | Government of Indonesia, senior bond, 144A, 4.35%, 1/08/27 | Indonesia | 300,000 | 318,742 | ||||||||||||||
| e | Government of Kazakhstan, senior bond, 144A, 4.875%, 10/14/44 | Kazakhstan | 4,600,000 | 5,241,668 | ||||||||||||||
Government of Mexico, senior note, 4.15%, 3/28/27 | Mexico | 9,200,000 | 9,234,500 | |||||||||||||||
Government of Peru, senior bond, 6.55%, 3/14/37 | Peru | 2,600,000 | 3,746,886 | |||||||||||||||
| e | Government of Russia, senior note, 144A, 4.875%, 9/16/23 | Russia | 1,000,000 | 1,092,440 | ||||||||||||||
Government of South Africa, senior bond, 7.00%, 2/28/31 | South Africa | 126,400,000 | ZAR | 5,282,393 | ||||||||||||||
| e | Government of Ukraine, senior bond, 144A, 7.375%, 9/25/32 | Ukraine | 8,900,000 | 7,923,047 | ||||||||||||||
| s | Government of Uruguay, senior bond, Index Linked, 3.70%, 6/26/37 | Uruguay | 257,369,772 | UYU | 5,601,998 | |||||||||||||
| f | Italy Buoni Poliennali Del Tesoro, Reg S, senior note, 0.35%, 2/01/25 | Italy | 46,800,000 | EUR | 49,415,237 | |||||||||||||
The Korea Development Bank, senior note, 3.375%, 3/12/23 | South Korea | 7,100,000 | 7,527,633 | |||||||||||||||
Nota do Tesouro Nacional, 10.00%, 1/01/21 | Brazil | 2,350i | BRL | 451,778 | ||||||||||||||
|
| |||||||||||||||||
Total Foreign Government and Agency Securities (Cost $173,039,876) | 151,615,062 | |||||||||||||||||
|
| |||||||||||||||||
| U.S. Government and Agency Securities 6.9% | ||||||||||||||||||
U.S. Treasury Note, | ||||||||||||||||||
2.125%, 9/30/21 | United States | 10,000,000 | 10,274,024 | |||||||||||||||
s Index Linked, 0.625%, 4/15/23 | United States | 105,173,061 | 106,813,548 | |||||||||||||||
s Index Linked, 0.375%, 7/15/23 | United States | 11,114,502 | 11,288,274 | |||||||||||||||
s Index Linked, 0.25%, 1/15/25 | United States | 1,463,336 | 1,499,522 | |||||||||||||||
s Index Linked, 0.375%, 7/15/25 | United States | 1,308,849 | 1,360,393 | |||||||||||||||
s Index Linked, 0.625%, 1/15/26 | United States | 37,446,505 | 39,482,592 | |||||||||||||||
s Index Linked, 0.125%, 7/15/26 | United States | 35,933,021 | 37,105,384 | |||||||||||||||
s Index Linked, 0.375%, 7/15/27 | United States | 4,060,337 | 4,298,074 | |||||||||||||||
|
| |||||||||||||||||
Total U.S. Government and Agency Securities (Cost $210,971,330) | 212,121,811 | |||||||||||||||||
|
| |||||||||||||||||
Asset-Backed Securities and Commercial Mortgage-Backed Securities 45.8% | ||||||||||||||||||
Banks 0.7% | ||||||||||||||||||
| e,t | BX Commercial Mortgage Trust, | |||||||||||||||||
2018-IND, A, 144A, FRN, 1.564%, 11/15/35 | United States | 4,585,864 | 4,458,010 | |||||||||||||||
2019-XL, A, 144A, FRN, 1.734%, 10/15/36 | United States | 3,678,292 | 3,609,971 | |||||||||||||||
| e | BXP Trust, 2017-GM, A, 144A, 3.379%, 6/13/39 | United States | 2,000,000 | 2,160,890 | ||||||||||||||
| t | Commercial Mortgage Trust, | |||||||||||||||||
2006-GG7, AJ, FRN, 5.807%, 7/10/38 | United States | 1,908,000 | 1,163,880 | |||||||||||||||
2006-GG7, AM, FRN, 5.807%, 7/10/38 | United States | 100,729 | 100,343 | |||||||||||||||
| 70 |
Semiannual Report | franklintempleton.com | ||
FRANKLIN INVESTORS SECURITIES TRUST
STATEMENT OF INVESTMENTS (UNAUDITED)
Franklin Low Duration Total Return Fund (continued)
| Country/ Organization | | Principal Amount | * | Value | ||||||||||||
Asset-Backed Securities and Commercial Mortgage-Backed Securities (continued) | ||||||||||||||||
Banks (continued) | ||||||||||||||||
| u | CWABS Inc. Asset-Backed Certificates, 2004-1, M1, FRN, 1.237%, (1-month USD LIBOR + 0.75%), 3/25/34 | United States | 104,815 | $ | 103,128 | |||||||||||
| e,u | DBCG Mortgage Trust, 2017-BBG, A, 144A, FRN, 1.514%, (1-month USD LIBOR + 0.70%), 6/15/34 | United States | 1,500,000 | 1,432,649 | ||||||||||||
Freddie Mac Remics, 4402, PE, 3.50%, 3/15/43 | United States | 1,375,607 | 1,433,580 | |||||||||||||
| t | GE Capital Commercial Mortgage Corp. Trust, 2007-C1, AM, FRN, 5.606%, 12/10/49 | United States | 552,539 | 470,961 | ||||||||||||
| e | Government of Iraq, 144A, 5.80%, 1/15/28 | Iraq | 9,600,000 | 7,056,000 | ||||||||||||
| u | Merrill Lynch Mortgage Investors Trust, 2003-A, 1A, FRN, 1.227%, (1-month USD LIBOR + 0.74%), 3/25/28 | United States | 175,150 | 164,123 | ||||||||||||
|
| |||||||||||||||
| 22,153,535 | ||||||||||||||||
|
| |||||||||||||||
Diversified Financials 45.1% | ||||||||||||||||
| e,t | Adagio CLO VIII DAC, VIII-A, B1, 144A, FRN, 1.65%, 4/15/32 | Ireland | 500,000 | EUR | 509,765 | |||||||||||
| e,u | Alinea CLO Ltd., 2018-1A, B, 144A, FRN, 2.785%, (3-month USD LIBOR + 1.65%), 7/20/31 | United States | 5,300,000 | 4,976,975 | ||||||||||||
American Express Credit Account Master Trust, 2017-6, A, 2.04%, 5/15/23 | United States | 16,300,000 | 16,400,758 | |||||||||||||
| u | American Home Mortgage Investment Trust, | |||||||||||||||
2004-3, 4A, FRN, 3.033%, (6-month USD LIBOR + 1.50%), 10/25/34 | United States | 1,232,113 | 1,203,098 | |||||||||||||
2005-1, 6A, FRN, 2.973%, (6-month USD LIBOR + 2.00%), 6/25/45 | United States | 656,220 | 640,137 | |||||||||||||
| e | American Homes 4 Rent, 2015-SFR1, A, 144A, 3.467%, 4/17/52 | United States | 5,579,829 | 5,805,429 | ||||||||||||
| u | Ameriquest Mortgage Securities Inc. Asset-Backed Pass-Through Certificates, 2004-R4, M1, FRN, 1.312%, (1-month USD LIBOR + 0.825%), 6/25/34 | United States | 224,267 | 223,056 | ||||||||||||
| e,t | AMMC CLO 15 Ltd., | |||||||||||||||
2014-15A, ARR, 144A, FRN, 2.479%, 1/15/32 | United States | 4,700,000 | 4,453,133 | |||||||||||||
2014-15A, BRR, 144A, FRN, 3.019%, 1/15/32 | United States | 1,494,355 | 1,414,740 | |||||||||||||
| e,u | AMMC CLO 21 Ltd., 2017-21A, C, 144A, FRN, 3.863%, (3-month USD LIBOR + 2.10%), 11/02/30 | United States | 400,000 | 357,812 | ||||||||||||
| e,u | AMMC CLO XI Ltd., | |||||||||||||||
2012-11A, BR2, 144A, FRN, 2.36%, (3-month USD LIBOR + 1.60%), 4/30/31 | United States | 1,700,000 | 1,561,812 | |||||||||||||
2012-11A, CR2, 144A, FRN, 2.66%, (3-month USD LIBOR + 1.90%), 4/30/31 | United States | 1,850,000 | 1,621,017 | |||||||||||||
| e,u | Antares CLO Ltd., 2018-1A, B, 144A, FRN, 2.785%, (3-month USD LIBOR + 1.65%), 4/20/31 | United States | 6,000,000 | 5,593,904 | ||||||||||||
| e,u | ARES CLO Ltd., 2018-48A, B, 144A, FRN, 2.715%, (3-month USD LIBOR + 1.58%), 7/20/30 | United States | 1,000,000 | 934,657 | ||||||||||||
| e,t | Ares European CLO VIII BV, | |||||||||||||||
8A, AR, 144A, FRN, 0.92%, 4/17/32 | Netherlands | 2,600,000 | EUR | 2,735,314 | ||||||||||||
8A, BR, 144A, FRN, 1.60%, 4/17/32 | Netherlands | 700,000 | EUR | 711,546 | ||||||||||||
| e,t | ARES L CLO Ltd., 2018-50A, B, 144A, FRN, 2.919%, 1/15/32 | United States | 4,000,000 | 3,798,701 | ||||||||||||
| e,t | ARES LII CLO Ltd., 2019-52A, C, 144A, FRN, 3.778%, 4/22/31 | United States | 1,000,000 | 934,312 | ||||||||||||
| e,t | ARES XLIX CLO Ltd., 2018-49A, C, 144A, FRN, 3.048%, 7/22/30 | United States | 3,100,000 | 2,816,687 | ||||||||||||
| e,u | ARES XLVIII CLO Ltd., 2018-48A, C, 144A, FRN, 2.935%, (3-month USD LIBOR + 1.80%), 7/20/30 | United States | 3,135,000 | 2,841,864 | ||||||||||||
franklintempleton.com | Semiannual Report | 71 | ||||
FRANKLIN INVESTORS SECURITIES TRUST
STATEMENT OF INVESTMENTS (UNAUDITED)
Franklin Low Duration Total Return Fund (continued)
| Country/ Organization | | Principal Amount | * | Value | ||||||||||||
Asset-Backed Securities and Commercial Mortgage-Backed Securities (continued) | ||||||||||||||||
Diversified Financials (continued) | ||||||||||||||||
| u | Argent Securities Inc. Asset-Backed Pass-Through Certificates, 2005-W2, A2C, FRN, 0.847%, (1-month USD LIBOR + 0.36%), 10/25/35 | United States | 259,564 | $ | 259,160 | |||||||||||
| e,t | Armada Euro CLO IV DAC, 4A, B, 144A, FRN, 1.70%, 7/15/33 | Ireland | 12,400,000 | EUR | 12,396,097 | |||||||||||
| e,u | Atrium XIII, | |||||||||||||||
2013A, B, 144A, FRN, 2.543%, (3-month USD LIBOR + 1.50%), 11/21/30 | United States | 3,000,000 | 2,816,523 | |||||||||||||
2013A, C, 144A, FRN, 2.843%, (3-month USD LIBOR + 1.80%), 11/21/30 | United States | 1,600,000 | 1,431,119 | |||||||||||||
| e,t | Atrium XIV LLC, | |||||||||||||||
14A, B, 144A, FRN, 2.876%, 8/23/30 | United States | 2,400,000 | 2,256,010 | |||||||||||||
14A, C, 144A, FRN, 3.126%, 8/23/30 | United States | 4,000,000 | 3,618,965 | |||||||||||||
| e,t | Atrium XV, 15A, B, 144A, FRN, 2.793%, 1/23/31 | United States | 2,000,000 | 1,898,397 | ||||||||||||
| e,t | Avoca CLO XVII Designated Activity Co., 17A, B1R, 144A, FRN, 1.70%, 10/15/32 | Ireland | 1,200,000 | EUR | 1,246,434 | |||||||||||
| e,u | Bain Capital Credit CLO, 2018-1A, A1, 144A, FRN, 2.003%, (3-month USD LIBOR + 0.96%), 4/23/31 | United States | 2,000,000 | 1,908,724 | ||||||||||||
| e | BAMLL Commercial Mortgage Securities Trust, | |||||||||||||||
2012-PARK, A, 144A, 2.959%, 12/10/30 | United States | 3,300,000 | 3,431,368 | |||||||||||||
2015-200P, A, 144A, 3.218%, 4/14/33 | United States | 600,000 | 628,737 | |||||||||||||
Banc of America Commercial Mortgage Trust, 2015-UBS7, A4, 3.705%, 9/15/48 | United States | 100,000 | 109,110 | |||||||||||||
| e,t | BCC Middle Market CLO LLC, 2018-1A, A2, 144A, FRN, 3.285%, 10/20/30 | United States | 2,100,000 | 1,925,777 | ||||||||||||
| e,u | Bellemeade Re Ltd., 2018-1A, M1B, 144A, FRN, 2.087%, (1-month USD LIBOR + 1.60%), 4/25/28 | United States | 3,994,363 | 3,891,351 | ||||||||||||
| e,u | Betony CLO 2 Ltd., 2018-1A, A2, 144A, FRN, 2.36%, (3-month USD LIBOR + 1.60%), 4/30/31 | United States | 3,500,000 | 3,271,845 | ||||||||||||
| e,t | Blackrock European CLO IX DAC, | |||||||||||||||
9A, A, 144A, FRN, 0.90%, 12/15/32 | Ireland | 3,300,000 | EUR | 3,465,951 | ||||||||||||
9A, B, 144A, FRN, 1.55%, 12/15/32 | Ireland | 1,100,000 | EUR | 1,108,881 | ||||||||||||
| e,t | BlueMountain CLO Ltd., | |||||||||||||||
2012-2A, BR2, 144A, FRN, 3.145%, 11/20/28 | United States | 2,970,000 | 2,827,757 | |||||||||||||
2012-2A, DR2, 144A, FRN, 4.595%, 11/20/28 | United States | 2,000,000 | 1,598,441 | |||||||||||||
2014-2A, CR2, 144A, FRN, 3.335%, 10/20/30 | United States | 1,000,000 | 901,397 | |||||||||||||
2018-3A, B, 144A, FRN, 2.761%, 10/25/30 | United States | 4,000,000 | 3,748,635 | |||||||||||||
2018-3A, C, 144A, FRN, 3.191%, 10/25/30 | United States | 1,785,715 | 1,619,891 | |||||||||||||
| e,t | BlueMountain CLO XXIV Ltd., | |||||||||||||||
2019-24A, A2, 144A, FRN, 2.735%, 4/20/31 | United States | 6,250,000 | 6,111,742 | |||||||||||||
2019-24A, C, 144A, FRN, 3.835%, 4/20/31 | United States | 1,750,000 | 1,655,568 | |||||||||||||
2019-24A, D, 144A, FRN, 5.035%, 4/20/31 | United States | 1,000,000 | 855,425 | |||||||||||||
| e,t | Bluemountain Fuji Eur CLO V DAC, | |||||||||||||||
5A, A, 144A, FRN, 0.91%, 1/15/33 | Ireland | 14,800,000 | EUR | 15,531,341 | ||||||||||||
5A, B, 144A, FRN, 1.55%, 1/15/33 | Ireland | 4,550,000 | EUR | 4,617,299 | ||||||||||||
| 72 |
Semiannual Report | franklintempleton.com | ||
FRANKLIN INVESTORS SECURITIES TRUST
STATEMENT OF INVESTMENTS (UNAUDITED)
Franklin Low Duration Total Return Fund (continued)
| Country/ Organization | | Principal Amount | * | Value | ||||||||||||
Asset-Backed Securities and Commercial Mortgage-Backed Securities (continued) | ||||||||||||||||
Diversified Financials (continued) | ||||||||||||||||
| e,u | BlueMountain Fuji U.S. CLO III Ltd., | |||||||||||||||
2017-3A, A2, 144A, FRN, 2.369%, (3-month USD LIBOR + 1.15%), 1/15/30 | United States | 1,000,000 | $ | 954,832 | ||||||||||||
2017-3A, C, 144A, FRN, 2.919%, (3-month USD LIBOR + 1.70%), 1/15/30 | United States | 500,000 | 443,152 | |||||||||||||
| e | BRAVO Residential Funding Trust, | |||||||||||||||
2019-1, A1C, 144A, 3.50%, 3/25/58 | United States | 6,769,877 | 6,859,582 | |||||||||||||
t 2019-2, A3, 144A, FRN, 3.50%, 10/25/44 | United States | 9,248,516 | 9,450,734 | |||||||||||||
| e,t | Burnham Park CLO Ltd., 2016-1A, BR, 144A, FRN, 2.635%, 10/20/29 | United States | 5,321,575 | 5,090,040 | ||||||||||||
| e,t | BX Commercial Mortgage Trust, 2020-BXLP, A, 144A, FRN., 1.614%, 12/15/36 | United States | 11,550,000 | 11,183,231 | ||||||||||||
Capital One Multi-Asset Execution Trust, 2017-A4, A4, 1.99%, 7/17/23 | United States | 14,230,000 | 14,295,617 | |||||||||||||
| e,t | Carlyle Euro CLO DAC, 2019-2A, A2A, 144A, FRN, 1.80%, 8/15/32 | Ireland | 2,700,000 | EUR | 2,768,866 | |||||||||||
| e,u | Carlyle Global Market Strategies CLO Ltd., | |||||||||||||||
2014-1A, A2R2, 144A, FRN, 2.265%, (3-month USD LIBOR + 1.13%), 4/17/31 | United States | 1,200,000 | 1,103,514 | |||||||||||||
2014-4RA, A2, 144A, FRN, 2.819%, (3-month USD LIBOR + 1.60%), 7/15/30 | United States | 12,000,000 | 11,024,258 | |||||||||||||
| e,t | Carlyle GMS Finance MM CLO LLC, 2015-1A, A2R, 144A, FRN, 3.419%, 10/15/31 | United States | 7,300,000 | 6,640,895 | ||||||||||||
| e,u | Carlyle U.S. CLO Ltd., | |||||||||||||||
2017-3A, B, 144A, FRN, 3.485%, (3-month USD LIBOR + 2.35%), 7/20/29 | United States | 1,250,000 | 1,100,400 | |||||||||||||
2017-4A, B, 144A, FRN, 3.069%, (3-month USD LIBOR + 1.85%), 1/15/30 | United States | 1,107,000 | 980,278 | |||||||||||||
2017-4A, C, 144A, FRN, 4.019%, (3-month USD LIBOR + 2.80%), 1/15/30 | United States | 400,000 | 294,437 | |||||||||||||
2017-5A, B, 144A, FRN, 2.935%, (3-month USD LIBOR + 1.80%), 1/20/30 | United States | 2,200,000 | 1,937,316 | |||||||||||||
| e,u | Catamaran CLO Ltd., 2014-2A, BR, 144A, FRN, 4.085%, (3-month USD LIBOR + 2.95%), 10/18/26 | United States | 3,011,300 | 2,938,098 | ||||||||||||
| e,t | CIM Trust, | |||||||||||||||
2018-INV1, A4, 144A, FRN, 4.00%, 8/25/48 | United States | 6,749,999 | 6,976,336 | |||||||||||||
2019-INV1, A1, 144A, FRN, 4.00%, 2/25/49 | United States | 1,144,756 | 1,165,350 | |||||||||||||
2019-INV2, A3, 144A, FRN, 4.00%, 5/25/49 | United States | 10,498,080 | 10,750,958 | |||||||||||||
Citibank Credit Card Issuance Trust, 2018-A1, A1, 2.49%, 1/20/23 | United States | 13,700,000 | 13,872,902 | |||||||||||||
| e,t | Cole Park CLO Ltd., 2015-1A, BR, 144A, FRN, 2.735%, 10/20/28 | United States | 2,571,429 | 2,474,582 | ||||||||||||
| e,t | Columbia Cent CLO 27 Ltd., 2018-27A, A2A, 144A, FRN, 2.591%, 10/25/28 | United States | 2,307,693 | 2,188,636 | ||||||||||||
| e | COMM Mortgage Trust, | |||||||||||||||
t 2014-277P, A, 144A, FRN, 3.732%, 8/10/49 | United States | 3,880,000 | 4,111,005 | |||||||||||||
2015-3BP, A, 144A, 3.178%, 2/10/35 | United States | 600,000 | 626,375 | |||||||||||||
franklintempleton.com | Semiannual Report | 73 | ||||
FRANKLIN INVESTORS SECURITIES TRUST
STATEMENT OF INVESTMENTS (UNAUDITED)
Franklin Low Duration Total Return Fund (continued)
| Country/ Organization | | Principal Amount | * | Value | ||||||||||||
Asset-Backed Securities and Commercial Mortgage-Backed Securities (continued) | ||||||||||||||||
Diversified Financials (continued) | ||||||||||||||||
| t | Conseco Finance Securitizations Corp., 2002-2, M1, FRN, 7.424%, 3/01/33 | United States | 557,584 | $ | 578,278 | |||||||||||
| t | Conseco Financial Corp., 1998-6, A8, FRN, 6.66%, 6/01/30 | United States | 1,913,742 | 1,942,892 | ||||||||||||
| e,t | Consumer Loan Underlying Bond CLUB Certificate Issuer Trust I, | |||||||||||||||
2020-7, PT, 144A, FRN, 14.159%, 4/17/45 | United States | 3,195,486 | 2,754,682 | |||||||||||||
2018-14, PT, 144A, FRN, 9.461%, 9/16/41 | United States | 1,567,978 | 1,421,213 | |||||||||||||
2018-29, PT, 144A, FRN, 28.366%, 12/15/43 | United States | 520,798 | 384,773 | |||||||||||||
2018-8, 144A, FRN, 8.662%, 6/17/41 | United States | 1,072,240 | 964,615 | |||||||||||||
2019-26, PT, 144A, FRN, 19.324%, 8/15/44 | United States | 2,037,986 | 1,620,721 | |||||||||||||
2019-31, PT, 144A, FRN, 22.58%, 9/15/44 | United States | 1,871,241 | 1,480,499 | |||||||||||||
2019-37, PT, 144A, FRN, 21.925%, 10/17/44 | United States | 1,791,790 | 1,457,529 | |||||||||||||
2019-42, PT, 144A, FRN, 20.897%, 11/15/44 | United States | 1,734,474 | 1,385,346 | |||||||||||||
2019-51, PT, 144A, FRN, 17.718%, 1/15/45 | United States | 4,483,077 | 3,744,944 | |||||||||||||
2019-52, PT, 144A, FRN, 17.151%, 1/15/45 | United States | 5,407,411 | 4,577,567 | |||||||||||||
2019-S1, PT, 144A, FRN, 16.345%, 4/15/44 | United States | 1,450,594 | 1,142,120 | |||||||||||||
2019-S2, PT, 144A, FRN, 13.40%, 5/16/44 | United States | 1,108,916 | 878,482 | |||||||||||||
2019-S3, PT, 144A, FRN, 14.312%, 6/15/44 | United States | 712,727 | 557,373 | |||||||||||||
2019-S4, PT, 144A, FRN, 13.259%, 8/15/44 | United States | 1,558,111 | 1,241,119 | |||||||||||||
2019-S5, PT, 144A, FRN, 18.85%, 9/15/44 | United States | 1,498,975 | 1,209,087 | |||||||||||||
2019-S6, PT, 144A, FRN, 12.849%, 10/17/44 | United States | 1,430,892 | 1,158,151 | |||||||||||||
2019-S7, PT, 144A, FRN, 11.521%, 12/15/44 | United States | 2,762,771 | 2,234,211 | |||||||||||||
2019-S8, PT, 144A, FRN, 11.622%, 1/15/45 | United States | 3,380,929 | 2,754,589 | |||||||||||||
2020-2, PT, 144A, FRN, 15.85%, 3/15/45 | United States | 5,183,456 | 4,416,115 | |||||||||||||
| e,u | Cook Park CLO Ltd., 2018-1A, A2, 144A, FRN, 2.255%, (3-month USD LIBOR + 1.12%), 4/17/30 | United States | 1,000,000 | 929,743 | ||||||||||||
| u | Countrywide Asset-Backed Certificates, 2002-3, 1A1, FRN, 1.227%, (1-month USD LIBOR + 0.74%), 5/25/32 | United States | 1,203 | 1,161 | ||||||||||||
| t | Countrywide Home Loans, 2004-11, 2A1, FRN, 3.72%, 7/25/34 | United States | 1,116,555 | 1,041,742 | ||||||||||||
Credit Suisse First Boston Mortgage Securities Corp., 2004-6, 3A1, 5.00%, 5/25/26 | United States | 162,896 | 134,050 | |||||||||||||
| e,t | CSMC Trust, 2014-IVR3, A1, 144A, FRN, 3.50%, 7/25/44 | United States | 1,432,399 | 1,459,877 | ||||||||||||
Discover Card Execution Note Trust, | ||||||||||||||||
2018-A4, A4, 3.11%, 1/16/24 | United States | 8,230,000 | 8,476,080 | |||||||||||||
t 2019-A2, A, FRN, 1.084%, 12/15/23 | United States | 9,250,000 | 9,228,393 | |||||||||||||
2019-A3, A, 1.89%, 10/15/24 | United States | 13,340,000 | 13,682,303 | |||||||||||||
| e,u | Dorchester Park CLO Ltd., 2015-1A, CR, 144A, FRN, 2.885%, (3-month USD LIBOR + 1.75%), 4/20/28 | United States | 1,350,000 | 1,256,101 | ||||||||||||
| e,t | Dryden 38 Senior Loan Fund, 2015-38A, CR, 144A, FRN, 3.219%, 7/15/30 | United States | 2,500,000 | 2,251,936 | ||||||||||||
| e,t | Dryden 45 Senior Loan Fund, 2016-45A, CR, 144A, FRN, 3.419%, 10/15/30 | United States | 1,875,000 | 1,683,278 | ||||||||||||
| e,u | Dryden 50 Senior Loan Fund, 2017-50A, A1, 144A, FRN, 2.439%, (3-month USD LIBOR + 1.22%), 7/15/30 | United States | 2,640,000 | 2,571,701 | ||||||||||||
| 74 |
Semiannual Report | franklintempleton.com | ||
FRANKLIN INVESTORS SECURITIES TRUST
STATEMENT OF INVESTMENTS (UNAUDITED)
Franklin Low Duration Total Return Fund (continued)
| | Country/ Organization |
| | Principal Amount | * | Value | ||||||||||||
Asset-Backed Securities and Commercial Mortgage-Backed Securities (continued) | ||||||||||||||||||
Diversified Financials (continued) | ||||||||||||||||||
| e,u | Dryden 55 CLO Ltd., | |||||||||||||||||
2018-55A, C, 144A, FRN, 3.119%, (3-month USD LIBOR + 1.90%), 4/15/31 | United States | 600,000 | $ | 536,536 | ||||||||||||||
2018-55A, D, 144A, FRN, 4.069%, (3-month USD LIBOR + 2.85%), 4/15/31 | United States | 300,000 | 237,113 | |||||||||||||||
| e,u | Dryden 58 CLO Ltd., | |||||||||||||||||
2018-58A, A2, 144A, FRN, 2.385%, (3-month USD LIBOR + 1.25%), 7/17/31 | United States | 1,600,000 | 1,493,011 | |||||||||||||||
2018-58A, B, 144A, FRN, 2.635%, (3-month USD LIBOR + 1.50%), 7/17/31 | United States | 11,000,000 | 10,223,887 | |||||||||||||||
| e,u | Dryden 64 CLO Ltd., 2018-64A, C, 144A, FRN, 2.885%, (3-month USD LIBOR + 1.75%), 4/18/31 | United States | 750,000 | 662,054 | ||||||||||||||
| e,t | Dryden 70 CLO Ltd., 2018-70A, B, 144A, FRN, 2.876%, 1/16/32 | United States | 560,580 | 529,336 | ||||||||||||||
| e,t | Dunedin Park CLO DAC, | |||||||||||||||||
1A, A1, 144A, FRN, 1.07%, 10/22/32 | Ireland | 9,800,000 | EUR | 10,416,989 | ||||||||||||||
1A, A2A, 144A, FRN, 1.75%, 10/22/32 | Ireland | 4,700,000 | EUR | 4,833,832 | ||||||||||||||
| e,t | Eaton Vance CLO Ltd., 2014-1RA, C, 144A, FRN, 3.319%, 7/15/30 | United States | 789,030 | 735,526 | ||||||||||||||
| e,t | Eleven Madison Trust Mortgage Trust, 2015-11MD, A, 144A, FRN, 3.673%, 9/10/35 | United States | 2,005,000 | 2,127,609 | ||||||||||||||
| e,u | Ellington CLO III Ltd., 2018-3A, A1, 144A, FRN, 2.785%, (3-month USD LIBOR + 1.65%), 7/20/30 | United States | 3,900,000 | 3,749,944 | ||||||||||||||
| e,t | Euro-Galaxy III CLO BV, 2013-3A, B2ER, 144A, FRN, 1.50%, 1/17/31 | Netherlands | 2,050,000 | EUR | 2,174,585 | |||||||||||||
| e,t | Euro-Galaxy V CLO BV, 2016-5A, BR, 144A, FRN, 1.60%, 11/10/30 | Netherlands | 7,400,000 | EUR | 7,731,657 | |||||||||||||
FHLMC Structured Agency Credit Risk Debt Notes, | ||||||||||||||||||
u 2013-DN2, M2, FRN, 4.737%, (1-month USD LIBOR + 4.25%), 11/25/23 | United States | 8,004,436 | 6,935,942 | |||||||||||||||
u 2014-DN1, M2, FRN, 2.687%, (1-month USD LIBOR + 2.20%), 2/25/24 | United States | 808,013 | 774,969 | |||||||||||||||
u 2014-DN2, M3, FRN, 4.087%, (1-month USD LIBOR + 3.60%), 4/25/24 | United States | 16,995,000 | 11,658,961 | |||||||||||||||
u 2014-DN3, M3, FRN, 4.487%, (1-month USD LIBOR + 4.00%), 8/25/24 | United States | 3,260,995 | 2,652,379 | |||||||||||||||
u 2014-DN4, M3, FRN, 5.037%, (1-month USD LIBOR + 4.55%), 10/25/24 | United States | 7,541,159 | 6,366,205 | |||||||||||||||
u 2014-HQ1, M3, FRN, 4.587%, (1-month USD LIBOR + 4.10%), 8/25/24 | United States | 9,046,019 | 7,805,833 | |||||||||||||||
u 2014-HQ2, M2, FRN, 2.687%, (1-month USD LIBOR + 2.20%), 9/25/24 | United States | 203,002 | 193,050 | |||||||||||||||
u 2014-HQ2, M3, FRN, 4.237%, (1-month USD LIBOR + 3.75%), 9/25/24 | United States | 14,560,000 | 11,608,695 | |||||||||||||||
u 2014-HQ3, M3, FRN, 5.237%, (1-month USD LIBOR + 4.75%), 10/25/24 | United States | 2,801,292 | 2,463,554 | |||||||||||||||
u 2015-DN1, M3, FRN, 4.637%, (1-month USD LIBOR + 4.15%), 1/25/25 | United States | 10,153,695 | 8,809,268 | |||||||||||||||
u 2015-DNA1, M2, FRN, 2.337%, (1-month USD LIBOR + 1.85%), 10/25/27 | United States | 3,531,185 | 3,519,867 | |||||||||||||||
u 2015-DNA1, M3, FRN, 3.787%, (1-month USD LIBOR + 3.30%), 10/25/27 | United States | 6,500,000 | 6,510,013 | |||||||||||||||
franklintempleton.com | Semiannual Report | 75 | ||||
FRANKLIN INVESTORS SECURITIES TRUST
STATEMENT OF INVESTMENTS (UNAUDITED)
Franklin Low Duration Total Return Fund (continued)
| Country/ Organization | | Principal Amount | * | Value | ||||||||||||
Asset-Backed Securities and Commercial Mortgage-Backed Securities (continued) | ||||||||||||||||
Diversified Financials (continued) | ||||||||||||||||
| FHLMC Structured Agency Credit Risk Debt Notes, (continued) | ||||||||||||||||
u 2015-DNA2, M3, FRN, 4.387%, (1-month USD LIBOR + 3.90%), 12/25/27 | United States | 17,341,398 | $ | 17,290,623 | ||||||||||||
u 2015-DNA3, M2, FRN, 3.337%, (1-month USD LIBOR + 2.85%), 4/25/28 | United States | 1,707,344 | 1,679,486 | |||||||||||||
u 2015-DNA3, M3, FRN, 5.187%, (1-month USD LIBOR + 4.70%), 4/25/28 | United States | 9,470,000 | 9,589,046 | |||||||||||||
u 2015-HQ1, M3, FRN, 4.287%, (1-month USD LIBOR + 3.80%), 3/25/25 | United States | 7,467,991 | 6,876,763 | |||||||||||||
u 2015-HQ2, M3, FRN, 3.737%, (1-month USD LIBOR + 3.25%), 5/25/25 | United States | 8,360,000 | 6,912,476 | |||||||||||||
u 2015-HQA1, M3, FRN, 5.187%, (1-month USD LIBOR + 4.70%), 3/25/28 | United States | 17,271,729 | 17,311,882 | |||||||||||||
u 2015-HQA2, M2, FRN, 3.287%, (1-month USD LIBOR + 2.80%), 5/25/28 | United States | 756,493 | 751,778 | |||||||||||||
u 2015-HQA2, M3, FRN, 5.287%, (1-month USD LIBOR + 4.80%), 5/25/28 | United States | 2,000,000 | 2,007,642 | |||||||||||||
u 2016-DNA1, M2, FRN, 3.387%, (1-month USD LIBOR + 2.90%), 7/25/28 | United States | 9,273 | 9,248 | |||||||||||||
u 2016-DNA1, M3, FRN, 6.037%, (1-month USD LIBOR + 5.55%), 7/25/28 | United States | 25,160,000 | 25,571,255 | |||||||||||||
u 2016-DNA2, M3, FRN, 5.137%, (1-month USD LIBOR + 4.65%), 10/25/28 | United States | 15,188,925 | 15,126,784 | |||||||||||||
u 2016-HQA2, M2, FRN, 2.737%, (1-month USD LIBOR + 2.25%), 11/25/28 | United States | 166,945 | 166,898 | |||||||||||||
u 2016-HQA2, M3, FRN, 5.637%, (1-month USD LIBOR + 5.15%), 11/25/28 | United States | 11,640,000 | 11,780,520 | |||||||||||||
u 2016-HQA3, M2, FRN, 1.837%, (1-month USD LIBOR + 1.35%), 3/25/29 | United States | 1,019,454 | 1,012,501 | |||||||||||||
u 2016-HQA4, M2, FRN, 1.787%, (1-month USD LIBOR + 1.30%), 4/25/29 | United States | 244,649 | 243,990 | |||||||||||||
t 2017-DNA1, M2, FRN, 3.737%, 7/25/29 | United States | 2,900,000 | 2,798,614 | |||||||||||||
t 2017-DNA2, M2, FRN, 3.937%, 10/25/29 | United States | 16,080,000 | 15,637,083 | |||||||||||||
u 2017-DNA3, M2, FRN, 2.987%, (1-month USD LIBOR + 2.50%), 3/25/30 | United States | 10,350,000 | 9,866,459 | |||||||||||||
t 2017-HQA1, M2, FRN, 4.037%, 8/25/29 | United States | 22,613,313 | 21,095,004 | |||||||||||||
t 2017-HQA3, M2, FRN, 2.837%, 4/25/30 | United States | 209,723 | 185,427 | |||||||||||||
| e,t | Flagship CLO VIII Ltd, 2014-8A, BRR, 144A, FRN, 2.576%, 1/16/26 | United States | 1,760,000 | 1,689,056 | ||||||||||||
| e,u | Flagship CLO VIII Ltd., | |||||||||||||||
2014-8A, ARR, 144A, FRN, 2.026%, (3-month USD LIBOR + 0.85%), 1/16/26 | United States | 2,617,206 | 2,601,114 | |||||||||||||
2014-8A, CRR, 144A, FRN, 2.976%, (3-month USD LIBOR + 1.80%), 1/16/26 | United States | 1,400,000 | 1,322,441 | |||||||||||||
76 | Semiannual Report | franklintempleton.com | ||
FRANKLIN INVESTORS SECURITIES TRUST
STATEMENT OF INVESTMENTS (UNAUDITED)
Franklin Low Duration Total Return Fund (continued)
| Country/ Organization | | Principal Amount | * | Value | ||||||||||||
Asset-Backed Securities and Commercial Mortgage-Backed Securities (continued) | ||||||||||||||||
Diversified Financials (continued) | ||||||||||||||||
| e,t | Flagstar Mortgage Trust, 2018-6RR, 1A3, 144A, FRN, 4.00%, 10/25/48 | United States | 5,253,972 | $ | 5,306,146 | |||||||||||
FNMA Connecticut Avenue Securities, | ||||||||||||||||
u 2013-C01, M2, FRN, 5.737%, (1-month USD LIBOR + 5.25%), 10/25/23 | United States | 18,008,316 | 15,601,171 | |||||||||||||
u 2014-C01, M2, FRN, 4.887%, (1-month USD LIBOR + 4.40%), 1/25/24 | United States | 2,973,756 | 2,395,013 | |||||||||||||
u 2014-C02, 1M2, FRN, 3.087%, (1-month USD LIBOR + 2.60%), 5/25/24 | United States | 13,505,757 | 10,330,882 | |||||||||||||
b,u 2014-C02, 2M2, FRN, 3.087%, (1-month USD LIBOR + 2.60%), 5/25/24 | United States | 3,205,083 | 2,573,542 | |||||||||||||
u 2014-C03, 1M2, FRN, 3.487%, (1-month USD LIBOR + 3.00%), 7/25/24 | United States | 21,881,421 | 17,080,110 | |||||||||||||
u 2014-C03, 2M2, FRN, 3.387%, (1-month USD LIBOR + 2.90%), 7/25/24 | United States | 18,315,027 | 14,408,870 | |||||||||||||
u 2014-C04, 1M1, FRN, 5.387%, (1-month USD LIBOR + 4.90%), 11/25/24 | United States | 12,378,072 | 9,963,639 | |||||||||||||
u 2014-C04, 2M2, FRN, 5.487%, (1-month USD LIBOR + 5.00%), 11/25/24 | United States | 4,697,712 | 4,186,398 | |||||||||||||
u 2015-C01, 1M2, FRN, 4.787%, (1-month USD LIBOR + 4.30%), 2/25/25 | United States | 9,511,904 | 7,721,778 | |||||||||||||
u 2015-C01, 2M2, FRN, 5.037%, (1-month USD LIBOR + 4.55%), 2/25/25 | United States | 4,217,293 | 3,711,334 | |||||||||||||
u 2015-C02, 1M2, FRN, 4.487%, (1-month USD LIBOR + 4.00%), 5/25/25 | United States | 10,494,686 | 8,712,214 | |||||||||||||
u 2015-C02, 2M2, FRN, 4.487%, (1-month USD LIBOR + 4.00%), 5/25/25 | United States | 5,480,995 | 4,784,930 | |||||||||||||
u 2015-C03, 1M2, FRN, 5.487%, (1-month USD LIBOR + 5.00%), 7/25/25 | United States | 11,437,441 | 8,636,463 | |||||||||||||
b,u 2015-C03, 2M2, FRN, 5.487%, (1-month USD LIBOR + 5.00%), 7/25/25 | United States | 5,622,490 | 4,376,883 | |||||||||||||
u 2016-C01, 1M2, FRN, 7.237%, (1-month USD LIBOR + 6.75%), 8/25/28 | United States | 1,912,514 | 1,980,637 | |||||||||||||
t 2016-C01, 2M2, FRN, 7.437%, 8/25/28 | United States | 6,420,293 | 6,676,965 | |||||||||||||
t 2016-C02, 1M2, FRN, 6.487%, 9/25/28 | United States | 184,361 | 189,401 | |||||||||||||
t 2016-C04, 1M2, FRN, 4.737%, 1/25/29 | United States | 15,658,582 | 15,538,116 | |||||||||||||
t 2016-C05, 2M2, FRN, 4.937%, 1/25/29 | United States | 13,153,454 | 13,041,414 | |||||||||||||
t 2016-C06, 1M2, FRN, 4.737%, 4/25/29 | United States | 4,720,000 | 4,660,002 | |||||||||||||
t 2016-C07, 2M2, FRN, 4.837%, 5/25/29 | United States | 10,091,624 | 9,996,818 | |||||||||||||
u 2017-C01, 1B1, FRN, 6.237%, (1-month USD LIBOR + 5.75%), 7/25/29 | United States | 33,000 | 28,015 | |||||||||||||
u 2017-C01, 1M2, FRN, 4.037%, (1-month USD LIBOR + 3.55%), 7/25/29 | United States | 20,533,391 | 19,914,279 | |||||||||||||
t 2017-C02, 2M2, FRN, 4.137%, 9/25/29 | United States | 3,021,591 | 2,889,398 | |||||||||||||
t 2017-C03, 1M2, FRN, 3.487%, 10/25/29 | United States | 2,780,000 | 2,664,701 | |||||||||||||
t 2017-C03, 2M2, FRN, 3.337%, 11/25/29 | United States | 570,000 | 528,941 | |||||||||||||
t 2017-C06, 1M2, FRN, 3.137%, 2/25/30 | United States | 12,456,749 | 11,437,910 | |||||||||||||
t 2017-C07, 1M1, FRN, 1.137%, 5/25/30 | United States | 21,432 | 21,417 | |||||||||||||
franklintempleton.com | Semiannual Report | 77 | ||||
FRANKLIN INVESTORS SECURITIES TRUST
STATEMENT OF INVESTMENTS (UNAUDITED)
Franklin Low Duration Total Return Fund (continued)
| Country/ Organization | | Principal Amount | * | Value | ||||||||||||
Asset-Backed Securities and Commercial Mortgage-Backed Securities (continued) | ||||||||||||||||
Diversified Financials (continued) | ||||||||||||||||
| e,t | Galaxy XVIII CLO Ltd., 2018-28A, A2, 144A, FRN, 2.289%, 7/15/31 | United States | 6,500,000 | $ | 6,265,584 | |||||||||||
| e,t | Galaxy XXV CLO Ltd., 2018-25A, B, 144A, FRN, 2.641%, 10/25/31 | United States | 2,000,000 | 1,876,669 | ||||||||||||
| e,t | Galaxy XXVI CLO Ltd., 2018-26A, B, 144A, FRN, 3.383%, 11/22/31 | United States | 2,100,000 | 1,997,959 | ||||||||||||
| e,u | Galaxy XXVII CLO Ltd., 2018-27A, A, 144A, FRN, 2.712%, (3-month USD LIBOR + 1.02%), 5/16/31 | United States | 1,500,000 | 1,428,884 | ||||||||||||
| e,u | Gilbert Park CLO Ltd., 2017-1A, B, 144A, FRN, 2.819%, (3-month USD LIBOR + 1.60%), 10/15/30 | United States | 3,000,000 | 2,861,250 | ||||||||||||
| t | Greenpoint Manufactured Housing, 1999-5, M1A, FRN, 8.30%, 10/15/26 | United States | 279,609 | 287,316 | ||||||||||||
GS Mortgage Securities Trust, | ||||||||||||||||
2016-GS3, A4, 2.85%, 10/10/49 | United States | 600,000 | 617,080 | |||||||||||||
2017-GS6, A3, 3.433%, 5/10/50 | United States | 2,000,000 | 2,093,524 | |||||||||||||
| u | GSAA Home Equity Trust, | |||||||||||||||
2005-5, M3, FRN, 1.432%, (1-month USD LIBOR + 0.945%), 2/25/35 | United States | 1,292,579 | 1,300,436 | |||||||||||||
2005-6, A3, FRN, 0.857%, (1-month USD LIBOR + 0.37%), 6/25/35 | United States | 17,597 | 17,600 | |||||||||||||
| t | GSR Mortgage Loan Trust, 2005-AR1, 1A1, FRN, 4.311%, 1/25/35 | United States | 201,194 | 182,650 | ||||||||||||
| e,u | Halcyon Loan Advisors Funding Ltd., 2018-1A, A2, 144A, FRN, 2.935%, (3-month USD LIBOR + 1.80%), 7/21/31 | United States | 5,000,000 | 4,700,000 | ||||||||||||
| e,t | Harbor Park CLO Ltd., | |||||||||||||||
1A, A2, 144A, FRN, 2.535%, 1/20/31 | United States | 1,710,526 | 1,621,398 | |||||||||||||
1A, B1, 144A, FRN, 2.835%, 1/20/31 | United States | 466,667 | 442,871 | |||||||||||||
| e,u | HayFin Kingsland IX Ltd., 2013-6A, BR, 144A, FRN, 2.687%, (3-month USD LIBOR + 1.80%), 4/28/31 | United States | 5,200,000 | 4,938,883 | ||||||||||||
| e,t | Holland Park CLO DAC, | |||||||||||||||
1A, A1RR, 144A, FRN, 0.92%, 11/14/32 | Ireland | 30,000,000 | EUR | 31,605,969 | ||||||||||||
1A, A2R, 144A, FRN, 1.65%, 11/14/32 | Ireland | 7,200,000 | EUR | 7,358,926 | ||||||||||||
| e,t | HPS Loan Management Ltd., | |||||||||||||||
2013A-18, A2, 144A, FRN, 2.669%, 10/15/30 | United States | 1,400,000 | 1,322,392 | |||||||||||||
2013A-18, C, 144A, FRN, 3.369%, 10/15/30 | United States | 500,000 | 436,425 | |||||||||||||
| e | Invitation Homes Trust, | |||||||||||||||
u 2017-SFR2, A, 144A, FRN, 1.601%, (1-month USD LIBOR + 0.85%), 12/17/36 | United States | 12,981,760 | 12,641,805 | |||||||||||||
u 2018-SFR3, A, 144A, FRN, 1.751%, (1-month USD LIBOR + 1.00%), 7/17/37 | United States | 10,715,874 | 10,483,693 | |||||||||||||
t 2018-SFR4, A, 144A, FRN, 1.851%, 1/17/38 | United States | 8,840,331 | 8,680,575 | |||||||||||||
| e,t | J.P. Morgan Chase Commercial Mortgage Securities Trust, 2016-NINE, A, 144A, FRN, 2.949%, 9/06/38 | United States | 600,000 | 617,973 | ||||||||||||
| t | JP Morgan Mortgage Trust, 2004-A1, 5A1, FRN, 3.967%, 2/25/34 | United States | 31,356 | 30,720 | ||||||||||||
JPMBB Commercial Mortgage Securities Trust, | ||||||||||||||||
2015-C30, A5, 3.822%, 7/15/48 | United States | 1,500,000 | 1,636,018 | |||||||||||||
2016-C1, A5, 3.576%, 3/15/49 | United States | 1,500,000 | 1,626,786 | |||||||||||||
| e,u | LCM 26 Ltd., | |||||||||||||||
26A, B, 144A, FRN, 2.535%, (3-month USD LIBOR + 1.40%), 1/20/31 | United States | 4,500,000 | 4,112,576 | |||||||||||||
26A, C, 144A, FRN, 2.935%, (3-month USD LIBOR + 1.80%), 1/20/31 | United States | 2,000,000 | 1,753,051 | |||||||||||||
| 78 |
Semiannual Report | franklintempleton.com | ||
FRANKLIN INVESTORS SECURITIES TRUST
STATEMENT OF INVESTMENTS (UNAUDITED)
Franklin Low Duration Total Return Fund (continued)
| Country/ Organization | | Principal Amount | * | Value | ||||||||||||
Asset-Backed Securities and Commercial Mortgage-Backed Securities (continued) | ||||||||||||||||
Diversified Financials (continued) | ||||||||||||||||
| e,t | LCM XVI LP, 2016A, BR2, 144A, FRN, 2.969%, 10/15/31 | United States | 1,756,602 | $ | 1,629,012 | |||||||||||
| e,t | LCM XXII Ltd., 22A, A2R, 144A, FRN, 2.585%, 10/20/28 | United States | 8,500,000 | 7,933,354 | ||||||||||||
| u | Lehman XS Trust, 2005-4, 1A4, FRN, 1.047%, (1-month USD LIBOR + 0.56%), 10/25/35 | United States | 328,967 | 323,498 | ||||||||||||
| e,u | Long Point Park CLO Ltd., | |||||||||||||||
2017-1A, A2, 144A, FRN, 2.51%, (3-month USD LIBOR + 1.375%), 1/17/30 | United States | 3,400,000 | 3,155,250 | |||||||||||||
2017-1A, B, 144A, FRN, 2.835%, (3-month USD LIBOR + 1.70%), 1/17/30 | United States | 2,000,000 | 1,776,130 | |||||||||||||
| e,t | Mach One ULC, 2004-1A, M, 144A, FRN, 5.45%, 5/28/40 | United States | 40,110 | 39,599 | ||||||||||||
| e,t | Madison Park Euro Funding VIII DAC, | |||||||||||||||
8A, ARN, 144A, FRN, 0.95%, 4/15/32 | Ireland | 24,700,000 | EUR | 25,718,530 | ||||||||||||
8A, BRN, 144A, FRN, 1.70%, 4/15/32 | Ireland | 2,800,000 | EUR | 2,862,144 | ||||||||||||
| e,t | Madison Park Euro Funding XIV DAC, 2014A, A1N, 144A, FRN, 1.12%, 7/15/32 | Ireland | 8,000,000 | EUR | 8,592,595 | |||||||||||
| e,u | Madison Park Funding Ltd., | |||||||||||||||
2018-28A, B, 144A, FRN, 2.819%, (3-month USD LIBOR + 1.60%), 7/15/30 | United States | 2,000,000 | 1,867,475 | |||||||||||||
2018-28A, C, 144A, FRN, 3.069%, (3-month USD LIBOR + 1.85%), 7/15/30 | United States | 4,200,000 | 3,760,891 | |||||||||||||
| e,t | Madison Park Funding XIV Ltd., | |||||||||||||||
2014-14A, BRR, 144A, FRN, 2.798%, 10/22/30 | United States | 2,500,000 | 2,372,735 | |||||||||||||
2014-14A, CRR, 144A, FRN, 3.298%, 10/22/30 | United States | 937,500 | 843,901 | |||||||||||||
| e,t | Madison Park Funding XXII Ltd.22A, CR, 144A, FRN, 3.219%, 1/15/33 | United States | 2,800,000 | 2,449,102 | ||||||||||||
| e,u | Madison Park Funding XXIII Ltd., 2017-23A, B, 144A, FRN, 2.691%, (3-month USD LIBOR + 1.70%), 7/27/30 | United States | 4,000,000 | 3,850,882 | ||||||||||||
| e,t | Madison Park Funding XXIX Ltd., | |||||||||||||||
2018-29A, B, 144A, FRN, 2.885%, 10/18/30 | United States | 4,000,000 | 3,765,741 | |||||||||||||
2018-29A, C, 144A, FRN, 3.335%, 10/18/30 | United States | 995,968 | 904,778 | |||||||||||||
| e,t | Madison Park Funding XXXI Ltd., | |||||||||||||||
2018-31A, A2A, 144A, FRN, 2.543%, 1/23/31 | United States | 3,000,000 | 2,821,361 | |||||||||||||
2018-31A, B, 144A, FRN, 2.743%, 1/23/31 | United States | 6,000,000 | 5,697,983 | |||||||||||||
2018-31A, C, 144A, FRN, 3.193%, 1/23/31 | United States | 2,600,000 | 2,344,735 | |||||||||||||
| e,t | Magnetite Ltd., 2015-14RA, A1, 144A, FRN, 2.255%, 10/18/31 | United States | 11,000,000 | 10,556,589 | ||||||||||||
MASTR Alternative Loan Trust, | ||||||||||||||||
2003-1, 3A1, 5.00%, 6/25/23 | United States | 13,134 | 13,904 | |||||||||||||
2003-6, 2A1, 5.00%, 8/25/20 | United States | 23,447 | 23,493 | |||||||||||||
| u | Merrill Lynch Mortgage Investors Trust, 2005-A10, A, FRN, 0.697%, (1-month USD LIBOR + 0.21%), 2/25/36 | United States | 1,619,617 | 1,584,140 | ||||||||||||
| u | Merrill Lynch Mortgage Investors Trust Inc., 2003-E, A1, FRN, 1.107%, (1-month USD LIBOR + 0.62%), 10/25/28 | United States | 404,345 | 384,268 | ||||||||||||
| e,t | Mill City Mortgage Loan Trust, | |||||||||||||||
2016-1, A, 144A, FRN, 2.50%, 4/25/57 | United States | 4,695,610 | 4,704,235 | |||||||||||||
2017-1, A1, 144A, FRN, 2.75%, 11/25/58 | United States | 825,012 | 840,590 | |||||||||||||
2017-3, A1, 144A, FRN, 2.75%, 1/25/61 | United States | 5,728,193 | 5,803,606 | |||||||||||||
2018-1, A1, 144A, FRN, 3.25%, 5/25/62 | United States | 13,623,222 | 13,955,476 | |||||||||||||
franklintempleton.com | Semiannual Report | 79 | ||||
FRANKLIN INVESTORS SECURITIES TRUST
STATEMENT OF INVESTMENTS (UNAUDITED)
Franklin Low Duration Total Return Fund (continued)
| | Country/ Organization | | | Principal Amount | * | Value | ||||||||||||
Asset-Backed Securities and Commercial Mortgage-Backed Securities (continued) | ||||||||||||||||||
Diversified Financials (continued) | ||||||||||||||||||
| e,t | Mill City Mortgage Loan Trust, (continued) | |||||||||||||||||
2018-2, A1, 144A, FRN, 3.50%, 5/25/58 | United States | 3,915,391 | $ | 4,044,906 | ||||||||||||||
2018-4, A1B, 144A, FRN, 3.50%, 4/25/66 | United States | 11,247,206 | 11,516,480 | |||||||||||||||
| e | Morgan Stanley Capital I Trust, | |||||||||||||||||
t 2011-C1, A4, 144A, FRN, 5.033%, 9/15/47 | United States | 1,129,963 | 1,144,455 | |||||||||||||||
2014-150E, A, 144A, 3.912%, 9/09/32 | United States | 450,000 | 485,656 | |||||||||||||||
| e | Neuberger Berman CLO Ltd., | |||||||||||||||||
t 2016-22A, BR, 144A, FRN, 2.785%, 10/17/30 | United States | 900,000 | 845,746 | |||||||||||||||
u 2017-26A, C, 144A, FRN, 2.885%, (3-month USD LIBOR + 1.75%), 10/18/30 | United States | 2,100,000 | 1,862,790 | |||||||||||||||
| e,t | Neuberger Berman CLO XVIII Ltd., | |||||||||||||||||
2014-18A, A1BR, 144A, FRN, 2.509%, 10/21/30 | United States | 2,295,000 | 2,149,158 | |||||||||||||||
2014-18A, BR2, 144A, FRN, 3.259%, 10/21/30 | United States | 1,600,000 | 1,419,106 | |||||||||||||||
| e,u | Neuberger Berman CLO XVI-S Ltd., 2017-16SA, C, 144A, FRN, 2.819%, (3-month USD LIBOR + 1.60%), 1/15/28 | United States | 400,000 | 363,333 | ||||||||||||||
| e | Neuberger Berman Loan Advisers CLO Ltd., | |||||||||||||||||
u 2017-26A, B, 144A, FRN, 2.635%, (3-month USD LIBOR + 1.50%), 10/18/30 | United States | 1,618,420 | 1,539,404 | |||||||||||||||
u 2018-27A, C, 144A, FRN, 2.919%, (3-month USD LIBOR + 1.70%), 1/15/30 | United States | 500,000 | 441,623 | |||||||||||||||
t 2019-32A, B, 144A, FRN, 2.985%, 1/19/32 | United States | 7,600,000 | 7,401,147 | |||||||||||||||
t 2019-32A, C, 144A, FRN, 3.785%, 1/19/32 | United States | 6,000,000 | 5,582,641 | |||||||||||||||
| u | New York Mortgage Trust, 2005-3, M1, FRN, 1.162%, (1-month USD LIBOR + 0.675%), 2/25/36 | United States | 180,155 | 161,108 | ||||||||||||||
| e,u | Newark BSL CLO 2 Ltd., 2017-1A, B, 144A, FRN, 3.341%, (3-month USD LIBOR + 2.35%), 7/25/30 | United States | 583,989 | 542,906 | ||||||||||||||
| e,u | NZCG Funding Ltd., 2015-1A, A2R, 144A, FRN, 3.197%, (3-month USD LIBOR + 1.55%), 2/26/31 | United States | 6,600,000 | 6,177,498 | ||||||||||||||
| e,u | OBX Trust, 2018-1, A2, 144A, FRN, 1.137%, (1-month USD LIBOR + 0.65%), 6/25/57 | United States | 2,216,880 | 2,145,557 | ||||||||||||||
| e | Octagon Investment Partners 18-R Ltd., | |||||||||||||||||
t 2018-18A, A1A, 144A, FRN, 2.136%, 4/16/31 | United States | 1,000,000 | 961,983 | |||||||||||||||
u 2018-18A, C, 144A, FRN, 3.876%, (3-month USD LIBOR + 2.70%), 4/16/31 | United States | 1,000,000 | 781,604 | |||||||||||||||
| e,u | Octagon Investment Partners 26 Ltd., | |||||||||||||||||
2016-1A, A2R, 144A, FRN, 2.569%, (3-month USD LIBOR + 1.35%), 7/15/30 | United States | 1,600,000 | 1,509,278 | |||||||||||||||
2016-1A, BR, 144A, FRN, 2.819%, (3-month USD LIBOR + 1.60%), 7/15/30 | United States | 2,000,000 | 1,870,924 | |||||||||||||||
| e,t | Octagon Investment Partners 28 Ltd., | |||||||||||||||||
2016-1A, A2R, 144A, FRN, 2.47%, 10/24/30 | United States | 4,000,000 | 3,744,489 | |||||||||||||||
2016-1A, BR, 144A, FRN, 2.82%, 10/24/30 | United States | 1,186,282 | 1,132,549 | |||||||||||||||
80 |
Semiannual Report |
franklintempleton.com | ||
FRANKLIN INVESTORS SECURITIES TRUST
STATEMENT OF INVESTMENTS (UNAUDITED)
Franklin Low Duration Total Return Fund (continued)
| | Country/ Organization | | | Principal Amount | * | Value | ||||||||||||
Asset-Backed Securities and Commercial Mortgage-Backed Securities (continued) | ||||||||||||||||||
Diversified Financials (continued) | ||||||||||||||||||
| e,u | Octagon Investment Partners 31 LLC, 2017-1A, C, 144A, FRN, 3.535%, (3-month USD LIBOR + 2.40%), 7/20/30 | United States | 280,761 | $ | 262,064 | |||||||||||||
| e,u | Octagon Investment Partners 33 Ltd., | |||||||||||||||||
2017-1A, A2, 144A, FRN, 2.635%, (3-month USD LIBOR + 1.50%), 1/20/31 | United States | 2,000,000 | 1,725,099 | |||||||||||||||
2017-1A, B, 144A, FRN, 2.985%, (3-month USD LIBOR + 1.85%), 1/20/31 | United States | 500,000 | 417,662 | |||||||||||||||
2017-1A, C, 144A, FRN, 3.885%, (3-month USD LIBOR + 2.75%), 1/20/31 | United States | 250,000 | 183,390 | |||||||||||||||
| e,u | Octagon Investment Partners 35 Ltd., 2018-1A, A1B, 144A, FRN, 2.235%, (3-month USD LIBOR + 1.10%), 1/20/31 | United States | 2,000,000 | 1,887,684 | ||||||||||||||
| e,u | Octagon Investment Partners 37 Ltd., 2018-2A, A2, 144A, FRN, 2.571%, (3-month USD LIBOR + 1.58%), 7/25/30 | United States | 1,000,000 | 925,477 | ||||||||||||||
| e,u | Octagon Investment Partners XVI Ltd., | |||||||||||||||||
2013-1A, BR, 144A, FRN, 2.735%, (3-month USD LIBOR + 1.60%), 7/17/30 | United States | 4,000,000 | 3,706,408 | |||||||||||||||
2013-1A, CR, 144A, FRN, 2.985%, (3-month USD LIBOR + 1.85%), 7/17/30 | United States | 3,000,000 | 2,659,500 | |||||||||||||||
| e,u | Octagon Investment Partners XXII Ltd., 2014-1A, CRR, 144A, FRN, 2.998%, (3-month USD LIBOR + 1.90%), 1/22/30 | United States | 2,100,000 | 1,875,774 | ||||||||||||||
| e,u | Octagon Investment Partners XXIII Ltd., | |||||||||||||||||
2015-1A, BR, 144A, FRN, 2.419%, (3-month USD LIBOR + 1.20%), 7/15/27 | United States | 1,200,000 | 1,148,551 | |||||||||||||||
2015-1A, DR, 144A, FRN, 3.769%, (3-month USD LIBOR + 2.55%), 7/15/27 | United States | 600,000 | 505,096 | |||||||||||||||
| e | Progress Residential Trust, | |||||||||||||||||
2017-SFR1, A, 144A, 2.768%, 8/17/34 | United States | 408,280 | 413,240 | |||||||||||||||
2018-SFR2, A, 144A, 3.712%, 8/17/35 | United States | 3,257,000 | 3,385,461 | |||||||||||||||
| e | Prosper Pass-Thru Trust III, | |||||||||||||||||
t 2020-PT1, A, 144A, FRN, 8.796%, 3/15/26 | United States | 3,338,351 | 3,211,617 | |||||||||||||||
t 2020-PT2, A, 144A, FRN, 9.444%, 4/15/26 | United States | 3,660,945 | 3,564,920 | |||||||||||||||
2020-PT3, A, 144A, FRN, 7.183%, 5/15/26 | United States | 1,149,130 | 1,167,935 | |||||||||||||||
| e,t | Provident Funding Mortgage Trust 2019-1, 2019-1, A3, 144A, FRN, 3.00%, 12/25/49 | United States | 6,714,534 | 6,842,811 | ||||||||||||||
| e,t | Provident Funding Mortgage Trust, 2020-1, A3, 144A, FRN, 3.00%, 2/25/50 | United States | 8,040,256 | 8,239,268 | ||||||||||||||
| u | RAAC, 2004-SP1, AII, FRN, 1.187%, (1-month USD LIBOR + 0.70%), 3/25/34 | United States | 188,008 | 181,326 | ||||||||||||||
| e,t | Race Point X CLO Ltd., 2016-10A, B1R, 144A, FRN, 2.641%, 7/25/31 | United States | 700,000 | 645,415 | ||||||||||||||
| e,u | Radnor RE Ltd., 2018-1, M1, 144A, FRN, 1.887%, (1-month USD LIBOR + 1.40%), 3/25/28 | United States | 983,043 | 977,272 | ||||||||||||||
| e,t | Sequoia Mortgage Trust, 2016-2, A4, 144A, FRN, 3.50%, 8/25/46 | United States | 11,183,588 | 11,403,726 | ||||||||||||||
| e,t | Sound Point Euro CLO II Funding DAC, | |||||||||||||||||
2A, A, 144A, FRN, 1.11%, 10/26/32 | Ireland | 9,800,000 | EUR | 10,387,001 | ||||||||||||||
2A, B1, 144A, FRN, 1.85%, 10/26/32 | Ireland | 5,150,000 | EUR | 5,356,910 | ||||||||||||||
franklintempleton.com | Semiannual Report | 81 | ||||
FRANKLIN INVESTORS SECURITIES TRUST
STATEMENT OF INVESTMENTS (UNAUDITED)
Franklin Low Duration Total Return Fund (continued)
| | Country/ Organization | | | Principal Amount | * | Value | ||||||||||||
Asset-Backed Securities and Commercial Mortgage-Backed Securities (continued) | ||||||||||||||||||
Diversified Financials (continued) | ||||||||||||||||||
| t | Structured ARM Loan Trust, 2004-12, 3A1, FRN, 3.83%, 9/25/34 | United States | 1,028,666 | $ | 1,005,590 | |||||||||||||
| u | Structured Asset Mortgage Investments II Trust, 2004-AR6, A1A, FRN, 1.418%, (1-month USD LIBOR + 0.70%), 2/19/35 | United States | 1,057,026 | 939,082 | ||||||||||||||
| e | TCI-Flatiron CLO Ltd., | |||||||||||||||||
t 2017-1A, A, 144A, FRN, 2.892%, 11/18/30 | United States | 2,000,000 | 1,937,403 | |||||||||||||||
u 2017-1A, B, 144A, FRN, 3.252%, (3-month USD LIBOR + 1.56%), 11/18/30 | United States | 2,000,000 | 1,877,496 | |||||||||||||||
u 2017-1A, C, 144A, FRN, 3.542%, (3-month USD LIBOR + 1.85%), 11/18/30 | United States | 1,700,000 | 1,522,552 | |||||||||||||||
Thornburg Mortgage Securities Trust, | ||||||||||||||||||
u 2004-3, A, FRN, 1.227%, (1-month USD LIBOR + 0.74%), 9/25/34 | United States | 646,341 | 574,928 | |||||||||||||||
t 2005-1, A3, FRN, 3.648%, 4/25/45 | United States | 160,380 | 146,677 | |||||||||||||||
| e | Towd Point Mortgage Trust, | |||||||||||||||||
t 2015-1, 144A, FRN, 2.75%, 11/25/60 | United States | 344,245 | 345,942 | |||||||||||||||
2015-1, AE, 144A, 3.00%, 10/25/53 | United States | 2,883,159 | 2,898,831 | |||||||||||||||
t 2015-2, 2A1, 144A, FRN, 3.75%, 11/25/57 | United States | 493,463 | 497,991 | |||||||||||||||
t 2015-3, A1A, 144A, FRN, 3.50%, 3/25/54 | United States | 1,395,309 | 1,406,171 | |||||||||||||||
t 2015-3, A1B, 144A, FRN, 3.00%, 3/25/54 | United States | 644,333 | 647,388 | |||||||||||||||
t 2016-1, A1, 144A, FRN, 3.50%, 2/25/55 | United States | 6,270,995 | 6,353,996 | |||||||||||||||
t 2016-2, A1A, 144A, FRN, 2.75%, 8/25/55 | United States | 669,467 | 672,817 | |||||||||||||||
t 2016-3, A1, 144A, FRN, 2.25%, 4/25/56 | United States | 7,820,279 | 7,827,022 | |||||||||||||||
t 2016-4, A1, 144A, FRN, 2.25%, 7/25/56 | United States | 11,007,531 | 11,009,768 | |||||||||||||||
t 2016-5, A1, 144A, FRN, 2.50%, 10/25/56 | United States | 3,690,881 | 3,687,684 | |||||||||||||||
t 2017-1, A1, 144A, FRN, 2.75%, 10/25/56 | United States | 11,096,557 | 11,189,737 | |||||||||||||||
t 2017-2, A1, 144A, FRN, 2.75%, 4/25/57 | United States | 10,953,318 | 10,996,145 | |||||||||||||||
t 2017-4, A1, 144A, FRN, 2.75%, 6/25/57 | United States | 12,883,392 | 13,021,898 | |||||||||||||||
u 2017-5, A1, 144A, FRN, 1.087%, (1-month USD LIBOR + 0.60%), 2/25/57 | United States | 2,316,383 | 2,269,499 | |||||||||||||||
t 2018-1, A1, 144A, FRN, 3.00%, 1/25/58 | United States | 3,045,670 | 3,110,470 | |||||||||||||||
t 2018-2, A1, 144A, FRN, 3.25%, 3/25/58 | United States | 6,385,007 | 6,523,949 | |||||||||||||||
t 2018-3, A1, 144A, FRN, 3.75%, 5/25/58 | United States | 13,138,603 | 13,706,130 | |||||||||||||||
t 2018-4, A1, 144A, FRN, 3.00%, 6/25/58 | United States | 17,510,838 | 17,973,506 | |||||||||||||||
t 2018-5, A1A, 144A, FRN, 3.25%, 7/25/58 | United States | 3,990,413 | 4,100,831 | |||||||||||||||
t 2018-6, A1A, 144A, FRN, 3.75%, 3/25/58 | United States | 6,245,025 | 6,491,967 | |||||||||||||||
t 2019-1, A1, 144A, FRN, 3.75%, 3/25/58 | United States | 14,345,257 | 14,928,406 | |||||||||||||||
| b,e,t | Upgrade Master Pass-Thru Trust, | |||||||||||||||||
2019-PT1, A, 144A, FRN, 10.739%, 6/15/25 | United States | 848,871 | 644,565 | |||||||||||||||
2019-PT2, A, 144A, FRN, 12.57%, 2/15/26 | United States | 3,163,364 | 2,941,615 | |||||||||||||||
| e | Voya CLO Ltd., | |||||||||||||||||
u 2013-2A, A1R, 144A, FRN, 1.961%, (3-month USD LIBOR + 0.97%), 4/25/31 | United States | 11,800,000 | 11,239,123 | |||||||||||||||
u 2013-2A, CR, 144A, FRN, 3.741%, (3-month USD LIBOR + 2.75%), 4/25/31 | United States | 375,000 | 283,125 | |||||||||||||||
u 2014-1A, BR2, 144A, FRN, 3.035%, (3-month USD LIBOR + 1.90%), 4/18/31 | United States | 2,750,000 | 2,488,704 | |||||||||||||||
82 |
Semiannual Report |
franklintempleton.com | ||
FRANKLIN INVESTORS SECURITIES TRUST
STATEMENT OF INVESTMENTS (UNAUDITED)
Franklin Low Duration Total Return Fund (continued)
| | Country/ Organization | | | Principal Amount | * | Value | ||||||||||
Asset-Backed Securities and Commercial | ||||||||||||||||
Diversified Financials (continued) | ||||||||||||||||
| e | Voya CLO Ltd., (continued) | |||||||||||||||
u2014-1A, CR2, 144A, FRN, 3.935%, (3-month USD LIBOR + 2.80%), 4/18/31 | United States | 600,000 | $ | 469,699 | ||||||||||||
t2016-3A, A2R, 144A, FRN, 2.535%, 10/18/31 | United States | 818,182 | 771,106 | |||||||||||||
t2016-3A, CR, 144A, FRN, 4.385%, 10/18/31 | United States | 1,698,113 | 1,363,315 | |||||||||||||
u2017-3A, B, 144A, FRN, 3.485%, (3-month USD LIBOR + 2.35%), 7/20/30 | United States | 507,690 | 470,598 | |||||||||||||
u2018-2A, A2, 144A, FRN, 2.469%, (3-month USD LIBOR + 1.25%), 7/15/31 | United States | 2,500,000 | 2,349,028 | |||||||||||||
t2018-4A, B, 144A, FRN, 3.069%, 1/15/32 | United States | 948,052 | 904,922 | |||||||||||||
| u | WaMu Mortgage Pass-Through Certificates, | |||||||||||||||
2005-AR19, A1A1, FRN, 0.757%, (1-month USD LIBOR + 0.27%), 12/25/45 | United States | 1,810,571 | 1,677,702 | |||||||||||||
2005-AR8, 1A1A, FRN, 1.067%, (1-month USD LIBOR + 0.58%), 7/25/45 | United States | 760,783 | 671,732 | |||||||||||||
e,u | Webster Park CLO Ltd., 2015-1A, A2R, 144A, FRN, 2.735%, | United States | 1,750,000 | 1,616,315 | ||||||||||||
Wells Fargo Commercial Mortgage Trust, 2016-NXS6, A2, 2.399%, 11/15/49 | United States | 6,534,000 | 6,582,306 | |||||||||||||
| e,t | Wells Fargo Mortgage Backed Securities, 2018-1, A3, 144A, FRN, 3.50%, 7/25/47 | United States | 4,811,118 | 4,879,138 | ||||||||||||
| e,u | West CLO Ltd., | |||||||||||||||
2014-1A, A2R, 144A, FRN, 2.485%, (3-month USD LIBOR + 1.35%), 7/18/26 | United States | 1,530,000 | 1,524,530 | |||||||||||||
2014-1A, BR, 144A, FRN, 2.985%, (3-month USD LIBOR + 1.85%), 7/18/26 | United States | 2,410,000 | 2,357,159 | |||||||||||||
|
| |||||||||||||||
| 1,393,464,535 | ||||||||||||||||
|
| |||||||||||||||
| Real Estate 0.0%† | ||||||||||||||||
| e | American Homes 4 Rent, 2014-SFR3, A, 144A, 3.678%, 12/17/36 | United States | 732,364 | 766,432 | ||||||||||||
|
| |||||||||||||||
Total Asset-Backed Securities and Commercial |
| 1,416,384,502 | ||||||||||||||
|
| |||||||||||||||
Mortgage-Backed Securities 2.9% | ||||||||||||||||
| v | Federal Home Loan Mortgage Corp. (FHLMC) Adjustable Rate 0.0%† | |||||||||||||||
FHLMC, 3.904% - 4.325%, (12-month USD LIBOR +/- MBS Margin), 10/01/36 - 6/01/37 | United States | 1,232,300 | 1,282,380 | |||||||||||||
|
| |||||||||||||||
Federal Home Loan Mortgage Corp. (FHLMC) Fixed Rate 2.4% | ||||||||||||||||
| w | FHLMC 15 Year, 2.50%, 5/01/35 | United States | 70,870,000 | 74,103,443 | ||||||||||||
FHLMC Gold 15 Year, 5.00%, 10/01/23 | United States | 61,569 | 64,707 | |||||||||||||
FHLMC Gold 15 Year, 6.00%, 6/01/23 | United States | 7,940 | 8,290 | |||||||||||||
FHLMC Gold 30 Year, 5.00%, 1/01/39 | United States | 94,750 | 108,230 | |||||||||||||
|
| |||||||||||||||
| 74,284,670 | ||||||||||||||||
|
| |||||||||||||||
franklintempleton.com | Semiannual Report | 83 | ||||
FRANKLIN INVESTORS SECURITIES TRUST
STATEMENT OF INVESTMENTS (UNAUDITED)
Franklin Low Duration Total Return Fund (continued)
| | Country/ Organization | | | Principal Amount | * | Value | ||||||||||||
Mortgage-Backed Securities (continued) | ||||||||||||||||||
| v | Federal National Mortgage Association (FNMA) Adjustable Rate 0.4% | |||||||||||||||||
FNMA, 2.10% - 2.792%, (1-month USD LIBOR +/- MBS Margin), 4/01/28 -7/01/34 | United States | 246,592 | $ | 248,470 | ||||||||||||||
FNMA, 4.00%, (Federal COF +/- MBS Margin), 8/01/29 | United States | 3,213 | 3,229 | |||||||||||||||
FNMA, 4.125%, (6-month US T-Bill +/- MBS Margin), 8/01/32 | United States | 81,365 | 82,075 | |||||||||||||||
FNMA, 3.469% - 4.461%, (US 3 Year CMT T-Note +/- MBS Margin), 2/01/26 -6/01/34 | United States | 45,130 | 45,429 | |||||||||||||||
FNMA, 3.014% - 4.547%, (12-month USD LIBOR +/- MBS Margin), 11/01/32 -2/01/44 | United States | 8,028,486 | 8,298,314 | |||||||||||||||
FNMA, 4.762%, (US 5 Year CMT T-Note +/- MBS Margin), 2/01/30 | United States | 48,532 | 48,719 | |||||||||||||||
FNMA, 2.30% - 4.885%, (6-month USD LIBOR +/- MBS Margin), 9/01/22 -8/01/37 | United States | 800,840 | 809,243 | |||||||||||||||
FNMA, 3.071% - 4.895%, (US 1 Year CMT T-Note +/- MBS Margin), 5/01/21 - 10/01/44 | United States | 2,001,108 | 2,024,374 | |||||||||||||||
FNMA, 2.239% - 5.624%, (11th District COF +/- MBS Margin), 12/01/25 -12/01/36 | United States | 93,205 | 93,908 | |||||||||||||||
|
| |||||||||||||||||
| 11,653,761 | ||||||||||||||||||
|
| |||||||||||||||||
| Federal National Mortgage Association (FNMA) Fixed Rate 0.1% | ||||||||||||||||||
FNMA 15 Year, 3.50%, 10/01/25 | United States | 549,482 | 581,466 | |||||||||||||||
FNMA 15 Year, 4.00%, 12/01/25 | United States | 826,884 | 875,467 | |||||||||||||||
FNMA 15 Year, 4.50%, 5/01/23 - 6/01/25 | United States | 511,054 | 543,520 | |||||||||||||||
FNMA 30 Year, 5.00%, 3/01/38 | United States | 19,350 | 22,040 | |||||||||||||||
|
| |||||||||||||||||
| 2,022,493 | ||||||||||||||||||
|
| |||||||||||||||||
| v | Government National Mortgage Association (GNMA) Adjustable Rate 0.0%† | |||||||||||||||||
GNMA, 3.25% - 3.875%, (US 1 Year CMT T-Note +/- MBS Margin), | United States | 13,278 | 13,446 | |||||||||||||||
|
| |||||||||||||||||
Total Mortgage-Backed Securities | 89,256,750 | |||||||||||||||||
|
| |||||||||||||||||
Municipal Bonds 2.7% | ||||||||||||||||||
California State GO, Various Purpose, Refunding, 2.375%, 10/01/26 | United States | 18,195,000 | 18,858,754 | |||||||||||||||
Cincinnati GO, Various Purpose, Improvement and Refunding, | United States | 100,000 | 118,383 | |||||||||||||||
Citizens Property Insurance Corp. Revenue, Coastal Account, | United States | 125,000 | 131,934 | |||||||||||||||
Colorado State Board of Governors University Enterprise System Revenue, Green Bonds, Series E-2, 5.00%, 3/01/25 | United States | 100,000 | 117,479 | |||||||||||||||
Honolulu City and County Wastewater System Revenue, Second Bond Resolution, Refunding, Junior Series B, 2.233%, 7/01/24 | United States | 2,470,000 | 2,546,619 | |||||||||||||||
Massachusetts State College Building Authority Revenue, | United States | 2,635,000 | 2,653,076 | |||||||||||||||
New York State GO, Refunding, Series B, 2.12%, 2/15/25 | United States | 18,195,000 | 18,542,888 | |||||||||||||||
New York State Urban Development Corp. Sales Tax Revenue, | United States | 20,685,000 | 20,944,183 | |||||||||||||||
Oregon State Department Of Transportation Highway User Tax | United States | 3,640,000 | 3,743,012 | |||||||||||||||
84 |
Semiannual Report |
franklintempleton.com | ||
FRANKLIN INVESTORS SECURITIES TRUST
STATEMENT OF INVESTMENTS (UNAUDITED)
Franklin Low Duration Total Return Fund (continued)
| | Country/ Organization | | | Principal Amount | * | Value | ||||||||||
Municipal Bonds (continued) | ||||||||||||||||
Orlando Health Obligated Group, 3.777%, 10/01/28 | United States | 105,000 | $ | 111,464 | ||||||||||||
Providence St. Joseph Health Obligated Group, 2.746%, 10/01/26 | United States | 15,000 | 16,044 | |||||||||||||
San Jose RDA Successor Agency Tax Allocation, | ||||||||||||||||
Senior, Refunding, Series A-T, 2.48%, 8/01/21 | United States | 1,595,000 | 1,614,315 | |||||||||||||
Senior, Refunding, Series A-T, 2.63%, 8/01/22 | United States | 5,320,000 | 5,441,668 | |||||||||||||
Senior, Refunding, Series A-T, 3.226%, 8/01/27 | United States | 190,000 | 201,387 | |||||||||||||
Teays Valley Local School District GO, Pickaway Fairfield and Franklin Counties, Refunding, 4.00%, 12/01/26 | United States | 100,000 | 108,607 | |||||||||||||
Texas State GO, Transportation Commission Highway Improvement, | United States | 2,690,000 | 2,792,785 | |||||||||||||
Texas State University System Financing Revenue, Refunding, | United States | 4,825,000 | 4,950,016 | |||||||||||||
|
| |||||||||||||||
Total Municipal Bonds (Cost $81,121,153) |
| 82,892,614 | ||||||||||||||
|
| |||||||||||||||
| Shares | ||||||||||||||||
Escrows and Litigation Trusts 0.0% | ||||||||||||||||
| a,b | Millennium Corporate Claim Trust, Escrow Account | United States | 477,205 | — | ||||||||||||
| a,b | Millennium Lender Claim Trust, Escrow Account | United States | 477,205 | — | ||||||||||||
| a,b,c | Remington Outdoor Co. Inc., Litigation Units | United States | 16,078 | — | ||||||||||||
|
| |||||||||||||||
Total Escrows and Litigation Trusts (Cost $—) | — | |||||||||||||||
|
| |||||||||||||||
Total Investments before Short Term Investments | 3,059,017,591 | |||||||||||||||
|
| |||||||||||||||
| Principal Amount* | ||||||||||||||||
Short Term Investments 1.9% | ||||||||||||||||
U.S. Government and Agency Securities (Cost $6,680,305) 0.2% | ||||||||||||||||
| x | U.S. Treasury Bill, 6/04/20 - 8/13/20 | United States | 6,700,000 | 6,698,733 | ||||||||||||
|
| |||||||||||||||
Total Investments before Money Market Funds | 3,065,716,324 | |||||||||||||||
|
| |||||||||||||||
| Shares | ||||||||||||||||
Money Market Funds (Cost $52,307,992) 1.7% | ||||||||||||||||
| d,y | Institutional Fiduciary Trust Money Market Portfolio, 0.01% | United States | 52,307,992 | 52,307,992 | ||||||||||||
|
| |||||||||||||||
Total Investments (Cost $3,295,467,618) 100.9% | 3,118,024,316 | |||||||||||||||
Options Written (0.1)% | (2,553,694 | ) | ||||||||||||||
Other Assets, less Liabilities (0.8)% | (25,296,559 | ) | ||||||||||||||
|
| |||||||||||||||
Net Assets 100.0% | $ | 3,090,174,063 | ||||||||||||||
|
| |||||||||||||||
franklintempleton.com | Semiannual Report | 85 | ||||
FRANKLIN INVESTORS SECURITIES TRUST
STATEMENT OF INVESTMENTS (UNAUDITED)
Franklin Low Duration Total Return Fund (continued)
| | Number of Contracts | | | Notional Amount | * | Value | ||||||||||
| z | Options Written (Premiums received $83,509) (0.1)% | |||||||||||||||
Puts - Over-the-Counter | ||||||||||||||||
Credit Default Swaptions (0.1)% | ||||||||||||||||
Buy protection on CDX.NA.HY.33, Counterparty CITI, Premium Rate | 1 | 20,493,000 | $ | (2,553,694 | ) | |||||||||||
|
| |||||||||||||||
†Rounds to less than 0.1% of net assets.
*The principal/notional amount is stated in U.S. dollars unless otherwise indicated.
aNon-income producing.
bFair valued using significant unobservable inputs. See Note 14 regarding fair value measurements.
cSee Note 9 regarding restricted securities.
dSee Note 3(f) regarding investments in affiliated management investment companies.
eSecurity was purchased pursuant to Rule 144A under the Securities Act of 1933 and may be sold in transactions exempt from registration only to qualified institutional buyers or in a public offering registered under the Securities Act of 1933. At April 30, 2020, the aggregate value of these securities was $1,186,559,288, representing 38.2% of net assets.
fSecurity was purchased pursuant to Regulation S under the Securities Act of 1933, which exempts from registration securities offered and sold outside of the United States. Such a security cannot be sold in the United States without either an effective registration statement filed pursuant to the Securities Act of 1933, or pursuant to an exemption from registration. At April 30, 2020, the aggregate value of these securities was $104,240,331, representing 3.4% of net assets.
gIncome may be received in additional securities and/or cash.
hThe coupon rate shown represents the rate at period end.
iPrincipal amount is stated in 1,000 Brazilian Real Units.
jSee Note 7 regarding defaulted securities.
kSee Note 1(f) regarding loan participation notes.
lPerpetual security with no stated maturity date.
mSecurity purchased on a when-issued basis. See Note 1(d).
nSee Note 1(j) regarding senior floating rate interests.
oSecurity purchased on a delayed delivery basis. See Note 1(d).
pA portion or all of the security represents an unsettled loan commitment. The coupon rate is to-be determined (TBD) at the time of settlement and will be based upon a reference index/floor plus a spread.
qSee Note 1(k) regarding Marketplace lending.
rA supranational organization is an entity formed by two or more central governments through international treaties.
sPrincipal amount of security is adjusted for inflation. See Note 1(m).
tAdjustable rate security with an interest rate that is not based on a published reference index and spread. The rate is based on the structure of the agreement and current market conditions. The coupon rate shown represents the rate at period end.
uThe coupon rate shown represents the rate inclusive of any caps or floors, if applicable, in effect at period end.
vAdjustable Rate Mortgage-Backed Security (ARM); the rate shown is the effective rate at period end. ARM rates are not based on a published reference rate and spread, but instead pass-through weighted average interest income inclusive of any caps or floors, if applicable, from the underlying mortgage loans in which the majority of mortgages pay interest based on the index shown at their designated reset dates plus a spread, less the applicable servicing and guaranty fee (MBS margin).
wSecurity purchased on a to-be-announced (TBA) basis. See Note 1(d).
xThe security was issued on a discount basis with no stated coupon rate.
yThe rate shown is the annualized seven-day effective yield at period end.
zSee Note 1(e) regarding written options.
86 |
Semiannual Report |
franklintempleton.com | ||
FRANKLIN INVESTORS SECURITIES TRUST
STATEMENT OF INVESTMENTS (UNAUDITED)
Franklin Low Duration Total Return Fund (continued)
At April 30, 2020, the Fund had the following futures contracts outstanding. See Note 1(e).
Futures Contracts
| Description | Type | | Number of Contracts | | | Notional Amount | * | | Expiration Date | | | Value/ Unrealized Appreciation (Depreciation) | | |||||||
| Interest Rate Contracts | ||||||||||||||||||||
Australian 3 Yr. Bond | Long | 743 | $ | 56,733,215 | 6/15/20 | $ 339,074 | ||||||||||||||
Canada 10 Yr. Bond | Long | 614 | 65,904,196 | 6/19/20 | 3,956,295 | |||||||||||||||
CME Ultra Long Term U.S. Treasury Bond | Short | 39 | 8,766,469 | 6/19/20 | (723,981 | ) | ||||||||||||||
Euro-BOBL | Short | 40 | 5,958,416 | 6/08/20 | 24,072 | |||||||||||||||
Euro-Bund | Short | 5 | 955,615 | 6/08/20 | 8,323 | |||||||||||||||
Euro-OAT | Long | 335 | 61,970,654 | 6/08/20 | 623,595 | |||||||||||||||
U.S. Treasury 10 Yr. Note | Short | 789 | 109,720,312 | 6/19/20 | (3,160,547 | ) | ||||||||||||||
U.S. Treasury 2 Yr. Note | Long | 2,915 | 642,552,539 | 6/30/20 | 5,393,709 | |||||||||||||||
U.S. Treasury 30 Yr. Bond | Short | 95 | 17,197,969 | 6/19/20 | (1,018,416 | ) | ||||||||||||||
U.S. Treasury 5 Yr. Note | Short | 850 | 106,661,719 | 6/30/20 | (429,920 | ) | ||||||||||||||
Ultra 10 Yr. U.S. Treasury Note | Short | 220 | 34,546,875 | 6/19/20 | (1,333,676 | ) | ||||||||||||||
|
| |||||||||||||||||||
Total Futures Contracts | $3,678,528 | |||||||||||||||||||
|
| |||||||||||||||||||
*As of period end.
At April 30, 2020, the Fund had the following forward exchange contracts outstanding. See Note 1(e).
Forward Exchange Contracts
| Currency | Counterpartya | Type | Quantity | | Contract Amount | * | | Settlement Date | | | Unrealized Appreciation | | | Unrealized Depreciation | | |||||||||
| OTC Forward Exchange Contracts | ||||||||||||||||||||||||
Brazilian Real | JPHQ | Sell | 2,520,623 | 560,247 | 5/13/20 | $ 97,166 | $ — | |||||||||||||||||
Brazilian Real | JPHQ | Sell | 4,945,000 | 1,113,914 | 6/02/20 | 206,600 | — | |||||||||||||||||
Indonesian Rupiah | JPHQ | Buy | 47,801,500,000 | 3,375,384 | 6/15/20 | — | (248,706 | ) | ||||||||||||||||
Australian Dollar | JPHQ | Sell | 17,920,000 | 12,354,586 | 7/02/20 | 675,014 | — | |||||||||||||||||
Turkish Lira | JPHQ | Buy | 12,510,000 | 1,815,807 | 7/14/20 | — | (64,230 | ) | ||||||||||||||||
Japanese Yen | CITI | Buy | 4,360,480,600 | 40,600,000 | 7/16/20 | 76,099 | — | |||||||||||||||||
Japanese Yen | CITI | Sell | 4,360,480,600 | 40,582,430 | 7/16/20 | — | (93,670 | ) | ||||||||||||||||
Australian Dollar | JPHQ | Sell | 5,800,000 | 3,983,498 | 7/21/20 | 203,248 | — | |||||||||||||||||
Japanese Yen | JPHQ | Buy | 3,242,700,000 | 29,963,683 | 7/22/20 | 288,631 | — | |||||||||||||||||
Canadian Dollar | JPHQ | Sell | 54,366,003 | 41,362,155 | 7/23/20 | 2,301,511 | — | |||||||||||||||||
Danish Krone | JPHQ | Sell | 108,670,307 | 16,227,683 | 7/23/20 | 239,546 | — | |||||||||||||||||
Euro | JPHQ | Sell | 42,415,113 | 47,271,731 | 7/23/20 | 714,387 | — | |||||||||||||||||
Mexican Peso | JPHQ | Buy | 48,650,000 | 2,520,895 | 7/23/20 | — | (528,757 | ) | ||||||||||||||||
Norwegian Krone | JPHQ | Buy | 86,200,000 | 9,531,260 | 7/23/20 | — | (1,113,975 | ) | ||||||||||||||||
Norwegian Krone | JPHQ | Sell | 86,200,000 | 8,457,614 | 7/23/20 | 40,329 | — | |||||||||||||||||
Euro | JPHQ | Sell | 35,750,927 | 41,072,961 | 8/05/20 | 1,819,210 | — | |||||||||||||||||
Australian Dollar | JPHQ | Sell | 23,500,000 | 14,200,110 | 8/06/20 | — | (1,116,369 | ) | ||||||||||||||||
Japanese Yen | JPHQ | Buy | 2,130,000,000 | 19,977,490 | 8/13/20 | — | (97,456 | ) | ||||||||||||||||
Japanese Yen | JPHQ | Sell | 1,700,000,000 | 15,836,596 | 8/13/20 | — | (30,098 | ) | ||||||||||||||||
Singapore Dollar | JPHQ | Sell | 71,000,000 | 5,295,183,550 | JPY | 8/13/20 | — | (945,714 | ) | |||||||||||||||
Chinese Yuan Renminbi | JPHQ | Buy | 81,750,000 | 11,713,209 | 8/21/20 | — | (193,940 | ) | ||||||||||||||||
franklintempleton.com | Semiannual Report | 87 | ||||
FRANKLIN INVESTORS SECURITIES TRUST
STATEMENT OF INVESTMENTS (UNAUDITED)
Franklin Low Duration Total Return Fund (continued)
Forward Exchange Contracts (continued)
Currency | Counterpartya | Type | Quantity | | Contract Amount | * | | Settlement Date | | | Unrealized Appreciation | | | Unrealized Depreciation | | |||||||||||||
| OTC Forward Exchange Contracts (continued) |
| |||||||||||||||||||||||||||
Chinese Yuan Renminbi | JPHQ | Sell | 81,750,000 | 11,611,226 | 8/21/20 | $ 91,957 | $ | — | ||||||||||||||||||||
Japanese Yen | JPHQ | Buy | 1,236,500,000 | 11,829,083 | 9/14/20 | — | (280,964 | ) | ||||||||||||||||||||
Canadian Dollar | JPHQ | Buy | 43,524,355 | 31,430,066 | 9/15/20 | — | (154,243 | ) | ||||||||||||||||||||
Canadian Dollar | JPHQ | Sell | 12,370,000 | 8,932,698 | 9/15/20 | 43,837 | — | |||||||||||||||||||||
Euro | BZWS | Sell | 194,860 | 219,231 | 9/15/20 | 5,076 | — | |||||||||||||||||||||
Euro | CITI | Sell | 391,262 | 439,501 | 9/15/20 | 9,496 | — | |||||||||||||||||||||
Euro | DBAB | Sell | 3,487,136 | 3,923,516 | 9/15/20 | 91,085 | — | |||||||||||||||||||||
Euro | GSCO | Sell | 420,000 | 472,353 | 9/15/20 | 10,765 | — | |||||||||||||||||||||
Euro | JPHQ | Sell | 7,135,500 | 7,737,665 | 9/15/20 | — | (104,389 | ) | ||||||||||||||||||||
Euro | JPHQ | Sell | 56,783,315 | 63,875,551 | 9/15/20 | 1,469,578 | — | |||||||||||||||||||||
Norwegian Krone | JPHQ | Buy | 109,600,000 | 10,851,700 | 9/15/20 | — | (148,458 | ) | ||||||||||||||||||||
Norwegian Krone | JPHQ | Sell | 109,600,000 | 10,745,098 | 9/15/20 | 41,856 | — | |||||||||||||||||||||
South Korean Won | JPHQ | Sell | 3,920,000,000 | 3,193,483 | 9/16/20 | — | (42,496 | ) | ||||||||||||||||||||
|
| |||||||||||||||||||||||||||
Total Forward Exchange Contracts |
| $ 8,425,391 | $ (5,163,465) | |||||||||||||||||||||||||
|
| |||||||||||||||||||||||||||
Net unrealized appreciation (depreciation) |
| $ 3,261,926 | ||||||||||||||||||||||||||
|
| |||||||||||||||||||||||||||
*In U.S. dollars unless otherwise indicated.
aMay be comprised of multiple contracts with the same counterparty, currency and settlement date.
At April 30, 2020, the Fund had the following credit default swap contracts outstanding. See Note 1(e).
Credit Default Swap Contracts
Description | | Periodic Payment Rate Received (Paid) | | | Payment Frequency | | | Counter- party | | | Maturity Date | | | Notional Amounta | | Value | | Unamortized Upfront Payments (Receipts) | | | Unrealized Appreciation (Depreciation) | | Ratingb | |||||||||||||
| Centrally Cleared Swap Contracts |
| |||||||||||||||||||||||||||||||||||
| Contracts to Sell Protectionc,d |
| |||||||||||||||||||||||||||||||||||
| Traded Index |
| |||||||||||||||||||||||||||||||||||
CDX.EM.32 | 1.00% | Quarterly | 12/20/24 | $ 67,620,000 | $(6,232,627) | $(3,735,798) | $(2,496,829) | |||||||||||||||||||||||||||||
CDX.NA.HY.33 | 5.00% | Quarterly | 12/20/24 | 43,115,000 | (2,182,249) | (160,196) | (2,022,053) | Non- | ||||||||||||||||||||||||||||
| Investment | ||||||||||||||||||||||||||||||||||||
| Grade | ||||||||||||||||||||||||||||||||||||
CDX.NA.IG.31 | 1.00% | Quarterly | 12/20/21 | 74,600,000 | 369,104 | 665,761 | (296,657) | Investment | ||||||||||||||||||||||||||||
| Grade | ||||||||||||||||||||||||||||||||||||
CDX.NA.IG.33 | 1.00% | Quarterly | 12/20/24 | 160,000,000 | 1,342,686 | 1,901,639 | (558,953) | Investment | ||||||||||||||||||||||||||||
| Grade | ||||||||||||||||||||||||||||||||||||
Total Centrally Cleared Swap Contracts |
| $(6,703,086) | $(1,328,594) | $(5,374,492) | ||||||||||||||||||||||||||||||||
| OTC Swap Contracts |
| |||||||||||||||||||||||||||||||||||
| Contracts to Buy Protectionc |
| |||||||||||||||||||||||||||||||||||
| Single Name |
| |||||||||||||||||||||||||||||||||||
AES Corp. | (5.00)% | Quarterly | CITI | 3/20/21 | $ 2,750,000 | $ (126,820) | $ (104,512) | $ (22,308) | ||||||||||||||||||||||||||||
Ally Financial Inc. | (5.00)% | Quarterly | JPHQ | 12/20/24 | 13,600,000 | (1,825,296) | (2,359,305) | 534,009 | ||||||||||||||||||||||||||||
Avon Products Inc. | (5.00)% | Quarterly | CITI | 3/20/23 | 5,835,000 | 128,941 | (490,170) | 619,111 | ||||||||||||||||||||||||||||
CenturyLink Inc. | (5.00)% | Quarterly | BZWS | 6/20/21 | 4,700,000 | (200,228) | (126,823) | (73,405) | ||||||||||||||||||||||||||||
| 88 |
Semiannual Report | franklintempleton.com | ||
FRANKLIN INVESTORS SECURITIES TRUST
STATEMENT OF INVESTMENTS (UNAUDITED)
Franklin Low Duration Total Return Fund (continued)
Credit Default Swap Contracts (continued)
| Description | | Periodic Payment Rate Received (Paid) |
| | Payment Frequency | | | Counter- party | | | Maturity Date | | | Notional Amount | a | Value | | Unamortized Upfront Payments (Receipts) |
| | Unrealized Appreciation (Depreciation) |
| Rating | b | ||||||||||||||
OTC Swap Contracts (continued) |
| |||||||||||||||||||||||||||||||||||||
Contracts to Buy Protectionc (continued) |
| |||||||||||||||||||||||||||||||||||||
| Single Name (continued) | ||||||||||||||||||||||||||||||||||||||
Chesapeake Energy Corp. | (5.00)% | Quarterly | CITI | 6/20/20 | $ | 495,000 | $ | 327,415 | $ | 44,828 | $ | 282,587 | ||||||||||||||||||||||||||
Chesapeake Energy Corp. | (5.00)% | Quarterly | JPHQ | 6/20/20 | 1,968,100 | 1,301,789 | 198,852 | 1,102,937 | ||||||||||||||||||||||||||||||
Energy Transfer LP | (5.00)% | Quarterly | MSCO | 12/20/20 | 750,000 | (26,123 | ) | (20,224 | ) | (5,899 | ) | |||||||||||||||||||||||||||
Government of Italy | (1.00)% | Quarterly | BZWS | 6/20/23 | 4,800,000 | 120,701 | 32,816 | 87,885 | ||||||||||||||||||||||||||||||
HCA Inc. | (5.00)% | Quarterly | FBCO | 3/20/22 | 2,050,000 | (178,602 | ) | (141,693 | ) | (36,909 | ) | |||||||||||||||||||||||||||
Nabors Industries Inc. | (1.00)% | Quarterly | CITI | 12/20/21 | 6,200,000 | 3,600,971 | 148,191 | 3,452,780 | ||||||||||||||||||||||||||||||
| Contracts to Sell Protectionc,d |
| |||||||||||||||||||||||||||||||||||||
| Single Name | ||||||||||||||||||||||||||||||||||||||
The Goldman Sachs Group Inc. | 1.00% | Quarterly | JPHQ | 12/20/24 | 13,600,000 | 135,926 | 217,432 | (81,506 | ) | BBB+ | ||||||||||||||||||||||||||||
Government of Argentina | 5.00% | Quarterly | CITI | 12/20/21 | 8,045,000 | (5,943,019 | ) | (3,496,567 | ) | (2,446,452 | ) | CC | ||||||||||||||||||||||||||
Government of Indonesia | 1.00% | Quarterly | CITI | 12/20/24 | 6,250,000 | (244,807 | ) | 37,963 | (282,770 | ) | NR | |||||||||||||||||||||||||||
Government of Italy | 1.00% | Quarterly | BZWS | 6/20/23 | 4,800,000 | (120,701 | ) | (143,903 | ) | 23,202 | NR | |||||||||||||||||||||||||||
Government of Russia | 1.00% | Quarterly | CITI | 12/20/24 | 4,320,000 | (106,270 | ) | 39,750 | (146,020 | ) | BBB- | |||||||||||||||||||||||||||
Morgan Stanley | 1.00% | Quarterly | JPHQ | 12/20/24 | 13,600,000 | 163,314 | 238,643 | (75,329 | ) | BBB+ | ||||||||||||||||||||||||||||
Nabors Industries Inc. | 1.00% | Quarterly | CITI | 12/20/23 | 6,200,000 | (4,832,410 | ) | (675,758 | ) | (4,156,652 | ) | CCC+ | ||||||||||||||||||||||||||
Sprint Communications Inc. | 5.00% | Quarterly | JPHQ | 9/20/20 | 12,000 | 277 | — | 277 | B | |||||||||||||||||||||||||||||
| Traded Index | ||||||||||||||||||||||||||||||||||||||
| e | BNP Paribas Bespoke Bordeaux Index, Mezzanine Tranche 7-10% | 2.10% | Quarterly | BNDP | 6/20/20 | 300,000 | (7,061 | ) | — | (7,061 | ) | Non- | ||||||||||||||||||||||||||
| Investment | ||||||||||||||||||||||||||||||||||||||
| Grade | ||||||||||||||||||||||||||||||||||||||
| e | BNP Paribas Bespoke Rodez Index, Mezzanine Tranche 5-7% | 2.00% | Quarterly | BNDP | 12/20/20 | 4,100,000 | (970,551 | ) | — | (970,551 | ) | Non- | ||||||||||||||||||||||||||
| Investment | ||||||||||||||||||||||||||||||||||||||
| Grade | ||||||||||||||||||||||||||||||||||||||
| e | BNP Paribas Bespoke Rodez2 Index, Mezzanine Tranche 5-7% | 3.20% | Quarterly | BNDP | 12/20/20 | 2,340,000 | (439,831 | ) | — | (439,831 | ) | Non- | ||||||||||||||||||||||||||
| Investment | ||||||||||||||||||||||||||||||||||||||
| Grade | ||||||||||||||||||||||||||||||||||||||
| e | Citibank Bespoke Bogota Index, Mezzanine Tranche 7-10% | 1.35% | Quarterly | CITI | 6/20/20 | 1,650,000 | (35,248 | ) | — | (35,248 | ) | Non- | ||||||||||||||||||||||||||
| Investment | ||||||||||||||||||||||||||||||||||||||
| Grade | ||||||||||||||||||||||||||||||||||||||
franklintempleton.com | Semiannual Report | 89 | ||||
FRANKLIN INVESTORS SECURITIES TRUST
STATEMENT OF INVESTMENTS (UNAUDITED)
Franklin Low Duration Total Return Fund (continued)
Credit Default Swap Contracts (continued)
| Description | | Periodic Payment Rate Received (Paid) |
| | Payment Frequency | | | Counter- party | | | Maturity Date | | | Notional Amount | a | Value | | Unamortized Upfront Payments (Receipts) |
| | Unrealized Appreciation (Depreciation) |
| Rating | b | ||||||||||||||
| OTC Swap Contracts (continued) |
| |||||||||||||||||||||||||||||||||||||
| Contracts to Sell Protectionc,d (continued) |
| |||||||||||||||||||||||||||||||||||||
| Traded Index (continued) | ||||||||||||||||||||||||||||||||||||||
| e | Citibank Bespoke Palma Index, Mezzanine Tranche 5-7% | 2.30% | Quarterly | CITI | 6/20/21 | $ | 4,910,000 | $ | (1,062,660 | ) | $ | — | $ | (1,062,660 | ) | Non- | ||||||||||||||||||||||
| Investment | ||||||||||||||||||||||||||||||||||||||
| Grade | ||||||||||||||||||||||||||||||||||||||
| e | Citibank Bespoke Phoenix Index, Mezzanine Tranche 5-7% | 2.90% | Quarterly | CITI | 12/20/21 | 3,500,000 | (952,705 | ) | — | (952,705 | ) | Non- | ||||||||||||||||||||||||||
| Investment | ||||||||||||||||||||||||||||||||||||||
| Grade | ||||||||||||||||||||||||||||||||||||||
| e | Citibank Bespoke Singapore Index, Equity Tranche 0-3% | 0.00% | Quarterly | CITI | 6/20/20 | 5,770,000 | (1,822,332 | ) | (112,494 | ) | (1,709,838 | ) | Non- | |||||||||||||||||||||||||
| Investment | ||||||||||||||||||||||||||||||||||||||
| Grade | ||||||||||||||||||||||||||||||||||||||
| e,f | Citibank Bespoke Sydney Index, Equity Tranche 0-3% | 0.00% | Quarterly | CITI | 6/20/20 | 798,913 | (354,358 | ) | (17,782 | ) | (336,576 | ) | Non- | |||||||||||||||||||||||||
| Investment | ||||||||||||||||||||||||||||||||||||||
| Grade | ||||||||||||||||||||||||||||||||||||||
| e | MCDX.NA.30 | 1.00% | Quarterly | CITI | 6/20/28 | 2,000,000 | (41,584 | ) | 16,423 | (58,007 | ) | Investment | ||||||||||||||||||||||||||
| Grade | ||||||||||||||||||||||||||||||||||||||
| e | MCDX.NA.31 | 1.00% | Quarterly | CITI | 12/20/23 | 12,200,000 | (15,049 | ) | 91,572 | (106,621 | ) | Investment | ||||||||||||||||||||||||||
| Grade | ||||||||||||||||||||||||||||||||||||||
| e | Morgan Stanley Bespoke Pecan Index, Mezzanine Tranche 5-10% | 3.98% | Quarterly | MSCO | 12/20/21 | 3,700,000 | (1,918,611 | ) | — | (1,918,611 | ) | Non- | ||||||||||||||||||||||||||
| Investment | ||||||||||||||||||||||||||||||||||||||
| Grade | ||||||||||||||||||||||||||||||||||||||
| e | Morgan Stanley Bespoke Pecan Index, Mezzanine Tranche 5-10% | 4.10% | Quarterly | MSCO | 12/20/21 | 3,700,000 | (1,718,759 | ) | — | (1,718,759 | ) | Non- | ||||||||||||||||||||||||||
|
| |||||||||||||||||||||||||||||||||||||
| Investment | ||||||||||||||||||||||||||||||||||||||
| Grade | ||||||||||||||||||||||||||||||||||||||
Total OTC Swap Contracts |
| $ | (17,163,691 | ) | $ | (6,622,761 | ) | $ | (10,540,930 | ) | ||||||||||||||||||||||||||||
|
| |||||||||||||||||||||||||||||||||||||
Total Credit Default Swap Contracts |
| $ | (23,866,777 | ) | $ | (7,951,355 | ) | $ | (15,915,422 | ) | ||||||||||||||||||||||||||||
|
| |||||||||||||||||||||||||||||||||||||
aIn U.S. dollars unless otherwise indicated. For contracts to sell protection, the notional amount is equal to the maximum potential amount of the future payments and no recourse provisions have been entered into in association with the contracts.
bBased on Standard and Poor’s (S&P) Rating for single name swaps. Internal ratings based on mapping into equivalent ratings from external vendors.
cPerformance triggers for settlement of contract include default, bankruptcy or restructuring for single name swaps and failure to pay or bankruptcy of the underlying securities for traded index swaps.
dThe fund enters contracts to sell protection to create a long credit position.
eRepresents a custom index comprised of a basket of underlying instruments.
fFair valued using significant unobservable inputs. See Note 14 regarding fair value measurements.
90 | Semiannual Report | franklintempleton.com | ||
FRANKLIN INVESTORS SECURITIES TRUST
STATEMENT OF INVESTMENTS (UNAUDITED)
Franklin Low Duration Total Return Fund (continued)
At April 30, 2020, the Fund had the following cross-currency swap contracts outstanding. See Note 1(e).
Cross-Currency Swap Contracts
| Description | Payment Frequency | Coun- terparty | Maturity Date | Notional Amount | Value/ Unrealized Appreciation (Depreciation) | |||||||||||||||
| OTC Swap Contracts | ||||||||||||||||||||
Receive Floating 3-month USD LIBOR + 1.894% | Quarterly | 2,460,000 USD | ||||||||||||||||||
Pay Fixed 1.50% | Annual | CITI | 5/04/21 | 2,000,000 EUR | $ 266,837 | |||||||||||||||
Receive Floating 3-month USD LIBOR + 1.85% | Quarterly | 617,500 USD | ||||||||||||||||||
Pay Fixed 1.50% | Annual | CITI | 5/04/21 | 500,000 EUR | 68,930 | |||||||||||||||
Receive Floating 3-month USD LIBOR + 2.87% | Quarterly | 1,743,000 USD | ||||||||||||||||||
Pay Fixed 2.50% | Annual | CITI | 5/04/21 | 1,500,000 EUR | 83,088 | |||||||||||||||
Receive Floating 3-month USD LIBOR + 2.87% | Quarterly | 232,400 USD | ||||||||||||||||||
Pay Fixed 2.50% | Annual | CITI | 5/04/21 | 200,000 EUR | 11,080 | |||||||||||||||
Receive Floating 3-month USD LIBOR + 1.3025% | Quarterly | 496,000 USD | ||||||||||||||||||
Pay Fixed 1.00% | Annual | JPHQ | 5/04/21 | 400,000 EUR | 57,968 | |||||||||||||||
Receive Floating 3-month USD LIBOR + 1.334% | Quarterly | 4,704,000 USD | ||||||||||||||||||
Pay Floating 3-month EUR LIBOR + 1.12% | Quarterly | CITI | 7/10/21 | 4,200,000 EUR | 120,210 | |||||||||||||||
Receive Floating 3-month USD LIBOR + 1.334% | Quarterly | 4,256,000 USD | ||||||||||||||||||
Pay Floating 3-month EUR LIBOR + 1.12% | Quarterly | CITI | 7/10/21 | 3,800,000 EUR | 108,762 | |||||||||||||||
Receive Floating 3-month USD LIBOR + 1.81% | Quarterly | 6,720,000 USD | ||||||||||||||||||
Pay Floating 3-month EUR LIBOR + 1.6% | Quarterly | CITI | 8/12/21 | 6,000,000 EUR | 200,235 | |||||||||||||||
Receive Floating 3-month USD LIBOR + 1.81% | Quarterly | 1,568,000 USD | ||||||||||||||||||
Pay Floating 3-month EUR LIBOR + 1.6% | Quarterly | CITI | 8/12/21 | 1,400,000 EUR | 46,722 | |||||||||||||||
Receive Floating 3-month USD LIBOR + 1.305% | Quarterly | 2,988,900 USD | ||||||||||||||||||
Pay Floating 3-month EUR LIBOR + 1.11% | Quarterly | JPHQ | 8/20/21 | 2,700,000 EUR | 49,012 | |||||||||||||||
Receive Floating 3-month USD LIBOR + 1.31% | Quarterly | 13,875,000 USD | ||||||||||||||||||
Pay Floating 3-month EUR LIBOR + 1.11% | Quarterly | CITI | 8/30/21 | 12,500,000 EUR | 261,863 | |||||||||||||||
Receive Floating 3-month USD LIBOR + 1.31% | Quarterly | 2,719,500 USD | ||||||||||||||||||
Pay Floating 3-month EUR LIBOR + 1.11% | Quarterly | CITI | 8/30/21 | 2,450,000 EUR | 51,325 | |||||||||||||||
Receive Floating 3-month USD LIBOR + 1.23% | Quarterly | 15,429,000 USD | ||||||||||||||||||
Pay Floating 3-month EUR LIBOR + 1.07% | Quarterly | CITI | 9/17/21 | 13,900,000 EUR | 258,194 | |||||||||||||||
Receive Floating 3-month USD LIBOR + 1.23% | Quarterly | 2,941,500 USD | ||||||||||||||||||
Pay Floating 3-month EUR LIBOR + 1.07% | Quarterly | CITI | 9/17/21 | 2,650,000 EUR | 49,224 | |||||||||||||||
Receive Floating 3-month USD LIBOR + 1.25% | Quarterly | 5,550,000 USD | ||||||||||||||||||
Pay Floating 3-month EUR LIBOR + 1.1% | Quarterly | CITI | 10/30/21 | 5,000,000 EUR | 75,456 | |||||||||||||||
Receive Floating 3-month USD LIBOR + 1.1745% | Quarterly | 41,106,000 USD | ||||||||||||||||||
Pay Floating 3-month EUR LIBOR + 1.05% | Quarterly | CITI | 11/22/21 | 37,200,000 EUR | 519,776 | |||||||||||||||
Receive Floating 3-month USD LIBOR + 1.1745% | Quarterly | 4,862,000 USD | ||||||||||||||||||
Pay Floating 3-month EUR LIBOR + 1.05% | Quarterly | CITI | 11/22/21 | 4,400,000 EUR | 61,479 | |||||||||||||||
Receive Floating 3-month USD LIBOR + 1.1735% | Quarterly | 30,525,000 USD | ||||||||||||||||||
Pay Floating 3-month EUR LIBOR + 1.05% | Quarterly | CITI | 12/10/21 | 27,500,000 EUR | 491,818 | |||||||||||||||
Receive Floating 3-month USD LIBOR + 1.3175% | Quarterly | 35,242,500 USD | ||||||||||||||||||
Pay Floating 3-month EUR LIBOR + 1.2% | Quarterly | CITI | 12/12/21 | 31,750,000 EUR | 556,559 | |||||||||||||||
Receive Floating 3-month USD LIBOR + .84875% | Quarterly | 3,472,000 USD | ||||||||||||||||||
Pay Fixed 0.75% | Annual | DBAB | 9/14/22 | 2,800,000 EUR | 376,529 | |||||||||||||||
|
| |||||||||||||||||||
Total Cross Currency Swap Contracts |
| $3,715,067 | ||||||||||||||||||
|
| |||||||||||||||||||
franklintempleton.com | Semiannual Report | 91 | ||||
FRANKLIN INVESTORS SECURITIES TRUST
STATEMENT OF INVESTMENTS (UNAUDITED)
Franklin Low Duration Total Return Fund (continued)
At April 30, 2020, the Fund had the following interest rate swap contracts outstanding. See Note 1(e).
Interest Rate Swap Contracts
| Description | Payment Frequency | Maturity Date | Notional Amount | Value/ Unrealized Appreciation (Depreciation) | ||||||||||||
| Centrally Cleared Swap Contracts | ||||||||||||||||
Receive Floating 3-month USD LIBOR | Quarterly | |||||||||||||||
Pay Fixed 2.788% | Semi-Annual | 3/26/23 | $ | 7,900,000 | $ (568,471) | |||||||||||
Receive Floating 3-month USD LIBOR | Quarterly | |||||||||||||||
Pay Fixed 2.79% | Semi-Annual | 3/28/23 | 7,900,000 | (565,454 | ) | |||||||||||
Receive Floating 3-month USD LIBOR | Quarterly | |||||||||||||||
Pay Fixed 2.713% | Semi-Annual | 3/29/23 | 4,700,000 | (325,537 | ) | |||||||||||
Receive Floating 3-month USD LIBOR | Quarterly | |||||||||||||||
Pay Fixed 2.806% | Semi-Annual | 4/17/23 | 5,800,000 | (422,368 | ) | |||||||||||
|
| |||||||||||||||
Total Interest Rate Swap Contracts |
| $(1,881,830 | ) | |||||||||||||
|
| |||||||||||||||
At April 30, 2020, the Fund had the following inflation index swap contracts outstanding. See Note 1(e).
Inflation Index Swap Contracts
| Description | Payment Frequency | Maturity Date | Notional Amount | Value/ Unrealized Appreciaton (Depreciation) | ||||||||||||
| Centrally Cleared Swap Contracts | ||||||||||||||||
Receive variable change in USA-CPI-U | At maturity | |||||||||||||||
Pay Fixed 1.96% | At maturity | 8/31/24 | $ | 25,200,000 | $ (1,302,866) | |||||||||||
Receive variable change in USA-CPI-U | At maturity | |||||||||||||||
Pay Fixed 2.079% | At maturity | 9/18/24 | 1,770,000 | (106,550 | ) | |||||||||||
Receive variable change in USA-CPI-U | At maturity | |||||||||||||||
Pay Fixed 1.719% | At maturity | 8/14/26 | 16,000,000 | (744,228 | ) | |||||||||||
Receive variable change in USA-CPI-U | At maturity | |||||||||||||||
Pay Fixed 1.719% | At maturity | 8/14/26 | 2,050,000 | (95,511 | ) | |||||||||||
Receive variable change in USA-CPI-U | At maturity | |||||||||||||||
Pay Fixed 2.35% | At maturity | 9/20/26 | 5,200,000 | (541,014 | ) | |||||||||||
Receive variable change in USA-CPI-U | At maturity | |||||||||||||||
Pay Fixed 1.893% | At maturity | 1/15/27 | 123,400,000 | (7,423,936 | ) | |||||||||||
Receive variable change in USA-CPI-U | At maturity | |||||||||||||||
Pay Fixed 2.313% | At maturity | 6/01/28 | 1,400,000 | (158,171 | ) | |||||||||||
|
| |||||||||||||||
Total Inflation Index Swap Contracts |
| $(10,372,276 | ) | |||||||||||||
|
| |||||||||||||||
92 | Semiannual Report | franklintempleton.com | ||
FRANKLIN INVESTORS SECURITIES TRUST
STATEMENT OF INVESTMENTS (UNAUDITED)
Franklin Low Duration Total Return Fund (continued)
At April 30, 2020, the Fund had the following total return swap contracts outstanding. See Note 1(e).
Total Return Swap Contracts
| Underlying Instruments | Financing Rate | Payment Frequency | Counterparty | Maturity Date | Notional Value | Value/ Unrealized Appreciation (Depreciation) | ||||||||||||||||||
| ||||||||||||||||||||||||
| OTC Swap Contracts | ||||||||||||||||||||||||
| Longa | ||||||||||||||||||||||||
Markit iBoxx USD Liquid Leveraged Loan Index | 3-month USD LIBOR | Quarterly | BZWS | 6/20/20 | $ | 45,800,000 | $(3,053,478 | ) | ||||||||||||||||
|
| |||||||||||||||||||||||
aThe Fund receives the total return on the underlying instrument and pays a variable financing rate.
See Note 10 regarding other derivative information.
See Abbreviations on page 171.
franklintempleton.com | The accompanying notes are an integral part of these financial statements. | Semiannual Report | 93 | ||||
FRANKLIN INVESTORS SECURITIES TRUST
Consolidated Financial Highlights
Franklin Total Return Fund
Six Months Ended April 30, 2020 (unaudited) | Year Ended October 31, | |||||||||||||||||||||||
| 2019 | 2018 | 2017 | 2016 | 2015 | ||||||||||||||||||||
Class A | ||||||||||||||||||||||||
| Per share operating performance (for a share outstanding throughout the period) | ||||||||||||||||||||||||
Net asset value, beginning of period | $ 9.92 | $ 9.31 | $ 9.84 | $ 9.93 | $ 9.87 | $ 10.18 | ||||||||||||||||||
| Income from investment operationsa: | ||||||||||||||||||||||||
Net investment income | 0.133 | b | 0.302 | b | 0.269 | 0.251 | b | 0.231 | 0.217 | |||||||||||||||
Net realized and unrealized gains (losses) | (0.270 | ) | 0.618 | (0.518 | ) | (0.110 | ) | 0.107 | (0.220 | ) | ||||||||||||||
Total from investment operations | (0.137 | ) | 0.920 | (0.249 | ) | 0.141 | 0.338 | (0.003 | ) | |||||||||||||||
Less distributions from: | ||||||||||||||||||||||||
Net investment income and net foreign currency gains | (0.193 | ) | (0.310 | ) | (0.275 | ) | (0.231 | ) | (0.278 | ) | (0.307 | ) | ||||||||||||
Tax return of capital | — | — | (0.006 | ) | — | — | — | |||||||||||||||||
Total distributions | (0.193 | ) | (0.310 | ) | (0.281 | ) | (0.231 | ) | (0.278 | ) | (0.307 | ) | ||||||||||||
Net asset value, end of period | $ 9.59 | $ 9.92 | $ 9.31 | $ 9.84 | $ 9.93 | $ 9.87 | ||||||||||||||||||
Total returnc | (1.41)% | 10.01% | (2.57)% | 1.47% | 3.53% | (0.05)% | ||||||||||||||||||
| Ratios to average net assetsd | ||||||||||||||||||||||||
Expenses before waiver and payments by affiliates | 0.88% | 0.90% | 0.91% | 0.91% | 0.90% | 0.91% | ||||||||||||||||||
Expenses net of waiver and payments by affiliatese | 0.84% | 0.86% | 0.88% | 0.87% | 0.85% | 0.87% | ||||||||||||||||||
Net investment income | 2.73% | 3.12% | 2.91% | 2.58% | 2.32% | 2.08% | ||||||||||||||||||
| Supplemental data | ||||||||||||||||||||||||
Net assets, end of period (000’s) | $3,560,331 | $3,422,747 | $2,763,774 | $3,153,751 | $3,623,035 | $3,527,479 | ||||||||||||||||||
Portfolio turnover rate | 100.47% | 169.95% | f | 151.77% | 101.07% | 287.38% | 294.80% | |||||||||||||||||
Portfolio turnover rate excluding mortgage dollar rollsg | 80.53% | 98.83% | f | 84.86% | 78.46% | 146.15% | 95.06% | |||||||||||||||||
aThe amount shown for a share outstanding throughout the period may not correlate with the Consolidated Statement of Operations for the period due to the timing of sales and repurchases of the Fund’s shares in relation to income earned and/or fluctuating fair value of the investments of the Fund.
bBased on average daily shares outstanding.
cTotal return does not reflect sales commissions or contingent deferred sales charges, if applicable, and is not annualized for periods less than one year.
dRatios are annualized for periods less than one year, except for non-recurring expenses, if any.
eBenefit of expense reduction rounds to less than 0.01%.
fExcludes the value of portfolio activity as a result of in-kind transactions.
gSee Note 1(i) regarding mortgage dollar rolls.
94 | Semiannual Report | The accompanying notes are an integral part of these financial statements. | franklintempleton.com | ||
FRANKLIN INVESTORS SECURITIES TRUST
CONSOLIDATED FINANCIAL HIGHLIGHTS
Franklin Total Return Fund (continued)
Six Months Ended April 30, 2020 (unaudited) | Year Ended October 31, | |||||||||||||||||||||||
| 2019 | 2018 | 2017 | 2016 | 2015 | ||||||||||||||||||||
Class C | ||||||||||||||||||||||||
| Per share operating performance (for a share outstanding throughout the period) | ||||||||||||||||||||||||
Net asset value, beginning of period | $ 9.85 | $ 9.25 | $ 9.77 | $ 9.87 | $ 9.84 | $ 10.16 | ||||||||||||||||||
| Income from investment operationsa: | ||||||||||||||||||||||||
Net investment income | 0.113 | b | 0.262 | b | 0.183 | 0.212 | b | 0.189 | 0.172 | |||||||||||||||
Net realized and unrealized gains (losses) | (0.270 | ) | 0.609 | (0.457 | ) | (0.109 | ) | 0.100 | (0.214 | ) | ||||||||||||||
Total from investment operations | (0.157 | ) | 0.871 | (0.274 | ) | 0.103 | 0.289 | (0.042 | ) | |||||||||||||||
| Less distributions from: | ||||||||||||||||||||||||
Net investment income and net foreign currency gains | (0.173 | ) | (0.271 | ) | (0.241 | ) | (0.203 | ) | (0.259 | ) | (0.278 | ) | ||||||||||||
Tax return of capital | — | — | (0.005 | ) | — | — | — | |||||||||||||||||
Total distributions | (0.173 | ) | (0.271 | ) | (0.246 | ) | (0.203 | ) | (0.259 | ) | (0.278 | ) | ||||||||||||
Net asset value, end of period | $ 9.52 | $ 9.85 | $ 9.25 | $ 9.77 | $ 9.87 | $ 9.84 | ||||||||||||||||||
Total returnc | (1.62)% | 9.52% | (2.84)% | 0.98% | 3.13% | (0.43)% | ||||||||||||||||||
| Ratios to average net assetsd | ||||||||||||||||||||||||
Expenses before waiver and payments by affiliates | 1.28% | 1.30% | 1.31% | 1.31% | 1.30% | 1.31% | ||||||||||||||||||
Expenses net of waiver and payments by affiliatese | 1.24% | 1.26% | 1.28% | 1.27% | 1.25% | 1.27% | ||||||||||||||||||
Net investment income | 2.33% | 2.72% | 2.51% | 2.18% | 1.92% | 1.68% | ||||||||||||||||||
| Supplemental data | ||||||||||||||||||||||||
Net assets, end of period (000’s) | $242,255 | $236,838 | $243,068 | $354,269 | $449,274 | $444,253 | ||||||||||||||||||
Portfolio turnover rate | 100.47% | 169.95% | f | 151.77% | 101.07% | 287.38% | 294.80% | |||||||||||||||||
Portfolio turnover rate excluding mortgage dollar rollsg | 80.53% | 98.83% | f | 84.86% | 78.46% | 146.15% | 95.06% | |||||||||||||||||
aThe amount shown for a share outstanding throughout the period may not correlate with the Consolidated Statement of Operations for the period due to the timing of sales and repurchases of the Fund’s shares in relation to income earned and/or fluctuating fair value of the investments of the Fund.
bBased on average daily shares outstanding.
cTotal return does not reflect sales commissions or contingent deferred sales charges, if applicable, and is not annualized for periods less than one year.
dRatios are annualized for periods less than one year, except for non-recurring expenses, if any.
eBenefit of expense reduction rounds to less than 0.01%.
fExcludes the value of portfolio activity as a result of in-kind transactions.
gSee Note 1(i) regarding mortgage dollar rolls.
franklintempleton.com | The accompanying notes are an integral part of these financial statements. | Semiannual Report | 95 | ||||
FRANKLIN INVESTORS SECURITIES TRUST
CONSOLIDATED FINANCIAL HIGHLIGHTS
Franklin Total Return Fund (continued)
Six Months Ended April 30, 2020 (unaudited) | Year Ended October 31, | |||||||||||||||||||||||
| 2019 | 2018 | 2017 | 2016 | 2015 | ||||||||||||||||||||
Class R | ||||||||||||||||||||||||
| Per share operating performance (for a share outstanding throughout the period) | ||||||||||||||||||||||||
Net asset value, beginning of period | $ 9.88 | $ 9.27 | $ 9.80 | $ 9.90 | $ 9.85 | $ 10.17 | ||||||||||||||||||
| Income from investment operationsa: | ||||||||||||||||||||||||
Net investment income | 0.120 | b | 0.277 | b | 0.182 | 0.228 | b | 0.199 | 0.198 | |||||||||||||||
Net realized and unrealized gains (losses) | (0.260 | ) | 0.619 | (0.453 | ) | (0.115 | ) | 0.117 | (0.229 | ) | ||||||||||||||
Total from investment operations | (0.140 | ) | 0.896 | (0.271 | ) | 0.113 | 0.316 | (0.031 | ) | |||||||||||||||
Less distributions from: | ||||||||||||||||||||||||
Net investment income and net foreign currency gains | (0.180 | ) | (0.286 | ) | (0.253 | ) | (0.213 | ) | (0.266 | ) | (0.289 | ) | ||||||||||||
Tax return of capital | — | — | (0.006 | ) | — | — | — | |||||||||||||||||
Total distributions | (0.180 | ) | (0.286 | ) | (0.259 | ) | (0.213 | ) | (0.266 | ) | (0.289 | ) | ||||||||||||
Net asset value, end of period | $ 9.56 | $ 9.88 | $ 9.27 | $ 9.80 | $ 9.90 | $ 9.85 | ||||||||||||||||||
Total returnc | (1.54)% | 9.66% | (2.70)% | 1.19% | 3.31% | (0.32)% | ||||||||||||||||||
| Ratios to average net assetsd | ||||||||||||||||||||||||
Expenses before waiver and payments by affiliates | 1.13% | 1.15% | 1.16% | 1.16% | 1.15% | 1.16% | ||||||||||||||||||
Expenses net of waiver and payments by affiliatese | 1.09% | 1.11% | 1.13% | 1.12% | 1.10% | 1.12% | ||||||||||||||||||
Net investment income | 2.48% | 2.87% | 2.66% | 2.33% | 2.07% | 1.83% | ||||||||||||||||||
| Supplemental data | ||||||||||||||||||||||||
Net assets, end of period (000’s) | $17,570 | $21,223 | $23,620 | $36,337 | $58,715 | $70,506 | ||||||||||||||||||
Portfolio turnover rate | 100.47% | 169.95% | f | 151.77% | 101.07% | 287.38% | 294.80% | |||||||||||||||||
Portfolio turnover rate excluding mortgage dollar rollsg | 80.53% | 98.83% | f | 84.86% | 78.46% | 146.15% | 95.06% | |||||||||||||||||
aThe amount shown for a share outstanding throughout the period may not correlate with the Consolidated Statement of Operations for the period due to the timing of sales and repurchases of the Fund’s shares in relation to income earned and/or fluctuating fair value of the investments of the Fund.
bBased on average daily shares outstanding.
cTotal return is not annualized for periods less than one year.
dRatios are annualized for periods less than one year, except for non-recurring expenses, if any.
eBenefit of expense reduction rounds to less than 0.01%.
fExcludes the value of portfolio activity as a result of in-kind transactions.
gSee Note 1(i) regarding mortgage dollar rolls.
| 96 |
Semiannual Report | The accompanying notes are an integral part of these financial statements. | franklintempleton.com | ||
FRANKLIN INVESTORS SECURITIES TRUST
CONSOLIDATED FINANCIAL HIGHLIGHTS
Franklin Total Return Fund (continued)
Six Months Ended April 30, 2020 (unaudited) | Year Ended October 31, | |||||||||||||||||||||||
| 2019 | 2018 | 2017 | 2016 | 2015 | ||||||||||||||||||||
| Class R6 | ||||||||||||||||||||||||
| Per share operating performance (for a share outstanding throughout the period) | ||||||||||||||||||||||||
Net asset value, beginning of period | $ 9.99 | $ 9.38 | $ 9.90 | $ 9.98 | $ 9.91 | $ 10.20 | ||||||||||||||||||
| Income from investment operationsa: | ||||||||||||||||||||||||
Net investment income | 0.151 | b | 0.340 | b | 0.308 | 0.296 | b | 0.195 | 0.255 | b | ||||||||||||||
Net realized and unrealized gains (losses) | (0.269 | ) | 0.617 | (0.512 | ) | (0.117 | ) | 0.173 | (0.209 | ) | ||||||||||||||
Total from investment operations | (0.118 | ) | 0.957 | (0.204 | ) | 0.179 | 0.368 | 0.046 | ||||||||||||||||
| Less distributions from: | ||||||||||||||||||||||||
Net investment income and net foreign currency gains | (0.212 | ) | (0.347 | ) | (0.309 | ) | (0.259 | ) | (0.298 | ) | (0.336 | ) | ||||||||||||
Tax return of capital | — | — | (0.007 | ) | — | — | — | |||||||||||||||||
Total distributions | (0.212 | ) | (0.347 | ) | (0.316 | ) | (0.259 | ) | (0.298 | ) | (0.336 | ) | ||||||||||||
| Net asset value, end of period | $ 9.66 | $ 9.99 | $ 9.38 | $ 9.90 | $ 9.98 | $ 9.91 | ||||||||||||||||||
Total returnc | (1.21)% | 10.35% | (2.10)% | 1.75% | 3.94% | 0.44% | ||||||||||||||||||
| Ratios to average net assetsd | ||||||||||||||||||||||||
Expenses before waiver and payments by affiliates | 0.53% | 0.53% | 0.54% | 0.50% | 0.51% | 0.50% | ||||||||||||||||||
Expenses net of waiver and payments by affiliatese | 0.48% | 0.49% | 0.49% | 0.48% | 0.46% | 0.46% | ||||||||||||||||||
Net investment income | 3.09% | 3.49% | 3.30% | 2.97% | 2.71% | 2.49% | ||||||||||||||||||
| Supplemental data | ||||||||||||||||||||||||
Net assets, end of period (000’s) | $490,489 | $481,399 | $430,637 | $398,732 | $93,892 | $68,848 | ||||||||||||||||||
Portfolio turnover rate | 100.47% | 169.95% | f | 151.77% | 101.07% | 287.38% | 294.80% | |||||||||||||||||
Portfolio turnover rate excluding mortgage dollar rollsg | 80.53% | 98.83% | f | 84.86% | 78.46% | 146.15% | 95.06% | |||||||||||||||||
aThe amount shown for a share outstanding throughout the period may not correlate with the Consolidated Statement of Operations for the period due to the timing of sales and repurchases of the Fund’s shares in relation to income earned and/or fluctuating fair value of the investments of the Fund.
bBased on average daily shares outstanding.
cTotal return is not annualized for periods less than one year.
dRatios are annualized for periods less than one year, except for non-recurring expenses, if any.
eBenefit of expense reduction rounds to less than 0.01%.
fExcludes the value of portfolio activity as a result of in-kind transactions.
gSee Note 1(i) regarding mortgage dollar rolls.
| franklintempleton.com |
The accompanying notes are an integral part of these financial statements. | Semiannual Report |
|
97 |
| ||
FRANKLIN INVESTORS SECURITIES TRUST
CONSOLIDATED FINANCIAL HIGHLIGHTS
Franklin Total Return Fund (continued)
Six Months Ended April 30, 2020 (unaudited) | Year Ended October 31, | |||||||||||||||||||||||
| 2019 | 2018 | 2017 | 2016 | 2015 | ||||||||||||||||||||
| Advisor Class | ||||||||||||||||||||||||
Per share operating performance (for a share outstanding throughout the period) | ||||||||||||||||||||||||
Net asset value, beginning of period | $ 9.98 | $ 9.37 | $ 9.89 | $ 9.98 | $ 9.91 | $ 10.20 | ||||||||||||||||||
| Income from investment operationsa: | ||||||||||||||||||||||||
Net investment income | 0.145 | b | 0.328 | b | 0.291 | 0.275 | b | 0.218 | 0.127 | |||||||||||||||
Net realized and unrealized gains (losses) | (0.269 | ) | 0.618 | (0.507 | ) | (0.116 | ) | 0.142 | (0.092 | ) | ||||||||||||||
Total from investment operations | (0.124 | ) | 0.946 | (0.216 | ) | 0.159 | 0.360 | 0.035 | ||||||||||||||||
| Less distributions from: | ||||||||||||||||||||||||
Net investment income and net foreign currency gains | (0.206 | ) | (0.336 | ) | (0.297 | ) | (0.249 | ) | (0.290 | ) | (0.325 | ) | ||||||||||||
Tax return of capital | — | — | (0.007 | ) | — | — | — | |||||||||||||||||
Total distributions | (0.206 | ) | (0.336 | ) | (0.304 | ) | (0.249 | ) | (0.290 | ) | (0.325 | ) | ||||||||||||
| Net asset value, end of period | $ 9.65 | $ 9.98 | $ 9.37 | $ 9.89 | $ 9.98 | $ 9.91 | ||||||||||||||||||
Total returnc | (1.27)% | 10.23% | (2.22)% | 1.65% | 3.75% | 0.33% | ||||||||||||||||||
| Ratios to average net assetsd | ||||||||||||||||||||||||
Expenses before waiver and payments by affiliates | 0.63% | 0.65% | 0.66% | 0.66% | 0.65% | 0.66% | ||||||||||||||||||
Expenses net of waiver and payments by affiliatese | 0.59% | 0.61% | 0.63% | 0.62% | 0.60% | 0.62% | ||||||||||||||||||
Net investment income | 2.98% | 3.37% | 3.16% | 2.83% | 2.57% | 2.33% | ||||||||||||||||||
| Supplemental data | ||||||||||||||||||||||||
Net assets, end of period (000’s) | $711,112 | $863,516 | $620,803 | $595,239 | $740,046 | $526,749 | ||||||||||||||||||
Portfolio turnover rate | 100.47% | 169.95% | f | 151.77% | 101.07% | 287.38% | 294.80% | |||||||||||||||||
Portfolio turnover rate excluding mortgage dollar rollsg | 80.53% | 98.83%f | 84.86% | 78.46% | 146.15% | 95.06% | ||||||||||||||||||
aThe amount shown for a share outstanding throughout the period may not correlate with the Consolidated Statement of Operations for the period due to the timing of sales and repurchases of the Fund’s shares in relation to income earned and/or fluctuating fair value of the investments of the Fund.
bBased on average daily shares outstanding.
cTotal return is not annualized for periods less than one year.
dRatios are annualized for periods less than one year, except for non-recurring expenses, if any.
eBenefit of expense reduction rounds to less than 0.01%.
fExcludes the value of portfolio activity as a result of in-kind transactions.
gSee Note 1(i) regarding mortgage dollar rolls.
98 | Semiannual Report | The accompanying notes are an integral part of these financial statements. | franklintempleton.com | ||
FRANKLIN INVESTORS SECURITIES TRUST
Consolidated Statement of Investments, April 30, 2020 (unaudited)
Franklin Total Return Fund
| Country/ Organization | Shares/ Warrants | Value | ||||||||||||||
Common Stocks and Other Equity Interests 0.0%† | ||||||||||||||||
Commercial & Professional Services 0.0%† | ||||||||||||||||
| a | Remington Outdoor Co. Inc. | United States | 52,019 | $ | 26,010 | |||||||||||
|
| |||||||||||||||
Consumer Services 0.0%† | ||||||||||||||||
| a,b,c | Turtle Bay Resort | United States | 1,550,567 | 34,112 | ||||||||||||
|
| |||||||||||||||
Energy 0.0%† | ||||||||||||||||
| a | Battalion Oil Corp. | United States | 531 | 2,602 | ||||||||||||
| a,c | Battalion Oil Corp., wts., A, 10/08/22 | United States | 2,551 | 7,557 | ||||||||||||
| a,c | Battalion Oil Corp., wts., B, 10/08/22 | United States | 3,189 | 9,338 | ||||||||||||
| a,c | Battalion Oil Corp., wts., C, 10/08/22 | United States | 4,100 | 11,831 | ||||||||||||
Riviera Resources Inc. | United States | 12,605 | 34,791 | |||||||||||||
| a | Weatherford International PLC | United States | 34,108 | 153,486 | ||||||||||||
|
| |||||||||||||||
| 219,605 | ||||||||||||||||
|
| |||||||||||||||
Materials 0.0%† | ||||||||||||||||
| a,c,d | Appvion Operations Inc. | United States | 13,033 | 241,708 | ||||||||||||
| a | Verso Corp., A | United States | 6,954 | 96,591 | ||||||||||||
| a | Verso Corp., wts., 7/25/23 | United States | 732 | 1,098 | ||||||||||||
|
| |||||||||||||||
| 339,397 | ||||||||||||||||
|
| |||||||||||||||
Retailing 0.0% | ||||||||||||||||
| a,c,d | K2016470219 South Africa Ltd., A | South Africa | 28,762,824 | — | ||||||||||||
| a,c,d | K2016470219 South Africa Ltd., B | South Africa | 2,862,311 | — | ||||||||||||
|
| |||||||||||||||
| — | ||||||||||||||||
|
| |||||||||||||||
Total Common Stocks and Other Equity Interests (Cost $7,661,737) | 619,124 | |||||||||||||||
|
| |||||||||||||||
Management Investment Companies 11.7% | ||||||||||||||||
Diversified Financials 11.7% | ||||||||||||||||
| e | Franklin Floating Rate Income Fund | United States | 1,549,310 | 10,984,609 | ||||||||||||
| e | Franklin Liberty High Yield Corporate ETF | United States | 3,830,000 | 89,845,672 | ||||||||||||
| e | Franklin Liberty Investment Grade Corporate ETF | United States | 18,335,000 | 467,909,200 | ||||||||||||
| e | Franklin Liberty Senior Loan ETF | United States | 914,900 | 21,308,021 | ||||||||||||
|
| |||||||||||||||
Total Management Investment Companies (Cost $596,840,900) | 590,047,502 | |||||||||||||||
|
| |||||||||||||||
Preferred Stocks (Cost $2,325,000) 0.0%† | ||||||||||||||||
Diversified Financials 0.0%† | ||||||||||||||||
Citigroup Capital XIII, 8.137%, pfd., 10/30/40 | United States | 93,000 | 2,489,610 | |||||||||||||
|
| |||||||||||||||
| | Principal Amount | * | ||||||||||||||
|
| |||||||||||||||
Corporate Bonds 21.3% | ||||||||||||||||
Automobiles & Components 0.3% | ||||||||||||||||
| f | Adient U.S. LLC, senior secured note, 144A, 7.00%, 5/15/26 | United States | 8,000,000 | 7,997,600 | ||||||||||||
| f | Allison Transmission Inc., senior bond, 144A, 5.875%, 6/01/29 | United States | 6,800,000 | 6,632,244 | ||||||||||||
|
| |||||||||||||||
| 14,629,844 | ||||||||||||||||
|
| |||||||||||||||
franklintempleton.com | Semiannual Report | 99 | ||||
FRANKLIN INVESTORS SECURITIES TRUST
CONSOLIDATED STATEMENT OF INVESTMENTS (UNAUDITED)
Franklin Total Return Fund (continued)
| Country/ Organization | | Principal Amount | * | Value | ||||||||||
Corporate Bonds (continued) | ||||||||||||||
Banks 3.1% | ||||||||||||||
| f | Akbank T.A.S., senior note, 144A, 5.125%, 3/31/25 | Turkey | 5,000,000 | $ | 4,588,495 | |||||||||
| g | Banca Monte dei Paschi di Siena SpA, secured note, Reg S, 2.125%, 11/26/63 | Italy | 20,000,000 | EUR | 23,494,897 | |||||||||
| Bank of America Corp, senior note, 2.592% to 4/29/30, FRN thereafter, 2.59%, 4/29/31 | United States | 6,700,000 | 6,873,597 | |||||||||||
Bank of Montreal, senior note, 1.85%, 5/01/25 | Canada | 9,800,000 | 9,835,943 | |||||||||||
| g | BDO Unibank Inc., senior note, Reg S, 2.95%, 3/06/23 | Philippines | 1,600,000 | 1,591,829 | ||||||||||
Fifth Third Bancorp, senior note, 2.55%, 5/05/27 | United States | 6,100,000 | 6,087,983 | |||||||||||
| JPMorgan Chase & Co., senior bond, 4.493% to 3/23/30, FRN thereafter, 3/24/31 | United States | 32,100,000 | 38,048,270 | |||||||||||
Lloyds Banking Group PLC, senior note, 3.87%, 7/09/25 | United Kingdom | 2,500,000 | 2,633,121 | |||||||||||
| g | Realkredit Danmark A/S, | |||||||||||||
secured bond, Reg S, 1.00%, 4/01/27 | Denmark | 77,800,000 | DKK | 12,166,278 | ||||||||||
senior bond, 10F, Reg S, 1.00%, 4/01/29 | Denmark | 57,080,000 | DKK | 8,951,656 | ||||||||||
Royal Bank of Canada, secured note, 2.10%, 10/14/21 | Canada | 11,500,000 | 11,571,453 | |||||||||||
| SVB Financial Group, senior note, 3.50%, 1/29/25 | United States | 6,000,000 | 6,162,968 | |||||||||||
Wells Fargo & Co., sub. bond, 4.65%, 11/04/44 | United States | 10,000,000 | 11,728,281 | |||||||||||
| f | Westpac Banking Corp., senior secured note, 144A, 2.25%, 11/09/21 | Australia | 10,800,000 | 10,881,563 | ||||||||||
|
| |||||||||||||
| 154,616,334 | ||||||||||||||
|
| |||||||||||||
Capital Goods 1.1% | ||||||||||||||
| f | Ahern Rentals Inc., secured note, second lien, 144A, 7.375%, 5/15/23 | United States | 400,000 | 191,080 | ||||||||||
| Aircastle Ltd., senior note, 4.25%, 6/15/26 | United States | 2,800,000 | 2,341,262 | |||||||||||
Amcor Finance USA Inc., senior note, 3.625%, 4/28/26 | Australia | 11,800,000 | 12,360,214 | |||||||||||
| f | Beacon Roofing Supply Inc., senior note, 144A, 4.875%, 11/01/25 | United States | 6,100,000 | 5,422,595 | ||||||||||
Caterpillar Inc., senior note, 2.60%, 4/09/30 | United States | 17,800,000 | 18,883,988 | |||||||||||
| CNH Industrial NV, senior bond, 3.85%, 11/15/27 | United Kingdom | 4,600,000 | 4,597,733 | |||||||||||
Emerson Electric Co., senior bond, 2.75%, 10/15/50 | United States | 2,400,000 | 2,339,694 | |||||||||||
| General Electric Co., senior note, 3.45%, 5/01/27 | United States | 2,500,000 | 2,546,012 | |||||||||||
| f | The Manitowoc Co. Inc., secured note, second lien, 144A, 9.00%, 4/01/26 | United States | 400,000 | 362,380 | ||||||||||
| f | Navistar International Corp., senior secured note, 144A, 9.50%, 5/01/25 | United States | 2,700,000 | 2,841,750 | ||||||||||
| f | NCI Building Systems Inc., senior secured note, 144A, 8.00%, 4/15/26 | United States | 400,000 | 342,404 | ||||||||||
| c,h | Onsite Rental Group Operations Pty. Ltd., secured note, PIK, 6.10%, 10/26/23 | Australia | 183,113 | 133,901 | ||||||||||
| f | Resideo Funding Inc., senior note, 144A, 6.125%, 11/01/26 | United States | 6,000,000 | 5,287,800 | ||||||||||
|
| |||||||||||||
| 57,650,813 | ||||||||||||||
|
| |||||||||||||
Commercial & Professional Services 0.1% | ||||||||||||||
| f | Harsco Corp., senior note, 144A, 5.75%, 7/31/27 | United States | 5,000,000 | 4,745,000 | ||||||||||
| f | Intrado Corp., senior note, 144A, 8.50%, 10/15/25 | United States | 2,700,000 | 1,903,905 | ||||||||||
|
| |||||||||||||
| 6,648,905 | ||||||||||||||
|
| |||||||||||||
Consumer Durables & Apparel 0.1% | ||||||||||||||
| f | Ashton Woods USA LLC/Ashton Woods Finance Co., senior note, 144A, 6.75%, 8/01/25 | United States | 4,600,000 | 3,920,580 | ||||||||||
|
| |||||||||||||
100 | Semiannual Report | franklintempleton.com | ||
FRANKLIN INVESTORS SECURITIES TRUST
CONSOLIDATED STATEMENT OF INVESTMENTS (UNAUDITED)
Franklin Total Return Fund (continued)
| Country/ Organization | | Principal Amount | * | Value | ||||||||||
Corporate Bonds (continued) | ||||||||||||||
Consumer Services 0.1% | ||||||||||||||
| f | Wynn Las Vegas LLC/Wynn Las Vegas Capital Corp., senior bond, 144A, 5.25%, 5/15/27 | United States | 6,000,000 | $ | 5,145,150 | |||||||||
|
| |||||||||||||
Diversified Financials 1.5% | ||||||||||||||
| Capital One Bank USA NA, sub. bond, 3.375%, 2/15/23 | United States | 6,000,000 | 6,096,156 | |||||||||||
GE Capital International Funding Co., senior bond, 3.373%, 11/15/25 | United States | 17,000,000 | 17,506,864 | |||||||||||
| The Goldman Sachs Group Inc., senior note, 3.75%, 2/25/26 | United States | 6,300,000 | 6,796,395 | |||||||||||
Goldman Sachs Group Inc., senior note, 2.60%, 2/07/30 | United States | 10,000,000 | 9,899,046 | |||||||||||
| Jyske Realkredit A/S, secured note, 1.00%, 4/01/26 | Denmark | 68,400,000 | DKK | 10,654,415 | ||||||||||
Morgan Stanley, senior unsecured note, 2.188% to 4/28/25, FRN thereafter, 4/28/26 | United States | 2,200,000 | 2,226,562 | |||||||||||
| Springleaf Finance Corp., | ||||||||||||||
senior bond, 5.375%, 11/15/29 | United States | 3,000,000 | 2,504,520 | |||||||||||
senior note, 6.625%, 1/15/28 | United States | 4,000,000 | 3,548,600 | |||||||||||
| g | TNB Global Ventures Capital Bhd., senior note, Reg S, 3.244%, 10/19/26 | Malaysia | 4,300,000 | 4,386,151 | ||||||||||
| f | UBS AG/London, senior note, 144A, 1.75%, 4/21/22 | Switzerland | 10,000,000 | 10,048,998 | ||||||||||
|
| |||||||||||||
| 73,667,707 | ||||||||||||||
|
| |||||||||||||
Energy 1.1% | ||||||||||||||
| f | Aker BP ASA, senior note, 144A, 4.75%, 6/15/24 | Norway | 3,400,000 | 3,154,143 | ||||||||||
| Baker Hughes a GE Co. LLC/Baker Hughes Co-Obligor Inc., | ||||||||||||||
senior note, 4.486%, 5/01/30 | United States | 800,000 | 822,960 | |||||||||||
senior bond, 4.08%, 12/15/47 | United States | 1,200,000 | 1,016,971 | |||||||||||
Canadian Natural Resources Ltd., senior bond, 3.85%, 6/01/27 | Canada | 10,000,000 | 9,302,712 | |||||||||||
| Cheniere Corpus Christi Holdings LLC, senior secured note, first lien, 5.875%, 3/31/25 | United States | 1,600,000 | 1,659,671 | |||||||||||
Enable Midstream Partners LP, | ||||||||||||||
senior bond, 5.00%, 5/15/44 | United States | 1,200,000 | 759,614 | |||||||||||
senior note, 3.90%, 5/15/24 | United States | 3,600,000 | 2,909,479 | |||||||||||
| Energy Transfer Operating LP, senior bond, 5.15%, 2/01/43 | United States | 6,000,000 | 4,972,929 | |||||||||||
EnLink Midstream LLC, senior bond, 5.375%, 6/01/29 | United States | 400,000 | 250,320 | |||||||||||
| EOG Resources Inc., senior bond, 4.375%, 4/15/30 | United States | 1,100,000 | 1,229,401 | |||||||||||
Exxon Mobil Corp., senior bond, 2.61%, 10/15/30 | United States | 6,100,000 | 6,366,088 | |||||||||||
| f | Harvest Operations Corp., senior note, 144A, 4.20%, 6/01/23 | South Korea | 3,800,000 | 4,089,180 | ||||||||||
Martin Midstream Partners LP/Martin Midstream Finance Corp., senior note, 7.25%, 2/15/21 | United States | 800,000 | 325,800 | |||||||||||
| MPLX LP, | ||||||||||||||
senior bond, 4.00%, 2/15/25 | United States | 4,600,000 | 4,379,254 | |||||||||||
senior bond, 4.70%, 4/15/48 | United States | 2,000,000 | 1,792,909 | |||||||||||
Murphy Oil USA Inc., senior bond, 4.75%, 9/15/29 | United States | 3,700,000 | 3,827,095 | |||||||||||
| i | Sanchez Energy Corp., senior note, 6.125%, 1/15/23 | United States | 3,000,000 | 22,500 | ||||||||||
Sunoco Logistics Partners Operations LP, senior note, 4.25%, 4/01/24 | United States | 6,100,000 | 6,020,014 | |||||||||||
| f | Tullow Oil PLC, senior note, 144A, 7.00%, 3/01/25 | Ghana | 600,000 | 315,750 | ||||||||||
Valaris PLC, senior bond, 5.75%, 10/01/44 | Saudi Arabia | 700,000 | 62,020 | |||||||||||
| f | Weatherford International Ltd., senior note, 144A, 11.00%, 12/01/24 | United States | 1,032,000 | 759,810 | ||||||||||
|
| |||||||||||||
| 54,038,620 | ||||||||||||||
|
| |||||||||||||
| franklintempleton.com | Semiannual Report |
|
101 |
| ||
FRANKLIN INVESTORS SECURITIES TRUST
CONSOLIDATED STATEMENT OF INVESTMENTS (UNAUDITED)
Franklin Total Return Fund (continued)
| Country/ Organization | | Principal Amount | * | Value | ||||||||||
Corporate Bonds (continued) | ||||||||||||||
Food & Staples Retailing 0.5% | ||||||||||||||
| f | Cencosud SA, senior note, 144A, 4.375%, 7/17/27 | Chile | 9,700,000 | $ | 9,123,745 | |||||||||
Costco Wholesale Corp., senior note, 1.375%, 6/20/27 | United States | 6,900,000 | 6,944,213 | |||||||||||
| Kroger Co/The, senior unsecured bond, 2.20%, 5/01/30 | United States | 6,900,000 | 6,931,368 | |||||||||||
|
| |||||||||||||
| 22,999,326 | ||||||||||||||
|
| |||||||||||||
Food, Beverage & Tobacco 1.3% | ||||||||||||||
Anheuser-Busch InBev Worldwide Inc., senior bond, 3.50%, 6/01/30 | Belgium | 10,400,000 | 11,115,885 | |||||||||||
| B&G Foods Inc., senior note, 5.25%, 9/15/27 | United States | 7,000,000 | 7,099,610 | |||||||||||
Bunge Ltd. Finance Corp., senior note, 3.25%, 8/15/26 | United States | 12,000,000 | 11,915,018 | |||||||||||
| Diageo Capital PLC., senior note, 2.00%, 4/29/30 | United Kingdom | 10,000,000 | 9,975,892 | |||||||||||
| f | JBS USA LUX SA/JBS USA Food Co./JBS USA Finance Inc., senior bond, 144A, 5.50%, 1/15/30 | United States | 5,200,000 | 5,289,180 | ||||||||||
| Kraft Heinz Foods Co., senior bond, 3.00%, 6/01/26 | United States | 5,100,000 | 5,068,987 | |||||||||||
| f | Post Holdings Inc., senior bond, 144A, 4.625%, 4/15/30 | United States | 5,800,000 | 5,720,192 | ||||||||||
| Reynolds American Inc., | ||||||||||||||
senior bond, 5.70%, 8/15/35 | United Kingdom | 9,300,000 | 10,900,531 | |||||||||||
senior bond, 5.85%, 8/15/45 | United Kingdom | 300,000 | 352,998 | |||||||||||
|
| |||||||||||||
| 67,438,293 | ||||||||||||||
|
| |||||||||||||
Health Care Equipment & Services 1.1% | ||||||||||||||
Anthem Inc., senior bond, 2.25%, 5/15/30 | United States | 4,500,000 | 4,483,125 | |||||||||||
| f | Centene Corp., | |||||||||||||
senior bond, 144A, 4.625%, 12/15/29 | United States | 1,900,000 | 2,089,335 | |||||||||||
senior note, 144A, 4.25%, 12/15/27 | United States | 2,400,000 | 2,522,160 | |||||||||||
CHS/Community Health Systems Inc., | ||||||||||||||
f senior secured note, 144A, 8.00%, 3/15/26 | United States | 4,000,000 | 3,853,120 | |||||||||||
senior secured note, first lien, 6.25%, 3/31/23 | United States | 4,000,000 | 3,745,000 | |||||||||||
| Cigna Corp., | ||||||||||||||
senior note, 4.125%, 11/15/25 | United States | 5,900,000 | 6,625,407 | |||||||||||
senior note, 2.40%, 3/15/30 | United States | 10,000,000 | 10,097,783 | |||||||||||
CVS Health Corp., senior bond, 4.30%, 3/25/28 | United States | 11,800,000 | 13,317,920 | |||||||||||
| Edwards Lifesciences Corp., senior note, 4.30%, 6/15/28 | United States | 1,700,000 | 1,946,613 | |||||||||||
| f | MEDNAX Inc., senior note, 144A, 6.25%, 1/15/27 | United States | 5,200,000 | 4,741,048 | ||||||||||
|
| |||||||||||||
| 53,421,511 | ||||||||||||||
|
| |||||||||||||
Household & Personal Products 0.2% | ||||||||||||||
| Avon Products Inc., senior bond, 7.00%, 3/15/23 | United Kingdom | 8,800,000 | 8,432,688 | |||||||||||
|
| |||||||||||||
Insurance 1.9% | ||||||||||||||
| Aflac Inc., | ||||||||||||||
senior note, 0.932%, 1/25/27 | United States | 1,400,000,000 | JPY | 13,121,984 | ||||||||||
senior note, 3.60%, 4/01/30 | United States | 6,000,000 | 6,736,126 | |||||||||||
| f | Liberty Mutual Group Inc., senior bond, 144A, 4.569%, 2/01/29 | United States | 12,000,000 | 13,468,294 | ||||||||||
| f | Metropolitan Life Global Funding I, senior note, 144A, 2.95%, 4/09/30 | United States | 18,700,000 | 20,097,743 | ||||||||||
Prudential PLC, senior note, 3.125%, 4/14/30 | United Kingdom | 18,000,000 | 18,606,894 | |||||||||||
| f | Teachers Insurance & Annuity Assn. of America, sub. bond, 144A, 4.90%, 9/15/44 | United States | 20,400,000 | 26,093,817 | ||||||||||
|
| |||||||||||||
| 98,124,858 | ||||||||||||||
|
| |||||||||||||
102 | Semiannual Report | franklintempleton.com | ||
FRANKLIN INVESTORS SECURITIES TRUST
CONSOLIDATED STATEMENT OF INVESTMENTS (UNAUDITED)
Franklin Total Return Fund (continued)
| | Country/ Organization |
| Principal Amount* | Value | ||||||||||||
| ||||||||||||||||
Corporate Bonds (continued) | ||||||||||||||||
Materials 1.0% | ||||||||||||||||
Air Products and Chemicals Inc., senior bond, 2.05%, 5/15/30 | United States | 4,900,000 | $ | 4,993,550 | ||||||||||||
| f | Braskem Netherlands Finance BV, senior bond, 144A, 4.50%, 1/31/30 | Brazil | 11,800,000 | 9,587,500 | ||||||||||||
| f | Mauser Packaging Solutions Holding Co., senior note, 144A, 7.25%, 4/15/25 | United States | 8,000,000 | 6,310,000 | ||||||||||||
| f | Novelis Corp., senior bond, 144A, 4.75%, 1/30/30 | United States | 5,000,000 | 4,473,500 | ||||||||||||
| f | Plastipak Holdings Inc., senior note, 144A, 6.25%, 10/15/25 | United States | 7,300,000 | 6,563,065 | ||||||||||||
Reliance Steel & Aluminum Co., senior note, 4.50%, 4/15/23 | United States | 5,600,000 | 5,821,554 | |||||||||||||
| f | Reynolds Group Issuer Inc./Reynolds Group Issuer LLC/Reynolds Group Issuer Luxembourg SA, senior note, 144A, 7.00%, 7/15/24 | United States | 6,000,000 | 6,050,400 | ||||||||||||
| f | SunCoke Energy Partners LP/SunCoke Energy Partners Finance Corp., senior note, 144A, 7.50%, 6/15/25 | United States | 7,500,000 | 5,765,625 | ||||||||||||
|
| |||||||||||||||
| 49,565,194 | ||||||||||||||||
|
| |||||||||||||||
| Media & Entertainment 0.9% | ||||||||||||||||
AMC Entertainment Holdings Inc., senior sub. bond, 5.75%, 6/15/25 | United States | 800,000 | 186,000 | |||||||||||||
| f | CCO Holdings LLC / CCO Holdings Capital Corp., senior note, 144A, 4.00%, 3/01/23 | United States | 2,000,000 | 2,026,700 | ||||||||||||
| f | CCO Holdings LLC/CCO Holdings Capital Corp., senior bond, 144A, 5.00%, 2/01/28 | United States | 1,500,000 | 1,551,975 | ||||||||||||
Charter Communications Operating LLC/Charter Communications Operating Capital, senior bond, 2.80%, 4/01/31 | United States | 8,100,000 | 8,164,640 | |||||||||||||
| f | CSC Holdings LLC, senior bond, 144A, 5.375%, 2/01/28 | United States | 3,000,000 | 3,149,550 | ||||||||||||
| f | Diamond Sports Group LLC/Diamond Sports Finance Co., first lien, 144A, 5.375%, 8/15/26 | United States | 6,200,000 | 4,741,140 | ||||||||||||
DISH DBS Corp., | ||||||||||||||||
senior bond, 5.00%, 3/15/23 | United States | 2,600,000 | 2,492,750 | |||||||||||||
senior note, 5.875%, 11/15/24 | United States | 3,000,000 | 2,901,120 | |||||||||||||
| f | Live Nation Entertainment Inc., senior note, 144A, 4.75%, 10/15/27 | United States | 3,000,000 | 2,578,920 | ||||||||||||
Netflix Inc., | ||||||||||||||||
senior bond, 4.875%, 4/15/28 | United States | 1,800,000 | 1,925,514 | |||||||||||||
f senior bond, 144A, 5.375%, 11/15/29 | United States | 6,000,000 | 6,617,400 | |||||||||||||
| f | Nexstar Broadcasting Inc., senior note, 144A, 5.625%, 7/15/27 | United States | 4,900,000 | 4,702,285 | ||||||||||||
| f | Univision Communications Inc., senior secured note, first lien, 144A, 5.125%, 2/15/25 | United States | 5,300,000 | 4,683,875 | ||||||||||||
|
| |||||||||||||||
| 45,721,869 | ||||||||||||||||
|
| |||||||||||||||
| Pharmaceuticals, Biotechnology & Life Sciences 0.8% | ||||||||||||||||
| f | AbbVie Inc., senior note, 144A, 3.20%, 11/21/29 | United States | 10,000,000 | 10,620,469 | ||||||||||||
| f | Bausch Health Cos. Inc., | |||||||||||||||
senior bond, 144A, 6.125%, 4/15/25 | United States | 1,800,000 | 1,828,485 | |||||||||||||
senior note, 144A, 5.00%, 1/30/28 | United States | 1,500,000 | 1,443,450 | |||||||||||||
Biogen Inc., | ||||||||||||||||
senior bond, 2.25%, 5/01/30 | United States | 3,500,000 | 3,487,524 | |||||||||||||
senior bond, 5.20%, 9/15/45 | United States | 18,200,000 | 23,786,201 | |||||||||||||
|
| |||||||||||||||
| 41,166,129 | ||||||||||||||||
|
| |||||||||||||||
franklintempleton.com | Semiannual Report | 103 | ||||
FRANKLIN INVESTORS SECURITIES TRUST
CONSOLIDATED STATEMENT OF INVESTMENTS (UNAUDITED)
Franklin Total Return Fund (continued)
| | Country/ Organization |
| Principal Amount* | Value | ||||||||||||
| ||||||||||||||||
Corporate Bonds (continued) | ||||||||||||||||
Real Estate 0.2% | ||||||||||||||||
| f | Five Point Operating Co. LP/Five Point Capital Corp., senior note, 144A, 7.875%, 11/15/25 | United States | 600,000 | $ | 584,250 | |||||||||||
National Retail Properties Inc., senior bond, 4.30%, 10/15/28 | United States | 9,700,000 | 9,789,796 | |||||||||||||
|
| |||||||||||||||
| 10,374,046 | ||||||||||||||||
|
| |||||||||||||||
| Retailing 0.0%† | ||||||||||||||||
| c,f,h | K2016470219 South Africa Ltd., senior secured note, 144A, PIK, 3.00%, 12/31/22 | South Africa | 2,313,828 | 2,864 | ||||||||||||
| c,f,h | K2016470260 South Africa Ltd., senior secured note, 144A, PIK, 25.00%, 12/31/22 | South Africa | 609,326 | 2,812 | ||||||||||||
| f | Party City Holdings Inc., senior note, 144A, 6.625%, 8/01/26 | United States | 5,100,000 | 529,125 | ||||||||||||
|
| |||||||||||||||
| 534,801 | ||||||||||||||||
|
| |||||||||||||||
| Semiconductors & Semiconductor Equipment 0.5% | ||||||||||||||||
| f | Amkor Technology Inc., senior note, 144A, 6.625%, 9/15/27 | United States | 1,000,000 | 1,032,150 | ||||||||||||
Maxim Integrated Products Inc., senior note, 3.375%, 3/15/23 | United States | 22,000,000 | 22,691,412 | |||||||||||||
|
| |||||||||||||||
| 23,723,562 | ||||||||||||||||
|
| |||||||||||||||
| Software & Services 0.2% | ||||||||||||||||
Fiserv Inc., senior bond, 3.85%, 6/01/25 | United States | 9,300,000 | 10,240,657 | |||||||||||||
|
| |||||||||||||||
| Technology Hardware & Equipment 0.3% | ||||||||||||||||
| f | CommScope Inc., senior bond, 144A, 5.50%, 6/15/24 | United States | 2,000,000 | 1,803,260 | ||||||||||||
| f | CommScope Technologies LLC, senior bond, 144A, 5.00%, 3/15/27 | United States | 5,000,000 | 4,306,500 | ||||||||||||
| f | Presidio Holdings Inc., senior note, 144A, 8.25%, 2/01/28 | United States | 7,000,000 | 6,951,350 | ||||||||||||
|
| |||||||||||||||
| 13,061,110 | ||||||||||||||||
|
| |||||||||||||||
| Telecommunication Services 0.6% | ||||||||||||||||
| f | Altice France Holding SAsenior note, 144A, 10.50%, 5/15/27 | Luxembourg | 600,000 | 649,560 | ||||||||||||
| f | Altice France SA/France, senior secured note, 144A, 5.50%, 1/15/28 | France | 5,000,000 | 5,072,750 | ||||||||||||
Hughes Satellite Systems Corp., senior bond, 6.625%, 8/01/26 | United States | 5,000,000 | 5,385,500 | |||||||||||||
| f | T-Mobile USA Inc., senior secured bond, 144A, 3.875%, 4/15/30 | United States | 18,000,000 | 19,779,300 | ||||||||||||
|
| |||||||||||||||
| 30,887,110 | ||||||||||||||||
|
| |||||||||||||||
Transportation 1.3% | ||||||||||||||||
Burlington Northern and Santa Fe 99-2 Trust, secured bond, 7.57%, 1/02/21 | United States | 4,608 | 4,699 | |||||||||||||
FedEx Corp., senior note, 3.80%, 5/15/25 | United States | 18,000,000 | 19,256,938 | |||||||||||||
| f | Kazakhstan Temir Zholy Finance BV, senior bond, 144A, 6.95%, 7/10/42 | Kazakhstan | 7,400,000 | 8,537,935 | ||||||||||||
| f | Mexico City Airport Trust, senior secured bond, first lien, 144A, 5.50%, 7/31/47 | Mexico | 4,500,000 | 3,773,700 | ||||||||||||
| g,j | RZD Capital PLC, (Russian Railways), loan participation, senior bond, Reg S, 5.70%, 4/05/22 | Russia | 11,600,000 | 12,215,960 | ||||||||||||
| f | Transurban Finance Co. Pty. Ltd., senior secured bond, 144A, 4.125%, 2/02/26 | Australia | 7,200,000 | 7,767,618 | ||||||||||||
Union Pacific Railroad Co. 2005 Pass Through Trust, 2005-1, 5.082%, 1/02/29 | United States | 93,404 | 100,580 | |||||||||||||
United Parcel Service Inc., senior bond, 5.30%, 4/01/50 | United States | 10,000,000 | 14,313,272 | |||||||||||||
|
| |||||||||||||||
| 65,970,702 | ||||||||||||||||
|
| |||||||||||||||
| 104 |
Semiannual Report | franklintempleton.com | ||
FRANKLIN INVESTORS SECURITIES TRUST
CONSOLIDATED STATEMENT OF INVESTMENTS (UNAUDITED)
Franklin Total Return Fund (continued)
| | Country/ Organization |
| Principal Amount* | Value | ||||||||||||
| ||||||||||||||||
Corporate Bonds (continued) | ||||||||||||||||
Utilities 3.1% | ||||||||||||||||
| f | Calpine Corp., senior note, 144A, 5.125%, 3/15/28 | United States | 6,000,000 | $ | 5,887,500 | |||||||||||
| f | Colbun SA, senior note, 144A, 3.15%, 3/06/30 | Chile | 4,400,000 | 4,218,500 | ||||||||||||
Commonwealth Edison Co., secured bond, 6.45%, 1/15/38 | United States | 700,000 | 1,039,054 | |||||||||||||
Dominion Energy Inc., | ||||||||||||||||
senior note, 4.25%, 6/01/28 | United States | 10,000,000 | 11,237,830 | |||||||||||||
senior note, 3.375%, 4/01/30 | United States | 4,351,000 | 4,733,433 | |||||||||||||
Duke Energy Corp., senior bond, 3.15%, 8/15/27 | United States | 15,400,000 | 16,439,972 | |||||||||||||
| f,k | EDF SA, junior sub. note, 144A, 5.25% to 1/29/23, FRN thereafter, Perpetual | France | 24,000,000 | 23,591,760 | ||||||||||||
Exelon Corp., senior bond, 4.05%, 4/15/30 | United States | 16,900,000 | 19,310,379 | |||||||||||||
Georgia Power Co., senior bond, 4.30%, 3/15/42 | United States | 9,000,000 | 10,478,282 | |||||||||||||
| f | InterGen NV, secured bond, 144A, 7.00%, 6/30/23 | Netherlands | 1,900,000 | 1,695,750 | ||||||||||||
| f | Israel Electric Corp. Ltd., secured bond, 144A, 4.25%, 8/14/28 | Israel | 6,700,000 | 7,101,229 | ||||||||||||
The Southern Co., | ||||||||||||||||
senior bond, 3.25%, 7/01/26 | United States | 7,950,000 | 8,503,614 | |||||||||||||
senior bond, 3.70%, 4/30/30 | United States | 13,900,000 | 15,456,991 | |||||||||||||
| f | State Grid Overseas Investment 2016 Ltd., | |||||||||||||||
senior note, 144A, 3.50%, 5/04/27 | China | 10,700,000 | 11,688,269 | |||||||||||||
senior note, 144A, 4.25%, 5/02/28 | China | 6,700,000 | 7,770,009 | |||||||||||||
| f | Talen Energy Supply LLC, | |||||||||||||||
senior note, 144A, 10.50%, 1/15/26 | United States | 1,500,000 | 1,246,305 | |||||||||||||
senior secured note, 144A, 7.25%, 5/15/27 | United States | 5,500,000 | 5,470,575 | |||||||||||||
Virginia Electric & Power Co., senior bond, 6.35%, 11/30/37 | United States | 520,000 | 735,733 | |||||||||||||
|
| |||||||||||||||
| 156,605,185 | ||||||||||||||||
|
| |||||||||||||||
Total Corporate Bonds (Cost $1,067,703,122) | 1,068,584,994 | |||||||||||||||
|
| |||||||||||||||
| l,m | Senior Floating Rate Interests 3.1% | |||||||||||||||
| Automobiles & Components 0.1% | ||||||||||||||||
Adient U.S. LLC, Initial Term Loans, 5.45% - 5.742%, (3-month USD LIBOR + 4.00%), 5/06/24 | United States | 4,074,237 | 3,698,641 | |||||||||||||
Clarios Global LP (Power Solutions), Initial Dollar Term Loan, 3.904%, (1-month USD LIBOR + 3.50%), 4/30/26 | United States | 977,544 | 888,343 | |||||||||||||
Thor Industries Inc., Initial USD Term Loans, 4.625% - 4.75%, (1-month USD LIBOR + 3.75%), 2/01/26 | United States | 2,840,883 | 2,614,797 | |||||||||||||
|
| |||||||||||||||
| 7,201,781 | ||||||||||||||||
|
| |||||||||||||||
| Capital Goods 0.2% | ||||||||||||||||
| h | Alloy Finco Ltd., Term Loan B, PIK, 14.00%, 3/06/25 | United States | 101,699 | 49,578 | ||||||||||||
Altra Industrial Motion Corp., Term Loan, 2.404%, (1-month USD LIBOR + 2.00%), 10/01/25 | United States | 1,594,790 | 1,517,044 | |||||||||||||
| n | Dynasty Acquisition Co. Inc., | |||||||||||||||
Initial Term B-1 Loan, 4.95%, (3-month USD LIBOR + 3.50%), 4/04/26 | United States | 795,431 | 703,625 | |||||||||||||
Initial Term B-2 Loan (CAD), 4.95%, (3-month USD LIBOR + 3.50%), 4/04/26 | United States | 427,651 | 378,293 | |||||||||||||
franklintempleton.com | Semiannual Report | 105 | ||||
FRANKLIN INVESTORS SECURITIES TRUST
CONSOLIDATED STATEMENT OF INVESTMENTS (UNAUDITED)
Franklin Total Return Fund (continued)
Country/ Organization | Principal Amount* | Value | ||||||||||||||
| ||||||||||||||||
| l,m | Senior Floating Rate Interests (continued) | |||||||||||||||
| Capital Goods (continued) | ||||||||||||||||
Navistar Inc., Tranche B Term Loan, 4.22%, (1-month USD LIBOR + 3.50%), 11/06/24 | United States | 3,413,807 | $ | 3,117,943 | ||||||||||||
Onsite Rental Group Operations Pty. Ltd., Term Loan, 5.50%, (1-month USD LIBOR + 4.50%), 10/25/22 | Australia | 133,931 | 110,493 | |||||||||||||
Strike, LLC, | ||||||||||||||||
Term Loan, 9.45%, (3-month USD LIBOR + 8.00%), 11/30/22 | United States | 86,443 | 73,476 | |||||||||||||
Term Loan, 9.072%, (6-month USD LIBOR + 8.00%), 11/30/22 | United States | 5,705,226 | 4,849,442 | |||||||||||||
|
| |||||||||||||||
| 10,799,894 | ||||||||||||||||
|
| |||||||||||||||
| Commercial & Professional Services 0.2% | ||||||||||||||||
Nielsen Finance LLC (VNU Inc.), Class B-4 Term Loans, 2.864%, (1-month USD LIBOR + 2.00%), 10/04/23 | United States | 3,681,026 | 3,568,294 | |||||||||||||
Pitney Bowes Inc., Incremental Tranche Term B Loans, 5.91%, (1-month USD LIBOR + 5.50%), 1/07/25 | United States | 1,744,616 | 1,512,002 | |||||||||||||
Prime Security Services Borrower LLC, Term B-1, 4.266%, (1-month USD LIBOR + 3.25%), 9/12/26 | United States | 2,232,812 | 2,138,382 | |||||||||||||
United Rentals North America Inc., Initial Term Loans, 2.154%, (1-month USD LIBOR + 1.75%), 10/31/25 | United States | 2,533,957 | 2,435,992 | |||||||||||||
Ventia Pty. Ltd., Term B Loans, 4.95%, (3-month USD LIBOR + 3.50%), 5/21/26 | Australia | 1,941,848 | 1,786,500 | |||||||||||||
|
| |||||||||||||||
| 11,441,170 | ||||||||||||||||
|
| |||||||||||||||
| Consumer Durables & Apparel 0.0%† | ||||||||||||||||
Champ Acquisition Corp., Initial Term Loan, 6.572%, (3-month USD LIBOR + 5.50%), 12/21/25 | United States | 645,865 | 579,664 | |||||||||||||
Playtika Holding Corp., Term B Loans, 7.072%, (3-month USD LIBOR + 6.00%), 12/10/24 | United States | 1,471,375 | 1,462,179 | |||||||||||||
|
| |||||||||||||||
| 2,041,843 | ||||||||||||||||
|
| |||||||||||||||
| Consumer Services 0.2% | ||||||||||||||||
24 Hour Fitness Worldwide Inc., Term Loan, 4.95%, (3-month USD LIBOR + 3.50%), 5/30/25 | United States | 3,314,697 | 904,809 | |||||||||||||
Caesars Resort Collection LLC, Term B Loans, 3.154%, (1-month USD LIBOR + 2.75%), 12/22/24 | United States | 3,128,198 | 2,644,632 | |||||||||||||
Eldorado Resorts Inc., Initial Term Loan, 3.25%, (3-month USD LIBOR + 2.25%), 4/17/24 | United States | 1,695,099 | 1,622,704 | |||||||||||||
Equinox Holdings Inc., Term B-1 Loans, 4.072%, (1-month USD LIBOR + 3.00%), 3/08/24 | United States | 1,780,612 | 1,422,820 | |||||||||||||
KFC Holding Co./Pizza Hut Holdings LLC/Taco Bell of America LLC (Yum Brands), Term Loan B, 2.468%, (1-month USD LIBOR + 1.75%), 4/03/25 | United States | 2,969,697 | 2,856,941 | |||||||||||||
NASCAR Holdings Inc., Initial Term Loans, 3.375%, (1-month USD LIBOR + 2.75%), 10/18/26 | United States | 2,246,491 | 2,110,699 | |||||||||||||
|
| |||||||||||||||
| 11,562,605 | ||||||||||||||||
|
| |||||||||||||||
| 106 |
Semiannual Report | franklintempleton.com | ||
FRANKLIN INVESTORS SECURITIES TRUST
CONSOLIDATED STATEMENT OF INVESTMENTS (UNAUDITED)
Franklin Total Return Fund (continued)
Country/ Organization | | Principal Amount | * | Value | ||||||||||||
| l,m | Senior Floating Rate Interests (continued) | |||||||||||||||
Diversified Financials 0.2% | ||||||||||||||||
| n | Asurion LLC, Replacement B-6 Term Loans, 3.404%, (1-month USD LIBOR + 3.00%), 11/03/23 | United States | 1,795,268 | $ | 1,722,709 | |||||||||||
| n | First Eagle Holdings Inc., Initial Term Loan, 3.95%, (3-month USD LIBOR + 2.50%), 2/01/27 | United States | 5,333,333 | 4,973,333 | ||||||||||||
Trans Union LLC, 2019 Replacement Term B-5 Loans, 2.154%, (1-month USD LIBOR + 1.75%), 11/15/26 | United States | 2,421,635 | 2,325,779 | |||||||||||||
|
| |||||||||||||||
| 9,021,821 | ||||||||||||||||
|
| |||||||||||||||
Energy 0.1% | ||||||||||||||||
| Buckeye Partners LP, Initial Term Loans, 3.766%, (1-month USD LIBOR + 2.75%), 11/01/26 | United States | 1,370,000 | 1,292,937 | |||||||||||||
| n | Centurion Pipeline Co. LLC, Initial Term Loans, 3.654%, (1-month USD LIBOR + 3.25%), 9/28/25 | United States | 1,337,770 | 1,180,582 | ||||||||||||
| i | Fieldwood Energy LLC, Closing Date Loans, 6.25%, (3-month USD LIBOR + 5.25%), 4/11/22 | United States | 5,877,828 | 1,498,846 | ||||||||||||
Utex Industries Inc., | ||||||||||||||||
Initial Term Loan (First Lien), 5.311%, (3-month USD LIBOR + 4.00%), 5/21/21 | United States | 358,741 | 99,252 | |||||||||||||
Second Lien Initial Term Loan, 8.561%, (3-month USD LIBOR + 7.25%), 5/20/22 | United States | 37,581 | 5,199 | |||||||||||||
|
| |||||||||||||||
| 4,076,816 | ||||||||||||||||
|
| |||||||||||||||
Food & Staples Retailing 0.1% | ||||||||||||||||
| Aramark Corp., | ||||||||||||||||
U.S. Term B-2 Loan, 2.154%, (1-month USD LIBOR + 1.75%), 3/28/24 | United States | 2,657,462 | 2,529,904 | |||||||||||||
U.S. Term B-4 Loan, 2.154%, (1-month USD LIBOR + 1.75%), 1/15/27 | United States | 960,000 | 908,250 | |||||||||||||
Whatabrands LLC (Whataburger), 2020 Refinancing Term Loans, 3.732%, (1-month USD LIBOR + 2.75%), 8/02/26 | United States | 486,406 | 452,358 | |||||||||||||
|
| |||||||||||||||
| 3,890,512 | ||||||||||||||||
|
| |||||||||||||||
Food, Beverage & Tobacco 0.2% | ||||||||||||||||
| B&G Foods Inc., Tranche B-4 Term Loan, 2.904%, (1-month USD LIBOR + 2.50%), 10/10/26 | United States | 2,769,817 | 2,701,148 | |||||||||||||
CSM Bakery Supplies LLC, Second Lien Term Loan, 9.10%, (3-month USD LIBOR + 7.75%), 7/03/21 | United States | 337,282 | 258,582 | |||||||||||||
| JBS USA Lux SA, New Term Loans, 3.072%, (3-month USD LIBOR + 2.00%), 5/01/26 | United States | 4,607,024 | 4,470,974 | |||||||||||||
|
| |||||||||||||||
| 7,430,704 | ||||||||||||||||
|
| |||||||||||||||
| Health Care Equipment & Services 0.3% | ||||||||||||||||
Catalent Pharma Solutions Inc., Dollar Term B-2 Loan, 3.25%, (1-month USD LIBOR + 2.25%), 5/17/26 | United States | 1,994,962 | 1,970,025 | |||||||||||||
| DaVita Inc., Tranche B-1 Term Loan, 2.154%, (1-month USD LIBOR + 1.75%), 8/12/26 | United States | 4,657,515 | 4,549,083 | |||||||||||||
IQVIA Inc., | ||||||||||||||||
Term B-2 Dollar Loans, 2.154%, (1-month USD LIBOR + 1.75%), 1/20/25 | United States | 1,003,234 | 969,625 | |||||||||||||
Term B-3 Dollar Loans, 3.20%, (3-month USD LIBOR + 1.75%), 6/11/25 | United States | 2,874,118 | 2,776,398 | |||||||||||||
| franklintempleton.com |
Semiannual Report | 107 | ||||
FRANKLIN INVESTORS SECURITIES TRUST
CONSOLIDATED STATEMENT OF INVESTMENTS (UNAUDITED)
Franklin Total Return Fund (continued)
| | Country/ Organization | | | Principal Amount | * | Value | ||||||||||||
| l,m | Senior Floating Rate Interests (continued) | |||||||||||||||||
Health Care Equipment & Services (continued) | ||||||||||||||||||
National Mentor Holdings Inc., | ||||||||||||||||||
Initial Term C Loans, 5.71%, (3-month USD LIBOR + 4.25%), 3/08/26 | United States | 18,208 | $ | 17,389 | ||||||||||||||
Initial Term Loans, 4.66%, (1-month USD LIBOR + 4.25%), 3/08/26 | United States | 287,693 | 274,747 | |||||||||||||||
Initial Term Loans, 5.71%, (3-month USD LIBOR + 4.25%), 3/08/26 | United States | 113,231 | 108,136 | |||||||||||||||
Phoenix Guarantor Inc., Tranche B-1 Term Loan, 4.079%, (1-month USD LIBOR + 3.25%), 3/05/26 | United States | 1,666,389 | 1,566,406 | |||||||||||||||
| n | Inovalon Holdings Inc., Refinancing Date Term Loans, FRN, 3.875%, (1-month USD LIBOR + 3.00%), 4/02/25 | United States | 144,582 | 140,606 | ||||||||||||||
US Anesthesia Partners Inc., First Lien Term Loan, 4.00%, (3-month USD LIBOR + 3.00%), 6/23/24 | United States | 392,325 | 337,399 | |||||||||||||||
|
| |||||||||||||||||
| 12,709,814 | ||||||||||||||||||
|
| |||||||||||||||||
| Household & Personal Products 0.0%† | ||||||||||||||||||
| c | FGI Operating Co. LLC (Freedom Group), | |||||||||||||||||
h Term Loan, PIK, 12.00%, (3-month USD LIBOR + 10.00%), 5/15/22 | United States | 594,141 | 519,022 | |||||||||||||||
Term Loan FILO, 9.50%, (3-month USD LIBOR + 7.50%), 5/15/21 | United States | 1,127,442 | 1,122,392 | |||||||||||||||
Knowlton Development Corp., Initial Term Loan, 4.154%, (1-month USD LIBOR + 3.75%), 12/21/25 | United States | 227,566 | 205,378 | |||||||||||||||
|
| |||||||||||||||||
| 1,846,792 | ||||||||||||||||||
|
| |||||||||||||||||
| Insurance 0.1% | ||||||||||||||||||
Alliant Holdings Intermediate LLC/Alliant Holdings Co-Issue, Initial Term Loan, 3.154%, (1-month USD LIBOR + 2.75%), 5/10/25 | United States | 1,546,197 | 1,452,943 | |||||||||||||||
AssuredPartners Inc., 2020 February Refinancing Term Loans, 3.904%, (1-month USD LIBOR + 3.50%), 2/13/27 | United States | 997,500 | 939,146 | |||||||||||||||
|
| |||||||||||||||||
| 2,392,089 | ||||||||||||||||||
|
| |||||||||||||||||
| Materials 0.2% | ||||||||||||||||||
Appvion Operations Inc., | ||||||||||||||||||
Term Loan, 7.00%, (3-month USD LIBOR + 6.00%), 6/15/26 | United States | 188,939 | 185,160 | |||||||||||||||
Term Loan, 8.25%, (Prime + 5.00%), 6/15/26 | United States | 787 | 771 | |||||||||||||||
| n | Arconic Corp., Initial Term Loans, 3.24%, (1-month USD LIBOR + 2.75%), 2/04/27 | United States | 2,430,000 | 2,417,850 | ||||||||||||||
Axalta Coating Systems U.S. Holdings Inc. (DuPont Performance Coatings), Term B-3 Dollar Loan, 3.20%, (3-month USD LIBOR + 1.75%), 6/01/24 | United States | 2,492,724 | 2,434,146 | |||||||||||||||
| n,o | Mauser Packaging Solutions Holding Co., Initial Term Loan, TBD, 4/03/24 | United States | 930,000 | 806,775 | ||||||||||||||
Oxbow Carbon LLC, Tranche B Term Loan, 4.154%, (1-month USD LIBOR + 3.75%), 1/04/23 | United States | 2,466,273 | 2,231,977 | |||||||||||||||
|
| |||||||||||||||||
| 8,076,679 | ||||||||||||||||||
|
| |||||||||||||||||
| Media & Entertainment 0.3% | ||||||||||||||||||
| n,o | Banijay Group US Holding Inc., Facility B (USD) Loan, TBD, 2/03/25 | France | 680,000 | 630,700 | ||||||||||||||
Charter Communications Operating LLC (CCO Safari III LLC), Term B-2 Loan, 2.16%, (1-month USD LIBOR + 1.75%), 2/01/27 | United States | 2,969,886 | 2,867,532 | |||||||||||||||
Diamond Sports Group LLC, Term Loan, 3.82%, (1-month USD LIBOR + 3.25%), 8/24/26 | United States | 4,863,345 | 3,990,982 | |||||||||||||||
108 |
Semiannual Report |
franklintempleton.com | ||
FRANKLIN INVESTORS SECURITIES TRUST
CONSOLIDATED STATEMENT OF INVESTMENTS (UNAUDITED)
Franklin Total Return Fund (continued)
| | Country/ Organization |
| | Principal Amount | * | Value | ||||||||
| l,m | Senior Floating Rate Interests (continued) | |||||||||||||
| Media & Entertainment (continued) | ||||||||||||||
Gray Television Inc., Term C Loan, 3.493%, (1-month USD LIBOR + 2.50%), 1/02/26 | United States | 3,381,175 | $ | 3,205,777 | ||||||||||
Lions Gate Capital Holdings LLC, Term A Loan, 2.154%, (1-month USD LIBOR + 1.75%), 3/22/23 | Canada | 1,586,465 | 1,495,243 | |||||||||||
Mediacom Illinois LLC, Tranche N Term Loan, 1.90%, (1-week USD LIBOR + 1.75%), 2/15/24 | United States | 1,431,102 | 1,386,380 | |||||||||||
Sinclair Television Group Inc., Tranche B Term Loans, 2.66%, (1-month USD LIBOR + 2.25%), 1/03/24 | United States | 989,770 | 928,528 | |||||||||||
WideOpenWest Finance LLC, Term B Loan, 4.25%, (1-month USD LIBOR + 3.25%), 8/19/23 | United States | 537,084 | 504,188 | |||||||||||
|
| |||||||||||||
| 15,009,330 | ||||||||||||||
|
| |||||||||||||
| Pharmaceuticals, Biotechnology & Life Sciences 0.2% | ||||||||||||||
eResearch Technology Inc., Initial Term Loan, 5.50%, (1-month USD LIBOR + 4.50%), 2/04/27 | United States | 345,454 | 327,696 | |||||||||||
Grifols Worldwide Operations USA Inc., Dollar Tranche B Term Loan, 2.137%, (1-week USD LIBOR + 2.00%), 11/15/27 | United States | 1,535,187 | 1,516,820 | |||||||||||
Horizon Pharma Inc., Seventh Amendment Refinancing Term Loans, 3.25%, (1-month USD LIBOR + 2.25%), 5/22/26 | United States | 3,179,283 | 3,118,345 | |||||||||||
Valeant Pharmaceuticals International, | ||||||||||||||
First Incremental Term Loan, 3.468%, (1-month USD LIBOR + 2.75%), 11/27/25 | United States | 2,550,000 | 2,464,848 | |||||||||||
Initial Term Loans, 3.718%, (1-month USD LIBOR + 3.00%), 6/02/25 | United States | 291,777 | 282,902 | |||||||||||
|
| |||||||||||||
| 7,710,611 | ||||||||||||||
|
| |||||||||||||
| Real Estate 0.0%† | ||||||||||||||
Cushman & Wakefield U.S. Borrower LLC, Replacement Term Loan, 3.154%, (1-month USD LIBOR + 2.75%), 8/21/25 | United States | 700,000 | 651,750 | |||||||||||
|
| |||||||||||||
| Retailing 0.1% | ||||||||||||||
Bass Pro Group LLC, Initial Term Loans, 6.072%, (3-month USD LIBOR + 5.00%), 9/25/24 | United States | 1,243,622 | 1,040,912 | |||||||||||
General Nutrition Centers, Inc., | ||||||||||||||
Tranche B-2 Term Loans, 9.50%, (1-month USD LIBOR + 8.75%), 3/04/21 | United States | 436,774 | 308,199 | |||||||||||
Tranche B-2 Term Loans, 10.37%, (3-month USD LIBOR + 8.75%), 3/04/21 | United States | 588,606 | 415,335 | |||||||||||
Harbor Freight Tools USA Inc., Refinancing Loans, 3.25%, (1-month USD LIBOR + 2.50%), 8/19/23 | United States | 2,129,009 | 2,027,881 | |||||||||||
Michaels Stores, Inc., | ||||||||||||||
2018 New Replacement Term B Loan, 3.50%, (1-month USD LIBOR + 2.50%), 1/28/23 | United States | 1,370,630 | 1,130,770 | |||||||||||
2018 New Replacement Term B Loan, 3.558% - 3.568%, (3-month USD LIBOR + 2.50%), 1/28/23 | United States | 1,612,306 | 1,330,152 | |||||||||||
Staples Inc., 2019 Refinancing Term B-1 Loans, 6.016%, (1-month USD LIBOR + 5.00%), 4/12/26 | United States | 474,415 | 381,311 | |||||||||||
|
| |||||||||||||
| 6,634,560 | ||||||||||||||
|
| |||||||||||||
| Semiconductors & Semiconductor Equipment 0.0%† | ||||||||||||||
ON Semiconductor Corp., 2019 Replacement Term B-4 Loans, 2.404%, (1-month USD LIBOR + 2.00%), 9/18/26 | United States | 1,239,178 | 1,195,806 | |||||||||||
|
| |||||||||||||
franklintempleton.com |
.Semiannual Report |
|
109 |
| ||
FRANKLIN INVESTORS SECURITIES TRUST
CONSOLIDATED STATEMENT OF INVESTMENTS (UNAUDITED)
Franklin Total Return Fund (continued)
| | Country/ Organization |
| | Principal Amount | * | Value | ||||||||
| l,m | Senior Floating Rate Interests (continued) | |||||||||||||
| Software & Services 0.3% | ||||||||||||||
DCert Buyer Inc., Initial Term Loans, 4.404%, (1-month USD LIBOR + 4.00%), 10/16/26 | United States | 1,890,000 | $ | 1,793,926 | ||||||||||
Go Daddy Operating Co. LLC, Tranche B-2 Term Loan, 2.154%, (1-month USD LIBOR + 1.75%), 2/15/24 | United States | 4,793,810 | 4,663,979 | |||||||||||
| n | Hyland Software Inc., Term Loans, 4.00%, (1-month USD LIBOR + 3.25%), 7/01/24 | United States | 397,500 | 383,041 | ||||||||||
Infor (U.S.) Inc. (Lawson), Tranche B-6 Term Loan, 3.75%, (1-month USD LIBOR + 2.75%), 2/01/22 | United States | 994,872 | 980,777 | |||||||||||
LegalZoom.com Inc., 2018 Term Loans, 4.904%, (1-month USD LIBOR + 4.50%), 11/21/24 | United States | 3,290,162 | 3,068,076 | |||||||||||
| n | Solera LLC, Dollar Term Loan, 4.363%, (3-month USD LIBOR + 2.75%), 3/03/23 | United States | 3,269,482 | 3,111,458 | ||||||||||
Surf Holdings LLC (Sophos), Dollar Tranche Term Loan, 4.814%, (3-month USD LIBOR + 3.50%), 3/05/27 | United States | 765,898 | 706,541 | |||||||||||
TIBCO Software Inc., Term B-3 Loans, 4.16%, (1-month USD LIBOR + 3.75%), 7/31/26 | United States | 780,000 | 735,637 | |||||||||||
Verscend Holding Corp., Term B Loans, 4.904%, (1-month USD LIBOR + 4.50%), 7/27/25 | United States | 498,734 | 472,785 | |||||||||||
Waystar (Navicure Inc), Initial Term Loans, 4.404%, (1-month USD LIBOR + 4.00%), 10/22/26 | United States | 1,000,000 | 940,000 | |||||||||||
|
| |||||||||||||
| 16,856,220 | ||||||||||||||
|
| |||||||||||||
| Technology Hardware & Equipment 0.0%† | ||||||||||||||
CommScope Inc., Initial Term Loans, 3.654%, (1-month USD LIBOR + 3.25%), 4/04/26 | United States | 2,487,500 | 2,362,503 | |||||||||||
|
| |||||||||||||
| Telecommunication Services 0.1% | ||||||||||||||
Global Tel*Link Corp., | ||||||||||||||
First Lien Term Loan, 5.70%, (3-month USD LIBOR + 4.25%), 11/29/25 | United States | 1,047,329 | 918,231 | |||||||||||
Second Lien Term Loan, 9.70%, (3-month USD LIBOR + 8.25%), 11/29/26 | United States | 127,673 | 103,202 | |||||||||||
Aventiv Technologies LLC, Second Lien Initial Loan, 9.25%, (3-month USD LIBOR + 8.25%), 11/01/25 | United States | 416,510 | 260,319 | |||||||||||
Zayo Group Holdings Inc (Front Range BidCo), Initial Dollar Term Loan, 3.404%, (1-month USD LIBOR + 3.00%), 3/09/27 | United States | 1,700,000 | 1,601,720 | |||||||||||
|
| |||||||||||||
| 2,883,472 | ||||||||||||||
|
| |||||||||||||
| Transportation 0.2% | ||||||||||||||
Air Canada, Term Loans, 2.468%, (1-month USD LIBOR + 1.75%), 10/06/23 | Canada | 40,466 | 36,925 | |||||||||||
Allegiant Travel Co., Class B Term Loan, 4.707%, (3-month USD LIBOR + 3.00%), 2/05/24 | United States | 2,336,917 | 1,869,534 | |||||||||||
Avis Budget Car Rental LLC, Tranche B Term Loans, 2.66%, (1-month USD LIBOR + 2.25%), 8/06/27 | United States | 3,766,794 | 2,629,222 | |||||||||||
| n | The Kenan Advantage Group Inc., Initial Canadian Term Loan, 4.00%, (1-month USD LIBOR + 3.00%), 7/29/22 | United States | 383,230 | 321,594 | ||||||||||
| n | Kenan Advantage Group Inc., Initial U.S. Term Loans, 4.00%, (1-month USD LIBOR + 3.00%), 7/31/22 | United States | 1,611,553 | 1,352,362 | ||||||||||
Westjet Airlines Ltd., Initial Term Loan, 4.00%, (1-month USD LIBOR + 3.00%), 12/11/26 | Canada | 1,682,841 | 1,381,613 | |||||||||||
|
| |||||||||||||
| 7,591,250 | ||||||||||||||
|
| |||||||||||||
110 |
Semiannual Report |
franklintempleton.com | ||
FRANKLIN INVESTORS SECURITIES TRUST
CONSOLIDATED STATEMENT OF INVESTMENTS (UNAUDITED)
Franklin Total Return Fund (continued)
| | Country/ Organization |
| | Principal Amount | * | Value | ||||||||||||
| l,m | Senior Floating Rate Interests (continued) | |||||||||||||||||
Utilities 0.0%† | ||||||||||||||||||
EFS Cogen Holdings I LLC (Linden), | ||||||||||||||||||
Term B Advance, 4.25%, (1-month USD LIBOR + 3.25%), 6/28/23 | United States | 331,235 | $ | 320,832 | ||||||||||||||
Term B Advance, 4.71%, (3-month USD LIBOR + 3.25%), 6/28/23 | United States | 798,414 | 773,339 | |||||||||||||||
|
| |||||||||||||||||
| 1,094,171 | ||||||||||||||||||
|
| |||||||||||||||||
Total Senior Floating Rate Interests | 154,482,193 | |||||||||||||||||
|
| |||||||||||||||||
| p | Marketplace Loans 0.2% | |||||||||||||||||
Diversified Financials 0.2% | ||||||||||||||||||
| c | Lending Club LCX, 6.46% - 25.65%, 7/15/22 - 2/24/25 | United States | 5,253,356 | 4,898,948 | ||||||||||||||
| c | Upgrade, 13.64% - 30.99%, 10/11/22 - 4/14/25 | United States | 4,694,397 | 4,202,564 | ||||||||||||||
|
| |||||||||||||||||
Total Marketplace Loans (Cost $9,825,933) | 9,101,512 | |||||||||||||||||
|
| |||||||||||||||||
Foreign Government and Agency Securities 3.3% | ||||||||||||||||||
| f | Angolan Government International Bond, senior note, 144A, 8.25%, 5/09/28 | Angola | 16,700,000 | 7,431,817 | ||||||||||||||
| g | Banque Centrale de Tunisie International Bond, senior note, Reg S, 5.625%, 2/17/24 | Tunisia | 16,500,000 | EUR | 15,058,402 | |||||||||||||
| f | Banque Ouest Africaine de Developpement, senior note, 144A, 5.00%, 7/27/27 | Supranationalq | 10,700,000 | 9,991,981 | ||||||||||||||
| f | Dominican Republic, senior note, 144A, 8.90%, 2/15/23 | Dominican Republic | 727,200,000 | DOP | 11,880,331 | |||||||||||||
| f | Government of Belarus International Bond, senior note, 144A, 7.625%, 6/29/27 | Belarus | 13,300,000 | 13,188,347 | ||||||||||||||
Government of Colombia, | ||||||||||||||||||
senior bond, 9.85%, 6/28/27 | Colombia | 27,300,000,000 | COP | 7,901,906 | ||||||||||||||
senior bond, 5.00%, 6/15/45 | Colombia | 13,000,000 | 13,097,500 | |||||||||||||||
| f | Government of Gabon, | |||||||||||||||||
144A, 6.375%, 12/12/24 | Gabon | 6,878,488 | 4,985,666 | |||||||||||||||
senior note, 144A, 6.625%, 2/06/31 | Gabon | 11,000,000 | 7,846,130 | |||||||||||||||
| f | Government of Kazakhstan, senior bond, 144A, 4.875%, 10/14/44 | Kazakhstan | 8,200,000 | 9,343,843 | ||||||||||||||
Government of Mexico, senior note, 4.15%, 3/28/27 | Mexico | 17,200,000 | 17,264,500 | |||||||||||||||
Government of Peru, senior bond, 6.55%, 3/14/37 | Peru | 5,700,000 | 8,214,327 | |||||||||||||||
Government of South Africa, senior bond, 7.00%, 2/28/31 | South Africa | 259,300,000 | ZAR | 10,836,428 | ||||||||||||||
| f | Government of Ukraine, | |||||||||||||||||
144A, 7.75%, 9/01/20 | Ukraine | 292,000 | 285,218 | |||||||||||||||
144A, 7.75%, 9/01/21 | Ukraine | 229,000 | 221,679 | |||||||||||||||
144A, 7.75%, 9/01/22 | Ukraine | 229,000 | 219,213 | |||||||||||||||
144A, 7.75%, 9/01/23 | Ukraine | 229,000 | 218,199 | |||||||||||||||
144A, 7.75%, 9/01/24 | Ukraine | 229,000 | 216,913 | |||||||||||||||
144A, 7.75%, 9/01/25 | Ukraine | 229,000 | 214,702 | |||||||||||||||
144A, 7.75%, 9/01/26 | Ukraine | 229,000 | 212,422 | |||||||||||||||
144A, 7.75%, 9/01/27 | Ukraine | 229,000 | 210,618 | |||||||||||||||
a,r144A, VRI, GDP Linked Security, 5/31/40 | Ukraine | 474,000 | 352,664 | |||||||||||||||
senior bond, 144A, 7.375%, 9/25/32 | Ukraine | 18,200,000 | 16,202,186 | |||||||||||||||
franklintempleton.com |
Semiannual Report |
|
111 |
| ||
FRANKLIN INVESTORS SECURITIES TRUST
CONSOLIDATED STATEMENT OF INVESTMENTS (UNAUDITED)
Franklin Total Return Fund (continued)
| | Country/ Organization |
| | Principal Amount | * | Value | ||||||||||||
Foreign Government and Agency Securities | ||||||||||||||||||
| s | Government of Uruguay, senior bond, Index Linked, 3.70%, 6/26/37 | Uruguay | 535,199,903 | UYU | $ | 11,649,343 | ||||||||||||
|
| |||||||||||||||||
Total Foreign Government and Agency Securities | 167,044,335 | |||||||||||||||||
|
| |||||||||||||||||
U.S. Government and Agency Securities 12.9% | ||||||||||||||||||
U.S. Treasury Bond, | ||||||||||||||||||
2.50%, 2/15/46 | United States | 18,400,000 | 23,329,906 | |||||||||||||||
2.25%, 8/15/46 | United States | 58,500,000 | 71,040,937 | |||||||||||||||
2.75%, 11/15/47 | United States | 19,500,000 | 26,120,098 | |||||||||||||||
3.125%, 5/15/48 | United States | 10,500,000 | 15,053,555 | |||||||||||||||
3.00%, 8/15/48 | United States | 17,000,000 | 23,910,234 | |||||||||||||||
2.875%, 5/15/49 | United States | 14,000,000 | 19,392,188 | |||||||||||||||
2.25%, 8/15/49 | United States | 29,500,000 | 36,396,777 | |||||||||||||||
s Index Linked, 1.75%, 1/15/28 | United States | 49,385,931 | 57,471,922 | |||||||||||||||
s Index Linked, 3.625%, 4/15/28 | United States | 43,178,371 | 56,744,670 | |||||||||||||||
U.S. Treasury Note, | ||||||||||||||||||
2.00%, 8/31/21 | United States | 2,600,000 | 2,663,324 | |||||||||||||||
1.25%, 8/31/24 | United States | 30,500,000 | 31,702,129 | |||||||||||||||
1.50%, 9/30/24 | United States | 48,700,000 | 51,174,949 | |||||||||||||||
s Index Linked, 1.25%, 7/15/20 | United States | 9,488,192 | 9,408,436 | |||||||||||||||
s Index Linked, 0.125%, 4/15/22 | United States | 8,508,526 | 8,438,473 | |||||||||||||||
s Index Linked, 0.125%, 7/15/22 | United States | 6,973,544 | 6,968,885 | |||||||||||||||
s Index Linked, 0.125%, 1/15/23 | United States | 7,059,651 | 7,059,508 | |||||||||||||||
s Index Linked, 0.625%, 1/15/24 | United States | 8,313,991 | 8,539,198 | |||||||||||||||
s Index Linked, 0.125%, 7/15/24 | United States | 74,618,369 | 75,864,080 | |||||||||||||||
s Index Linked, 0.25%, 1/15/25 | United States | 4,368,166 | 4,476,185 | |||||||||||||||
s Index Linked, 0.375%, 7/15/25 | United States | 45,809,728 | 47,613,758 | |||||||||||||||
s Index Linked, 0.625%, 1/15/26 | United States | 14,695,576 | 15,494,622 | |||||||||||||||
s Index Linked, 0.375%, 7/15/27 | United States | 45,266,409 | 47,916,809 | |||||||||||||||
|
| |||||||||||||||||
Total U.S. Government and Agency Securities | 646,780,643 | |||||||||||||||||
|
| |||||||||||||||||
Asset-Backed Securities and Commercial Mortgage-Backed Securities 29.3% | ||||||||||||||||||
Banks 0.6% | ||||||||||||||||||
| t | Commercial Mortgage Trust, | |||||||||||||||||
2006-GG7, AJ, FRN, 5.807%, 7/10/38 | United States | 3,599,000 | 2,195,390 | |||||||||||||||
2006-GG7, AM, FRN, 5.807%, 7/10/38 | United States | 715,026 | 712,282 | |||||||||||||||
| f,t | CSMC, 2009-15R, 3A1, 144A, FRN, 4.073%, 3/26/36 | United States | 273,788 | 273,300 | ||||||||||||||
| u | CWABS Inc. Asset-Backed Certificates, 2004-1, M1, FRN, 1.237%, (1-month USD LIBOR + 0.75%), 3/25/34 | United States | 565,733 | 556,628 | ||||||||||||||
| f,u | DBCG Mortgage Trust, 2017-BBG, A, 144A, FRN, 1.514%, (1-month USD LIBOR + 0.70%), 6/15/34 | United States | 9,840,000 | 9,398,175 | ||||||||||||||
| u | FNMA, 2005-122, FN, FRN, 0.837%, (1-month USD LIBOR + 0.35%), 1/25/36 | United States | 380,188 | 369,725 | ||||||||||||||
| t | GE Capital Commercial Mortgage Corp. Trust, 2007-C1, AM, FRN, 5.606%, 12/10/49 | United States | 1,086,242 | 925,868 | ||||||||||||||
112 |
Semiannual Report |
franklintempleton.com | ||
FRANKLIN INVESTORS SECURITIES TRUST
CONSOLIDATED STATEMENT OF INVESTMENTS (UNAUDITED)
Franklin Total Return Fund (continued)
| | Country/ Organization |
| | Principal Amount | * | Value | ||||||||||||
Asset-Backed Securities and Commercial Mortgage-Backed Securities (continued) | ||||||||||||||||||
Banks (continued) | ||||||||||||||||||
| f | Government of Iraq, 144A, 5.80%, 1/15/28 | Iraq | 18,000,000 | $ | 13,230,000 | |||||||||||||
| u | Merrill Lynch Mortgage Investors Trust, 2003-A, 1A, FRN, 1.227%, (1-month USD LIBOR + 0.74%), 3/25/28 | United States | 509,622 | 477,538 | ||||||||||||||
| c | Weyerhaeuser Mortgage Co., 1984-A, 7.43%, 1/01/24 | United States | 8,917 | 8,917 | ||||||||||||||
|
| |||||||||||||||||
| 28,147,823 | ||||||||||||||||||
|
| |||||||||||||||||
Diversified Financials 28.7% | ||||||||||||||||||
| f,t | Adagio CLO VIII DAC, VIII-A, B1, 144A, FRN, 1.65%, 4/15/32 | Ireland | 2,050,000 | EUR | 2,090,036 | |||||||||||||
American Express Credit Account Master Trust, | ||||||||||||||||||
t2018-3, A, FRN, 1.134%, 10/15/25 | United States | 33,268,000 | 33,061,762 | |||||||||||||||
2019-3, A, 2.00%, 4/15/25 | United States | 14,405,000 | 14,827,899 | |||||||||||||||
| u | American Home Mortgage Investment Trust, 2004-3, 4A, FRN, 3.033%, (6-month USD LIBOR + 1.50%), 10/25/34 | United States | 724,600 | 707,536 | ||||||||||||||
| u | Ameriquest Mortgage Securities Inc. Asset-Backed Pass-Through Certificates, 2004-R4, M1, FRN, 1.312%, (1-month USD LIBOR + 0.825%), 6/25/34 | United States | 1,207,688 | 1,201,163 | ||||||||||||||
| f,t | AMMC CLO 15 Ltd., | |||||||||||||||||
2014-15A, ARR, 144A, FRN, 2.479%, 1/15/32 | United States | 3,000,000 | 2,842,425 | |||||||||||||||
2014-15A, BRR, 144A, FRN, 3.019%, 1/15/32 | United States | 922,984 | 873,810 | |||||||||||||||
| f,u | AMMC CLO 21 Ltd., 2017-21A, C, 144A, FRN, 3.863%, (3-month USD LIBOR + 2.10%), 11/02/30 | United States | 1,000,000 | 894,531 | ||||||||||||||
| f,u | AMMC CLO XI Ltd., | |||||||||||||||||
2012-11A, BR2, 144A, FRN, 2.36%, (3-month USD LIBOR + 1.60%), 4/30/31 | United States | 5,050,000 | 4,639,501 | |||||||||||||||
2012-11A, CR2, 144A, FRN, 2.66%, (3-month USD LIBOR + 1.90%), 4/30/31 | United States | 2,750,000 | 2,409,620 | |||||||||||||||
| f,u | Antares CLO Ltd., 2018-1A, B, 144A, FRN, 2.785%, (3-month USD LIBOR + 1.65%), 4/20/31 | United States | 12,900,000 | 12,026,893 | ||||||||||||||
| f,u | Ares CLO Ltd., 2018-48A, D, 144A, FRN, 3.835%, (3-month USD LIBOR + 2.70%), 7/20/30 | United States | 2,000,000 | 1,575,115 | ||||||||||||||
| f,t | Ares European CLO VIII BV, | |||||||||||||||||
8A, AR, 144A, FRN, 0.92%, 4/17/32 | Netherlands | 20,700,000 | EUR | 21,777,305 | ||||||||||||||
8A, BR, 144A, FRN, 1.60%, 4/17/32 | Netherlands | 2,900,000 | EUR | 2,947,835 | ||||||||||||||
| f,t | ARES LII CLO Ltd., | |||||||||||||||||
2019-52A, A2, 144A, FRN, 2.748%, 4/22/31 | United States | 1,382,114 | 1,230,253 | |||||||||||||||
2019-52A, B, 144A, FRN, 2.948%, 4/22/31 | United States | 6,000,000 | 5,744,205 | |||||||||||||||
2019-52A, C, 144A, FRN, 3.778%, 4/22/31 | United States | 2,500,000 | 2,335,780 | |||||||||||||||
| u | Argent Securities Inc. Asset-Backed Pass-Through Certificates, 2005-W2, A2C, FRN, 0.847%, (1-month USD LIBOR + 0.36%), 10/25/35 | United States | 1,398,947 | 1,396,773 | ||||||||||||||
| f,t | Armada Euro CLO IV DAC, 4A, B, 144A, FRN, 1.70%, 7/15/33 | Ireland | 5,100,000 | EUR | 5,098,395 | |||||||||||||
| f,u | Atrium XIII, | |||||||||||||||||
2013A, B, 144A, FRN, 2.543%, (3-month USD LIBOR + 1.50%), 11/21/30 | United States | 2,700,000 | 2,534,871 | |||||||||||||||
2013A, C, 144A, FRN, 2.843%, (3-month USD LIBOR + 1.80%), 11/21/30 | United States | 3,753,500 | 3,357,316 | |||||||||||||||
2013A, D, 144A, FRN, 3.743%, (3-month USD LIBOR + 2.70%), 11/21/30 | United States | 5,500,000 | 4,366,619 | |||||||||||||||
franklintempleton.com |
Semiannual Report |
|
113 |
| ||
FRANKLIN INVESTORS SECURITIES TRUST
CONSOLIDATED STATEMENT OF INVESTMENTS (UNAUDITED)
Franklin Total Return Fund (continued)
| | Country/ Organization |
| | Principal Amount | * | Value | ||||||||||||
Asset-Backed Securities and Commercial Mortgage-Backed Securities (continued) | ||||||||||||||||||
Diversified Financials (continued) | ||||||||||||||||||
| f,t | Atrium XIV LLC, 14A, A2A, 144A, FRN, 2.626%, 8/23/30 | United States | 7,400,000 | $ | 6,958,896 | |||||||||||||
| f,t | Atrium XV, 15A, A1, 144A, FRN, 2.213%, 1/23/31 | United States | 3,150,000 | 3,034,225 | ||||||||||||||
| f,t | Avoca CLO XVII Designated Activity Co., 17A, B1R, 144A, FRN, 1.70%, 10/15/32 | Ireland | 5,600,000 | EUR | 5,816,691 | |||||||||||||
| f,u | Bain Capital Credit CLO, | |||||||||||||||||
2018-1A, A1, 144A, FRN, 2.003%, (3-month USD LIBOR + 0.96%), 4/23/31 | United States | 12,000,000 | 11,452,341 | |||||||||||||||
2018-1A, A2, 144A, FRN, 2.193%, (3-month USD LIBOR + 1.15%), 4/23/31 | United States | 5,100,000 | 4,818,988 | |||||||||||||||
| f,t | BCC Middle Market CLO LLC, 2018-1A, A2, 144A, FRN, 3.285%, 10/20/30 | United States | 5,100,000 | 4,676,886 | ||||||||||||||
| f,u | Bellemeade Re Ltd., 2018-1A, M1B, 144A, FRN, 2.087%, (1-month USD LIBOR + 1.60%), 4/25/28 | United States | 5,472,111 | 5,330,989 | ||||||||||||||
| f,t | Blackrock European CLO IX DAC, | |||||||||||||||||
9A, A, 144A, FRN, 0.90%, 12/15/32 | Ireland | 17,350,000 | EUR | 18,222,501 | ||||||||||||||
9A, B, 144A, FRN, 1.55%, 12/15/32 | Ireland | 5,250,000 | EUR | 5,292,387 | ||||||||||||||
| f,t | BlueMountain CLO Ltd., | |||||||||||||||||
2014-2A, CR2, 144A, FRN, 3.335%, 10/20/30 | United States | 3,600,000 | 3,245,030 | |||||||||||||||
2018-3A, B, 144A, FRN, 2.761%, 10/25/30 | United States | 2,000,000 | 1,874,318 | |||||||||||||||
2018-3A, C, 144A, FRN, 3.191%, 10/25/30 | United States | 1,071,430 | 971,936 | |||||||||||||||
| f,t | BlueMountain CLO XXII Ltd., 2018-1A, B, 144A, FRN, 2.46%, 7/30/30 | United States | 272,725 | 252,892 | ||||||||||||||
| f,t | Bluemountain Fuji Eur CLO V DAC, | |||||||||||||||||
5A, A, 144A, FRN, 0.91%, 1/15/33 | Ireland | 20,950,000 | EUR | 21,985,243 | ||||||||||||||
5A, B, 144A, FRN, 1.55%, 1/15/33 | Ireland | 6,250,000 | EUR | 6,342,443 | ||||||||||||||
| f,u | BlueMountain Fuji U.S. CLO III Ltd., | |||||||||||||||||
2017-3A, C, 144A, FRN, 2.919%, (3-month USD LIBOR + 1.70%), 1/15/30 | United States | 2,300,000 | 2,038,497 | |||||||||||||||
2017-3A, D, 144A, FRN, 3.619%, (3-month USD LIBOR + 2.40%), 1/15/30 | United States | 1,600,000 | 1,246,090 | |||||||||||||||
| f | BRAVO Residential Funding Trust, | |||||||||||||||||
2019-1, A1C, 144A, 3.50%, 3/25/58 | United States | 15,035,690 | 15,234,922 | |||||||||||||||
t2019-2, A3, 144A, FRN, 3.50%, 10/25/44 | United States | 11,855,716 | 12,114,941 | |||||||||||||||
| f,t | Burnham Park CLO Ltd., 2016-1A, BR, 144A, FRN, 2.635%, 10/20/29 | United States | 1,488,189 | 1,423,440 | ||||||||||||||
| f,t | Buttermilk Park CLO Ltd., 2018-1A, C, 144A, FRN, 3.319%, 10/15/31 | United States | 1,452,380 | 1,315,495 | ||||||||||||||
Capital One Multi-Asset Execution Trust, 2015-A4, A4, 2.75%, 5/15/25 | United States | 13,430,000 | 13,957,444 | |||||||||||||||
| f,t | Carlyle Euro CLO DAC, 2019-2A, A1A, 144A, FRN, 1.11%, 8/15/32 | Ireland | 10,400,000 | EUR | 11,053,421 | |||||||||||||
| f,u | Carlyle Global Market Strategies CLO Ltd., | |||||||||||||||||
2014-1A, A1R2, 144A, FRN, 2.105%, (3-month USD LIBOR + 0.97%), 4/17/31 | United States | 723,713 | 690,712 | |||||||||||||||
2014-1A, A2R2, 144A, FRN, 2.265%, (3-month USD LIBOR + 1.13%), 4/17/31 | United States | 6,300,000 | 5,793,448 | |||||||||||||||
114 |
Semiannual Report |
franklintempleton.com | ||
FRANKLIN INVESTORS SECURITIES TRUST
CONSOLIDATED STATEMENT OF INVESTMENTS (UNAUDITED)
Franklin Total Return Fund (continued)
| | Country/ Organization |
| | Principal Amount | * | Value | ||||||||||
Asset-Backed Securities and Commercial Mortgage-Backed Securities (continued) | ||||||||||||||||
Diversified Financials (continued) | ||||||||||||||||
| f,t | Carlyle GMS Finance MM CLO LLC, 2015-1A, A2R, 144A, FRN, 3.419%, 10/15/31 | United States | 10,000,000 | $ | 9,097,116 | |||||||||||
| f,u | Carlyle U.S. CLO Ltd., | |||||||||||||||
2017-3A, B, 144A, FRN, 3.485%, (3-month USD LIBOR + 2.35%), 7/20/29 | United States | 1,000,000 | 880,320 | |||||||||||||
2017-4A, C, 144A, FRN, 4.019%, (3-month USD LIBOR + 2.80%), 1/15/30 | United States | 545,000 | 401,170 | |||||||||||||
2017-5A, A2, 144A, FRN, 2.535%, (3-month USD LIBOR + 1.40%), 1/20/30 | United States | 2,000,000 | 1,832,278 | |||||||||||||
2017-5A, B, 144A, FRN, 2.935%, (3-month USD LIBOR + 1.80%), 1/20/30 | United States | 7,000,000 | 6,164,186 | |||||||||||||
| f,u | Catamaran CLO Ltd., | |||||||||||||||
2014-2A, BR, 144A, FRN, 4.085%, (3-month USD LIBOR + 2.95%), 10/18/26 | United States | 6,401,000 | 6,245,398 | |||||||||||||
2015-1A, C2R, 144A, FRN, 3.048%, (3-month USD LIBOR + 1.95%), 4/22/27 | United States | 7,600,000 | 7,156,348 | |||||||||||||
| f,t | CIM Trust, | |||||||||||||||
2018-INV1, A4, 144A, FRN, 4.00%, 8/25/48 | United States | 8,612,948 | 8,901,752 | |||||||||||||
2019-INV1, A1, 144A, FRN, 4.00%, 2/25/49 | United States | 9,417,686 | 9,587,109 | |||||||||||||
2019-INV2, A3, 144A, FRN, 4.00%, 5/25/49 | United States | 15,802,891 | 16,183,551 | |||||||||||||
| t | Citibank Credit Card Issuance Trust, 2017-A7, A7, FRN, 1.291%, 8/08/24 | United States | 3,477,000 | 3,466,451 | ||||||||||||
| f,t | Citigroup Mortgage Loan Trust, 2013-A, A, 144A, FRN, 3.00%, 5/25/42 | United States | 399,548 | 379,844 | ||||||||||||
| f,t | Cole Park CLO Ltd., 2015-1A, BR, 144A, FRN, 2.735%, 10/20/28 | United States | 2,571,428 | 2,474,581 | ||||||||||||
| f,t | Columbia Cent CLO 27 Ltd., 2018-27A, A2A, 144A, FRN, 2.591%, 10/25/28 | United States | 769,230 | 729,544 | ||||||||||||
| f,l | Consumer Loan Underlying Bond CLUB Certificate Issuer Trust I, | |||||||||||||||
2018-14, PT, 144A, FRN, 9.461%, 9/16/41 | United States | 2,408,840 | 2,183,369 | |||||||||||||
2018-29, PT, 144A, FRN, 28.366%, 12/15/43 | United States | 1,281,964 | 947,136 | |||||||||||||
2019-26, PT, 144A, FRN, 19.324%, 8/15/44 | United States | 5,944,126 | 4,727,104 | |||||||||||||
2019-31, PT, 144A, FRN, 22.58%, 9/15/44 | United States | 5,457,787 | 4,318,122 | |||||||||||||
2019-37, PT, 144A, FRN, 21.925%, 10/17/44 | United States | 6,026,931 | 4,902,598 | |||||||||||||
2019-42, PT, 144A, FRN, 20.897%, 11/15/44 | United States | 6,764,448 | 5,402,848 | |||||||||||||
2019-51, PT, 144A, FRN, 17.718%, 1/15/45 | United States | 8,258,298 | 6,898,580 | |||||||||||||
2019-52, PT, 144A, FRN, 17.151%, 1/15/45 | United States | 8,039,338 | 6,805,586 | |||||||||||||
2019-S1, PT, 144A, FRN, 16.345%, 4/15/44 | United States | 4,110,015 | 3,236,007 | |||||||||||||
2019-S2, PT, 144A, FRN, 13.40%, 5/16/44 | United States | 3,326,748 | 2,635,446 | |||||||||||||
2019-S3, PT, 144A, FRN, 14.312%, 6/15/44 | United States | 4,276,364 | 3,344,238 | |||||||||||||
2019-S4, PT, 144A, FRN, 13.259%, 8/15/44 | United States | 4,957,625 | 3,949,014 | |||||||||||||
2019-S5, PT, 144A, FRN, 18.85%, 9/15/44 | United States | 4,905,738 | 3,957,013 | |||||||||||||
2019-S6, PT, 144A, FRN, 12.849%, 10/17/44 | United States | 4,682,919 | 3,790,310 | |||||||||||||
2019-S7, PT, 144A, FRN, 11.521%, 12/15/44 | United States | 4,972,986 | 4,021,578 | |||||||||||||
2019-S8, PT, 144A, FRN, 11.622%, 1/15/45 | United States | 6,228,027 | 5,074,242 | |||||||||||||
2020-2, PT, 144A, FRN, 15.85%, 3/15/45 | United States | 8,264,865 | 7,041,363 | |||||||||||||
2020-7, PT, 144A, FRN, 14.159%, 4/17/45 | United States | 5,493,192 | 4,735,430 |
| franklintempleton.com |
Semiannual Report | 115 | ||||
FRANKLIN INVESTORS SECURITIES TRUST
CONSOLIDATED STATEMENT OF INVESTMENTS (UNAUDITED)
Franklin Total Return Fund (continued)
| | Country/ Organization |
| | Principal Amount | * | Value | ||||||||||
Asset-Backed Securities and Commercial Mortgage-Backed Securities (continued) | ||||||||||||||||
Diversified Financials (continued) | ||||||||||||||||
| f,u | Cook Park CLO Ltd., 2018-1A, A2, 144A, FRN, 2.255%, (3-month USD LIBOR + 1.12%), 4/17/30 | United States | 6,000,000 | $ | 5,578,461 | |||||||||||
Credit Suisse First Boston Mortgage Securities Corp., 2004-6, 3A1, 5.00%, 5/25/26 | United States | 118,344 | 97,387 | |||||||||||||
| f,u | Dryden 42 Senior Loan Fund, 2016-42A, DR, 144A, FRN, 4.149%, (3-month USD LIBOR + 2.93%), 7/15/30 | United States | 800,000 | 632,340 | ||||||||||||
| f,t | Dryden 45 Senior Loan Fund, 2016-45A, CR, 144A, FRN, 3.419%, 10/15/30 | United States | 1,250,000 | 1,122,185 | ||||||||||||
| f,u | Dryden 49 Senior Loan Fund, 2017-49A, A, 144A, FRN, 2.345%, (3-month USD LIBOR + 1.21%), 7/18/30 | United States | 7,030,000 | 6,856,302 | ||||||||||||
| f,u | Dryden 50 Senior Loan Fund, 2017-50A, A1, 144A, FRN, 2.439%, (3-month USD LIBOR + 1.22%), 7/15/30 | United States | 5,660,000 | 5,513,570 | ||||||||||||
| f,u | Dryden 55 CLO Ltd., | |||||||||||||||
2018-55A, A1, 144A, FRN, 2.239%, (3-month USD LIBOR + 1.02%), 4/15/31 | United States | 23,362,000 | 22,655,299 | |||||||||||||
2018-55A, D, 144A, FRN, 4.069%, (3-month USD LIBOR + 2.85%), 4/15/31 | United States | 2,000,000 | 1,580,751 | |||||||||||||
| f,t | Eleven Madison Trust Mortgage Trust, 2015-11MD, A, 144A, FRN, 3.673%, 9/10/35 | United States | 3,255,000 | 3,454,048 | ||||||||||||
| f,u | Ellington CLO III Ltd., 2018-3A, A1, 144A, FRN, 2.785%, (3-month USD LIBOR + 1.65%), 7/20/30 | United States | 5,400,000 | 5,192,230 | ||||||||||||
| f,t | Euro-Galaxy III CLO BV, 2013-3A, B2ER, 144A, FRN, 1.50%, 1/17/31 | Netherlands | 2,550,000 | EUR | 2,704,971 | |||||||||||
FHLMC Structured Agency Credit Risk Debt Notes, | ||||||||||||||||
u 2014-DN1, M2, FRN, 2.687%, (1-month USD LIBOR + 2.20%), 2/25/24 | United States | 1,104,177 | 1,059,022 | |||||||||||||
u 2014-DN3, M3, FRN, 4.487%, (1-month USD LIBOR + 4.00%), 8/25/24 | United States | 12,345,703 | 10,041,559 | |||||||||||||
u 2014-DN4, M3, FRN, 5.037%, (1-month USD LIBOR + 4.55%), 10/25/24 | United States | 7,091,184 | 5,986,338 | |||||||||||||
u 2014-HQ1, M3, FRN, 4.587%, (1-month USD LIBOR + 4.10%), 8/25/24 | United States | 2,161,264 | 1,864,961 | |||||||||||||
u 2015-DN1, M3, FRN, 4.637%, (1-month USD LIBOR + 4.15%), 1/25/25 | United States | 7,474,686 | 6,484,980 | |||||||||||||
u 2015-DNA2, M3, FRN, 4.387%, (1-month USD LIBOR + 3.90%), 12/25/27 | United States | 23,913,016 | 23,842,999 | |||||||||||||
u 2015-DNA3, M2, FRN, 3.337%, (1-month USD LIBOR + 2.85%), 4/25/28 | United States | 4,329,160 | 4,258,522 | |||||||||||||
u 2015-DNA3, M3, FRN, 5.187%, (1-month USD LIBOR + 4.70%), 4/25/28 | United States | 3,330,000 | 3,371,861 | |||||||||||||
u 2015-HQ1, M3, FRN, 4.287%, (1-month USD LIBOR + 3.80%), 3/25/25 | United States | 15,487,068 | 14,260,983 | |||||||||||||
u 2015-HQ2, M3, FRN, 3.737%, (1-month USD LIBOR + 3.25%), 5/25/25 | United States | 4,580,000 | 3,786,978 | |||||||||||||
u 2015-HQA2, M2, FRN, 3.287%, (1-month USD LIBOR + 2.80%), 5/25/28 | United States | 204,385 | 203,111 | |||||||||||||
u 2016-DNA1, M2, FRN, 3.387%, (1-month USD LIBOR + 2.90%), 7/25/28 | United States | 191,071 | 190,568 | |||||||||||||
u 2016-DNA1, M3, FRN, 6.037%, (1-month USD LIBOR + 5.55%), 7/25/28 | United States | 29,600,000 | 30,083,830 |
116 | Semiannual Report | franklintempleton.com | ||
FRANKLIN INVESTORS SECURITIES TRUST
CONSOLIDATED STATEMENT OF INVESTMENTS (UNAUDITED)
Franklin Total Return Fund (continued)
| | Country/ Organization |
| | Principal Amount | * | Value | ||||||||||
Asset-Backed Securities and Commercial Mortgage-Backed Securities (continued) | ||||||||||||||||
Diversified Financials (continued) | ||||||||||||||||
FHLMC Structured Agency Credit Risk Debt Notes, (continued) | ||||||||||||||||
u 2016-DNA2, M3, FRN, 5.137%, (1-month USD LIBOR + 4.65%), 10/25/28 | United States | 16,820,007 | $ | 16,751,193 | ||||||||||||
u 2016-HQA2, M2, FRN, 2.737%, (1-month USD LIBOR + 2.25%), 11/25/28 | United States | 2,088,514 | 2,087,937 | |||||||||||||
u 2016-HQA2, M3, FRN, 5.637%, (1-month USD LIBOR + 5.15%), 11/25/28 | United States | 26,915,000 | 27,239,923 | |||||||||||||
u 2016-HQA3, M2, FRN, 1.837%, (1-month USD LIBOR + 1.35%), 3/25/29 | United States | 882,220 | 876,203 | |||||||||||||
t 2017-DNA1, M2, FRN, 3.737%, 7/25/29 | United States | 14,778,000 | 14,261,351 | |||||||||||||
t 2017-DNA2, M2, FRN, 3.937%, 10/25/29 | United States | 26,327,007 | 25,601,840 | |||||||||||||
u 2017-DNA3, M2, FRN, 2.987%, (1-month USD LIBOR + 2.50%), 3/25/30 | United States | 13,500,000 | 12,869,295 | |||||||||||||
t 2017-HQA1, M2, FRN, 4.037%, 8/25/29 | �� | United States | 21,367,186 | 19,932,544 | ||||||||||||
t 2017-HQA2, M2, FRN, 3.137%, 12/25/29 | United States | 7,760,000 | 6,972,854 | |||||||||||||
t 2017-HQA3, M2, FRN, 2.837%, 4/25/30 | United States | 8,312,592 | 7,349,600 | |||||||||||||
| f,t | Flagship CLO VIII Ltd, 2014-8A, BRR, 144A, FRN, 2.576%, 1/16/26 | United States | 1,590,000 | 1,525,909 | ||||||||||||
| f,u | Flagship CLO VIII Ltd., 2014-8A, ARR, 144A, FRN, 2.026%, (3-month USD LIBOR + 0.85%), 1/16/26 | United States | 2,418,405 | 2,403,535 | ||||||||||||
FNMA Connecticut Avenue Securities, | ||||||||||||||||
u 2013-C01, M2, FRN, 5.737%, (1-month USD LIBOR + 5.25%), 10/25/23 | United States | 9,163,806 | 7,938,894 | |||||||||||||
u 2014-C02, 1M2, FRN, 3.087%, (1-month USD LIBOR + 2.60%), 5/25/24 | United States | 20,365,616 | 15,578,155 | |||||||||||||
c,u 2014-C02, 2M2, FRN, 3.087%, (1-month USD LIBOR + 2.60%), 5/25/24 | United States | 7,090,084 | 5,693,029 | |||||||||||||
u 2014-C03, 1M2, FRN, 3.487%, (1-month USD LIBOR + 3.00%), 7/25/24 | United States | 24,253,656 | 18,931,820 | |||||||||||||
u 2014-C03, 2M2, FRN, 3.387%, (1-month USD LIBOR + 2.90%), 7/25/24 | United States | 2,535,080 | 1,994,408 | |||||||||||||
u 2014-C04, 1M1, FRN, 5.387%, (1-month USD LIBOR + 4.90%), 11/25/24 | United States | 18,346,698 | 14,768,041 | |||||||||||||
u 2014-C04, 2M2, FRN, 5.487%, (1-month USD LIBOR + 5.00%), 11/25/24 | United States | 3,103,450 | 2,765,661 | |||||||||||||
u 2015-C01, 1M2, FRN, 4.787%, (1-month USD LIBOR + 4.30%), 2/25/25 | United States | 2,547,423 | 2,068,002 | |||||||||||||
u 2015-C01, 2M2, FRN, 5.037%, (1-month USD LIBOR + 4.55%), 2/25/25 | United States | 8,769,224 | 7,717,159 | |||||||||||||
u 2015-C02, 1M2, FRN, 4.487%, (1-month USD LIBOR + 4.00%), 5/25/25 | United States | 12,280,859 | 10,195,014 | |||||||||||||
u 2015-C02, 2M2, FRN, 4.487%, (1-month USD LIBOR + 4.00%), 5/25/25 | United States | 3,068,555 | 2,678,861 | |||||||||||||
u 2015-C03, 1M2, FRN, 5.487%, (1-month USD LIBOR + 5.00%), 7/25/25 | United States | 8,813,348 | 6,654,999 | |||||||||||||
c,u 2015-C03, 2M2, FRN, 5.487%, (1-month USD LIBOR + 5.00%), 7/25/25 | United States | 3,190,758 | 2,483,877 | |||||||||||||
t 2016-C02, 1M2, FRN, 6.487%, 9/25/28 | United States | 16,279,105 | 16,724,107 | |||||||||||||
t 2016-C04, 1M2, FRN, 4.737%, 1/25/29 | United States | 15,776,112 | 15,654,742 | |||||||||||||
t 2016-C05, 2M2, FRN, 4.937%, 1/25/29 | United States | 16,443,666 | 16,303,600 |
franklintempleton.com | Semiannual Report | 117 | ||||
FRANKLIN INVESTORS SECURITIES TRUST
CONSOLIDATED STATEMENT OF INVESTMENTS (UNAUDITED)
Franklin Total Return Fund (continued)
| | Country/ Organization |
| | Principal Amount | * | Value | ||||||||||
Asset-Backed Securities and Commercial Mortgage-Backed Securities (continued) | ||||||||||||||||
Diversified Financials (continued) | ||||||||||||||||
FNMA Connecticut Avenue Securities, (continued) | ||||||||||||||||
t 2016-C07, 2M2, FRN, 4.837%, 5/25/29 | United States | 10,539,146 | $ | 10,440,136 | ||||||||||||
u 2017-C01, 1B1, FRN, 6.237%, (1-month USD LIBOR + 5.75%), 7/25/29 | United States | 5,375,000 | 4,562,980 | |||||||||||||
u 2017-C01, 1M2, FRN, 4.037%, (1-month USD LIBOR + 3.55%), 7/25/29 | United States | 23,740,069 | 23,024,270 | |||||||||||||
t 2017-C02, 2M2, FRN, 4.137%, 9/25/29 | United States | 10,556,688 | 10,094,837 | |||||||||||||
t 2017-C03, 1M2, FRN, 3.487%, 10/25/29 | United States | 27,670,000 | 26,522,401 | |||||||||||||
t 2017-C03, 2M2, FRN, 3.337%, 11/25/29 | United States | 6,125,851 | 5,684,589 | |||||||||||||
t 2017-C05, 1M2, FRN, 2.687%, 1/25/30 | United States | 26,275,785 | 24,601,087 | |||||||||||||
| f,u | Galaxy XXVII CLO Ltd., | |||||||||||||||
2018-27A, A, 144A, FRN, 2.712%, (3-month USD LIBOR + 1.02%), 5/16/31 | United States | 1,000,000 | 952,590 | |||||||||||||
2018-27A, C, 144A, FRN, 3.492%, (3-month USD LIBOR + 1.80%), 5/16/31 | United States | 4,000,000 | 3,532,993 | |||||||||||||
| f,u | Gilbert Park CLO Ltd., 2017-1A, B, 144A, FRN, 2.819%, (3-month USD LIBOR + 1.60%), 10/15/30 | United States | 1,000,000 | 953,750 | ||||||||||||
| u | GSAA Home Equity Trust, 2005-5, M3, FRN, 1.432%, (1-month USD LIBOR + 0.945%), 2/25/35 | United States | 771,203 | 775,891 | ||||||||||||
| f,u | Halcyon Loan Advisors Funding Ltd., 2018-1A, A2, 144A, FRN, 2.935%, (3-month USD LIBOR + 1.80%), 7/21/31 | United States | 4,500,000 | 4,230,000 | ||||||||||||
| f,t | Harbor Park CLO Ltd., 1A, A2, 144A, FRN, 2.535%, 1/20/31 | United States | 657,895 | 623,615 | ||||||||||||
| f,u | HayFin Kingsland IX Ltd., 2013-6A, BR, 144A, FRN, 2.687%, (3-month USD LIBOR + 1.80%), 4/28/31 | United States | 14,500,000 | 13,771,885 | ||||||||||||
| f,t | Holland Park CLO DAC, | |||||||||||||||
1A, A1RR, 144A, FRN, 0.92%, 11/14/32 | Ireland | 50,450,000 | EUR | 53,150,704 | ||||||||||||
1A, A2R, 144A, FRN, 1.65%, 11/14/32 | Ireland | 9,700,000 | EUR | 9,914,109 | ||||||||||||
| f,t | HPS Loan Management Ltd., | |||||||||||||||
2013A-18, A2, 144A, FRN, 2.669%, 10/15/30 | United States | 8,600,000 | 8,123,267 | |||||||||||||
2013A-18, C, 144A, FRN, 3.369%, 10/15/30 | United States | 3,000,000 | 2,618,551 | |||||||||||||
| f,u | Invitation Homes Trust, 2017-SFR2, A, 144A, FRN, 1.601%, (1-month USD LIBOR + 0.85%), 12/17/36 | United States | 9,021,223 | 8,784,983 | ||||||||||||
| f,u | LCM 26 Ltd., | |||||||||||||||
26A, B, 144A, FRN, 2.535%, (3-month USD LIBOR + 1.40%), 1/20/31 | United States | 2,000,000 | 1,827,811 | |||||||||||||
26A, C, 144A, FRN, 2.935%, (3-month USD LIBOR + 1.80%), 1/20/31 | United States | 9,600,000 | 8,414,647 | |||||||||||||
26A, D, 144A, FRN, 3.635%, (3-month USD LIBOR + 2.50%), 1/20/31 | United States | 600,000 | 425,624 | |||||||||||||
| f,u | LCM XVIII LP, 2018A, CR, 144A, FRN, 2.985%, (3-month USD LIBOR + 1.85%), 4/20/31 | United States | 2,000,000 | 1,760,624 | ||||||||||||
| f,t | LCM XXII Ltd., | |||||||||||||||
22A, A2R, 144A, FRN, 2.585%, 10/20/28 | United States | 1,000,000 | 933,336 | |||||||||||||
22A, CR, 144A, FRN, 3.935%, 10/20/28 | United States | 1,000,000 | 779,798 |
118 | Semiannual Report | franklintempleton.com | ||
FRANKLIN INVESTORS SECURITIES TRUST
CONSOLIDATED STATEMENT OF INVESTMENTS (UNAUDITED)
Franklin Total Return Fund (continued)
| | Country/ Organization |
| | Principal Amount | * | Value | ||||||||||
Asset-Backed Securities and Commercial Mortgage-Backed Securities (continued) | ||||||||||||||||
Diversified Financials (continued) | ||||||||||||||||
| f,u | Long Point Park CLO Ltd., | |||||||||||||||
2017-1A, A2, 144A, FRN, 2.51%, (3-month USD LIBOR + 1.375%), 1/17/30 | United States | 5,800,000 | $ | 5,382,486 | ||||||||||||
2017-1A, B, 144A, FRN, 2.835%, (3-month USD LIBOR + 1.70%), 1/17/30 | United States | 2,700,000 | 2,397,776 | |||||||||||||
2017-1A, C, 144A, FRN, 3.535%, (3-month USD LIBOR + 2.40%), 1/17/30 | United States | 3,100,000 | 2,405,332 | |||||||||||||
| f,t | Madison Park Euro Funding VIII DAC, | |||||||||||||||
8A, ARN, 144A, FRN, 0.95%, 4/15/32 | Ireland | 41,450,000 | EUR | 43,159,234 | ||||||||||||
8A, BRN, 144A, FRN, 1.70%, 4/15/32 | Ireland | 4,600,000 | EUR | 4,702,094 | ||||||||||||
| f,t | Madison Park Euro Funding XIV DAC, 2014A, A1N, 144A, FRN, 1.12%, 7/15/32 | Ireland | 7,300,000 | EUR | 7,840,743 | |||||||||||
| f,t | Madison Park Funding XXII Ltd.22A, CR, 144A, FRN, 3.219%, 1/15/33 | United States | 7,790,000 | 6,813,751 | ||||||||||||
| f,u | Madison Park Funding XXIII Ltd., 2017-23A, B, 144A, FRN, 2.691%, (3-month USD LIBOR + 1.70%), 7/27/30 | United States | 3,840,000 | 3,696,847 | ||||||||||||
| f,t | Madison Park Funding XXIX Ltd., 2018-29A, C, 144A, FRN, 3.335%, 10/18/30 | United States | 1,072,581 | 974,377 | ||||||||||||
| f,t | Madison Park Funding XXXI Ltd., | |||||||||||||||
2018-31A, B, 144A, FRN, 2.743%, 1/23/31 | United States | 1,500,000 | 1,424,496 | |||||||||||||
2018-31A, C, 144A, FRN, 3.193%, 1/23/31 | United States | 650,000 | 586,184 | |||||||||||||
| f,t | Mill City Mortgage Loan Trust, | |||||||||||||||
2018-1, A1, 144A, FRN, 3.25%, 5/25/62 | United States | 1,962,901 | 2,010,774 | |||||||||||||
2018-4, A1B, 144A, FRN, 3.50%, 4/25/66 | United States | 14,157,198 | 14,496,141 | |||||||||||||
| f,t | Neuberger Berman CLO XVIII Ltd., 2014-18A, A1BR, 144A, FRN, 2.509%, 10/21/30 | United States | 1,700,000 | 1,591,969 | ||||||||||||
| f,u | Neuberger Berman CLO XVI-S Ltd., | |||||||||||||||
2017-16SA, C, 144A, FRN, 2.819%, (3-month USD LIBOR + 1.60%), 1/15/28 | United States | 2,350,000 | 2,134,579 | |||||||||||||
2017-16SA, D, 144A, FRN, 3.719%, (3-month USD LIBOR + 2.50%), 1/15/28 | United States | 650,000 | 541,373 | |||||||||||||
| f | Neuberger Berman Loan Advisers CLO Ltd., | |||||||||||||||
u 2017-26A, B, 144A, FRN, 2.635%, (3-month USD LIBOR + 1.50%), 10/18/30 | United States | 5,772,370 | 5,490,547 | |||||||||||||
u 2018-27A, C, 144A, FRN, 2.919%, (3-month USD LIBOR + 1.70%), 1/15/30 | United States | 4,900,000 | 4,327,908 | |||||||||||||
t 2019-32A, C, 144A, FRN, 3.785%, 1/19/32 | United States | 2,000,000 | 1,860,880 | |||||||||||||
| f,u | Newark BSL CLO 2 Ltd., 2017-1A, B, 144A, FRN, 3.341%, (3-month USD LIBOR + 2.35%), 7/25/30 | United States | 3,069,687 | 2,853,736 | ||||||||||||
| f,u | NZCG Funding Ltd., 2015-1A, A2R, 144A, FRN, 3.197%, (3-month USD LIBOR + 1.55%), 2/26/31 | United States | 11,200,000 | 10,483,027 | ||||||||||||
| f,u | Octagon Investment Partners 18-R Ltd., 2018-18A, C, 144A, FRN, 3.876%, (3-month USD LIBOR + 2.70%), 4/16/31 | United States | 9,050,000 | 7,073,518 | ||||||||||||
| f,t | Octagon Investment Partners 24 Ltd., 2015-1A, BS, 144A, FRN, 3.009%, 4/21/31 | United States | 6,482,500 | 6,237,858 | ||||||||||||
| f,t | Octagon Investment Partners 28 Ltd., 2016-1A, A2R, 144A, FRN, 2.47%, 10/24/30 | United States | 1,000,000 | 936,122 | ||||||||||||
| f,u | Octagon Investment Partners 31 LLC, 2017-1A, C, 144A, FRN, 3.535%, (3-month USD LIBOR + 2.40%), 7/20/30 | United States | 1,707,068 | 1,593,385 |
franklintempleton.com | Semiannual Report | 119 | ||||
FRANKLIN INVESTORS SECURITIES TRUST
CONSOLIDATED STATEMENT OF INVESTMENTS (UNAUDITED)
Franklin Total Return Fund (continued)
| | Country/ Organization |
| | Principal Amount | * | Value | ||||||||||
Asset-Backed Securities and Commercial Mortgage-Backed Securities (continued) | ||||||||||||||||
Diversified Financials (continued) | ||||||||||||||||
| f,u | Octagon Investment Partners 33 Ltd., | |||||||||||||||
2017-1A, A2, 144A, FRN, 2.635%, (3-month USD LIBOR + 1.50%), 1/20/31 | United States | 400,000 | $ | 345,020 | ||||||||||||
2017-1A, C, 144A, FRN, 3.885%, (3-month USD LIBOR + 2.75%), 1/20/31 | United States | 2,800,000 | 2,053,969 | |||||||||||||
| f,u | Octagon Investment Partners 35 Ltd., | |||||||||||||||
2018-1A, A1B, 144A, FRN, 2.235%, (3-month USD LIBOR + 1.10%), 1/20/31 | United States | 3,325,000 | 3,138,275 | |||||||||||||
2018-1A, B, 144A, FRN, 2.835%, (3-month USD LIBOR + 1.70%), 1/20/31 | United States | 450,000 | 399,641 | |||||||||||||
| f,u | Octagon Investment Partners 36 Ltd., | |||||||||||||||
2018-1A, A1, 144A, FRN, 2.189%, (3-month USD LIBOR + 0.97%), 4/15/31 | United States | 18,000,000 | 17,103,301 | |||||||||||||
2018-1A, A2, 144A, FRN, 2.419%, (3-month USD LIBOR + 1.20%), 4/15/31 | United States | 8,500,000 | 7,942,691 | |||||||||||||
| f,u | Octagon Investment Partners 37 Ltd., 2018-2A, C, 144A, FRN, 3.841%, (3-month USD LIBOR + 2.85%), 7/25/30 | United States | 2,000,000 | 1,580,520 | ||||||||||||
| f,t | Octagon Investment Partners 38 Ltd., 2018-1A, C, 144A, FRN, 4.085%, 7/20/30 | United States | 4,000,000 | 3,194,483 | ||||||||||||
| f,u | Octagon Investment Partners XVII Ltd., 2013-1A, CR2, 144A, FRN, 2.691%, (3-month USD LIBOR + 1.70%), 1/25/31 | United States | 5,250,000 | 4,630,819 | ||||||||||||
| f,u | Octagon Investment Partners XXIII Ltd., 2015-1A, BR, 144A, FRN, 2.419%, (3-month USD LIBOR + 1.20%), 7/15/27 | United States | 1,170,000 | 1,119,837 | ||||||||||||
| f,t | Prosper Pass-Thru Trust III, | |||||||||||||||
2020-PT1, A, 144A, FRN, 8.796%, 3/15/26 | United States | 5,276,748 | 5,076,427 | |||||||||||||
2020-PT2, A, 144A, FRN, 9.444%, 4/15/26 | United States | 6,090,171 | 5,930,427 | |||||||||||||
2020-PT3, A, 144A, FRN, 7.183%, 5/15/26 | United States | 2,018,741 | 2,051,777 | |||||||||||||
| f,t | Provident Funding Mortgage Trust, | |||||||||||||||
2019-1, A2, 144A, FRN, 3.00%, 12/25/49 | United States | 10,703,012 | 11,071,160 | |||||||||||||
2020-1, A3, 144A, FRN, 3.00%, 2/25/50 | United States | 18,224,581 | 18,675,674 | |||||||||||||
| f,u | Race Point IX CLO Ltd., 2015-9A, A1AR, 144A, FRN, 2.429%, (3-month USD LIBOR + 1.21%), 10/15/30 | United States | 5,175,000 | 5,019,750 | ||||||||||||
| f,t | Race Point X CLO Ltd., 2016-10A, B1R, 144A, FRN, 2.641%, 7/25/31 | United States | 3,600,000 | 3,319,276 | ||||||||||||
| f,u | Radnor RE Ltd., 2018-1, M1, 144A, FRN, 1.887%, (1-month USD LIBOR + 1.40%), 3/25/28 | United States | 1,004,020 | 998,127 | ||||||||||||
| f,t | Strata CLO I Ltd., 2018-1A, B, 144A, FRN, 3.419%, 1/15/31 | United States | 11,000,000 | 9,302,778 | ||||||||||||
| f,u | TCI-Flatiron CLO Ltd., | |||||||||||||||
2017-1A, B, 144A, FRN, 3.252%, (3-month USD LIBOR + 1.56%), 11/18/30 | United States | 3,500,000 | 3,285,618 | |||||||||||||
2017-1A, C, 144A, FRN, 3.542%, (3-month USD LIBOR + 1.85%), 11/18/30 | United States | 2,800,000 | 2,507,732 | |||||||||||||
| f,t | Towd Point Mortgage Trust, | |||||||||||||||
2017-1, A1, 144A, FRN, 2.75%, 10/25/56 | United States | 6,970,793 | 7,029,328 | |||||||||||||
2017-1, A2, 144A, FRN, 3.50%, 10/25/56 | United States | 8,862,000 | 9,074,933 | |||||||||||||
2017-2, A1, 144A, FRN, 2.75%, 4/25/57 | United States | 3,178,056 | 3,190,482 | |||||||||||||
2017-4, A1, 144A, FRN, 2.75%, 6/25/57 | United States | 5,634,587 | 5,695,164 | |||||||||||||
2019-1, A1, 144A, FRN, 3.75%, 3/25/58 | United States | 12,464,654 | 12,971,354 |
120 | Semiannual Report | franklintempleton.com | ||
FRANKLIN INVESTORS SECURITIES TRUST
CONSOLIDATED STATEMENT OF INVESTMENTS (UNAUDITED)
Franklin Total Return Fund (continued)
| | Country/ Organization |
| | Principal Amount | * | Value | ||||||||||
Asset-Backed Securities and Commercial Mortgage-Backed Securities (continued) | ||||||||||||||||
Diversified Financials (continued) | ||||||||||||||||
| c,f,l | Upgrade Master Pass-Thru Trust, | |||||||||||||||
2019-PT1, A, 144A, FRN, 10.739%, 6/15/25 | United States | 2,546,614 | $ | 1,933,696 | ||||||||||||
2019-PT2, A, 144A, FRN, 12.57%, 2/15/26 | United States | 4,538,739 | 4,220,577 | |||||||||||||
| f | Voya CLO Ltd., | |||||||||||||||
u 2013-2A, CR, 144A, FRN, 3.741%, (3-month USD LIBOR + 2.75%), 4/25/31 | United States | 1,650,000 | 1,245,750 | |||||||||||||
u 2014-1A, BR2, 144A, FRN, 3.035%, (3-month USD LIBOR + 1.90%), 4/18/31 | United States | 1,000,000 | 904,983 | |||||||||||||
u 2014-1A, CR2, 144A, FRN, 3.935%, (3-month USD LIBOR + 2.80%), 4/18/31 | United States | 3,750,000 | 2,935,618 | |||||||||||||
t 2016-3A, CR, 144A, FRN, 4.385%, 10/18/31 | United States | 2,547,170 | 2,044,972 | |||||||||||||
u 2017-3A, B, 144A, FRN, 3.485%, (3-month USD LIBOR + 2.35%), 7/20/30 | United States | 3,091,704 | 2,865,823 | |||||||||||||
t 2018-2A, A1, 144A, FRN, 2.219%, 7/15/31 | United States | 6,122,582 | 5,893,758 | |||||||||||||
u 2018-2A, A2, 144A, FRN, 2.469%, (3-month USD LIBOR + 1.25%), 7/15/31 | United States | 1,500,000 | 1,409,417 | |||||||||||||
u 2018-2A, C1, 144A, FRN, 3.069%, (3-month USD LIBOR + 1.85%), 7/15/31 | United States | 700,000 | 618,273 | |||||||||||||
t 2018-4A, B, 144A, FRN, 3.069%, 1/15/32 | United States | 1,896,104 | 1,809,844 | |||||||||||||
| f,u | Webster Park CLO Ltd., 2015-1A, BR, 144A, FRN, 2.935%, (3-month USD LIBOR + 1.80%), 7/20/30 | United States | 2,000,000 | 1,787,853 | ||||||||||||
| f,u | West CLO Ltd., | |||||||||||||||
2014-1A, A2R, 144A, FRN, 2.485%, (3-month USD LIBOR + 1.35%), 7/18/26 | United States | 2,860,000 | 2,849,775 | |||||||||||||
2014-1A, BR, 144A, FRN, 2.985%, (3-month USD LIBOR + 1.85%), 7/18/26 | United States | 5,060,000 | 4,949,056 | |||||||||||||
|
| |||||||||||||||
|
1,441,096,833 |
| ||||||||||||||
|
| |||||||||||||||
Total Asset-Backed Securities and Commercial | 1,469,244,656 | |||||||||||||||
|
| |||||||||||||||
Mortgage-Backed Securities 21.7% | ||||||||||||||||
| v | Federal Home Loan Mortgage Corp. (FHLMC) Adjustable Rate 0.0%† | |||||||||||||||
FHLMC, 2.234%, (11th District COF +/- MBS Margin), 11/01/27 | United States | 1,068,094 | 1,055,098 | |||||||||||||
|
| |||||||||||||||
Federal Home Loan Mortgage Corp. (FHLMC) Fixed Rate 13.6% | ||||||||||||||||
| w | FHLMC 15 Year, 2.50%, 5/01/35 | United States | 26,000,000 | 27,186,250 | ||||||||||||
| w | FHLMC 15 Year, 3.00%, 4/01/35 | United States | 26,000,000 | 27,419,043 | ||||||||||||
FHLMC 30 Year, 2.50%, 10/01/49 | United States | 38,708,892 | 40,370,062 | |||||||||||||
| w | FHLMC 30 Year, 2.50%, 5/01/50 | United States | 91,000,000 | 94,764,413 | ||||||||||||
FHLMC 30 Year, 3.00%, 12/01/49 | United States | 22,541,950 | 23,838,086 | |||||||||||||
| w | FHLMC 30 Year, 3.00%, 5/01/50 | United States | 391,447,000 | 413,251,823 | ||||||||||||
FHLMC 30 Year, 3.50%, 12/01/47 | United States | 42,756,733 | 45,505,043 | |||||||||||||
FHLMC 30 Year, 6.00%, 6/01/37 | United States | 27,557 | 31,775 | |||||||||||||
FHLMC 30 Year, 6.50%, 8/01/25 - 11/01/31 | United States | 78,294 | 89,190 | |||||||||||||
FHLMC 30 Year, 7.00%, 7/01/31 | United States | 5,395 | 5,731 | |||||||||||||
FHLMC 30 Year, 8.00%, 2/01/30 | United States | 14,856 | 17,610 | |||||||||||||
FHLMC 30 Year, 8.50%, 10/01/24 | United States | 2,863 | 3,150 | |||||||||||||
franklintempleton.com | Semiannual Report | 121 | ||||
FRANKLIN INVESTORS SECURITIES TRUST
CONSOLIDATED STATEMENT OF INVESTMENTS (UNAUDITED)
Franklin Total Return Fund (continued)
| | Country/ Organization | | | Principal Amount | * | Value | ||||||||||
| Mortgage-Backed Securities (continued) | ||||||||||||||||
Federal Home Loan Mortgage Corp. (FHLMC) Fixed Rate (continued) | ||||||||||||||||
FHLMC Gold 15 Year, 5.50%, 11/01/22 | United States | 38,556 | $ | 39,004 | ||||||||||||
FHLMC Gold 15 Year, 6.00%, 10/01/21 - 9/01/22 | United States | 90,185 | 93,084 | |||||||||||||
FHLMC Gold 30 Year, 4.50%, 3/01/39 | United States | 1,244,287 | 1,382,884 | |||||||||||||
FHLMC Gold 30 Year, 5.00%, 8/01/33 - 2/01/39 | United States | 7,596,522 | 8,670,171 | |||||||||||||
FHLMC Gold 30 Year, 5.50%, 1/01/35 - 12/01/37 | United States | 607,288 | 692,988 | |||||||||||||
FHLMC Gold 30 Year, 6.00%, 5/01/33 - 4/01/38 | United States | 797,103 | 917,904 | |||||||||||||
FHLMC Gold 30 Year, 6.50%, 4/01/28 - 3/01/39 | United States | 613,245 | 717,704 | |||||||||||||
FHLMC Gold 30 Year, 7.00%, 1/01/28 - 7/01/32 | United States | 44,822 | 51,714 | |||||||||||||
FHLMC Gold 30 Year, 7.50%, 3/01/32 | United States | 11,398 | 13,728 | |||||||||||||
FHLMC Gold 30 Year, 8.50%, 8/01/30 | United States | 1,125 | 1,339 | |||||||||||||
FHLMC Gold 30 Year, 9.00%, 1/01/22 | United States | 3 | 3 | |||||||||||||
|
| |||||||||||||||
| 685,062,699 | ||||||||||||||||
|
| |||||||||||||||
| v | Federal National Mortgage Association (FNMA) Adjustable Rate 0.1% | |||||||||||||||
FNMA, 3.181%, (6-month USD LIBOR +/- MBS Margin), 10/01/32 | United States | 75,681 | 76,442 | |||||||||||||
FNMA, 3.345% - 3.734%, (12-month USD LIBOR +/- MBS Margin), 2/01/34 - 3/01/37 | United States | 764,884 | 780,031 | |||||||||||||
FNMA, 4.035%, (US 3 Year CMT T-Note +/- MBS Margin), 12/01/24 | United States | 6,453 | 6,498 | |||||||||||||
FNMA, 2.234% - 4.106%, (11th District COF +/- MBS Margin), 12/01/27 - 9/01/34 | United States | 2,128,153 | 2,146,684 | |||||||||||||
FNMA, 3.80% - 4.857%, (US 1 Year CMT T-Note +/- MBS Margin), 5/01/25 - 10/01/36 | United States | 191,934 | 195,468 | |||||||||||||
|
| |||||||||||||||
| 3,205,123 | ||||||||||||||||
|
| |||||||||||||||
| v | Federal National Mortgage Association (FNMA) Fixed Rate 5.5% | |||||||||||||||
FNMA 15 Year, 2.50%, 12/01/34 | United States | 45,913,017 | 48,088,263 | |||||||||||||
FNMA 15 Year, 5.50%, 12/01/22 - 12/01/23 | United States | 64,046 | 66,621 | |||||||||||||
FNMA 15 Year, 6.00%, 9/01/22 | United States | 29,029 | 29,669 | |||||||||||||
FNMA 30 Year, 3.00%, 9/01/48 | United States | 67,227,830 | 71,532,465 | |||||||||||||
FNMA 30 Year, 3.00%, 11/01/48 | United States | 82,626,029 | 87,464,123 | |||||||||||||
FNMA 30 Year, 3.00%, 12/01/49 | United States | 22,640,283 | 23,942,073 | |||||||||||||
FNMA 30 Year, 3.00%, 1/01/50 | United States | 29,767,275 | 31,478,859 | |||||||||||||
FNMA 30 Year, 5.00%, 6/01/36 - 5/01/39 | United States | 1,380,649 | 1,571,936 | |||||||||||||
FNMA 30 Year, 5.50%, 6/01/33 - 8/01/37 | United States | 4,395,106 | 4,964,193 | |||||||||||||
FNMA 30 Year, 6.00%, 9/01/32 - 9/01/38 | United States | 5,243,347 | 6,042,071 | |||||||||||||
FNMA 30 Year, 6.50%, 8/01/28 - 5/01/37 | United States | 153,493 | 174,643 | |||||||||||||
FNMA 30 Year, 7.00%, 11/01/25 | United States | 2,615 | 2,624 | |||||||||||||
FNMA 30 Year, 7.50%, 1/01/30 | United States | 8,548 | 10,094 | |||||||||||||
FNMA 30 Year, 8.50%, 4/01/30 - 5/01/32 | United States | 49,656 | 60,731 | |||||||||||||
FNMA 30 Year, 9.00%, 11/01/26 - 5/01/27 | United States | 45,088 | 46,218 | |||||||||||||
|
| |||||||||||||||
| 275,474,583 | ||||||||||||||||
|
| |||||||||||||||
| v | Government National Mortgage Association (GNMA) Adjustable Rate 0.0%† | |||||||||||||||
GNMA, 3.00% - 3.125%, (US 1 Year CMT T-Note +/- MBS Margin), 1/20/23 - 10/20/26 | United States | 22,138 | 22,744 | |||||||||||||
|
| |||||||||||||||
122 | Semiannual Report | franklintempleton.com | ||
FRANKLIN INVESTORS SECURITIES TRUST
CONSOLIDATED STATEMENT OF INVESTMENTS (UNAUDITED)
Franklin Total Return Fund (continued)
| | Country/ Organization | | | Principal Amount | * | Value | ||||||||||
Mortgage-Backed Securities (continued) | ||||||||||||||||
Government National Mortgage Association (GNMA) Fixed Rate 2.5% | ||||||||||||||||
GNMA I SF 30 Year, 6.00%, 1/15/39 | United States | 123,256 | $ | 140,172 | ||||||||||||
GNMA I SF 30 Year, 6.50%, 10/15/31 - 7/15/38 | United States | 17,906 | 20,386 | |||||||||||||
GNMA I SF 30 Year, 7.00%, 10/15/27 - 6/15/31 | United States | 23,732 | 27,482 | |||||||||||||
GNMA I SF 30 Year, 7.50%, 2/15/22 - 5/15/26 | United States | 23,061 | 23,771 | |||||||||||||
GNMA I SF 30 Year, 9.00%, 9/15/25 | United States | 38 | 38 | |||||||||||||
GNMA II SF 30 Year, 3.50%, 12/20/49 | United States | 115,475,184 | 122,973,831 | |||||||||||||
GNMA II SF 30 Year, 6.00%, 5/20/31 | United States | 2,989 | 3,352 | |||||||||||||
GNMA II SF 30 Year, 6.50%, 3/20/28 - 7/20/38 | United States | 291,094 | 337,780 | |||||||||||||
GNMA II SF 30 Year, 7.50%, 8/20/30 - 1/20/33 | United States | 31,988 | 36,729 | |||||||||||||
|
| |||||||||||||||
| 123,563,541 | ||||||||||||||||
|
| |||||||||||||||
Total Mortgage-Backed Securities | 1,088,383,788 | |||||||||||||||
|
| |||||||||||||||
Municipal Bonds 5.7% | ||||||||||||||||
Birmingham Water Works Board Revenue, Senior, Refunding, 3.573%, 1/01/45 | United States | 13,525,000 | 14,151,072 | |||||||||||||
Board of Regents of the Texas A & M University System Revenue, Permanent University Fund, Refunding, 3.10%, 7/01/49 | United States | 9,020,000 | 9,092,611 | |||||||||||||
Broward County Airport System Revenue, Refunding, Series C, 3.477%, 10/01/43 | United States | 3,625,000 | 3,560,113 | |||||||||||||
California Health Facilities Financing Authority Revenue, | ||||||||||||||||
Senior, No Place Like Home Program, 2.934%, 6/01/32 | United States | 3,455,000 | 3,386,556 | |||||||||||||
Senior, No Place Like Home Program, 3.034%, 6/01/34 | United States | 2,255,000 | 2,193,190 | |||||||||||||
Senior, No Place Like Home Program, 2.984%, 6/01/33 | United States | 2,980,000 | 2,908,569 | |||||||||||||
Chicago Transit Authority Sales and Transfer Tax Receipts Revenue, Pension Funding, Series A, 6.899%, 12/01/40 | United States | 800,000 | 1,020,352 | |||||||||||||
City of Austin Electric Utility System Revenue, Travis and Williamson Counties, Refunding, 6.262%, 11/15/32 | United States | 6,830,000 | 8,706,338 | |||||||||||||
Foothill/Eastern Transportation Corridor Agency Toll Road Revenue, Refunding, Series A, 4.094%, 1/15/49 | United States | 1,760,000 | 1,774,291 | |||||||||||||
Gilroy USD, GO, Santa Clara County, Refunding, 3.364%, 8/01/47 | United States | 7,435,000 | 7,369,572 | |||||||||||||
Greenville City School District GO, County of Darke, School Improvement, Refunding, 3.541%, 1/01/51 | United States | 8,420,000 | 8,425,557 | |||||||||||||
Honolulu City and County Wastewater System Revenue, Second Bond Resolution, Refunding, Junior Series B, 2.585%, 7/01/28 | United States | 1,350,000 | 1,410,548 | |||||||||||||
Industry Public Facilities Authority Tax Allocation Revenue, Transportation District, Industrial Redevelopment Project No. 2, Refunding, Series B, AGMC Insured, 4.294%, 1/01/23 | United States | 8,450,000 | 8,657,279 | |||||||||||||
Kaiser Foundation Hospitals, 3.266%, 11/01/49 | United States | 11,270,000 | 12,139,618 | |||||||||||||
Massachusetts State College Building Authority Revenue, Refunding, Series C, 3.373%, 5/01/43 | United States | 5,900,000 | 5,900,354 | |||||||||||||
Massachusetts State School Building Authority Dedicated Sales Tax Revenue, Subordinated, Refunding, Series B, 3.395%, 10/15/40 | United States | 6,760,000 | 6,982,066 | |||||||||||||
Metro Wastewater Reclamation District Sewer Revenue, Refunding, Series B, 3.158%, 4/01/41 | United States | 5,600,000 | 5,838,392 | |||||||||||||
Metropolitan St. Louis Sewer District Wastewater System Revenue, Refunding, Series C, 3.259%, 5/01/45 | United States | 16,230,000 | 16,630,556 | |||||||||||||
franklintempleton.com | Semiannual Report | 123 | ||
FRANKLIN INVESTORS SECURITIES TRUST
CONSOLIDATED STATEMENT OF INVESTMENTS (UNAUDITED)
Franklin Total Return Fund (continued)
| | Country/ Organization | | | Principal Amount | * | Value | ||||||||||
Municipal Bonds (continued) | ||||||||||||||||
Minnesota State GO, Various Purpose, Refunding, Series F, 4.00%, 10/01/24 | United States | 5,760,000 | $ | 6,321,196 | ||||||||||||
New Jersey State Transportation Trust Fund Authority Revenue, Transportation System, Series B, 4.131%, 6/15/42 | United States | 4,060,000 | 3,954,846 | |||||||||||||
New York State Dormitory Authority Revenues, Non State Supported Debt, State University of New York Dormitory Facilities, Series B, 3.142%, 7/01/43 | United States | 3,605,000 | 3,545,265 | |||||||||||||
New York State GO, Refunding, Series B, 3.20%, 2/15/39 | United States | 13,470,000 | 13,784,390 | |||||||||||||
New York State Urban Development Corp. Sales Tax Revenue, Bidding Group 2, Series B, 2.97%, 3/15/34 | United States | 22,040,000 | 23,083,153 | |||||||||||||
Ohio State Hospital Facility Revenue, Cleveland Clinic Health System Obligated Group, Refunding, Series G, 3.276%, 1/01/42 | United States | 2,265,000 | 2,369,620 | |||||||||||||
Oregon State Department of Transportation Highway User Tax Revenue, senior lien, Refunding, Series B, 3.168%, 11/15/38 | United States | 4,510,000 | 4,637,182 | |||||||||||||
Orlando Health Obligated Group, 3.777%, 10/01/28 | United States | 2,810,000 | 2,982,976 | |||||||||||||
Pennsylvania State Turnpike Commission Turnpike Revenue, Motor License Fund-Enhanced, Subordinate, Refunding, First Series, 3.579%, 12/01/43 | United States | 11,275,000 | 11,362,043 | |||||||||||||
Port Authority of New York and New Jersey Revenue, | ||||||||||||||||
Consolidated, One Hundred Ninety-First Series, 4.823%, 6/01/45 | United States | 4,570,000 | 4,998,209 | |||||||||||||
Consolidated, Refunding, One Hundred Ninety-Second Series, 4.81%, 10/15/65 | United States | 15,000,000 | 18,759,750 | |||||||||||||
Providence St. Joseph Health Obligated Group, 2.746%, 10/01/26 | United States | 8,875,000 | 9,492,741 | |||||||||||||
Regional Transportation District Sales Tax Revenue, FasTracks Project, Refunding, Series A, 3.258%, 11/01/38 | United States | 3,605,000 | 3,715,385 | |||||||||||||
RWJ Barnabas Health Inc., 3.477%, 7/01/49 | United States | 3,050,000 | 3,102,015 | |||||||||||||
Salt Lake City Sales and Excise Tax Revenue, Refunding, Series B, 3.102%, 4/01/38 | United States | 3,155,000 | 3,176,612 | |||||||||||||
San Bernardino Community College District GO, San Bernadino and Riverside Counties, Election of 2018, Series A-1, 3.271%, 8/01/39 | United States | 2,480,000 | 2,565,907 | |||||||||||||
San Diego County Regional Transportation Commission Sales Tax Revenue, Limited Tax, Refunding, Series A, 3.248%, 4/01/48 | United States | 2,705,000 | 2,818,204 | |||||||||||||
San Francisco City and County Public Utilities Commission Water Revenue, Green Bonds, Refunding, Sub-Series A, 3.473%, 11/01/43 | United States | 2,640,000 | 2,769,122 | |||||||||||||
San Jose RDA Successor Agency Tax Allocation, Senior, Refunding, Series A-T, 3.226%, 8/01/27 | United States | 6,150,000 | 6,518,570 | |||||||||||||
Texas State GO, Transportation Commission, Highway Improvement, Refunding, 3.211%, 4/01/44 | United States | 6,760,000 | 7,216,706 | |||||||||||||
Texas State University System Financing Revenue, | ||||||||||||||||
Refunding, Series B, 2.938%, 3/15/33 | United States | 2,655,000 | 2,707,861 | |||||||||||||
Refunding, Serise B, 3.289%, 3/15/40 | United States | 2,255,000 | 2,301,273 | |||||||||||||
University of California Revenue, Limited Project, Refunding, Series J, 4.131%, 5/15/45 | United States | 10,750,000 | 12,510,527 | |||||||||||||
University of Pittsburgh of the Commonwealth System of Higher Education Revenue, Refunding, Series C, 3.005%, 9/15/41 | United States | 6,315,000 | 6,396,842 | |||||||||||||
Utah Transit Authority Sales Tax Revenue, Refunding, Series B, 3.443%, 12/15/42 | United States | 4,510,000 | 4,757,148 | |||||||||||||
|
| |||||||||||||||
Total Municipal Bonds (Cost $272,377,513) | 285,994,577 | |||||||||||||||
|
| |||||||||||||||
124 | Semiannual Report | franklintempleton.com | ||
FRANKLIN INVESTORS SECURITIES TRUST
CONSOLIDATED STATEMENT OF INVESTMENTS (UNAUDITED)
Franklin Total Return Fund (continued)
| Country/ Organization | Shares | Value | ||||||||||||
| Escrows and Litigation Trusts 0.0% | ||||||||||||||
| a,c | Millennium Corporate Claim Trust, Escrow Account | United States | 73,754 | $ | — | |||||||||
| a,c | Millennium Lender Claim Trust, Escrow Account | United States | 73,753 | — | ||||||||||
| a,c | Motors Liquidation Co., Escrow Account, cvt. pfd., C | United States | 43,500 | — | ||||||||||
| a,c,d | Remington Outdoor Co. Inc., Litigation Units | United States | 4,897 | — | ||||||||||
|
| |||||||||||||
| Total Escrows and Litigation Trusts (Cost $2,307) | — | |||||||||||||
|
| |||||||||||||
Total Investments before Short Term Investments | 5,482,772,934 | |||||||||||||
|
| |||||||||||||
| Short Term Investments (Cost $60,832,286) 1.2% | ||||||||||||||
| Money Market Funds 1.2% | ||||||||||||||
| e,x | Institutional Fiduciary Trust Money Market Portfolio, 0.01% | United States | 60,832,286 | 60,832,286 | ||||||||||
|
| |||||||||||||
Total Investments (Cost $5,656,529,929) 110.4% | 5,543,605,220 | |||||||||||||
| Other Assets, less Liabilities (10.4)% | (521,847,952 | ) | ||||||||||||
|
| |||||||||||||
| Net Assets 100.0% | $ | 5,021,757,268 | ||||||||||||
|
| |||||||||||||
franklintempleton.com | Semiannual Report | 125 | ||||
FRANKLIN INVESTORS SECURITIES TRUST
CONSOLIDATED STATEMENT OF INVESTMENTS (UNAUDITED)
Franklin Total Return Fund (continued)
†Rounds to less than 0.1% of net assets.
*The principal amount is stated in U.S. dollars unless otherwise indicated.
aNon-income producing.
bThe security is owned by FT Holdings Corporation I, a wholly-owned subsidiary of the Fund. See Note 1(h).
cFair valued using significant unobservable inputs. See Note 14 regarding fair value measurements.
dSee Note 9 regarding restricted securities.
eSee Note 3(f) regarding investments in affiliated management investment companies.
fSecurity was purchased pursuant to Rule 144A under the Securities Act of 1933 and may be sold in transactions exempt from registration only to qualified institutional buyers or in a public offering registered under the Securities Act of 1933. At April 30, 2020, the aggregate value of these securities /value of this security was $1,368,855,281, representing 27.3% of net assets.
gSecurity was purchased pursuant to Regulation S under the Securities Act of 1933, which exempts from registration securities offered and sold outside of the United States. Such a security cannot be sold in the United States without either an effective registration statement filed pursuant to the Securities Act of 1933, or pursuant to an exemption from registration. At April 30, 2020, the aggregate value of these securities was $77,865,173, representing 1.6% of net assets.
hIncome may be received in additional securities and/or cash.
iSee Note 7 regarding defaulted securities.
jSee Note 1(f) regarding loan participation notes.
kPerpetual security with no stated maturity date.
lThe coupon rate shown represents the rate at period end.
mSee Note 1(j) regarding senior floating rate interests.
nA portion security purchased on a delayed delivery basis. See Note 1(d).
oA portion or all of the security represents an unsettled loan commitment. The coupon rate is to-be determined (TBD) at the time of settlement and will be based upon a reference index/floor plus a spread.
pSee Note 1(k) regarding Marketplace lending.
qA supranational organization is an entity formed by two or more central governments through international treaties.
rThe principal represents the notional amount. See Note 1(e) regarding value recovery instruments.
sPrincipal amount of security is adjusted for inflation. See Note 1(m).
tAdjustable rate security with an interest rate that is not based on a published reference index and spread. The rate is based on the structure of the agreement and current market conditions. The coupon rate shown represents the rate at period end.
uThe coupon rate shown represents the rate inclusive of any caps or floors, if applicable, in effect at period end.
vAdjustable Rate Mortgage-Backed Security (ARM); the rate shown is the effective rate at period end. ARM rates are not based on a published reference rate and spread, but instead pass-through weighted average interest income inclusive of any caps or floors, if applicable, from the underlying mortgage loans in which the majority of mortgages pay interest based on the index shown at their designated reset dates plus a spread, less the applicable servicing and guaranty fee (MBS margin).
wA portion security purchased on a to-be-announced (TBA) basis. See Note 1(d).
xThe rate shown is the annualized seven-day effective yield at period end.
126 | Semiannual Report | franklintempleton.com | ||
FRANKLIN INVESTORS SECURITIES TRUST
CONSOLIDATED STATEMENT OF INVESTMENTS (UNAUDITED)
Franklin Total Return Fund (continued)
At April 30, 2020, the Fund had the following futures contracts outstanding. See Note 1(e).
Futures Contracts
| Description | Type | | Number of Contracts | | | Notional Amount | * | | Expiration Date | | | Value/ Unrealized Appreciation (Depreciation) | | |||||||
| Interest Rate Contracts | ||||||||||||||||||||
Australian 3 Yr. Bond | Long | 2,020 | $154,241,043 | 6/15/20 | $ 921,341 | |||||||||||||||
Australian 10 Yr. Bond | Long | 89 | 8,632,755 | 6/15/20 | 62,621 | |||||||||||||||
Canada 10 Yr. Bond | Long | 1,902 | 204,152,737 | 6/19/20 | 12,255,494 | |||||||||||||||
CME Ultra Long Term U.S. Treasury Bond | Long | 420 | 94,408,125 | 6/19/20 | 4,264,469 | |||||||||||||||
Euro-BTP | Long | 521 | 79,121,152 | 6/08/20 | (4,635,351 | ) | ||||||||||||||
Euro-Bund | Long | 330 | 63,070,572 | 6/08/20 | (560,727 | ) | ||||||||||||||
Euro-OAT | Long | 700 | 129,490,918 | 6/08/20 | 1,575,950 | |||||||||||||||
U.S. Treasury 2 Yr. Note | Long | 2,673 | 589,208,555 | 6/30/20 | 8,383,767 | |||||||||||||||
U.S. Treasury 10 Yr. Note | Long | 2,265 | 314,976,563 | 6/19/20 | 2,030,483 | |||||||||||||||
U.S. Treasury 30 Yr. Bond | Long | 951 | 172,160,719 | 6/19/20 | 11,620,424 | |||||||||||||||
Ultra 10 Yr. U.S. Treasury Note | Short | 595 | 93,433,594 | 6/19/20 | (117,690 | ) | ||||||||||||||
|
| |||||||||||||||||||
Total Futures Contracts | $35,800,781 | |||||||||||||||||||
|
| |||||||||||||||||||
*As of period end.
At April 30, 2020, the Fund had the following forward exchange contracts outstanding. See Note 1(e).
Forward Exchange Contracts
| Currency | Counterparty | a | Type | Quantity | | Contract Amount | | | Settlement Date | | | Unrealized Appreciation | | | Unrealized Depreciation | | ||||||||||||||||
| OTC Forward Exchange Contracts |
| |||||||||||||||||||||||||||||||
Indonesian Rupiah | DBAB | Buy | 139,844,100,000 | 9,771,040 | 6/15/20 | $ | — | $ | (623,888 | ) | ||||||||||||||||||||||
Indonesian Rupiah | JPHQ | Buy | 6,900,000,000 | 481,743 | 6/15/20 | — | (30,416 | ) | ||||||||||||||||||||||||
Australian Dollar | JPHQ | Sell | 34,750,000 | 23,957,693 | 7/02/20 | 1,308,969 | — | |||||||||||||||||||||||||
Japanese Yen | JPHQ | Sell | 1,400,000,000 | 13,023,740 | 7/02/20 | — | (32,665 | ) | ||||||||||||||||||||||||
Turkish Lira | JPHQ | Buy | 41,600,000 | 6,038,174 | 7/14/20 | — | (213,586 | ) | ||||||||||||||||||||||||
Japanese Yen | CITI | Buy | 6,540,720,900 | 60,900,000 | 7/16/20 | 114,149 | — | |||||||||||||||||||||||||
Japanese Yen | CITI | Sell | 6,540,720,900 | 60,873,644 | 7/16/20 | — | (140,504 | ) | ||||||||||||||||||||||||
Australian Dollar | JPHQ | Sell | 11,200,000 | 7,692,272 | 7/21/20 | 392,479 | — | |||||||||||||||||||||||||
Japanese Yen | JPHQ | Buy | 7,348,000,000 | 67,898,091 | 7/22/20 | 654,040 | — | |||||||||||||||||||||||||
Japanese Yen | JPHQ | Sell | 460,000,000 | 4,282,803 | 7/22/20 | — | (8,702 | ) | ||||||||||||||||||||||||
Canadian Dollar | JPHQ | Sell | 15,200,000 | 11,564,300 | 7/23/20 | 643,471 | — | |||||||||||||||||||||||||
Danish Krone | JPHQ | Sell | 226,372,668 | 33,804,120 | 7/23/20 | 499,003 | — | |||||||||||||||||||||||||
Euro | JPHQ | Sell | 22,466,930 | 25,040,404 | 7/23/20 | 379,369 | — | |||||||||||||||||||||||||
Mexican Peso | JPHQ | Buy | 206,500,000 | 10,700,203 | 7/23/20 | — | (2,244,365 | ) | ||||||||||||||||||||||||
Norwegian Krone | JPHQ | Buy | 274,700,000 | 30,373,980 | 7/23/20 | — | (3,549,988 | ) | ||||||||||||||||||||||||
Norwegian Krone | JPHQ | Sell | 274,700,000 | 26,952,512 | 7/23/20 | 128,519 | — | |||||||||||||||||||||||||
Euro | JPHQ | Sell | 20,100,000 | 22,631,595 | 8/05/20 | 562,226 | — | |||||||||||||||||||||||||
Australian Dollar | JPHQ | Sell | 79,500,000 | 48,038,670 | 8/06/20 | — | (3,776,653 | ) | ||||||||||||||||||||||||
Japanese Yen | JPHQ | Buy | 6,100,000,000 | 57,212,530 | 8/13/20 | — | (279,100 | ) | ||||||||||||||||||||||||
Japanese Yen | JPHQ | Sell | 6,100,000,000 | 56,825,433 | 8/13/20 | — | (107,997 | ) | ||||||||||||||||||||||||
Singapore Dollar | JPHQ | Sell | 150,000,000 | 11,187,007,500 | JPY | 8/13/20 | — | (1,997,988 | ) | |||||||||||||||||||||||
franklintempleton.com | Semiannual Report | 127 | ||||
FRANKLIN INVESTORS SECURITIES TRUST
CONSOLIDATED STATEMENT OF INVESTMENTS (UNAUDITED)
Franklin Total Return Fund (continued)
Forward Exchange Contracts (continued)
| Currency | Counterparty | a | Type | Quantity | | Contract Amount | | | Settlement Date | | | Unrealized Appreciation | | | Unrealized Depreciation | | ||||||||||||
| OTC Forward Exchange Contracts (continued) |
| |||||||||||||||||||||||||||
Chinese Yuan Renminbi | JPHQ | Buy | 153,300,000 | 21,964,954 | 8/21/20 | $ — | $ (363,682 | ) | ||||||||||||||||||||
Chinese Yuan Renminbi | JPHQ | Sell | 153,300,000 | 21,773,712 | 8/21/20 | 172,441 | — | |||||||||||||||||||||
Japanese Yen | JPHQ | Buy | 3,750,000,000 | 35,874,697 | 9/14/20 | — | (852,096 | ) | ||||||||||||||||||||
Canadian Dollar | JPHQ | Sell | 50,180,000 | 36,236,280 | 9/15/20 | 177,830 | — | |||||||||||||||||||||
Euro | DBAB | Sell | 2,178,384 | 2,450,987 | 9/15/20 | 56,900 | — | |||||||||||||||||||||
Euro | JPHQ | Sell | 68,474,138 | 77,026,558 | 9/15/20 | 1,772,142 | — | |||||||||||||||||||||
Norwegian Krone | JPHQ | Buy | 233,800,000 | 23,148,973 | 9/15/20 | — | (316,692 | ) | ||||||||||||||||||||
Norwegian Krone | JPHQ | Sell | 233,800,000 | 22,921,569 | 9/15/20 | 89,288 | — | |||||||||||||||||||||
South Korean Won | JPHQ | Sell | 14,000,000,000 | 11,405,295 | 9/16/20 | — | (151,772 | ) | ||||||||||||||||||||
|
| |||||||||||||||||||||||||||
Total Forward Exchange Contracts |
| $ 6,950,826 | $(14,690,094 | ) | ||||||||||||||||||||||||
|
| |||||||||||||||||||||||||||
Net unrealized appreciation (depreciation) |
| $ (7,739,268 | ) | |||||||||||||||||||||||||
|
| |||||||||||||||||||||||||||
aMay be comprised of multiple contracts with the same counterparty, currency and settlement date.
At April 30, 2020, the Fund had the following credit default swap contracts outstanding. See Note 1(e).
Credit Default Swap Contracts
| Description | | Periodic Payment Rate Received (Paid) | | | Payment Frequency | | | Counter- party | | | Maturity Date | | | Notional Amount | a | Value | | Unamortized Upfront Payments (Receipts) | | | Unrealized Appreciation (Depreciation) | | Rating | b | ||||||||||||
| Centrally Cleared Swap Contracts |
| |||||||||||||||||||||||||||||||||||
| Contracts to Sell Protectionc,d |
| |||||||||||||||||||||||||||||||||||
| Traded Index | ||||||||||||||||||||||||||||||||||||
CDX.EM.32 | 1.00% | Quarterly | 12/20/24 | $123,480,000 | $(11,381,319) | $ (6,821,727) | $ (4,559,592) | |||||||||||||||||||||||||||||
CDX.NA.HY.33 | 5.00% | Quarterly | 12/20/24 | 84,717,050 | (4,286,103) | 4,455,122 | (8,741,225) | | Non- Investment Grade | | ||||||||||||||||||||||||||
CDX.NA.IG.33 | 1.00% | Quarterly | 12/20/24 | 29,300,000 | 245,879 | 328,478 | (82,599) | Investment | ||||||||||||||||||||||||||||
|
| |||||||||||||||||||||||||||||||||||
| Grade | ||||||||||||||||||||||||||||||||||||
Total Centrally Cleared Swap Contracts |
| $ (15,421,543 | ) | $ (2,038,127 | ) | $(13,383,416) | ||||||||||||||||||||||||||||||
|
| |||||||||||||||||||||||||||||||||||
| OTC Swap Contracts |
| |||||||||||||||||||||||||||||||||||
| Contracts to Buy Protectionc |
| |||||||||||||||||||||||||||||||||||
| Single Name |
| |||||||||||||||||||||||||||||||||||
Ally Financial Inc. | (5.00)% | Quarterly | JPHQ | 12/20/24 | $ 20,750,000 | $ (2,784,918 | ) | $ (3,599,674 | ) | $ 814,756 | ||||||||||||||||||||||||||
Avon Products Inc. | (5.00)% | Quarterly | CITI | 3/20/23 | 8,800,000 | 194,460 | (739,245 | ) | 933,705 | |||||||||||||||||||||||||||
Chesapeake Energy Corp. | (5.00)% | Quarterly | CITI | 6/20/20 | 1,150,000 | 760,661 | 104,144 | 656,517 | ||||||||||||||||||||||||||||
Chesapeake Energy Corp. | (5.00)% | Quarterly | JPHQ | 6/20/20 | 4,605,667 | 3,046,394 | 465,346 | 2,581,048 | ||||||||||||||||||||||||||||
Government of Italy | (1.00)% | Quarterly | BZWS | 6/20/23 | 10,600,000 | 266,548 | 72,469 | 194,079 | ||||||||||||||||||||||||||||
Nabors Industries Inc. | (1.00)% | Quarterly | CITI | 12/20/21 | 10,225,000 | 5,938,698 | 244,402 | 5,694,296 | ||||||||||||||||||||||||||||
128 | Semiannual Report | franklintempleton.com | ||
FRANKLIN INVESTORS SECURITIES TRUST
CONSOLIDATED STATEMENT OF INVESTMENTS (UNAUDITED)
Franklin Total Return Fund (continued)
Credit Default Swap Contracts (continued)
| Description | | Periodic Payment Rate Received |
| | Payment Frequency | | | Counter- party | | | Maturity Date | | | Notional Amount | a | Value | | Unamortized Upfront Payments (Receipts) | | | Unrealized Appreciation (Depreciation) | | Rating | b | ||||||||||||||
OTC Swap Contracts (continued) |
| |||||||||||||||||||||||||||||||||||||
Contracts to Sell Protectionc,d |
| |||||||||||||||||||||||||||||||||||||
Single Name |
| |||||||||||||||||||||||||||||||||||||
The Goldman Sachs Group Inc. | 1.00% | Quarterly | JPHQ | 12/20/24 | $ 20,750,000 | $ 207,387 | $ 331,743 | $ (124,356 | ) | BBB+ | ||||||||||||||||||||||||||||
Government of Argentina | 5.00% | Quarterly | CITI | 12/20/21 | 16,050,000 | (11,856,485 | ) | (6,956,335 | ) | (4,900,150 | ) | CC | ||||||||||||||||||||||||||
Government of Indonesia | 1.00% | Quarterly | CITI | 12/20/24 | 17,770,000 | (696,036 | ) | 107,937 | (803,973 | ) | NR | |||||||||||||||||||||||||||
Government of Italy | 1.00% | Quarterly | BZWS | 6/20/23 | 10,600,000 | (266,548 | ) | (317,785 | ) | 51,237 | NR | |||||||||||||||||||||||||||
Government of Russia | 1.00% | Quarterly | CITI | 12/20/24 | 8,600,000 | (211,556 | ) | 79,132 | (290,688 | ) | BBB- | |||||||||||||||||||||||||||
Morgan Stanley | 1.00% | Quarterly | JPHQ | 12/20/24 | 20,750,000 | 249,172 | 364,105 | (114,933 | ) | BBB+ | ||||||||||||||||||||||||||||
Nabors Industries Inc. | 1.00% | Quarterly | CITI | 12/20/23 | 10,225,000 | (7,969,578 | ) | (1,114,476 | ) | (6,855,102 | ) | CCC+ | ||||||||||||||||||||||||||
Traded Index | ||||||||||||||||||||||||||||||||||||||
| e | BNP Paribas Bespoke Bordeaux Index, Mezzanine Tranche 7-10% | 2.10% | Quarterly | BNDP | 6/20/20 | 5,150,000 | (121,218 | ) | — | (121,218 | ) | Non- | ||||||||||||||||||||||||||
| | Investment Grade | | ||||||||||||||||||||||||||||||||||||
| e | BNP Paribas Bespoke Rodez Index, Mezzanine Tranche 5-7% | 2.00% | Quarterly | BNDP | 12/20/20 | 5,300,000 | (1,254,614 | ) | — | (1,254,614 | ) | Non- | ||||||||||||||||||||||||||
| | Investment Grade | | ||||||||||||||||||||||||||||||||||||
| e | BNP Paribas Bespoke Rodez2 Index, Mezzanine Tranche 5-7% | 3.20% | Quarterly | BNDP | 12/20/20 | 2,700,000 | (507,497 | ) | — | (507,497 | ) | Non- | ||||||||||||||||||||||||||
| | Investment Grade | | ||||||||||||||||||||||||||||||||||||
| e | Citibank Bespoke Palma Index, Mezzanine Tranche 5-7% | 2.30% | Quarterly | CITI | 6/20/21 | 5,900,000 | (1,276,924 | ) | — | (1,276,924 | ) | Non- | ||||||||||||||||||||||||||
| | Investment Grade | | ||||||||||||||||||||||||||||||||||||
| e | Citibank Bespoke Phoenix Index, Mezzanine Tranche 5-7% | 2.90% | Quarterly | CITI | 12/20/21 | 7,800,000 | (2,123,170 | ) | — | (2,123,170 | ) | Non- | ||||||||||||||||||||||||||
| | Investment Grade | | ||||||||||||||||||||||||||||||||||||
| e | Citibank Bespoke Singapore Index, Equity Tranche 0-3% | 0.00% | Quarterly | CITI | 6/20/20 | 11,300,000 | (3,568,866 | ) | (220,310 | ) | (3,348,556 | ) | Non- | |||||||||||||||||||||||||
| | Investment Grade | | ||||||||||||||||||||||||||||||||||||
franklintempleton.com | Semiannual Report | 129 | ||||
FRANKLIN INVESTORS SECURITIES TRUST
CONSOLIDATED STATEMENT OF INVESTMENTS (UNAUDITED)
Franklin Total Return Fund (continued)
Credit Default Swap Contracts (continued)
| Description | | Periodic Payment Rate Received (Paid) | | | Payment Frequency | | | Counter- party | | | Maturity Date | | | Notional Amount | a | Value | | Unamortized Upfront Payments (Receipts) | | | Unrealized Appreciation (Depreciation) | | Ratingb | |||||||||||||||
OTC Swap Contracts (continued) |
| |||||||||||||||||||||||||||||||||||||
Contracts to Sell Protectionc,d (continued) |
| |||||||||||||||||||||||||||||||||||||
Traded Index (continued) |
| |||||||||||||||||||||||||||||||||||||
| e,f | Citibank Bespoke Sydney Index, Equity Tranche 0-3% | 0.00% | Quarterly | CITI | 6/20/20 | $ 3,595,109 | $ (1,594,610 | ) | $ (80,018) | $ (1,514,592 | ) | Non- | ||||||||||||||||||||||||||
| | Investment Grade | | ||||||||||||||||||||||||||||||||||||
MCDX.NA.31 | 1.00% | Quarterly | CITI | 12/20/23 | 2,325,000 | (2,868 | ) | 17,139 | (20,007 | ) | Investment | |||||||||||||||||||||||||||
| Grade | ||||||||||||||||||||||||||||||||||||||
| e | Morgan Stanley Bespoke Pecan Index, Mezzanine Tranche 5-10% | 3.98% | Quarterly | MSCO | 12/20/21 | 8,300,000 | (4,303,912 | ) | — | (4,303,912 | ) | Non- | ||||||||||||||||||||||||||
| | Investment Grade | | ||||||||||||||||||||||||||||||||||||
| e | Morgan Stanley Bespoke Pecan Index, Mezzanine Tranche 5-10% | 4.10% | Quarterly | MSCO | 12/20/21 | 8,300,000 | (3,855,595 | ) | — | (3,855,595 | ) | Non- | ||||||||||||||||||||||||||
|
| |||||||||||||||||||||||||||||||||||||
| | Investment Grade | | ||||||||||||||||||||||||||||||||||||
Total OTC Swap Contracts |
| $(31,731,075 | ) | $(11,241,426 | ) | $(20,489,649 | ) | |||||||||||||||||||||||||||||||
|
| |||||||||||||||||||||||||||||||||||||
Total Credit Default Swap Contracts |
| $(47,152,618 | ) | $(13,279,553 | ) | $(33,873,065 | ) | |||||||||||||||||||||||||||||||
|
| |||||||||||||||||||||||||||||||||||||
aIn U.S. dollars unless otherwise indicated. For contracts to sell protection, the notional amount is equal to the maximum potential amount of the future payments and no recourse provisions have been entered into in association with the contracts.
bBased on Standard and Poor’s (S&P) Rating for single name swaps and internal ratings for index swaps. Internal ratings based on mapping into equivalent ratings from external vendors.
cPerformance triggers for settlement of contract include default, bankruptcy or restructuring for single name swaps, and failure to pay or bankruptcy of the underlying securities for traded index swaps.
dThe fund enters contracts to sell protection to create a long credit position.
eRepresents a custom index comprised of a basket of underlying instruments.
fFair valued using significant unobservable inputs. See Note 14 regarding fair value measurements.
At April 30, 2020, the Fund had the following cross-currency swap contracts outstanding. See Note 1(e).
Cross-Currency Swap Contracts
| Description | | Payment Frequency | | | Coun- terparty | | | Maturity Date | | | Notional Amount | | | Value/ Unrealized Appreciation (Depreciation) | | |||||||||
| OTC Swap Contracts | ||||||||||||||||||||||||
Receive Floating 3-month USD LIBOR + 2.87% | Quarterly | 3,137,400 | USD | |||||||||||||||||||||
Pay Fixed 2.50% | Annual | CITI | 5/04/21 | 2,700,000 | EUR | $ 149,557 | ||||||||||||||||||
Receive Floating 3-month USD LIBOR + 1.334% | Quarterly | 8,176,000 | USD | |||||||||||||||||||||
Pay Floating 3-month EUR LIBOR + 1.12% | Quarterly | CITI | 7/10/21 | 7,300,000 | EUR | 208,937 | ||||||||||||||||||
130 | Semiannual Report | franklintempleton.com | ||
FRANKLIN INVESTORS SECURITIES TRUST
CONSOLIDATED STATEMENT OF INVESTMENTS (UNAUDITED)
Franklin Total Return Fund (continued)
Cross-Currency Swap Contracts (continued)
| Description | | Payment Frequency | | | Coun- terparty | | | Maturity Date | | | Notional Amount | | | Value/ Unrealized Appreciation (Depreciation) | | |||||||||
| OTC Swap Contracts (continued) | ||||||||||||||||||||||||
Receive Floating 3-month USD LIBOR + 1.305% | Quarterly | 11,512,800 | USD | |||||||||||||||||||||
Pay Floating 3-month EUR LIBOR + 1.11% | Quarterly | JPHQ | 8/20/21 | 10,400,000 | EUR | $ 188,787 | ||||||||||||||||||
Receive Floating 3-month USD LIBOR + 1.23% | Quarterly | 2,830,500 | USD | |||||||||||||||||||||
Pay Floating 3-month EUR LIBOR + 1.07% | Quarterly | CITI | 9/17/21 | 2,550,000 | EUR | 47,367 | ||||||||||||||||||
Receive Floating 3-month USD LIBOR + 1.87% | Quarterly | 6,160,000 | USD | |||||||||||||||||||||
Pay Floating 3-month EUR LIBOR + 1.7% | Quarterly | CITI | 10/15/21 | 5,600,000 | EUR | 39,870 | ||||||||||||||||||
Receive Floating 3-month USD LIBOR + 1.25% | Quarterly | 28,471,500 | USD | |||||||||||||||||||||
Pay Floating 3-month EUR LIBOR + 1.1% | Quarterly | CITI | 10/30/21 | 25,650,000 | EUR | 387,089 | ||||||||||||||||||
Receive Floating 3-month USD LIBOR + 1.1745% | Quarterly | 66,465,750 | USD | |||||||||||||||||||||
Pay Floating 3-month EUR LIBOR + 1.05% | Quarterly | CITI | 11/22/21 | 60,150,000 | EUR | 840,444 | ||||||||||||||||||
Receive Floating 3-month USD LIBOR + 1.17% | Quarterly | 25,086,000 | USD | |||||||||||||||||||||
Pay Floating 3-month EUR LIBOR + 1.05% | Quarterly | CITI | 11/29/21 | 22,600,000 | EUR | 427,046 | ||||||||||||||||||
Receive Floating 3-month USD LIBOR + 1.1735% | Quarterly | 51,115,500 | USD | |||||||||||||||||||||
Pay Floating 3-month EUR LIBOR + 1.05% | Quarterly | CITI | 12/10/21 | 46,050,000 | EUR | 823,571 | ||||||||||||||||||
Receive Floating 3-month USD LIBOR + 1.3175% | Quarterly | 35,853,000 | USD | |||||||||||||||||||||
Pay Floating 3-month EUR LIBOR + 1.2% | Quarterly | CITI | 12/12/21 | 32,300,000 | EUR | 566,200 | ||||||||||||||||||
|
| |||||||||||||||||||||||
Total Cross Currency Swap Contracts | $3,678,868 | |||||||||||||||||||||||
|
| |||||||||||||||||||||||
At April 30, 2020, the Fund had the following inflation index swap contracts outstanding. See Note 1(e).
Inflation Index Swap Contracts
| Description | | Payment Frequency | | | Counter- party | | | Maturity Date | | | Notional Amount | | | Value/ Unrealized Appreciaton (Depreciation) | | |||||
| Centrally Cleared Swap Contracts | ||||||||||||||||||||
Receive variable change in USA-CPI-U | At maturity | |||||||||||||||||||
Pay Fixed 1.96% | At maturity | 8/31/24 | $ 24,600,000 | $ (1,271,845 | ) | |||||||||||||||
Receive variable change in USA-CPI-U | At maturity | |||||||||||||||||||
Pay Fixed 1.719% | At maturity | 8/14/26 | 23,000,000 | (1,069,750 | ) | |||||||||||||||
Receive variable change in USA-CPI-U | At maturity | |||||||||||||||||||
Pay Fixed 1.913% | At maturity | 1/14/29 | 37,900,000 | (2,534,545 | ) | |||||||||||||||
Receive variable change in USA-CPI-U | At maturity | |||||||||||||||||||
Pay Fixed 1.943% | At maturity | 1/15/29 | 132,100,000 | (9,215,736 | ) | |||||||||||||||
|
| |||||||||||||||||||
Total Centrally Cleared Swap Contracts | $(14,091,876 | ) | ||||||||||||||||||
|
| |||||||||||||||||||
| OTC Swap Contracts | ||||||||||||||||||||
Receive variable change in USA-CPI-U | At maturity | |||||||||||||||||||
Pay Fixed 1.782% | At maturity | JPHQ | 5/27/24 | $ 35,700,000 | $ (1,188,885 | ) | ||||||||||||||
| �� |
|
| ||||||||||||||||||
Total Inflation Index Swap Contracts | $(15,280,761 | ) | ||||||||||||||||||
|
| |||||||||||||||||||
franklintempleton.com | Semiannual Report | 131 | ||||
FRANKLIN INVESTORS SECURITIES TRUST
CONSOLIDATED STATEMENT OF INVESTMENTS (UNAUDITED)
Franklin Total Return Fund (continued)
At April 30, 2020, the Fund had the following total return swap contracts outstanding. See Note 1(e).
Total Return Swap Contracts
| Underlying Instruments | Financing Rate | | Payment Frequency | | | Counter- party | | Maturity Date | | | Notional Value | | | Value/ Unrealized Appreciation (Depreciation | ) | |||||||||
| OTC Swap Contracts | ||||||||||||||||||||||||
Longa | ||||||||||||||||||||||||
Markit iBoxx USD Liquid Leveraged Loan Index | 3-month USD LIBOR | Quarterly | BZWS | 6/20/20 | $56,300,000 | $(3,215,795 | ) | |||||||||||||||||
|
| |||||||||||||||||||||||
aThe Fund receives the total return on the underlying instrument and pays a variable financing rate.
See Note 10 regarding other derivative information.
See Abbreviations on page 171.
132 | Semiannual Report | The accompanying notes are an integral part of these financial statements. | franklintempleton.com | ||
FRANKLIN INVESTORS SECURITIES TRUST
Statements of Assets and Liabilities
April 30, 2020 (unaudited)
| Franklin Adjustable U.S. Government Securities Fund | Franklin Floating Rate Daily Access Fund | Franklin Low Duration Total Return Fund | Franklin Total Return Funda | |||||||||||||
Assets: | ||||||||||||||||
Investments in securities: | ||||||||||||||||
Cost - Unaffiliated issuers | $685,510,796 | $1,527,585,250 | $3,219,849,331 | $4,998,856,743 | ||||||||||||
Cost - Controlled affiliates (Note 3f and 11) | — | — | — | 581,727,024 | ||||||||||||
Cost - Non-controlled affiliates (Note 3f and 11) | 36,861,475 | 271,840,384 | 75,618,287 | 75,946,162 | ||||||||||||
Cost - Unaffiliated repurchase agreements | 29,701,565 | 18,286,788 | — | — | ||||||||||||
|
| |||||||||||||||
Value - Unaffiliated issuers | $681,331,069 | $1,286,891,707 | $3,048,776,133 | $4,892,725,432 | ||||||||||||
Value - Controlled affiliates (Note 3f and 11) | — | — | — | 579,062,893 | ||||||||||||
Value - Non-controlled affiliates (Note 3f and 11) | 36,861,475 | 189,991,780 | 69,248,183 | 71,816,895 | ||||||||||||
Value - Unaffiliated repurchase agreements | 29,701,565 | 18,286,788 | — | — | ||||||||||||
Cash | — | 1,499,098 | 2,644,568 | 8,756,616 | ||||||||||||
Foreign currency, at value (cost $—, $—, $48,507,752 and $357,731, respectively) | — | — | 48,274,878 | 316,794 | ||||||||||||
Receivables: | ||||||||||||||||
Investment securities sold | 2,472,376 | 43,390,183 | 3,045,805 | 53,502,629 | ||||||||||||
Capital shares sold | 5,310,232 | 428,622 | 9,308,556 | 14,248,608 | ||||||||||||
Dividends and interest | 2,247,708 | 6,511,167 | 12,738,279 | 28,987,761 | ||||||||||||
Deposits with brokers for: | ||||||||||||||||
OTC derivative contracts | — | — | 17,890,000 | 36,570,000 | ||||||||||||
TBA transactions | — | — | 70,000 | 570,000 | ||||||||||||
Futures contracts | — | — | 6,250,052 | 29,603,271 | ||||||||||||
Centrally cleared swap contracts | — | — | 277,842 | 171,293 | ||||||||||||
Variation margin on futures contracts | — | — | 478,202 | 1,038,249 | ||||||||||||
OTC swap contracts (upfront payments $—, $—, $1,587,680 and $2,783,720, respectively) | — | — | 1,066,470 | 1,786,417 | ||||||||||||
Unrealized appreciation on OTC forward exchange contracts | — | — | 8,425,391 | 6,950,826 | ||||||||||||
Unrealized appreciation on OTC swap contracts | — | — | 9,817,855 | 14,604,506 | ||||||||||||
FT Subsidiary deferred tax benefit (Note 1h) | — | — | — | 101,634 | ||||||||||||
Other assets | 686 | 1,992 | 3,511 | 5,335 | ||||||||||||
|
| |||||||||||||||
Total assets | 757,925,111 | 1,547,001,337 | 3,238,315,725 | 5,740,819,159 | ||||||||||||
|
| |||||||||||||||
Liabilities: | ||||||||||||||||
Payables: | ||||||||||||||||
Investment securities purchased | 16,625,629 | 50,892,255 | 102,967,120 | 644,013,284 | ||||||||||||
Capital shares redeemed | 2,197,284 | 5,889,315 | 6,211,873 | 6,558,904 | ||||||||||||
Management fees | 291,703 | 656,316 | 560,939 | 1,701,072 | ||||||||||||
Distribution fees | 137,636 | 272,182 | 402,708 | 858,959 | ||||||||||||
Transfer agent fees | 150,583 | 508,527 | 469,909 | 580,330 | ||||||||||||
Trustees’ fees and expenses | 639 | 4,789 | 1,241 | 34 | ||||||||||||
Distributions to shareholders | 69,227 | 1,061,534 | 1,860,849 | 1,080,916 | ||||||||||||
Variation margin on centrally cleared swap contracts | — | — | 221,273 | 311,446 | ||||||||||||
OTC swap contracts (upfront receipts $—, $—, $11,293,222 and $19,376,010) | — | — | 7,689,231 | 13,027,843 | ||||||||||||
Options written, at value (premiums received $—, $—, $83,509 and $—, respectively) | — | — | 2,553,694 | — | ||||||||||||
Unrealized depreciation on OTC forward exchange contracts | — | — | 5,163,465 | 14,690,094 | ||||||||||||
Unrealized depreciation on OTC swap contracts | — | — | 19,697,196 | 35,819,967 | ||||||||||||
franklintempleton.com | The accompanying notes are an integral part of these financial statements. | Semiannual Report | 133 | ||||
FRANKLIN INVESTORS SECURITIES TRUST
FINANCIAL STATEMENTS
Statements of Assets and Liabilities (continued)
April 30, 2020 (unaudited)
| Franklin Adjustable U.S. Government Securities Fund | Franklin Floating Rate Daily Access Fund | Franklin Low Duration Total Return Fund | Franklin Total Return Funda | |||||||||||||
Accrued expenses and other liabilities | $ | 138,794 | $ | 219,452 | $ | 342,164 | $ | 419,042 | ||||||||
|
|
| ||||||||||||||
Total liabilities | 19,611,495 | 59,504,370 | 148,141,662 | 719,061,891 | ||||||||||||
|
|
| ||||||||||||||
Net assets, at value | $ | 738,313,616 | $ | 1,487,496,967 | $ | 3,090,174,063 | $ | 5,021,757,268 | ||||||||
|
|
| ||||||||||||||
Net assets consist of: | ||||||||||||||||
Paid-in capital | $ | 873,948,518 | $ | 2,137,507,984 | $ | 3,436,158,886 | $ | 5,253,189,242 | ||||||||
Total distributable earnings (losses) | (135,634,902 | ) | (650,011,017 | ) | (345,984,823 | ) | (231,431,974 | ) | ||||||||
|
|
| ||||||||||||||
Net assets, at value | $ | 738,313,616 | $ | 1,487,496,967 | $ | 3,090,174,063 | $ | 5,021,757,268 | ||||||||
|
|
| ||||||||||||||
| Class A: | ||||||||||||||||
Net assets, at value | $ | 435,539,726 | $ | 757,158,587 | $ | 1,626,928,818 | $ | 3,560,331,243 | ||||||||
|
|
| ||||||||||||||
Shares outstanding | 54,824,191 | 105,080,087 | 179,519,781 | 371,061,889 | ||||||||||||
|
|
| ||||||||||||||
Net asset value per shareb | $7.94 | $7.21 | $9.06 | $9.59 | ||||||||||||
|
|
| ||||||||||||||
Maximum offering price per share (net asset value per share ÷ 97.75%, 97.75%, 97.75% and 96.25%, respectively) | $8.12 | $7.38 | $9.27 | $9.96 | ||||||||||||
|
|
| ||||||||||||||
| Class A1: | ||||||||||||||||
Net assets, at value | $ | 80,219,875 | ||||||||||||||
|
|
| ||||||||||||||
Shares outstanding | 10,100,247 | |||||||||||||||
|
|
| ||||||||||||||
Net asset value per shareb | $7.94 | |||||||||||||||
|
|
| ||||||||||||||
Maximum offering price per share (net asset value per share ÷ 97.75%) | $8.12 | |||||||||||||||
|
|
| ||||||||||||||
| Class C: | ||||||||||||||||
Net assets, at value | $ | 82,326,122 | $ | 203,140,655 | $ | 131,451,560 | $ | 242,254,852 | ||||||||
|
|
| ||||||||||||||
Shares outstanding | 10,369,160 | 28,187,257 | 14,566,392 | 25,434,976 | ||||||||||||
|
|
| ||||||||||||||
Net asset value and maximum offering price per shareb | $7.94 | $7.21 | $9.02 | $9.52 | ||||||||||||
|
|
| ||||||||||||||
| Class R: | ||||||||||||||||
Net assets, at value | $ | 172,511 | $ | 17,570,401 | ||||||||||||
|
| |||||||||||||||
Shares outstanding | 19,029 | 1,838,868 | ||||||||||||||
|
| |||||||||||||||
Net asset value and maximum offering price per share | $ | 9.07 | $9.56 | |||||||||||||
|
| |||||||||||||||
| Class R6: | ||||||||||||||||
Net assets, at value | $ | 30,188,747 | $ | 12,165,525 | $ | 1,131,790,363 | $ | 490,488,999 | ||||||||
|
|
| ||||||||||||||
Shares outstanding | 3,793,379 | 1,685,114 | 124,124,758 | 50,767,564 | ||||||||||||
|
|
| ||||||||||||||
Net asset value and maximum offering price per share | $7.96 | $7.22 | $9.12 | $9.66 | ||||||||||||
|
|
| ||||||||||||||
| Advisor Class: | ||||||||||||||||
Net assets, at value | $ | 110,039,146 | $ | 515,032,200 | $ | 199,830,811 | $ | 711,111,773 | ||||||||
|
|
| ||||||||||||||
Shares outstanding | 13,838,092 | 71,443,042 | 21,933,947 | 73,665,823 | ||||||||||||
|
|
| ||||||||||||||
Net asset value and maximum offering price per share | $7.95 | $7.21 | $9.11 | $9.65 | ||||||||||||
|
|
| ||||||||||||||
aConsolidated financial statement. See Note 1(h).
bRedemption price is equal to net asset value less contingent deferred sales charges, if applicable.
134 | Semiannual Report | The accompanying notes are an integral part of these financial statements. | franklintempleton.com | ||
FRANKLIN INVESTORS SECURITIES TRUST
FINANCIAL STATEMENTS
Statements of Operations
for the six months ended April 30, 2020 (unaudited)
| Franklin Adjustable U.S. Government Securities Fund | Franklin Floating Rate Daily Access Fund | Franklin Low Duration Total Return Fund | Franklin Total Return Funda | |||||||||||||
Investment income: | ||||||||||||||||
Dividends: | ||||||||||||||||
Unaffiliated issuers | $ | — | $ | 891,823 | $ | 783,757 | $ | 138,135 | ||||||||
Controlled affiliates (Note 3f and 11) | — | — | — | 10,773,710 | ||||||||||||
Non-controlled affiliates (Note 3f and 11) | 163,444 | 1,871,269 | 1,108,599 | 971,402 | ||||||||||||
Interest: (net of foreign taxes)~ | ||||||||||||||||
Non-controlled affiliates (Note 11) | — | 1,724,681 | — | — | ||||||||||||
Unaffiliated issuers: | ||||||||||||||||
Paydown gain (loss) | (3,491,055 | ) | — | (5,146,612 | ) | (6,334,172 | ) | |||||||||
Paid in cash | 11,841,874 | 48,953,981 | 57,252,403 | 85,498,887 | ||||||||||||
Income from securities loaned: | ||||||||||||||||
Unaffiliated entities (net of fees and rebates) | — | — | 207,154 | — | ||||||||||||
Non-controlled affiliates (Note 3f) | — | — | 18,274 | — | ||||||||||||
|
| |||||||||||||||
Total investment income | 8,514,263 | 53,441,754 | 54,223,575 | 91,047,962 | ||||||||||||
|
| |||||||||||||||
Expenses: | ||||||||||||||||
Management fees (Note 3a) | 1,732,092 | 5,087,948 | 7,874,416 | 11,931,459 | ||||||||||||
Distribution fees: (Note 3c) | ||||||||||||||||
Class A | 497,794 | 1,175,510 | 2,075,504 | 4,405,989 | ||||||||||||
Class A1 | 41,483 | — | — | — | ||||||||||||
Class C | 255,726 | 838,856 | 444,279 | 787,097 | ||||||||||||
Class R | — | — | 212 | 48,468 | ||||||||||||
Transfer agent fees: (Note 3e) | ||||||||||||||||
Class A | 297,117 | 609,829 | 1,187,899 | 2,302,864 | ||||||||||||
Class A1 | 61,935 | — | — | — | ||||||||||||
Class C | 58,712 | 167,412 | 97,774 | 158,237 | ||||||||||||
Class R | — | — | 63 | 12,717 | ||||||||||||
Class R6 | 9,133 | 7,750 | 139,256 | 70,316 | ||||||||||||
Advisor Class | 76,982 | 428,122 | 164,723 | 552,761 | ||||||||||||
Custodian fees (Note 4) | 2,535 | 7,271 | 52,441 | 70,604 | ||||||||||||
Reports to shareholders | 48,325 | 106,186 | 154,873 | 280,633 | ||||||||||||
Registration and filing fees | 68,335 | 81,420 | 134,457 | 126,633 | ||||||||||||
Professional fees | 31,512 | 57,028 | 70,760 | 77,943 | ||||||||||||
Trustees’ fees and expenses | 4,314 | 17,250 | 18,222 | 25,487 | ||||||||||||
Marketplace lending fees (Note 1k) | — | — | 266,795 | 16,907 | ||||||||||||
Other | 103,391 | 40,950 | 168,091 | 173,173 | ||||||||||||
|
| |||||||||||||||
Total expenses | 3,289,386 | 8,625,532 | 12,849,765 | 21,041,288 | ||||||||||||
Expense reductions (Note 4) | — | (1,826 | ) | (2,031 | ) | (2,953 | ) | |||||||||
Expenses waived/paid by affiliates (Note 3f and 3g) | (64,111 | ) | (296,244 | ) | (4,162,452 | ) | (1,082,001 | ) | ||||||||
|
| |||||||||||||||
Net expenses | 3,225,275 | 8,327,462 | 8,685,282 | 19,956,334 | ||||||||||||
|
| |||||||||||||||
Net investment income | 5,288,988 | 45,114,292 | 45,538,293 | 71,091,628 | ||||||||||||
|
| |||||||||||||||
Realized and unrealized gains (losses): | ||||||||||||||||
Net realized gain (loss) from: | ||||||||||||||||
Investments: | ||||||||||||||||
Unaffiliated issuers | — | (62,195,049 | ) | (2,821,204 | ) | 24,457,818 | ||||||||||
Non-controlled affiliates (Note 3f and 11) | — | 20,257 | — | — | ||||||||||||
Written options | — | — | (5,271,978 | ) | (6,248,482 | ) | ||||||||||
Foreign currency transactions | — | — | (246,675 | ) | (796,693 | ) | ||||||||||
franklintempleton.com | The accompanying notes are an integral part of these financial statements. | Semiannual Report | 135 | ||||
FRANKLIN INVESTORS SECURITIES TRUST
FINANCIAL STATEMENTS
Statements of Operations (continued)
for the six months ended April 30, 2020 (unaudited)
| Franklin Adjustable U.S. Government Securities Fund | Franklin Floating Rate Daily Access Fund | Franklin Low Duration Total Return Fund | Franklin Total Return Funda | |||||||||||||
Forward exchange contracts | $ | — | $ | — | $ | (1,394,022 | ) | $ | (203,449 | ) | ||||||
Futures contracts | — | — | (9,003,210 | ) | 12,072,454 | |||||||||||
Swap contracts | — | (382,887 | ) | (2,608,448 | ) | (10,881,028 | ) | |||||||||
Capital gain distributions from management investment companies: | ||||||||||||||||
Controlled affiliates (Note 3f) | — | — | — | 1,041,978 | ||||||||||||
|
| |||||||||||||||
Net realized gain (loss) | — | (62,557,679 | ) | (21,345,537 | ) | 19,442,598 | ||||||||||
|
| |||||||||||||||
Net change in unrealized appreciation (depreciation) on: | ||||||||||||||||
Investments: | ||||||||||||||||
Unaffiliated issuers | (3,869,714 | ) | (154,818,210 | ) | (152,673,740 | ) | (153,666,483 | ) | ||||||||
Controlled affiliates (Note 3f and 11) | — | — | — | (13,178,698 | ) | |||||||||||
Non-controlled affiliates (Note 3f and 11) | — | (3,673,181 | ) | (2,819,383 | ) | (1,828,186 | ) | |||||||||
Translation of other assets and liabilities denominated in foreign currencies | — | — | 368,550 | 491,436 | ||||||||||||
Forward exchange contracts | — | — | 3,622,228 | (5,730,732 | ) | |||||||||||
Written options | — | — | (2,470,185 | ) | — | |||||||||||
Futures contracts | — | — | 4,910,074 | 49,455,808 | ||||||||||||
Swap contracts | — | 369,172 | (26,233,177 | ) | (46,275,312 | ) | ||||||||||
Change in deferred taxes on unrealized appreciation | — | — | — | 2,835 | ||||||||||||
|
| |||||||||||||||
Net change in unrealized appreciation (depreciation) | (3,869,714 | ) | (158,122,219 | ) | (175,295,633 | ) | (170,729,332 | ) | ||||||||
|
| |||||||||||||||
Net realized and unrealized gain (loss) | (3,869,714 | ) | (220,679,898 | ) | (196,641,170 | ) | (151,286,734 | ) | ||||||||
|
| |||||||||||||||
Net increase (decrease) in net assets resulting from operations | $ | 1,419,274 | $ | (175,565,606 | ) | $ | (151,102,877 | ) | $ | (80,195,106 | ) | |||||
|
| |||||||||||||||
~Foreign taxes withheld on interest | $ | — | $ | — | $ | — | $ | 4,157 | ||||||||
aConsolidated financial statement. See Note 1(h).
136 | Semiannual Report | The accompanying notes are an integral part of these financial statements. | franklintempleton.com | ||
FRANKLIN INVESTORS SECURITIES TRUST
FINANCIAL STATEMENTS
Statements of Changes in Net Assets
| Franklin Adjustable U.S. Government Securities Fund | Franklin Floating Rate Daily Access Fund | |||||||||||||||
Six Months Ended April 30, 2020 | Year Ended October 31, 2019 | Six Months Ended April 30, 2020 (unaudited) | Year Ended October 31, 2019 | |||||||||||||
Increase (decrease) in net assets: | ||||||||||||||||
Operations: | ||||||||||||||||
Net investment income | $ | 5,288,988 | $ | 13,215,775 | $ | 45,114,292 | $ | 161,201,518 | ||||||||
Net realized gain (loss) | — | — | (62,557,679 | ) | (72,522,962 | ) | ||||||||||
Net change in unrealized appreciation (depreciation) | (3,869,714 | ) | 2,476,828 | (158,122,219 | ) | (111,443,489 | ) | |||||||||
|
| |||||||||||||||
Net increase (decrease) in net assets resulting from operations | 1,419,274 | 15,692,603 | (175,565,606 | ) | (22,764,933 | ) | ||||||||||
|
| |||||||||||||||
Distributions to shareholders: | ||||||||||||||||
Class A | (4,990,149 | ) | (12,001,795 | ) | (23,206,790 | ) | (64,119,132 | ) | ||||||||
Class A1 | (1,108,372 | ) | (2,915,661 | ) | — | — | ||||||||||
Class C | (833,239 | ) | (2,843,324 | ) | (5,863,374 | ) | (18,210,835 | ) | ||||||||
Class R6 | (451,454 | ) | (1,199,781 | ) | (417,327 | ) | (3,994,879 | ) | ||||||||
Advisor Class | (1,414,752 | ) | (3,815,385 | ) | (17,175,450 | ) | (77,201,443 | ) | ||||||||
|
| |||||||||||||||
Total distributions to shareholders | (8,797,966 | ) | (22,775,946 | ) | (46,662,941 | ) | (163,526,289 | ) | ||||||||
|
| |||||||||||||||
Capital share transactions: (Note 2) | ||||||||||||||||
Class A | 45,893,782 | (21,579,949 | ) | (178,057,464 | ) | (220,170,584 | ) | |||||||||
Class A1 | (5,450,323 | ) | (13,138,172 | ) | — | — | ||||||||||
Class C | (1,508,489 | ) | (40,864,972 | ) | (62,517,099 | ) | (119,511,218 | ) | ||||||||
Class R6 | (1,460,055 | ) | (3,739,246 | ) | (4,745,500 | ) | (118,338,106 | ) | ||||||||
Advisor Class | 7,733,437 | (7,695,018 | ) | (267,281,136 | ) | (802,269,979 | ) | |||||||||
|
| |||||||||||||||
Total capital share transactions | 45,208,352 | (87,017,357 | ) | (512,601,199 | ) | (1,260,289,887 | ) | |||||||||
|
| |||||||||||||||
Net increase (decrease) in net assets | 37,829,660 | (94,100,700 | ) | (734,829,746 | ) | (1,446,581,109 | ) | |||||||||
Net assets: | ||||||||||||||||
Beginning of period | 700,483,956 | 794,584,656 | 2,222,326,713 | 3,668,907,822 | ||||||||||||
|
| |||||||||||||||
End of period | $ | 738,313,616 | $ | 700,483,956 | $ | 1,487,496,967 | $ | 2,222,326,713 | ||||||||
|
| |||||||||||||||
franklintempleton.com | The accompanying notes are an integral part of these financial statements. | Semiannual Report | 137 | ||||
FRANKLIN INVESTORS SECURITIES TRUST
FINANCIAL STATEMENTS
Statements of Changes in Net Assets (continued)
Franklin Low Duration Total Return Fund | Franklin Total Return Funda | |||||||||||||||
|
| |||||||||||||||
| Six Months Ended April 30, 2020 (unaudited) | Year Ended October 31, 2019 | Six Months Ended April 30, 2020 (unaudited) | Year Ended October 31, 2019 | |||||||||||||
Increase (decrease) in net assets: | ||||||||||||||||
Operations: | ||||||||||||||||
Net investment income | $ 45,538,293 | $ 95,790,942 | $ 71,091,628 | $ 138,007,986 | ||||||||||||
Net realized gain (loss) | (21,345,537) | 11,354,598 | 19,442,598 | 110,171,716 | ||||||||||||
Net change in unrealized appreciation (depreciation) | (175,295,633) | 9,929,361 | (170,729,332) | 162,522,506 | ||||||||||||
|
| |||||||||||||||
Net increase (decrease) in net assets resulting from operations | (151,102,877) | 117,074,901 | (80,195,106) | 410,702,208 | ||||||||||||
|
| |||||||||||||||
Distributions to shareholders: | ||||||||||||||||
Class A | (30,223,599) | (52,306,023) | (69,397,472) | (92,537,289) | ||||||||||||
Class C | (2,232,525) | (3,709,440) | (4,289,621) | (6,711,287) | ||||||||||||
Class R | (1,536) | (7) | (364,596) | (667,734) | ||||||||||||
Class R6 | (24,832,968) | (38,208,441) | (10,582,801) | (15,990,733) | ||||||||||||
Advisor Class | (4,489,191) | (8,102,666) | (17,784,673) | (25,772,639) | ||||||||||||
|
| |||||||||||||||
Total distributions to shareholders | (61,779,819) | (102,326,577) | (102,419,163) | (141,679,682) | ||||||||||||
|
| |||||||||||||||
Capital share transactions: (Note 2) | ||||||||||||||||
Class A | 103,154,235 | 123,680,413 | 263,508,127 | 479,864,224 | ||||||||||||
Class C | 5,162,144 | 4,489,729 | 14,309,445 | (21,014,946) | ||||||||||||
Class R | 160,416 | 18,305 | (2,972,125) | (3,811,785) | ||||||||||||
Class R6 | 210,432,579 | (19,707,867) | 26,118,349 | 22,963,552 | ||||||||||||
Advisor Class | (39,888,513) | 38,827,472 | (122,315,415) | 196,798,568 | ||||||||||||
|
| |||||||||||||||
Total capital share transactions | 279,020,861 | 147,308,052 | 178,648,381 | 674,799,613 | ||||||||||||
|
| |||||||||||||||
Net increase (decrease) in net assets | 66,138,165 | 162,056,376 | (3,965,888) | 943,822,139 | ||||||||||||
Net assets: | ||||||||||||||||
Beginning of period | 3,024,035,898 | 2,861,979,522 | 5,025,723,156 | 4,081,901,017 | ||||||||||||
|
| |||||||||||||||
End of period | $3,090,174,063 | $3,024,035,898 | $5,021,757,268 | $5,025,723,156 | ||||||||||||
|
| |||||||||||||||
aConsolidated financial statement. See Note 1(h).
138 | Semiannual Report | The accompanying notes are an integral part of these financial statements. | franklintempleton.com | ||
FRANKLIN INVESTORS SECURITIES TRUST
Notes to Financial Statements (unaudited)
1. Organization and Significant Accounting Policies
Franklin Investors Securities Trust (Trust) is registered under the Investment Company Act of 1940 (1940 Act) as an open-end management investment company, consisting of seven separate funds, four of which are included in this report (Funds) and applies the specialized accounting and reporting guidance in U.S. Generally Accepted Accounting Principles (U.S. GAAP). The classes of shares offered within each of the Funds are indicated below. Class C shares automatically convert to Class A shares after they have been held for 10 years. Each class of shares may differ by its initial sales load, contingent deferred sales charges, voting rights on matters affecting a single class, its exchange privilege and fees due to differing arrangements for distribution and transfer agent fees.
Class A, Class A1, Class C, Class R6 & Advisor Class
Franklin Adjustable U.S. Government Securities Fund
Class A, Class C, Class R6 & Advisor Class
Franklin Floating Rate Daily Access Fund
Class A, Class C, Class R, Class R6 & Advisor Class
Franklin Low Duration Total Return Fund
Franklin Total Return Fund
The following summarizes the Funds’ significant accounting policies.
a. Financial Instrument Valuation
The Funds’ investments in financial instruments are carried at fair value daily. Fair value is the price that would be received to sell an asset or paid to transfer a liability in an orderly transaction between market participants on the measurement date. The Funds calculate the net asset value (NAV) per share each business day as of 4 p.m. Eastern time or the regularly scheduled close of the New York Stock Exchange (NYSE), whichever is earlier. Under compliance policies and procedures approved by the Trust’s Board of Trustees (the Board), the Funds’ administrator has responsibility for oversight of valuation, including leading the cross-functional Valuation Committee (VC). The Funds may utilize independent pricing services, quotations from securities and financial instrument dealers, and other market sources to determine fair value.
Equity securities, exchange traded funds and derivative financial instruments listed on an exchange or on the NASDAQ National Market System are valued at the last quoted sale price or the official closing price of the day, respectively. Foreign equity securities are valued as of the close of trading on the foreign stock exchange on which the security is primarily traded, or as of 4 p.m. Eastern time. The value is then converted into its U.S. dollar equivalent at the foreign exchange rate in effect at 4 p.m. Eastern time on the day that the value of the security is determined. Over-the-counter (OTC) securities are valued within the range of the most recent quoted bid and ask prices. Securities that trade in multiple markets or on multiple exchanges are valued according to the broadest and most representative market. Certain equity securities are valued based upon fundamental characteristics or relationships to similar securities.
Debt securities generally trade in the OTC market rather than on a securities exchange. The Funds’ pricing services use multiple valuation techniques to determine fair value. In instances where sufficient market activity exists, the pricing services may utilize a market-based approach through which quotes from market makers are used to determine fair value. In instances where sufficient market activity may not exist or is limited, the pricing services also utilize proprietary valuation models which may consider market characteristics such as benchmark yield curves, credit spreads, estimated default rates, anticipated market interest rate volatility, coupon rates, anticipated timing of principal repayments, underlying collateral, and other unique security features in order to estimate the relevant cash flows, which are then discounted to calculate the fair value. Securities denominated in a foreign currency are converted into their U.S. dollar equivalent at the foreign exchange rate in effect at 4 p.m. Eastern time on the date that the values of the foreign debt securities are determined.
Investments in open-end mutual funds are valued at the closing NAV. Investments in repurchase agreement are valued at cost, which approximates fair value.
Certain derivative financial instruments are centrally cleared or trade in the OTC market. The Funds’ pricing services use various techniques including industry standard option pricing models and proprietary discounted cash flow models to determine the fair value of those instruments. The Funds’ net benefit or obligation under the derivative contract, as measured by the fair value of the contract, is included in net assets.
franklintempleton.com | Semiannual Report | 139 | ||||
FRANKLIN INVESTORS SECURITIES TRUST
NOTES TO FINANCIAL STATEMENTS (UNAUDITED)
1. Organization and Significant Accounting Policies (continued)
a. Financial Instrument Valuation (continued)
The Funds have procedures to determine the fair value of financial instruments for which market prices are not reliable or readily available. Under these procedures, the Funds primarily employ a market-based approach which may use related or comparable assets or liabilities, recent transactions, market multiples, book values, and other relevant information for the investment to determine the fair value of the investment. An income-based valuation approach may also be used in which the anticipated future cash flows of the investment are discounted to calculate fair value. Discounts may also be applied due to the nature or duration of any restrictions on the disposition of the investments. Due to the inherent uncertainty of valuations of such investments, the fair values may differ significantly from the values that would have been used had an active market existed.
Trading in securities on foreign securities stock exchanges and OTC markets may be completed before 4 p.m. Eastern time. In addition, trading in certain foreign markets may not take place on every Funds’ business day. Occasionally, events occur between the time at which trading in a foreign security is completed and 4 p.m. Eastern time that might call into question the reliability of the value of a portfolio security held by the Fund. As a result, differences may arise between the value of the Funds’ portfolio securities as determined at the foreign market close and the latest indications of value at 4 p.m. Eastern time. In order to minimize the potential for these differences, the VC monitors price movements following the close of trading in foreign stock markets through a series of country specific market proxies (such as baskets of American Depositary Receipts, futures contracts and exchange traded funds). These price movements are measured against established trigger thresholds for each specific market proxy to assist in determining if an event has occurred that may call into question the reliability of the values of the foreign securities held by the Funds. If such an event occurs, the securities may be valued using fair value procedures, which may include the use of independent pricing services.
When the last day of the reporting period is a non-business day, certain foreign markets may be open on those days that the Funds’ NAV is not calculated, which could result in differences between the value of the Funds’ portfolio securities on the last business day and the last calendar day
of the reporting period. Any significant security valuation changes due to an open foreign market are adjusted and reflected by the Funds for financial reporting purposes.
b. Foreign Currency Translation
Portfolio securities and other assets and liabilities denominated in foreign currencies are translated into U.S. dollars based on the exchange rate of such currencies against U.S. dollars on the date of valuation. The Funds may enter into foreign currency exchange contracts to facilitate transactions denominated in a foreign currency. Purchases and sales of securities, income and expense items denominated in foreign currencies are translated into U.S. dollars at the exchange rate in effect on the transaction date. Portfolio securities and assets and liabilities denominated in foreign currencies contain risks that those currencies will decline in value relative to the U.S. dollar. Occasionally, events may impact the availability or reliability of foreign exchange rates used to convert the U.S. dollar equivalent value. If such an event occurs, the foreign exchange rate will be valued at fair value using procedures established and approved by the Board.
The Funds do not separately report the effect of changes in foreign exchange rates from changes in market prices on securities held. Such changes are included in net realized and unrealized gain or loss from investments in the Statements of Operations.
Realized foreign exchange gains or losses arise from sales of foreign currencies, currency gains or losses realized between the trade and settlement dates on securities transactions and the difference between the recorded amounts of dividends, interest, and foreign withholding taxes and the U.S. dollar equivalent of the amounts actually received or paid. Net unrealized foreign exchange gains and losses arise from changes in foreign exchange rates on foreign denominated assets and liabilities other than investments in securities held at the end of the reporting period.
c. Joint Repurchase Agreement
Certain or all Funds enter into a joint repurchase agreement whereby their uninvested cash balance is deposited into a joint cash account with other funds managed by the investment manager or an affiliate of the investment manager and is used to invest in one or more repurchase agreements. The value and face amount of the joint repurchase agreement are allocated to the funds based on their pro-rata
140 | Semiannual Report | franklintempleton.com | ||
FRANKLIN INVESTORS SECURITIES TRUST
NOTES TO FINANCIAL STATEMENTS (UNAUDITED)
interest. A repurchase agreement is accounted for as a loan by the Fund to the seller, collateralized by securities which are delivered to the Funds’ custodian. The fair value, including accrued interest, of the initial collateralization is required to be at least 102% of the dollar amount invested by the funds, with the value of the underlying securities marked to market daily to maintain coverage of at least 100%. Repurchase agreements are subject to the terms of Master Repurchase Agreements (MRAs) with approved counterparties (sellers). The MRAs contain various provisions, including but not limited to events of default and maintenance of collateral for repurchase agreements. In the event of default by either the seller or the Funds, certain MRAs may permit the non-defaulting party to net and close-out all transactions, if any, traded under such agreements. The Funds may sell securities it holds as collateral and apply the proceeds towards the repurchase price and any other amounts owed by the seller to the Funds in the event of default by the seller. This could involve costs or delays in addition to a loss on the securities if their value falls below the repurchase price owed by the seller. The joint repurchase agreement held by the Funds at period end, as indicated in the Statements of Investments, had been entered into on April 30, 2020.
d. Securities Purchased on a When-Issued or Delayed Delivery and TBA Basis
Certain or all Funds purchase securities on a when-issued or delayed delivery and to-be-announced (TBA) basis, with payment and delivery scheduled for a future date. These transactions are subject to market fluctuations and are subject to the risk that the value at delivery may be more or less than the trade date purchase price. Although the Funds will generally purchase these securities with the intention of holding the securities, they may sell the securities before the settlement date. Sufficient assets have been segregated for these securities and collateral has been pledged and/or received for open TBA trades.
e. Derivative Financial Instruments
Certain or all Funds invested in derivative financial instruments in order to manage risk or gain exposure to various other investments or markets. Derivatives are financial contracts based on an underlying or notional amount, require no initial investment or an initial net investment that is smaller than would normally be required to have a similar response to changes in market factors, and require or permit net settlement. Derivatives contain various
risks including the potential inability of the counterparty to fulfill their obligations under the terms of the contract, the potential for an illiquid secondary market, and/or the potential for market movements which expose the Fund to gains or losses in excess of the amounts shown in the Statements of Assets and Liabilities. Realized gain and loss and unrealized appreciation and depreciation on these contracts for the period are included in the Statements of Operations.
Derivative counterparty credit risk is managed through a formal evaluation of the creditworthiness of all potential counterparties. Certain or all Funds attempt to reduce their exposure to counterparty credit risk on OTC derivatives, whenever possible, by entering into International Swaps and Derivatives Association (ISDA) master agreements with certain counterparties. These agreements contain various provisions, including but not limited to collateral requirements, events of default, or early termination. Termination events applicable to the counterparty include certain deteriorations in the credit quality of the counterparty. Termination events applicable to the Funds include failure of the Funds to maintain certain net asset levels and/or limit the decline in net assets over various periods of time. In the event of default or early termination, the ISDA master agreement gives the non-defaulting party the right to net and close-out all transactions traded, whether or not arising under the ISDA agreement, to one net amount payable by one counterparty to the other. However, absent an event of default or early termination, OTC derivative assets and liabilities are presented gross and not offset in the Statements of Assets and Liabilities. Early termination by the counterparty may result in an immediate payment by the Funds of any net liability owed to that counterparty under the ISDA agreement.
Collateral requirements differ by type of derivative. Collateral or initial margin requirements are set by the broker or exchange clearing house for exchange traded and centrally cleared derivatives. Initial margin deposited is held at the exchange and can be in the form of cash and/or securities. For OTC derivatives traded under an ISDA master agreement, posting of collateral is required by either the Fund or the applicable counterparty if the total net exposure of all OTC derivatives with the applicable counterparty exceeds the minimum transfer amount, which typically ranges from $100,000 to $250,000, and can vary depending on the counterparty and the type of the agreement. Generally, collateral is determined at the close of Fund business each day and any additional collateral required due to changes in derivative values may be delivered by the Fund or the
franklintempleton.com | Semiannual Report | 141 | ||||
FRANKLIN INVESTORS SECURITIES TRUST
NOTES TO FINANCIAL STATEMENTS (UNAUDITED)
1. Organization and Significant Accounting Policies (continued)
e. Derivative Financial Instruments (continued)
counterparty the next business day, or within a few business days. Collateral pledged and/or received by the Fund for OTC derivatives, if any, is held in segregated accounts with the Fund’s custodian/counterparty broker and can be in the form of cash and/or securities. Unrestricted cash may be invested according to the Funds’ investment objectives. To the extent that the amounts due to the Fund from its counterparties are not subject to collateralization or are not fully collateralized, the Fund bears the risk of loss from counterparty non-performance.
Certain or all Funds entered into exchange traded futures contracts primarily to manage and/or gain exposure to interest rate risk. A futures contract is an agreement between the Fund and a counterparty to buy or sell an asset at a specified price on a future date. Required initial margins are pledged by the Fund, and the daily change in fair value is accounted for as a variation margin payable or receivable in the Statements of Assets and Liabilities.
Certain or all Funds entered into OTC forward exchange contracts primarily to manage and/or gain exposure to certain foreign currencies. A forward exchange contract is an agreement between the Fund and a counterparty to buy or sell a foreign currency at a specific exchange rate on a future date.
Certain or all Funds entered into credit default swap contracts primarily to manage and/or gain exposure to credit risk. A credit default swap is an agreement between the Fund and a counterparty whereby the buyer of the contract receives credit protection and the seller of the contract guarantees the credit worthiness of a referenced debt obligation. These agreements may be privately negotiated in the over-the-counter market (OTC credit default swaps) or may be executed in a multilateral trade facility platform, such as a registered exchange (centrally cleared credit default swaps). The underlying referenced debt obligation may be a single issuer of corporate or sovereign debt, a credit index, a basket of issuers or indices, or a tranche of a credit index or basket of issuers or indices. In the event of a default of the underlying referenced debt obligation, the buyer is entitled to receive the notional amount of the credit default swap contract from the seller in exchange for the referenced debt obligation, a net settlement amount equal to the notional
amount of the credit default swap less the recovery value of the referenced debt obligation, or other agreed upon amount. For centrally cleared credit default swaps, required initial margins are pledged by the Fund, and the daily change in fair value is accounted for as a variation margin payable or receivable in the Statements of Assets and Liabilities. Over the term of the contract, the buyer pays the seller a periodic stream of payments, provided that no event of default has occurred. Such periodic payments are accrued daily as an unrealized appreciation or depreciation until the payments are made, at which time they are realized. Upfront payments and receipts are reflected in the Statements of Assets and Liabilities and represent compensating factors between stated terms of the credit default swap agreement and prevailing market conditions (credit spreads and other relevant factors). These upfront payments and receipts are amortized over the term of the contract as a realized gain or loss in the Statements of Operations.
Certain or all Funds entered into OTC cross currency swap contracts primarily to manage and/or gain exposure to certain foreign currencies. A cross currency swap is an agreement between the Fund and a counterparty to exchange cash flows (determined using either a fixed or floating rate) based on the notional amounts of two different currencies. The notional amounts are typically determined based on the spot exchange rates at the opening of the contract. Cross currency swaps may require the exchange of notional amounts at the opening and/or closing of the contract. Over the term of the contract, contractually required payments to be paid and to be received are accrued daily and recorded as unrealized depreciation and appreciation until the payments are made, at which time they are realized. Upfront payments and receipts are reflected in the Statements of Assets and Liabilities and represent compensating factors between stated terms of the cross currency swap contract and prevailing market conditions (interest rate spreads and other relevant factors). These upfront payments and receipts are amortized over the term of the contract as a realized gain or loss in the Statements of Operations.
Certain or all Funds entered into inflation index swap contracts primarily to manage and/or gain exposure to inflation risk. An inflation index swap is an agreement between the Fund and a counterparty to exchange cash flows whereby one party makes payments based on the percentage change in an index that serves as a measure of inflation and the other party makes a regular payment based on a compounded fixed rate, applied to a notional amount.
142 | Semiannual Report | franklintempleton.com | ||
FRANKLIN INVESTORS SECURITIES TRUST
NOTES TO FINANCIAL STATEMENTS (UNAUDITED)
These agreements may be privately negotiated in the over-the-counter market (OTC inflation index swap) or may be executed on a registered exchange (centrally cleared inflation index swap). For centrally cleared inflation index swaps, required initial margins are pledged by the Fund, and the daily change in fair value is accounted for as a variation margin payable or receivable. Over the term of the contract, contractually required payments to be paid and to be received are accrued daily and recorded as unrealized depreciation and appreciation until the payments are made, at which time they are realized. Typically, an inflation index swap has payment obligations netted and exchanged upon maturity.
Certain or all Funds entered into interest rate swap contracts primarily to manage interest rate risk. An interest rate swap is an agreement between the Fund and a counterparty to exchange cash flows based on the difference between two interest rates, applied to a notional amount. These agreements may be privately negotiated in the over-the-counter market (OTC interest rate swaps) or may be executed on a registered exchange (centrally cleared interest rate swaps). For centrally cleared interest rate swaps, required initial margins are pledged by the Fund, and the daily change in fair value is accounted for as a variation margin payable or receivable in the Statements of Assets and Liabilities. Over the term of the contract, contractually required payments to be paid and to be received are accrued daily and recorded as unrealized depreciation and appreciation until the payments are made, at which time they are realized.
Certain or all Funds entered into OTC total return swap contracts primarily to manage and/or gain exposure to credit and other market risk of an underlying instrument such as a stock, bond, index or basket of securities or indices. A total return swap is an agreement between the Fund and a counterparty to exchange a return linked to an underlying instrument for a floating or fixed rate payment, both based upon a notional amount. Over the term of the contract, contractually required payments to be paid or received are accrued daily and recorded as unrealized appreciation or depreciation until the payments are made, at which time they are recognized as realized gain or loss.
Certain or all Funds purchased or wrote exchange traded and/or OTC option contracts primarily to manage and/or gain exposure to interest rate and credit risk. An option is a contract entitling the holder to purchase or sell a specific amount of shares or units of an asset or notional amount of a swap (swaption), at a specified price. When an option is
purchased or written, an amount equal to the premium paid or received is recorded as an asset or liability, respectively. Upon exercise of an option, the acquisition cost or sales proceeds of the underlying investment is adjusted by any premium received or paid. Upon expiration of an option, any premium received or paid is recorded as a realized gain or loss. Upon closing an option other than through expiration or exercise, the difference between the premium received or paid and the cost to close the position is recorded as a realized gain or loss.
Certain or all Funds invest in value recovery instruments (VRI) primarily to gain exposure to economic growth. Periodic payments from VRI are dependent on established benchmarks for underlying variables. VRI has a notional amount, which is used to calculate amounts of payments to holders. Payments are recorded upon receipt as realized gains in the Statements of Operations. The risks of investing in VRI include growth risk, liquidity, and the potential loss of investment.
See Note 10 regarding other derivative information.
f. Loan Participation Notes
Certain or all Funds invest in loan participation notes (Participations). Participations are loans originally issued to a borrower by one or more financial institutions (the Lender) and subsequently sold to other investors, such as the Funds. Participations typically result in the Fund having a contractual relationship only with the Lender and not with the borrower. The Funds have the right to receive from the Lender any payments of principal, interest and fees which the Lender received from the borrower. The Funds generally have no rights to either enforce compliance by the borrower with the terms of the loan agreement or to any collateral relating to the original loan. As a result, the Funds assume the credit risk of both the borrower and the Lender that is selling the Participation. The Participations may also involve interest rate risk and liquidity risk, including the potential default or insolvency of the borrower and/or the Lender.
g. Securities Lending
Certain or all Funds participate in an agency based securities lending program to earn additional income. The Fund receives cash collateral against the loaned securities in an amount equal to at least 102% of the fair value of the loaned securities. Collateral is maintained over the life of the loan in an amount not less than 100% of the fair value of loaned
franklintempleton.com | Semiannual Report | 143 | ||||
FRANKLIN INVESTORS SECURITIES TRUST
NOTES TO FINANCIAL STATEMENTS (UNAUDITED)
1. Organization and Significant Accounting Policies (continued)
g. Securities Lending (continued)
securities, as determined at the close of Fund business each day; any additional collateral required due to changes in security values is delivered to the Fund on the next business day. The collateral is deposited into a joint cash account with other funds and is used to invest in a money market fund managed by Franklin Advisers, Inc., an affiliate of the Funds. The Fund may receive income from the investment of cash collateral, in addition to lending fees and rebates paid by the borrower. Income from securities loaned, net of fees paid to the securities lending agent and/or third-party vendor, is reported separately in the Statements of Operations. The Fund bears the market risk with respect to the collateral investment, securities loaned, and the risk that the agent may default on its obligations to the Fund. If the borrower defaults on its obligation to return the securities loaned, the Fund has the right to repurchase the securities in the open market using the collateral received. The securities lending agent has agreed to indemnify the Fund in the event of default by a third party borrower. At April 30, 2020, the Franklin Low Duration Total Return Fund had no securities on loan.
h. Investments in FT Holdings Corporation I (FT Subsidiary)
Franklin Total Return Fund invests in certain financial instrument through its investment in FT Subsidiary. FT Subsidiary is a Delaware Corporation, is a wholly-owned subsidiary of the Fund, and is able to invest in certain financial instruments consistent with the investment objective of the Fund. At April 30, 2020, FT Subsidiary’s investment, Turtle Bay Resort, as well as any other assets and liabilities of the FT Subsidiary are reflected in the Fund’s Consolidated Statement of Investments and Consolidated Statement of Assets and Liabilities.
At April 30, 2020, FT Subsidiary, which is a tax paying entity, recognized an unrealized loss on its Turtle Bay investment. An estimated deferred tax asset based on such unrealized loss is reflected as FT Subsidiary deferred tax benefit in the Consolidated Statement of Assets and Liabilities. The estimated benefit was calculated using a federal rate of 21%. When the Turtle Bay investment liquidates, FT Subsidiary will recognize a capital loss which can be carried-back to offset prior year capital gains, resulting in a tax refund which will relieve the deferred tax asset.
The financial statements have been consolidated and include the accounts of the Fund and FT Subsidiary. All intercompany transactions and balances have been eliminated. At April 30, 2020, the net assets of FT Subsidiary were $5,159,028, representing 0.1% of the Fund’s consolidated net assets. The Fund’s investment in FT Subsidiary is limited to 25% of consolidated assets.
i. Mortgage Dollar Rolls
Certain or all Funds enter into mortgage dollar rolls, typically on a TBA basis. Mortgage dollar rolls are agreements between the Fund and a financial institution where the Fund sells (or buys) mortgage-backed securities for delivery on a specified date and simultaneously contracts to repurchase (or sell) substantially similar (same type, coupon, and maturity) securities at a future date and at a predetermined price. Gains or losses are realized on the initial sale, and the difference between the repurchase price and the sale price is recorded as an unrealized gain or loss to the Fund upon entering into the mortgage dollar roll. In addition, the Fund may invest the cash proceeds that are received from the initial sale. During the period between the sale and repurchase, the Fund is not entitled to principal and interest paid on the mortgage backed securities. Transactions in mortgage dollar rolls are accounted for as purchases and sales and may result in an increase to the Fund’s portfolio turnover rate. The risks of mortgage dollar roll transactions include the potential inability of the counterparty to fulfill its obligations.
j. Senior Floating Rate Interests
Certain or all Funds invest in senior secured corporate loans that pay interest at rates which are periodically reset by reference to a base lending rate plus a spread. These base lending rates are generally the prime rate offered by a designated U.S. bank or the London InterBank Offered Rate (LIBOR). Senior secured corporate loans often require prepayment of principal from excess cash flows or at the discretion of the borrower. As a result, actual maturity may be substantially less than the stated maturity. Senior secured corporate loans in which the Funds invest are generally readily marketable, but may be subject to certain restrictions on resale. On July 27, 2017, the United Kingdom’s Financial Conduct Authority announced its intention to cease sustaining LIBOR after 2021. There remains uncertainty regarding the future utilization of LIBOR and the nature of any replacement rate. As such, the potential effect of a transition away from
144 | Semiannual Report | franklintempleton.com | ||
FRANKLIN INVESTORS SECURITIES TRUST
NOTES TO FINANCIAL STATEMENTS (UNAUDITED)
LIBOR on the Fund or the Fund’s investments that use or may use a floating rate based on LIBOR cannot yet be determined.
k. Marketplace Lending
Certain or all Funds invest in loans obtained through marketplace lending. Marketplace lending, sometimes referred to as peer-to-peer lending, is a method of financing in which a platform facilitates the borrowing and lending of money. It is considered an alternative to more traditional forms of debt financing. Prospective borrowers are required to provide certain financial information to the platform, including, but not limited to, the intended purpose of the loan, income, employment information, credit score, debt-to-income ratio, credit history (including defaults and delinquencies) and home ownership status. Based on this and other information, the platform assigns its own credit rating to the borrower and sets the interest rate for the requested loan. The platform then posts the borrowing requests online, giving investors the opportunity to purchase the loans based on factors such as the interest rates and expected yields of the loans, the borrower background data, and the credit rating assigned by the platform.
When the Funds invest in these loans, they usually purchases all rights, title and interest in the loans pursuant to a loan purchase agreement directly from the platform. The platform or a third-party servicer typically continues to service the loans, collecting payments and distributing them to the Funds, less any servicing fees assessed. The servicer is typically responsible for taking actions against a borrower in the event of a default on the loan. Servicing fees, along with other administration fees, are included in marketplace lending fees in the Statements of Operations. The Funds, as investors in a loan, would be entitled to receive payment only from the borrower and would not be able to recover any deficiency from the platform, except under very narrow circumstances. The loans in which the Funds may invest are unsecured.
l. Income and Deferred Taxes
It is each Fund’s policy to qualify as a regulated investment company under the Internal Revenue Code. Each Fund intends to distribute to shareholders substantially all of its taxable income and net realized gains to relieve it from federal income and excise taxes. As a result, no provision for U.S. federal income taxes is required.
The Funds may be subject to foreign taxation related to income received, capital gains on the sale of securities and certain foreign currency transactions in the foreign jurisdictions in which the Funds invest. Foreign taxes, if any, are recorded based on the tax regulations and rates that exist in the foreign markets in which the Funds invest. When a capital gain tax is determined to apply, certain or all Funds record an estimated deferred tax liability in an amount that would be payable if the securities were disposed of on the valuation date.
Each Fund may recognize an income tax liability related to its uncertain tax positions under U.S. GAAP when the uncertain tax position has a less than 50% probability that it will be sustained upon examination by the tax authorities based on its technical merits. As of April 30, 2020, the each Fund has determined that no tax liability is required in its financial statements related to uncertain tax positions for any open tax years (or expected to be taken in future tax years). Open tax years are those that remain subject to examination and are based on the statute of limitations in each jurisdiction in which the Fund invests.
m. Security Transactions, Investment Income, Expenses and Distributions
Security transactions are accounted for on trade date. Realized gains and losses on security transactions are determined on a specific identification basis. Interest income and estimated expenses are accrued daily. Amortization of premium and accretion of discount on debt securities are included in interest income. Paydown gains and losses are recorded separately on the Statements of Operations. Facility fees are recognized as income over the expected term of the loan. Dividend income and realised gain distributions are recorded on the ex-dividend date except for certain dividends from securities where the dividend rate is not available. In such cases, the dividend is recorded as soon as the information is received by the Funds. Dividends from net investment income are normally declared daily; these dividends may be reinvested or paid monthly to shareholders. Distributions from realized capital gains and other distributions, if any, are recorded on the ex-dividend date. Distributions to shareholders are recorded on the ex-dividend date. Distributable earnings are determined according to income tax regulations (tax basis) and may differ from earnings recorded in accordance with U.S. GAAP. These differences may be permanent or temporary. Permanent differences are reclassified among capital accounts to reflect
franklintempleton.com | Semiannual Report | 145 | ||||
FRANKLIN INVESTORS SECURITIES TRUST
NOTES TO FINANCIAL STATEMENTS (UNAUDITED)
1. Organization and Significant Accounting Policies (continued)
m. Security Transactions, Investment Income, Expenses and Distributions (continued)
their tax character. These reclassifications have no impact on net assets or the results of operations. Temporary differences are not reclassified, as they may reverse in subsequent periods.
Common expenses incurred by the Trust are allocated among the Funds based on the ratio of net assets of each Fund to the combined net assets of the Trust or based on the ratio of number of shareholders of each Fund to the combined number of shareholders of the Trust. Fund specific expenses are charged directly to the Fund that incurred the expense.
Net investment income, excluding class specific expenses, is allocated daily to each class of shares based upon the relative value of the settled shares of each class. Realized and unrealized gains and losses are allocated daily to each class of shares based upon the relative proportion of net assets of each class. Differences in per share distributions by class are generally due to differences in class specific expenses.
Inflation-indexed bonds are adjusted for inflation through periodic increases or decreases in the security’s interest accruals, face amount, or principal redemption value, by
amounts corresponding to the rate of inflation as measured by an index. Any increase or decrease in the face amount or principal redemption value will be included as interest income in the Statements of Operations.
n. Accounting Estimates
The preparation of financial statements in accordance with U.S. GAAP requires management to make estimates and assumptions that affect the reported amounts of assets and liabilities at the date of the financial statements and the amounts of income and expenses during the reporting period. Actual results could differ from those estimates.
o. Guarantees and Indemnifications
Under the Trust’s organizational documents, its officers and trustees are indemnified by the Trust against certain liabilities arising out of the performance of their duties to the Trust. Additionally, in the normal course of business, the Trust, on behalf of the Funds, enters into contracts with service providers that contain general indemnification clauses. The Trust’s maximum exposure under these arrangements is unknown as this would involve future claims that may be made against the Trust that have not yet occurred. Currently, the Trust expects the risk of loss to be remote.
146 | Semiannual Report | franklintempleton.com | ||
FRANKLIN INVESTORS SECURITIES TRUST
NOTES TO FINANCIAL STATEMENTS (UNAUDITED)
2. Shares of Beneficial Interest
At April 30, 2020, there were an unlimited number of shares authorized (without par value). Transactions in the Funds’ shares were as follows:
| Franklin Adjustable U.S Government Securities Fund | Franklin Floating Rate Daily Access Fund | |||||||||||||||
| Shares | Amount | Shares | Amount | |||||||||||||
| Class A Shares: | ||||||||||||||||
| Six Months ended April 30, 2020 | ||||||||||||||||
| Shares solda | 17,003,090 | $ | 135,559,055 | 7,352,928 | $ | 58,839,605 | ||||||||||
| Shares issued in reinvestment of distributions | 594,866 | 4,739,117 | 2,737,336 | 21,623,561 | ||||||||||||
| Shares redeemed | (11,861,973 | ) | (94,404,390 | ) | (33,322,879 | ) | (258,520,630 | ) | ||||||||
| Net increase (decrease) | 5,735,983 | $ | 45,893,782 | (23,232,615 | ) | $ | (178,057,464 | ) | ||||||||
| Year ended October 31, 2019 | ||||||||||||||||
| Shares solda | 18,451,688 | $ | 148,737,677 | 24,396,121 | $ | 207,005,295 | ||||||||||
| Shares issued in reinvestment of distributions | 1,420,216 | 11,437,638 | 7,091,086 | 59,838,783 | ||||||||||||
| Shares redeemed | (22,545,484 | ) | (181,755,264 | ) | (57,649,550 | ) | (487,014,662 | ) | ||||||||
| Net increase (decrease) | (2,673,580 | ) | $ | (21,579,949 | ) | (26,162,343 | ) | $ | (220,170,584 | ) | ||||||
| Class A1 Shares: | ||||||||||||||||
| Six Months ended April 30, 2020 | ||||||||||||||||
| Shares sold | 320,473 | $ | 2,559,741 | |||||||||||||
| Shares issued in reinvestment of distributions | 130,892 | 1,042,776 | ||||||||||||||
| Shares redeemed | (1,134,659 | ) | (9,052,840 | ) | ||||||||||||
| Net increase (decrease) | (683,294 | ) | $ | (5,450,323 | ) | |||||||||||
| Year ended October 31, 2019 | ||||||||||||||||
| Shares sold | 644,638 | $ | 5,198,030 | |||||||||||||
| Shares issued in reinvestment of distributions | 341,392 | 2,748,361 | ||||||||||||||
| Shares redeemed | (2,617,010 | ) | (21,084,563 | ) | ||||||||||||
| Net increase (decrease) | (1,630,980 | ) | $ | (13,138,172 | ) | |||||||||||
| Class C Shares: | ||||||||||||||||
| Six Months ended April 30, 2020 | ||||||||||||||||
| Shares sold | 4,792,287 | $ | 38,170,008 | 1,131,842 | $ | 9,067,631 | ||||||||||
| Shares issued in reinvestment of distributions | 98,168 | 781,414 | 686,193 | 5,430,652 | ||||||||||||
| Shares redeemeda | (5,086,383 | ) | (40,459,911 | ) | (9,834,953 | ) | (77,015,382 | ) | ||||||||
| Net increase (decrease) | (195,928 | ) | $ | (1,508,489 | ) | (8,016,918 | ) | $ | (62,517,099 | ) | ||||||
| Year ended October 31, 2019 | ||||||||||||||||
| Shares sold | 2,141,425 | $ | 17,258,372 | 4,867,026 | $ | 41,398,389 | ||||||||||
| Shares issued in reinvestment of distributions | 328,535 | 2,643,522 | 2,007,653 | 16,956,492 | ||||||||||||
| Shares redeemeda | (7,551,249 | ) | (60,766,866 | ) | (21,042,279 | ) | (177,866,099 | ) | ||||||||
| Net increase (decrease) | (5,081,289 | ) | $ | (40,864,972 | ) | (14,167,600 | ) | $ | (119,511,218 | ) | ||||||
franklintempleton.com | Semiannual Report | 147 | ||||
FRANKLIN INVESTORS SECURITIES TRUST
NOTES TO FINANCIAL STATEMENTS (UNAUDITED)
2. Shares of Beneficial Interest (continued)
| Franklin Adjustable U.S. Government Securities Fund | Franklin Floating Rate Daily Access Fund | |||||||||||||||
| Shares | Amount | Shares | Amount | |||||||||||||
| Class R6 Shares: | ||||||||||||||||
| Six Months ended April 30, 2020 | ||||||||||||||||
| Shares sold | 528,429 | $ | 4,221,179 | 226,144 | $ | 1,798,159 | ||||||||||
| Shares issued in reinvestment of distributions | 56,578 | 451,446 | 47,359 | 375,207 | ||||||||||||
| Shares redeemed | (768,411 | ) | (6,132,680 | ) | (878,374 | ) | (6,918,866 | ) | ||||||||
| Net increase (decrease) | (183,404 | ) | $ | (1,460,055 | ) | (604,871 | ) | $ | (4,745,500 | ) | ||||||
| Year ended October 31, 2019 | ||||||||||||||||
| Shares sold | 1,808,708 | $ | 14,620,360 | 6,237,102 | $ | 53,203,518 | ||||||||||
| Shares issued in reinvestment of distributions | 148,766 | 1,199,760 | 449,623 | 3,806,996 | ||||||||||||
| Shares redeemed | (2,423,068 | ) | (19,559,366 | ) | (20,715,643 | ) | (175,348,620 | ) | ||||||||
| Net increase (decrease) | (465,594 | ) | $ | (3,739,246 | ) | (14,028,918 | ) | $ | (118,338,106 | ) | ||||||
| Advisor Class Shares: | ||||||||||||||||
| Six Months ended April 30, 2020 | ||||||||||||||||
| Shares sold | 8,673,204 | $ | 69,403,615 | 13,783,871 | $ | 106,573,499 | ||||||||||
| Shares issued in reinvestment of distributions | 159,877 | 1,274,483 | 1,454,428 | 11,514,080 | ||||||||||||
| Shares redeemed | (7,902,304 | ) | (62,944,661 | ) | (48,669,735 | ) | (385,368,715 | ) | ||||||||
| Net increase (decrease) | 930,777 | $ | 7,733,437 | (33,431,436 | ) | $ | (267,281,136 | ) | ||||||||
| Year ended October 31, 2019 | ||||||||||||||||
| Shares sold | 9,661,245 | $ | 78,040,579 | 49,968,193 | $ | 425,681,497 | ||||||||||
| Shares issued in reinvestment of distributions | 409,290 | 3,300,024 | 5,583,560 | 47,203,015 | ||||||||||||
| Shares redeemed | (11,037,539 | ) | (89,035,621 | ) | (150,952,054 | ) | (1,275,154,491 | ) | ||||||||
| Net increase (decrease) | (967,004 | ) | $ | (7,695,018 | ) | (95,400,301 | ) | $ | (802,269,979 | ) | ||||||
aMay include a portion of Class C shares that were automatically converted to Class A.
| Franklin Low Duration Total Return Fundb | Franklin Total Return Fund | |||||||||||||||
| Shares | Amount | Shares | Amount | |||||||||||||
| Class A Shares: | ||||||||||||||||
| Six Months ended April 30, 2020 | ||||||||||||||||
| Shares solda | 42,621,759 | $ | 403,135,230 | 49,758,102 | $ | 488,689,665 | ||||||||||
| Shares issued in reinvestment of distributions | 2,946,881 | 27,824,611 | 6,409,005 | 62,775,951 | ||||||||||||
| Shares issued on reorganization (Note 12) | 186,443 | 1,794,790 | 10,674,554 | 105,907,423 | ||||||||||||
| Shares redeemed | (35,319,116 | ) | (329,600,396 | ) | (40,850,105 | ) | (393,864,912 | ) | ||||||||
| Net increase (decrease) | 10,435,967 | $ | 103,154,235 | 25,991,556 | $ | 263,508,127 | ||||||||||
| Year ended October 31, 2019 | ||||||||||||||||
| Shares solda | 79,629,462 | $ | 767,009,943 | 100,587,834 | $ | 983,059,322 | ||||||||||
| Shares issued in reinvestment of distributions | 4,538,511 | 43,788,521 | 9,364,951 | 90,862,421 | ||||||||||||
| Shares redeemed | (71,313,399 | ) | (687,118,051 | ) | (61,650,157 | ) | (594,057,519 | ) | ||||||||
| Net increase (decrease) | 12,854,574 | $ | 123,680,413 | 48,302,628 | $ | 479,864,224 | ||||||||||
148 | Semiannual Report | franklintempleton.com | ||
FRANKLIN INVESTORS SECURITIES TRUST
NOTES TO FINANCIAL STATEMENTS (UNAUDITED)
| Franklin Low Duration Total Return Fundb | Franklin Total Return Fund | |||||||||||||||
| Shares | Amount | Shares | Amount | |||||||||||||
| Class C Shares: | ||||||||||||||||
| Six Months ended April 30, 2020 | ||||||||||||||||
| Shares sold | 4,559,246 | $ | 42,743,586 | 4,192,492 | $ | 40,864,526 | ||||||||||
| Shares issued in reinvestment of distributions | 208,548 | 1,960,984 | 417,103 | 4,056,209 | ||||||||||||
| Shares issued on reorganization (Note 12) | 38,777 | 371,738 | 1,574,396 | 15,495,570 | ||||||||||||
| Shares redeemeda | (4,331,622 | ) | (39,914,164 | ) | (4,801,710 | ) | (46,106,860 | ) | ||||||||
| Net increase (decrease) | 474,949 | $ | 5,162,144 | 1,382,281 | $ | 14,309,445 | ||||||||||
| Year ended October 31, 2019 | ||||||||||||||||
| Shares sold | 5,751,967 | $ | 55,153,027 | 5,400,892 | $ | 52,080,169 | ||||||||||
| Shares issued in reinvestment of distributions | 330,448 | 3,174,573 | 655,873 | 6,311,021 | ||||||||||||
| Shares redeemeda | (5,611,766 | ) | (53,837,871 | ) | (8,294,058 | ) | (79,406,136 | ) | ||||||||
| Net increase (decrease) | 470,649 | $ | 4,489,729 | (2,237,293 | ) | $ | (21,014,946 | ) | ||||||||
| Class R Shares: | ||||||||||||||||
| Six Months ended April 30, 2020 | ||||||||||||||||
| Shares sold | 8,353 | $ | 75,847 | 226,972 | $ | 2,217,597 | ||||||||||
| Shares issued in reinvestment of distributions | 154 | 1,451 | 35,524 | 346,831 | ||||||||||||
| Shares issued on reorganization (Note 12) | 8,625 | 83,118 | — | — | ||||||||||||
| Shares redeemed | — | — | (572,272 | ) | (5,536,553 | ) | ||||||||||
| Net increase (decrease) | 17,132 | $ | 160,416 | (309,776 | ) | $ | (2,972,125 | ) | ||||||||
| Year ended October 31, 2019 | ||||||||||||||||
| Shares sold | 1,897 | $ | 18,305 | 333,857 | $ | 3,227,561 | ||||||||||
| Shares issued in reinvestment of distributions | — | — | 65,347 | 630,599 | ||||||||||||
| Shares redeemed | — | — | (797,352 | ) | (7,669,945 | ) | ||||||||||
| Net increase (decrease) | 1,897 | $ | 18,305 | (398,148 | ) | $ | (3,811,785 | ) | ||||||||
| Class R6 Shares: | ||||||||||||||||
| Six Months ended April 30, 2020 | ||||||||||||||||
| Shares sold | 9,743,886 | $ | 92,421,741 | 8,536,130 | $ | 84,180,224 | ||||||||||
| Shares issued in reinvestment of distributions | 1,661,274 | 15,812,034 | 972,030 | 9,589,704 | ||||||||||||
| Shares issued on reorganization (Note 12) | 41,091,087 | 398,028,665 | 387,849 | 3,874,914 | ||||||||||||
| Shares redeemed | (31,723,134 | ) | (295,829,861 | ) | (7,329,226 | ) | (71,526,493 | ) | ||||||||
| Net increase (decrease) | 20,773,113 | $ | 210,432,579 | 2,566,783 | $ | 26,118,349 | ||||||||||
| Year ended October 31, 2019 | ||||||||||||||||
| Shares sold | 48,117,630 | $ | 466,169,000 | 11,319,959 | $ | 110,557,913 | ||||||||||
| Shares issued in reinvestment of distributions | 3,421,634 | 33,223,142 | 1,474,135 | 14,399,466 | ||||||||||||
| Shares redeemed | (53,573,761 | ) | (519,100,009 | ) | (10,523,386 | ) | (101,993,827 | ) | ||||||||
| Net increase (decrease) | (2,034,497 | ) | $ | (19,707,867 | ) | 2,270,708 | $ | 22,963,552 | ||||||||
franklintempleton.com | Semiannual Report | 149 | ||||
FRANKLIN INVESTORS SECURITIES TRUST
NOTES TO FINANCIAL STATEMENTS (UNAUDITED)
2. Shares of Beneficial Interest (continued)
| Franklin Low Duration Total Return Fundb | Franklin Total Return Fund | |||||||||||||||
| Shares | Amount | Shares | Amount | |||||||||||||
| Advisor Class Shares: | ||||||||||||||||
| Six Months ended April 30, 2020 | ||||||||||||||||
| Shares sold | 7,053,137 | $ | 66,832,002 | 10,488,583 | $ | 103,535,050 | ||||||||||
| Shares issued in reinvestment of distributions | 409,580 | 3,892,637 | 1,696,230 | 16,728,003 | ||||||||||||
| Shares issued on reorganization (Note 12) | 41,394 | 400,965 | 878,914 | 8,772,333 | ||||||||||||
| Shares redeemed | (11,794,074 | ) | (111,014,117 | ) | (25,927,484 | ) | (251,350,801 | ) | ||||||||
| Net increase (decrease) | (4,289,963 | ) | $ | (39,888,513) | (12,863,757 | ) | $ | (122,315,415 | ) | |||||||
| Year ended October 31, 2019 | ||||||||||||||||
| Shares sold | 18,103,769 | $ | 175,348,265 | 45,881,218 | $ | 444,031,555 | ||||||||||
| Shares issued in reinvestment of distributions | 730,667 | 7,086,653 | 2,450,870 | 23,965,092 | ||||||||||||
| Shares redeemed | (14,823,774 | ) | (143,607,446 | ) | (28,072,302 | ) | (271,198,079 | ) | ||||||||
| Net increase (decrease) | 4,010,662 | $ | 38,827,472 | 20,259,786 | $ | 196,798,568 | ||||||||||
aMay include a portion of Class C shares that were automatically converted to Class A.
bFor Class R, for the period October 15, 2019 (effective date) to October 31, 2019.
3. Transactions with Affiliates
Franklin Resources, Inc. is the holding company for various subsidiaries that together are referred to as Franklin Templeton. Certain officers and trustees of the Trust are also officers and/or directors of the following subsidiaries:
| Subsidiary | Affiliation | |
| Franklin Advisers, Inc. (Advisers) | Investment manager | |
| Franklin Templeton Institutional, LLC (FT Institutional) | Investment manager | |
| Franklin Templeton Services, LLC (FT Services) | Administrative manager | |
| Franklin Templeton Distributors, Inc. (Distributors) | Principal underwriter | |
| Franklin Templeton Investor Services, LLC (Investor Services) | Transfer agent | |
a. Management Fees
Franklin Adjustable U.S. Government Securities Fund pays an investment management fee to Advisers based on the average daily net assets of the Fund as follows:
| Annualized Fee Rate | Net Assets | |
| 0.500% | Up to and including $5 billion | |
| 0.440% | Over $5 billion, up to and including $10 billion | |
| 0.410% | Over $10 billion, up to and including $15 billion | |
| 0.380% | In excess of $15 billion | |
150 |
Semiannual Report | franklintempleton.com | ||
FRANKLIN INVESTORS SECURITIES TRUST
NOTES TO FINANCIAL STATEMENTS (UNAUDITED)
Franklin Floating Rate Daily Access Fund pays an investment management fee to Advisers based on the average daily net assets of the Fund as follows:
| Annualized Fee Rate | Net Assets | |
| 0.650% | Up to and including $500 million | |
| 0.550% | Over $500 million, up to and including $1 billion | |
| 0.500% | Over $1 billion, up to and including $1.5 billion | |
| 0.450% | Over $1.5 billion, up to and including $6.5 billion | |
| 0.425% | Over $6.5 billion, up to and including $11.5 billion | |
| 0.400% | Over $11.5 billion, up to and including $16.5 billion | |
| 0.390% | Over $16.5 billion, up to and including $19 billion | |
| 0.380% | Over $19 billion, up to and including $21.5 billion | |
| 0.370% | In excess of $21.5 billion | |
Franklin Low Duration Total Return Fund and Franklin Total Return Fund pay an investment management fee to Advisers based on the average daily net assets of each of the Funds as follows:
| Annualized Fee Rate | Net Assets | |
| 0.625% | Up to and including $500 million | |
| 0.525% | Over $500 million, up to and including $1 billion | |
| 0.480% | Over $1 billion, up to and including $1.5 billion | |
| 0.435% | Over $1.5 billion, up to and including $6.5 billion | |
| 0.415% | Over $6.5 billion, up to and including $11.5 billion | |
| 0.400% | Over $11.5 billion, up to and including $16.5 billion | |
| 0.390% | Over $16.5 billion, up to and including $19 billion | |
| 0.380% | Over $19 billion, up to and including $21.5 billion | |
| 0.370% | In excess of $21.5 billion | |
For the period ended April 30, 2020, each Fund’s annualized gross effective investment management fee rate based on average daily net assets was as follows:
| Franklin Adjustable U.S. Government Securities Fund | Franklin Floating Rate Daily Access Fund | Franklin Low Duration Total Return Fund | Franklin Total Return Fund | |||||||||||
| 0.500% | 0.544% | 0.486% | 0.467% | |||||||||||
Under a subadvisory agreement, FT Institutional, an affiliate of Advisers, provides subadvisory services to Franklin Total Return Fund. The subadvisory fee is paid by Advisers based on the Fund’s average daily net assets, and is not an additional expense of the Fund. Effective October 31, 2019, the subadvisory agreement was terminated for Franklin Total Return Fund.
b. Administrative Fees
Under an agreement with Advisers, FT Services provides administrative services to the Funds. The fee is paid by Advisers based on each of the Funds’ average daily net assets, and is not an additional expense of the Funds.
franklintempleton.com | Semiannual Report | 151 | ||||
FRANKLIN INVESTORS SECURITIES TRUST
NOTES TO FINANCIAL STATEMENTS (UNAUDITED)
3. Transactions with Affiliates (continued)
c. Distribution Fees
The Board has adopted distribution plans for each share class, with the exception of Class R6 and Advisor Class shares, pursuant to Rule 12b-1 under the 1940 Act. Under the Funds’ Class A and A1 reimbursement distribution plans, the Funds reimburse Distributors for costs incurred in connection with the servicing, sale and distribution of each Fund’s shares up to the maximum annual plan rate for each class. Under the Class A and A1 reimbursement distribution plans, costs exceeding the maximum for the current plan year cannot be reimbursed in subsequent periods. In addition, under the Funds’ Class C and R compensation distribution plans, the Funds pay Distributors for costs incurred in connection with the servicing, sale and distribution of each Fund’s shares up to the maximum annual plan rate for each class. The plan year, for purposes of monitoring compliance with the maximum annual plan rates, is February 1 through January 31 for each Fund.
The maximum annual plan rates, based on the average daily net assets, for each class, are as follows:
| Franklin Adjustable U.S. Government Securities Fund | Franklin Floating Rate Daily Access Fund | Franklin Low Duration Total Return Fund | Franklin Total Return Fund | |||||||||||||
Reimbursement Plans: | ||||||||||||||||
Class A | 0.25% | 0.25% | 0.25% | 0.25% | ||||||||||||
Class A1 | 0.10% | —% | —% | —% | ||||||||||||
Compensation Plans: | ||||||||||||||||
Class C | 0.65% | 0.65% | 0.65% | 0.65% | ||||||||||||
Class R | — | — | 0.50% | 0.50% | ||||||||||||
d. Sales Charges/Underwriting Agreements
Front-end sales charges and contingent deferred sales charges (CDSC) do not represent expenses of the Funds. These charges are deducted from the proceeds of sales of fund shares prior to investment or from redemption proceeds prior to remittance, as applicable. Distributors has advised the Funds of the following commission transactions related to the sales and redemptions of the Funds’ shares for the period:
| Franklin Adjustable U.S. Government Securities Fund | Franklin Floating Rate Daily Access Fund | Franklin Low Duration Total Return Fund | Franklin Total Return Fund | |||||||||||||
Sales charges retained net of commissions paid to unaffiliated brokers/dealers | $ | 2,922 | $ | 7,906 | $ | 24,639 | $ | 137,714 | ||||||||
CDSC retained | $ | 23,077 | $ | 27,843 | $ | 99,113 | $ | 18,749 | ||||||||
e. Transfer Agent Fees
Each class of shares pays transfer agent fees to Investor Services for its performance of shareholder servicing obligations. The fees are based on an annualized asset based fee of 0.02% plus a transaction based fee. In addition, each class reimburses Investor Services for out of pocket expenses incurred and, except for Class R6, reimburses shareholder servicing fees paid to third parties. These fees are allocated daily based upon their relative proportion of such classes’ aggregate net assets. Class R6 pays Investor Services transfer agent fees specific to that class.
152 |
Semiannual Report | franklintempleton.com | ||
FRANKLIN INVESTORS SECURITIES TRUST
NOTES TO FINANCIAL STATEMENTS (UNAUDITED)
For the period ended April 30, 2020, the Funds paid transfer agent fees as noted in the Statements of Operations of which the following amounts were retained by Investor Services:
| Franklin Adjustable U.S. Government Securities Fund | Franklin Floating Rate Daily Access Fund | Franklin Low Duration Total Return Fund | Franklin Total Return Fund | |||||||||||||
Transfer agent fees | $242,993 | $493,277 | $602,764 | $1,260,936 | ||||||||||||
f. Investments in Affiliated Management Investment Companies
Certain or all Funds invest in one or more affiliated management investment companies for purposes other than exercising a controlling influence over the management or policies. Management fees paid by the Funds are waived on assets invested in the affiliated management investment companies, as noted in the Statements of Operations, in an amount not to exceed the management and administrative fees paid directly or indirectly by each affiliate. During the period ended April 30, 2020, investments in affiliated management investment companies were as follows:
| Value at Beginning of Period | Purchases | Sales | Realized Gain (Loss) | Net Change in Unrealized Appreciation (Depreciation) | Value at End of Period | Number of Shares Held at End of Period | Investment Income | |||||||||||||||||||||||||
| Franklin Adjustable U.S. Government Securities Fund |
| |||||||||||||||||||||||||||||||
| Non-Controlled Affiliates |
| |||||||||||||||||||||||||||||||
| Dividends | ||||||||||||||||||||||||||||||||
Institutional Fiduciary Trust Money Market Portfolio, 0.01% | $ | 35,052,748 | $ | 24,298,113 | $ | (22,489,386 | ) | $ — | $ | — | $ | 36,861,475 | 36,861,475 | $ | 163,444 | |||||||||||||||||
| Franklin Floating Rate Daily Access Fund |
| |||||||||||||||||||||||||||||||
| Non-Controlled Affiliates |
| |||||||||||||||||||||||||||||||
| Dividends | ||||||||||||||||||||||||||||||||
Franklin Floating Rate Income Fund | $ | 56,546,081 | $ | — | $ | — | $ — | $ | (8,068,244 | ) | $ | 48,477,837 | 6,837,495 | $ | 1,482,499 | |||||||||||||||||
Institutional Fiduciary Trust Money Market Portfolio, 0.01% | 103,958,277 | 203,046,303 | (217,547,354 | ) | — | — | 89,457,226 | 89,457,226 | 388,770 | |||||||||||||||||||||||
Total Affiliated Securities | $ | 160,504,358 | $ | 203,046,303 | $ | (217,547,354 | ) | $ — | $ | (8,068,244 | ) | $ | 137,935,063 | $ | 1,871,269 | |||||||||||||||||
| Franklin Low Duration Total Return Fund |
| |||||||||||||||||||||||||||||||
| Non-Controlled Affiliates |
| |||||||||||||||||||||||||||||||
| Dividends | ||||||||||||||||||||||||||||||||
Franklin Floating Rate Income Fund | $ | 19,759,574 | $ | — | $ | — | $ — | $ | (2,819,383 | ) | $ | 16,940,191 | 2,389,308 | $ | 518,047 | |||||||||||||||||
Institutional Fiduciary Trust Money Market Portfolio, 0.01% | 108,041,040 | 761,249,514 | (816,982,562 | ) | — | — | 52,307,992 | 52,307,992 | 590,552 | |||||||||||||||||||||||
| $ | 127,800,614 | $ | 761,249,514 | $ | (816,982,562 | ) | $ — | $ | (2,819,383 | ) | $ | 69,248,183 | $ | 1,108,599 | ||||||||||||||||||
| | Income from securities loaned | | ||||||||||||||||||||||||||||||
Institutional Fiduciary Trust Money Market Portfolio, 0.01% | $ | — | $ | 51,223,000 | $ | (51,223,000 | ) | $ — | $ | — | $ | — | — | $ | 18,274 | |||||||||||||||||
Total Affiliated Securities | $ | 127,800,614 | $ | 812,472,514 | $ | (868,205,562 | ) | $ — | $ | (2,819,383 | ) | $ | 69,248,183 | $ | 1,126,873 | |||||||||||||||||
franklintempleton.com | Semiannual Report | 153 | ||||
FRANKLIN INVESTORS SECURITIES TRUST
NOTES TO FINANCIAL STATEMENTS (UNAUDITED)
3. Transactions with Affiliates (continued)
f. Investments in Affiliated Management Investment Companies (continued)
| Value at Beginning of Period | Purchases | Sales | Realized Gain (Loss) | Net Change in Unrealized Appreciation (Depreciation) | Value at End of Period | Number of of Period | Investment Income | |||||||||||||||||||||||||
| Franklin Total Return Fund |
| |||||||||||||||||||||||||||||||
| Controlled Affiliates |
| |||||||||||||||||||||||||||||||
| Dividends | ||||||||||||||||||||||||||||||||
Franklin Liberty High Yield Corporate ETF | $ | — | $ | 99,991,725 | $ | — | $ — | $ | (10,146,053 | ) | $ | 89,845,672 | 3,830,000 | $ | 1,725,725 | |||||||||||||||||
Franklin Liberty Investment Grade Corporate ETF | 369,960,975 | 99,558,200 | — | — | (1,609,975 | ) | 467,909,200 | 18,335,000 | 9,677,543 | a | ||||||||||||||||||||||
Franklin Liberty Senior Loan ETF | 22,730,691 | — | — | — | (1,422,670 | ) | 21,308,021 | 914,900 | 412,420 | |||||||||||||||||||||||
Total Controlled Affiliates | $ | 392,691,666 | $ | 199,549,925 | $ | — | $ — | $ | (13,178,698 | ) | $ | 579,062,893 | $ | 11,815,688 | ||||||||||||||||||
| Non-Controlled Affiliates |
| |||||||||||||||||||||||||||||||
Franklin Floating Rate Income Fund | $ | 12,812,795 | $ | — | $ | — | $ — | $ | (1,828,186 | ) | $ | 10,984,609 | 1,549,310 | $ | 335,920 | |||||||||||||||||
Institutional Fiduciary Trust Money Market Portfolio, 0.01% | 373,627,760 | 1,428,409,031 | (1,741,204,505 | ) | — | — | 60,832,286 | 60,832,286 | 635,482 | |||||||||||||||||||||||
Total Non-Controlled Affiliates | $ | 386,440,555 | $ | 1,428,409,031 | $ | (1,741,204,505 | ) | $ — | $ | (1,828,186 | ) | $ | 71,816,895 | $ | 971,402 | |||||||||||||||||
Total Affiliated Securities | $ | 779,132,221 | $ | 1,627,958,956 | $ | (1,741,204,505 | ) | $ — | $ | (15,006,884 | ) | $ | 650,879,788 | $ | 12,787,090 | |||||||||||||||||
aDividend income includes any capital gain distributions received from underlying funds, and are presented in corresponding line item in the Statement of Operations.
g. Waiver and Expense Reimbursements
Advisers and Investor Services have contractually agreed in advance to waive or limit their respective fees and to assume as their own expense certain expenses otherwise payable by Franklin Low Duration Total Return Fund and Franklin Total Return Fund so that the expenses (excluding distribution fees and acquired fund fees and expenses and certain non-routine expenses or costs, including those relating to litigation, indemnification, reorganizations, and liquidations) for Class A, Class C, Class R and Advisor Class of the Funds do not exceed 0.44% and 0.60%, respectively, and for Class R6 do not exceed 0.30% and 0.48%, respectively, based on the average net assets of each class until February 28, 2021. Total expenses waived or paid are not subject to recapture subsequent to the Funds’ fiscal year end.
Prior to March 1, 2020, expenses (excluding certain fees and expenses as previously disclosed) for Franklin Total Return Fund for Class R6 were limited to 0.49% based on the average net assets of the class.
For Franklin Adjustable U.S. Government Fund and Franklin Floating Rate Daily Access Fund, Investor Services has contractually agreed in advance to waive or limit its fees so that the Class R6 transfer agent fees do not exceed 0.03% based on the average net assets of the class until February 28, 2021.
h. Other Affiliated Transactions
At April 30, 2020, one or more of the funds in Franklin Fund Allocator Series owned 15.9% of Franklin Low Duration Total Return Fund outstanding shares.
154 |
Semiannual Report | franklintempleton.com | ||
FRANKLIN INVESTORS SECURITIES TRUST
NOTES TO FINANCIAL STATEMENTS (UNAUDITED)
4. Expense Offset Arrangement
The Funds have entered into an arrangement with their custodian whereby credits realized as a result of uninvested cash balances are used to reduce a portion of the Funds’ custodian expenses. During the period ended April 30, 2020, the custodian fees were reduced as noted in the Statements of Operations.
5. Income Taxes
For tax purposes, capital losses may be carried over to offset future capital gains.
At October 31, 2019, the capital loss carryforwards were as follows:
| Franklin Adjustable U.S. Government Securities Fund | Franklin Floating Rate Daily Access Fund | Franklin Low Duration Total Return Fund | Franklin Total Return Fund | |||||||||||||
Capital loss carryforwards not subject to expiration: | ||||||||||||||||
Short term | $ | 23,092,600 | $ | 20,570,518 | $ | 32,471,167 | $ | 30,224,308 | ||||||||
Long term | 104,891,205 | 239,462,365 | 81,065,745 | 91,879,023 | ||||||||||||
Total capital loss carryforwards | $ | 127,983,805 | $ | 260,032,883 | $ | 113,536,912 | $ | 122,103,331 | ||||||||
At April 30, 2020, the cost of investments and net unrealized appreciation (depreciation) for income tax purposes were as follows:
| Franklin Adjustable U.S. Government Securities Fund | Franklin Floating Rate Daily Access Fund | Franklin Low Duration Total Return Fund | Franklin Total Return Fund | |||||||||||||
Cost of investments | $ | 752,073,836 | $ | 1,820,505,301 | $ | 3,289,137,476 | $ | 5,635,180,850 | ||||||||
Unrealized appreciation | $ | 4,655,471 | $ | 15,250,938 | $ | 63,323,723 | $ | 241,291,137 | ||||||||
Unrealized depreciation | (8,835,198) | (340,585,964) | (265,705,577) | (366,759,934) | ||||||||||||
Net unrealized appreciation (depreciation) | $ | (4,179,727) | $ | (325,335,026) | $ | (202,381,854) | $ | (125,468,797) | ||||||||
Differences between income and/or capital gains as determined on a book basis and a tax basis are primarily due to differing treatments of foreign currency transactions, pass-through entity income, paydown losses, bond discounts and premiums and swaps.
6. Investment Transactions
Purchases and sales of investments (excluding short term securities) for the period ended April 30, 2020, were as follows:
| Franklin Adjustable U.S. Government Securities Fund | Franklin Floating Rate Daily Access Fund | Franklin Low Duration Total Return Fund | Franklin Total Return Fund | |||||||||||||
Purchases | $ | 121,619,268 | $ | 239,945,660 | $ | 1,613,194,036 | $ | 5,720,339,681 | ||||||||
Sales | $ | 84,527,490 | $ | 782,848,402 | $ | 1,688,900,206 | $ | 5,437,778,861 | ||||||||
franklintempleton.com | Semiannual Report | 155 | ||||
FRANKLIN INVESTORS SECURITIES TRUST
NOTES TO FINANCIAL STATEMENTS (UNAUDITED)
7. Credit Risk and Defaulted Securities
At April 30, 2020, Franklin Floating Rate Daily Access Fund, Franklin Low Duration Total Return Fund and Franklin Total Return Fund had 80.9%, 14.0% and 13.1%, respectively, of their portfolio invested in high yield securities, senior secured floating rate loans, or other securities rated below investment grade and unrated securities, if any. These securities may be more sensitive to economic conditions causing greater price volatility and are potentially subject to a greater risk of loss due to default than higher rated securities.
Certain or all Funds held defaulted securities and/or other securities for which the income has been deemed uncollectible. The Funds discontinue accruing income on securities for which income has been deemed uncollectible and provide an estimate for losses on interest receivable. The securities have been identified in the accompanying Statements of Investments. At April 30, 2020, the aggregate value of these securities was as follows:
| Value | Percentage of Net Assets | |||||||
Franklin Floating Rate Daily Access Fund | $19,156,231 | 1.3% | ||||||
Franklin Low Duration Total Return Fund | 1,097,192 | 0.0%† | ||||||
Franklin Total Return Fund | 1,521,346 | 0.0%† | ||||||
†Rounds to less than 0.1% of net assets. | ||||||||
8. Novel Coronavirus Pandemic
The global outbreak of the novel coronavirus disease, known as COVID-19, has caused adverse effects on many companies, sectors, nations, regions and the markets in general, and may continue for an unpredictable duration. The effects of this pandemic may materially impact the value and performance of the Funds, their ability to buy and sell fund investments at appropriate valuations and their ability to achieve their investment objectives.
9. Restricted Securities
Certain or all Funds invest in securities that are restricted under the Securities Act of 1933 (1933 Act). Restricted securities are often purchased in private placement transactions, and cannot be sold without prior registration unless the sale is pursuant to an exemption under the 1933 Act. Disposal of these securities may require greater effort and expense, and prompt sale at an acceptable price may be difficult. The Funds may have registration rights for restricted securities. The issuer generally incurs all registration costs.
At April 30, 2020, investments in restricted securities, excluding securities exempt from registration under the 1933 Act, were as follows:
| Principal Amount/ Shares/ Units | Issuer | Acquisition Date | Cost | Value | ||||||||||||
| Franklin Floating Rate Daily Access Fund | ||||||||||||||||
| 1,219,956 | a Appvion Operations Inc. | 6/14/18 - 4/12/19 | $ | 12,791,766 | $ | 22,625,485 | ||||||||||
| 170,300 | b Remington Outdoor Co. Inc., Litigation Units | 5/16/18 - 4/12/19 | — | — | ||||||||||||
Total Restricted Securities (Value is 1.5% of Net Assets) | $ | 12,791,766 | $ | 22,625,485 | ||||||||||||
| Franklin Low Duration Total Return Fund | ||||||||||||||||
| 24,740 | c Appvion Operations Inc. | 4/12/19 | $ | 334,607 | $ | 458,820 | ||||||||||
156 |
Semiannual Report | franklintempleton.com | ||
FRANKLIN INVESTORS SECURITIES TRUST
NOTES TO FINANCIAL STATEMENTS (UNAUDITED)
Principal Amount/ Shares/ Units | Issuer | Acquisition Date | Cost | Value | ||||||||||
| Franklin Low Duration Total Return Fund | ||||||||||||||
| 12,326,925 | d K2016470219 South Africa Ltd., A | 4/15/13 - 2/01/17 | $ | 92,077 | $ | — | ||||||||
| 1,226,701 | d K2016470219 South Africa Ltd., B | 2/01/17 | 911 | — | ||||||||||
| 16,078 | e Remington Outdoor Co. Inc., Litigation Units | 5/16/18 - 4/12/19 | — | — | ||||||||||
|
| |||||||||||||
Total Restricted Securities (Value is 0.0%† of Net Assets) | $ | 427,595 | $ | 458,820 | ||||||||||
|
| |||||||||||||
| Franklin Total Return Fund | ||||||||||||||
| 13,033 | f Appvion Operations Inc. | 4/12/19 | $ | 176,272 | $ | 241,708 | ||||||||
| 28,762,824 | g K2016470219 South Africa Ltd., A | 4/15/13 - 2/01/17 | 221,469 | — | ||||||||||
| 2,862,311 | g K2016470219 South Africa Ltd., B | 2/01/17 | 2,125 | — | ||||||||||
| 4,897 | h Remington Outdoor Co. Inc., Litigation Units | 4/12/19 | — | — | ||||||||||
|
| |||||||||||||
Total Restricted Securities (Value is 0.0%† of Net Assets) | $ | 399,866 | $ | 241,708 | ||||||||||
|
| |||||||||||||
†Rounds to less than 0.1% of net assets.
aThe Fund also invests in unrestricted securities of the issuer, valued at $28,526,766 as of April 30, 2020.
bThe Fund also invests in unrestricted securities of the issuer, valued at $904,466 as of April 30, 2020.
cThe Fund also invests in unrestricted securities of the issuer, valued at $352,943 as of April 30, 2020
dThe Fund also invests in unrestricted securities of the issuer, valued at $1,227 as of April 30, 2020.
eThe Fund also invests in unrestricted securities of the issuer, valued at $85,393 as of April 30, 2020.
fThe Fund also invests in unrestricted securities of the issuer, valued at $185,931 as of April 30, 2020.
gThe Fund also invests in unrestricted securities of the issuer, valued at $2,864 as of April 30, 2020.
hThe Fund also invests in unrestricted securities of the issuer, valued at $26,010 as of April 30, 2020.
10. Other Derivative Information
At April 30, 2020, investments in derivative contracts are reflected in the Statements of Assets and Liabilities as follows:
| Asset Derivatives | Liability Derivatives | |||||||||||||||
Derivative Contracts Not Accounted for as Hedging Instruments | Statements of Assets and Liabilities Location | Fair Value | Statements of Assets and Liabilities Location | Fair Value | ||||||||||||
| Franklin Low Duration Total Return Fund | ||||||||||||||||
Interest rate contracts | Variation margin on futures contracts | | $10,345,068 | a | Variation margin on futures contracts | $ | 6,666,540 | a | ||||||||
Variation margin on centrally cleared swap contracts | — | Variation margin on centrally cleared swap contracts | 1,881,830 | a | ||||||||||||
Unrealized appreciation on OTC swap contracts | 3,715,067 | Unrealized depreciation on OTC swap contracts | — | |||||||||||||
Foreign exchange contracts | Unrealized appreciation on OTC forward exchange contracts | 8,425,391 | Unrealized depreciation on OTC forward exchange contracts | 5,163,465 | ||||||||||||
franklintempleton.com | Semiannual Report | 157 | ||||
FRANKLIN INVESTORS SECURITIES TRUST
NOTES TO FINANCIAL STATEMENTS (UNAUDITED)
10. Other Derivative Information (continued)
| Asset Derivatives | Liability Derivatives | |||||||||||||||
Derivative Contracts Not Accounted for as Hedging Instruments | Statements of Assets and Liabilities Location | Fair Value | Statements of Assets and Liabilities Location | Fair Value | ||||||||||||
| Franklin Low Duration Total Return Fund (continued) | ||||||||||||||||
| Credit contracts | Investments in securities, at value | $ — | Options written, at value | $2,553,694 | ||||||||||||
Variation margin on centrally cleared swap contracts | — | Variation margin on centrally cleared swap contracts | 5,374,492 | a | ||||||||||||
OTC swap contracts (upfront payments) | 1,066,470 | OTC swap contracts (upfront receipts) | 7,689,231 | |||||||||||||
Unrealized appreciation on OTC swap contracts | 6,102,788 | Unrealized depreciation on OTC swap contracts | 19,697,196 | |||||||||||||
Inflation contracts | Variation margin on centrally cleared swap contracts | — | Variation margin on centrally cleared swap contracts | 10,372,276 | a | |||||||||||
|
|
|
| |||||||||||||
Totals | $29,654,784 | $59,398,724 | ||||||||||||||
|
|
|
| |||||||||||||
| Franklin Total Return Fund | ||||||||||||||||
| Interest rate contracts | Variation margin on futures contracts | $41,114,549 | a | Variation margin on futures contracts | $5,313,768 | a | ||||||||||
Unrealized appreciation on OTC swap contracts | 3,678,868 | Unrealized depreciation on OTC swap contracts | — | |||||||||||||
Foreign exchange contracts | Unrealized appreciation on OTC forward exchange contracts | 6,950,826 | Unrealized depreciation on OTC forward exchange contracts | 14,690,094 | ||||||||||||
Credit contracts | Variation margin on centrally cleared swap contracts | — | Variation margin on centrally cleared swap contracts | 13,383,416 | a | |||||||||||
OTC swap contracts (upfront payments) | 1,786,417 | OTC swap contracts (upfront receipts) | 13,027,843 | |||||||||||||
Unrealized appreciation on OTC swap contracts | 10,925,638 | Unrealized depreciation on OTC swap contracts | 34,631,082 | |||||||||||||
Inflation contracts | Variation margin on centrally cleared swap contracts | — | Variation margin on centrally cleared swap contracts | 14,091,876 | a | |||||||||||
Unrealized appreciation on OTC swap contracts | — | Unrealized depreciation on OTC swap contracts | 1,188,885 | |||||||||||||
Value recovery instruments | Investments in securities, at value | 352,664 | b | |||||||||||||
|
|
|
| |||||||||||||
Totals | $64,808,962 | $96,326,964 | ||||||||||||||
|
|
|
| |||||||||||||
aThis amount reflects the cumulative appreciation (depreciation) of futures contracts and centrally cleared swap contracts as reported in the Statement of Investments. Only the variation margin receivable/payable at period end is separately reported within the Statements of Assets and Liabilities. Prior variation margin movements were recorded to cash upon receipt or payment.
bVRI are included in investments in securities, at value in the Statements of Assets and Liabilities.
158 | Semiannual Report | franklintempleton.com | ||
FRANKLIN INVESTORS SECURITIES TRUST
NOTES TO FINANCIAL STATEMENTS (UNAUDITED)
For the period ended April 30, 2020, the effect of derivative contracts in the Statements of Operations was as follows:
Derivative Contracts Not Accounted for as Hedging Instruments | Statements of Operations Location | Net Realized Gain (Loss) for the Period | Statements of Operations Location | Net Change in Unrealized Appreciation (Depreciation) for the Period | ||||||||
Net realized gain (loss) from: |
| Net change in unrealized appreciation (depreciation) on: | ||||||||||
| Franklin Floating Rate Daily Access Fund |
| |||||||||||
| Credit contracts | Swap contracts | $ (382,887) | Swap contracts | $ 369,172 | ||||||||
| Franklin Low Duration Total Return Fund |
| |||||||||||
| Interest rate contracts | Written options | $ (5,410,636) | Written options | $ — | ||||||||
Futures contracts | (9,003,210) | Futures contracts | 4,910,074 | |||||||||
Swap contracts | 1,555,911 | Swap contracts | 2,590,988 | |||||||||
| Foreign exchange contracts | Investments | 673,309 | a | Investments | — | |||||||
Forward exchange contracts | (1,394,022) | Forward exchange contracts | 3,622,228 | |||||||||
| Credit contracts | Investments | (37,868) | a | Investments | — | |||||||
Written options | 138,658 | Written options | �� | (2,470,185 | ) | |||||||
Swap contracts | (4,164,336) | Swap contracts | (18,842,266 | ) | ||||||||
| Inflation contracts | Swap contracts | (23) | Swap contracts | (9,981,899 | ) | |||||||
|
|
|
| |||||||||
Totals | $(17,642,217) | $(20,171,060 | ) | |||||||||
|
|
|
| |||||||||
| Franklin Total Return Fund | ||||||||||||
| Interest rate contracts | Investments | $ (5,933,615) | a | Investments | $ — | |||||||
Written options | 2,382,098 | Written options | — | |||||||||
Futures contracts | 12,072,454 | Futures contracts | 49,455,808 | |||||||||
Swap contracts | 2,279,651 | Swap contracts | 5,006,653 | |||||||||
| Foreign exchange contracts | Investments | 1,011,927 | a | Investments | — | |||||||
Forward exchange contracts | (203,449) | Forward exchange contracts | (5,730,732 | ) | ||||||||
| Credit contracts | Written options | (8,630,580) | Written options | — | ||||||||
Swap contracts | (13,160,652) | Swap contracts | (36,235,875 | ) | ||||||||
| Inflation contracts | Swap contracts | (27) | Swap contracts | (15,046,090 | ) | |||||||
| Value recovery instruments | Investments | — | Investments | (93,868 | )a | |||||||
|
|
|
| |||||||||
Totals | $(10,182,193) | $ (2,644,104 | ) | |||||||||
|
|
|
| |||||||||
aPurchased option contracts and VRI are included in net realized gain (loss) from investments and net change in unrealized appreciation (depreciation) on investments in the Statements of Operations.
For the period ended April 30, 2020, the average month end notional amount of futures contracts, swap contracts and options and the average month end contract value for forward exchange contracts, and average month end fair value of VRI, were as follows:
| Franklin Floating Rate Daily Access Fund | Franklin Fund | Franklin Total Return Fund | ||||||||||||||||
Futures Contracts | $ | — | $1,177,532,066 | $1,893,156,377 | ||||||||||||||
Swap contracts | 9,077,714 | 718,393,120 | 880,455,124 | |||||||||||||||
franklintempleton.com | Semiannual Report | 159 | ||||
FRANKLIN INVESTORS SECURITIES TRUST
NOTES TO FINANCIAL STATEMENTS (UNAUDITED)
10. Other Derivative Information (continued)
| Franklin Floating Rate Daily Access Fund | Franklin Low Duration Total Retur Fund | Franklin Total Return Fund | ||||||||||||||
Forward exchange contracts | — | 421,060,490 | 684,210,274 | |||||||||||||
VRI | — | — | 425,915 | |||||||||||||
Options | — | 145,054,143 | 103,485,714 | |||||||||||||
At April 30, 2020, the Funds’ OTC derivative assets and liabilities are as follows: |
| |||||||||||||||
Gross Amounts of Assets and Liabilities Presented in the Statements of Assets and Liabilities | ||||||||||||||||||||
| Assetsa | Liabilitiesa | |||||||||||||||||||
| Derivatives | ||||||||||||||||||||
| Franklin Low Duration | ||||||||||||||||||||
| Total Return Fund | ||||||||||||||||||||
Forward exchange contracts | $ | 8,425,391 | $ | 5,163,465 | ||||||||||||||||
Options written | — | 2,553,694 | ||||||||||||||||||
Swap contracts | 10,884,325 | 27,386,427 | ||||||||||||||||||
Total | $ | 19,309,716 | $ | 35,103,586 | ||||||||||||||||
Franklin Total | ||||||||||||||||||||
Return Fund | ||||||||||||||||||||
Forward exchange contracts | 6,950,826 | 14,690,094 | ||||||||||||||||||
Swap contracts | 16,390,923 | 48,847,810 | ||||||||||||||||||
Total | $ | 23,341,749 | $ | 63,537,904 | ||||||||||||||||
aAbsent an event of default or early termination, OTC derivative assets and liabilities are presented gross and not offset in the Statements of Assets and Liabilities.
160 | Semiannual Report | franklintempleton.com | ||
FRANKLIN INVESTORS SECURITIES TRUST
NOTES TO FINANCIAL STATEMENTS (UNAUDITED)
At April 30, 2020, OTC derivative assets, which may be offset against OTC derivative liabilities and collateral received from the counterparty, are as follows:
Amounts Not Offset in the Statement of Assets and Liabilities | ||||||||||||||||||||
| | Gross Amounts of | | | Financial Instruments Available for Offset | | | Financial Instruments Collateral Receiveda,b | | | Cash Collateral Received | | | Net Amount (Not less than zero) | | ||||||
Franklin Low Duration Total Return Fund | ||||||||||||||||||||
Counterparty | ||||||||||||||||||||
BNDP | $ — | $ — | $ — | $ — | $ — | |||||||||||||||
BZWS | 148,979 | (148,979 | ) | — | — | — | ||||||||||||||
CITI | 8,050,358 | (8,050,358 | ) | — | — | — | ||||||||||||||
DBAB | 467,614 | — | (467,614 | ) | — | — | ||||||||||||||
FBCO | — | — | — | — | — | |||||||||||||||
GSCO | 10,765 | — | — | — | 10,765 | |||||||||||||||
JPHQ | 10,632,000 | (7,585,935 | ) | (3,046,065 | ) | — | — | |||||||||||||
MSCO | — | — | — | — | — | |||||||||||||||
Total | $19,309,716 | $(15,785,272 | ) | $(3,513,679 | ) | $ — | $10,765 | |||||||||||||
Amounts Not Offset in the Statement of Assets and Liabilities | ||||||||||||||||||||
| | Gross Amounts of Assets Presented in |
| | Financial Instruments Available for Offset | | | Financial Instruments Collateral Received | | | Cash Collateral Received | | | Net Amount (Not less than zero) | | ||||||
Franklin Total Return Fund | ||||||||||||||||||||
Counterparty | ||||||||||||||||||||
BNDP | $ — | $ — | $ — | $ — | $ — | |||||||||||||||
BZWS | 317,785 | (317,785 | ) | — | — | — | ||||||||||||||
CITI | 11,441,502 | (11,441,502 | ) | — | — | — | ||||||||||||||
DBAB | 56,900 | (56,900 | ) | — | — | — | ||||||||||||||
JPHQ | 11,525,562 | (11,525,562 | ) | — | — | — | ||||||||||||||
MSCO | — | — | — | — | — | |||||||||||||||
Total | $23,341,749 | $(23,341,749 | ) | $ — | $ — | $ — | ||||||||||||||
franklintempleton.com | Semiannual Report | 161 | ||||
FRANKLIN INVESTORS SECURITIES TRUST
NOTES TO FINANCIAL STATEMENTS (UNAUDITED)
10. Other Derivative Information (continued)
At April 30, 2020, OTC derivative liabilities, which may be offset against OTC derivative assets and collateral pledged to the counterparty, are as follows:
| Amounts Not Offset in the Statement of Assets and Liabilities | ||||||||||||||||||||
Gross Assets and Liabilities | Financial Instruments Available for Offset | Financial Instruments Collateral Pledged | Cash Collateral Pledgeda | Net Amount (Not less than zero) | ||||||||||||||||
| Franklin Low Duration Total Return Fund | ||||||||||||||||||||
| Counterparty | ||||||||||||||||||||
BNDP | $ 1,417,443 | $ — | $ — | $ (1,350,000 | ) | $ 67,443 | ||||||||||||||
BZWS | 3,397,609 | (148,979 | ) | — | (3,160,000 | ) | 88,630 | |||||||||||||
CITI | 18,860,504 | (8,050,358 | ) | — | (9,320,000 | ) | 1,490,146 | |||||||||||||
DBAB | — | — | — | — | — | |||||||||||||||
FBCO | 178,602 | — | — | (130,000 | ) | 48,602 | ||||||||||||||
GSCO | — | — | — | — | — | |||||||||||||||
JPHQ | 7,585,935 | (7,585,935 | ) | — | — | — | ||||||||||||||
MSCO | 3,663,493 | — | — | (3,663,493 | ) | — | ||||||||||||||
|
| |||||||||||||||||||
Total | $35,103,586 | $(15,785,272 | ) | $ — | $(17,623,493 | ) | $1,694,821 | |||||||||||||
|
| |||||||||||||||||||
| Amounts Not Offset in the Statement of Assets and Liabilities | ||||||||||||||||||||
Gross Amounts of Liabilities Presented in | Financial Instruments Available for Offset | Financial Instruments Collateral Pledged | Cash Collateral Pledgeda | Net Amount (Not less than zero) | ||||||||||||||||
| Franklin Total Return Fund | ||||||||||||||||||||
| Counterparty | ||||||||||||||||||||
BNDP | $ 1,883,329 | $ — | $ — | $ (1,883,329 | ) | $ — | ||||||||||||||
BZWS | 3,533,580 | (317,785 | ) | — | (3,215,795 | ) | — | |||||||||||||
CITI | 30,384,050 | (11,441,502 | ) | — | (16,580,000 | ) | 2,362,548 | |||||||||||||
DBAB | 623,888 | (56,900 | ) | — | (566,988 | ) | — | |||||||||||||
JPHQ | 18,953,550 | (11,525,562 | ) | — | (5,380,000 | ) | 2,047,988 | |||||||||||||
MSCO | 8,159,507 | — | — | (8,159,507 | ) | — | ||||||||||||||
|
| |||||||||||||||||||
Total | $63,537,904 | $(23,341,749 | ) | $ — | $(35,785,619 | ) | $4,410,536 | |||||||||||||
|
| |||||||||||||||||||
aIn some instances, the collateral amounts disclosed in the table above were adjusted due to the requirement to limit the collateral amounts to avoid the effect of overcollateralization. Actual collateral received and/or pledged may be more than the amounts disclosed herein.
bAt April 30, 2020, the Fund received U.S. Treasury Bonds and Notes as collateral for derivatives.
See Note 1(e) regarding derivative financial instruments.
See Abbreviations on page 171.
162 �� | Semiannual Report | franklintempleton.com | ||
FRANKLIN INVESTORS SECURITIES TRUST
NOTES TO FINANCIAL STATEMENTS (UNAUDITED)
11. Holdings of 5% Voting Securities of Portfolio Companies
The 1940 Act defines "affiliated companies" to include investments in portfolio companies in which a fund owns 5% or more of the outstanding voting securities. During the period ended April 30, 2020, investments in “affiliated companies” were as follows:
| Name of Issuer | Value at Beginning of Period | Purchases | Sales | Realized Gain (Loss) | Net Change in Unrealized Appreciation (Depreciation) | Value at End of Period | Number of Units/ | Investment Income | ||||||||||||||||||||||||
Franklin Floating Rate Daily Access Fund | ||||||||||||||||||||||||||||||||
Non-Controlled Affiliates | ||||||||||||||||||||||||||||||||
| Dividends | ||||||||||||||||||||||||||||||||
|
| |||||||||||||||||||||||||||||||
Appvion Operations Inc. | $16,265,063 | $ — | $ — | $ — | $ 6,360,422 | $22,625,485 | 1,219,956 | $ — | ||||||||||||||||||||||||
Remington Outdoor Co. Inc. | 1,808,932 | — | — | — | (904,466 | ) | 904,466 | 1,808,932 | — | |||||||||||||||||||||||
Remington Outdoor Co. Inc., Litigation Units | — | — | — | — | — | — | 170,300 | — | ||||||||||||||||||||||||
|
|
|
| |||||||||||||||||||||||||||||
| $18,073,995 | $ — | $ — | $ — | $ 5,455,956 | $23,529,951 | $ — | ||||||||||||||||||||||||||
|
|
|
| |||||||||||||||||||||||||||||
| Interest | ||||||||||||||||||||||||||||||||
|
| |||||||||||||||||||||||||||||||
Appvion Operations Inc., Term Loan, 6/15/26 | 45,636,106 | $6,613a | $(16,075,317 | )a | $20,257 | $(1,060,893 | ) | $28,526,766 | 29,108,945 | $1,724,681 | ||||||||||||||||||||||
|
|
|
| |||||||||||||||||||||||||||||
Total Affiliated Securities (Value is 3.5% of Net Assets) | $63,710,101 | $ 6,613 | $(16,075,317 | ) | $20,257 | $ 4,395,063 | $52,056,717 | $1,724,681 | ||||||||||||||||||||||||
|
|
|
| |||||||||||||||||||||||||||||
aMay include accretion, amortization, partnership adjustments, and/or other corporate actions.
12. Reorganization
On December 6, 2019, Franklin Low Duration Total Return Fund (Surviving Fund), pursuant to a plan of reorganization approved on October 18, 2019, by shareholders of Franklin Flexible Alpha Bond Fund (Acquired Fund), a series of Franklin Strategic Series, acquired 100% of the Acquired Fund’s net assets, primarily made up of investment securities, which included $145,479 of unrealized appreciation, through a tax-free exchange of 41,366,326 shares of the Surviving Fund (valued at $400,679,276). Immediately after the completion of the reorganization, the combined net assets of the Surviving Fund were $3,385,783,187.
The primary purpose for the reorganization was to combine the Acquired Fund with a larger fund that had lower annual fund operating expense ratios, better overall historical performance, similar investment goals and similar principal investment strategies/risks. The estimated cost of the reorganization was $103,000 of which the Surviving Fund and the Acquired Fund each paid 25% and Advisers paid 50%. The allocated portion of the Surviving Fund’s reorganization expenses are included with other expenses in the Statement of Operations.
franklintempleton.com | Semiannual Report | 163 | ||||
FRANKLIN INVESTORS SECURITIES TRUST
NOTES TO FINANCIAL STATEMENTS (UNAUDITED)
12. Reorganization (continued)
Assuming the reorganization had been completed on November 1, 2019, the Fund’s pro forma results of operations, would have been as follows:
| Period | Net Investment Income | Net Realized and Unrealized Gain (Loss) | Net Increase (Decrease) in Net Assets from Operations | |||||||||
For the period November 1, 2019 through April 30, 2020 | $46,657,729 | $(197,447,215) | (150,789,486) | |||||||||
Subsequent to the reorganization, the Surviving Fund has been managed as a single entity. Accordingly, it is impracticable to identify the amounts of investment income and net investment income attributable to the Acquired Fund’s assets after the completion of the reorganization.
On January 31, 2020, Franklin Total Return Fund (Surviving Fund), pursuant to a plan of reorganization approved on December 6, 2019, by shareholders of Franklin Real Return Fund (Acquired Fund), a series of Franklin Investors Securities Trust, acquired 100% of the Acquired Fund’s net assets, primarily made up of investment securities, which included $1,332,218 of unrealized appreciation, through a tax-free exchange of 13,515,713 shares of the Surviving Fund (valued at $134,050,240). Immediately after the completion of the reorganization, the combined net assets of the Surviving Fund were $5,241,870,095.
The primary purpose for the reorganization was to combine the Acquired Fund with a larger fund that had lower annual fund operating expense ratios, better overall historical performance and similar principal investment strategies/risks. The estimated cost of the reorganization was $200,000 of which the Surviving Fund and the Acquired Fund each paid 25% and Advisers paid 50%. The allocated portion of the Surviving Fund’s reorganization expenses are included with other expenses in the Statement of Operations.
Assuming the reorganization had been completed on November 1, 2019, the Fund’s pro forma results of operations, would have been as follows:
| Period | Net Investment Income | Net Realized and Unrealized Gain (Loss) | Net Increase (Decrease) in Net Assets from Operations | |||||||||
For the period November 1, 2019 through April 30, 2020 | $71,539,124 | $(149,096,901 | ) | $(77,557,777 | ) | |||||||
Subsequent to the reorganization, the Surviving Fund has been managed as a single entity. Accordingly, it is impracticable to identify the amounts of investment income and net investment income attributable to the Acquired Fund’s assets after the completion of the reorganization.
13. Credit Facility
The Funds, together with other U.S. registered and foreign investment funds (collectively, Borrowers), managed by Franklin Templeton, are borrowers in a joint syndicated senior unsecured credit facility totaling $2 billion (Global Credit Facility) which matures on February 5, 2021. This Global Credit Facility provides a source of funds to the Borrowers for temporary and emergency purposes, including the ability to meet future unanticipated or unusually large redemption requests.
Under the terms of the Global Credit Facility, the Funds shall, in addition to interest charged on any borrowings made by the Funds and other costs incurred by the Funds, pay their share of fees and expenses incurred in connection with the implementation and maintenance of the Global Credit Facility, based upon their relative share of the aggregate net assets of
164 | Semiannual Report | franklintempleton.com | ||
FRANKLIN INVESTORS SECURITIES TRUST
NOTES TO FINANCIAL STATEMENTS (UNAUDITED)
all of the Borrowers, including an annual commitment fee of 0.15% based upon the unused portion of the Global Credit Facility. These fees are reflected in other expenses in the Statements of Operations. During the period ended April 30, 2020, the Funds did not use the Global Credit Facility.
14. Fair Value Measurements
The Funds follow a fair value hierarchy that distinguishes between market data obtained from independent sources (observable inputs) and the Funds’ own market assumptions (unobservable inputs). These inputs are used in determining the value of the Funds’ financial instruments and are summarized in the following fair value hierarchy:
| • | Level 1 – quoted prices in active markets for identical financial instruments |
| • | Level 2 – other significant observable inputs (including quoted prices for similar financial instruments, interest rates, prepayment speed, credit risk, etc.) |
| • | Level 3 – significant unobservable inputs (including the Funds’ own assumptions in determining the fair value of financial instruments) |
The input levels are not necessarily an indication of the risk or liquidity associated with financial instruments at that level.
A summary of inputs used as of April 30, 2020, in valuing the Funds’ assets and liabilities carried at fair value, is as follows:
| Level 1 | Level 2 | Level 3 | Total | |||||||||||||
| Franklin Adjustable U.S. Government Securities Fund | ||||||||||||||||
Assets: | ||||||||||||||||
Investments in Securities:a | ||||||||||||||||
Commercial Mortgage-Backed Securities | $ | — | $ | 11,401,579 | $ | — | $ | 11,401,579 | ||||||||
Mortgage-Backed Securities | — | 669,929,490 | — | 669,929,490 | ||||||||||||
Short Term Investments | 36,861,475 | 29,701,565 | — | 66,563,040 | ||||||||||||
|
| |||||||||||||||
Total Investments in Securities | $ | 36,861,475 | $ | 711,032,634 | $ | — | $ | 747,894,109 | ||||||||
|
| |||||||||||||||
| Franklin Floating Rate Daily Access Fund | ||||||||||||||||
Assets: | ||||||||||||||||
Investments in Securities:a | ||||||||||||||||
Equity Investments:b | ||||||||||||||||
Diversified Support Services | $ | — | $ | 904,466 | $ | — | $ | 904,466 | ||||||||
Forest Products | — | — | 22,625,485 | 22,625,485 | ||||||||||||
Oil & Gas Exploration & Production | — | 7,140,837 | — | 7,140,837 | ||||||||||||
All Other Equity Investments | 48,477,837 | — | — | 48,477,837 | ||||||||||||
Corporate Bonds | — | — | 15,426,642 | 15,426,642 | ||||||||||||
Senior Floating Rate Interests: | ||||||||||||||||
Personal Products | — | 9,901,673 | 56,454,915 | 66,356,588 | ||||||||||||
All Other Senior Floating Rate Interests | — | 1,146,479,465 | — | 1,146,479,465 | ||||||||||||
Asset-Backed Securities | — | 80,014,941 | — | 80,014,941 | ||||||||||||
Escrows and Litigation Trusts | — | — | — | c | — | |||||||||||
Short Term Investments | 89,457,226 | 18,286,788 | — | 107,744,014 | ||||||||||||
|
| |||||||||||||||
Total Investments in Securities | $ | 137,935,063 | $ | 1,262,728,170 | $ | 94,507,042 | $ | 1,495,170,275 | ||||||||
|
| |||||||||||||||
franklintempleton.com | Semiannual Report | 165 | ||||
FRANKLIN INVESTORS SECURITIES TRUST
NOTES TO FINANCIAL STATEMENTS (UNAUDITED)
14. Fair Value Measurements (continued)
| Level 1 | Level 2 | Level 3 | Total | |||||||||||||
| Franklin Low Duration Total Return Fund | ||||||||||||||||
Assets: | ||||||||||||||||
Investments in Securities:a | ||||||||||||||||
Equity Investments:b | ||||||||||||||||
Commercial & Professional Services | $ | — | $ | 85,393 | $ | — | $ | 85,393 | ||||||||
Energy | 8,937 | — | 12,308 | 21,245 | ||||||||||||
Materials | 19,485 | — | 458,820 | 478,305 | ||||||||||||
All Other Equity Investments | 51,116,611 | — | — | c | 51,116,611 | |||||||||||
Corporate Bonds: | ||||||||||||||||
Capital Goods | — | 30,472,997 | 254,177 | 30,727,174 | ||||||||||||
Retailing | — | 14,970,475 | 2,432 | 14,972,907 | ||||||||||||
All Other Corporate Bonds | — | 877,225,160 | — | 877,225,160 | ||||||||||||
Senior Floating Rate Interests: | ||||||||||||||||
Household & Personal Products | — | 2,082,686 | 3,115,797 | 5,198,483 | ||||||||||||
All Other Senior Floating Rate Interests | — | 98,510,901 | — | 98,510,901 | ||||||||||||
Marketplace Loans | — | — | 28,410,673 | 28,410,673 | ||||||||||||
Foreign Government and Agency Securities | — | 151,615,062 | — | 151,615,062 | ||||||||||||
U.S. Government and Agency Securities | — | 212,121,811 | — | 212,121,811 | ||||||||||||
Asset-Backed Securities and Commercial | ||||||||||||||||
Mortgage-Backed Securities: | ||||||||||||||||
Diversified Financials | — | 1,382,927,930 | 10,536,605 | 1,393,464,535 | ||||||||||||
All Other Asset-Backed Securities and | — | 22,919,967 | — | 22,919,967 | ||||||||||||
Mortgage-Backed Securities | — | 89,256,750 | — | 89,256,750 | ||||||||||||
Municipal Bonds | — | 82,892,614 | — | 82,892,614 | ||||||||||||
Escrows and Litigation Trusts | — | — | — | c | — | |||||||||||
Short Term Investments | 59,006,725 | — | — | 59,006,725 | ||||||||||||
|
| |||||||||||||||
Total Investments in Securities | $ | 110,151,758 | $ | 2,965,081,746 | $ | 42,790,812 | $ | 3,118,024,316 | ||||||||
|
| |||||||||||||||
Other Financial Instruments: | ||||||||||||||||
Futures Contracts | $ | 10,345,068 | $ | — | $ | — | $ | 10,345,068 | ||||||||
Forward Exchange Contracts | — | 8,425,391 | — | 8,425,391 | ||||||||||||
Swap Contracts | — | 9,817,855 | — | 9,817,855 | ||||||||||||
|
| |||||||||||||||
Total Other Financial Instruments | $ | 10,345,068 | $ | 18,243,246 | $ | — | $ | 28,588,314 | ||||||||
|
| |||||||||||||||
Liabilities: | ||||||||||||||||
Other Financial Instruments: | ||||||||||||||||
Options Written | $ | — | $ | 2,553,694 | $ | — | $ | 2,553,694 | ||||||||
Futures Contracts | 6,666,540 | — | — | 6,666,540 | ||||||||||||
Forward Exchange Contracts | — | 5,163,465 | — | 5,163,465 | ||||||||||||
Swap Contracts | — | 36,989,218 | 336,576 | 37,325,794 | ||||||||||||
|
| |||||||||||||||
Total Other Financial Instruments | $ | 6,666,540 | $ | 44,706,377 | $ | 336,576 | $ | 51,709,493 | ||||||||
|
| |||||||||||||||
| 166 |
Semiannual Report | franklintempleton.com | ||
FRANKLIN INVESTORS SECURITIES TRUST
NOTES TO FINANCIAL STATEMENTS (UNAUDITED)
| Level 1 | Level 2 | Level 3 | Total | |||||||||||||
| Franklin Total Return Fund | ||||||||||||||||
Assets: | ||||||||||||||||
Investments in Securities:a | ||||||||||||||||
Equity Investments:b | ||||||||||||||||
Commercial & Professional Services | $ | — | $ | 26,010 | $ | — | $ | 26,010 | ||||||||
Consumer Services | — | — | 34,112 | 34,112 | ||||||||||||
Energy | 190,879 | — | 28,726 | 219,605 | ||||||||||||
Materials | 97,689 | — | 241,708 | 339,397 | ||||||||||||
All Other Equity Investments | 592,537,112 | — | — | c | 592,537,112 | |||||||||||
Corporate Bonds: | ||||||||||||||||
Capital Goods | — | 57,516,912 | 133,901 | 57,650,813 | ||||||||||||
Retailing | — | 529,125 | 5,676 | 534,801 | ||||||||||||
All Other Corporate Bonds | — | 1,010,399,380 | — | 1,010,399,380 | ||||||||||||
Senior Floating Rate Interests: | ||||||||||||||||
Household & Personal Products | — | 205,378 | 1,641,414 | 1,846,792 | ||||||||||||
All Other Senior Floating Rate Interests | — | 152,635,401 | — | 152,635,401 | ||||||||||||
Marketplace Loans | — | — | 9,101,512 | 9,101,512 | ||||||||||||
Foreign Government and Agency Securities | — | 167,044,335 | — | 167,044,335 | ||||||||||||
U.S. Government and Agency Securities | — | 646,780,643 | — | 646,780,643 | ||||||||||||
Asset-Backed Securities and Commercial | ||||||||||||||||
Mortgage-Backed Securities: | ||||||||||||||||
Banks | — | 28,138,906 | 8,917 | 28,147,823 | ||||||||||||
Diversified Financials | — | 1,426,765,654 | 14,331,179 | 1,441,096,833 | ||||||||||||
Mortgage-Backed Securities | — | 1,088,383,788 | — | 1,088,383,788 | ||||||||||||
Municipal Bonds | — | 285,994,577 | — | 285,994,577 | ||||||||||||
Escrows and Litigation Trusts | — | — | — | c | — | |||||||||||
Short Term Investments | 60,832,286 | — | — | 60,832,286 | ||||||||||||
|
| |||||||||||||||
Total Investments in Securities | $ | 653,657,966 | $ | 4,864,420,109 | $ | 25,527,145 | $ | 5,543,605,220 | ||||||||
|
| |||||||||||||||
Other Financial Instruments: | ||||||||||||||||
Futures Contracts | $ | 41,114,549 | $ | — | $ | — | $ | 41,114,549 | ||||||||
Forward Exchange Contracts | — | 6,950,826 | — | 6,950,826 | ||||||||||||
Swap Contracts | — | 14,604,506 | — | 14,604,506 | ||||||||||||
|
| |||||||||||||||
Total Other Financial Instruments | $ | 41,114,549 | $ | 21,555,332 | $ | — | $ | 62,669,881 | ||||||||
|
| |||||||||||||||
Liabilities: | ||||||||||||||||
Other Financial Instruments: | ||||||||||||||||
Futures Contracts | $ | 5,313,768 | $ | — | $ | — | $ | 5,313,768 | ||||||||
Forward Exchange Contracts | — | 14,690,094 | — | 14,690,094 | ||||||||||||
Swap Contracts | — | 61,780,667 | 1,514,592 | 63,295,259 | ||||||||||||
|
| |||||||||||||||
Total Other Financial Instruments | $ | 5,313,768 | $ | 76,470,761 | $ | 1,514,592 | $ | 83,299,121 | ||||||||
|
| |||||||||||||||
aFor detailed categories, see the accompanying Statement of Investments.
bIncludes common, preferred stocks and management investment companies as well as other equity interests.
cIncludes securities determined to have no value at April 30, 2020.
franklintempleton.com | Semiannual Report | 167 | ||||
FRANKLIN INVESTORS SECURITIES TRUST
NOTES TO FINANCIAL STATEMENTS (UNAUDITED)
14. Fair Value Measurements (continued)
A reconciliation in which Level 3 inputs are used in determining fair value is presented when there are significant Level 3 assets and/or liabilities at the beginning and/or end of the period. At April 30, 2020, the reconciliation is as follows:
| Balance at Beginning of Period | Purchases | Sales | Transfer Level 3a | Transfer Out of Level 3b | Cost Basis Adjustmentsc | Net Realized Gain (Loss) | Net Unrealized Appreciation (Depreciation) | Balance at End of Period | Net Change in Unrealized Appreciation (Depreciation) on Assets Held at Period End | |||||||||||||||||||||||||||||||
Franklin Floating Rate Daily Access Fund | ||||||||||||||||||||||||||||||||||||||||
| Assets: | ||||||||||||||||||||||||||||||||||||||||
Investments in Securities: | ||||||||||||||||||||||||||||||||||||||||
Equity Investments: | ||||||||||||||||||||||||||||||||||||||||
Diversified Support Services | $ 1,808,932 | $ — | $ — | $ — | $(1,130,583 | ) | $ — | $ — | $ (678,349 | ) | $ — | $ — | ||||||||||||||||||||||||||||
Forest Products | 16,265,063 | — | — | — | — | — | — | 6,360,422 | 22,625,485 | 6,360,422 | ||||||||||||||||||||||||||||||
Corporate Bonds | — | — | — | 15,426,642 | — | — | — | — | 15,426,642 | — | ||||||||||||||||||||||||||||||
Senior Floating Rate Interests: | ||||||||||||||||||||||||||||||||||||||||
Personal Products | 61,403,599 | — | — | — | — | 210,084 | — | (5,158,768 | ) | 56,454,915 | (5,158,768 | ) | ||||||||||||||||||||||||||||
Escrows and Litigation Trusts | — | e | — | e | — | — | — | (1,277,251 | ) | 1,277,251 | — | — | e | — | ||||||||||||||||||||||||||
|
| |||||||||||||||||||||||||||||||||||||||
| Total Investments in Securities | $79,477,594 | $ — | $ — | $15,426,642 | $(1,130,583 | ) | $(1,067,167 | ) | $1,277,251 | $ 523,305 | $94,507,042 | $ 1,201,654 | ||||||||||||||||||||||||||||
|
| |||||||||||||||||||||||||||||||||||||||
Franklin Low Duration Total Return Fund | ||||||||||||||||||||||||||||||||||||||||
| Assets: | ||||||||||||||||||||||||||||||||||||||||
Investments in Securities: | ||||||||||||||||||||||||||||||||||||||||
Equity Investments:d | ||||||||||||||||||||||||||||||||||||||||
Commercial & Professional Services | $ 170,787 | $ — | $ — | $ — | $ (85,394 | ) | $ — | $ | $ (85,393 | ) | $ — | $ — | ||||||||||||||||||||||||||||
Energy | 4,511e | — | — | — | (2,327 | ) | — | — | 10,124 | 12,308 | 10,124 | |||||||||||||||||||||||||||||
Materials | 329,838 | — | — | — | — | — | — | 128,982 | 458,820 | 128,982 | ||||||||||||||||||||||||||||||
Retailing | 8,967 | — | — | — | — | — | — | (8,967 | ) | — | e | (8,967 | ) | |||||||||||||||||||||||||||
Corporate Bonds: | ||||||||||||||||||||||||||||||||||||||||
Capital Goods | — | — | — | 290,023 | — | 1,673 | — | (37,519 | ) | 254,177 | (37,519 | ) | ||||||||||||||||||||||||||||
Retailing | 2,280 | — | — | — | — | (69,976 | ) | — | 70,128 | 2,432 | 70,128 | |||||||||||||||||||||||||||||
Senior Floating Rate Interests: | ||||||||||||||||||||||||||||||||||||||||
Household & Personal Products | 3,233,528 | — | — | — | — | 10,871 | — | (128,602 | ) | 3,115,797 | (128,602 | ) | ||||||||||||||||||||||||||||
Marketplace Loans | 24,471,922 | 5,991,758 | — | — | — | — | — | (2,053,007 | ) | 28,410,673 | (2,053,007 | ) | ||||||||||||||||||||||||||||
168 | Semiannual Report | franklintempleton.com | ||
FRANKLIN INVESTORS SECURITIES TRUST
NOTES TO FINANCIAL STATEMENTS (UNAUDITED)
| Balance at Beginning of Period | Purchases | Sales | Transfer Level 3a | Transfer Out of Level 3b | Cost Basis Adjustmentsc | Net Realized Gain (Loss) | Net Unrealized Appreciation (Depreciation) | Balance at End of Period | Net Change in Period End | |||||||||||||||||||||||||||||||
Asset-Backed Securities and Commercial Mortgage-Backed Securities: | ||||||||||||||||||||||||||||||||||||||||
Diversified Financials | $ — | $ — | $ — | $10,536,605 | $ — | $ — | $ — | $ — | $10,536,605 | $ — | ||||||||||||||||||||||||||||||
Escrows and Litigation Trusts | —e | —e | — | — | — | (7,705 | ) | 7,705 | — | —e | — | |||||||||||||||||||||||||||||
|
| |||||||||||||||||||||||||||||||||||||||
Total Investments in Securities | $28,221,833 | $5,991,758 | $ — | $10,826,628 | $ (87,721 | ) |
| $ (65,137 | ) | $ 7,705 | $(2,104,254 | ) | $42,790,812 | $(2,018,861 | ) | |||||||||||||||||||||||||
|
| |||||||||||||||||||||||||||||||||||||||
| Liabilities: | ||||||||||||||||||||||||||||||||||||||||
Other Financial Instruments: | ||||||||||||||||||||||||||||||||||||||||
Swap Contracts | $ — | $ — | $ — | $ 336,576 | $ — | $ — | $ — | $ — | $ 336,576 | $ — | ||||||||||||||||||||||||||||||
|
| |||||||||||||||||||||||||||||||||||||||
aTransferred into Level 3 as a result of the unavailability of a quoted market price in an active market for identical securities and other significant observable valuation inputs.
bThe investments were transferred out of Level 3 as a result of the availability of other significant observable valuation inputs.
cMay include accretion, amortization, partnership adjustments, and/or other cost basis adjustments.
dIncludes common stocks and other equity interests.
eIncludes securities determined to have no value.
Significant unobservable valuation inputs for material Level 3 assets and/or liabilities and impact to fair value as a result of changes in unobservable valuation inputs as of April 30, 2020, are as follows:
franklintempleton.com | Semiannual Report | 169 | ||||
FRANKLIN INVESTORS SECURITIES TRUST
NOTES TO FINANCIAL STATEMENTS (UNAUDITED)
14. Fair Value Measurements (continued)
| Description | Fair Value at End of Period | Valuation Technique | Unobservable Input | Amount/Range (Weighted Averagea) | Impact to Fair Value if Input Increasesb | |||||||||||
| ||||||||||||||||
| Franklin Floating Rate Daily Access Fund | ||||||||||||||||
| Assets: | ||||||||||||||||
Investments in Securities: | ||||||||||||||||
Equity Investments: | ||||||||||||||||
Forest Products | Discounted cash flow | Weighted average cost of capital | 16.8% | Decreased | ||||||||||||
| $22,625,485 | ||||||||||||||||
| ||||||||||||||||
| Total unlevered free cashflows | $188.4 mil | Increase | ||||||||||||||
| ||||||||||||||||
| Discount for lack of marketability | 20.0% | Decreased | ||||||||||||||
| ||||||||||||||||
| Long term growth | 0.0% | Increase | ||||||||||||||
| ||||||||||||||||
Corporate Bonds | 15,426,642 | Market transaction | Transaction price weighting | 50.0% | Increased | |||||||||||
| ||||||||||||||||
Senior Floating Rate Interests: | ||||||||||||||||
Personal Products | Discounted cash flow | Discount rate | 10.2% - 20.8% | Decreased | ||||||||||||
| 56,454,915 | (18.3%) | |||||||||||||||
| ||||||||||||||||
| Free cash flow | $15.0 - $63.6 mil | Increasec | ||||||||||||||
| ($52.1) mil | ||||||||||||||||
| ||||||||||||||||
All Other Investmentse | — | f | ||||||||||||||
| ||||||||||||||||
Total | $94,507,042 | |||||||||||||||
| ||||||||||||||||
| Franklin Low Duration Total Return Fund | ||||||||||||||||
| Assets: | ||||||||||||||||
Investments in Securities: | ||||||||||||||||
Marketplace Loans - Lending Club | $21,260,351 | Discounted cash flow | Loss-adjusted discount rate | 7.4% | Decreasec | |||||||||||
| ||||||||||||||||
| Projected loss rate | 24.9% | Decreasec | ||||||||||||||
| ||||||||||||||||
Marketplace Loans – Lending Club LCX | 3,950,046 | Discounted cash flow | Loss-adjusted discount rate | 9.8% | Decreasec | |||||||||||
| ||||||||||||||||
| Projected loss rate | 18.9% | Decreasec | ||||||||||||||
| ||||||||||||||||
Marketplace Loans – Upgrade | 3,200,276 | Discounted cash flow | Loss-adjusted discount rate | 15.2% | Decreasec | |||||||||||
| ||||||||||||||||
| Projected loss rate | 22.0% | Decreasec | ||||||||||||||
| ||||||||||||||||
All other investmentse | $14,380,139f | |||||||||||||||
| ||||||||||||||||
| Liabilities: | ||||||||||||||||
Other Financial Instruments: | ||||||||||||||||
Credit Defaults Swap Contractse | $ 336,576 | |||||||||||||||
| ||||||||||||||||
| 170 |
Semiannual Report | franklintempleton.com | ||
FRANKLIN INVESTORS SECURITIES TRUST
NOTES TO FINANCIAL STATEMENTS (UNAUDITED)
aWeighted based on the relative fair value of the financial instruments.
bRepresents the directional change in the fair value that would result from a significant and reasonable increase in the corresponding input. A significant and reasonable decrease in the input would have the opposite effect. Significant impacts, if any, to fair value and/or net assets have been indicated.
cRepresents a significant impact to fair value and net assets.
dRepresents a significant impact to fair value but not net assets.
eIncludes fair value of immaterial financial instruments developed using various valuation techniques and unobservable inputs. May also include values derived private transaction prices or non-public third party pricing information which is unobservable.
fIncludes securities determined to have no value at April 30, 2020.
15. New Accounting Pronouncements
In March 2020, the Financial Accounting Standards Board issued Accounting Standards Update (ASU) No. 2020-04, Reference Rate Reform (Topic 848) – Facilitation of the Effects of Reference Rate Reform on Financial Reporting. The amendments in the ASU provides optional temporary financial reporting relief from the effect of certain types of contract modifications due to the planned discontinuation of LIBOR and other interbank-offered based reference rates as of the end of 2021. The ASU is effective for certain reference rate-related contract modifications that occur during the period March 12, 2020 through December 31, 2022. Management is currently evaluating the impact, if any, of applying this ASU.
16. Subsequent Events
The Funds have evaluated subsequent events through the issuance of the financial statements and determined that no events have occurred that require disclosure.
Abbreviations
| Counterparty | Currency | |||||
| BNDP | BNP Paribas SA | BRL | Brazilian Real | |||
| BZWS | Barclays Bank PLC | CAD | Canadian Dollar | |||
| CITI | Citigroup, Inc. | CNY | Chinese Yuan | |||
| DBAB | Deutsche Bank AG | COP | Colombian Peso | |||
| FBCO | Credit Suisse Group AG | DKK | Danish Krone | |||
| GSCO | The Goldman Sachs Group, Inc. | DOP | Dominican Peso | |||
| JPHQ | JP Morgan Chase & Co. | EUR | Euro | |||
| MSCO | Morgan Stanley | JPY | Japanese Yen | |||
| USD | United States Dollar | |||||
| UYU | Uruguayan Peso | |||||
| ZAR | South Africa C Rand | |||||
| Selected Portfolio | ||
| ADR | American Depositary Receipt | |
| AGMC | Assured Guaranty Municipal Corp. | |
| ARM | Adjustable Rate Mortgage | |
| BOBL | Bundesobligation | |
franklintempleton.com | Semiannual Report | 171 | ||||
FRANKLIN INVESTORS SECURITIES TRUST
NOTES TO FINANCIAL STATEMENTS (UNAUDITED)
| BTP | Buoni del Tesoro Poliennali | GO | General Obligation | |||
| BZDIOVRA | Brazil Cetip DI Interbank Deposit Rate | IO | Interest Only | |||
| CLO | Collateralized Loan Obligation | LIBOR | London InterBank Offered Rate | |||
| CME | Chicago Mercantile Exchange | MBS | Mortgage-Backed Security | |||
| CMT | Constant Maturity Treasury Index | OAT | Obligation Assumable by the Treasurer | |||
| CNRR | China Reverse Repo Rate | PIK | Payment-In-Kind | |||
| COF | Cost of Funds | RDA | Redevelopment Agency/Authority | |||
| CPI | Consumer Price Index | REIT | Real Estate Investment Trust | |||
| ETF | Exchange Traded Fund | SF | Single Family | |||
| FHLMC | Federal Home Loan Mortgage Corp. | SFR | Single Family Revenue | |||
| FNMA | Federal National Mortgage Association | SPDR | S&P Depositary Receipt | |||
| FRN | Floating Rate Note | T-Bill | Treasury Bill | |||
| GDP | Gross Domestic Product | T-Note | Treasury Note | |||
| GNMA | Government National Mortgage Association | VRI | Value Recovery Instruments |
| Index | ||
| CDX.EM.Series number | CDX Emerging Markets Index | |
| CDX.NA.HY.Series number | CDX North America High Yield Index | |
| CDX.NA.IG.Series number | CDX North America Investment Grade Index | |
| MCDX.NA.Series number | MCDX North America Index | |
| 172 |
Semiannual Report | franklintempleton.com | ||
FRANKLIN INVESTORS SECURITIES TRUST
Board Approval of Investment
Management Agreements
FRANKLIN INVESTORS SECURITIES TRUST
Franklin Adjustable U.S. Government Securities Fund
Franklin Floating Rate Daily Access Fund
Franklin Low Duration Total Return Fund
Franklin Total Return Fund
(each a Fund)
At an in-person meeting held on February 25, 2020 (Meeting), the Board of Trustees (Board) of Franklin Investors Securities Trust (Trust), including a majority of the trustees who are not “interested persons” as defined in the Investment Company Act of 1940 (Independent Trustees), reviewed and approved the continuance of the investment management agreement between Franklin Advisers, Inc. (FAI) and the Trust, on behalf of each Fund and the investment sub-advisory agreement between FAI and Franklin Templeton Institutional, LLC (Sub-Adviser), an affiliate of FAI, on behalf of the Franklin Total Return Fund (each a Management Agreement) for an additional one-year period. The Independent Trustees received advice from and met separately with Independent Trustee counsel in considering whether to approve the continuation of each Management Agreement. Although the Management Agreements for the Funds were considered at the same Board meeting, the Board considered the information provided to it about the Funds together and with respect to each Fund separately as the Board deemed appropriate. FAI and the Sub-Adviser are each referred to herein as a Manager.
In considering the continuation of each Management Agreement, the Board reviewed and considered information provided by each Manager at the Meeting and throughout the year at meetings of the Board and its committees. The Board also reviewed and considered information provided in response to a detailed set of requests for information submitted to FAI by Independent Trustee counsel on behalf of the Independent Trustees in connection with the annual contract renewal process. In addition, prior to the Meeting, the Independent Trustees held a telephonic contract renewal meeting at which the Independent Trustees conferred amongst themselves and Independent Trustee counsel about contract renewal matters and, in some cases, requested additional information from FAI relating to the contract. The Board reviewed and considered all of the factors it deemed relevant in approving the continuance of each Management Agreement, including, but not limited to:
(i) the nature, extent and quality of the services provided by each Manager; (ii) the investment performance of each Fund; (iii) the costs of the services provided and profits realized by each Manager and its affiliates from the relationship with each Fund; (iv) the extent to which economies of scale are realized as each Fund grows; and (v) whether fee levels reflect these economies of scale for the benefit of Fund investors.
In approving the continuance of each Management Agreement, the Board, including a majority of the Independent Trustees, determined that the terms of the Management Agreement are fair and reasonable and that the continuance of such Management Agreement is in the interests of the applicable Fund and its shareholders. While attention was given to all information furnished, the following discusses some primary factors relevant to the Board’s determination.
Nature, Extent and Quality of Services
The Board reviewed and considered information regarding the nature, extent and quality of investment management services provided by each Manager and its affiliates to the Funds and their shareholders. This information included, among other things, the qualifications, background and experience of the senior management and investment personnel of each Manager; as well as information on succession planning where appropriate; the structure of investment personnel compensation; oversight of third-party service providers; investment performance reports and related financial information for each Fund; reports on expenses and shareholder services; legal and compliance matters; risk controls; pricing and other services provided by each Manager and its affiliates; and management fees charged by each Manager and its affiliates to US funds and other accounts, including management’s explanation of differences among accounts where relevant. The Board also reviewed and considered an annual report on payments made by Franklin Templeton (FT) or the Funds to financial intermediaries, as well as a memorandum relating to third-party servicing arrangements, which included discussion of the changing distribution landscape for the Funds. The Board noted management’s continuing efforts and expenditures in establishing effective business continuity plans and developing strategies to address areas of heightened concern in the mutual fund industry, such as cybersecurity and liquidity risk management.
The Board also reviewed and considered the benefits provided to Fund shareholders of investing in a fund that is
franklintempleton.com | Semiannual Report | 173 | ||||
FRANKLIN INVESTORS SECURITIES TRUST
SHAREHOLDER INFORMATION
part of the FT family of funds. The Board noted the financial position of Franklin Resources, Inc. (FRI), the Managers’ parent, and its commitment to the mutual fund business as evidenced by its continued introduction of new funds, reassessment of the fund offerings in response to the market environment and project initiatives and capital investments relating to the services provided to the Funds by the FT organization. The Board specifically noted FT’s commitment to enhancing services and controlling costs, as reflected in its plan to outsource certain administrative functions, and growth opportunities, as evidenced by its upcoming acquisition of the Legg Mason companies. The Board acknowledged the change in leadership at FRI and the opportunity to hear from Jennifer Johnson, President and Chief Executive Officer of FRI, about goals she has for the company that will benefit the Funds.
Following consideration of such information, the Board was satisfied with the nature, extent and quality of services provided by each Manager and its affiliates to the Funds and their shareholders.
Fund Performance
The Board reviewed and considered the performance results of each Fund over various time periods ended December 31, 2019. The Board considered the performance returns for each Fund in comparison to the performance returns of mutual funds deemed comparable to the Fund included in a universe (Performance Universe) selected by Broadridge Financial Solutions, Inc. (Broadridge), an independent provider of investment company data. The Board received a description of the methodology used by Broadridge to select the mutual funds included in a Performance Universe. The Board also reviewed and considered Fund performance reports provided and discussions that occurred with portfolio managers at Board meetings throughout the year. A summary of each Fund’s performance results is below.
Franklin Adjustable U.S. Government Securities Fund - The Performance Universe for the Fund included the Fund and all retail and institutional ultra-short obligation funds. The Board noted that the Fund’s annualized income return for the one-, three-, five- and 10-year periods was above the median and in the first quintile (best) of its Performance Universe. The Board also noted that the Fund’s annualized total return for the one-, three-, five- and 10-year periods was below the median and in the fifth (worst) or fourth quintile of its Performance Universe. The Board discussed this performance with management and management explained that the Fund invests in plain vanilla ARM securities issued
or guaranteed by the U.S. government or its related agencies (such as Fannie Mae or Freddie Mac), so it tends to underperform its Broadridge peers, many of which invest in a broader range of asset types, during periods of decreasing risk premiums. Given the Fund’s income-oriented investment objective and management’s explanation, the Board concluded that the Fund’s performance was satisfactory.
Franklin Floating Rate Daily Access Fund - The Performance Universe for the Fund included the Fund and all retail and institutional loan participation funds. The Board noted that the Fund’s annualized income return for the one-, three-, five- and 10-year periods was above the median of its Performance Universe. The Board also noted that the Fund’s annualized total return for the one-, three-, five- and 10-year periods was below the median and in the 5th quintile (worst) of its Performance Universe. The Board discussed this performance with management and management explained that many of the Fund’s peers had stronger performance than the Fund in 2019, which influenced longer-term rankings significantly as well, because the peers were invested in high yield bonds, which had a very strong 2019, as opposed to loan participations invested in by the Fund. Management also explained that a primary source of the Fund’s below median one-year annualized total return was due to the Fund’s exposure to select issuers within the retail and metals/minerals sectors, where industry headwinds generally caused reported results to fall short of investor expectations. The Board noted management’s steps to address the underperformance of the Fund and concluded that the Fund’s Management Agreement should be continued for an additional one-year period, and management’s efforts should continue to be monitored.
Franklin Low Duration Total Return Fund - The Performance Universe for the Fund included the Fund and all retail and institutional short investment-grade debt funds. The Board noted that the Fund’s annualized income return for the one-, three-, five- and 10-year periods was above the median and in the first quintile (best) of its Performance Universe. The Board also noted that the Fund’s annualized total return for the three-, five- and 10-year periods was below the median of its Performance Universe, but for the one-year period was above the median of its Performance Universe. The Board concluded that the Fund’s performance was satisfactory. In doing so, the Board noted that the Fund’s annualized total return for each of the three-, five- and 10-year periods, while below the median, exceeded 1.65%.
| 174 |
Semiannual Report | franklintempleton.com | ||
FRANKLIN INVESTORS SECURITIES TRUST
SHAREHOLDER INFORMATION
Franklin Total Return Fund - The Performance Universe for the Fund included the Fund and all retail and institutional core plus bond funds. The Board noted that the Fund’s annualized income return for the five-year period was below the median of its Performance Universe, but for the one-, three- and 10-year periods was above the median of its Performance Universe. The Board also noted that the Fund’s annualized total return for the one-, three-, five- and 10-year periods was below the median of its Performance Universe. The Board discussed this performance with management and management explained that it has implemented an enhanced investment process to address the Fund’s underperformance, in particular in the areas of macroeconomic analysis, quantitative modeling and portfolio construction. The Board concluded that the Fund’s Management Agreement should be continued for an additional one-year period, and management’s efforts should continue to be monitored. In doing so, the Board noted that the Fund’s annualized total return for the one-year period, while below the median, exceeded 9.00% and was in the third quintile of its Performance Universe as compared to the fifth quintile (worst) for the three- and five-year periods.
Comparative Fees and Expenses
The Board reviewed and considered information regarding each Fund’s actual total expense ratio and its various components, including, as applicable, management fees; transfer agent expenses; underlying fund expenses; Rule 12b-1 and non-Rule 12b-1 service fees; and other non-management fees. The Board also noted the quarterly and annual reports it receives on all marketing support payments made by FT to financial intermediaries. The Board considered the actual total expense ratio and, separately, the contractual management fee rate, without the effect of fee waivers, if any (Management Rate) of each Fund in comparison to the median expense ratio and median Management Rate, respectively, of other mutual funds deemed comparable to and with a similar expense structure to the Fund selected by Broadridge (Expense Group). Broadridge fee and expense data is based upon information taken from each fund’s most recent annual report, which reflects historical asset levels that may be quite different from those currently existing, particularly in a period of market volatility. While recognizing such inherent limitation and the fact that expense ratios and Management Rates generally increase as assets decline and decrease as assets grow, the Board believed the independent analysis conducted by Broadridge to be an appropriate measure of comparative fees and expenses. The Broadridge Management Rate includes administrative charges, and the
actual total expense ratio, for comparative consistency, was shown (i) for Class A shares for each of the Franklin Adjustable U.S. Government Securities Fund, the Franklin Floating Rate Daily Access Fund and the Franklin Total Return Fund and for Class A shares for the other funds in each Fund’s respective Expense Group; and (ii) for Investor Class shares for the Franklin Low Duration Total Return Fund and for Class A shares and Class M shares for the other funds in the Fund’s Expense Group. The Board received a description of the methodology used by Broadridge to select the mutual funds included in an Expense Group.
Franklin Adjustable U.S. Government Securities Fund and Franklin Total Return Fund – The Expense Group for the Franklin Adjustable U.S. Government Securities Fund included the Fund and five other ultra-short obligation funds. The Expense Group for the Franklin Total Return Fund included the Fund and ten other core plus bond funds. The Board noted that the Management Rate and actual total expense ratio for each Fund was above the median of its respective Expense Group. The Board discussed with management each Fund’s expenses and noted management’s explanation that it believed the expenses of the Franklin Adjustable U.S. Government Securities Fund were appropriate, especially in light of the Fund’s first quintile (best) annualized income return for the one-, three-, five- and 10-year periods. The Board also noted that the Management Rate for the Franklin Total Return Fund was only slightly above the median of its Expense Group and that the Fund’s Sub-Adviser was paid by FAI out of the management fee FAI received from the Fund. The Board concluded that the Management Rate charged to each Fund is reasonable.
Franklin Floating Rate Daily Access Fund – The Expense Group for the Fund included the Fund and 13 other loan participation funds. The Board noted that the Management Rate and actual total expense ratio for the Fund were below the medians and in the first quintile (least expensive) of the Expense Group. The Board concluded that the Management Rate charged to the Fund is reasonable.
Franklin Low Duration Total Return Fund – The Expense Group for the Fund included the Fund and 10 other short investment-grade debt funds. The Board noted that the Management Rate was above the median and in the fifth quintile (most expensive) of its Expense Group. The Board also noted that the actual total expense ratio for the Fund was below the median of its Expense Group. The Board concluded that the Management Rate charged to the Fund is
franklintempleton.com | Semiannual Report | 175 | ||||
FRANKLIN INVESTORS SECURITIES TRUST
SHAREHOLDER INFORMATION
reasonable. In doing so, the Board noted the Fund’s first quintile (best) annualized income return for the one-, three-, five- and 10-year periods and that the actual total expense ratio for the Fund reflected a fee waiver from management.
Profitability
The Board reviewed and considered information regarding the profits realized by each Manager and its affiliates in connection with the operation of each Fund. In this respect, the Board considered the Fund profitability analysis that addresses the overall profitability of FT’s US fund business, as well as its profits in providing investment management and other services to each of the individual funds during the 12-month period ended September 30, 2019, being the most recent fiscal year-end for FRI. The Board noted that although management continually makes refinements to its methodologies used in calculating profitability in response to organizational and product-related changes, the overall methodology has remained consistent with that used in the Funds’ profitability report presentations from prior years. Additionally, PricewaterhouseCoopers LLP, auditor to FRI and certain FT funds, was engaged to review and assess the allocation methodologies to be used solely by the Funds’ Board with respect to the profitability analysis.
The Board noted management’s belief that costs incurred in establishing the infrastructure necessary for the type of mutual fund operations conducted by each Manager and its affiliates may not be fully reflected in the expenses allocated to each Fund in determining its profitability, as well as the fact that the level of profits, to a certain extent, reflected operational cost savings and efficiencies initiated by management. As part of this evaluation, the Board considered the initiative currently underway to outsource certain operations, which effort would require considerable upfront expenditures by the Managers but, over the long run is expected to result in greater efficiencies. The Board also noted management’s expenditures in improving shareholder services provided to the Funds, as well as the need to implement systems and meet additional regulatory and compliance requirements resulting from recent US Securities and Exchange Commission and other regulatory requirements, notably in the area of cybersecurity protections.
The Board also considered the extent to which each
Manager and its affiliates might derive ancillary benefits from fund operations, including revenues generated from transfer agent services, potential benefits resulting from personnel and systems enhancements necessitated by fund growth, as
well as increased leverage with service providers and counterparties. Based upon its consideration of all these factors, the Board concluded that the level of profits realized by each Manager and its affiliates from providing services to each Fund was not excessive in view of the nature, extent and quality of services provided to each Fund.
Economies of Scale
The Board reviewed and considered the extent to which each Manager may realize economies of scale, if any, as each Fund grows larger and whether each Fund’s management fee structure reflects any economies of scale for the benefit of shareholders. With respect to possible economies of scale, the Board noted the existence of management fee breakpoints, which operate generally to share any economies of scale with a Fund’s shareholders by reducing the Fund’s effective management fees as the Fund grows in size. The Board considered management’s view that any analyses of potential economies of scale in managing a particular fund are inherently limited in light of the joint and common costs and investments each Manager incurs across the FT family of funds as a whole. The Board noted that the Franklin Adjustable U.S. Government Securities Fund and the Franklin Floating Rate Daily Access Fund had experienced a decrease in assets and would not be expected to demonstrate additional economies of scale in the near term, but concluded that to the extent economies of scale may be realized by a Manager and its affiliates, each Fund’s management fee structure provided a sharing of benefits with the Fund and its shareholders as the Fund grows.
Conclusion
Based on its review, consideration and evaluation of all factors it believed relevant, including the above-described factors and conclusions, the Board unanimously approved the continuation of each Management Agreement for an additional one-year period.
Proxy Voting Policies and Procedures
The Trust’s investment manager has established Proxy Voting Policies and Procedures (Policies) that the Trust uses to determine how to vote proxies relating to portfolio securities. Shareholders may view the Trust’s complete Policies online at franklintempleton.com. Alternatively, shareholders may request copies of the Policies free of charge by calling the Proxy Group collect at (954) 527-7678 or by sending a written request to: Franklin Templeton Companies, LLC, 300 S.E. 2nd Street, Fort Lauderdale, FL
| 176 |
Semiannual Report | franklintempleton.com | ||
FRANKLIN INVESTORS SECURITIES TRUST
SHAREHOLDER INFORMATION
33301, Attention: Proxy Group. Copies of the Trust’s proxy voting records are also made available online at franklintempleton.com and posted on the U.S. Securities and Exchange Commission’s website at sec.gov and reflect the most recent 12-month period ended June 30.
Quarterly Statement of Investments
The Trust files a complete statement of investments with the U.S. Securities and Exchange Commission for the first and third quarters for each fiscal year as an exhibit to its report on Form N-PORT. Shareholders may view the filed Form N-PORT by visiting the Commission’s website at sec.gov. The filed form may also be viewed and copied at the Commission’s Public Reference Room in Washington, DC. Information regarding the operations of the Public Reference Room may be obtained by calling (800) SEC-0330.
franklintempleton.com | Semiannual Report | 177 | ||||
This page intentionally left blank.
This page intentionally left blank.
This page intentionally left blank.
Authorized for distribution only when accompanied or preceded by a summary prospectus and/or prospectus. Investors should carefully consider a fund’s investment goals, risks, charges and expenses before investing. A prospectus contains this and other information; please read it carefully before investing.
To help ensure we provide you with quality service, all calls to and from our service areas are monitored and/or recorded.
 | Semiannual Report and Shareholder Letter | |||||
Franklin Investors Securities Trust
| ||||||
| Investment Manager | Distributor | Shareholder Services | ||||
| Franklin Advisers, Inc. | Franklin Templeton Distributors, Inc. | (800) 632-2301 | ||||
| (800) DIAL BEN® / 342-5236 | ||||||
| franklintempleton.com | ||||||
© 2020 Franklin Templeton Investments. All rights reserved. | FIST2 S 06/20 | |||||
| Item 2. | Code of Ethics. |
(a) The Registrant has adopted a code of ethics that applies to its principal executive officers and principal financial and accounting officer.
(c) N/A
(d) N/A
(f) Pursuant to Item 13(a)(1), the Registrant is attaching as an exhibit a copy of its code of ethics that applies to its principal executive officers and principal financial and accounting officer.
| Item 3. | Audit Committee Financial Expert. |
(a)(1) The Registrant has an audit committee financial expert serving on its audit committee.
(2) The audit committee financial expert is Mary C. Choksi and she is “independent” as defined under the relevant Securities and Exchange Commission Rules and Releases.
| Item 4. | Principal Accountant Fees and Services. N/A |
| Item 5. | Audit Committee of Listed Registrants. N/A |
| Item 6. | Schedule of Investments. N/A |
| Item 7. | Disclosure of Proxy Voting Policies and Procedures for Closed-End Management Investment Companies. N/A |
| Item 8. | Portfolio Managers of Closed-End Management Investment Companies. N/A |
| Item 9. | Purchases of Equity Securities by Closed-End Management Investment Company and Affiliated Purchasers. N/A |
| Item 10. | Submission of Matters to a Vote of Security Holders. |
There have been no changes to the procedures by which shareholders may recommend nominees to the Registrant’s Board of Trustees that would require disclosure herein.
| Item 11. | Controls and Procedures. |
(a) Evaluation of Disclosure Controls and Procedures. The Registrant maintains disclosure controls and procedures that are designed to provide reasonable assurance that information required to be disclosed in the Registrant’s filings under the Securities Exchange Act of 1934, as amended, and the Investment Company Act of 1940 is recorded, processed, summarized and reported within the periods specified in the rules and forms of the Securities and Exchange Commission. Such information is accumulated and communicated to the Registrant’s management, including its principal executive officer and principal financial officer, as appropriate, to allow timely decisions regarding required disclosure. The Registrant’s management, including the principal executive officer and the principal financial officer, recognizes that any set of controls and procedures, no matter how well designed and operated, can provide only reasonable assurance of achieving the desired control objectives.
Within 90 days prior to the filing date of this Shareholder Report on Form N-CSRS, the Registrant had carried out an evaluation, under the supervision and with the participation of the Registrant’s management, including the Registrant’s principal executive officer and the Registrant’s principal financial officer, of the effectiveness of the design and operation of the Registrant’s disclosure controls and procedures. Based on such evaluation, the Registrant’s principal executive officer and principal financial officer concluded that the Registrant’s disclosure controls and procedures are effective.
(b) Changes in Internal Controls. There have been no changes in the Registrant’s internal control over financial reporting that occurred during the period covered by this report that has materially affected, or is reasonably likely to materially affect the internal control over financial reporting.
| Item 12. | Disclosure of Securities Lending Activities for Closed-End Management Investment Company. N/A |
| Item 13. | Exhibits. |
SIGNATURES
Pursuant to the requirements of the Securities Exchange Act of 1934 and the Investment Company Act of 1940, the registrant has duly caused this report to be signed on its behalf by the undersigned, thereunto duly authorized.
FRANKLIN INVESTORS SECURITIES TRUST
| By | /S/ MATTHEW T. HINKLE | |
| Matthew T. Hinkle | ||
| Chief Executive Officer – Finance and Administration | ||
| Date | June 30, 2020 |
Pursuant to the requirements of the Securities Exchange Act of 1934 and the Investment Company Act of 1940, this report has been signed below by the following persons on behalf of the registrant and in the capacities and on the dates indicated.
| By | /S/ MATTHEW T. HINKLE | |
| Matthew T. Hinkle | ||
| Chief Executive Officer – Finance and Administration | ||
| Date | June 30, 2020 |
| By | /S/ GASTON GARDEY | |
| Gaston Gardey | ||
| Chief Financial Officer and Chief Accounting Officer | ||
| Date | June 30, 2020 |